Exhibit 99.1
REITweek2018 InvestorConference June 2018 NYSE: ZAYO @ZayoGroup |
non-cash income/(loss) on equity and cost method investments. Adjusted EBITDA Margin is defined as Adjusted EBITDA divided by revenue. Unlevered free cash flow is defined as Adjusted EBITDA less purchases of property and equipment, net of stimulus grants. Adjusted unlevered free cash flow is defined as Adjusted EBITDA less purchases of property and equipment, net of stimulus grants, plus additions to deferred revenue, less non-cash monthly amortized revenue. Levered free cash flow is defined as net cash provided by operating activities less purchases of property and equipment, net of stimulus grants. Adjusted funds from operations (“AFFO”) is defined as earnings/(loss) from operations before depreciation and amortization, unrealized foreign currency gains/(losses) on intercompany loans, stock-based compensation, acquisition or disposal-related transaction costs, losses on extinguishment of debt, non-cash income/(loss) on equity and cost investments, non-cash monthly amortized revenue, less cash payments related to maintenance capital expenditures. These measures are not measurements of our financial performance under GAAP and should not be considered in isolation or as alternatives to net income, net cash flows provided by operating activities, total net cash flows or any other performance measures derived in accordance with GAAP or as alternatives to net cash flows from operating activities or total net cash flows as measures of our liquidity. We use Adjusted EBITDA to evaluate our operating performance.In addition to Adjusted EBITDA, management uses unlevered free cash flow, which measures the ability of Adjusted EBITDA to cover capital expenditures. Adjusted EBITDA is a performance rather than cash flow measure. Correlating our capital expenditures to our Adjusted EBITDA does not imply that we will be able to fund such capital expenditures solely with cash from operations. These metrics are among the primary measures used by management for planning and forecasting future periods. We believe the presentation of Adjusted EBITDA is relevant and useful for investors because it allows investors to view results in a manner similar to the method used by management and make it easier to compare our results with the results of other companies that have different financing and capital structures. We believe that the presentation of levered free cash flow is relevant and useful to investors because it provides a measure of cash available to pay the principal on our debt and pursue acquisitions of businesses or other strategic investments or uses of capital. We believe the presentation of AFFO is useful to investors by providing measures presented by certain datacenter and cellular tower REITs with which we are sometimes compared. 2 Safe Harbor Information contained in this supplemental presentation that is not historical by nature constitutes “forward-looking statements” which can be identified by the use of forward-looking terminology such as “believes,” “expects,” “plans,” “intends,” “estimates,” “projects,” “could,” “may,” “will,” “should,” or “anticipates” or the negatives thereof, other variations thereon or comparable terminology, or by discussions of strategy. No assurance can be given that future results expressed or implied by the forward-looking statements will be achieved and actual results may differ materially from those contemplated by the forward-looking statements. Such statements are based on management’s current expectations and beliefs and are subject to a number of risks and uncertainties that could cause actual results to differ materially from those expressed or implied by the forward-looking statements. These risks and uncertainties include, but are not limited to, those relating to Zayo Group Holdings, Inc.’s (“the Company” or “ZGH”) financial and operating prospects, current economic trends, future opportunities, ability to retain existing customers and attract new ones, outlook of customers, and strength of competition and pricing. In addition, there is risk and uncertainty in the Company’s acquisition strategy including our ability to integrate acquired companies and assets. Specifically there is a risk associated with our recent acquisitions, and the benefits thereof, including financial and operating results and synergy benefits that may be realized from these acquisitions and the timeframe for realizing these benefits. Other factors and risks that may affect our business and future financial results are detailed in the “Risk Factors” section of our annual report on Form 10-K and most recent Form 10-Q filed with the Securities and Exchange Commission. We caution you not to place undue reliance on these forward-looking statements, which speak only as of their respective dates. We undertake no obligation to publicly update or revise forward-looking statements to reflect events or circumstances after releasing this supplemental information or to reflect the occurrence of unanticipated events, except as required by law. Presentation of Certain Consolidated Pro-forma Financial Data Acquisitions have been, and are expected to continue to be, a component of the Company’s strategy. In this Supplemental Earnings Information under “Foreign Exchange Impact & Exposure,” the Company sets forth its pro-forma annualized revenue growth rate and pro-forma annualized Adjusted EBITDA growth rates for the current fiscal quarter. The adjustments reflected in our pro-forma amounts have not been prepared with a view towards complying with Article 11 of Regulation S-X. These pro-forma measures are intended to provide additional information regarding such rates of growth on a more comparable basis than would be provided without such pro-forma adjustments and are not presented as a measure of our pro-forma financial performance. Non-GAAP Financial Measures The Company provides financial measures that are not defined under generally accepted accounting principles in the United States, or GAAP, including Adjusted EBITDA, Adjusted EBITDA Margin, unlevered free cash flow, adjusted unlevered free cash flow, levered free cash flow, and adjusted funds from operations. Adjusted EBITDA, as defined below and in our Segment Reporting note to our consolidated financial statements and notes thereto, is the primary measure used by our Chief Operating decision maker to evaluate segment operating performance. Adjusted EBITDA is defined as earnings/(loss) from operations before interest, income taxes, depreciation, and amortization (“EBITDA”)adjusted to exclude acquisition or disposal-related transaction costs, losses on extinguishment of debt, stock-based compensation, unrealized foreign currency gains/ (losses) on intercompany loans, and |
Unlevered free cash flow and adjusted unlevered free cash flow have limitations as analytical tools and should not be considered in isolation from, or as a substitute for, analysis of our results as reported under GAAP. For example, unlevered free cash flow: ● ● ● does not reflect changes in, or cash requirements for, our working capital needs; does not reflect the interest expense, or the cash requirements necessary to service the interest payments, on our debt; and does not reflect cash required to pay income taxes. Levered free cash flow and AFFO have limitations as an analytical tool and should not be considered in isolation from, or as a substitute for, analysis of our results as reported under GAAP. For example, levered free cash flow, and AFFO: ● ● ● ● does not reflect principal payments on debt; does not reflect principal payments on capital lease obligations; does not reflect dividend payments, if any; and does not reflect the cost of acquisitions. Our computation of Adjusted EBITDA, unlevered free cash flow, adjusted unlevered free cash flow, levered free cash flow, and AFFO may not be comparable to other similarly titled measures computed by other companies because all companies do not calculate these measures in the same fashion. Because we have acquired numerous entities since our inception and incurred transaction costs in connection with each acquisition, borrowed money in order to finance our operations and acquisitions, and used capital and intangible assets in our business, and because the payment of income taxes is necessary if we generate taxable income after the utilization of our net operating loss carryforwards, any measure that excludes these items has material limitations. As a result of these limitations, these measures should not be considered as a measure of discretionary cash available to us to invest in the growth of our business or as a measure of our liquidity. See “Historical Financial data & Reconciliation” for a quantitative reconciliation of Adjusted EBITDA, and AFFO to net income/(loss) and for a quantitative reconciliation of unlevered free cash flow, adjusted unlevered free cash flow and levered free cash flow to net cash provided by operating activities. Annualized revenue and annualized Adjusted EBITDA are derived by multiplying the total revenue and Adjusted EBITDA, respectively, for the most recent quarterly period by four. Our computations of annualized revenue and annualized Adjusted EBITDA may not be representative of our actual annual results. Measures referred to as being calculated on a constant currency basis are intended to present the relevant information assuming a constant exchange rate between the two periods being compared. Such metrics are calculated by applying the currency exchange rates used in the preparation of the prior period financial results to the subsequent period results. Tables reconciling such non-GAAP measures are included in the Historical Financial Data & Reconciliations section of this presentation. A glossary of terms used throughout is available under the investor section of the Company’s website at http://www.zayo.com/investors/. Components may not sum due to rounding. 3 Non-GAAP Financial Measures (continued) We also monitor Adjusted EBITDA because our subsidiaries have debt covenants that restrict their borrowing capacity that are based on a leverage ratio, which utilizes a modified EBITDA, as defined in our credit agreement and the indentures governing our notes. The modified EBITDA is consistent with our definition of Adjusted EBITDA; however, it includes the pro forma Adjusted EBITDA of and expected cost synergies from the companies acquired by us during the quarter for which the debt compliance certification is due. Adjusted EBITDA results, along with the quantitative and qualitative information, are also utilized by management and our Compensation Committee, as an input for determining incentive payments to employees. Adjusted EBITDA has limitations as an analytical tool and should not be considered in isolation from, or as a substitute for, analysis of our results of operations and operating cash flows as reported under GAAP. For example, Adjusted EBITDA: ●does not reflect capital expenditures, or future requirements for capital and major maintenance expenditures or contractual commitments; ●does not reflect changes in, or cash requirements for, our working capital needs; ●does not reflect the interest expense, or the cash requirements necessary to service the interest payments, on our debt; and ●does not reflect cash required to pay income taxes. |
|
|
mission accelerate our customers’ capabilities to advance freedom and prosperity by providing enormous, high-quality bandwidth zayo 4
|
vision amass fiber and data center assets, then unleash their value by providing exceptional communications infrastructure services zayo 5
|
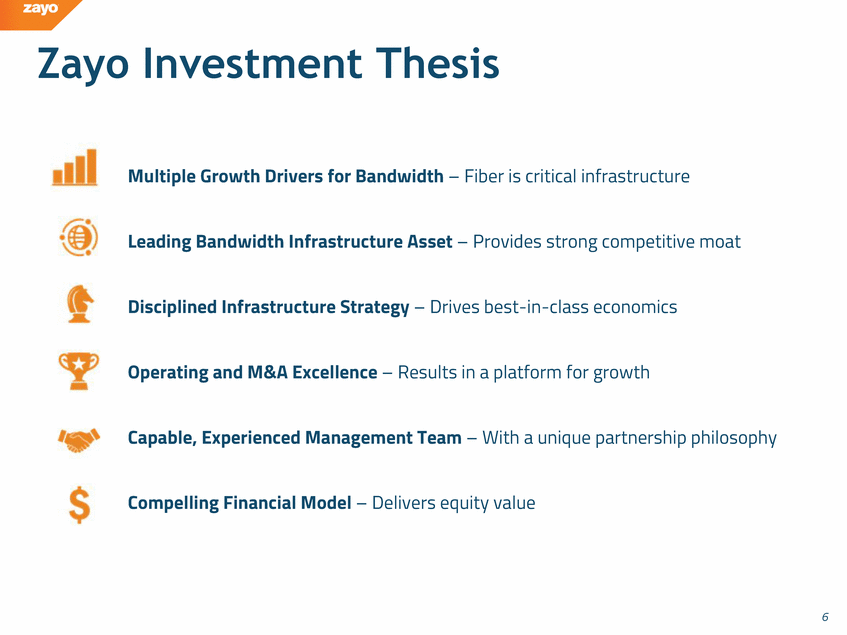
6 Multiple Growth Drivers for Bandwidth – Fiber is critical infrastructure Leading Bandwidth Infrastructure Asset – Provides strong competitive moat Disciplined Infrastructure Strategy – Drives best-in-class economics Operating and M&A Excellence – Results in a platform for growth Capable, Experienced Management Team – With a unique partnership philosophy Compelling Financial Model – Delivers equity value Zayo Investment Thesis
|
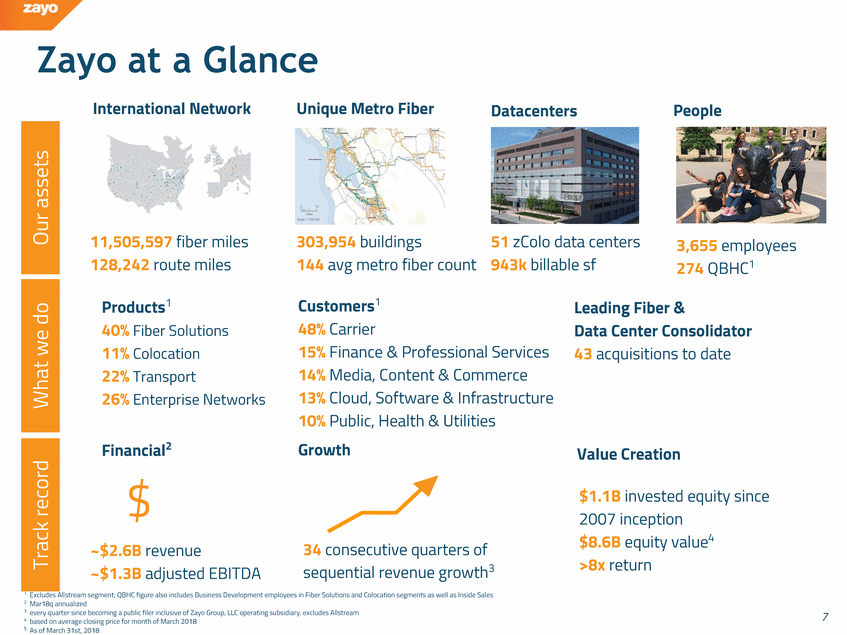
International Network Unique Metro Fiber Datacenters People data centers le sf 274 QBHC1 Customers1 Products1 40% Fiber Solutions 11% Colocation 22% Transport 26% Enterprise Networks Leading Fiber & 48% Carrier Data Center Consolidator 15% Finance & Professional Services 43 acquisitions to date 14% Media, Content & Commerce 13% Cloud, Software & Infrastructure 10% Public, Health & Utilities Financial2 $ sequential revenue growth3 1 Excludes Allstream segment; QBHC figure also includes Business Development employees in Fiber Solutions and Colocation segments as well as Inside Sales 2 Mar18q annualized 3 every quarter since becoming a public filer inclusive of Zayo Group, LLC operating subsidiary. excludes Allstream 4 based on average closing price for month of March 2018 5 As of March 31st, 2018 7 What we do Our assets 34 consecutive quarters of ~$2.6B revenue ~$1.3B adjusted EBITDA $1.1B invested equity since 2007 inception $8.6B equity value4 >8x return Track record 3,655 employees 51 zColo 943k billab 11,505,597 fiber miles 128,242 route miles 303,954 buildings 144 avg metro fiber count Growth Value Creation Zayo at a Glance |
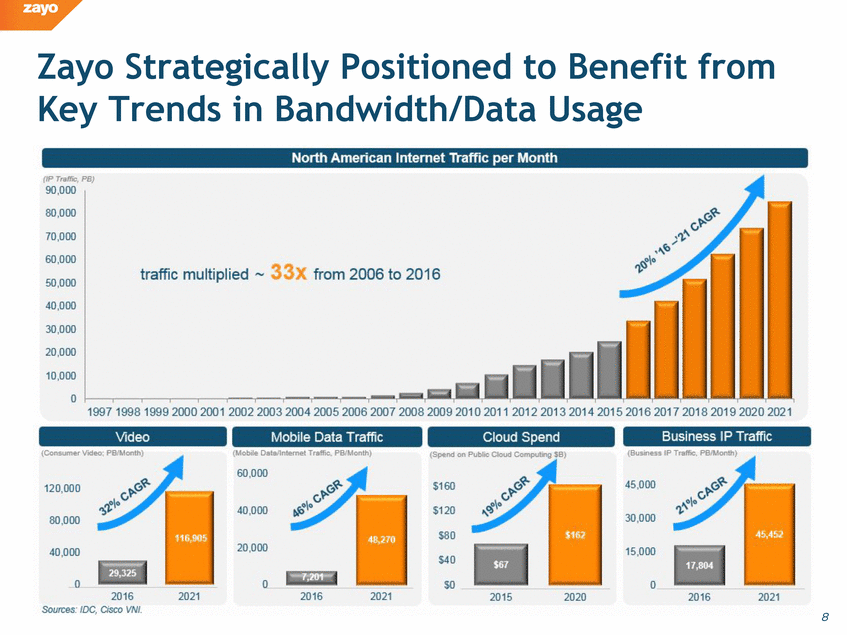
8 Zayo Strategically Positioned to Benefit from Key Trends in Bandwidth/Data Usage north American internet traffic per month 90,000 80,000 70,000 60,000 50,000 40,000 30,000 20,000 10,000 0 1997 1998 2000 2001 2002 2003 2004 2005 2006 2007 2008 2009 2010 2011 2012 2013 2014 2015 2016 2017 2018 2019 2020 2021 traffic multiplied ~ 33x from 2006 to 2016 20% 16 – 21 CAGR video mobile data traffic cloud spend business ip traffic (consumer vide: PB/Month) (mobile data/internet traffic, pb/month) (spend on public cloud computing $b) (business ip traffic, pb/month) 120,000 80,000 40,000 29,325 116,905 sources: IDC, cisco vni. 60,000 40,000 20,000 7,201 48,270 $160 $120 $80 $40 $0 $67 $162 45,000 30,000 15,000 17,804 45,452 21% cagr 19% cagr 46% cagr
|
|
|
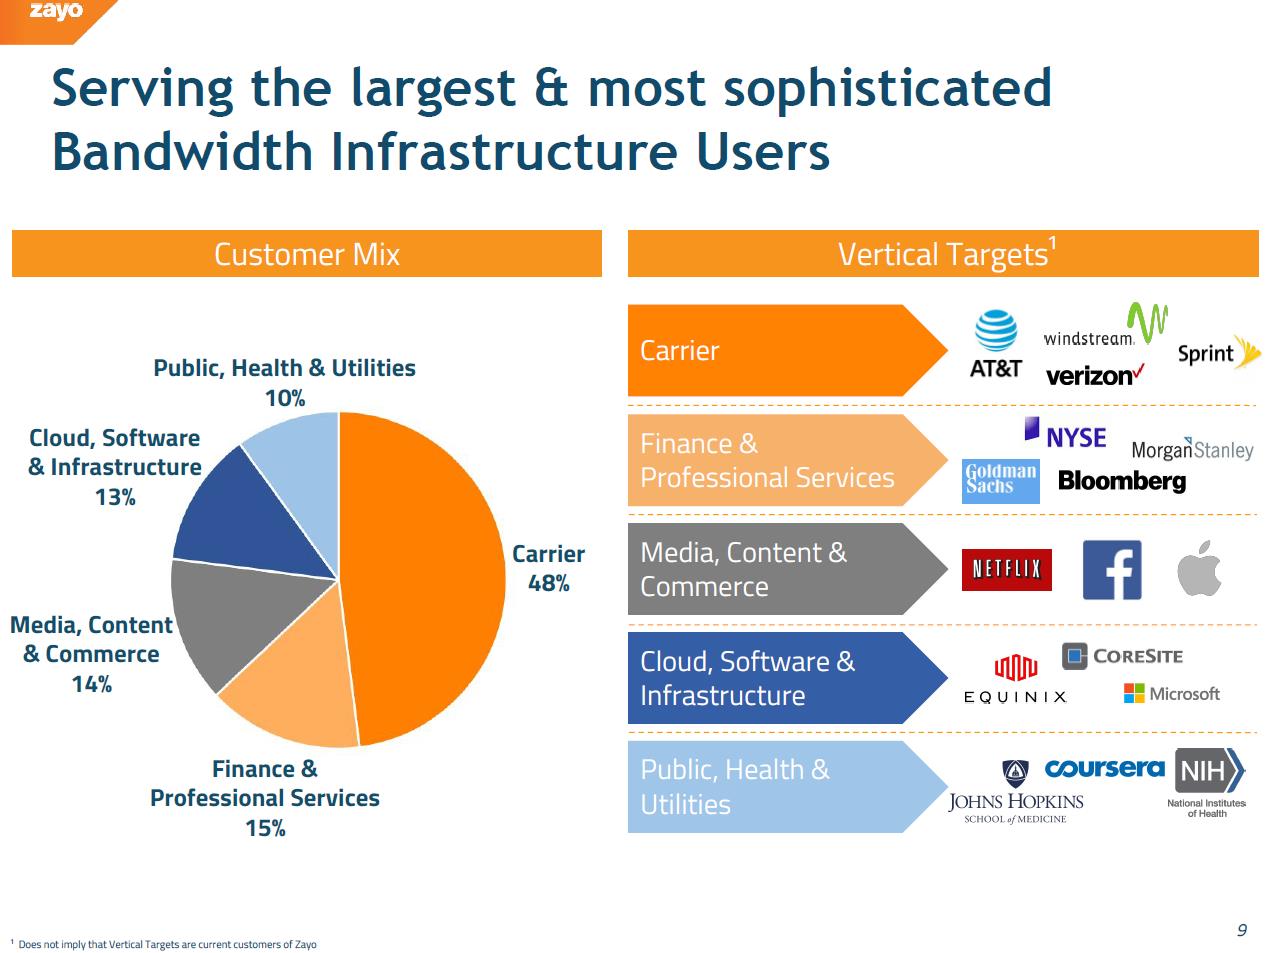
Serving the largest & most sophisticated bandwidth infrastructure users customer mix vertical targets1 public, health & utilities 10% cloud, software & infrastructure 13% media, content & commerce finance & professional services 15% carrier 48% carrier Finance & professional services media, content & commerce cloud, software & infrastructure public, health & utilities
|
|
|
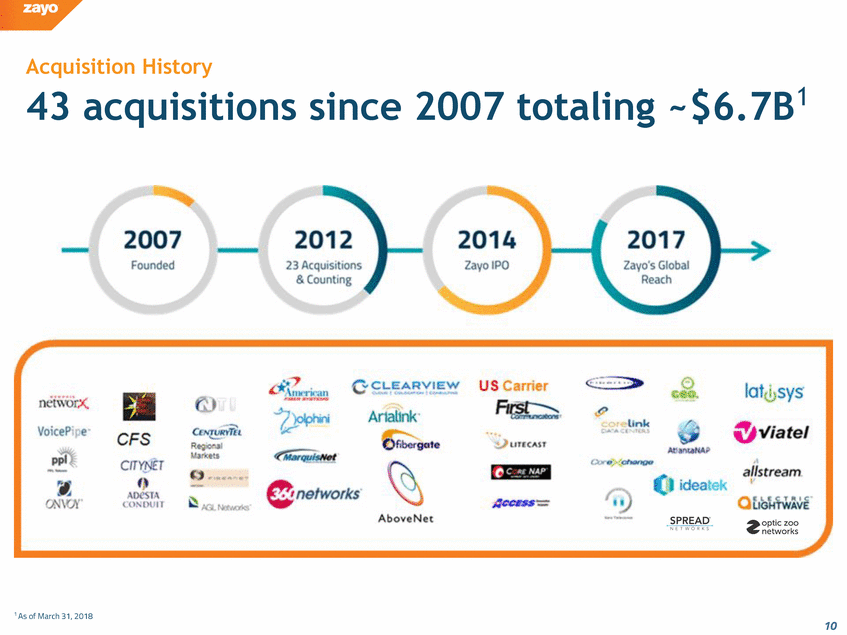
Acquisition History ~$6.7B1 43 acquisitions since 2007 totaling 1 As of March 31, 2018 10 2007 founded 2012 23 acquisitions & counting 2014 zayo ipo 2017 zayo’s global reach |
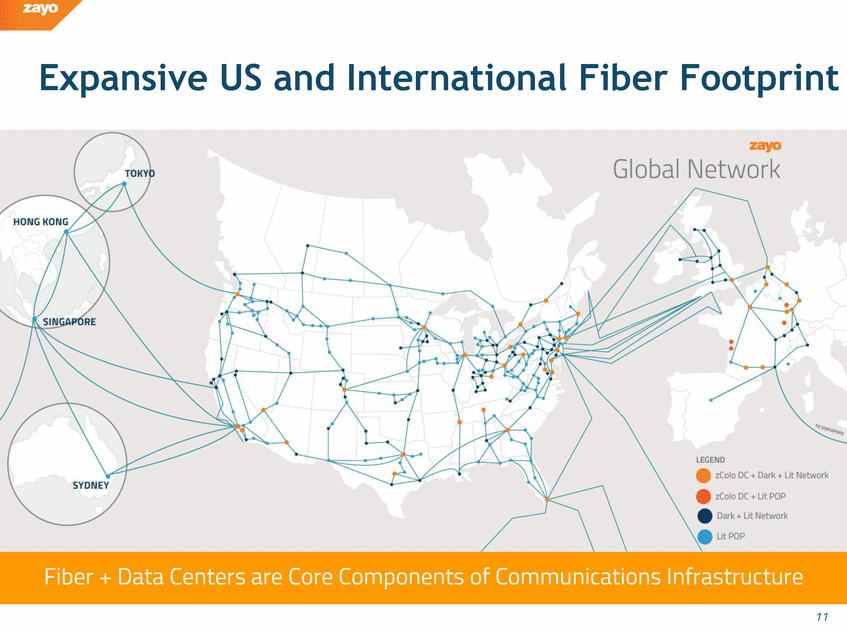
Expansive US and International Fiber Footprint Global Network LEGEND zColo DC + Dark + Lit Network e zColo DC + Lit POP e Dark + Lit Network eUtPOP 11 tokyo hong kong Singapore Sydney
|
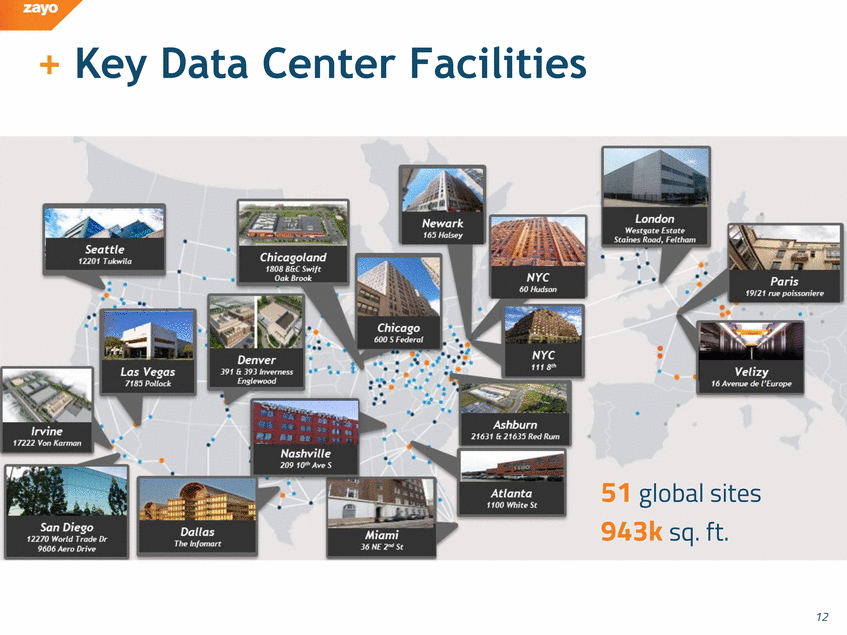
51 global sites 943k sq. ft. 12 +Key Data Center Facilities zayo seattle 12201 tukwila Chicagoland 1808 b&c swift 0ak brook Newark 165 halsey nyc 60 hudon London westgate estate straines road, feltham paris 19/21 rue poissoniere velizy 16 avenue de l’europe nyc 111 8th ashburn 21631 & 21635 red rum atlanta 1100 whit st Miami 36 ne 2nd st Nashville 209 10th ave s Denver 391 & 393 Inverness Englewood las vegas 7185 pollock Irvine 17222 von karmon san diego 12270 world trade dr 9606 aero drive dallas the Infomart 12
|
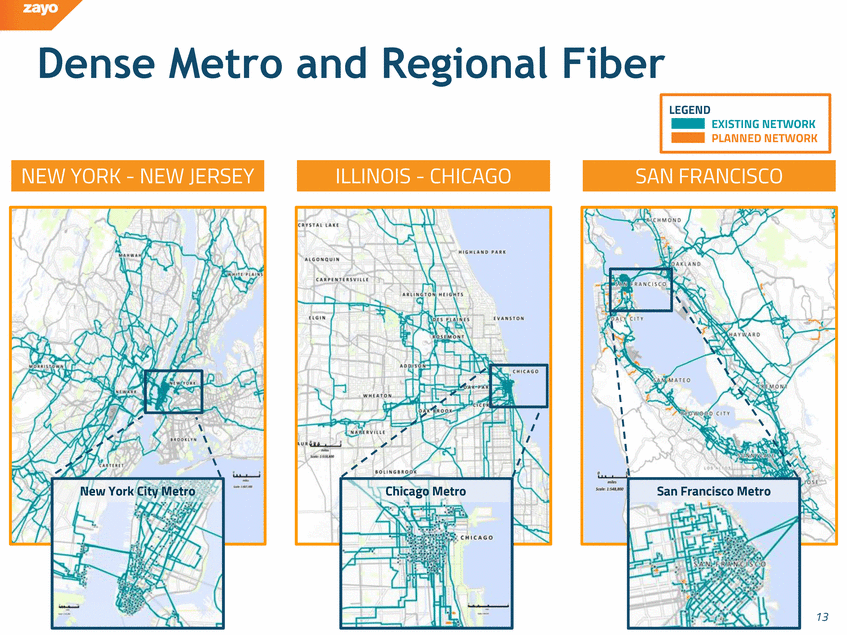
San Francisco Metro 13 Chicago Metro New York City Metro ILLINOIS - CHICAGO SAN FRANCISCO NEW YORK - NEW JERSEY Dense Metro and Regional Fiber LEGEND EXISTING NETWORK PLANNED NETWORK new York city metro Chicago metro san Francisco metro
|
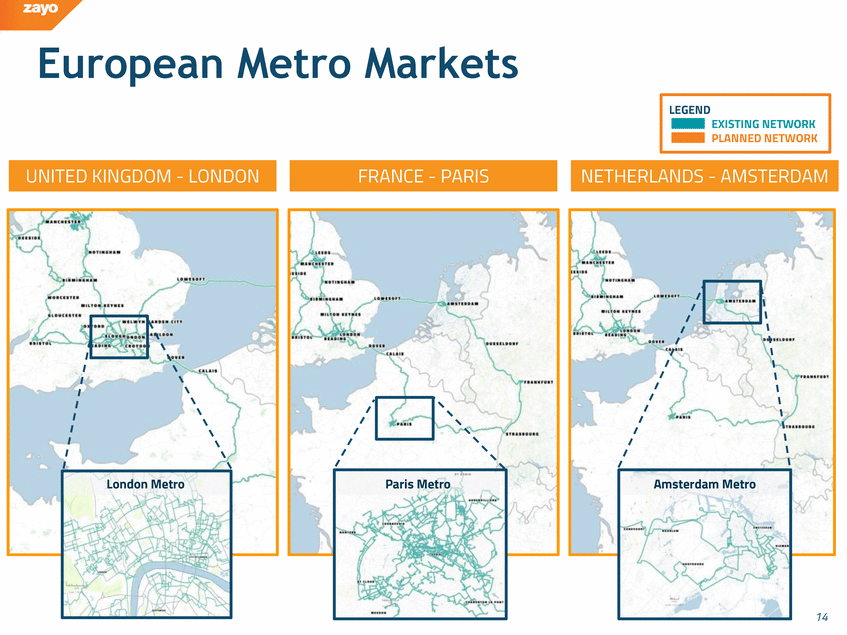
14 Amsterdam Metro Paris Metro London Metro FRANCE - PARIS NETHERLANDS - AMSTERDAM UNITED KINGDOM - LONDON European Metro Markets LEGEND EXISTING NETWORK PLANNED NETWORK London metro paris metro Amsterdam metro
|
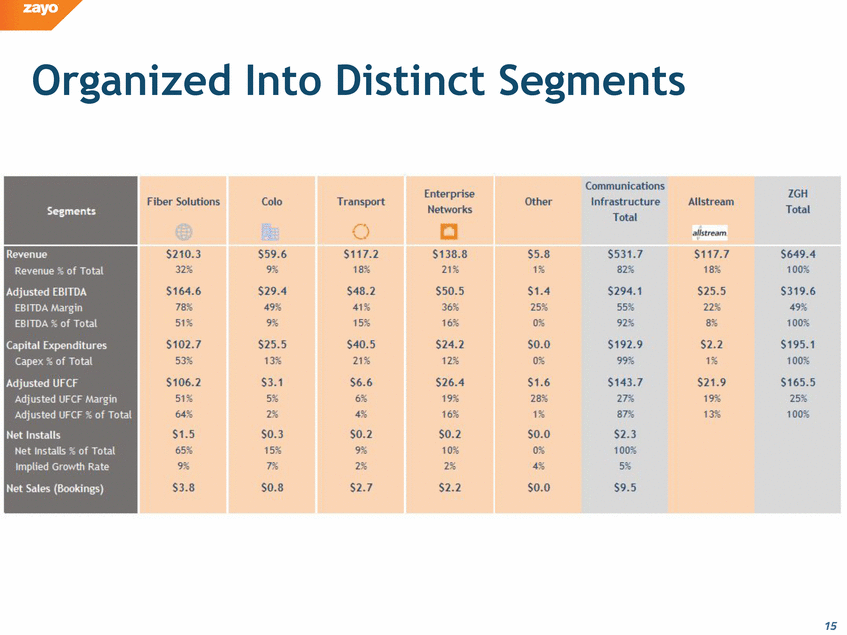
Organized Into Distinct Segments Communications Infrastructure Total Enterprise Networks Fiber Solutions Colo Transport Other Allstream Segments ) $117.2 18,o /l$tream $210.3 32,c $59.6 9 o $138.8 21 ·C $5.8 L·c $531.7 82 c $117.7 181' Revenue Revenue % of Total Adjusted EBITDA EBITDA Margin EBITDA 1£ of Total $164.6 78c 51" $102.7 53,.: $29.4 49 Jc 9 $48.2 41 · 15,6 $50.5 36 .c 16=1: $1.4 25. o.. $0.0 0: $294.1 55;f 92J' $25.5 22,c 8 $25.5 13-$40.5 2L ' $24.2 12·-$192.9 99 $2.2 1 ,: $21.9 19 c 13,c Capital Expenditures Capex % of Total $106.2 51.tc 64,c $1.5 65 9 : $3.1 5 0 2; $0.3 15 c 7:.)t.o' $6.6 6"' 4. $0.2 91-2,' $26.4 19 . - 16 . $0.2 1 Q, 2 : $1.6 28 0 1, so.o o; 4:1).' so.o $143.7 27 8Tf $2.3 1oo:). 57' Adjusted UFCF Adjusted UFCF Margin Adjusted UFCF % of Total Net Installs Net Installs % of Total $3.8 $0.8 $2.7 $2.2 $9.5 Net Sales (Bookings) 15 Implied Growth Rate ZGH Total $649.4 100% $319.6 49% 100% 195.1 100% $165.5 25% 100% 32% 78% 51% 53% 64% 65% 9% 49% 9% 13% 5% 2% 15% 7% 18% 41% 15% 21% 6% 4% 9% 2% 1% 25% 0% 28% 1% 4% 82% 55% 92% 99% 27% 87% 100% 5%
|
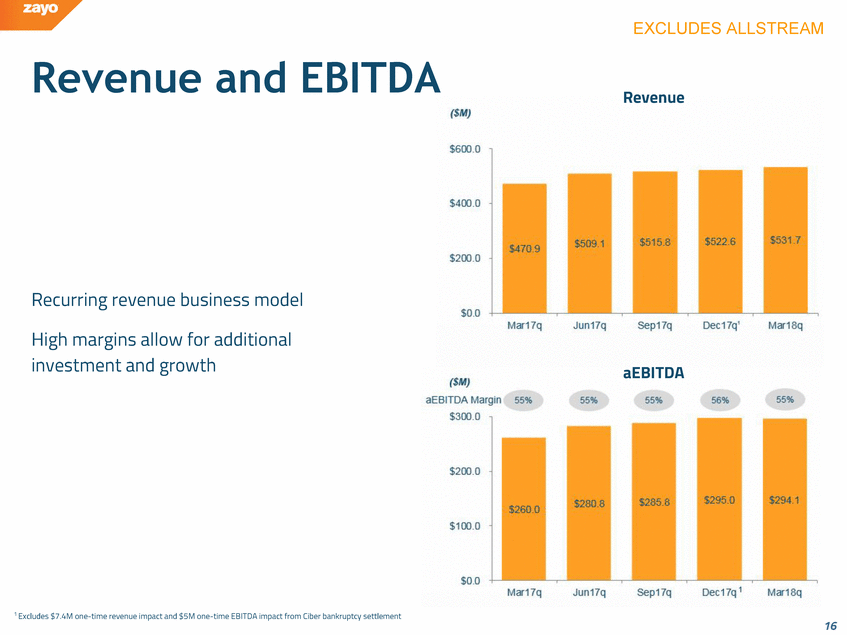
EXCLUDES ALLSTREAM Revenue and EBITDA Revenue Recurring revenue business model High margins allow for additional investment and growth Revenue ($M) ($M) $600.0 $400.0 $200.0 $0.0 Mar17q Jun17q Sep17q Dec17q Mar18q $470.9 $509.1 $515.8 $522.6 $531.7 ($M) aEBITDA Margin aEBITDA 55% 55% 55% 56% 55% $300.0 $200.0 $100.0 $0.0 Mar17q Jun17q Sep17q Dec17q1 Mar18q 1 Excludes $7.4M one-time revenue impact and $5M one-time EBITDA impact from Ciber bankruptcy settlement 16
|
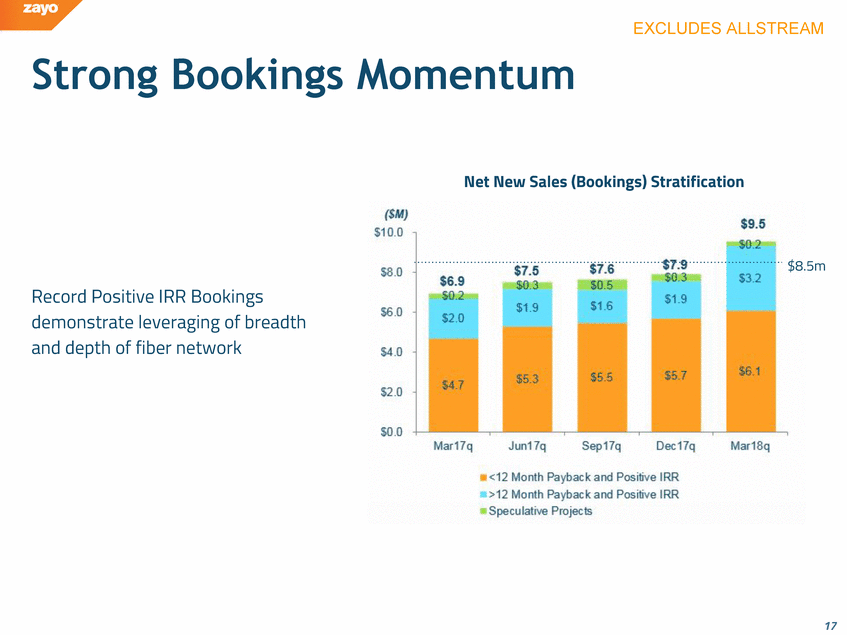
EXCLUDES ALLSTREAM Strong Bookings Momentum Net New Sales (Bookings) Stratification $8.5m Record Positive IRR Bookings demonstrate leveraging of breadth and depth of fiber network ($M) $10.0 $8.0 $6.0 $4.0 $2.0 $0.0 Mar17q Jun17q Sep17q Dec17q Mar18q $4.7 $5.3 $5.5 $5.7 $6.1 $2.0 $1.9 $1.6 $1.9 $3.2 $0.2 $0.3 $0.5 $0.3 $0.2 $6.9 $7.5 $7.6 $7.9 $9.5 <12 Month Payback and Positivie IRR >12 Month Payback and Positivie IRR Speculative Projects 17
|
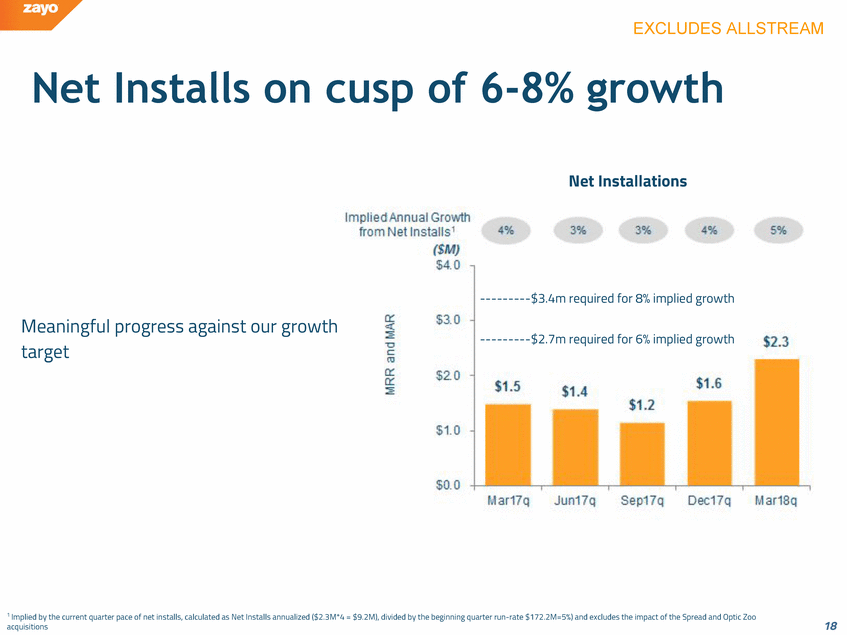
EXCLUDES ALLSTREAM Net Installs on cusp of 6-8%growth Net Installations Implied Annual Growth from Net Installs 1 4% 3% 3$ 4% 5% ($M) $4.0 $3.0 $2.0 $1.0 $0.0 ---------$3.4m required for 8% implied growth $1.5 $1.4 $1.2 $1.6 $2.3 Mar17q Jun17q Sep17q Dec17q Mar18q Meaningful progress against our growth target MRR and MAR ---------$2.7m required for 6% implied growth 1 Implied by the current quarter pace of net installs, calculated as Net Installs annualized ($2.3M*4 = $9.2M), divided by the beginning quarter run-rate $172.2M=5%) and excludes the impact of the Spread and Optic Zoo acquisitions 18
|
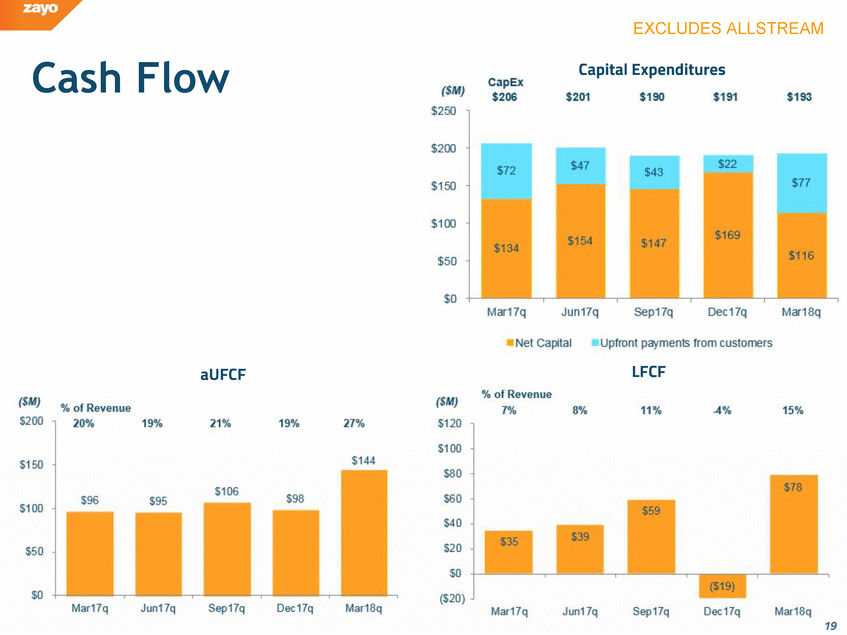
EXCLUDES ALLSTREAM Cash Flow Capital Expenditures CapEx $206 $201 $190 $191 $193 ($M) $250 $200 $150 $100 $50 $0 Mar17q Jun17q Sep17q Dec17q Mar18q $72 $47 $43 $22 $77 $134 $154 $147 $169 $116 Net Capital Upfront payments from customers aUFCF ($M) $200 $150 $100 $50 $0 Mar17q Jun17q Sep17q Dec17q Mar18q % of Revenue 20% 19% 21% 19% 27% $96 $95 $106 $98 $144 LFCF ($M) % of Revenue 7% 8% 11% -4% 15% $120 $100 $80 $60 $40 $20 $0 ($20) Mar17q Jun17q Sep17q Dec17q Mar18q $35 $39 $59 ($19) $78 19
|
|
|
While Zayo is a c-corp,manyofits communications infrastructure peers are REITS 20
|
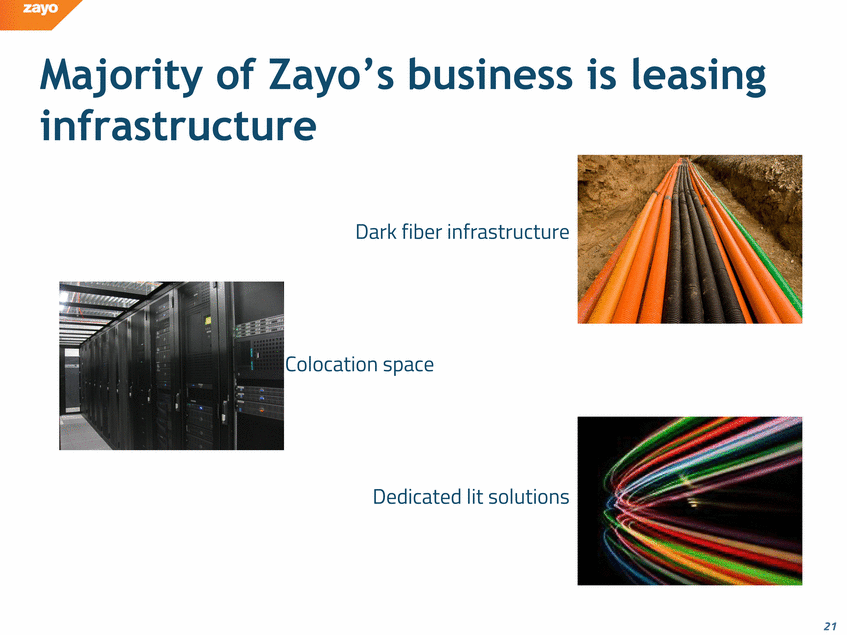
Majority of Zayo’s business infrastructure is leasing infrastructure Dark fiber infrastructure Colocation space Dedicated lit solutions 21
|
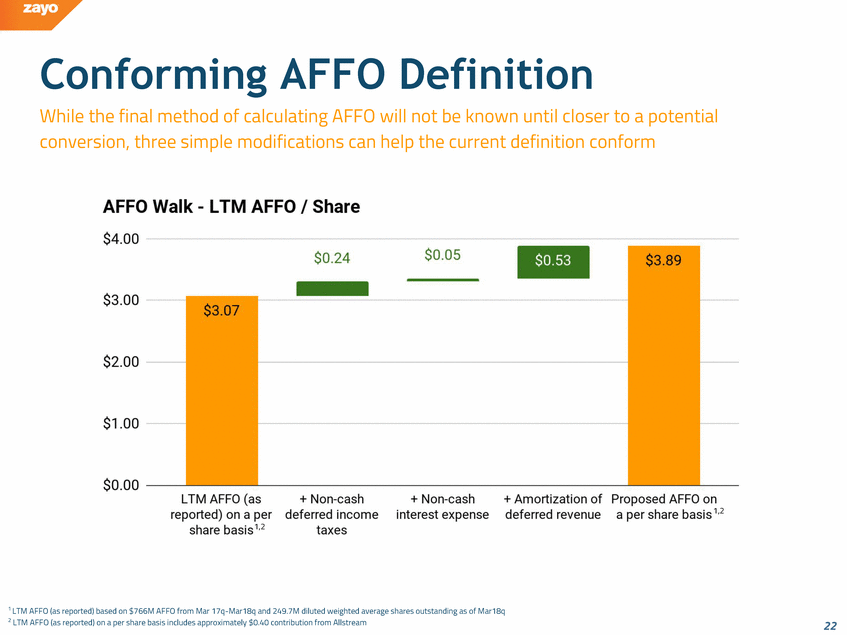
Conforming AFFO Definition While the final method of calculating AFFO will not be known until closer to a potential conversion, three simple modifications can help the current definition conform AFFO Walk – LTM AFFO / Share $4.00 $3.00 $2.00 $1.00 $0.00 $3.07 $0.24 $0.05 $0.53 $3.89 LTM AFFO (as reported) on a per share basis 1,2 + Non-cash deferred income taxes + Non-cash interest expense + Amortization of deferred revenue Proposed AFFO on a per share basis 1,2 1 LTM AFFO (as reported) based on $766M AFFO from Mar 17q-Mar18q and 249.7M diluted weighted average shares outstanding as of Mar18q 2 LTM AFFO (as reported) on a per share basis includes approximately $0.40 contribution from Allstream 22
|
|
|
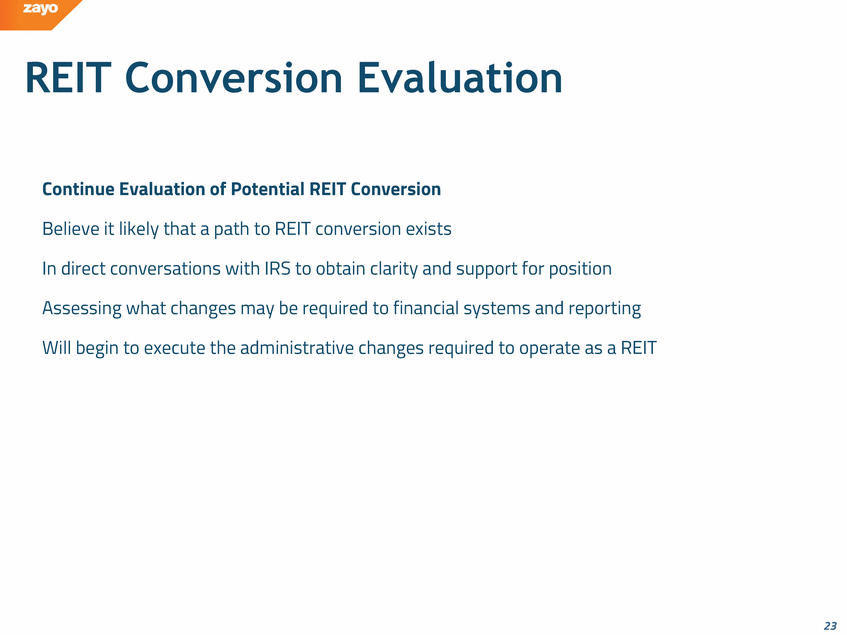
REIT Conversion Evaluation Continue Evaluation of Potential REIT Conversion Believe it likely that a path to REIT conversion exists In direct conversations with IRS to obtain clarity and support for position Assessing what changes may be required to financial systems and reporting Will begin to execute the administrative changes required to operate as a REIT 23
|
HISTORICAL FINANCIAL DATA & RECONCILIATIONS zayo
|
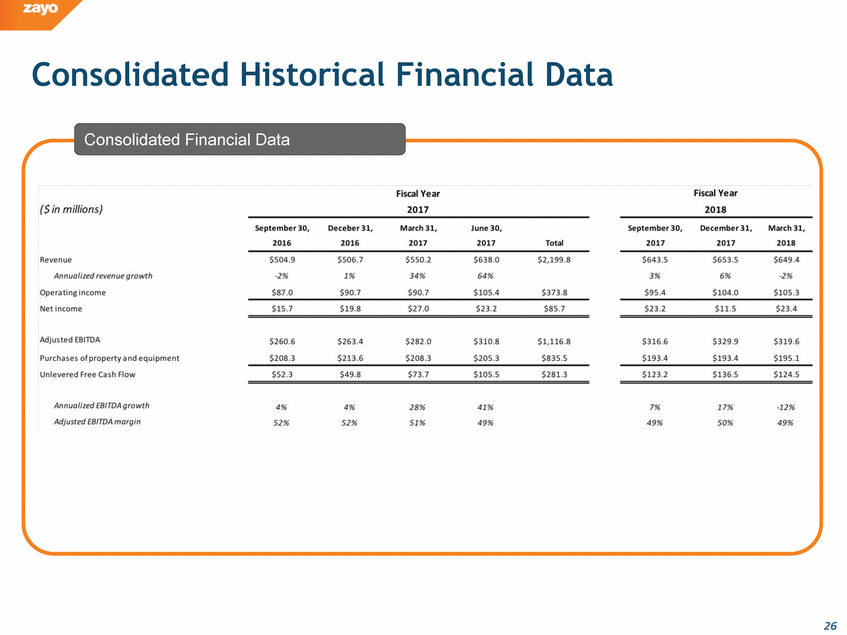
Consolidated Historical Financial Data Consolidated Financial Data Consolidated Financial Data ($ in millions) Fiscal Year 2017 2018 September 30, 2016 December 31, 2016 March 31, 2017 June 30, 2017 Total September 30, 2017 December 31, 2017 March 31, 2018 Revenue $504.9 $506.7 $ 550.2 $638.0 $2,199.8 $643.5 $653.5 $649.4 Annualized revenue growth -2% 1% 34% 64% 3% 6% -2% Operating income $87.0 $90.7 $90.7 $105.4 $373.8 $95.4 $104.0 $105.3 Net income $15.7 $19.8 $27.0 $23.2 $85.7 $23.2 $11.5 $23.4 Adjusted EBITDA $260.6 $263.4 $282.0 $310.8 $1,116.8 $316.6 $329.9 $319.6 Purchases of property and equipment $208.3 $213.6 $208.3 $205.3 $835.5 $193.4 $193.4 $195.1 Unlevered Free Cash Flow $52.3 $49.8 $73.7 $105.5 $281.3 $123.2 $136.5 $124.5 Annualized EBITDA growth 4% 4% 28% 41% 7% 17% -12% Adjusted EBITDA margin 52% 52% 51% 49% 49% 50% 49%. 26
|
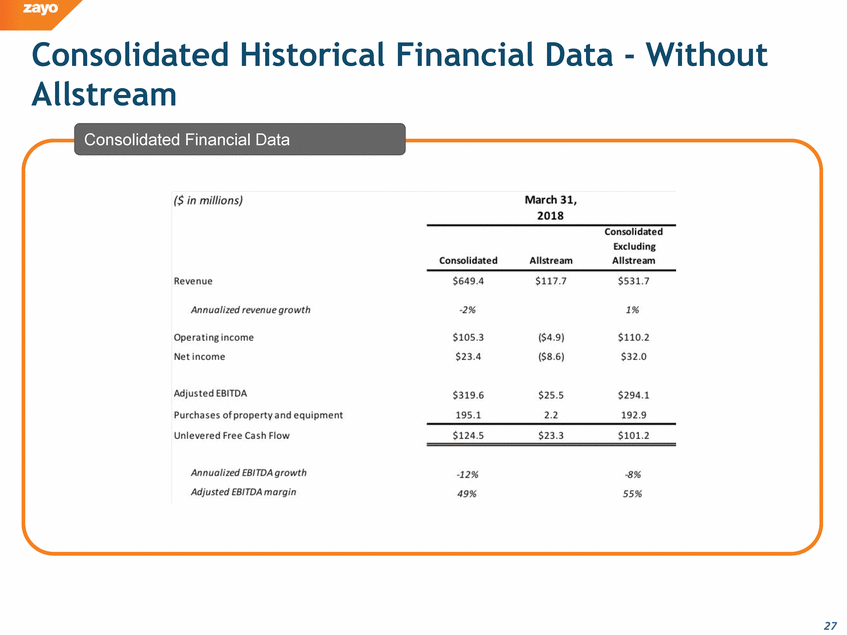
Consolidated Historical Financial Data - Without Allstream Consolidated Financial Data ($ in millions) March 31, 2018 Consolidated Allstream Consolidated Excluding Allstream Revenue $649.4 $111.7 $531.7 Annualized revenue growth -2% 1% Operating income $105.3 ($4.9) $110.2 Net income $23.4 ($8.6) $32.0 Adjusted EBITDA $319.6 $25.5 $294.1 Purchases of property and equipment 195.1 2.2 192.9 Unlevered Free Cash Flow $124.5 $23.3 $101.2 Annualized EBITDA growth -12% -8% Adjusted EBITDA margin 49% 55% 27
|
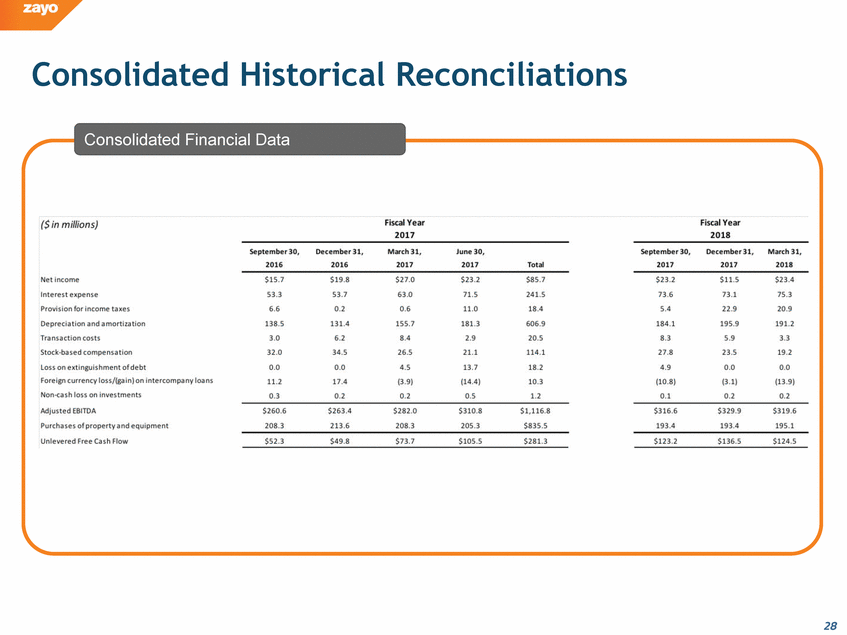
Consolidated Historical Reconciliations Consolidated Financial Data 28 consolidated financial data ($ in millions) net income interest expense provision for income taxes depreciation and amortization transaction costs stock based compensation loss on extinguishment of debt foreign currency loss/(gain) on intercompany loans non-cash loss on investments adjusted EBITDA purchases of property and equipment unlevered free cash flow September 30, December 31, march 31, june 30, 2017 2016 total 2018 fiscal year $15.7 $3.3 6.6 138.5 3.0 32.0 0.0 11.2 0.3 $260.6 208.3 $52.3 $19.8 $3.7 0.2 131.4 6.2 34.5 0.0 17.4 0.2 $263.4 213.6 $49.8 $27.0 63.0 0.6 155.7 8.4 26.5 4.5 (3.9) 0.2 $282.0 208.3 $73.7 $23.2 71.5 11.0 181.3 2.9 21.1 13.7 (14.4) 0.5 $310.8 205.3 $105.5 $85.7 241.5 18.4 606.9 20.5 114.1 18.2 10.3 1.2 $1,116.8 $835.5 $281.3 $23.2 73.6 5.4 184.1 8.3 27.8 4.9 (10.8) 0.1 $316.6 193.4 $123.2 $11.5 73.1 22.9 195.9 5.9 23.5 0.0 (3.1) 0.2 $329.9 193.4 $136.5 $23.4 75.3 20.9 191.2 3.3 19.2 0.0 (13.9) 0.2 $319.6 195.1 $124.5
|
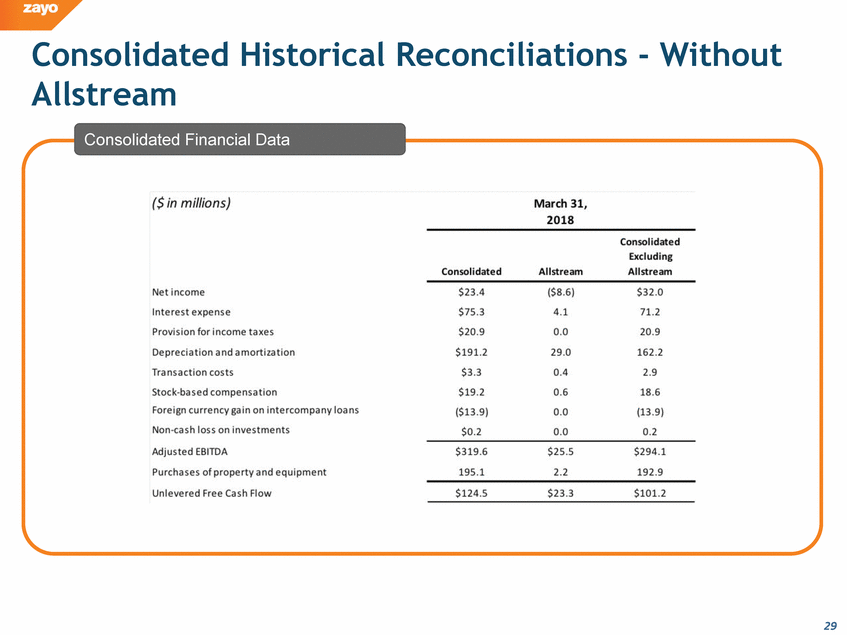
Consolidated Historical Allstream Reconciliations - Without Consolidated Financial Data 29 consolidated financial data ($ in millions) march 31, 2018 net income interest expense provision for income taxes depreciation and amortization transaction costs stock-based compensation foreign currency gain on intercompany loans Non-cash loss on investments adjusted EBITDA purchases of property and equipment unievered free cash flow consolidated allstream consolidated excluding allstream $23.4 $75.3 $20.9 $191.2 $3.3 $19.2 ($13.9) $0.2 $319.6 195.1 $124.5 ($8.6 4.1 0.0 29.0 0.4 0.6 $25.5 2.2 $23.3 $32.0 71.2 20.9 162.2 2.9 18.6 (13.9) 0.2 $294.1 192.9 $101.2
|
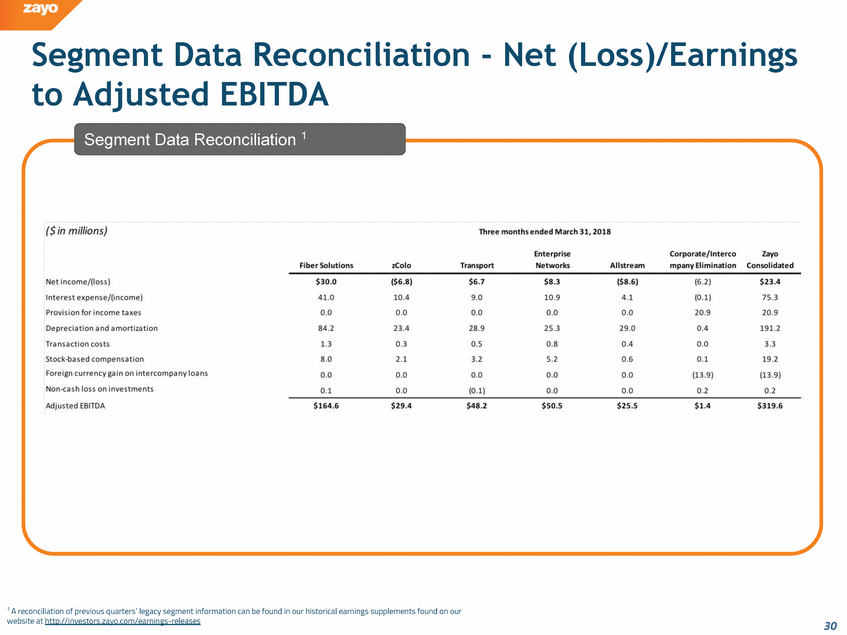
Segment Data Reconciliation - Net (Loss)/Earnings to Adjusted EBITDA Segment Data Reconciliation 1 1 A reconciliation of previous quarters’ legacy segment information can be found in our historical earnings supplements found on our website at http://investors.zayo.com/earnings-releases 30 segment data reconciliation 1 ($ in millions) net income/(loss) interest expense/(income) provision for income taxes depreciation and amortization transaction costs stock-based compensation foreign currency gain on intercompany loans Non-cash loss on investments adjusted EBITDA three months ended march 31, 2018 fiber solutions zcolo transport enterprise networks allstream corporate/intercompany elimination consolidated zayo $30.0 41.0 0.0 84.2 1.3 8.0 0.0 0.1 $164.6 ($6.8) 10.4 23.4 0.3 2.1 $29.4 $6.7 9.0 28.9 0.5 3.2 (0.1) $48.2 $8.3 10.9 25.3 0.8 5.2 $50.5 ($8.6) 4.1 29.0 0.4 0.6 $25.5 (6.2) (0.1) 20.9 0.4 (13.9) 0.2 $1.4 $23.4 75.3 20.9 191.2 3.3 19.2 (13.9) 0.2 $319.6
|
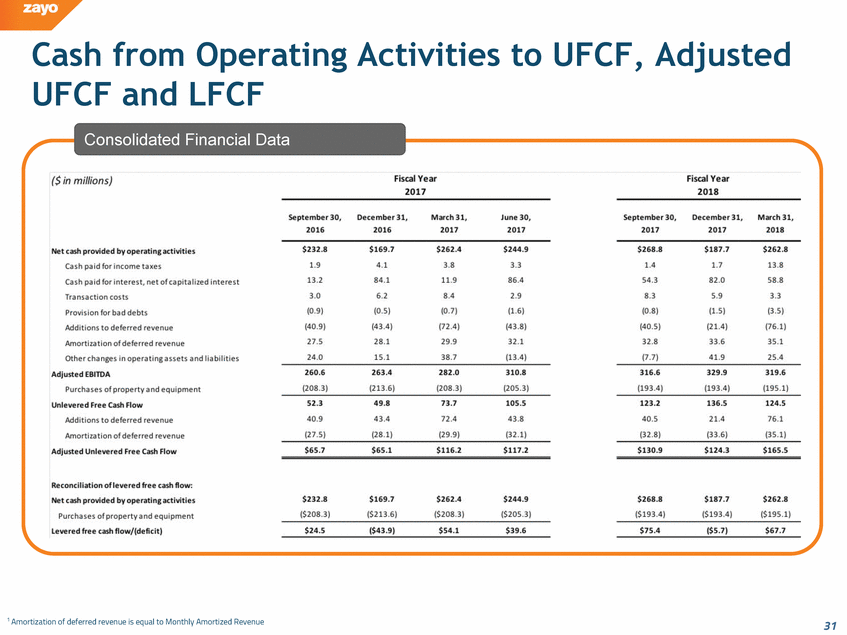
Cash from Operating UFCF and LFCF Activities to UFCF, Adjusted Consolidated Financial Data 1 Amortization of deferred revenue is equal to Monthly Amortized Revenue 31 consolidated financial data ($ in millions) fiscal year 2017 2018 september 30, December 31, march 31, june 30, 2017 2016 net cash provided by operating activities cash paid for income taxes cash paid for interest, net of capitalized interest transaction costs provision for bad debts additions to deferred revenue amortization of deferred revenue other changes in operating assets and liabilities adjusted ebitda purchases of property and equipment unlevered free cash flow additions to deferred revenue amortization of deferred revenue adjusted unlevered free cash flow reconciliation of levered free cash flow: net cash provided by operating activities purchases of property and equipment levered free cash flow/(deficit) $232.8 1.9 13.2 3.0 (0.9) (40.9) 27.5 24.0 260.6 (208.3) 52.3 40.9 (27.5) $65.7 $232.8 ($208.3) $24.5 $169.7 4.1 84.1 6.2 (0.5) (43.4) 28.1 15.1 263.4 (213.6) 49.8 43.4 (28.1) $65.1 $169.7 ($213.6) ($43.9) $262.4 3.8 11.9 8.4 (0.7) (72.4) 29.9 38.7 282.0 (208.0) 73.7 72.4 (29.9) $116.2 $262.4 ($208.3) $54.1 $244.9 3.3 86.4 2.9 (1.6) (43.8) 32.1 (13.4) 310.8 (205.3) 105.5 43.8 (32.1) $117.2 $244.9 ($205.3) $39.6 $268.8 1.4 54.3 8.3 (0.8) (40.5) 32.8 (7.7) 316.6 (193.4) 123.2 40.5 (32.8) $130.9 $268.8 ($193.4) $75.4 $187.7 1.7 82.0 5.9 (1.5) 33.6 (21.4) 41.9 329.9 (193.4) 136.5 21.4 (33.6) $124.3 $187.7 ($193.4) ($5.7) $262.8 13.8 58.8 3.3 (3.5) (76.1) 35.1 25.4 319.6 (195.1) 124.5 76.1 (35.1) $165.5 $262.8 ($195.1) $67.7
|
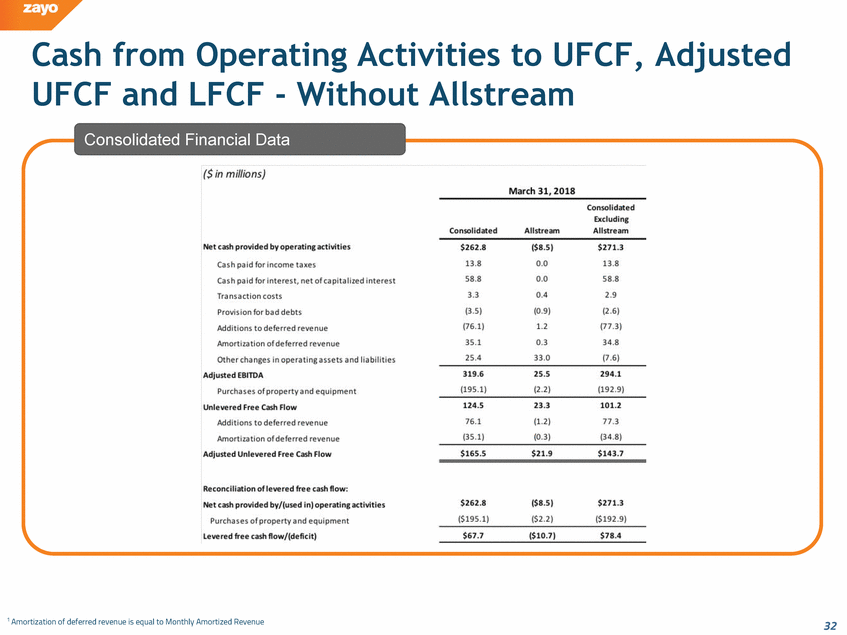
Cash from Operating Activities to UFCF, Adjusted UFCF and LFCF - Without Allstream Consolidated Financial Data 1 Amortization of deferred revenue is equal to Monthly Amortized Revenue 32 consolidated financial data ($ in millions) march 31, 2018 consolidated allstream consolidated excluding allstream net cash provided by operating activities cash paid for income taxes cash paid for interest, net of capitalized interest transaction costs provision for bad debts additions to deferred revenue amortization of deferred revenue other changes in operating assets and liabilities adjusted ebitda purchases of property and equipment unlevered free cash flow additions to deferred revenue amortization of deferred revenue adjusted unlevered free cash flow reconciliation of levered free cash flow: net cash provided by/(used in) operating activities purchases of property and equipment levered free cash flow/(deficit) $26.2.8 13.8 58.8 3.3 (3.5) (76.1) 35.1 25.4 319.6 (195.1) 124.5 76.1 (35.1) $165.5 $262.8 ($195.1) $67.7 ($8.5) 0.0 0.4 (0.9) 1.2 0.3 33.0 25.5 (2.2) 23.3 (1.2) (0.3) $21.9 ($8.5) ($2.2) ($10.7) $271.3 13.8 58.8 2.9 (2.6) (77.3) 34.8 (7.6) 294.1 (192.9) 101.2 77.3 (34.8) $143.7 $271.3 ($192.9) $78.4
|
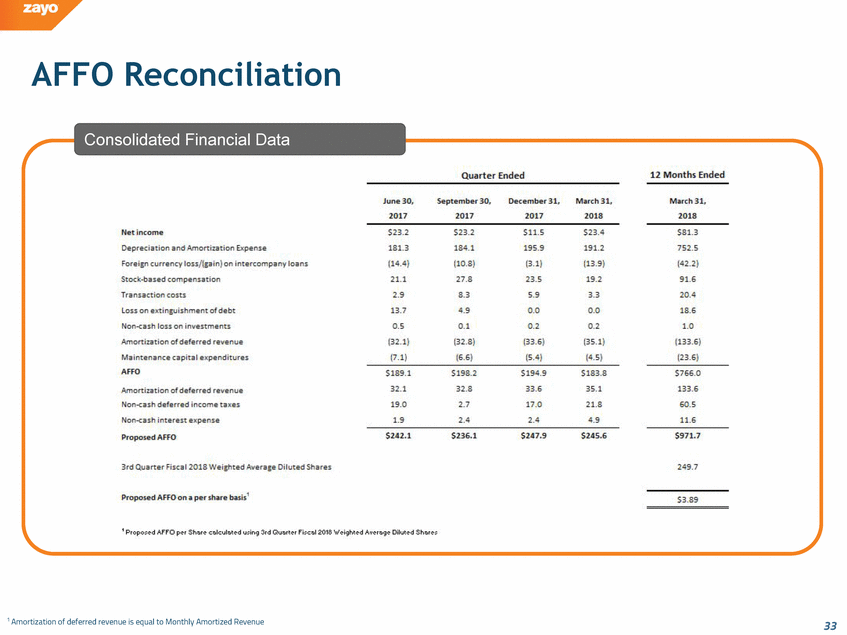
AFFO Reconciliation Consolidated Financial Data Quarter Ended 12 Months Ended June 30, 2017 September 30, 2017 December 31, 2017 March 31, 2018 March 31, 2018 Net income $23.2 $23.2 $11.5 $23.4 $81.3 Depreciation and Amortization Expense 181.3 184.1 195.9 191.2 752.5 Foreign currency loss/(gain) on intercompany loans (14.4) (10.8) (3.1) (13.9) (42.2) Stock-based compensation 21.1 27.8 23.5 19.2 91.6 Transaction costs 2.9 8.3 5.9 3.3 20.4 Loss on extinguishment of debt 13.7 4.9 0.0 0.0 18.6 Non-cash loss on investments 0.5 0.1 0.2 0.2 1.0 Amortization of deferred revenue (32.1) (32.8) (33.6) (35.1) (133.6) Maintenance capital expenditures (7.1) (6.6) (5.4) (4.5) (23.6) AFFO $189.1 $198.2 $194.9 $ 183.8 $766.0 Amortization of deferred revenue 32.1 32.8 33.6 35.1 133.6 Non-cash deferred income taxes 19.0 2.7 17.0 21.8 60.5 Non-cash interest expense 1.9 2.4 2.4 4.9 11.6 Proposed AFFO $242.1 $236.1 $247.9 $245.6 $971.7 3rd Quarter Fiscal 2018 Weighted Average Diluted Shares 249.7 Proposed AFFO on a per share basis1 $3.89 1 Proposed AFFO per Share calculated using 3rd Quarter Fiscal 2018 Weighted Average Diluted Shares 1 Amortization of deferred revenue is equal to Monthly Amortized Revenue 33
|