UNITED STATES
SECURITIES AND EXCHANGE COMMISSION
Washington, D.C. 20549
FORM N-CSR
CERTIFIED SHAREHOLDER REPORT OF REGISTERED
MANAGEMENT INVESTMENT COMPANIES
| | |
Investment Company Act file number | | 811-22970 |
Nuveen Dow 30SM Dynamic Overwrite Fund
(Exact name of registrant as specified in charter)
Nuveen Investments
333 West Wacker Drive
Chicago, IL 60606
(Address of principal executive offices) (Zip code)
Kevin J. McCarthy
Nuveen Investments
333 West Wacker Drive
Chicago, IL 60606
(Name and address of agent for service)
Registrant’s telephone number, including area code: (312) 917-7700
Date of fiscal year end: December 31
Date of reporting period: December 31, 2015
Form N-CSR is to be used by management investment companies to file reports with the Commission not later than 10 days after the transmission to stockholders of any report that is required to be transmitted to stockholders under Rule 30e-1 under the Investment Company Act of 1940 (17 CFR 270.30e-1). The Commission may use the information provided on Form N-CSR in its regulatory, disclosure review, inspection, and policymaking roles.
A registrant is required to disclose the information specified by Form N-CSR, and the Commission will make this information public. A registrant is not required to respond to the collection of information contained in Form N-CSR unless the Form displays a currently valid Office of Management and Budget (“OMB”) control number. Please direct comments concerning the accuracy of the information collection burden estimate and any suggestions for reducing the burden to Secretary, Securities and Exchange Commission, 450 Fifth Street, NW, Washington, DC 20549-0609. The OMB has reviewed this collection of information under the clearance requirements of 44 U.S.C. ss. 3507.
ITEM 1. REPORTS TO STOCKHOLDERS.
| | |
| | |  |
| Closed-End Funds | |
| | |
| | | Nuveen Investments |
| | | Closed-End Funds |
| | | | | | |
| | | | | | | Annual Report December 31, 2015 |
| | | |
| | | | | | |
| | | | | | | |
| BXMX | | | | | | |
| Nuveen S&P 500 Buy-Write Income Fund | | |
| | | | | | | |
| DIAX | | | | | | |
| Nuveen Dow 30SM Dynamic Overwrite Fund | | |
| | | | | | | |
| SPXX | | | | | | |
| Nuveen S&P 500 Dynamic Overwrite Fund | | |
| | | | | | | |
| QQQX | | | | | | |
| Nuveen Nasdaq 100 Dynamic Overwrite Fund | | |
| | | | | | | | | | | | |
| | | | | | |
| | | | |
| | | | | | | | |
| | | |
| | Life is Complex | | | | |
| |
| | Nuveen makes things e-simple. It only takes a minute to sign up for e-Reports. Once enrolled, you’ll receive an e-mail as soon as your Nuveen Investments Fund information is ready – no more waiting for delivery by regular mail. Just click on the link within the e-mail to see the report and save it on your computer if you wish. |
| | |
| | Free e-Reports right to your e-mail! |
| |
| | www.investordelivery.com If you receive your Nuveen Fund dividends and statements from your financial advisor or brokerage account. |
| |
| or | | www.nuveen.com/accountaccess If you receive your Nuveen Fund dividends and statements directly from Nuveen. |

Table
of Contents
Chairman’s Letter
to Shareholders

Dear Shareholders,
For better or for worse, the financial markets spent most of the past year waiting for the U.S. Federal Reserve (Fed) to end its accommodative monetary policy. The policy has propped up stock and bond markets since the Great Recession, but the question remains: how will markets behave without its influence? This uncertainty was a considerable source of volatility for stock and bond prices for much of 2015, despite the Fed carefully conveying its intention to raise rates slowly and only when the economy shows evidence of readiness.
As was widely expected, the long-awaited Fed rate hike materialized in mid-December. While the move was interpreted as a vote of confidence on the U.S. economy’s underlying strength, the Fed emphasized that future rate increases will be gradual and guided by its ongoing assessment of financial conditions. Headwinds including rising borrowing costs, softer commodity prices, low inflation, a strong U.S. dollar and a stagnant global economy could necessitate keeping monetary conditions accommodative for longer. Meanwhile, policy makers in Europe and Japan are deploying their available tools to try to bolster their economies’ fragile growth, while Chinese authorities have stepped up efforts to manage China’s slowdown.
Although the new year began with a more pessimistic tone to investor sentiment and elevated volatility in the markets, we caution investors from making long-term decisions based on short-term news. In times like these, you can look to a professional investment manager with the experience and discipline to maintain the proper perspective on short-term events. And if the daily headlines do concern you, I encourage you to reach out to your financial advisor. Your financial advisor can help you evaluate your investment strategies in light of current events, your time horizon and risk tolerance.
On behalf of the other members of the Nuveen Fund Board, we look forward to continuing to earn your trust in the months and years ahead.
Sincerely,

William J. Schneider
Chairman of the Board
February 22, 2016
Portfolio Managers’
Comments
Nuveen S&P 500 Buy-Write Income Fund (BXMX)
Nuveen Dow 30SM Dynamic Overwrite Fund (DIAX)
Nuveen S&P 500 Dynamic Overwrite Fund (SPXX)
Nuveen Nasdaq 100 Dynamic Overwrite Fund (QQQX)
The Nuveen S&P 500 Buy-Write Income Fund (BXMX) features portfolio management by Gateway Investment Advisers, LLC (Gateway). Kenneth H. Toft and Michael T. Buckius are co-portfolio managers. Effective February 29, 2016 (subsequent to the close of this reporting period) Daniel M. Ashcraft was added as a portfolio manager for BXMX. Nuveen Dow 30SM Dynamic Overwrite Fund (DIAX), Nuveen S&P 500 Dynamic Overwrite Fund (SPXX) and Nuveen Nasdaq 100 Dynamic Overwrite Fund (QQQX) feature portfolio management by Nuveen Asset Management, LLC (NAM), an affiliate of Nuveen Investments, Inc. Keith Hembre, CFA, and David Friar serve as co-portfolio managers.
Here the portfolio managers discuss economic and market conditions, their management strategies and the performance of the Funds for the twelve-month reporting period ended December 31, 2015.
What factors affected the U.S. economy and financial markets during the twelve-month reporting period ended December 31, 2015?
The U.S. economy grew at an overall moderate pace during the twelve-month reporting period. Harsh winter weather and a west coast port strike weighed on growth in the first quarter of 2015, but those factors proved temporary. Rebounding economic activity in the second quarter was followed by a mediocre advance in the latter half of the year. Real gross domestic product (GDP), which is the value of the goods and services produced by the nation’s economy less the value of the goods and services used up in production, adjusted for price changes, increased at an annual rate of 0.7% in the fourth quarter of 2015, as reported by the “advance” estimate of the Bureau of Economic Analysis, down from 2.0% in the third quarter.
The labor and housing markets were among the bright spots in the economy during the reporting period, as both showed steady improvement. As reported by the Bureau of Labor Statistics, the unemployment rate fell to 5.0% in December from 5.7% in January 2015, and job gains averaged slightly above 200,000 per month for the past twelve months. The S&P/Case-Shiller U.S. National Home Price Index, which covers all nine U.S. census divisions, recorded a 5.1% annual gain in November 2015 (most recent data available at the time this report was prepared). The 10-City and 20-City Composites reported year-over-year increases of 5.3% and 5.8%, respectively.
With GDP growth averaging around 2% for the previous four quarters, the U.S. economic recovery continued to underwhelm. Consumers, whose purchases comprise the largest component of the U.S. economy, benefited from lower gasoline prices and an improving jobs market but didn’t necessarily spend more. Pessimism about the economy’s future and lackluster wage growth likely contributed to consumers’ somewhat muted spending. The sharp decline in energy prices and tepid wage growth kept inflation subdued during this reporting period. The Consumer Price Index CPI declined 0.1% in December on a seasonally adjusted basis, as reported by the U.S. Bureau of Labor Statistics. The core CPI (which excludes food and energy) increased 0.1% during the same period, below the Fed’s unofficial longer term inflation objective of 2.0%.
Certain statements in this report are forward-looking statements. Discussions of specific investments are for illustration only and are not intended as recommendations of individual investments. The forward-looking statements and other views expressed herein are those of the portfolio managers as of the date of this report. Actual future results or occurrences may differ significantly from those anticipated in any forward-looking statements and the views expressed herein are subject to change at any time, due to numerous market and other factors. The Funds disclaim any obligation to update publicly or revise any forward-looking statements or views expressed herein.
Refer to the Glossary of Terms Used in this Report for further definition of the terms used within this section.
Portfolio Managers’ Comments (continued)
Business investment was also rather restrained. Corporate earnings growth slowed during 2015, reflecting an array of factors ranging from weakening demand amid sluggish U.S. and global growth to the impact of falling commodity prices and a strong U.S. dollar. Energy, materials and industrials companies were hit particularly hard by the downturn in natural resource prices, as well as the expectation of rising interest rates, which would make their debts more costly to service. With demand waning, companies, especially in the health care and technology sectors, looked to consolidations with rivals as a way to boost revenues. Merger and acquisition deals, both in the U.S. and globally, reached record levels in the calendar year 2015.
Although the current expansion continued to look subpar relative to past recoveries, the U.S. Federal Reserve (Fed) believed the economy was strong enough to begin the withdrawal of its stimulus policies. After winding down its bond buying program, known as quantitative easing, in October 2014, the Fed began telegraphing its intention to raise the target federal funds rate some time in 2015. The Fed had held the fed funds rate near zero since December 2008. However, the timing of its first rate hike was uncertain, particularly as the inflation rate stayed stubbornly low and signs of global economic weakness, notably from China, merited caution. After delaying the rate change at each prior meeting in 2015, the Fed announced in December 2015 that it would raise its main policy interest rate by 0.25%. The news had a relatively muted impact on the financial markets, as the move was widely expected.
Sluggish economic growth and significant downside risks created a challenging environment for investors in 2015. Recent equity volatility has attracted the most attention, but a wide range of markets participated in the correction. Bond yields declined, commodity prices dropped and currency markets fluctuated.
With this volatile backdrop, the S&P 500® Index finished 2015 with a modest gain of 1.38%, the Dow Jones Industrial Average (DJIA) 0.27% and the NASDAQ 100 Index was 9.75%. Until mid-August implied volatility, as measured by the Chicago Board Options Exchange’s (CBOE) Volatility Index (VIX), was very similar to the conditions that had existed since mid-2012, with the VIX rarely above 20 and most often below 15. As concerns about China intensified and the S&P 500® Index neared its low-point for the year on August 24th, the VIX spiked and reached an intra-day high for the year of 53.29, its highest point since January 2009. From late August to year-end, the VIX spent nearly half of its trading sessions above 20 and never closed below 14.
What key strategies were used to manage the Funds during this twelve-month reporting period ended December 31, 2015?
BXMX
BXMX seeks attractive total return with less volatility than the S&P 500® Index. During the reporting period ended December 31, 2015, BXMX invested in an equity portfolio which sought to track the price movements of the S&P 500® Index and wrote (sold) listed index call options on approximately 100% of the notional value of its stock portfolio. The premium generated by the index call options is intended to supplement the dividend yield on the underlying stock portfolio to support the Fund’s distribution policy and to provide the potential for growth in value during rising markets and/or risk mitigation in the event of a market decline. The writing of call options on a broad equity index, while investing in a portfolio of equities, has the potential to enhance returns while exposing BXMX to less risk than unhedged equity investments. The portion of the Fund subject to the overwrite sacrifices some of its upside potential in exchange for the premium received for the written index call options. The downside is buffered by the amount of the cash flow premium received. In flat or declining markets, the option premium can enhance total return relative to the S&P 500® Index. In rising markets, the options can hurt the Fund’s total return relative to the S&P 500® Index.
DIAX
DIAX seeks attractive total return with less volatility than the Dow Jones Industrial Average (DJIA). NAM varies the level of call option overwrite within a range of approximately 35% to 75%, with a long-run target of 55% overwrite. NAM uses
its proprietary view of the market’s return and volatility profile to dynamically adjust the overwrite percentage and other factors. Generally, if NAM expects the equity market to appreciate, the overwrite percentage will be reduced to offer more potential upside capture. Likewise, if NAM expects equity markets to be flat or to decline, the overwrite percentage may be increased, thus managing the Fund to potentially receive additional cash flow from higher sales of call options. This dynamic option overwrite approach offers potential for greater equity market upside capture than the full overwrite approach, while still offering a measure of downside protection. The Fund currently expects to carry out its principal investment strategy by emphasizing single name options on individual stocks in the DJIA. It also employs an expanded range of options including index options on the DJIA and other broad-based indexes and options on custom baskets of stocks in addition to exchange-traded funds (ETFs). The Fund also has the opportunity to utilize call spread strategies and sell put options on a portion of the underlying equity portfolio.
SPXX
SPXX seeks attractive total return with less volatility than the S&P 500® Index. NAM varies the level of option overwrite within a range of approximately 35% to 75% overwrite, with a long-run target of 55% overwrite. NAM uses its proprietary view of the market’s return and volatility profile to dynamically adjust the overwrite percentage and other factors. Generally, if NAM expects the equity market to appreciate, the overwrite percentage will be reduced to offer more potential upside capture. Likewise, if NAM expects equity markets to be flat or to decline, the overwrite percentage may be increased, thus managing the Fund to potentially receive additional cash flow from higher sales of call options. This dynamic option overwrite approach offers potential for greater equity market upside capture than the full overwrite approach, while still offering a measure of downside protection. The Fund currently expects to emphasize index call options on the S&P 500® Index and can also employ an expanded range of options including index options on other broad-based indexes and options on custom baskets of stocks in addition to exchange-traded funds (ETFs) and single name options. The Fund also has the opportunity to utilize call spread strategies and sell put options on a portion of the underlying equity portfolio.
QQQX
QQQX seeks attractive total return with less volatility than the NASDAQ-100 Index. NAM varies the level of call option overwrite within a range of approximately 35% to 75% overwrite, with a long-run target of 55% overwrite. NAM uses its proprietary view of the market’s return and volatility profile to dynamically adjust the overwrite percentage and other factors. Generally, if NAM expects the equity market to appreciate, the overwrite percentage will be reduced to offer more potential upside capture. Likewise, if NAM expects equity markets to be flat or to decline, the overwrite percentage may be increased, thus managing the Fund to potentially receive additional cash flow from higher sales of call options. This dynamic option overwrite approach offers potential for greater equity market upside capture than the full overwrite approach, while still offering a measure of downside protection. The Fund, in carrying out its principal options strategy, expects to primarily write index call options on the NASDAQ-100 Index and other broad-based indexes and can also write call options on a variety of other equity market indexes and options on custom baskets of stocks in addition to exchange-traded funds (ETFs) and single name options. The Fund also has the opportunity to utilize call spread strategies and sell put options on a portion of the underlying equity portfolio.
How did the Funds perform during this twelve-month reporting period ended December 31, 2015?
The tables in the Performance Overview and Holding Summaries section of this report provide total return for the one-year, five-year, ten-year and/or since inception periods ended December 31, 2015. Each Fund’s total returns at net asset value (NAV) are compared with the performance of its corresponding market index. For the twelve-month reporting period ended December 31, 2015, BXMX shares at NAV outperformed the S&P 500® Index, while SPXX underperformed the S&P 500® Index. DIAX performed in line the Dow Jones Industrial Average, while QQQX underperformed the NASDAQ 100 Index.
Portfolio Managers’ Comments (continued)
BXMX
BXMX follows a strategy which combines an investment in an underlying equity portfolio, which tracks the price movements of the S&P 500® Index, with the sale of a mix of nearly at-the-money index call options. As the short call options advance to expiration, premium is earned. Premium earned during periods of market advance results in return for the strategy while premium earned during periods of market decline generally offsets at least a portion of the underlying equity portfolio’s loss.
The Fund’s return during the reporting period was attributable to the higher stock market volatility environment throughout much of 2015 which increased the Fund’s net call option premiums received. Unlike in prior years, volatility did not quickly contract after each spike. For example, after the intra-day volatility spike to 53.29 in late August, the VIX spent the entire month of September in a range between 20 and 30 and did not decline under 20 until early October. As a result, the selling of index call options contributed positively to the performance of the Fund for 2015.
On a quarterly basis, index call option premiums contributed positively to the Fund’s return in each of the first three quarters while detracting in the fourth. Similarly, the Fund outperformed its benchmark in the first three quarters and underperformed in the fourth. Underperformance in the fourth quarter was due mainly to October’s results when cash flow generated by the Fund’s strategy was insufficient to keep pace with the S&P 500® Index’s strong advance of 8.44%.
DIAX
DIAX seeks to dampen the beta (a measure of price volatility) of the overall portfolio by selling call options on a portion of the Fund’s underlying equity portfolio. This overwrite strategy provides incremental cash flow to the Fund and allows the portion of the Fund’s assets that are not overwritten to participate in any equity market rally. Those portions of the Fund that are overwritten have capped upside potential. The downside is buffered by the amount of cash flow premium received. Therefore, in flat or declining markets, the option premiums can enhance total returns relative to the Index. In rising markets, however, the options can hinder the Fund’s total return relative to the Index.
During the first half of the reporting period, implied volatility, as measured by the VIX was muted and U.S. equities traded within a tight band. Market peaks tended to fall around option expiration dates, making it risky to deviate from benchmark strike levels. These factors, combined with low levels of volatility premiums in the market, made the first half of the reporting period a challenging one for relative outperformance. Given the market conditions and uncertainty surrounding a number of near-term macroeconomic events, our strategy during that time was to manage the Fund defensively. The overwrite levels were kept only modestly above the passive benchmark, averaging 61.5% versus 55.0% for the benchmark. Further, the strike level of the options written in DIAX was kept very close to the levels in the CBOE DJIA BuyWrite Index.
From January through the beginning of February 2015, implied volatility briefly spiked. During that time, the Fund had a higher overwrite percentage of 65% to 75%, which helped the Fund’s performance as the index declined. However, when volatility declined, the Fund still had a high overwrite level when the market began to rebound, which detracted from performance.
The second half of the reporting period began with U.S. equities experiencing their steepest declines since 2011 during the third quarter. In the beginning of August, the VIX was at 14 where it had been for the last several quarters. By the end of August, the VIX was near 40. As sellers of options, the premiums we receive are more valuable when volatility is increased. This helped performance as we were able to limit our downside as well as increase the premiums we were paid. As the fourth quarter began, U.S. equities rebounded nicely from their steep declines during the third quarter. Since we experienced a rising market, the Fund was not able to capture as much of the upside potential which detracted from the Fund’s performance.
We continued to reduce the Fund’s exposure to over-the counter (OTC) options. Because these off-exchange traded options have no secondary market, they become more illiquid during periods of higher volatility. We also reduced the number of custom baskets and single name options in the portfolio as we expect volatility to remain elevated heading into 2016.
The Fund is able to sell put options on up to 5% of its portfolio. We took advantage of this and the premium received contributed to the Fund’s performance. Also boosting performance were custom baskets of options.
SPXX
SPXX seeks to dampen the beta (a measure of price volatility) of the overall portfolio by selling call options on a portion of the Fund’s underlying equity portfolio. This overwrite strategy provides incremental cash flow to the Fund and allows the portion of the Fund’s assets that are not overwritten to participate in any equity market rally. Those portions of the Fund that are overwritten have capped upside potential. The downside is buffered by the amount of cash flow premium received. Therefore, in flat or declining markets, the option premiums can enhance total returns relative to the Index. In rising markets, however, the options can hinder the Fund’s total return relative to the Index.
During the first half of the reporting period, implied volatility, as measured by the VIX was muted and U.S. equities traded within a tight band. Market peaks tended to fall around option expiration dates, making it risky to deviate from benchmark strike levels. These factors, combined with low levels of volatility premiums in the market, made the first half of the reporting period a challenging one for relative outperformance. Given the market conditions and uncertainty surrounding a number of near-term macroeconomic events, our strategy during that time was to manage the Fund defensively. The overwrite levels were kept only modestly above the passive benchmark, averaging 61.5% versus 55.0% for the benchmark. Further, the strike level of the options written in SPXX was kept very close to the levels in the CBOE S&P 500® BuyWrite Index.
From January through the beginning of February 2015, implied volatility briefly spiked. During that time, the Fund had a higher overwrite percentage of 65% to 75%, which helped the Fund’s performance as the index declined. However, when volatility declined, the Fund still had a high overwrite level when the market began to rebound, which detracted from performance.
The second half of the reporting period began with U.S. equities experiencing their steepest declines since 2011 during the third quarter. In the beginning of August, the VIX was at 14 where it had been for the last several quarters. By the end of August, the VIX was near 40. As sellers of options, the premiums we receive are more valuable when volatility is increased. This helped contribute to performance as we were able to limit our downside as well as increase the premiums we were paid. As the fourth quarter began, U.S. equities rebounded nicely from their steep declines during the third quarter. Since we experienced a rising market, the Fund was not able to capture as much of the upside potential which detracted from the Fund’s performance.
We continued to reduce the Fund’s exposure to over-the counter (OTC) options. Because these off-exchange traded options have no secondary market, they become more illiquid during periods of higher volatility. We also reduced the number of custom baskets and single name options in the portfolio as we expect volatility to remain elevated heading into 2016.
The Fund is able to sell put options on up to 5% of its portfolio. We took advantage of this and the premium received contributed to the Fund’s performance. Also boosting performance were custom baskets of options.
QQQX
QQQX seeks to dampen the beta (a measure of price volatility) of the overall portfolio by selling call options on a portion of the Fund’s underlying equity portfolio. This overwrite strategy provides incremental cash flow to the Fund and
Portfolio Managers’ Comments (continued)
allows the portion of the Fund’s assets that are not overwritten to participate in any equity market rally. Those portions of the Fund that are overwritten have capped upside potential. The downside is buffered by the amount of cash flow premium received. Therefore, in flat or declining markets, the option premiums can enhance total returns relative to the Index. In rising markets, however, the options can hinder the Fund’s total return relative to the Index.
During the first half of the reporting period, implied volatility, as measured by the VIX was muted and U.S. equities traded within a tight band. Market peaks tended to fall around option expiration dates, making it risky to deviate from benchmark strike levels. These factors, combined with low levels of volatility premiums in the market, made the first half of the reporting period a challenging one for relative outperformance. Given the market conditions and uncertainty surrounding a number of near-term macroeconomic events, our strategy during that time was to manage the Fund defensively. The overwrite levels were kept only modestly above the passive benchmark, averaging 61.5% versus 55.0% for the benchmark. Further, the strike level of the options written in QQQX was kept very close to the levels in the CBOE Nasdaq 100 BuyWrite Index.
From January through the beginning of February 2015, implied volatility briefly spiked. During that time, the Fund had a higher overwrite percentage of 65% to 75%, which helped the Fund’s performance as the Index declined. However, when volatility declined, the Fund still had a high overwrite level when the market began to rebound, which detracted from performance.
The second half of the reporting period began with U.S. equities experiencing their steepest declines since 2011 during the third quarter. In the beginning of August, the VIX was at 14 where it had been for the last several quarters. By the end of August, the VIX was near 40. As sellers of options, the premiums we receive are more valuable when volatility is increased. This helped contribute to performance as we were able to limit our downside as well as increase the premiums we were paid. As the fourth quarter began, U.S. equities rebounded nicely from their steep declines during the third quarter. The NASDAQ 100 Index returned 10.21% for the quarter and 9.75% for the reporting period. Since we experienced a rising market, the Fund was not able to capture as much of the upside potential which detracted from the Fund’s performance and contributed to its underperformance versus its benchmark.
We continued to reduce the Fund’s exposure to over-the counter (OTC) options. Because these off-exchange traded options have a limited secondary market, they become more illiquid during periods of higher volatility. We also reduced the number of custom baskets and single name options in the portfolio as we expect volatility to remain elevated heading into 2016.
The Fund is able to sell put options on up to 5% of its portfolio. We took advantage of this and the premium received contributed to the Fund’s performance. Also boosting performance were custom baskets of options.
Share
Information
DISTRIBUTION INFORMATION
The following information regarding each Fund’s distributions is current as of December 31, 2015, the Funds’ fiscal and tax year end, and may differ from previously issued notifications. Each Fund’s distribution level may vary over time based on the Fund’s investment activities and portfolio investment value changes.
Each Fund has adopted a managed distribution program. The goal of a Fund’s managed distribution program is to provide shareholders relatively consistent and predictable cash flow by systematically converting its expected long-term return potential into regular distributions. As a result, regular distributions throughout the year will likely include a portion of expected long-term and/or short-term gains (both realized and unrealized), along with net investment income.
Important points to understand about Nuveen fund managed distributions are:
| • | | Each Fund seeks to establish a relatively stable common share distribution rate that roughly corresponds to the projected total return from its investment strategy over an extended period of time. However, you should not draw any conclusions about a Fund’s past or future investment performance from its current distribution rate. |
| • | | Actual share returns will differ from projected long-term returns (and therefore a Fund’s distribution rate), at least over shorter time periods. Over a specific timeframe, the difference between actual returns and total distributions will be reflected in an increasing (returns exceed distributions) or a decreasing (distributions exceed returns) Fund net asset value. |
| • | | Each period’s distributions are expected to be paid from some or all of the following sources: |
| | • | | net investment income consisting of regular interest and dividends, |
| | • | | net realized gains from portfolio investments, and |
| | • | | unrealized gains, or, in certain cases, a return of principal (non-taxable distributions). |
| • | | A non-taxable distribution is a payment of a portion of a Fund’s capital. When a Fund’s returns exceed distributions, it may represent portfolio gains generated, but not realized as a taxable capital gain. In periods when the Fund’s returns fall short of distributions, it will represent a portion of your original principal unless the shortfall is offset during other time periods over the life of your investment (previous or subsequent) when the Fund’s total return exceeds distributions. |
| • | | Because distribution source estimates are updated throughout the current fiscal year based on a Fund’s performance, these estimates may differ from both the tax information reported to you in each Fund’s 1099 statement, as well as the ultimate economic sources of distributions over the life of your investment. |
The following table provides information regarding each Fund’s distributions and total return performance over various time periods. This information is intended to help you better understand whether each Fund’s returns for the specified time periods were sufficient to meet their distributions.
Share Information (continued)
Data as of December 31, 2015
| | | | | | | | | | | | | | | | | | | | | | | | | | | | | | | | | | | | | | | | |
Fund | | Inception
Date | | | Per Share
Regular Distributions | | | Total
Current Year
Net Investment
Income | | | Total
Current Year
Net Realized
Gain/Loss | | | Current
Unrealized
Gain/Loss | | | Current
Distribution
Rate on NAV1,3 | | | Actual Full-Year
Distribution
Rate on NAV2,3 | | | Annualized Total Return on NAV | |
| | | Latest
Quarter | | | Total
Current Year | | | | | | | | 1-Year | | | 5-Year | |
BXMX | | | 10/2004 | | | $ | 0.2490 | | | $ | 0.9960 | | | $ | 0.1691 | | | $ | 1.0905 | | | $ | 5.1762 | | | | 7.47 | % | | | 7.47 | % | | | 5.17 | % | | | 8.20 | % |
DIAX | | | 4/2005 | | | $ | 0.2660 | | | $ | 1.0640 | | | $ | 0.2493 | | | $ | 0.4860 | | | $ | 4.9877 | | | | 6.74 | % | | | 6.74 | % | | | 0.17 | % | | | 9.25 | % |
SPXX | | | 11/2005 | | | $ | 0.2610 | | | $ | 1.0440 | | | $ | 0.2013 | | | $ | 1.0099 | | | $ | 5.2647 | | | | 7.09 | % | | | 7.09 | % | | | 1.09 | % | | | 8.03 | % |
QQQX | | | 1/2007 | | | $ | 0.3500 | | | $ | 1.4000 | | | $ | 0.1094 | | | $ | 1.2257 | | | $ | 10.5823 | | | | 7.01 | % | | | 7.01 | % | | | 7.97 | % | | | 14.65 | % |
| 1 | Current distribution per share, annualized, divided by the NAV per share on the stated date other than net investment income, as shown in the table immediately below. |
| 2 | Actual total per share distributions made during the full fiscal year, divided by the NAV per share on the stated date. |
| 3 | Each distribution represents a “managed distribution rate”. For these Funds, at least in the just completed fiscal year, distributions may be comprised of sources other than net investment income, as shown in the table immediately below. |
The following table provides each Fund’s distribution sources as of December 31, 2015.
The amounts and sources of distributions reported in this notice are for financial reporting purposes and are not being provided for tax reporting purposes. The actual amounts and character of the distributions for tax reporting purposes will be reported to shareholders on Form 1099-DIV which will be sent to shareholders shortly after calendar year-end. More details about each Fund’s distributions and the basis for these amounts are available on www.nuveen.com/cef.
Data as of December 31, 2015
| | | | | | | | | | | | | | | | | | | | | | | | | | | | |
| | | Fiscal YTD | | | Fiscal YTD | |
| | | Source of Distribution | | | Per Share Amounts | |
| Fund | | Net
Investment
Income | | | Realized
Gains | | | Return of
Capital1 | | | Distributions | | | NII | | | Realized
Gains | | | Return of
Capital1 | |
BXMX | | | 100.00 | % | | | 0.00 | % | | | 0.00 | % | | $ | 0.9960 | | | $ | 0.9960 | | | $ | 0.0000 | | | $ | 0.0000 | |
DIAX | | | 60.82 | % | | | 6.92 | % | | | 32.26 | % | | $ | 1.0640 | | | $ | 0.6471 | | | $ | 0.0736 | | | $ | 0.3433 | |
SPXX | | | 67.36 | % | | | 0.00 | % | | | 32.64 | % | | $ | 1.0440 | | | $ | 0.7032 | | | $ | 0.0000 | | | $ | 0.3408 | |
QQQX | | | 30.59 | % | | | 69.41 | % | | | 0.00 | % | | $ | 1.4000 | | | $ | 0.4283 | | | $ | 0.9717 | | | $ | 0.0000 | |
| 1 | Return of Capital may represent unrealized gains, return of shareholder’s principal, or both. In certain circumstances, all or a portion of the return of capital my be characterized as ordinary income under federal tax law. The actual tax characterization will be provided to shareholders on Form 1099-DIV shortly after calendar year-end. |
SHARE REPURCHASES
During August 2015, the Funds’ Board of Trustees reauthorized an open-market share repurchase program, allowing each Fund to repurchase an aggregate of up to approximately 10% of its outstanding shares.
As of December 31, 2015, and since the inception of the Funds’ repurchase programs, the Funds have cumulatively repurchased and retired its outstanding shares as shown in the accompanying table.
| | | | | | | | | | | | | | | | |
| | | BXMX | | | DIAX | | | SPXX | | | QQQX | |
Shares cumulatively repurchased and retired | | | 460,238 | | | | 0 | | | | 383,763 | | | | 0 | |
Shares authorized for repurchase | | | 10,355,000 | | | | 3,610,000 | | | | 1,615,000 | | | | 3,655,000 | |
During the current reporting period, the Funds did not repurchase any of their outstanding shares.
OTHER SHARE INFORMATION
As of December 31, 2015, and during the current reporting period, the Funds’ share prices were trading at a premium/(discount) to their NAVs as shown in the accompanying table.
| | | | | | | | | | | | | | | | |
| | | BXMX | | | DIAX | | | SPXX | | | QQQX | |
NAV | | | $13.34 | | | $ | 15.78 | | | $ | 14.72 | | | $ | 19.98 | |
Share price | | | $13.43 | | | $ | 14.36 | | | $ | 13.47 | | | $ | 19.37 | |
Premium/(Discount) to NAV | | | 0.67 | % | | | (9.00 | )% | | | (8.49 | )% | | | (3.05 | )% |
12-month average premium/(discount) to NAV | | | (6.17 | )% | | | (9.60 | )% | | | (9.16 | )% | | | (6.25 | )% |
Risk
Considerations
Fund shares are not guaranteed or endorsed by any bank or other insured depository institution, and are not federally insured by the Federal Deposit Insurance Corporation.
Nuveen S&P 500 Buy-Write Income Fund (BXMX)
Investing in closed-end funds involves risk; principal loss is possible. There is no guarantee the Fund’s investment objectives will be achieved. Closed-end fund shares may frequently trade at a discount or premium to their net asset value. Common stock returns often have experienced significant volatility. The Fund may not participate in any appreciation of its equity portfolio as fully as it would if the Fund did not sell call options. In addition, the Fund will continue to bear the risk of declines in the value of the equity portfolio. Because index options are settled in cash, sellers of index call options, such as the Fund, cannot provide in advance for their potential settlement obligations by acquiring and holding the underlying securities. For these and other risks, including tax risk, please see the Fund’s web page at www.nuveen.com/BXMX.
Nuveen Dow 30SM Dynamic Overwrite Fund (DIAX)
Investing in closed-end funds involves risk; principal loss is possible. There is no guarantee the Fund’s investment objectives will be achieved. Closed-end fund shares may frequently trade at a discount or premium to their net asset value. Common stock returns often have experienced significant volatility. The Fund may not participate in any appreciation of its equity portfolio as fully as it would if the Fund did not sell call options. In addition, the Fund will continue to bear the risk of declines in the value of the equity portfolio. Because index options are settled in cash, sellers of index call options, such as the Fund, cannot provide in advance for their potential settlement obligations by acquiring and holding the underlying securities. For these and other risks, including tax risk, please see the Fund’s web page at www.nuveen.com/DIAX.
Nuveen S&P 500 Dynamic Overwrite Fund (SPXX)
Investing in closed-end funds involves risk; principal loss is possible. There is no guarantee the Fund’s investment objectives will be achieved. Closed-end fund shares may frequently trade at a discount or premium to their net asset value. Common stock returns often have experienced significant volatility. The Fund may not participate in any appreciation of its equity portfolio as fully as it would if the Fund did not sell call options. In addition, the Fund will continue to bear the risk of declines in the value of the equity portfolio. Because index options are settled in cash, sellers of index call options, such as the Fund, cannot provide in advance for their potential settlement obligations by acquiring and holding the underlying securities. For these and other risks, including tax risk, please see the Fund’s web page at www.nuveen.com/SPXX.
Nuveen Nasdaq 100 Dynamic Overwrite Fund (QQQX)
Investing in closed-end funds involves risk; principal loss is possible. There is no guarantee the Fund’s investment objectives will be achieved. Closed-end fund shares may frequently trade at a discount or premium to their net asset value. Common stock returns often have experienced significant volatility. The Fund may not participate in any appreciation of its equity portfolio as fully as it would if the Fund did not sell call options. In addition, the Fund will continue to bear the risk of declines in the value of the equity portfolio. Because index options are settled in cash, sellers of index call options, such as the Fund, cannot provide in advance for their potential settlement obligations by acquiring and holding the underlying securities. For these and other risks, including tax risk, please see the Fund’s web page at www.nuveen.com/QQQX.
THIS PAGE INTENTIONALLY LEFT BLANK
BXMX
Nuveen S&P 500 Buy-Write Income Fund
Performance Overview and Holding Summaries as of December 31, 2015
Refer to the Glossary of Terms Used in this Report for further definition of the terms used within this section.
Average Annual Total Returns as of December 31, 2015
| | | | | | | | | | | | |
| | | Average Annual | |
| | | 1-Year | | | 5-Year | | | 10-Year | |
| BXMX at NAV | | | 5.17% | | | | 8.20% | | | | 5.61% | |
| BXMX at Share Price | | | 19.80% | | | | 10.00% | | | | 7.00% | |
| S&P 500® Index | | | 1.38% | | | | 12.57% | | | | 7.31% | |
Past performance is not predictive of future results. Current performance may be higher or lower than the data shown. Returns do not reflect the deduction of taxes that shareholders may have to pay on Fund distributions or upon the sale of Fund shares. Returns at NAV are net of Fund expenses and assume reinvestment of distributions. Comparative index return information is provided for the Fund’s shares at NAV only. Indexes are not available for direct investment.
Share Price Performance — Weekly Closing Price
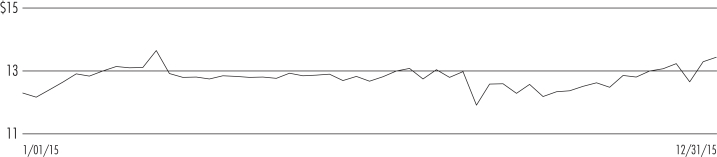
This data relates to the securities held in the Fund’s portfolio of investments as of the end of the reporting period. It should not be construed as a measure of performance for the Fund itself. Holdings are subject to change.
Fund Allocation
(% of net assets)
| | | | |
| Common Stocks | | | 98.5% | |
| Repurchase Agreements | | | 2.7% | |
| Other Assets Less Liabilities | | | (1.2)% | |
| Net Assets | | | 100% | |
Top Five Issuers
(% of total long-term
investments)1
| | | | |
Apple, Inc. | | | 3.5% | |
Microsoft Corporation | | | 2.5% | |
Exxon Mobil Corporation | | | 1.9% | |
Berkshire Hathaway Inc., Class B | | | 1.9% | |
Johnson & Johnson | | | 1.8% | |
(% of total investments)1
| | | | |
Banks | | | 6.1% | |
Pharmaceuticals | | | 5.5% | |
Oil, Gas & Consumable Fuels | | | 5.3% | |
Internet Software & Services | | | 5.2% | |
Software | | | 4.5% | |
Technology Hardware, Storage & Peripherals | | | 4.2% | |
Biotechnology | | | 4.0% | |
Media | | | 3.1% | |
Health Care Providers & Services | | | 2.9% | |
IT Services | | | 2.9% | |
Specialty Retail | | | 2.8% | |
Aerospace & Defense | | | 2.7% | |
Industrial Conglomerates | | | 2.6% | |
Insurance | | | 2.6% | |
| | | | |
Internet & Catalog Retail | | | 2.6% | |
Beverages | | | 2.4% | |
Diversified Financial Services | | | 2.4% | |
Semiconductors & Semiconductor Equipment | | | 2.3% | |
Food & Staples Retailing | | | 2.3% | |
Chemicals | | | 2.1% | |
Diversified Telecommunication Services | | | 2.1% | |
Machinery | | | 2.0% | |
Household Products | | | 2.0% | |
Capital Markets | | | 1.9% | |
Health Care Equipment & Supplies | | | 1.9% | |
Repurchase Agreements | | | 2.7% | |
Other | | | 18.9% | |
Total | | | 100% | |
| 1 | Excluding investments in derivatives. |
DIAX
Nuveen Dow 30SM Dynamic Overwrite Fund
Performance Overview and Holding Summaries as of December 31, 2015
Refer to the Glossary of Terms Used in this Report for further definition of the terms used within this section.
Average Annual Total Returns as of December 31, 2015
| | | | | | | | | | | | |
| | | Average Annual | |
| | | 1-Year | | | 5-Year | | | 10-Year | |
| DIAX at NAV | | | 0.17% | | | | 9.25% | | | | 7.02% | |
| DIAX at Share Price | | | 0.18% | | | | 7.42% | | | | 6.77% | |
| Dow Jones Industrial Average (DJIA) | | | 0.21% | | | | 11.30% | | | | 7.75% | |
Past performance is not predictive of future results. Current performance may be higher or lower than the data shown. Returns do not reflect the deduction of taxes that shareholders may have to pay on Fund distributions or upon the sale of Fund shares. Returns at NAV are net of Fund expenses and assume reinvestment of distributions. Comparative index return information is provided for the Fund’s shares at NAV only. Indexes are not available for direct investment.
Share Price Performance — Weekly Closing Price
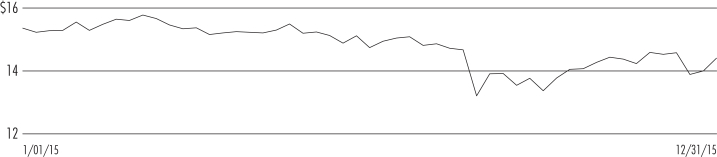
This data relates to the securities held in the Fund’s portfolio of investments as of the end of the reporting period. It should not be construed as a measure of performance for the Fund itself. Holdings are subject to change.
Fund Allocation
(% of net assets)
| | | | |
| Common Stocks | | | 95.6% | |
| Exchange-Traded Funds | | | 4.3% | |
| U.S. Government and Agency Obligations | | | 0.9% | |
| Other Assets Less Liabilities | | | (0.8)% | |
| Net Assets | | | 100% | |
Top Five Issuers
(% of total long-term investments)1
| | | | |
Goldman Sachs Group, Inc. | | | 6.6% | |
3M Co. | | | 5.5% | |
Boeing Company | | | 5.3% | |
International Business Machines Corporation | | | 5.1% | |
Home Depot, Inc. | | | 4.9% | |
Portfolio Composition
(% of total investments)1
| | | | |
Aerospace & Defense | | | 8.8% | |
IT Services | | | 7.8% | |
Pharmaceuticals | | | 6.8% | |
Industrial Conglomerates | | | 6.6% | |
Capital Markets | | | 6.6% | |
Oil, Gas & Consumable Fuels | | | 6.1% | |
Specialty Retail | | | 4.8% | |
Textiles, Apparel & Luxury Goods | | | 4.5% | |
Hotels, Restaurants & Leisure | | | 4.3% | |
| | | | |
Health Care Providers & Services | | | 4.3% | |
Insurance | | | 4.1% | |
Technology Hardware, Storage & Peripherals | | | 3.8% | |
Media | | | 3.8% | |
Household Products | | | 2.9% | |
Exchange-Traded Funds | | | 4.2% | |
U.S. Government and Agency Obligations | | | 0.9% | |
Other | | | 19.7% | |
Total | | | 100% | |
| 1 | Excluding investments in derivatives. |
SPXX
Nuveen S&P 500 Dynamic Overwrite Fund
Performance Overview and Holding Summaries as of December 31, 2015
Refer to the Glossary of Terms Used in this Report for further definition of the terms used within this section.
Average Annual Total Returns as of December 31, 2015
| | | | | | | | | | | | |
| | | Average Annual | |
| | | 1-Year | | | 5-Year | | | 10-Year | |
| SPXX at NAV | | | 1.09% | | | | 8.03% | | | | 5.43% | |
| SPXX at Share Price | | | 1.70% | | | | 7.75% | | | | 6.30% | |
| S&P 500® Index | | | 1.38% | | | | 12.57% | | | | 7.31% | |
Performance prior to December 22, 2014, reflects the Fund’s performance under the management of a sub-adviser using an investment strategy that differed from those currently in place.
Past performance is not predictive of future results. Current performance may be higher or lower than the data shown. Returns do not reflect the deduction of taxes that shareholders may have to pay on Fund distributions or upon the sale of Fund shares. Returns at NAV are net of Fund expenses and assume reinvestment of distributions. Comparative index return information is provided for the Fund’s shares at NAV only. Indexes are not available for direct investment.
Share Price Performance — Weekly Closing Price
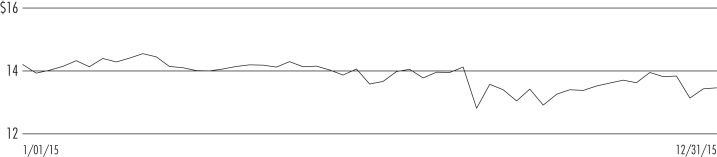
This data relates to the securities held in the Fund’s portfolio of investments as of the end of the reporting period. It should not be construed as a measure of performance for the Fund itself. Holdings are subject to change.
Fund Allocation
(% of net assets)
| | | | |
| Common Stocks | | | 96.8% | |
| Exchange-Traded Funds | | | 3.9% | |
| Other Assets Less Liabilities | | | (0.7)% | |
| Net Assets | | | 100% | |
Top Five Issuers
(% of total long-term investments)1
| | | | |
SPDR® S&P 500® ETF | | | 3.8% | |
Apple, Inc. | | | 3.6% | |
Microsoft Corporation | | | 2.7% | |
Wells Fargo & Company | | | 1.9% | |
Exxon Mobil Corporation | | | 1.9% | |
Portfolio Composition
(% of total investments)1
| | | | |
Banks | | | 6.7% | |
Pharmaceuticals | | | 6.6% | |
Oil, Gas & Consumable Fuels | | | 5.6% | |
Internet Software & Services | | | 4.6% | |
Technology Hardware, Storage & Peripherals | | | 4.3% | |
Software | | | 3.7% | |
Aerospace & Defense | | | 3.2% | |
Biotechnology | | | 3.1% | |
IT Services | | | 3.1% | |
Health Care Providers & Services | | | 2.9% | |
Insurance | | | 2.8% | |
Media | | | 2.8% | |
Industrial Conglomerates | | | 2.8% | |
Specialty Retail | | | 2.5% | |
| | | | |
Semiconductors & Semiconductor Equipment | | | 2.5% | |
Beverages | | | 2.4% | |
Diversified Telecommunication Services | | | 2.2% | |
Diversified Financial Services | | | 2.2% | |
Chemicals | | | 2.1% | |
Tobacco | | | 2.0% | |
Internet & Catalog Retail | | | 2.0% | |
Household Products | | | 2.0% | |
Machinery | | | 2.0% | |
Food & Staples Retailing | | | 1.8% | |
Health Care Equipment & Supplies | | | 1.8% | |
Exchange-Traded Funds | | | 3.8% | |
Other | | | 18.5% | |
Total | | | 100% | |
| 1 | Excluding investments in derivatives. |
QQQX
Nuveen Nasdaq 100 Dynamic Overwrite Fund
Performance Overview and Holding Summaries as of December 31, 2015
Refer to the Glossary of Terms Used in this Report for further definition of the terms used within this section.
Average Annual Total Returns as of December 31, 2015
| | | | | | | | | | | | |
| | | Average Annual | |
| | | 1-Year | | | 5-Year | | | Since
Inception | |
| QQQX at NAV | | | 7.97% | | | | 14.65% | | | | 10.12% | |
| QQQX at Share Price | | | 8.47% | | | | 15.08% | | | | 9.63% | |
| Nasdaq 100® Index | | | 9.75% | | | | 17.09% | | | | 12.31% | |
Since inception returns are from 1/30/07. Past performance is not predictive of future results. Current performance may be higher or lower than the data shown. Returns do not reflect the deduction of taxes that shareholders may have to pay on Fund distributions or upon the sale of Fund shares. Returns at NAV are net of Fund expenses and assume reinvestment of distributions. Comparative index return information is provided for the Fund’s shares at NAV only. Indexes are not available for direct investment.
Share Price Performance — Weekly Closing Price
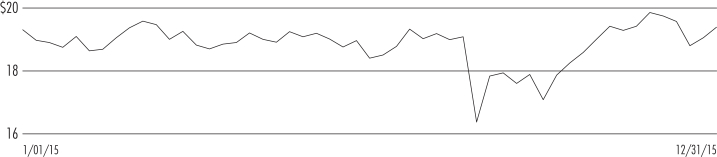
This data relates to the securities held in the Fund’s portfolio of investments as of the end of the reporting period. It should not be construed as a measure of performance for the Fund itself. Holdings are subject to change.
Fund Allocation
(% of net assets)
| | | | |
| Common Stocks | | | 96.0% | |
| Exchange-Traded Funds | | | 4.8% | |
| Other Assets Less Liabilities | | | (0.8)% | |
| Net Assets | | | 100% | |
Top Five Issuers
(% of total long-term investments)1
| | | | |
Apple, Inc. | | | 12.1% | |
Microsoft Corporation | | | 8.7% | |
Amazon.com, Inc. | | | 6.8% | |
Alphabet Inc., Class C | | | 5.4% | |
Alphabet Inc., Class A | | | 4.7% | |
Portfolio Composition
(% of total investments)1
| | | | |
Internet Software & Services | | | 17.0% | |
Technology Hardware, Storage & Peripherals | | | 12.6% | |
Biotechnology | | | 10.3% | |
Software | | | 9.9% | |
Internet & Catalog Retail | | | 8.6% | |
Semiconductors & Semiconductor Equipment | | | 5.9% | |
Communications Equipment | | | 4.9% | |
| | | | |
Media | | | 3.2% | |
Health Care Providers & Services | | | 2.5% | |
IT Services | | | 2.4% | |
Exchange-Traded Funds | | | 4.7% | |
Other | | | 18.0% | |
Total | | | 100% | |
| 1 | Excluding investments in derivatives. |
Shareholder
Meeting Report
The annual meeting of shareholders was held in the offices of Nuveen Investments on August 5, 2015 for DIAX and QQQX; at this meeting the shareholders were asked to elect Board Members.
| | | | | | | | |
| | | DIAX | | | QQQX | |
| | | Common
Shares | | | Common
Shares | |
Approval of the Board Members was reached as follows: | | | | | | | | |
Jack B. Evans | | | | | | | | |
For | | | 30,215,383 | | | | 31,203,926 | |
Withhold | | | 1,065,599 | | | | 995,660 | |
Total | | | 31,280,982 | | | | 32,199,586 | |
William J. Schneider | | | | | | | | |
For | | | 30,219,174 | | | | 31,198,087 | |
Withhold | | | 1,061,808 | | | | 1,001,499 | |
Total | | | 31,280,982 | | | | 32,199,586 | |
Thomas S. Schreier, Jr. | | | | | | | | |
For | | | 30,229,828 | | | | 31,189,586 | |
Withhold | | | 1,051,154 | | | | 1,010,000 | |
Total | | | 31,280,982 | | | | 32,199,586 | |
Report of
Independent Registered Public Accounting Firm
To the Board of Trustees and Shareholders of
Nuveen S&P 500 Buy-Write Income Fund
Nuveen Dow 30SM Dynamic Overwrite Fund
Nuveen S&P 500 Dynamic Overwrite Fund
Nuveen Nasdaq 100 Dynamic Overwrite Fund:
In our opinion, the accompanying statements of assets and liabilities, including the portfolios of investments, and the related statements of operations and of changes in net assets and the financial highlights present fairly, in all material respects, the financial position of Nuveen S&P 500 Buy-Write Income Fund, Nuveen Dow 30SM Dynamic Overwrite Fund, Nuveen S&P 500 Dynamic Overwrite Fund, and Nuveen Nasdaq 100 Dynamic Overwrite Fund (hereinafter referred to as the “Funds”) at December 31, 2015, the results of each of their operations for the year then ended, the changes in each of their net assets for each of the two years in the period then ended and the financial highlights for each of the five years in the period then ended, in conformity with accounting principles generally accepted in the United States of America. These financial statements and financial highlights (hereafter referred to as “financial statements”) are the responsibility of the Funds’ management. Our responsibility is to express an opinion on these financial statements based on our audits. We conducted our audits of these financial statements in accordance with the standards of the Public Company Accounting Oversight Board (United States). Those standards require that we plan and perform the audit to obtain reasonable assurance about whether the financial statements are free of material misstatement. An audit includes examining, on a test basis, evidence supporting the amounts and disclosures in the financial statements, assessing the accounting principles used and significant estimates made by management, and evaluating the overall financial statement presentation. We believe that our audits, which included confirmation of securities at December 31, 2015 by correspondence with the custodian and brokers, provide a reasonable basis for our opinion.
PricewaterhouseCoopers LLP
Chicago, IL
February 25, 2016
BXMX
| | |
Nuveen S&P 500 Buy-Write Income Fund | | |
Portfolio of Investments | | December 31, 2015 |
| | | | | | | | | | | | | | |
| Shares | | | Description (1) | | | | | | | | Value | |
| | | | | |
| | | | LONG-TERM INVESTMENTS – 98.5% | | | | | | | | | | |
| | | | | |
| | | | COMMON STOCKS – 98.5% (2) | | | | | | | | | | |
| | | | | |
| | | | Aerospace & Defense – 2.7% | | | | | | | | | |
| | | | | |
| | 67,004 | | | Boeing Company | | | | | | | | $ | 9,688,108 | |
| | 85,468 | | | Honeywell International Inc. | | | | | | | | | 8,851,921 | |
| | 8,874 | | | Huntington Ingalls Industries Inc. | | | | | | | | | 1,125,667 | |
| | 28,502 | | | Northrop Grumman Corporation | | | | | | | | | 5,381,463 | |
| | 47,825 | | | Raytheon Company | | | | | | | | | 5,955,647 | |
| | 63,296 | | | United Technologies Corporation | | | | | | | | | 6,080,847 | |
| | | | Total Aerospace & Defense | | | | | | | | | 37,083,653 | |
| | | | | |
| | | | Air Freight & Logistics – 0.7% | | | | | | | | | |
| | | | | |
| | 104,952 | | | United Parcel Service, Inc., Class B | | | | | | | | | 10,099,531 | |
| | | | | |
| | | | Airlines – 0.4% | | | | | | | | | |
| | | | | |
| | 103,293 | | | United Continental Holdings Inc., (3) | | | | | | | | | 5,918,689 | |
| | | | | |
| | | | Auto Components – 0.2% | | | | | | | | | |
| | | | | |
| | 22,233 | | | Cooper Tire & Rubber Company | | | | | | | | | 841,519 | |
| | 85,832 | | | Gentex Corporation | | | | | | | | | 1,374,170 | |
| | | | Total Auto Components | | | | | | | | | 2,215,689 | |
| | | | | |
| | | | Automobiles – 0.6% | | | | | | | | | |
| | | | | |
| | 388,012 | | | Ford Motor Company | | | | | | | | | 5,467,089 | |
| | 50,303 | | | Harley-Davidson, Inc. | | | | | | | | | 2,283,253 | |
| | | | Total Automobiles | | | | | | | | | 7,750,342 | |
| | | | | |
| | | | Banks – 6.2% | | | | | | | | | |
| | | | | |
| | 914,632 | | | Bank of America Corporation | | | | | | | | | 15,393,257 | |
| | 262,997 | | | Citigroup Inc. | | | | | | | | | 13,610,095 | |
| | 33,724 | | | Comerica Incorporated | | | | | | | | | 1,410,675 | |
| | 71,851 | | | Fifth Third Bancorp | | | | | | | | | 1,444,205 | |
| | 86,613 | | | First Horizon National Corporation | | | | | | | | | 1,257,621 | |
| | 289,842 | | | JP Morgan Chase & Co. | | | | | | | | | 19,138,266 | |
| | 29,619 | | | Lloyds Banking Group PLC, ADR | | | | | | | | | 129,139 | |
| | 3,803 | | | M&T Bank Corporation | | | | | | | | | 460,848 | |
| | 234,861 | | | U.S. Bancorp | | | | | | | | | 10,021,519 | |
| | 408,071 | | | Wells Fargo & Company | | | | | | | | | 22,182,740 | |
| | | | Total Banks | | | | | | | | | 85,048,365 | |
| | | | | |
| | | | Beverages – 2.4% | | | | | | | | | |
| | | | | |
| | 317,900 | | | Coca-Cola Company | | | | | | | | | 13,656,984 | |
| | 29,293 | | | Monster Beverage Corporation, (3) | | | | | | | | | 4,363,485 | |
| | 153,014 | | | PepsiCo, Inc. | | | | | | | | | 15,289,159 | |
| | | | Total Beverages | | | | | | | | | 33,309,628 | |
| | | | | |
| | | | Biotechnology – 4.0% | | | | | | | | | |
| | | | | |
| | 161,773 | | | AbbVie Inc. | | | | | | | | | 9,583,433 | |
| | 74,396 | | | Amgen Inc. | | | | | | | | | 12,076,703 | |
| | 40,852 | | | Baxalta Inc. | | | | | | | | | 1,594,454 | |
| | 15,948 | | | Biogen Inc., (3) | | | | | | | | | 4,885,670 | |
| | 102,082 | | | Celgene Corporation, (3) | | | | | | | | | 12,225,340 | |
| | 148,267 | | | Gilead Sciences, Inc. | | | | | | | | | 15,003,137 | |
| | | | Total Biotechnology | | | | | | | | | 55,368,737 | |
| | | | | | | | | | | | | | |
| Shares | | | Description (1) | | | | | | | | Value | |
| | | | | |
| | | | Building Products – 0.1% | | | | | | | | | |
| | | | | |
| | 4,369 | | | Allegion PLC | | | | | | | | $ | 288,004 | |
| | 42,748 | | | Masco Corporation | | | | | | | | | 1,209,768 | |
| | | | Total Building Products | | | | | | | | | 1,497,772 | |
| | | | | |
| | | | Capital Markets – 2.0% | | | | | | | | | |
| | | | | |
| | 201,302 | | | Charles Schwab Corporation | | | | | | | | | 6,628,875 | |
| | 28,291 | | | Eaton Vance Corporation | | | | | | | | | 917,477 | |
| | 57,390 | | | Goldman Sachs Group, Inc. | | | | | | | | | 10,343,400 | |
| | 78,237 | | | Legg Mason, Inc. | | | | | | | | | 3,069,238 | |
| | 150,485 | | | Morgan Stanley | | | | | | | | | 4,786,928 | |
| | 47,635 | | | Waddell & Reed Financial, Inc., Class A | | | | | | | | | 1,365,219 | |
| | | | Total Capital Markets | | | | | | | | | 27,111,137 | |
| | | | | |
| | | | Chemicals – 2.2% | | | | | | | | | |
| | | | | |
| | 22,572 | | | Chemours Company | | | | | | | | | 120,986 | |
| | 128,057 | | | Dow Chemical Company | | | | | | | | | 6,592,374 | |
| | 108,564 | | | E.I. Du Pont de Nemours and Company | | | | | | | | | 7,230,362 | |
| | 72,974 | | | Eastman Chemical Company | | | | | | | | | 4,926,475 | |
| | 65,907 | | | Monsanto Company | | | | | | | | | 6,493,158 | |
| | 48,329 | | | Olin Corporation | | | | | | | | | 834,159 | |
| | 80,712 | | | RPM International, Inc. | | | | | | | | | 3,556,171 | |
| | | | Total Chemicals | | | | | | | | | 29,753,685 | |
| | | | | |
| | | | Commercial Services & Supplies – 0.4% | | | | | | | | | |
| | | | | |
| | 14,145 | | | Deluxe Corporation | | | | | | | | | 771,468 | |
| | 26,475 | | | Pitney Bowes Inc. | | | | | | | | | 546,709 | |
| | 28,908 | | | R.R. Donnelley & Sons Company | | | | | | | | | 425,526 | |
| | 60,369 | | | Waste Management, Inc. | | | | | | | | | 3,221,894 | |
| | | | Total Commercial Services & Supplies | | | | | | | | | 4,965,597 | |
| | | | | |
| | | | Communications Equipment – 1.4% | | | | | | | | | |
| | | | | |
| | 4,101 | | | ADTRAN, Inc. | | | | | | | | | 70,619 | |
| | 3,408 | | | Ciena Corporation, (3) | | | | | | | | | 70,512 | |
| | 371,982 | | | Cisco Systems, Inc. | | | | | | | | | 10,101,171 | |
| | 2,206 | | | Lumentum Holdings Inc., (3) | | | | | | | | | 48,576 | |
| | 36,243 | | | Motorola Solutions Inc. | | | | | | | | | 2,480,833 | |
| | 117,004 | | | QUALCOMM, Inc. | | | | | | | | | 5,848,445 | |
| | 11,034 | | | Viavi Solutions Inc., (3) | | | | | | | | | 67,197 | |
| | | | Total Communications Equipment | | | | | | | | | 18,687,353 | |
| | | | | |
| | | | Consumer Finance – 0.9% | | | | | | | | | |
| | | | | |
| | 89,615 | | | American Express Company | | | | | | | | | 6,232,723 | |
| | 84,491 | | | Discover Financial Services | | | | | | | | | 4,530,407 | |
| | 77,393 | | | Navient Corporation | | | | | | | | | 886,150 | |
| | 77,393 | | | SLM Corporation, (3) | | | | | | | | | 504,602 | |
| | | | Total Consumer Finance | | | | | | | | | 12,153,882 | |
| | | | | |
| | | | Containers & Packaging – 0.3% | | | | | | | | | |
| | | | | |
| | 3,177 | | | Avery Dennison Corporation | | | | | | | | | 199,071 | |
| | 57,446 | | | Packaging Corp. of America | | | | | | | | | 3,621,970 | |
| | 5,718 | | | Sonoco Products Company | | | | | | | | | 233,695 | |
| | | | Total Containers & Packaging | | | | | | | | | 4,054,736 | |
| | | | | |
| | | | Distributors – 0.1% | | | | | | | | | |
| | | | | |
| | 23,190 | | | Genuine Parts Company | | | | | | | | | 1,991,789 | |
| | | | | |
| | | | Diversified Consumer Services – 0.0% | | | | | | | | | |
| | | | | |
| | 7,623 | | | Apollo Education Group, Inc., (3) | | | | | | | | | 58,468 | |
| | | | |
| BXMX | | Nuveen S&P 500 Buy-Write Income Fund | | |
| | Portfolio of Investments (continued) | | December 31, 2015 |
| | | | | | | | | | | | | | |
| Shares | | | Description (1) | | | | | | | | Value | |
| | | | | |
| | | | Diversified Financial Services – 2.4% | | | | | | | | | |
| | | | | |
| | 193,497 | | | Berkshire Hathaway Inc., Class B, (3) | | | | | | | | $ | 25,549,343 | |
| | 41,332 | | | CME Group, Inc. | | | | | | | | | 3,744,679 | |
| | 12,616 | | | Intercontinental Exchange, Inc. | | | | | | | | | 3,232,976 | |
| | 39,312 | | | Leucadia National Corporation | | | | | | | | | 683,636 | |
| | | | Total Diversified Financial Services | | | | | | | | | 33,210,634 | |
| | | | | |
| | | | Diversified Telecommunication Services – 2.1% | | | | | | | | | |
| | | | | |
| | 431,692 | | | AT&T Inc. | | | | | | | | | 14,854,522 | |
| | 20,819 | | | CenturyLink Inc. | | | | | | | | | 523,806 | |
| | 192,058 | | | Frontier Communications Corporation | | | | | | | | | 896,911 | |
| | 285,057 | | | Verizon Communications Inc. | | | | | | | | | 13,175,335 | |
| | 3,033 | | | Windstream Holdings Inc. | | | | | | | | | 19,533 | |
| | | | Total Diversified Telecommunication Services | | | | | | | | | 29,470,107 | |
| | | | | |
| | | | Electric Utilities – 1.3% | | | | | | | | | |
| | | | | |
| | 55,671 | | | Duke Energy Corporation | | | | | | | | | 3,974,353 | |
| | 98,619 | | | Great Plains Energy Incorporated | | | | | | | | | 2,693,285 | |
| | 89,635 | | | OGE Energy Corp. | | | | | | | | | 2,356,504 | |
| | 64,913 | | | Pepco Holdings, Inc. | | | | | | | | | 1,688,387 | |
| | 11,931 | | | Pinnacle West Capital Corporation | | | | | | | | | 769,311 | |
| | 138,207 | | | Southern Company | | | | | | | | | 6,466,706 | |
| | | | Total Electric Utilities | | | | | | | | | 17,948,546 | |
| | | | | |
| | | | Electrical Equipment – 0.9% | | | | | | | | | |
| | | | | |
| | 52,322 | | | Eaton Corporation PLC | | | | | | | | | 2,722,837 | |
| | 76,676 | | | Emerson Electric Company | | | | | | | | | 3,667,413 | |
| | 11,240 | | | Hubbell Incorporated | | | | | | | | | 1,135,690 | |
| | 44,800 | | | Rockwell Automation, Inc. | | | | | | | | | 4,596,928 | |
| | | | Total Electrical Equipment | | | | | | | | | 12,122,868 | |
| | | | | |
| | | | Electronic Equipment, Instruments & Components – 0.2% | | | | | | | | | |
| | | | | |
| | 151,993 | | | Corning Incorporated | | | | | | | | | 2,778,432 | |
| | | | | |
| | | | Energy Equipment & Services – 1.1% | | | | | | | | | |
| | | | | |
| | 8,826 | | | Diamond Offshore Drilling, Inc. | | | | | | | | | 186,229 | |
| | 139,879 | | | Halliburton Company | | | | | | | | | 4,761,481 | |
| | 72,619 | | | Patterson-UTI Energy, Inc. | | | | | | | | | 1,095,095 | |
| | 131,088 | | | Schlumberger Limited | | | | | | | | | 9,143,388 | |
| | | | Total Energy Equipment & Services | | | | | | | | | 15,186,193 | |
| | | | | |
| | | | Food & Staples Retailing – 2.3% | | | | | | | | | |
| | | | | |
| | 126,797 | | | CVS Health Corporation | | | | | | | | | 12,396,943 | |
| | 195,316 | | | Kroger Co. | | | | | | | | | 8,170,068 | |
| | 69,240 | | | SUPERVALU INC., (3) | | | | | | | | | 469,447 | |
| | 74,151 | | | Walgreens Boots Alliance Inc. | | | | | | | | | 6,314,328 | |
| | 68,690 | | | Wal-Mart Stores, Inc. | | | | | | | | | 4,210,697 | |
| | | | Total Food & Staples Retailing | | | | | | | | | 31,561,483 | |
| | | | | |
| | | | Food Products – 0.8% | | | | | | | | | |
| | | | | |
| | 252,157 | | | Mondelez International Inc., Class A | | | | | | | | | 11,306,720 | |
| | | | | |
| | | | Gas Utilities – 0.3% | | | | | | | | | |
| | | | | |
| | 14,435 | | | AGL Resources Inc. | | | | | | | | | 921,097 | |
| | 33,764 | | | Atmos Energy Corporation | | | | | | | | | 2,128,483 | |
| | 23,688 | | | National Fuel Gas Company | | | | | | | | | 1,012,662 | |
| | 4,901 | | | ONE Gas Inc. | | | | | | | | | 245,883 | |
| | | | Total Gas Utilities | | | | | | | | | 4,308,125 | |
| | | | | |
| | | | Health Care Equipment & Supplies – 1.9% | | | | | | | | | |
| | | | | |
| | 163,485 | | | Abbott Laboratories | | | | | | | | | 7,342,111 | |
| | | | | | | | | | | | | | |
| Shares | | | Description (1) | | | | | | | | Value | |
| | | | | |
| | | | Health Care Equipment & Supplies (continued) | | | | | | | | | |
| | | | | |
| | 40,852 | | | Baxter International, Inc. | | | | | | | | $ | 1,558,504 | |
| | 1,463 | | | Halyard Health Inc., (3) | | | | | | | | | 48,879 | |
| | 36,821 | | | Hill-Rom Holdings Inc. | | | | | | | | | 1,769,617 | |
| | 62,936 | | | Hologic Inc., (3) | | | | | | | | | 2,434,994 | |
| | 2,456 | | | Intuitive Surgical, Inc., (3) | | | | | | | | | 1,341,369 | |
| | 148,378 | | | Medtronic, PLC | | | | | | | | | 11,413,236 | |
| | | | Total Health Care Equipment & Supplies | | | | | | | | | 25,908,710 | |
| | | | | |
| | | | Health Care Providers & Services – 3.0% | | | | | | | | | |
| | | | | |
| | 47,337 | | | Aetna Inc. | | | | | | | | | 5,118,076 | |
| | 41,388 | | | Anthem Inc. | | | | | | | | | 5,771,143 | |
| | 69,194 | | | Brookdale Senior Living Inc., (3) | | | | | | | | | 1,277,321 | |
| | 89,014 | | | Express Scripts Holding Company, (3) | | | | | | | | | 7,780,714 | |
| | 42,009 | | | HCA Holdings Inc., (3) | | | | | | | | | 2,841,069 | |
| | 39,574 | | | Henry Schein Inc., (3) | | | | | | | | | 6,260,211 | |
| | 15,942 | | | Kindred Healthcare Inc. | | | | | | | | | 189,869 | |
| | 101,713 | | | UnitedHealth Group Incorporated | | | | | | | | | 11,965,517 | |
| | | | Total Health Care Providers & Services | | | | | | | | | 41,203,920 | |
| | | | | |
| | | | Health Care Technology – 0.2% | | | | | | | | | |
| | | | | |
| | 38,826 | | | Cerner Corporation, (3) | | | | | | | | | 2,336,160 | |
| | | | | |
| | | | Hotels, Restaurants & Leisure – 1.4% | | | | | | | | | |
| | | | | |
| | 54,924 | | | Carnival Corporation | | | | | | | | | 2,992,260 | |
| | 2,272 | | | Interval Leisure Group Inc. | | | | | | | | | 35,466 | |
| | 4,969 | | | Las Vegas Sands Corp. | | | | | | | | | 217,841 | |
| | 116,737 | | | McDonald’s Corporation | | | | | | | | | 13,791,309 | |
| | 21,179 | | | Starwood Hotels & Resorts Worldwide, Inc. | | | | | | | | | 1,467,281 | |
| | 15,729 | | | Wynn Resorts Ltd | | | | | | | | | 1,088,290 | |
| | | | Total Hotels, Restaurants & Leisure | | | | | | | | | 19,592,447 | |
| | | | | |
| | | | Household Durables – 0.7% | | | | | | | | | |
| | | | | |
| | 2,893 | | | Garmin Limited | | | | | | | | | 107,533 | |
| | 50,944 | | | KB Home | | | | | | | | | 628,140 | |
| | 112,138 | | | Newell Rubbermaid Inc. | | | | | | | | | 4,943,043 | |
| | 11,162 | | | TopBuild Corporation, (3) | | | | | | | | | 343,455 | |
| | 1,285 | | | Tupperware Brands Corporation | | | | | | | | | 71,510 | |
| | 28,733 | | | Whirlpool Corporation | | | | | | | | | 4,220,016 | |
| | | | Total Household Durables | | | | | | | | | 10,313,697 | |
| | | | | |
| | | | Household Products – 2.0% | | | | | | | | | |
| | | | | |
| | 112,288 | | | Colgate-Palmolive Company | | | | | | | | | 7,480,627 | |
| | 34,108 | | | Kimberly-Clark Corporation | | | | | | | | | 4,341,948 | |
| | 197,194 | | | Procter & Gamble Company | | | | | | | | | 15,659,176 | |
| | | | Total Household Products | | | | | | | | | 27,481,751 | |
| | | | | |
| | | | Industrial Conglomerates – 2.6% | | | | | | | | | |
| | | | | |
| | 68,629 | | | 3M Co. | | | | | | | | | 10,338,273 | |
| | 692,030 | | | General Electric Company | | | | | | | | | 21,556,735 | |
| | 24,839 | | | Roper Technologies, Inc. | | | | | | | | | 4,714,194 | |
| | | | Total Industrial Conglomerates | | | | | | | | | 36,609,202 | |
| | | | | |
| | | | Insurance – 2.6% | | | | | | | | | |
| | | | | |
| | 107,121 | | | Allstate Corporation | | | | | | | | | 6,651,143 | |
| | 92,845 | | | American International Group, Inc. | | | | | | | | | 5,753,605 | |
| | 34,937 | | | Arthur J. Gallagher & Co. | | | | | | | | | 1,430,321 | |
| | 40,755 | | | CNO Financial Group Inc. | | | | | | | | | 778,013 | |
| | 29,385 | | | FNF Group | | | | | | | | | 1,018,778 | |
| | 65,958 | | | Genworth Financial Inc., Class A, (3) | | | | | | | | | 246,023 | |
| | 74,204 | | | Hartford Financial Services Group, Inc. | | | | | | | | | 3,224,906 | |
| | 2,764 | | | Kemper Corporation | | | | | | | | | 102,959 | |
| | | | |
| BXMX | | Nuveen S&P 500 Buy-Write Income Fund | | |
| | Portfolio of Investments (continued) | | December 31, 2015 |
| | | | | | | | | | | | | | |
| Shares | | | Description (1) | | | | | | | | Value | |
| | | | | |
| | | | Insurance (continued) | | | | | | | | | |
| | | | | |
| | 77,588 | | | Lincoln National Corporation | | | | | | | | $ | 3,899,573 | |
| | 161,940 | | | Marsh & McLennan Companies, Inc. | | | | | | | | | 8,979,573 | |
| | 35,787 | | | Travelers Companies, Inc. | | | | | | | | | 4,038,921 | |
| | | | Total Insurance | | | | | | | | | 36,123,815 | |
| | | | | |
| | | | Internet & Catalog Retail – 2.6% | | | | | | | | | |
| | | | | |
| | 33,109 | | | Amazon.com, Inc., (3) | | | | | | | | | 22,378,042 | |
| | 21,503 | | | HSN, Inc. | | | | | | | | | 1,089,557 | |
| | 43,662 | | | Netflix Inc., (3) | | | | | | | | | 4,994,060 | |
| | 5,882 | | | Priceline Group, Inc. (The), (3) | | | | | | | | | 7,499,256 | |
| | | | Total Internet & Catalog Retail | | | | | | | | | 35,960,915 | |
| | | | | |
| | | | Internet Software & Services – 5.2% | | | | | | | | | |
| | | | | |
| | 50,540 | | | Akamai Technologies, Inc., (3) | | | | | | | | | 2,659,920 | |
| | 31,576 | | | Alphabet Inc., Class A, (3) | | | | | | | | | 24,566,444 | |
| | 18,533 | | | Alphabet Inc., Class C, (3) | | | | | | | | | 14,064,323 | |
| | 150,929 | | | eBay Inc., (3) | | | | | | | | | 4,147,529 | |
| | 203,647 | | | Facebook Inc., Class A, (3) | | | | | | | | | 21,313,695 | |
| | 20,261 | | | IAC/InterActiveCorp | | | | | | | | | 1,216,673 | |
| | 46,900 | | | VeriSign, Inc., (3) | | | | | | | | | 4,097,184 | |
| | | | Total Internet Software & Services | | | | | | | | | 72,065,768 | |
| | | | | |
| | | | IT Services – 3.0% | | | | | | | | | |
| | | | | |
| | 4,939 | | | Alliance Data Systems Corporation, (3) | | | | | | | | | 1,365,979 | |
| | 94,311 | | | Automatic Data Processing, Inc. | | | | | | | | | 7,990,028 | |
| | 83,491 | | | Fidelity National Information Services, Inc. | | | | | | | | | 5,059,555 | |
| | 56,245 | | | International Business Machines Corporation | | | | | | | | | 7,740,437 | |
| | 150,929 | | | PayPal Holdings, Inc., (3) | | | | | | | | | 5,463,630 | |
| | 170,320 | | | Visa Inc., Class A | | | | | | | | | 13,208,316 | |
| | | | Total IT Services | | | | | | | | | 40,827,945 | |
| | | | | |
| | | | Leisure Products – 0.2% | | | | | | | | | |
| | | | | |
| | 29,141 | | | Mattel, Inc. | | | | | | | | | 791,761 | |
| | 18,145 | | | Polaris Industries Inc. | | | | | | | | | 1,559,563 | |
| | | | Total Leisure Products | | | | | | | | | 2,351,324 | |
| | | | | |
| | | | Machinery – 2.0% | | | | | | | | | |
| | | | | |
| | 91,577 | | | Caterpillar Inc. | | | | | | | | | 6,223,573 | |
| | 36,891 | | | Cummins Inc. | | | | | | | | | 3,246,777 | |
| | 21,151 | | | Deere & Company | | | | | | | | | 1,613,187 | |
| | 39,521 | | | Graco Inc. | | | | | | | | | 2,848,278 | |
| | 35,953 | | | Hillenbrand Inc. | | | | | | | | | 1,065,287 | |
| | 36,751 | | | Ingersoll-Rand PLC | | | | | | | | | 2,031,963 | |
| | 16,893 | | | Parker Hannifin Corporation | | | | | | | | | 1,638,283 | |
| | 10,877 | | | Snap-on Incorporated | | | | | | | | | 1,864,644 | |
| | 22,230 | | | SPX Flow Inc., (3) | | | | | | | | | 620,439 | |
| | 47,536 | | | Stanley Black & Decker Inc. | | | | | | | | | 5,073,517 | |
| | 57,774 | | | Timken Company | | | | | | | | | 1,651,759 | |
| | | | Total Machinery | | | | | | | | | 27,877,707 | |
| | | | | |
| | | | Media – 3.2% | | | | | | | | | |
| | | | | |
| | 37,547 | | | CBS Corporation, Class B | | | | | | | | | 1,769,590 | |
| | 226,828 | | | Comcast Corporation, Class A | | | | | | | | | 12,799,904 | |
| | 6,400 | | | DISH Network Corporation, Class A, (3) | | | | | | | | | 365,952 | |
| | 86,999 | | | New York Times Company (The), Class A | | | | | | | | | 1,167,527 | |
| | 186,868 | | | News Corporation, Class A | | | | | | | | | 2,496,556 | |
| | 2,025 | | | News Corporation Class B | | | | | | | | | 28,269 | |
| | 76,905 | | | Omnicom Group, Inc. | | | | | | | | | 5,818,632 | |
| | 31,371 | | | Regal Entertainment Group, Class A | | | | | | | | | 591,971 | |
| | 178,965 | | | Walt Disney Company | | | | | | | | | 18,805,642 | |
| | | | Total Media | | | | | | | | | 43,844,043 | |
| | | | | | | | | | | | | | |
| Shares | | | Description (1) | | | | | | | | Value | |
| | | | | |
| | | | Metals & Mining – 0.4% | | | | | | | | | |
| | | | | |
| | 253,192 | | | Alcoa Inc. | | | | | | | | $ | 2,499,005 | |
| | 20,083 | | | Barrick Gold Corporation | | | | | | | | | 148,213 | |
| | 38,316 | | | Newmont Mining Corporation | | | | | | | | | 689,305 | |
| | 24,595 | | | Nucor Corporation | | | | | | | | | 991,179 | |
| | 41,017 | | | Southern Copper Corporation | | | | | | | | | 1,071,364 | |
| | | | Total Metals & Mining | | | | | | | | | 5,399,066 | |
| | | | | |
| | | | Multiline Retail – 0.8% | | | | | | | | | |
| | | | | |
| | 993 | | | Dollar Tree Inc., (3) | | | | | | | | | 76,679 | |
| | 80,174 | | | Macy’s, Inc. | | | | | | | | | 2,804,487 | |
| | 67,816 | | | Nordstrom, Inc. | | | | | | | | | 3,377,915 | |
| | 14,738 | | | Sears Holdings Corporation, (3) | | | | | | | | | 303,013 | |
| | 59,302 | | | Target Corporation | | | | | | | | | 4,305,918 | |
| | | | Total Multiline Retail | | | | | | | | | 10,868,012 | |
| | | | | |
| | | | Multi-Utilities – 1.3% | | | | | | | | | |
| | | | | |
| | 102,253 | | | Ameren Corporation | | | | | | | | | 4,420,397 | |
| | 57,390 | | | Consolidated Edison, Inc. | | | | | | | | | 3,688,455 | |
| | 18,999 | | | NorthWestern Corporation | | | | | | | | | 1,030,696 | |
| | 157,390 | | | Public Service Enterprise Group Incorporated | | | | | | | | | 6,089,419 | |
| | 62,665 | | | WEC Energy Group, Inc. | | | | | | | | | 3,215,341 | |
| | | | Total Multi-Utilities | | | | | | | | | 18,444,308 | |
| | | | | |
| | | | Oil, Gas & Consumable Fuels – 5.4% | | | | | | | | | |
| | | | | |
| | 9,051 | | | Cenovus Energy Inc. | | | | | | | | | 114,224 | |
| | 173,750 | | | Chevron Corporation | | | | | | | | | 15,630,550 | |
| | 159,197 | | | ConocoPhillips | | | | | | | | | 7,432,908 | |
| | 53,708 | | | CONSOL Energy Inc. | | | | | | | | | 424,293 | |
| | 66,781 | | | Continental Resources Inc., (3) | | | | | | | | | 1,534,627 | |
| | 181,113 | | | Encana Corporation | | | | | | | | | 921,865 | |
| | 335,043 | | | Exxon Mobil Corporation | | | | | | | | | 26,116,601 | |
| | 83,636 | | | Hess Corporation | | | | | | | | | 4,054,673 | |
| | 81,683 | | | Occidental Petroleum Corporation | | | | | | | | | 5,522,588 | |
| | 62,632 | | | ONEOK, Inc. | | | | | | | | | 1,544,505 | |
| | 2,376 | | | PetroChina Company Limited, ADR | | | | | | | | | 155,842 | |
| | 77,446 | | | Phillips 66 | | | | | | | | | 6,335,083 | |
| | 17,453 | | | Suncor Energy, Inc. | | | | | | | | | 450,287 | |
| | 58,070 | | | Valero Energy Corporation | | | | | | | | | 4,106,130 | |
| | | | Total Oil, Gas & Consumable Fuels | | | | | | | | | 74,344,176 | |
| | | | | |
| | | | Pharmaceuticals – 5.6% | | | | | | | | | |
| | | | | |
| | 171,532 | | | Bristol-Myers Squibb Company | | | | | | | | | 11,799,686 | |
| | 116,215 | | | Eli Lilly and Company | | | | | | | | | 9,792,276 | |
| | 244,236 | | | Johnson & Johnson | | | | | | | | | 25,087,921 | |
| | 251,757 | | | Merck & Co. Inc. | | | | | | | | | 13,297,805 | |
| | 525,734 | | | Pfizer Inc. | | | | | | | | | 16,970,694 | |
| | | | Total Pharmaceuticals | | | | | | | | | 76,948,382 | |
| | | | | |
| | | | Professional Services – 0.1% | | | | | | | | | |
| | | | | |
| | 18,195 | | | Manpowergroup Inc. | | | | | | | | | 1,533,657 | |
| | | | | |
| | | | Real Estate Investment Trust – 1.9% | | | | | | | | | |
| | | | | |
| | 32,859 | | | Annaly Capital Management Inc. | | | | | | | | | 308,217 | |
| | 69,995 | | | Apartment Investment & Management Company, Class A | | | | | | | | | 2,801,900 | |
| | 109,496 | | | Brandywine Realty Trust | | | | | | | | | 1,495,715 | |
| | 10,613 | | | Care Capital Properties, Inc. | | | | | | | | | 324,439 | |
| | 34,687 | | | CBL & Associates Properties Inc. | | | | | | | | | 429,078 | |
| | 185,124 | | | CubeSmart | | | | | | | | | 5,668,497 | |
| | 66,098 | | | DCT Industrial Trust Inc. | | | | | | | | | 2,470,082 | |
| | 36,770 | | | Equity Commonwealth, (3) | | | | | | | | | 1,019,632 | |
| | 42,070 | | | Healthcare Realty Trust, Inc. | | | | | | | | | 1,191,422 | |
| | | | |
| BXMX | | Nuveen S&P 500 Buy-Write Income Fund | | |
| | Portfolio of Investments (continued) | | December 31, 2015 |
| | | | | | | | | | | | | | |
| Shares | | | Description (1) | | | | | | | | Value | |
| | | | | |
| | | | Real Estate Investment Trust (continued) | | | | | | | | | |
| | | | | |
| | 126,978 | | | Lexington Realty Trust | | | | | | | | $ | 1,015,824 | |
| | 55,742 | | | Liberty Property Trust | | | | | | | | | 1,730,789 | |
| | 19,790 | | | MFA Financial, Inc. | | | | | | | | | 130,614 | |
| | 26,716 | | | Senior Housing Properties Trust | | | | | | | | | 396,465 | |
| | 31,121 | | | Ventas Inc. | | | | | | | | | 1,756,158 | |
| | 58,810 | | | Welltower Inc. | | | | | | | | | 4,000,844 | |
| | 37,228 | | | Weyerhaeuser Company | | | | | | | | | 1,116,095 | |
| | | | Total Real Estate Investment Trust | | | | | | | | | 25,855,771 | |
| | | | | |
| | | | Real Estate Management & Development – 0.0% | | | | | | | | | |
| | | | | |
| | 296 | | | The RMR Group Inc., Class A, (3) | | | | | | | | | 4,265 | |
| | | | | |
| | | | Road & Rail – 0.4% | | | | | | | | | |
| | | | | |
| | 69,592 | | | Norfolk Southern Corporation | | | | | | | | | 5,886,787 | |
| | | | | |
| | | | Semiconductors & Semiconductor Equipment – 2.3% | | | | | | | | | |
| | | | | |
| | 89,419 | | | Analog Devices, Inc. | | | | | | | | | 4,946,659 | |
| | 93,391 | | | Broadcom Corporation, Class A | | | | | | | | | 5,399,868 | |
| | 427,356 | | | Intel Corporation | | | | | | | | | 14,722,413 | |
| | 38,906 | | | Intersil Corporation, Class A | | | | | | | | | 496,441 | |
| | 15,324 | | | Lam Research Corporation | | | | | | | | | 1,217,032 | |
| | 81,111 | | | Linear Technology Corporation | | | | | | | | | 3,444,784 | |
| | 24,776 | | | Microchip Technology Incorporated | | | | | | | | | 1,153,075 | |
| | 27,856 | | | NVIDIA Corporation | | | | | | | | | 918,134 | |
| | | | Total Semiconductors & Semiconductor Equipment | | | | | | | | | 32,298,406 | |
| | | | | |
| | | | Software – 4.6% | | | | | | | | | |
| | | | | |
| | 101,998 | | | Activision Blizzard Inc. | | | | | | | | | 3,948,343 | |
| | 74,642 | | | Adobe Systems Incorporated, (3) | | | | | | | | | 7,011,869 | |
| | 48,079 | | | Autodesk, Inc., (3) | | | | | | | | | 2,929,453 | |
| | 28,116 | | | CDK Global Inc. | | | | | | | | | 1,334,667 | |
| | 621,537 | | | Microsoft Corporation | | | | | | | | | 34,482,873 | |
| | 260,115 | | | Oracle Corporation | | | | | | | | | 9,502,001 | |
| | 55,570 | | | Salesforce.com, Inc., (3) | | | | | | | | | 4,356,688 | |
| | | | Total Software | | | | | | | | | 63,565,894 | |
| | | | | |
| | | | Specialty Retail – 2.8% | | | | | | | | | |
| | | | | |
| | 8,222 | | | Abercrombie & Fitch Co., Class A | | | | | | | | | 221,994 | |
| | 32,842 | | | American Eagle Outfitters, Inc. | | | | | | | | | 509,051 | |
| | 56,044 | | | Best Buy Co., Inc. | | | | | | | | | 1,706,540 | |
| | 46,645 | | | CarMax, Inc., (3) | | | | | | | | | 2,517,431 | |
| | 7,749 | | | CST Brands Inc. | | | | | | | | | 303,296 | |
| | 50,159 | | | Gap, Inc. | | | | | | | | | 1,238,927 | |
| | 106,894 | | | Home Depot, Inc. | | | | | | | | | 14,136,731 | |
| | 47,459 | | | L Brands Inc. | | | | | | | | | 4,547,521 | |
| | 130,011 | | | Lowe’s Companies, Inc. | | | | | | | | | 9,886,036 | |
| | 14,496 | | | Ross Stores, Inc. | | | | | | | | | 780,030 | |
| | 13,465 | | | Tiffany & Co. | | | | | | | | | 1,027,245 | |
| | 28,637 | | | TJX Companies, Inc. | | | | | | | | | 2,030,650 | |
| | | | Total Specialty Retail | | | | | | | | | 38,905,452 | |
| | | | | |
| | | | Technology Hardware, Storage & Peripherals – 4.2% | | | | | | | | | |
| | | | | |
| | 454,076 | | | Apple, Inc. | | | | | | | | | 47,796,039 | |
| | 222,417 | | | EMC Corporation | | | | | | | | | 5,711,669 | |
| | 118,686 | | | Hewlett-Packard Company | | | | | | | | | 1,804,027 | |
| | 118,686 | | | HP Inc. | | | | | | | | | 1,405,242 | |
| | 61,069 | | | NetApp, Inc. | | | | | | | | | 1,620,161 | |
| | | | Total Technology Hardware, Storage & Peripherals | | | | | | | | | 58,337,138 | |
| | | | | |
| | | | Textiles, Apparel & Luxury Goods – 0.3% | | | | | | | | | |
| | | | | |
| | 70,297 | | | VF Corporation | | | | | | | | | 4,375,988 | |
| | | | | | | | | | | | | | | | |
| Shares | | | Description (1) | | | | | | | | Value | |
| | | | |
| | | | Thrifts & Mortgage Finance – 0.0% | | | | | | | | | |
| | | | |
| | 40,800 | | | MGIC Investment Corporation, (3) | | | | | | | | | | $ | 360,264 | |
| | | | |
| | | | Tobacco – 1.8% | | | | | | | | | |
| | | | |
| | 197,076 | | | Altria Group, Inc. | | | | | | | | | | | 11,471,793 | |
| | 99,883 | | | Philip Morris International, Inc., | | | | | | | | | | | 8,780,715 | |
| | 107,356 | | | Reynolds American Inc. | | | | | | | | | | | 4,954,479 | |
| | 11,091 | | | Vector Group Ltd. | | | | | | | | | | | 261,637 | |
| | | | Total Tobacco | | | | | | | | | | | 25,468,624 | |
| | | | |
| | | | Wireless Telecommunication Services – 0.0% | | | | | | | | | |
| | | | |
| | 116,407 | | | Sprint Corporation, (3) | | | | | | | | | | | 421,393 | |
| | | | Total Long-Term Investments (cost $841,741,937) | | | | | | | | | | | 1,360,477,148 | |
| | | | |
Principal
Amount (000) | | | Description (1) | | Coupon | | | Maturity | | | Value | |
| | | | |
| | | | SHORT-TERM INVESTMENTS – 2.7% | | | | | | | | | |
| | | | |
| | | | REPURCHASE AGREEMENTS – 2.7% | | | | | | | | | |
| | | | |
| $ | 37,439 | | | Repurchase Agreement with Fixed Income Clearing Corporation, dated 12/31/15,
repurchase price $37,439,038, collateralized by $37,040,000 U.S. Treasury Bonds,
3.125%, due 2/15/43, value $38,191,203 | | | 0.030% | | | | 1/04/16 | | | $ | 37,439,038 | |
| | | | Total Short-Term Investments (cost $37,439,038) | | | | | | | | | | | 37,439,038 | |
| | | | Total Investments (cost $879,180,975) – 101.2% | | | | | | | | | | | 1,397,916,186 | |
| | | | Other Assets Less Liabilities – (1.2)% (4) | | | | | | | | | | | (16,026,987 | ) |
| | | | Net Assets – 100% | | | | | | | | | | $ | 1,381,889,199 | |
Investments in Derivatives as of December 31, 2015
Options Written outstanding:
| | | | | | | | | | | | | | | | | | | | |
Number of
Contracts | | | Description | | Notional
Amount (5) | | | Expiration
Date | | | Strike
Price | | | Value | |
| | (713 | ) | | S&P 500® Index | | $ | (146,165,000 | ) | | | 1/08/16 | | | $ | 2,050 | | | $ | (1,051,675 | ) |
| | (759 | ) | | S&P 500® Index | | | (151,800,000 | ) | | | 1/15/16 | | | | 2,000 | | | | (4,128,960 | ) |
| | (1,498 | ) | | S&P 500® Index | | | (307,090,000 | ) | | | 1/15/16 | | | | 2,050 | | | | (3,100,860 | ) |
| | (763 | ) | | S&P 500® Index | | | (158,322,500 | ) | | | 1/15/16 | | | | 2,075 | | | | (717,220 | ) |
| | (779 | ) | | S&P 500® Index | | | (163,590,000 | ) | | | 1/15/16 | | | | 2,100 | | | | (264,860 | ) |
| | (700 | ) | | S&P 500® Index | | | (145,250,000 | ) | | | 1/22/16 | | | | 2,075 | | | | (927,500 | ) |
| | (646 | ) | | S&P 500® Index | | | (130,815,000 | ) | | | 2/19/16 | | | | 2,025 | | | | (3,572,380 | ) |
| | (759 | ) | | S&P 500® Index | | | (155,595,000 | ) | | | 2/19/16 | | | | 2,050 | | | | (3,024,615 | ) |
| | (6,617 | ) | | Total Options Written (premiums received $34,073,972) | | $ | (1,358,627,500 | ) | | | | | | | | | | $ | (16,788,070 | ) |
For Fund portfolio compliance purposes, the Fund’s industry classifications refer to any one or more of the industry sub-classifications used by one or more widely recognized market indexes or ratings group indexes, and/or as defined by Fund management. This definition may not apply for purposes of this report, which may combine industry sub-classifications into sectors for reporting ease.
| (1) | All percentages shown in the Portfolio of Investments are based on net assets. |
| (2) | The Fund may designate up to 100% of its common stock investments to cover outstanding options written. |
| (3) | Non-income producing; issuer has not declared a dividend within the past twelve months. |
| (4) | Other assets less liabilities includes the unrealized appreciation (depreciation) of certain over-the-counter derivatives as presented on the Statement of Assets and Liabilities. The unrealized appreciation (depreciation) of exchange-cleared and exchange-traded derivatives is recognized as part of the cash collateral at brokers and/or the receivable or payable for variation margin as presented on the Statement of Assets and Liabilities, when applicable. Other assets less liabilities also includes the value of options as presented on Statement of Assets and Liabilities. |
| (5) | For disclosure purposes, Notional Amount is calculated by multiplying the Number of Contracts by the Strike Price by 100. |
| ADR | American Depositary Receipt |
See accompanying notes to financial statements.
DIAX
| | |
Nuveen Dow 30SM Dynamic Overwrite Fund | | |
Portfolio of Investments | | December 31, 2015 |
| | | | | | | | | | | | | | |
| Shares | | | Description (1) | | | | | | | | Value | |
| | | | | |
| | | | LONG-TERM INVESTMENTS – 99.9% | | | | | | | | | | |
| | | | | |
| | | | COMMON STOCKS – 95.6% | | | | | | | | | | |
| | | | | |
| | | | Aerospace & Defense – 8.8% | | | | | | | | | |
| | | | | |
| | 209,000 | | | Boeing Company, (2) | | | | | | | | $ | 30,219,310 | |
| | 209,000 | | | United Technologies Corporation | | | | | | | | | 20,078,630 | |
| | | | Total Aerospace & Defense | | | | | | | | | 50,297,940 | |
| | | | | |
| | | | Banks – 2.4% | | | | | | | | | |
| | | | | |
| | 209,000 | | | JP Morgan Chase & Co. | | | | | | | | | 13,800,270 | |
| | | | | |
| | | | Beverages – 1.6% | | | | | | | | | |
| | | | | |
| | 209,000 | | | Coca-Cola Company | | | | | | | | | 8,978,640 | |
| | | | | |
| | | | Capital Markets – 6.6% | | | | | | | | | |
| | | | | |
| | 209,000 | | | Goldman Sachs Group, Inc., (2) | | | | | | | | | 37,668,070 | |
| | | | | |
| | | | Chemicals – 2.4% | | | | | | | | | |
| | | | | |
| | 209,000 | | | E.I. Du Pont de Nemours and Company, (2) | | | | | | | | | 13,919,400 | |
| | | | | |
| | | | Communications Equipment – 1.0% | | | | | | | | | |
| | | | | |
| | 209,000 | | | Cisco Systems, Inc., (2) | | | | | | | | | 5,675,395 | |
| | | | | |
| | | | Consumer Finance – 2.5% | | | | | | | | | |
| | | | | |
| | 209,000 | | | American Express Company, (2) | | | | | | | | | 14,535,950 | |
| | | | | |
| | | | Diversified Telecommunication Services – 1.7% | | | | | | | | | |
| | | | | |
| | 209,000 | | | Verizon Communications Inc. | | | | | | | | | 9,659,980 | |
| | | | | |
| | | | Food & Staples Retailing – 2.2% | | | | | | | | | |
| | | | | |
| | 209,000 | | | Wal-Mart Stores, Inc., (2) | | | | | | | | | 12,811,700 | |
| | | | | |
| | | | Health Care Providers & Services – 4.3% | | | | | | | | | |
| | | | | |
| | 209,000 | | | UnitedHealth Group Incorporated | | | | | | | | | 24,586,760 | |
| | | | | |
| | | | Hotels, Restaurants & Leisure – 4.3% | | | | | | | | | |
| | | | | |
| | 209,000 | | | McDonald’s Corporation | | | | | | | | | 24,691,260 | |
| | | | | |
| | | | Household Products – 2.9% | | | | | | | | | |
| | | | | |
| | 209,000 | | | Procter & Gamble Company, (2) | | | | | | | | | 16,596,690 | |
| | | | | |
| | | | Industrial Conglomerates – 6.7% | | | | | | | | | |
| | | | | |
| | 209,000 | | | 3M Co., (2) | | | | | | | | | 31,483,760 | |
| | 209,000 | | | General Electric Company, (2) | | | | | | | | | 6,510,350 | |
| | | | Total Industrial Conglomerates | | | | | | | | | 37,994,110 | |
| | | | | |
| | | | Insurance – 4.1% | | | | | | | | | |
| | | | | |
| | 209,000 | | | Travelers Companies, Inc. | | | | | | | | | 23,587,740 | |
| | | | | |
| | | | IT Services – 7.9% | | | | | | | | | |
| | | | | |
| | 209,000 | | | International Business Machines Corporation, (2) | | | | | | | | | 28,762,580 | |
| | 209,000 | | | Visa Inc., Class A | | | | | | | | | 16,207,950 | |
| | | | Total IT Services | | | | | | | | | 44,970,530 | |
| | | | | |
| | | | Machinery – 2.5% | | | | | | | | | |
| | | | | |
| | 209,000 | | | Caterpillar Inc., (2) | | | | | | | | | 14,203,640 | |
| | | | | | | | | | | | | | | | | | | | |
| Shares | | | Description (1) | | | | | | | | | | | Value | |
| | | | | |
| | | | Media – 3.9% | | | | | | | | | | | | |
| | | | | |
| | 209,000 | | | Walt Disney Company | | | | | | | | | | | | | | $ | 21,961,720 | |
| | | | | |
| | | | Oil, Gas & Consumable Fuels – 6.2% | | | | | | | | | | | | |
| | | | | |
| | 209,000 | | | Chevron Corporation, (2) | | | | | | | | | | | | | | | 18,801,640 | |
| | 209,000 | | | Exxon Mobil Corporation, (2) | | | | | | | | | | | | | | | 16,291,550 | |
| | | | Total Oil, Gas & Consumable Fuels | | | | | | | | | | | | | | | 35,093,190 | |
| | | | | |
| | | | Pharmaceuticals – 6.9% | | | | | | | | | | | | |
| | | | | |
| | 209,000 | | | Johnson & Johnson | | | | | | | | | | | | | | | 21,468,480 | |
| | 209,000 | | | Merck & Co. Inc. | | | | | | | | | | | | | | | 11,039,380 | |
| | 209,000 | | | Pfizer Inc. | | | | | | | | | | | | | | | 6,746,520 | |
| | | | Total Pharmaceuticals | | | | | | | | | | | | | | | 39,254,380 | |
| | | | | |
| | | | Semiconductors & Semiconductor Equipment – 1.3% | | | | | | | | | | | | |
| | | | | |
| | 209,000 | | | Intel Corporation | | | | | | | | | | | | | | | 7,200,050 | |
| | | | | |
| | | | Software – 2.0% | | | | | | | | | | | | |
| | | | | |
| | 209,000 | | | Microsoft Corporation | | | | | | | | | | | | | | | 11,595,320 | |
| | | | | |
| | | | Specialty Retail – 4.9% | | | | | | | | | | | | |
| | | | | |
| | 209,000 | | | Home Depot, Inc. | | | | | | | | | | | | | | | 27,640,250 | |
| | | | | |
| | | | Technology Hardware, Storage & Peripherals – 3.9% | | | | | | | | | | | | |
| | | | | |
| | 209,000 | | | Apple, Inc. | | | | | | | | | | | | | | | 21,999,340 | |
| | | | | |
| | | | Textiles, Apparel & Luxury Goods – 4.6% | | | | | | | | | | | | |
| | | | | |
| | 418,000 | | | Nike, Inc., Class B | | | | | | | | | | | | | | | 26,125,000 | |
| | | | Total Common Stocks (cost $364,262,674) | | | | | | | | | | | | | | | 544,847,325 | |
| | | | | |
| Shares | | | Description (1), (3) | | | | | | | | | | | Value | |
| | | | | |
| | | | EXCHANGE-TRADED FUNDS – 4.3% | | | | | | | | | | | | | | | | |
| | | | | |
| | 140,000 | | | SPDR® Dow Jones® Industrial Average ETF | | | | | | | | | | | | | | $ | 24,358,600 | |
| | | | Total Exchange-Traded Funds (cost $25,323,197) | | | | | | | | | | | | | | | 24,358,600 | |
| | | | Total Long-Term Investments (cost $389,585,871) | | | | | | | | | | | | | | | 569,205,925 | |
| | | | | |
Principal
Amount (000) | | | Description (1) | | Coupon | | | Maturity | | | Ratings (4) | | | Value | |
| | | | | |
| | | | SHORT-TERM INVESTMENTS – 0.9% | | | | | | | | | | | | | | | | |
| | | | | |
| | | | U.S. GOVERNMENT AND AGENCY OBLIGATIONS – 0.9% | | | | | | | | | | | | |
| | | | | |
| $ | 5,000 | | | U.S. Treasury Bills | | | 0.000% | | | | 4/28/16 | | | | AAA | | | $ | 4,995,810 | |
| | | | Total Short-Term Investments (cost $4,995,559) | | | | | | | | | | | | | | | 4,995,810 | |
| | | | Total Investments (cost $394,581,430) – 100.8% | | | | | | | | | | | | | | | 574,201,735 | |
| | | | Other Assets Less Liabilities – (0.8)% (5) | | | | | | | | | | | | | | | (4,597,765 | ) |
| | | | Net Assets – 100% | | | | | | | | | | | | | | $ | 569,603,970 | |
Investments in Derivatives as of December 31, 2015
Options Written outstanding:
| | | | | | | | | | | | | | | | | | | | | | | | | | | | |
| Option Type | | Number of
Contracts | | | Description | | Exchange-Traded/
Over-the-Counter | | | Counterparty | | Notional
Amount (6) | | | Expiration
Date | | | Strike
Price | | | Value | |
Call | | | (50 | ) | | 3M Co. | | | Over-the-Counter | | | UBS | | $ | (799,902 | ) | | | 1/26/16 | | | $ | 159.9804 | | | $ | (604 | ) |
Call | | | (50 | ) | | American Express Company | | | Over-the-Counter | | | UBS | | | (378,810 | ) | | | 1/26/16 | | | | 75.7620 | | | | (194 | ) |
Call | | | (50 | ) | | Apple, Inc. | | | Over-the-Counter | | | HSBC | | | (596,645 | ) | | | 1/26/16 | | | | 119.3290 | | | | (1,048 | ) |
Call | | | (50 | ) | | Boeing Company | | | Over-the-Counter | | | UBS | | | (791,262 | ) | | | 1/26/16 | | | | 158.2524 | | | | (545 | ) |
| | | | |
| DIAX | | Nuveen Dow 30SM Dynamic Overwrite Fund |
| | Portfolio of Investments (continued) | | December 31, 2015 |
Investments in Derivatives as of December 31, 2015
Options Written outstanding (continued):
| | | | | | | | | | | | | | | | | | | | | | | | | | | | |
| Option Type | | Number of
Contracts | | | Description | | Exchange-Traded/
Over-the-Counter | | | Counterparty | | Notional
Amount (6) | | | Expiration
Date | | | Strike Price | | | Value | |
Call | | | (50 | ) | | Caterpillar Inc. | | | Over-the-Counter | | | HSBC | | $ | (360,450 | ) | | | 1/26/16 | | | $ | 72.0900 | | | $ | (1,413 | ) |
Call | | | (50 | ) | | Chevron Corporation | | | Over-the-Counter | | | BNP Paribas | | | (500,904 | ) | | | 1/26/16 | | | | 100.1808 | | | | (819 | ) |
Call | | | (50 | ) | | Cisco Systems, Inc. | | | Over-the-Counter | | | HSBC | | | (144,990 | ) | | | 1/26/16 | | | | 28.9980 | | | | (205 | ) |
Call | | | (50 | ) | | Coca-Cola Company | | | Over-the-Counter | | | UBS | | | (232,578 | ) | | | 1/26/16 | | | | 46.5156 | | | | (79 | ) |
Call | | | (50 | ) | | E.I. Du Pont de Nemours and Company | | | Over-the-Counter | | | Citigroup | | | (359,100 | ) | | | 1/26/16 | | | | 71.8200 | | | | (1,755 | ) |
Call | | | (50 | ) | | Exxon Mobil Corporation | | | Over-the-Counter | | | BNP Paribas | | | (428,922 | ) | | | 1/26/16 | | | | 85.7844 | | | | (408 | ) |
Call | | | (50 | ) | | General Electric Company | | | Over-the-Counter | | | UBS | | | (163,728 | ) | | | 1/26/16 | | | | 32.7456 | | | | (122 | ) |
Call | | | (50 | ) | | Goldman Sachs Group, Inc. | | | Over-the-Counter | | | UBS | | | (982,854 | ) | | | 1/26/16 | | | | 196.5708 | | | | (1,765 | ) |
Call | | | (50 | ) | | Home Depot, Inc. | | | Over-the-Counter | | | BNP Paribas | | | (708,966 | ) | | | 1/26/16 | | | | 141.7932 | | | | (287 | ) |
Call | | | (50 | ) | | International Business Machines Corporation | | | Over-the-Counter | | | BNP Paribas | | | (744,066 | ) | | | 1/26/16 | | | | 148.8132 | | | | (531 | ) |
Call | | | (50 | ) | | Intel Corporation | | | Over-the-Counter | | | UBS | | | (189,972 | ) | | | 1/26/16 | | | | 37.9944 | | | | (249 | ) |
Call | | | (50 | ) | | Johnson & Johnson | | | Over-the-Counter | | | UBS | | | (562,302 | ) | | | 1/26/16 | | | | 112.4604 | | | | (147 | ) |
Call | | | (50 | ) | | JPMorgan Chase & Co. | | | Over-the-Counter | | | UBS | | | (356,940 | ) | | | 1/26/16 | | | | 71.3880 | | | | (269 | ) |
Call | | | (50 | ) | | McDonald’s Corporation | | | Over-the-Counter | | | BNP Paribas | | | (631,422 | ) | | | 1/26/16 | | | | 126.2844 | | | | (1,022 | ) |
Call | | | (50 | ) | | Merck & Co. Inc. | | | Over-the-Counter | | | HSBC | | | (285,660 | ) | | | 1/26/16 | | | | 57.1320 | | | | (168 | ) |
Call | | | (50 | ) | | Microsoft Corporation | | | Over-the-Counter | | | BNP Paribas | | | (298,080 | ) | | | 1/26/16 | | | | 59.6160 | | | | (1,104 | ) |
Put | | | (64 | ) | | NASDAQ 100® Index | | | Exchange-Traded | | | — | | | (28,800,000 | ) | | | 1/15/16 | | | | 4,500.0000 | | | | (217,920 | ) |
Call | | | (64 | ) | | NASDAQ 100® Index | | | Exchange-Traded | | | — | | | (30,720,000 | ) | | | 1/15/16 | | | | 4,800.0000 | | | | (13,600 | ) |
Call | | | (100 | ) | | Nike, Inc. | | | Over-the-Counter | | | BNP Paribas | | | (694,494 | ) | | | 1/26/16 | | | | 69.4494 | | | | (619 | ) |
Call | | | (50 | ) | | Pfizer Inc. | | | Over-the-Counter | | | UBS | | | (174,204 | ) | | | 1/26/16 | | | | 34.8408 | | | | (149 | ) |
Call | | | (50 | ) | | Procter & Gamble Company | | | Over-the-Counter | | | UBS | | | (430,272 | ) | | | 1/26/16 | | | | 86.0544 | | | | (39 | ) |
Call | | | (1,080 | ) | | S&P 500® Index | | | Exchange-Traded | | | — | | | (218,700,000 | ) | | | 1/15/16 | | | | 2,025.0000 | | | | (3,893,400 | ) |
Call | | | (280 | ) | | S&P 500® Index | | | Exchange-Traded | | | — | | | (58,100,000 | ) | | | 1/15/16 | | | | 2,075.0000 | | | | (263,200 | ) |
Call | | | (50 | ) | | Travelers Companies, Inc. | | | Over-the-Counter | | | HSBC | | | (611,172 | ) | | | 1/26/16 | | | | 122.2344 | | | | (406 | ) |
Call | | | (50 | ) | | United Technologies Corporation | | | Over-the-Counter | | | BNP Paribas | | | (503,604 | ) | | | 1/26/16 | | | | 100.7208 | | | | (2,245 | ) |
Call | | | (50 | ) | | UnitedHealth Group Incorporated | | | Over-the-Counter | | | JPMorgan Chase | | | (635,094 | ) | | | 1/26/16 | | | | 127.0188 | | | | (1,132 | ) |
Call | | | (50 | ) | | Verizon Communications Inc. | | | Over-the-Counter | | | UBS | | | (245,970 | ) | | | 1/26/16 | | | | 49.1940 | | | | (92 | ) |
Call | | | (50 | ) | | Visa Inc. | | | Over-the-Counter | | | UBS | | | (424,494 | ) | | | 1/26/16 | | | | 84.8988 | | | | (365 | ) |
Call | | | (50 | ) | | Wal-Mart Stores, Inc. | | | Over-the-Counter | | | BNP Paribas | | | (322,056 | ) | | | 1/26/16 | | | | 64.4112 | | | | (556 | ) |
Call | | | (50 | ) | | Walt Disney Company | | | Over-the-Counter | | | BNP Paribas | | | (605,664 | ) | | | 1/26/16 | | | | 121.1328 | | | | (249 | ) |
| | | | (3,038 | ) | | Total Options Written (premiums received $4,768,102) | | | | | $ | (350,484,577 | ) | | | | | | | | | | $ | (4,406,706 | ) |
For Fund portfolio compliance purposes, the Fund’s industry classifications refer to any one or more of the industry sub-classifications used by one or more widely recognized market indexes or ratings group indexes, and/or as defined by Fund management. This definition may not apply for purposes of this report, which may combine industry sub-classifications into sectors for reporting ease.
| (1) | All percentages in the Portfolio of Investments are based on net assets. |
| (2) | Investment, or portion of investment, has been pledged to collateralize the net payment obligations for investments in derivatives. |
| (3) | A copy of the most recent financial statements for these exchange-traded funds can be obtained directly from the Securities and Exchange Commission on its website at http://www.sec.gov. |
| (4) | Ratings (not covered by the report of independent registered public accounting firm): Using the highest of Standard & Poor’s Group (“Standard & Poor’s”), Moody’s Investors Service, Inc. (“Moody’s”) or Fitch, Inc. (“Fitch”) rating. Ratings below BBB by Standard & Poor’s, Baa by Moody’s or BBB by Fitch are considered to be below investment grade. Holdings designated N/R are not rated by any of these national rating agencies. |
| (5) | Other assets less liabilities includes the unrealized appreciation (depreciation) of certain over-the-counter derivatives as presented on the Statement of Assets and Liabilities. The unrealized appreciation (depreciation) of exchange-cleared and exchange-traded derivatives is recognized as part of the cash collateral at brokers and/or the receivable or payable for variation margin as presented on the Statement of Assets and Liabilities, when applicable. Other assets less liabilities also includes the value of options as presented on the Statement of Assets and Liabilities. |
| (6) | For disclosure purposes, Notional Amount is calculated by multiplying the Number of Contracts by the Strike Price by 100. |
See accompanying notes to financial statements.
SPXX
| | |
Nuveen S&P 500 Dynamic Overwrite Fund | | |
Portfolio of Investments | | December 31, 2015 |
| | | | | | | | | | | | | | |
| Shares | | | Description (1) | | | | | | | | Value | |
| | | | | |
| | | | LONG-TERM INVESTMENTS – 100.7% | | | | | | | | | | |
| | | | | |
| | | | COMMON STOCKS – 96.8% | | | | | | | | | | |
| | | | | |
| | | | Aerospace & Defense – 3.2% | | | | | | | | | |
| | | | | |
| | 13,360 | | | Boeing Company | | | | | | | | $ | 1,931,722 | |
| | 14,778 | | | Honeywell International Inc. | | | | | | | | | 1,530,557 | |
| | 5,000 | | | Lockheed Martin Corporation | | | | | | | | | 1,085,750 | |
| | 11,161 | | | Raytheon Company | | | | | | | | | 1,389,879 | |
| | 18,456 | | | United Technologies Corporation, (2) | | | | | | | | | 1,773,068 | |
| | | | Total Aerospace & Defense | | | | | | | | | 7,710,976 | |
| | | | | |
| | | | Air Freight & Logistics – 0.6% | | | | | | | | | |
| | | | | |
| | 15,007 | | | United Parcel Service, Inc., Class B, (2) | | | | | | | | | 1,444,124 | |
| | | | | |
| | | | Airlines – 0.3% | | | | | | | | | |
| | | | | |
| | 8,915 | | | Alaska Air Group, Inc. | | | | | | | | | 717,747 | |
| | | | | |
| | | | Auto Components – 0.1% | | | | | | | | | |
| | | | | |
| | 9,310 | | | Cooper Tire & Rubber Company | | | | | | | | | 352,384 | |
| | | | | |
| | | | Automobiles – 0.7% | | | | | | | | | |
| | | | | |
| | 79,596 | | | Ford Motor Company | | | | | | | | | 1,121,508 | |
| | 2,596 | | | Tesla Motors Inc., (3) | | | | | | | | | 623,066 | |
| | | | Total Automobiles | | | | | | | | | 1,744,574 | |
| | | | | |
| | | | Banks – 6.7% | | | | | | | | | |
| | | | | |
| | 160,447 | | | Bank of America Corporation, (2) | | | | | | | | | 2,700,323 | |
| | 44,963 | | | Citigroup Inc. | | | | | | | | | 2,326,835 | |
| | 12,743 | | | Comerica Incorporated | | | | | | | | | 533,040 | |
| | 12,783 | | | Fifth Third Bancorp | | | | | | | | | 256,938 | |
| | 49,105 | | | Huntington BancShares Inc. | | | | | | | | | 543,101 | |
| | 50,000 | | | JP Morgan Chase & Co. | | | | | | | | | 3,301,500 | |
| | 33,673 | | | Regions Financial Corporation | | | | | | | | | 323,261 | |
| | 33,569 | | | U.S. Bancorp | | | | | | | | | 1,432,389 | |
| | 84,846 | | | Wells Fargo & Company, (2) | | | | | | | | | 4,612,229 | |
| | | | Total Banks | | | | | | | | | 16,029,616 | |
| | | | | |
| | | | Beverages – 2.4% | | | | | | | | | |
| | | | | |
| | 59,322 | | | Coca-Cola Company | | | | | | | | | 2,548,473 | |
| | 31,552 | | | PepsiCo, Inc. | | | | | | | | | 3,152,676 | |
| | | | Total Beverages | | | | | | | | | 5,701,149 | |
| | | | | |
| | | | Biotechnology – 3.1% | | | | | | | | | |
| | | | | |
| | 30,542 | | | AbbVie Inc. | | | | | | | | | 1,809,308 | |
| | 13,002 | | | Amgen Inc. | | | | | | | | | 2,110,615 | |
| | 12,463 | | | Celgene Corporation, (3) | | | | | | | | | 1,492,569 | |
| | 20,000 | | | Gilead Sciences, Inc., (2) | | | | | | | | | 2,023,800 | |
| | | | Total Biotechnology | | | | | | | | | 7,436,292 | |
| | | | | |
| | | | Capital Markets – 1.7% | | | | | | | | | |
| | | | | |
| | 46,972 | | | Charles Schwab Corporation | | | | | | | | | 1,546,788 | |
| | 16,113 | | | Federated Investors Inc. | | | | | | | | | 461,637 | |
| | 5,365 | | | Goldman Sachs Group, Inc. | | | | | | | | | 966,934 | |
| | 30,033 | | | Morgan Stanley | | | | | | | | | 955,350 | |
| | | | Total Capital Markets | | | | | | | | | 3,930,709 | |
| | | | |
| SPXX | | Nuveen S&P 500 Dynamic Overwrite Fund |
| | Portfolio of Investments (continued) | | December 31, 2015 |
| | | | | | | | | | | | | | |
| Shares | | | Description (1) | | | | | | | | Value | |
| | | | | |
| | | | Chemicals – 2.1% | | | | | | | | | |
| | | | | |
| | 3,540 | | | Chemours Company | | | | | | | | $ | 18,974 | |
| | 14,584 | | | Dow Chemical Company | | | | | | | | | 750,784 | |
| | 17,703 | | | E.I. Du Pont de Nemours and Company | | | | | | | | | 1,179,020 | |
| | 9,690 | | | Eastman Chemical Company | | | | | | | | | 654,172 | |
| | 10,640 | | | Monsanto Company | | | | | | | | | 1,048,253 | |
| | 15,626 | | | Olin Corporation | | | | | | | | | 269,705 | |
| | 11,220 | | | PPG Industries, Inc. | | | | | | | | | 1,108,760 | |
| | | | Total Chemicals | | | | | | | | | 5,029,668 | |
| | | | | |
| | | | Commercial Services & Supplies – 0.2% | | | | | | | | | |
| | | | | |
| | 9,103 | | | Deluxe Corporation | | | | | | | | | 496,478 | |
| | | | | |
| | | | Communications Equipment – 1.8% | | | | | | | | | |
| | | | | |
| | 73,511 | | | Cisco Systems, Inc. | | | | | | | | | 1,996,191 | |
| | 11,542 | | | Motorola Solutions Inc. | | | | | | | | | 790,050 | |
| | 27,896 | | | QUALCOMM, Inc. | | | | | | | | | 1,394,382 | |
| | | | Total Communications Equipment | | | | | | | | | 4,180,623 | |
| | | | | |
| | | | Consumer Finance – 0.6% | | | | | | | | | |
| | | | | |
| | 20,573 | | | American Express Company | | | | | | | | | 1,430,852 | |
| | | | | |
| | | | Containers & Packaging – 0.1% | | | | | | | | | |
| | | | | |
| | 5,330 | | | Avery Dennison Corporation | | | | | | | | | 333,978 | |
| | | | | |
| | | | Diversified Financial Services – 2.2% | | | | | | | | | |
| | | | | |
| | 27,775 | | | Berkshire Hathaway Inc., Class B, (2), (3) | | | | | | | | | 3,667,411 | |
| | 10,081 | | | CME Group, Inc. | | | | | | | | | 913,339 | |
| | 2,724 | | | Intercontinental Exchange, Inc. | | | | | | | | | 698,052 | |
| | | | Total Diversified Financial Services | | | | | | | | | 5,278,802 | |
| | | | | |
| | | | Diversified Telecommunication Services – 2.3% | | | | | | | | | |
| | | | | |
| | 75,000 | | | AT&T Inc., (2) | | | | | | | | | 2,580,750 | |
| | 52,803 | | | Frontier Communications Corporation | | | | | | | | | 246,590 | |
| | 55,000 | | | Verizon Communications Inc., (2) | | | | | | | | | 2,542,100 | |
| | | | Total Diversified Telecommunication Services | | | | | | | | | 5,369,440 | |
| | | | | |
| | | | Electric Utilities – 1.0% | | | | | | | | | |
| | | | | |
| | 20,970 | | | Duke Energy Corporation | | | | | | | | | 1,497,048 | |
| | 18,987 | | | Westar Energy Inc. | | | | | | | | | 805,239 | |
| | | | Total Electric Utilities | | | | | | | | | 2,302,287 | |
| | | | | |
| | | | Electrical Equipment – 0.6% | | | | | | | | | |
| | | | | |
| | 6,500 | | | Eaton Corporation PLC | | | | | | | | | 338,260 | |
| | 10,000 | | | Emerson Electric Company | | | | | | | | | 478,300 | |
| | 6,854 | | | Rockwell Automation, Inc. | | | | | | | | | 703,289 | |
| | | | Total Electrical Equipment | | | | | | | | | 1,519,849 | |
| | | | | |
| | | | Electronic Equipment, Instruments & Comp – 0.3% | | | | | | | | | |
| | | | | |
| | 35,466 | | | Corning Incorporated | | | | | | | | | 648,318 | |
| | | | | |
| | | | Energy Equipment & Services – 1.1% | | | | | | | | | |
| | | | | |
| | 12,363 | | | Baker Hughes Incorporated | | | | | | | | | 570,552 | |
| | 10,000 | | | Halliburton Company | | | | | | | | | 340,400 | |
| | 9,961 | | | National-Oilwell Varco Inc. | | | | | | | | | 333,594 | |
| | 20,806 | | | Schlumberger Limited | | | | | | | | | 1,451,219 | |
| | | | Total Energy Equipment & Services | | | | | | | | | 2,695,765 | |
| | | | | |
| | | | Food & Staples Retailing – 1.8% | | | | | | | | | |
| | | | | |
| | 18,974 | | | CVS Health Corporation | | | | | | | | | 1,855,088 | |
| | 12,000 | | | Walgreens Boots Alliance Inc. | | | | | | | | | 1,021,860 | |
| | | | | | | | | | | | | | |
| Shares | | | Description (1) | | | | | | | | Value | |
| | | | | |
| | | | Food & Staples Retailing (continued) | | | | | | | | | |
| | | | | |
| | 24,502 | | | Wal-Mart Stores, Inc. | | | | | | | | $ | 1,501,973 | |
| | | | Total Food & Staples Retailing | | | | | | | | | 4,378,921 | |
| | | | | |
| | | | Food Products – 1.0% | | | | | | | | | |
| | | | | |
| | 13,960 | | | Archer-Daniels-Midland Company | | | | | | | | | 512,053 | |
| | 17,628 | | | ConAgra Foods, Inc. | | | | | | | | | 743,196 | |
| | 15,625 | | | Kraft Heinz Company | | | | | | | | | 1,136,875 | |
| | | | Total Food Products | | | | | | | | | 2,392,124 | |
| | | | | |
| | | | Gas Utilities – 0.2% | | | | | | | | | |
| | | | | |
| | 9,045 | | | AGL Resources Inc. | | | | | | | | | 577,161 | |
| | | | | |
| | | | Health Care Equipment & Supplies – 1.8% | | | | | | | | | |
| | | | | |
| | 27,082 | | | Abbott Laboratories, (2) | | | | | | | | | 1,216,253 | |
| | 28,854 | | | Boston Scientific Corporation, (3) | | | | | | | | | 532,068 | |
| | 31,998 | | | Medtronic, PLC | | | | | | | | | 2,461,286 | |
| | | | Total Health Care Equipment & Supplies | | | | | | | | | 4,209,607 | |
| | | | | |
| | | | Health Care Providers & Services – 3.0% | | | | | | | | | |
| | | | | |
| | 9,358 | | | Aetna Inc. | | | | | | | | | 1,011,787 | |
| | 6,848 | | | Anthem Inc. | | | | | | | | | 954,885 | |
| | 16,284 | | | Express Scripts Holding Company, (3) | | | | | | | | | 1,423,384 | |
| | 5,614 | | | Humana Inc. | | | | | | | | | 1,002,155 | |
| | 367 | | | Laboratory Corporation of America Holdings, (3) | | | | | | | | | 45,376 | |
| | 3,233 | | | McKesson HBOC Inc. | | | | | | | | | 637,645 | |
| | 16,804 | | | UnitedHealth Group Incorporated, (2) | | | | | | | | | 1,976,823 | |
| | | | Total Health Care Providers & Services | | | | | | | | | 7,052,055 | |
| | | | | |
| | | | Hotels, Restaurants & Leisure – 1.5% | | | | | | | | | |
| | | | | |
| | 6,278 | | | Dominos Pizza Inc. | | | | | | | | | 698,428 | |
| | 15,000 | | | McDonald’s Corporation | | | | | | | | | 1,772,100 | |
| | 20,000 | | | Starbucks Corporation | | | | | | | | | 1,200,600 | |
| | | | Total Hotels, Restaurants & Leisure | | | | | | | | | 3,671,128 | |
| | | | | |
| | | | Household Durables – 0.7% | | | | | | | | | |
| | | | | |
| | 9,325 | | | Lennar Corporation, Class A, (2) | | | | | | | | | 456,086 | |
| | 16,964 | | | Newell Rubbermaid Inc. | | | | | | | | | 747,773 | |
| | 2,393 | | | Whirlpool Corporation | | | | | | | | | 351,460 | |
| | | | Total Household Durables | | | | | | | | | 1,555,319 | |
| | | | | |
| | | | Household Products – 2.0% | | | | | | | | | |
| | | | | |
| | 10,456 | | | Colgate-Palmolive Company | | | | | | | | | 696,579 | |
| | 9,737 | | | Kimberly-Clark Corporation | | | | | | | | | 1,239,520 | |
| | 36,241 | | | Procter & Gamble Company, (2) | | | | | | | | | 2,877,898 | |
| | | | Total Household Products | | | | | | | | | 4,813,997 | |
| | | | | |
| | | | Industrial Conglomerates – 2.8% | | | | | | | | | |
| | | | | |
| | 15,041 | | | 3M Co. | | | | | | | | | 2,265,776 | |
| | 140,000 | | | General Electric Company | | | | | | | | | 4,361,000 | |
| | | | Total Industrial Conglomerates | | | | | | | | | 6,626,776 | |
| | | | | |
| | | | Insurance – 2.8% | | | | | | | | | |
| | | | | |
| | 20,000 | | | American International Group, Inc. | | | | | | | | | 1,239,400 | |
| | 16,090 | | | Arthur J. Gallagher & Co. | | | | | | | | | 658,725 | |
| | 17,655 | | | FNF Group | | | | | | | | | 612,099 | |
| | 20,130 | | | Genworth Financial Inc., Class A, (3) | | | | | | | | | 75,085 | |
| | 11,100 | | | Marsh & McLennan Companies, Inc. | | | | | | | | | 615,495 | |
| | 15,000 | | | MetLife, Inc. | | | | | | | | | 723,150 | |
| | 10,189 | | | Prudential Financial, Inc. | | | | | | | | | 829,486 | |
| | 12,000 | | | Torchmark Corporation | | | | | | | | | 685,920 | |
| | | | |
| SPXX | | Nuveen S&P 500 Dynamic Overwrite Fund |
| | Portfolio of Investments (continued) | | December 31, 2015 |
| | | | | | | | | | | | | | |
| Shares | | | Description (1) | | | | | | | | Value | |
| | | | | |
| | | | Insurance (continued) | | | | | | | | | |
| | | | | |
| | 11,626 | | | Travelers Companies, Inc. | | | | | | | | $ | 1,312,110 | |
| | | | Total Insurance | | | | | | | | | 6,751,470 | |
| | | | | |
| | | | Internet & Catalog Retail – 2.0% | | | | | | | | | |
| | | | | |
| | 5,000 | | | Amazon.com, Inc., (3) | | | | | | | | | 3,379,450 | |
| | 5,000 | | | Netflix Inc., (3) | | | | | | | | | 571,900 | |
| | 690 | | | Priceline Group, Inc. (The), (3) | | | | | | | | | 879,716 | |
| | | | Total Internet & Catalog Retail | | | | | | | | | 4,831,066 | |
| | | | | |
| | | | Internet Software & Services – 4.6% | | | | | | | | | |
| | | | | |
| | 3,711 | | | Akamai Technologies, Inc., (3) | | | | | | | | | 195,310 | |
| | 4,020 | | | Alphabet Inc., Class A, (2), (3) | | | | | | | | | 3,127,600 | |
| | 4,031 | | | Alphabet Inc., Class C, (3) | | | | | | | | | 3,059,045 | |
| | 20,000 | | | eBay Inc., (3) | | | | | | | | | 549,600 | |
| | 34,000 | | | Facebook Inc., Class A, (3) | | | | | | | | | 3,558,440 | |
| | 6,424 | | | VeriSign, Inc., (3) | | | | | | | | | 561,201 | |
| | | | Total Internet Software & Services | | | | | | | | | 11,051,196 | |
| | | | | |
| | | | IT Services – 3.1% | | | | | | | | | |
| | | | | |
| | 11,474 | | | Fidelity National Information Services, Inc. | | | | | | | | | 695,324 | |
| | 12,300 | | | International Business Machines Corporation, (2) | | | | | | | | | 1,692,726 | |
| | 16,471 | | | MasterCard, Inc. | | | | | | | | | 1,603,617 | |
| | 20,000 | | | PayPal Holdings, Inc., (3) | | | | | | | | | 724,000 | |
| | 34,024 | | | Visa Inc., Class A | | | | | | | | | 2,638,561 | |
| | | | Total IT Services | | | | | | | | | 7,354,228 | |
| | | | | |
| | | | Life Sciences Tools & Services – 0.6% | | | | | | | | | |
| | | | | |
| | 6,183 | | | Bio-Techne Corporation | | | | | | | | | 556,470 | |
| | 6,000 | | | Thermo Fisher Scientific, Inc. | | | | | | | | | 851,100 | |
| | | | Total Life Sciences Tools & Services | | | | | | | | | 1,407,570 | |
| | | | | |
| | | | Machinery – 2.0% | | | | | | | | | |
| | | | | |
| | 12,391 | | | Caterpillar Inc. | | | | | | | | | 842,092 | |
| | 3,049 | | | Cummins Inc. | | | | | | | | | 268,342 | |
| | 11,246 | | | Deere & Company | | | | | | | | | 857,732 | |
| | 13,943 | | | Illinois Tool Works, Inc., (2) | | | | | | | | | 1,292,237 | |
| | 5,351 | | | Pentair Limited | | | | | | | | | 265,035 | |
| | 5,000 | | | Snap-on Incorporated | | | | | | | | | 857,150 | |
| | 3,000 | | | Stanley Black & Decker Inc. | | | | | | | | | 320,190 | |
| | | | Total Machinery | | | | | | | | | 4,702,778 | |
| | | | | |
| | | | Media – 2.8% | | | | | | | | | |
| | | | | |
| | 12,544 | | | CBS Corporation, Class B | | | | | | | | | 591,199 | |
| | 47,345 | | | Comcast Corporation, Class A, (2) | | | | | | | | | 2,671,678 | |
| | 4,063 | | | Gannett Company, Inc. | | | | | | | | | 66,186 | |
| | 26,035 | | | Regal Entertainment Group, Class A | | | | | | | | | 491,280 | |
| | 8,126 | | | TEGNA Inc. | | | | | | | | | 207,376 | |
| | 25,000 | | | Walt Disney Company | | | | | | | | | 2,627,000 | |
| | | | Total Media | | | | | | | | | 6,654,719 | |
| | | | | |
| | | | Metals & Mining – 0.3% | | | | | | | | | |
| | | | | |
| | 47,758 | | | Freeport-McMoRan, Inc. | | | | | | | | | 323,322 | |
| | 10,237 | | | Southern Copper Corporation | | | | | | | | | 267,390 | |
| | | | Total Metals & Mining | | | | | | | | | 590,712 | |
| | | | | |
| | | | Multiline Retail – 0.7% | | | | | | | | | |
| | | | | |
| | 7,375 | | | Nordstrom, Inc. | | | | | | | | | 367,349 | |
| | 18,608 | | | Target Corporation | | | | | | | | | 1,351,127 | |
| | | | Total Multiline Retail | | | | | | | | | 1,718,476 | |
| | | | | | | | | | | | | | |
| Shares | | | Description (1) | | | | | | | | Value | |
| | | | | |
| | | | Multi-Utilities – 1.4% | | | | | | | | | |
| | | | | |
| | 14,444 | | | Alliant Energy Corporation | | | | | | | | $ | 902,028 | |
| | 20,000 | | | CenterPoint Energy, Inc., (2) | | | | | | | | | 367,200 | |
| | 7,260 | | | Consolidated Edison, Inc. | | | | | | | | | 466,600 | |
| | 22,250 | | | Dominion Resources, Inc. | | | | | | | | | 1,504,990 | |
| | | | Total Multi-Utilities | | | | | | | | | 3,240,818 | |
| | | | | |
| | | | Oil, Gas & Consumable Fuels – 5.7% | | | | | | | | | |
| | | | | |
| | 27,692 | | | Chevron Corporation, (2) | | | | | | | | | 2,491,172 | |
| | 20,462 | | | ConocoPhillips | | | | | | | | | 955,371 | |
| | 11,317 | | | CONSOL Energy Inc. | | | | | | | | | 89,404 | |
| | 10,972 | | | EOG Resources, Inc. | | | | | | | | | 776,708 | |
| | 56,985 | | | Exxon Mobil Corporation, (2) | | | | | | | | | 4,441,981 | |
| | 7,395 | | | Hess Corporation | | | | | | | | | 358,510 | |
| | 23,618 | | | Marathon Oil Corporation | | | | | | | | | 297,351 | |
| | 12,072 | | | Marathon Petroleum Corporation | | | | | | | | | 625,812 | |
| | 16,016 | | | Occidental Petroleum Corporation | | | | | | | | | 1,082,842 | |
| | 10,602 | | | ONEOK, Inc. | | | | | | | | | 261,445 | |
| | 10,973 | | | Phillips 66 | | | | | | | | | 897,591 | |
| | 16,856 | | | Valero Energy Corporation | | | | | | | | | 1,191,888 | |
| | | | Total Oil, Gas & Consumable Fuels | | | | | | | | | 13,470,075 | |
| | | | | |
| | | | Personal Products – 0.2% | | | | | | | | | |
| | | | | |
| | 114,427 | | | Avon Products, Inc. | | | | | | | | | 463,429 | |
| | | | | |
| | | | Pharmaceuticals – 6.6% | | | | | | | | | |
| | | | | |
| | 6,000 | | | Allergan PLC, (3) | | | | | | | | | 1,875,000 | |
| | 33,890 | | | Bristol-Myers Squibb Company | | | | | | | | | 2,331,293 | |
| | 12,124 | | | Eli Lilly and Company | | | | | | | | | 1,021,568 | |
| | 42,430 | | | Johnson & Johnson, (2) | | | | | | | | | 4,358,410 | |
| | 50,045 | | | Merck & Co. Inc. | | | | | | | | | 2,643,377 | |
| | 5,000 | | | Mylan NV, (3) | | | | | | | | | 270,350 | |
| | 100,558 | | | Pfizer Inc. | | | | | | | | | 3,246,012 | |
| | | | Total Pharmaceuticals | | | | | | | | | 15,746,010 | |
| | | | | |
| | | | Real Estate Investment Trust – 1.3% | | | | | | | | | |
| | | | | |
| | 35,857 | | | Brandywine Realty Trust | | | | | | | | | 489,807 | |
| | 5,547 | | | Care Capital Properties, Inc. | | | | | | | | | 169,572 | |
| | 22,779 | | | CubeSmart | | | | | | | | | 697,493 | |
| | 16,442 | | | Hospitality Properties Trust | | | | | | | | | 429,958 | |
| | 20,277 | | | Omega Healthcare Investors Inc. | | | | | | | | | 709,289 | |
| | 10,000 | | | Ventas Inc. | | | | | | | | | 564,300 | |
| | | | Total Real Estate Investment Trust | | | | | | | | | 3,060,419 | |
| | | | | |
| | | | Real Estate Management & Development – 0.0% | | | | | | | | | |
| | | | | |
| | 272 | | | The RMR Group Inc., (3) | | | | | | | | | 3,920 | |
| | | | | |
| | | | Road & Rail – 0.5% | | | | | | | | | |
| | | | | |
| | 16,045 | | | Union Pacific Corporation, (2) | | | | | | | | | 1,254,719 | |
| | | | | |
| | | | Semiconductors & Semiconductor Equipment – 2.5% | | | | | | | | | |
| | | | | |
| | 5,985 | | | Analog Devices, Inc. | | | | | | | | | 331,090 | |
| | 78,815 | | | Intel Corporation | | | | | | | | | 2,715,177 | |
| | 12,219 | | | Microchip Technology Incorporated | | | | | | | | | 568,672 | |
| | 16,356 | | | Micron Technology, Inc., (3) | | | | | | | | | 231,601 | |
| | 19,215 | | | NVIDIA Corporation | | | | | | | | | 633,326 | |
| | 25,684 | | | Texas Instruments Incorporated | | | | | | | | | 1,407,740 | |
| | | | Total Semiconductors & Semiconductor Equipment | | | | | | | | | 5,887,606 | |
| | | | | |
| | | | Software – 3.8% | | | | | | | | | |
| | | | | |
| | 8,286 | | | Autodesk, Inc., (3) | | | | | | | | | 504,866 | |
| | 8,353 | | | CDK Global Inc. | | | | | | | | | 396,517 | |
| | | | |
| SPXX | | Nuveen S&P 500 Dynamic Overwrite Fund |
| | Portfolio of Investments (continued) | | December 31, 2015 |
| | | | | | | | | | | | | | |
| Shares | | | Description (1) | | | | | | | | Value | |
| | | | | |
| | | | Software (continued) | | | | | | | | | |
| | | | | |
| | 116,985 | | | Microsoft Corporation, (2) | | | | | | | | $ | 6,490,328 | |
| | 42,362 | | | Oracle Corporation | | | | | | | | | 1,547,484 | |
| | | | Total Software | | | | | | | | | 8,939,195 | |
| | | | | |
| | | | Specialty Retail – 2.5% | | | | | | | | | |
| | | | | |
| | 13,107 | | | Best Buy Co., Inc. | | | | | | | | | 399,108 | |
| | 17,000 | | | Home Depot, Inc., (2) | | | | | | | | | 2,248,250 | |
| | 8,340 | | | L Brands Inc. | | | | | | | | | 799,139 | |
| | 14,954 | | | Lowe’s Companies, Inc. | | | | | | | | | 1,137,102 | |
| | 7,525 | | | Tiffany & Co. | | | | | | | | | 574,082 | |
| | 10,968 | | | TJX Companies, Inc. | | | | | | | | | 777,741 | |
| | | | Total Specialty Retail | | | | | | | | | 5,935,422 | |
| | | | | |
| | | | Technology Hardware, Storage & Peripherals – 4.4% | | | | | | | | | |
| | | | | |
| | 82,408 | | | Apple, Inc., (2) | | | | | | | | | 8,674,266 | |
| | 40,436 | | | EMC Corporation | | | | | | | | | 1,038,396 | |
| | 25,651 | | | Hewlett-Packard Company | | | | | | | | | 389,895 | |
| | 25,651 | | | HP Inc. | | | | | | | | | 303,708 | |
| | | | Total Technology Hardware, Storage & Peripherals | | | | | | | | | 10,406,265 | |
| | | | | |
| | | | Textiles, Apparel & Luxury Goods – 0.9% | | | | | | | | | |
| | | | | |
| | 20,000 | | | Nike, Inc., Class B | | | | | | | | | 1,250,000 | |
| | 5,000 | | | Under Armour, Inc., (3) | | | | | | | | | 403,050 | |
| | 7,352 | | | VF Corporation, (2) | | | | | | | | | 457,662 | |
| | | | Total Textiles, Apparel & Luxury Goods | | | | | | | | | 2,110,712 | |
| | | | | |
| | | | Tobacco – 2.1% | | | | | | | | | |
| | | | | |
| | 26,349 | | | Altria Group, Inc. | | | | | | | | | 1,533,775 | |
| | 24,790 | | | Philip Morris International, Inc. | | | | | | | | | 2,179,289 | |
| | 25,474 | | | Reynolds American Inc. | | | | | | | | | 1,175,625 | |
| | | | Total Tobacco | | | | | | | | | 4,888,689 | |
| | | | | |
| | | | Trading Companies & Distributors – 0.1% | | | | | | | | | |
| | | | | |
| | 1,520 | | | W.W. Grainger, Inc. | | | | | | | | | 307,937 | |
| | | | Total Common Stocks (cost $145,390,390) | | | | | | | | | 230,408,150 | |
| | | | | |
| Shares | | | Description (1), (4) | | | | | | | | Value | |
| | | | | |
| | | | EXCHANGE-TRADE FUNDS – 3.9% | | | | | | | | | |
| | | | | |
| | 45,000 | | | SPDR® S&P 500® ETF, (2) | | | | | | | | $ | 9,175,050 | |
| | | | Total Exchange-Traded Funds (cost $9,331,668) | | | | | | | | | 9,175,050 | |
| | | | Total Long-Term Investments (cost $154,722,058) | | | | | | | | | 239,583,200 | |
| | | | Other Assets Less Liabilities – (0.7)% (5) | | | | | | | | | (1,773,799 | ) |
| | | | Net Assets – 100% | | | | | | | | $ | 237,809,401 | |
Investments in Derivatives as of December 31, 2015
Options Written outstanding:
| | | | | | | | | | | | | | | | | | | | | | |
| Option Type | | Number of
Contracts | | | Description | | Notional
Amount (6) | | | Expiration
Date | | | Strike
Price | | | Value | |
Put | | | (26 | ) | | NASDAQ 100® Index | | $ | (11,700,000 | ) | | | 1/15/16 | | | $ | 4,500 | | | $ | (48,047 | ) |
Call | | | (26 | ) | | NASDAQ 100® Index | | | (12,480,000 | ) | | | 1/15/16 | | | | 4,800 | | | | (5,525 | ) |
Call | | | (480 | ) | | S&P 500® Index | | | (97,200,000 | ) | | | 1/15/16 | | | | 2,025 | | | | (1,730,400 | ) |
Call | | | (120 | ) | | S&P 500® Index | | | (24,900,000 | ) | | | 1/15/16 | | | | 2,075 | | | | (112,800 | ) |
| | | | (652 | ) | | Total Options Written (premiums received $2,074,282) | | $ | (146,280,000 | ) | | | | | | | | | | $ | (1,896,772 | ) |
For Fund portfolio compliance purposes, the Fund’s industry classifications refer to any one or more of the industry sub-classifications used by one or more widely recognized market indexes or ratings group indexes, and/or as defined by Fund management. This definition may not apply for purposes of this report, which may combine industry sub-classifications into sectors for reporting ease.
| (1) | All percentages in the Portfolio of Investments are based on net assets. |
| (2) | Investment, or portion of investment, has been pledged to collateralize the net payment obligations for investments in derivatives. |
| (3) | Non-income producing; issuer has not declared a dividend within the past twelve months. |
| (4) | A copy of the most recent financial statements for these exchange-traded funds can be obtained directly from the Securities and Exchange Commission on its website at http://www.sec.gov. |
| (5) | Other assets less liabilities includes the unrealized appreciation (depreciation) of certain over-the counter derivatives as presented on the Statement of Assets and Liabilities. The unrealized appreciation (depreciation) of exchange-cleared and exchange-traded derivatives is recognized as part of the cash collateral at brokers and/or the receivable or payable for variation margin as presented on the Statement of Assets and Liabilities, when applicable. Other assets less liabilities also includes the value of options as presented on the Statement of Assets and Liabilities. |
| (6) | For disclosure purposes, Notional Amount is calculated by multiplying the Number of Contracts by the Strike Price by 100. |
See accompanying notes to financial statements.
QQQX
| | |
Nuveen Nasdaq 100 Dynamic Overwrite Fund | | |
Portfolio of Investments | | December 31, 2015 |
| | | | | | | | | | | | | | |
| Shares | | | Description (1) | | | | | | | | Value | |
| | | | | |
| | | | LONG-TERM INVESTMENTS – 100.8% | | | | | | | | | | |
| | | | | |
| | | | COMMON STOCKS – 96.0% | | | | | | | | | | |
| | | | | |
| | | | Aerospace & Defense – 1.0% | | | | | | | | | |
| | | | | |
| | 14,654 | | | Boeing Company | | | | | | | | $ | 2,118,822 | |
| | 19,540 | | | Honeywell International Inc. | | | | | | | | | 2,023,758 | |
| | 2,019 | | | Precision Castparts Corporation | | | | | | | | | 468,428 | |
| | 24,142 | | | United Technologies Corporation | | | | | | | | | 2,319,322 | |
| | | | Total Aerospace & Defense | | | | | | | | | 6,930,330 | |
| | | | | |
| | | | Air Freight & Logistics – 0.1% | | | | | | | | | |
| | | | | |
| | 2,768 | | | FedEx Corporation | | | | | | | | | 412,404 | |
| | | | | |
| | | | Airlines – 0.3% | | | | | | | | | |
| | | | | |
| | 12,008 | | | Delta Air Lines, Inc. | | | | | | | | | 608,686 | |
| | 6,742 | | | Ryanair Holdings PLC, Sponsored ADR | | | | | | | | | 582,913 | |
| | 26,363 | | | Southwest Airlines Co. | | | | | | | | | 1,135,191 | |
| | | | Total Airlines | | | | | | | | | 2,326,790 | |
| | | | | |
| | | | Auto Components – 0.1% | | | | | | | | | |
| | | | | |
| | 10,102 | | | American Axle and Manufacturing Holdings Inc. | | | | | | | | | 191,332 | |
| | 21,986 | | | Gentex Corporation | | | | | | | | | 351,996 | |
| | 4,227 | | | Lear Corporation | | | | | | | | | 519,202 | |
| | | | Total Auto Components | | | | | | | | | 1,062,530 | |
| | | | | |
| | | | Automobiles – 0.5% | | | | | | | | | |
| | | | | |
| | 49,165 | | | Ford Motor Company | | | | | | | | | 692,735 | |
| | 14,597 | | | Harley-Davidson, Inc. | | | | | | | | | 662,558 | |
| | 10,265 | | | Tesla Motors Inc., (2) | | | | | | | | | 2,463,703 | |
| | | | Total Automobiles | | | | | | | | | 3,818,996 | |
| | | | | |
| | | | Beverages – 0.9% | | | | | | | | | |
| | | | | |
| | 4,447 | | | Brown-Forman Corporation | | | | | | | | | 441,498 | |
| | 20,819 | | | Monster Beverage Corporation, (2) | | | | | | | | | 3,101,198 | |
| | 32,232 | | | PepsiCo, Inc. | | | | | | | | | 3,220,621 | |
| | | | Total Beverages | | | | | | | | | 6,763,317 | |
| | | | | |
| | | | Biotechnology – 10.4% | | | | | | | | | |
| | | | | |
| | 34,891 | | | AbbVie Inc. | | | | | | | | | 2,066,943 | |
| | 10,000 | | | Agios Pharmaceutical Inc., (2) | | | | | | | | | 649,200 | |
| | 14,052 | | | Alkermes PLC, (2) | | | | | | | | | 1,115,448 | |
| | 120,000 | | | Amgen Inc., (3) | | | | | | | | | 19,479,600 | |
| | 9,126 | | | Baxalta Inc. | | | | | | | | | 356,188 | |
| | 160,000 | | | Celgene Corporation, (2), (3) | | | | | | | | | 19,161,600 | |
| | 220,000 | | | Gilead Sciences, Inc., (3) | | | | | | | | | 22,261,800 | |
| | 6,049 | | | Immunogen, Inc., (2) | | | | | | | | | 82,085 | |
| | 10,136 | | | Ionis Pharmaceuticals, Inc., (2) | | | | | | | | | 627,722 | |
| | 12,904 | | | Myriad Genetics Inc., (2) | | | | | | | | | 556,937 | |
| | 15,000 | | | Regeneron Pharmaceuticals, Inc., (2) | | | | | | | | | 8,143,050 | |
| | 12,177 | | | Seattle Genetics, Inc., (2) | | | | | | | | | 546,504 | |
| | 6,117 | | | United Therapeutics Corporation, (2) | | | | | | | | | 957,983 | |
| | | | Total Biotechnology | | | | | | | | | 76,005,060 | |
| | | | | |
| | | | Capital Markets – 0.6% | | | | | | | | | |
| | | | | |
| | 62,652 | | | Charles Schwab Corporation | | | | | | | | | 2,063,130 | |
| | 24,475 | | | Morgan Stanley | | | | | | | | | 778,550 | |
| | 11,627 | | | SEI Investments Company | | | | | | | | | 609,255 | |
| | | | | | | | | | | | | | |
| Shares | | | Description (1) | | | | | | | | Value | |
| | | | | |
| | | | Capital Markets (continued) | | | | | | | | | |
| | | | | |
| | 5,883 | | | T. Rowe Price Group Inc. | | | | | | | | $ | 420,576 | |
| | 13,816 | | | Waddell & Reed Financial, Inc., Class A | | | | | | | | | 395,967 | |
| | | | Total Capital Markets | | | | | | | | | 4,267,478 | |
| | | | | |
| | | | Chemicals – 0.4% | | | | | | | | | |
| | | | | |
| | 2,138 | | | Air Products & Chemicals Inc. | | | | | | | | | 278,175 | |
| | 4,865 | | | CF Industries Holdings, Inc. | | | | | | | | | 198,541 | |
| | 4,408 | | | Chemours Company | | | | | | | | | 23,627 | |
| | 5,970 | | | Ecolab Inc. | | | | | | | | | 682,849 | |
| | 7,810 | | | Methanex Corporation | | | | | | | | | 257,808 | |
| | 10,514 | | | Monsanto Company | | | | | | | | | 1,035,839 | |
| | 3,448 | | | Praxair, Inc. | | | | | | | | | 353,075 | |
| | | | Total Chemicals | | | | | | | | | 2,829,914 | |
| | | | | |
| | | | Commercial Services & Supplies – 0.3% | | | | | | | | | |
| | | | | |
| | 3,842 | | | Cintas Corporation | | | | | | | | | 349,814 | |
| | 5,162 | | | Copart Inc., (2) | | | | | | | | | 196,208 | |
| | 7,605 | | | KAR Auction Services Inc. | | | | | | | | | 281,613 | |
| | 15,000 | | | Tetra Tech, Inc. | | | | | | | | | 390,300 | |
| | 4,788 | | | Waste Connections Inc. | | | | | | | | | 269,660 | |
| | 9,417 | | | Waste Management, Inc. | | | | | | | | | 502,585 | |
| | | | Total Commercial Services & Supplies | | | | | | | | | 1,990,180 | |
| | | | | |
| | | | Communications Equipment – 4.9% | | | | | | | | | |
| | | | | |
| | 818,295 | | | Cisco Systems, Inc., (3) | | | | | | | | | 22,220,801 | |
| | 21,858 | | | Ericsson, Sponsored ADR | | | | | | | | | 210,055 | |
| | 273,466 | | | QUALCOMM, Inc., (3) | | | | | | | | | 13,669,198 | |
| | | | Total Communications Equipment | | | | | | | | | 36,100,054 | |
| | | | | |
| | | | Consumer Finance – 0.1% | | | | | | | | | |
| | | | | |
| | 8,310 | | | American Express Company | | | | | | | | | 577,961 | |
| | 27,215 | | | Navient Corporation | | | | | | | | | 311,612 | |
| | 27,215 | | | SLM Corporation, (3) | | | | | | | | | 177,442 | |
| | | | Total Consumer Finance | | | | | | | | | 1,067,015 | |
| | | | | |
| | | | Containers & Packaging – 0.2% | | | | | | | | | |
| | | | | |
| | 10,899 | | | International Paper Company | | | | | | | | | 410,892 | |
| | 17,353 | | | Packaging Corp. of America | | | | | | | | | 1,094,107 | |
| | 4,824 | | | Sonoco Products Company | | | | | | | | | 197,157 | |
| | | | Total Containers & Packaging | | | | | | | | | 1,702,156 | |
| | | | | |
| | | | Distributors – 0.2% | | | | | | | | | |
| | | | | |
| | 3,449 | | | Genuine Parts Company | | | | | | | | | 296,235 | |
| | 40,470 | | | LKQ Corporation, (2) | | | | | | | | | 1,199,126 | |
| | | | Total Distributors | | | | | | | | | 1,495,361 | |
| | | | | |
| | | | Diversified Consumer Services – 0.1% | | | | | | | | | |
| | | | | |
| | 21,475 | | | Service Corporation International | | | | | | | | | 558,780 | |
| | | | | |
| | | | Diversified Financial Services – 0.3% | | | | | | | | | |
| | | | | |
| | 14,599 | | | CME Group, Inc. | | | | | | | | | 1,322,669 | |
| | 9,902 | | | Moody’s Corporation | | | | | | | | | 993,567 | |
| | | | Total Diversified Financial Services | | | | | | | | | 2,316,236 | |
| | | | | |
| | | | Electric Utilities – 0.2% | | | | | | | | | |
| | | | | |
| | 48,358 | | | Great Plains Energy Incorporated | | | | | | | | | 1,320,657 | |
| | 10,842 | | | OGE Energy Corp. | | | | | | | | | 285,036 | |
| | | | Total Electric Utilities | | | | | | | | | 1,605,693 | |
| | | | |
| QQQX | | Nuveen Nasdaq 100 Dynamic Overwrite Fund |
| | Portfolio of Investments (continued) | | December 31, 2015 |
| | | | | | | | | | | | | | |
| Shares | | | Description (1) | | | | | | | | Value | |
| | | | | |
| | | | Electrical Equipment – 0.4% | | | | | | | | | |
| | | | | |
| | 23,934 | | | Eaton Corporation PLC | | | | | | | | $ | 1,245,525 | |
| | 8,327 | | | Hubbell Inc. | | | | | | | | | 841,360 | |
| | 9,416 | | | Rockwell Automation, Inc. | | | | | | | | | 966,176 | |
| | | | Total Electrical Equipment | | | | | | | | | 3,053,061 | |
| | | | | |
| | | | Electronic Equipment, Instruments & Components – 0.3% | | | | | | | | | |
| | | | | |
| | 12,148 | | | Amphenol Corporation, Class A, (3) | | | | | | | | | 634,490 | |
| | 3,675 | | | Arrow Electronics, Inc., (2) | | | | | | | | | 199,112 | |
| | 5,960 | | | Avnet Inc. | | | | | | | | | 255,326 | |
| | 30,310 | | | Corning Incorporated | | | | | | | | | 554,067 | |
| | 7,692 | | | Keysight Technologies, Inc., (2) | | | | | | | | | 217,914 | |
| | 13,756 | | | National Instruments Corporation | | | | | | | | | 394,660 | |
| | | | Total Electronic Equipment, Instruments & Components | | | | | | | | | 2,255,569 | |
| | | | | |
| | | | Energy Equipment & Services – 0.4% | | | | | | | | | |
| | | | | |
| | 20,122 | | | Cooper Cameron Corporation, (2) | | | | | | | | | 1,271,710 | |
| | 7,838 | | | Diamond Offshore Drilling, Inc. | | | | | | | | | 165,382 | |
| | 15,853 | | | Schlumberger Limited | | | | | | | | | 1,105,747 | |
| | | | Total Energy Equipment & Services | | | | | | | | | 2,542,839 | |
| | | | | |
| | | | Food & Staples Retailing – 2.3% | | | | | | | | | |
| | | | | |
| | 2,453 | | | Casey’s General Stores, Inc. | | | | | | | | | 295,464 | |
| | 29,337 | | | CVS Health Corporation, (3) | | | | | | | | | 2,868,278 | |
| | 55,616 | | | Kroger Co. | | | | | | | | | 2,326,417 | |
| | 130,000 | | | Walgreens Boots Alliance Inc. | | | | | | | | | 11,070,150 | |
| | | | Total Food & Staples Retailing | | | | | | | | | 16,560,309 | |
| | | | | |
| | | | Food Products – 0.1% | | | | | | | | | |
| | | | | |
| | 10,080 | | | Archer-Daniels-Midland Company | | | | | | | | | 369,734 | |
| | | | | |
| | | | Gas Utilities – 0.2% | | | | | | | | | |
| | | | | |
| | 18,047 | | | AGL Resources Inc. | | | | | | | | | 1,151,579 | |
| | | | | |
| | | | Health Care Equipment & Supplies – 0.8% | | | | | | | | | |
| | | | | |
| | 31,753 | | | Abbott Laboratories, (3) | | | | | | | | | 1,426,027 | |
| | 9,126 | | | Baxter International, Inc. | | | | | | | | | 348,157 | |
| | 3,650 | | | Becton, Dickinson and Company, (3) | | | | | | | | | 562,429 | |
| | 1,655 | | | C. R. Bard, Inc. | | | | | | | | | 313,523 | |
| | 12,334 | | | Hill-Rom Holdings Inc. | | | | | | | | | 592,772 | |
| | 12,792 | | | Saint Jude Medical Inc. | | | | | | | | | 790,162 | |
| | 3,714 | | | Stryker Corporation | | | | | | | | | 345,179 | |
| | 11,178 | | | Zimmer Holdings, Inc. | | | | | | | | | 1,146,751 | |
| | | | Total Health Care Equipment & Supplies | | | | | | | | | 5,525,000 | |
| | | | | |
| | | | Health Care Providers & Services – 2.5% | | | | | | | | | |
| | | | | |
| | 7,890 | | | AmerisourceBergen Corporation | | | | | | | | | 818,272 | |
| | 7,690 | | | Anthem Inc. | | | | | | | | | 1,072,294 | |
| | 13,759 | | | Brookdale Senior Living Inc., (2) | | | | | | | | | 253,991 | |
| | 20,971 | | | Cardinal Health, Inc. | | | | | | | | | 1,872,081 | |
| | 115,949 | | | Express Scripts Holding Company, (2), (3) | | | | | | | | | 10,135,102 | |
| | 7,293 | | | McKesson HBOC Inc., (3) | | | | | | | | | 1,438,398 | |
| | 14,614 | | | UnitedHealth Group Incorporated | | | | | | | | | 1,719,191 | |
| | 7,946 | | | Universal Health Services, Inc., Class B | | | | | | | | | 949,468 | |
| | | | Total Health Care Providers & Services | | | | | | | | | 18,258,797 | |
| | | | | |
| | | | Health Care Technology – 0.0% | | | | | | | | | |
| | | | | |
| | 13,136 | | | Quality Systems Inc. | | | | | | | | | 211,752 | |
| | | | | |
| | | | Hotels, Restaurants & Leisure – 0.5% | | | | | | | | | |
| | | | | |
| | 20,714 | | | Carnival Corporation | | | | | | | | | 1,128,499 | |
| | | | | | | | | | | | | | |
| Shares | | | Description (1) | | | | | | | | Value | |
| | | | | |
| | | | Hotels, Restaurants & Leisure (continued) | | | | | | | | | |
| | | | | |
| | 1,773 | | | Panera Bread Company, Class A, (2) | | | | | | | | $ | 345,345 | |
| | 1,769 | | | Restaurant Brands International Inc. | | | | | | | | | 66,090 | |
| | 25,654 | | | Wynn Resorts Ltd, (3) | | | | | | | | | 1,775,000 | |
| | | | Total Hotels, Restaurants & Leisure | | | | | | | | | 3,314,934 | |
| | | | | |
| | | | Household Durables – 0.4% | | | | | | | | | |
| | | | | |
| | 41,536 | | | KB Home | | | | | | | | | 512,139 | |
| | 36,936 | | | Newell Rubbermaid Inc. | | | | | | | | | 1,628,139 | |
| | 7,376 | | | Whirlpool Corporation | | | | | | | | | 1,083,313 | |
| | | | Total Household Durables | | | | | | | | | 3,223,591 | |
| | | | | |
| | | | Industrial Conglomerates – 0.7% | | | | | | | | | |
| | | | | |
| | 8,803 | | | 3M Co. | | | | | | | | | 1,326,084 | |
| | 16,011 | | | Danaher Corporation | | | | | | | | | 1,487,102 | |
| | 82,528 | | | General Electric Company | | | | | | | | | 2,570,747 | |
| | | | Total Industrial Conglomerates | | | | | | | | | 5,383,933 | |
| | | | | |
| | | | Insurance – 0.6% | | | | | | | | | |
| | | | | |
| | 12,439 | | | American International Group, Inc. | | | | | | | | | 770,845 | |
| | 30,836 | | | CNA Financial Corporation | | | | | | | | | 1,083,885 | |
| | 29,248 | | | FNF Group | | | | | | | | | 1,014,028 | |
| | 12,000 | | | Torchmark Corporation | | | | | | | | | 685,920 | |
| | 9,130 | | | Travelers Companies, Inc. | | | | | | | | | 1,030,412 | |
| | | | Total Insurance | | | | | | | | | 4,585,090 | |
| | | | | |
| | | | Internet & Catalog Retail – 8.7% | | | | | | | | | |
| | | | | |
| | 73,866 | | | Amazon.com, Inc., (2), (3) | | | | | | | | | 49,925,291 | |
| | 11,995 | | | Hosting Site Network, Inc. | | | | | | | | | 607,787 | |
| | 9,963 | | | Priceline Group, Inc. (The), (2) | | | | | | | | | 12,702,327 | |
| | | | Total Internet & Catalog Retail | | | | | | | | | 63,235,405 | |
| | | | | |
| | | | Internet Software & Services – 17.1% | | | | | | | | | |
| | | | | |
| | 19,016 | | | Akamai Technologies, Inc., (2) | | | | | | | | | 1,000,812 | |
| | 44,044 | | | Alphabet Inc., Class A, (2), (3) | | | | | | | | | 34,266,672 | |
| | 52,142 | | | Alphabet Inc., Class C, (2), (3) | | | | | | | | | 39,569,520 | |
| | 45,473 | | | Baidu Inc., Sponsored ADR, (2), (3) | | | | | | | | | 8,596,216 | |
| | 220,000 | | | eBay Inc., (2), (3) | | | | | | | | | 6,045,600 | |
| | 325,000 | | | Facebook Inc., Class A, (2), (3) | | | | | | | | | 34,014,500 | |
| | 17,621 | | | IAC/InterActiveCorp | | | | | | | | | 1,058,141 | |
| | 4,807 | | | J2 Global Inc. | | | | | | | | | 395,712 | |
| | 5,270 | | | WebMD Health Corporation, (2) | | | | | | | | | 254,541 | |
| | | | Total Internet Software & Services | | | | | | | | | 125,201,714 | |
| | | | | |
| | | | IT Services – 2.4% | | | | | | | | | |
| | | | | |
| | 479 | | | Alliance Data Systems Corporation, (2) | | | | | | | | | 132,477 | |
| | 10,704 | | | Computer Sciences Corporation | | | | | | | | | 349,807 | |
| | 10,704 | | | CSRA Inc. | | | | | | | | | 321,120 | |
| | 12,966 | | | Fidelity National Information Services, Inc. | | | | | | | | | 785,740 | |
| | 19,208 | | | Genpact Limited, (2) | | | | | | | | | 479,816 | |
| | 16,316 | | | Global Payments Inc. | | | | | | | | | 1,052,545 | |
| | 19,648 | | | Henry Jack and Associates Inc. | | | | | | | | | 1,533,723 | |
| | 29,448 | | | Infosys Technologies Limited, Sponsored ADR | | | | | | | | | 493,254 | |
| | 5,008 | | | Leidos Holdings Inc. | | | | | | | | | 281,750 | |
| | 26,206 | | | MasterCard, Inc., Class A | | | | | | | | | 2,551,416 | |
| | 31,483 | | | Paychex, Inc. | | | | | | | | | 1,665,136 | |
| | 200,000 | | | PayPal Holdings, Inc., (2) | | | | | | | | | 7,240,000 | |
| | 8,580 | | | Total System Services Inc. | | | | | | | | | 427,284 | |
| | | | Total IT Services | | | | | | | | | 17,314,068 | |
| | | | |
| QQQX | | Nuveen Nasdaq 100 Dynamic Overwrite Fund |
| | Portfolio of Investments (continued) | | December 31, 2015 |
| | | | | | | | | | | | | | |
| Shares | | | Description (1) | | | | | | | | Value | |
| | | | | |
| | | | Life Sciences Tools & Services – 0.6% | | | | | | | | | |
| | | | | |
| | 15,384 | | | Agilent Technologies, Inc. | | | | | | | | $ | 643,205 | |
| | 20,567 | | | Bio-Techne Corporation | | | | | | | | | 1,851,030 | |
| | 4,788 | | | Charles River Laboratories International, Inc., (2) | | | | | | | | | 384,907 | |
| | 14,460 | | | ICON plc, (2) | | | | | | | | | 1,123,542 | |
| | | | Total Life Sciences Tools & Services | | | | | | | | | 4,002,684 | |
| | | | | |
| | | | Machinery – 0.5% | | | | | | | | | |
| | | | | |
| | 9,726 | | | Caterpillar Inc. | | | | | | | | | 660,979 | |
| | 6,217 | | | Deere & Company | | | | | | | | | 474,171 | |
| | 19,465 | | | Graco Inc. | | | | | | | | | 1,402,843 | |
| | 7,181 | | | Makita Corporation, Sponsored ADR, (4) | | | | | | | | | 419,655 | |
| | 3,641 | | | Nordson Corporation | | | | | | | | | 233,570 | |
| | 11,888 | | | SPX Corporation | | | | | | | | | 110,915 | |
| | 11,888 | | | SPX Flow Inc., (2) | | | | | | | | | 331,794 | |
| | 2,114 | | | WABCO Holdings Inc. | | | | | | | | | 216,178 | |
| | | | Total Machinery | | | | | | | | | 3,850,105 | |
| | | | | |
| | | | Media – 3.2% | | | | | | | | | |
| | | | | |
| | 19,288 | | | CBS Corporation, Class B | | | | | | | | | 909,043 | |
| | 300,100 | | | Comcast Corporation, Class A, (3) | | | | | | | | | 16,934,642 | |
| | 51,332 | | | News Corporation, Class A | | | | | | | | | 685,796 | |
| | 12,888 | | | News Corporation Class B | | | | | | | | | 179,916 | |
| | 20,124 | | | Omnicom Group, Inc. | | | | | | | | | 1,522,582 | |
| | 5,242 | | | Time Warner Cable | | | | | | | | | 972,863 | |
| | 21,163 | | | Time Warner Inc. | | | | | | | | | 1,368,611 | |
| | 6,836 | | | WPP Group PLC, Sponsored ADR | | | | | | | | | 784,363 | |
| | | | Total Media | | | | | | | | | 23,357,816 | |
| | | | | |
| | | | Multiline Retail – 0.0% | | | | | | | | | |
| | | | | |
| | 3,881 | | | Macy’s, Inc. | | | | | | | | | 135,757 | |
| | 2,818 | | | Nordstrom, Inc. | | | | | | | | | 140,365 | |
| | | | Total Multiline Retail | | | | | | | | | 276,122 | |
| | | | | |
| | | | Oil, Gas & Consumable Fuels – 0.3% | | | | | | | | | |
| | | | | |
| | 9,342 | | | Cabot Oil & Gas Corporation | | | | | | | | | 165,260 | |
| | 22,649 | | | Phillips 66 | | | | | | | | | 1,852,688 | |
| | | | Total Oil, Gas & Consumable Fuels | | | | | | | | | 2,017,948 | |
| | | | | |
| | | | Pharmaceuticals – 1.5% | | | | | | | | | |
| | | | | |
| | 14,808 | | | Allergan PLC, (2) | | | | | | | | | 4,627,500 | |
| | 6,117 | | | Eli Lilly and Company | | | | | | | | | 515,418 | |
| | 8,946 | | | Endo International PLC, (2) | | | | | | | | | 547,674 | |
| | 36,144 | | | Merck & Co. Inc. | | | | | | | | | 1,909,126 | |
| | 73,196 | | | Pfizer Inc. | | | | | | | | | 2,362,767 | |
| | 6,009 | | | Shire plc, ADR | | | | | | | | | 1,231,845 | |
| | | | Total Pharmaceuticals | | | | | | | | | 11,194,330 | |
| | | | | |
| | | | Professional Services – 0.6% | | | | | | | | | |
| | | | | |
| | 6,314 | | | Equifax Inc. | | | | | | | | | 703,190 | |
| | 2,798 | | | IHS Inc., Class A, (2) | | | | | | | | | 331,367 | |
| | 11,461 | | | Manpowergroup Inc. | | | | | | | | | 966,048 | |
| | 19,598 | | | Robert Half International Inc. | | | | | | | | | 923,850 | |
| | 15,000 | | | Verisk Analytics Inc, (2) | | | | | | | | | 1,153,200 | |
| | | | Total Professional Services | | | | | | | | | 4,077,655 | |
| | | | | |
| | | | Real Estate Investment Trust – 0.5% | | | | | | | | | |
| | | | | |
| | 18,413 | | | Apartment Investment & Management Company, Class A | | | | | | | | | 737,072 | |
| | 3,008 | | | Care Capital Properties, Inc. | | | | | | | | | 91,955 | |
| | 54,624 | | | CubeSmart | | | | | | | | | 1,672,587 | |
| | 17,523 | | | Senior Housing Properties Trust | | | | | | | | | 260,041 | |
| | | | | | | | | | | | | | |
| Shares | | | Description (1) | | | | | | | | Value | |
| | | | | |
| | | | Real Estate Investment Trust (continued) | | | | | | | | | |
| | | | | |
| | 12,035 | | | Ventas Inc. | | | | | | | | $ | 679,135 | |
| | | | Total Real Estate Investment Trust | | | | | | | | | 3,440,790 | |
| | | | | |
| | | | Real Estate Management & Development – 0.0% | | | | | | | | | |
| | | | | |
| | 194 | | | The RMR Group Inc., , Class A, (2) | | | | | | | | | 2,796 | |
| | | | | |
| | | | Road & Rail – 0.3% | | | | | | | | | |
| | | | | |
| | 23,916 | | | CSX Corporation | | | | | | | | | 620,620 | |
| | 19,779 | | | Heartland Express, Inc. | | | | | | | | | 336,639 | |
| | 4,374 | | | J.B. Hunt Transports Serives Inc. | | | | | | | | | 320,877 | |
| | 9,051 | | | Landstar System | | | | | | | | | 530,841 | |
| | 8,819 | | | Werner Enterprises, Inc. | | | | | | | | | 206,276 | |
| | | | Total Road & Rail | | | | | | | | | 2,015,253 | |
| | | | | |
| | | | Semiconductors & Semiconductor Equipment – 5.9% | | | | | | | | | |
| | | | | |
| | 60,043 | | | Analog Devices, Inc., (3) | | | | | | | | | 3,321,579 | |
| | 47,386 | | | Atmel Corporation | | | | | | | | | 407,993 | |
| | 28,948 | | | Fairchild Semiconductor International Inc., (2) | | | | | | | | | 599,513 | |
| | 17,789 | | | Integrated Device Technology, Inc., (2) | | | | | | | | | 468,740 | |
| | 753,388 | | | Intel Corporation, (3) | | | | | | | | | 25,954,217 | |
| | 14,136 | | | Intersil Corporation, Class A | | | | | | | | | 180,375 | |
| | 13,210 | | | Lam Research Corporation | | | | | | | | | 1,049,138 | |
| | 45,919 | | | Linear Technology Corporation | | | | | | | | | 1,950,180 | |
| | 101,033 | | | Micron Technology, Inc., (2), (3) | | | | | | | | | 1,430,627 | |
| | 8,107 | | | Microsemi Corporation, (2) | | | | | | | | | 264,207 | |
| | 78,000 | | | NVIDIA Corporation | | | | | | | | | 2,570,880 | |
| | 40,000 | | | NXP Semiconductors NV, (2) | | | | | | | | | 3,370,000 | |
| | 27,886 | | | ON Semiconductor Corporation, (2) | | | | | | | | | 273,283 | |
| | 5,933 | | | Power Integrations Inc. | | | | | | | | | 288,522 | |
| | 10,146 | | | Silicon Laboratories Inc., (2) | | | | | | | | | 492,487 | |
| | 44,749 | | | Siliconware Precision Industries Company Limited, Sponsored ADR | | | | | | | | | 346,805 | |
| | 2,774 | | | Taiwan Semiconductor Manufacturing Company Limited, Sponsored ADR | | | | | | | 63,109 | |
| | 7,657 | | | Tessera Technologies Inc. | | | | | | | | | 229,787 | |
| | | | Total Semiconductors & Semiconductor Equipment | | | | | | | | | 43,261,442 | |
| | | | | |
| | | | Software – 10.0% | | | | | | | | | |
| | | | | |
| | 7,378 | | | Ansys Inc., (2) | | | | | | | | | 682,465 | |
| | 30,000 | | | Autodesk, Inc., (2) | | | | | | | | | 1,827,900 | |
| | 51,724 | | | Cadence Design Systems, Inc., (2) | | | | | | | | | 1,076,376 | |
| | 11,986 | | | CDK Global Inc. | | | | | | | | | 568,975 | |
| | 1,160,000 | | | Microsoft Corporation, (3) | | | | | | | | | 64,356,800 | |
| | 1,584 | | | Microstrategy Inc., Class A, (2) | | | | | | | | | 283,995 | |
| | 11,112 | | | Open Text Corporation | | | | | | | | | 532,598 | |
| | 49,954 | | | Oracle Corporation | | | | | | | | | 1,824,820 | |
| | 12,402 | | | Parametric Technology Corporation, (2) | | | | | | | | | 429,481 | |
| | 5,477 | | | Red Hat, Inc., (2) | | | | | | | | | 453,550 | |
| | 25,778 | | | Synopsys Inc., (2), (3) | | | | | | | | | 1,175,735 | |
| | | | Total Software | | | | | | | | | 73,212,695 | |
| | | | | |
| | | | Specialty Retail – 1.0% | | | | | | | | | |
| | | | | |
| | 4,472 | | | Advance Auto Parts, Inc. | | | | | | | | | 673,081 | |
| | 18,980 | | | Ascena Retail Group Inc., (2) | | | | | | | | | 186,953 | |
| | 1,202 | | | AutoZone, Inc., (2) | | | | | | | | | 891,776 | |
| | 4,581 | | | CarMax, Inc., (2) | | | | | | | | | 247,237 | |
| | 3,340 | | | Dick’s Sporting Goods Inc. | | | | | | | | | 118,069 | |
| | 16,432 | | | L Brands Inc. | | | | | | | | | 1,574,514 | |
| | 9,254 | | | Rent-A-Center Inc. | | | | | | | | | 138,532 | |
| | 5,585 | | | Signet Jewelers Limited | | | | | | | | | 690,809 | |
| | 5,134 | | | Tiffany & Co. | | | | | | | | | 391,673 | |
| | 24,566 | | | TJX Companies, Inc. | | | | | | | | | 1,741,975 | |
| | 2,515 | | | Ulta Salon, Cosmetics & Fragrance, Inc., (2) | | | | | | | | | 465,275 | |
| | | | |
| QQQX | | Nuveen Nasdaq 100 Dynamic Overwrite Fund |
| | Portfolio of Investments (continued) | | December 31, 2015 |
| | | | | | | | | | | | | | |
| Shares | | | Description (1) | | | | | | | | Value | |
| | | | | |
| | | | Specialty Retail (continued) | | | | | | | | | |
| | | | | |
| | 2,384 | | | Williams-Sonoma Inc. | | | | | | | | $ | 139,249 | |
| | | | Total Specialty Retail | | | | | | | | | 7,259,143 | |
| | | | | |
| | | | Technology Hardware, Storage & Peripherals – 12.7% | | | | | | | | | |
| | | | | |
| | 848,612 | | | Apple, Inc., (3) | | | | | | | | | 89,324,898 | |
| | 36,925 | | | EMC Corporation | | | | | | | | | 948,234 | |
| | 19,045 | | | Hewlett Packard Enterprise Co | | | | | | | | | 289,484 | |
| | 19,045 | | | HP Inc. | | | | | | | | | 225,493 | |
| | 24,822 | | | SanDisk Corporation | | | | | | | | | 1,886,224 | |
| | | | Total Technology Hardware, Storage & Peripherals | | | | | | | | | 92,674,333 | |
| | | | | |
| | | | Textiles, Apparel & Luxury Goods – 0.1% | | | | | | | | | |
| | | | | |
| | 13,384 | | | Coach, Inc. | | | | | | | | | 438,058 | |
| | 2,496 | | | PVH Corporation | | | | | | | | | 183,830 | |
| | 5,000 | | | Under Armour, Inc., Class A, (2) | | | | | | | | | 403,050 | |
| | | | Total Textiles, Apparel & Luxury Goods | | | | | | | | | 1,024,938 | |
| | | | | |
| | | | Tobacco – 0.5% | | | | | | | | | |
| | | | | |
| | 20,575 | | | Altria Group, Inc. | | | | | | | | | 1,197,671 | |
| | 28,923 | | | Philip Morris International, Inc. | | | | | | | | | 2,542,621 | |
| | | | Total Tobacco | | | | | | | | | 3,740,292 | |
| | | | | |
| | | | Trading Companies & Distributors – 0.0% | | | | | | | | | |
| | | | | |
| | 4,640 | | | MSC Industrial Direct Inc., Class A | | | | | | | | | 261,093 | |
| | | | | |
| | | | Wireless Telecommunication Services – 0.3% | | | | | | | | | |
| | | | | |
| | 12,000 | | | SBA Communications Corporation, Class A, (2) | | | | | | | | | 1,260,840 | |
| | 19,244 | | | Telephone and Data Systems Inc. | | | | | | | | | 498,227 | |
| | 13,012 | | | United States Cellular Corporation, (2) | | | | | | | | | 531,020 | |
| | | | Total Wireless Telecommunication Services | | | | | | | | | 2,290,087 | |
| | | | Total Common Stocks (cost $317,388,170) | | | | | | | | | 701,399,191 | |
| | | | | |
| Shares | | | Description (1), (5) | | | | | | | | Value | |
| | | | | |
| | | | EXCHANGE-TRADED FUNDS – 4.8% | | | | | | | | | |
| | | | | |
| | 15,000 | | | iShares PHLX Semiconductor ETF | | | | | | | | $ | 1,347,600 | |
| | 300,000 | | | PowerShares QQQ Trust, Series 1, (3) | | | | | | | | | 33,558,000 | |
| | | | Total Exchange-Traded Funds (cost $32,656,932) | | | | | | | | | 34,905,600 | |
| | | | Total Long-Term Investments (cost $350,045,102) | | | | | | | | | 736,304,791 | |
| | | | Other Assets Less Liabilities – (0.8)% (6) | | | | | | | | | (5,683,099 | ) |
| | | | Net Assets – 100% | | | | | | | | $ | 730,621,692 | |
Investments in Derivatives as of December 31, 2015
Options Written outstanding:
| | | | | | | | | | | | | | | | | | | | | | |
| Option Type | | Number of
Contracts | | | Description | | Notional
Amount (7) | | | Expiration
Date | | | Strike
Price | | | Value | |
Call | | | (755 | ) | | NASDAQ 100® Index | | $ | (345,412,500 | ) | | | 1/15/16 | | | $ | 4,575 | | | $ | (5,560,575 | ) |
Put | | | (80 | ) | | NASDAQ 100® Index | | | (36,000,000 | ) | | | 1/15/16 | | | | 4,500 | | | | (272,400 | ) |
Call | | | (55 | ) | | NASDAQ 100® Index | | | (25,850,000 | ) | | | 1/15/16 | | | | 4,700 | | | | (88,000 | ) |
Call | | | (80 | ) | | NASDAQ 100® Index | | | (38,400,000 | ) | | | 1/15/16 | | | | 4,800 | | | | (17,000 | ) |
| | | | (970 | ) | | Total Options Written (premiums received $6,614,469) | | $ | (445,662,500 | ) | | | | | | | | | | $ | (5,937,975 | ) |
For Fund portfolio compliance purposes, the Fund’s industry classifications refer to any one or more of the industry sub-classifications used by one or more widely recognized market indexes or ratings group indexes, and/or as defined by Fund management. This definition may not apply for purposes of this report, which may combine industry sub-classifications into sectors for reporting ease.
| (1) | All percentages shown in the Portfolio of Investments are based on net assets. |
| (2) | Non-income producing; issuer has not declared a dividend within the past twelve months. |
| (3) | Investment, or portion of investment, has been pledged to collateralize the net payment obligations for investments in derivatives. |
| (4) | For fair value measurement disclosure purposes, investment classified as Level 2. See Notes to Financial Statements, Note 2 – Investment Valuation and Fair Value Measurements for more information. |
| (5) | A copy of the most recent financial statements for these exchange-traded funds can be obtained directly from the Securities and Exchange Commission on its website at http://www.sec.gov. |
| (6) | Other assets less liabilities includes the unrealized appreciation (depreciation) of certain over-the-counter derivatives as presented on the Statement of Assets and Liabilities. The unrealized appreciation (depreciation) of exchange-cleared and exchange-traded derivatives is recognized as part of the cash collateral at brokers and/or the receivable or payable for variation margin as presented on the Statement of Assets and Liabilities, when applicable. Other assets less liabilities also includes the value of options as presented on the Statement of Assets and Liabilities. |
| (7) | For disclosure purposes, Notional Amount is calculated by multiplying the Number of Contracts by the Strike Price by 100. |
| ADR | American Depositary Receipt |
See accompanying notes to financial statements.
| | | | | | |
Statement of Assets and Liabilities | | December 31, 2015 |
| | | | | | | | | | | | | | | | |
| | | S&P 500
Buy-Write
Income
(BXMX) | | | Dow 30SM
Dynamic
Overwrite
(DIAX) | | | S&P 500
Dynamic
Overwrite
(SPXX) | | | Nasdaq 100
Dynamic
Overwrite
(QQQX) | |
Assets | | | | | | | | | | | | | | | | |
Long-term investments, at value (cost $841,741,937, $389,585,871, $154,722,058 and $350,045,102, respectively) | | $ | 1,360,477,148 | | | $ | 569,205,925 | | | $ | 239,583,200 | | | $ | 736,304,791 | |
Short-term investments, at value (cost $37,439,038, $4,995,559, $— and $—, respectively) | | | 37,439,038 | | | | 4,995,810 | | | | — | | | | — | |
Cash | | | 31,568 | | | | — | | | | — | | | | — | |
Receivable for: | | | | | | | | | | | | | | | | |
Dividends | | | 1,901,693 | | | | 523,021 | | | | 391,513 | | | | 249,602 | |
Interest | | | 31 | | | | — | | | | — | | | | — | |
Investments sold | | | — | | | | 3,808,529 | | | | 2,155,677 | | | | 7,010,714 | |
Reclaims | | | 295 | | | | — | | | | — | | | | 329 | |
Other assets | | | 187,660 | | | | 19,596 | | | | 29,040 | | | | 58,540 | |
Total assets | | | 1,400,037,433 | | | | 578,552,881 | | | | 242,159,430 | | | | 743,623,976 | |
Liabilities | | | | | | | | | | | | | | | | |
Cash overdraft | | | — | | | | 3,787,922 | | | | 2,179,453 | | | | 6,308,288 | |
Options written, at value (premiums received $34,073,972, $4,768,102, $2,074,282 and $6,614,469, respectively) | | | 16,788,070 | | | | 4,406,706 | | | | 1,896,772 | | | | 5,937,975 | |
Accrued expenses: | | | | | | | | | | | | | | | | |
Management fees | | | 992,798 | | | | 421,351 | | | | 168,120 | | | | 530,990 | |
Trustees fees | | | 189,657 | | | | 19,784 | | | | 28,681 | | | | 60,539 | |
Other | | | 177,709 | | | | 313,148 | | | | 77,003 | | | | 164,492 | |
Total liabilities | | | 18,148,234 | | | | 8,948,911 | | | | 4,350,029 | | | | 13,002,284 | |
Net assets | | $ | 1,381,889,199 | | | $ | 569,603,970 | | | $ | 237,809,401 | | | $ | 730,621,692 | |
Shares outstanding | | | 103,554,549 | | | | 36,085,350 | | | | 16,152,579 | | | | 36,564,414 | |
Net asset value (“NAV”) per share outstanding | | $ | 13.34 | | | $ | 15.78 | | | $ | 14.72 | | | $ | 19.98 | |
Net assets consist of: | | | | | | | | | | | | | | | | |
Shares, $0.01 par value per share | | $ | 1,035,545 | | | $ | 360,854 | | | $ | 161,526 | | | $ | 365,644 | |
Paid-in surplus | | | 890,401,414 | | | | 389,742,907 | | | | 182,965,412 | | | | 357,337,880 | |
Undistributed (Over-distribution of) net investment income | | | — | | | | — | | | | — | | | | — | |
Accumulated net realized gain (loss) | | | (45,568,865 | ) | | | (481,492 | ) | | | (30,356,189 | ) | | | (14,018,015 | ) |
Net unrealized appreciation (depreciation) | | | 536,021,105 | | | | 179,981,701 | | | | 85,038,652 | | | | 386,936,183 | |
Net assets | | $ | 1,381,889,199 | | | $ | 569,603,970 | | | $ | 237,809,401 | | | $ | 730,621,692 | |
Authorized shares | | | Unlimited | | | | Unlimited | | | | Unlimited | | | | Unlimited | |
See accompanying notes to financial statements.
| | | | | | |
Statement of Operations | | Year Ended December 31, 2015 |
| | | | | | | | | | | | | | | | |
| | | S&P 500
Buy-Write
Income
(BXMX) | | | Dow 30SM
Dynamic
Overwrite
(DIAX) | | | S&P 500
Dynamic
Overwrite
(SPXX) | | | Nasdaq 100
Dynamic
Overwrite
(QQQX) | |
Investment Income (net of foreign tax withheld of $17,642, $—, $— and $8,810, respectively) | | $ | 30,349,910 | | | $ | 14,474,941 | | | $ | 5,515,550 | | | $ | 10,840,183 | |
Expenses | | | | | | | | | | | | | | | | |
Management fees | | | 11,889,942 | | | | 5,080,037 | | | | 2,033,440 | | | | 6,222,150 | |
Custodian fees | | | 169,609 | | | | 82,755 | | | | 60,048 | | | | 111,723 | |
Trustees fees | | | 36,163 | | | | 15,587 | | | | 6,536 | | | | 18,823 | |
Professional fees | | | 102,100 | | | | 70,177 | | | | 46,591 | | | | 78,002 | |
Shareholder reporting expenses | | | 233,167 | | | | 77,623 | | | | 42,534 | | | | 140,158 | |
Shareholder servicing agent fees | | | 2,160 | | | | 741 | | | | 266 | | | | 758 | |
Stock exchange listing fees | | | 20,359 | | | | 5,145 | | | | 10,447 | | | | — | |
Investor relations expenses | | | 74,976 | | | | 19,245 | | | | 13,388 | | | | 27,756 | |
Other | | | 311,958 | | | | 126,746 | | | | 51,204 | | | | 241,108 | |
Total expenses | | | 12,840,434 | | | | 5,478,056 | | | | 2,264,454 | | | | 6,840,478 | |
Net investment income (loss) | | | 17,509,476 | | | | 8,996,885 | | | | 3,251,096 | | | | 3,999,705 | |
Realized and Unrealized Gain (Loss) | | | | | | | | | | | | | | | | |
Net realized gain (loss) from: | | | | | | | | | | | | | | | | |
Investments and foreign currency | | | 73,527,141 | | | | 12,656,612 | | | | 14,499,229 | | | | 54,271,896 | |
Options purchased | | | — | | | | 462,569 | | | | (222,728 | ) | | | (177,298 | ) |
Options written | | | 39,402,678 | | | | 4,416,871 | | | | 2,036,012 | | | | (9,277,584 | ) |
Change in net unrealized appreciation (depreciation) of: | | | | | | | | | | | | | | | | |
Investments and foreign currency | | | (73,165,116 | ) | | | (25,933,280 | ) | | | (17,568,196 | ) | | | 5,718,931 | |
Options purchased | | | — | | | | — | | | | 454,835 | | | | 815,063 | |
Options written | | | 14,206,473 | | | | 90,478 | | | | 142,423 | | | | 179,409 | |
Net realized and unrealized gain (loss) | | | 53,971,176 | | | | (8,306,750 | ) | | | (658,425 | ) | | | 51,530,417 | |
Net increase (decrease) in net assets from operations | | $ | 71,480,652 | | | $ | 690,135 | | | $ | 2,592,671 | | | $ | 55,530,122 | |
See accompanying notes to financial statements.
| | | | | | |
Statement of Changes in Net Assets | | |
| | | | | | | | | | | | | | | | |
| | | S&P 500 Buy-Write Income (BXMX) | | | Dow 30SM Dynamic Overwrite (DIAX) | |
| | | Year
Ended
12/31/15 | | | Year
Ended
12/31/14 | | | Year
Ended
12/31/15 | | | Year
Ended
12/31/14 | |
Operations | | | | | | | | | | | | | | | | |
Net investment income (loss) | | $ | 17,509,476 | | | $ | 6,704,512 | | | $ | 8,996,885 | | | $ | 2,255,702 | |
Net realized gain (loss) from: | | | | | | | | | | | | | | | | |
Investments and foreign currency | | | 73,527,141 | | | | 45,817,171 | | | | 12,656,612 | | | | 4,496,680 | |
Options purchased | | | — | | | | (32,948 | ) | | | 462,569 | | | | — | |
Options written | | | 39,402,678 | | | | (40,294,681 | ) | | | 4,416,871 | | | | (2,971,045 | ) |
Change in net unrealized appreciation (depreciation) of: | | | | | | | | | | | | | | | | |
Investments and foreign currency | | | (73,165,116 | ) | | | 8,438,004 | | | | (25,933,280 | ) | | | 11,139,953 | |
Options purchased | | | — | | | | — | | | | — | | | | — | |
Options written | | | 14,206,473 | | | | 11,472,739 | | | | 90,478 | | | | 1,513,182 | |
Net increase (decrease) in net assets from operations | | | 71,480,652 | | | | 32,104,797 | | | | 690,135 | | | | 16,434,472 | |
Distributions to Shareholders | | | | | | | | | | | | | | | | |
From net investment income | | | (103,140,331 | ) | | | (7,115,283 | ) | | | (23,350,404 | ) | | | (2,647,222 | ) |
From accumulated net realized gains | | | — | | | | — | | | | (2,657,425 | ) | | | (1,054,139 | ) |
Return of capital | | | — | | | | (31,195,830 | ) | | | (12,386,984 | ) | | | (9,083,316 | ) |
Decrease in net assets from distributions to shareholders | | | (103,140,331 | ) | | | (38,311,113 | ) | | | (38,394,813 | ) | | | (12,784,677 | ) |
Capital Share Transactions | | | | | | | | | | | | | | | | |
Shares issued in the reorganizations | | | — | | | | 888,642,700 | | | | — | | | | 403,959,687 | |
Net proceeds from shares issued to shareholders due to reinvestment of distributions | | | — | | | | — | | | | — | | | | — | |
Net increase (decrease) in net assets from capital share transactions | | | — | | | | 888,642,700 | | | | — | | | | 403,959,687 | |
Net increase (decrease) in net assets | | | (31,659,679 | ) | | | 882,436,384 | | | | (37,704,678 | ) | | | 407,609,482 | |
Net assets at the beginning of period | | | 1,413,548,878 | | | | 531,112,494 | | | | 607,308,648 | | | | 199,699,166 | |
Net assets at the end of period | | $ | 1,381,889,199 | | | $ | 1,413,548,878 | | | $ | 569,603,970 | | | $ | 607,308,648 | |
Undistributed (Over-distribution of) net investment income at the end of period | | $ | — | | | $ | — | | | $ | — | | | $ | — | |
See accompanying notes to financial statements.
| | | | | | |
Statement of Changes in Net Assets | | (continued) |
| | | | | | | | | | | | | | | | |
| | | S&P 500 Dynamic Overwrite (SPXX) | | | Nasdaq 100 Dynamic Overwrite (QQQX) | |
| | | Year
Ended
12/31/15 | | | Year
Ended
12/31/14 | | | Year
Ended
12/31/15 | | | Year
Ended
12/31/14 | |
Operations | | | | | | | | | | | | | | | | |
Net investment income (loss) | | $ | 3,251,096 | | | $ | 3,117,191 | | | $ | 3,999,705 | | | $ | 1,146,879 | |
Net realized gain (loss) from: | | | | | | | | | | | | | | | | |
Investments and foreign currency | | | 14,499,229 | | | | 18,290,772 | | | | 54,271,896 | | | | 21,431,590 | |
Options purchased | | | (222,728 | ) | | | 1,701 | | | | (177,298 | ) | | | — | |
Options written | | | 2,036,012 | | | | (13,249,254 | ) | | | (9,277,584 | ) | | | (6,477,975 | ) |
Change in net unrealized appreciation (depreciation) of: | | | | | | | | | | | | | | | | |
Investments and foreign currency | | | (17,568,196 | ) | | | 4,718,553 | | | | 5,718,931 | | | | 29,971,630 | |
Options purchased | | | 454,835 | | | | (454,835 | ) | | | 815,063 | | | | (815,063 | ) |
Options written | | | 142,423 | | | | 3,303,379 | | | | 179,409 | | | | 1,782,067 | |
Net increase (decrease) in net assets from operations | | | 2,592,671 | | | | 15,727,507 | | | | 55,530,122 | | | | 47,039,128 | |
Distributions to Shareholders | | | | | | | | | | | | | | | | |
From net investment income | | | (11,359,070 | ) | | | (3,119,271 | ) | | | (15,659,622 | ) | | | (1,248,726 | ) |
From accumulated net realized gains | | | — | | | | — | | | | (35,530,557 | ) | | | (8,909,792 | ) |
Return of capital | | | (5,504,222 | ) | | | (13,744,021 | ) | | | — | | | | (15,055,028 | ) |
Decrease in net assets from distributions to shareholders | | | (16,863,292 | ) | | | (16,863,292 | ) | | | (51,190,179 | ) | | | (25,213,546 | ) |
Capital Share Transactions | | | | | | | | | | | | | | | | |
Shares issued in the reorganizations | | | — | | | | — | | | | — | | | | 360,939,978 | |
Net proceeds from shares issued to shareholders due to reinvestment of distributions | | | — | | | | — | | | | — | | | | 386,518 | |
Net increase (decrease) in net assets from capital share transactions | | | — | | | | — | | | | — | | | | 361,326,496 | |
Net increase (decrease) in net assets | | | (14,270,621 | ) | | | (1,135,785 | ) | | | 4,339,943 | | | | 383,152,078 | |
Net assets at the beginning of period | | | 252,080,022 | | | | 253,215,807 | | | | 726,281,749 | | | | 343,129,671 | |
Net assets at the end of period | | $ | 237,809,401 | | | $ | 252,080,022 | | | $ | 730,621,692 | | | $ | 726,281,749 | |
Undistributed (Over-distribution of) net investment income at the end of period | | $ | — | | | $ | — | | | $ | — | | | $ | (9 | ) |
See accompanying notes to financial statements.
Financial
Highlights
Selected data for a share outstanding throughout each period:
| | | | | | | | | | | | | | | | | | | | | | | | | | | | | | | | | | | | | | | | | | | | |
| | | | | | |
| | | | | | Investment Operations | | | Less Distributions | | | | | | | | | | |
| | | Beginning
NAV | | | Net
Investment
Income
(Loss)(a) | | | Net
Realized/
Unrealized
Gain (Loss) | | | Total | | | From
Net
Investment
Income | | | From
Accumulated
Net Realized
Gains | | | Return of
Capital | | | Total | | | Discount
From Shares
Repurchased
and Retired | | | Ending
NAV | | | Ending
Share
Price | |
|
S&P 500 Buy-Write Income (BXMX) | |
Year Ended 12/31: | |
2015 | | $ | 13.65 | | | $ | 0.17 | | | $ | 0.52 | | | $ | 0.69 | | | $ | (1.00 | ) | | $ | — | | | $ | — | | | $ | (1.00 | ) | | $ | — | | | $ | 13.34 | | | $ | 13.43 | |
2014 | | | 13.81 | | | | 0.17 | | | | 0.67 | | | | 0.84 | | | | (0.19 | ) | | | — | | | | (0.81 | ) | | | (1.00 | ) | | | — | | | | 13.65 | | | | 12.11 | |
2013 | | | 13.13 | | | | 0.20 | | | | 1.56 | | | | 1.76 | | | | (0.20 | ) | | | — | | | | (0.88 | ) | | | (1.08 | ) | | | — | | | | 13.81 | | | | 12.55 | |
2012 | | | 12.89 | | | | 0.24 | | | | 1.08 | | | | 1.32 | | | | (0.25 | ) | | | — | | | | (0.83 | ) | | | (1.08 | ) | | | — | * | | | 13.13 | | | | 11.83 | |
2011 | | | 13.34 | | | | 0.23 | | | | 0.48 | | | | 0.71 | | | | (0.75 | ) | | | — | | | | (0.41 | ) | | | (1.16 | ) | | | — | * | | | 12.89 | | | | 11.18 | |
|
Dow 30SM Dynamic Overwrite (DIAX) | |
Year Ended 12/31: | |
2015 | | | 16.83 | | | | 0.25 | | | | (0.24 | ) | | | 0.01 | | | | (0.65 | ) | | | (0.07 | ) | | | (0.34 | ) | | | (1.06 | ) | | | — | | | | 15.78 | | | | 14.36 | |
2014 | | | 16.62 | | | | 0.18 | | | | 1.09 | | | | 1.27 | | | | (0.22 | ) | | | (0.09 | ) | | | (0.75 | ) | | | (1.06 | ) | | | — | | | | 16.83 | | | | 15.42 | |
2013 | | | 14.34 | | | | 0.22 | | | | 3.12 | | | | 3.34 | | | | (0.54 | ) | | | (0.43 | ) | | | (0.09 | ) | | | (1.06 | ) | | | — | | | | 16.62 | | | | 15.57 | |
2012 | | | 14.23 | | | | 0.25 | | | | 0.92 | | | | 1.17 | | | | (0.53 | ) | | | — | | | | (0.53 | ) | | | (1.06 | ) | | | — | | | | 14.34 | | | | 13.25 | |
2011 | | | 14.39 | | | | 0.23 | | | | 0.77 | | | | 1.00 | | | | (0.30 | ) | | | — | | | | (0.86 | ) | | | (1.16 | ) | | | — | | | | 14.23 | | | | 13.12 | |
|
S&P 500 Dynamic Overwrite (SPXX) | |
Year Ended 12/31: | |
2015 | | | 15.61 | | | | 0.20 | | | | (0.05 | ) | | | 0.15 | | | | (0.70 | ) | | | — | | | | (0.34 | ) | | | (1.04 | ) | | | — | | | | 14.72 | | | | 13.47 | |
2014 | | | 15.68 | | | | 0.19 | | | | 0.78 | | | | 0.97 | | | | (0.19 | ) | | | — | | | | (0.85 | ) | | | (1.04 | ) | | | — | | | | 15.61 | | | | 14.30 | |
2013 | | | 14.36 | | | | 0.22 | | | | 2.22 | | | | 2.44 | | | | (0.22 | ) | | | — | | | | (0.90 | ) | | | (1.12 | ) | | | — | | | | 15.68 | | | | 14.12 | |
2012 | | | 13.96 | | | | 0.25 | | | | 1.27 | | | | 1.52 | | | | (0.26 | ) | | | — | | | | (0.86 | ) | | | (1.12 | ) | | | — | * | | | 14.36 | | | | 12.93 | |
2011 | | | 14.41 | | | | 0.24 | | | | 0.42 | | | | 0.66 | | | | (0.40 | ) | | | — | | | | (0.72 | ) | | | (1.12 | ) | | | 0.01 | | | | 13.96 | | | | 12.07 | |
|
Nasdaq 100 Dynamic Overwrite (QQQX) | |
Year Ended 12/31: | |
2015 | | | 19.86 | | | | 0.11 | | | | 1.41 | | | | 1.52 | | | | (0.43 | ) | | | (0.97 | ) | | | — | | | | (1.40 | ) | | | — | | | | 19.98 | | | | 19.37 | |
2014 | | | 18.54 | | | | 0.06 | | | | 2.62 | | | | 2.68 | | | | (0.07 | ) | | | (0.48 | ) | | | (0.81 | ) | | | (1.36 | ) | | | — | | | | 19.86 | | | | 19.25 | |
2013 | | | 15.17 | | | | 0.07 | | | | 4.51 | | | | 4.58 | | | | (0.07 | ) | | | — | | | | (1.14 | ) | | | (1.21 | ) | | | — | | | | 18.54 | | | | 17.80 | |
2012 | | | 14.11 | | | | 0.06 | | | | 2.21 | | | | 2.27 | | | | (0.06 | ) | | | — | | | | (1.15 | ) | | | (1.21 | ) | | | — | | | | 15.17 | | | | 15.08 | |
2011 | | | 14.67 | | | | (0.01 | ) | | | 0.69 | | | | 0.68 | | | | (0.47 | ) | | | (0.77 | ) | | | — | | | | (1.24 | ) | | | — | | | | 14.11 | | | | 13.03 | |
| (a) | Per share Net Investment Income (Loss) is calculated using the average daily shares method. |
| (b) | Total Return Based on NAV is the combination of changes in NAV, reinvested dividend income at NAV and reinvested capital gains distributions at NAV, if any. The last dividend declared in the period, which is typically paid on the first business day of the following month, is assumed to be reinvested at the ending NAV. The actual reinvest price for the last dividend declared in the period may often be based on the Fund’s market price (and not its NAV), and therefore may be different from the price used in the calculation. Total returns are not annualized. |
Total Return Based on Share Price is the combination of changes in the market price per share and the effect of reinvested dividend income and reinvested capital gains distributions, if any, at the average price paid per share at the time of reinvestment. The last dividend declared in the period, which is typically paid on the first business day of the following month, is assumed to be reinvested at the ending market price. The actual reinvestment for the last dividend declared in the period may take place over several days, and in some instances may not be based on the market price, so the actual reinvestment price may be different from the price used in the calculation. Total returns are not annualized.
| | | | | | | | | | | | | | | | | | | | | | | | | | | | | | |
| | | | | | | Ratios/Supplemental Data | |
| Total Returns | | | | | | Ratios to Average Net Assets
Before Reimbursement | | | Ratios to Average Net Assets
After Reimbursement(c) | | | | |
Based
on
NAV(b) | | | Based
on
Share
Price(b) | | | Ending
Net Assets
(000) | | | Expenses | | | Net
Investment
Income (Loss) | | | Expenses | | | Net
Investment
Income (Loss) | | | Portfolio
Turnover
Rate(d) | |
| | | | | | | |
| | | | | | | | | | | | | | | | | | | | | | | | | | | | | | | |
| | | | | | | | | | | | | | | | | | | | | | | | | | | | | | |
| | 5.17 | % | | | 19.80 | % | | $ | 1,381,889 | | | | 0.91 | % | | | 1.24 | % | | | N/A | | | | N/A | | | | 8 | % |
| | 6.20 | | | | 4.31 | | | | 1,413,549 | | | | 1.02 | | | | 1.21 | | | | N/A | | | | N/A | | | | 14 | |
| | 13.85 | | | | 15.53 | | | | 531,112 | | | | 0.96 | | | | 1.48 | | | | N/A | | | | N/A | | | | — | ** |
| | 10.43 | | | | 15.58 | | | | 504,982 | | | | 0.96 | | | | 1.78 | | | | 0.91 | % | | | 1.84 | % | | | 3 | |
| | 5.63 | | | | (3.41 | ) | | | 496,085 | | | | 0.97 | | | | 1.60 | | | | 0.84 | | | | 1.73 | | | | 4 | |
| | | | | | | |
| | | | | | | | | | | | | | | | | | | | | | | | | | | | | | | |
| | | | | | | | | | | | | | | | | | | | | | | | | | | | | | |
| | 0.17 | | | | 0.18 | | | | 569,604 | | | | 0.93 | | | | 1.52 | | | | N/A | | | | N/A | | | | 18 | |
| | 7.93 | | | | 5.89 | | | | 607,309 | | | | 1.12 | | | | 1.08 | | | | N/A | | | | N/A | | | | 6 | |
| | 23.93 | | | | 26.09 | | | | 199,699 | | | | 1.01 | | | | 1.42 | | | | N/A | | | | N/A | | | | 21 | |
| | 8.27 | | | | 9.04 | | | | 172,266 | | | | 1.00 | | | | 1.73 | | | | N/A | | | | N/A | | | | 3 | |
| | 7.27 | | | | (1.86 | ) | | | 171,003 | | | | 1.02 | | | | 1.63 | | | | N/A | | | | N/A | | | | — | |
| | | | | | | |
| | | | | | | | | | | | | | | | | | | | | | | | | | | | | | | |
| | | | | | | | | | | | | | | | | | | | | | | | | | | | | | |
| | 1.09 | | | | 1.70 | | | | 237,809 | | | | 0.92 | | | | 1.32 | | | | N/A | | | | N/A | | | | 21 | |
| | 6.37 | | | | 8.88 | | | | 252,080 | | | | 0.96 | | | | 1.23 | | | | N/A | | | | N/A | | | | 8 | |
| | 17.47 | | | | 18.32 | | | | 253,216 | | | | 0.96 | | | | 1.43 | | | | N/A | | | | N/A | | | | 1 | |
| | 11.03 | | | | 16.58 | | | | 232,005 | | | | 0.96 | | | | 1.74 | | | | N/A | | | | N/A | | | | 1 | |
| | 4.89 | | | | (4.88 | ) | | | 225,664 | | | | 0.96 | | | | 1.66 | | | | N/A | | | | N/A | | | | 4 | |
| | | | | | | |
| | | | | | | | | | | | | | | | | | | | | | | | | | | | | | | |
| | | | | | | | | | | | | | | | | | | | | | | | | | | | | | |
| | 7.97 | | | | 8.47 | | | | 730,622 | | | | 0.93 | | | | 0.54 | | | | N/A | | | | N/A | | | | 15 | |
| | 14.94 | | | | 16.12 | | | | 726,282 | | | | 1.00 | | | | 0.32 | | | | N/A | | | | N/A | | | | 17 | |
| | 31.30 | | | | 27.04 | | | | 343,130 | | | | 1.00 | | | | 0.44 | | | | N/A | | | | N/A | | | | 9 | |
| | 15.98 | | | | 25.05 | | | | 280,033 | | | | 1.01 | | | | 0.40 | | | | N/A | | | | N/A | | | | 1 | |
| | 4.82 | | | | 0.91 | | | | 260,176 | | | | 1.04 | | | | (0.04 | ) | | | N/A | | | | N/A | | | | 51 | |
| (c) | After expense reimbursement from Adviser, where applicable. As of October 31, 2012, the Adviser is no longer reimbursing S&P 500 Buy-Write Income (BXMX), for any fees or expenses. |
| (d) | Portfolio Turnover Rate is calculated based on the lesser of long-term purchases or sales (as disclosed in Note 5 – Investment Transactions) divided by the average long-term market value during the period. |
| N/A | Fund does not have, or no longer has, a contractual reimbursement agreement with the Adviser. |
| * | Rounds to less than $0.01 per share. |
| ** | Rounds to less than 1%. |
See accompanying notes to financial statements.
Notes to
Financial Statements
1. General Information and Significant Accounting Policies
General Information
Fund Information
The funds covered in this report and their corresponding New York Stock Exchange (“NYSE”) or NASDAQ National Market (“NASDAQ”) symbols are as follows (each a “Fund” and collectively, the “Funds”):
| | • | | Nuveen S&P 500 Buy-Write Income Fund (“S&P 500 Buy-Write Income (BXMX)”) |
| | • | | Nuveen Dow 30SM Dynamic Overwrite Fund (“Dow 30SM Dynamic Overwrite (DIAX)”) |
| | • | | Nuveen S&P 500 Dynamic Overwrite Fund (“S&P 500 Dynamic Overwrite (SPXX)”) |
| | • | | Nuveen Nasdaq 100 Dynamic Overwrite Fund (“Nasdaq 100 Dynamic Overwrite (QQQX)”) |
The Funds are registered under the Investment Company Act of 1940, as amended, as diversified (non-diversified for Dow 30SM Dynamic Overwrite (DIAX) and Nasdaq 100 Dynamic Overwrite (QQQX)) closed-end management investment companies. Shares of S&P 500 Buy-Write Income (BXMX), Dow 30SM Dynamic Overwrite (DIAX) and S&P 500 Dynamic Overwrite (SPXX) are traded on the NYSE while shares of NASDAQ 100 Dynamic Overwrite (QQQX) are traded on the NASDAQ. S&P 500 Buy-Write Income (BXMX), Dow 30SM Dynamic Overwrite (DIAX), S&P 500 Dynamic Overwrite (SPXX) and Nasdaq 100 Dynamic Overwrite (QQQX) were organized as Massachusetts business trusts on July 23, 2004, May 20, 2014, November 11, 2004 and May 20, 2014, respectively.
The end of the reporting period for the Funds is December 31, 2015, and the period covered by these Notes to Financial Statements is the fiscal year ended December 31, 2015 (the “current fiscal period”).
Investment Adviser
The Funds’ investment adviser is Nuveen Fund Advisors, LLC (the “Adviser”), a wholly-owned subsidiary of Nuveen Investments, Inc. (Nuveen). The Adviser is responsible for each Fund’s overall investment strategy and asset allocation decisions. The Adviser has entered into sub-advisory agreements with Gateway Investment Advisers, LLC (“Gateway”), under which Gateway manages S&P 500 Buy-Write Income’s (BXMX) investment portfolio and Nuveen Asset Management, LLC (“NAM”), a subsidiary of the Adviser, under which NAM manages the investment portfolios of Dow 30SM Dynamic Overwrite (DIAX), S&P 500 Dynamic Overwrite (SPXX) and Nasdaq Premium Income & Growth (QQQX).
Investment Objectives and Principal Investment Strategies
S&P 500 Buy-Write Income’s (BXMX) investment objective is to provide a high level of current income and gains. The Fund invests its managed assets in a diversified equity portfolio that seeks to substantially replicate price movements of the S&P 500® Index. The Fund also uses an index option strategy of writing (selling) index call options in seeking to moderate the volatility of returns relative to an all equity portfolio.
Dow 30SM Dynamic Overwrite’s (DIAX) investment objective is to seek attractive total return with less volatility than the DJIA. The Fund pursues its investment strategy by emphasizing single name options on individual stocks in the Dow Jones Industrial AverageSM (“DJIA”), as well as a range of options including index options on the DJIA and other broad-based indexes and options on custom baskets of stocks in addition to exchange-traded funds (ETFs). The Fund uses a dynamic call option overwrite strategy within a range of approximately 35% to 75%, with a long-run target of 55% overwrite of the value of the Fund’s equity portfolio, in seeking to enhance the portfolio’s risk-adjusted returns.
S&P 500 Dynamic Overwrite’s (SPXX) investment objective is to seek attractive total returns with less volatility than the S&P 500® Index. The Fund pursues its investment strategy by emphasizing index call options on the S&P 500® Index, as well as a range of options including index options on other broad-based indexes and options on custom baskets of stocks in addition to exchange-traded funds (ETFs). The Fund uses a dynamic call option overwrite strategy within a range of approximately 35% to 75%, with a long-run target of 55% overwrite of the value of the Fund’s equity portfolio, in seeking to enhance the portfolio’s risk-adjusted returns.
Nasdaq 100 Dynamic Overwrite (QQQX)
Nasdaq 100 Dynamic Overwrite’s (QQQX) investment objective is to seek attractive total return with less volatility than the NASDAQ 100® Index. The Fund pursues its investment strategy by emphasizing index call options on the NASDQ-100 Index, as well other broad-based indexes and options on a variety of other equity market indexes and options on custom baskets of stocks in addition to exchange-traded funds (ETFs) and single name options. The Fund uses a dynamic call option overwrite strategy within a range of approximately 35% to 75%, with a long-run target of 55% overwrite of the value of
the Fund’s equity portfolio, in seeking to enhance the portfolio’s risk-adjusted returns. The Fund also has the opportunity to utilize call spread strategies and sell put options on a portion of the underlying equity portfolio.
Significant Accounting Policies
Each Fund is an investment company and follows accounting and reporting guidance under Financial Accounting Standards Board (FASB) Accounting Standards Codification (ASC) Topic 946 “Financial Services – Investment Companies.” The following is a summary of significant accounting policies followed by the Funds in the preparation of their financial statements in accordance with accounting principles generally accepted in the United States of America (“U.S. GAAP”).
Investment Transactions
Investment transactions are recorded on a trade date basis. Realized gains and losses from transactions are determined on the specific identification method, which is the same basis used for federal income tax purposes. Investments purchased on a when-issued/delayed delivery basis may have extended settlement periods. Any investments so purchased are subject to market fluctuation during this period. The Funds have earmarked securities in their portfolios with a current value at least equal to the amount of the when-issued/delayed delivery purchase commitments.
As of the end of the reporting period, the Funds’ did not have any outstanding when-issued/delayed delivery purchase commitments.
Investment Income
Dividend income is recorded on the ex-dividend date or, for foreign securities, when information is available. Interest income is recorded on an accrual basis.
Professional Fees
Professional fees presented on the Statement of Operations consist of legal fees incurred in the normal course of operations, audit fees, tax consulting fees and, in some cases, workout expenditures. Workout expenditures are incurred in an attempt to protect or enhance an investment, or to pursue other claims or legal actions on behalf of Fund shareholders. If a refund is received for workout expenditures paid in a prior reporting period, such amounts will be recognized as “Legal fee refund” on the Statement of Operations.
Dividends and Distributions to Common Shareholders
Distributions to common shareholders are recorded on the ex-dividend date. The amount and timing of distributions are determined in accordance with federal income tax regulations, which may differ from U.S. GAAP.
Each Fund makes quarterly cash distributions to common shareholders of a stated dollar amount per share. Subject to approval and oversight by the Funds’ Board of Trustees (the “Board”), each Fund seeks to maintain a stable distribution level designed to deliver the long-term return potential of each Fund’s investment strategy through regular quarterly distributions (a “Managed Distribution Program”). Total distributions during a calendar year generally will be made from each Fund’s net investment income, net realized capital gains and net unrealized capital gains in the Fund’s portfolio, if any. The portion of distributions paid attributed to net unrealized gains, if any, is distributed from the Fund’s assets and is treated by shareholders as a nontaxable distribution (“return of capital”) for tax purposes. In the event that total distributions during a calendar year exceed a Fund’s total return on net asset value (“NAV”), the difference will reduce NAV per share. If a Fund’s total return on NAV exceeds total distributions during a calendar year, the excess will be reflected as an increase in NAV per share. The final determination of the source and character of all distributions paid by a Fund during the fiscal year is made after the end of the fiscal year and is reflected in the financial statements contained in the annual report as of December 31 each year.
The tax character of each Fund’s distributions for a fiscal year is dependent upon the amount and tax character of distributions received from securities held in the Fund’s portfolio. Distributions received from certain securities in which each Fund invests, most notably REIT securities, may be characterized for tax purposes as ordinary income, long-term capital gain and/or a return of capital. The issuer of a security reports the tax character of its distributions only once per year, generally during the first two months of the calendar year. The distribution is included in a Fund’s ordinary income until such time the Fund is notified by the issuer of the actual tax character. For the fiscal year just ended, dividend income, net realized gain (loss) and unrealized appreciation (depreciation) recognized on the Statement of Operations for each Fund reflects the amounts of ordinary income, capital gain, and/or return of capital as reported by the issuers of such securities.
Indemnifications
Under the Funds’ organizational documents, their officers and trustees are indemnified against certain liabilities arising out of the performance of their duties to the Funds. In addition, in the normal course of business, the Funds enter into contracts that provide general indemnifications to other parties. The Funds’ maximum exposure under these arrangements is unknown as this would involve future claims that may be made against the Funds that have not yet occurred. However, the Funds have not had prior claims or losses pursuant to these contracts and expect the risk of loss to be remote.
Netting Agreements
In the ordinary course of business, the Funds may enter into transactions subject to enforceable master repurchase agreements, International Swaps and Derivative Association, Inc. (“ISDA”) master agreements or other similar arrangements (“netting agreements”). Generally, the right to offset in netting
Notes to Financial Statements (continued)
agreements allows each Fund to offset certain securities and derivatives with to a specific counterparty as well as any collateral received or delivered to that counterparty based on the terms of the agreements. Generally, a Fund manages its cash collateral and securities collateral on a counterparty basis.
The Funds’ investments subject to netting agreements as of the end of the reporting period, if any, are further described in Note 3 – Portfolio Securities and Investments in Derivatives.
Use of Estimates
The preparation of financial statements in conformity with U.S. GAAP requires management to make estimates and assumptions that affect the reported amounts of assets and liabilities at the date of the financial statements and the reported amounts of increases and decreases in net assets from operations during the reporting period. Actual results may differ from those estimates.
2. Investment Valuation and Fair Value Measurements
The fair valuation input levels as described below are for fair value measurement purposes.
Fair value is defined as the price that would be received upon selling an investment or transferring a liability in an orderly transaction to an independent buyer in the principal or most advantageous market for the investment. A three-tier hierarchy is used to maximize the use of observable market data and minimize the use of unobservable inputs and to establish classification of fair value measurements for disclosure purposes. Observable inputs reflect the assumptions market participants would use in pricing the asset or liability. Observable inputs are based on market data obtained from sources independent of the reporting entity. Unobservable inputs reflect the reporting entity’s own assumptions about the assumptions market participants would use in pricing the asset or liability. Unobservable inputs are based on the best information available in the circumstances. The following is a summary of the three-tiered hierarchy of valuation input levels.
| | |
| Level 1 – | | Inputs are unadjusted and prices are determined using quoted prices in active markets for identical securities. |
| Level 2 – | | Prices are determined using other significant observable inputs (including quoted prices for similar securities, interest rates, prepayment speeds, credit risk, etc.). |
| Level 3 – | | Prices are determined using significant unobservable inputs (including management’s assumptions in determining the fair value of investments). |
Common stocks and other equity-type securities are valued at the last sales price on the securities exchange on which such securities are primarily traded and are generally classified as Level 1. Securities primarily traded on the NASDAQ are valued at the NASDAQ Official Closing Price and are generally classified as Level 1. However, securities traded on a securities exchange or NASDAQ for which there were no transactions on a given day or securities not listed on a securities exchange or NASDAQ are valued at the last quoted bid price and are generally classified as Level 2. Prices of certain American Depositary Receipts (“ADR”) held by the Funds that trade in the United States are valued based on the last traded price, official closing price, or the most recent bid price of the underlying non-U.S.-traded stock, adjusted as appropriate for the underlying-to-ADR conversion ratio and foreign exchange rate, and from time-to-time may also be adjusted further to take into account material events that may take place after the close of the local non-U.S. market but before the close of the NYSE, which may represent a transfer from a Level 1 to a Level 2 security.
Prices of fixed-income securities are provided by a pricing service approved by the Board. The pricing service establishes a security’s fair value using methods that may include consideration of the following: yields or prices of investments of comparable quality, type of issue, coupon, maturity and rating, market quotes or indications of value from security dealers, evaluations of anticipated cash flows or collateral, general market conditions and other information and analysis, including the obligor’s credit characteristics considered relevant. These securities are generally classified as Level 2. In pricing certain securities, particularly less liquid and lower quality securities, the pricing service may consider information about a security, its issuer or market activity, provided by the Adviser. These securities are generally classified as Level 2 or Level 3 depending on the priority of the significant inputs.
Exchange-traded funds are valued at the last sales price on the securities exchange on which such securities are primarily traded and are generally classified as Level 1.
Index options are valued at the 4:00 p.m. Eastern Time (ET) close price of the NYSE. The values of exchange-traded options are based on the mean of the closing bid and ask prices. Index and exchange-traded options are generally classified as Level 1. Options traded in the over-the-counter market are valued using an evaluated mean price and are generally classified as Level 2.
Repurchase agreements are valued at contract amount plus accrued interest, which approximates market value. These securities are generally classified as Level 2.
Certain securities may not be able to be priced by the pre-established pricing methods as described above. Such securities may be valued by the Board and/or its appointee at fair value. These securities generally include, but are not limited to, restricted securities (securities which may not be publicly sold without registration under the Securities Act of 1933, as amended) for which a pricing service is unable to provide a market price; securities whose trading has been formally suspended; debt securities that have gone into default and for which there is no current market quotation; a security whose market price is not available from a pre-established pricing source; a security with respect to which an event has occurred that is likely to materially affect the value of the
security after the market has closed but before the calculation of a Fund’s NAV (as may be the case in non-U.S. markets on which the security is primarily traded) or make it difficult or impossible to obtain a reliable market quotation; and a security whose price, as provided by the pricing service, is not deemed to reflect the security’s fair value. As a general principle, the fair value of a security would appear to be the amount that the owner might reasonably expect to receive for it in a current sale. A variety of factors may be considered in determining the fair value of such securities, which may include consideration of the following: yields or prices of investments of comparable quality, type of issue, coupon, maturity and rating, market quotes or indications of value from security dealers, evaluations of anticipated cash flows or collateral, general market conditions and other information and analysis, including the obligor’s credit characteristics considered relevant. These securities are generally classified as Level 2 or Level 3 depending on the priority of the significant inputs. Regardless of the method employed to value a particular security, all valuations are subject to review by the Board and/or its appointee.
The inputs or methodologies used for valuing securities are not an indication of the risks associated with investing in those securities. The following is a summary of each Fund’s fair value measurements as of the end of the reporting period:
| | | | | | | | | | | | | | | | |
| S&P 500 Buy-Write Income (BXMX) | | Level 1 | | | Level 2 | | | Level 3 | | | Total | |
Long-Term Investments*: | | | | | | | | | | | | | | | | |
Common Stocks | | $ | 1,360,477,148 | | | $ | — | | | $ | — | | | $ | 1,360,477,148 | |
| | | | |
Short-Term Investments: | | | | | | | | | | | | | | | | |
Repurchase Agreements | | | — | | | | 37,439,038 | | | | — | | | | 37,439,038 | |
| | | | |
Investments in Derivatives: | | | | | | | | | | | | | | | | |
Options Written | | | (16,788,070 | ) | | | — | | | | — | | | | (16,788,070 | ) |
Total | | $ | 1,343,689,078 | | | $ | 37,439,038 | | | $ | — | | | $ | 1,381,128,116 | |
| Dow 30SM Dynamic Overwrite (DIAX) | | | | | | | | | | | | |
Long-Term Investments*: | | | | | | | | | | | | | | | | |
Common Stocks | | $ | 544,847,325 | | | $ | — | | | $ | — | | | $ | 544,847,325 | |
Exchange-Traded Funds | | | 24,358,600 | | | | — | | | | — | | | | 24,358,600 | |
| | | | |
Short-Term Investments: | | | | | | | | | | | | | | | | |
U.S. Government and Agency Obligations | | | — | | | | 4,995,810 | | | | — | | | | 4,995,810 | |
| | | | |
Investments in Derivatives: | | | | | | | | | | | | | | | | |
Options Written | | | (4,388,120 | ) | | | (18,586 | ) | | | — | | | | (4,406,706 | ) |
Total | | $ | 564,817,805 | | | $ | 4,977,224 | | | $ | — | | | $ | 569,795,029 | |
| S&P 500 Dynamic Overwrite (SPXX) | | | | | | | | | | | | |
Long-Term Investments*: | | | | | | | | | | | | | | | | |
Common Stocks | | $ | 230,408,150 | | | $ | — | | | $ | — | | | $ | 230,408,150 | |
Exchange-Traded Funds | | | 9,175,050 | | | | — | | | | — | | | | 9,175,050 | |
| | | | |
Investments in Derivatives: | | | | | | | | | | | | | | | | |
Options Written | | | (1,896,772 | ) | | | — | | | | — | | | | (1,896,772 | ) |
Total | | $ | 237,686,428 | | | $ | — | | | $ | — | | | $ | 237,686,428 | |
| NASDAQ 100 Dynamic Overwrite (QQQX) | | | | | | | | | | | | |
Long-Term Investments*: | | | | | | | | | | | | | | | | |
Common Stocks | | $ | 700,979,536 | | | $ | 419,655 | ** | | $ | — | | | $ | 701,399,191 | |
Exchange-Traded Funds | | | 34,905,600 | | | | — | | | | — | | | | 34,905,600 | |
| | | | |
Investments in Derivatives: | | | | | | | | | | | | | | | | |
Options Written | | | (5,937,975 | ) | | | — | | | | — | | | | (5,937,975 | ) |
Total | | $ | 729,947,161 | | | $ | 419,655 | | | $ | — | | | $ | 730,366,816 | |
| * | Refer to the Fund’s Portfolio of Investments for industry classifications. |
| ** | Refer to the Fund’s Portfolio of Investments for securities classified as Level 2. |
The Board is responsible for the valuation process and has appointed the oversight of the daily valuation process to the Adviser’s Valuation Committee. The Valuation Committee, pursuant to the valuation policies and procedures adopted by the Board, is responsible for making fair value determinations, evaluating the effectiveness of the Funds’ pricing policies and reporting to the Board. The Valuation Committee is aided in its efforts by the Adviser’s dedicated Securities Valuation Team, which is responsible for administering the daily valuation process and applying fair value methodologies as approved by the Valuation Committee. When determining the reliability of independent pricing services for investments owned by the Funds, the Valuation Committee, among other things, conducts due diligence reviews of the pricing services and monitors the quality of security prices received through various testing reports conducted by the Securities Valuation Team.
Notes to Financial Statements (continued)
The Valuation Committee will consider pricing methodologies it deems relevant and appropriate when making a fair value determination, based on the facts and circumstances specific to the portfolio instrument. Fair value determinations generally will be derived as follows, using public or private market information:
| | (i) | If available, fair value determinations shall be derived by extrapolating from recent transactions or quoted prices for identical or comparable securities. |
| | (ii) | If such information is not available, an analytical valuation methodology may be used based on other available information including, but not limited to: analyst appraisals, research reports, corporate action information, issuer financial statements and shelf registration statements. Such analytical valuation methodologies may include, but are not limited to: multiple of earnings, discount from market value of a similar freely-traded security, discounted cash flow analysis, book value or a multiple thereof, risk premium/yield analysis, yield to maturity and/or fundamental investment analysis. |
The purchase price of a portfolio instrument will be used to fair value the instrument only if no other valuation methodology is available or deemed appropriate, and it is determined that the purchase price fairly reflects the instrument’s current value.
For each portfolio security that has been fair valued pursuant to the policies adopted by the Board, the fair value price is compared against the last available and next available market quotations. The Valuation Committee reviews the results of such testing and fair valuation occurrences are reported to the Board.
3. Portfolio Securities and Investments in Derivatives
Portfolio Securities
Foreign Currency Transactions
To the extent that the Funds invest in securities and/or contracts that are denominated in a currency other than U.S. dollars, the Funds will be subject to currency risk, which is the risk that an increase in the U.S. dollar relative to the foreign currency will reduce returns or portfolio value. Generally, when the U.S. dollar rises in value against a foreign currency, the Funds’ investments denominated in that currency will lose value because their currency is worth fewer U.S. dollars; the opposite effect occurs if the U.S. dollar falls in relative value. Investments and other assets and liabilities denominated in foreign currencies are converted into U.S. dollars on a spot (i.e. cash) basis at the spot rate prevailing in the foreign currency exchange market at the time of valuation. Purchases and sales of investments and income denominated in foreign currencies are translated into U.S. dollars on the respective dates of such transactions.
The books and records of the Funds are maintained in U.S. dollars. Foreign currencies, assets and liabilities are translated into U.S. dollars at 4:00 p.m. ET. Investment transactions, income and expenses are translated on the respective dates of such transactions. Net realized foreign currency gains and losses resulting from changes in exchange rates include foreign currency gains and losses between trade date and settlement date of the transactions, foreign currency transactions, and the difference between the amounts of interest and dividends recorded on the books of the Funds and the amounts actually received.
The realized gains and losses resulting from changes in foreign currency exchange rates and changes in foreign exchange rates associated with (i) investments, (ii) investments in derivatives and (iii) other assets and liabilities are recognized as a component of “Net realized gain (loss) from investments and foreign currency,” on the Statement of Operations, when applicable.
The unrealized gains and losses resulting from changes in foreign currency exchange rates and changes in foreign exchange rates associated with (i) investments and (ii) other assets and liabilities are recognized as a component of “Change in unrealized appreciation (depreciation) of investments and foreign currency,” on the Statement of Operations, when applicable. The unrealized gains and losses resulting from changes in foreign exchange rates associated with investments in derivatives are recognized as a component of the respective derivative’s related “Change in net unrealized appreciation (depreciation)” on the Statement of Operations, when applicable.
Repurchase Agreements
In connection with transactions in repurchase agreements, it is each Fund’s policy that its custodian take possession of the underlying collateral securities, the fair value of which exceeds the principal amount of the repurchase transaction, including accrued interest, at all times. If the counterparty defaults, and the fair value of the collateral declines, realization of the collateral may be delayed or limited.
The following table presents the repurchase agreements for the Funds that are subject to netting agreements as of the end of the reporting period, and the collateral delivered related to those repurchase agreements.
| | | | | | | | | | | | | | |
| Fund | | Counterparty | | Short-Term
Investments, at Value | | | Collateral
Pledged (From)
Counterparty* | | | Net
Exposure | |
| S&P 500 Buy-Write Income (BXMX) | | Fixed Income Clearing Corporation | | $ | 37,439,038 | | | $ | (37,439,038 | ) | | $ | — | |
| * | As of the end of the reporting period, the value of the collateral pledged from the counterparty exceeded the value of the repurchase agreements. Refer to the Fund’s Portfolio of Investments for details on the repurchase agreements. |
Zero Coupon Securities
A zero coupon security does not pay a regular interest coupon to its holders during the life of the security. Income to the holder of the security comes from accretion of the difference between the original purchase price of the security at issuance and the par value of the security at maturity and is effectively paid at maturity. The market prices of zero coupon securities generally are more volatile than the market prices of securities that pay interest periodically.
Investments in Derivatives
Each Fund is authorized to invest in certain derivative instruments, such as futures, options and swap contracts. Each Fund limits its investments in futures, options on futures and swap contracts to the extent necessary for the Adviser to claim the exclusion from regulation by the Commodity Futures Trading Commission as a commodity pool operator with respect to the Fund. The Funds record derivative instruments at fair value, with changes in fair value recognized on the Statement of Operations, when applicable. Even though the Funds’ investments in derivatives may represent economic hedges, they are not considered to be hedge transactions for financial reporting purposes.
Options Transactions
The purchase of options involves the risk of loss of all or a part of the cash paid for the options (the premium). The market risk associated with purchasing options is limited to the premium paid. The counterparty credit risk of purchasing options, however, needs to take into account the current value of the option, as this is the performance expected from the counterparty. When a Fund purchases an option, an amount equal to the premium paid (the premium plus commission) is recognized as a component of “Options purchased, at value” on the Statement of Asset and Liabilities. When a Fund writes an option, an amount equal to the net premium received (the premium less commission) is recognized as a component of “Options written, at value” on the Statement of Assets and Liabilities and is subsequently adjusted to reflect the current value of the written option until the option is exercised or expires or the Fund enters into a closing purchase transaction. The changes in the value of options purchased during the fiscal period are recognized as a component of “Change in net unrealized appreciation (depreciation) of options purchased” on the Statement of Operations. The changes in values of the options written during the fiscal period are recognized as a component of “Change in net unrealized appreciation (depreciation) of options written” on the Statement of Operations. When an option is exercised or expires or a Fund enters into a closing purchase transaction, the difference between the net premium received, and any amount paid at expiration or on executing a closing purchase transaction, including commission, is recognized as a component of “Net realized gain (loss) from options purchased and/or written” on the Statement of Operations. The Fund, as writer of an option, has no control over whether the underlying instrument may be sold (called) or purchased (put) and as a result bears the risk of an unfavorable change in the market value of the instrument underlying the written option. There is also the risk the Fund may not be able to enter into a closing transaction because of an illiquid market.
During the current fiscal period, S&P 500 Buy-Write Income (BXMX) sold call options on equity indices as part of its overall investment strategy. The notional amount of these options averaged 99% of the Fund’s assets.
During the current fiscal period, S&P 500 Dynamic Overwrite (SPXX), DOW 30sm (DIAX), and Nasdaq 100 Dynamic Overwrite (QQQX) each sold call options on equity indices as part of its overall investment strategy. The notional amounts of these options averaged 60% of each Fund’s assets. Each Fund also purchased a small amount of call options as part of its overwrite strategy and sold put options on up to 5% of its portfolio.
The average notional amount of outstanding options contracts purchased and options contracts written during the current fiscal period, was as follows:
| | | | | | | | | | | | | | | | |
| | | | | | Dow 30
Dynamic
Overwrite
(DIAX) | | | S&P 500
Dynamic
Overwrite
(SPXX) | | | Nasdaq 100
Dynamic
Overwrite
(QQQX) | |
Average notional amount of outstanding call options purchased* | | | | | | $ | 123,000 | | | $ | 9,094,000 | | | $ | 16,151,000 | |
| | | | |
| | | S&P 500
Buy-Write
Income
(BXMX) | | | Dow 30SM
Dynamic
Overwrite
(DIAX) | | | S&P 500
Dynamic
Overwrite
(SPXX) | | | Nasdaq 100
Dynamic
Overwrite
(QQQX) | |
Average notional amount of outstanding call options written* | | $ | (1,370,064,500 | ) | | $ | (360,041,876 | ) | | $ | (159,106,198 | ) | | $ | (461,835,559 | ) |
| | | | |
| | | | | | Dow 30SM
Dynamic
Overwrite
(DIAX) | | | S&P 500
Dynamic
Overwrite
(SPXX) | | | Nasdaq 100
Dynamic
Overwrite
(QQQX) | |
Average notional amount of outstanding put options written* | | | | | | $ | (16,815,000 | ) | | $ | (6,640,000 | ) | | $ | (21,295,000 | ) |
| * | The average notional amount is calculated based on the outstanding notional at the beginning of the fiscal period and at the end of each fiscal quarter within the current fiscal period. |
Notes to Financial Statements (continued)
The following table presents the fair value of all options held by the Funds as of the end of the reporting period, the location of these instruments on the Statement of Assets and Liabilities and the primary underlying risk exposure.
| | | | | | | | | | | | | | | | |
| | | | | Location on the Statement of Assets and Liabilities | |
Underlying
Risk Exposure | | Derivative
Instrument | | Asset Derivatives | | | | | (Liability) Derivatives | |
| | | Location | | Value | | | | | Location | | Value | |
| S&P 500 Buy-Write Income (BXMX) | |
| Equity price | | Options | | — | | $ | — | | | | | Options written, at value | | $ | (16,788,070 | ) |
| Dow 30SM Dynamic Overwrite (DIAX) | |
| Equity price | | Options | | — | | $ | — | | | | | Options written, at value | | $ | (4,406,706 | ) |
| S&P 500 Dynamic Overwrite (SPXX) | |
| Equity price | | Options | | — | | $ | — | | | | | Options written, at value | | $ | (1,896,772 | ) |
| Nasdaq 100 Dynamic Overwrite (QQQX) | |
| Equity price | | Options | | — | | $ | — | | | | | Options written, at value | | $ | (5,937,975 | ) |
The following table presents the options written subject to netting agreements, as well as the collateral delivered related to those options written as of the end of the reporting period.
| | | | | | | | | | | | | | | | | | | | | | |
| Fund | | Counterparty | | Gross
Options Written,
at Value | | | Amounts Netted on
Statement of Assets
and Liabilities | | | Net
Options Written,
at Value | | | Collateral Pledged
to Counterparty | | | Net
Exposure | |
| Dow 30SM Dynamic Overwrite (DIAX) | | | | | | | | | | | | | | | | | | | | | | |
| | BNP Paribas | | $ | (7,840 | ) | | $ | — | | | $ | (7,840 | ) | | $ | — | | | $ | (7,840 | ) |
| | Citigroup | | | (1,755 | ) | | | — | | | | (1,755 | ) | | | — | | | | (1,755 | ) |
| | HSBC | | | (3,240 | ) | | | — | | | | (3,240 | ) | | | — | | | | (3,240 | ) |
| | JPMorgan Chase | | | (1,132 | ) | | | — | | | | (1,132 | ) | | | — | | | | (1,132 | ) |
| | | UBS | | | (4,619 | ) | | | — | | | | (4,619 | ) | | | — | | | | (4,619 | ) |
| Total | | | | $ | (18,586 | ) | | $ | — | | | $ | (18,586 | ) | | $ | — | | | $ | (18,586 | ) |
The following table presents the amount of net realized gain (loss) and change in net unrealized appreciation (depreciation) recognized on options purchased and options written on the Statement of Operations during the current fiscal period, and the primary underlying risk exposure.
| | | | | | | | | | | | |
| Fund | | Underlying
Risk Exposure | | Derivative
Instrument | | Net Realized Gain(Loss) from
Options Purchased/Written | | | Change in Net Unrealized
Appreciation (Depreciation) of
Options Purchased/Written | |
| S&P 500 Buy-Write Income (BXMX) | | Equity price | | Options Written | | $ | 39,402,678 | | | $ | 14,206,473 | |
| Dow 30SM Dynamic Overwrite (DIAX) | | Equity price | | Options Purchased | | | 462,569 | | | | — | |
| Dow 30SM Dynamic Overwrite (DIAX) | | Equity price | | Options Written | | | 4,416,871 | | | | 90,478 | |
| S&P 500 Dynamic Overwrite (SPXX) | | Equity price | | Options Purchased | | | (222,728 | ) | | | 454,835 | |
| S&P 500 Dynamic Overwrite (SPXX) | | Equity price | | Options Written | | | 2,036,012 | | | | 142,423 | |
| Nasdaq 100 Dynamic Overwrite (QQQX) | | Equity price | | Options Purchased | | | (177,298 | ) | | | 815,063 | |
| Nasdaq 100 Dynamic Overwrite (QQQX) | | Equity price | | Options Written | | | (9,277,584 | ) | | | 179,409 | |
Market and Counterparty Credit Risk
In the normal course of business each Fund may invest in financial instruments and enter into financial transactions where risk of potential loss exists due to changes in the market (market risk) or failure of the other party to the transaction to perform (counterparty credit risk). The potential loss could exceed the value of the financial assets recorded on the financial statements. Financial assets, which potentially expose each Fund to counterparty credit risk, consist principally of cash due from counterparties on forward, option and swap transactions, when applicable. The extent of each Fund’s exposure to counterparty credit risk in respect to these financial assets approximates their carrying value as recorded on the Statement of Assets and Liabilities.
Each Fund helps manage counterparty credit risk by entering into agreements only with counterparties the Adviser believes have the financial resources to honor their obligations and by having the Adviser monitor the financial stability of the counterparties. Additionally, counterparties may be required to pledge collateral daily (based on the daily valuation of the financial asset) on behalf of each Fund with a value approximately equal to the amount of any unrealized gain above a pre-determined threshold. Reciprocally, when each Fund has an unrealized loss, the Funds have instructed the custodian to
pledge assets of the Funds as collateral with a value approximately equal to the amount of the unrealized loss above a pre-determined threshold. Collateral pledges are monitored and subsequently adjusted if and when the valuations fluctuate, either up or down, by at least the pre-determined threshold amount.
4. Fund Shares
Transactions in shares during the Funds’ current and prior fiscal period were as follows:
| | | | | | | | | | | | | | | | |
| | | S&P 500 Buy-Write
Income (BXMX) | | | Dow 30SM Dynamic
Overwrite (DIAX) | |
| | | Year
Ended
12/31/15 | | | Year
Ended
12/31/14 | | | Year
Ended
12/31/15 | | | Year
Ended
12/31/14 | |
Shares issued in the Reorganizations | | | — | | | | 65,089,576 | | | | — | | | | 24,069,676 | |
| | |
| | | S&P 500 Dynamic
Overwrite (SPXX) | | | Nasdaq 100 Dynamic
Overwrite (QQQX) | |
| | | Year
Ended
12/31/15 | | | Year
Ended
12/31/14 | | | Year
Ended
12/31/15 | | | Year
Ended
12/31/14 | |
Shares: | | | | | | | | | | | | | | | | |
Issued in the Reorganizations | | | — | | | | — | | | | — | | | | 18,033,457 | |
Issued to shareholders due to reinvestment of distributions | | | — | | | | — | | | | — | | | | 21,029 | |
5. Investment Transactions
Long-term purchases and sales (excluding derivative transactions) during the current reporting period, were as follows:
| | | | | | | | | | | | | | | | |
| | | S&P 500
Buy-Write
Income
(BXMX) | | | Dow 30SM
Dynamic
Overwrite
(DIAX) | | | S&P 500
Dynamic
Overwrite
(SPXX) | | | Nasdaq 100
Dynamic
Overwrite
(QQQX) | |
Purchases | | $ | 105,190,971 | | | $ | 105,968,152 | | | $ | 51,892,725 | | | $ | 113,600,475 | |
Sales | | | 134,040,667 | | | | 127,978,874 | | | | 65,494,991 | | | | 156,403,040 | |
Transactions in options written during the current reporting period, were as follows:
| | | | | | | | | | | | | | | | |
| | | S&P 500 Buy-Write
Income (BXMX) | | | Dow 30SM Dynamic
Overwrite (DIAX) | |
| | | Number of
Contracts | | | Premiums
Received | | | Number of
Contracts | | | Premiums
Received | |
Options outstanding, beginning of period | | | 6,701 | | | $ | 31,623,174 | | | | 25,015 | | | $ | 2,357,314 | |
Options written | | | 79,571 | | | | 279,892,136 | | | | 1,434,772 | | | | 81,012,889 | |
Options terminated in closing purchase transactions | | | (78,323 | ) | | | (275,378,115 | ) | | | (772,201 | ) | | | (69,492,441 | ) |
Options expired | | | (1,332 | ) | | | (2,063,223 | ) | | | (684,548 | ) | | | (9,109,660 | ) |
Options outstanding, end of period | | | 6,617 | | | $ | 34,073,972 | | | | 3,038 | | | $ | 4,768,102 | |
| | | | | | | | | | | | | | | | |
| | | S&P 500 Dynamic
Overwrite (SPXX) | | | Nasdaq 100 Dynamic
Overwrite (QQQX) | |
| | | Number of
Contracts | | | Premiums
Received | | | Number of
Contracts | | | Premiums
Received | |
Options outstanding, beginning of period | | | 1,365 | | | $ | 2,573,269 | | | | 3,269 | | | $ | 5,604,793 | |
Options written | | | 1,106,611 | | | | 34,900,715 | | | | 1,405,953 | | | | 109,404,999 | |
Options terminated in closing purchase transactions | | | (629,613 | ) | | | (31,163,858 | ) | | | (762,206 | ) | | | (98,807,885 | ) |
Options expired | | | (477,611 | ) | | | (4,228,224 | ) | | | (645,746 | ) | | | (9,548,902 | ) |
Options exercised | | | (100 | ) | | | (7,620 | ) | | | (300 | ) | | | (38,536 | ) |
Options outstanding, end of period | | | 652 | | | $ | 2,074,282 | | | | 970 | | | $ | 6,614,469 | |
Notes to Financial Statements (continued)
6. Income Tax Information
Each Fund is a separate taxpayer for federal income tax purposes. Each Fund intends to distribute substantially all of its net investment company taxable income to shareholders and to otherwise comply with the requirements of Subchapter M of the Internal Revenue Code applicable to regulated investment companies. In any year when the Funds realize net capital gains, each Fund may choose to distribute all or a portion of its net capital gains to shareholders, or alternatively, to retain all or a portion of its net capital gains and pay federal corporate income taxes on such retained gains.
For all open tax years and all major taxing jurisdictions, management of the Funds has concluded that there are no significant uncertain tax positions that would require recognition in the financial statements. Open tax years are those that are open for examination by taxing authorities (i.e., generally the last four tax year ends and the interim tax period since then). Furthermore, management of the Funds is also not aware of any tax positions for which it is reasonably possible that the total amounts of unrecognized tax benefits will significantly change in the next twelve months.
The following information is presented on an income tax basis. Differences between amounts for financial statement and federal income tax purposes are primarily due to timing differences in recording income, timing differences in recognizing certain gains and losses on investment transactions and the recognition of unrealized gain or loss for tax (mark-to-market) on options contracts. To the extent that differences arise that are permanent in nature, such amounts are reclassified within the capital accounts as detailed below. Temporary differences do not require reclassification. Temporary and permanent differences do not impact the NAVs of the Funds.
As of December 31, 2015, the cost and unrealized appreciation (depreciation) of investments (excluding investments in derivatives), as determined on a federal income tax basis, were as follows:
| | | | | | | | | | | | | | | | |
| | | S&P 500
Buy-Write
Income
(BXMX) | | | Dow 30SM
Dynamic
Overwrite
(DIAX) | | | S&P 500
Dynamic
Overwrite
(SPXX) | | | Nasdaq 100
Dynamic
Overwrite
(QQQX) | |
Cost of investments | | $ | 879,797,790 | | | $ | 394,749,094 | | | $ | 154,722,058 | | | $ | 350,079,854 | |
Gross unrealized: | | | | | | | | | | | | | | | | |
Appreciation | | $ | 562,562,873 | | | $ | 185,984,563 | | | $ | 95,055,955 | | | $ | 388,788,194 | |
Depreciation | | | (44,444,477 | ) | | | (6,531,922 | ) | | | (10,194,813 | ) | | | (2,563,257 | ) |
Net unrealized appreciation (depreciation) of investments | | $ | 518,118,396 | | | $ | 179,452,641 | | | $ | 84,861,142 | | | $ | 386,224,937 | |
Permanent differences, primarily due to foreign currency transactions, federal taxes paid, investments in passive foreign investment companies, nondeductible reorganization expenses, real estate investment trust adjustments, deemed dividend due to corporate actions and tax basis earnings and profits adjustments, resulted in reclassifications among the Funds’ components of net assets as of December 31, 2015, the Funds’ tax year end, as follows:
| | | | | | | | | | | | | | | | |
| | | S&P 500
Buy-Write
Income
(BXMX) | | | Dow 30SM
Dynamic
Overwrite
(DIAX) | | | S&P 500
Dynamic
Overwrite
(SPXX) | | | Nasdaq 100
Dynamic
Overwrite
(QQQX) | |
Paid-in surplus | | $ | (85,452,692 | ) | | $ | (14,354,119 | ) | | $ | (8,030,437 | ) | | $ | (10,086,791 | ) |
Undistributed (Over-distribution of) net investment income | | | 85,630,855 | | | | 14,353,519 | | | | 8,107,974 | | | | 11,659,926 | |
Accumulated net realized gain (loss) | | | (178,163 | ) | | | 600 | | | | (77,537 | ) | | | (1,573,135 | ) |
The tax components of undistributed net ordinary income and net long-term capital gains as of December 31, 2015, the Funds’ tax year end, were as follows:
| | | | | | | | | | | | | | | | |
| | | S&P 500
Buy-Write
Income
(BXMX) | | | Dow 30SM
Dynamic
Overwrite
(DIAX) | | | S&P 500
Dynamic
Overwrite
(SPXX) | | | Nasdaq 100
Dynamic
Overwrite
(QQQX) | |
Undistributed net ordinary income | | $ | — | | | $ | — | | | $ | — | | | $ | — | |
Undistributed net long-term capital gains | | | — | | | | — | | | | — | | | | — | |
The tax character of distributions paid during the Funds’ tax years ended December 31, 2015 and December 31, 2014, was designated for purposes of the dividends paid deduction as follows:
| | | | | | | | | | | | | | | | |
| 2015 | | S&P 500
Buy-Write
Income
(BXMX) | | | Dow 30SM
Dynamic
Overwrite
(DIAX) | | | S&P 500
Dynamic
Overwrite
(SPXX) | | | Nasdaq 100
Dynamic
Overwrite
(QQQX) | |
Distributions from net ordinary income1 | | $ | 103,140,331 | | | $ | 23,350,404 | | | $ | 11,359,070 | | | $ | 15,777,079 | |
Distributions from net long-term capital gains2 | | | — | | | | 2,657,425 | | | | — | | | | 35,423,100 | |
Return of capital | | | — | | | | 12,386,984 | | | | 5,504,222 | | | | — | |
| | | | | | | | | | | | | | | | |
2014 | | S&P 500
Buy-Write
Income
(BXMX) | | | Dow 30SM
Dynamic
Overwrite
(DIAX) | | | S&P 500
Dynamic
Overwrite
(SPXX) | | | Nasdaq 100
Dynamic
Overwrite
(QQQX) | |
Distributions from net ordinary income1 | | $ | 7,115,283 | | | $ | 2,647,222 | | | $ | 3,119,271 | | | $ | 1,248,726 | |
Distributions from net long-term capital gains | | | — | | | | 1,054,139 | | | | — | | | | 8,909,792 | |
Return of capital | | | 31,195,830 | | | | 9,083,316 | | | | 13,744,021 | | | | 15,055,028 | |
1 Net ordinary income consists of net taxable income derived from dividends, interest and current year earnings and profits attributed to realized gains. | |
2 The Funds hereby designate as long-term capital gain dividend, pursuant to Internal Revenue Code Section 852(b)(3), the amount necessary to reduce earnings and profits of the Funds related to net capital gain to zero for the tax year ended December 31, 2015. | |
As of December 31, 2015, the Funds’ tax year end, the following Funds had unused capital loss carryforwards available for federal income tax purposes to be applied against future capital gains, if any. If not applied, the carryforwards will expire as shown in the following table. The losses not subject to expiration will be utilized first by a Fund.
| | | | | | | | |
| | | S&P 500
Buy-Write
Income
(BXMX)3 | | | S&P 500
Dynamic
Overwrite
(SPXX) | |
Expiration: | | | | | | | | |
December 31, 2017 | | $ | 22,707,245 | | | | 22,481,967 | |
December 31, 2018 | | | 4,958,903 | | | | 7,655,485 | |
Not subject to expiration | | | — | | | | — | |
Total | | $ | 27,666,148 | | | $ | 30,137,452 | |
3 A portion of S&P 500 Buy-Write Income’s (BXMX) capital loss carryforward is subject to an annual limitation under the Internal Revenue Code and related regulations. | |
During the Funds’ tax year ended December 31, 2015, the Funds utilized capital loss carryforwards as follows:
| | | | | | | | | | | | | | | | |
| | | S&P 500
Buy-Write
Income
(BXMX) | | | Dow 30SM
Dynamic
Overwrite
(DIAX) | | | S&P 500
Dynamic
Overwrite
(SPXX) | | | Nasdaq 100
Dynamic
Overwrite
(QQQX) | |
Utilized capital loss carryforwards | | $ | 127,064,296 | | | $ | 15,121,392 | | | $ | 16,944,068 | | | $ | 22,925,868 | |
7. Management Fees and Other Transactions with Affiliates
The management fee compensates the Adviser for overall investment advisory and administrative services and general office facilities. Gateway and NAM are compensated for their services to the Funds from the management fees paid to the Adviser.
Each Fund’s management fee consists of two components – a fund-level fee, based only on the amount of assets within the Fund, and a complex-level fee, based on the aggregate amount of all eligible fund assets managed by the Adviser. This pricing structure enables the Fund’s shareholders to benefit from growth in the assets within their respective Funds as well as from growth in the amount of complex-wide assets managed by the Adviser.
Notes to Financial Statements (continued)
The annual Fund-level fee, payable monthly, for each Fund is calculated according to the following schedule:
| | | | | | | | | | | | | | | | |
| Average Daily Managed Assets* | | S&P 500 Buy-Write
Income (BXMX) | | | DOW 30SM
Dynamic
Overwrite
(DIAX) | | | S&P 500
Dynamic
Overwrite
(SPXX) | | | Nasdaq 100
Dynamic
Overwrite
(QQQX) | |
For the first $500 million | | | 0.7000 | % | | | 0.7000 | % | | | 0.6600 | % | | | 0.6900 | % |
For the next $500 million | | | 0.6750 | | | | 0.6750 | | | | 0.6350 | | | | 0.6650 | |
For the next $500 million | | | 0.6500 | | | | 0.6500 | | | | 0.6100 | | | | 0.6400 | |
For the next $500 million | | | 0.6250 | | | | 0.6250 | | | | 0.5850 | | | | 0.6150 | |
For managed assets over $2 billion | | | 0.6000 | | | | 0.6000 | | | | 0.5600 | | | | 0.5900 | |
The annual complex-level fee, payable monthly, for each Fund is calculated according to the following schedule:
| | | | |
| Complex-Level Managed Asset Breakpoint Level* | | Effective Rate at Breakpoint Level | |
$55 billion | | | 0.2000 | % |
$56 billion | | | 0.1996 | |
$57 billion | | | 0.1989 | |
$60 billion | | | 0.1961 | |
$63 billion | | | 0.1931 | |
$66 billion | | | 0.1900 | |
$71 billion | | | 0.1851 | |
$76 billion | | | 0.1806 | |
$80 billion | | | 0.1773 | |
$91 billion | | | 0.1691 | |
$125 billion | | | 0.1599 | |
$200 billion | | | 0.1505 | |
$250 billion | | | 0.1469 | |
$300 billion | | | 0.1445 | |
| * | For the fund-level and complex-level fees, managed assets include closed-end fund assets managed by the Adviser that are attributable to certain types of leverage. For these purposes, leverage includes the funds’ use of preferred stock and borrowings and certain investments in the residual interest certificates (also called inverse floating rate securities) in tender option bond (TOB) trusts, including the portion of assets held by a TOB trust that has been effectively financed by the trust’s issuance of floating rate securities, subject to an agreement by the Adviser as to certain funds to limit the amount of such assets for determining managed assets in certain circumstances. The complex-level fee is calculated based upon the aggregate daily managed assets of all Nuveen funds that constitute “eligible assets.” Eligible assets do not include assets attributable to investments in other Nuveen funds and assets in excess of $2 billion added to the Nuveen fund complex in connection with the Adviser’s assumption of the management of the former First American Funds effective January 1, 2011. As of December 31, 2015, the complex-level fee rate for each of these Funds was 0.1639%. |
The Funds pay no compensation directly to those of its trustees who are affiliated with the Adviser or to its officers, all of whom receive remuneration for their services to the Funds from the Adviser or its affiliates. The Board has adopted a deferred compensation plan for independent trustees that enables trustees to elect to defer receipt of all or a portion of the annual compensation they are entitled to receive from certain Nuveen-advised funds. Under the plan, deferred amounts are treated as though equal dollar amounts had been invested in shares of select Nuveen-advised funds.
Additional
Fund Information (Unaudited)
| | | | | | | | | | |
| Board of Trustees | | | | | | | | | | |
| William Adams IV* | | Jack B. Evans | | William C. Hunter | | David J. Kundert | | John K. Nelson | | William J. Schneider |
Thomas S. Schreier, Jr.* | | Judith M. Stockdale | | Carole E. Stone | | TerenceJ, Toth | | Margaret L. Wolff** | | |
| ** | Effective February 15, 2016. |
| | | | | | | | |
| | | | | |
Fund Manager Nuveen Fund Advisors, LLC 333 West Wacker Drive Chicago, lL60606 | | Custodian State Street Bank & Trust Company Boston, MA 02111 | | Legal Counsel Chapman and Cutler LLP Chicago, IL 60603 | | Independent Registered
Public Accounting Firm PricewaterhouseCoopers LLP Chicago, IL60606 | | Transfer Agent and
Shareholder Services State Street Bank
& Trust Company Nuveen Funds P.O. Box 43071 Providence, RI 02940-3071 (800) 257-8787 |
Distribution Information
The Funds hereby designate their percentages of dividends paid from net ordinary income as dividends qualifying for the 70% dividends received deduction (“DRD”) for corporations and their percentages as qualified dividend income (“QDI”) for individuals under Section 1(h)(11) of the Internal Revenue Code as shown in the accompanying table. The actual qualified dividend income distributions will be reported to shareholders on Form 1099-DIV which will be sent to shareholders shortly after calendar year end.
| | | | | | | | | | | | | | | | |
| | | BXMX | | | DIAX | | | SPXX | | | QQQX | |
% DRD | | | 28.18% | | | | 61.85% | | | | 46.67% | | | | 66.18% | |
% QDI | | | 28.57% | | | | 61.60% | | | | 46.51% | | | | 77.13% | |
Quarterly Form N-Q Portfolio of Investments Information
Each Fund is required to file its complete schedule of portfolio holdings with the Securities and Exchange Commission (SEC) for the first and third quarters of each fiscal year on Form N-Q. You may obtain this information directly from the SEC. Visit the SEC on-line at http://www.sec.gov or in person at the SEC’s Public Reference Room in Washington, D.C. Call the SEC toll-free at (800) SEC-0330 for room hours and operation.
Nuveen Funds’ Proxy Voting Information
You may obtain (i) information regarding how each fund voted proxies relating to portfolio securities held during the most recent twelve-month period ended June 30, without charge, upon request, by calling Nuveen Investments toll-free at (800) 257-8787 or on Nuveen’s website at www.nuveen.com and (ii) a description of the policies and procedures that each fund used to determine how to vote proxies relating to portfolio securities without charge, upon request, by calling Nuveen Investments toll free at (800) 257-8787. You may also obtain this information directly from the SEC. Visit the SEC on-line at http://www.sec.gov.
CEO Certification Disclosure
Each Fund’s Chief Executive Officer (CEO) has submitted to the New York Stock Exchange (NYSE) the annual CEO certification as required by Section 303A.12(a) of the NYSE Listed Company Manual. Each Fund has filed with the SEC the certification of its CEO and Chief Financial Officer required by Section 302 of the Sarbanes-Oxley Act.
Share Repurchases
Each Fund intends to repurchase through its open-market share repurchase program, shares of its own common stock at such times and in such amounts as is deemed advisable. During the period covered by this report, each Fund repurchased shares of its common stock as shown in the accompanying table. Any future repurchases will be reported in the next annual or semi-annual report.
| | | | | | | | | | | | | | | | |
| | | BXMX | | | DIAX | | | SPXX | | | QQQX | |
Shares repurchased | | | — | | | | — | | | | — | | | | — | |
FINRA BrokerCheck
The Financial Industry Regulatory Authority (FINRA) provides information regarding the disciplinary history of FINRA member firms and associated investment professionals. This information as well as an investor brochure describing FINRA BrokerCheck is available to the public by calling the FINRA BrokerCheck Hotline number at (800) 289-9999 or by visiting www.FlNRA.org.
Glossary of Terms
Used in this Report (Unaudited)
| n | | Average Annual Total Return: This is a commonly used method to express an investment’s performance over a particular, usually multi-year time period. It expresses the return that would have been necessary each year to equal the investment’s actual cumulative performance (including change in NAV or market price and reinvested dividends and capital gains distributions, if any) over the time period being considered. |
| n | | Beta: A measure of the variability of the change in the share price for a Fund in relation to a change in the value of the Fund’s market benchmark. Securities with betas higher than 1.0 have been, and are expected to be, more volatile than the benchmark; securities with betas lower than 1 .0 have been, and are expected to be, less volatile than the benchmark. |
| n | | Chicago Board Options Exchange (CBOE) S&P 500 Buy-Write Index (BXM): An index designed to track the performance of a hypothetical buy-write strategy on the S&P 500® Index. Index returns assume reinvestment of distributions, but do not include the effects of any applicable sales charges or management fees. |
| n | | Chicago Board of Exchange (CBOE) Volatility Index® (VIX®): An Index that is a key measure of market expectations of near-term volatility conveyed by S&P 500® stock index option prices. Since its introduction in 1993, VIX has been considered by many to be the world’s premier barometer of investor sentiment and market volatility (www.cboe.com). Index returns assume reinvestment of distributions, but do not include the effects of any applicable sales charges or management fees. |
| n | | Chicago Board of Exchange (CBOE) Dow Jones Industrial Average (DJIA) BuyWrite Index (BXD): A benchmark index that measures the performance of a theoretical portfolio that sells call options on the Dow Jones Industrial Average (the Dow), against a portfolio of the stocks included in the Dow. Index returns assume reinvestment of distributions, but do not include the effects of any applicable sales charges or management fees. |
| n | | Chicago Board of Exchange (CBOE) Nasdaq 100 BuyWrite Index (BXN): A benchmark index that measures the performance of a theoretical portfolio that owns a basket of the stocks included in the Nasdaq 100 Index, and “writes” (or sells) Nasdaq 100 Index covered call options each month. Index returns assume reinvestment of distributions, but do not include the effects of any applicable sales charges or management fees. |
| n | | Dow Jones Industrial Average (DJIA): An average that tracks the performance of 30 large cap companies. Index returns assume reinvestment of distributions, but do not reflect any applicable sales charges or management fees. |
| n | | Effective Leverage: Effective leverage is a fund’s effective economic leverage, and includes both regulatory leverage (see below) and the leverage effects of certain derivative investments in the fund’s portfolio that increase the fund’s investment exposure. |
| n | | Gross Domestic Product (GDP): The total market value of all final goods and services produced in a country/region in a given year, equal to total consumer, investment and government spending, plus the value of exports, minus the value of imports. |
| n | | Leverage: Leverage is created whenever a fund has investment exposure (both reward and/or risk) equivalent to more than 100% of the investment capital. |
| n | | NASDAQ-100 Index: An index that includes 100 of the largest domestic and international nonfinancial securities listed on The NASDAQ Stock Market based on market capitalization. Index returns assume reinvestment of distributions, but do not reflect any applicable sales charges or management fees. |
| n | | Net Asset Value (NAV) Per Share: A fund’s Net Assets is equal to its total assets (securities, cash, accrued earnings and receivables) less its total liabilities. NAV per share is equal to the fund’s Net Assets divided by its number of shares outstanding. |
| n | | Regulatory Leverage: Regulatory leverage consists of preferred shares issued by or borrowings of a fund. Both of these are part of a fund’s capital structure. Regulatory leverage is subject to asset coverage limits set in the Investment Company Act of 1940. |
| n | | S&P 500® Index: An unmanaged index generally considered representative of the U.S. stock market. Index returns assume reinvestment of distributions, but do not reflect any applicable sales charges or management fees. |
Reinvest Automatically,
Easily and Conveniently
Nuveen makes reinvesting easy. A phone call is all it takes to set up your reinvestment account.
Nuveen Closed-End Funds Automatic Reinvestment Plan
Your Nuveen Closed-End Fund allows you to conveniently reinvest distributions in additional Fund shares.
By choosing to reinvest, you’ll be able to invest money regularly and automatically, and watch your investment grow through the power of compounding. Just like distributions in cash, there may be times when income or capital gains taxes may be payable on distributions that are reinvested.
It is important to note that an automatic reinvestment plan does not ensure a profit, nor does it protect you against loss in a declining market.
Easy and convenient
To make recordkeeping easy and convenient, each quarter you’ll receive a statement showing your total distributions, the date of investment, the shares acquired and the price per share, and the total number of shares you own.
How shares are purchased
The shares you acquire by reinvesting will either be purchased on the open market or newly issued by the Fund. If the shares are trading at or above net asset value at the time of valuation, the Fund will issue new shares at the greater of the net asset value or 95% of the then-current market price. If the shares are trading at less than net asset value, shares for your account will be purchased on the open market. If the Plan Agent begins purchasing Fund shares on the open market while shares are trading below net asset value, but the Fund’s shares subsequently trade at or above their net asset value before the Plan Agent is able to complete its purchases, the Plan Agent may cease open-market purchases and may invest the uninvested portion of the distribution in newly-issued Fund shares at a price equal to the greater of the shares’ net asset value or 95% of the shares’ market value on the last business day immediately prior to the purchase date, Distributions received to purchase shares in the open market will normally be invested shortly after the distribution payment date. No interest will be paid on distributions awaiting reinvestment. Because the market price of the shares may increase before purchases are completed, the average purchase price per share may exceed the market price at the time of valuation, resulting in the acquisition of fewer shares than if the distribution had been paid in shares issued by the Fund. A pro rata portion of any applicable brokerage commissions on open market purchases will be paid by Plan participants. These commissions usually will be lower than those charged on individual transactions.
Flexible
You may change your distribution option or withdraw from the Plan at any time, should your needs or situation change.
You can reinvest whether your shares are registered in your name, or in the name of a brokerage firm, bank, or other nominee. Ask your investment advisor if his or her firm will participate on your behalf. Participants whose shares are registered in the name of one firm may not be able to transfer the shares to another firm and continue to participate in the Plan.
The Fund reserves the right to amend or terminate the Plan at any time. Although the Fund reserves the right to amend the Plan to include a service charge payable by the participants, there is no direct service charge to participants in the Plan at this time.
Call today to start reinvesting distributions
For more information on the Nuveen Automatic Reinvestment Plan or to enroll in or withdraw from the Plan, speak with your financial advisor or call us at (800) 257-8787.
Board
Members & Officers (Unaudited)
The management of the Funds, including general supervision of the duties performed for the Funds by the Adviser, is the responsibility of the Board of Trustees of the Funds. The number of trustees of the Funds is currently set at eleven. None of the trustees who are not “interested” persons of the Funds (referred to herein as “independent trustees”) has ever been a director or employee of, or consultant to, Nuveen or its affiliates. The names and business addresses of the trustees and officers of the Funds, their principal occupations and other affiliations during the past five years, the number of portfolios each oversees and other directorships they hold are set forth below.
| | | | | | | | |
| | | | |
| | | | | | | | | |
Name,
Year of Birth
& Address | | Position(s) Held
with the Funds | | Year First
Elected or
Appointed
and Term(1) | | Principal
Occupation(s)
Including other
Directorships
During Past 5 Years | | Number
of Portfolios
in Fund Complex
Overseen by
Board Member |
| | | | |
| | | | | | | | | |
|
| Independent Board Members: |
| | | | |
n WILLIAM J. SCHNEIDER | | | | | | Chairman of Miller-Valentine Partners, a real estate investment company; formerly, Senior Partner and Chief Operating Officer (retired (2004) of Miller-Valentine Group; an owner in several other Miller Valentine entities; Board Member of Med-America Health System, and WDPR Public Radio station; formerly, member, Business Advisory Council, Cleveland Federal Reserve Bank and University of Dayton Business School Advisory Council | | |
1944 333 W. Wacker Drive Chicago, IL 60606 | | Chairman and Board Member | |
1996
Class III | | |
197 |
| | | | | | | |
| | | | |
n JACK B. EVANS | | | | | | President, The Hall-Perrine Foundation, a private philanthropic corporation (since 1996); Director and Chairman, United Fire Group, a publicly held company; formerly, President Pro-Tem of the Board of Regents for the State of Iowa University System; Director, Source Media Group; Life Trustee of Coe College; formerly, Director, Alliant Energy; formerly, Director, Federal Reserve Bank of Chicago; formerly, President and Chief Operating Officer, SCI Financial Group, Inc., a regional financial services firm. | | |
1948 333 W. Wacker Drive Chicago, IL 60606 | |
Board Member | |
1999
Class III | | |
197 |
| | | | | | | |
| | | | | | | |
| | | | |
n WILLIAM C. HUNTER | | | | | | Dean Emeritus, formerly, Dean, Tippie College of Business, University of Iowa (2006-2012); Director (since 2004) of Xerox Corporation; Director (since 2005), and past President (2010-2014) Beta Gamma Sigma, Inc., The International Business Honor Society; Director of Wellmark, Inc. (since 2009); formerly, Dean and Distinguished Professor of Finance, School of Business at the University of Connecticut (2003-2006); previously, Senior Vice President and Director of Research at the Federal Reserve Bank of Chicago (1995-2003); formerly, Director (1997-2007), Credit Research Center at Georgetown University. | | |
1948 333 W. Wacker Drive Chicago, IL 60606 | |
Board Member | |
2004
Class I | | |
197 |
| | | | | | | |
| | | | | | | |
| | | | | | | |
| | | | |
n DAVID J. KUNDERT | | | | | | Formerly, Director, Northwestern Mutual Wealth Management Company (2006-2013), retired (since 2004) as Chairman, JPMorgan Fleming Asset Management, President and CEO, Banc One Investment Advisors Corporation, and President, One Group Mutual Funds; prior thereto, Executive Vice President, Banc One Corporation and Chairman and CEO, Banc One Investment Management Group; Regent Emeritus, Member of Investment Committee, Luther College; member of the Wisconsin Bar Association; member of Board of Directors and Chair of Investment Committee, Greater Milwaukee Foundation; member of the Board of Directors (Milwaukee), College Possible | | |
1942 333 W. Wacker Drive Chicago, IL 60606 | |
Board Member | |
2005
Class II | | |
197 |
| | | | | | | |
| | | | | | | | |
| | | | |
| | | | | | | | | |
Name,
Year of Birth
& Address | | Position(s) Held
with the Funds | | Year First
Elected or
Appointed(1) | | Principal
Occupation(s)
During Past 5 Years | | Number
of Portfolios
in Fund Complex
Overseen by
Board Member |
| | | | |
| | | | | | | | | |
|
| Independent Board Members (continued): |
| | | | |
n JOHN K. NELSON | | | | | | Member of Board of Directors of Core12 LLC (since 2008), a private firm which develops branding, marketing and communications strategies for clients; Director of The Curran Center for Catholic American Studies (since 2009) and The President’s Council, Fordham University (since 2010); formerly, senior external advisor to the financial services practice of Deloitte Consulting LLP (2012- 2014): formerly, Chairman of the Board of Trustees of Marian University (2010 as trustee, 2011-2014 as Chairman); formerly, Chief Executive Officer of ABN AMRO N.V. North America, and Global Head of its Financial Markets Division (2007-2008); prior senior positions held at ABN AMRO include Corporate Executive Vice President and Head of Global Markets-the Americas (2006- 2007), CEO of Wholesale Banking North America and Global Head of Foreign Exchange and Futures Markets (2001-2006), and Regional Commercial Treasurer and Senior Vice President Trading – North America (1996-2001); formerly, Trustee at St. Edmund Preparatory School in New York City. | | |
1962 333 W. Wacker Drive Chicago, IL 60606 | |
Board Member | |
2013
Class II | | |
197 |
| | | | | | | |
| | | | |
n JUDITH M. STOCKDALE | | | | | | Board Member, Land Trust Alliance (since 2013) and U.S. Endowment for Forestry and Communities (since 2013); formerly, Executive Director (1994-2012), Gaylord and Dorothy Donnelley Foundation; prior thereto, Executive Director, Great Lakes Protection Fund (1990-1994). | | |
1947 333 W. Wacker Drive Chicago, IL 60606 | |
Board Member | |
1997
Class I | | |
197 |
| | | | |
n CAROLE E. STONE | | | | | | Director, Chicago Board Options Exchange, Inc. (since 2006); Director, C2 Options Exchange, Incorporated (since 2009); Director, CBOE Holdings, Inc. (since 2010); formerly, Commissioner, New York State Commission on Public Authority Reform (2005-2010). | | |
1947 333 W. Wacker Drive Chicago, IL 60606 | |
Board Member | |
2007
Class I | | |
197 |
| | | | |
n TERENCE J. TOTH | | | | | | Managing Partner, Promus Capital (since 2008); Director, Fulcrum IT Service LLC (since 2010), Quality Control Corporation (since 2012) and LogicMark LLC (since 2012); formerly, Director, Legal & General Investment Management America, Inc. (2008-2013); formerly, CEO and President, Northern Trust Global Investments (2004-2007): Executive Vice President, Quantitative Management & Securities Lending (2000-2004); prior thereto, various positions with Northern Trust Company (since 1994); member: Chicago Fellowship Board (since 2005), Catalyst Schools of Chicago Board (since 2008) and Mather Foundation Board (since 2012), and chair of its investment committee; formerly, Member, Northern Trust Mutual Funds Board (2005-2007), Northern Trust Global Investments Board (2004-2007), Northern Trust Japan Board (2004-2007), Northern Trust Securities Inc. Board (2003-2007) and Northern Trust Hong Kong Board (1997-2004). | | |
1959 333 W. Wacker Drive Chicago, IL 60606 | |
Board Member | |
2008
Class II | | |
197 |
| | | | | | | |
| | | | |
n MARGARET L. WOLFF | | | | | | Member of the Board of Directors (since 2013) of Travelers Insurance Company of Canada and The Dominion of Canada General Insurance Company (each, a part of Travelers Canada, the Canadian operation of The Travelers Companies, Inc.); formerly, Of Counsel, Skadden, Arps, Slate, Meagher & Flom LLP (Mergers & Acquisitions Group) (2005-2014); Member of the Board of Trustees of New York-Presbyterian Hospital (since 2005); Member (since 2004) and Chair (since 2015) of the Board of Trustees of The John A. Hartford Foundation (a philanthropy dedicated to improving the care of older adults); formerly, Member (2005-2015) and Vice Chair (2011-2015) of the Board of Trustees of Mt. Holyoke College. | | |
1955 333 W. Wacker Drive Chicago, IL 60606 | |
Board Member | |
2016
Class I | | |
197 |
| | | | | | | |
Board Members & Officers (continued)
| | | | | | | | |
| | | | |
| | | | | | | | | |
Name,
Year of Birth
& Address | | Position(s) Held
with the Funds | | Year First
Elected or
Appointed(1) | | Principal
Occupation(s)
Including other
Directorships
During Past 5 Years | | Number
of Portfolios
in Fund Complex
Overseen by
Board Member |
| | | | |
| | | | | | | | | |
|
| Interested Board Members: |
| | | | |
n WILLIAM ADAMS IV(2) | | | | | | Senior Executive Vice President, Global Structured Products (since 2010); formerly, Executive Vice President, U.S. Structured Products, of Nuveen Investments, Inc. (1999-2010); Co-President of Nuveen Fund Advisors, LLC (since 2011); Executive Vice President of Nuveen Securities, LLC; President (since 2011), formerly, Managing Director (2010-2011) of Nuveen Commodities Asset Management, LLC; Board Member of the Chicago Symphony Orchestra and of Gilda’s Club Chicago. | | |
1955 333 W. Wacker Drive Chicago, IL 60606 | |
Board Member | |
2013
Class II | | |
197 |
| | | | | | | |
| | | | |
n THOMAS S. SCHREIER, JR.(2) | | | | | | Vice Chairman, Wealth Management of Nuveen Investments, Inc. (since 2011); Co-President of Nuveen Fund Advisors, LLC; Chairman of Nuveen Asset Management, LLC (since 2011); Co-Chief Executive Officer of Nuveen Securities, LLC (since 2011); Member of Board of Governors and Chairman’s Council of the Investment Company Institute; Director of Allina Health and a member of its Finance, Audit and Investment Committees: formerly, Chief Executive Officer (2000-2010) and Chief Investment Officer (2007-2010) of FAF Advisors, Inc.; formerly, President of First American Funds (2001-2010). | | |
1962 333 W. Wacker Drive Chicago, IL 60606 | |
Board Member | |
2013
Class III | | |
197 |
| | | | | | | |
| | | | |
| | | | | | | | | |
Name,
Year of Birth
& Address | | Position(s) Held
with the Funds | | Year First
Elected or
Appointed(3) | | Principal
Occupation(s)
During Past 5 Years | | Number
of Portfolios
in Fund Complex
Overseen by Officer |
| | | | |
| | | | | | | | | |
|
| Officers of the Funds: |
| | | | |
n GIFFORD R. ZIMMERMAN | | | | | | Managing Director (since 2002), and Assistant Secretary of Nuveen Securities, LLC; Managing Director (since 2004) and Assistant Secretary (since 1994) of Nuveen Investments, Inc.; Managing Director (since 2002), Assistant Secretary (since 1997) and Co-General Counsel (since 2011) of Nuveen Fund Advisors, LLC; Managing Director, Assistant Secretary and Associate General Counsel of Nuveen Asset Management, LLC (since 2011); Managing Director and Assistant Secretary of Symphony Asset Management LLC (since 2003); Vice President and Assistant Secretary of NWQ Investment Management Company, LLC (since 2002), Nuveen Investments Advisers Inc. (since 2002), Santa Barbara Asset Management, LLC (since 2006), and of Winslow Capital Management, LLC, (since 2010); Vice President and Assistant Secretary (since 2013), formerly, Chief Administrative Officer and Chief Compliance Officer (2006-2013) of Nuveen Commodities Asset Management, LLC; Chartered Financial Analyst. | | |
1956 333 W. Wacker Drive Chicago, IL 60606 | | Chief Administrative Officer | |
1988 | | |
198 |
| | | | | | | |
| | | | |
n CEDRIC H. ANTOSIEWICZ | | | | | | Managing Director of Nuveen Securities, LLC. (since 2004); Managing Director of Nuveen Fund Advisors, LLC (since 2014). | | |
1962 333 W. Wacker Drive Chicago, IL 60606 | |
Vice President | |
2007 | | |
90 |
| | | | |
n MARGO L. COOK | | | | | | Senior Executive Vice President of Nuveen Investments, Inc.; Executive Vice President, Investment Services of Nuveen Fund Advisors, LLC (since 2011); Managing Director – Investment Services of Nuveen Commodities Asset Management, LLC (since 2011); Co-Chief Executive Officer (since 2015); previously, Executive Vice President (2013-2015) of Nuveen Securities, LLC; Chartered Financial Analyst. | | |
1964 333 W. Wacker Drive Chicago, IL 60606 | |
Vice President | |
2009 | | |
198 |
| | | | | | | |
| | | | | | | | |
| | | | |
| | | | | | | | | |
Name,
Year of Birth
& Address | | Position(s) Held
with the Funds | | Year First
Elected or
Appointed(3) | | Principal
Occupation(s)
During Past 5 Years | | Number
of Portfolios
in Fund Complex
Overseen by Officer |
| | | | |
| | | | | | | | | |
|
| Officers of the Funds (continued): |
| | | | |
n LORNA C. FERGUSON | | | | | | Managing Director (since 2004) of Nuveen Investments Holdings, Inc. | | |
1945 333 W. Wacker Drive Chicago, IL 60606 | |
Vice President | |
1998 | | |
198 |
| | | | |
n STEPHEN D. FOY | | | | | | Managing Director (since 2014), formerly, Senior Vice President (2013-2014) and Vice President (2005-2013) of Nuveen Fund Advisors, LLC; Chief Financial Officer of Nuveen Commodities Asset Management, LLC (since 2010); Certified Public Accountant. | | |
1954 333 W. Wacker Drive Chicago, IL 60606 | | Vice President
and Controller | |
1998 | | |
198 |
| | | | |
n SHERRI A. HLAVACEK | | | | | | Executive Vice President (since May 2015, formerly, Managing Director) and Controller of Nuveen Fund Advisors, LLC; Managing Director and Controller of Nuveen Commodities Asset Management, LLC; Executive Vice President (since May 2015, formerly, Managing Director), Treasurer and Controller of Nuveen Asset Management, LLC; Executive Vice President, Principal Financial Officer (since July 2015, formerly, Managing Director), Treasurer and Corporate Controller of Nuveen Investments, Inc.; Executive Vice President (since May 2015, formerly, Managing Director), Treasurer and Corporate Controller of Nuveen Investments Advisers Inc. and Nuveen Investments Holdings, Inc.; Managing Director, Chief Financial Officer and Corporate Controller of Nuveen Securities, LLC; Vice President, Controller and Treasurer of NWQ Investment Management Company, LLC; Vice President and Controller of Santa Barbara Asset Management, LLC, Tradewinds Global Investors, LLC, Symphony Asset Management LLC and Winslow Capital Management, LLC; Certified Public Accountant. | | |
1962 333 W. Wacker Drive Chicago, IL 60606 | | Vice President
and Treasurer | |
2015 | | |
198 |
| | | | | | | |
| | | | |
n WALTER M. KELLY | | | | | | Senior Vice President (since 2008) of Nuveen Investment Holdings, Inc. | | |
1970 333 W. Wacker Drive Chicago, IL 60606 | | Chief Compliance Officer and Vice President | |
2003 | | |
198 |
| | | | |
n TINA M. LAZAR | | | | | | Senior Vice President of Nuveen Investments Holdings, Inc. and Nuveen Securities, LLC. | | |
1961 333 W. Wacker Drive Chicago, IL 60606 | |
Vice President | |
2002 | | |
198 |
| | | | |
n KEVIN J. MCCARTHY | | | | | | Managing Director and Assistant Secretary (since 2008), Nuveen Securities, LLC; Managing Director (since 2008), Assistant Secretary since 2007) and Co-General Counsel (since 2011) of Nuveen Fund Advisors, LLC; Managing Director, Assistant Secretary and Associate General Counsel (since 2011) of Nuveen Asset Management, LLC; Managing Director and Assistant Secretary, Nuveen Investments, Inc.; Vice President (since 2007) and Assistant Secretary of Nuveen Investments Advisers Inc., NWQ Investment Management Company, LLC, Symphony Asset Management LLC, Santa Barbara Asset Management, LLC, and of Winslow Capital Management, LLC. (since 2010); Vice President and Secretary (since 2010) of Nuveen Commodities Asset Management, LLC. | | |
1966 333 W. Wacker Drive Chicago, IL 60606 | | Vice President
and Secretary | |
2007 | | |
198 |
| | | | | | | |
| | | | |
n KATHLEEN L. PRUDHOMME | | | | | | Managing Director, Assistant Secretary and Co-General Counsel (since 2011) of Nuveen Fund Advisors, LLC; Managing Director, Assistant Secretary and Associate General Counsel (since 2011) of Nuveen Asset Management, LLC; Managing Director and Assistant Secretary (since 2011) of Nuveen Securities, LLC; formerly, Deputy General Counsel, FAF Advisors, Inc. (2004-2010). | | |
1953 901 Marquette Avenue Minneapolis, MN 55402 | | Vice President
and Assistant
Secretary | |
2011 | | |
198 |
| | | | | | | |
Board Members & Officers (continued)
| | | | | | | | |
| | | | |
| | | | | | | | | |
Name,
Year of Birth
& Address | | Position(s) Held
with the Funds | | Year First
Elected or
Appointed(3) | | Principal
Occupation(s)
During Past 5 Years | | Number
of Portfolios
in Fund Complex
Overseen by Officer |
| | | | |
| | | | | | | | | |
|
| Officers of the Funds (continued): |
| | | | |
n JOEL T. SLAGER | | | | | | Fund Tax Director for Nuveen Funds (since 2013); previously, Vice President of Morgan Stanley Investment Management, Inc., Assistant Treasurer of the Morgan Stanley Funds (from 2010 to 2013). | | |
1978 333 W. Wacker Drive Chicago, IL 60606 | | Vice President and Assistant Secretary | |
2013 | | |
198 |
| (1) | The Board Members serve three year terms. The Board of Trustees is divided into three classes. Class I, Class II, and Class III, with each being elected to serve until the third succeeding annual shareholders’ meeting subsequent to its election or thereafter in each case when its respective successors are duly elected or appointed. The first year elected or appointed represents the year in which the board member was first elected or appointed to any fund in the Nuveen Complex. |
| (2) | “Interested person” as defined in the 1940 Act, by reason of his position with Nuveen Investments, Inc. and certain of its subsidiaries, which are affiliates of the Nuveen Funds. |
| (3) | Officers serve one year terms through August of each year. The year first elected or appointed represents the year in which the Officer was first elected or appointed to any fund in the Nuveen Complex. |
Notes
Notes
Notes
| | | | | | | | | | | | | | |
| | | | | | | | |
| | | | |
| | | | | | | | |
| | | | | | | | |
| | |
| | Nuveen Investments: | | |
| | | | Serving Investors for Generations | | |
| | |
| | | | |
| | | | Since 1898, financial advisors and their clients have relied on Nuveen Investments to provide dependable investment solutions through continued adherence to proven, long-term investing principles. Today, we offer a range of high quality equity and fixed-income solutions designed to be integral components of a well-diversified core portfolio. | | |
| | | |
| | | | | | |
| | | | | | Focused on meeting investor needs. Nuveen Investments provides high-quality investment services designed to help secure the long-term goals of institutional and individual investors as well as the consultants and financial advisors who serve them. Nuveen Investments markets a wide range of specialized investment solutions which provide investors access to capabilities of its high-quality boutique investment affiliates – Nuveen Asset Management, Symphony Asset Management, NWQ Investment Management Company, Santa Barbara Asset Management, Tradewinds Global Investors, Winslow Capital Management and Gresham Investment Management. In total, Nuveen Investments managed approximately $225 billion as of December 31, 2015. | | |
| | | | |
| | | | | | | | |
| | | | | | Find out how we can help you. To learn more about how the products and services of Nuveen Investments may be able to help you meet your financial goals, talk to your financial advisor, or call us at (800) 257-8787. Please read the information provided carefully before you invest. Investors should consider the investment objective and policies, risk considerations, charges and expenses of any investment carefully. Where applicable, be sure to obtain a prospectus, which contains this and other relevant information. To obtain a prospectus, please contact your securities representative or Nuveen Investments, 333 W. Wacker Dr., Chicago, IL 6o6o6. Please read the prospectus carefully before you invest or send money. Learn more about Nuveen Funds at: www.nuveen.com/cef | | |
| | | | | | |
| | | | | | | | | | | | |
Distributed by Nuveen Securities, LLC | 333 West Wacker Drive | Chicago, IL 60606 | www.nuveen.com/cef
EAN-D-1215D 14102-INV-Y-02/17
ITEM 2. CODE OF ETHICS.
As of the end of the period covered by this report, the registrant has adopted a code of ethics that applies to the registrant’s principal executive officer, principal financial officer, principal accounting officer or controller, or persons performing similar functions. There were no amendments to or waivers from the Code during the period covered by this report. The registrant has posted the code of ethics on its website at www.nuveen.com/CEF/Shareholder/FundGovernance.aspx. (To view the code, click on Code of Conduct.)
ITEM 3. AUDIT COMMITTEE FINANCIAL EXPERT.
The registrant’s Board of Directors or Trustees (“Board”) determined that the registrant has at least one “audit committee financial expert” (as defined in Item 3 of Form N-CSR) serving on its Audit Committee. The registrant’s audit committee financial experts are Carole E. Stone and Jack B. Evans, who are “independent” for purposes of Item 3 of Form N-CSR.
Ms. Stone served for five years as Director of the New York State Division of the Budget. As part of her role as Director, Ms. Stone was actively involved in overseeing the development of the State’s operating, local assistance and capital budgets, its financial plan and related documents; overseeing the development of the State’s bond-related disclosure documents and certifying that they fairly presented the State’s financial position; reviewing audits of various State and local agencies and programs; and coordinating the State’s system of internal audit and control. Prior to serving as Director, Ms. Stone worked as a budget analyst/examiner with increasing levels of responsibility over a 30 year period, including approximately five years as Deputy Budget Director. Ms. Stone has also served as Chair of the New York State Racing Association Oversight Board, as Chair of the Public Authorities Control Board, as a Commissioner on the New York State Commission on Public Authority Reform and as a member of the Boards of Directors of several New York State public authorities. These positions have involved overseeing operations and finances of certain entities and assessing the adequacy of project/entity financing and financial reporting. Currently, Ms. Stone is on the Board of Directors of CBOE Holdings, Inc., of the Chicago Board Options Exchange, and of C2 Options Exchange. Ms. Stone’s position on the boards of these entities and as a member of both CBOE Holdings’ Audit Committee and its Finance Committee has involved, among other things, the oversight of audits, audit plans and preparation of financial statements.
Mr. Evans was formerly President and Chief Operating Officer of SCI Financial Group, Inc., a full service registered broker-dealer and registered investment adviser (“SCI”). As part of his role as President and Chief Operating Officer, Mr. Evans actively supervised the Chief Financial Officer (the “CFO”) and actively supervised the CFO’s preparation of financial statements and other filings with various regulatory authorities. In such capacity, Mr. Evans was actively involved in the preparation of SCI’s financial statements and the resolution of issues raised in connection therewith. Mr. Evans has also served on the audit committee of various reporting companies. At such companies, Mr. Evans was involved in the oversight of audits, audit plans, and the preparation of financial statements. Mr. Evans also formerly chaired the audit committee of the Federal Reserve Bank of Chicago.
ITEM 4. PRINCIPAL ACCOUNTANT FEES AND SERVICES.
NUVEEN DOW 30SM DYNAMIC OVERWRITE FUND
The following tables show the amount of fees that PricewaterhouseCoopers LLP, the Fund’s auditor, billed to the Fund during the Fund’s last two full fiscal years. For engagements with PricewaterhouseCoopers LLP the Audit Committee approved in advance all audit services and non-audit services that PricewaterhouseCoopers LLP provided to the Fund, except for those non-audit services that were subject to the pre-approval exception under Rule 2-01 of Regulation S-X (the “pre-approval exception”). The pre-approval exception for services provided directly to the Fund waives the pre-approval requirement for services other than audit, review or attest services if: (A) the aggregate amount of all such services provided constitutes no more than 5% of the total amount of revenues paid by the Fund to its accountant during the fiscal year in which the services are provided; (B) the Fund did not recognize the services as non-audit services at the time of the engagement; and (C) the services are promptly brought to the Audit Committee’s attention, and the Committee (or its delegate) approves the services before the audit is completed.
The Audit Committee has delegated certain pre-approval responsibilities to its Chairman (or, in his absence, any other member of the Audit Committee).
SERVICES THAT THE FUND’S AUDITOR BILLED TO THE FUND
| | | | | | | | | | | | |
Fiscal Year Ended | | Audit Fees Billed
to Fund 1 | | | Audit-Related Fees
Billed to Fund 2 | | | Tax Fees
Billed to Fund 3 | |
December 31, 2015 | | $ | 32,714 | | | $ | 7,265 | | | $ | 5,360 | |
| | | | | | | | | | | | |
| | | | | | | | | | | | |
Percentage approved pursuant to pre-approval exception | | | 0 | % | | | 0 | % | | | 0 | % |
| | | | | | | | | | | | |
| | | | | | | | | | | | |
December 31, 2014 | | $ | 31,918 | 5 | | $ | 5,000 | | | $ | 810 | |
| | | | | | | | | | | | |
| | | | | | | | | | | | |
Percentage approved pursuant to pre-approval exception | | | 0 | % | | | 0 | % | | | 0 | % |
| | | | | | | | | | | | |
1 “Audit Fees” are the aggregate fees billed for professional services for the audit of the Fund’s annual financial statements and services provided in connection with statutory and regulatory filings or engagements.
2 “Audit Related Fees” are the aggregate fees billed for assurance and related services reasonably related to the performance of the audit or review of financial statements that are not reported under “Audit Fees”. These fees include offerings related to the Fund’s common shares and leverage.
3 “Tax Fees” are the aggregate fees billed for professional services for tax advice, tax compliance, and tax planning. These fees include: all global withholding tax services; excise and state tax reviews; capital gain, tax equalization and taxable basis calculation performed by the principal accountant.
4 “All Other Fees” are the aggregate fees billed for products and services other than “Audit Fees”, “Audit-Related Fees” and “Tax Fees”. These fees represent all “Agreed-Upon Procedures” engagements pertaining to the Fund’s use of leverage.
5 Fee was restated because an additional charge of $1,500 was incorrectly categorized under “Audit Fees Billed to Fund” on the 2014 N-CSR report. The additional fee is now reported under the 2015 “Audit Related Fees Billed to Fund” as the invoice was paid during the 2015 Fiscal Year.
SERVICES THAT THE FUND’S AUDITOR BILLED TO THE
ADVISER AND AFFILIATED FUND SERVICE PROVIDERS
The following tables show the amount of fees billed by PricewaterhouseCoopers LLP to Nuveen Fund Advisors, LLC (formerly Nuveen Fund Advisors, Inc.) (the “Adviser”), and any entity controlling, controlled by or under common control with the Adviser that provides ongoing services to the Fund (“Affiliated Fund Service Provider”), for engagements directly related to the Fund’s operations and financial reporting, during the Fund’s last two full fiscal years.
The tables also show the percentage of fees subject to the pre-approval exception. The pre-approval exception for services provided to the Adviser and any Affiliated Fund Service Provider (other than audit, review or attest services) waives the pre-approval requirement if: (A) the aggregate amount of all such services provided constitutes no more than 5% of the total amount of revenues paid to PricewaterhouseCoopers LLP by the Fund, the Adviser and Affiliated Fund Service Providers during the fiscal year in which the services are provided that would have to be pre-approved by the Audit Committee; (B) the Fund did not recognize the services as non-audit services at the time of the engagement; and (C) the services are promptly brought to the Audit Committee’s attention, and the Committee (or its delegate) approves the services before the Fund’s audit is completed.
| | | | | | | | | | | | |
Fiscal Year Ended | | Audit-Related Fees
Billed to Adviser and
Affiliated Fund
Service Providers | | | Tax Fees Billed to
Adviser and
Affiliated Fund
Service Providers | | | All Other Fees
Billed to Adviser
and Affiliated Fund
Service Providers | |
December 31, 2015 | | $ | 0 | | | $ | 0 | | | $ | 0 | |
| | | | | | | | | | | | |
| | | | | | | | | | | | |
Percentage approved pursuant to pre-approval exception | | | 0 | % | | | 0 | % | | | 0 | % |
| | | | | | | | | | | | |
| | | | | | | | | | | | |
December 31, 2014 | | $ | 0 | | | $ | 0 | | | $ | 0 | |
| | | | | | | | | | | | |
| | | | | | | | | | | | |
Percentage approved pursuant to pre-approval exception | | | 0 | % | | | 0 | % | | | 0 | % |
| | | | | | | | | | | | |
NON-AUDIT SERVICES
The following table shows the amount of fees that PricewaterhouseCoopers LLP billed during the Fund’s last two full fiscal years for non-audit services. The Audit Committee is required to pre-approve non-audit services that PricewaterhouseCoopers LLP provides to the Adviser and any Affiliated Fund Services Provider, if the engagement related directly to the Fund’s operations and financial reporting (except for those subject to the pre-approval exception described above). The Audit Committee requested and received information from PricewaterhouseCoopers LLP about any non-audit services that PricewaterhouseCoopers LLP rendered during the Fund’s last fiscal year to the Adviser and any Affiliated Fund Service Provider. The Committee considered this information in evaluating PricewaterhouseCoopers LLP’s independence.
| | | | | | | | | | | | |
Fiscal Year Ended | | Total Non-Audit Fees
Billed to Fund | | | Total Non-Audit Fees
billed to Adviser and
Affiliated Fund Service
Providers (engagements
related directly to the
operations and financial
reporting of the Fund) | | | Total Non-Audit Fees
billed to Adviser and
Affiliated Fund Service
Providers (all other
engagements) | |
December 31 , 2015 | | $ | 5,360 | | | $ | 0 | | | $ | 0 | |
December 31 , 2014 | | $ | 811 | | | $ | 0 | | | $ | 0 | |
“Non-Audit Fees billed to Fund” for both fiscal year ends represent “Tax Fees” and “All Other Fees” billed to Fund in their respective amounts from the previous table.
Less than 50 percent of the hours expended on the principal accountant’s engagement to audit the registrant’s financial statements for the most recent fiscal year were attributed to work performed by persons other than the principal accountant’s full-time, permanent employees.
Audit Committee Pre-Approval Policies and Procedures. Generally, the Audit Committee must approve (i) all non-audit services to be performed for the Fund by the Fund’s independent accountants and (ii) all audit and non-audit services to be performed by the Fund’s independent accountants for the Affiliated Fund Service Providers with respect to operations and financial reporting of the Fund Regarding tax and research projects conducted by the independent accountants for the Fund and Affiliated Fund Service Providers (with respect to operations and financial reports of the Fund) such engagements will be (i) pre-approved by the Audit Committee if they are expected to be for amounts greater than $10,000; (ii) reported to the Audit Committee chairman for his verbal approval prior to engagement if they are expected to be for amounts under $10,000 but greater than $5,000; and (iii) reported to the Audit Committee at the next Audit Committee meeting if they are expected to be for an amount under $5,000.
ITEM 5. AUDIT COMMITTEE OF LISTED REGISTRANTS.
The registrant’s Board has a separately designated Audit Committee established in accordance with Section 3(a)(58)(A) of the Securities Exchange Act of 1934, as amended (15 U.S.C. 78c(a)(58)(A)). The members of the audit committee are Jack B. Evans, David J. Kundert, John K. Nelson, Carole E. Stone and Terence J. Toth.
ITEM 6. SCHEDULE OF INVESTMENTS.
(a) See Portfolio of Investments in Item 1.
(b) Not applicable.
ITEM 7. DISCLOSURE OF PROXY VOTING POLICIES AND PROCEDURES FOR CLOSED-END MANAGEMENT INVESTMENT COMPANIES.
Nuveen Fund Advisors, LLC is the registrant’s investment adviser (also referred to as the “Adviser”). The Adviser is responsible for the on-going monitoring of the Fund’s investment portfolio, managing the Fund’s business affairs and providing certain clerical, bookkeeping and administrative services. The Adviser has engaged Nuveen Asset Management, LLC (“Sub-Adviser”) as Sub-Adviser to provide discretionary investment advisory services. As part of these services, the Adviser has delegated to the Sub-Adviser the full responsibility for proxy voting on securities held in the registrant’s portfolio and related duties in accordance with the Sub-Adviser’s policies and procedures. The Adviser periodically monitors the Sub-Adviser’s voting to ensure that it is carrying out its duties. The Sub-Adviser’s proxy voting policies and procedures are attached to this filing as an exhibit and incorporated herein by reference.
ITEM 8. PORTFOLIO MANAGERS OF CLOSED-END MANAGEMENT INVESTMENT COMPANIES.
Nuveen Fund Advisors, LLC (“NFALLC”) is the registrant’s investment adviser (NFALLC is also referred to as the “Adviser”). NFALLC is responsible for the selection and on-going monitoring of the Fund’s investment portfolio, managing the Fund’s business affairs and providing certain clerical, bookkeeping and administrative services. The Adviser has engaged Nuveen Asset Management, LLC (“Nuveen Asset Management” or “Sub-Adviser”), as Sub-Adviser to provide discretionary investment advisory services. The following section provides information on the portfolio managers at the Sub-Adviser:
Nuveen Asset Management
Item 8(a)(1). PORTFOLIO MANAGER BIOGRAPHIES
Mr. Hembre, Managing Director of Nuveen Asset Management, entered the financial services industry in 1992. He joined Nuveen Asset Management, LLC in January 2011 following the firm’s acquisition of a portion of the asset management business of FAF Advisors, Inc. (“FAF Advisors”) and currently serves as Nuveen Asset Management’s Chief Economist and Chief Investment Strategist. Mr. Hembre previously served in various positions with FAF Advisors since 1997 where he headed the team that managed the firm’s asset allocation, international equity, quantitative equity, and index products and most recently also served as Chief Economist and Chief Investment Strategist.
Mr. Friar, Senior Vice President and Portfolio Manager of Nuveen Asset Management since January 2011, entered the financial services industry in 1998. He joined Nuveen Asset Management in January 2011 following the firm’s acquisition of a portion of the asset management business of FAF Advisors. Mr. Friar previously served in various positions with FAF Advisors since 1999 where he served as a member of FAF’s Performance Measurement group.
Item 8(a)(2). OTHER ACCOUNTS MANAGED BY PORTFOLIO MANAGERS
In addition to the Fund, as of December 31, 2015, the portfolio managers are also primarily responsible for the day-to-day portfolio management of the following accounts:
| | | | | | | | | | | | | | | | | | | | | | | | | | | | | | | | | | | | |
| | | | | | (ii) Number of Other Accounts Managed and Assets by Account Type | | | (iii) Number of Other Accounts and
Assets for Which Advisory Fee is
Performance-Based | |
(i) Name of Portfolio Manager | | Other
Registered
Investment
Companies | | | Other
Pooled
Investment
Vehicles | | | Other
Accounts | | | Other
Registered
Investment
Companies | | | Other
Pooled
Investment
Vehicles | | | Other
Accounts | |
Keith Hembre | | | 10 | | | $ | 2.27 billion | | | | 0 | | | $ | 0 | | | | 5 | | | $ | 47.3 million | | | | N/A | | | | N/A | | | | N/A | |
David Friar | | | 9 | | | $ | 3.12 billion | | | | 0 | | | $ | 0 | | | | 8 | | | $ | 471 million | | | | N/A | | | | N/A | | | | N/A | |
| | | | | | | | | | | | | | | | | | | 1 | * | | $ | 285 million | | | | | | | | | | | | | |
| * | Other Accounts-overlay strategies – The portfolio manager is responsible for the management of overlay strategies employed by this account that use derivative instruments either to obtain, offset or substitute for certain portfolio exposures beyond those provided by the account’s underlying portfolios. |
POTENTIAL MATERIAL CONFLICTS OF INTEREST
Actual or apparent conflicts of interest may arise when a portfolio manager has day-to-day management responsibilities with respect to more than one account. More specifically, portfolio managers who manage multiple accounts are presented a number of potential conflicts, including, among others, those discussed below.
The management of multiple accounts may result in a portfolio manager devoting unequal time and attention to the management of each account. Nuveen Asset Management seeks to manage such competing interests for the time and attention of portfolio managers by having portfolio managers focus on a particular investment discipline. Most accounts managed by a portfolio manager in a particular investment strategy are managed using the same investment models.
If a portfolio manager identifies a limited investment opportunity which may be suitable for more than one account, an account may not be able to take full advantage of that opportunity due to an allocation of filled purchase or sale orders across all eligible accounts. To deal with these situations, Nuveen Asset Management has adopted procedures for allocating limited opportunities across multiple accounts.
With respect to many of its clients’ accounts, Nuveen Asset Management determines which broker to use to execute transaction orders, consistent with its duty to seek best execution of the transaction. However, with respect to certain other accounts, Nuveen Asset Management may be limited by the client with respect to the selection of brokers or may be instructed to direct trades through a particular broker. In these cases, Nuveen Asset Management may place separate, non-simultaneous, transactions for a Fund and other accounts which may temporarily affect the market price of the security or the execution of the transaction, or both, to the detriment of the Fund or the other accounts.
Some clients are subject to different regulations. As a consequence of this difference in regulatory requirements, some clients may not be permitted to engage in all the investment techniques or transactions or to engage in these transactions to the same extent as the other accounts managed by the portfolio manager. Finally, the appearance of a conflict of interest may arise where Nuveen Asset Management has an incentive, such as a performance-based management fee, which relates to the management of some accounts, with respect to which a portfolio manager has day-to-day management responsibilities.
Nuveen Asset Management has adopted certain compliance procedures which are designed to address these types of conflicts common among investment managers. However, there is no guarantee that such procedures will detect each and every situation in which a conflict arises.
Item 8(a)(3). FUND MANAGER COMPENSATION
Portfolio manager compensation consists primarily of base pay, an annual cash bonus and long term incentive payments.
Base pay. Base pay is determined based upon an analysis of the portfolio manager’s general performance, experience, and market levels of base pay for such position.
Annual cash bonus. The Fund’s portfolio managers are eligible for an annual cash bonus based on investment performance, qualitative evaluation and financial performance of Nuveen Asset Management.
A portion of each portfolio manager’s annual cash bonus is based on the Fund’s pre-tax investment performance, generally measured over the past one- and three or five-year periods unless the portfolio manager’s tenure is shorter. Investment performance for the Fund generally is determined by evaluating the Fund’s performance relative to its benchmark(s) and/or Lipper industry peer group.
A portion of the cash bonus is based on a qualitative evaluation made by each portfolio manager’s supervisor taking into consideration a number of factors, including the portfolio manager’s team collaboration, expense management, support of personnel responsible for asset growth, and his or her compliance with Nuveen Asset Management’s policies and procedures.
The final factor influencing a portfolio manager’s cash bonus is the financial performance of Nuveen Asset Management based on its operating earnings.
Long-term incentive compensation. Certain key employees of Nuveen Investments and its affiliates, including certain portfolio managers, participate in a Long-Term Performance Plan designed to provide compensation opportunities that links a portion of each participant’s compensation to Nuveen Investments’ financial and operational performance. In addition, certain key employees of Nuveen Asset Management, including certain portfolio managers, have received profits interests in Nuveen Asset Management which entitle their holders to participate in the firm’s growth over time.
There are generally no differences between the methods used to determine compensation with respect to the Fund and the Other Accounts shown in the table above.
Item 8(a)(4). OWNERSHIP OF DIAX SECURITIES AS OF DECEMBER 31, 2015
| | | | | | | | | | | | | | | | |
Name of Portfolio Manager | | None | | | $1 -
$10,000 | | $10,001-
$50,000 | | $50,001-
$100,000 | | $100,001-
$500,000 | | $500,001-
$1,000,000 | | Over
$1,000,000 |
Keith Hembre | | | X | | | | | | | | | | | | | |
David Friar | | | X | | | | | | | | | | | | | |
ITEM 9. PURCHASES OF EQUITY SECURITIES BY CLOSED-END MANAGEMENT INVESTMENT COMPANY AND AFFILIATED PURCHASERS.
Not applicable.
ITEM 10. SUBMISSION OF MATTERS TO A VOTE OF SECURITY HOLDERS.
There have been no material changes to the procedures by which shareholders may recommend nominees to the registrant’s Board implemented after the registrant last provided disclosure in response to this Item.
ITEM 11. CONTROLS AND PROCEDURES.
| | (a) | The registrant’s principal executive and principal financial officers, or persons performing similar functions, have concluded that the registrant’s disclosure controls and procedures (as defined in Rule 30a-3(c) under the Investment Company Act of 1940, as amended (the “1940 Act”) (17 CFR 270.30a-3(c))) are effective, as of a date within 90 days of the filing date of this report that includes the disclosure required by this paragraph, based on their evaluation of the controls and procedures required by Rule 30a-3(b) under the 1940 Act (17 CFR 270.30a-3(b)) and Rules 13a-15(b) or 15d-15 (b) under the Securities Exchange Act of 1934, as amended (the “Exchange Act”) (17 CFR 240.13a-15(b) or 240.15d-15 (b)). |
| | (b) | There were no changes in the registrant’s internal control over financial reporting (as defined in Rule 30a-3(d) under the 1940 Act (17 CFR 270.30a-3(d)) that occurred during the second fiscal quarter of the period covered by this report that has materially affected, or is reasonably likely to materially affect, the registrant’s internal control over financial reporting. |
ITEM 12. EXHIBITS.
File the exhibits listed below as part of this Form.
(a)(1) Any code of ethics, or amendment thereto, that is the subject of the disclosure required by Item 2, to the extent that the registrant intends to satisfy the Item 2 requirements through filing of an exhibit: Not applicable because the code is posted on registrant’s website at www.nuveen.com/CEF/Shareholder/FundGovernance.aspx and there were no amendments during the period covered by this report. (To view the code, click on Code of Conduct.)
(a)(2) A separate certification for each principal executive officer and principal financial officer of the registrant as required by Rule 30a-2(a) under the 1940 Act (17 CFR 270.30a-2(a)) in the exact form set forth below: Ex-99.CERT Attached hereto.
(a)(3) Any written solicitation to purchase securities under Rule 23c-1 under the 1940 Act (17 CFR 270.23c-1) sent or given during the period covered by the report by or on behalf of the registrant to 10 or more persons. Not applicable.
(b) If the report is filed under Section 13(a) or 15(d) of the Exchange Act, provide the certifications required by Rule 30a-2(b) under the 1940 Act (17 CFR 270.30a-2(b)); Rule 13a-14(b) or Rule 15d-14(b) under the Exchange Act (17 CFR 240.13a-14(b) or 240.15d-14(b)), and Section 1350 of Chapter 63 of Title 18 of the United States Code (18 U.S.C. 1350) as an exhibit. A certification furnished pursuant to this paragraph will not be deemed “filed” for purposes of Section 18 of the Exchange Act (15 U.S.C. 78r), or otherwise subject to the liability of that section. Such certification will not be deemed to be incorporated by reference into any filing under the Securities Act of 1933 or the Exchange Act, except to the extent that the registrant specifically incorporates it by reference. Ex-99.906 CERT attached hereto.
SIGNATURES
Pursuant to the requirements of the Securities Exchange Act of 1934 and the Investment Company Act of 1940, the registrant has duly caused this report to be signed on its behalf by the undersigned, thereunto duly authorized.
(Registrant) Nuveen Dow 30SM Dynamic Overwrite Fund
| | | | |
| By (Signature and Title) | | /s/ Kevin J. McCarthy | | |
| | Kevin J. McCarthy | | |
| | Vice President and Secretary | | |
| |
| Date: March 9, 2016 | | |
Pursuant to the requirements of the Securities Exchange Act of 1934 and the Investment Company Act of 1940, this report has been signed below by the following persons on behalf of the registrant and in the capacities and on the dates indicated.
| | | | |
| By (Signature and Title) | | /s/ Gifford R. Zimmerman | | |
| | Gifford R. Zimmerman | | |
| | Chief Administrative Officer | | |
| | (principal executive officer) | | |
| |
| Date: March 9, 2016 | | |
| | |
| By (Signature and Title) | | /s/ Stephen D. Foy | | |
| | Stephen D. Foy | | |
| | Vice President and Controller | | |
| | (principal financial officer) | | |
| |
| Date: March 9, 2016 | | |