2021 Annual Meeting of Shareholders Presentation NASDAQ: PBHC June 4, 2021 Chris R. Burritt Thomas W. “Tom” Schneider Walter F. Rusnak Chairman of the Board President, CEO & Director Senior VP & CFO 1

Welcoming Remarks Chris R. Burritt Chairman of the Board 2
Forward Looking Statements This presentation may contain the words or phrases “will likely result”, “are expected to”, “will continue”, “is anticipated”, “estimate”, ”project” or similar expressions that are intended to identify “forward-looking statements” within the meaning of the Private Securities Litigation Reform Act of 1995. Such statements are subject to certain risks and uncertainties. By identifying these forward-looking statements for you in this manner, the Company is alerting you to the possibility that its actual results and financial condition may differ, possibly materially, from the anticipated results and financial condition indicated in these forward-looking statements. Important factors that could cause the Company’s actual results and financial condition to differ from those indicated in the forward-looking statements include, among others: The effects of the COVID-19 Pandemic on our financial condition and results of operations; Credit quality and the effect of credit quality on the adequacy of our allowance for loan losses; Deterioration in financial markets that may result in impairment charges relating to our securities portfolio; Competition in our primary market areas; The impact of significant government regulations, legislation and potential changes thereto; A reduction in our ability to generate or originate revenue-producing assets as a result of compliance with heightened capital standards; Increased cost of operations due to greater regulatory oversight, supervision and examination of banks and bank holding companies, and higher deposit insurance premiums; The limitation on our ability to expand consumer product and service offerings due to anticipated stricter consumer protection laws and regulations; and Other risks described herein and in the other reports and statements we file with the SEC. These risks and uncertainties should be considered in evaluating forward-looking statements. The Company wishes to caution readers not to place undue reliance on any such forward-looking statements. The Company wishes to advise readers that the factors listed above could affect the Company’s financial performance and could cause the Company’s actual results for future periods to differ materially from any opinions or statements expressed with respect to future periods in any current statements. Additionally, all statements in this document, including forward-looking statements, speak only as of the date they are made, and the Company undertakes no obligation to update any statement in light of new information or future events. Note: The following presentation includes certain financial measures that are not calculated according to Generally Accepted Accounting Standards (GAAP) promulgated in the United States. These measures are reconciled to promulgated GAAP in the Appendix included within this document. 3
Agenda – 2021 Annual Meeting of Shareholders Introduction of Directors, Management and Guests Conduct of the Meeting Notice and proxy Report of Inspector of Elections Meeting proposals Call for vote Management Presentation and Written Questions & Verbal Answers to Follow Results of Shareholder Vote Meeting Adjournment 4
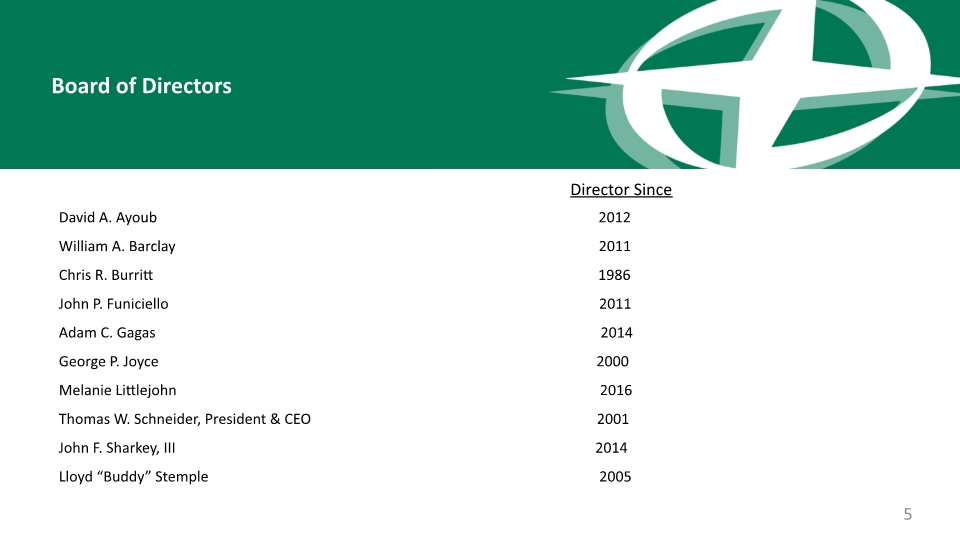
Board of Directors Director Since David A. Ayoub 2012 William A. Barclay 2011 Chris R. Burritt 1986 John P. Funiciello 2011 Adam C. Gagas 2014 George P. Joyce 2000 Melanie Littlejohn 2016 Thomas W. Schneider, President & CEO 2001 John F. Sharkey, III 2014 Lloyd “Buddy” Stemple 2005 5
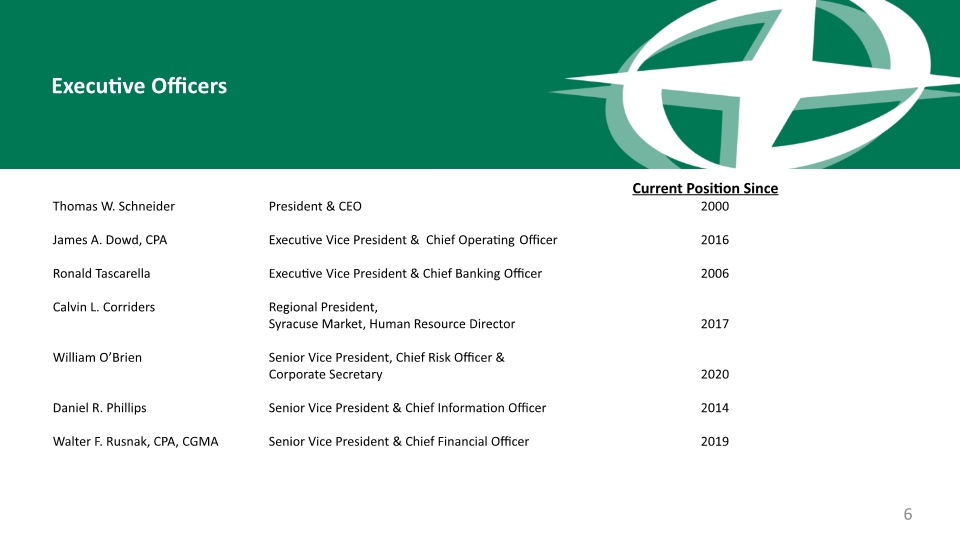
Executive Officers Current Position Since Thomas W. Schneider President & CEO 2000 James A. Dowd, CPA Executive Vice President & Chief Operating Officer 2016 Ronald Tascarella Executive Vice President & Chief Banking Officer 2006 Calvin L. Corriders Regional President, Syracuse Market, Human Resource Director 2017 William O’Brien Senior Vice President, Chief Risk Officer & Corporate Secretary 2020 Daniel R. Phillips Senior Vice President & Chief Information Officer 2014 Walter F. Rusnak, CPA, CGMA Senior Vice President & Chief Financial Officer 2019 6

Independent Registered Public Accounting Firm Tamara L. Gamble, CPA Partner Bonadio & Company, LLP 7
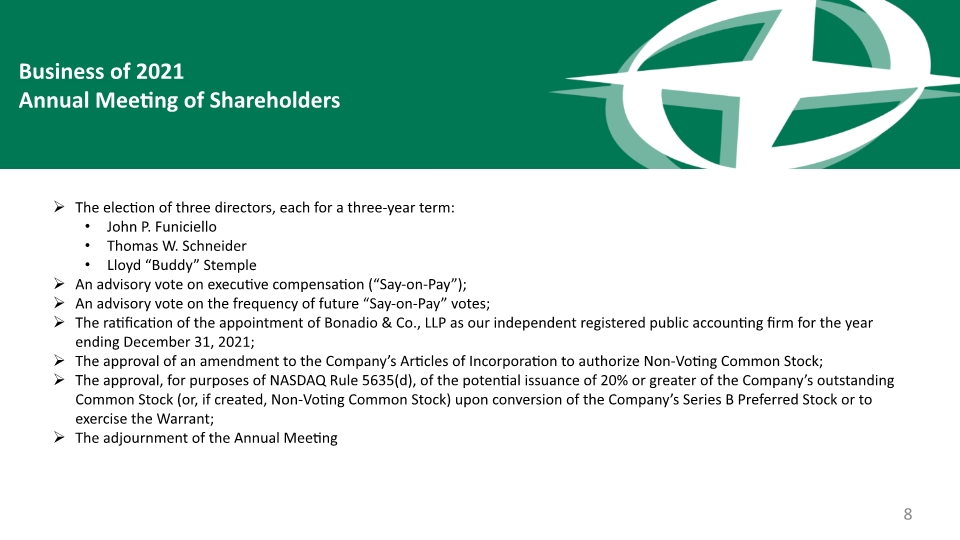
Business of 2021 Annual Meeting of Shareholders The election of three directors, each for a three-year term: John P. Funiciello Thomas W. Schneider Lloyd “Buddy” Stemple An advisory vote on executive compensation (“Say-on-Pay”); An advisory vote on the frequency of future “Say-on-Pay” votes; The ratification of the appointment of Bonadio & Co., LLP as our independent registered public accounting firm for the year ending December 31, 2021; The approval of an amendment to the Company’s Articles of Incorporation to authorize Non-Voting Common Stock; The approval, for purposes of NASDAQ Rule 5635(d), of the potential issuance of 20% or greater of the Company’s outstanding Common Stock (or, if created, Non-Voting Common Stock) upon conversion of the Company’s Series B Preferred Stock or to exercise the Warrant; The adjournment of the Annual Meeting 8
Executive Management Presentation Thomas W. Schneider, President and Chief Executive Officer Walter F. Rusnak, Senior Vice President and Chief Financial Officer 9
10 Introduction to Pathfinder Bancorp, Inc. Market Performance Corporate Financial Highlights Strategy – Where We Are Going Lower Cost of Funds Control Operating Expenses Increase Recurring Non-Interest Income Table of Contents
11 Company Overview Key Milestones Corporate Highlights Path to a Simplified Capital Structure Introduction to Pathfinder Bancorp, Inc.
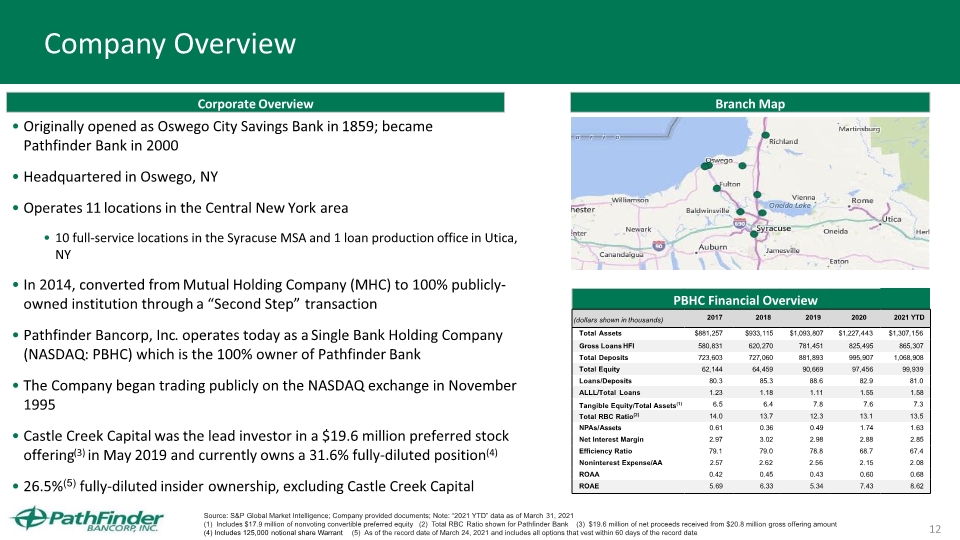
12 Branch Map Corporate Overview Originally opened as Oswego City Savings Bank in 1859; became Pathfinder Bank in 2000 Headquartered in Oswego, NY Operates 11 locations in the Central New York area 10 full-service locations in the Syracuse MSA and 1 loan production office in Utica, NY In 2014, converted from Mutual Holding Company (MHC) to 100% publicly-owned institution through a “Second Step” transaction Pathfinder Bancorp, Inc. operates today as a Single Bank Holding Company (NASDAQ: PBHC) which is the 100% owner of Pathfinder Bank The Company began trading publicly on the NASDAQ exchange in November 1995 Castle Creek Capital was the lead investor in a $19.6 million preferred stock offering(3) in May 2019 and currently owns a 31.6% fully-diluted position(4) 26.5%(5) fully-diluted insider ownership, excluding Castle Creek Capital Source: S&P Global Market Intelligence; Company provided documents; Note: “2021 YTD” data as of March 31, 2021 (1) Includes $17.9 million of nonvoting convertible preferred equity (2) Total RBC Ratio shown for Pathfinder Bank (3) $19.6 million of net proceeds received from $20.8 million gross offering amount (4) Includes 125,000 notional share Warrant (5) As of the record date of March 24, 2021 and includes all options that vest within 60 days of the record date Company Overview
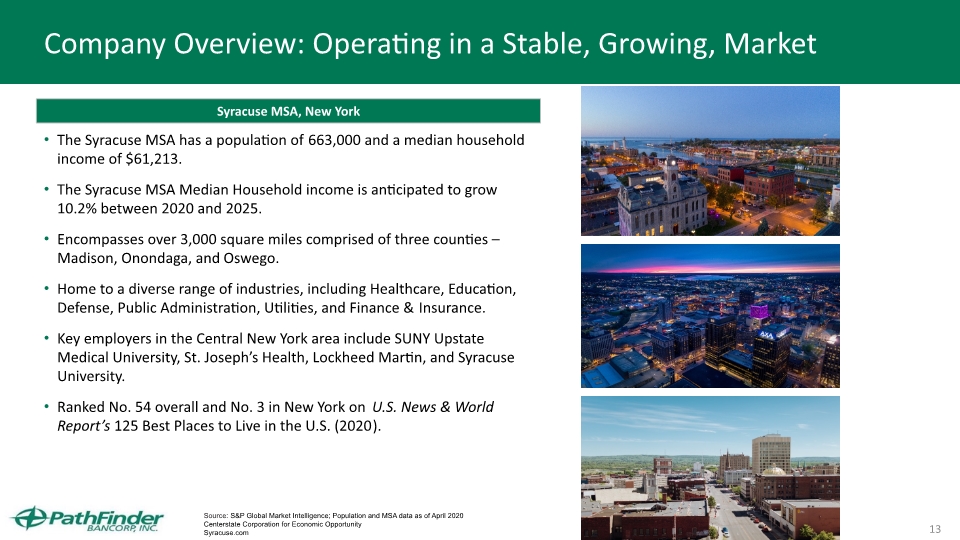
13 Company Overview: Operating in a Stable, Growing, Market Syracuse MSA, New York The Syracuse MSA has a population of 663,000 and a median household income of $61,213. The Syracuse MSA Median Household income is anticipated to grow 10.2% between 2020 and 2025. Encompasses over 3,000 square miles comprised of three counties – Madison, Onondaga, and Oswego. Home to a diverse range of industries, including Healthcare, Education, Defense, Public Administration, Utilities, and Finance & Insurance. Key employers in the Central New York area include SUNY Upstate Medical University, St. Joseph’s Health, Lockheed Martin, and Syracuse University. Ranked No. 54 overall and No. 3 in New York on U.S. News & World Report’s 125 Best Places to Live in the U.S. (2020). Source: S&P Global Market Intelligence; Population and MSA data as of April 2020 Centerstate Corporation for Economic Opportunity Syracuse.com
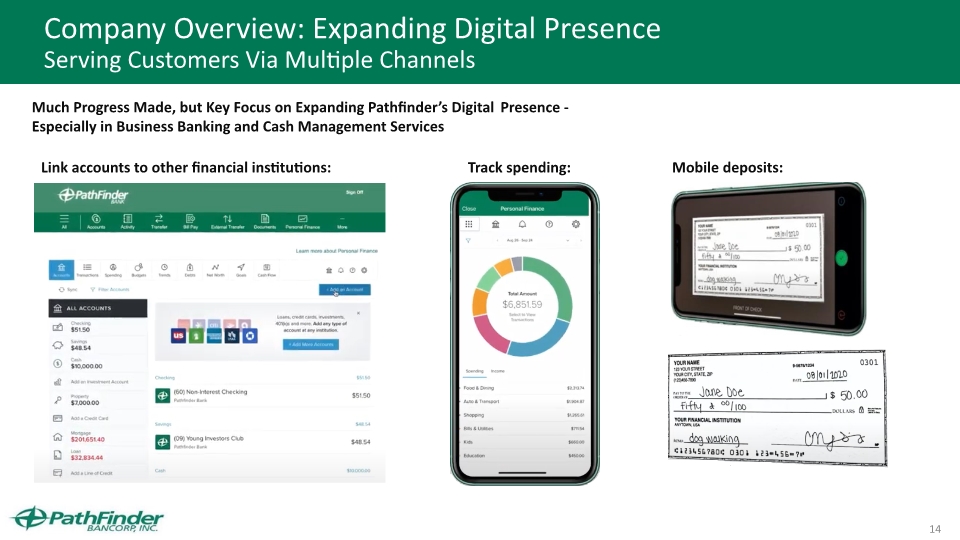
14 Company Overview: Expanding Digital Presence Serving Customers Via Multiple Channels Much Progress Made, but Key Focus on Expanding Pathfinder’s Digital Presence - Especially in Business Banking and Cash Management Services Link accounts to other financial institutions: Mobile deposits: Track spending:
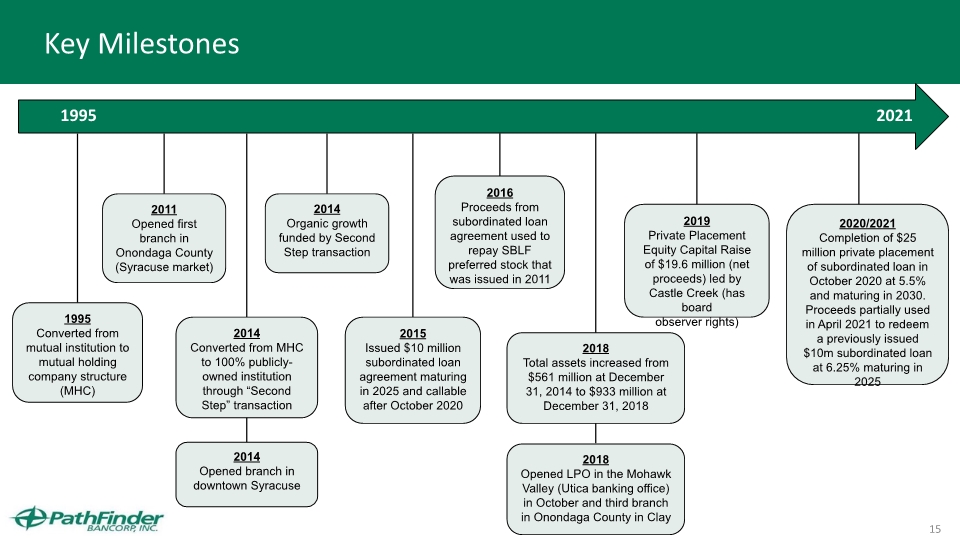
15 Key Milestones 2015 Issued $10 million subordinated loan agreement maturing in 2025 and callable after October 2020 2011 Opened first branch in Onondaga County (Syracuse market) 2018 Total assets increased from $561 million at December 31, 2014 to $933 million at December 31, 2018 2019 Private Placement Equity Capital Raise of $19.6 million (net proceeds) led by Castle Creek (has board observer rights) 2014 Organic growth funded by Second Step transaction 2016 Proceeds from subordinated loan agreement used to repay SBLF preferred stock that was issued in 2011 1995 Converted from mutual institution to mutual holding company structure (MHC) 1995 2021 2018 Opened LPO in the Mohawk Valley (Utica banking office) in October and third branch in Onondaga County in Clay 2014 Opened branch in downtown Syracuse 2014 Converted from MHC to 100% publicly-owned institution through “Second Step” transaction 2020/2021 Completion of $25 million private placement of subordinated loan in October 2020 at 5.5% and maturing in 2030. Proceeds partially used in April 2021 to redeem a previously issued $10m subordinated loan at 6.25% maturing in 2025
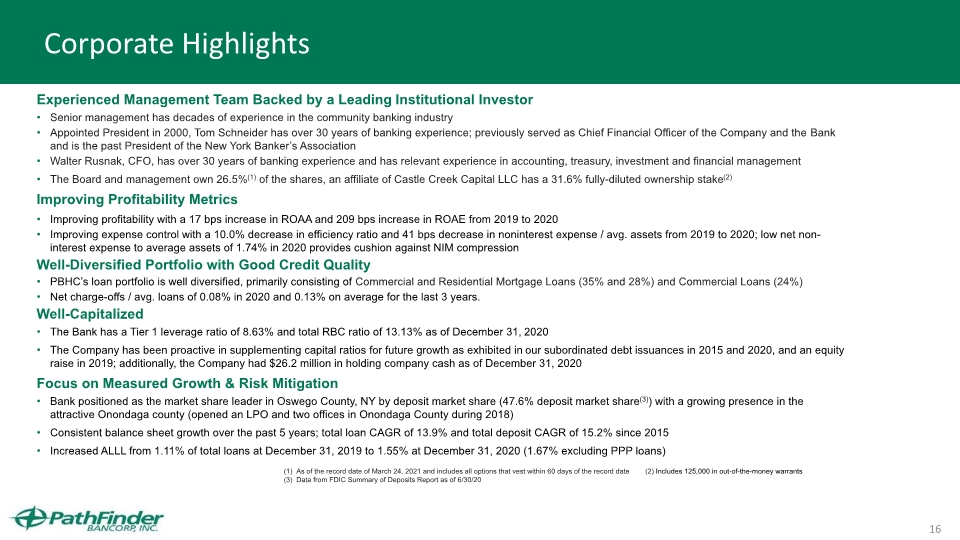
16 Corporate Highlights Experienced Management Team Backed by a Leading Institutional Investor Senior management has decades of experience in the community banking industry Appointed President in 2000, Tom Schneider has over 30 years of banking experience; previously served as Chief Financial Officer of the Company and the Bank and is the past President of the New York Banker’s Association Walter Rusnak, CFO, has over 30 years of banking experience and has relevant experience in accounting, treasury, investment and financial management The Board and management own 26.5%(1) of the shares, an affiliate of Castle Creek Capital LLC has a 31.6% fully-diluted ownership stake(2) Improving Profitability Metrics Improving profitability with a 17 bps increase in ROAA and 209 bps increase in ROAE from 2019 to 2020 Improving expense control with a 10.0% decrease in efficiency ratio and 41 bps decrease in noninterest expense / avg. assets from 2019 to 2020; low net non-interest expense to average assets of 1.74% in 2020 provides cushion against NIM compression Well-Diversified Portfolio with Good Credit Quality PBHC’s loan portfolio is well diversified, primarily consisting of Commercial and Residential Mortgage Loans (35% and 28%) and Commercial Loans (24%) Net charge-offs / avg. loans of 0.08% in 2020 and 0.13% on average for the last 3 years. Well-Capitalized The Bank has a Tier 1 leverage ratio of 8.63% and total RBC ratio of 13.13% as of December 31, 2020 The Company has been proactive in supplementing capital ratios for future growth as exhibited in our subordinated debt issuances in 2015 and 2020, and an equity raise in 2019; additionally, the Company had $26.2 million in holding company cash as of December 31, 2020 Focus on Measured Growth & Risk Mitigation Bank positioned as the market share leader in Oswego County, NY by deposit market share (47.6% deposit market share(3)) with a growing presence in the attractive Onondaga county (opened an LPO and two offices in Onondaga County during 2018) Consistent balance sheet growth over the past 5 years; total loan CAGR of 13.9% and total deposit CAGR of 15.2% since 2015 Increased ALLL from 1.11% of total loans at December 31, 2019 to 1.55% at December 31, 2020 (1.67% excluding PPP loans) (1) As of the record date of March 24, 2021 and includes all options that vest within 60 days of the record date (2) Includes 125,000 in out-of-the-money warrants (3) Data from FDIC Summary of Deposits Report as of 6/30/20
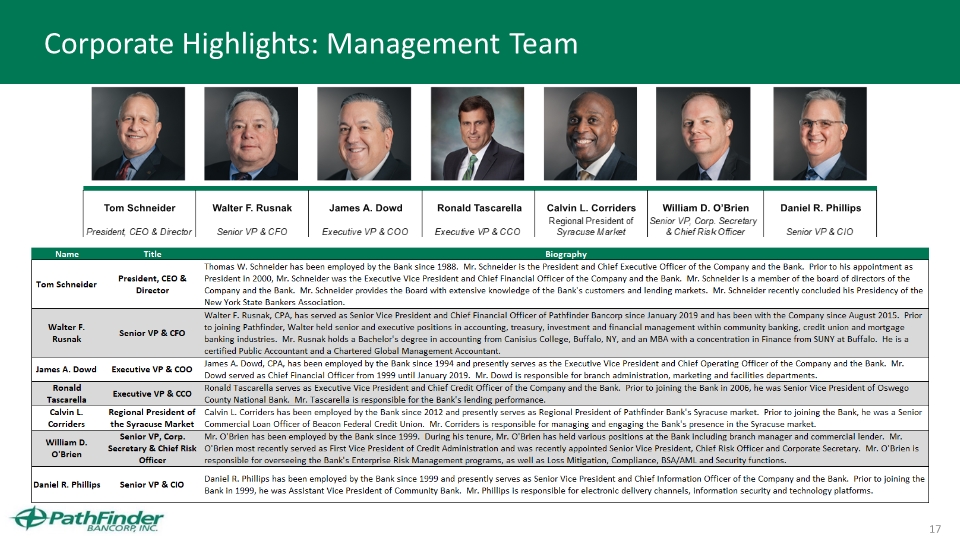
17 Corporate Highlights: Management Team Calvin L. Corriders William D. O’Brien Daniel R. Phillips Walter F. Rusnak Tom Schneider James A. Dowd Ronald Tascarella
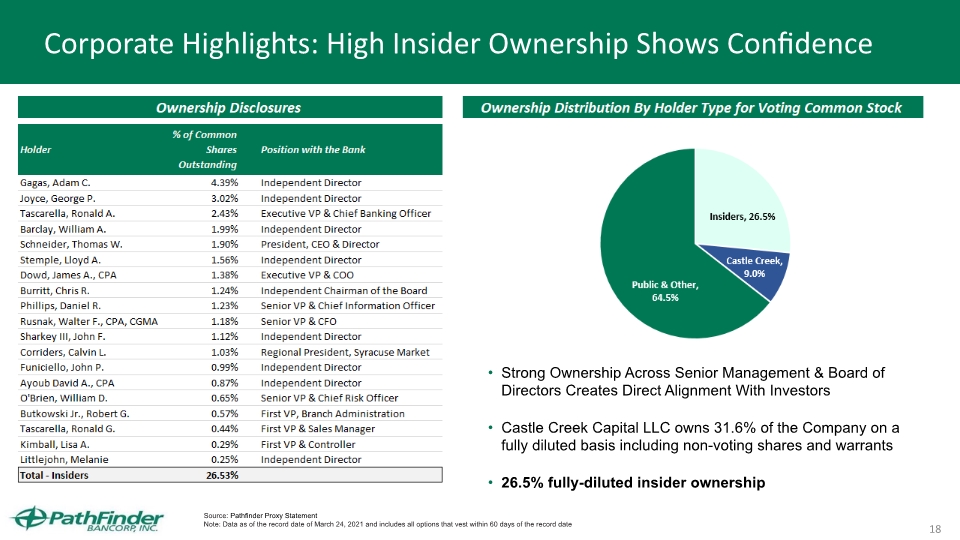
18 Corporate Highlights: High Insider Ownership Shows Confidence Source: Pathfinder Proxy Statement Note: Data as of the record date of March 24, 2021 and includes all options that vest within 60 days of the record date Strong Ownership Across Senior Management & Board of Directors Creates Direct Alignment With Investors Castle Creek Capital LLC owns 31.6% of the Company on a fully diluted basis including non-voting shares and warrants 26.5% fully-diluted insider ownership
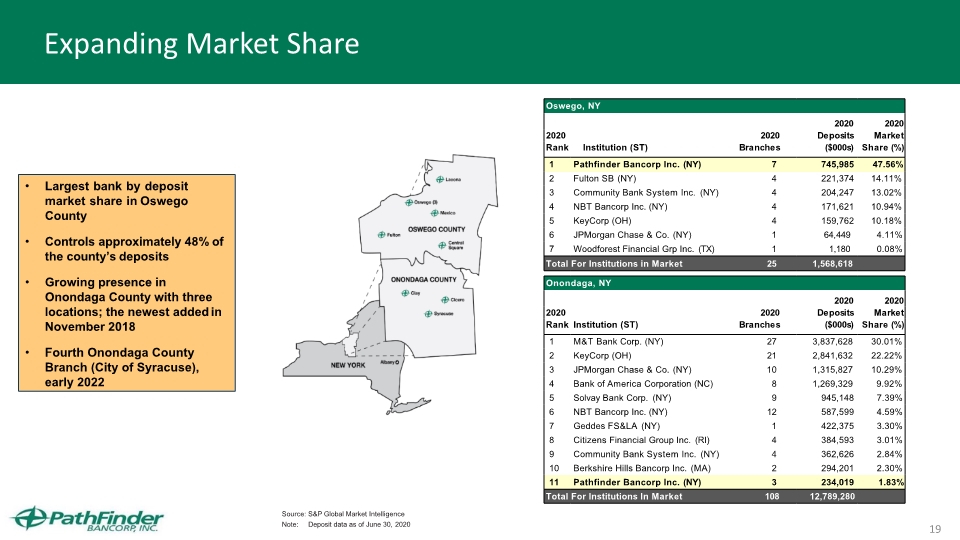
19 Expanding Market Share Source: S&P Global Market Intelligence Note: Deposit data as of June 30, 2020 Largest bank by deposit market share in Oswego County Controls approximately 48% of the county’s deposits Growing presence in Onondaga County with three locations; the newest added in November 2018 Fourth Onondaga County Branch (City of Syracuse), early 2022
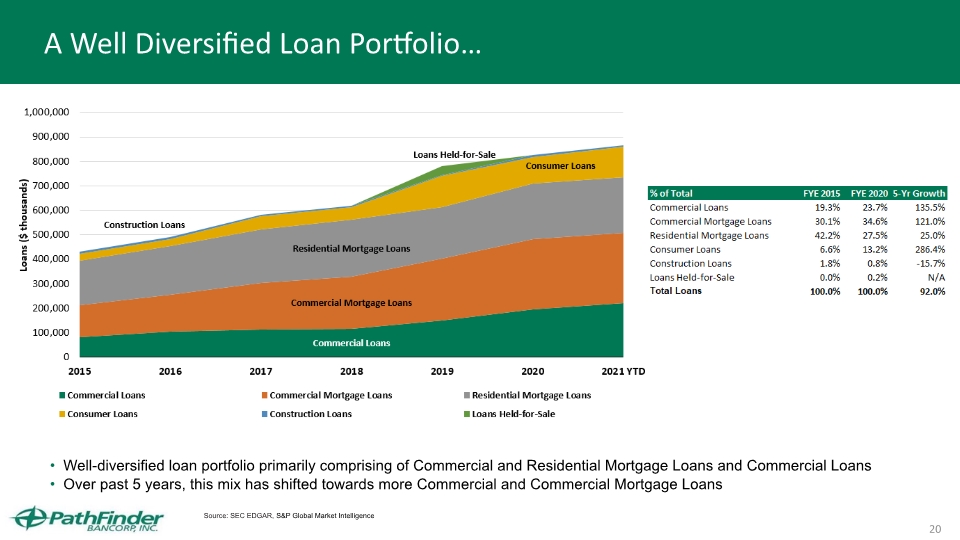
20 A Well Diversified Loan Portfolio… Source: SEC EDGAR, S&P Global Market Intelligence Well-diversified loan portfolio primarily comprising of Commercial and Residential Mortgage Loans and Commercial Loans Over past 5 years, this mix has shifted towards more Commercial and Commercial Mortgage Loans
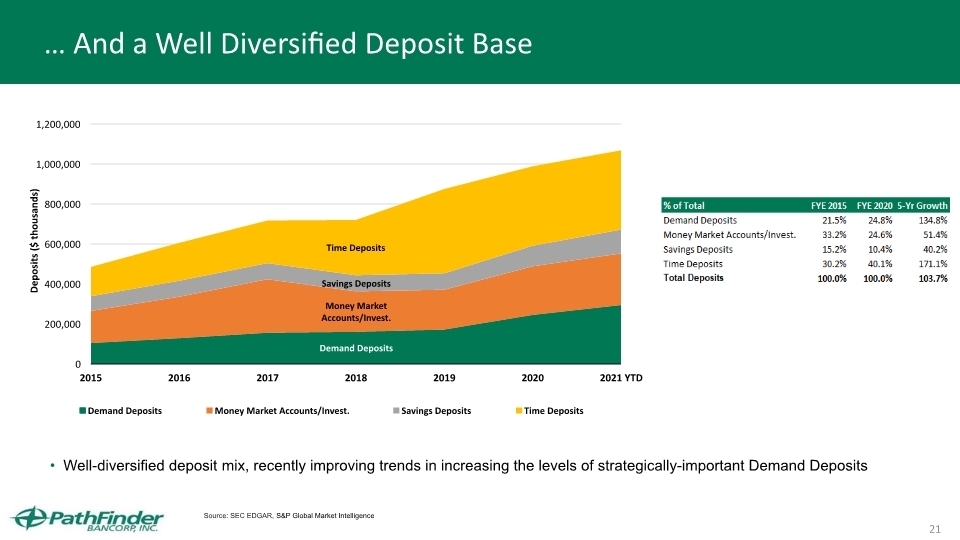
21 … And a Well Diversified Deposit Base Source: SEC EDGAR, S&P Global Market Intelligence Well-diversified deposit mix, recently improving trends in increasing the levels of strategically-important Demand Deposits
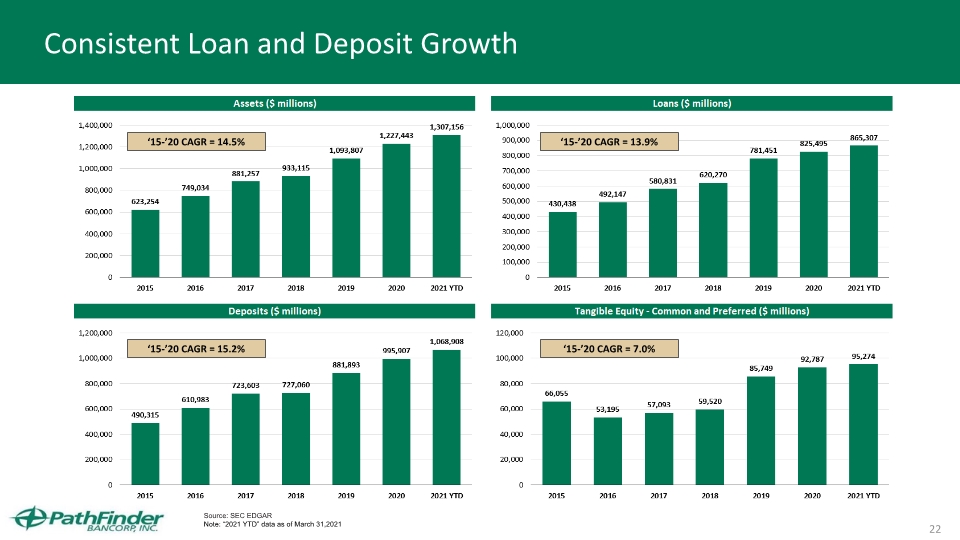
22 Consistent Loan and Deposit Growth Source: SEC EDGAR Note: “2021 YTD” data as of March 31,2021 ‘15-’20 CAGR = 14.5% ‘15-’20 CAGR = 15.2% ‘15-’20 CAGR = 7.0% ‘15-’20 CAGR = 13.9%
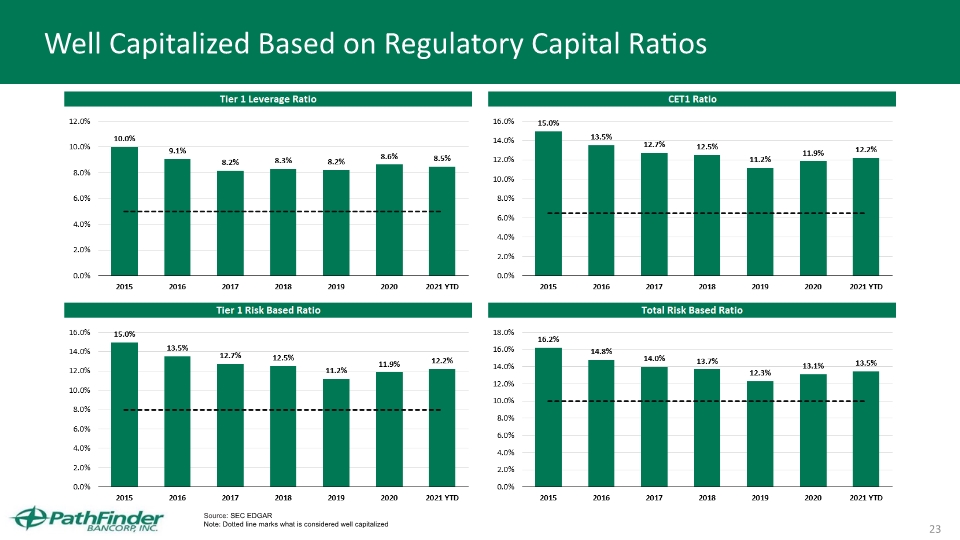
23 Well Capitalized Based on Regulatory Capital Ratios Source: SEC EDGAR Note: Dotted line marks what is considered well capitalized
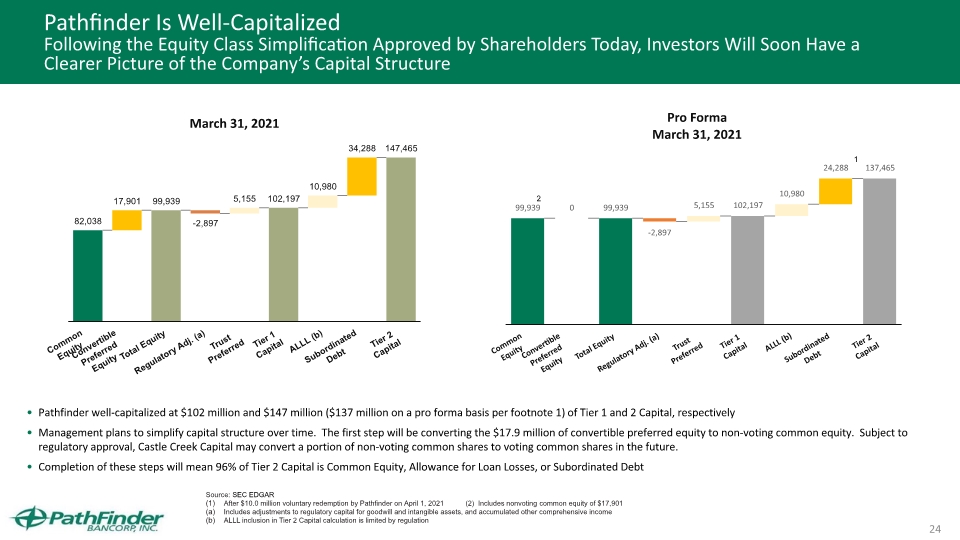
24 Pathfinder Is Well-Capitalized Following the Equity Class Simplification Approved by Shareholders Today, Investors Will Soon Have a Clearer Picture of the Company’s Capital Structure Pathfinder well-capitalized at $102 million and $147 million ($137 million on a pro forma basis per footnote 1) of Tier 1 and 2 Capital, respectively Management plans to simplify capital structure over time. The first step will be converting the $17.9 million of convertible preferred equity to non-voting common equity. Subject to regulatory approval, Castle Creek Capital may convert a portion of non-voting common shares to voting common shares in the future. Completion of these steps will mean 96% of Tier 2 Capital is Common Equity, Allowance for Loan Losses, or Subordinated Debt Source: SEC EDGAR After $10.0 million voluntary redemption by Pathfinder on April 1, 2021 (2) Includes nonvoting common equity of $17,901 Includes adjustments to regulatory capital for goodwill and intangible assets, and accumulated other comprehensive income ALLL inclusion in Tier 2 Capital calculation is limited by regulation 1 2
25 Market Performance Share Price Performance Performance vs. Peers Market-Based Expectations

26 PBHC Share Price Performance: Performance Lagging Peers Historically, But Improving Recent Performance Source: S&P Global Market Intelligence as of 5/31/21 Pathfinder and KBW Regional Banking Index underperforming S&P 500 over 3 and 5 years, but outperforming last year and YTD.
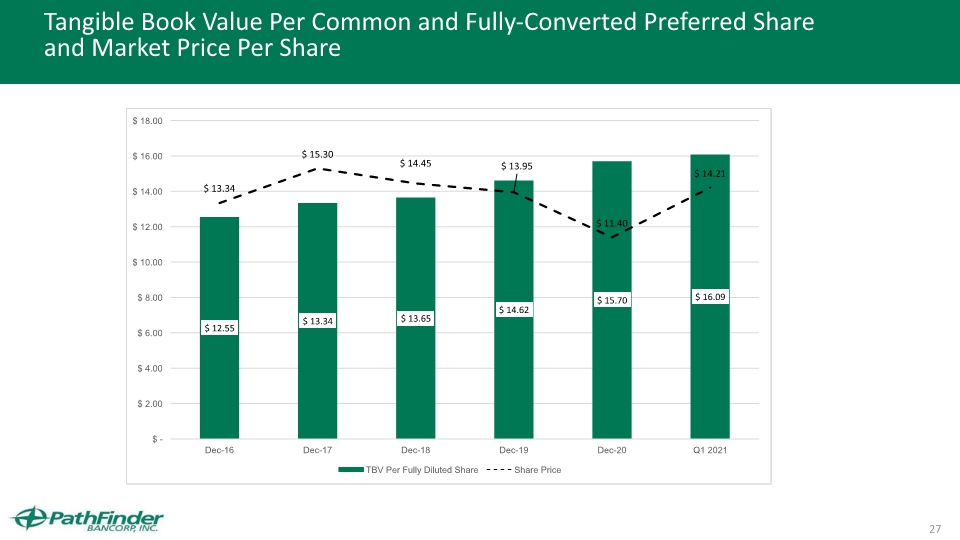
27 Tangible Book Value Per Common and Fully-Converted Preferred Share and Market Price Per Share
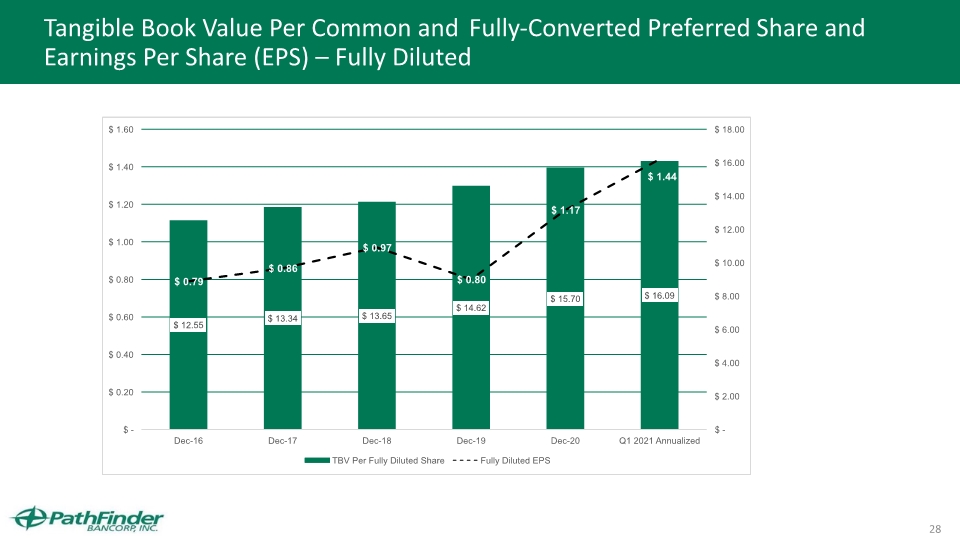
28 Tangible Book Value Per Common and Fully-Converted Preferred Share and Earnings Per Share (EPS) – Fully Diluted
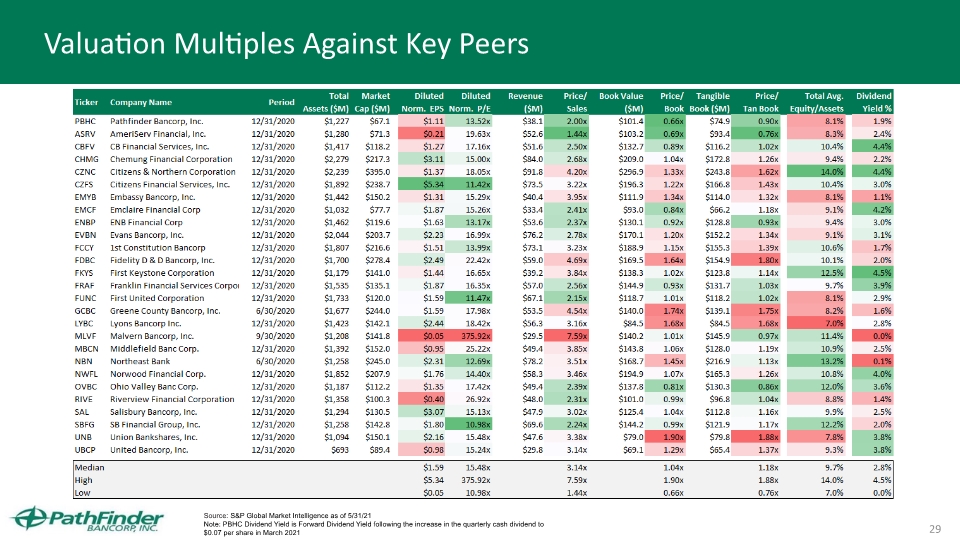
29 Valuation Multiples Against Key Peers Source: S&P Global Market Intelligence as of 5/31/21 Note: PBHC Dividend Yield is Forward Dividend Yield following the increase in the quarterly cash dividend to $0.07 per share in March 2021
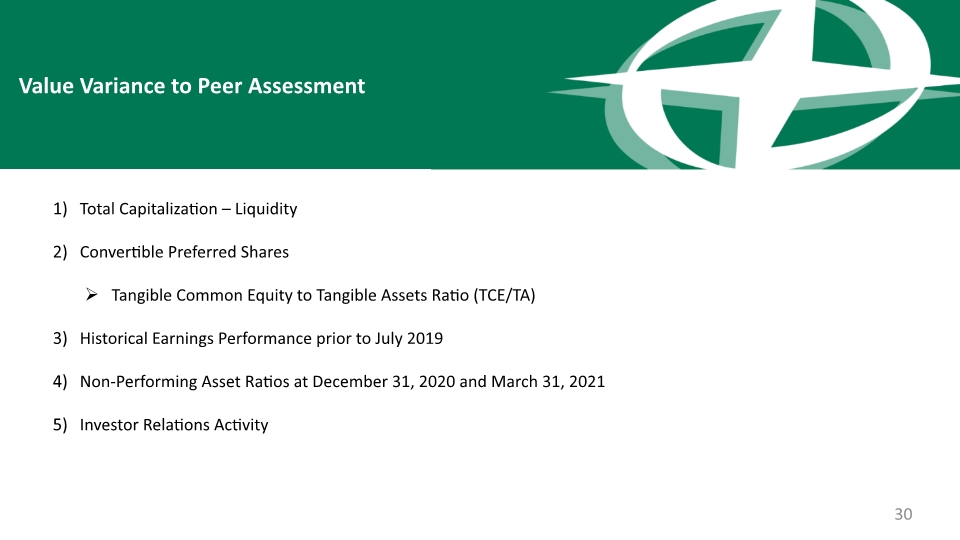
Value Variance to Peer Assessment Total Capitalization – Liquidity Convertible Preferred Shares Tangible Common Equity to Tangible Assets Ratio (TCE/TA) Historical Earnings Performance prior to July 2019 Non-Performing Asset Ratios at December 31, 2020 and March 31, 2021 Investor Relations Activity 30
31 Corporate Financial Highlights Walter F. Rusnak, SVP, Chief Financial Officer
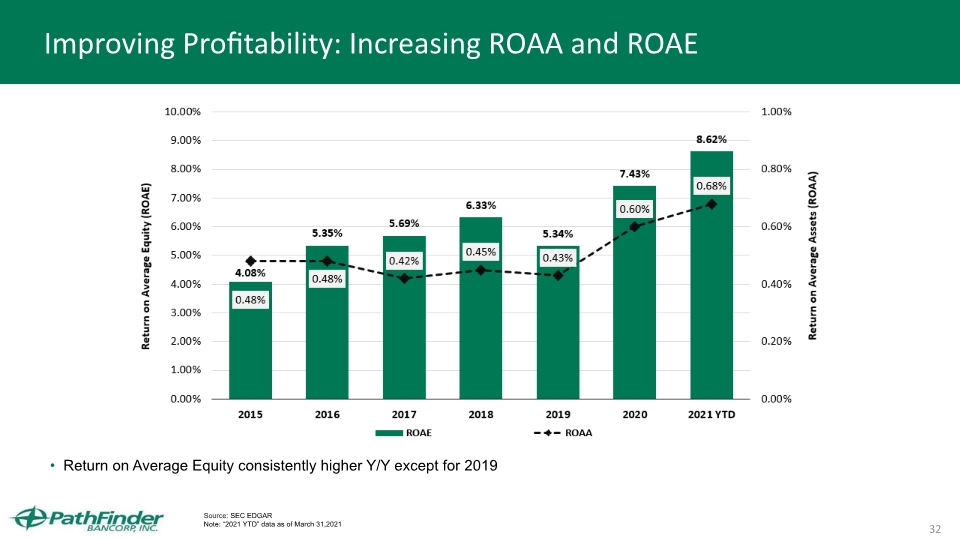
32 Improving Profitability: Increasing ROAA and ROAE Source: SEC EDGAR Note: “2021 YTD” data as of March 31,2021 Return on Average Equity consistently higher Y/Y except for 2019
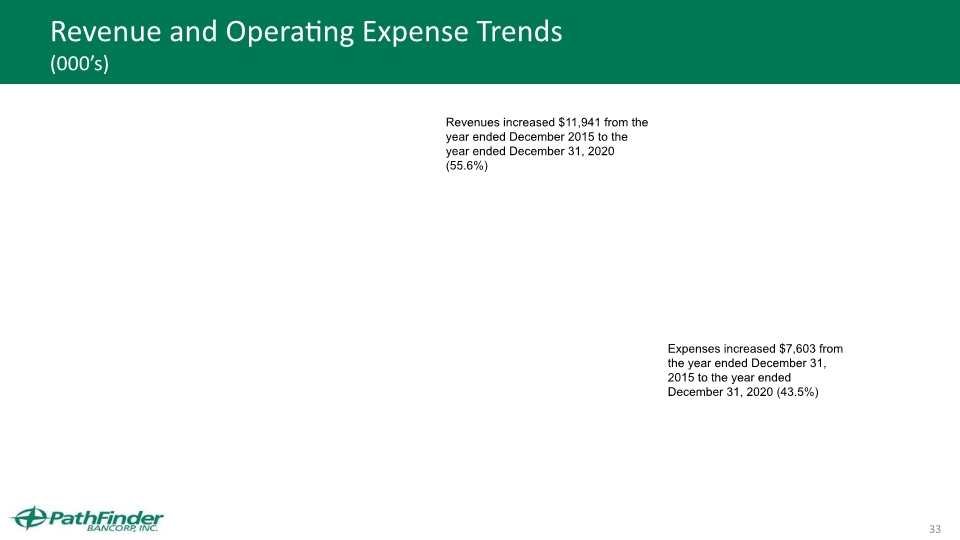
33 Revenue and Operating Expense Trends (000’s) Revenues increased $11,941 from the year ended December 2015 to the year ended December 31, 2020 (55.6%) Expenses increased $7,603 from the year ended December 31, 2015 to the year ended December 31, 2020 (43.5%)
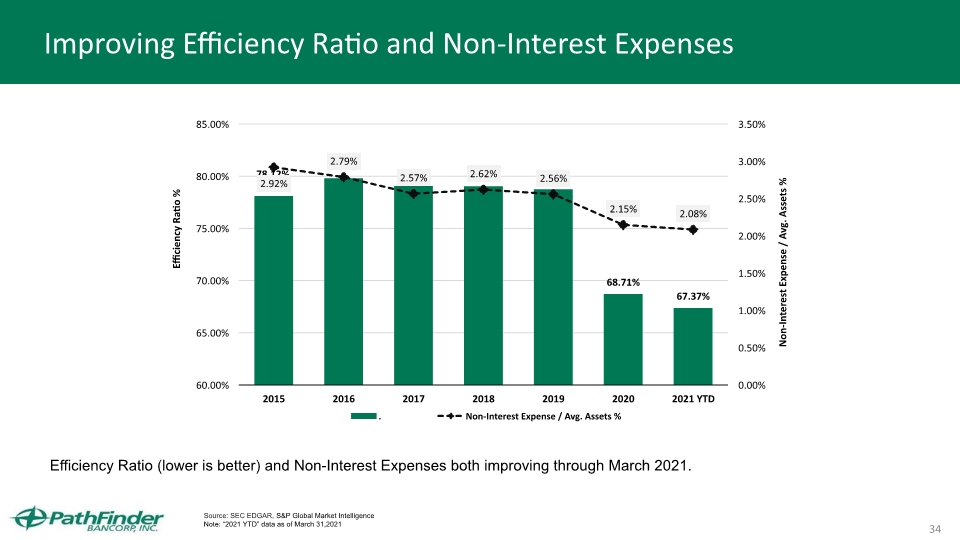
34 Improving Efficiency Ratio and Non-Interest Expenses Source: SEC EDGAR, S&P Global Market Intelligence Note: “2021 YTD” data as of March 31,2021 Efficiency Ratio (lower is better) and Non-Interest Expenses both improving through March 2021.
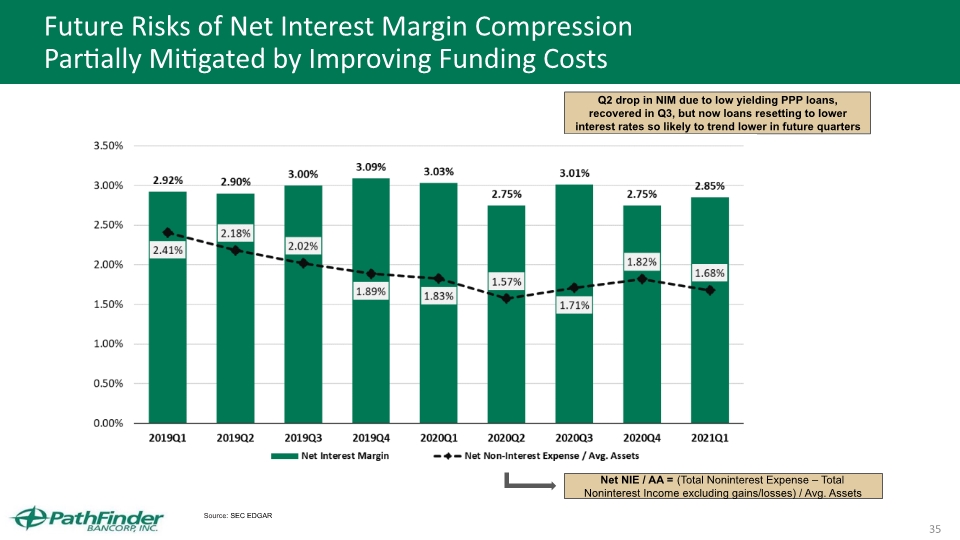
35 Future Risks of Net Interest Margin Compression Partially Mitigated by Improving Funding Costs Net NIE / AA = (Total Noninterest Expense – Total Noninterest Income excluding gains/losses) / Avg. Assets Source: SEC EDGAR Q2 drop in NIM due to low yielding PPP loans, recovered in Q3, but now loans resetting to lower interest rates so likely to trend lower in future quarters
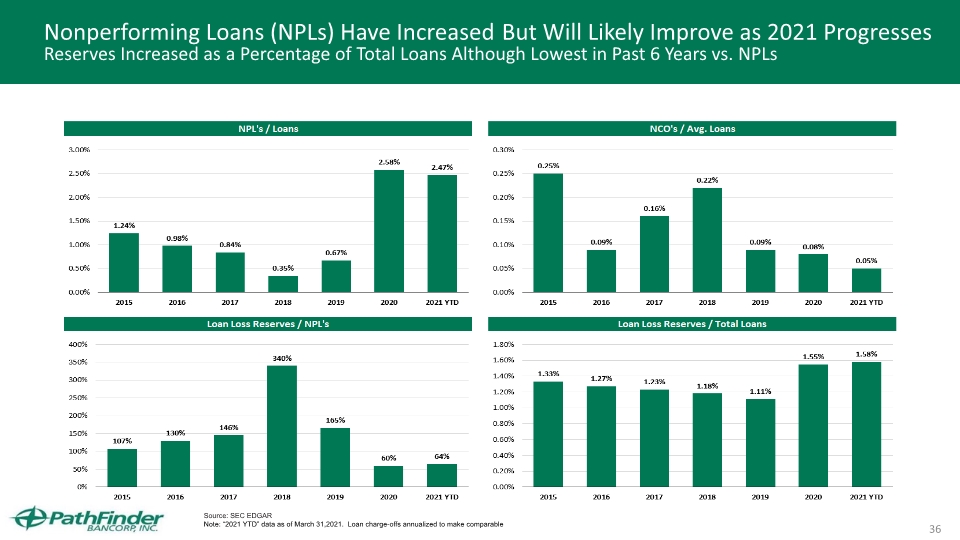
36 Nonperforming Loans (NPLs) Have Increased But Will Likely Improve as 2021 Progresses Reserves Increased as a Percentage of Total Loans Although Lowest in Past 6 Years vs. NPLs Source: SEC EDGAR Note: “2021 YTD” data as of March 31,2021. Loan charge-offs annualized to make comparable

37 Strategy – Key Performance Metrics Update
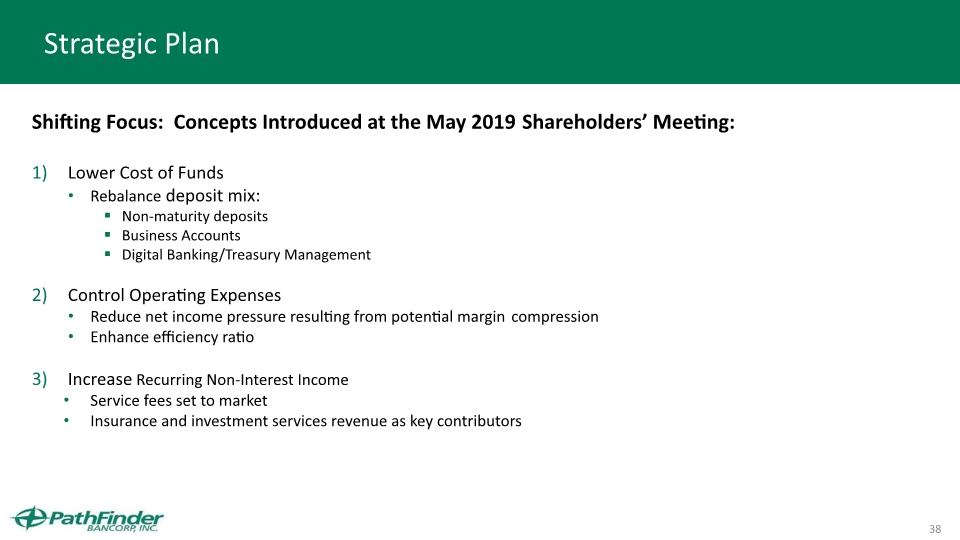
38 Strategic Plan Shifting Focus: Concepts Introduced at the May 2019 Shareholders’ Meeting: Lower Cost of Funds Rebalance deposit mix: Non-maturity deposits Business Accounts Digital Banking/Treasury Management Control Operating Expenses Reduce net income pressure resulting from potential margin compression Enhance efficiency ratio Increase Recurring Non-Interest Income Service fees set to market Insurance and investment services revenue as key contributors
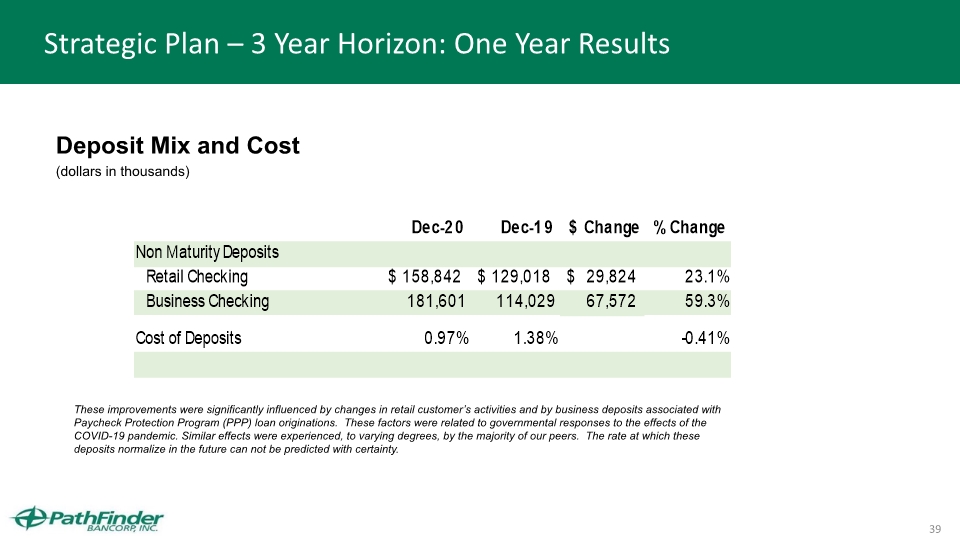
39 Strategic Plan – 3 Year Horizon: One Year Results Deposit Mix and Cost (dollars in thousands) These improvements were significantly influenced by changes in retail customer’s activities and by business deposits associated with Paycheck Protection Program (PPP) loan originations. These factors were related to governmental responses to the effects of the COVID-19 pandemic. Similar effects were experienced, to varying degrees, by the majority of our peers. The rate at which these deposits normalize in the future can not be predicted with certainty.
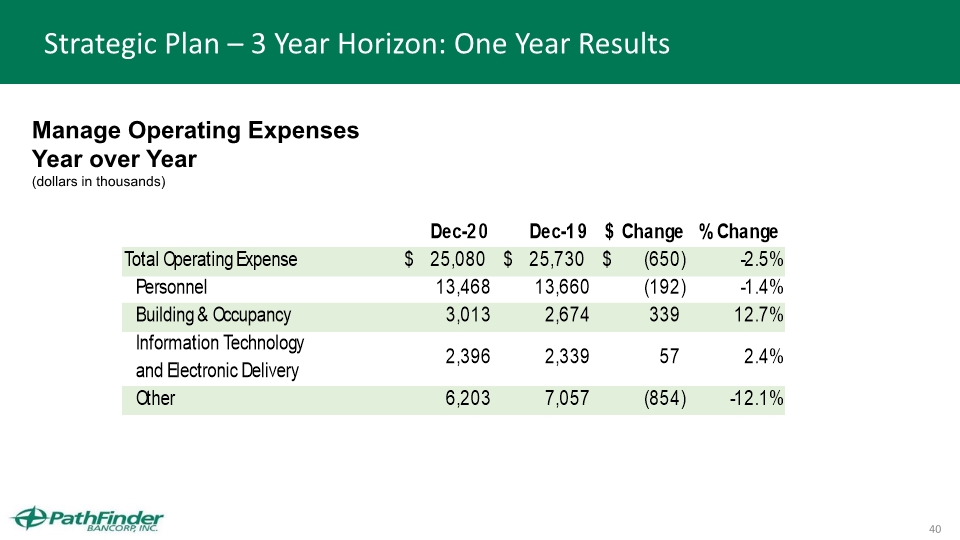
40 Strategic Plan – 3 Year Horizon: One Year Results Manage Operating Expenses Year over Year (dollars in thousands)
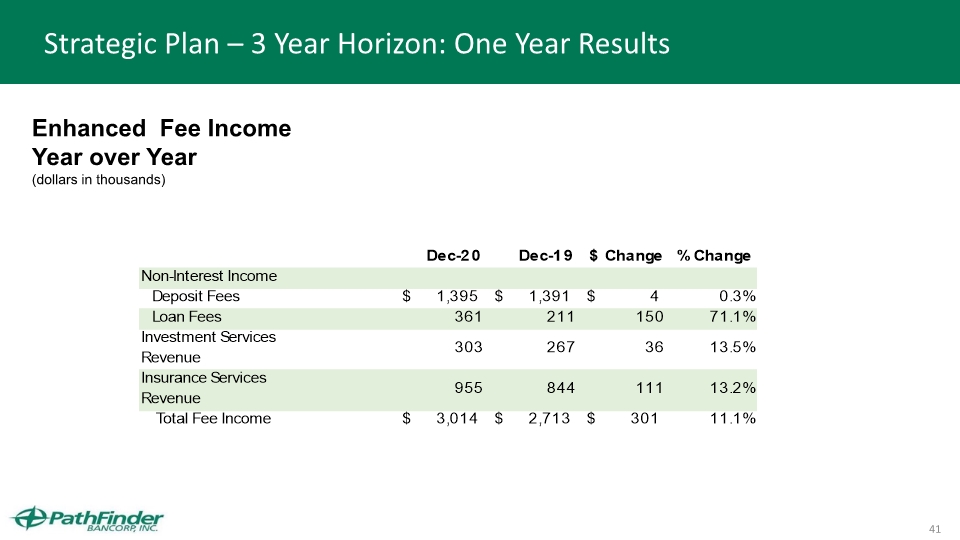
41 Strategic Plan – 3 Year Horizon: One Year Results Enhanced Fee Income Year over Year (dollars in thousands)

42 COVID-19 – Response and Impact
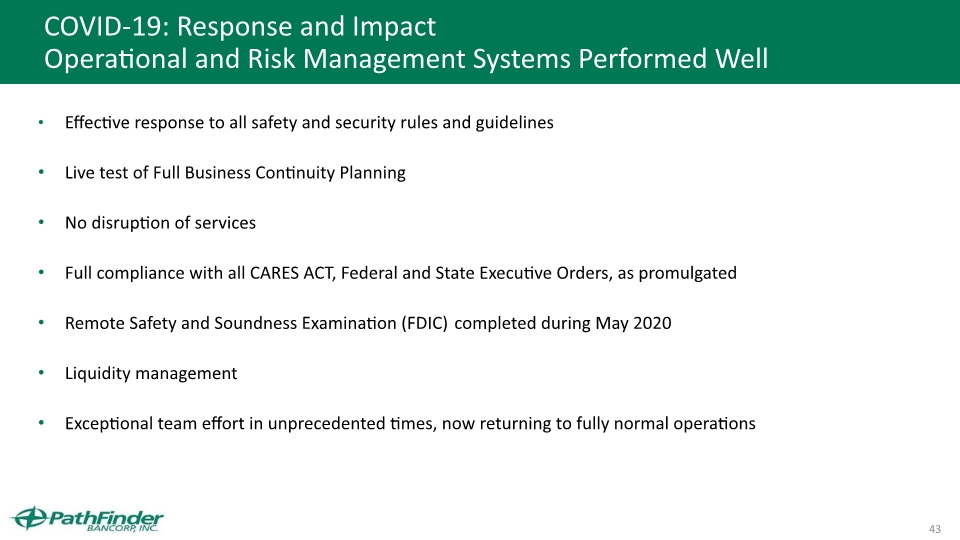
43 COVID-19: Response and Impact Operational and Risk Management Systems Performed Well Effective response to all safety and security rules and guidelines Live test of Full Business Continuity Planning No disruption of services Full compliance with all CARES ACT, Federal and State Executive Orders, as promulgated Remote Safety and Soundness Examination (FDIC) completed during May 2020 Liquidity management Exceptional team effort in unprecedented times, now returning to fully normal operations

Questions and Discussion 44
Voting Results Chris R. Burritt, Chairman Inspector of Elections Report, William O’Brien, Corporate Secretary 45

2018 Annual Meeting of Shareholders Meeting Adjourned Thank You for Attending 46 2021 Annual Meeting of Shareholders
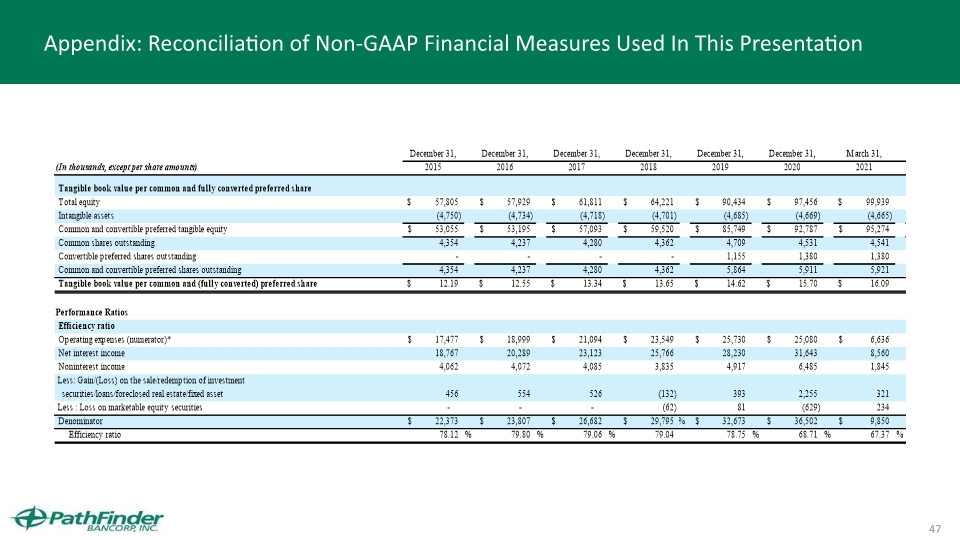
47 Appendix: Reconciliation of Non-GAAP Financial Measures Used In This Presentation


