
Long Beach ANALYST DAY & SITE TOUR Day 1 | October 13, 2015
Analyst Presentation – Day 1 FORWARD-LOOKING / CAUTIONARY STATEMENTS This presentation contains forward-looking statements that involve risks and uncertainties that could materially affect our expected results of operations, liquidity, cash flows and business prospects, and reported results should not be considered an indication of future performance. Such statements specifically include our expectations as to our future financial position, drilling program, production, projected costs, future operations, hedging activities, capital investments and other guidance included in this presentation. Factors (but not necessarily all the factors) that could cause results to differ include: commodity price fluctuations; the effect of our debt on the impact of economic downturns and adverse business developments; sufficiency of our operating cash flow to fund planned capital investments; the ability to obtain government permits and approvals; effectiveness of our capital investments; restrictions and changes in restrictions imposed by regulations including those related to our ability to obtain, use, manage or dispose of water; risks of drilling; tax law changes; the subjective nature of estimates of proved reserves and related future net cash flows; restriction of operations to, and concentration of exposure to events such as industrial accidents, refinery shutdowns, natural disasters and labor difficulties in, California; concerns about climate change and air quality issues; lower-than-expected production from development projects or acquisitions; catastrophic events for which we may be uninsured or underinsured; cyber attacks; operational issues that restrict market access; and uncertainties related to the spin-off, the agreements related thereto and the anticipated effects of restructuring or reorganizing our business. Material risks are further discussed in “Risk Factors” in our Annual Report on Form 10-K available on our website at crc.com. Words such as "aim," "anticipate," "believe," "budget," "continue," "could," "effort," "estimate," "expect," "forecast," "goal," "guidance," "intend," "likely," "may," "might," "objective," "outlook," "plan," "potential," "predict," "project," "seek," "should," "target, "will" or "would" “or similar expressions that convey the prospective nature of events or outcomes generally indicate forward-looking statements. Any forward-looking statement speaks only as of the date on which such statement is made and the Company undertakes no obligation to correct or update any forward-looking statement, whether as a result of new information, future events or otherwise, except as required by applicable law. This presentation includes financial measures that are not in accordance with United States generally accepted accounting principles (“GAAP”), including PV-10 and Adjusted EBITDAX. While management believes that such measures are useful for investors, they should not be used as a replacement for financial measures that are in accordance with GAAP. For a reconciliation of Adjusted EBITDAX to the nearest comparable measure in accordance with GAAP, please see the Appendix. 1
Analyst Presentation – Day 1 CAUTIONARY STATEMENTS REGARDING HYDROCARBON QUANTITIES We have provided internally generated estimates for proved reserves and aggregated proved, probable and possible reserves (“3P Reserves”) as of December 31, 2014 in this presentation, with each category of reserves estimated in accordance with SEC guidelines and definitions, though we have not reported all such estimates to the SEC. As used in this presentation: • Probable reserves. We use deterministic methods to estimate probable reserve quantities, and when deterministic methods are used, it is as likely as not that actual remaining quantities recovered will exceed the sum of estimated proved plus probable reserves. • Possible reserves. We use deterministic methods to estimate possible reserve quantities, and when deterministic methods are used to estimate possible reserve quantities, the total quantities ultimately recovered from a project have a low probability of exceeding proved plus probable plus possible reserves. The SEC prohibits companies from aggregating proved, probable and possible reserves estimated using deterministic estimation methods in filings with the SEC due to the different levels of certainty associated with each reserve category. Actual quantities that may be ultimately recovered from our interests may differ substantially from the estimates in this presentation. Factors affecting ultimate recovery include the scope of our ongoing drilling program, which will be directly affected by commodity prices, the availability of capital, regulatory approvals, drilling and production costs, availability of drilling services and equipment, drilling results, lease expirations, transportation constraints and other factors; actual drilling results, which may be affected by geological, mechanical and other factors that determine recovery rates; and budgets based upon our future evaluation of risk, returns and the availability of capital. We use the term “oil-in-place”, “net unrisked 3P resources”, “net unrisked prospective resources” and “estimated ultimate recovery” in this presentation to describe estimates of potentially recoverable hydrocarbons remaining in the applicable reservoir. SEC guidelines restrict us from including these measures in filings with the SEC. These have been estimated internally without review by independent engineers and may include shale resources which are not considered in most older, publicly available estimates. Actual recovery of these potential resource volumes is inherently more speculative than recovery of estimated reserves and any such recovery will be dependent upon future design and implementation of a successful development plan. Management’s estimate of original hydrocarbons in place includes historical production plus estimates of proved, probable and possible reserves and a gross resource estimate that has not been reduced by appropriate factors for potential recovery and as a result differs significantly from estimates of hydrocarbons that can potentially be recovered. Ultimate recoveries will be dependent upon numerous factors including those noted above. In addition, we discuss “PUD-like” reserves by which we mean reserves for which our technical evaluation indicates that we would book the reserves as proved undeveloped reserves except that we do not expect to develop them within five years. These are not proved reserves in accordance with SEC regulations. 2

Analyst Presentation – Day 1 3 • Day One Strategic Overview of CRC – Todd Stevens, President & CEO Marketing Overview – Carlos Contreras, VP Marketing Regulatory Overview – Charlie Weiss, EVP – Public Affairs Waterflood Primer – Jerry Foster, Manager IOR/EOR Los Angeles and Ventura Basins – Frank Komin, EVP – Southern Operations THUMS Island Tour • Day Two Exploration Overview – Darren Williams, EVP – Exploration Northern Operations Overview– Bob Barnes, EVP – Northern Operations Steamflood Primer Dr. Vic Ziegler, Director- Corporate Development Jeff Hatlen – Chief Reservoir Engineer Thermal Operations Elk Hills Site Tour CRC AGENDA
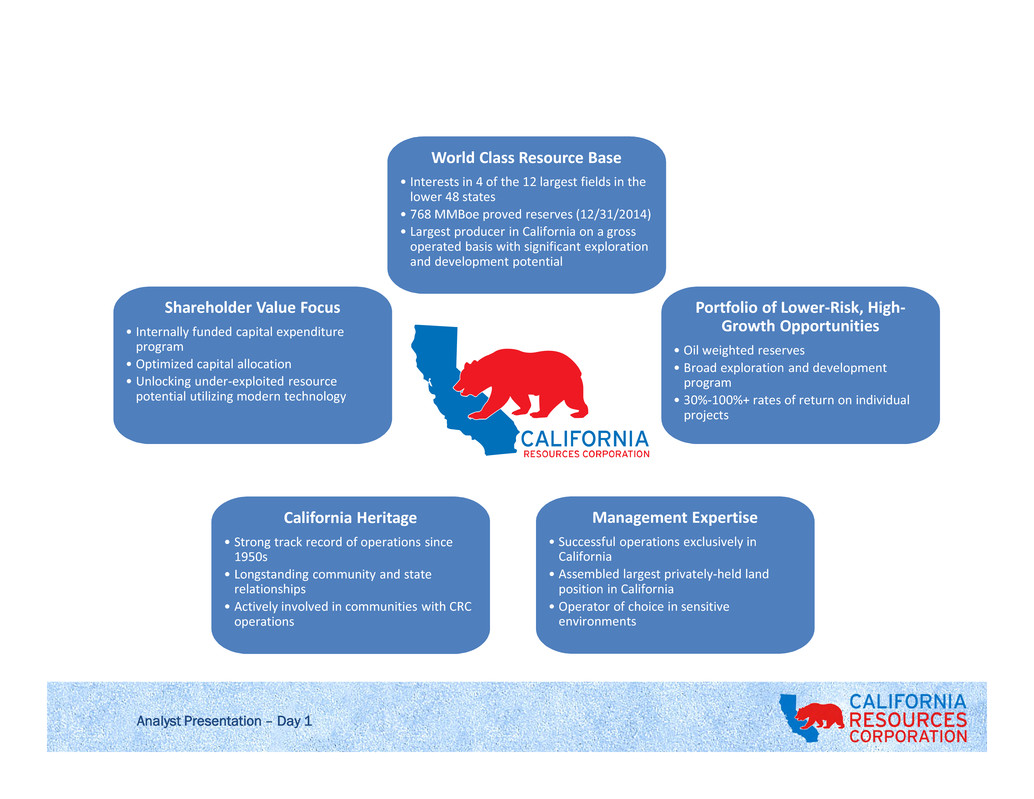
Analyst Presentation – Day 1 World Class Resource Base • Interests in 4 of the 12 largest fields in the lower 48 states • 768 MMBoe proved reserves (12/31/2014) • Largest producer in California on a gross operated basis with significant exploration and development potential California Heritage • Strong track record of operations since 1950s • Longstanding community and state relationships • Actively involved in communities with CRC operations Management Expertise • Successful operations exclusively in California • Assembled largest privately-held land position in California • Operator of choice in sensitive environments Portfolio of Lower-Risk, High- Growth Opportunities • Oil weighted reserves • Broad exploration and development program • 30%-100%+ rates of return on individual projects Shareholder Value Focus • Internally funded capital expenditure program • Optimized capital allocation • Unlocking under-exploited resource potential utilizing modern technology
CRC STRATEGIC OVERVIEW Todd Stevens | President & CEO | October 13, 2015

Analyst Presentation – Day 1 Sacramento Basin 19 MMBoe Proved Reserves 7 MBoepd production San Joaquin Basin 525 MMBoe Proved Reserves 114 MBoepd production Ventura Basin 58 MMBoe Proved Reserves 9 MBoepd production Los Angeles Basin 166 MMBoe Proved Reserves 33 MBoepd production • World-Class Resource Base In 4 of 12 largest fields in the continental U.S. 768 MMBoe proved reserves • Capital Structure No significant near-term debt maturities, greater than $750 million current liquidity* Evaluating options to reduce spin-off debt Adjusted 2015 capital investment plan to $440mm, down 80% from 2014 level • Positioned to Grow as Prices Increase Internally funded capital program designed to live within cash flow and drive growth • Low decline rate that is flattening • Increasing crude oil mix improves margins Operating flexibility to shift basins and drive mechanisms to optimize growth through commodity price cycles CRC AT A GLANCE Reserves as of 12/31/14; Production figures reflect average YTD 2015 rates. 6 * As of September 30, 2015

Analyst Presentation – Day 1 CRC OVERVIEW California Pure-Play Net Resource Overview • An independent E&P company spun off by Occidental Focused on high-return assets in California • Largest private mineral acreage-holder, with 2.3 million net acres1 ~60% of total net mineral interests position held in fee1 • Conventional and unconventional opportunities Primary production Waterfloods & gas injection Steam / EOR • Substantial base of Proved Reserves1 768 MMBoe (72% PD, 72% oil, 83% liquids) PV-10 of $16.1 billion (SEC 5-year rule applied to PUDs) San Joaquin Basin 68% 70% PD Los Angeles Basin 22% 76% PD Ventura Basin 8% 72% PD Sacramento Basin 2% 94% PD 1 As of 9/30/2015 219,800 gross locations in known formations as of 12/31/14. Does not include 6,400 prospective resource locations. Total proved reserves by basin (12/31/2014) 14,450 73% 2,000 10% 2,350 12% 1,000 5% San Joaquin Basin Los Angeles Basin Sacramento Basin Ventura Basin Total identified gross drilling locations by basin2 19,800 total gross locations2768 MMBoe, 72% PD, 72% oil 7 Avg. net production by basin (YTD through 6/30/15) San Joaquin Basin 70% 59% Oil Los Angeles Basin 20% 100% Oil Ventura Basin 5% 67% Oil Sacramento Basin 5% (100% Dry Gas) 163 MBoepd, 65% oil
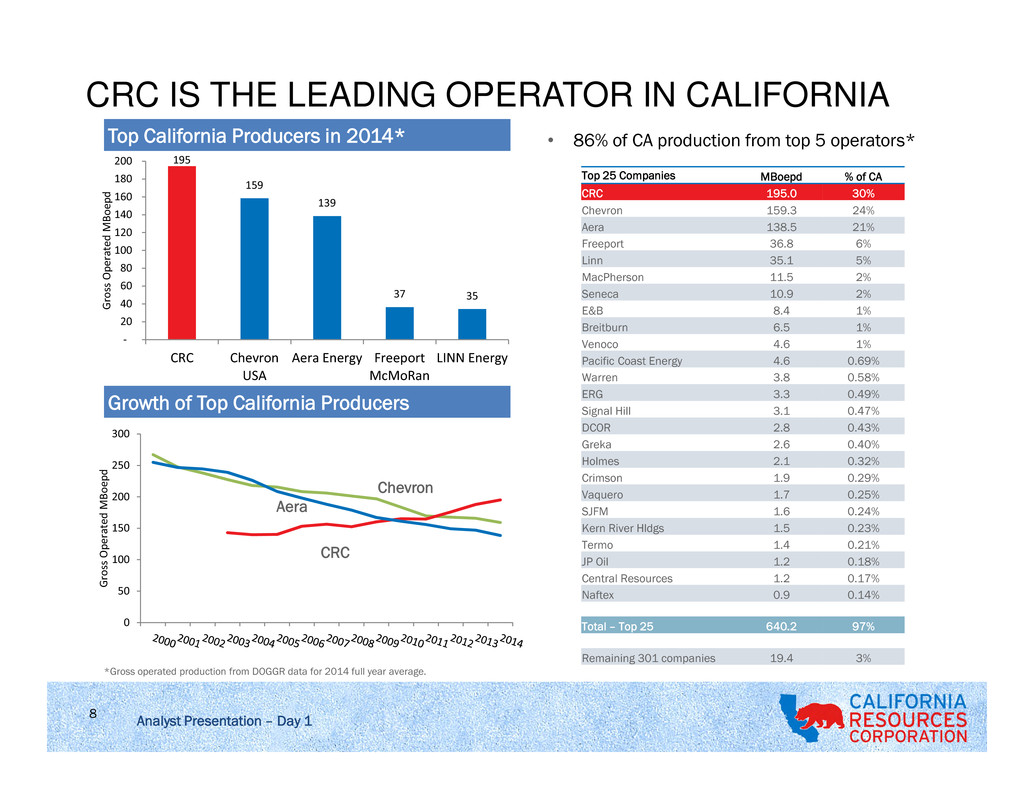
Analyst Presentation – Day 1 8 CRC IS THE LEADING OPERATOR IN CALIFORNIA 0 50 100 150 200 250 300 G ro ss O p er at ed M B o ep d • 86% of CA production from top 5 operators*Top California Producers in 2014* Growth of Top California Producers 195 159 139 37 35 - 20 40 60 80 100 120 140 160 180 200 CRC Chevron USA Aera Energy Freeport McMoRan LINN Energy G ro ss O p er at ed M B o ep d Aera Chevron CRC Top 25 Companies MBoepd % of CA CRC 195.0 30% Chevron 159.3 24% Aera 138.5 21% Freeport 36.8 6% Linn 35.1 5% MacPherson 11.5 2% Seneca 10.9 2% E&B 8.4 1% Breitburn 6.5 1% Venoco 4.6 1% Pacific Coast Energy 4.6 0.69% Warren 3.8 0.58% ERG 3.3 0.49% Signal Hill 3.1 0.47% DCOR 2.8 0.43% Greka 2.6 0.40% Holmes 2.1 0.32% Crimson 1.9 0.29% Vaquero 1.7 0.25% SJFM 1.6 0.24% Kern River Hldgs 1.5 0.23% Termo 1.4 0.21% JP Oil 1.2 0.18% Central Resources 1.2 0.17% Naftex 0.9 0.14% Total – Top 25 640.2 97% Remaining 301 companies 19.4 3% *Gross operated production from DOGGR data for 2014 full year average.

Analyst Presentation – Day 1 9 • Deleveraging is a priority • February credit facility amendment provides additional financial flexibility • Ratings trigger provides security on Bank Facility – Confident in asset coverage • Current Liquidity of >$750 Million, at September 30 • Strategic and opportunistic commodity hedging to support capital program CAPITAL STRUCTURE 1 We have the ability to incur total borrowings of $1.25 billion less outstanding amounts through 12/31/16. 2 Assumes full year interest expense at indicated debt levels and current interest rates. 3 PV-10 as of 12/31/14 based on SEC five-year rule applied to PUDs using SEC price deck. See Appendix for additional information. Capitalization as of 6/30/15 ($MM) $25 $625 $1,000 $1,750 $2,250 $0 $500 $1,000 $1,500 $2,000 $2,500 Ja n -1 6 Ju l- 1 6 Ja n -1 7 Ju l- 1 7 Ja n -1 8 Ju l- 1 8 Ja n -1 9 Ju l- 1 9 Ja n -2 0 Ju l- 2 0 Ja n -2 1 Ju l- 2 1 Ja n -2 2 Ju l- 2 2 Ja n -2 3 Ju l- 2 3 Ja n -2 4 Ju l- 2 4 Term Loan Debt Maturities and Amortizations ($MM) Senior Unsecured RCF 1 590 Senior Unsecured Term Loan 1,000 Senior Unsecured Notes 5,000 Total Debt 6,590 Less cash and deferred financing (101) Total Net Debt 6,489 Equity 2,455 Total Net Capitalization 8,944 Total Net Debt / Net Capitalization 73% Total Net Debt / LTM Adjusted EBITDAX 4.1x LTM Adjusted EBITDAX / Interest Expense 2 4.9x PV-10 3 / Total Net Debt 2.48x Total Net Debt / Proved Reserves ($/Boe) $8.45 Total Net Debt / PD Reserves ($/Boe) $11.76 Total Net Debt / Production ($/Boepd) $40,811

Analyst Presentation – Day 1 10 • Priorities and Response • Deleverage the Balance Sheet for Flexibility • Protect the Base • Defend our Margins • Prepare for Change in Cycle 2015-16 STRATEGIC FOCUS

Analyst Presentation – Day 1 11 CRC 2015 YTD PRIORITY DELIVERY 1. Address Balance Sheet 2. Adjust Activity Levels for Current Environment • Live within means and bring capital investments in line with projected cash flow 3. Focus on base production and protecting our margins 4. Align costs for the current operating environment Narrowed discussions with leading counter- parties on preferred transactions Balanced 2Q15 cash flows of $117 million with capital investment of $95 million Achieved 2Q15 production target with less than expected capital investment Delivered average 2Q15 oil production of 104,000 Bopd, up 7% yoy period and higher than the FY 2014 average of 99,000 Bopd Focused on costs. Cash costs on a per Boe basis excluding interest expense declined ~9% in 2Q15 vs 2Q14 • Production costs down to $16.59/Boe for 2Q15, compared to $19.03/Boe in 2Q14 Priorities Execution

Analyst Presentation – Day 1 12 2015-16 STRATEGIC FOCUS • Priorities and response • Deleverage the Balance Sheet for Flexibility • Protect the Base • Defend our Margins • Prepare for Change in Cycle

Analyst Presentation – Day 1 • Exploring adjustments to capital structure Total long-term debt: ~$6.5 billion, net, at 6/30/2015 Proactively sought and received favorable amendment to revolver and term loan through end of 2016 Resource base enables a variety of alternatives Given the long time horizon and growth potential of the company’s asset base, management is conducting a thoughtful assessment of the various midstream and upstream alternatives to enhance shareholder value • Our model for internally funded capital budgets Capital budget is internally funded and is designed to live within free cash flow after debt service Select projects on the basis of potential future value creation (VCI)1 Target expected value creation of 30% per invested dollar using VCI metric Maintain significant operational flexibility to adjust production CAPITAL ALLOCATION PRIORITY: DE-LEVERAGING BALANCE SHEET 1 The VCI for each project is calculated by dividing the net present value of the project's expected pre-tax cash flow over its life by the present value of the investments, each using a 10% discount rate. Projects are expected to meet a VCI of 1.3, meaning that 30% of expected value is created for every dollar invested. 13
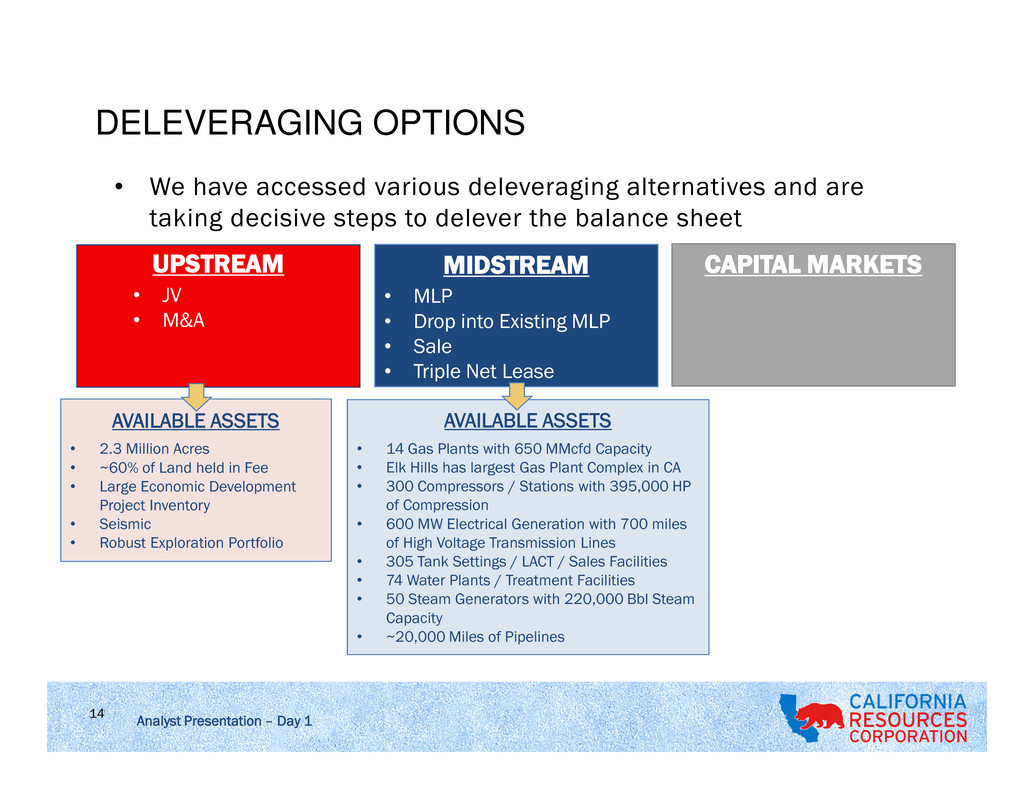
Analyst Presentation – Day 1 14 • We have accessed various deleveraging alternatives and are taking decisive steps to delever the balance sheet DELEVERAGING OPTIONS UPSTREAM • JV • M&A MIDSTREAM • MLP • Drop into Existing MLP • Sale • Triple Net Lease CAPITAL MARKETS AVAILABLE ASSETS • 14 Gas Plants with 650 MMcfd Capacity • Elk Hills has largest Gas Plant Complex in CA • 300 Compressors / Stations with 395,000 HP of Compression • 600 MW Electrical Generation with 700 miles of High Voltage Transmission Lines • 305 Tank Settings / LACT / Sales Facilities • 74 Water Plants / Treatment Facilities • 50 Steam Generators with 220,000 Bbl Steam Capacity • ~20,000 Miles of Pipelines AVAILABLE ASSETS • 2.3 Million Acres • ~60% of Land held in Fee • Large Economic Development Project Inventory • Seismic • Robust Exploration Portfolio

Analyst Presentation – Day 1 15 2015-16 STRATEGIC OPTIONS • Priorities and response • Deleverage the Balance Sheet for Flexibility • Protect the Base • Defend our Margins • Prepare for Change in Cycle

Analyst Presentation – Day 1 16 CAPITAL ALLOCATION APPROACH • Portfolio Management since spin-off • Three principal drivers: o Maximize long-term value – VCI > 1.3 o Oil production growth o Financial discipline – self-funding business • Results in combination of projects that provide quick payback (workovers), longer term value / future growth (steamfloods/waterfloods) and high IP’s (conventional/tight sands/unconventional). PV10 pre-tax cash flows PV10 of investments VCI = Value Creation Index Measures value created per dollar investment (“Bang for the buck”)

Analyst Presentation – Day 1 17 • Capital associated with currently identified projects delivering VCI >1.3* • Current average well cost ~$1.1 MM • Multi-year inventory to maintain flat production at different points in the price curve FLEXIBLE HIGH RETURN INVENTORY $0.0 $1.0 $2.0 $3.0 $4.0 $5.0 $6.0 $7.0 $8.0 55 65 75 85 D ri lli n g C a p it a l( $ B ) Brent $/Bbl Actionable Inventory at Various Price Levels Workovers Steamflood Primary Waterflood Unconventional Pace – Rigs/Year Years of Inventory 3 11.1 24.0 37.1 45.9 5 6.7 14.4 22.2 27.5 7 4.8 10.3 15.9 19.7 10 3.3 7.2 11.1 13.8 * Does not include injectors

Analyst Presentation – Day 1 18 BEST IN CLASS CORPORATE DECLINE RATE Unlabeled operators include : AMXG, AREX, BBG, BCEI, CLR, CPE, CRK, CWEI, CXO, EGN, EOG, EPE, EXXI, FANG, GDP, HK, JONE, LPI, MPO, NFX, OAS, PDCE, PE, PVA, PXD, ROSE, RSPP, SFY, SM, SN, TPLM, WTI, XEC Source: ITG IR, raw data provided by Drilling Info, Inc.

JRCO 0915Analyst Presentation – Day 1 0 20 40 60 80 100 120 2011 2012 2013 2014 2015 2016E 2017E 2018E M b o p d CRC Historical Maintenance CRC Decline Average Peer Company Median Peer ~35% Corporate Decline CRC ~15% Corporate Decline CAPITAL EFFICIENT PORTFOLIO OUTPERFORMS IN ‘LOWER FOR LONGER’ 19 CRC Oil Production Hypothetical Comparison Plays Capital Required to Maintain Oil Production ($mm)* Ratio vs CRC Investment Bakken $1,300 2.0x Permian Wolfcamp $1,150 1.8x Permian Bone Springs $1,250 1.9x CRC-Full Cycle $600 - $700 1.0x *Denotes D&C capital investment required to maintain 100 Mbopd oil production using Wood Mackenzie type curves published in May/June 2015 for the various plays assuming a 35% decline rate. Source: Wood Mackenzie, ITG IR, CRC Estimates

JRCO 0915Analyst Presentation – Day 1 Rich asset portfolio and thoughtful capital allocation deliver high margin production and operational flexibility through the price cycle • Conventional assets have relatively low decline rates, long production life • Steamflood and waterflood investments will deliver crude oil growth in 2015 with little new investment; characterized by single digit base decline rates • Large inventory of conventional development projects that are expected to be repeatable, with low technical risk Application of modern technologies produces growth opportunity in California • Deferring many high-return project opportunities until prices rise • Identifying investments economically viable through commodity price cycles RESOURCE BASE ENABLES RESILIENT PRODUCTION PROFILE 1Q14 2Q14 3Q14 4Q14 1Q15 2Q15 3Q15E FY 2014 FY 2015E Production By Stream (MBoepd) Oil NGL Gas Guidance Range Average Total Production 159 Mboepd Average Oil Production 99 MBblpd 20

Analyst Presentation – Day 1 21 DIVERSIFIED PRODUCTION – TOP 10 FIELDS 0 20,000 40,000 60,000 80,000 100,000 120,000 140,000 160,000 180,000 2011 2012 2013 2014 1H 2015 B o e p d Production by Field Unconventional Waterflood Conventional Steamflood Gas Other Fields

Analyst Presentation – Day 1 22 2015-16 STRATEGIC FOCUS • Priorities and response • Deleverage the Balance Sheet for Flexibility • Protect the Base • Defend our Margins • Prepare for Change in Cycle

Analyst Presentation – Day 1 23 STRONG RETURNS THROUGH THE COMMODITY CYCLE Oil Prices ↑ / Gas Prices ↓ • Invest in steam floods (above 5x Oil/Gas ratio) • Conventional, waterflood and unconventional oil opportunities • Gas used at the Elk Hills power plant (electricity) • San Joaquin and Ventura Conventional (Pleito), Long Beach WF, Huntington Beach WF, Buena Vista Oil Prices ↓ / Gas Prices ↓ • Invest in steam floods (above 5x Oil/Gas ratio) • Oil projects down to $24.50/barrel* • Gas projects down to ~$1.75/Mcf • Mount Poso/Eastern Shallow Oil Zone at Elk Hills; Kern Front Steamfloods, Long Beach WF, Workovers Oil Prices ↑ / Gas Prices ↑ • Gas price is a cost for steam floods. Invest in steam floods above 5x Oil/Gas ratio • Many projects commercial in CRC’s high- graded portfolio • Conventional and unconventional oil and gas opportunities • All basins work, deep drilling and exploration Oil Prices ↓ / Gas Prices ↑ • Invest in steam floods (above 5x Oil/Gas ratio) • Invest in Sacramento gas projects, take advantage of dominant position in the basin • Oil projects down to $24.50/barrel* • Sacramento Basin, Elk Hills, San Joaquin Shales (Elk Hills 29R, Buena Vista Shales) * Reflect 1.3 VCI projects

JRCO 0915Analyst Presentation – Day 1 CRC EXECUTING ON CONTROLLABLES 24 1236 232 0 200 400 600 800 1000 1200 1400 1600 1H14 Volume Price Costs Interest Tax Working Capital and Other 1H15 $ M M O p e ra ti n g C a sh F lo w

Analyst Presentation – Day 1 25 STABLE LEASEHOLD POSITION 41,757 46,768 137,858 96,872 937 391 2,192 7,638 9,626 8,336 18,422 24,557 0 500,000 1,000,000 1,500,000 2,000,000 2014 2015 2016 2017 N e t A cr e s San Joaquin Basin Ventura Basin Sacramento Basin Note: Los Angeles Basin has no net undeveloped acreage lease expirations through 2017. Net undeveloped acreage lease expirations San Joaquin Basin Los Angeles Basin Ventura Basin Sacramento Basin Total CRC Net acreage held in fee (000s) 996 18 161 194 1,368 % net acreage held in fee 64% 51% 70% 37% ~60% Net undeveloped acreage (000s) 1,186 14 162 271 1,633 Total net acreage (000s) 1,566 35 229 520 2,350 % undeveloped 76% 40% 71% 52% 69% As of September 30, 2015

Analyst Presentation – Day 1 26 2015-16 STRATEGIC FOCUS • Priorities and response • Deleverage the Balance Sheet for Flexibility • Protect the Base • Defend our Margins • Prepare for Change in Cycle

Analyst Presentation – Day 1 27 LOWER FOR LONGER? 0 0.2 0.4 0.6 0.8 1 1.2 1.4 8/12/1985 8/12/1986 8/12/1987 8/12/1988 8/12/1989 8/12/1990 WTI Crude Price Index 1986 Price Decline 2014 Price Decline Source: Bloomberg 2014 Price Series begins at June 1, 2014.

Analyst Presentation – Day 1 28 CAN WE TRUST THE CURVE? 0 20 40 60 80 100 120 140 1 /1 /2 0 0 0 9 /1 /2 0 0 0 5 /1 /2 0 0 1 1 /1 /2 0 0 2 9 /1 /2 0 0 2 5 /1 /2 0 0 3 1 /1 /2 0 0 4 9 /1 /2 0 0 4 5 /1 /2 0 0 5 1 /1 /2 0 0 6 9 /1 /2 0 0 6 5 /1 /2 0 0 7 1 /1 /2 0 0 8 9 /1 /2 0 0 8 5 /1 /2 0 0 9 1 /1 /2 0 1 0 9 /1 /2 0 1 0 5 /1 /2 0 1 1 1 /1 /2 0 1 2 9 /1 /2 0 1 2 5 /1 /2 0 1 3 1 /1 /2 0 1 4 9 /1 /2 0 1 4 5 /1 /2 0 1 5 1 /1 /2 0 1 6 9 /1 /2 0 1 6 5 /1 /2 0 1 7 1 /1 /2 0 1 8 9 /1 /2 0 1 8 5 /1 /2 0 1 9 1 /1 /2 0 2 0 9 /1 /2 0 2 0 5 /1 /2 0 2 1 1 /1 /2 0 2 2 9 /1 /2 0 2 2 15 Years of Brent Market Outlooks Brent Jan-06 Sep-08 Jan-09 Sep-10 Sep-14 Mar-15 Sep-15

Analyst Presentation – Day 1 29 WHAT IS THE NEW NORMAL? Conventional/Pre-Shale Tight Spare Capacity Political PremiumsNew Normal Source: Bloomberg, WTI (1/1995 – 9/2015) WTI $/Bbl F re q u e n cy (D a ys ) WTI Daily Price Frequency

Analyst Presentation – Day 1 30 MARGINAL SUPPLY NEEDS $70+ (BRENT) Goldman Sachs estimates for breakeven prices do not include the costs of acreage acquisition or exploration that, if included, would lead to higher breakeven commodity prices. This can be particularly material for North American onshore resource plays Source: Goldman Sachs Global Investment Research Marginal heavy oil and deepwater More Canadian heavy oil, Angola pre-salt, West Africa offshore Brazil Campos basin, Bakken shale non-core, GoM Paleogene, Argentina shale, Angola pre-salt, Libra Brazil Santos basin, best of GoM, Johan Sverdrup, more Russia Best of Canadian heavy oil, Bakken Core, Eagle Ford Oil, Permian, more GoM, more Russia Kurdistan, Kenya Brazil Santos transfer of rights, best of Russia Exhibit 24: Marginal Top 420 oil fields require US $70/bl= oil price Breakeven of non-producing and recently onstream oil assets 5,000 10,000 15,000 20,000 25,000 30,000 35,000 40,000 Cumulative peak oil production (kb/d) C o m m e rc ia lb re a k e ve n (U S $ /b l) 140 130 120 110 100 90 80 70 60 50 40 30 20 10

Analyst Presentation – Day 1 31 CALIFORNIA IS A WORLD-CLASS OIL PROVINCE 1 Produced volumes: California Division of Oil, Gas & Geothermal Resources (“DOGGR”). • Over 35 billion Boe produced since 18761 • Pico Canyon #4 was the first well with commercial production west of the Rockies and produced from 1876 to 1992 • Rich marine oil and gas source rocks • Underexplored with large undiscovered resources • ~ 50 different active plays • We have operated in California since the 1950s • California's oil-in-place estimates have grown over many decades, and CRC expects to continue to expand its resource base with the increasing application of proven, modern technologies San Francisco Los Angeles Bakersfield Sacramento CRC Fee/LeaseRC F e/Lease 2 billion Boe1 19 billion Boe1 4 billion Boe1 10 billion Boe1
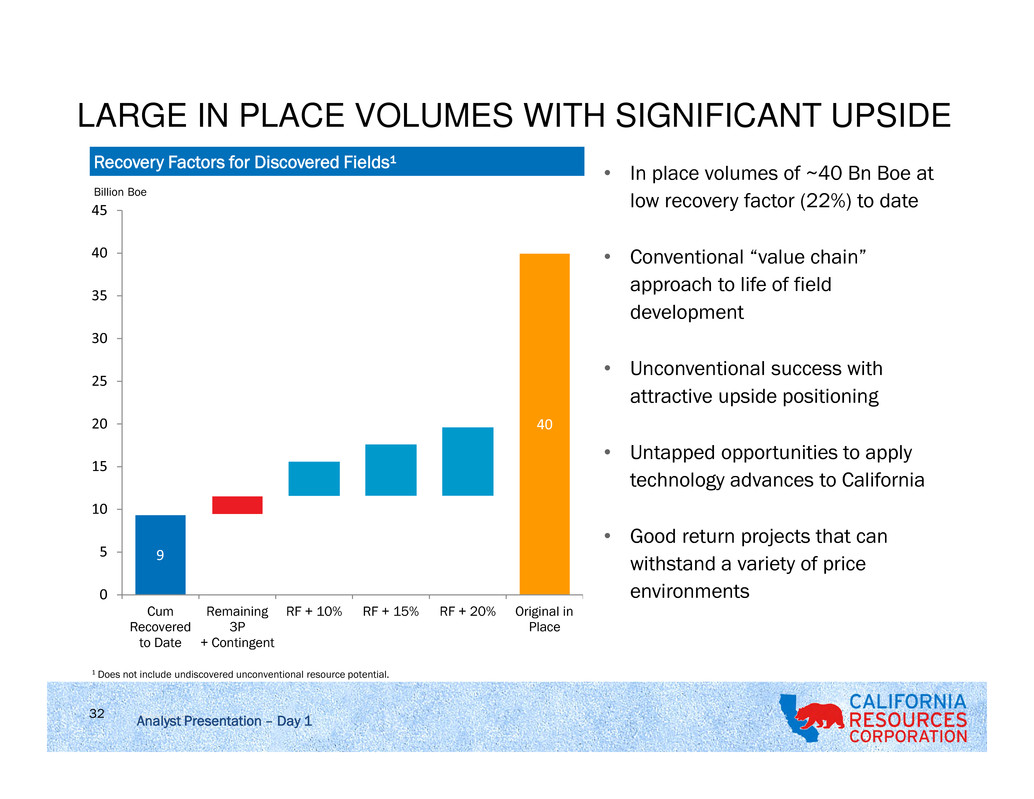
JRCO 0915Analyst Presentation – Day 1 Recovery Factors for Discovered Fields¹ 9 40 0 5 10 15 20 25 30 35 40 45 Cum Recovered to Date Remaining 3P + Contingent RF + 10% RF + 15% RF + 20% Original in Place Billion Boe 1 Does not include undiscovered unconventional resource potential. • In place volumes of ~40 Bn Boe at low recovery factor (22%) to date • Conventional “value chain” approach to life of field development • Unconventional success with attractive upside positioning • Untapped opportunities to apply technology advances to California • Good return projects that can withstand a variety of price environments LARGE IN PLACE VOLUMES WITH SIGNIFICANT UPSIDE 32

JRCO 0915Analyst Presentation – Day 1 • Conventional fields in various stages of development • Base assets in place – advancing recovery with traditional means • Moving recoveries from primary through EOR • Primary (94 fields) • Production with natural energy of reservoir or gravity drainage • Waterflood (17 fields) • Incremental recovery beyond primary with pressure support and displacement • Steam / EOR (13 fields) • Enhanced recovery from reservoirs using techniques such as steam or CO2 0 10 20 30 40 50 60 70 80 Primary Waterflood Steam R e co ve ry o f O ri g .i n P la ce ;R F % Approximate current average CRC RF% Development program is based on reservoir characteristics, reserves potential and expected returns Typical Recoveries by Mechanism Type CREATING A RECOVERY VALUE CHAIN 33

Analyst Presentation – Day 1 34 MULTIPLE STACKED PAY OPPORTUNITIES • California basins have significant resource potential in stacked conventional and unconventional reservoirs • Conventional reservoirs: • Reservoirs that are capable of natural flow and will produce economic volumes of oil and gas without special recovery techniques • Reservoirs: Sands and shales with good porosity, permeability and/or fracture development • Development: Densely spaced vertical wells • Unconventional reservoirs: • Reservoirs that cannot be produced at economic flow rates or that do not produce economic volumes of oil and gas without assistance from stimulation treatments or special recovery processes and technologies • Reservoirs: Sands and shales with low porosity, permeability and fractures • Technologies: Hydraulic fracturing and acid treatment • Development: Mostly vertical and horizontal wells Conventional Reservoirs Unconventional Reservoirs • Heavy oil trend • Conventional production • 500 – 1,000’ thick source rock • TOC 2-18% • Productive in Kettleman North and Middle Dome • Excellent reservoir properties • High well productivity • Stacked sands, individual reservoirs 100-500’+ • Productive at Elk Hills, Kettleman North Dome • 200 – 500’ thick source rock • TOC 1 – 6% L O W E R M O N TE R E Y T E M B LO R K R E Y E N H A G E N M O R E N O L O D O U P P E R M O N TE R E Y E T C H E G O IN 5 0 0 ’ • 500 – 3,500’ thick • Stacked pay • Good reservoir quality • Productive at Elk Hills, Buena Vista and North Shafter • 250-500’ thick source rock • TOC 1-12% • 200-500’ thick sands • Good reservoir quality Source: Information based on internal observed data and external published reports.

Analyst Presentation – Day 1 35 THE ADVANCEMENT OF OIL FIELD TECHNOLOGY IN CALIFORNIA 1930 1940 1950 1960 1970 1980 19901910 1920 2000 2010 2020 Majors In California Focus on Shallow Steam Fields left undeveloped CRC Growth Hand-drawn maps Open Hole Completions 3D Seismic and Microseismic Cable Drilling Offshore Horizontal Electric Logs Onshore Horizontal 2D Seismic Geosteering Rig Drilling Dynamic Electric Logs Image Logs Computer-Aided 3D Geomodeling IOR / EOR Technologies Cased Hole Completions Frac and Acid Completions Advanced Technology Improves Old Fields Majors Pull Out of CA • Implementation • Improving deep drilling efficiency • Cost per well reductions 30%1 • High success rates in targets • Identification • Proprietary seismic interpretations • Improving understanding of rock physics and pay zone identification • Testing stimulation methods and response predictions • Basic industry techniques so far • Learning from other shale areas 1 Cost / well for deeper unconventional drilling has decreased 30% since 2012.

Analyst Presentation – Day 1 36 2014 Net Proved Reserves (MMBoe) 768 2014 % Oil– Net Proved 72% Pre-Tax Proved PV-10 ($ millions)1 $16,091 2015 Avg. Net Production (MBoepd)2 163 2015 % Oil2 65% 2015 Net Acreage (‘000 acres) 3 2,350 2014 Identified Gross Locations 19,800 1 PV-10 shown as of 12/31/14 based on SEC five-year rule applied to PUDs using SEC-based realized price deck of $95.20/Bbl and $4.73/Mcf. 2 YTD through June 30, 2015 3 As of September 30, 2015 San Joaquin Basin Los Angeles Basin Ventura Basin Sacramento Basin 2014 Net Proved Reserves (MMBoe) 525 166 58 19 2014 % Liquids – Net Proved 80% 98% 88% 0% 2015 Avg. Net Production (MBoepd) 2 114 33 9 7 2015 % Oil 2 59% 100% 67% 0% 2015 Net Acreage (million acres) 3 1.6 <0.1 0.2 0.5 2014 Identified Gross Drilling Locations 14,450 2,000 2,350 1,000 WORLD CLASS ASSETS WITH SIGNIFICANT DEVELOPMENT OPPORTUNITIES • Diversity of basins, drive mechanisms • Predictable production, low decline rates • Multi-stacked reservoirs • Development targets include repeatable projects with low technical risk

Analyst Presentation – Day 1 • World-class asset base with diverse and rich resources. • Capacity for significant production growth at higher prices as we develop high-return, lower-risk opportunities. • Committed to capital budgets that live within our cash flows. • As we bring our capital structure in line with today’s prices, we’re focusing on our best options to de-leverage. • Legacy of safe production and commitment to community and regulatory outreach in California. WELL POSITIONED FOR GROWTH IN RECOVERY 37

MARKETING Carlos Contreras | VP Commercial | October 13, 2015

Analyst Presentation – Day 1 39 • Crude • With the isolating factors of infrastructure and necessity for waterborne crude in the CA crude market, postings tend to follow the Brent benchmark along with the Brent WTI spread • Natural Gas • CRC produces 1/3 of the natural gas in California • CRC has the ability to service markets throughout the state of California as well as outside markets • NGLs • Largest NGL marketer in the state • Looking for opportunities in new markets • Higher Propane margins than the Gulf Coast KEY TAKEAWAYS

Analyst Presentation – Day 1 40 Waterborne crude imported into the Gulf and East Coast can flow through the center and east regions of the country with the advanced pipe and rail network. 71% of waterborne crude is imported into these two regions. Unlike California where limited infrastructure investment has occurred. CALIFORNIA IS AN ISLAND • CA prod 592 Mbpd • CA imports 1,030 Mbpd • No interstate crude pipeline • Rail is one-directional CAPTIVE MARKET Top Imports by Source (Mbpd) Saudi Arabia 268 ANS 212 Ecuador 137 Colombia 134 Kuwait 74 API Weighted Average California 18 Import Barrels 30 Source: Clipperdata.com

Analyst Presentation – Day 1 41 CRC – PRICE REALIZATIONS $95.12 $94.21 $97.97 $93.00 $53.29 $103.80 $104.02 $104.16 $92.30 $51.51 $110.90 $111.70 $108.76 $99.51 $59.33 $30 $40 $50 $60 $70 $80 $90 $100 $110 $120 2011 2012 2013 2014 1H15 $ /B b l WTI Realizations Brent $4.11 $2.81 $3.66 $4.39 $2.90 $4.31 $2.94 $3.73 $4.34 $2.67 0.0 0.5 1.0 1.5 2.0 2.5 3.0 3.5 4.0 4.5 5.0 2011 2012 2013 2014 1H15 $ /M cf NYMEX Realizations NGL Price Realization - % of WTI Realization % of WTI 109% 110% 106 % 99% 97% Realization % of NYMEX 105% 105 % 102 % 101% 92% Oil Price Realization Gas Price Realization 74% 56% 51% 51% 39% 0% 10% 20% 30% 40% 50% 60% 70% 80% 2011 2012 2013 2014 1H15 % o f W TI • Since California imports a significant percentage of its crude oil requirements, California refiners typically purchase crude oil at international index-based prices for comparable grades • California also imports approximately 90% of its natural gas • Discrete California market issues have impacted differentials

Analyst Presentation – Day 1 42 CVO 260 P66 120 TSO 165 VLO 170 Shell 165 SF Bay Area Refineries CVX 290 TSO 265 TSO 100 P66 140 VLO 135 XOM 155 LA Area Refineries 72M 6.5M 40M SJ Valley Refineries CRC crude California Refining Capacity: 13 total Refineries, 2.0 MMBopd Kern 25 SJVR 10 CRC CRUDE – DAILY MARKETED BARRELS Northbound Bbls/d Various pipelines to Bay Area 48,000 Southbound Bbls/d Plains Pipeline to Los Angeles 15,000 Local Pipeline & Truck Bbls/d Bakersfield Refineries 6,800 Ventura 6,500 LA Basin 38,500 Trucks 3,700 Total Marketed Production 118,500

Analyst Presentation – Day 1 800 909 1,049 1,037 1,087 1,005 1,068 1,014 941 1,070 538 547 547 548 551 559 564 565 566 55851 50 52 51 48 51 53 50 50 46 8 13 16 32 16 19 13 15 8 3 - 200 400 600 800 1,000 1,200 1,400 1,600 1,800 1Q 2013 2Q 2013 3Q 2013 4Q 2013 1Q 2014 2Q 2014 3Q 2014 4Q 2014 1Q 2015 2Q 2015 CALIFORNIA REFINERY SUPPLY, MBOPD Waterborne Imports CA Production PADD V Offshore (federal) Rail Imports 43 WATERBORNE IMPORTS DOMINATE CA SUPPLY Source: Clipperdata.com, EIA, California Energy Commission Energy Almanac
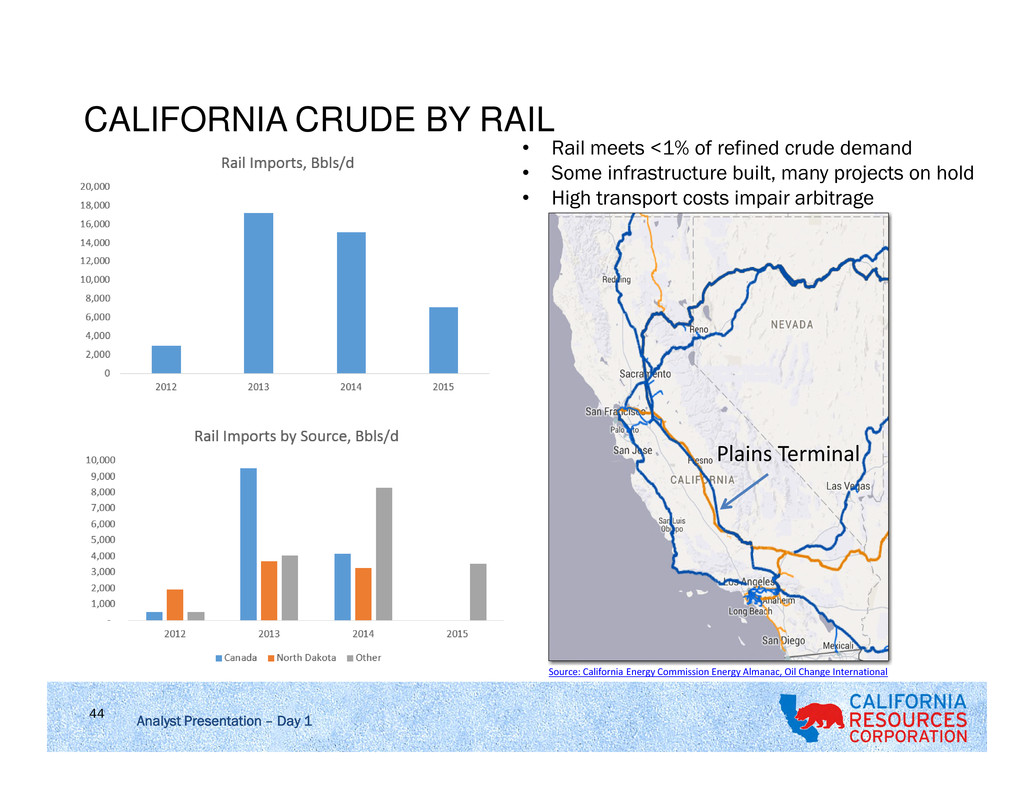
Analyst Presentation – Day 1 44 Source: California Energy Commission Energy Almanac, Oil Change International • Rail meets <1% of refined crude demand • Some infrastructure built, many projects on hold • High transport costs impair arbitrage CALIFORNIA CRUDE BY RAIL Plains Terminal

Analyst Presentation – Day 1 45 OPPORTUNISTICALLY BUILT HEDGE PORTFOLIO • Hedge book started at zero post spin target hedges on 50% of production • Strategy focuses on protecting cash flow for capital investments • Hedge transactions completed with multiple counterparties $40 $45 $50 $55 $60 $65 $70 $75 $80 30,000 Bbl/d $72.12 call 70,000 Bbl/d $52.14 put 40,000 Bbl/d $73.88 call 35,500 Bbl/d $66.15 call 3,000 Bbl/d $74.42 call 40,000 Bbl/d $61.25 put 30,500 Bbl/d $52.38 put 3,000 Bbl/d $50.00 put

Analyst Presentation – Day 1 46 • CRC produces ~230,000 Mcf/d (4% of CA demand) • Ability to service markets throughout CA as well as others • 80% sold to Southern CA markets via SoCal Gas, Kern, Mojave • 20% sold to Northern CA market via PG&E, other direct markets • CRC’s Elk Hills Power Plant consumes 80,000 Mcf/d CRC NATURAL GAS MARKET Source: EIA Production Bcfd % California 0.6 10% Canada 0.95 16% Southwest 2.3 38% Rocky Mountains 2.2 36% Total 6.1 100% Rockies Canada Southwest

Analyst Presentation – Day 1 47 SOCAL BORDER BASIS COMPARISON TO NYMEX HENRYHUB Historical: 2011-2014: New supply outside California causes NYMEX prices to weaken relative to California prices 1H15: Cold temps and higher demand in East keeps NYMEX prices high relative to California prices Forward: 2015-2018: Winter NYMEX prices are expected to be strong relative to California prices, as they have been for the past several winters 2018+: New demand from Mexico is expected to reduce supplies to California. This is expected to push California higher relative to NYMEX Source: Pacific Gas and Electric Company, EIA

Analyst Presentation – Day 1 48 INTERNAL HEDGE ON NATURAL GAS • 60,000 mmbtu/d Natural Hedge with thermal operations Thermal Operations buys 60,000 mmbtu/d When prices fall, Thermal Ops benefits from lower gas cost • More than 50% of our natural gas production is either internally hedged or financially hedged $2.60 $2.70 $2.80 $2.90 $3.00 $3.10 $3.20 7/15 8/15 9/15 10/15 11/15 12/15 20,000 MMBTU/d $3.165 NYMEX HH call 40,000 MMBTU/d $3.01 NGI SoCal Border Basis Swap 20,000 MMBTU/d $2.80 NYMEX HH put

Analyst Presentation – Day 1 49 • Largest NGL producer in CA ~20,000 bpd • Breakdown of NGL production: Propane – 53% Butane – 33% Natural Gasoline – 14% • ~75% of the propane is sold into Mexican market Balance sold locally • Normal and Iso Butane moves to LA and San Francisco Bay area refiners for motor gasoline production • 90% of natural gasoline sold to Canadian markets to be used as diluent • Load 35 trucks and 10 rail cars per day of propane and natural gas CRC NATURAL GAS LIQUIDS MARKETING Bakersfield Natural Gasoline Canada Butane Bay Area Butane Los Angeles Propane Tijuana Propane Calexico
Analyst Presentation – Day 1 50 • Crude • With the isolating factors of infrastructure and necessity for waterborne crude in the CA crude market, postings tend to follow the Brent benchmark along with the Brent WTI spread • Natural Gas • CRC produces 1/3 of the natural gas in California • CRC has the ability to service markets throughout the state of California as well as outside markets • NGLs • Largest NGL marketer in the state • Looking for opportunities in new markets • Higher Propane margins than the Gulf Coast SUMMARY

REGULATORY OVERVIEW Charlie Weiss | EVP – Public Affairs | October 13, 2015
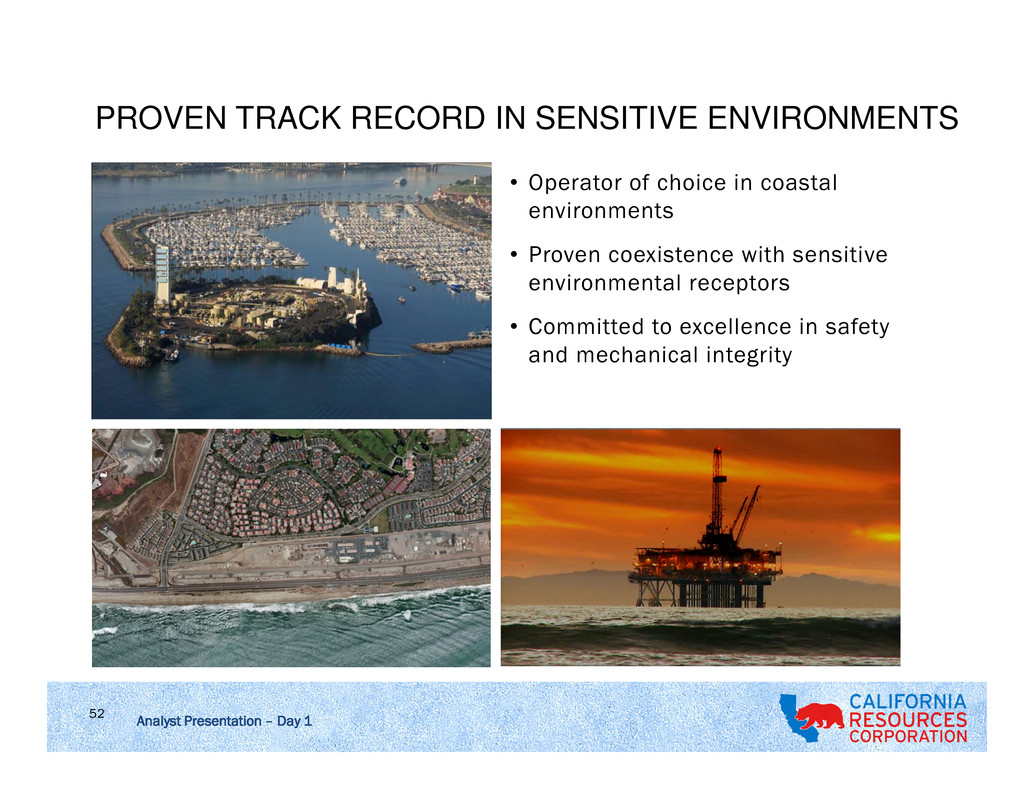
Analyst Presentation – Day 1 52 PROVEN TRACK RECORD IN SENSITIVE ENVIRONMENTS • Operator of choice in coastal environments • Proven coexistence with sensitive environmental receptors • Committed to excellence in safety and mechanical integrity

Analyst Presentation – Day 1 53 A NET WATER SUPPLIER • Provide more reclaimed produced water to agriculture than the amount of fresh water we purchase for operations statewide • In 2014, we used approximately 79% of produced water in improved or enhanced recovery operations • 3-year goal: Increase net water supply to agriculture by > 10% above the 2014 level of 204 million gallons 94% 4% 2% WATER MANAGED IN CRC’s 2014 OPERATIONS Produced Water Fresh Water Non-Fresh Water In 2014, CRC’s steamflood operations supplied more than 2 billion gallons – over 6,200 acre-feet – of water for irrigation This preserves fresh water for other beneficial uses, equivalent to the needs of approximately 13,700 families per year CRC’s operations in Long Beach use recycled water for approximately 99 percent of their total water use

Analyst Presentation – Day 1 54 EXAMPLE: LONG BEACH WATER CONSERVATION • Target 50% reduction in fresh water usage o Expect to reach 10 MBPD fresh water goal by YE15 o Compare to ~1.8 MMBPD water injected (~0.6%) o Remaining fresh water use by workers, power plant and island habitat • Economic venture: 1.8 VCI10 on $1.5MM invested Eliminating fresh water: • Bearing cooling • Drilling muds • Completion fluids • Pipeline hydro-testing • Dust mitigation 0 5 10 15 20 25 30 F re sh W a te r (m b p d ) THUMS Tidelands Huntington Beach Power Plant

Analyst Presentation – Day 1 55 WATER MANAGEMENT REGULATIONS • California is changing water rights and allocations o CRC’s water supplies have not been curtailed to date o CRC has reduced fresh water use through recycling and conservation measures o The state is reassessing longstanding permitted water recycling and disposal • Underground Injection Control o State agencies are reviewing certain permitted injection wells and aquifer exemptions o The state intends to restrict water disposal into zones at oil and gas fields with less salinity over the next 18 months, unless U.S. EPA reissues aquifer exemptions o CRC is pursuing certain aquifer exemptions while continuing to increase our water recycling and reclamation • Reclaimed Water to Agriculture o Reclaimed produced water used safely for irrigation over 30 years without incident o State scientific panel is reviewing use of reclaimed water o CRC has partnered with a water district to triple our delivery of reclaimed water for irrigation and recharge in the next few years

Analyst Presentation – Day 1 56 WELL STIMULATION REGULATIONS • 2015 regulations and studies should make hydraulic fracturing and well stimulation permitting more predictable o Final DOGGR well stimulation regulations in effect under Senate Bill 4 o State Water Board groundwater monitoring regulations issued o U.S. EPA five-year scientific study issued o California Council on Science and Technology studies issued o DOGGR statewide environmental impact report (EIR) certified o Public comment period completed for Kern County EIR o Governor appointed interagency panel to review and act on recent studies • CRC is implementing well stimulation jobs that exceed our VCI threshold

Analyst Presentation – Day 1 57 2015 LEGISLATIVE DEVELOPMENTS • SB 350: Key state energy legislation enacted Governor’s goals to double electricity generation from renewables and energy efficiency of buildings by 2030 • State Assembly rejected other proposals this year to: o Restrict use of petroleum in motor vehicle fuels in California o Expand the state’s greenhouse gas cap and trade program o Impose additional restrictions on oil and gas operations o Reduce DOGGR’s discretion in overseeing oil and gas operations • CRC engages proactively with business, labor, agriculture and community organizations on legislative and regulatory proposals

WATERFLOODING Jerry Foster, PE | Reservoir Engineering Manager - IOR/EOR Team | October 13, 2015

Analyst Presentation – Day 1 59 Definition Recovery phases Why waterflood? Increase oil recovery Key success factors CRC portfolio CRC demonstrates success Take home messages Learn nomenclature & concepts Cliffs Notes

Analyst Presentation – Day 1 60 DEFINITION: WATERFLOOD • Waterflooding is a process used to inject water into an oil- bearing reservoir for pressure maintenance as well as for displacing and producing incremental oil.
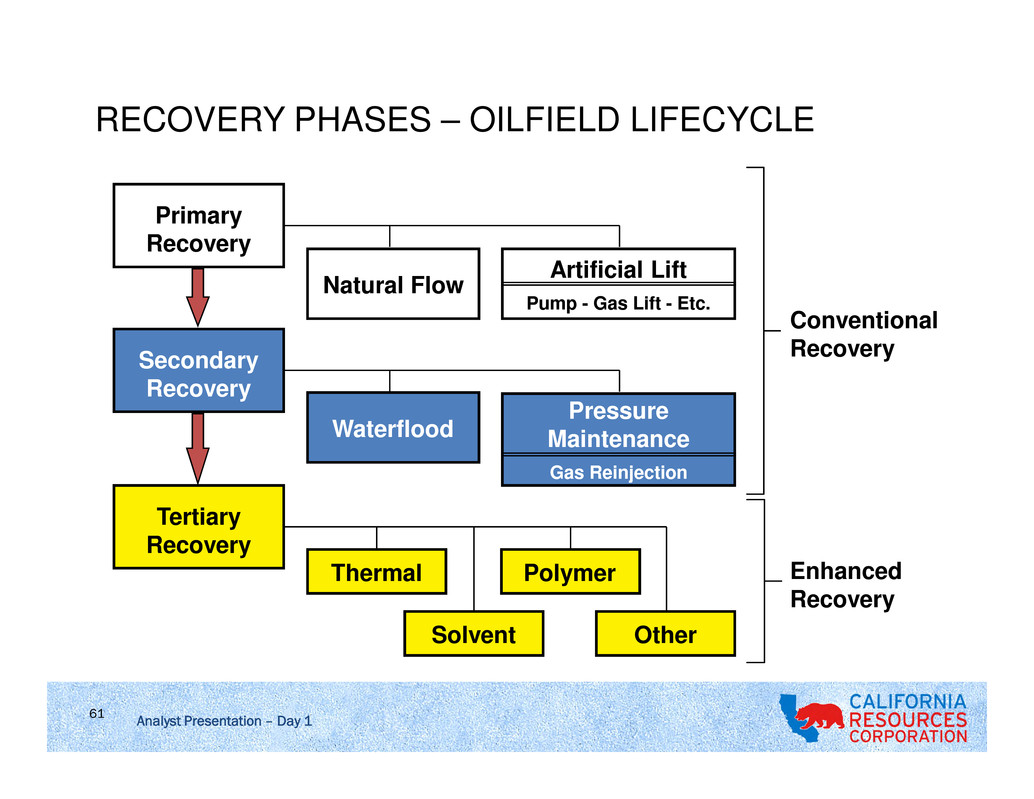
Analyst Presentation – Day 1 61 RECOVERY PHASES – OILFIELD LIFECYCLE Conventional Recovery Enhanced Recovery Tertiary Recovery Other Polymer Solvent Thermal Pressure Maintenance Gas Reinjection Secondary Recovery Artificial Lift Pump - Gas Lift - Etc. Waterflood Natural Flow Primary Recovery
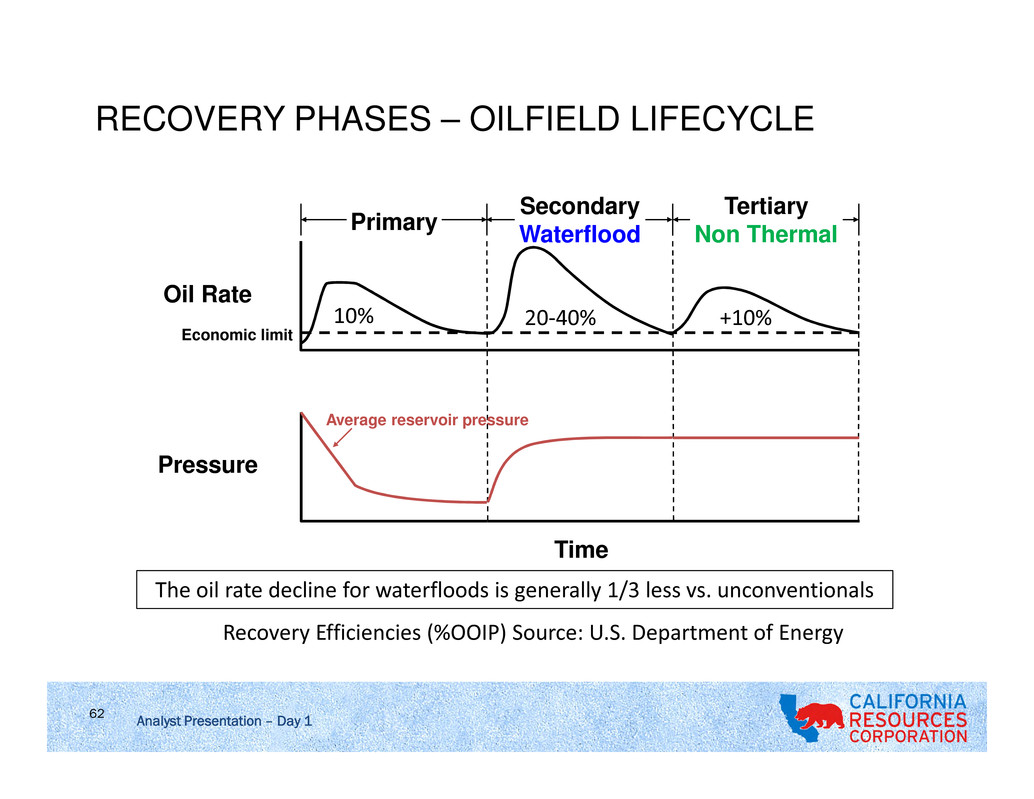
Analyst Presentation – Day 1 62 RECOVERY PHASES – OILFIELD LIFECYCLE Primary Secondary Waterflood Tertiary Non Thermal Oil Rate Pressure Economic limit Time Average reservoir pressure Recovery Efficiencies (%OOIP) Source: U.S. Department of Energy 10% 20-40% +10% The oil rate decline for waterfloods is generally 1/3 less vs. unconventionals
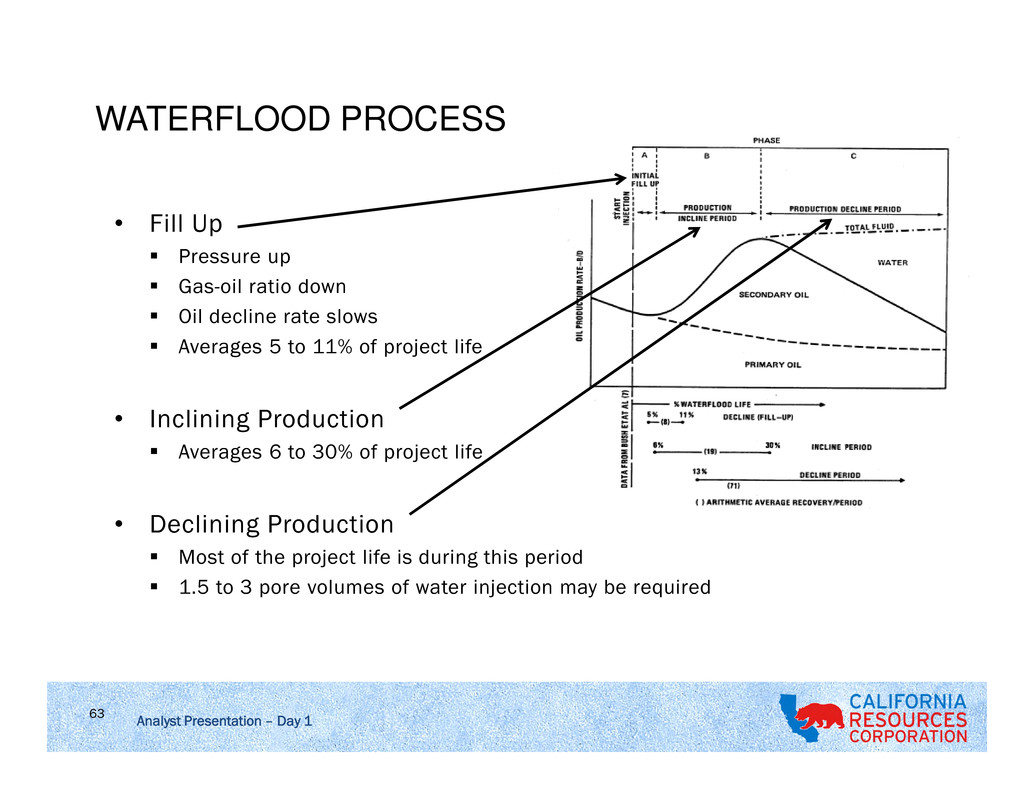
Analyst Presentation – Day 1 63 WATERFLOOD PROCESS • Fill Up Pressure up Gas-oil ratio down Oil decline rate slows Averages 5 to 11% of project life • Inclining Production Averages 6 to 30% of project life • Declining Production Most of the project life is during this period 1.5 to 3 pore volumes of water injection may be required
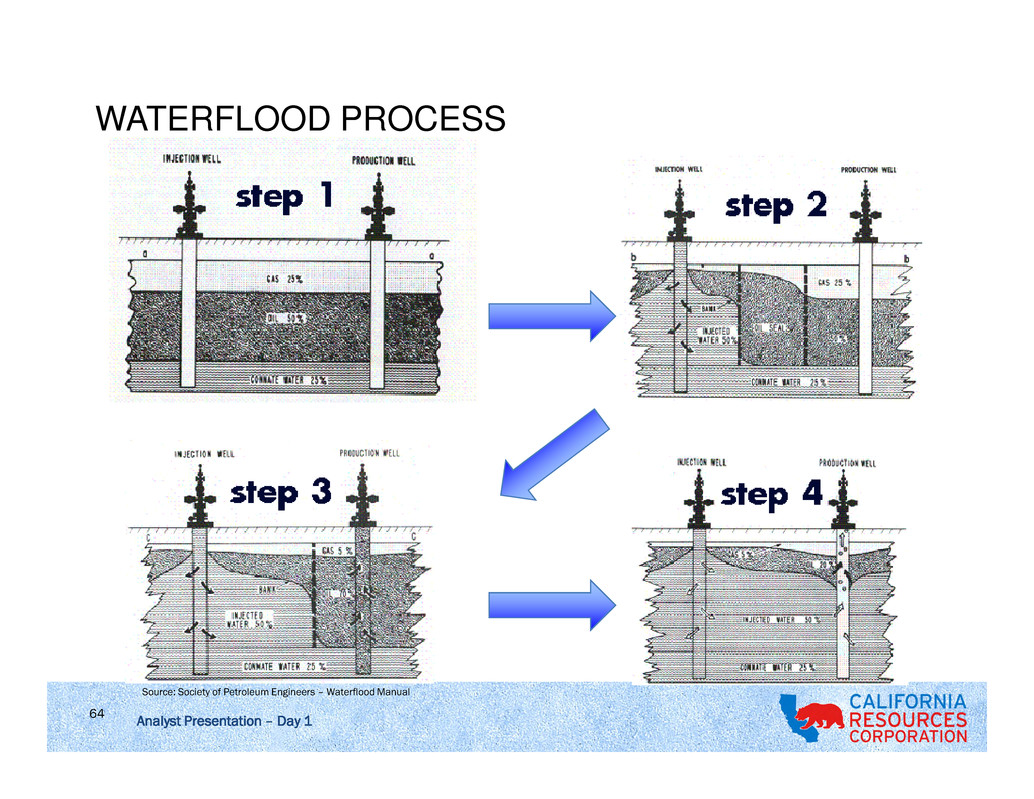
Analyst Presentation – Day 1 64 WATERFLOOD PROCESS Source: Society of Petroleum Engineers – Waterflood Manual

Analyst Presentation – Day 1 65 WHY WATERFLOOD? • Most widely-used fluid injection process Numerous successful smaller waterflood operators • It’s a “mature” technology When were the first benefits of waterflooding reported in the literature? • Adequate produced water (recycled) readily available Does not require fresh water resources • Provides the foundation for EOR opportunities e.g., CO2 injection • Proven method to increase economic oil recovery Provides significant value over decades
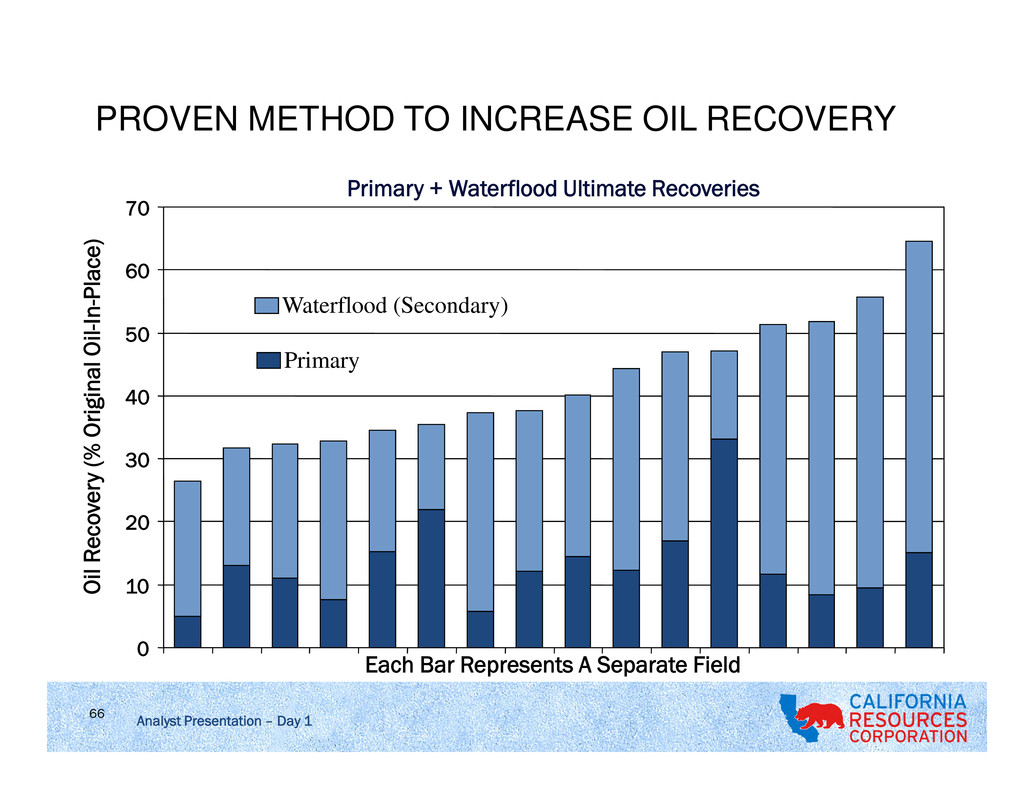
Analyst Presentation – Day 1 66 PROVEN METHOD TO INCREASE OIL RECOVERY Primary + Waterflood Ultimate Recoveries 0 10 20 30 40 50 60 70 O il R e co ve ry (% O ri gi n a lO il- In -P la ce ) Primary Waterflood (Secondary) Each Bar Represents A Separate Field

Analyst Presentation – Day 1 67 MAIN REASONS FOR INCREASED OIL RECOVERY 1. Pressure maintenance Wells flow longer and at higher rates Gas stays in the oil . . . More gas in the oil results in lower viscosity Less resistance to flow = more flow 2. Displacement of oil by water injection We measure the tendency of the oil to “adhere” to the rock - wettability Oil-Wet Water-Wet Reservoir rock Reservoir rock oil dropoil drop
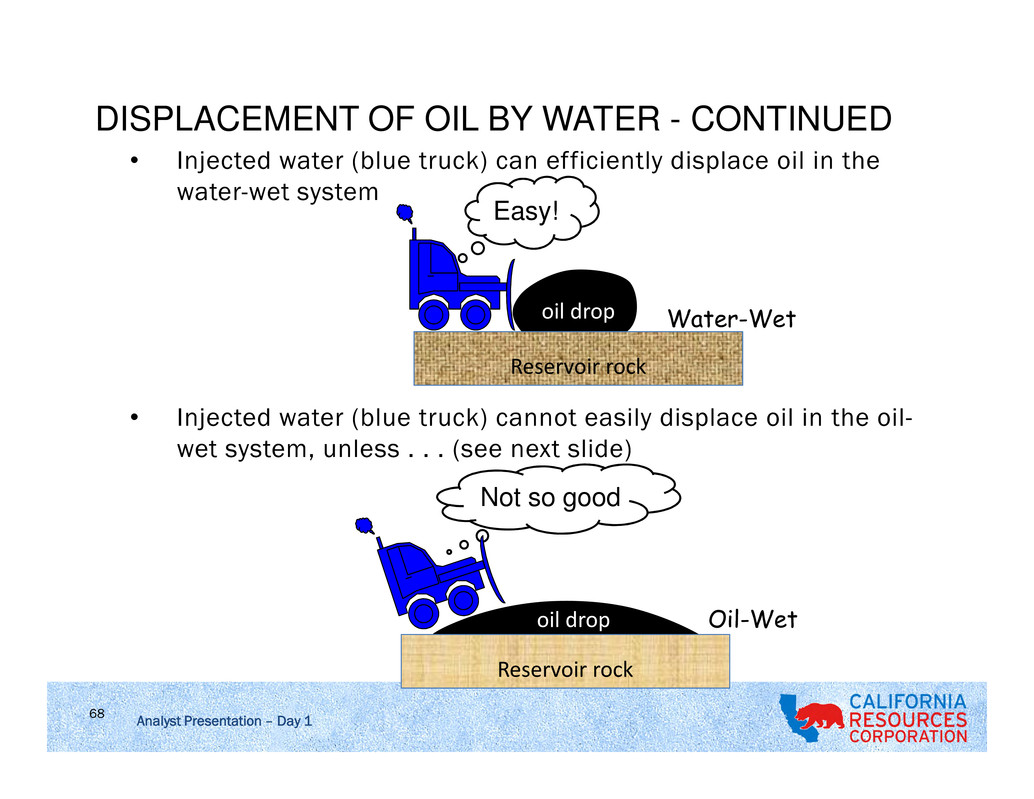
Analyst Presentation – Day 1 68 DISPLACEMENT OF OIL BY WATER - CONTINUED • Injected water (blue truck) can efficiently displace oil in the water-wet system • Injected water (blue truck) cannot easily displace oil in the oil- wet system, unless . . . (see next slide) Oil-Wet Water-Wet Not so good Easy! Reservoir rock Reservoir rock oil drop oil drop

Analyst Presentation – Day 1 69 DISPLACEMENT OF OIL BY WATER - CONTINUED • Injected water (blue truck) “imbibes” into the reservoir rock • Tilted reservoir improves the “gravity-stability” Oil-Wet Better Traction Reservoir rock oil dropoil drop

Analyst Presentation – Day 1 70 KEY SUCCESS FACTORS ARE WELL-KNOWN • Reservoir Geometry • Lithology, Porosity, Permeability • Reservoir Depth • Continuity of Rock Properties • Fluid Saturations & Distributions • Fluid Properties • Relative Permeability • Primary Drive Mechanism(s) Source: Thomas, Mahoney & Winter, Society of Petroleum Engineering Handbook 1992

Analyst Presentation – Day 1 71 GEOLOGY – DEPOSITIONAL ENVIRONMENTS Source: Waterflood A-Z Course OGCI

Analyst Presentation – Day 1 72 COMPLEX WATER MOVEMENT MECHANISMS Source: GeoArabia Special Publication 4, Volume 1: Barremian – Aptian Stratigraphy and Hydrocarbon Habitat of the Eastern Arabian Plate

Analyst Presentation – Day 1 73 WATERFLOOD OPTIMIZATION • Pattern flood appropriate for low dip • Peripheral flood (downdip) fewer wells better sweep when gravity stable injection well production well 5-spot 9-spot production well injection well 7-spot

Analyst Presentation – Day 1 74 KEY SUCCESS FACTORS • Start the waterflood early in the field’s life • Understand the reservoir’s geology • Infill drill to reduce lateral pay discontinuities • Develop with 5-spot or line drive • Open all pay in both injectors and producers • Keep all producing wells pumped off • Inject below formation parting pressure • Operate the waterflood from the injector side • Conduct a surveillance program Source: Gulick & McCain, Society of Petroleum Engineering Paper-40044, 1998 “Successful implementation and operation of a waterflood project, even in complex heterogeneous formations, is a matter of executing a well-conceived comprehensive plan, none of the elements of which are rocket science.”

Analyst Presentation – Day 1 75 SURVEILLANCE AND WATERFLOOD MANAGEMENT • Side view of water (blue) movement through vertical geologic layers • Orange/red = oil saturation Water production Oil production Water injection

Analyst Presentation – Day 1 76 PROPER INTEGRATION IS A KEY SUCCESS FACTOR TREATMENT -filtration INJECTION -pressures -rates -inj. index -profile SURVEILLANCE -diagnostic performance plots -pressure transient analysis -infill wells -cased hole logging -RFT pressures PRODUCTION -prod. index -lift method -scale mitigation -completion -profileRESERVOIR MODEL -structure -stratigraphy
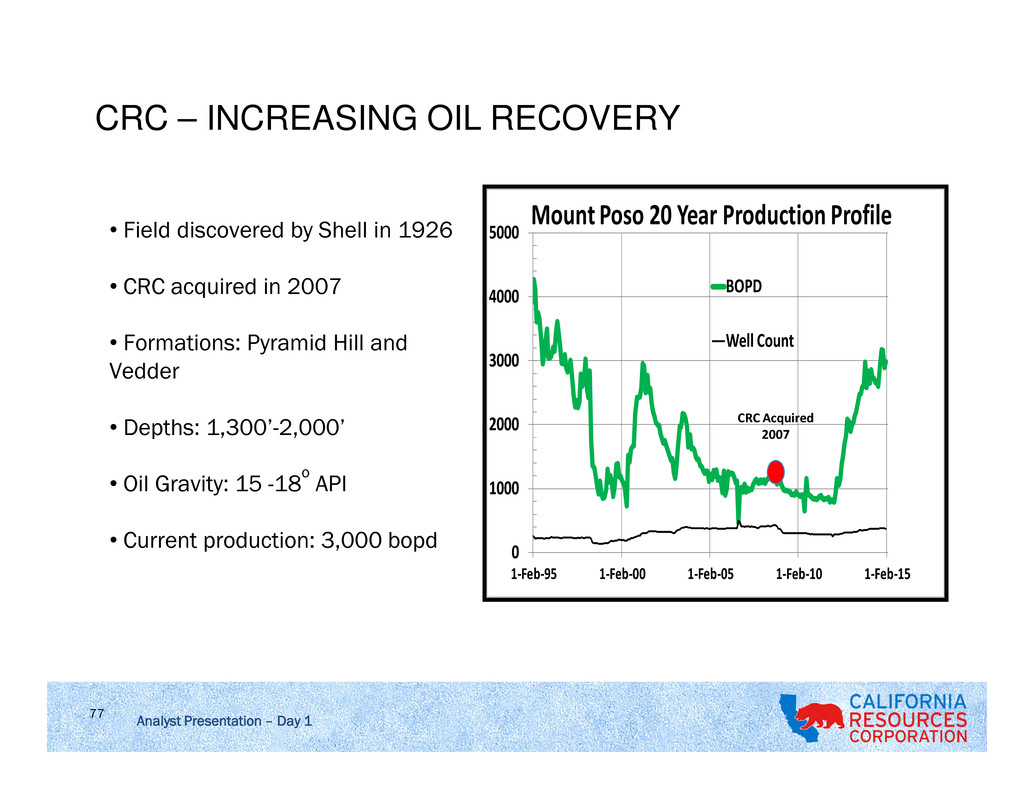
Analyst Presentation – Day 1 77 CRC – INCREASING OIL RECOVERY 0 1000 2000 3000 4000 5000 1-Feb-95 1-Feb-00 1-Feb-05 1-Feb-10 1-Feb-15 Mount Poso 20 Year Production Profile BOPD Well Count CRC Acquired 2007 • Field discovered by Shell in 1926 • CRC acquired in 2007 • Formations: Pyramid Hill and Vedder • Depths: 1,300’-2,000’ • Oil Gravity: 15 -18 o API • Current production: 3,000 bopd

Analyst Presentation – Day 1 78 CRC RECOVERY VALUE CHAIN • Primary production 94 Fields • Waterflood (secondary recovery) 17 Fields 250 MMBOE proved reserves 2014 • EOR including thermal methods 13 Fields

Analyst Presentation – Day 1 79 WATERFLOODING – TAKE HOME MESSAGES • Keeps oil rates higher for longer Protect the base oil production • Mature technology Critical success factors are well-known • Maintaining reservoir pressure Allows oil to flow more easily – (i.e., lower oil viscosity) Minimizes surface gas handling volumes (less CAPEX) Maintains key rock properties: Permeability, porosity Mitigates subsidence • Provides the foundation for numerous EOR opportunities Significant waterflood and EOR projects/candidates in portfolio • CRC has demonstrated waterflood success Wilmington is a worldwide best-in-class example of high-watercut success

SOUTHERN OPERATIONS Frank Komin | EVP – Southern Operations | October 13, 2015

Analyst Presentation – Day 1 Big fields get bigger! Focus: Sensitive environments, mature waterfloods, with generally low technical risk and proven repeatable technology across huge OOIP fields • Emphasize base management & maintaining low decline rates • Focus on reducing costs to defend margins • Well Positioned to Grow as Prices Increase Continue to regenerate drilling inventory in mature fields (e.g., Wilmington) Refine Ventura Life of Field Plans ~300,000 net acres & 2,350 identified gross drilling locations1 3.5 Bn Boe in place at a 14% Recovery Factor2 1 Locations – include PUDs, PUD-l ike locat ions (outside 5 year SEC rule) and other unproven locat ions. 2 Information based on CRC internal est imates; includes shales which are not considered in most older, publicly available est imates. 81 CRC SOUTH KEY TAKEAWAYS

Analyst Presentation – Day 182 CRC SOUTH OVERVIEW Focus: Sensitive environments, mature waterfloods, with generally low technical risk and proven repeatable technology across huge OOIP fields • Emphasize base management & maintaining low decline rates • Focus on reducing costs to defend margins • Well positioned to grow as prices increase Santa Clara Avenue Rincon SanMiguelito Ojai Oxnard Saticoy South Mountain West Mountain Bardsdale Shiells Canyon Oak Park Big Mountain Wayside Canyon Honor Rancho Newhall- Portrero Del Valle Torrey Canyon Oak Ridge TapoRidge TapoCanyon S. Santa SusanaRincon ti South Mountain West t i Bardsdale iells Canyon Oak Park Rancho Portrero Del Valle Canyon S. Santa Susana Other Fields in Ventura Basin CRC Fields West Montalvo CRC Waterflood Fields 1H 2015 Net Rate YE2014 Proved Reserves 42 Mboepd (94% liquids) 223 Mmboe (96% liquids)

Analyst Presentation – Day 1 83 CRC SOUTH WATERFLOODS 0 5,000 10,000 15,000 20,000 25,000 30,000 35,000 40,000 45,000 2011 2012 2013 2014 2015 B o e p d Net Rate from Waterfloods LONG BEACH TIDELANDS HUNTINGTON BEACH OTHER 1H

JRCO 0915Analyst Presentation – Day 1 LOS ANGELES BASIN • Large, world class basin with thick deposits • Kitchen is the entire basin, hydrocarbons did not migrate laterally; basin depth (>30,000 ft) • ~10 billion barrels OOIP in CRC fields1 • Most significant discoveries date to the 1920s – past exploration focused on seeps & surface expressions • Very few deep wells (> 10,000 ft) ever drilled • Focus on urban, mature waterfloods, with generally low technical risk and proven repeatable technology across huge OOIP fields • 1H 2015 avg. net production of 33 MBoe/d • Over 20,000 net acres • Major properties are world class coastal developments of Wilmington and Huntington Beach Key Assets Basin Map 84 1 Information based on CRC internal estimates; includes shales which are not considered in most older, publicly available estimates. Overview

Analyst Presentation – Day 185 WILMINGTON FIELD - OVERVIEW Overview Field Map Proved Reserves & Cumulative Production Structure Map & Acquisition History • CRC’s flagship coastal asset: acquired in 2000 • Field discovered in 1932; 3 rd largest field in the U.S. • Over 7 billion barrels OOIP (34% recovered to date)1 • Depths 2,000’ – 10,000’ (TVDSS) • 1H 2015 avg. production of 36 MBoe/d (gross) • Over 8,000 wells drilled to date • PSC (Working Interest and NRI vary by contract) • CRC partnering with State and City of Long Beach - 50 100 150 200 250 2000 2001 2002 2003 2004 2005 2006 2007 2008 2009 2010 2011 2012 2013 2014 M M B o e Net Proved Reserves Production to Date* Tidelands Acquired: 2006 Belmont Offshore Acquired: 2003 Long Beach Unit Acquired: 2000 Pico Properties Acquired: 2008 *Proved reserves prior to 2009 represent previously effective SEC methodology. Proved reserves for 2009 – 2014 are based on current SEC reserve methodology and SEC pricing. 1 Internal Estimate. Includes shales which are not considered in most older, publicly available estimates.

Analyst Presentation – Day 186 • Example of Wilmington (“mature waterflood”) • Growing Proven Reserves 168% Reserves Replacement since 2011 • Increased inventory of well locations Drilled 500 wells Additional 774 wells identified in mature field BIG FIELDS CONTINUE TO GET BIGGER…. Replenishing Inventory - # Drilling Locations Inventory of locations* in 2011 712 Wells drilled 2011-14 -498 Additional inventory 2011-14 774 Remaining locations 988 Large, long-life assets provide multiple opportunities to enhance production and expand inventories. 0 25 50 75 100 125 150 2011 Entry Production Proven Adds 2014 Exit P ro ve n R e se rv e s (M m b o e ) Mature Waterflood Wilmington Proved Reserves** * Locations – include PUDs, PUD-like locations (outside 5 year SEC rule) and other unproven locations. ** Proved reserves determined at EOY SEC Reserve prices for each year.

Analyst Presentation – Day 1 WILMINGTON FIELD – GEOLOGY Stratigraphic Column Beaubouef et al, 1999 Upper Fan Middle Fan Lower Fan San Clemente, CA 237 Zone reservoirs Shallow Gas reservoirs Upper Fan Middle Fan Middle Fan Lower Fan Deep marine Siliclastics Ranger reservoirs Terminal reservoirs UP-Ford reservoirs 87

Analyst Presentation – Day 1 WILMINGTON FIELD – GEOSTEERING TECHNOLOGY Well Complexity • State of the art, proprietary directional drilling technology • Over 8,000 wellbores since 1930s • Small surface footprint, reach far out into reservoirs • Well placement critical to maximizing value 88

Analyst Presentation – Day 1 WILMINGTON FIELD – PRODUCTION SHARING CONTRACTS • Over 90% of CRC’s Long Beach production is covered under Production Sharing Contracts (PSCs) with the State and City of Long Beach • CRC net production decreases when prices rise and increases when prices decline • “Base” rate/profit are defined in contracts • State/City receive most of base profit • CRC receives remainder • “Incremental” rate/profit is everything greater than base Tidelands PSC LBU PSC - 10,000 20,000 30,000 40,000 50,000 1 9 92 1 9 94 1 9 96 1 9 98 2 0 00 2 0 02 2 0 04 2 0 06 2 0 08 2 0 10 2 0 12 2 0 14 B o e/ d Base Incremental Base Profit Split: 4% CRC / 96% State Incremental profit split: 49% CRC / 51% State - 2,000 4,000 6,000 8,000 10,000 2006 2008 2010 2012 2014 B o e/ d Base Incremental Base Profit Split: 4% CRC / 96% State (average) 49% CRC / 51% State & City First of 3 new PSC’s executed 89

JRCO 0915Analyst Presentation – Day 1 - 1,000 2,000 3,000 4,000 Potential Existing - 400 800 1,200 1,600 M ill io n B b ls Potential - Locations & Reserves VENTURA BASIN • Estimated ~3.5 billion barrels OOIP in CRC fields1 • Operate 29 fields (about 40% of basin) • ~300,000 net acres • Multiple source rocks: Miocene (Monterey and Rincon Formations), Eocene (Anita and Cozy Dell Formations) • 1H 2015 average net production of 9 MBoe/d • In 2013, shot 10 mi2 of 3D Seismic > First 3D seismic acquired by any company in the basin Overview Key Assets Basin Map • CRC has four early stage waterfloods • Ventura Avenue Field analog has >30% RF • CRC fields have 3.5 Bn Boe in place at 14% RF Waterflood Potential2 1 Information based on CRC internal estimates; includes shales which are not considered in most older, publicly available estimates. 2 Source: USGS 90 14% 20% 30% 40%Recovery FactorWells
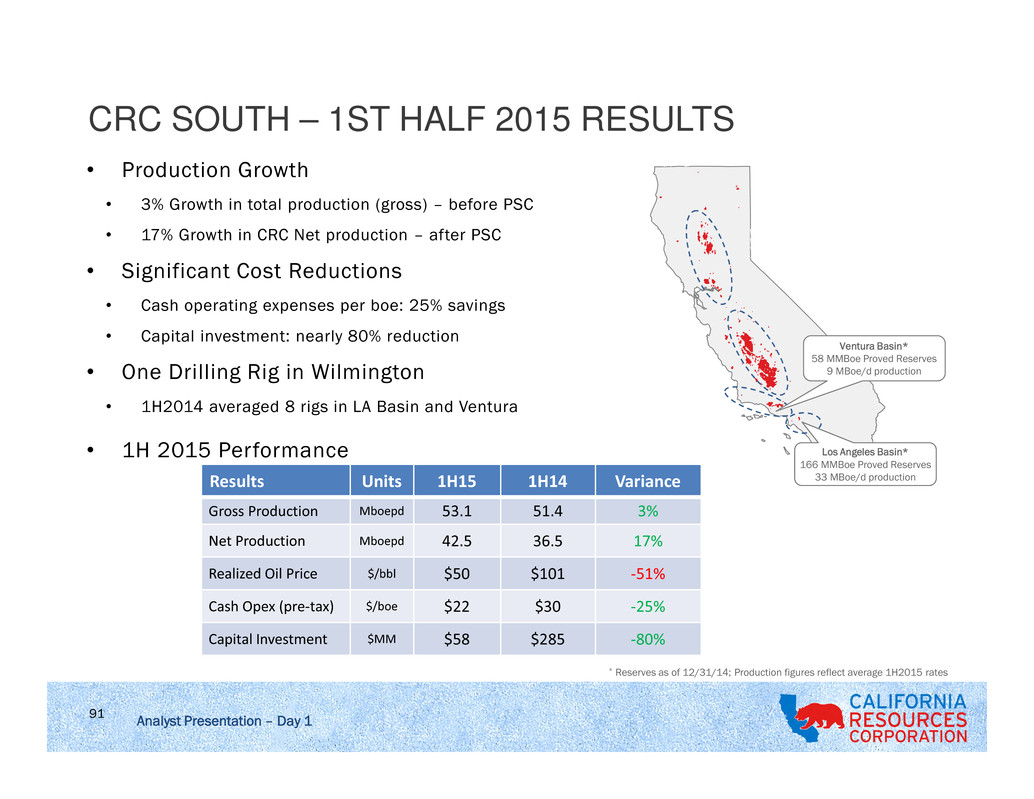
Analyst Presentation – Day 1 CRC SOUTH – 1ST HALF 2015 RESULTS • Production Growth • 3% Growth in total production (gross) – before PSC • 17% Growth in CRC Net production – after PSC • Significant Cost Reductions • Cash operating expenses per boe: 25% savings • Capital investment: nearly 80% reduction • One Drilling Rig in Wilmington • 1H2014 averaged 8 rigs in LA Basin and Ventura • 1H 2015 Performance Ventura Basin* 58 MMBoe Proved Reserves 9 MBoe/d production Los Angeles Basin* 166 MMBoe Proved Reserves 33 MBoe/d production 91 Results Units 1H15 1H14 Variance Gross Production Mboepd 53.1 51.4 3% Net Production Mboepd 42.5 36.5 17% Realized Oil Price $/bbl $50 $101 -51% Cash Opex (pre-tax) $/boe $22 $30 -25% Capital Investment $MM $58 $285 -80% * Reserves as of 12/31/14; Production figures reflect average 1H2015 rates

Analyst Presentation – Day 1 CRC SOUTH DASHBOARD – GOOD CAPITAL EFFICIENCY YTD Drilling Results – Beating expectations 1H 2015 Drill Wells Costs 18% below AFE IP rate 9% above AFE* 1H15 Average Capital Efficiency - Drilling wells faster & cheaper than planned - Allows equivalent of 5 more wells - Also beating rate expectations 92 * Initial Production (IP) rate based on 90-day average rates

Analyst Presentation – Day 1 FLAT PRODUCTION PROFILE – FOCUS ON BASE Gross Production - 2015 gross oil decline of 13% 93 Results Units 1H15 1H14 Variance Gross Production Mboepd 53.1 51.4 3% Net Production Mboepd 42.5 36.5 17% Net Production - Strong performance, lifted by PSC 0.0 10.0 20.0 30.0 40.0 50.0 60.0 1Q14 2Q14 3Q14 4Q14 1Q15 2Q15 Gross & Net Production (Mboepd) Net RateGross Rate
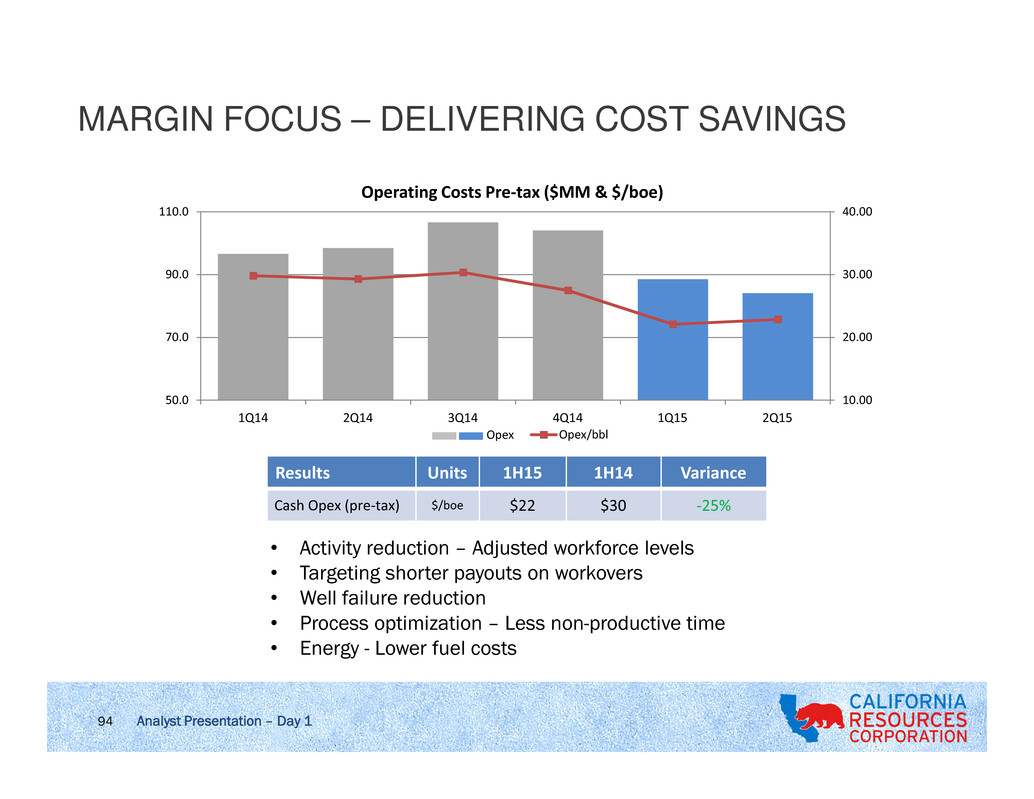
Analyst Presentation – Day 1 MARGIN FOCUS – DELIVERING COST SAVINGS 10.00 20.00 30.00 40.00 50.0 70.0 90.0 110.0 1Q14 2Q14 3Q14 4Q14 1Q15 2Q15 Operating Costs Pre-tax ($MM & $/boe) Opex/bblOpex Results Units 1H15 1H14 Variance Cash Opex (pre-tax) $/boe $22 $30 -25% • Activity reduction – Adjusted workforce levels • Targeting shorter payouts on workovers • Well failure reduction • Process optimization – Less non-productive time • Energy - Lower fuel costs 94

Analyst Presentation – Day 1 CAPITAL INVESTMENTS – LIVING WITHIN CASH FLOWS Results Units 1H15 1H14 Variance Capital Investment $MM $58 $285 -80% 0.0 50.0 100.0 150.0 200.0 1Q14 2Q14 3Q14 4Q14 1Q15 2Q15 Capital Investment ($MM) 95 • Activity reduction – Lower rig count • Drilling capital efficiency – drill well costs down ~20% vs. 2014 • Contract concessions • Process improvements & NPT reduction

Analyst Presentation – Day 1 Big fields get bigger! Focus: Sensitive environments, mature waterfloods, with generally low technical risk and proven repeatable technology across huge OOIP fields • Emphasize base management & maintaining low decline rates • Focus on reducing costs to defend margins • Well Positioned to Grow as Prices Increase Continue to regenerate drilling inventory in mature fields (e.g., Wilmington) Refine Ventura Life of Field Plans ~300,000 net acres & 2,350 identified gross drilling locations1 3.5 Bn Boe in place at a 14% Recovery Factor2 1 Locations – include PUDs, PUD-l ike locat ions (outside 5 year SEC rule) and other unproven locat ions. 2 Information based on CRC internal est imates; includes shales which are not considered in most older, publicly available est imates. 96 CRC SOUTH SUMMARY

Analyst Presentation – Day 1 97 CALIFORNIA RESOURCES CORPORATION APPENDIX

Analyst Presentation – Day 1 END NOTES: (1) The reserves replacement ratio is calculated for a specified period using the applicable proved oil-equivalent additions divided by oil-equivalent production. Company- wide 76% of 2014 additions were proved undeveloped. There is no guarantee that historical sources of reserves additions will continue as many factors fully or partially outside management’s control, including the underlying geology, commodity prices and availability of capital, affect reserves additions. Management uses this measure to gauge results of its capital allocation. The measure is limited in that reserves may be added and produced based on costs incurred in separate periods and other oil and gas producers may use different replacement ratios affecting comparability. (2) Finding and Development costs for the capital program are calculated by dividing the costs incurred from the capital program (development and exploration costs) by the amount of proved reserves added in the same year from improved recovery and extensions and discoveries (excluding acquisitions and revisions). Our management believes that reporting our finding and development costs can aid evaluation of our ability to add proved reserves at a reasonable cost and is not a substitute for our GAAP disclosures. Various factors, including timing differences and effects of commodity price changes, can cause finding and development costs to reflect costs associated with particular reserves imprecisely. For example, we will need to make more investments in order to develop the proved undeveloped reserves added during the year and any future revisions may change the actual measure from that presented above. Our calculations of finding and development costs may not be comparable to similar measures provided by other companies. (3) Our total production costs consist of variable costs that tend to vary depending on production levels, and fixed costs that do not vary with changes in production levels or well counts, especially in the short term. The substantial majority of our near-term fixed costs become variable over the longer term as they can be managed based on the field’s stage of life and operating characteristics. For example, portions of labor and material costs, energy, workovers and maintenance expenditures correlate to well count, production and activity levels. Portions of these same costs can be relatively fixed over the near term, however, they are managed down as fields mature in a manner that correlates to production and commodity price levels. While a certain amount of costs for facilities, surface support, surveillance and related maintenance can be regarded as fixed in the early phases of a program, as the production from a certain area matures, well count increases and daily per well production drops, such support costs can be reduced and consolidated over a larger number of wells, reducing costs per operating well. Further, many of our other costs, such as property taxes and oilfield services, are variable and will respond to activity levels and tend to correlate with commodity prices. Overall, we believe less than one-third of our operating costs are fixed over the life cycle of our fields. We actively manage our fields to optimize production and costs. If we see growth in a field we increase capacities, and similarly if a field is reaching the end of its economic life we would manage the costs while it remains economically viable to produce. 98

JRCO 0915Analyst Presentation – Day 1 Non-GAAP Reconciliation for Adjusted EBITDAX For the Second Quarter Ended June 30, For the Six Months Ended June 30, Full Year ($ in millions) 2015 2014 2015 2014 2014 Net Income/(loss) ($68) $246 ($168) $469 ($1,434) Interest expense 83 - 162 - 72 Income taxes expense/(benefit) (46) 162 (115) 313 (987) Depreciation, depletion and amortization 251 293 504 582 1,198 Exploration expense 7 15 24 46 139 Asset Impairments (a) - - - - 3,402 Other (b) 43 11 61 22 158 Adjusted EBITDAX $270 $727 $468 $1,432 $2,548 Net cash provided by operating activities $117 $496 $232 $1,236 $2,371 Interest expense 83 - 162 - 72 Cash income taxes - 135 - 135 165 Cash exploration expenses 6 7 17 13 38 Changes in operating assets and liabilities 49 118 50 47 (143) Other, net 15 (29) 7 1 45 Adjusted EBITDAX $270 $727 $468 $1,432 $2,548 a - For full year 2014, includes pre-tax impairment charges of $3.4 bn. b - Includes non-cash and unusual or infrequent charges. 99

JRCO 0915Analyst Presentation – Day 1 Non-GAAP Reconciliation for PV-10 ($ in millions) At December 31, 2014 PV-10 $16,091 Present value of future income taxes discounted at 10% (5,263) Standardized Measure of Discounted Future Net Cash Flows $10,828 PV-10 is a non-GAAP financial measure and represents the year-end present value of estimated future cash inflows from proved oil and natural gas reserves, less future development and production costs, discounted at 10% per annum to reflect the timing of future cash flows and using SEC prescribed pricing assumptions for the period. PV-10 differs from Standardized Measure because Standardized Measure includes the effects of future income taxes on future net cash flows. Neither PV-10 nor Standardized Measure should be construed as the fair value of our oil and natural gas reserves. PV-10 and Standardized Measure are used by the industry and by our management as an asset value measure to compare against our past reserve bases and the reserve bases of other business entities because the pricing, cost environment and discount assumptions are prescribed by the SEC and are comparable. PV-10 further facilitates the comparisons to other companies as it is not dependent on the tax paying status of the entity. 100