| FREE WRITING PROSPECTUS | ||
| FILED PURSUANT TO RULE 433 | ||
| REGISTRATION FILE NO.: 333-177891-08 | ||
 |  |
Free Writing Prospectus
Structural and Collateral Term Sheet
Structural and Collateral Term Sheet
$1,425,796,349
(Approximate Aggregate Cut-off Date Balance of Mortgage Pool)
(Approximate Aggregate Cut-off Date Balance of Mortgage Pool)
$1,242,225,000
(Approximate Aggregate Principal Balance of Offered Certificates)
(Approximate Aggregate Principal Balance of Offered Certificates)
WFRBS Commercial Mortgage Trust 2014-C21
as Issuing Entity
as Issuing Entity
RBS Commercial Funding Inc.
as Depositor
as Depositor
Wells Fargo Bank, National Association
The Royal Bank of Scotland
Liberty Island Group I LLC
C-III Commercial Mortgage LLC
Basis Real Estate Capital II, LLC
NCB, FSB
as Sponsors and Mortgage Loan Sellers
as Sponsors and Mortgage Loan Sellers
Commercial Mortgage Pass-Through Certificates
Series 2014-C21
Series 2014-C21
July 11, 2014
| RBS | WELLS FARGO SECURITIES | |
Co-Lead Manager and Co-Bookrunner | Co-Lead Manager and Co-Bookrunner | |
Citigroup Co-Manager | ||
STATEMENT REGARDING THIS FREE WRITING PROSPECTUS
The depositor has filed a registration statement (including a prospectus) with the Securities and Exchange Commission (‘‘SEC’’) (SEC File No. 333-177891) for the offering to which this communication relates. Before you invest, you should read the prospectus in the registration statement and other documents the depositor has filed with the SEC for more complete information about the depositor, the issuing entity and this offering. You may get these documents for free by visiting EDGAR on the SEC Web site at www.sec.gov. Alternatively, the depositor, any underwriter, or any dealer participating in the offering will arrange to send you the prospectus after filing if you request it by calling toll free 1-866-884-2071 (8 a.m. – 5 p.m. EST) or by emailing rbscmbs@rbs.com.
Nothing in this document constitutes an offer to sell or a solicitation to buy securities in any jurisdiction where such offer, solicitation or sale is not permitted. The information contained herein is preliminary as of the date hereof, supersedes any such information previously delivered to you and will be superseded by any information subsequently delivered and ultimately by the final prospectus relating to the securities. These materials are subject to change, completion, supplement or amendment from time to time.
STATEMENT REGARDING ASSUMPTIONS AS TO SECURITIES, PRICING ESTIMATES AND OTHER INFORMATION
The attached information contains certain tables and other statistical analyses (the “Computational Materials”) which have been prepared in reliance upon information furnished by the Mortgage Loan Sellers. Numerous assumptions were used in preparing the Computational Materials, which may or may not be reflected herein. As such, no assurance can be given as to the Computational Materials’ accuracy, appropriateness or completeness in any particular context; or as to whether the Computational Materials and/or the assumptions upon which they are based reflect present market conditions or future market performance. The Computational Materials should not be construed as either projections or predictions or as legal, tax, financial or accounting advice. You should consult your own counsel, accountant and other advisors as to the legal, tax, business, financial and related aspects of a purchase of these securities. Any weighted average lives, yields and principal payment periods shown in the Computational Materials are based on prepayment and/or loss assumptions, and changes in such prepayment and/or loss assumptions may dramatically affect such weighted average lives, yields and principal payment periods. In addition, it is possible that prepayments or losses on the underlying assets will occur at rates higher or lower than the rates shown in the attached Computational Materials. The specific characteristics of the securities may differ from those shown in the Computational Materials due to differences between the final underlying assets and the preliminary underlying assets used in preparing the Computational Materials. The principal amount and designation of any security described in the Computational Materials are subject to change prior to issuance. None of RBS Securities Inc. (“RBSSI”), Wells Fargo Securities, LLC (“WFS”), Deutsche Bank Securities Inc. or any of their respective affiliates make any representation or warranty as to the actual rate or timing of payments or losses on any of the underlying assets or the payments or yield on the securities. The information in this presentation is based upon management forecasts and reflects prevailing conditions and management’s views as of this date, all of which are subject to change. In preparing this presentation, we have relied upon and assumed, without independent verification, the accuracy and completeness of all information available from public sources or which was provided to us by or on behalf of the Mortgage Loan Sellers or which was otherwise reviewed by us.
This free writing prospectus contains certain forward-looking statements. If and when included in this free writing prospectus, the words “expects”, “intends”, “anticipates”, “estimates” and analogous expressions and all statements that are not historical facts, including statements about our beliefs or expectations, are intended to identify forward-looking statements. Any forward-looking statements are made subject to risks and uncertainties which could cause actual results to differ materially from those stated. Those risks and uncertainties include, among other things, declines in general economic and business conditions, increased competition, changes in demographics, changes in political and social conditions, regulatory initiatives and changes in customer preferences, many of which are beyond our control and the control of any other person or entity related to this offering. The forward-looking statements made in this free writing prospectus are made as of the date stated on the cover. We have no obligation to update or revise any forward-looking statement.
RBS is a trade name for the investment banking business of RBSSI. Securities, syndicated loan arranging, financial advisory and other investment banking activities are performed by RBSSI and their securities affiliates. Lending, derivatives and other commercial banking activities are performed by The Royal Bank of Scotland plc and their banking affiliates. RBSSI is a member of SIPC, FINRA and the NYSE.
Wells Fargo Securities is the trade name for the capital markets and investment banking services of Wells Fargo & Company and its subsidiaries, including Wells Fargo Securities, LLC, a member of FINRA, NYSE, NFA and SIPC, Wells Fargo Institutional Securities, LLC, a member of FINRA and SIPC, Wells Fargo Prime Services, LLC, a member of FINRA, NFA and SIPC and Wells Fargo Bank, N.A.
IRS CIRCULAR 230 NOTICE
THIS TERM SHEET IS NOT INTENDED OR WRITTEN TO BE USED, AND CANNOT BE USED, FOR THE PURPOSE OF AVOIDING U.S. FEDERAL, STATE OR LOCAL TAX PENALTIES. THIS TERM SHEET IS WRITTEN AND PROVIDED BY THE DEPOSITOR IN CONNECTION WITH THE PROMOTION OR MARKETING BY THE DEPOSITOR AND THE CO-LEAD BOOKRUNNING MANAGERS OF THE TRANSACTION OR MATTERS ADDRESSED HEREIN. INVESTORS SHOULD SEEK ADVICE BASED ON THEIR PARTICULAR CIRCUMSTANCES FROM AN INDEPENDENT TAX ADVISOR.
IMPORTANT NOTICE REGARDING THE OFFERED CERTIFICATES
The offered certificates referred to in these materials and the asset pool backing them are subject to modification or revision (including the possibility that one or more classes of certificates may be split, combined or eliminated at any time prior to issuance or availability of a final prospectus) and are offered on a “when, as and if issued” basis. Prospective investors should understand that, when considering the purchase of the offered certificates, a contract of sale will come into being no sooner than the date on which the relevant class of certificates has been priced and the underwriters have confirmed the allocation of certificates to be made to investors; any “indications of interest” expressed by any prospective investor, and any “soft circles” generated by the underwriters, will not create binding contractual obligations for such prospective investors, on the one hand, or the underwriters, the depositor or any of their respective agents or affiliates, on the other hand.
As a result of the foregoing, a prospective investor may commit to purchase certificates that have characteristics that may change, and each prospective investor is advised that all or a portion of the certificates referred to in these materials may be issued that differ from the characteristics described in these materials. The underwriters’ obligation to sell certificates to any prospective investor is conditioned on the certificates and the transaction having the characteristics described in these materials. If the underwriters determine that a condition is not satisfied in any material respect, such prospective investor will be notified, and neither the depositor nor the underwriters will have any obligation to such prospective investor to deliver any portion of the offered certificates which such prospective investor has committed to purchase, and there will be no liability between the underwriters, the depositor or any of their respective agents or affiliates, on the one hand, and such prospective investor, on the other hand, as a consequence of the non-delivery.
Each prospective investor has requested that the underwriters provide to such prospective investor information in connection with such prospective investor’s consideration of the purchase of the certificates described in these materials. These materials are being provided to each prospective investor for informative purposes only in response to such prospective investor’s specific request. The underwriters described in these materials may from time to time perform investment banking services for, or solicit investment banking business from, any company named in these materials. The underwriters and/or their affiliates or respective employees may from time to time have a long or short position in any security or contract discussed in these materials.
The information contained herein supersedes any previous such information delivered to any prospective investor and will be superseded by information delivered to such prospective investor prior to the time of sale.
IMPORTANT NOTICE RELATING TO AUTOMATICALLY-GENERATED EMAIL DISCLAIMERS
Any legends, disclaimers or other notices that may appear at the bottom of, or attached to, any email communication to which this free writing prospectus is attached relating to (1) these materials not constituting an offer (or a solicitation of an offer), (2) no representation that these materials are accurate or complete and may not be updated or (3) these materials possibly being confidential, are not applicable to these materials and should be disregarded. Such legends, disclaimers or other notices have been automatically generated as a result of these materials having been sent via Bloomberg or another system.
THE INFORMATION IN THIS STRUCTURAL AND COLLATERAL TERM SHEET IS NOT COMPLETE AND MAY BE AMENDED PRIOR TO THE TIME OF SALE. THIS TERM SHEET IS NOT AN OFFER TO SELL THESE SECURITIES AND IT IS NOT A SOLICITATION OF AN OFFER TO BUY THESE SECURITIES IN ANY JURISDICTION WHERE THE OFFER OR SALE IS NOT PERMITTED.
2
| WFRBS Commercial Mortgage Trust 2014-C21 | Characteristics of the Mortgage Pool |
| I. | Certificate Structure |
| Class | Expected Ratings (DBRS/Moody’s/Morningstar)(1) | Approximate Initial Certificate Principal Balance or Notional Amount(2) | Approx. Initial Credit Support(3) | Pass-Through Rate Description | Weighted Average Life (Years)(4) | Expected Principal Window(4) | Certificate Principal to Value Ratio(5) | Certificate Principal U/W NOI Debt Yield(6) | ||||||||||
| Offered Certificates | ||||||||||||||||||
| A-1 | AAA(sf)/Aaa(sf)/AAA | $66,230,000 | 30.000% | (7) | 2.67 | 09/14 - 06/19 | 34.6% | 17.2% | ||||||||||
| A-2 | AAA(sf)/Aaa(sf)/AAA | $109,149,000 | 30.000% | (7) | 4.87 | 06/19 - 07/19 | 34.6% | 17.2% | ||||||||||
| A-3 | AAA(sf)/Aaa(sf)/AAA | $48,253,000 | 30.000% | (7) | 6.83 | 04/21 - 08/21 | 34.6% | 17.2% | ||||||||||
| A-4 | AAA(sf)/Aaa(sf)/AAA | $330,000,000 | 30.000% | (7) | 9.80 | 01/24 - 06/24 | 34.6% | 17.2% | ||||||||||
| A-5 | AAA(sf)/Aaa(sf)/AAA | $345,689,000 | 30.000% | (7) | 9.91 | 06/24 - 07/24 | 34.6% | 17.2% | ||||||||||
| A-SB | AAA(sf)/Aaa(sf)/AAA | $98,736,000 | 30.000% | (7) | 7.23 | 07/19 - 01/24 | 34.6% | 17.2% | ||||||||||
A-S(8) | AAA(sf)/Aaa(sf)/AAA | $92,677,000 | 23.500% | (7) | 9.93 | 07/24 - 07/24 | 37.8% | 15.8% | ||||||||||
B(8) | AA(low)(sf)/Aa3(sf)/AA- | $98,023,000 | 16.625% | (7) | 9.93 | 07/24 - 07/24 | 41.2% | 14.5% | ||||||||||
C(8) | A(low)(sf)/A3(sf)/A- | $53,468,000 | 12.875% | (7) | 9.93 | 07/24 - 07/24 | 43.1% | 13.9% | ||||||||||
PEX(8) | A(low)(sf)/A1(sf)/A- | $244,168,000 | 12.875% | (7) | 9.93 | 07/24 - 07/24 | 43.1% | 13.9% | ||||||||||
| X-A | AAA(sf)/Aaa(sf)/AAA | $1,090,734,000 | (9) | N/A | Variable(10) | N/A | N/A | N/A | N/A | |||||||||
| X-B | AAA(sf)/NR/AAA | $235,256,000 | (11) | N/A | Variable(12) | N/A | N/A | N/A | N/A | |||||||||
Non-Offered Certificates | ||||||||||||||||||
| X-C | AAA(sf)/NR/AAA | $19,605,000 | (13) | N/A | Variable(14) | N/A | N/A | N/A | N/A | |||||||||
| X-D | AAA(sf)/NR/AAA | $80,201,349 | (15) | N/A | Variable(16) | N/A | N/A | N/A | N/A | |||||||||
| D | BBB(low)(sf)/NR/BBB- | $83,765,000 | 7.000% | (7) | 9.93 | 07/24 - 07/24 | 46.0% | 13.0% | ||||||||||
| E | BB(sf)/NR/BB | $19,605,000 | 5.625% | (7) | 9.99 | 07/24 - 08/24 | 46.6% | 12.8% | ||||||||||
| F | B(sf)/NR/B | $26,733,000 | 3.750% | (7) | 10.01 | 08/24 - 08/24 | 47.6% | 12.5% | ||||||||||
| G | NR/NR/NR | $53,468,349 | 0.000% | (7) | 10.01 | 08/24 - 08/24 | 49.4% | 12.1% | ||||||||||
Notes: | ||||||||||||||||||
| (1) | The expected ratings presented are those of DBRS, Inc. (“DBRS”), Moody’s Investors Service, Inc. (“Moody’s”), and Morningstar Credit Ratings, LLC (“Morningstar”) which the depositor hired to rate the rated offered certificates. One or more other nationally recognized statistical rating organizations, as defined in Section 3(a)(62) of the Securities Exchange Act of 1934, as amended (the “Exchange Act”), that were not hired by the depositor may use information they receive pursuant to Rule 17g-5 under the Securities Exchange Act or otherwise to rate or provide market reports and/or published commentary related to the offered certificates. We cannot assure you as to what ratings a non-hired nationally recognized statistical rating organization would assign or that its reports will not express differing, possibly negative, views of the mortgage loans and/or the offered certificates. See “Risk Factors—Risks Related to the Offered Certificates—Nationally Recognized Statistical Rating Organizations May Assign Different Ratings to the Certificates; Ratings of the Certificates Reflect Only the Views of the Applicable Rating Agencies as of the Dates Such Ratings Were Issued; Ratings May Affect ERISA Eligibility; Ratings May Be Downgraded” in the free writing prospectus, dated July 11, 2014 (the “Free Writing Prospectus”). |
| (2) | The principal balances and notional amounts set forth in the table are approximate. The actual initial principal balances and notional amounts may be larger or smaller depending on the aggregate cut-off date principal balance of the mortgage loans definitively included in the pool of mortgage loans, which aggregate cut-off date principal balance may be as much as 5% larger or smaller than the amount presented in the Free Writing Prospectus. |
| (3) | The approximate initial credit support with respect to the Class A-1, A-2, A-3, A-4, A-5 and A-SB Certificates represents the approximate credit enhancement for the Class A-1, A-2, A-3, A-4, A-5 and A-SB Certificates in the aggregate. The approximate initial credit support with respect to each of the Class C Certificates and Class PEX Certificates is equal to the approximate initial credit support of the Class C regular interest. |
| (4) | Weighted Average Lives and Expected Principal Windows are calculated based on an assumed prepayment rate of 0% CPR and the “Structuring Assumptions” described on Annex D to the Free Writing Prospectus. |
| (5) | The Certificate Principal to Value Ratio for each Class of Certificates (other than the Class A-1, A-2, A-3, A-4, A-5 and A-SB Certificates and other than the Exchangeable Certificates) is calculated by dividing the aggregate principal balance of such class of certificates and all classes of certificates (other than the Exchangeable Certificates and other than the Class X-A, X-B, X-C and X-D Certificates, which are notional amount certificates and will not have principal balances), if any, that are senior to such class by the aggregate appraised value of $2,884,596,243 (calculated as described in the Free Writing Prospectus) of the mortgaged properties securing the mortgage loans (excluding, with respect to the Queens Atrium, Montgomery Mall, and Oak Court Mall loan combinations, a pro rata portion of the related appraised value allocated to the related companion loan based on its cut-off date principal balance). The Certificate Principal to Value Ratios for each of the Class A-1, A-2, A-3, A-4, A-5 and A-SB Certificates are calculated by dividing the aggregate principal balance of the Class A-1, A-2, A-3, A-4, A-5 and A-SB Certificates by such aggregate appraised value (excluding, with respect to the Queens Atrium, Montgomery Mall, and Oak Court Mall loan combinations, a pro rata portion of the related appraised value allocated to the related companion loan based on its cut-off date principal balance). The Certificate Principal to Value Ratio for each of the Class A-S, B and C Certificates is calculated by dividing the aggregate principal balance of the Class A-S regular interest, the Class B regular interest or the Class C regular interest, as applicable, and all other classes of certificates (other than the Exchangeable Certificates) and the regular interests that are senior to such class, by such aggregate appraised value (excluding, with respect to the Queens Atrium, Montgomery Mall, and Oak Court Mall loan combinations, a pro rata portion of the related appraised value allocated to the related companion loan based on its cut-off date principal balance). The Certificate Principal to Value Ratio of the Class PEX Certificates is equal to the Certificate Principal to Value Ratio of the Class C Certificates. In any event, however, excess mortgaged property value associated with a mortgage loan will not be available to offset losses on any other mortgage loan (unless such mortgage loans are cross-collateralized and the cross-collateralization remains in effect). |
| (6) | The Certificate Principal U/W NOI Debt Yield for each Class of Certificates (other than the Class A-1, A-2, A-3, A-4, A-5 and A-SB Certificates and other than the Exchangeable Certificates) is calculated by dividing the underwritten net operating income (which excludes, with respect to Queens Atrium, Montgomery Mall, and Oak Court Mall loan combinations, a pro rata portion of the related underwritten net operating income allocated to the related companion loan based on its cut-off date principal balance) for the mortgage pool of $172,089,005 (calculated as described in the Free Writing Prospectus) by the aggregate principal balance of such class of certificates and all classes of certificates (other than the Class X-A, X-B, X-C and X-D Certificates, which are notional amount certificates and will not have principal balances, and other than the Exchangeable Certificates), if any, that are senior to such class of certificates. The Certificate Principal U/W NOI Debt Yield for each of the Class A-1, A-2, A-3, A-4, A-5 and A-SB Certificates is calculated by dividing such mortgage pool underwritten net operating income (which excludes, with respect to the Queens Atrium, Montgomery Mall, and Oak Court Mall loan combinations, a pro rata portion of the related underwritten net operating income allocated to the related companion loan based on its cut-off date principal balance) by the aggregate principal balance of the Class A-1, A-2, A-3, A-4, A-5 and A-SB Certificates. The Certificate Principal U/W NOI Debt Yield for each of the Class A-S, B and C Certificates is calculated by dividing the underwritten net operating income (which excludes, with respect to the Queens Atrium, Montgomery Mall, and Oak Court Mall loan combinations, a pro rata portion of the related underwritten net operating income allocated to the related companion loan based on its cut-off date principal balance) for the mortgage pool of approximately $172,089,005 (calculated as described in the Free Writing Prospectus) by the aggregate principal balance of the Class A-S regular interest, the Class B regular interest or the Class C regular interest, as applicable, and all other classes of certificates (other than the Exchangeable Certificates) and the regular interests that are senior to such class. The Certificate Principal U/W NOI Debt Yield of the Class PEX Certificates is equal to the Certificate Principal U/W NOI Debt Yield for the Class C Certificates. In any event, however, cash flow from each mortgaged property supports only the related mortgage loan and will not be available to support any other mortgage loan (unless such mortgage loans are cross-collateralized and the cross-collateralization remains in effect). |
THE INFORMATION IN THIS STRUCTURAL AND COLLATERAL TERM SHEET IS NOT COMPLETE AND MAY BE AMENDED PRIOR TO THE TIME OF SALE. THIS TERM SHEET IS NOT AN OFFER TO SELL THESE SECURITIES AND IT IS NOT A SOLICITATION OF AN OFFER TO BUY THESE SECURITIES IN ANY JURISDICTION WHERE THE OFFER OR SALE IS NOT PERMITTED.
3
| WFRBS Commercial Mortgage Trust 2014-C21 | Characteristics of the Mortgage Pool |
| (7) | The pass-through rates for the Class A-1, A-2, A-3, A-4, A-5, A-SB, D, E, F and G Certificates and the Class A-S, B and C regular interests, in each case, will be one of the following: (i) a fixed rate per annum, (ii) the WAC Rate (as defined in the Free Writing Prospectus) for the related distribution date, (iii) a variable rate per annum equal to the lesser of (a) a fixed rate and (b) the WAC Rate for the related distribution date or (iv) a variable rate per annum equal to the WAC Rate for the related distribution date minus a specified percentage. For purposes of the calculation of the weighted average of the net mortgage interest rates on the mortgage loans for each distribution date, the mortgage interest rates will be adjusted as necessary to a 30/360 basis. The Class PEX Certificates will not have a pass-through rate, but will be entitled to receive the sum of the interest distributable on the percentage interests of the Class A-S, B and C regular interests represented by the Class PEX Certificates. The pass-through rates on the Class A-S, B and C Certificates will at all times be the same as the pass-through rates of the Class A-S, B and C regular interests. |
| (8) | The Class A-S, B, C and PEX Certificates are “Exchangeable Certificates”. On the closing date, the upper-tier REMIC of the issuing entity will issue the Class A-S, B and C regular interests (each a “regular interest”) which will have outstanding principal balances on the closing date of $92,677,000, $98,023,000 and $53,468,000, respectively. The regular interests will be held in a grantor trust for the benefit of the holders of the Class A-S, B, C and PEX Certificates. The Class A-S, B, C and PEX Certificates will, at all times, represent undivided beneficial ownership interests in a grantor trust that will hold those regular interests. Each class of the Class A-S, B and C Certificates will, at all times, represent an undivided beneficial ownership interest in a percentage of the outstanding certificate principal balance of the regular interest with the same alphabetical class designation. The Class PEX Certificates will, at all times, represent an undivided beneficial ownership interest in the remaining percentages of the outstanding certificate principal balances of the Class A-S, B and C regular interests and which portions of those regular interests are referred to in this Term Sheet as the Class PEX Component A-S, Class PEX Component B and Class PEX Component C (collectively, the “Class PEX Components”). Following any exchange of Class A-S, B and C Certificates for Class PEX Certificates or any exchange of Class PEX Certificates for Class A-S, B and C Certificates as described in the Free Writing Prospectus, the percentage interest of the outstanding certificate principal balances of the Class A-S, B and C regular interest that is represented by the Class A-S, B, C and PEX Certificates will be increased or decreased accordingly. The initial certificate principal balance of each of the Class A-S, B and C Certificates shown in the table represents the maximum certificate principal balance of such class without giving effect to any exchange. The initial certificate principal balance of the Class PEX Certificates is equal to the aggregate of the initial certificate principal balance of the Class A-S, B and C Certificates and represents the maximum certificate principal balance of the Class PEX Certificates that could be issued in an exchange. The certificate principal balances of the Class A-S, B and C Certificates to be issued on the closing date will be reduced, in required proportions, by an amount equal to the certificate principal balance of the Class PEX Certificates issued on the closing date. Distributions and allocations of payments and losses with respect to the Exchangeable Certificates are described in this Term Sheet under “Allocations and Distributions on the Class A-S, B, C and PEX Certificates” and under “Description of the Offered Certificates—Distributions” in the Free Writing Prospectus. The maximum certificate principal balance of the Class PEX Certificates is set forth in the table but is not included in the certificate principal balance of the certificates set forth on the cover page of this Term Sheet or on the top of the cover page of the Free Writing Prospectus. |
| (9) | The Class X-A Certificates are notional amount certificates. The Notional Amount of the Class X-A Certificates will be equal to the aggregate principal balance of the Class A-1, A-2, A-3, A-4, A-5 and A-SB Certificates and the Class A-S regular interest outstanding from time to time. The Class X-A Certificates will not be entitled to distributions of principal. |
| (10) | The pass-through rate for the Class X-A Certificates for any distribution date will be a per annum rate equal to the excess, if any, of (a) the weighted average of the net mortgage interest rates on the mortgage loans for the related distribution date, over (b) the weighted average of the pass-through rates on the Class A-1, A-2, A-3, A-4, A-5 and A-SB Certificates and the Class A-S regular interest for the related distribution date, weighted on the basis of their respective aggregate principal balances outstanding immediately prior to that distribution date. For purposes of the calculation of the weighted average of the net mortgage interest rates on the mortgage loans for each distribution date, the mortgage interest rates will be adjusted as necessary to a 30/360 basis. |
| (11) | The Class X-B Certificates are notional amount certificates. The Notional Amount of the Class X-B Certificates will be equal to the aggregate principal balance of the Class B and C regular interests and the Class D Certificates outstanding from time to time. The Class X-B Certificates will not be entitled to distributions of principal. |
| (12) | The pass-through rate for the Class X B certificates for any distribution date will be a per annum rate equal to the excess, if any, of (a) the weighted average of the net mortgage interest rates on the mortgage loans for the related distribution date, over (b) the weighted average of the pass-through rates on the Class D certificates and the Class B and Class C regular interests for the related distribution date, weighted on the basis of their respective aggregate certificate principal balances outstanding immediately prior to that distribution date. For purposes of the calculation of the weighted average of the net mortgage interest rates on the mortgage loans for each distribution date, the mortgage interest rates will be adjusted as necessary to a 30/360 basis. |
| (13) | The Class X-C Certificates are notional amount certificates. The Notional Amount of the Class X-C Certificates will be equal to the principal balance of the Class E Certificates outstanding from time to time. The Class X-C Certificates will not be entitled to distributions of principal. |
| (14) | The pass-through rate for the Class X-C Certificate for any distribution date will be a per annum rate equal to the excess, if any, of (a) the weighted average of the net mortgage interest rates on the mortgage loans for the related distribution date, over (b) the pass-through rate on the Class E Certificates for the related distribution date. For purposes of the calculation of the weighted average of the net mortgage interest rates on the mortgage loans for each distribution date, the mortgage interest rates will be adjusted as necessary to a 30/360 basis. |
| (15) | The Class X-D Certificates are notional amount certificates. The Notional Amount of the Class X-D Certificates will be equal to the aggregate principal balance of the Class F and G Certificates outstanding from time to time. The Class X-D Certificates will not be entitled to distributions of principal. |
| (16) | The pass-through rate for the Class X-D Certificates for any distribution date will be a per annum rate equal to the excess, if any, of (a) the weighted average of the net mortgage interest rates on the mortgage loans for the related distribution date, over (b) the weighted average of the pass-through rates on the Class F and G Certificates for the related distribution date, weighted on the basis of their respective aggregate principal balances outstanding immediately prior to that distribution date. For purposes of the calculation of the weighted average of the net mortgage interest rates on the mortgage loans for each distribution date, the mortgage interest rates will be adjusted as necessary to a 30/360 basis. |
THE INFORMATION IN THIS STRUCTURAL AND COLLATERAL TERM SHEET IS NOT COMPLETE AND MAY BE AMENDED PRIOR TO THE TIME OF SALE. THIS TERM SHEET IS NOT AN OFFER TO SELL THESE SECURITIES AND IT IS NOT A SOLICITATION OF AN OFFER TO BUY THESE SECURITIES IN ANY JURISDICTION WHERE THE OFFER OR SALE IS NOT PERMITTED.
4
| WFRBS Commercial Mortgage Trust 2014-C21 | Characteristics of the Mortgage Pool |
| II. | Transaction Highlights |
Mortgage Loan Sellers:
| Mortgage Loan Seller | Number of Mortgage Loans | Number of Mortgaged Properties | Aggregate Cut-off Date Balance | % of Cut-off Date Pool Balance | ||||||||||||||
| Wells Fargo Bank, National Association | 40 | 41 | $587,584,612 | 41.2 | % | |||||||||||||
The Royal Bank of Scotland(1) | 16 | 34 | 384,156,012 | 26.9 | ||||||||||||||
| Liberty Island Group I LLC | 14 | 16 | 189,621,552 | 13.3 | ||||||||||||||
| C-III Commercial Mortgage LLC | 27 | 30 | 126,954,763 | 8.9 | ||||||||||||||
| Basis Real Estate Capital II, LLC | 10 | 10 | 77,992,875 | 5.5 | ||||||||||||||
| NCB, FSB | 15 | 15 | 59,486,535 | 4.2 | ||||||||||||||
| Total | 122 | 146 | $1,425,796,349 | 100.0 | % | |||||||||||||
| (1) | The mortgage loan seller referred to herein as The Royal Bank of Scotland is comprised of two affiliated companies: The Royal Bank of Scotland plc and RBS Financial Products Inc. With respect to the mortgage loans being sold for the deposit into the trust by The Royal Bank of Scotland: (a) fourteen (14) mortgage loans, having an aggregate cut-off date principal balance of $357,917,998 and representing approximately 25.1% of the aggregate principal balance of the pool of mortgage loans as of the cut-off date, are being sold for deposit into the trust by The Royal Bank of Scotland plc and (b) two (2) mortgage loans, having an aggregate cut-off date principal balance of $26,238,014and representing approximately 1.8% of the aggregate principal balance of the pool of mortgage loans as of the cut-off date are being sold for deposit into the trust by RBS Financial Products Inc. |
Loan Pool:
| Cut-off Date Balance: | $1,425,796,349 |
| Number of Mortgage Loans: | 122 |
| Average Cut-off Date Balance per Mortgage Loan: | $11,686,855 |
| Number of Mortgaged Properties: | 146 |
Average Cut-off Date Balance per Mortgaged Property(1): | $9,765,728 |
| Weighted Average Mortgage Interest Rate: | 4.608% |
| Ten Largest Mortgage Loans as % of Cut-off Date Pool Balance: | 42.2% |
| Weighted Average Original Term to Maturity or ARD (months): | 114 |
| Weighted Average Remaining Term to Maturity or ARD (months): | 113 |
Weighted Average Original Amortization Term (months)(2): | 351 |
Weighted Average Remaining Amortization Term (months)(2): | 351 |
| Weighted Average Seasoning (months): | 1 |
| (1) | Information regarding mortgage loans secured by multiple properties is based on an allocation according to relative appraised values or the allocated loan amounts or property-specific release prices set forth in the related loan documents or such other allocation as the related mortgage loan seller deemed appropriate. |
| (2) | Excludes any mortgage loan that does not amortize. |
Credit Statistics:
Weighted Average U/W Net Cash Flow DSCR(1): | 1.98x |
Weighted Average U/W Net Operating Income Debt Yield Ratio(1): | 12.1% |
Weighted Average Cut-off Date Loan-to-Value Ratio(1): | 63.3% |
Weighted Average Balloon or ARD Loan-to-Value Ratio(1): | 55.2% |
% of Mortgage Loans with Additional Subordinate Debt(2): | 5.0% |
% of Mortgage Loans with Single Tenants(3): | 6.3% |
| (1) | With respect to the Queens Atrium, Montgomery Mall, and Oak Court Mall mortgage loans, loan-to-value ratio, debt service coverage ratio and debt yield calculations include the related pari passu companion loan (unless otherwise stated) in total debt. The information for each mortgaged property that relates to a mortgage loan that is cross-collateralized with other mortgage loans is based upon the principal balance of that mortgage loan, except that the applicable loan-to-value ratio, debt service coverage ratio, or debt yield for each such mortgaged property is based upon the ratio or yield (as applicable) for the aggregate indebtedness evidenced by all loans in the group. On an individual basis, without regard to the cross-collateralization feature, any mortgaged property securing a mortgage loan that is part of a cross-collateralized group of mortgage loans may have a higher loan-to-value ratio, lower debt service coverage ratio and/or lower debt yield than is presented herein. The debt service coverage ratio and debt yield calculations for each residential cooperative mortgage loan is calculated using underwritten net cash flow for the related residential cooperative property, which is the projected net cash flow reflected in the most recent appraisal obtained by or otherwise in the possession of the related mortgage loan seller as of the cut-off date, and the loan-to value ratio information for each residential cooperative mortgage loan is based upon the appraised value of the residential cooperative property determined as if such residential cooperative property is operated as a residential cooperative.See Annex A to the Free Writing Prospectus. Debt service coverage ratio, debt yield and loan-to-value ratio information does not take into account any of subordinate debt (whether or not secured by the mortgaged property), that is allowed under the terms of any mortgage loan. |
| (2) | Nine (9) of the mortgage loans, each of which are secured by residential cooperative properties, currently have in place subordinate secured lines of credit to the related mortgage borrowers that permit future advances (such loans, collectively, the “Subordinate Coop LOCs”). The percentage figure expressed as “% of Mortgage loans with Additional Subordinate Debt” is determined as a percentage of cut-off date principal balance of the mortgage pool and does not take into account future subordinate debt (whether or not secured by the mortgaged property), if any, that may be permitted under the terms of any mortgage loan or the pooling and servicing agreement. See “Description of the Mortgage Pool—Subordinate and/or Other Financing” and “—Additional Debt Financing for Mortgage Loans Secured by Residential Cooperatives” in the Free Writing Prospectus. |
| (3) | Excludes mortgage loans that are secured by multiple single-tenant properties. |
THE INFORMATION IN THIS STRUCTURAL AND COLLATERAL TERM SHEET IS NOT COMPLETE AND MAY BE AMENDED PRIOR TO THE TIME OF SALE. THIS TERM SHEET IS NOT AN OFFER TO SELL THESE SECURITIES AND IT IS NOT A SOLICITATION OF AN OFFER TO BUY THESE SECURITIES IN ANY JURISDICTION WHERE THE OFFER OR SALE IS NOT PERMITTED.
5
| WFRBS Commercial Mortgage Trust 2014-C21 | Characteristics of the Mortgage Pool |
Loan Structural Features:
Amortization: Based on the Cut-off Date Pool Balance, 81.5% of the mortgage pool (112 mortgage loans) have scheduled amortization, as follows:
45.8% (85 mortgage loans) require amortization during the entire loan term
35.6% (27 mortgage loans) provide for an interest-only period followed by an amortization and/or hyperamortization period
Interest-Only: Based on the Cut-off Date Pool Balance, 18.5% of the mortgage pool (10 mortgage loans) provides for interest-only payments during the entire loan term. The Weighted Average Cut-off Date Loan-to-Value Ratio and Weighted Average U/W Net Cash Flow DSCR for those mortgage loans is 58.9% and 3.19x, respectively.
Hard Lockboxes: Based on the Cut-off Date Pool Balance, 43.5% of the mortgage pool (22 mortgage loans) have hard lockboxes in place.
Reserves: The mortgage loans require amounts to be escrowed monthly as follows (excluding any mortgage loans with springing provisions):
| Real Estate Taxes: | 79.1% of the pool | |||
| Insurance Premiums: | 66.0% of the pool | |||
| Capital Replacements: | 79.5% of the pool | |||
| TI/LC: | 69.3% of the pool(1) | |||
| (1) | The percentage of the Cut-off Date Balance for loans with TI/LC reserves is based on the aggregate principal balance allocable to office, retail, industrial, and other properties. | |||
Call Protection/Defeasance: Based on the Cut-off Date Pool Balance, the mortgage pool has the following call protection and defeasance features:
86.3% of the mortgage pool (94 mortgage loans) feature a lockout period, then defeasance only until an open period
4.2% of the mortgage pool (15 mortgage loans) feature no lockout period, but the greater of a prepayment premium or yield maintenance, then prepayment premium until an open period
5.4% of the mortgage pool (11 mortgage loans) feature a lockout period, then the greater of a prepayment premium or yield maintenance until an open period
3.3% of the mortgage pool (1 mortgage loans) feature no lockout period, then the greater of a prepayment premium or yield maintenance until an open period
0.8% of the mortgage pool (1 mortgage loans) feature a lockout period, then defeasance or the greater of a prepayment premium or yield maintenance until an open period
THE INFORMATION IN THIS STRUCTURAL AND COLLATERAL TERM SHEET IS NOT COMPLETE AND MAY BE AMENDED PRIOR TO THE TIME OF SALE. THIS TERM SHEET IS NOT AN OFFER TO SELL THESE SECURITIES AND IT IS NOT A SOLICITATION OF AN OFFER TO BUY THESE SECURITIES IN ANY JURISDICTION WHERE THE OFFER OR SALE IS NOT PERMITTED.
6
| WFRBS Commercial Mortgage Trust 2014-C21 | Characteristics of the Mortgage Pool |
| III. | Issue Characteristics | ||
| Securities Offered: | $1,242,225,000 approximate monthly pay, multi-class, commercial mortgage REMIC pass-through certificates consisting of twelve classes (Classes A-1, A-2, A-3, A-4, A-5, A-SB, A-S, B, C, PEX, X-A and X-B), which are offered pursuant to a registration statement filed with the SEC. | ||
| Mortgage Loan Sellers: | Wells Fargo Bank, National Association (“WFB”); The Royal Bank of Scotland (“RBS”); Liberty Island Group I LLC (“LIG I”); Basis Real Estate Capital II, LLC (“Basis”), C-III Commercial Mortgage LLC (“CIIICM”) and NCB, FSB | ||
| Co-lead Bookrunning Managers: | RBS Securities Inc. and Wells Fargo Securities, LLC | ||
| Co-Managers: | Citigroup Global Markets Inc. | ||
| Rating Agencies: | DBRS, Inc., Moody’s Investors Service, Inc., and Morningstar Credit Ratings, LLC | ||
| Master Servicers: | Wells Fargo Bank, National Association and NCB, FSB | ||
| Special Servicers: | CWCapital Asset Management, LLC and NCB, FSB | ||
| Certificate Administrator: | Wells Fargo Bank, National Association | ||
| Trustee: | Wilmington Trust, National Associatation | ||
| Trust Advisor: | Trimont Real Estate Advisors, Inc. | ||
| Initial Majority Subordinate Certificateholder: | An affiliate of Seer Capital Management, LP | ||
| Cut-off Date: | The Cut-off Date with respect to each mortgage loan is the due date for the monthly debt service payment that is due in August 2014 (or, in the case of any mortgage loan that has its first due date in September 2014, the date that would have been its due date in August 2014 under the terms of that mortgage loan if a monthly debt service payment were scheduled to be due in that month). | ||
| Expected Closing Date: | On or about August 12, 2014. | ||
| Determination Dates: | The eleventh day of each month (or if that day is not a business day, the next succeeding business day), commencing in September 2014. | ||
| Distribution Dates: | The fourth business day following the Determination Date in each month, commencing in September 2014. | ||
| Rated Final Distribution Date: | The Distribution Date in August 2047. | ||
| Interest Accrual Period: | With respect to any Distribution Date, the calendar month preceding the month in which such Distribution Date occurs. | ||
| Day Count: | The Offered Certificates will accrue interest on a 30/360 basis. | ||
| Minimum Denominations: | $10,000 for each Class of Offered Certificates (other than the Class X-A and Class X-B Certificates) and $1,000,000 for the Class X-A and Class X-B Certificates. Investments may also be made in any whole dollar denomination in excess of the applicable minimum denomination. | ||
| Clean-up Call: | 1% | ||
| Delivery: | DTC, Euroclear and Clearstream Banking | ||
| ERISA/SMMEA Status: | Each Class of Offered Certificates is expected to be eligible for exemptive relief under ERISA. No Class of Offered Certificates will be SMMEA eligible. | ||
| Risk Factors: | THE CERTIFICATES INVOLVE CERTAIN RISKS AND MAY NOT BE SUITABLE FOR ALL INVESTORS. SEE THE “RISK FACTORS” SECTION OF THE FREE WRITING PROSPECTUS. | ||
| Bond Analytics Information: | The Certificate Administrator will be authorized to make distribution date settlements, CREFC® reports and certain supplemental reports (other than confidential information) available to certain financial modeling and data provision services, including Bloomberg Financial Markets L.P., Trepp LLC, Intex Solutions, Inc., Markit Group Limited, Interactive Data Corp., BlackRock Financial Management, Inc. and CMBS.com, Inc. |
THE INFORMATION IN THIS STRUCTURAL AND COLLATERAL TERM SHEET IS NOT COMPLETE AND MAY BE AMENDED PRIOR TO THE TIME OF SALE. THIS TERM SHEET IS NOT AN OFFER TO SELL THESE SECURITIES AND IT IS NOT A SOLICITATION OF AN OFFER TO BUY THESE SECURITIES IN ANY JURISDICTION WHERE THE OFFER OR SALE IS NOT PERMITTED.
7
| WFRBS Commercial Mortgage Trust 2014-C21 | Characteristics of the Mortgage Pool |
| IV. | Characteristics of the Mortgage Pool(1) |
| A. | Ten Largest Mortgage Loans |
Mortgage Loan Seller | Mortgage Loan Name | City | State | Number of Mortgage Loans / Mortgaged Properties | Mortgage Loan Cut-off Date Balance ($) | % of Cut- off Date Pool Balance (%) | Property Type | Number of SF, Rooms or Units | Cut-off Date Balance Per Unit of Measure($) | Cut-off Date LTV Ratio (%) | Balloon or ARD LTV Ratio (%) | U/W NCF DSCR (x) | U/W NOI Debt Yield (%) | ||||||||||||||||||||||||||
| RBS | Fairview Park Drive | Falls Church | VA | 1 / 1 | $90,000,000 | 6.3 | % | Office | 360,864 | $249 | 66.7 | % | 66.7 | % | 1.91 | x | 8.7 | % | |||||||||||||||||||||
| WFB | Queens Atrium | Long Island City | NY | 1 / 1 | 90,000,000 | 6.3 | Office | 1,032,402 | 174 | 69.2 | 63.2 | 1.41 | 9.2 | ||||||||||||||||||||||||||
| WFB | Sheraton Austin | Austin | TX | 1 / 1 | 67,000,000 | 4.7 | Hospitality | 365 | 183,562 | 61.8 | 61.8 | 3.03 | 13.6 | ||||||||||||||||||||||||||
| RBS | Highland Portfolio | Various | MI | 1 / 6 | 62,400,000 | 4.4 | Multifamily | 1,873 | 33,316 | 72.1 | 65.1 | 1.20 | 8.4 | ||||||||||||||||||||||||||
| WFB | Cedar Crest Professional Park | Allentown | PA | 1 / 1 | 59,929,763 | 4.2 | Office | 700,815 | 86 | 64.4 | 52.3 | 1.47 | 10.5 | ||||||||||||||||||||||||||
| WFB | Shops at CenterPoint | Grand Rapids | MI | 1 / 1 | 54,000,000 | 3.8 | Retail | 461,196 | 117 | 73.4 | 67.1 | 1.44 | 9.3 | ||||||||||||||||||||||||||
| RBS | Algonquin Portfolio | Various | NJ | 1 / 12 | 49,500,000 | 3.5 | Various | 750,823 | 66 | 59.7 | 52.5 | 1.39 | 9.4 | ||||||||||||||||||||||||||
| WFB | Tryp by Wyndham Times Square South | New York | NY | 1 / 1 | 46,879,457 | 3.3 | Hospitality | 173 | 270,980 | 53.8 | 43.4 | 1.67 | 11.4 | ||||||||||||||||||||||||||
| RBS | Montgomery Mall | North Wales | PA | 1 / 1 | 46,000,000 | 3.2 | Retail | 1,109,341 | 90 | 51.3 | 51.3 | 3.06 | 14.7 | ||||||||||||||||||||||||||
| WFB | The Bluffs | Junction City | KS | 1 / 1 | 36,184,577 | 2.5 | Multifamily | 602 | 60,107 | 74.9 | 61.2 | 1.35 | 8.9 | ||||||||||||||||||||||||||
| Top Three Total/Weighted Average | 3 / 3 | $247,000,000 | 17.3 | % | 66.3 | % | 64.1 | % | 2.03 | x | 10.2 | % | |||||||||||||||||||||||||||
| Top Five Total/Weighted Average | 5 / 10 | $369,329,763 | 25.9 | % | 67.0 | % | 62.4 | % | 1.80 | x | 10.0 | % | |||||||||||||||||||||||||||
| Top Ten Total/Weighted Average | 10 / 26 | $601,893,797 | 42.2 | % | 65.2 | % | 59.6 | % | 1.79 | x | 10.3 | % | |||||||||||||||||||||||||||
| Non-Top Ten Total/Weighted Average | 112 / 120 | $823,902,552 | 57.8 | % | 61.9 | % | 52.0 | % | 2.11 | x | 13.4 | % | |||||||||||||||||||||||||||
| (1) | With respect to the Queens Atrium, Montgomery Mall, and Oak Court Mall mortgage loans, Cut-off Date Balance per unit of measure, loan-to-value ratio, debt service coverage ratio and debt yield calculations include the related pari passu companion loan (unless otherwise stated) in total debt. |
THE INFORMATION IN THIS STRUCTURAL AND COLLATERAL TERM SHEET IS NOT COMPLETE AND MAY BE AMENDED PRIOR TO THE TIME OF SALE. THIS TERM SHEET IS NOT AN OFFER TO SELL THESE SECURITIES AND IT IS NOT A SOLICITATION OF AN OFFER TO BUY THESE SECURITIES IN ANY JURISDICTION WHERE THE OFFER OR SALE IS NOT PERMITTED.
8
| WFRBS Commercial Mortgage Trust 2014-C21 | Characteristics of the Mortgage Pool |
| B. | Summary of Pari Passu Split Loan Structures |
| Mortgage Loan Name | Mortgage Loan Seller | Related Notes in Loan Group (Original Balance) | Holder of Note | Whether Note is Lead Servicing for the Entire Loan Combination | Current Master Servicer Under Related Securitization PSA | Current Special Servicer Under Related Securitization PSA | ||||||
| Queens Atrium | WFB | $90,000,000 | WFRBS 2014-C21 | (1) | Wells Fargo Bank, National Association | CWCapital Asset Management, LLC | ||||||
| Barclays | $90,000,000 | Barclays Bank PLC | (1) | TBD | TBD | |||||||
| Montgomery Mall | RBS | $54,000,000 | WFCM 2014-LC16 | Y | Wells Fargo Bank, National Association | Rialto Capital Management, LLC | ||||||
| RBS | $46,000,000 | WFRBS 2014-C21 | N | Wells Fargo Bank, National Association | CWCapital Asset Management, LLC | |||||||
| Oak Court Mall | RBS | $24,000,000 | WFRBS 2014-C21 | Y | Wells Fargo Bank, National Association | CWCapital Asset Management, LLC | ||||||
| RBS | $16,000,000 | WFCM 2014-LC16 | N | Wells Fargo Bank, National Association | Rialto Capital Management, LLC |
| (1) | The Queens Atrium pari passu loan combination will be serviced under the WFRBS 2014-C21 pooling and servicing agreement until the securitization of the related pari passu companion loan, after which such loan combination will be serviced under the pooling and servicing agreement related to the securitization of the pari passu companion loan. The master servicer under the latter pooling and servicing agreement will be identified in a notice, report or statement to holders of the WFRBS 2014-C21 certificates after the securitization of the pari passu companion loan. |
| C. | Mortgage Loans with Additional Secured and Mezzanine Financing(1)(2) |
| Loan No. | Mortgage Loan Seller | Mortgage Loan Name | Mortgage Loan Cut-off Date Balance ($) | % of Cut- off Date Balance (%) | Sub Debt Cut-off Date Balance ($) | Mezzanine Debt Cut-off Date Balance ($) | Total Debt Interest Rate (%) | Mortgage Loan U/W NCF DSCR (x) | Total Debt U/W NCF DSCR (x) | Mortgage Loan Cut- off Date U/W NOI Debt Yield (%) | Total Debt Cut-off Date U/W NOI Debt Yield (%) | Mortgage Loan Cut-off Date LTV Ratio (%) | Total Debt Cut-off Date LTV Ratio (%) | |||||||||||||||||||||||||||||||
| 13 | Basis | Oak Park Village Apartments | $29,150,000 | 2.0 | % | $0 | $4,000,000 | 5.642 | % | 1.58 | x | 1.25 | x | 10.5 | % | 9.2 | % | 69.3 | %(3) | 80.1 | %(3) | |||||||||||||||||||||||
| 21 | WFB | Barrington Orthopedics Portfolio | 15,859,221 | 1.1 | 0 | 3,975,000 | 4.550 | (4) | 1.66 | 1.37 | (4) | 10.8 | 8.6 | 59.6 | 74.5 | |||||||||||||||||||||||||||||
| Total/Weighted Average | $45,009,221 | 3.2 | % | $0 | $7,975,000 | 5.257 | % | 1.61 | x | 1.29 | x | 10.6 | % | 9.0 | % | 65.9 | % | 78.1 | % | |||||||||||||||||||||||||
| (1) | In addition, nine (9) of the mortgage loans, each of which are secured by residential cooperative properties, currently have in place Subordinate Coop LOCs that permit future advances, but as to which there are no present outstanding balances, except for loan #121 214 West 17th Apartment Corp., which has a balance of $50,000 on its related Subordinate Coop LOC. See “Description of the Mortgage Pool—Subordinate and/or Other Financing” and “—Additional Debt Financing for Mortgage Loans Secured by Residential Cooperatives” in the Free Writing Prospectus. |
| (2) | Total Debt Interest Rate for any specified mortgage loan reflects the weighted average of the interest rates on the respective components of the total debt. |
| (3) | The Cut-off Date LTV Ratios were calculated net of the $3,500,000 holdback. |
| (4) | The mezzanine loan interest rate is variable. For calculations, 5.15% was the assumed mezzanine loan rate. |
THE INFORMATION IN THIS STRUCTURAL AND COLLATERAL TERM SHEET IS NOT COMPLETE AND MAY BE AMENDED PRIOR TO THE TIME OF SALE. THIS TERM SHEET IS NOT AN OFFER TO SELL THESE SECURITIES AND IT IS NOT A SOLICITATION OF AN OFFER TO BUY THESE SECURITIES IN ANY JURISDICTION WHERE THE OFFER OR SALE IS NOT PERMITTED.
9
| WFRBS Commercial Mortgage Trust 2014-C21 | Characteristics of the Mortgage Pool |
| D. | Previous Securitization History(1) |
| Loan No. | Mortgage Loan Seller | Mortgage Loan or Mortgaged Property Name | City | State | Property Type | Mortgage Loan or Mortgaged Property Cut-off Date Balance ($) | % of Cut-off Date Pool Balance (%) | Previous Securitization | ||||||||||
| 1 | RBS | Fairview Park Drive | Falls Church | VA | Office | $90,000,000 | 6.3 | % | BSCMS 2004-PWR5 | |||||||||
| 2 | WFB | Queens Atrium | Long Island City | NY | Office | 90,000,000 | 6.3 | BACM 2005-3 | ||||||||||
| 7 | RBS | Algonquin Portfolio | Various | NJ | Various | 49,500,000 | 3.5 | GMACC 2005-C1; BSCMS 2004-PWR5 | ||||||||||
| 9 | RBS | Montgomery Mall | North Wales | PA | Retail | 46,000,000 | 3.2 | LBUBS 2004-C7 | ||||||||||
| 11 | LIG I | Holiday Inn San Francisco Airport | South San Francisco | CA | Hospitality | 33,000,000 | 2.3 | CSMC 2006-C1 | ||||||||||
| 12 | WFB | White Road Plaza | San Jose | CA | Retail | 32,000,000 | 2.2 | GSMS 2004-GG2 | ||||||||||
| 17 | CIIICM | Rock Pointe East | Spokane | WA | Office | 21,750,000 | 1.5 | CD 2006-CD2 | ||||||||||
| 25 | RBS | Coastal Sunbelt | Savage | MD | Industrial | 14,500,000 | 1.0 | BSCMS 2007-PW17 | ||||||||||
| 27 | CIIICM | Kingsborough Estates MHC | Raleigh | NC | Manufactured Housing Community | 13,125,000 | 0.9 | GSMS 2011-GC3 | ||||||||||
| 29 | NCB, FSB | Warminster Heights Home Ownership Association, Inc. | Warminster | PA | Multifamily | 11,986,016 | 0.8 | CSFB 2005-C3 | ||||||||||
| 36 | WFB | Colonial Heritage MHC | Doylestown | PA | Manufactured Housing Community | 10,981,900 | 0.8 | WBCMT 2004-C11 | ||||||||||
| 42 | RBS | Quest Automotive Products | Massillon | OH | Industrial | 8,462,421 | 0.6 | JPMCC 2007-CB20 | ||||||||||
| 45 | RBS | Holiday Inn Express Superior | Superior | WI | Hospitality | 7,967,417 | 0.6 | LBUBS 2006-C6 | ||||||||||
| 50 | CIIICM | Bramblewood MHC | McKinney | TX | Manufactured Housing Community | 6,995,949 | 0.5 | LBUBS 2004-C6 | ||||||||||
| 51 | RBS | Residence Inn by Marriott, Colorado Springs, CO | Colorado Springs | CO | Hospitality | 6,800,000 | 0.5 | JPMCC 2006-LDP6 | ||||||||||
| 61 | RBS | Fairfield Inn & Suites Colorado Springs, CO | Colorado Springs | CO | Hospitality | 5,600,000 | 0.4 | MLMT 2006-C1 | ||||||||||
| 70 | NCB, FSB | Gateway Apartment Owners Corp. | Yonkers | NY | Multifamily | 4,811,970 | 0.3 | MSC 2005-IQ10 | ||||||||||
| 76 | CIIICM | All American Storage Bloomington South | Bloomington | IN | Self Storage | 4,194,651 | 0.3 | JPMCC 2005-LDP3 | ||||||||||
| 77 | RBS | Fairfield Inn & Suites, Olathe, KS | Olathe | KS | Hospitality | 4,080,000 | 0.3 | JPMCC 2006-LDP6 | ||||||||||
| 81 | WFB | Bay Area Self Storage - Bird | San Jose | CA | Self Storage | 3,900,000 | 0.3 | BSCMS 2004-PWR5 | ||||||||||
| 84 | NCB, FSB | 67th Road Housing Corporation | Forest Hills | NY | Multifamily | 3,585,775 | 0.3 | MSC 2005-IQ10 | ||||||||||
| 86 | NCB, FSB | 993 Fifth Avenue Corporation | New York | NY | Multifamily | 3,500,000 | 0.2 | CSFB 2005-C5 | ||||||||||
| 89 | CIIICM | All American Storage East | Bloomington | IN | Self Storage | 3,395,670 | 0.2 | JPMCC 2005-LDP3 | ||||||||||
| 90 | Basis | Shoppes of Fort Wright | Fort Wright | KY | Retail | 3,267,428 | 0.2 | JPMCC 2004-LN2 | ||||||||||
| 91 | WFB | Patriot Village | Brandon | FL | Retail | 3,200,000 | 0.2 | BSCMS 2003-PWR2 | ||||||||||
| 93 | WFB | University Center South | Jacksonville | FL | Retail | 3,142,626 | 0.2 | MLMT 2005-CIP1 | ||||||||||
| 95 | CIIICM | Shadow Wood MHP | Champaign | IL | Manufactured Housing Community | 2,954,777 | 0.2 | LBUBS 2004-C4 | ||||||||||
| 97 | WFB | Taxi Office Building | Denver | CO | Office | 2,846,768 | 0.2 | BSCMS 2004-PWR5 | ||||||||||
| 100 | WFB | Walgreens - Denver | Denver | CO | Retail | 2,728,180 | 0.2 | BSCMS 2004-PWR5 | ||||||||||
| 102 | NCB, FSB | 67-35 Yellowstone Blvd. Owners Corp. | Forest Hills | NY | Multifamily | 2,496,261 | 0.2 | MSC 2005-IQ9 | ||||||||||
| 104 | NCB, FSB | Palmbrook Gardens Tenants Corp. | Yonkers | NY | Multifamily | 2,490,381 | 0.2 | MSC 2005-IQ9 | ||||||||||
| 105 | CIIICM | Commercial Drive Plaza | New Hartford | NY | Retail | 2,397,521 | 0.2 | CSFB 2004-C3 | ||||||||||
| 106 | CIIICM | Stonegate MHP | San Antonio | TX | Manufactured Housing Community | 2,397,420 | 0.2 | LBUBS 2004-C7 | ||||||||||
| 107 | NCB, FSB | Harrison Commons, Ltd. | Harrison | NY | Multifamily | 2,246,645 | 0.2 | MSC 2005-IQ10 | ||||||||||
| 113 | NCB, FSB | Florence Court Corporation | Brooklyn | NY | Multifamily | 1,693,704 | 0.1 | MSC 2005-IQ9 | ||||||||||
| 118 | NCB, FSB | 320 W. 89th St. Owners Corp. | New York | NY | Multifamily | 1,494,181 | 0.1 | MSC 2005-IQ10 | ||||||||||
| 121 | NCB, FSB | 214 West 17th Apartment Corp. | New York | NY | Multifamily | 972,388 | 0.1 | MSC 2005-IQ9 | ||||||||||
| Total | $510,465,049 | 35.8 | % | |||||||||||||||
(1) The table above represents the most recent securitization with respect to the mortgaged property securing the related mortgage loan, based on information provided by the related borrower or obtained through searches of a third-party database. While the above mortgage loans may have been securitized multiple times in prior transactions, mortgage loans are only listed in the above chart if the mortgage loan paid off a mortgage loan in another securitization. The information in the table above has not otherwise been confirmed by the mortgage loan sellers.
THE INFORMATION IN THIS STRUCTURAL AND COLLATERAL TERM SHEET IS NOT COMPLETE AND MAY BE AMENDED PRIOR TO THE TIME OF SALE. THIS TERM SHEET IS NOT AN OFFER TO SELL THESE SECURITIES AND IT IS NOT A SOLICITATION OF AN OFFER TO BUY THESE SECURITIES IN ANY JURISDICTION WHERE THE OFFER OR SALE IS NOT PERMITTED.
10
| WFRBS Commercial Mortgage Trust 2014-C21 | Characteristics of the Mortgage Pool |
E. Mortgage Loans with Scheduled Balloon Payments and Related Classes
Class A-2(1) | ||||||||||||||||||||||||||||||||
| Loan No. | Mortgage Loan Seller | Mortgage Loan Name | State | Property Type | Mortgage Loan Cut-off Date Balance ($) | % of Cut-off Date Pool Balance (%) | Mortgage Loan Balance at Maturity ($) | % of Class A-2 Certificate Principal Balance (%)(2) | Units/SF /Rooms | Loan per Unit/SF/ Room ($) | U/W NCF DSCR (x) | U/W NOI Debt Yield (%) | Cut-off Date LTV Ratio (%) | Balloon LTV Ratio(%) | Rem. IO Period (mos.) | Rem. Term to Maturity (mos.) | ||||||||||||||||
| 3 | WFB | Sheraton Austin | TX | Hospitality | $67,000,000 | 4.7% | $67,000,000 | 61.4% | 365 | $183,562 | 3.03x | 13.6% | 61.8% | 61.8% | 58 | 58 | ||||||||||||||||
| 16 | LIG I | Kane Distribution Center 6 | PA | Industrial | 22,600,000 | 1.6 | 21,444,520 | 19.6 | 955,935 | 24 | 1.72 | 11.2 | 57.8 | 54.8 | 23 | 59 | ||||||||||||||||
| 52 | Basis | Fitch Apartments | DC | Multifamily | 6,743,516 | 0.5 | 6,264,081 | 5.7 | 75 | 89,914 | 1.27 | 8.9 | 73.3 | 68.1 | 0 | 59 | ||||||||||||||||
| 76 | CIIICM | All American Storage Bloomington South | IN | Self Storage | 4,194,651 | 0.3 | 3,824,642 | 3.5 | 55,534 | 76 | 1.57 | 9.4 | 72.3 | 65.9 | 0 | 59 | ||||||||||||||||
| 89 | CIIICM | All American Storage East | IN | Self Storage | 3,395,670 | 0.2 | 3,096,139 | 2.8 | 50,784 | 67 | 1.54 | 9.2 | 74.5 | 67.9 | 0 | 59 | ||||||||||||||||
| 92 | CIIICM | All American Storage of Evansville | IN | Self Storage | 3,195,925 | 0.2 | 2,914,013 | 2.7 | 57,135 | 56 | 1.51 | 9.1 | 74.3 | 67.8 | 0 | 59 | ||||||||||||||||
| 112 | WFB | World Park 9 | OH | Industrial | 1,752,731 | 0.1 | 1,596,283 | 1.5 | 58,800 | 30 | 1.73 | 12.4 | 64.9 | 59.1 | 0 | 59 | ||||||||||||||||
| Total/Weighted Average | $108,882,493 | 7.6% | $106,139,678 | 97.2% | 2.48x | 12.4% | 62.9% | 61.2% | 40 | 58 | ||||||||||||||||||||||
(1) The table above presents the mortgage loans whose balloon payments would be applied to pay down the principal balance of the Class A-2 Certificates, assuming a 0% CPR and applying the “Structuring Assumptions” described in the Free Writing Prospectus, including the assumptions that (i) none of the mortgage loans in the pool experience prepayments, defaults or losses; (ii) there are no extensions of maturity dates of any mortgage loans in the pool; and (iii) each mortgage loan in the pool is paid in full on its stated maturity date. Each class of Certificates, including the Class A-2 Certificates, evidences undivided ownership interests in the entire pool of mortgage loans. (2) Reflects the Mortgage Loan Balance at Maturity divided by the initial Class A-2 Certificate Principal Balance expressed as a percentage. |
Class A-3(1) | ||||||||||||||||||||||||||||||||
| Loan No. | Mortgage Loan Seller | Mortgage Loan Name | State | Property Type | Mortgage Loan Cut-off Date Balance ($) | % of Cut-off Date Pool Balance (%) | Mortgage Loan Balance at Maturity ($) | % of Class A-3 Certificate Principal Balance (%)(2) | Units/SF /Pads | Loan per Unit/SF/ Pads ($) | U/W NCF DSCR (x) | U/W NOI Debt Yield (%) | Cut-off Date LTV Ratio (%) | Balloon LTV Ratio (%) | Rem. IO Period (mos.) | Rem. Term to Maturity (mos.) | ||||||||||||||||
| 15 | RBS | Oak Court Mall | TN | Retail | $23,884,983 | 1.7% | $21,132,804 | 43.8% | 240,197 | $166 | 1.81x | 12.1% | 65.3% | 57.7% | 0 | 80 | ||||||||||||||||
| 38 | WFB | Arrowhead Apartments | OH | Multifamily | 9,987,623 | 0.7 | 8,719,616 | 18.1 | 360 | 27,743 | 1.96 | 12.8 | 48.8 | 42.6 | 0 | 83 | ||||||||||||||||
| 49 | CIIICM | Riverplace Athletic Club | OR | Retail | 7,100,000 | 0.5 | 6,306,004 | 13.1 | 55,462 | 128 | 1.46 | 10.7 | 67.0 | 59.5 | 0 | 84 | ||||||||||||||||
| 79 | WFB | American Mini Storage I - Missouri City | TX | Self Storage | 4,000,000 | 0.3 | 3,733,799 | 7.7 | 55,175 | 73 | 1.70 | 10.5 | 63.0 | 58.8 | 35 | 83 | ||||||||||||||||
| 87 | WFB | American Mini Storage II - Arlington | TX | Self Storage | 3,500,000 | 0.2 | 3,264,988 | 6.8 | 85,175 | 41 | 1.72 | 10.7 | 63.6 | 59.4 | 35 | 83 | ||||||||||||||||
| 98 | WFB | American Mini Storage II - Colorado Springs | CO | Self Storage | 2,800,000 | 0.2 | 2,611,991 | 5.4 | 109,460 | 26 | 1.83 | 11.5 | 65.9 | 61.5 | 35 | 83 | ||||||||||||||||
| 99 | CIIICM | Red Run MHC | MI | Manufactured Housing Community | 2,797,087 | 0.2 | 2,483,783 | 5.1 | 122 | 22,927 | 1.75 | 11.6 | 69.9 | 62.1 | 0 | 83 | ||||||||||||||||
| Total/Weighted Average | $54,069,693 | 3.8% | $48,252,986 | 100.0% | 1.78x | 11.8% | 62.5% | 55.8% | 7 | 82 | ||||||||||||||||||||||
(1) The table above presents the mortgage loans whose balloon payments would be applied to pay down the principal balance of the Class A-3 Certificates, assuming a 0% CPR and applying the “Structuring Assumptions” described in the Free Writing Prospectus, including the assumptions that (i) none of the mortgage loans in the pool experience prepayments, defaults or losses; (ii) there are no extensions of maturity dates of any mortgage loans in the pool; and (iii) each mortgage loan in the pool is paid in full on its stated maturity date. Each class of Certificates, including the Class A-3 Certificates, evidences undivided ownership interests in the entire pool of mortgage loans. (2) Reflects the Mortgage Loan Balance at Maturity divided by the initial Class A-3 Certificate Principal Balance expressed as a percentage. | ||||||||||||||||||||||||||||||||
THE INFORMATION IN THIS STRUCTURAL AND COLLATERAL TERM SHEET IS NOT COMPLETE AND MAY BE AMENDED PRIOR TO THE TIME OF SALE. THIS TERM SHEET IS NOT AN OFFER TO SELL THESE SECURITIES AND IT IS NOT A SOLICITATION OF AN OFFER TO BUY THESE SECURITIES IN ANY JURISDICTION WHERE THE OFFER OR SALE IS NOT PERMITTED.
11
| WFRBS Commercial Mortgage Trust 2014-C21 | Characteristics of the Mortgage Pool |
F. Property Type Distribution(1)
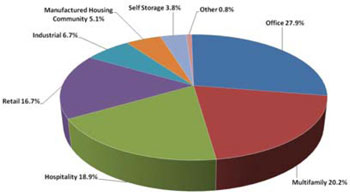
| Property Type | Number of Mortgaged Properties | Aggregate Cut- off Date Balance ($) | % of Cut- off Date Pool Balance (%) | Weighted Average Cut-off Date LTV Ratio (%) | Weighted Average Balloon or ARD LTV Ratio (%) | Weighted Average U/W NCF DSCR (x) | Weighted Average U/W NOI Debt Yield (%) | Weighted Average U/W NCF Debt Yield (%) | Weighted Average Mortgage Rate (%) | |||||||||
| Office | 18 | $397,129,491 | 27.9% | 66.1% | 59.5% | 1.62x | 9.9% | 8.9% | 4.471% | |||||||||
| Suburban | 12 | 174,390,507 | 12.2 | 65.1 | 60.2 | 1.72 | 9.7 | 8.9 | 4.505 | |||||||||
| CBD | 4 | 146,950,000 | 10.3 | 68.8 | 62.7 | 1.55 | 9.6 | 8.8 | 4.393 | |||||||||
| Medical | 2 | 75,788,984 | 5.3 | 63.4 | 51.4 | 1.51 | 10.6 | 9.2 | 4.542 | |||||||||
| Multifamily | 39 | 287,608,427 | 20.2 | 57.7 | 49.9 | 2.88 | 16.5 | 15.9 | 4.667 | |||||||||
| Garden | 18 | 165,721,892 | 11.6 | 67.0 | 57.3 | 1.62 | 10.3 | 9.6 | 4.708 | |||||||||
| Cooperative | 15 | 59,486,535 | 4.2 | 16.7 | 13.5 | 8.13 | 42.2 | 42.2 | 4.250 | |||||||||
| Low Rise | 5 | 56,368,290 | 4.0 | 72.1 | 65.1 | 1.20 | 8.4 | 7.7 | 4.956 | |||||||||
| Mid Rise | 1 | 6,031,710 | 0.4 | 72.1 | 65.1 | 1.20 | 8.4 | 7.7 | 4.956 | |||||||||
| Hospitality | 19 | 269,365,246 | 18.9 | 61.1 | 51.3 | 2.08 | 13.1 | 11.8 | 4.601 | |||||||||
| Full Service | 4 | 156,849,207 | 11.0 | 58.4 | 51.3 | 2.30 | 13.1 | 11.7 | 4.374 | |||||||||
| Limited Service | 15 | 112,516,039 | 7.9 | 64.8 | 51.2 | 1.77 | 13.2 | 11.8 | 4.919 | |||||||||
| Retail | 19 | 238,711,370 | 16.7 | 66.7 | 60.1 | 1.79 | 10.9 | 10.2 | 4.653 | |||||||||
| Anchored | 5 | 116,025,000 | 8.1 | 72.3 | 65.5 | 1.39 | 9.2 | 8.5 | 4.557 | |||||||||
| Regional Mall | 2 | 69,884,983 | 4.9 | 56.1 | 53.5 | 2.63 | 13.8 | 13.2 | 4.634 | |||||||||
| Single Tenant | 3 | 20,816,194 | 1.5 | 65.4 | 55.2 | 1.60 | 10.9 | 10.2 | 4.934 | |||||||||
| Unanchored | 5 | 18,351,453 | 1.3 | 67.3 | 55.4 | 1.57 | 10.9 | 10.0 | 4.859 | |||||||||
Shadow Anchored(2) | 4 | 13,633,739 | 1.0 | 73.7 | 61.3 | 1.50 | 10.1 | 9.5 | 4.859 | |||||||||
| Industrial | 17 | 95,128,084 | 6.7 | 61.6 | 53.6 | 1.49 | 10.4 | 9.4 | 4.660 | |||||||||
| Warehouse | 7 | 63,150,403 | 4.4 | 62.6 | 54.3 | 1.52 | 10.6 | 9.6 | 4.668 | |||||||||
| Flex | 10 | 31,977,681 | 2.2 | 59.6 | 52.2 | 1.43 | 9.8 | 8.8 | 4.644 | |||||||||
| Manufactured Housing Community | 14 | 73,029,038 | 5.1 | 69.9 | 55.0 | 1.47 | 10.0 | 9.8 | 4.863 | |||||||||
| Manufactured Housing Community | 14 | 73,029,038 | 5.1 | 69.9 | 55.0 | 1.47 | 10.0 | 9.8 | 4.863 | |||||||||
| Self Storage | 19 | 53,474,693 | 3.8 | 62.5 | 53.9 | 1.81 | 11.1 | 10.7 | 4.698 | |||||||||
| Self Storage | 19 | 53,474,693 | 3.8 | 62.5 | 53.9 | 1.81 | 11.1 | 10.7 | 4.698 | |||||||||
| Other | 1 | 11,350,000 | 0.8 | 59.7 | 52.5 | 1.39 | 9.4 | 8.6 | 4.670 | |||||||||
| Total/Weighted Average | 146 | $1,425,796,349 | 100.0% | 63.3% | 55.2% | 1.98x | 12.1% | 11.2% | 4.608% |
| (1) | Because this table presents information relating to the mortgaged properties and not the mortgage loans, (a) the information for mortgage loans secured by more than one mortgaged property (other than through cross-collateralization with other mortgage loans) is based on allocated amounts (allocating the mortgage loan principal balance to each of those properties according to the relative appraised values of the mortgaged properties or the allocated loan amounts or property-specific release prices set forth in the related mortgage loan documents or such other allocation as the related mortgage loan seller deemed appropriate), and (b) the information for each mortgaged property that relates to a mortgage loan that is cross-collateralized with other mortgage loans is based upon the principal balance of that mortgage loan, except that the applicable loan-to-value ratio, debt service coverage ratio or debt yield for each such mortgaged property is based upon the ratio or yield (as applicable) for the aggregate indebtedness evidenced by all loans in the group. On an individual basis, without regard to the cross-collateralization feature, any mortgaged property securing a mortgage loan that is part of a cross-collateralized group of mortgage loans may have a higher loan-to-value ratio, lower debt service coverage ratio and/or lower debt yield than is presented herein. For mortgaged properties securing residential cooperative mortgage loans, the debt service coverage ratio or debt yield for each such mortgaged property is calculated using underwritten net cash flow for the related residential cooperative property, which is the projected net cash flow reflected in the most recent appraisal obtained by or otherwise in the possession of the related mortgage loan seller as of the cut-off date, and the loan-to-value ratio is calculated based upon the appraised value of the residential cooperative property determined as if such residential cooperative property is operated as a residential cooperative. Debt service coverage ratio, debt yield and loan-to-value ratio information takes no account of subordinate debt (whether or not secured by the mortgaged property), if any, that is allowed under the terms of any mortgage loan. With respect to the Queens Atrium, Montgomery Mall, and Oak Court Mall mortgage loans, loan-to-value ratio, debt service coverage ratio and debt yield calculations include the related pari passu companion loan (unless otherwise stated) in total debt. |
| (2) | A mortgaged property is classified as shadow anchored if it is located in close proximity to an anchored retail property. |
THE INFORMATION IN THIS STRUCTURAL AND COLLATERAL TERM SHEET IS NOT COMPLETE AND MAY BE AMENDED PRIOR TO THE TIME OF SALE. THIS TERM SHEET IS NOT AN OFFER TO SELL THESE SECURITIES AND IT IS NOT A SOLICITATION OF AN OFFER TO BUY THESE SECURITIES IN ANY JURISDICTION WHERE THE OFFER OR SALE IS NOT PERMITTED.
12
| WFRBS Commercial Mortgage Trust 2014-C21 | Characteristics of the Mortgage Pool |
G. Geographic Distribution(1)(2)
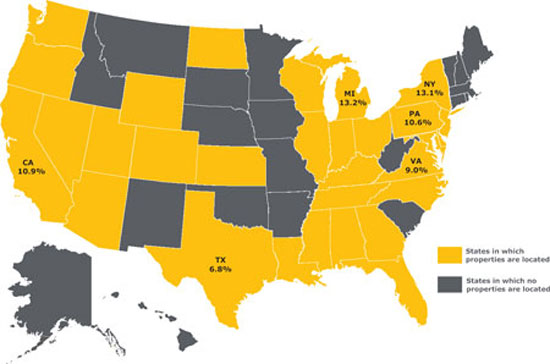
Location(3) | Number of Mortgaged Properties | Aggregate Cut-off Date Balance ($) | % of Cut-off Date Pool Balance | Weighted Average Cut-off Date LTV Ratio (%) | Weighted Average Balloon or ARD LTV Ratio (%) | Weighted Average U/W NCF DSCR (x) | Weighted Average U/W NOI Debt Yield (%) | Weighted Average U/W NCF Debt Yield (%) | Weighted Average Mortgage Rate (%) | |||||||||
| Michigan | 20 | $188,419,038 | 13.2 | % | 69.9 | % | 61.5 | % | 1.45 | x | 10.0 | % | 9.2 | % | 4.778 | % | ||
| New York | 17 | 186,777,497 | 13.1 | 51.8 | 45.3 | 3.39 | 18.9 | 18.2 | 4.303 | |||||||||
| California | 11 | 155,452,107 | 10.9 | 62.7 | 53.0 | 1.69 | 11.5 | 10.6 | 4.688 | |||||||||
| Northern | 7 | 109,980,821 | 7.7 | 61.2 | 50.8 | 1.77 | 12.0 | 11.1 | 4.685 | |||||||||
| Southern | 4 | 45,471,286 | 3.2 | 66.3 | 58.4 | 1.51 | 10.1 | 9.4 | 4.695 | |||||||||
| Pennsylvania | 5 | 151,497,680 | 10.6 | 56.3 | 49.4 | 2.27 | 13.4 | 12.5 | 4.530 | |||||||||
| Virginia | 4 | 127,967,122 | 9.0 | 64.2 | 62.4 | 1.91 | 9.4 | 8.9 | 4.382 | |||||||||
| Texas | 10 | 97,062,868 | 6.8 | 63.8 | 60.0 | 2.58 | 12.8 | 11.6 | 4.219 | |||||||||
Other States(4) | 79 | 518,620,037 | 36.4 | 66.9 | 56.2 | 1.56 | 10.7 | 9.8 | 4.784 | |||||||||
| Total/Weighted Average | 146 | $1,425,796,349 | 100.0 | % | 63.3 | % | 55.2 | % | 1.98 | x | 12.1 | % | 11.2 | % | 4.608 | % | ||
| (1) | The mortgaged properties are located in 30 states and the District of Columbia. |
| (2) | Because this table presents information relating to the mortgaged properties and not the mortgage loans, (a) the information for mortgage loans secured by more than one mortgaged property (other than through cross-collateralization with other mortgage loans) is based on allocated amounts (allocating the mortgage loan principal balance to each of those properties according to the relative appraised values of the mortgaged properties or the allocated loan amounts or property-specific release prices set forth in the related mortgage loan documents or such other allocation as the related mortgage loan seller deemed appropriate), and (b) the information for each mortgaged property that relates to a mortgage loan that is cross-collateralized with other mortgage loans is based upon the principal balance of that mortgage loan, except that the applicable loan-to-value ratio, debt service coverage ratio or debt yield for each such mortgaged property is based upon the ratio or yield (as applicable) for the aggregate indebtedness evidenced by all loans in the group. On an individual basis, without regard to the cross-collateralization feature, any mortgaged property securing a mortgage loan that is part of a cross-collateralized group of mortgage loans may have a higher loan-to-value ratio, lower debt service coverage ratio and/or lower debt yield than is presented herein. For mortgaged properties securing residential cooperative mortgage loans, the debt service coverage ratio or debt yield for each such mortgaged property is calculated using underwritten net cash flow for the related residential cooperative property, which is the projected net cash flow reflected in the most recent appraisal obtained by or otherwise in the possession of the related mortgage loan seller as of the cut-off date, and the loan-to-value ratio is calculated based upon the appraised value of the residential cooperative property determined as if such residential cooperative property is operated as a residential cooperative. Debt service coverage ratio, debt yield and loan-to-value ratio information takes no account of subordinate debt (whether or not secured by the mortgaged property), if any, that is allowed under the terms of any mortgage loan. With respect to the Queens Atrium, Montgomery Mall, and Oak Court Mall mortgage loans, loan-to-value ratio, debt service coverage ratio and debt yield calculations include the related pari passu companion loan (unless otherwise stated) in total debt. |
| (3) | For purposes of determining whether a mortgaged property is in Northern California or Southern California, Northern California includes areas with zip codes above 93600 and Southern California includes areas with zip codes of 93600 and below. |
| (4) | Includes 24 other states and the District of Columbia. |
THE INFORMATION IN THIS STRUCTURAL AND COLLATERAL TERM SHEET IS NOT COMPLETE AND MAY BE AMENDED PRIOR TO THE TIME OF SALE. THIS TERM SHEET IS NOT AN OFFER TO SELL THESE SECURITIES AND IT IS NOT A SOLICITATION OF AN OFFER TO BUY THESE SECURITIES IN ANY JURISDICTION WHERE THE OFFER OR SALE IS NOT PERMITTED.
13
| WFRBS Commercial Mortgage Trust 2014-C21 | Characteristics of the Mortgage Pool |
H. Characteristics of the Mortgage Pool(1)
| CUT-OFF DATE BALANCE | ||||
Range of Cut-off Date Balances ($) | Number of Mortgage Loans | Aggregate Cut- off Date Balance ($) | % of Cut-off Date Pool Balance | |
| 847,754 - 1,000,000 | 2 | $1,820,142 | 0.1% | |
| 1,000,001 - 2,000,000 | 12 | 19,057,436 | 1.3 | |
| 2,000,001 - 3,000,000 | 16 | 41,273,226 | 2.9 | |
| 3,000,001 - 4,000,000 | 15 | 53,231,796 | 3.7 | |
| 4,000,001 - 5,000,000 | 12 | 54,755,863 | 3.8 | |
| 5,000,001 - 6,000,000 | 9 | 49,385,682 | 3.5 | |
| 6,000,001 - 7,000,000 | 7 | 46,998,318 | 3.3 | |
| 7,000,001 - 8,000,000 | 6 | 45,191,956 | 3.2 | |
| 8,000,001 - 9,000,000 | 4 | 33,852,584 | 2.4 | |
| 9,000,001 - 10,000,000 | 2 | 19,957,373 | 1.4 | |
| 10,000,001 - 15,000,000 | 15 | 184,684,873 | 13.0 | |
| 15,000,001 - 20,000,000 | 5 | 87,308,321 | 6.1 | |
| 20,000,001 - 30,000,000 | 5 | 121,384,983 | 8.5 | |
| 30,000,001 - 50,000,000 | 6 | 243,564,034 | 17.1 | |
| 50,000,001 - 70,000,000 | 4 | 243,329,763 | 17.1 | |
| 70,000,001 - 90,000,000 | 2 | 180,000,000 | 12.6 | |
| Total: | 122 | $1,425,796,349 | 100.0% | |
| Average: | $11,686,855 | |||
| UNDERWRITTEN NOI DEBT SERVICE COVERAGE RATIO | ||||
Range of U/W NOI DSCRs (x) | Number of Mortgage Loans | Aggregate Cut- off Date Balance ($) | % of Cut-off Date Pool Balance | |
| 1.31 - 1.40 | 9 | 117,870,085 | 8.3% | |
| 1.41 - 1.50 | 13 | 131,564,161 | 9.2 | |
| 1.51 - 1.60 | 13 | 242,565,581 | 17.0 | |
| 1.61 - 1.70 | 17 | 164,848,695 | 11.6 | |
| 1.71 - 1.80 | 18 | 170,163,124 | 11.9 | |
| 1.81 - 1.90 | 6 | 92,498,712 | 6.5 | |
| 1.91 - 2.00 | 9 | 175,387,364 | 12.3 | |
| 2.01 - 2.25 | 12 | 92,509,954 | 6.5 | |
| 2.26 - 2.50 | 5 | 58,286,569 | 4.1 | |
| 2.51 - 3.00 | 2 | 5,585,570 | 0.4 | |
| 3.01 - 3.50 | 2 | 113,000,000 | 7.9 | |
| 3.51 - 34.06 | 16 | 61,516,535 | 4.3 | |
| Total: | 122 | $1,425,796,349 | 100.0% | |
| Weighted Average: | 2.12x | |||
| UNDERWRITTEN NCF DEBT SERVICE COVERAGE RATIO | ||||
Range of U/W NCF DSCRs (x) | Number of Mortgage Loans | Aggregate Cut- off Date Balance ($) | % of Cut-off Date Pool Balance | |
| 1.20 - 1.20 | 1 | $62,400,000 | 4.4% | |
| 1.21 - 1.30 | 5 | 36,795,764 | 2.6 | |
| 1.31 - 1.40 | 18 | 202,650,371 | 14.2 | |
| 1.41 - 1.50 | 23 | 364,634,895 | 25.6 | |
| 1.51 - 1.60 | 14 | 106,525,349 | 7.5 | |
| 1.61 - 1.70 | 11 | 117,770,127 | 8.3 | |
| 1.71 - 1.80 | 13 | 105,402,856 | 7.4 | |
| 1.81 - 1.90 | 6 | 46,314,990 | 3.2 | |
| 1.91 - 2.00 | 5 | 142,515,803 | 10.0 | |
| 2.01 - 2.25 | 5 | 55,874,090 | 3.9 | |
| 2.26 - 2.50 | 1 | 4,810,000 | 0.3 | |
| 2.51 - 3.50 | 4 | 118,585,570 | 8.3 | |
| 3.51 - 4.00 | 2 | 11,675,279 | 0.8 | |
| 4.01 - 34.06 | 14 | 49,841,256 | 3.5 | |
| Total: | 122 | $1,425,796,349 | 100.0% | |
| Weighted Average: | 1.98x | |||
| LOAN PURPOSE | ||||
| Loan Purpose | Number of Mortgage Loans | Aggregate Cut- off Date Balance ($) | % of Cut-off Date Pool Balance | |
| Refinance | 97 | $1,046,082,157 | 73.4% | |
| Acquisition | 25 | 379,714,193 | 26.6 | |
| Total: | 122 | $1,425,796,349 | 100.0% | |
| MORTGAGE RATE | ||||
Range of Mortgage Rates (%) | Number of Mortgage Loans | Aggregate Cut- off Date Balance ($) | % of Cut-off Date Pool Balance | |
| 3.960 - 4.000 | 1 | $67,000,000 | 4.7% | |
| 4.001 - 4.250 | 17 | 78,654,934 | 5.5 | |
| 4.251 - 4.500 | 18 | 397,376,432 | 27.9 | |
| 4.501 - 4.750 | 31 | 381,466,380 | 26.8 | |
| 4.751 - 5.000 | 33 | 398,486,409 | 27.9 | |
| 5.001 - 5.250 | 14 | 66,995,943 | 4.7 | |
| 5.251 - 5.500 | 5 | 24,234,954 | 1.7 | |
| 5.501 - 5.750 | 3 | 11,581,297 | 0.8 | |
| Total: | 122 | $1,425,796,349 | 100.0% | |
| Weighted Average: | 4.608% | |||
| UNDERWRITTEN NOI DEBT YIELD | ||||
Range of U/W NOI Debt Yields (%) | Number of Mortgage Loans | Aggregate Cut- off Date Balance ($) | % of Cut-off Date Pool Balance | |
| 8.4 - 8.9 | 9 | $262,971,374 | 18.4% | |
| 9.0 - 9.9 | 25 | 327,117,390 | 22.9 | |
| 10.0 - 10.9 | 27 | 315,719,312 | 22.1 | |
| 11.0 - 11.9 | 14 | 110,433,142 | 7.7 | |
| 12.0 - 12.9 | 13 | 133,629,885 | 9.4 | |
| 13.0 - 13.9 | 9 | 108,019,776 | 7.6 | |
| 14.0 - 14.9 | 5 | 92,874,160 | 6.5 | |
| 15.0 - 16.9 | 3 | 11,829,204 | 0.8 | |
| 17.0 - 19.9 | 1 | 1,685,570 | 0.1 | |
| 18.0 - 146.4 | 16 | 61,516,535 | 4.3 | |
| Total: | 122 | $1,425,796,349 | 100.0% | |
| Weighted Average: | 12.1% | |||
| UNDERWRITTEN NCF DEBT YIELD | ||||
Range of U/W NCF Debt Yields (%) | Number of Mortgage Loans | Aggregate Cut- off Date Balance ($) | % of Cut-off Date Pool Balance | |
| 7.7 - 7.9 | 2 | $73,825,000 | 5.2% | |
| 8.0 - 8.9 | 16 | 423,736,795 | 29.7 | |
| 9.0 - 9.9 | 40 | 373,396,066 | 26.2 | |
| 10.0 - 10.9 | 18 | 166,612,702 | 11.7 | |
| 11.0 - 11.9 | 16 | 135,494,336 | 9.5 | |
| 12.0 - 12.9 | 4 | 76,492,630 | 5.4 | |
| 13.0 - 13.9 | 7 | 62,044,487 | 4.4 | |
| 14.0 - 19.9 | 3 | 52,677,798 | 3.7 | |
| 20.0 - 146.4 | 16 | 61,516,535 | 4.3 | |
| Total: | 122 | $1,425,796,349 | 100.0% | |
| Weighted Average: | 11.2% | |||
| (1) | Information regarding mortgage loans that are cross-collateralized with other mortgage loans is based upon the individual loan balances, except that the applicable loan-to value ratio, debt service coverage ratio or debt yield for each such mortgage loan is based upon the ratio or yield (as applicable) for the aggregate indebtedness evidenced by all loans in the group. On an individual basis, without regard to the cross-collateralization feature, any mortgage loan that is part of a cross-collateralized group of mortgage loans may have a higher loan-to-value ratio, lower debt service coverage ratio and/or lower debt yield than is presented herein. Debt service coverage ratio, debt yield and loan-to-value ratio information takes no account of subordinate debt (whether or not secured by the mortgaged property), if any, that is allowed under the terms of any mortgage loan. With respect to the Queens Atrium, Montgomery Mall, and Oak Court Mall mortgage loans, loan-to-value ratio, debt service coverage ratio and debt yield calculations include the related pari passu companion loan (unless otherwise stated) in total debt. For mortgaged properties securing residential cooperative mortgage loans, the debt service coverage ratio or debt yield for each such mortgaged property is calculated using underwritten net cash flow for the related residential cooperative property, which is the projected net cash flow reflected in the most recent appraisal obtained by or otherwise in the possession of the related mortgage loan seller as of the cut-off date, and the loan-to-value ratio is calculated based upon the appraised value of the residential cooperative property determined as if such residential cooperative property is operated as a residential cooperative. |
THE INFORMATION IN THIS STRUCTURAL AND COLLATERAL TERM SHEET IS NOT COMPLETE AND MAY BE AMENDED PRIOR TO THE TIME OF SALE. THIS TERM SHEET IS NOT AN OFFER TO SELL THESE SECURITIES AND IT IS NOT A SOLICITATION OF AN OFFER TO BUY THESE SECURITIES IN ANY JURISDICTION WHERE THE OFFER OR SALE IS NOT PERMITTED.
14
| WFRBS Commercial Mortgage Trust 2014-C21 | Characteristics of the Mortgage Pool |
| ORIGINAL TERM TO MATURITY OR ARD | |||||
Range of Original Terms to Maturity or ARD (months) | Number of Mortgage Loans | Aggregate Cut- off Date Balance ($) | % of Cut-off Date Pool Balance | ||
| 60 | 7 | $108,882,493 | 7.6% | ||
| 84 | 7 | 54,069,693 | 3.8 | ||
| 120 | 108 | 1,262,844,163 | 88.6 | ||
| Total: | 122 | $1,425,796,349 | 100.0% | ||
| Weighted Average: | 114 months | ||||
REMAINING TERM TO MATURITY OR ARD | |||||
Range of Remaining Terms to Maturity or ARD (months) | Number of Mortgage Loans | Aggregate Cut- off Date Balance ($) | % of Cut-off Date Pool Balance | ||
| 58 - 60 | 7 | $108,882,493 | 7.6% | ||
| 61 - 84 | 7 | 54,069,693 | 3.8 | ||
| 85 - 120 | 108 | 1,262,844,163 | 88.6 | ||
| Total: | 122 | $1,425,796,349 | 100.0% | ||
| Weighted Average: | 113 months | ||||
ORIGINAL AMORTIZATION TERM(2) | |||||
Range of Original Amortization Terms (months) | Number of Mortgage Loans | Aggregate Cut- off Date Balance ($) | % of Cut-off Date Pool Balance | ||
| Non-Amortizing | 10 | $264,340,000 | 18.5% | ||
| 168 - 180 | 1 | 5,928,302 | 0.4 | ||
| 181 - 240 | 1 | 8,462,421 | 0.6 | ||
| 241 - 300 | 16 | 134,074,029 | 9.4 | ||
| 301 - 360 | 92 | 1,008,248,691 | 70.7 | ||
| 361 - 480 | 2 | 4,742,906 | 0.3 | ||
| Total: | 122 | $1,425,796,349 | 100.0% | ||
Weighted Average(3): | 351 months | ||||
(2) The original amortization term shown for any mortgage loan that is interest-only for part of its term does not include the number of months in its interest-only period and reflects only the number of months as of the commencement of amortization remaining from the end of such interest-only period. | |||||
(3) Excludes the non-amortizing loans. | |||||
REMAINING AMORTIZATION TERM(4) | |||||
Range of Remaining Amortization Terms (months) | Number of Mortgage Loans | Aggregate Cut- off Date Balance ($) | % of Cut-off Date Pool Balance | ||
| Non-Amortizing | 10 | $264,340,000 | 18.5% | ||
| 165 -180 | 1 | 5,928,302 | 0.4 | ||
| 181 - 240 | 1 | 8,462,421 | 0.6 | ||
| 241 - 300 | 16 | 134,074,029 | 9.4 | ||
| 301 - 360 | 92 | 1,008,248,691 | 70.7 | ||
| 361 - 478 | 2 | 4,742,906 | 0.3 | ||
| Total: | 122 | $1,425,796,349 | 100.0% | ||
Weighted Average(5): | 351 months | ||||
(4) The remaining amortization term shown for any mortgage loan that is interest-only for part of its term does not include the number of months in its interest-only period and reflects only the number of months as of the commencement of amortization remaining from the end of such interest-only period. (5) Excludes the non-amortizing loans. | |||||
| LOCKBOXES | |||||
| Type of Lockbox | Number of Mortgage Loans | Aggregate Cut- off Date Balance ($) | % of Cut-off Date Pool Balance | ||
| Hard/Springing Cash Management | 20 | $498,165,867 | 34.9% | ||
| Springing (Without Estab Account) | 59 | 449,151,250 | 31.5 | ||
| Soft/Springing Cash Management | 7 | 174,626,950 | 12.2 | ||
| None | 32 | 143,270,184 | 10.0 | ||
| Hard/Upfront Cash Management | 2 | 122,000,000 | 8.6 | ||
| Soft/Upfront Cash Management | 1 | 36,184,577 | 2.5 | ||
| Springing (With Estab Account) | 1 | 2,397,521 | 0.2 | ||
| Total: | 122 | $1,425,796,349 | 100.0% | ||
| PREPAYMENT PROVISION SUMMARY | |||||
| Prepayment Provision | Number of Mortgage Loans | Aggregate Cut- off Date Balance ($) | % of Cut-off Date Pool Balance | ||
| Lockout/Defeasance/Open | 94 | $1,230,282,807 | 86.3% | ||
| Lockout/YM%/Open | 11 | 77,147,550 | 5.4 | ||
| YM%/%/Open | 15 | 59,486,535 | 4.2 | ||
| YM%/Open | 1 | 46,879,457 | 3.3 | ||
| Lockout/YM% or Defease/Open | 1 | 12,000,000 | 0.8 | ||
| Total: | 122 | $1,425,796,349 | 100.0% | ||
| CUT-OFF DATE LOAN-TO-VALUE RATIO | |||||
Range of Cut-off Date LTV Ratios (%) | Number of Mortgage Loans | Aggregate Cut- off Date Balance ($) | % of Cut-off Date Pool Balance | ||
| 1.3 - 30.0 | 15 | $53,427,031 | 3.7% | ||
| 30.1 - 45.0 | 1 | 8,089,504 | 0.6 | ||
| 45.1 - 50.0 | 1 | 9,987,623 | 0.7 | ||
| 50.1 - 55.0 | 11 | 150,170,412 | 10.5 | ||
| 55.1 - 60.0 | 13 | 196,654,661 | 13.8 | ||
| 60.1 - 65.0 | 20 | 235,449,556 | 16.5 | ||
| 65.1 - 70.0 | 27 | 389,291,430 | 27.3 | ||
| 70.1 - 75.0 | 34 | 382,726,131 | 26.8 | ||
| Total: | 122 | $1,425,796,349 | 100.0% | ||
| Weighted Average: | 63.3% | ||||
| BALLOON OR ARD LOAN-TO-VALUE RATIO | |||||
| Range of Balloon or ARD LTV Ratios (%) | Number of Mortgage Loans | Aggregate Cut- off Date Balance ($) | % of Cut-off Date Pool Balance | ||
| 1.3 - 35.0 | 17 | $67,444,837 | 4.7% | ||
| 35.1 - 40.0 | 3 | 14,757,372 | 1.0 | ||
| 40.1 - 45.0 | 13 | 159,028,980 | 11.2 | ||
| 45.1 - 50.0 | 10 | 78,675,457 | 5.5 | ||
| 50.1 - 55.0 | 17 | 265,363,829 | 18.6 | ||
| 55.1 - 60.0 | 28 | 196,829,335 | 13.8 | ||
| 60.1 - 65.0 | 24 | 371,954,277 | 26.1 | ||
| 65.1 - 68.1 | 10 | 271,742,262 | 19.1 | ||
| Total: | 122 | $1,425,796,349 | 100.0% | ||
| Weighted Average: | 55.2% | ||||
| AMORTIZATION TYPE | |||||
| Type of Amortization | Number of Mortgage Loans | Aggregate Cut- off Date Balance ($) | % of Cut-off Date Pool Balance | ||
| Amortizing Balloon | 83 | $633,913,413 | 44.5% | ||
| Interest-only, Amortizing Balloon | 26 | 493,592,500 | 34.6 | ||
| Interest-only, Balloon | 10 | 264,340,000 | 18.5 | ||
| Amortizing, ARD | 2 | 19,450,436 | 1.4 | ||
| Interest-only, Amortizing ARD | 1 | 14,500,000 | 1.0 | ||
| Total: | 122 | $1,425,796,349 | 100.0% | ||
ORIGINAL TERM OF INTEREST-ONLY PERIOD FOR PARTIAL IO LOANS | |||||
| IO Term (months) | Number of Mortgage Loans | Aggregate Cut- off Date Balance ($) | % of Cut-off Date Pool Balance | ||
| 1 - 12 | 4 | $33,030,000 | 2.3% | ||
| 13 - 24 | 7 | 73,500,000 | 5.2 | ||
| 25 - 36 | 9 | 121,412,500 | 8.5 | ||
| 37 - 48 | 1 | 62,400,000 | 4.4 | ||
| 49 - 60 | 6 | 217,750,000 | 15.3 | ||
| Total: | 27 | $508,092,500 | 35.6% | ||
| Weighted Average: | 44 months | ||||
SEASONING | |||||
| Seasoning (months) | Number of Mortgage Loans | Aggregate Cut- off Date Balance ($) | % of Cut-off Date Pool Balance | ||
| 0 | 7 | $119,687,500 | 8.4% | ||
| 1 - 3 | 112 | 1,261,697,859 | 88.5 | ||
| 4 - 6 | 2 | 35,830,060 | 2.5 | ||
| 7 - 9 | 1 | 8,580,931 | 0.6 | ||
| Total: | 122 | $1,425,796,349 | 100.0% | ||
| Weighted Average: | 1 month | ||||
THE INFORMATION IN THIS STRUCTURAL AND COLLATERAL TERM SHEET IS NOT COMPLETE AND MAY BE AMENDED PRIOR TO THE TIME OF SALE. THIS TERM SHEET IS NOT AN OFFER TO SELL THESE SECURITIES AND IT IS NOT A SOLICITATION OF AN OFFER TO BUY THESE SECURITIES IN ANY JURISDICTION WHERE THE OFFER OR SALE IS NOT PERMITTED.
15
| WFRBS Commercial Mortgage Trust 2014-C21 | Certain Terms and Conditions |
V. Certain Terms and Conditions
| Interest Entitlements: | The interest entitlement of each Class of Offered Certificates on each Distribution Date generally will be the interest accrued during the related Interest Accrual Period on the related Certificate Principal Balance or Notional Amount at the related pass-through rate, net of any prepayment interest shortfalls allocated to that Class for such Distribution Date as described below. If prepayment interest shortfalls arise from voluntary prepayments (without Special Servicer consent) on particular non-specially serviced mortgage loans during any collection period, the applicable Master Servicer is required to make a compensating interest payment to offset those shortfalls, generally up to an amount equal to the portion of its master servicing fees that accrue at one basis point per annum. The remaining amount of prepayment interest shortfalls will be allocated to reduce the interest entitlement on all Classes of Certificates (other than the Class X-A, Class X-B, X-C, and X-D Certificates), pro rata, based on their respective amounts of accrued interest for the related Distribution Date (except with respect to the allocation among the Class A-S, Class B, Class C and Class PEX Certificates as described below under “Allocations and Distributions on the Class A-S, B, C and PEX Certificates”). If a Class receives less than the entirety of its interest entitlement on any Distribution Date, then the shortfall, excluding any shortfall due to prepayment interest shortfalls, will be added to its interest entitlement for the next succeeding Distribution Date. Interest entitlements on the Class D Certificates, the Class C regular interest and the Class B regular interest, in that order, may be reduced by certain Trust Advisor expenses (subject to the discussion below under “Allocations and Distributions on the Class A-S, B, C and PEX Certificates”). | |
| Principal Distribution Amount: | The Principal Distribution Amount for each Distribution Date generally will be the aggregate amount of principal received or advanced in respect of the mortgage loans, net of any non-recoverable advances and interest thereon that are reimbursed to the applicable Master Servicer, the applicable Special Servicer or the Trustee during the related collection period. Non-recoverable advances and interest thereon are reimbursable from principal collections and advances before reimbursement from other amounts. The Principal Distribution Amount may also be reduced, with a corresponding loss, to the Class D Certificates and the Class C, B and A-S regular interests, then to the Class A-1, A-2, A-3, A-4, A-5 and A-SB Certificates (with any losses on the Class A-1, A-2, A-3, A-4, A-5 and A-SB Certificates allocated pro rata according to their respective Certificate Principal Balances immediately prior to that Distribution Date), in that order, in connection with certain Trust Advisor expenses to the extent that interest entitlements on the Class B and C regular interests and the Class D Certificates are insufficient to absorb the effect of the expense on any particular Distribution Date. For a discussion on the allocation of amounts distributable in respect of the Class A-S, B and C regular interests, see “Allocations and Distributions on the Class A-S, B, C and PEX Certificates” below. | |
| Distributions: | On each Distribution Date, funds available for distribution from the mortgage loans, net of specified trust fees, expenses and reimbursements will generally be distributed in the following amounts and order of priority (in each case to the extent of remaining available funds): | |
1. Class A-1, A-2, A-3, A-4, A-5, A-SB, X-A, X-B, X-C, and X-D Certificates: To interest on the Class A-1, A-2, A-3, A-4, A-5, A-SB, X-A, X-B, X-C, and X-D Certificates, pro rata, according to their respective interest entitlements. | ||
| 2. Class A-1, A-2, A-3, A-4, A-5 and A-SB Certificates: To principal on the Class A-1, A-2, A-3, A-4, A-5 and A-SB Certificates in the following amounts and order of priority: (i) first, to principal on the Class A-SB Certificates, in an amount up to the Principal Distribution Amount for such Distribution Date until their Certificate Principal Balance is reduced to the Class A-SB Planned Principal Balance for such Distribution Date; (ii) second, to principal on the Class A-1 Certificates until their Certificate Principal Balance is reduced to zero, up to the remainder of the Principal Distribution Amount for such Distribution Date; (iii) third, to principal on the Class A-2 Certificates until their Certificate Principal Balance is reduced to zero, up to the remainder of the Principal Distribution Amount for such Distribution Date; (iv) fourth, to principal on the Class A-3 Certificates until their Certificate Principal Balance is reduced to zero, up to the remainder of the Principal Distribution Amount for such Distribution Date; (v) fifth, to principal on the Class A-4 Certificates until their Certificate Principal Balance is reduced to zero, up to the remainder of the Principal Distribution Amount for such Distribution Date; (vi) sixth, to principal on the Class A-5 Certificates until their Certificate Principal Balance is reduced to zero, up to the remainder of the Principal Distribution Amount for such Distribution Date; and (vii) seventh, to principal on the Class A-SB Certificates until their Certificate Principal Balance is reduced to zero, up to the remainder of the Principal Distribution Amount for such Distribution Date. However, if the Certificate Principal Balance of each and every Class of Principal Balance Certificates, other than the Class A-1, A-2, A-3, A-4, A-5 and A-SB |
THE INFORMATION IN THIS STRUCTURAL AND COLLATERAL TERM SHEET IS NOT COMPLETE AND MAY BE AMENDED PRIOR TO THE TIME OF SALE. THIS TERM SHEET IS NOT AN OFFER TO SELL THESE SECURITIES AND IT IS NOT A SOLICITATION OF AN OFFER TO BUY THESE SECURITIES IN ANY JURISDICTION WHERE THE OFFER OR SALE IS NOT PERMITTED.
16
| WFRBS Commercial Mortgage Trust 2014-C21 | Certain Terms and Conditions |
Certificates, has been reduced to zero as a result of the allocation of Mortgage Loan losses and expenses and any of the Class A-1, A-2, A-3, A-4, A-5 and A-SB Certificates remains outstanding, then the Principal Distribution Amount will be distributed on the Class A-1, A-2, A-3, A-4, A-5 and A-SB Certificates, pro rata, based on their respective outstanding Certificate Principal Balances, until their Certificate Principal Balances have been reduced to zero. | ||
3. Class A-1, A-2, A-3, A-4, A-5 and A-SB Certificates: To reimburse the holders of the Class A-1, A-2, A-3, A-4, A-5 and A-SB Certificates, pro rata, for any previously unreimbursed losses (other than certain Trust Advisor expenses) on the mortgage loans that were previously allocated in reduction of the Certificate Principal Balances of such Classes. | ||
4. Class A-S regular interest: To make distributions on the Class A-S regular interest as follows: (a) first, to interest on Class A-S regular interest in the amount of the interest entitlement for that Class; (b) next, to the extent of the portion of the Principal Distribution Amount remaining after distributions in respect of principal to each Class with a higher distribution priority (in this case, the Class A-1, A-2, A-3, A-4, A-5 and A-SB Certificates), to principal on the Class A-S regular interest until its principal balance is reduced to zero; and (c) next, to reimburse the holders of the Class A-S regular interest for any previously unreimbursed losses (other than certain Trust Advisor expenses) on the mortgage loans that were previously allocated to that Class in reduction of its principal balance. 5. Class B regular interest: To make distributions on the Class B regular interest as follows: (a) first, to interest on Class B regular interest in the amount of the interest entitlement for that Class; (b) next, to the extent of the portion of the Principal Distribution Amount remaining after distributions in respect of principal to each Class with a higher distribution priority (in this case, the Class A-1, A-2, A-3, A-4, A-5 and A-SB Certificates and the Class A-S regular interest), to principal on the Class B regular interest until its principal balance is reduced to zero; and (c) next, to reimburse the holders of the Class B regular interest for any previously unreimbursed losses (other than certain Trust Advisor expenses) on the mortgage loans that were previously allocated to that Class in reduction of its principal balance. 6. Class C regular interest: To make distributions on the Class C regular interest as follows: (a) first, to interest on Class C regular interest in the amount of the interest entitlement for that Class; (b) next, to the extent of the portion of the Principal Distribution Amount remaining after distributions in respect of principal to each Class with a higher distribution priority (in this case, the Class A-1, A-2, A-3, A-4, A-5 and A-SB Certificates and the Class A-S and B regular interests), to principal on the Class C regular interest until its principal balance is reduced to zero; and (c) next, to reimburse the holders of the Class C regular interest for any previously unreimbursed losses (other than certain Trust Advisor expenses) on the mortgage loans that were previously allocated to that Class in reduction of its principal balance. | ||
| 7. After the Class A-1, A-2, A-3, A-4, A-5 and A-SB Certificates and Class A-S, B and C regular interests are paid all amounts to which they are entitled, the remaining funds available for distribution will be used to pay interest, principal and loss reimbursement amounts (other than certain Trust Advisor expenses) on the Class D, E, F and G Certificates sequentially in that order in a manner analogous to the Class C regular interest. |
THE INFORMATION IN THIS STRUCTURAL AND COLLATERAL TERM SHEET IS NOT COMPLETE AND MAY BE AMENDED PRIOR TO THE TIME OF SALE. THIS TERM SHEET IS NOT AN OFFER TO SELL THESE SECURITIES AND IT IS NOT A SOLICITATION OF AN OFFER TO BUY THESE SECURITIES IN ANY JURISDICTION WHERE THE OFFER OR SALE IS NOT PERMITTED.
17
| WFRBS Commercial Mortgage Trust 2014-C21 | Certain Terms and Conditions |
| Allocations and Distributions on the Class A-S, B, C and PEX Certificates: | On the closing date, the upper-tier REMIC of the issuing entity will issue the Class A-S, Class B and Class C regular interests (each a “regular interest”) which will have outstanding principal balances on the closing date of $92,677,000, $98,023,000 and $53,468,000, respectively. The regular interests will be held in a grantor trust for the benefit of the holders of the Class A-S, B, C and PEX Certificates. The Class A-S, B, C and PEX Certificates will, at all times, represent undivided beneficial ownership interests in a grantor trust that will hold those regular interests. Each class of the Class A-S, B, C and PEX Certificates will, at all times, represent an undivided beneficial ownership interest in a percentage of the outstanding principal balance of the regular interest with the same alphabetical class designation. The Class PEX Certificates will, at all times, represent an undivided beneficial ownership interest in the remaining percentages of the outstanding principal balances of the Class A-S, B and C regular interests and which percentage interests are referred to in this Term Sheet as the “Class PEX Component A-S”, “Class PEX Component B”, and “Class PEX Component C” (collectively, the “Class PEX Components”). Interest, principal, prepayment premiums, yield maintenance charges and voting rights that are allocated to the Class A-S, B or C regular interest will be distributed or allocated, as applicable, as between the Class A-S, B or C Certificates, as applicable, on the one hand, and Class PEX Component A-S, Class PEX Component B or Class PEX Component C, as applicable (and correspondingly, the Class PEX Certificates), on the other hand, pro rata, based on their respective percentage interests in the Class A-S, Class B or Class C regular interest, as applicable. In addition, any losses (including, without limitation, as a result of Trust Advisor expenses) that are allocated to the Class A-S, Class B or Class C regular interest will correspondingly be allocated as between the Class A-S, B or C Certificates, as applicable, on the one hand, and Class PEX Component A-S, Class PEX Component B or Class PEX Component C, as applicable (and correspondingly, the Class PEX Certificates), on the other hand, pro rata, based on their respective percentage interests in the Class A-S, Class B or Class C regular interest, as applicable. For a complete description of the allocations and distributions with respect to the Class A-S regular interest, the Class B regular interest and the Class C regular interest (and correspondingly the Class A-S, B, C and PEX Certificates and the Class PEX Component A-S, Class PEX Component B and Class PEX Component C), see “Description of the Offered Certificates” in the Free Writing Prospectus. See “Material Federal Income Tax Consequences” in the Free Writing Prospectus for a discussion of the tax treatment of the Exchangeable Certificates. | |
Exchanging Certificates through Combination and Recombination: | If you own Class A-S, B and C Certificates, you will be able to exchange them for a proportionate interest in the Class PEX Certificates, and vice versa, as described in the Free Writing Prospectus. You can exchange your Exchangeable Certificates by notifying the Certificate Administrator. If Exchangeable Certificates are outstanding and held by certificateholders, those certificates will receive principal and interest that would otherwise have been payable on the same proportion of certificates exchanged therefor if those certificates were outstanding and held by certificateholders. Any such allocations of principal and interest between classes of Exchangeable Certificates will have no effect on the principal or interest entitlements of any other class of certificates. The Free Writing Prospectus describes the available combinations of Exchangeable Certificates eligible for exchange. | |
| Allocation of Yield Maintenance and Prepayment Premiums: | If any yield maintenance charges and prepayment premiums are collected during any particular collection period with respect to any mortgage loan, then on the distribution date corresponding to that collection period, the certificate administrator will pay a portion of the yield maintenance charges and prepayment premiums (net of liquidation fees payable therefrom) in the following manner: (1) pro rata, between (x) the group (the “YM Group A”) of the Class A-1, A-2, A-3, A-4, A-5, A-SB and X-A Certificates and the Class A-S regular interest and (y) the group (the “YM Group B” and, collectively with the YM Group A, the “YM Groups”) of Class B and C regular interests and the Class D and X-B Certificates, based upon the aggregate amount of principal distributed to the applicable classes of principal balance certificates (other than the Class A-S, B, C and PEX Certificates) and the Class A-S, B and C regular interests, as applicable, in each YM Group for that distribution date, and (2) among the classes of certificates and regular interest(s) in each YM Group, in the following manner, up to an amount equal to the product of (a) the yield maintenance or prepayment premium allocated to such YM Group, (b) the related Base Interest Fraction (as defined in the Free Writing Prospectus), and (c) a fraction, which in no event may be greater than 1.0, the numerator of which is equal to the amount of principal distributed to the holder(s) of such class or regular interest for that distribution date, and the denominator of which is the aggregate amount of principal distributed to all the certificates and the regular interests in that YM Group for that distribution date. Any yield maintenance charges or prepayment premium allocated to such YM Group remaining after such distributions to Principal Balance Certificates or regular interest(s) described above will be distributed to the Class X-A or Class X-B Certificates as applicable, in such YM Group. |
THE INFORMATION IN THIS STRUCTURAL AND COLLATERAL TERM SHEET IS NOT COMPLETE AND MAY BE AMENDED PRIOR TO THE TIME OF SALE. THIS TERM SHEET IS NOT AN OFFER TO SELL THESE SECURITIES AND IT IS NOT A SOLICITATION OF AN OFFER TO BUY THESE SECURITIES IN ANY JURISDICTION WHERE THE OFFER OR SALE IS NOT PERMITTED.
18
| WFRBS Commercial Mortgage Trust 2014-C21 | Certain Terms and Conditions |
| No prepayment premiums or yield maintenance charges will be distributed to the holders of the Class X-C, X-D, E, F, G, V or R Certificates. The holders of the Class X-B Certificates will be entitled to all prepayment premiums and yield maintenance charges collected after the Class A-1, A-2, A-3, A-4, A-5, X-A, A-SB, and D Certificates and the Class A-S, B and C regular interests (and, therefore, the Class A-S, B, C and PEX Certificates) are retired. For a description of when prepayment premiums and yield maintenance charges are generally required on the mortgage loans, see Annex A-1 to the Free Writing Prospectus. See also “Risk Factors—Prepayments and Repurchases of the Mortgage Assets Will Affect the Timing of Your Cash Flow and May Affect Your Yield” in the prospectus attached to the Free Writing Prospectus. Prepayment premiums and yield maintenance charges will be distributed on each Distribution Date only to the extent they are actually received on the mortgage loans as of the related Determination Date. | ||
| Realized Losses: | The Certificate Principal Balances of the Class A-1, A-2, A-3, A-4, A-5, A-SB, D, E, F and G Certificates and the Class A-S, B and C regular interests will be reduced without distribution on any Distribution Date as a write-off to the extent of any losses realized on the mortgage loans allocated to such Class or regular interest on such Distribution Date. Such losses (other than certain Trust Advisor expenses) will be applied in the following order, in each case until the related Certificate Principal Balance is reduced to zero: first, to Class G; second, to Class F; third, to Class E; fourth, to Class D; fifth, to Class C regular interest; sixth, to Class B regular interest; seventh, to Class A-S regular interest; and, finally, pro rata, to Classes A-1, A-2, A-3, A-4, A-5 and A-SB based on their outstanding Certificate Principal Balances. Certain Trust Advisor expenses (if not absorbed by reductions of interest entitlements on Class D Certificates and the Class C and B regular interests) will be applied as write-offs in a similar manner, except that such write-offs will be applied only to the Class D Certificates, the Class C, B and A-S regular interests, and the Class A-1, A-2, A-3, A-4, A-5 and A-SB Certificates (with any write-offs on the Class A-1, A-2, A-3, A-4, A-5 and A-SB Certificates to be allocated pro rata according to their respective Certificate Principal Balances immediately prior to that Distribution Date), in that order. Any realized losses allocated to the Class A-S, B and C regular interests will, in turn, be allocated to the Class A-S, B, C and PEX Certificates as described above in “Allocations and Distributions on the Class A-S, B, C and PEX Certificates”. The notional amount of the Class X-A Certificates will be reduced by the amount of all losses that are allocated to the Class A-1, A-2, A-3, A-4, A-5 or A-SB Certificates or the Class A-S regular interest as write-offs in reduction of their Certificate Principal Balances. The notional amount of the Class X-B Certificates will be reduced by the amount of all losses that are allocated to the Class D Certificates or the Class B and C regular interest as write-offs in reduction of their Certificate Principal Balances. The notional amount of the Class X-C Certificates will be reduced by the amount of all losses that are allocated to the Class E Certificates as write-offs in reduction of their Certificate Principal Balance. The notional amount of the Class X-D Certificates will be reduced by the amount of all losses that are allocated to the Class F and G Certificates as write-offs in reduction of their Certificate Principal Balances. | |
| Debt Service Advances: | The related Master Servicer or, if such Master Servicer fails to do so, the Trustee, will be obligated to advance delinquent debt service payments (other than balloon payments and default interest) and assumed debt service payments on the mortgage loans (including each pari passu mortgage loan but not its related pari passu companion loan), except to the extent any such advance is deemed non-recoverable from collections on the related mortgage loan. In addition, if an Appraisal Reduction Amount exists for a given mortgage loan, the interest portion of any debt service advance for such mortgage loan will be reduced, which will have the effect of reducing the amount of interest available for distribution to the Certificates in reverse alphabetical order of their Class designations (except that interest payments on the Class A-1, A-2, A-3, A-4, A-5, A-SB, X-A, X-B, X-C, and X-D Certificates would be affected on a pari passu basis). | |
| Servicing Advances: | Each Master Servicer or, if either Master Servicer fails to do so, the Trustee, will be obligated to make servicing advances with respect to each mortgage loan it services, including the payment of delinquent property taxes, insurance premiums and ground rent, except to the extent that those advances are deemed non-recoverable from collections on the related mortgage loan. The applicable master servicer under the WFCM 2014-LC16 securitization will have the primary obligation to make any servicing advances with respect to the Montgomery Mall loan combination. After any securitization of the Queens Atrium controlling pari passu companion loan, the master servicer under that securitization will have the primary obligation to make any servicing advances with respect to the related loan combination. | |
| Appraisal Reduction Amounts: | An Appraisal Reduction Amount generally will be created in the amount, if any, by which the principal balance of a required appraisal loan (which is a mortgage loan with respect to which certain defaults, modifications or insolvency events have occurred as further described in the Free Writing Prospectus) plus other amounts overdue or advanced in connection with such mortgage loan exceeds 90% of the appraised value of the related mortgaged property plus certain escrows and reserves (including letters of credit) held with respect to the mortgage loan. |
THE INFORMATION IN THIS STRUCTURAL AND COLLATERAL TERM SHEET IS NOT COMPLETE AND MAY BE AMENDED PRIOR TO THE TIME OF SALE. THIS TERM SHEET IS NOT AN OFFER TO SELL THESE SECURITIES AND IT IS NOT A SOLICITATION OF AN OFFER TO BUY THESE SECURITIES IN ANY JURISDICTION WHERE THE OFFER OR SALE IS NOT PERMITTED.
19
| WFRBS Commercial Mortgage Trust 2014-C21 | Certain Terms and Conditions |
| A mortgage loan will cease to be a required appraisal loan when the same has ceased to be a specially serviced mortgage loan (if applicable), has been brought current for at least three consecutive months and no other circumstances exist that would cause such mortgage loan to be a required appraisal loan. | ||
| Appraisal Reduction Amounts will affect the amount of debt service advances on the related mortgage loan. Appraisal Reduction Amounts will also be taken into account in the determination of the identity of the Class whose majority constitutes the “majority subordinate certificateholder” and is entitled to appoint the subordinate class representative. | ||
| Clean-Up Call and Exchange Termination: | On each Distribution Date occurring after the aggregate unpaid principal balance of the mortgage loans is reduced below 1% of the initial aggregate principal balance of the mortgage loans as of the Cut-off Date, certain specified persons will have the option to purchase all of the remaining mortgage loans (and the trust’s interest in all property acquired through exercise of remedies in respect of any mortgage loan) at the price specified in the Free Writing Prospectus. Exercise of the option will terminate the trust and retire the then-outstanding certificates. | |
| If the aggregate Certificate Principal Balances of each of the Class A-1, A-2, A-3, A-4, A-5, A-SB and D Certificates and the Class A-S, B and C regular interests have been reduced to zero, the trust may also be terminated in connection with an exchange of all the then-outstanding certificates, for the mortgage loans and REO properties then remaining in the issuing entity, but all of the holders of those Classes of outstanding certificates would have to voluntarily participate in the exchange. | ||
| Liquidated Loan Waterfall: | Following the liquidation of any loan or property, the net liquidation proceeds generally will be applied (after reimbursement of advances and certain trust fund expenses), first, as a recovery of accrued interest, other than delinquent interest that was not advanced as a result of Appraisal Reduction Amounts, second, as a recovery of principal until all principal has been recovered, and then as a recovery of delinquent interest that was not advanced as a result of Appraisal Reduction Amounts. Please see “Description of the Offered Certificates—Distributions—Application of Mortgage Loan Collections” in the Free Writing Prospectus. | |
| Majority Subordinate Certificateholder and Subordinate Class Representative: | A subordinate class representative may be appointed by the “majority subordinate certificate-holder”, which will be the holder(s) of a majority of: (a) during a “subordinate control period”, the most subordinate class between the Class E, F and G Certificates that has a Certificate Principal Balance, as notionally reduced by any Appraisal Reduction Amounts allocable to that class, that is at least equal to 25% of its total initial principal balance and (b) during a “collective consultation period”, the most subordinate class between the Class E, F and G Certificates that has a total principal balance, without regard to Appraisal Reduction Amounts, that is at least equal to 25% of its initial Certificate Principal Balance. The majority subordinate certificateholder will have a continuing right to appoint, remove or replace the subordinate class representative in its sole discretion. This right may be exercised at any time and from time to time. See “Servicing of the Mortgage Loans and Administration of the Trust Fund—The Majority Subordinate Certificateholder and the Subordinate Class Representative” in the Free Writing Prospectus. | |
| Control and Consultation: | The rights of various parties to replace either or both of the Special Servicers and approve or consult with respect to major actions of the Special Servicers will vary according to defined periods. A “subordinate control period” will exist as long as the Class E Certificates have a Certificate Principal Balance, net of any Appraisal Reduction Amounts allocable to that class, that is not less than 25% of the initial principal balance of that class (unless a senior consultation period is deemed to occur generally or with respect to a particular mortgage loan, pursuant to clause (ii) of the definition of “senior consultation period”). In general, during a subordinate control period (other than with respect to the Queens Atrium or Montgomery Mall loan combinations), (i) the subordinate class representative will be entitled to grant or withhold approval of asset status reports prepared, and material servicing actions proposed, by the applicable Special Servicer, and (ii) the majority subordinate certificateholder, or the subordinate class representative on its behalf, will be entitled to terminate and replace either or both of the Special Servicers with or without cause, and appoint itself or another person as the applicable successor special servicer (other than with respect to the Queens Atrium and Montgomery Mall loan combinations). It will be a condition to such appointment that DBRS, Moody’s, and Morningstar confirm that the appointment would not result in a qualification, downgrade or withdrawal of any of their then-current ratings of certificates. A “collective consultation period” will exist as long as the Class E Certificates have a Certificate Principal Balance that both (i) as notionally reduced by any Appraisal Reduction Amounts allocable to that class, is less than 25% of its initial principal balance and (ii) without regard to any Appraisal Reduction Amounts allocable to that class, is 25% or more of its initial Certificate Principal Balance (unless a senior consultation period is deemed to occur generally or with respect to a particular mortgage loan, pursuant to clause (ii) of the definition of “senior consultation period”). In general, during a collective |
THE INFORMATION IN THIS STRUCTURAL AND COLLATERAL TERM SHEET IS NOT COMPLETE AND MAY BE AMENDED PRIOR TO THE TIME OF SALE. THIS TERM SHEET IS NOT AN OFFER TO SELL THESE SECURITIES AND IT IS NOT A SOLICITATION OF AN OFFER TO BUY THESE SECURITIES IN ANY JURISDICTION WHERE THE OFFER OR SALE IS NOT PERMITTED.
20
| WFRBS Commercial Mortgage Trust 2014-C21 | Certain Terms and Conditions |
| consultation period, each Special Servicer will be required to consult with the Trust Advisor (in addition to the subordinate class representative, during a collective consultation period) in connection with asset status reports and material special servicing actions. A “senior consultation period” will exist as long as either (i) the Class E certificates have an aggregate principal balance, without regard to any Appraisal Reduction Amounts allocable to that class, that is less than 25% of its initial principal balance or (ii) during such time as the Class E certificates are the most subordinate class of control-eligible certificates that have a then outstanding principal balance, net of Appraisal Reduction Amounts, at least equal to 25% of its initial principal balance, the then-majority subordinate certificateholder has irrevocably waived its right to appoint a subordinate class representative and to exercise any of the rights of the majority subordinate certificateholder or cause the exercise of the rights of the subordinate class representative and such rights have not been reinstated to a successor majority subordinate certificateholder as set forth in the pooling and servicing agreement. In general, during a senior consultation period, each Special Servicer must seek to consult with the Trust Advisor in connection with asset status reports and material special servicing actions, and, in general, no subordinate class representative will be recognized or have any right to terminate either Special Servicer or approve, direct or consult with respect to servicing matters. Furthermore, notwithstanding any contrary description set forth above, with respect to the Queens Atrium mortgage loan, in general (a) for as long as the loan combination is serviced under the pooling and servicing agreement for this securitization, the initial holder of the related pari passu companion loan will have control rights that include the right to approve or disapprove various material servicing actions involving the loan combination and the subordinate class representative for this securitization will have the right to be consulted on a non-binding basis with respect to such actions, and (b) in connection with any securitization of the related pari passu companion loan, after which the loan combination will be serviced under the pooling and servicing agreement for that other securitization, that pooling and servicing agreement may grant to a subordinate or controlling class representative or other third party control rights that include the right to approve or disapprove various material servicing actions involving the loan combination but the subordinate class representative for this securitization will nonetheless each have the right to be consulted on a non-binding in basis with respect to such actions. For purposes of the servicing of the applicable loan combination, the occurrence and continuance of a collective consultation period or senior consultation period with respect to the subordinate class representative under this securitization will not limit the control or other rights of the initial holder of the pari passu companion loan or of a subordinate or controlling class representative or other third party under any securitization thereof, and any collective consultation period or senior consultation period or similar period under that other securitization will not limit the consultation rights of the subordinate class representative under this securitization. Furthermore, notwithstanding any contrary description set forth above, with respect to the Montgomery Mall mortgage loan, in general the loan combination will be serviced under the WFCM 2014-LC16 pooling and servicing agreement, which grants to a subordinate class representative control rights that include the right to approve or disapprove various material servicing actions involving the loan combination but the subordinate class representative for this securitization will nonetheless have the right to be consulted on a non-binding basis with respect to such actions. For purposes of the servicing of the Montgomery Mall loan combination, the occurrence and continuance of a collective consultation period or senior consultation period with respect to the subordinate class representative under this securitization will not limit the control or other rights of the subordinate class representative under the WFCM 2014-LC16 securitization, and any collective consultation period or senior consultation period or similar period under the WFCM 2014-LC16 securitization will not limit the consultation rights of the subordinate class representative under this securitization. In general, loan combination control rights also include the right, in certain circumstances, to direct the replacement of the applicable special servicer for the related loan combination only. | ||
| Replacement of Special Servicer by General Vote of Certificateholders: | During any “collective consultation period” or “senior consultation period”, either or both of the Special Servicers may be terminated and replaced upon the affirmative direction of certificate owners holding not less than 75% of the appraisal-reduced voting rights of all certificates, following a proposal from certificate owners holding not less than 25% of the appraisal-reduced voting rights of all certificates. The certificateholders who initiate a vote on a termination and replacement of either or both of the Special Servicers without cause must cause DBRS, Moody’s, and Morningstar to confirm the then-current ratings of the certificates (or decline to review the matter) and cause the payment of the fees and expenses incurred in the replacement. |
THE INFORMATION IN THIS STRUCTURAL AND COLLATERAL TERM SHEET IS NOT COMPLETE AND MAY BE AMENDED PRIOR TO THE TIME OF SALE. THIS TERM SHEET IS NOT AN OFFER TO SELL THESE SECURITIES AND IT IS NOT A SOLICITATION OF AN OFFER TO BUY THESE SECURITIES IN ANY JURISDICTION WHERE THE OFFER OR SALE IS NOT PERMITTED.
21
| WFRBS Commercial Mortgage Trust 2014-C21 | Certain Terms and Conditions |
| Appraisal Remedy: | Solely for purposes of determining whether a “subordinate control period” is in effect, whenever the applicable Special Servicer obtains an appraisal or updated appraisal under the pooling and servicing agreement, the subordinate class representative, with respect to the mortgage loans (other than the Queens Atrium and Montgomery Mall mortgage loans) will have the right (at its expense) to direct the applicable Special Servicer to hire a qualified appraiser to prepare a second appraisal of the mortgaged property. The applicable Special Servicer must thereafter determine whether, based on its assessment of such second appraisal, any recalculation of the Appraisal Reduction Amount is warranted. The Appraisal Reduction Amount, whether based on the first or the second appraisal, will become effective following the second appraisal, except that the Appraisal Reduction Amount based on the first appraisal shall become effective if the subordinate class representative declines to demand a second appraisal within a specified number of business days, or if a second appraisal is not received within 90 days after the direction of the subordinate class representative. In addition, for the same purposes, if there is a material change in the mortgaged property securing any mortgage loan for which an Appraisal Reduction Amount has been calculated, the majority certificateholder of the Class E, F or G Certificates or other designated certificateholders will be entitled (at its expense) to present an additional appraisal to the applicable Special Servicer, which will generally be required to recalculate the Appraisal Reduction Amount based upon such additional appraisal. This latter right may not be exercised more frequently than once in any 12-month period for each mortgage loan for which an Appraisal Reduction Amount was calculated and can only be exercised during a subordinate control period or a collective consultation period as further described in the Free Writing Prospectus. | |
| Sale of Defaulted Assets: | There will be no “fair value” purchase option. Instead, the pooling and servicing agreement will authorize each Special Servicer to sell defaulted mortgage loans serviced by such Special Servicer to the highest bidder in a manner generally similar to sales of REO properties. The sale of a defaulted loan (other than the Queens Atrium and Montgomery Mall mortgage loans) for less than par plus accrued interest and certain other fees and expenses owed on the loan will be subject to consent or consultation rights of the subordinate class representative and/or Trust Advisor, as described in the Free Writing Prospectus. In the case of the Queens Atrium mortgage loan, the sale will be subject to the consent and/or consultation rights of the holders of the related pari passu companion loan, as described in the Free Writing Prospectus. After the securitization of the Queens Atrium pari passu companion loan, pursuant to the respective intercreditor agreement, the party acting as special servicer with respect to the Queens Atrium loan combination pursuant to the pooling and servicing agreement of that securitization, may offer to sell to any person (or may offer to purchase) for cash such loan combination during such time as such loan combination constitutes a defaulted mortgage loan, and, in connection with any such sale, that special servicer is required to sell both the pari passu mortgage loan and related pari passu companion loan in any such loan combination as a whole loan. The subordinate class representative will have consultation rights as the holder of an interest in the related loan combination, as described in the Free Writing Prospectus. In the case of the Montgomery Mall mortgage loan, pursuant to the respective intercreditor agreement and the WFCM 2014-LC16 pooling and servicing agreement, the WFCM 2014-LC16 special servicer may offer to sell to any person (or may offer to purchase) for cash such loan combination during such time as such loan combination constitutes a defaulted mortgage loan, and, in connection with any such sale, the WFCM 2014-LC16 special servicer is required to sell both the pari passu mortgage loan and related pari passu companion loan in any such loan combination as a whole loan. The subordinate class representative will have consultation rights as the holder of an interest in the related pari passu mortgage loan, as described in the Free Writing Prospectus. | |
| “As-Is” Appraisals: | Appraisals must be conducted on an “as-is” basis, and must be no more than 9 months old, for purposes of determining Appraisal Reduction Amounts, market value in connection with REO sales, etc. Required appraisals may consist of updates of prior appraisals. Internal valuations by each Special Servicer are permitted if the principal balance of a mortgage loan is less than $2,000,000. | |
| Trust Advisor: | The Trust Advisor will perform certain review duties that will generally include a limited annual review of and report regarding the Special Servicer to the Certificate Administrator. Each review and report generally will be based on: (a) during a collective consultation period or senior consultation period, any asset status reports and additional information delivered to the Trust Advisor by the applicable Special Servicer with respect to any mortgage loan serviced by such Special Servicer, and/or (b) during a senior consultation period, in addition to the applicable information described above, a meeting with the applicable Special Servicer to conduct a limited review of such Special Servicer’s operational practices on a platform basis in light of the servicing standard. In addition, during any collective consultation period or senior consultation period, each |
THE INFORMATION IN THIS STRUCTURAL AND COLLATERAL TERM SHEET IS NOT COMPLETE AND MAY BE AMENDED PRIOR TO THE TIME OF SALE. THIS TERM SHEET IS NOT AN OFFER TO SELL THESE SECURITIES AND IT IS NOT A SOLICITATION OF AN OFFER TO BUY THESE SECURITIES IN ANY JURISDICTION WHERE THE OFFER OR SALE IS NOT PERMITTED.
22
| WFRBS Commercial Mortgage Trust 2014-C21 | Certain Terms and Conditions |
Special Servicer must seek to consult with the Trust Advisor (in addition to the subordinate class representative during a collective consultation period) in connection with material special servicing actions with respect to specially serviced mortgage loans serviced by such Special Servicer. Furthermore, under certain circumstances, but only during a senior consultation period, the Trust Advisor may recommend the replacement of either or both of the Special Servicers, in which case the Certificate Administrator will deliver notice of such recommendation to the certificateholders, and certificateholders with specified percentages of the voting rights may direct the replacement of either or both of the Special Servicers at their expense. Notwithstanding any contrary provision described above, the Trust Advisor will have no rights or duties in connection with the Queens Atrium and Montgomery Mall mortgage loans. The Trust Advisor may be removed and replaced without cause upon the affirmative direction of certificates owners holding not less than 75% of the appraisal-reduced voting rights of all certificates, following a proposal from certificate owners holding not less than 25% of the appraisal-reduced voting rights of all certificates. The certificateholders who initiate a vote on a termination and replacement of the Trust Advisor without cause must cause DBRS, Moody’s and Morningside to confirm the then-current ratings of the certificates (or decline to review the matter) and cause the payment of the fees and expenses incurred in the replacement. During any “subordinate control period”, the proposed replacement trust advisor will be subject to the subordinate class representative’s consent (such consent not to be unreasonably withheld). If a proposed termination and replacement of the Trust Advisor is not consummated within 180 days following the initial request of the certificateholders who requested a vote, the proposed termination and replacement shall have no further force or effect. The Trust Advisor generally may be discharged from its duties if and when the Class A-1, A-2, A-3, A-4, A-5, A-SB, A-S, B, C, PEX, and D Certificates are retired. | ||
| Certain Fee Offsets: | If a workout fee is earned by the Special Servicer following a loan default with respect to any mortgage loan that it services, then certain limitations will apply to the collection and retention of a modification fee from the borrower. The modification fee generally must not exceed 1% of the principal balance of the loan as modified. In addition, if the loan re-defaults within a specified period of months and other conditions are satisfied, any subsequent workout or liquidation fee on that loan must be reduced by a portion of the previously-collected modification fee. Furthermore, workout fees, liquidation fees and modification fees collected with respect to any workout, liquidation and/or partial liquidation of a mortgage loan or loan combination that is serviced by the Special Servicer will be subject to an aggregate cap equal to the greater of (i) $1,000,000 and (ii) 1.00% of the stated principal balance of the subject mortgage loan or loan combination. | |
| Deal Website: | The Certificate Administrator will be required to maintain a deal website which will include, among other items: (a) summaries of asset status reports prepared by the Special Servicer, (b) inspection reports, (c) appraisals, (d) various “special notices” described in the Free Writing Prospectus, (e) the “Investor Q&A Forum” and (f) a voluntary “Investor Registry”. Investors may access the deal website following execution of a certification and confidentiality agreement. | |
| Initial Majority Subordinate Certificateholder: | It is expected that an affiliate of Seer Capital Management, LLC will be the initial majority subordinate certificateholder. | |
| Loan Combinations: | Each of the mortgaged property identified on Annex A to the Free Writing Prospectus as Queens Atrium, Montgomery Mall, and Oak Court Mall secure both a mortgage loan to be included in the trust fund and one other mortgage loan that will not be included in the trust fund, which will be pari passu in right of payment with the trust mortgage loan. With respect to the group of mortgage loans, which we refer to as a “loan combination”: The Queens Atrium loan combination will be serviced under the WFRBS 2014-C21 pooling and servicing agreement until the securitization of the related pari passu companion loan, after which date such loan combination will be serviced under the pooling and servicing agreement for the securitization of the related pari passu companion loan. The Montgomery Mall loan combination will be serviced under the pooling and servicing agreement relating to the WFCM 2014-LC16 transaction. The Oak Court Mall will be principally serviced under the WFRBS 2014-C21 pooling and servicing agreement. |
THE INFORMATION IN THIS STRUCTURAL AND COLLATERAL TERM SHEET IS NOT COMPLETE AND MAY BE AMENDED PRIOR TO THE TIME OF SALE. THIS TERM SHEET IS NOT AN OFFER TO SELL THESE SECURITIES AND IT IS NOT A SOLICITATION OF AN OFFER TO BUY THESE SECURITIES IN ANY JURISDICTION WHERE THE OFFER OR SALE IS NOT PERMITTED.
23
(THIS PAGE INTENTIONALLY LEFT BLANK)
24
| FAIRVIEW PARK DRIVE |

THE INFORMATION IN THIS STRUCTURAL AND COLLATERAL TERM SHEET IS NOT COMPLETE AND MAY BE AMENDED PRIOR TO THE TIME OF SALE. THIS TERM SHEET IS NOT AN OFFER TO SELL THESE SECURITIES AND IT IS NOT A SOLICITATION OF AN OFFER TO BUY THESE SECURITIES IN ANY JURISDICTION WHERE THE OFFER OR SALE IS NOT PERMITTED.
25
| FAIRVIEW PARK DRIVE |
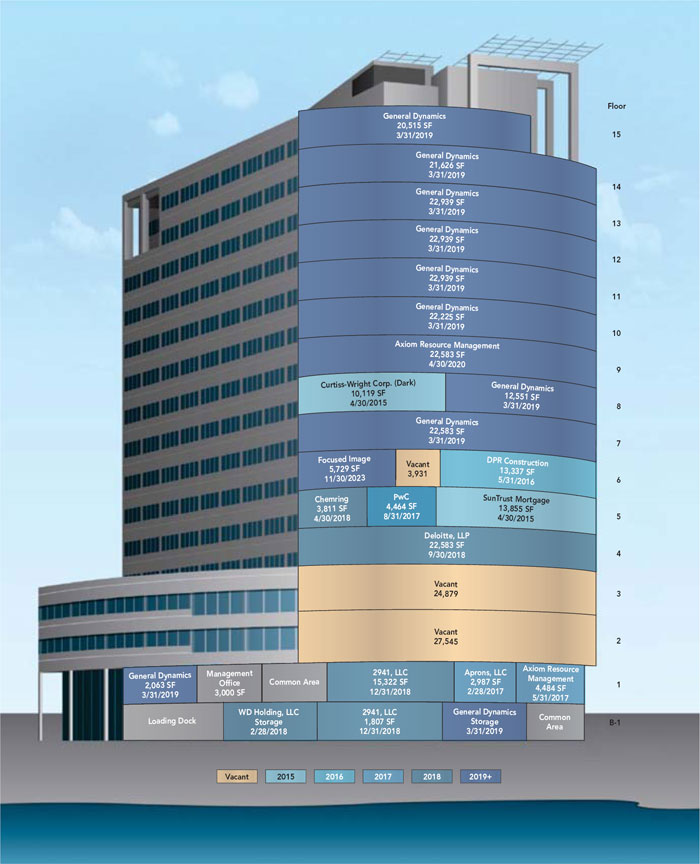
THE INFORMATION IN THIS STRUCTURAL AND COLLATERAL TERM SHEET IS NOT COMPLETE AND MAY BE AMENDED PRIOR TO THE TIME OF SALE. THIS TERM SHEET IS NOT AN OFFER TO SELL THESE SECURITIES AND IT IS NOT A SOLICITATION OF AN OFFER TO BUY THESE SECURITIES IN ANY JURISDICTION WHERE THE OFFER OR SALE IS NOT PERMITTED.
26
| FAIRVIEW PARK DRIVE |
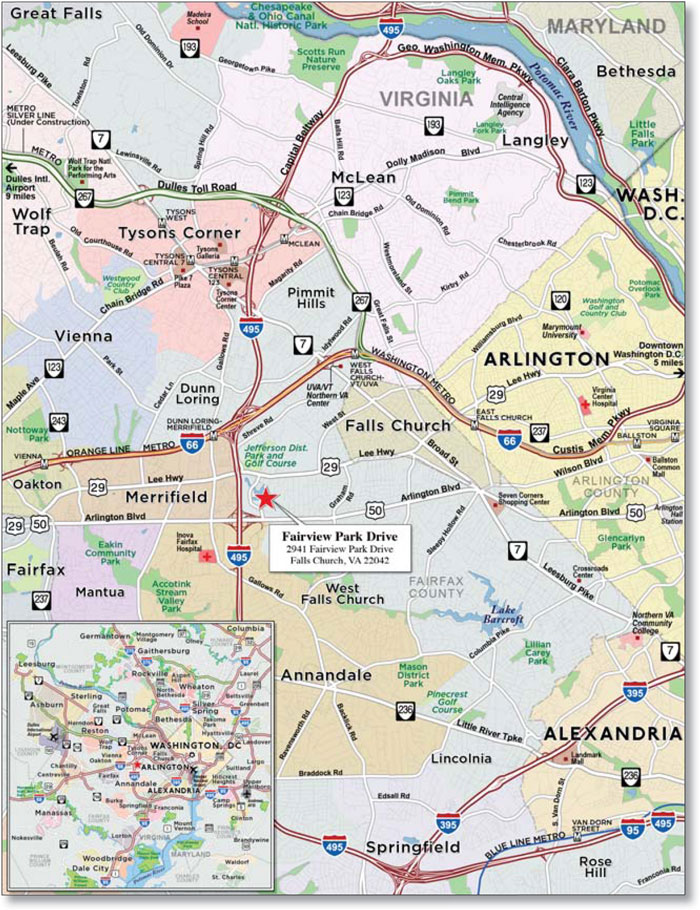
THE INFORMATION IN THIS STRUCTURAL AND COLLATERAL TERM SHEET IS NOT COMPLETE AND MAY BE AMENDED PRIOR TO THE TIME OF SALE. THIS TERM SHEET IS NOT AN OFFER TO SELL THESE SECURITIES AND IT IS NOT A SOLICITATION OF AN OFFER TO BUY THESE SECURITIES IN ANY JURISDICTION WHERE THE OFFER OR SALE IS NOT PERMITTED.
27
| No. 1 – Fairview Park Drive | |||||||
| Loan Information | Property Information | ||||||
| Mortgage Loan Seller: | The Royal Bank of Scotland | Single Asset/Portfolio: | Single Asset | ||||
Credit Assessment (DBRS/Moody’s/Morningstar): | NR/NR/NR | Property Type: | Office | ||||
| Original Principal Balance: | $90,000,000 | Specific Property Type: | Suburban | ||||
| Cut-off Date Principal Balance: | $90,000,000 | Location: | Falls Church, VA | ||||
| % of Initial Pool Balance: | 6.3% | Size: | 360,864 SF | ||||
| Loan Purpose: | Refinance | Cut-off Date Principal Balance Per SF: | $249.40 | ||||
| Borrower Name: | 2941 Fairview Park Drive, LLC | Year Built/Renovated: | 2004/NAP | ||||
| Sponsor: | Fairview Property Investments, L.L.C.; Richard L. Adams, Jr. | Title Vesting: | Fee | ||||
| Mortgage Rate: | 4.329% | Property Manager: | Self-managed | ||||
| Note Date: | June 27, 2014 | 3rd Most Recent Occupancy (As of)(2): | 77.4% (12/31/2011) | ||||
| Anticipated Repayment Date: | NAP | 2nd Most Recent Occupancy (As of): | 85.0% (12/31/2012) | ||||
| Maturity Date: | July 1, 2024 | Most Recent Occupancy (As of): | 84.0% (12/31/2013) | ||||
| IO Period: | 120 months | Current Occupancy (As of)(3): | 85.5% (4/1/2014) | ||||
| Loan Term (Original): | 120 months | ||||||
| Seasoning: | 1 months | Underwriting and Financial Information: | |||||
| Amortization Term (Original): | NAP | ||||||
| Loan Amortization Type: | Interest-only, Balloon | 3rd Most Recent NOI (As of)(4): | $6,533,691 (12/31/2012) | ||||
| Interest Accrual Method: | Actual/360 | 2nd Most Recent NOI (As of)(4): | $7,816,921 (12/31/2013) | ||||
| Call Protection: | L(25),D(91),O(4) | Most Recent NOI (As of): | $7,708,997 (TTM 3/31/2014) | ||||
| Lockbox Type: | Hard/Springing Cash Management | ||||||
| Additional Debt: | None | U/W Revenues: | $11,786,995 | ||||
| Additional Debt Type: | NAP | U/W Expenses: | $3,957,669 | ||||
| U/W NOI: | $7,829,326 | ||||||
| U/W NCF: | $7,525,755 | ||||||
| U/W NOI DSCR: | 1.98x | ||||||
Escrows and Reserves(1): | U/W NCF DSCR: | 1.91x | |||||
| U/W NOI Debt Yield: | 8.7% | ||||||
Type: | Initial | Monthly | Cap (If Any) | U/W NCF Debt Yield: | 8.4% | ||
| Taxes | $222,511 | $111,256 | NAP | As-Is Appraised Value: | $135,000,000 | ||
| Insurance | $8,615 | $8,615 | NAP | As-Is Appraisal Valuation Date: | May 22, 2014 | ||
| Replacement Reserves | $7,518 | $7,518 | $350,000 | Cut-off Date LTV Ratio: | 66.7% | ||
| TI/LC Reserve | $12,029 | $12,029 | $5,500,000 | LTV Ratio at Maturity or ARD: | 66.7% | ||
| (1) | See “Escrows” section. |
| (2) | See “Historical Occupancy” section. |
| (3) | Current Occupancy excluding the Curtiss-Wright Corp. tenant which is dark, paying rent but excluded from the underwritten income, is 82.7%. |
| (4) | See “Cash Flow Analysis” section. |
The Mortgage Loan. The mortgage loan (the “Fairview Park Drive Mortgage Loan”) is evidenced by a single promissory note that is secured by a first mortgage encumbering an office building and adjacent five-story parking garage located in Falls Church, Virginia (the “Fairview Park Drive Property”). The Fairview Park Drive Mortgage Loan was originated on June 27, 2014 by The Royal Bank of Scotland. The Fairview Park Drive Mortgage Loan had an original principal balance of $90,000,000, has an outstanding principal balance as of the Cut-off Date of $90,000,000 and accrues interest at an interest rate of 4.329% per annum. The Fairview Park Drive Mortgage Loan had an initial term of 120 months, has a remaining term of 119 months as of the Cut-off Date and requires interest-only payments through the term of the Fairview Park Drive Mortgage Loan. The Fairview Park Drive Mortgage Loan matures on July 1, 2024.
Following the lockout period, the borrower has the right to defease the Fairview Park Drive Mortgage Loan in whole, but not in part, on any date before April 1, 2024. In addition, the Fairview Park Drive Mortgage Loan is prepayable without penalty on or after April 1, 2024.
THE INFORMATION IN THIS STRUCTURAL AND COLLATERAL TERM SHEET IS NOT COMPLETE AND MAY BE AMENDED PRIOR TO THE TIME OF SALE. THIS TERM SHEET IS NOT AN OFFER TO SELL THESE SECURITIES AND IT IS NOT A SOLICITATION OF AN OFFER TO BUY THESE SECURITIES IN ANY JURISDICTION WHERE THE OFFER OR SALE IS NOT PERMITTED.
28
| FAIRVIEW PARK DRIVE |
Sources and Uses
| Sources | Uses | |||||||
| Original loan amount | $90,000,000 | 100.0% | Loan payoff(1) | $64,703,367 | 71.9% | |||
| Reserves | 250,673 | 0.3 | ||||||
| Closing costs | 1,509,582 | 1.7 | ||||||
| Return of equity | 23,536,378 | 26.2 | ||||||
| Total Sources | $90,000,000 | 100.0% | Total Uses | $90,000,000 | 100.0% | |||
| (1) | The Fairview Park Property was previously securitized in BSCMS 2004-PWR5. |
The Property. The Fairview Park Drive Property is a 15-story, class A office building situated on approximately 13.8 acres located in Falls Church, Virginia, approximately 10 miles west of Washington, D.C. and 14 miles east of the Dulles International Airport. The Fairview Park Drive Property was constructed in 2004, contains 360,864 rentable square feet and is located within the 220-acre Fairview Park master planned office and hotel campus in Northern Virginia. Amenities at the Fairview Park Drive Property include the 2941 Restaurant, a fitness center, lakefront views, an outdoor terrace area, ballrooms and 24-hour security. The Fairview Park Drive Property also features a five-story, 1,208 space parking garage, resulting in a parking ratio of 3.3 spaces per 1,000 square feet of rentable area.
As of April 1, 2014 The Fairview Park Drive Property was 85.5% leased to 14 tenants including a mix of government contractors, “Big 4” accounting firms, financial firms and private sector tenants. Currently approximately 60.0% of rentable area is from tenants utilizing the Fairview Park Drive property as their headquarters locations, including the largest tenant, General Dynamics, which has reportedly invested approximately $50.0 million ($293 per square foot) of their own capital to build out its space.
The following table presents certain information relating to the tenancy at the Fairview Park Drive Property:
Major Tenants
| Tenant Name | Credit Rating (Fitch/Moody’s /S&P)(1) | Tenant NRSF | % of NRSF | Annual U/W Base Rent PSF(2) | Annual U/W Base Rent(2) | % of Total Annual U/W Base Rent | Lease Expiration Date | |||||||
| Major Tenants | ||||||||||||||
| General Dynamics | A/A2/A | 174,243 | 48.3% | $40.35 | $7,030,670 | 62.8% | 3/31/2019(3) | |||||||
| Axiom Resource | NR/NR/NR | 27,067 | 7.5% | $43.02 | $1,164,483 | 10.4% | Various(4) | |||||||
| Deloitte, LLP | NR/NR/NR | 22,583 | 6.3% | $41.91 | $946,454 | 8.4% | 9/30/2018 | |||||||
SunTrust Mortgage(5) | BBB+/Baa1/BBB | 14,255 | 4.0% | $33.34 | $475,269 | 4.2% | 4/30/2015 | |||||||
| 2941, LLC | NR/NR/NR | 17,129 | 4.7% | $10.50 | $179,880 | 1.6% | 12/31/2018 | |||||||
| Total Major Tenants | 255,277 | 70.7% | $38.38 | $9,796,755 | 87.5% | |||||||||
| Non-Major Tenants | 43,044 | 11.9% | $32.64 | $1,405,076 | 12.5% | |||||||||
| Occupied Collateral Total | 298,321 | 82.7% | $37.55 | $11,201,831 | 100.0% | |||||||||
| Vacant Space | 62,543 | 17.3%(6) | ||||||||||||
| Collateral Total | 360,864 | 100.0% | ||||||||||||
| (1) | Certain ratings are those of the parent company whether or not the parent guarantees the lease. |
| (2) | Annual U/W Base Rent PSF and Annual U/W Base Rent include contractual rent steps through December 2014. |
| (3) | General Dynamics has two, 5-year lease renewal options. |
| (4) | Axiom Resource occupies one space totaling 22,583 square feet (6.3% of NRSF and 8.7% of Annual U/W Base Rent) with a lease expiration date of April 30, 2020 and one space totaling 4,484 square feet (1.2% of NRSF and 1.6% of Annual U/W Base Rent) with a lease expiration of May 31, 2017. |
| (5) | SunTrust Mortgage exercised its termination option and is vacating April 30, 2015. There is an agreed upon letter of intent to lease with Booz Allen Hamilton for approximately 12,045 square feet of the former SunTrust Mortgage space. |
| (6) | Includes the Curtiss-Wright Corp. tenant which is dark, paying rent but excluded from the underwritten income. |
THE INFORMATION IN THIS STRUCTURAL AND COLLATERAL TERM SHEET IS NOT COMPLETE AND MAY BE AMENDED PRIOR TO THE TIME OF SALE. THIS TERM SHEET IS NOT AN OFFER TO SELL THESE SECURITIES AND IT IS NOT A SOLICITATION OF AN OFFER TO BUY THESE SECURITIES IN ANY JURISDICTION WHERE THE OFFER OR SALE IS NOT PERMITTED.
29
| FAIRVIEW PARK DRIVE |
The following table presents certain information relating to the lease rollover schedule at the Fairview Park Drive Property:
Lease Expiration Schedule(1)(2)
Year Ending December 31, | No. of Leases Expiring | Expiring NRSF | % of Total NRSF | Cumulative Expiring NRSF | Cumulative % of Total NRSF | Annual U/W Base Rent | Annual U/W Base Rent PSF(3) | ||||||||
| MTM | 0 | 0 | 0.0% | 0 | 0.0% | $0 | $0.00 | ||||||||
| 2014 | 0 | 0 | 0.0% | 0 | 0.0% | $0 | $0.00 | ||||||||
| 2015 | 1 | 14,255 | 4.0% | 14,255 | 4.0% | $475,269 | $33.34 | ||||||||
| 2016 | 1 | 13,337 | 3.7% | 27,592 | 7.6% | $505,872 | $37.93 | ||||||||
| 2017 | 3 | 11,935 | 3.3% | 39,527 | 11.0% | $459,653 | $38.51 | ||||||||
| 2018 | 4 | 49,892 | 13.8% | 89,419 | 24.8% | $1,314,460 | $26.35 | ||||||||
| 2019 | 2 | 177,590 | 49.2% | 267,009 | 74.0% | $7,164,784 | $40.34 | ||||||||
| 2020 | 1 | 22,583 | 6.3% | 289,592 | 80.2% | $979,876 | $43.39 | ||||||||
| 2021 | 0 | 0 | 0.0% | 289,592 | 80.2% | $0 | $0.00 | ||||||||
| 2022 | 0 | 0 | 0.0% | 289,592 | 80.2% | $0 | $0.00 | ||||||||
| 2023 | 1 | 5,729 | 1.6% | 295,321 | 81.8% | $211,916 | $36.99 | ||||||||
| 2024 | 0 | 0 | 0.0% | 295,321 | 81.8% | $0 | $0.00 | ||||||||
| Thereafter | 1 | 3,000 | 0.8% | 298,321 | 82.7% | $90,000 | $30.00 | ||||||||
| Vacant | 0 | 62,543 | 17.3%(4) | 360,864 | 100.0% | $0 | $0.00 | ||||||||
| Total/Weighted Average | 14 | 360,864 | 100.0% | $11,201,831 | $37.55 |
| (1) | Information obtained from the underwritten rent roll. |
| (2) | Certain tenants may have lease termination options that are exercisable prior to the originally stated expiration date of the subject lease and that are not considered in the Lease Expiration Schedule. |
| (3) | Weighted Average Annual U/W Base Rent PSF excludes vacant space. |
| (4) | Includes the Curtiss-Wright Corp. tenant which is dark, paying rent but excluded from the underwritten income. |
The following table presents historical occupancy percentages at the Fairview Park Drive Property:
Historical Occupancy(1)
12/31/2011(2) | 12/31/2012 | 12/31/2013 | 4/1/2014(3) | |||
| 77.4% | 85.0% | 84.0% | 85.5% |
| (1) | Information obtained from the borrower. |
| (2) | Lower occupancy in 2011 was due to a major tenant filing bankruptcy and ending its lease. |
| (3) | Excluding the Curtiss-Wright Corp. tenant which is dark, paying rent but excluded from the underwritten income, the occupancy is 82.7%. |
Operating History and Underwritten Net Cash Flow. The following table presents certain information relating to the Underwritten Net Cash Flow at the Fairview Park Drive Property:
Cash Flow Analysis
| 2012 | 2013 | TTM 3/31/2014 | U/W(1) | U/W $ per SF(1) | ||||||||||||
| Base Rent | $10,113,105 | $11,057,936 | $11,027,305 | $11,201,831 | $31.04 | |||||||||||
| Grossed Up Vacant Space | 0 | 0 | 0 | 2,439,177 | 6.76 | |||||||||||
| Total Reimbursables | 350,333 | 441,774 | 459,420 | 387,538 | 1.07 | |||||||||||
| Other Income | 110,851 | 205,687 | 197,626 | 197,626 | 0.55 | |||||||||||
| Less Vacancy & Free Rent | (313,409) | (17,187) | (68,748) | (2,439,177)(2) | (6.76) | |||||||||||
| Effective Gross Income | $10,260,880 | $11,688,210 | $11,615,603 | $11,786,995 | $32.66 | |||||||||||
| Total Operating Expenses | $3,727,189 | $3,871,289 | $3,906,606 | $3,957,669 | $10.97 | |||||||||||
| Net Operating Income | $6,533,691(3) | $7,816,921(3) | $7,708,997 | $7,829,326 | $21.70 | |||||||||||
| TI/LC | 0 | 0 | 0 | 213,355 | 0.59 | |||||||||||
| Capital Expenditures | 0 | 0 | 0 | 90,216 | 0.25 | |||||||||||
| Net Cash Flow | $6,533,691 | $7,816,921 | $7,708,997 | $7,525,755 | $20.85 | |||||||||||
| NOI DSCR | 1.65x | 1.98x | 1.95x | 1.98x | ||||||||||||
| NCF DSCR | 1.65x | 1.98x | 1.95x | 1.91x | ||||||||||||
| NOI DY | 7.3% | 8.7% | 8.6% | 8.7% | ||||||||||||
| NCF DY | 7.3% | 8.7% | 8.6% | 8.4% | ||||||||||||
| (1) | Annual U/W Base Rent PSF and Annual U/W Base Rent include contractual rent steps through December 2014. |
| (2) | The underwritten economic vacancy is 17.4%. The Fairview Park Drive Property was 85.5% leased as of April 1, 2014. |
| (3) | 2013 NOI is higher than 2012 NOI due to new leases and renewals; three new leases totaling more than $1.3 million in rental income were signed in the last six months of 2012. |
THE INFORMATION IN THIS STRUCTURAL AND COLLATERAL TERM SHEET IS NOT COMPLETE AND MAY BE AMENDED PRIOR TO THE TIME OF SALE. THIS TERM SHEET IS NOT AN OFFER TO SELL THESE SECURITIES AND IT IS NOT A SOLICITATION OF AN OFFER TO BUY THESE SECURITIES IN ANY JURISDICTION WHERE THE OFFER OR SALE IS NOT PERMITTED.
30
| FAIRVIEW PARK DRIVE |
Appraisal. As of the appraisal valuation date of May 22, 2014, the Fairview Park Drive Property had an “as-is” appraised value of $135,000,000.
Environmental Matters. According to the Phase I environmental report dated June 5, 2014, there was no evidence of any recognized environmental conditions at the Fairview Park Drive Property.
Market Overview and Competition. The Fairview Park Drive Property is located in Falls Church, Virginia, which is approximately 14 miles east of Dulles International Airport and 10 miles west of downtown Washington, D.C. Primary access to the Fairview Park Drive Property is provided by the Capital Beltway (Interstate-495) which encircles the District of Columbia and provides direct access to the majority of the region’s highways and main arteries including Interstates 66, 95 and 270. According to the appraisal, the Fairview Park Drive Property is located in the Washington D.C. Metro market, within the class A, high rise office submarket which comprises approximately 6.4 million square feet of office space as of the first quarter of 2014. The submarket occupancy rate is currently 87.7% and has trended upward for three consecutive years, averaging 90.6% over the past nine years. The current average asking rent within the submarket is $41.01 per square foot on a gross basis.
The following table presents certain information relating to comparable office properties for the Fairview Park Drive Property:
Competitive Set(1)
Fairview Park Drive (Subject) | 3141 Fairview Park Drive | 3110 Fairview Park Drive | Willow Oaks Two | Williams Plaza 1 | ||||||
| Location | Falls Church, VA | Falls Church, VA | Falls Church, VA | Fairfax, VA | Fairfax, VA | |||||
| Distance from Subject | -- | 0.7 miles | 0.8 miles | 1.4 miles | 1.7 miles | |||||
| Property Type | Office | Office | Office | Office | Office | |||||
| Year Built/Renovated | 2004/NAP | 1988/NAV | 1986/NAV | 1989/NAV | 1988/NAV | |||||
| Stories | 15 | 8 | 14 | 8 | 6 | |||||
| Total GLA | 360,864 SF | 176,570 SF | 252,776 SF | 205,002 SF | 127,639 SF | |||||
| Total Occupancy | 85% | 98% | 67% | 55% | 72% |
(1) Information obtained from the appraisal.
The Borrower. The borrower is 2941 Fairview Park Drive, LLC, a Delaware limited liability company which is a single purpose entity with two independent directors. Legal counsel to the borrower delivered a non-consolidation opinion in connection with the origination of the Fairview Park Drive Mortgage Loan. Fairview Property Investments, L.L.C. is the guarantor of certain nonrecourse carveouts under the Fairview Park Drive Mortgage Loan.
The Sponsors. The loan sponsors are Fairview Property Investments, L.L.C. and Richard L. Adams, Jr., who is the majority owner and controlling party of Fairview Property Investments, L.L.C. Mr. Adams is an internet pioneer and is the founder of UUNET, which in the mid and late 1990s was the world’s largest internet service provider. Mr. Adams purchased 111 acres at Fairview Park in 1998 and opened the Fairview Park Drive Property in 2004.
Escrows. The loan documents provide for an upfront reserve in the amount of $222,511 for real estate taxes, $8,615 for insurance, $7,518 for replacement reserves and $12,029 for tenant improvements and leasing commissions (“TI/LCs”). The loan documents also provide for ongoing monthly escrows in the amount of $111,256 for real estate taxes, $8,615 for insurance, $7,518 for replacement reserves (subject to a cap of $350,000) and $12,029 for TI/LCs (subject to a cap of $5,500,000). Additionally, during a Lease Sweep Period (as defined below), all excess cash flow (after payment of debt service, required reserves and budgeted and approved operating expenses) is deposited into the TI/LC reserve until such time that an amount equal to the Lease Sweep Cap (as defined below) has been deposited into the TI/LC reserve.
“Lease Sweep Cap” is defined as (i) if the General Dynamics lease triggered a Lease Sweep Period, $5,500,000, and (ii) with respect to any other Major Lease (as defined below) that has triggered a Lease Sweep Period, an amount equal to the lesser of (x) $5,500,000 or (y) $30.00, multiplied by the rentable square footage demised under such Major Lease.
Lockbox and Cash Management. The Fairview Park Drive Mortgage Loan requires a lender-controlled lockbox account which is already in place, and that the borrower direct tenants to pay their rents directly to such lockbox account. The loan documents also require that all cash revenues and all other monies received by the borrower or the property manager be deposited into the lockbox account within one business day after receipt. Prior to the occurrence of a Cash Management Period (as defined below) or Lease Sweep Period, all funds on deposit in the lockbox account will be released to the borrower’s account on a daily basis. During a Cash Management Period or Lease Sweep Period, funds on deposit in the lockbox account will be swept on a daily basis into a lender controlled cash management account.
A “Cash Management Period” will commence if an event of default has occurred or is continuing.
A “Lease Sweep Period” will commence on the first payment date under the Fairview Park Drive Mortgage Loan following the occurrence of any of the following: (i) the date which is 24 months prior to the expiration of any Major Lease; (ii) the date upon which a Major Tenant (as defined below) is required to give notice of its exercise of a renewal option under a Major Lease, if such renewal has not been exercised; (iii) any Major Lease is surrendered, cancelled or terminated prior to its then-current expiration
THE INFORMATION IN THIS STRUCTURAL AND COLLATERAL TERM SHEET IS NOT COMPLETE AND MAY BE AMENDED PRIOR TO THE TIME OF SALE. THIS TERM SHEET IS NOT AN OFFER TO SELL THESE SECURITIES AND IT IS NOT A SOLICITATION OF AN OFFER TO BUY THESE SECURITIES IN ANY JURISDICTION WHERE THE OFFER OR SALE IS NOT PERMITTED.
31
| FAIRVIEW PARK DRIVE |
date; (iv) any Major Tenant discontinues its business at the premises or gives notice that it intends to discontinue its business; (v) the occurrence of a default under any Major Lease; or (vi) upon the occurrence of an insolvency proceeding by any tenant under a Major Lease. A Lease Sweep Period will end upon the earlier to occur of (x) the reasonable determination by the lender that sufficient funds have been accumulated in the leasing reserve to pay for all anticipated expenses in connection with the re-leasing of the space under the applicable Major Lease that gave rise to the subject Lease Sweep Period, or (y) the occurrence of any of the following: (1) with respect to clauses (i), (ii), (iii), or (iv) above, upon the earlier to occur of (A) the date on which the subject Major Tenant exercises its renewal or extension option, or (B) the date on which all the space demised under the subject Major Lease that gave rise to the subject Lease Sweep Period has been fully leased pursuant to a replacement lease or replacement leases in accordance with the terms of the loan documents, and all leasing expenses have been paid in full; (2) with respect to clause (v) above, if the subject default has been cured, and no other default has occurred under a Major Lease for a period of six consecutive months following such cure; (3) with respect to clause (vi) above, if the applicable Major Lease has been affirmed, assumed or assigned in a manner satisfactory to the lender; and (4) the date on which an amount equal to the applicable Lease Sweep Cap in the aggregate has been deposited into the TI/LC reserve.
“Major Lease” is defined as the General Dynamics lease or any other lease which covers 40,000 or more rentable square feet of improvements. A “Major Tenant” is defined as a tenant under a Major Lease.
Property Management. The Fairview Park Drive Property is managed by an affiliate of the borrower.
Assumption. The borrower has the right to transfer the Fairview Park Drive Property, provided that no event of default has occurred and is continuing and certain other conditions are satisfied, including (i) the lender’s reasonable determination that the proposed transferee and guarantor satisfy the lender’s credit review and underwriting standards, taking into consideration transferee experience, financial strength and general business standing; (ii) execution of a recourse guaranty (which includes an environmental indemnity) by an affiliate of the transferee; and (iii) rating agency confirmation from DBRS, Moody’s and Morningstar that the transfer will not result in a downgrade, withdrawal or qualification of the respective ratings assigned to the Series 2014-C21 Certificates.
Partial Release. Not permitted.
Real Estate Substitution. Not permitted.
Subordinate and Mezzanine Indebtedness. Not permitted.
Ground Lease. None.
Terrorism Insurance. The loan documents require that the “all risk” insurance policy required to be maintained by the borrower provide coverage for terrorism in an amount equal to the full replacement cost of the Fairview Park Drive Property, as well as business interruption insurance covering no less than the 18-month period following the occurrence of a casualty event, together with a six-month extended period of indemnity.
THE INFORMATION IN THIS STRUCTURAL AND COLLATERAL TERM SHEET IS NOT COMPLETE AND MAY BE AMENDED PRIOR TO THE TIME OF SALE. THIS TERM SHEET IS NOT AN OFFER TO SELL THESE SECURITIES AND IT IS NOT A SOLICITATION OF AN OFFER TO BUY THESE SECURITIES IN ANY JURISDICTION WHERE THE OFFER OR SALE IS NOT PERMITTED.
32
(THIS PAGE INTENTIONALLY LEFT BLANK)
33
(THIS PAGE INTENTIONALLY LEFT BLANK)
34
| QUEENS ATRIUM |
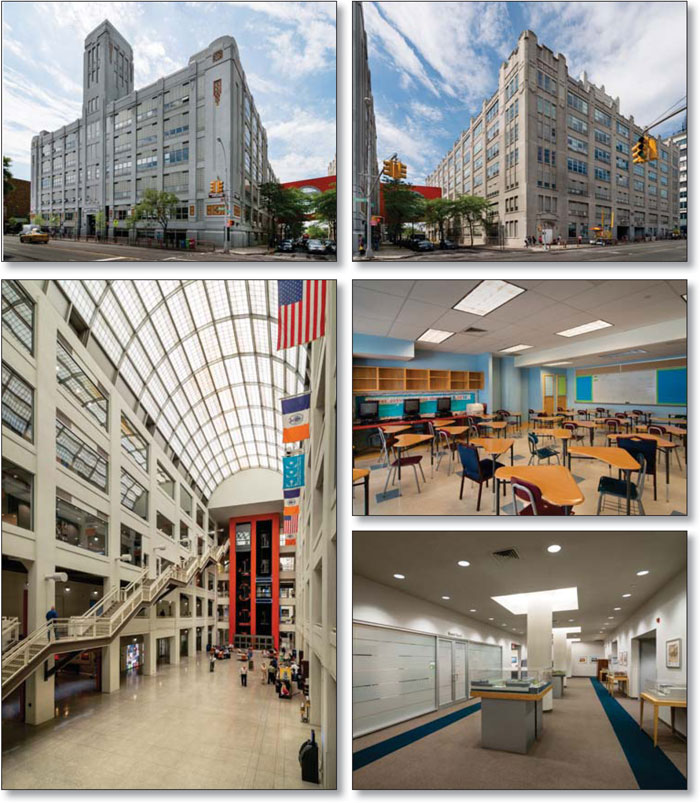
THE INFORMATION IN THIS STRUCTURAL AND COLLATERAL TERM SHEET IS NOT COMPLETE AND MAY BE AMENDED PRIOR TO THE TIME OF SALE. THIS TERM SHEET IS NOT AN OFFER TO SELL THESE SECURITIES AND IT IS NOT A SOLICITATION OF AN OFFER TO BUY THESE SECURITIES IN ANY JURISDICTION WHERE THE OFFER OR SALE IS NOT PERMITTED.
35
| QUEENS ATRIUM |
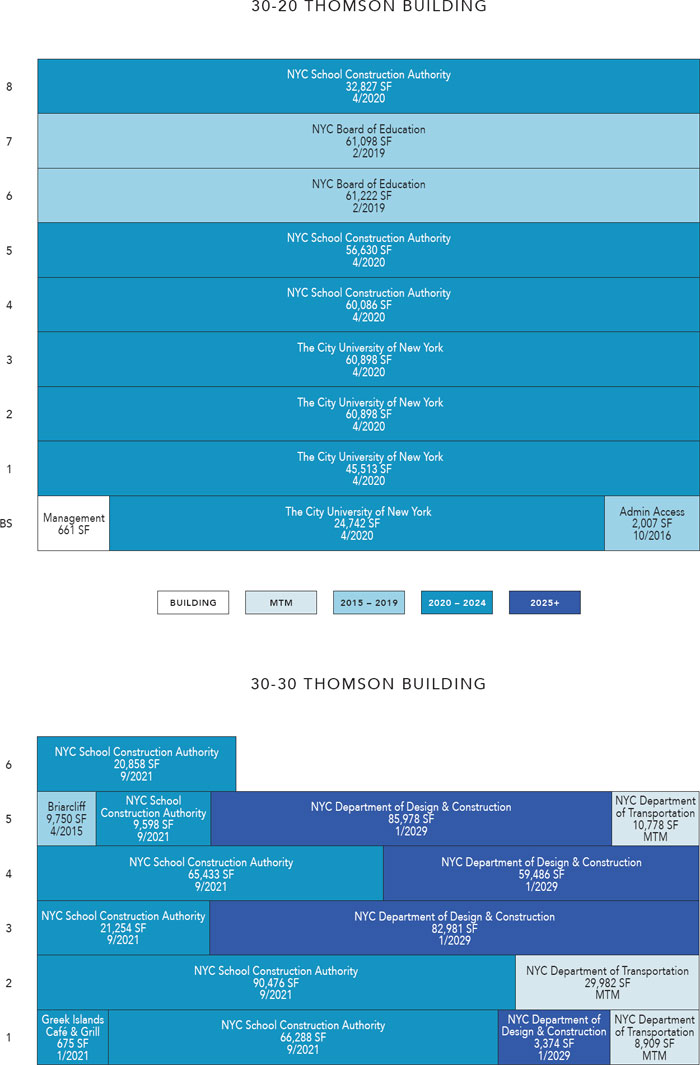
THE INFORMATION IN THIS STRUCTURAL AND COLLATERAL TERM SHEET IS NOT COMPLETE AND MAY BE AMENDED PRIOR TO THE TIME OF SALE. THIS TERM SHEET IS NOT AN OFFER TO SELL THESE SECURITIES AND IT IS NOT A SOLICITATION OF AN OFFER TO BUY THESE SECURITIES IN ANY JURISDICTION WHERE THE OFFER OR SALE IS NOT PERMITTED.
36
| QUEENS ATRIUM |
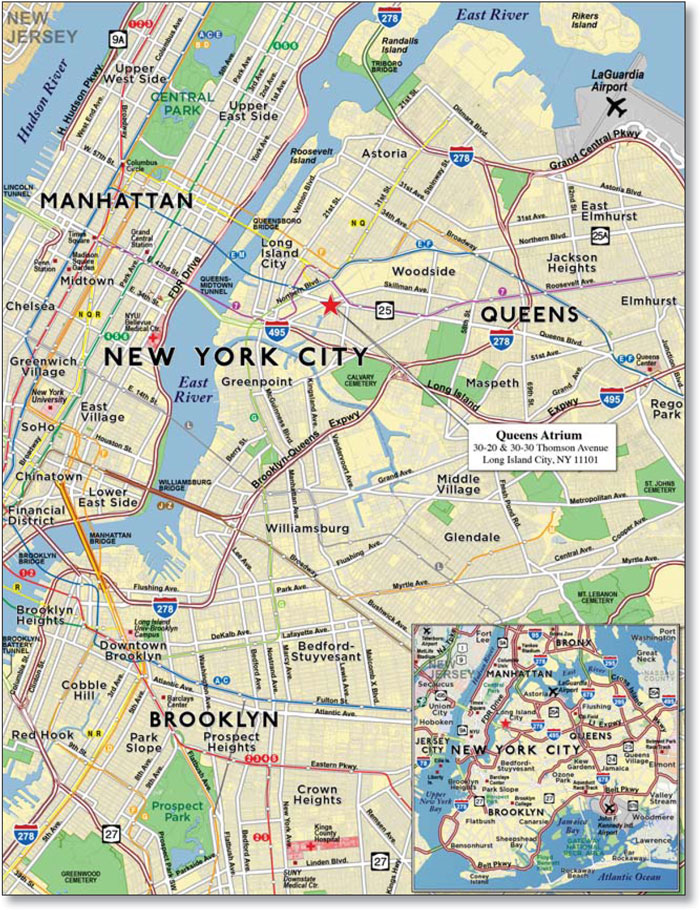
THE INFORMATION IN THIS STRUCTURAL AND COLLATERAL TERM SHEET IS NOT COMPLETE AND MAY BE AMENDED PRIOR TO THE TIME OF SALE. THIS TERM SHEET IS NOT AN OFFER TO SELL THESE SECURITIES AND IT IS NOT A SOLICITATION OF AN OFFER TO BUY THESE SECURITIES IN ANY JURISDICTION WHERE THE OFFER OR SALE IS NOT PERMITTED.
37
| No. 2 Queens Atrium |
| Loan Information | Property Information | ||||||
| Mortgage Loan Seller: | Wells Fargo Bank, National Association | Single Asset/Portfolio: | Single Asset | ||||
| Credit Assessment (DBRS/Moody’s/Morningstar): | NR/NR/NR | Property Type: | Office | ||||
Original Principal Balance(1): | $90,000,000 | Specific Property Type: | CBD | ||||
Cut-off Date Principal Balance(1): | $90,000,000 | Location: | Long Island City, NY | ||||
| % of Initial Pool Balance: | 6.3% | Size: | 1,032,402 SF | ||||
| Loan Purpose: | Refinance | Cut-off Date Principal Balance Per SF(1): | $174.35 | ||||
| Borrower Name: | Celtic Holdings, LLC | Year Built/Renovated: | 1914/2011 | ||||
| Sponsors: | Jeffrey J. Feil; Lloyd Goldman | Title Vesting: | Fee | ||||
Mortgage Rate(1): | 4.306% | Property Manager: | Self-managed | ||||
| Note Date: | July 1, 2014 | 3rd Most Recent Occupancy (As of): | 97.9% (12/31/2011) | ||||
| Anticipated Repayment Date: | NAP | 2nd Most Recent Occupancy (As of): | 97.9% (12/31/2012) | ||||
| Maturity Date: | July 6, 2024 | Most Recent Occupancy (As of): | 100.0% (12/31/2013) | ||||
| IO Period: | 60 months | Current Occupancy (As of): | 100.0% (6/2/2014) | ||||
| Loan Term (Original): | 120 months | ||||||
| Seasoning: | 1 month | Underwriting and Financial Information: | |||||
| Amortization Term (Original): | 360 months | ||||||
| Loan Amortization Type: | Interest-only, Amortizing Balloon | 3rd Most Recent NOI (As of): | $11,221,582 (12/30/2011) | ||||
| Interest Accrual Method: | Actual/360 | 2nd Most Recent NOI (As of): | $14,080,184 (12/30/2012) | ||||
| Call Protection: | L(25),D(91),O(4) | Most Recent NOI (As of): | $14,045,381 (12/30/2013) | ||||
| Lockbox Type: | Hard/Upfront Cash Management | ||||||
Additional Debt(1)(2): | Yes | ||||||
Additional Debt Type(1)(2): | Pari Passu and Future Mezzanine | U/W Revenues: | $26,187,130 | ||||
| U/W Expenses: | $9,712,945 | ||||||
U/W NOI(4): | $16,474,185 | ||||||
Escrows and Reserves(3): | U/W NCF(4): | $15,235,302 | |||||
U/W NOI DSCR(1): | 1.53x | ||||||
Type: | Initial | Monthly | Cap (If Any) | U/W NCF DSCR(1): | 1.41x | ||
| Taxes | $0 | $161,995 | NAP | U/W NOI Debt Yield(1): | 9.2% | ||
| Insurance | $0 | $47,399 | NAP | U/W NCF Debt Yield(1): | 8.5% | ||
| Replacement Reserves | $0 | $17,207 | $825,921 | As-Is Appraised Value: | $260,000,000 | ||
| TI/LC Reserve | $0 | $86,034 | $3,871,507 | As-Is Appraisal Valuation Date: | June 10, 2014 | ||
| NYC Department of Design & Construction TI/LC Reserve | $12,699,423 | $0 | NAP | Cut-off Date LTV Ratio(1): | 69.2% | ||
| NYC Department of Design & Construction Free Rent Reserve | $289,088 | $0 | NAP | LTV Ratio at Maturity or ARD(1): | 63.2% | ||
| (1) | The Queens Atrium Loan Combination, totalling $180,000,000, is comprised of two pari passu notes (Notes A-1 and A-2). The non-controlling Note A-2 had an original balance of $90,000,000, has an outstanding principal balance of $90,000,000 as of the Cut-off Date and will be contributed to the WFRBS 2014-C21 Trust. The controlling Note A-1 had an original principal balance of $90,000,000 and is expected to be contributed to a future trust. All statistical information related to balances per square foot, loan-to-value ratios, debt service coverage ratios and debt yields are based on the Queens Atrium Loan Combination, taking into account the blended interest rate as described in “The Mortgage Loan” section. |
| (2) | See “Subordinate and Mezzanine Indebtedness” section. |
| (3) | See “Escrows” section. |
| (4) | See “Cash Flow Analysis” section. |
The Mortgage Loan. The mortgage loan (the “Queens Atrium Loan Combination”) is evidenced by two pari passu promissory notes (Notes A-1 and A-2) secured by a first mortgage encumbering two adjacent office buildings located in Long Island City, New York (the “Queens Atrium Property”). The Queens Atrium Loan Combination was co-originated on July 1, 2014 by Wells Fargo Bank, National Association and Barclays Bank PLC. The Queens Atrium Loan Combination had an original principal balance of $180,000,000, has an outstanding principal balance as of the Cut-off Date of $180,000,000 and accrues interest at a blended interest rate of 4.381% per annum (Notes A-1 and A-2 accrue interest at interest rates of 4.456% and 4.306% per annum, respectively). The Queens Atrium Loan Combination had an initial term of 120 months, has a remaining term of 119 months as of the Cut-off Date and requires payments of interest-only for the first 60 payments following origination and, thereafter, requires payments of principal and interest based on a 30-year amortization schedule. The Queens Atrium Loan Combination matures on July 6, 2024. See “Description of the Mortgage Pool—Additional Indebtedness—The Loan Combinations—The Queens Atrium Loan Combination” and “The Pooling and Servicing Agreement—Servicing of the Loan Combinations” in the Free Writing Prospectus.
Note A-2, which represents the non-controlling interest in the Queens Atrium Loan Combination and will be contributed to the WFRBS 2014-C21 Trust, had an original principal balance of $90,000,000 and has an outstanding principal balance as of the Cut-off Date of $90,000,000. Note A-1 (the “Queens Atrium Companion Loan”), which is expected to be contributed to a future trust, had
THE INFORMATION IN THIS STRUCTURAL AND COLLATERAL TERM SHEET IS NOT COMPLETE AND MAY BE AMENDED PRIOR TO THE TIME OF SALE. THIS TERM SHEET IS NOT AN OFFER TO SELL THESE SECURITIES AND IT IS NOT A SOLICITATION OF AN OFFER TO BUY THESE SECURITIES IN ANY JURISDICTION WHERE THE OFFER OR SALE IS NOT PERMITTED.
38
| QUEENS ATRIUM |
an original principal balance of $90,000,000 and represents the controlling interest in the Queens Atrium Loan Combination. The lender provides no assurance that Note A-1 will not be split further.
Following the lockout period, the borrower has the right to defease the Queens Atrium Loan Combination in whole, but not in part, on any date before April 6, 2024. In addition, the Queens Atrium Loan Combination is prepayable without penalty on or after April 6, 2024.
Sources and Uses
| Sources | Uses | ||||||||
| Original loan combination amount | $180,000,000 | 100.0% | Loan payoff(1) | $108,487,368 | 60.3 | % | |||
| Reserves | 12,988,511 | 7.2 | |||||||
| Closing costs | 4,299,513 | 2.4 | |||||||
| Return of equity | 54,224,609 | 30.1 | |||||||
| Total Sources | $180,000,000 | 100.0% | Total Uses | $180,000,000 | 100.0 | % |
| (1) | The Queens Atrium Property was previously securitized in BACM 2005-3. The loan payoff represents a $69.4 million trust balance and $39.1 million of mezzanine debt. |
The Property. The Queens Atrium Property comprises two adjacent, class B office buildings (30-20 Thomson Avenue and 30-30 Thomson Avenue) containing 1,032,402 square feet in aggregate and located in Long Island City, New York. Situated on two separate blocks that are connected via a sky bridge, the Queens Atrium Property was originally constructed in 1914, converted to office use in the 1990s and renovated in 1986, 2010 and 2011. The 30-30 Thomson Avenue building is a six-story, 565,820 square foot office building that is 100.0% occupied by the New York City (“NYC”) School Construction Authority, the NYC Department of Design and Construction, and the NYC Department of Transportation. The 30-20 Thomson Avenue building is an eight-story, 466,582 square foot office building that is primarily operated as classroom space and is 100.0% occupied by The City University of New York, NYC School Construction Authority and the NYC Board of Education (operated as Frank Sinatra High School). Five New York City agencies comprise approximately 98.7% of the net rentable area and 98.8% of the underwritten base rent, and the leases do not contain appropriation-based termination options (but do contain contraction options, as described in the “Major Tenants” section). The Queens Atrium Property contains 120 surface parking spaces. As of June 2, 2014, the Queens Atrium Property was 100.0% occupied by eight tenants.
THE INFORMATION IN THIS STRUCTURAL AND COLLATERAL TERM SHEET IS NOT COMPLETE AND MAY BE AMENDED PRIOR TO THE TIME OF SALE. THIS TERM SHEET IS NOT AN OFFER TO SELL THESE SECURITIES AND IT IS NOT A SOLICITATION OF AN OFFER TO BUY THESE SECURITIES IN ANY JURISDICTION WHERE THE OFFER OR SALE IS NOT PERMITTED.
39
| QUEENS ATRIUM |
The following table presents certain information relating to the tenancy at the Queens Atrium Property:
Major Tenants
| Tenant Name | Credit Rating (Fitch/Moody’s /S&P)(1) | Tenant NRSF | % of NRSF | Annual U/W Base Rent PSF | Annual U/W Base Rent | % of Total Annual U/W Base Rent | Lease Expiration Date | ||||
| Major Tenants | |||||||||||
| NYC School Construction Authority | AA/Aa2/AA | 423,450 | 41.0% | $20.35(2) | $8,618,462(2) | 35.7% | Various(2)(3) | ||||
| NYC Department of Design & Construction | AA/Aa2/AA | 231,819 | 22.5% | $28.80(4) | $6,677,115(4) | 27.6% | 1/31/2029(5) | ||||
| The City University of New York | AA/Aa2/AA | 192,051 | 18.6% | $25.84 | $4,962,703 | 20.5% | 4/30/2020 | ||||
| NYC Board of Education | AA/Aa2/AA | 122,320 | 11.8% | $18.41 | $2,251,660 | 9.3% | 2/18/2019 | ||||
| NYC Department of Transportation | AA/Aa2/AA | 49,669 | 4.8% | $27.50 | $1,365,902 | 5.7% | MTM(6) | ||||
| Total Major Tenants | 1,019,309 | 98.7% | $23.42 | $23,875,842 | 98.8% | ||||||
| Non-Major Tenants | 13,093 | 1.3% | $22.31 | $292,061 | 1.2% | ||||||
| Occupied Collateral Total | 1,032,402 | 100.0% | $23.41 | $24,167,903 | 100.0% | ||||||
| Vacant Space | 0 | 0.0% | |||||||||
| Collateral Total | 1,032,402 | 100.0% | |||||||||
| (1) | Certain ratings are those of the parent company whether or not the parent guarantees the lease. |
| (2) | NYC School Construction Authority occupies two suites: 149,543 square feet (14.5% of the NRSF and 11.3% of Annual U/W Base Rent) with an Annual U/W Base Rent of $18.24 PSF and a lease expiration date of April 30, 2020; and 273,907 square feet (26.5% of NRSF and 24.4% of Annual U/W Base Rent) with an Annual U/W Base Rent of $21.51 PSF and a lease expiration date of September 30, 2021. The Annual U/W Base Rent and Annual U/W Base Rent PSF for the 149,543 square foot space reflects a $2.00 PSF contractual rent bump on May 1, 2019. |
| (3) | NYC School Construction Authority has the ongoing right to surrender up to 51,790 square feet (but not less than 18,000 square feet) of its leased space with 180 days notice commencing September 1, 2016. NYC School Construction Authority also has the right to surrender 5,599 square feet of its leased space at any time with 30 days notice. |
| (4) | The Annual U/W Base Rent PSF and Annual U/W Base Rent for NYC Department of Design & Construction represent the tenant’s average rent over the loan term. The tenant’s current in-place rent is $26.99 PSF. NYC Department of Design & Construction is not currently in occupancy or paying rent on their 21,628 square foot (2.1% of NRSF) expansion space. After taking possession and occupancy of the space, the tenant will have a six month rent abatement period, for which an escrow of $289,088 was collected at closing. |
| (5) | NYC Department of Design & Construction has the option to surrender up to 20,000 square feet of its leased space with 12 months’ notice on January 31, 2019 or January 31, 2024 only. |
| (6) | NYC Department of Transportation’s lease expired on April 4, 2014 and they are occupying the space on a month-to-month basis as a lease renewal is being negotiated with the borrower. |
The following table presents certain information relating to the lease rollover schedule at the Queens Atrium Property:
Lease Expiration Schedule(1)(2)
Year Ending December 31, | No. of Leases Expiring | Expiring NRSF | % of Total NRSF | Cumulative Expiring NRSF | Cumulative % of Total NRSF | Annual U/W Base Rent | Annual U/W Base Rent PSF | ||||||
| MTM | 2 | 50,330 | 4.9% | 50,330 | 4.9% | $1,365,902 | $27.14 | ||||||
| 2014 | 0 | 0 | 0.0% | 50,330 | 4.9% | $0 | $0.00 | ||||||
| 2015 | 1 | 9,750 | 0.9% | 60,080 | 5.8% | $209,655 | $21.50 | ||||||
| 2016 | 1 | 2,007 | 0.2% | 62,087 | 6.0% | $38,133 | $19.00 | ||||||
| 2017 | 0 | 0 | 0.0% | 62,087 | 6.0% | $0 | $0.00 | ||||||
| 2018 | 0 | 0 | 0.0% | 62,087 | 6.0% | $0 | $0.00 | ||||||
| 2019 | 1 | 122,320 | 11.8% | 184,407 | 17.9% | $2,251,660 | $18.41 | ||||||
| 2020 | 3 | 341,594 | 33.1% | 526,001 | 50.9% | $7,690,007 | $22.51 | ||||||
| 2021 | 2 | 274,582 | 26.6% | 800,583 | 77.5% | $5,935,431 | $21.62 | ||||||
| 2022 | 0 | 0 | 0.0% | 800,583 | 77.5% | $0 | $0.00 | ||||||
| 2023 | 0 | 0 | 0.0% | 800,583 | 77.5% | $0 | $0.00 | ||||||
| 2024 | 0 | 0 | 0.0% | 800,583 | 77.5% | $0 | $0.00 | ||||||
| Thereafter | 1 | 231,819 | 22.5% | 1,032,402 | 100.0% | $6,677,115 | $28.80 | ||||||
| Vacant | 0 | 0 | 0.0% | 1,032,402 | 100.0% | $0 | $0.00 | ||||||
| Total/Weighted Average | 11(3) | 1,032,402 | 100.0% | $24,167,903 | $23.41 |
| (1) | Information obtained from the underwritten rent roll. |
| (2) | Certain tenants may have lease termination or contraction options that are exercisable prior to the originally stated expiration date of the subject lease and that are not considered in the Lease Expiration Schedule. |
| (3) | Multiple tenants operate under more than one lease. There are eight tenants and 11 leases. |
THE INFORMATION IN THIS STRUCTURAL AND COLLATERAL TERM SHEET IS NOT COMPLETE AND MAY BE AMENDED PRIOR TO THE TIME OF SALE. THIS TERM SHEET IS NOT AN OFFER TO SELL THESE SECURITIES AND IT IS NOT A SOLICITATION OF AN OFFER TO BUY THESE SECURITIES IN ANY JURISDICTION WHERE THE OFFER OR SALE IS NOT PERMITTED.
40
| QUEENS ATRIUM |
The following table presents historical occupancy percentages at the Queens Atrium Property:
Historical Occupancy
12/31/2011(1) | 12/31/2012(1) | 12/31/2013(1) | 6/2/2014(2) | |||
| 97.9% | 97.9% | 100.0% | 100.0% |
| (1) | Information obtained from the borrower. |
| (2) | Information obtained from the underwritten rent roll. |
Operating History and Underwritten Net Cash Flow. The following table presents certain information relating to the historical operating performance and the Underwritten Net Cash Flow at the Queens Atrium Property:
Cash Flow Analysis
| 2011 | 2012 | 2013 | U/W | U/W $ per SF | ||||||
| Base Rent | $19,648,811 | $20,664,784 | $20,980,152(1) | $24,167,903(1) | $23.41 | |||||
| Grossed Up Vacant Space | 0 | 0 | 0 | 0 | 0.00 | |||||
| Total Reimbursables | 2,016,165 | 1,650,041 | 2,102,266 | 2,462,038 | 2.38 | |||||
| Other Income | 218,917 | 253,417 | 200,309 | 371,604 | 0.36 | |||||
| Less Vacancy & Credit Loss | 0 | 0 | 0 | (814,415)(2) | (0.79) | |||||
| Effective Gross Income | $21,883,893 | $22,568,242 | $23,282,727 | $26,187,130 | $25.37 | |||||
| Total Operating Expenses | $10,662,311 | $8,488,058 | $9,237,346(3) | $9,712,945(3) | $9.41 | |||||
| Net Operating Income | $11,221,582 | $14,080,184(4) | $14,045,381 | $16,474,185 | $15.96 | |||||
| TI/LC | 0 | 0 | 0 | 1,032,402 | 1.00 | |||||
| Capital Expenditures | 0 | 0 | 0 | 206,480 | 0.20 | |||||
| Net Cash Flow | $11,221,582 | $14,080,184 | $14,045,381 | $15,235,302 | $14.76 | |||||
NOI DSCR(5) | 1.04x | 1.30x | 1.30x | 1.53x | ||||||
NCF DSCR(5) | 1.04x | 1.30x | 1.30x | 1.41x | ||||||
NOI DY(5) | 6.2% | 7.8% | 7.8% | 9.2% | ||||||
NCF DY(5) | 6.2% | 7.8% | 7.8% | 8.5% | ||||||
| (1) | The increase in Base Rent from 2013 to U/W is primarily due to the expansion of the NYC Department of Design & Construction ($503,498) and a rental increase on their existing space ($1,853,654), along with approximately $694,188 in scheduled rent increases and rent averaging. |
| (2) | The underwritten economic vacancy is 3.4%. The Queens Atrium Property was 100.0% physically occupied as of June 2, 2014. |
| (3) | The Queens Atrium Property benefits from three separate Industrial and Commercial Incentive Programs (“ICIPs”), which results in a reduced property tax expense. The property tax expense as of year-end 2013 was $1,840,312. The ICIPs expire in 2033 and will be gradually phased out beginning in the 2014/2015 tax year. The U/W property tax expense of $1,943,940 is based on the abated tax expense for the 2014/2015 tax year. The taxes are projected to increase from the current level of $1.9 million to $5.1 million by the time the Queens Atrium Loan Combination matures. According to the leases, all tax increases may be passed through to the tenants (except for the NYC Department of Transportation) at the Queens Atrium Property. |
| (4) | The increase in Net Operating Income from 2011 to 2012 is due to a large one-time expense in 2011 for a payment to the NYC School Construction Authority for overcharges in real estate tax reimbursements between the 2001/2002 and 2011/2012 tax years. |
| (5) | DSCRs and debt yields are based on the Queens Atrium Loan Combination. |
Appraisal. As of the appraisal valuation date of June 10, 2014, the Queens Atrium Property had an “as-is” appraised value of $260,000,000.
Environmental Matters. According to a Phase I environmental site assessment dated April 28, 2014, two recognized environmental conditions (“RECs”) exist at the Queens Atrium Property. The first REC is related to two underground storage tanks (“USTs”) that were reportedly removed from each of the 30-20 Thomson Avenue and 30-30 Thomson Avenue properties in 1970 as well as two USTs that were reportedly removed from beneath the sidewalk on the north side of the 30-30 Thomson Avenue property in 1985; however, no record of the USTs was available. Due to the lack of documentation, the Phase I recommended that the presence or absence of USTs at the Queens Atrium Property should be determined via ground penetrating radar. Further, if USTs are detected, subsurface sampling should be performed to determine the presence of potential contamination. The second REC is related to the historical use of the 30-20 Thomson Avenue property as a filling station and auto repair facility, which contained an oil fuel tank, between 1970 and 1980. The auto repair facility building was demolished in 1985; however, no information regarding the operation or closure of any USTs associated with the filling station and auto repair facility was identified in state or local regulatory files. Due to the lack of documentation and prior subsurface investigations, the potential that USTs remain in the ground was considered a REC.
An environmental consultant estimated that potential remediation costs associated with the aforementioned RECs could range from $0 to $500,000. In lieu of additional investigation, the borrower obtained a $2.0 million environmental policy with a 10-year term and a three-year tail. See “Description of the Mortgage Pool—Assessments of Property Value and Condition—Environmental Insurance” in the Free Writing Prospectus.
Market Overview and Competition. The Queens Atrium Property is situated on two entire city blocks bounded by Thomson Avenue to the north, 47th Avenue to the south, 30th Street to the west and 31st Street to the east in the Long Island City neighborhood of Queens, New York, less than two miles east of Manhattan and approximately five miles southwest of LaGuardia Airport. Long Island City is located in the northwest portion of Queens County and comprises three square miles. The Queens
THE INFORMATION IN THIS STRUCTURAL AND COLLATERAL TERM SHEET IS NOT COMPLETE AND MAY BE AMENDED PRIOR TO THE TIME OF SALE. THIS TERM SHEET IS NOT AN OFFER TO SELL THESE SECURITIES AND IT IS NOT A SOLICITATION OF AN OFFER TO BUY THESE SECURITIES IN ANY JURISDICTION WHERE THE OFFER OR SALE IS NOT PERMITTED.
41
| QUEENS ATRIUM |
Atrium Property is located in a mixed-use area surrounded by office, industrial and office/school uses. Historically, Long Island City has been a manufacturing and industrial hub of the New York City area, but the area has been undergoing revitalization since the early 2000’s when a rezoning plan resulted in an increase in commercial and residential construction. Changes included the development of office, educational and cultural facilities such as the Citibank Building, LaGuardia Community College and movie and television production studios. Long Island City is accessible via the Long Island Expressway, which is located at the southern end of Long Island City, and the Brooklyn Queens Expressway, which is located along the eastern end of Long Island City. Additionally, Queens Boulevard, Northern Boulevard and Hunters Point Avenue provide access into Long Island City. Access to Manhattan from Long Island City is provided by the Queensboro Bridge and the Queens Midtown Tunnel. The Queens Atrium Property is also accessible by the 7, E, F, V, G, N, R and W subway train lines, and the Queensboro Plaza subway station is located approximately one-half mile northwest of the Queens Atrium Property.
According to a third party market research report, the Queens Atrium Property is located within the Northwest Queens office submarket. As of the first quarter of 2014, the submarket had a total inventory of 124 class B office buildings comprising 5.4 million square feet. The class B office submarket reported a vacancy rate of 6.4%, and class B office properties over 100,000 square feet reported a vacancy rate of 3.1%. The appraiser concluded to a market rent of $28.87 per square foot, modified gross, for the Queens Atrium Property.
The following table presents certain information relating to comparable properties to the Queens Atrium Property:
Competitive Set(1)
Queens Atrium (Subject) | 1 Hunters Point | NE Court Square I | Court Square Center | The Center Building | City View Plaza | Silks Building | |
| Location | Long Island City, NY | Long Island City, NY | Long Island City, NY | Long Island City, NY | Long Island City, NY | Long Island City, NY | Long Island City, NY |
| Distance from Subject | -- | 0.6 miles | 0.8 miles | 0.8 miles | 0.9 miles | 1.1 miles | 1.4 miles |
| Property Type | Office | Office | Office | Office | Office | Office | Office |
| Year Built/Renovated | 1914/2011 | 1987/2004 | 1985 | 1920/1989 | 1970 | 1914/2001 | 1930/2004 |
| Stories | 6 & 8 | 10 | 52 | 6 | 8 | 5 | 4 |
| Total GLA | 1,032,402 SF | 200,000 SF | 1,485,000 SF | 130,158 SF | 444,606 SF | 193,034 | 113,320 SF |
| Total Occupancy | 100% | 87% | 100% | 100% | 98% | 100% | 94% |
| (1) | Information obtained from the appraisal and a third party market research report. |
The Borrower. The borrower is Celtic Holdings, LLC, a single purpose entity whose managing member has two independent directors. Legal counsel to the borrower delivered a non-consolidation opinion in connection with the origination of the Queens Atrium Loan Combination. Jeffrey J. Feil and Lloyd Goldman are the guarantors of certain nonrecourse carveouts under the Queens Atrium Loan Combination.
The Sponsors. The loan sponsors are Jeffrey J. Feil and Lloyd Goldman. Jeffrey Feil is the Chief Executive Officer of the Feil Organization, a privately held full service real estate company based in New York, New York. The Feil Organization owns, develops and manages over 5,000 residential units and 26.0 million square feet of retail, commercial and industrial properties. Lloyd Goldman is the founder of BLDG Management, a private real estate company that manages over $2.0 billion of assets. Jeffrey J. Feil is involved in ongoing litigation with various family member and shareholders. See “Description of the Mortgage Pool—Litigation Considerations” in the Free Writing Prospectus.
Escrows. The loan documents provide for upfront reserves in the amount of $12,699,423 for capital improvements, base building improvements, tenant improvements and leasing commissions (“TI/LC”) associated with the NYC Department of Design & Construction space and $289,088 for free rent associated with the NYC Department of Design & Construction space. The loan documents require monthly deposits of $161,995 for taxes, $47,399 for insurance, $17,207 for replacement reserves (subject to a cap of $825,921) and $86,034 for general TI/LCs (subject to a cap of $3,871,507).
Lockbox and Cash Management. The Queens Atrium Loan Combination requires a lender-controlled lockbox account, which is already in place, and that the borrower direct tenants to pay their rents directly into such lockbox account. The loan documents also require that all rents received by the borrower or the property manager be deposited into the lockbox account within one business day of receipt. Funds are then swept to a cash management account controlled by the lender and prior to the occurrence of a Cash Trap Event Period (as defined below), all excess funds after application in accordance with the loan documents are distributed to the borrower’s operating account. During a Cash Trap Event Period, all excess cash flow is retained in the cash management account.
A “Cash Trap Event Period” will commence upon the earlier of (i) the occurrence and continuance of an event of default; (ii) the net operating income debt yield falling below 7.5% at the end of any calendar quarter; or (iii) (a) any of the NYC Board of Education, the City University of New York or the NYC School Construction Authority (collectively the “Sweep Tenants”) terminating its lease; (b) any Sweep Tenant’s lease being terminated, cancelled or no longer in full force and effect; or (c) any of the Sweep Tenants failing to provide notice of lease renewal prior to the notice date in the lease or 12 months prior to lease expiration, whichever is
THE INFORMATION IN THIS STRUCTURAL AND COLLATERAL TERM SHEET IS NOT COMPLETE AND MAY BE AMENDED PRIOR TO THE TIME OF SALE. THIS TERM SHEET IS NOT AN OFFER TO SELL THESE SECURITIES AND IT IS NOT A SOLICITATION OF AN OFFER TO BUY THESE SECURITIES IN ANY JURISDICTION WHERE THE OFFER OR SALE IS NOT PERMITTED.
42
| QUEENS ATRIUM |
later. A Cash Trap Event Period will be cured, with regard to clause (i), upon the cure of such event of default; with regard to clause (ii), upon the net operating income debt yield being equal to or greater than 7.5% for two consecutive calendar quarters; or with regard to clause (iii), upon the borrower signing a lease with a replacement tenant for the applicable space with such tenant paying full unabated rent and all related tenant improvements and allowances having been completed and paid in full.
In addition, the borrower has the right to cure a Cash Trap Event Period caused solely in connection with clause (ii) by posting cash or a letter of credit in an amount, which, if applied to reduce the outstanding principal balance of the Queens Atrium Loan Combination when combined with amounts on deposit in the cash management and reserve accounts, would result in a net operating income debt yield of at least 7.5%.
In the event the Cash Trap Event Period is caused solely in connection with clause (iii), the borrower’s obligation to make tenant deposits will be limited to $15.00 per square foot of net rentable square feet for each applicable Sweep Tenant.
Property Management. The Queens Atrium Property is managed by an affiliate of the borrower.
Assumption. The borrower has the right to transfer the Queens Atrium Property provided that certain conditions are satisfied, including (i) no event of default has occurred and is continuing; (ii) either the transferee is a qualified transferee as described in the loan documents or the lender reasonably determines that the proposed transferee and guarantor satisfy the lender’s credit review and underwriting standards, taking into consideration transferee experience, financial strength and general business standing; and (iii) the lender has received confirmation from DBRS, Moody’s and Morningstar and each rating agency rating any securities backed by the Queens Atrium Companion Loan that such assumption will not result in a downgrade, withdrawal or qualification of the respective ratings assigned to the Series 2014-C21 Certificates.
Partial Release. Not permitted.
Real Estate Substitution. Not permitted.
Subordinate and Mezzanine Indebtedness. After July 1, 2017, the borrower has the right to incur mezzanine financing subject to the satisfaction of certain conditions including (i) the execution of an intercreditor agreement in form and substance acceptable to lender and each of DBRS, Moody’s and Morningstar and each rating agency rating any securities backed by the Queens Atrium Companion Loan; (ii) the combined loan-to-value ratio is not greater than 70.0%; (iii) the combined net operating income debt yield is not less than 8.4%; (iv) the combined debt service coverage ratio is not less than 1.24x; and (v) receipt of rating agency confirmation from DBRS, Moody’s and Morningstar that the mezzanine financing will not result in a downgrade, withdrawal or qualification of the respective ratings assigned to the Series 2014-C21 Certificates, and similar confirmations with respect to the ratings of any securities backed by the Queens Atrium Companion Loan.
Terrorism Insurance. The loan documents require that the “all risk” insurance policy required to be maintained by the borrower provides coverage for terrorism in an amount equal to the full replacement cost of the Queens Atrium Property, provided however, that the borrower will not be required to spend more than 200% of the cost of property coverage and business interruption coverage in the event the Terrorism Risk Insurance Act or a similar government backstop is no longer in effect. The loan documents also require business interruption insurance covering no less than the 12-month period following the occurrence of a casualty event, together with a six-month extended period of indemnity.
THE INFORMATION IN THIS STRUCTURAL AND COLLATERAL TERM SHEET IS NOT COMPLETE AND MAY BE AMENDED PRIOR TO THE TIME OF SALE. THIS TERM SHEET IS NOT AN OFFER TO SELL THESE SECURITIES AND IT IS NOT A SOLICITATION OF AN OFFER TO BUY THESE SECURITIES IN ANY JURISDICTION WHERE THE OFFER OR SALE IS NOT PERMITTED.
43
| SHERATON AUSTIN |

THE INFORMATION IN THIS STRUCTURAL AND COLLATERAL TERM SHEET IS NOT COMPLETE AND MAY BE AMENDED PRIOR TO THE TIME OF SALE. THIS TERM SHEET IS NOT AN OFFER TO SELL THESE SECURITIES AND IT IS NOT A SOLICITATION OF AN OFFER TO BUY THESE SECURITIES IN ANY JURISDICTION WHERE THE OFFER OR SALE IS NOT PERMITTED.
44
| SHERATON AUSTIN |

THE INFORMATION IN THIS STRUCTURAL AND COLLATERAL TERM SHEET IS NOT COMPLETE AND MAY BE AMENDED PRIOR TO THE TIME OF SALE. THIS TERM SHEET IS NOT AN OFFER TO SELL THESE SECURITIES AND IT IS NOT A SOLICITATION OF AN OFFER TO BUY THESE SECURITIES IN ANY JURISDICTION WHERE THE OFFER OR SALE IS NOT PERMITTED.
45
| No. 3 – Sheraton Austin |
| Loan Information | Property Information | ||||||
| Mortgage Loan Seller: | Wells Fargo Bank, National Association | Single Asset/Portfolio: | Single Asset | ||||
Credit Assessment (DBRS/Moody’s/Morningstar): | NR/NR/NR | Property Type: | Hospitality | ||||
| Original Principal Balance: | $67,000,000 | Specific Property Type: | Full Service | ||||
| Cut-off Date Principal Balance: | $67,000,000 | Location: | Austin, TX | ||||
| % of Initial Pool Balance: | 4.7% | Size: | 365 Rooms | ||||
| Loan Purpose: | Acquisition | Cut-off Date Principal Balance Per Room: | $183,562 | ||||
| Borrower Name: | CWI-JMI Austin Capitol Hotel, LLC | Year Built/Renovated: | 1988/2013 | ||||
| Sponsor: | Carey Watermark Investors, Inc.; JMI Realty, LLC | Title Vesting: | Fee | ||||
| Mortgage Rate: | 3.960% | Property Manager: | Merritt Hospitality, LLC | ||||
| Note Date: | May 29, 2014 | 3rd Most Recent Occupancy (As of): | 79.2% (12/31/2011) | ||||
| Anticipated Repayment Date: | NAP | 2nd Most Recent Occupancy (As of): | 82.8% (12/31/2012) | ||||
| Maturity Date: | June 1, 2019 | Most Recent Occupancy (As of): | 77.0% (12/31/2013) | ||||
| IO Period: | 60 months | Current Occupancy (As of): | 76.6% (3/31/2014) | ||||
| Loan Term (Original): | 60 months | ||||||
| Seasoning: | 2 months | Underwriting and Financial Information: | |||||
| Amortization Term (Original): | NAP | ||||||
| Loan Amortization Type: | Interest-only, Balloon | 3rd Most Recent NOI (As of): | $8,509,975 (12/31/2012) | ||||
| Interest Accrual Method: | Actual/360 | 2nd Most Recent NOI (As of): | $9,638,119 (12/31/2013) | ||||
| Call Protection: | L(26),D(30),O(4) | Most Recent NOI (As of): | $9,412,469 (TTM 3/31/2014) | ||||
| Lockbox Type: | Hard/Springing Cash Management | ||||||
| Additional Debt: | None | U/W Revenues: | $23,746,524 | ||||
| Additional Debt Type: | NAP | U/W Expenses: | $14,650,821 | ||||
| U/W NOI: | $9,095,703 | ||||||
| U/W NCF: | $8,145,842 | ||||||
| U/W NOI DSCR: | 3.38x | ||||||
Escrows and Reserves(1): | U/W NCF DSCR: | 3.03x | |||||
| U/W NOI Debt Yield: | 13.6% | ||||||
Type: | Initial | Monthly | Cap (If Any) | U/W NCF Debt Yield: | 12.2% | ||
| Taxes | $591,530 | $133,571 | NAP | As-Is Appraised Value(2): | $108,400,000 | ||
| Insurance | $2,872 | Springing | NAP | As-Is Appraisal Valuation Date(2): | May 9, 2014 | ||
| FF&E Reserve | $1,104,500 | $79,155 | NAP | Cut-off Date LTV Ratio(2): | 61.8% | ||
| PIP Reserve | $5,395,500 | Springing | NAP | LTV Ratio at Maturity or ARD(2): | 61.8% | ||
| (1) | See “Escrows” section. |
| (2) | The appraiser concluded to an “as if complete” value of $113,800,000, which assumes that the PIP Stage 1 work is complete. Based on the “as if complete” appraised value, the Cut-off Date LTV Ratio and LTV Ratio at Maturity would be 58.9%. The appraiser also concluded to an “as stabilized” value of $125,000,000, which assumes that the Sheraton Austin Property has stabilized as of June 1, 2018. Based on the “as stabilized” appraised value, the Cut-off Date LTV Ratio and LTV Ratio at Maturity would be 53.6%. |
The Mortgage Loan. The mortgage loan (the “Sheraton Austin Mortgage Loan”) is evidenced by a single promissory note that is secured by a first mortgage encumbering the fee interest in a full service hotel located in Austin, Texas (the “Sheraton Austin Property”). The Sheraton Austin Mortgage Loan was originated on May 29, 2014 by Wells Fargo Bank, National Association. The Sheraton Austin Mortgage Loan had an original principal balance of $67,000,000, has an outstanding principal balance as of the Cut-off Date of $67,000,000 and accrues interest at an interest rate of 3.960% per annum. The Sheraton Austin Mortgage Loan had an initial term of 60 months, has a remaining term of 58 months as of the Cut-off Date and requires interest-only payments through the term of the Sheraton Austin Mortgage Loan. The Sheraton Austin Mortgage Loan matures on June 1, 2019.
Following the lockout period, the borrower has the right to defease the Sheraton Austin Mortgage Loan in whole, but not in part, on any date before March 1, 2019. In addition, the Sheraton Austin Mortgage Loan is prepayable without penalty on or after March 1, 2019.
Sources and Uses
| Sources | Uses | |||||||
| Original loan amount | $67,000,000 | 62.4% | Purchase price | $99,000,000 | 92.3% | |||
| Sponsor’s new cash contribution | 40,301,476 | 37.6 | Reserves | 7,094,402 | 6.6 | |||
| Closing costs | 1,207,074 | 1.1 | ||||||
| Total Sources | $107,301,476 | 100.0% | Total Uses | $107,301,476 | 100.0% |
THE INFORMATION IN THIS STRUCTURAL AND COLLATERAL TERM SHEET IS NOT COMPLETE AND MAY BE AMENDED PRIOR TO THE TIME OF SALE. THIS TERM SHEET IS NOT AN OFFER TO SELL THESE SECURITIES AND IT IS NOT A SOLICITATION OF AN OFFER TO BUY THESE SECURITIES IN ANY JURISDICTION WHERE THE OFFER OR SALE IS NOT PERMITTED.
46
| SHERATON AUSTIN |
The Property. The Sheraton Austin Property is a 365-room, 16-story, full service hotel located in the central business district of Austin, Texas, less than a half-mile from the Texas State Capitol building. The Sheraton Austin Property was built in 1988 and originally opened as a Marriott hotel. The Sheraton Austin Property underwent a $16.6 million ($45,479 per key) renovation in 2007-2008 when it was converted from a Marriott hotel to a Sheraton hotel, as well as an additional $1.6 million ($4,384 per key) guestroom renovation in 2013. The Sheraton Austin Property comprises 208 king rooms, 153 double rooms, and four one-bedroom suites. Amenities at the Sheraton Austin Property include a full service restaurant that serves breakfast, lunch and dinner, lobby bar, coffee bar, fitness center, indoor/outdoor swimming pool, indoor whirlpool, club lounge, business center, and gift shop. The Sheraton Austin Property also has six meeting rooms totaling 4,953 square feet, a 9,600 square foot ballroom, and a 2,700 square foot third floor terrace with a view of the Texas State Capitol building. The franchise agreement expires in January 2027.
The borrower plans to complete an approximate $8.5 million ($23,164 per room) Property Improvement Plan (“PIP”) in two phases as part of the assignment of the franchise agreement. The first phase of the PIP (“PIP Stage 1”) is budgeted at approximately $4.9 million and is expected to be completed by year-end 2015. PIP Stage 1 renovations include improvements to guestroom bathrooms, front desk/lobby area, public restrooms, meeting space, swimming pool area, and parking garage. The second phase of the PIP (“PIP Stage 2”) is budgeted at $3.6 million and is expected to commence in 2018 and be completed by year-end 2018. PIP Stage 2 renovations include guestroom refurbishment consisting of the replacement of carpeting and wall vinyl and the replacement of interior and exterior signage. PIP Stage 1 was reserved for upfront, while PIP Stage 2 will be funded by the FF&E reserve (See “Escrows” section below).
Operating History and Underwritten Net Cash Flow. The following table presents certain information relating to the historical operating performance and the Underwritten Net Cash Flow at the Sheraton Austin Property:
Cash Flow Analysis
| 2011 | 2012 | 2013 | TTM 3/31/2014 | U/W | U/W $ per Room | ||||||||
| Occupancy | 79.2% | 82.8% | 77.0% | 76.6% | 76.6% | ||||||||
| ADR | $134.04 | $145.95 | $166.55 | $169.08 | $169.08 | ||||||||
| RevPAR | $106.15 | $120.91 | $128.31 | $129.43 | $129.43 | ||||||||
| Total Revenue | $20,479,061 | $22,096,924 | $23,833,699 | $23,746,524 | $23,746,524 | $65,059 | |||||||
| Total Department Expenses | 6,616,278 | 6,681,656 | 6,740,029 | 6,745,878 | 6,745,878 | 18,482 | |||||||
| Gross Operating Profit | $13,862,783 | $15,415,268 | $17,093,670 | $17,000,646 | $17,000,646 | $46,577 | |||||||
| Total Undistributed Expenses | 5,347,502 | 5,656,129 | 6,114,031 | 6,202,372 | 6,202,046 | 16,992 | |||||||
| Profit Before Fixed Charges | $8,515,281 | $9,759,139 | $10,979,639 | $10,798,274 | $10,798,600 | $29,585 | |||||||
| Total Fixed Charges | 797,162 | 1,249,164 | 1,341,520 | 1,385,805 | 1,702,897 | 4,665 | |||||||
| Net Operating Income | $7,718,119 | $8,509,975 | $9,638,119 | $9,412,469 | $9,095,703 | $24,920 | |||||||
| FF&E | 808,215 | 883,877 | 953,348 | 949,861 | 949,861 | 2,602 | |||||||
| Net Cash Flow | $6,909,904 | $7,626,098 | $8,684,771 | $8,462,608 | $8,145,842 | $22,317 | |||||||
| NOI DSCR | 2.87x | 3.16x | 3.58x | 3.50x | 3.38x | ||||||||
| NCF DSCR | 2.57x | 2.83x | 3.23x | 3.15x | 3.03x | ||||||||
| NOI DY | 11.5% | 12.7% | 14.4% | 14.0% | 13.6% | ||||||||
| NCF DY | 10.3% | 11.4% | 13.0% | 12.6% | 12.2% | ||||||||
Appraisal. As of the appraisal valuation date of May 9, 2014, the Sheraton Austin Property had an “as-is” appraised value of $108,400,000 and an “as if complete” value of $113,800,000, which assumes that the PIP Stage 1 work is complete. The appraisal also concluded to an “as stabilized” value of $125,000,000 with a valuation date of June 1, 2018.
Environmental Matters. According to the Phase I environmental site assessment dated May 12, 2014, there was no evidence of any recognized environmental conditions at the Sheraton Austin Property.
Market Overview and Competition. The Sheraton Austin Property is located in Austin, Texas along the south side of East 11th Street, bounded by 10th Street to the south and an Interstate 35 access road to the east. The access road provides access to Interstate 35, a major roadway that connects Austin directly to San Antonio to the southwest and the Dallas/Fort Worth area to the northeast. The Sheraton Austin Property is located approximately one-half mile southeast of the Texas State Capitol building and less than one mile south of the University of Texas at Austin, two of the most significant demand generators in the Austin area. The Sheraton Austin Property is also located five blocks north of the 6th Street entertainment district and six blocks north of the Austin Convention Center. The University of Texas recently announced plans for the Dell Medical School, which is to be built two blocks north of the Sheraton Austin Property and is projected to open in 2016.
THE INFORMATION IN THIS STRUCTURAL AND COLLATERAL TERM SHEET IS NOT COMPLETE AND MAY BE AMENDED PRIOR TO THE TIME OF SALE. THIS TERM SHEET IS NOT AN OFFER TO SELL THESE SECURITIES AND IT IS NOT A SOLICITATION OF AN OFFER TO BUY THESE SECURITIES IN ANY JURISDICTION WHERE THE OFFER OR SALE IS NOT PERMITTED.
47
| SHERATON AUSTIN |
The following table presents certain information relating to the Sheraton Austin Property’s competitive set:
Subject and Market Historical Occupancy, ADR and RevPAR(1)
Competitive Set | Sheraton Austin | Penetration Factor | ||||||||||||||||
Year | Occupancy | ADR | RevPAR | Occupancy | ADR | RevPAR | Occupancy | ADR | RevPAR | |||||||||
| 4/30/2014 TTM | 77.3% | $190.40 | $147.25 | 76.3% | $169.62 | $129.44 | 98.7% | 89.1% | 87.9% | |||||||||
| 4/30/2013 TTM | 79.6% | $175.87 | $140.02 | 81.7% | $153.51 | $125.46 | 102.7% | 87.3% | 89.6% | |||||||||
| 4/30/2012 TTM | 78.1% | $160.09 | $125.00 | 80.4% | $136.62 | $109.87 | 103.0% | 85.3% | 87.9% | |||||||||
| (1) | Information obtained from a third party hospitality report dated May 19, 2014. The competitive set includes the following hotels: Radisson Hotel & Suites Austin Downtown, Hyatt Regency Austin, Omni Austin Hotel Downtown and Hilton Austin Convention Center. |
The Borrower. The borrower is CWI-JMI Austin Capitol Hotel, LLC, a Delaware limited liability company and a single purpose entity with one independent director. Legal counsel to the borrower delivered a non-consolidation opinion in connection with the origination of the Sheraton Austin Mortgage Loan. Carey Watermark Investors Incorporated (“CWI”) is the guarantor of certain nonrecourse carveouts under the Sheraton Austin Mortgage Loan.
The Sponsors. The sponsors are CWI and JMI Realty, LLC (“JMI”). CWI is a private non-listed hospitality real estate investment trust that was formed in March 2008 to acquire lodging assets across the United States. CWI’s real estate portfolio is comprised of ownership interests in 22 hotels located in 12 states. JMI is a private real estate investment and development company that was organized in 1992. As of June 2014, JMI managed a real estate investment portfolio valued at approximately $600 million and is currently developing, renovating and seeking to acquire opportunistic real estate investments throughout the United States. Since January 2002, JMI has developed three hotel properties comprising 1,030 rooms and is currently developing three hotels totaling approximately 2,500 rooms.
Escrows. The loan documents provide for upfront escrows in the amount of $591,530 for real estate taxes, $1,104,500 for FF&E and $5,395,500 for a PIP reserve. The loan documents provide for monthly escrows in the amount of $133,571 for real estate taxes and an amount equal to 4% of operating income for the immediately preceding calendar month for FF&E. Commencing October 1, 2017, all funds in the FF&E reserve account will be swept to the PIP reserve account until the earlier of (i) the date on which the funds in the PIP reserve account are equal to 105% of the estimated cost to perform the PIP Stage 2 and (ii) April 1, 2018. On April 1, 2018, the borrower must deposit an amount equal to the PIP Stage 2 Deposit Deficiency (as defined below), if any, into the PIP reserve account.
A “PIP Stage 2 Deposit Deficiency” means an amount equal to 105% of the cost of the PIP Stage 2 minus the sum of (a) the total funds available in the PIP reserve account and (b) six months of FF&E reserve monthly deposits (based on the trailing 12-month period).
Ongoing monthly reserves for insurance are not required as long as (i) no event of default has occurred and is continuing; (ii) the Sheraton Austin Property is covered by an acceptable blanket insurance policy; and (iii) the borrower provides the lender with evidence of renewal of the policies and timely proof of payment of insurance premiums.
Lockbox and Cash Management. The Sheraton Austin Mortgage Loan requires a lender-controlled lockbox account, which is already in place, and that the borrower and property manager cause all receipts payable with respect to the Sheraton Austin Property to be deposited directly into the lockbox account. The loan documents also require all revenues received by the borrower or the property manager to be deposited into the lockbox account within two business days of receipt. Prior to the occurrence of a Cash Trap Event Period (as defined below), all excess funds on deposit in the lockbox account are disbursed to the borrower. During a Cash Trap Event Period, all excess cash flow is swept to a lender-controlled cash management account on a monthly basis.
A “Cash Trap Event Period” will commence upon the earlier of (i) the occurrence and continuance of an event of default or (ii) the amortizing debt service coverage ratio falling below 1.30x at the end of any calendar quarter, with the first test commencing January 1, 2015. A Cash Trap Event Period will expire, with regard to clause (i), upon the cure of such event of default, or with regard to clause (ii), (a) upon the date that the amortizing debt service coverage ratio is equal to or greater than 1.40x for two consecutive calendar quarters or equal to or greater than 1.45x for one calendar quarter or (b) the payment of funds by the borrower into a reserve account or in lieu of posting funds into a reserve account, posting of a letter of credit that will be held as additional security during the loan term, which, if applied to reduce the outstanding principal balance of the loan, the amortizing debt service coverage ratio would be equal to or greater than 1.45x.
Property Management. The Sheraton Austin Property is managed by Merritt Hospitality, LLC.
Assumption. The borrower has the two-time right to transfer the Sheraton Austin Property provided that certain conditions are satisfied, including (i) no event of default has occurred and is continuing; (ii) the lender reasonably determines that the proposed transferee and guarantor satisfy the lender’s credit review and underwriting standards, taking into consideration transferee experience, financial strength and general business standing; and (iii) the lender has received confirmation from DBRS, Moody’s and Morningstar that such assumption will not result in a downgrade, withdrawal or qualification of the respective ratings assigned to the Series 2014-C21 Certificates.
THE INFORMATION IN THIS STRUCTURAL AND COLLATERAL TERM SHEET IS NOT COMPLETE AND MAY BE AMENDED PRIOR TO THE TIME OF SALE. THIS TERM SHEET IS NOT AN OFFER TO SELL THESE SECURITIES AND IT IS NOT A SOLICITATION OF AN OFFER TO BUY THESE SECURITIES IN ANY JURISDICTION WHERE THE OFFER OR SALE IS NOT PERMITTED.
48
| SHERATON AUSTIN |
Partial Release. Not permitted.
Real Estate Substitution. Not permitted.
Subordinate and Mezzanine Indebtedness. Not permitted.
Ground Lease. None.
Terrorism Insurance. The loan documents require that the “all risk” insurance policy required to be maintained by the borrower provide coverage for terrorism in an amount equal to the full replacement cost of the Sheraton Austin Property, as well as business interruption insurance covering no less than the 18-month period following the occurrence of a casualty event, together with a six-month extended period of indemnity.
THE INFORMATION IN THIS STRUCTURAL AND COLLATERAL TERM SHEET IS NOT COMPLETE AND MAY BE AMENDED PRIOR TO THE TIME OF SALE. THIS TERM SHEET IS NOT AN OFFER TO SELL THESE SECURITIES AND IT IS NOT A SOLICITATION OF AN OFFER TO BUY THESE SECURITIES IN ANY JURISDICTION WHERE THE OFFER OR SALE IS NOT PERMITTED.
49
| HIGHLAND PORTFOLIO |
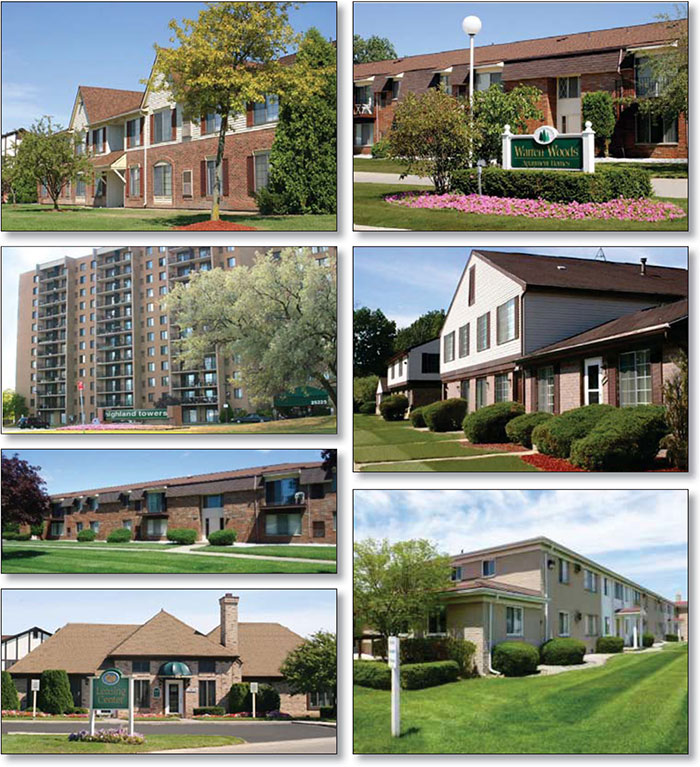
THE INFORMATION IN THIS STRUCTURAL AND COLLATERAL TERM SHEET IS NOT COMPLETE AND MAY BE AMENDED PRIOR TO THE TIME OF SALE. THIS TERM SHEET IS NOT AN OFFER TO SELL THESE SECURITIES AND IT IS NOT A SOLICITATION OF AN OFFER TO BUY THESE SECURITIES IN ANY JURISDICTION WHERE THE OFFER OR SALE IS NOT PERMITTED.
50
| HIGHLAND PORTFOLIO |
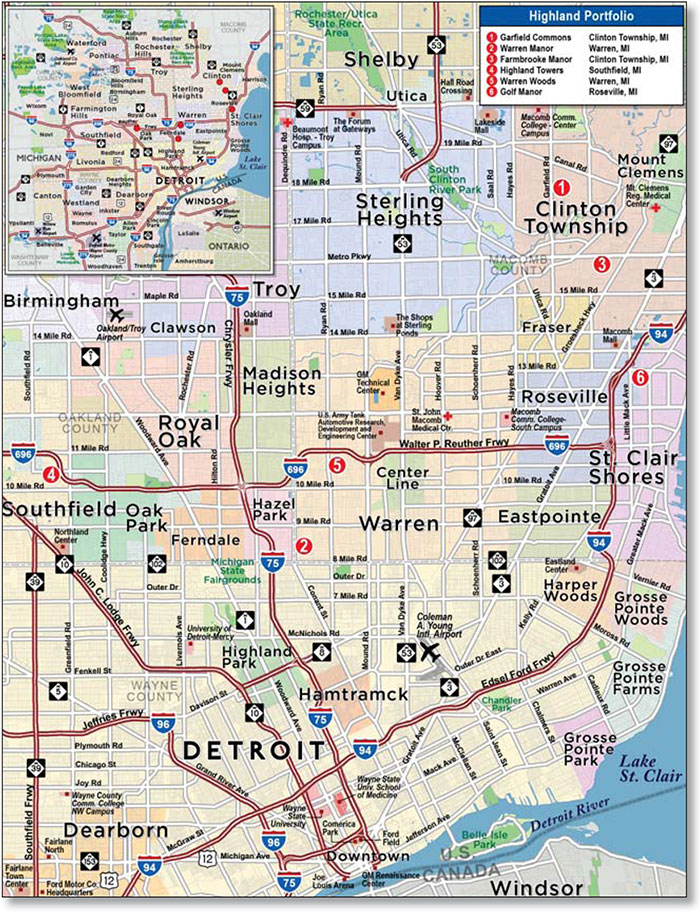
THE INFORMATION IN THIS STRUCTURAL AND COLLATERAL TERM SHEET IS NOT COMPLETE AND MAY BE AMENDED PRIOR TO THE TIME OF SALE. THIS TERM SHEET IS NOT AN OFFER TO SELL THESE SECURITIES AND IT IS NOT A SOLICITATION OF AN OFFER TO BUY THESE SECURITIES IN ANY JURISDICTION WHERE THE OFFER OR SALE IS NOT PERMITTED.
51
| No. 4 – Highland Portfolio | |||||||
| Loan Information | Properties Information | ||||||
| Mortgage Loan Seller: | The Royal Bank of Scotland | Single Asset/Portfolio: | Portfolio | ||||
| Credit Assessment (DBRS/Moody’s/Morningstar): | NR/NR/NR | Property Type: | Multifamily | ||||
| Original Principal Balance: | $62,400,000 | Specific Properties Type: | Various – See Table | ||||
| Cut-off Date Principal Balance: | $62,400,000 | Location: | Various – See Table | ||||
| % of Initial Pool Balance: | 4.2% | Size: | 1,873 units | ||||
| Loan Purpose: | Acquisition | Cut-off Date Principal Balance Per Unit: | $33,316 | ||||
Borrower Name(1): | Various | Year Built/Renovated: | Various – See Table | ||||
| Sponsor: | ROCO Real Estate | Title Vesting: | Fee | ||||
| Mortgage Rate: | 4.956% | Property Manager: | M. Shapiro Development Company LLC | ||||
| Note Date: | July 9, 2014 | 3rd Most Recent Occupancy (As of): | 94.4% (12/31/2011) | ||||
| Anticipated Repayment Date: | NAP | 2nd Most Recent Occupancy (As of): | 92.6% (12/31/2012) | ||||
| Maturity Date: | August 1, 2024 | Most Recent Occupancy (As of): | 90.7% (12/31/2013) | ||||
| IO Period: | 48 months | Current Occupancy (As of): | 93.8% (6/5/2014) | ||||
| Loan Term (Original): | 120 months | ||||||
| Seasoning: | 0 months | Underwriting and Financial Information: | |||||
| Amortization Term (Original): | 360 months | ||||||
| Loan Amortization Type: | Interest-only, Amortizing Balloon | 3rd Most Recent NOI (As of): | $5,389,291 (12/31/2012) | ||||
| Interest Accrual Method: | Actual/360 | 2nd Most Recent NOI (As of): | $4,951,595 (12/31/2013) | ||||
| Call Protection: | L(24),D(92),O(4) | Most Recent NOI (As of): | $4,818,407 (TTM 5/31/2014) | ||||
| Lockbox Type: | Soft/Springing Cash Management | ||||||
| Additional Debt: | None | ||||||
| Additional Debt Type: | NAP | U/W Revenues: | $12,683,386 | ||||
| U/W Expenses: | $7,420,618 | ||||||
| U/W NOI: | $5,262,768 | ||||||
| U/W NCF: | $4,779,534 | ||||||
Escrows and Reserves(2): | U/W NOI DSCR: | 1.32x | |||||
| U/W NCF DSCR: | 1.20x | ||||||
| U/W NOI Debt Yield: | 8.4% | ||||||
Type: | Initial | Monthly | Cap (If Any) | U/W NCF Debt Yield: | 7.7% | ||
| Taxes | $107,552 | $107,552 | NAP | As-Is Appraised Value: | $86,590,000 | ||
| Insurance | $185,168 | $37,034 | NAP | As-Is Appraisal Valuation Date: | June 9, 2014 | ||
| Replacement Reserves | $0 | $40,270 | NAP | Cut-off Date LTV Ratio: | 72.1% | ||
| Deferred Maintenance | $1,157,756 | $0 | NAP | LTV Ratio at Maturity or ARD: | 65.1% | ||
| (1) | See “The Borrower” section. |
| (2) | See “Escrows” section. |
The Mortgage Loan. The mortgage loan (the “Highland Portfolio Mortgage Loan”) is evidenced by a single promissory note that is secured by a first mortgage encumbering six class B apartment properties totaling 1,873 units located in Michigan (the “Highland Portfolio Properties”). The Highland Portfolio Mortgage Loan was originated on July 9, 2014 by The Royal Bank of Scotland. The Highland Portfolio Mortgage Loan had an original principal balance of $62,400,000, has an outstanding principal balance as of the Cut-off Date of $62,400,000 and accrues interest at an interest rate of 4.956% per annum. The Highland Portfolio Mortgage Loan had an initial term of 120 months, has a remaining term of 120 months as of the Cut-off Date and requires interest-only payments for the first 48 payments following origination and thereafter, requires payments of principal and interest based on a 30-year amortization schedule. The Highland Portfolio Mortgage Loan matures on August 1, 2024.
Following the lockout period, the borrower has the right to defease the Highland Portfolio Mortgage Loan in whole, or in part, on any due date before May 1, 2024. In addition, the Highland Portfolio Mortgage Loan is prepayable without penalty on or after May 1, 2024.
THE INFORMATION IN THIS STRUCTURAL AND COLLATERAL TERM SHEET IS NOT COMPLETE AND MAY BE AMENDED PRIOR TO THE TIME OF SALE. THIS TERM SHEET IS NOT AN OFFER TO SELL THESE SECURITIES AND IT IS NOT A SOLICITATION OF AN OFFER TO BUY THESE SECURITIES IN ANY JURISDICTION WHERE THE OFFER OR SALE IS NOT PERMITTED.
52
| HIGHLAND PORTFOLIO |
Sources and Uses
| Sources | Uses | |||||||
| Original loan amount | $62,400,000 | 76.0% | Purchase price/Recapitalization | $78,000,000 | 95.0% | |||
| Sponsor’s new cash contribution | 9,000,000 | 11.0 | Reserves | 1,450,475 | 1.8 | |||
| Existing equity | 10,730,688 | 13.0 | Closing costs | 2,680,213 | 3.3 | |||
| Total Sources | $82,130,688 | 100.0% | Total Uses | $82,130,688 | 100.0% |
The Properties. The Highland Portfolio Properties consist of six class B apartment properties containing 1,873 units, located within 25 miles of downtown Detroit, Michigan and situated within the Detroit-Warren-Livonia Metropolitan Statistical Area (the “Detroit MSA”). Five of the Highland Portfolio Properties consist of multiple, two-story low-rise buildings and one of the Highland Portfolio Properties is comprised of a single mid-rise building. The Highland Portfolio Properties were built between 1970 and 1989, and the unit mix is comprised of 947 one-bedroom units, 798 two-bedroom units and 128 three-bedroom units. As of June 5, 2014, the Highland Portfolio Properties were 93.8% occupied.
The following table presents certain information relating to the Highland Portfolio Properties:
Property Name – Location | Allocated Cut-off Date Principal Balance | % of Portfolio Cut-off Date Principal Balance | Occupancy | Year Built/ Renovated | No. of Units | ||
Garfield Commons – Clinton Township, MI | $20,523,730 | 32.9% | 93.5% | 1989/NAP | 496 | ||
Farmbrooke Manor – Clinton Township, MI | $13,346,210 | 21.4% | 96.3% | 1975/NAP | 320 | ||
Warren Manor – Warren, MI | $11,688,700 | 18.7% | 92.3% | 1970/NAP | 480 | ||
Warren Woods – Warren, MI | $7,782,930 | 12.5% | 93.8%(1) | 1971/NAP | 192 | ||
Highland Towers – Southfield, MI | $6,031,710 | 9.7% | 94.7% | 1978/NAP | 265 | ||
Golf Manor – Roseville, MI | $3,026,726 | 4.9% | 91.7% | 1970/NAP | 120 | ||
| Total/Weighted Average | $62,400,000 | 100.0% | 93.8% | 1,873 | |||
| (1) | 16 units are offline due to a fire, as such the occupancy is based on 176 units. |
The following table presents certain information relating to the unit mix of the Highland Portfolio Properties:
| Unit Type | No. of Units | % of Total Units | Average Unit Size (SF) | |
| 1 Bedroom | 947 | 50.6% | 685 | |
| 2 Bedroom | 798 | 42.6% | 939 | |
| 3 Bedroom | 128 | 6.8% | 1,100 | |
| Total/Weighted Average | 1,873 | 100.0% | 822 | |
The following table presents historical occupancy percentages at the Highland Portfolio Properties:
Historical Occupancy
12/31/2011(1) | 12/31/2012(1) | 12/31/2013(1) | 6/5/2014(1) | |||
| 94.4% | 92.6% | 90.7% | 93.8% |
| (1) | Information obtained from the borrower. |
THE INFORMATION IN THIS STRUCTURAL AND COLLATERAL TERM SHEET IS NOT COMPLETE AND MAY BE AMENDED PRIOR TO THE TIME OF SALE. THIS TERM SHEET IS NOT AN OFFER TO SELL THESE SECURITIES AND IT IS NOT A SOLICITATION OF AN OFFER TO BUY THESE SECURITIES IN ANY JURISDICTION WHERE THE OFFER OR SALE IS NOT PERMITTED.
53
| HIGHLAND PORTFOLIO |
Operating History and Underwritten Net Cash Flow. The following table presents certain information relating to the historical operating performance and Underwritten Net Cash Flow at the Highland Portfolio Properties:
Cash Flow Analysis
| 2013 | TTM 5/31/2014 | U/W | U/W $ per Unit | ||||||||||||
| Base Rent | $13,971,950 | $14,230,278 | $14,255,311 | $14,392,092 | $7,684 | ||||||||||
| Loss to Lease | 0 | 0 | ) | (111 | ) | ||||||||||
| Other Income | 686,928 | 649,495 | 649,495 | 347 | |||||||||||
| Less Vacancy & Credit Loss | (2,177,440 | ) | (2,580,312 | ) | (2,500,901 | ) | (2,150,457 | )(1) | (1,148 | ) | |||||
| Effective Gross Income | $12,336,894 | $12,403,905 | $12,683,386 | $6,772 | |||||||||||
| Total Operating Expenses | $7,385,299 | $7,585,498 | $7,420,618 | $3,962 | |||||||||||
| Net Operating Income | (2) | $4,951,595 | (2) | $4,818,407 | (2) | $5,262,768 | $2,810 | ||||||||
| Capital Expenditures | 0 | 0 | 483,234 | 258 | |||||||||||
| Net Cash Flow | $5,389,291 | $4,951,595 | $4,818,407 | $4,779,534 | $2,552 | ||||||||||
| NOI DSCR | 1.24x | 1.20x | 1.32x | ||||||||||||
| NCF DSCR | 1.35x | 1.24x | 1.20x | 1.20x | |||||||||||
| NOI DY | 7.9% | 7.7% | 8.4% | ||||||||||||
| NCF DY | 8.6% | 7.9% | 7.7% | 7.7% | |||||||||||
| (1) | The underwritten economic vacancy and credit loss is 15.2%. The Highland Portfolio Properties were 93.8% physically occupied as of June 5, 2014. |
| (2) | TTM 5/31/2014 and 2013 NOI are lower than 2012 NOI due to increased utility expenses resulting from a particularly harsh winter. The sponsor has since instituted separate unit metering that tenants pay directly. Additionally, a fire occurred in October 2013 at the Warren Woods property. Insurance is covering the cost of remediation repairs. The damaged 16 units are currently being renovated and are anticipated to be complete by the third quarter of 2014. No income was underwritten from these units. |
Appraisal. As of the appraisal valuation date of June 9, 2014, the Highland Portfolio Properties had an aggregate “as-is” appraised value of $86,590,000.
Environmental Matters. According to Phase I environmental assessments dated June 30, 2014, no recognized environmental conditions were found at four of the six Highland Portfolio Properties. The Farmbrooke Manor property is situated adjacent to a property with estimated groundwater flow, which may contain pollutants, up gradient of the Farmbrooke Manor property. Because the potential contamination is on an adjacent site not owned by the borrower, and as federal and Michigan statutory law provide exemptions from liability for contamination migrating from off-site, the borrower will have no liability if any remediation is needed. In addition, the Farmbrooke Manor property is on a municipal water supply, so there is no threat to drinking water from any potential contamination. Regulatory records relating to the Highland Towers property indicate a release of petroleum occurred in 2000 from an underground storage tank (“UST”). The Phase I environmental site assessment revealed that the Michigan Department of Environmental Quality (“MDEQ”) did not accept the UST closure report dated April 19, 2002 and requested groundwater sampling in order to finalize the UST closure. An environmental assessment firm will be engaged by the borrower to take the necessary steps to bring the site into compliance and achieve closure. The estimated cost to complete this is $3,500. The loan documents require the borrower to complete the groundwater sampling and any other required actions by the MDEQ in order to finalize the closure.
Market Overview and Competition. The Highland Portfolio Properties are located in the northern suburbs of Detroit, Michigan in the Oakland and Macomb counties within the Detroit MSA. The Detroit MSA is the most populous area in the state of Michigan, accounting for 43.2% of the total Michigan population with a population density of 1,099 people per square mile. According to the appraisal, as of 2013 the Detroit MSA had an estimated population of 4.3 million and an unemployment rate of 9.4%, a decrease from 10.3% in 2012 and down from its peak of 15.0% in 2009. According to the appraisal, as of the first quarter of 2014, the Detroit apartment market maintains a current inventory of 327,157 units, up approximately 0.2% from the previous quarter. The market vacancy rate and asking rent per unit was 4.4% and $817 per unit per month, respectively as of the first quarter 2014, which remained flat from the previous quarter.
The Borrowers. The borrowers are Garfield Court Associates, LLC, Farmbrooke Manor Associates, LLC, Warren Manor Associates, LLC, Warren Woods Associates, LLC, Highland Towers Associates, LLC, and Golf Manor Associates, LLC, all single purpose entities and collectively with two independent directors. Legal counsel to the borrower delivered a non-consolidation opinion in connection with the origination of the Highland Portfolio Mortgage Loan. Tyler Ross, David Colman and Michael Colman, principals and founders of ROCO Real Estate, are the guarantors of certain nonrecourse carveouts under the Highland Portfolio Mortgage Loan.
The Sponsor. The sponsor is ROCO Real Estate, a privately owned real estate investment firm headquartered in Bloomfield Hills, Michigan. ROCO Real Estate acquired a controlling interest from RHP Properties in conjunction with the funding of the Highland Portfolio Mortgage loan. ROCO Real Estate specializes in acquiring, owning and operating multifamily properties nationwide. Founded in 2012, ROCO Real Estate has acquired 34 properties containing over 6,000 units, and has a portfolio valued at over $250.0 million.
Escrows. The loan documents provide for upfront reserves in the amount of $107,552 for real estate taxes, $185,168 for insurance and $1,157,756 for deferred maintenance. The loan documents also provide for ongoing monthly reserves in the amount of $107,552 for taxes, $37,034 for insurance and $40,270 for replacement reserves.
THE INFORMATION IN THIS STRUCTURAL AND COLLATERAL TERM SHEET IS NOT COMPLETE AND MAY BE AMENDED PRIOR TO THE TIME OF SALE. THIS TERM SHEET IS NOT AN OFFER TO SELL THESE SECURITIES AND IT IS NOT A SOLICITATION OF AN OFFER TO BUY THESE SECURITIES IN ANY JURISDICTION WHERE THE OFFER OR SALE IS NOT PERMITTED.
54
| HIGHLAND PORTFOLIO |
Lockbox and Cash Management. The Highland Portfolio Mortgage Loan requires a lender-controlled lockbox account, which is already in place, and that the borrower and property manager deposit all cash revenues and all other monies received into such lockbox account within one business days after receipt. Prior to the occurrence of a Cash Management Period (as defined below), all funds on deposit in the lockbox account are swept into the borrower’s operating account on a daily basis. During a Cash Management Period, all funds on deposit in the lockbox account are swept to a lender-controlled cash management account on a monthly basis.
A “Cash Management Period” will commence upon the earlier of (i) the occurrence and continuance of an event of default; (ii) the debt service coverage ratio being less than 1.10x as of the end of any calendar quarter. A Cash Management Period will end, with regard to clause (i), upon the cure of such event of default; and with regard to clause (ii), upon the amortizing debt service coverage ratio being equal to or greater than 1.10x for one calendar quarter.
Property Management. The Highland Portfolio Properties are managed by M. Shapiro Development Company LLC.
Assumption. The borrower has the right to transfer the Highland Portfolio Properties, provided that no event of default has occurred and is continuing and certain other conditions are satisfied, including, but not limited to (i) the proposed transferee and guarantor are satisfactory to the lender, taking into consideration transferee experience, financial strength and general business standing; and (ii) if requested by the lender, rating agency confirmation from DBRS, Moody’s and Morningstar that the transfer will not result in a downgrade, withdrawal or qualification of the Series 2014-C21 Certificates.
Partial Release. Following the second anniversary of the issuance of the Series 2014-C21 Certificates, the borrower is permitted to release any constituent property in connection with a sale to a third party, subject to certain conditions including (i) defeasance of a portion of the principal balance of the Highland Portfolio Mortgage Loan by the greater of (a) 100% of net proceeds of the sale of the released property; and (b) 120% of the released property’s allocated loan balance; (ii) no event of default under the Highland Portfolio Mortgage Loan has occurred and is continuing; (iii) the Highland Portfolio Mortgage Loan amortizing debt service coverage ratio, after giving effect to such release, is no less than each of (a) the amortizing debt service coverage ratio existing immediately prior to such release and (b) 1.25x; and (iv) delivery of a legal opinion to the lender to demonstrate that the release will satisfy REMIC requirements.
Real Estate Substitution. Not permitted.
Subordinate and Mezzanine Indebtedness. Not Permitted.
Ground Lease. None.
Terrorism Insurance. The loan documents require that the “all risk” insurance policy required to be maintained by the borrower provide coverage for terrorism in an amount equal to the full replacement cost of the Highland Portfolio Properties. The loan documents also require business interruption insurance covering no less than the 18-month period following the occurrence of a casualty event.
THE INFORMATION IN THIS STRUCTURAL AND COLLATERAL TERM SHEET IS NOT COMPLETE AND MAY BE AMENDED PRIOR TO THE TIME OF SALE. THIS TERM SHEET IS NOT AN OFFER TO SELL THESE SECURITIES AND IT IS NOT A SOLICITATION OF AN OFFER TO BUY THESE SECURITIES IN ANY JURISDICTION WHERE THE OFFER OR SALE IS NOT PERMITTED.
55
| CEDAR CREST PROFESSIONAL PARK |
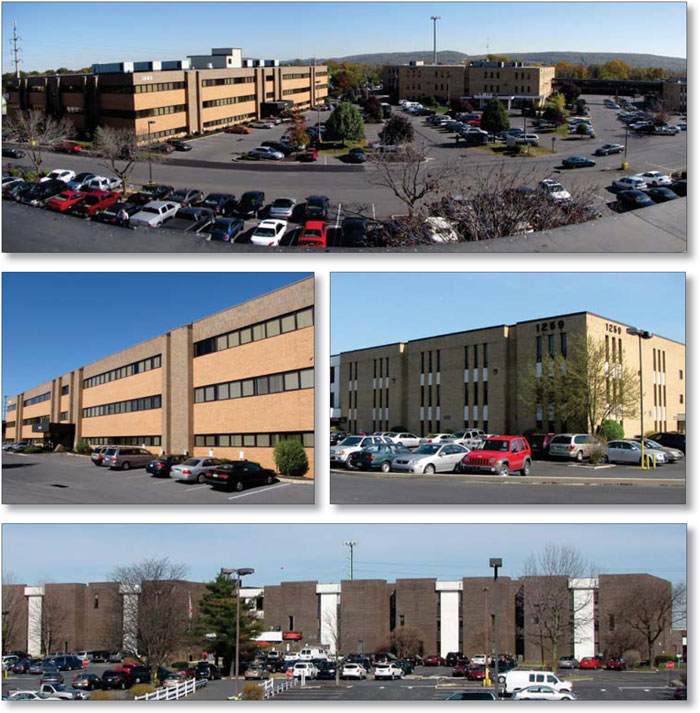
THE INFORMATION IN THIS STRUCTURAL AND COLLATERAL TERM SHEET IS NOT COMPLETE AND MAY BE AMENDED PRIOR TO THE TIME OF SALE. THIS TERM SHEET IS NOT AN OFFER TO SELL THESE SECURITIES AND IT IS NOT A SOLICITATION OF AN OFFER TO BUY THESE SECURITIES IN ANY JURISDICTION WHERE THE OFFER OR SALE IS NOT PERMITTED.
56
| CEDAR CREST PROFESSIONAL PARK |
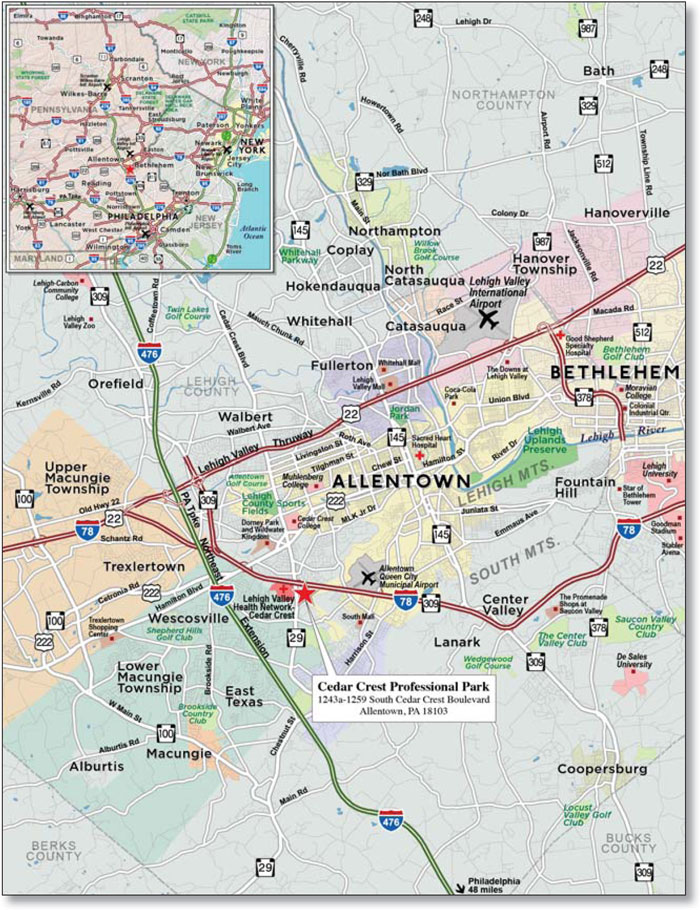
THE INFORMATION IN THIS STRUCTURAL AND COLLATERAL TERM SHEET IS NOT COMPLETE AND MAY BE AMENDED PRIOR TO THE TIME OF SALE. THIS TERM SHEET IS NOT AN OFFER TO SELL THESE SECURITIES AND IT IS NOT A SOLICITATION OF AN OFFER TO BUY THESE SECURITIES IN ANY JURISDICTION WHERE THE OFFER OR SALE IS NOT PERMITTED.
57
| No. 5 – Cedar Crest Professional Park |
| Loan Information | Property Information | ||||||
| Mortgage Loan Seller: | Wells Fargo Bank, National Association | Single Asset/Portfolio: | Single Asset | ||||
Credit Assessment (DBRS/Moody’s/Morningstar): | NR/NR/NR | Property Type: | Office | ||||
| Original Principal Balance: | $60,000,000 | Specific Property Type: | Medical | ||||
| Cut-off Date Principal Balance: | $59,929,763 | Location: | Allentown, PA | ||||
| % of Initial Pool Balance: | 4.2% | Size: | 700,815 SF | ||||
| Loan Purpose: | Refinance | Cut-off Date Principal Balance Per SF: | $85.51 | ||||
| Borrower Name: | Cedar Crest Professional Park VII LP | Year Built/Renovated: | 1979-2001/NAP | ||||
| Sponsor: | David B. Rothrock | Title Vesting: | Fee | ||||
| Mortgage Rate: | 4.580% | Property Manager: | MRA Realty, Inc. | ||||
| Note Date: | June 20, 2014 | 3rd Most Recent Occupancy (As of): | 72.7% (12/31/2011) | ||||
| Anticipated Repayment Date: | NAP | 2nd Most Recent Occupancy (As of): | 81.3% (12/31/2012) | ||||
| Maturity Date: | July 11, 2024 | Most Recent Occupancy (As of): | 78.9% (12/31/2013) | ||||
| IO Period: | None | Current Occupancy (As of): | 80.5% (4/29/2014) | ||||
| Loan Term (Original): | 120 months | ||||||
| Seasoning: | 1 month | Underwriting and Financial Information: | |||||
| Amortization Term (Original): | 360 months | ||||||
| Loan Amortization Type: | Amortizing Balloon | 3rd Most Recent NOI (As of): | $5,367,922 (12/31/2012) | ||||
| Interest Accrual Method: | Actual/360 | 2nd Most Recent NOI (As of): | $5,938,364 (12/31/2013) | ||||
| Call Protection: | L(25),D(91),O(4) | Most Recent NOI (As of): | $5,645,019 (TTM 3/31/2014) | ||||
| Lockbox Type: | Soft/Springing Cash Management | ||||||
| Additional Debt: | None | ||||||
| Additional Debt Type: | NAP | U/W Revenues: | $10,096,839 | ||||
| U/W Expenses: | $3,794,853 | ||||||
U/W NOI(2): | $6,301,986 | ||||||
Escrows and Reserves(1): | U/W NCF: | $5,397,429 | |||||
| U/W NOI DSCR: | 1.71x | ||||||
| Type: | Initial | Monthly | Cap (If Any) | U/W NCF DSCR: | 1.47x | ||
| Taxes | $725,164 | $89,566 | NAP | U/W NOI Debt Yield: | 10.5% | ||
| Insurance | $30,719 | $6,386 | NAP | U/W NCF Debt Yield: | 9.0% | ||
| Replacement Reserves | $500,000 | $19,856 | $500,000 | As-Is Appraised Value: | $93,100,000 | ||
| TI/LC Reserve | $700,000 | $58,333 | $2,100,000 | As-Is Appraisal Valuation Date: | March 4, 2014 | ||
| Deferred Maintenance | $379,725 | $0 | NAP | Cut-off Date LTV Ratio: | 64.4% | ||
| Tenant Specific TI/LC Reserve | $499,878 | $0 | NAP | LTV Ratio at Maturity or ARD: | 52.3% | ||
| (1) | See “Escrows” section. |
| (2) | See “Cash Flow Analysis” section. |
The Mortgage Loan. The mortgage loan (the “Cedar Crest Professional Park Mortgage Loan”) is evidenced by a single promissory note that is secured by a first mortgage encumbering a seven-building medical office campus totaling 700,815 square feet and a three-story parking structure located in Allentown, Pennsylvania (the “Cedar Crest Professional Park Property”). The Cedar Crest Professional Park Mortgage Loan was originated on June 20, 2014 by Wells Fargo Bank, National Association. The Cedar Crest Professional Park Mortgage Loan had an original principal balance of $60,000,000, has an outstanding principal balance as of the Cut-off Date of $59,929,763 and accrues interest at an interest rate of 4.580% per annum. The Cedar Crest Professional Park Mortgage Loan had an initial term of 120 months, has a remaining term of 119 months as of the Cut-off Date, and requires principal and interest payments based on a 30-year amortization schedule. The Cedar Crest Professional Park Mortgage Loan matures on July 11, 2024.
Following the lockout period, the borrower has the right to defease the Cedar Crest Professional Park Mortgage Loan in whole, but not in part, on any date before April 11, 2024. In addition, the Cedar Crest Professional Park Mortgage Loan is prepayable without penalty on or after April 11, 2024.
THE INFORMATION IN THIS STRUCTURAL AND COLLATERAL TERM SHEET IS NOT COMPLETE AND MAY BE AMENDED PRIOR TO THE TIME OF SALE. THIS TERM SHEET IS NOT AN OFFER TO SELL THESE SECURITIES AND IT IS NOT A SOLICITATION OF AN OFFER TO BUY THESE SECURITIES IN ANY JURISDICTION WHERE THE OFFER OR SALE IS NOT PERMITTED.
58
| CEDAR CREST PROFESSIONAL PARK |
Sources and Uses
| Sources | Uses | |||||||
| Original loan amount | $60,000,000 | 100.0% | Loan payoff | $45,071,246 | 75.1% | |||
| Reserves | 2,835,486 | 4.7% | ||||||
| Closing costs | 646,616 | 1.1% | ||||||
| Return of equity | 11,446,652 | 19.1% | ||||||
| Total Sources | $60,000,000 | 100.0% | Total Uses | $60,000,000 | 100.0% | |||
The Property. The Cedar Crest Professional Park Property is comprised of seven, three-story, class B medical office buildings totaling 700,815 square feet and a three-story parking structure located in Allentown, Pennsylvania. The Cedar Crest Professional Park Property was constructed in phases between 1979 and 2001 and is situated on a 30.5-acre parcel directly across Cedar Crest Boulevard from Lehigh Valley Hospital-Cedar Crest. The first building constructed in the Cedar Crest Professional Park Property was fully occupied by physicians on the medical staff of Lehigh Valley Hospital-Cedar Crest, and as the needs of the medical staff and hospital increased, the Cedar Crest Professional Park Property expanded to accommodate them. The Cedar Crest Professional Park Property contains 1,854 parking spaces (1,567 surface parking spaces and 287 parking spaces within a three-story parking structure), resulting in a parking ratio of 2.6 spaces per 1,000 square feet of rentable area. As of April 29, 2014, The Cedar Crest Professional Park Property was 80.5% occupied by 75 tenants.
Lehigh Valley Health Network (“LVHN”) leases a total of 320,471 square feet at the Cedar Crest Professional Park Property, accounting for 45.7% of the rentable area and 60.5% of the underwritten base rent (see “Lehigh Valley Health Network” table below). LVHN leases the entire 1243 Cedar Crest Boulevard building, which comprises 100,000 square feet and contains a rehabilitation center, examination rooms, exercise rooms, and physician offices. Originally founded as Allentown Hospital in 1899, LVHN is now one of the largest health care providers in Pennsylvania with over $1.5 billion of operating revenues and capturing more than 54,000 inpatient admissions in 2013. As one of the largest teaching facilities in Pennsylvania, Lehigh Valley Hospital-Cedar Crest offers practicing professionals an array of services and expertise to help them meet the health care needs of their patients. Additionally, Lehigh Valley Hospital-Cedar Crest was the first Level I trauma center in Pennsylvania (and remains the only Level I trauma center in the Lehigh Valley region), and its trauma staff serves the residents of an eight-county area.
The following table presents certain information relating to the tenancy at the Cedar Crest Professional Park Property:
Major Tenants
| Tenant Name | Credit Rating (Fitch/Moody’s /S&P) | Tenant NRSF | % of NRSF | Annual U/W Base Rent PSF | Annual U/W Base Rent | % of Total Annual U/W Base Rent | Lease Expiration Date | ||||||||||
| Major Tenants | |||||||||||||||||
| LVHN | NR/A1/NR | 320,471 | 45.7% | $14.26(1) | $4,570,860(1) | 60.5% | Various(2) | ||||||||||
| Advanced Dermatology Associates | NR/NR/NR | 25,318 | 3.6% | $12.00 | $303,816 | 4.0% | 7/1/2021 | ||||||||||
| Smile Krafters, P.C. | NR/NR/NR | 17,839 | 2.5% | $14.01 | $249,997 | 3.3% | Various(3) | ||||||||||
| Post & Schell, PC | NR/NR/NR | 14,000 | 2.0% | $14.00 | $196,000 | 2.6% | 11/30/2018 | ||||||||||
| Lehigh Magnetic Imaging Center, LP | NR/NR/NR | 11,910 | 1.7% | $12.00 | $142,920 | 1.9% | 11/30/2023 | ||||||||||
| Total Major Tenants | 389,538 | 55.6% | $14.03 | $5,463,593 | 72.4% | ||||||||||||
| Non-Major Tenants | 174,836 | 24.9% | $11.94 | $2,086,898 | 27.6% | ||||||||||||
| Occupied Collateral Total | 564,374 | 80.5% | $13.38 | $7,550,491 | 100.0% | ||||||||||||
| Vacant Space | 136,441 | 19.5% | |||||||||||||||
| Collateral Total | 700,815 | 100.0% | |||||||||||||||
| (1) | LVHN’s Annual U/W Base Rent PSF and Annual U/W Base Rent represent the tenant’s average rent over the lease term. LVHN currently pays a base rent of $13.47 per square foot. |
| (2) | LVHN operates under one main lease governing 24 separate spaces with different rental rates and lease expirations. See “Lehigh Valley Health Network” chart below. |
| (3) | Smile Krafters, P.C. leases two spaces at the Cedar Crest Professional Park Property, a 15,332 square foot space with a lease expiration date of November 1, 2020 and a 2,507 square foot space with a lease expiration date of February 1, 2023. |
THE INFORMATION IN THIS STRUCTURAL AND COLLATERAL TERM SHEET IS NOT COMPLETE AND MAY BE AMENDED PRIOR TO THE TIME OF SALE. THIS TERM SHEET IS NOT AN OFFER TO SELL THESE SECURITIES AND IT IS NOT A SOLICITATION OF AN OFFER TO BUY THESE SECURITIES IN ANY JURISDICTION WHERE THE OFFER OR SALE IS NOT PERMITTED.
59
| CEDAR CREST PROFESSIONAL PARK |
The following table presents certain information relating to the spaces occupied by LVHN at the Cedar Crest Professional Park Property:
Lehigh Valley Health Network
| Lease Expiration Year | Total NRSF | % of Total NRSF | Annual U/W Base Rent PSF | Annual U/W Base Rent | % of Total Annual U/W Base Rent | ||||||
| 2015 | 23,141 | 3.3% | $14.00 | $323,974 | 4.3% | ||||||
| 2016 | 24,507 | 3.5% | $14.00 | $343,098 | 4.5% | ||||||
| 2017 | 77,470 | 11.1% | $14.21 | $1,101,171 | 14.6% | ||||||
| 2018 | 18,244 | 2.6% | $14.92 | $272,164 | 3.6% | ||||||
| 2019 | 0 | 0.0% | $0.00 | $0 | 0.0% | ||||||
| 2020 | 10,914 | 1.6% | $14.03 | $153,165 | 2.0% | ||||||
| 2021 | 104,565 | 14.9% | $14.16 | $1,480,276 | 19.6% | ||||||
| 2022 | 61,630 | 8.8% | $14.55 | $897,012 | 11.9% | ||||||
| Total/Weighted Average | 320,471 | 45.7% | $14.26 | $4,570,860 | 60.5% |
The following table presents certain information relating to the lease rollover schedule at the Cedar Crest Professional Park Property:
Lease Expiration Schedule(1)(2)
Year Ending December 31, | No. of Leases Expiring(3) | Expiring NRSF | % of Total NRSF | Cumulative Expiring NRSF | Cumulative % of Total NRSF | Annual U/W Base Rent | Annual U/W Base Rent PSF(4) | ||||||||
| MTM | 12 | 14,298 | 2.0% | 14,298 | 2.0% | $177,803 | $12.44 | ||||||||
| 2014 | 8 | 12,815 | 1.8% | 27,113 | 3.9% | $162,566 | $12.69 | ||||||||
| 2015 | 13 | 40,032 | 5.7% | 67,145 | 9.6% | $578,867 | $14.46 | ||||||||
| 2016 | 17 | 56,855 | 8.1% | 124,000 | 17.7% | $761,227 | $13.39 | ||||||||
| 2017 | 13 | 100,107 | 14.3% | 224,107 | 32.0% | $1,324,660 | $13.23 | ||||||||
| 2018 | 11 | 49,711 | 7.1% | 273,818 | 39.1% | $691,831 | $13.92 | ||||||||
| 2019 | 8 | 24,261 | 3.5% | 298,079 | 42.5% | $324,094 | $13.36 | ||||||||
| 2020 | 4 | 29,716 | 4.2% | 327,795 | 46.8% | $412,923 | $13.90 | ||||||||
| 2021 | 5 | 129,883 | 18.5% | 457,678 | 65.3% | $1,784,092 | $13.74 | ||||||||
| 2022 | 5 | 61,630 | 8.8% | 519,308 | 74.1% | $897,012 | $14.55 | ||||||||
| 2023 | 3 | 25,139 | 3.6% | 544,447 | 77.7% | $301,572 | $12.00 | ||||||||
| 2024 | 2 | 12,705 | 1.8% | 557,152 | 79.5% | $72,243 | $5.69 | ||||||||
| Thereafter | 4 | 7,222 | 1.0% | 564,374 | 80.5% | $61,600 | $8.53 | ||||||||
| Vacant | 0 | 136,441 | 19.5% | 700,815 | 100.0% | $0 | $0.00 | ||||||||
| Total/Weighted Average | 105(5) | 700,815 | 100.0% | $7,550,491 | $13.38 |
| (1) | Information obtained from the underwritten rent roll. |
| (2) | Certain tenants may have lease termination options that are exercisable prior to the originally stated expiration date of the subject lease and that are not considered in the Lease Expiration Schedule. |
| (3) | LVHN operates under one main lease governing 24 separate spaces with different rental rates and lease expirations. They have been shown as separate leases for the purposes of the Lease Expiration Schedule. |
| (4) | Weighted Average Annual U/W Base Rent PSF excludes vacant space. |
| (5) | The Cedar Crest Professional Park Property is leased to 75 tenants subject to 105 leases. |
The following table presents historical occupancy percentages at the Cedar Crest Professional Park Property:
Historical Occupancy
12/31/2011(1) | 12/31/2012(1) | 12/31/2013(1) | 4/29/2014(2) | |||
| 72.7% | 81.3% | 78.9% | 80.5% |
| (1) | Information obtained from the borrower. |
| (2) | Information obtained from the underwritten rent roll. |
THE INFORMATION IN THIS STRUCTURAL AND COLLATERAL TERM SHEET IS NOT COMPLETE AND MAY BE AMENDED PRIOR TO THE TIME OF SALE. THIS TERM SHEET IS NOT AN OFFER TO SELL THESE SECURITIES AND IT IS NOT A SOLICITATION OF AN OFFER TO BUY THESE SECURITIES IN ANY JURISDICTION WHERE THE OFFER OR SALE IS NOT PERMITTED.
60
| CEDAR CREST PROFESSIONAL PARK |
Operating History and Underwritten Net Cash Flow. The following table presents certain information relating to the Underwritten Net Cash Flow at the Cedar Crest Professional Park Property:
Cash Flow Analysis
| 2012 | 2013 | TTM 3/31/2014 | U/W(1) | U/W $ per SF | ||||||||||||
| Base Rent | $6,495,522 | $7,007,429 | $7,122,143 | $7,550,491 | $10.77 | |||||||||||
| Grossed Up Vacant Space | 0 | 0 | 0 | 1,910,174 | 2.73 | |||||||||||
| Total Reimbursables | 2,134,377 | 2,333,146 | 2,383,097 | 2,539,683 | 3.62 | |||||||||||
| Other Income | 15,541 | 6,803 | 6,665 | 6,665 | 0.01 | |||||||||||
| Less Vacancy & Collection Loss | 0 | (3,445) | 0 | (1,910,174)(2) | (2.73) | |||||||||||
| Effective Gross Income | $8,645,440 | $9,343,932 | $9,511,906 | $10,096,839 | $14.41 | |||||||||||
| Total Operating Expenses | $3,277,518 | $3,405,569 | $3,866,886 | $ 3,794,853 | $ 5.41 | |||||||||||
| Net Operating Income | $5,367,922 | $5,938,364 | $5,645,019 | $6,301,986 | $8.99 | |||||||||||
| TI/LC | 0 | 0 | 0 | 666,280 | 0.95 | |||||||||||
| Capital Expenditures | 0 | 0 | 0 | 238,277 | 0.34 | |||||||||||
| Net Cash Flow | $5,367,922 | $5,938,364 | $5,645,019 | $5,397,429 | $7.70 | |||||||||||
| NOI DSCR | 1.46x | 1.61x | 1.53x | 1.71x | ||||||||||||
| NCF DSCR | 1.46x | 1.61x | 1.53x | 1.47x | ||||||||||||
| NOI DY | 9.0% | 9.9% | 9.4% | 10.5% | ||||||||||||
| NCF DY | 9.0% | 9.9% | 9.4% | 9.0% |
| (1) | Underwritten base rent and net operating income are higher than historicals, as the underwritten base rent for LVHN represents the tenant’s average rent over the lease term, due to the tenant’s investment-grade rating by Moody’s and long-term historical occupancy at the Cedar Crest Professional Park Property. The underwritten base rent for LVHN is approximately 5.9% higher than the tenant’s current in-place rent. In addition, the borrower has signed 14 new leases accounting for 9.0% of the net rentable area and 9.4% of the underwritten base rent since 2013. |
| (2) | The underwritten economic vacancy is 20.2%. The Cedar Crest Professional Park Property was 80.5% physically occupied as of April 29, 2014. |
Appraisal. As of the appraisal valuation date of March 4, 2014, the Cedar Crest Professional Park Property had an “as-is” appraised value of $93,100,000.
Environmental Matters. According to the Phase I environmental report dated May 2, 2014, there was no evidence of any recognized environmental conditions at the Cedar Crest Professional Park Property.
Market Overview and Competition. The Cedar Crest Professional Park Property is located in Allentown, Pennsylvania, approximately 66 miles northwest of Philadelphia. The Cedar Crest Professional Park Property is located directly across Cedar Crest Boulevard from Lehigh Valley Hospital-Cedar Crest and is often viewed by the medical community as an extension of the hospital campus. Lehigh Valley Hospital-Cedar Crest is an affiliate of LVHN, which occupies 45.7% of the net rentable area at the Cedar Crest Professional Park Property. The Cedar Crest Professional Park Property is adjacent to and has visibility from Interstate 78, which provides access to New York City to the east and Harrisburg, Pennsylvania to the west. The Cedar Crest Professional Park Property is also located approximately three miles east of Interstate 476, which provides access to Philadelphia to the south and Scranton to the north. As of 2013, the population within a one-, three-, and five-mile radius of the Cedar Crest Professional Park Property was 4,930, 87,413 and 208,467, respectively. The median household income within the same one-, three- and five-mile radii was $84,919, $69,940, and $65,961, respectively.
According to the appraisal, the Cedar Crest Professional Park Property is located in the Lehigh County submarket of the Lehigh Valley market. As of the fourth quarter of 2013, the Lehigh County submarket reported a total inventory of 1.9 million square feet of medical office space with a 4.7% vacancy rate and average asking rents of $21.57 per square foot on a gross basis. According to the appraisal, there is no current or proposed construction of medical office space in the Lehigh Valley market as such projects are not financially feasible without a major user or the credit of a large tenant in a build-to-suit transaction.
THE INFORMATION IN THIS STRUCTURAL AND COLLATERAL TERM SHEET IS NOT COMPLETE AND MAY BE AMENDED PRIOR TO THE TIME OF SALE. THIS TERM SHEET IS NOT AN OFFER TO SELL THESE SECURITIES AND IT IS NOT A SOLICITATION OF AN OFFER TO BUY THESE SECURITIES IN ANY JURISDICTION WHERE THE OFFER OR SALE IS NOT PERMITTED.
61
| CEDAR CREST PROFESSIONAL PARK |
The following table presents certain information relating to comparable office properties for the Cedar Crest Professional Park Property:
Competitive Set(1)
Cedar Crest (Subject) | Integrated Health Campus | Roma Corporate Center | Medical Arts @ Luther Crest | Springhouse Professional Building | Lehigh Medical Arts Building | |||||||
| Location | Allentown, PA | Allentown, PA | Allentown, PA | Allentown, PA | Allentown, PA | Allentown, PA | ||||||
| Distance from Subject | -- | 3.9 miles | 3.3 miles | 3.9 miles | 3.6 miles | 3.4 miles | ||||||
| Property Type | Medical Office | Medical Office | Medical Office | Medical Office | Medical Office | Medical Office | ||||||
| Year Built/Renovated | Various | 2006/NAP | 1994/NAV | 2000/NAV | 1995/NAV | 2006/NAP | ||||||
| Stories | 3 | 3 | 6 | 3 | 2 | 2 | ||||||
| Total GLA | 700,815 SF | 330,000 SF | 214,700 SF | 66,000 SF | 26,000 SF | 24,800 SF | ||||||
| Total Occupancy | 81% | 93% | 86% | 88% | 100% | 100% |
| (1) | Information obtained from the appraisal and a third party market research report. |
The Borrower. The borrower is Cedar Crest Professional Park VII LP, a single purpose entity with two independent directors. Legal counsel to the borrower delivered a non-consolidation opinion in connection with the origination of the Cedar Crest Professional Park Mortgage Loan. David B. Rothrock is the guarantor of certain nonrecourse carveouts under the Cedar Crest Professional Park Mortgage Loan.
The Sponsor. The loan sponsor is David B. Rothrock. Mr. Rothrock is the President and CEO of Rothrock Motor Sales, Inc., a multi-brand automobile dealership located in Allentown, approximately five miles northeast of the Cedar Crest Professional Park Property, with annual sales of approximately $150.0 million. Mr. Rothrock is also a partner in a number of ventures including hospitality and commercial real estate developments.
Escrows. The loan documents provide for upfront escrows in the amount of $725,164 for real estate taxes, $30,719 for insurance, $500,000 for replacement reserves, $700,000 for general tenant improvements and leasing commissions (“TI/LCs”), $379,725 for deferred maintenance and $499,878 for rent credits and TI/LCs owed to existing tenants. The loan documents require ongoing monthly escrows in the amount of $89,566 for real estate taxes, $6,386 for insurance, $19,856 for replacement reserves (subject to a cap of $500,000) and $58,333 for general TI/LCs (subject to a cap of $2,100,000).
Lockbox and Cash Management. The Cedar Crest Professional Park Mortgage Loan requires a lender-controlled lockbox account, which is already in place, and that the borrower and property manager deposit all cash revenues and all other monies received into such lockbox account within three business days after receipt. Prior to the occurrence of a Cash Trap Event Period (as defined below), all funds on deposit in the lockbox account are swept into the borrower’s operating account on a daily basis. During a Cash Trap Event Period, all funds on deposit in the lockbox account are swept to a lender-controlled cash management account on a monthly basis.
A “Cash Trap Event Period” will commence upon the earlier of (i) the occurrence and continuance of an event of default; (ii) the debt service coverage ratio being less than 1.20x at the end of any calendar month; or (iii) LVHN’s failure to renew its lease on or before August 1, 2020. A Cash Trap Event Period will end, with regard to clause (i), upon the cure of such event of default; with regard to clause (ii), upon the debt service coverage ratio being equal to or greater than 1.30x for two consecutive calendar quarters; and with regard to clause (iii), upon (x) the occupancy of the Cedar Crest Professional Park Property being equal to or greater than 80.0%; and (y) the debt service coverage ratio being equal to or greater than 1.30x for two consecutive calendar quarters.
Property Management. The Cedar Crest Professional Park Property is managed by MRA Realty, Inc. (“MRA”). As of November 2013, MRA provided various levels of property management services for over 4.5 million square feet of medical, office, retail, industrial and academic real estate throughout Pennsylvania, New Jersey and Delaware.
Assumption. The borrower has a two-time right to transfer the Cedar Crest Professional Park Property, provided that no event of default has occurred and is continuing and certain other conditions are satisfied, including (i) the lender’s reasonable determination that the proposed transferee and guarantor satisfy the lender’s credit review and underwriting standards, taking into consideration transferee experience, financial strength and general business standing; (ii) execution of a recourse guaranty and an environmental indemnity by an affiliate of the transferee; and (iii) if requested by the lender, rating agency confirmation from DBRS, Moody’s and Morningstar that the transfer will not result in a downgrade, withdrawal or qualification of the respective ratings assigned to the Series 2014-C21 Certificates.
Partial Release. Not permitted.
Real Estate Substitution. Not permitted.
Subordinate and Mezzanine Indebtedness. Not permitted.
THE INFORMATION IN THIS STRUCTURAL AND COLLATERAL TERM SHEET IS NOT COMPLETE AND MAY BE AMENDED PRIOR TO THE TIME OF SALE. THIS TERM SHEET IS NOT AN OFFER TO SELL THESE SECURITIES AND IT IS NOT A SOLICITATION OF AN OFFER TO BUY THESE SECURITIES IN ANY JURISDICTION WHERE THE OFFER OR SALE IS NOT PERMITTED.
62
| CEDAR CREST PROFESSIONAL PARK |
Right of First Offer or Right of First Refusal. A cell tower lessee, Verizon, has a Right of First Refusal (“ROFR”) to purchase the Cedar Crest Professional Park Property if the borrower receives a bona fide offer that the borrower is willing to accept. The ROFR is not extinguished by foreclosure; however, the ROFR does not apply to foreclosure or deed in lieu thereof.
Ground Lease. None.
Terrorism Insurance. The loan documents require that the “all risk” insurance policy required to be maintained by the borrower provide coverage for terrorism in an amount equal to the full replacement cost of the Cedar Crest Professional Park Property, provided however, that the borrower will not be required to spend more than 200% of the cost of property coverage in the event the Terrorism Risk Insurance Act or a similar government backstop is no longer in effect. The loan documents also require that the borrower maintains business interruption insurance covering no less than the 18-month period following the occurrence of a casualty event, together with a six-month extended period of indemnity.
THE INFORMATION IN THIS STRUCTURAL AND COLLATERAL TERM SHEET IS NOT COMPLETE AND MAY BE AMENDED PRIOR TO THE TIME OF SALE. THIS TERM SHEET IS NOT AN OFFER TO SELL THESE SECURITIES AND IT IS NOT A SOLICITATION OF AN OFFER TO BUY THESE SECURITIES IN ANY JURISDICTION WHERE THE OFFER OR SALE IS NOT PERMITTED.
63
(THIS PAGE INTENTIONALLY LEFT BLANK)
64
| SHOPS AT CENTERPOINT |
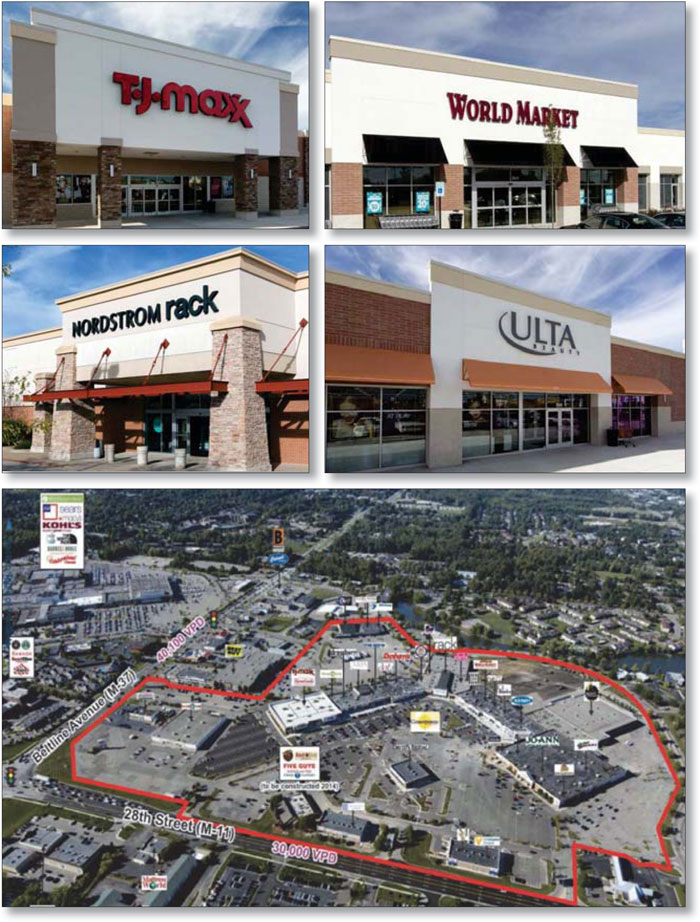
THE INFORMATION IN THIS STRUCTURAL AND COLLATERAL TERM SHEET IS NOT COMPLETE AND MAY BE AMENDED PRIOR TO THE TIME OF SALE. THIS TERM SHEET IS NOT AN OFFER TO SELL THESE SECURITIES AND IT IS NOT A SOLICITATION OF AN OFFER TO BUY THESE SECURITIES IN ANY JURISDICTION WHERE THE OFFER OR SALE IS NOT PERMITTED.
65
| SHOPS AT CENTERPOINT |
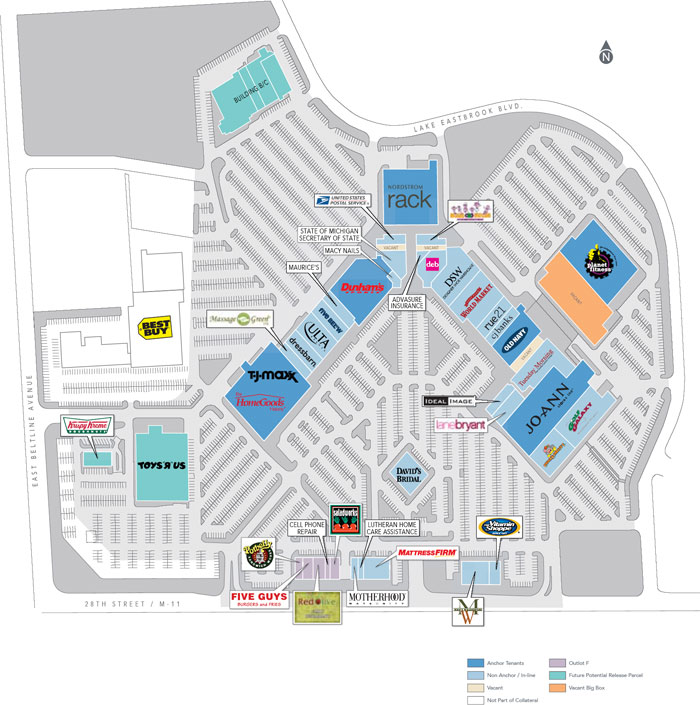
THE INFORMATION IN THIS STRUCTURAL AND COLLATERAL TERM SHEET IS NOT COMPLETE AND MAY BE AMENDED PRIOR TO THE TIME OF SALE. THIS TERM SHEET IS NOT AN OFFER TO SELL THESE SECURITIES AND IT IS NOT A SOLICITATION OF AN OFFER TO BUY THESE SECURITIES IN ANY JURISDICTION WHERE THE OFFER OR SALE IS NOT PERMITTED.
66
| SHOPS AT CENTERPOINT |
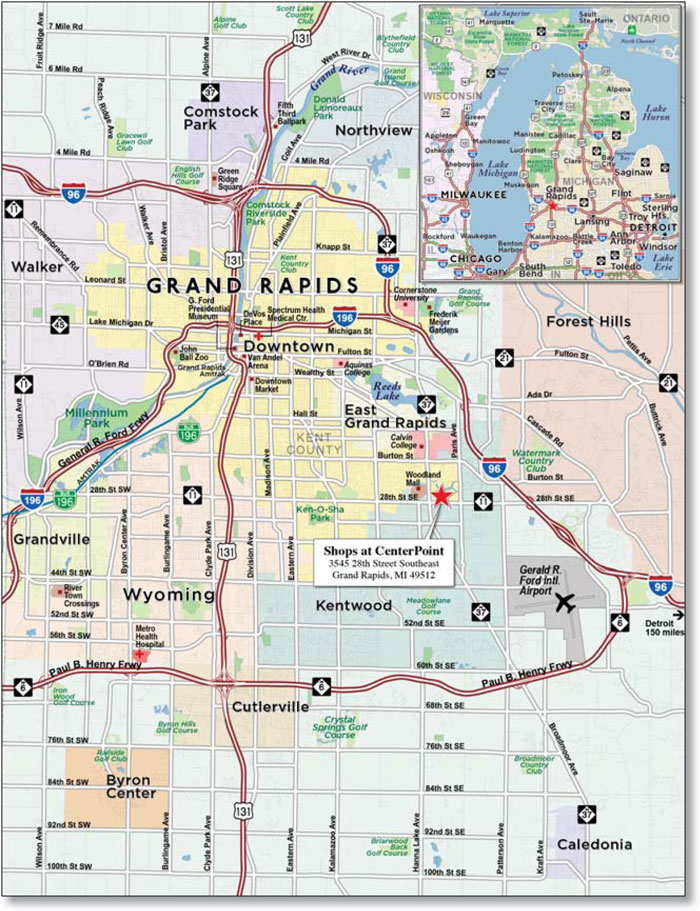
THE INFORMATION IN THIS STRUCTURAL AND COLLATERAL TERM SHEET IS NOT COMPLETE AND MAY BE AMENDED PRIOR TO THE TIME OF SALE. THIS TERM SHEET IS NOT AN OFFER TO SELL THESE SECURITIES AND IT IS NOT A SOLICITATION OF AN OFFER TO BUY THESE SECURITIES IN ANY JURISDICTION WHERE THE OFFER OR SALE IS NOT PERMITTED.
67
| No. 6 – Shops at CenterPoint | |||||||
| Loan Information | Property Information | ||||||
| Mortgage Loan Seller: | Wells Fargo Bank, National Association | Single Asset/Portfolio: | Single Asset | ||||
Credit Assessment (DBRS/Moody’s/Morningstar): | NR/NR/NR | Property Type: | Retail | ||||
| Original Principal Balance: | $54,000,000 | Specific Property Type: | Anchored | ||||
| Cut-off Date Principal Balance: | $54,000,000 | Location: | Grand Rapids, MI | ||||
| % of Initial Pool Balance: | 3.8% | Size: | 461,196 SF | ||||
| Loan Purpose: | Acquisition | Cut-off Date Principal Balance Per SF: | $117.09 | ||||
| Borrower Name: | CenterPoint Owner LLC | Year Built/Renovated: | 1960/2014 | ||||
| Sponsors: | Stonemar Partners, LLC; AGRE U.S. Real Estate Fund, L.P. | Title Vesting: | Fee | ||||
| Mortgage Rate: | 4.450% | Property Manager: | Self-managed | ||||
| Note Date: | June 27, 2014 | 3rd Most Recent Occupancy(5): | NAV | ||||
| Anticipated Repayment Date: | NAP | 2nd Most Recent Occupancy (As of)(5)(6): | 88.3% (12/31/2012) | ||||
| Maturity Date: | July 11, 2024 | Most Recent Occupancy (As of)(5)(6): | 89.6% (12/31/2013) | ||||
| IO Period: | 60 months | Current Occupancy (As of)(7): | 89.5% (5/19/2014) | ||||
| Loan Term (Original): | 120 months | ||||||
| Seasoning: | 1 month | Underwriting and Financial Information: | |||||
| Amortization Term (Original): | 360 months | ||||||
| Loan Amortization Type: | Interest-only, Amortizing Balloon | 3rd Most Recent NOI(5): | NAV | ||||
| Interest Accrual Method: | Actual/360 | 2nd Most Recent NOI (As of)(5): | $3,500,697 (12/31/2013) | ||||
| Call Protection: | L(25),D(88),O(7) | Most Recent NOI (As of)(7): | $3,938,303 (TTM 4/30/2014) | ||||
| Lockbox Type: | Springing (Without Established Account) | ||||||
Additional Debt(1): | Yes | ||||||
Additional Debt Type(1): | Future Mezzanine | ||||||
U/W Revenues(7): | $7,211,510 | ||||||
Escrows and Reserves(2): | U/W Expenses: | $2,176,032 | |||||
U/W NOI(7): | $5,035,478 | ||||||
Type: | Initial | Monthly | Cap (If Any) | U/W NCF(7): | $4,700,898 | ||
| Taxes | $0 | Springing | NAP | U/W NOI DSCR(7): | 1.54x | ||
| Insurance | $0 | Springing | NAP | U/W NCF DSCR(7): | 1.44x | ||
| Replacement Reserves | $0 | $8,576 | NAP | U/W NOI Debt Yield(7): | 9.3% | ||
| TI/LC Reserve | $0 | $12,500 | $500,000 | U/W NCF Debt Yield(7): | 8.7% | ||
| Deferred Maintenance | $1,366,000 | $0 | NAP | As-Completed Appraised Value(8): | $73,600,000 | ||
Big Box Reserve(3) | $3,706,000 | $0 | NAP | As-Completed Appraisal Valuation Date(8): | September 1, 2014 | ||
| Rent Concession | $151,883 | $0 | NAP | Cut-off Date LTV Ratio(8): | 73.4% | ||
| Construction Reserve | (4) | $0 | NAP | LTV Ratio at Maturity or ARD(8): | 67.1% | ||
| (1) | See “Subordinate and Mezzanine Indebtedness” section. |
| (2) | See “Escrows” section. |
| (3) | The Big Box Reserve consists of a Big Box Capital Expenditure Reserve of $1,225,000 and a Big Box TI/LC Reserve of $2,481,000, as further described in the “Escrows” section. |
| (4) | A third-party escrow agent holds the $2,494,431 Construction Reserve, which was funded by the seller. The lender is a party to the third-party escrow agreement. See “Escrows” section. |
| (5) | Limited historical information is available and is not necessarily reflective of current performance. The Shops at CenterPoint Property was formerly an approximately 750,000 square foot enclosed mall which was extensively renovated into an open-air retail center in 2012 and 2013. |
| (6) | 2nd Most Recent and Most Recent Occupancy exclude the square footage attributed to Outlot F (as defined in “The Property” section) and include the square footage attributed to the improvements on the Free Release Parcels (as defined in the “Free Release” section). |
| (7) | Occupancy includes 11,345 square feet comprising Outlot F, which represents 2.5% of the net rentable area and 6.6% of the underwritten base rent. Construction on Outlot F is expected to be completed in September 2014 and tenants will take occupancy and open for business shortly thereafter. A third-party escrow agent holds a reserve (to which the lender is a party) for the remaining construction cost and outstanding free rent and TI/LCs. Occupancy excluding these tenants is 87.0%. U/W figures include rental income attributable to tenants of Outlot F. See “Cash Flow Analysis” section. |
| (8) | The As-Completed Appraised Value assumes the release of the Free Release Parcels (see “Free Release” section) has occurred and construction of Outlot F is complete. The appraiser concluded to an “as stabilized” value of $84,100,000 as of January 1, 2017, which assumes Outlot F is complete and all tenants are in occupancy and open and the Big Box Space (as defined in the “Appraisal” section) has been renovated, leased and the tenants have commenced rent payments. Based on the “as stabilized” appraised value, the Cut-off Date LTV Ratio and LTV Ratio at Maturity are 64.2% and 58.7%, respectively. See “The Property” and “Appraisal” sections. |
The Mortgage Loan. The mortgage loan (the “Shops at CenterPoint Mortgage Loan”) is evidenced by a single promissory note that is secured by a first mortgage encumbering an anchored retail center located in Grand Rapids, Michigan (the “Shops at CenterPoint Property”). The Shops at CenterPoint Mortgage Loan was originated on June 27, 2014 by Wells Fargo Bank, National Association. The Shops at CenterPoint Mortgage Loan had an original principal balance of $54,000,000, has an outstanding principal balance as of the Cut-off Date of $54,000,000 and accrues interest at an interest rate of 4.450% per annum. The Shops at CenterPoint Mortgage Loan had an initial term of 120 months, has a remaining term of 119 months as of the Cut-off Date and
THE INFORMATION IN THIS STRUCTURAL AND COLLATERAL TERM SHEET IS NOT COMPLETE AND MAY BE AMENDED PRIOR TO THE TIME OF SALE. THIS TERM SHEET IS NOT AN OFFER TO SELL THESE SECURITIES AND IT IS NOT A SOLICITATION OF AN OFFER TO BUY THESE SECURITIES IN ANY JURISDICTION WHERE THE OFFER OR SALE IS NOT PERMITTED.
68
| SHOPS AT CENTERPOINT |
requires interest-only payments for the first 60 payments following origination and, thereafter, requires payments of principal and interest based on a 30-year amortization schedule. The Shops at CenterPoint Mortgage Loan matures on July 11, 2024.
Following the lockout period, the borrower has the right to defease the Shops at CenterPoint Mortgage Loan in whole, but not in part, on any date before January 11, 2024. In addition, the Shops at CenterPoint Mortgage Loan is prepayable without penalty on or after January 11, 2024.
Sources and Uses
Sources | Uses | |||||||
Original loan amount | $54,000,000 | 74.3% | Purchase price(1) | $66,450,000 | 91.4% | |||
Sponsor’s new cash contribution | 18,674,967 | 25.7 | Reserves | 5,223,883 | 7.2 | |||
| Closing costs | 1,001,084 | 1.4 | ||||||
Total Sources | $72,674,967 | 100.0% | Total Uses | $72,674,967 | 100.0% |
| (1) | The $1.8 million value attributed to the Free Release Parcels has been deducted from the purchase price even though it is collateral for the Shops at CenterPoint Mortgage Loan. See “Free Release” section. |
The Property. The Shops at CenterPoint Property is an anchored retail center located in Grand Rapids, Michigan that contains approximately 546,109 square feet, of which 461,196 square feet is expected to secure the Shops at CenterPoint Mortgage Loan (following the expected release of the Free Release Parcels as described in the “Free Release” section). Built in 1960 as an enclosed regional mall, the Shops at CenterPoint Property was extensively renovated and “de-malled” from 2012 through 2013 at a cost of approximately $30.0 million and transformed into a class A open-air retail center. During the economic recession in 2008, anchors Steve and Barry’s and Linens ’n Things declared bankruptcy and vacated, and furniture retailer Klingman’s was acquired and relocated, leaving significant vacancies at the Shops at CenterPoint Property. The seller, Lormax Stern, negotiated a discounted payoff with the prior lender in March 2012. See “Description of the Mortgage Pool—Default History, Prior Bankruptcy Issues and Other Proceedings” in the Free Writing Prospectus. Lormax Stern ultimately demolished the three-story, 182,000 square foot former Klingman’s store to make room for TJ Maxx, which expanded from 33,000 square feet to 55,000 square feet and brought sister brand HomeGoods to the Shops at CenterPoint Property, which represents their first location in the Grand Rapids market. The interior corridor space was torn down and replaced with parking and almost all stores now have exterior entrances. Newer stores Dress Barn, Ulta Salon, Rue 21 and Five Below complement existing original stores such as TJ Maxx, Dunham’s, Nordstrom Rack, DSW, Jo Ann’s, Christopher & Banks and David’s Bridal.
The Shops at CenterPoint Property is anchored by Nordstrom Rack, TJ Maxx, Jo Ann’s, Dunham’s and Planet Fitness. The Shops at CenterPoint Property has good visibility and may be entered via three curb cuts along 28th Street, two curb cuts along Beltline Avenue, and six curb cuts along Eastbrook Boulevard. “Outlot F”, which comprises 11,345 square feet (2.5% of net rentable square feet, 6.6% of underwritten base rent) is currently under construction and is expected to be completed in September 2014. Outlot F is leased to five tenants (four restaurant tenants, including Five Guys and Potbelly), which will begin build out shortly after delivery of the space. Furthermore, a Best Buy (not part of the collateral), Toys R Us and Krispy Kreme provide additional draws to the Shops at CenterPoint Property on pad sites near Beltline Avenue and 28th Street. The portion of the Shops at CenterPoint Property leased to Toys R Us (which includes the parcel occupied by Krispy Kreme) and Building B/C may be released from the lien of the Shops at CenterPoint Mortgage Loan, as described in the “Free Release” section. After the release, the Shops at CenterPoint Property will provide approximately 3,639 surface parking spaces, resulting in a parking ratio of 7.9 spaces per 1,000 square feet of rentable area. As of May 19, 2014, the Shops at CenterPoint Property was 89.5% leased (and 87.0% physically occupied) to 38 tenants.
THE INFORMATION IN THIS STRUCTURAL AND COLLATERAL TERM SHEET IS NOT COMPLETE AND MAY BE AMENDED PRIOR TO THE TIME OF SALE. THIS TERM SHEET IS NOT AN OFFER TO SELL THESE SECURITIES AND IT IS NOT A SOLICITATION OF AN OFFER TO BUY THESE SECURITIES IN ANY JURISDICTION WHERE THE OFFER OR SALE IS NOT PERMITTED.
69
| SHOPS AT CENTERPOINT |
The following table presents certain information relating to the tenancy at the Shops at CenterPoint Property:
Major Tenants
| Tenant Name | Credit Rating (Fitch/Moody’s /S&P)(1) | Tenant NRSF | % of NRSF | Annual U/W Base Rent PSF(2) | Annual U/W Base Rent(2) | % of Total Annual U/W Base Rent | Sales PSF(3) | Occupancy Cost(3) | Lease Expiration Date | |||||||
| Anchor Tenants | ||||||||||||||||
| Nordstrom Rack | A-/Baa1/A- | 36,000 | 7.8% | $12.50 | $450,000 | 8.2% | NAV | NAV | 1/31/2017(4) | |||||||
| TJ Maxx | NR/A3/A+ | 52,000 | 11.3% | $8.50 | $442,000 | 8.0% | NAV | NAV | 3/31/2023(5) | |||||||
| Jo Ann’s | NR/Caa1/B | 38,500 | 8.3% | $9.55 | $367,500 | 6.7% | NAV | NAV | 1/31/2020(6) | |||||||
| Dunham’s | NR/NR/NR | 28,235 | 6.1% | $9.75(7) | $275,291(7) | 5.0% | $84 | 11.6% | 1/31/2020(8) | |||||||
| Planet Fitness | NR/B1/NR | 38,459 | 8.3% | $6.01(9) | $231,000(9) | 4.2% | NAP | NAP | 12/31/2023(10) | |||||||
| Total Anchor Tenants | 193,194 | 41.9% | $9.14 | $1,765,791 | 32.0% | |||||||||||
| Major Tenants | ||||||||||||||||
| Golf Galaxy | NR/NR/NR | 20,330 | 4.4% | $13.00 | $264,290 | 4.8% | NAV | NAV | 7/31/2018 | |||||||
| DSW Warehouse | NR/NR/NR | 18,000 | 3.9% | $14.00 | $252,000 | 4.6% | $246(11) | 7.2%(11) | 1/31/2023 | |||||||
| Ulta Salon | NR/NR/NR | 10,712 | 2.3% | $22.00 | $235,664 | 4.3% | NAV | NAV | 5/31/2023 | |||||||
| Cost Plus World Market | NR/NR/BBB+ | 18,661 | 4.0% | $12.50 | $233,263 | 4.2% | NAV | NAV | 1/31/2024 | |||||||
| Old Navy | BBB-/Baa3/BBB- | 15,313 | 3.3% | $12.50 | $191,413 | 3.5% | NAV | NAV | 1/31/2018 | |||||||
| Tuesday Morning | NR/NR/NR | 18,098 | 3.9% | $7.87 | $142,500 | 2.6% | NAV | NAV | 1/31/2019 | |||||||
| Total Major Tenants | 101,114 | 21.9% | $13.05 | $1,319,130 | 23.9% | |||||||||||
Non-Major Tenants(12) | 118,469 | 25.7% | $20.56 | $2,435,745 | 44.1% | |||||||||||
| Occupied Collateral Total | 412,777 | 89.5% | $13.37 | $5,520,666 | 100.0% | |||||||||||
| Vacant Space | 48,419 | 10.5% | ||||||||||||||
| Collateral Total | 461,196 | 100.0% | ||||||||||||||
| (1) | Certain ratings are those of the parent company whether or not the parent guarantees the lease. |
| (2) | Annual U/W Base Rent PSF and Annual U/W Base Rent include contractual rent steps through February 2015. |
| (3) | Sales and occupancy costs are for the trailing 12-month period ending December 31, 2013, unless otherwise noted. |
| (4) | Nordstrom Rack has three, 5-year lease renewal options. |
| (5) | TJ Maxx has four, 5-year lease renewal options. |
| (6) | Jo Ann’s has four, 5-year lease renewal options. |
| (7) | Dunham’s was underwritten to the rental increase occurring in February 2015. Current in-place rent is $251,292 ($8.90 PSF). |
| (8) | Dunham’s has two, 5-year lease renewal options. |
| (9) | Planet Fitness was underwritten to their unabated rent, which will commence in November 2014. Planet Fitness has free rent totaling $24,063 for four months beginning August 11, 2014. A rent concession reserve of $96,250 was established at closing. |
| (10) | Planet Fitness has two, 5-year lease renewal options. |
| (11) | DSW Shoe Warehouse sales and occupancy costs are for the trailing 12-month period ending December 31, 2012. |
| (12) | Occupancy includes Outlot F, which comprises 11,345 square feet and represents 2.5% of the NRSF and 6.6% of Total Annual U/W Base Rent. Construction on Outlot F is expected to be completed in September 2014 and tenants will take occupancy and open for business shortly thereafter. A third-party escrow agent holds a reserve (to which the lender is a party) for the remaining construction cost and outstanding rent, free rent and TI/LCs. See “Escrows” section. |
THE INFORMATION IN THIS STRUCTURAL AND COLLATERAL TERM SHEET IS NOT COMPLETE AND MAY BE AMENDED PRIOR TO THE TIME OF SALE. THIS TERM SHEET IS NOT AN OFFER TO SELL THESE SECURITIES AND IT IS NOT A SOLICITATION OF AN OFFER TO BUY THESE SECURITIES IN ANY JURISDICTION WHERE THE OFFER OR SALE IS NOT PERMITTED.
70
| SHOPS AT CENTERPOINT |
The following table presents certain information relating to the lease rollover schedule at the Shops at CenterPoint Property:
Lease Expiration Schedule(1)(2)
Year Ending December 31, | No. of Leases Expiring | Expiring NRSF | % of Total NRSF | Cumulative Expiring NRSF | Cumulative % of Total NRSF | Annual U/W Base Rent | Annual U/W Base Rent PSF(3) | |||||||||||||
| MTM | 1 | 688 | 0.1% | 688 | 0.1% | $4,800 | $6.98 | |||||||||||||
| 2014 | 0 | 0 | 0.0% | 688 | 0.1% | $0 | $0.00 | |||||||||||||
| 2015 | 0 | 0 | 0.0% | 688 | 0.1% | $0 | $0.00 | |||||||||||||
| 2016 | 2 | 2,525 | 0.5% | 3,213 | 0.7% | $32,709 | $12.95 | |||||||||||||
| 2017 | 4 | 40,877 | 8.9% | 44,090 | 9.6% | $545,558 | $13.35 | |||||||||||||
| 2018 | 5 | 63,730 | 13.8% | 107,820 | 23.4% | $816,147 | $12.81 | |||||||||||||
| 2019 | 8 | 49,491 | 10.7% | 157,311 | 34.1% | $735,570 | $14.86 | |||||||||||||
| 2020 | 2 | 66,735 | 14.5% | 224,046 | 48.6% | $642,791 | $9.63 | |||||||||||||
| 2021 | 0 | 0 | 0.0% | 224,046 | 48.6% | $0 | $0.00 | |||||||||||||
| 2022 | 3 | 20,500 | 4.4% | 244,546 | 53.0% | $528,200 | $25.77 | |||||||||||||
| 2023 | 6 | 130,715 | 28.3% | 375,261 | 81.4% | $1,384,914 | $10.59 | |||||||||||||
| 2024 | 7 | 37,516 | 8.1% | 412,777 | 89.5% | $829,977 | $22.12 | |||||||||||||
| Thereafter | 0 | 0 | 0.0% | 412,777 | 89.5% | $0 | $0.00 | |||||||||||||
| Vacant | 0 | 48,419 | 10.5% | 461,196 | 100.0% | $0 | $0.00 | |||||||||||||
| Total/Weighted Average | 38 | 461,196 | 100.0% | $5,520,666 | $13.37 | |||||||||||||||
| (1) | Information obtained from the underwritten rent roll. |
| (2) | Certain tenants may have lease termination options that are exercisable prior to the originally stated expiration date of the subject lease and that are not considered in the Lease Expiration Schedule. |
| (3) | Weighted Average Annual U/W Base Rent PSF excludes vacant space. |
The following table presents historical occupancy percentages at the Shops at CenterPoint Property:
Historical Occupancy(1)
12/31/2011(1) | 12/31/2012(2) | 12/31/2013(2) | 5/19/2014(3) | |||
NAV | 88.3% | 89.6% | 89.5% |
| (1) | Limited historical information is available and is not necessarily reflective of current performance. The Shops at CenterPoint Property was formerly an approximately 750,000 square foot enclosed mall which was extensively renovated into an open-air retail center from 2012 to 2013. |
| (2) | The December 31, 2012 and December 31, 2013 occupancies exclude the square footage attributed to Outlot F and include the square footage attributed to the improvements on the Free Release Parcels. See “Free Release” section. |
| (3) | Information obtained from the underwritten rent roll. Current occupancy includes 11,345 square feet comprising Outlot F, which represents 2.5% of the net rentable area and 6.6% of the underwritten base rent. Construction on Outlot F is expected to be completed in September 2014 and tenants will take occupancy and open for business shortly thereafter. A third-party escrow agent holds a reserve (to which the lender is a party) for the remaining construction cost and outstanding free rent and TI/LCs. Occupancy excluding these tenants is 87.0%. |
THE INFORMATION IN THIS STRUCTURAL AND COLLATERAL TERM SHEET IS NOT COMPLETE AND MAY BE AMENDED PRIOR TO THE TIME OF SALE. THIS TERM SHEET IS NOT AN OFFER TO SELL THESE SECURITIES AND IT IS NOT A SOLICITATION OF AN OFFER TO BUY THESE SECURITIES IN ANY JURISDICTION WHERE THE OFFER OR SALE IS NOT PERMITTED.
71
| SHOPS AT CENTERPOINT |
Operating History and Underwritten Net Cash Flow. The following table presents certain information relating to the historical operating performance and Underwritten Net Cash Flow at the Shops at CenterPoint Property:
Cash Flow Analysis(1)
| 2013 | TTM 4/30/2014(2) | U/W(2) | U/W $ per SF | ||||||
| Base Rent | $4,591,785 | $4,914,015 | $5,520,666 | $11.97 | |||||
| Grossed Up Vacant Space | 0 | 0 | 877,475 | 1.90 | |||||
| Percentage Rent | 0 | 0 | 0 | 0.00 | |||||
| Total Reimbursables | 1,246,497 | 1,263,058 | 1,392,295 | 3.02 | |||||
| Other Income | 48,550 | 156,078 | 298,550 | 0.65 | |||||
| Less Vacancy & Credit Loss | (194,935) | (194,936) | (877,475)(3) | (1.90) | |||||
| Effective Gross Income | $5,691,897 | $6,138,215 | $7,211,510 | $15.64 | |||||
| Total Operating Expenses | $2,191,200 | $2,199,912 | $2,176,032 | $4.72 | |||||
| Net Operating Income | $3,500,697 | $3,938,303 | $5,035,478 | $10.92 | |||||
| TI/LC | 0 | 0 | 288,460 | 0.63 | |||||
| Capital Expenditures | 0 | 0 | 46,120 | 0.10 | |||||
| Net Cash Flow | $3,500,697 | $3,938,303 | $4,700,898 | $10.19 | |||||
| NOI DSCR | 1.07x | 1.21x | 1.54x | ||||||
| NCF DSCR | 1.07x | 1.21x | 1.44x | ||||||
| NOI DY | 6.5% | 7.3% | 9.3% | ||||||
| NCF DY | 6.5% | 7.3% | 8.7% | ||||||
| (1) | Limited historical information is available and is not necessarily reflective of current performance. The Shops at CenterPoint Property was formerly an approximately 750,000 square foot enclosed mall which was extensively renovated into an open-air retail center from 2012 to 2013. Further, income from the Free Release parcels totaling $369,591 has been excluded from the historical and underwritten cash flow: Toys R Us pays $141,000 annually, Krispy Kreme pays $90,750 annually and Building B/C generates $137,841 in annual rent from three tenants. Also, income from the Big Box Space was not included in the underwritten cash flow, but once reconfigured and leased the appraiser estimates the Big Box Space will generate an initial annual rent of $888,000. |
| (2) | The increase in Effective Gross Income and Net Operating Income from TTM 4/30/2014 to Underwritten is due to the inclusion of the tenants in Outlot F (11,345 square feet; $365,764 of U/W Base Rent), for which outstanding construction costs, TI/LC and free rent were reserved in a third-party held escrow in which the lender has a beneficial interest; new leasing activity totaling approximately 73,308 square feet (15.9% of the net rentable area) and contractual rent increases through February 2015. |
| (3) | The underwritten economic vacancy is 13.7%. The Shops at CenterPoint Property was 89.5% leased and 87.0% physically occupied as of May 19, 2014. |
Appraisal. As of the appraisal valuation date of September 1, 2014, the Shops at CenterPoint Property had an “as-completed” appraised value of $73,600,000, which assumes the release of the Free Release Parcels and the completion of Outlot F. The appraiser concluded to an “as stabilized” value of $84,100,000 as of January 1, 2017, which assumes Outlot F is complete and the Big Box Space has been renovated, leased and the tenants have commenced rent payments. “Big Box Space”, as referenced herein, is the former 37,308 square foot Menard’s space, which will be reconfigured, along with some interior corridor space, into 62,000 square feet of rentable area over the next two years, approximately.
Environmental Matters. According to the Phase I environmental site assessment dated June 24, 2014, there was no evidence of any recognized environmental conditions at the Shops at CenterPoint Property.
Market Overview and Competition. The Shops at CenterPoint Property is located in Grand Rapids, Michigan, at the intersection of East Beltline Avenue and 28th Street approximately 6.7 miles southeast of the Grand Rapids central business district. East Beltline Avenue and 28th Street have a combined daily traffic count of 70,000 vehicles. According to the appraiser, this is the primary intersection in the strongest retail corridor in the Grand Rapids-Wyoming, Michigan metropolitan statistical area. The 28th Street retail corridor has over 3.7 million square feet of retail space and an occupancy rate well above 90%. Furthermore, the Shops at CenterPoint Property is located adjacent to Woodland Mall, a 1.2 million square foot regional mall owned by Pennsylvania REIT. Woodland Mall is anchored by JC Penney, Sears, Macy’s, Kohl’s and Barnes & Noble and is reportedly 99% occupied with in-line sales in excess of $500 per square foot. In-line tenancy includes upscale retailers such as Apple, H&M, Forever 21, The North Face and Williams-Sonoma.
Grand Rapids is the second largest city in Michigan and the largest city in the western portion of the state. Grand Rapids will be the home of Michigan State University’s new $90.0 million medical school campus. Grand Rapids is also home to four Fortune 1000 companies: Steelcase, Universal Forest Products, Spartan Stores, and Herman Miller, in addition to the corporate headquarters of the discount retailer Meijer, Inc. According to a third party market research report, the Grand Rapids-Wyoming, Michigan metropolitan statistical area’s unemployment rate is 5.4%, compared to the national average of 6.3% and 7.5% for the state of Michigan overall (as of May 2014). According to a business news publication, Grand Rapids ranked seventh in “The Happiest Cities to Work In” and fourth for “Best Cities to Find Jobs” for 2013.
According to the appraisal, based on 2014 estimates, the Shops at CenterPoint Property’s trade area encompasses an area within a 20-minute drive time. The 2013 trade area population is 163,501, with an average household income of $69,232 and the median age is 34.3, compared to 37.2 for the United States. According to the appraisal, the Shops at CenterPoint Property is located in the 28th Street Southeast retail submarket. As of first quarter 2014, the submarket reported an inventory of approximately 7.0 million square feet with an 8.1% vacancy rate, a decline from 8.9% as of first quarter 2013. According to the appraisal, the weighted
THE INFORMATION IN THIS STRUCTURAL AND COLLATERAL TERM SHEET IS NOT COMPLETE AND MAY BE AMENDED PRIOR TO THE TIME OF SALE. THIS TERM SHEET IS NOT AN OFFER TO SELL THESE SECURITIES AND IT IS NOT A SOLICITATION OF AN OFFER TO BUY THESE SECURITIES IN ANY JURISDICTION WHERE THE OFFER OR SALE IS NOT PERMITTED.
72
| SHOPS AT CENTERPOINT |
average asking rent for the overall Grand Rapids retail market is $12.42 per square foot, on a triple-net basis. The average asking rental rate for the 28th Street Southeast submarket ranges from $9.00 to $15.00 per square foot, on a triple net basis.
The following table presents certain information relating to comparable retail properties for the Shops at CenterPoint Property:
Competitive Set
Shops at CenterPoint (Subject) | Woodbrook Center | Woodland Mall | Burlington Coat/ABC | Shopping Center | Kentwood Shopping Center | Waterfall Shoppes | |
| Location | Grand Rapids, MI | Grand Rapids, MI | Grand Rapids, MI | Kentwood, MI | Kentwood, MI | Kentwood, MI | Kentwood, MI |
| Distance from Subject | -- | 0.4 miles | 0.4 miles | 0.3 miles | 0.5 miles | 0.7 miles | 1.9 miles |
| Property Type | Anchored Retail | Anchored Retail | Anchored Retail | Anchored Retail | Anchored Retail | Anchored Retail | Anchored Retail |
| Year Built/Renovated | 1960/2014 | 1985/NAP | 1968/1989, 2001, 2005 | 1970’s/NAP | 1998/NAP | 1988/NAP | 2003- 2007/NAP |
| Anchors | Various(1) | Best Buy, Estate Sales Warehouse | Various(2) | Burlington Coat Factory, ABC Warehouse | Petsmart, Michaels, Gazelle Sports | Various(3) | Meijer, GFS Marketplace |
| Total GLA | 461,196 SF | 109,535 SF | 1,160,000 SF | 120,000 SF | 66,602 SF | 274,772 Sf | 371,000 SF |
| Total Occupancy | 90% | 85% | 99% | 100% | 100% | 94% | 100% |
| (1) | See Major Tenants table. |
| (2) | JC Penney, Sears, Macys, Kohl’s, Barnes & Noble, Celebration Cinema, and Apple. |
| (3) | Value City Furniture, Hobby Lobby, Big Lots, OfficeMax and buybuy BABY. |
The Borrower. The borrower is CenterPoint Owner, LLC, a single purpose entity with two independent directors. Legal counsel to the borrower delivered a non-consolidation opinion in connection with the origination of the Shops at CenterPoint Mortgage Loan. The borrower is indirectly owned by AGRE U.S. Real Estate Fund, L.P. (97%), a subsidiary of Apollo Global Management, LLC (“Apollo”) and Stonemar Partners, LLC (“Stonemar”). Greg Guido and Jonathan Gould, principals and founders of Stonemar, are the guarantors of certain nonrecourse carveouts under the Shops at CenterPoint Mortgage Loan.
The Sponsor. The sponsors are Apollo and Stonemar. The Shops at CenterPoint Property acquisition is the first transaction as part of a larger strategic joint venture. Apollo is a global alternative investment manager, with approximately $159.0 billion of assets under management as of March 31, 2014 in private equity, credit and real estate funds. Apollo targets debt and equity investment opportunities, including the acquisition and recapitalization of real estate portfolios, platforms and operating companies and distressed for control situations. As of March 31, 2014, Apollo’s real estate group had assets under management of approximately $8.9 billion through a combination of investment funds, strategic accounts and Apollo Commercial Real Estate Finance, Inc. (NYSE:ARI), a publicly-traded commercial mortgage real estate investment trust.
Stonemar’s senior executives have acquired, managed, and advised on more than $12.0 billion of real estate-related transactions throughout their careers. Collectively, they have more than 100 years of combined institutional-quality experience in real estate investment, capital markets, property management and redevelopment, leasing, and investor and tenant relations. The firm’s current portfolio is comprised of more than 1.2 million square feet of stabilized, well-located real estate. Stonemar had one prior deed in lieu of foreclosure on a retail property in Des Moines, Iowa due to a significant increase in tax expenses coupled with the economic downturn. See “Description of the Mortgage Pool—Default History, Prior Bankruptcy Issues and Other Proceedings” in the Free Writing Prospectus.
Escrows. The loan documents provide for upfront escrows in the amount of $1,366,000 for deferred maintenance, which includes $875,000 for parking lot repairs, $270,000 for electrical repairs and $221,000 for other miscellaneous items. The immediate repairs are required to be completed by July 1, 2015 and July 1, 2016, as further detailed in the loan documents. The loan documents also provide for upfront escrows in the amount of $3,706,000 for the Big Box Reserve, which consists of a Big Box Capital Expenditure Reserve of $1,225,000 and a Big Box TI/LC Reserve of $2,481,000. The Big Box Capital Expenditure Reserve will be disbursed for costs to demise and create the 62,000 square foot space. The Big Box TI/LC Reserve will be disbursed for costs associated with the tenant improvements and leasing commissions associated with the lease-up of the Big Box Space only. In the event the Big Box space is fully leased upon satisfactory terms for a minimum term of five years without utilizing the full amount of the reserve, the remaining amount may be used by the borrower for general tenant improvement and leasing commissions (“TI/LC”) costs at the Shops at CenterPoint Property.
The loan documents provide for upfront escrows in the amount of $151,883 for tenants that have not yet commenced rental payments ($96,250 for Planet Fitness, $43,005 for Massage Green, and $12,628 for Maurices). The loan documents also provide for ongoing monthly escrow deposits of $8,576 for replacement reserves and $12,500 for TI/LCs (subject to a cap of $500,000). The loan documents do not require monthly escrows for taxes provided (i) no event of default has occurred and is continuing and (ii) the borrower provides the lender with timely proof of payment. The loan documents do not require monthly escrows for insurance provided (i) no event of default has occurred and is continuing; (ii) the insurance is maintained pursuant to one or more blanket insurance polices; and (iii) the borrower provides the lender with timely proof of payment of insurance premiums.
An escrow agreement also governs a third-party held escrow for the construction of Outlot F totaling $2,494,431. The lender is a party to the third party escrow agreement, which governs the disbursement of the seller-escrowed funds. The majority of the
THE INFORMATION IN THIS STRUCTURAL AND COLLATERAL TERM SHEET IS NOT COMPLETE AND MAY BE AMENDED PRIOR TO THE TIME OF SALE. THIS TERM SHEET IS NOT AN OFFER TO SELL THESE SECURITIES AND IT IS NOT A SOLICITATION OF AN OFFER TO BUY THESE SECURITIES IN ANY JURISDICTION WHERE THE OFFER OR SALE IS NOT PERMITTED.
73
| SHOPS AT CENTERPOINT |
reserve is for the remaining contract and construction costs, totaling $1,143,064, one year of rent and reimbursements for the Outlot F tenants, totaling $763,551 and outstanding TI/LC costs, totaling $587,816. The lender does not hold or otherwise control the disbursement of funds, but the lender has the right during an event of default or Cash Trap Event Period (as defined below) to instruct the escrow agent to fund disbursements otherwise payable to the borrower under the escrow agreement into an account designated by the lender. The lender is entitled to such funds in the event of foreclosure. The seller has also executed a master lease in connection with the Outlot F space.
Lockbox and Cash Management. Upon the occurrence of a Cash Trap Event Period, the borrower will be required to establish a lender-controlled lockbox account and cause all rents to be deposited directly into such lockbox account. During a Cash Trap Event Period, all excess funds on deposit in the lockbox account are swept to a lender-controlled subaccount on a monthly basis.
A “Cash Trap Event Period” will commence upon the earlier of (i) the occurrence and continuance of an event of default or (ii) the amortizing debt service coverage ratio falling below 1.10x at the end of any calendar month. A Cash Trap Event Period will expire with regard to clause (i), upon the cure of such event of default and with regard to clause (ii), upon the date that the amortizing debt service coverage ratio is equal to or greater than 1.15x for two consecutive calendar quarters.
However, the borrower will have the ability to cure (and avoid) the Cash Trap Event Period described in clause (ii) above by depositing cash or delivering an acceptable letter of credit equal to 125% of the excess cash flow which would have been swept and retained by the lender assuming an amortizing debt service coverage ratio of 1.10x for the succeeding 12-month period. If the Cash Trap Event Period described in clause (ii) above has not been cured 12 months after depositing cash or delivery of a letter of credit, a “Continuing Cash Trap Event Period” will be triggered. However, the borrower will have the ability to cure (and avoid) the Continuing Cash Trap Event Period by depositing cash or delivering an acceptable letter of credit equal to 125% of the excess cash flow which would have been swept and retained by the lender assuming an amortizing debt service coverage ratio of 1.10x for the succeeding 12-month period. Upon achieving an amortizing debt service coverage ratio of 1.15x at the end of two consecutive quarters, the cash or letter of credit delivered in connection with such cure will be released to the borrower. The aforementioned scenarios are only permitted as long as CenterPoint Owner LLC is still the borrower, or AGRE U.S. Real Estate Fund, L.P. owns at least 51.0% of the borrower.
Property Management. The Shops at CenterPoint Property is managed by Stonemar Properties, an affiliate of the borrower.
Assumption. The borrower has a two-time right to transfer the Shops at CenterPoint Property, provided that no event of default has occurred and is continuing and certain other conditions are satisfied, including, but not limited to the following: (i) the lender’s reasonable determination that the proposed transferee and guarantor satisfy the lender’s credit review and underwriting standards, taking into consideration transferee’s experience, financial strength and general business standing; (ii) execution of a recourse guaranty and an environmental indemnity by an affiliate of the transferee; and (iii) if requested by the lender, rating agency confirmation from DBRS, Moody’s and Morningstar that the transfer will not result in a downgrade, withdrawal or qualification of the respective ratings assigned to the Series 2014-C21 Certificates.
Partial Release. Not permitted.
Free Release. Provided no event of default exists, the borrower is permitted to release Toys R Us (which includes the parcel occupied by Krispy Kreme) and Building B/C parcels (the “Free Release Parcels”) from the lien of the Shops at CenterPoint Mortgage Loan, provided that (i) separate tax parcel identifications have been created for the collateral to be released and (ii) reciprocal easement agreements acceptable to the lender have been delivered. No value has been attributed to nor has any income been underwritten from the Free Release Parcels or the related tenants.
Real Estate Substitution. Not permitted.
Subordinate and Mezzanine Indebtedness. There is no existing mezzanine debt in place related to the Shops at CenterPoint Mortgage Loan; however, future mezzanine debt is permitted, up to $10.0 million, subject to satisfaction of certain conditions, including: (i) an intercreditor agreement in form and substance acceptable to DBRS, Moody’s and Morningstar and reasonably acceptable to the lender; (ii) the combined loan-to-value ratio is not greater than 75.0%; (iii) the combined amortizing debt service coverage ratio is not less than 1.30x; and (iv) receipt of rating agency confirmation from DBRS, Moody’s and Morningstar that the mezzanine financing will not result in a downgrade, withdrawal or qualification of the respective ratings assigned to the Series 2014-C21 Certificates.
Ground Lease. None.
Terrorism Insurance. The loan documents require that the “all risk” insurance policy required to be maintained by the borrower provide coverage for terrorism in an amount equal to the full replacement cost of the Shops at CenterPoint Property; provided, however, that the borrowers will not be required to spend more than 200% of the cost of property coverage immediately prior to the date that the Terrorism Risk Insurance Act or a similar government backstop is no longer in effect. The loan documents also require business interruption insurance covering no less than the 24-month period following the occurrence of a casualty event, together with a six-month extended period of indemnity.
THE INFORMATION IN THIS STRUCTURAL AND COLLATERAL TERM SHEET IS NOT COMPLETE AND MAY BE AMENDED PRIOR TO THE TIME OF SALE. THIS TERM SHEET IS NOT AN OFFER TO SELL THESE SECURITIES AND IT IS NOT A SOLICITATION OF AN OFFER TO BUY THESE SECURITIES IN ANY JURISDICTION WHERE THE OFFER OR SALE IS NOT PERMITTED.
74
(THIS PAGE INTENTIONALLY LEFT BLANK)
75
| ALGONQUIN PORTFOLIO |
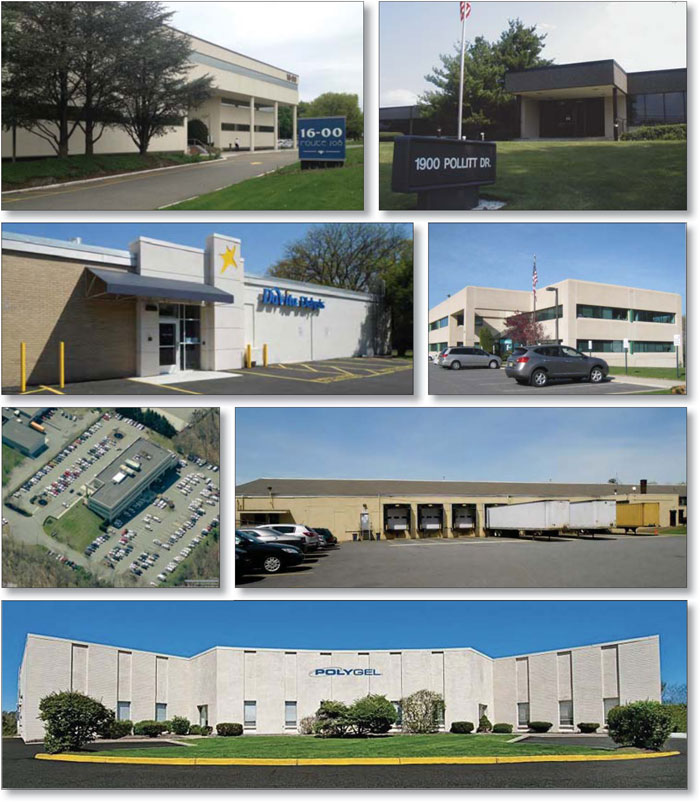
THE INFORMATION IN THIS STRUCTURAL AND COLLATERAL TERM SHEET IS NOT COMPLETE AND MAY BE AMENDED PRIOR TO THE TIME OF SALE. THIS TERM SHEET IS NOT AN OFFER TO SELL THESE SECURITIES AND IT IS NOT A SOLICITATION OF AN OFFER TO BUY THESE SECURITIES IN ANY JURISDICTION WHERE THE OFFER OR SALE IS NOT PERMITTED.
76
| ALGONQUIN PORTFOLIO |
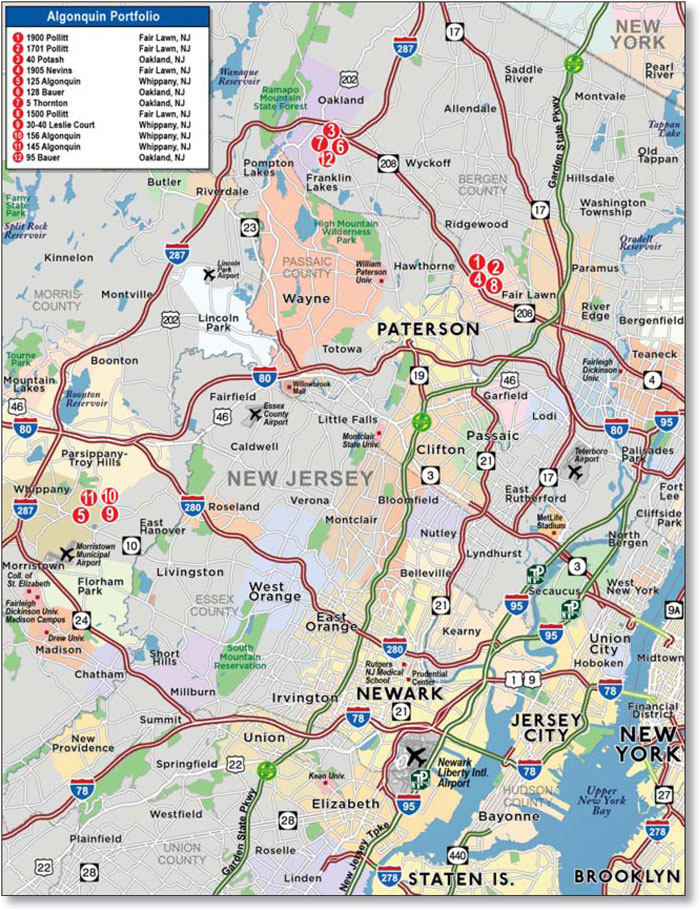
THE INFORMATION IN THIS STRUCTURAL AND COLLATERAL TERM SHEET IS NOT COMPLETE AND MAY BE AMENDED PRIOR TO THE TIME OF SALE. THIS TERM SHEET IS NOT AN OFFER TO SELL THESE SECURITIES AND IT IS NOT A SOLICITATION OF AN OFFER TO BUY THESE SECURITIES IN ANY JURISDICTION WHERE THE OFFER OR SALE IS NOT PERMITTED.
77
| No. 7 – Algonquin Portfolio | |||||||
| Loan Information | Property Information | ||||||
| Mortgage Loan Seller: | The Royal Bank of Scotland | Single Asset/Portfolio: | Portfolio | ||||
| Credit Assessment (DBRS/Moody’s/Morningstar): | NR/NR/NR | Property Type: | Various – See Table | ||||
| Original Principal Balance: | $49,500,000 | Specific Property Type: | Various | ||||
| Cut-off Date Principal Balance: | $49,500,000 | Location: | Various – See Table | ||||
| % of Initial Pool Balance: | 3.5% | Size: | 750,823 SF | ||||
| Loan Purpose: | Refinance | Cut-off Date Principal Balance Per SF: | $65.93 | ||||
| Borrower Names: | Various(1) | Year Built/Renovated: | Various – See Table | ||||
| Sponsor: | Kushner Companies | Title Vesting: | Fee | ||||
| Mortgage Rate: | 4.670% | Property Manager: | Self-managed | ||||
| Note Date: | May 27, 2014 | 3rd Most Recent Occupancy (As of): | 86.4% (12/31/2011) | ||||
| Anticipated Repayment Date: | NAP | 2nd Most Recent Occupancy (As of): | 96.4% (12/31/2012) | ||||
| Maturity Date: | June 1, 2024 | Most Recent Occupancy (As of): | 84.5% (12/31/2013) | ||||
| IO Period: | 36 months | Current Occupancy (As of): | 90.8% (5/27/2014) | ||||
| Loan Term (Original): | 120 months | ||||||
| Seasoning: | 2 months | Underwriting and Financial Information: | |||||
| Amortization Term (Original): | 360 months | ||||||
| Loan Amortization Type: | Interest-only, Amortizing Balloon | 3rd Most Recent NOI (As of)(3): | $5,967,578 (12/31/2012) | ||||
| Interest Accrual Method: | Actual/360 | 2nd Most Recent NOI (As of)(3): | $4,973,613 (12/31/2013) | ||||
| Call Protection: | L(26),D(90),O(4) | Most Recent NOI (As of): | $4,532,128 (TTM 2/28/2014) | ||||
| Lockbox Type: | Hard/Springing Cash Management | ||||||
| Additional Debt: | None | U/W Revenues: | $6,993,974 | ||||
| Additional Debt Type: | NAP | U/W Expenses: | $2,359,648 | ||||
| U/W NOI: | $4,634,326 | ||||||
Escrows and Reserves(2): | U/W NCF: | $4,277,922 | |||||
U/W NOI DSCR : | 1.51x | ||||||
| Type: | Initial | Monthly | Cap (If Any) | U/W NCF DSCR: | 1.39x | ||
| Taxes | $172,372 | $86,186 | NAP | U/W NOI Debt Yield: | 9.4% | ||
| Insurance | $77,741 | $12,957 | NAP | U/W NCF Debt Yield: | 8.6% | ||
| Replacement Reserves | $12,514 | $12,514 | NAP | As-Is Appraised Value: | $82,850,000 | ||
| TI/LC Reserves | $1,388,056 | Springing | $1,500,000 | As-Is Appraisal Valuation Dates: | Various(4) | ||
| Deferred Maintenance | $336,375 | $0 | NAP | Cut-off Date LTV Ratio: | 59.7% | ||
| Rent Reserves | $34,083 | $0 | NAP | LTV Ratio at Maturity or ARD: | 52.5% | ||
| (1) | See “Borrower” section. |
| (2) | See “Escrows” section. |
| (3) | See “Cash Flow Analysis” section. |
| (4) | See “Appraisal” section. |
The Mortgage Loan. The mortgage loan (the “Algonquin Portfolio Mortgage Loan”) is evidenced by a single promissory note that is secured by a first mortgage encumbering 11 industrial and office properties and one data center property located in New Jersey (the “Algonquin Portfolio Properties”). The Algonquin Portfolio Mortgage Loan was originated on May 27, 2014 by The Royal Bank of Scotland. The Algonquin Portfolio Mortgage Loan had an original principal balance of $49,500,000, has an outstanding principal balance as of the Cut-off Date of $49,500,000 and accrues interest at an interest rate of 4.670% per annum. The Algonquin Portfolio Mortgage Loan had an initial term of 120 months, has a remaining term of 118 months as of the Cut-off Date and requires interest-only payments for the first 36 payments following origination and, thereafter, requires payments of principal and interest based on a 30-year amortization schedule. The Algonquin Portfolio Mortgage Loan matures on June 1, 2024.
Following the lockout period, the borrower has the right to defease the Algonquin Portfolio Mortgage Loan in whole, or in part, on any date before March 1, 2024. In addition, the Algonquin Portfolio Mortgage Loan is prepayable without penalty on or after March 1, 2024.
THE INFORMATION IN THIS STRUCTURAL AND COLLATERAL TERM SHEET IS NOT COMPLETE AND MAY BE AMENDED PRIOR TO THE TIME OF SALE. THIS TERM SHEET IS NOT AN OFFER TO SELL THESE SECURITIES AND IT IS NOT A SOLICITATION OF AN OFFER TO BUY THESE SECURITIES IN ANY JURISDICTION WHERE THE OFFER OR SALE IS NOT PERMITTED.
78
| ALGONQUIN PORTFOLIO |
Sources and Uses
| Sources | Uses | |||||||
| Original loan amount | $49,500,000 | 96.6% | Loan payoff(1)(2) | $45,573,418 | 88.9% | |||
| Sponsor’s new cash contribution | 1,745,800 | 3.4 | Upfront reserves | 4,521,142 | 8.8 | |||
| Closing costs | 1,151,240 | 2.3 | ||||||
| Total Sources | $51,245,800 | 100.0% | Total Uses | $51,245,800 | 100.0% |
| (1) | Loan payoff includes an amount in connection with six negotiated discounted payoff (“DPO”) properties: 1900 Pollitt, 40 Potash, 1905 Nevins, 5 Thornton, 1500 Pollitt and 95 Bauer, which had been encumbered by two cross-collateralized loans. The DPO properties were previously securitized in GMACC 2005-C1. The borrower and special servicer agreed to a DPO, inclusive of held reserves, of $30.7 million, which was $7.8 million less than the remaining principal amount on the previous mortgage loans. See “Description of the Mortgage Pool—Statistical Characteristics of the Mortgage Loans—Default History, Prior Bankruptcy Issues and Other Proceedings” in the Free Writing Prospectus. |
| (2) | The 125 Algonquin, 145 Algonquin, 156 Algonquin and 30-40 Leslie Court properties were previously securitized in BSCMS 2004-PWR5. 1701 Pollitt and 128 Bauer were previously encumbered by bank debt. |
The Properties. The Algonquin Portfolio Mortgage Loan is secured by fee interests in 12 properties consisting of eight industrial properties, three office properties, and one data center, all located in New Jersey. The Algonquin Portfolio Properties comprise a total of 750,823 rentable square feet and range in size from 6,792 square feet to 151,874 square feet. Six of the Algonquin Portfolio Properties are occupied by single tenants, and six are occupied by two or more tenants representing an array of industries including: technology, printing, packaging, medical and others. Eight of the properties (125 Algonquin, 156 Algonquin, 30-40 Leslie Court, 128 Bauer, 1500 Pollitt, 1900 Pollitt, 40 Potash, and 95 Bauer) have experienced 100% occupancy since 2008, and 1905 Nevins has experienced 100% occupancy over the same time period barring part of 2011 during which the property was expanded. As of May 27, 2014, the Algonquin Portfolio Properties were 90.8% occupied by 20 tenants. On average, tenants have occupied their respective spaces in the Algonquin Portfolio Properties for over nine years.
The following table presents certain information relating to the Algonquin Portfolio Properties:
| Property Name – Location | Property Type | Allocated Cut-off Date Principal Balance | % of Portfolio | Occupancy | Year Built/ Renovated | Net Rentable Area (SF) | Appraised Value | |||||||||
| 1900 Pollitt – Fair Lawn, NJ | Data Center | $11,350,000 | 22.9% | 100.0% | 1960/2001 | 77,262 | $21,600,000 | |||||||||
| 1701 Pollitt – Fair Lawn, NJ | Industrial | $6,675,000 | 13.5% | 81.2% | 1958/NAP | 104,304 | $10,000,000 | |||||||||
| 40 Potash – Oakland, NJ | Office | $6,550,000 | 13.2% | 100.0% | 1990/NAP | 60,994 | $8,800,000 | |||||||||
| 1905 Nevins – Fair Lawn, NJ | Industrial | $6,500,000 | 13.1% | 100.0% | 1953/1960 | 150,873 | $9,400,000 | |||||||||
| 125 Algonquin – Whippany, NJ | Industrial | $5,475,000 | 11.1% | 100.0% | 1999/NAP | 71,000 | $7,300,000 | |||||||||
| 128 Bauer – Oakland, NJ | Industrial | $3,150,000 | 6.4% | 100.0% | 1979/NAP | 41,434 | $4,200,000 | |||||||||
| 5 Thornton – Oakland, NJ | Industrial | $3,050,000 | 6.2% | 69.0% | 1973/NAP | 151,874 | $10,400,000 | |||||||||
| 1500 Pollitt – Fair Lawn, NJ | Office | $1,970,000 | 4.0% | 100.0% | 1958/2013 | 18,614 | $3,000,000 | |||||||||
| 30-40 Leslie Court – Whippany, NJ | Industrial | $1,765,000 | 3.6% | 100.0% | 1972/NAP | 23,932 | $2,400,000 | |||||||||
| 156 Algonquin – Whippany, NJ | Industrial | $1,115,000 | 2.3% | 88.1% | 1978/NAP | 20,190 | $2,100,000 | |||||||||
| 145 Algonquin – Whippany, NJ | Industrial | $1,000,000 | 2.0% | 100.0% | 1975/NAP | 23,554 | $2,300,000 | |||||||||
| 95 Bauer – Oakland, NJ | Office | $900,000 | 1.8% | 100.0% | 1974/1991 | 6,792 | $1,350,000 | |||||||||
| Total/Weighted Average | $49,500,000 | 100.0% | 90.8% | 750,823 | $82,850,000 | |||||||||||
THE INFORMATION IN THIS STRUCTURAL AND COLLATERAL TERM SHEET IS NOT COMPLETE AND MAY BE AMENDED PRIOR TO THE TIME OF SALE. THIS TERM SHEET IS NOT AN OFFER TO SELL THESE SECURITIES AND IT IS NOT A SOLICITATION OF AN OFFER TO BUY THESE SECURITIES IN ANY JURISDICTION WHERE THE OFFER OR SALE IS NOT PERMITTED.
79
| ALGONQUIN PORTFOLIO |
The following table presents certain information relating to the tenancies at the Algonquin Portfolio Properties:
Major Tenants
| Tenant Name | Property | Credit Rating (Fitch/Moody’s /S&P)(1) | Tenant NRSF | % of NRSF | Annual U/W Base Rent PSF | Annual U/W Base Rent | % of Total Annual U/W Base Rent | Lease Expiration Date | ||||||||
| Major Tenant | ||||||||||||||||
| Merck/Paid Prescription | 1900 Pollitt | BBB/Baa3/BBB+ | 77,262 | 10.3% | $13.69 | $1,057,717 | 19.7% | 1/31/2016 | ||||||||
| Cablevision | 128 Bauer & 40 Potash | BB-/Ba2/BB- | 71,425 | 9.5% | $10.56 | $754,382 | 14.0% | Various(2) | ||||||||
| Global Transport Logistics | 1905 Nevins | NR/NR/NR | 150,873 | 20.1% | $4.63 | $698,542 | 13.0% | Various(3) | ||||||||
| Aphena Pharma Solutions | 125 Algonquin | NR/NR/NR | 50,000 | 6.7% | $8.69 | $434,672 | 8.1% | 7/31/2016 | ||||||||
| Garden State Lumber | 5 Thornton | NR/NR/NR | 62,882 | 8.4% | $5.08 | $319,441 | 5.9% | 10/31/2018 | ||||||||
| Total Major Tenants | 412,442 | 54.9% | $7.92 | $3,264,754 | 60.7% | |||||||||||
| Non-Major Tenants | 269,294 | 35.9% | $7.85 | $2,114,970 | 39.3% | |||||||||||
| Occupied Collateral Total | 681,736 | 90.8% | $7.89 | $5,379,724 | 100.0% | |||||||||||
| Vacant Space | 69,087 | 9.2% | ||||||||||||||
| Collateral Total | 750,823 | 100.0% | ||||||||||||||
| (1) | Certain ratings are those of the parent company whether or not the parent guarantees the lease. |
| (2) | Cablevision has two leases: 60,994 square feet (8.1% of NRSF and 12.5% of Annual U/W Base Rent) expiring on October 31, 2017, and 10,431 square feet (1.4% of NRSF and 1.6% of Annual U/W Base Rent) expiring on April 30, 2019. |
| (3) | Global Transport Logistics has two leases: 75,572 square feet (10.1% of NRSF and 6.5% of Annual U/W Base Rent) expiring on August 31, 2016, and 75,301 square feet (10.0% of NRSF and 6.5% of Annual U/W Base Rent) expiring on June 30, 2015. |
The following table presents certain information relating to the lease rollover schedule at the Algonquin Portfolio Properties:
Lease Expiration Schedule(1)(2)
Year Ending December 31, | No. of Leases Expiring | Expiring NRSF | % of Total NRSF | Cumulative Expiring NRSF | Cumulative % of Total NRSF | Annual U/W Base Rent | Annual U/W Base Rent PSF(3) | ||||||||
| MTM | 2 | 2,837 | 0.4% | 2,837 | 0.4% | $21,600 | $7.61 | ||||||||
| 2014 | 0 | 0 | 0.0% | 2,837 | 0.4% | $0 | $0.00 | ||||||||
| 2015 | 4 | 112,869 | 15.0% | 115,706 | 15.4% | $743,922 | $6.59 | ||||||||
| 2016 | 6 | 269,728 | 35.9% | 385,434 | 51.3% | $2,311,610 | $8.57 | ||||||||
| 2017 | 3 | 87,191 | 11.6% | 472,625 | 62.9% | $880,158 | $10.09 | ||||||||
| 2018 | 1 | 62,882 | 8.4% | 535,507 | 71.3% | $319,441 | $5.08 | ||||||||
| 2019 | 4 | 85,114 | 11.3% | 620,621 | 82.7% | $548,323 | $6.44 | ||||||||
| 2020 | 1 | 6,792 | 0.9% | 627,413 | 83.6% | $89,043 | $13.11 | ||||||||
| 2021 | 1 | 11,777 | 1.6% | 639,190 | 85.1% | $91,272 | $7.75 | ||||||||
| 2022 | 1 | 23,932 | 3.2% | 663,122 | 88.3% | $161,541 | $6.75 | ||||||||
| 2023 | 0 | 0 | 0.0% | 663,122 | 88.3% | $0 | $0.00 | ||||||||
| 2024 | 0 | 0 | 0.0% | 663,122 | 88.3% | $0 | $0.00 | ||||||||
| Thereafter | 1 | 18,614 | 2.5% | 681,736 | 90.8% | $212,814 | $11.43 | ||||||||
| Vacant | 0 | 69,087 | 9.2% | 750,823 | 100.0% | $0 | $0.00 | ||||||||
| Total / Weighted Average | 24 | 750,823 | 100.0% | 100.0% | $5,379,724 | $7.89 |
| (1) | Information obtained from the underwritten rent roll. |
| (2) | Certain tenants may have lease termination options that are exercisable prior to the originally stated expiration date of the subject lease and that are not considered in the Lease Expiration Schedule. |
| (3) | Weighted Average Annual U/W Base Rent PSF excludes vacant space. |
The following table presents historical occupancy percentages at the Algonquin Portfolio Properties:
Historical Occupancy
12/31/2011(1) | 12/31/2012(1) | 12/31/2013(1) | 5/27/2014(2) | |||
| 86.4% | 96.4% | 84.5% | 90.8% |
| (1) | Information obtained from the borrower. |
| (2) | Information obtained from the underwritten rent roll. |
THE INFORMATION IN THIS STRUCTURAL AND COLLATERAL TERM SHEET IS NOT COMPLETE AND MAY BE AMENDED PRIOR TO THE TIME OF SALE. THIS TERM SHEET IS NOT AN OFFER TO SELL THESE SECURITIES AND IT IS NOT A SOLICITATION OF AN OFFER TO BUY THESE SECURITIES IN ANY JURISDICTION WHERE THE OFFER OR SALE IS NOT PERMITTED.
80
| ALGONQUIN PORTFOLIO |
Operating History and Underwritten Net Cash Flow. The following table presents certain information relating to the historical operating performance and the Underwritten Net Cash Flow at the Algonquin Portfolio Properties:
Cash Flow Analysis
| 2012 | 2013 | TTM 2/28/2014 | U/W | U/W $ per SF | ||||||||||||
| Base Rent | $6,439,908 | $5,406,418 | $5,072,824 | $5,379,724 | $7.17 | |||||||||||
| Grossed Up Vacant Space | 0 | 0 | 0 | 710,180 | 0.95 | |||||||||||
| Total Reimbursables | 1,101,920 | 1,261,677 | 1,287,840 | 1,614,250 | 2.15 | |||||||||||
| Other Income | 15,041 | 168,200 | 168,200 | 0 | 0.00 | |||||||||||
| Less Vacancy & Credit Loss | 0 | 0 | 0 | (710,180)(1) | (0.95) | |||||||||||
| Effective Gross Income | $7,556,869 | $6,836,295 | $6,528,864 | $6,993,974 | $9.32 | |||||||||||
| Total Operating Expenses | $1,589,291 | $1,862,682 | $1,996,736 | $2,359,648 | $3.14 | |||||||||||
| Net Operating Income | $5,967,578(2) | $4,973,613(2) | $4,532,128 | $4,634,326 | $6.17 | |||||||||||
| TI/LC | 0 | 0 | 0 | 326,239 | 0.43 | |||||||||||
| Replacement Reserves | 0 | 0 | 0 | 150,165 | 0.20 | |||||||||||
| TI/LC Reserve Adjustment | 0 | 0 | 0 | (120,000) | (0.16) | |||||||||||
| Net Cash Flow | $5,967,578 | $4,973,613 | $4,532,128 | $4,277,922 | $5.70 | |||||||||||
| NOI DSCR | 1.94x | 1.62x | 1.48x | 1.51x | ||||||||||||
| NCF DSCR | 1.94x | 1.62x | 1.48x | 1.39x | ||||||||||||
| NOI DY | 12.1% | 10.0% | 9.2% | 9.4% | ||||||||||||
| NCF DY | 12.1% | 10.0% | 9.2% | 8.6% |
| (1) | The underwritten economic vacancy is 9.2%. The Algonquin Portfolio Properties were 90.8% physically occupied as of May 27, 2014. |
| (2) | 2013 NOI is lower than 2012 NOI due to a major tenant terminating its lease at the 5 Thornton Property in 2012, and the sole tenant at the 40 Potash Property having its lease rate reset at a lower rate. The 5 Thornton property is now 69.0% leased to Garden State Lumber and Carefusion/Vital Signs. |
Appraisal. As of the appraisal valuation dates ranging from May 7, 2014 to May 9, 2014 the Algonquin Portfolio Properties had an aggregate “as-is” appraised value of $82,850,000.
Environmental Matters. According to the Phase I environmental site assessments dated from May 9, 2014 to May 15, 2014, there was no evidence of any recognized environmental conditions (“REC”) at 11 of the 12 Algonquin Portfolio Properties. The 1701 Pollitt property is identified as having a REC related to one observation well and one groundwater monitoring well on the northern portion of the 1701 Pollitt property associated with the Fair Lawn Well Field Superfund Site, located one quarter of a mile from the 1701 Pollitt property. Investigations associated with this site were conducted on behalf of the potentially responsible parties, Eastman Kodak Company, Sandvik, Inc. and Fisher Scientific Company LLC (collectively, the “PRP Group”). As part of a remediation investigation, an evaluation of potential vapor intrusion was performed on the 1701 Pollitt property. Based on the results of investigations conducted in May 2009 and April 2011, levels of trichloroethene and benzene were found that exceeded the screening criteria of the Environmental Protection Agency (the “EPA”). The potential for vapor intrusion is currently being evaluated under the oversight of the EPA. In the event that the EPA determines that additional sampling or mitigation is required, the cost associated with this work will be the responsibility of the PRP Group, and the work will be performed under EPA oversight. Accordingly, the 1701 Pollitt Phase I recommended continued involvement with the EPA on such evaluation and remediation. See “Description of the Mortgage Pool—Environmental Considerations” in the Free Writing Prospectus.
Market Overview. The Algonquin Portfolio Properties are located in Northern New Jersey. Four properties totaling 351,053 square feet are located in Fair Lawn, New Jersey; four properties totaling 261,094 square feet are located in Oakland, New Jersey; and the remaining four properties totaling 138,676 square feet are located in Whippany, New Jersey.
Northern New Jersey is a prime location for warehouse and distribution facilities due to the region’s access to local and interstate highways, railroad networks, waterways, and international ports. Traditionally, Northern New Jersey’s industrial market has served many of the northeast region’s manufacturing industries and warehouse activity. According to the appraisals, a recently emerging market trend in Northern New Jersey is the backfilling of older warehouse/distribution space with data centers as the region has become a hub for data center construction due to its proximity to New York City. According to a third party market research report, as of the first quarter of 2014, the Northern New Jersey industrial market had a reported vacancy rate of 7.9% and average asking rents of $6.02 per square foot for warehouse space and $9.55 per square foot for high-tech space, both on a triple-net basis.
The Northern New Jersey office market is driven by the professional and business services and the trade, transportation and utilities industries. Additionally, Northern New Jersey is a hub for many pharmaceutical, healthcare and high-tech companies. As of the first quarter of 2014, the office market had a vacancy rate of 21.0% and an average asking rent of $27.58 per square foot on a triple-net basis.
The Borrowers. The borrower, collectively, is 19-00 Pollitt Drive Associates, LLC; 17-01 Pollitt Drive Associates, LLC; 40 Potash Road Associates, LLC; 19-05 Nevins Road Associates, LLC; 125 Algonquin Associates, LLC; 128 Bauer Drive Associates, LLC; 5 Thornton Road Associates, LLC; 15-00 Pollitt Drive Associates, LLC; 30 Leslie Associates, LLC; 156 Algonquin Associates, LLC; 145 Algonquin Associates, LLC; and 95 Bauer Drive Associates, LLC, all of which are Delaware limited liability companies and single purpose entities with two independent directors each. Legal counsel to the borrower delivered a non-consolidation
THE INFORMATION IN THIS STRUCTURAL AND COLLATERAL TERM SHEET IS NOT COMPLETE AND MAY BE AMENDED PRIOR TO THE TIME OF SALE. THIS TERM SHEET IS NOT AN OFFER TO SELL THESE SECURITIES AND IT IS NOT A SOLICITATION OF AN OFFER TO BUY THESE SECURITIES IN ANY JURISDICTION WHERE THE OFFER OR SALE IS NOT PERMITTED.
81
| ALGONQUIN PORTFOLIO |
opinion in connection with the origination of the Algonquin Portfolio Mortgage Loan. Jared Kushner is the guarantor of certain nonrecourse carveouts under the Algonquin Portfolio Mortgage Loan.
The Sponsor. The loan sponsor is Kushner Companies, a diversified real estate organization headquartered in New York City. Founded in 1985, Kushner Companies is involved in the ownership, management, development and redevelopment of numerous properties. The Kushner Companies owns 20,000 multifamily apartments as well as 10 million square feet of office, industrial and retail space throughout New York, New Jersey, Pennsylvania, Maryland, Illinois and Ohio. Jared Kushner is President and CEO of Kushner Companies and is the non-recourse carve-out guarantor of the Algonquin Portfolio Mortgage Loan. See “Description of the Mortgage Pool—Statistical Characteristics of the Mortgage Loans—Default History, Prior Bankruptcy Issues and Other Proceedings” in the Free Writing Prospectus.
Escrows. The loan documents provide for upfront escrows in the amount of $336,375 for deferred maintenance, $172,372 for real estate taxes, $77,741 for insurance, $12,514 for replacement reserves, $1,388,056 for tenant improvements and leasing commissions (“TI/LCs”), and $34,083 for rent reserves. The loan documents provide for monthly escrows in the amount of $86,186 for real estate taxes, $12,957 for insurance, $12,514 for replacement reserves, and $25,027 for TI/LCs (subject to a cap of $1,500,000), provided such monthly deposits for TI/LCs shall not be required until the upfront deposit has been reduced below $500,000. Upfront reserves funded at loan closing that have since met release criteria have been released.
Lockbox and Cash Management. The Algonquin Portfolio Mortgage Loan requires a lender-controlled lockbox account for each property, which are already in place, and that the borrower direct tenants to deposit all rents directly into the lockbox accounts and that the borrower and the property manager deposit all rents received into the lockbox account within two business days of receipt. Prior to the occurrence of a Cash Management Period (as defined below), all funds on deposit in the lockbox account will be released to the borrower’s account on a daily basis. During a Cash Management Period, funds on deposit in the lockbox account will be swept on a daily basis into a lender controlled cash management account.
A “Cash Management Period” will commence: (i) if an event of default has occurred and is continuing; (ii) if the amortizing debt service coverage ratio is less than 1.05x as of the end of any calendar quarter; (iii) upon the commencement of a Lease Sweep Period (as defined below); or (iv) any bankruptcy or insolvency proceeding of the property manager. A Cash Management Period will end with respect to clause (i), when such event of default has been cured; with respect to clause (ii), upon the achievement of an amortizing debt service coverage ratio of 1.35x or greater for two consecutive calendar quarters; with respect to clause (iii), when such Lease Sweep Period has ended; and with respect to clause (iv), upon the replacement of the property manager with a new property manager that has been approved by lender.
A “Lease Sweep Period” will commence on the first payment date under the Algonquin Portfolio Mortgage Loan following the occurrence of any of the following: (i) any Major Lease (as defined below) at any of the Algonquin Portfolio Properties is surrendered, cancelled or terminated prior to its then-current expiration date; (ii) the occurrence of a default under any Major Lease; (iii) upon the occurrence of an insolvency proceeding by any tenant under a Major Lease; or (iv) any Major Tenant (as defined below) under a Major Lease discontinues its business at the premises or gives notice that it intends to discontinue its business. A Lease Sweep Period will end upon the earlier to occur of (a) the reasonable determination by lender that sufficient funds have been accumulated in the special rollover reserve subaccount to pay for all anticipated expenses in connection with the re-leasing of the space under the applicable Major Lease that gave rise to the subject Lease Sweep Period; (b) lender’s determination that the related property has achieved an amortizing debt service coverage ratio of at least 1.35x for two consecutive calendar quarters, or (c) the occurrence of any of the following: with respect to clauses (i) or (iv), upon the date on which all of the space demised under the subject Major Lease (or portion thereof) that gave rise to the subject Lease Sweep Period has been fully leased pursuant to a replacement lease or replacement leases approved by lender; with respect to clause (ii), if the subject default has been cured, and no other default under a Major Lease has occurred for a period of six consecutive months following such cure; or with respect to clause (iii), if the applicable Major Tenant insolvency proceeding has terminated and the applicable Major Lease has been affirmed, assumed or assigned in a manner satisfactory to the lender.
A “Major Lease” is defined as any lease which covers 75,000 or more rentable square feet at any of the Algonquin Portfolio Properties.
A “Major Tenant” is defined as any tenant under one or more leases (leased by such tenant and/or its affiliates), which when taken together cover in the aggregate 75,000 or more rentable square feet at any one or more of the Algonquin Portfolio Properties.
Property Management. The Algonquin Portfolio Properties are managed by an affiliate of the borrower.
Assumption. The borrower has the right to transfer all, but not less than all, of the Algonquin Portfolio Properties, subject to customary conditions set forth in the loan documents, including but not limited to: (i) no event of default has occurred and is continuing; (ii) the proposed transferee, the property manager and management agreement are satisfactory to the lender and DBRS, Moody’s and Morningstar; and (iii) the lender has received confirmation from DBRS, Moody’s and Morningstar that such assumption will not result in a downgrade, withdrawal or qualification of the ratings assigned to the Series 2014-C21 Certificates.
Partial Release. On any payment date after August 1, 2016, the borrower may obtain the release of an individual property from the lien of the related mortgage (and the related loan documents) in connection with a partial defeasance upon the satisfaction of certain conditions including but not limited to: (i) no event of default has occurred or is continuing at the time that the release occurs; (ii) the borrower has delivered defeasance collateral in an amount equal to the greater of 100% of the
THE INFORMATION IN THIS STRUCTURAL AND COLLATERAL TERM SHEET IS NOT COMPLETE AND MAY BE AMENDED PRIOR TO THE TIME OF SALE. THIS TERM SHEET IS NOT AN OFFER TO SELL THESE SECURITIES AND IT IS NOT A SOLICITATION OF AN OFFER TO BUY THESE SECURITIES IN ANY JURISDICTION WHERE THE OFFER OR SALE IS NOT PERMITTED.
82
| ALGONQUIN PORTFOLIO |
net sales proceeds or 115% of the allocated loan amount for the property to be released; (iii) after such release, the debt service coverage ratio of the remaining properties must not be less than the greater of (a) the amortizing debt service coverage ratio immediately preceding such release and (b) 1.35x; and (iv) after such release, the loan-to-value ratio of the remaining properties must not be greater than the lesser of (x) the loan-to-value ratio immediately preceding such release and (y) 59.4%.
Real Estate Substitution. Not permitted.
Subordinate and Mezzanine Indebtedness. Not permitted.
Right of First Offer or Right of First Refusal. Kradle to Kindergarten, a tenant at the 95 Bauer property has a Right of First Offer (“ROFO”) to purchase its space in the event that the borrower seeks to sell the 95 Bauer property. The ROFO is not extinguished by foreclosure; however, the ROFO does not apply to foreclosure or deed in lieu thereof.
Ground Lease. None.
Terrorism Insurance. The loan documents require that the “all risk” insurance policy required to be maintained by the borrower provide coverage for terrorism in an amount equal to the full replacement cost of the Algonquin Portfolio Properties. The loan documents also require business interruption insurance covering no less than the 12-month period following the occurrence of a casualty event.
Windstorm Insurance. The loan documents require that the “all risk” insurance policy required to be maintained by the borrower provide coverage for windstorm in an amount equal to the full replacement cost of the Algonquin Portfolio Properties. The loan documents also require business interruption insurance covering no less than the 12-month period following the occurrence of a casualty event.
THE INFORMATION IN THIS STRUCTURAL AND COLLATERAL TERM SHEET IS NOT COMPLETE AND MAY BE AMENDED PRIOR TO THE TIME OF SALE. THIS TERM SHEET IS NOT AN OFFER TO SELL THESE SECURITIES AND IT IS NOT A SOLICITATION OF AN OFFER TO BUY THESE SECURITIES IN ANY JURISDICTION WHERE THE OFFER OR SALE IS NOT PERMITTED.
83
| TRYP BY WYNDHAM TIMES SQUARE SOUTH |

THE INFORMATION IN THIS STRUCTURAL AND COLLATERAL TERM SHEET IS NOT COMPLETE AND MAY BE AMENDED PRIOR TO THE TIME OF SALE. THIS TERM SHEET IS NOT AN OFFER TO SELL THESE SECURITIES AND IT IS NOT A SOLICITATION OF AN OFFER TO BUY THESE SECURITIES IN ANY JURISDICTION WHERE THE OFFER OR SALE IS NOT PERMITTED.
84
| TRYP BY WYNDHAM TIMES SQUARE SOUTH |
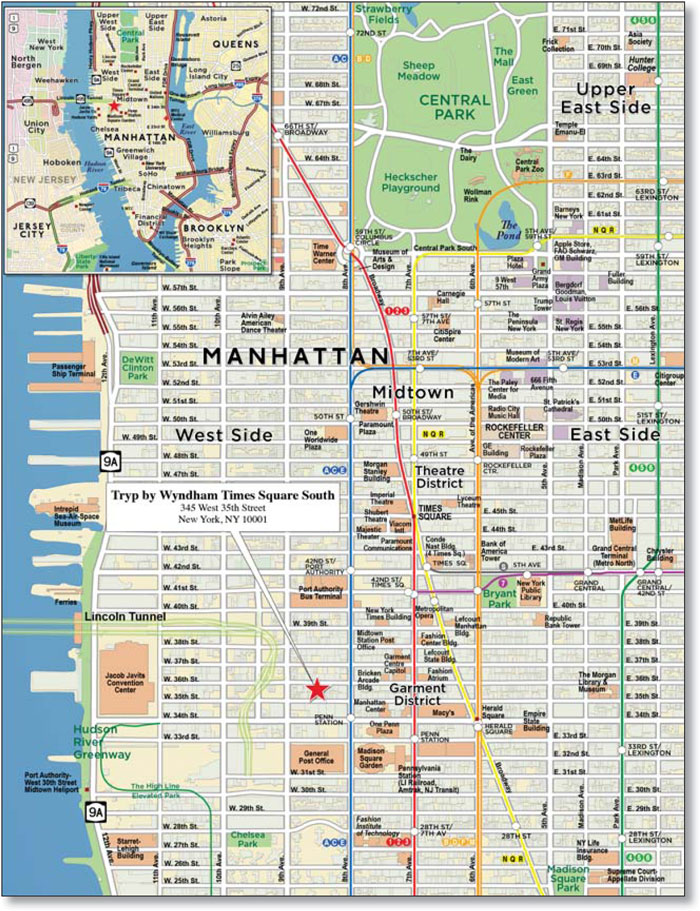
THE INFORMATION IN THIS STRUCTURAL AND COLLATERAL TERM SHEET IS NOT COMPLETE AND MAY BE AMENDED PRIOR TO THE TIME OF SALE. THIS TERM SHEET IS NOT AN OFFER TO SELL THESE SECURITIES AND IT IS NOT A SOLICITATION OF AN OFFER TO BUY THESE SECURITIES IN ANY JURISDICTION WHERE THE OFFER OR SALE IS NOT PERMITTED.
85
| No. 8 – Tryp by Wyndham Times Square South | ||||
| Loan Information | Property Information | |||
| Mortgage Loan Seller: | Wells Fargo Bank, National Association | Single Asset/Portfolio: | Single Asset | |
Credit Assessment (DBRS/Moody’s/Morningstar): | NR/NR/NR | Property Type: | Hospitality | |
| Original Principal Balance: | $47,000,000 | Specific Property Type: | Full Service | |
| Cut-off Date Principal Balance: | $46,879,457 | Location: | New York, NY | |
| % of Initial Pool Balance: | 3.3% | Size: | 173 Rooms | |
| Loan Purpose: | Refinance | Cut-off Date Principal Balance Per Room: | $270,980 | |
| Borrower Name: | Eros Management & Realty, LLC | Year Built/Renovated: | 1926/2012 | |
| Sponsor: | John Sharma | Title Vesting: | Fee | |
| Mortgage Rate: | 4.400% | Property Manager: | WHG Hotel Management, Inc. | |
| Note Date: | June 11, 2014 | 3rd Most Recent Occupancy(3): | NAV | |
| Anticipated Repayment Date: | NAP | 2nd Most Recent Occupancy (As of): | 85.0% (12/31/2012) | |
| Maturity Date: | June 11, 2024 | Most Recent Occupancy (As of): | 88.9% (12/31/2013) | |
| IO Period: | None | Current Occupancy (As of): | 90.1% (4/30/2014) | |
| Loan Term (Original): | 120 months | |||
| Seasoning: | 2 months | Underwriting and Financial Information: | ||
| Amortization Term (Original): | 360 months | |||
| Loan Amortization Type: | Amortizing Balloon | 3rd Most Recent NOI (As of)(4): | $4,686,123 (12/31/2012) | |
| Interest Accrual Method: | Actual/360 | 2nd Most Recent NOI (As of): | $6,223,333 (12/31/2013) | |
| Call Protection: | GRTR 3% or YM (116),O(4) | Most Recent NOI (As of): | $6,381,190 (TTM 4/30/2014) | |
| Lockbox Type: | Hard/Springing Cash Management | |||
Additional Debt(1): | Yes | U/W Revenues: | $15,795,555 | |
Additional Debt Type(1): | Future Mezzanine | U/W Expenses: | $10,435,475 | |
| U/W NOI: | $5,360,080 | |||
| U/W NCF: | $4,728,257 | |||
| U/W NOI DSCR: | 1.90x | |||
| U/W NCF DSCR: | 1.67x | |||
Escrows and Reserves(2): | U/W NOI Debt Yield: | 11.4% | ||
| U/W NCF Debt Yield: | 10.1% | |||||
Type: | Initial | Monthly | Cap (If Any) | As-Is Appraised Value: | $87,200,000 | |
| Taxes | $83,716 | $83,716 | NAP | As-Is Appraisal Valuation Date: | April 11, 2014 | |
| Insurance | $91,158 | $13,023 | NAP | Cut-off Date LTV Ratio: | 53.8% | |
| FF&E Reserve | $52,715 | (2) | NAP | LTV Ratio at Maturity or ARD: | 43.4% |
| (1) | See “Subordinate and Mezzanine Indebtedness” section. |
| (2) | See “Escrows” section. |
| (3) | The Tryp by Wyndham Times Square South Property opened in February 2012. |
| (4) | See “Cash Flow Analysis” section. |
The Mortgage Loan. The mortgage loan (the “Tryp by Wyndham Times Square South Mortgage Loan”) is evidenced by a single promissory note that is secured by a first mortgage encumbering the fee interest in a full service hotel located in New York, New York (the “Tryp by Wyndham Times Square South Property”). The Tryp by Wyndham Times Square South Mortgage Loan was originated on June 11, 2014 by Wells Fargo Bank, National Association. The Tryp by Wyndham Times Square South Mortgage Loan had an original principal balance of $47,000,000, has an outstanding principal balance as of the Cut-off Date of $46,879,457 and accrues interest at an interest rate of 4.400% per annum. The Tryp by Wyndham Times Square South Mortgage Loan had an initial term of 120 months, has a remaining term of 118 months as of the Cut-off Date and requires payments of principal and interest based on a 30-year amortization schedule. The Tryp by Wyndham Times Square South Mortgage Loan matures on June 11, 2024.
The borrower has the right to prepay the Tryp by Wyndham Times Square South Mortgage Loan in whole, but not in part, provided that the borrower pays the greater of a yield maintenance premium or a prepayment premium equal to 3.0% of the principal amount being prepaid, on any date prior to March 11, 2024. In addition, the Tryp by Wyndham Times Square South Property is prepayble without penalty on or after March 11, 2024.
THE INFORMATION IN THIS STRUCTURAL AND COLLATERAL TERM SHEET IS NOT COMPLETE AND MAY BE AMENDED PRIOR TO THE TIME OF SALE. THIS TERM SHEET IS NOT AN OFFER TO SELL THESE SECURITIES AND IT IS NOT A SOLICITATION OF AN OFFER TO BUY THESE SECURITIES IN ANY JURISDICTION WHERE THE OFFER OR SALE IS NOT PERMITTED.
86
| TRYP BY WYNDHAM TIMES SQUARE SOUTH |
| Sources | Uses | |||||||
| Original loan amount | $47,000,000 | 100.0% | Loan payoff | $36,100,776 | 76.8% | |||
| Reserves | 227,589 | 0.5 | ||||||
| Closing costs | 1,375,573 | 2.9 | ||||||
| Return of equity | 9,296,062 | 19.8 | ||||||
| Total Sources | $47,000,000 | 100.0% | Total Uses | $47,000,000 | 100.0% |
The Property. The Tryp by Wyndham Times Square South Property is a 173 room, 15-story, full service hotel located in the Times Square/Theatre District of Manhattan in New York, New York. The Tryp by Wyndham Times Square South Property was built in 1926 and originally used as an office building. From 2010 to 2012, the Tryp by Wyndham Times Square South Property was gut-renovated at a cost of approximately $45.2 million and converted to a hotel that opened in February 2012. The Tryp by Wyndham Times Square South Property contains 118 deluxe rooms, 30 premium rooms, 21 family rooms and two types of specialty rooms. Twenty-three of the deluxe rooms feature a queen bed; 59 feature a king bed; and 36 feature two queen beds. Premium rooms offer additional living space, a second bathroom, and a sleeper sofa. The family rooms are similar in size to the premium rooms with extra bunk beds for children. Finally, the specialty rooms are themed with either fitness or media technology features. The specialty fitness rooms feature an exercise bike and exercise mats and the specialty media technology rooms are equipped with a 3D TV and glasses along with Smart TV capability and premium cable channels. Amenities at the Tryp by Wyndham Times Square South Property include a restaurant and bar which serves breakfast and dinner, a 24-hour fitness center, a business center, a concierge desk, and a rooftop terrace. The Tryp by Wyndham Times Square South Property also features two meeting rooms totaling 1,835 square feet. Although there is no on-site parking lot at the Tryp by Wyndham Times Square South Property, there are five public parking lots or garages within three blocks of the hotel. No franchise agreement is in place and the Tryp by Wyndham Times Square South Property is managed by WHG Hotel Management, Inc., under a 20-year management agreement that expires in February 2032. The sponsor has the option to terminate the management agreement in February 2015 and again in February 2022. In the event that the management agreement is terminated, the borrower must enter into a franchise agreement with Wyndham Hotels which must be approved by lender.
Operating History and Underwritten Net Cash Flow. The following table presents certain information relating to the historical operating performance and the Underwritten Net Cash Flow at the Tryp by Wyndham Times Square South Property:
Cash Flow Analysis
2012(1) | 2013 | TTM 4/30/2014 | U/W | U/W $ per Room | ||||||
| Occupancy | 85.0% | 88.9% | 90.1% | 85.0% | ||||||
| ADR | $250.39 | $260.48 | $259.82 | $275.00 | ||||||
| RevPAR | $212.88 | $231.56 | $234.05 | $233.75 | ||||||
| Total Revenue | $13,424,843 | $15,715,843 | $15,814,782 | $15,795,555 | $91,304 | |||||
| Total Department Expenses | 4,516,406 | 4,744,019 | 4,681,344 | 4,560,602 | 26,362 | |||||
| Gross Operating Profit | $8,908,437 | $10,971,824 | $11,133,438 | $11,234,953 | $64,942 | |||||
| Total Undistributed Expenses | 3,740,297 | 4,118,207 | 4,007,504 | 4,165,042 | 24,075 | |||||
| Profit Before Fixed Charges | $5,168,140 | $6,853,617 | $7,125,934 | $7,069,911 | $40,867 | |||||
| Total Fixed Charges | 482,017 | 630,284 | 744,744(2) | 1,709,831(2) | 9,883 | |||||
| Net Operating Income | $4,686,123 | $6,223,333 | $6,381,190 | $5,360,080 | $30,983 | |||||
| FF&E | 631,822 | 3,652 | ||||||||
| Net Cash Flow | $4,686,123 | $6,223,333 | $6,381,190 | $4,728,257 | $27,331 | |||||
| NOI DSCR | 1.66x | 2.20x | 2.26x | 1.90x | ||||||
| NCF DSCR | 1.66x | 2.20x | 2.26x | 1.67x | ||||||
| NOI DY | 10.0% | 13.3% | 13.6% | 11.4% | ||||||
| NCF DY | 10.0% | 13.3% | 13.6% | 10.1% | ||||||
| (1) | The Tryp by Wyndham Times Square South Property opened in February 2012. |
| (2) | The Tryp by Wyndham Times Square South Property benefits from an Industrial and Commercial Abatement Program (“ICAP”), which results in a reduced property tax expense. The property tax expense as of the trailing-twelve months ending April 30, 2014 was $594,138. The ICAP expires in 2024 and is phased out during the final four years of the program. The U/W property tax expense of $1,561,000 is based on a fully assessed property value, deducting the present value of the ICAP savings (using a 9.4% discount rate) and capitalized at 10.5%. |
Appraisal. As of the appraisal valuation date of April 11, 2014, the Tryp by Wyndham Times Square South Property had an “as-is” appraised value of $87,200,000.
Environmental Matters. According to the Phase I environmental site assessment dated April 29, 2014, there was no evidence of any recognized environmental conditions at the Tryp by Wyndham Times Square South Property.
THE INFORMATION IN THIS STRUCTURAL AND COLLATERAL TERM SHEET IS NOT COMPLETE AND MAY BE AMENDED PRIOR TO THE TIME OF SALE. THIS TERM SHEET IS NOT AN OFFER TO SELL THESE SECURITIES AND IT IS NOT A SOLICITATION OF AN OFFER TO BUY THESE SECURITIES IN ANY JURISDICTION WHERE THE OFFER OR SALE IS NOT PERMITTED.
87
| TRYP BY WYNDHAM TIMES SQUARE SOUTH |
Market Overview and Competition. The Tryp by Wyndham Times Square South Property is located on the north side of West 35th Street between 8th Avenue and 9th Avenue in Manhattan. The Tryp by Wyndham Times Square South Property is located two blocks north of Pennsylvania Station, one of Manhattan’s primary transportation hubs, and is accessible via bus, subway train, car and taxi. Major demand generators include Times Square and the many surrounding businesses, located seven blocks north; the Jacob K. Javits Convention Center, located three blocks west; the 5th Avenue shopping area located three blocks west; and Broadway, located two blocks east. Madison Square Garden and the Garden Theatre, located two blocks south, are also demand generators, hosting a number of sporting, musical, and other entertainment events including Manhattan’s professional sports teams. According to the appraisal, in 2013, New York City accommodated a record number of approximately 54.3 million visitors and the overall economic impact was estimated to be $58.7 billion. In 2013, the Manhattan lodging market had an average occupancy of 86.7%, ADR of $285.87, and RevPAR of $247.74. Occupancy, ADR, and RevPAR for the Manhattan lodging market have increased 4.0%, 11.6%, and 16.0%, respectively, since 2010.
The following table presents certain information relating to the Tryp by Wyndham Times Square South Property’s competitive set:
Subject and Market Historical Occupancy, ADR and RevPAR(1)
Competitive Set | Tryp by Wyndham Times Square South | Penetration Factor | ||||||||||||||||
Year | Occupancy | ADR | RevPAR | Occupancy | ADR | RevPAR | Occupancy | ADR | RevPAR | |||||||||
| 4/30/2014 TTM | 94.2% | $246.64 | $232.39 | 90.1% | $259.82 | $234.05 | 95.6% | 105.3% | 100.7% | |||||||||
| 4/30/2013 TTM | 94.8% | $242.86 | $230.19 | 88.1% | $246.64 | $217.26 | 92.9% | 101.6% | 94.4% | |||||||||
| 4/30/2012 TTM | 92.1% | $229.48 | $211.34 | 70.3% | $215.46 | $151.48 | 76.3% | 93.9% | 71.7% | |||||||||
| (1) | Information obtained from a third party hospitality report dated May 19, 2014. The competitive set includes the following hotels: Wingate by Wyndham New York City, Fairfield Inn & Suites New York Manhattan Times Square, Four Points Midtown Times Square, Candlewood Suites New York City Times Square, Hampton Inn Manhattan 35th Street Empire State Building, Hilton Garden Inn New York West 35th Street and The Strand. |
The Borrower. The borrower is Eros Management & Realty, LLC, a New York limited liability company and a single purpose entity with one independent director. Legal counsel to the borrower delivered a non-consolidation opinion in connection with the origination of the Tryp by Wyndham Times Square South Mortgage Loan. John Sharma is the guarantor of certain nonrecourse carveouts under the Tryp by Wyndham Times Square South Mortgage Loan.
The Sponsor. The sponsor is John Sharma. In addition to the Tryp by Wyndham Times Square South Property, Mr. Sharma owns the 51-room Econo Lodge Times Square and the 74-room JFK Inn located in Queens, New York. Mr. Sharma is developing a third New York City hotel located in Manhattan, The Paul, which is scheduled to open in the fall of 2014. In addition, Mr. Sharma owns and operates Pan Express Travel Inc., a global wholesale and retail travel agency with offices in New York, New York, Seattle, Washington, San Francisco, California Toronto, Canada, London, England and Delhi, India.
Escrows. The loan documents provide for upfront escrows in the amount of $83,716 for real estate taxes, $91,158 for insurance and $52,715 for FF&E. The loan documents provide for ongoing monthly reserves in the amount of $83,716 for real estate taxes and $13,023 for insurance. The loan documents provide for monthly escrows for FF&E in an amount equal to the greater of (i) 4.0% of gross room revenue or (ii) the amount, if any, required to be reserved under the management agreement for FF&E monthly reserve deposits.
Lockbox and Cash Management. The Tryp by Wyndham Times Square South Mortgage Loan requires a lender-controlled lockbox account, which is already in place, and that the borrower direct all receipts payable with respect to the Tyrp by Wyndham Times Square South Property directly into the lockbox account. The loan documents also require all revenues received by the borrower or the property manager to be deposited into the lockbox account within two business days of receipt. Prior to the occurrence of a Cash Trap Event Period (as defined below), all excess funds on deposit in the lockbox account are disbursed to the borrower. During a Cash Trap Event Period, all excess cash flow is swept on a monthly basis to a lender-controlled cash management account.
A “Cash Trap Event Period” will commence upon the earlier of (i) the occurrence and continuance of an event of default or (ii) the debt service coverage ratio falling below 1.20x at the end of any calendar month. A Cash Trap Event Period will expire, with regard to clause (i), upon the cure of such event of default, or with regard to clause (ii), upon the date that the debt service coverage ratio is equal to or greater than 1.30x for two consecutive calendar quarters.
Property Management. The Tryp by Wyndham Times Square South Property is managed by WHG Hotel Management, Inc.
Assumption. The borrower has the two-time right to transfer the Tryp by Wyndham Times Square South Property provided that certain conditions are satisfied, including (i) no event of default has occurred and is continuing; (ii) the lender reasonably determined that the proposed transferee and guarantor satisfy the lender’s credit review and underwriting standards, taking into consideration transferee experience, financial strength and general business standing; and (iii) the lender has received confirmation from DBRS, Moody’s and Morningstar that such assumption will not result in a downgrade, withdrawal or qualification of the respective ratings assigned to the Series 2014-C21 Certificates.
Partial Release. Not permitted.
Real Estate Substitution. Not permitted.
THE INFORMATION IN THIS STRUCTURAL AND COLLATERAL TERM SHEET IS NOT COMPLETE AND MAY BE AMENDED PRIOR TO THE TIME OF SALE. THIS TERM SHEET IS NOT AN OFFER TO SELL THESE SECURITIES AND IT IS NOT A SOLICITATION OF AN OFFER TO BUY THESE SECURITIES IN ANY JURISDICTION WHERE THE OFFER OR SALE IS NOT PERMITTED.
88
| TRYP BY WYNDHAM TIMES SQUARE SOUTH |
Subordinate and Mezzanine Indebtedness. There is no existing mezzanine debt in place related to the Tryp by Wyndham Times Square South Property; however the borrower has the right to incur mezzanine financing subject to the satisfaction of certain conditions including (i) no event of default has occurred and is continuing; (ii) the execution of an intercreditor agreement in form and substance acceptable to DBRS, Moody’s and Morningstar and reasonably acceptable to the lender; (ii) the combined loan-to-value ratio is not greater than 70.0%; (iii) the combined debt service coverage ratio is not less than 1.30x; and (iv) receipt of rating agency confirmation from DBRS, Moody’s and Morningstar that the mezzanine financing will not result in a downgrade, withdrawal or qualification of the respective ratings assigned to the Series 2014-C21 Certificates.
Right of First Offer or Right of First Refusal. WHG Hotel Management, Inc. has a Right of First Offer (“ROFO”) and Right of First Refusal (“ROFR”) to purchase the Tryp by Wyndham Times Square South Property if the borrower markets the Tryp by Wyndham Times Square South Property for sale or if a third party offer is received that borrower is prepared to accept. The ROFO and ROFR are not extinguished by foreclosure; however, the ROFR does not apply to foreclosure or deed in lieu thereof.
Ground Lease. None.
Terrorism Insurance. The loan documents require that the “all risk” insurance policy required to be maintained by the borrower provide coverage for terrorism in an amount equal to the full replacement cost of the Tryp by Wyndham Times Square South Property, as well as business interruption insurance covering no less than the 18-month period following the occurrence of a casualty event, together with a six-month extended period of indemnity.
THE INFORMATION IN THIS STRUCTURAL AND COLLATERAL TERM SHEET IS NOT COMPLETE AND MAY BE AMENDED PRIOR TO THE TIME OF SALE. THIS TERM SHEET IS NOT AN OFFER TO SELL THESE SECURITIES AND IT IS NOT A SOLICITATION OF AN OFFER TO BUY THESE SECURITIES IN ANY JURISDICTION WHERE THE OFFER OR SALE IS NOT PERMITTED.
89
MONTGOMERY MALL |

THE INFORMATION IN THIS STRUCTURAL AND COLLATERAL TERM SHEET IS NOT COMPLETE AND MAY BE AMENDED PRIOR TO THE TIME OF SALE. THIS TERM SHEET IS NOT AN OFFER TO SELL THESE SECURITIES AND IT IS NOT A SOLICITATION OF AN OFFER TO BUY THESE SECURITIES IN ANY JURISDICTION WHERE THE OFFER OR SALE IS NOT PERMITTED.
90
MONTGOMERY MALL |
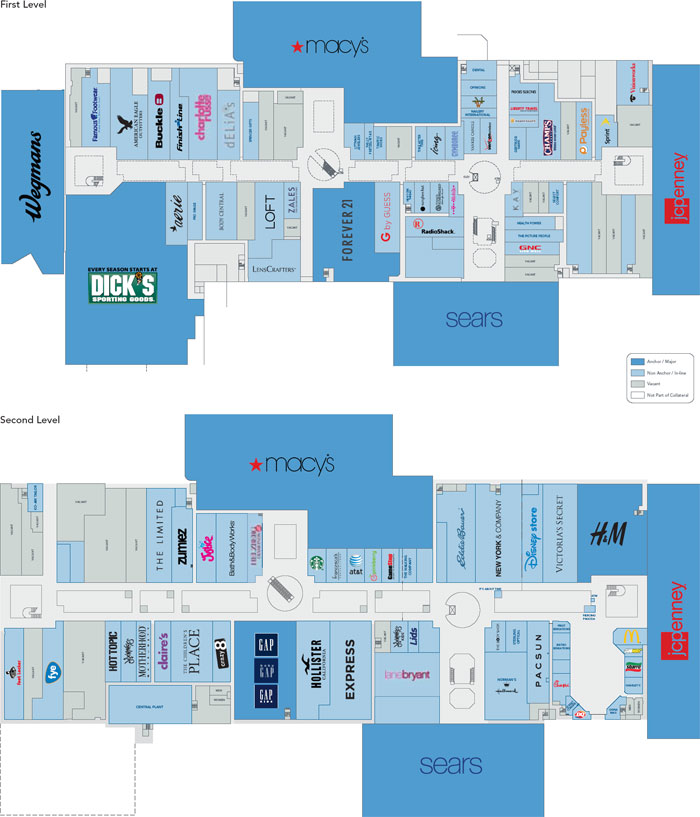
THE INFORMATION IN THIS STRUCTURAL AND COLLATERAL TERM SHEET IS NOT COMPLETE AND MAY BE AMENDED PRIOR TO THE TIME OF SALE. THIS TERM SHEET IS NOT AN OFFER TO SELL THESE SECURITIES AND IT IS NOT A SOLICITATION OF AN OFFER TO BUY THESE SECURITIES IN ANY JURISDICTION WHERE THE OFFER OR SALE IS NOT PERMITTED.
91
MONTGOMERY MALL |
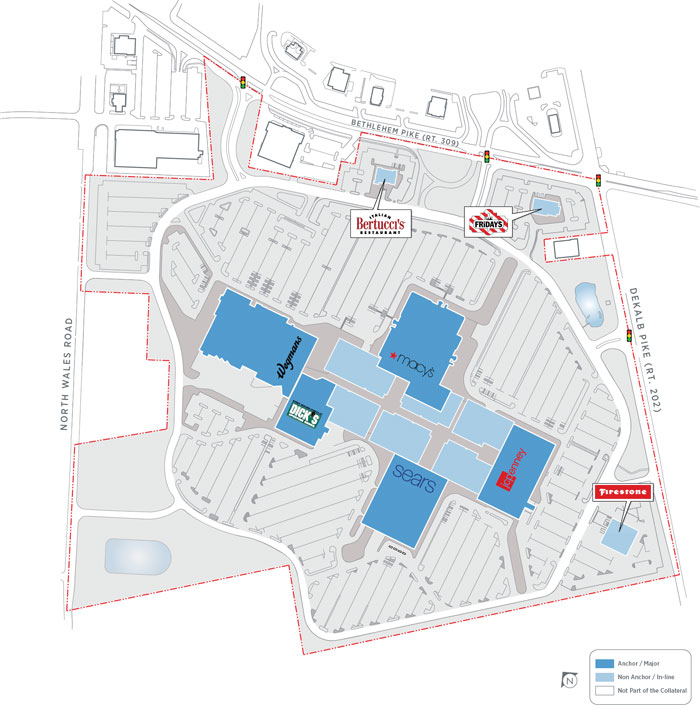
THE INFORMATION IN THIS STRUCTURAL AND COLLATERAL TERM SHEET IS NOT COMPLETE AND MAY BE AMENDED PRIOR TO THE TIME OF SALE. THIS TERM SHEET IS NOT AN OFFER TO SELL THESE SECURITIES AND IT IS NOT A SOLICITATION OF AN OFFER TO BUY THESE SECURITIES IN ANY JURISDICTION WHERE THE OFFER OR SALE IS NOT PERMITTED.
92
MONTGOMERY MALL |
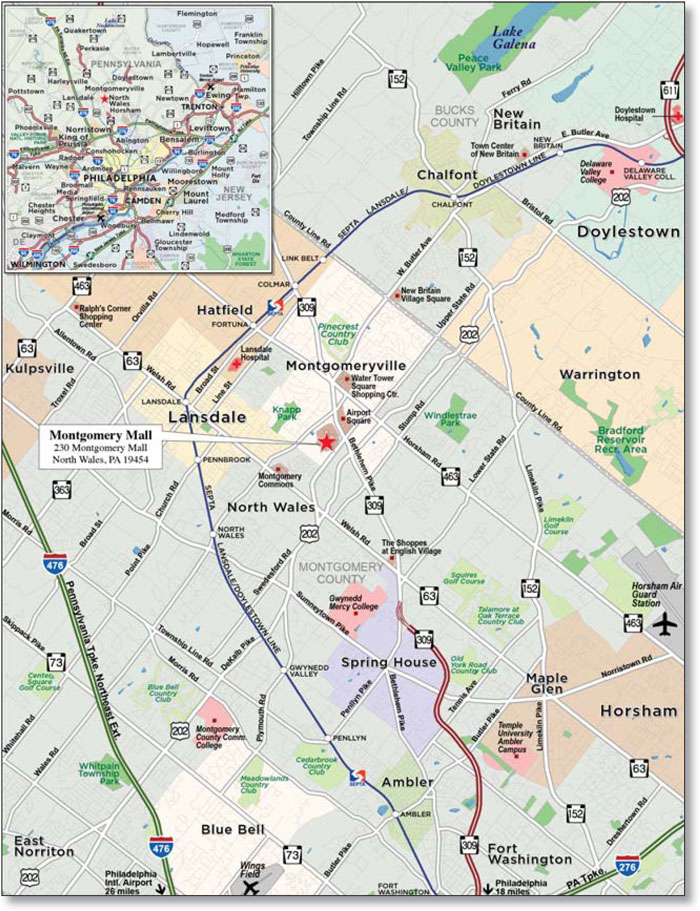
THE INFORMATION IN THIS STRUCTURAL AND COLLATERAL TERM SHEET IS NOT COMPLETE AND MAY BE AMENDED PRIOR TO THE TIME OF SALE. THIS TERM SHEET IS NOT AN OFFER TO SELL THESE SECURITIES AND IT IS NOT A SOLICITATION OF AN OFFER TO BUY THESE SECURITIES IN ANY JURISDICTION WHERE THE OFFER OR SALE IS NOT PERMITTED.
93
| No. 9 – Montgomery Mall | |||||||
| Loan Information | Property Information | ||||||
| Mortgage Loan Seller: | The Royal Bank of Scotland | Single Asset/Portfolio: | Single Asset | ||||
Credit Assessment (DBRS/Moody’s/Morningstar): | NR/NR/NR | Property Type: | Retail | ||||
Original Principal Balance(1): | $46,000,000 | Specific Property Type: | Regional Mall | ||||
Cut-off Date Principal Balance(1): | $46,000,000 | Location: | North Wales, PA | ||||
| % of Initial Pool Balance: | 3.2% | Size: | 1,109,341 SF | ||||
| Loan Purpose: | Refinance | Cut-off Date Principal Balance Per SF(1): | $90.14 | ||||
| Borrower Name: | Mall at Montgomery, L.P. | Year Built/Renovated: | 1977/2014 | ||||
| Sponsor: | Simon Property Group | Title Vesting: | Fee | ||||
| Mortgage Rate: | 4.570% | Property Manager: | Self-managed | ||||
| Note Date: | April 22, 2014 | 3rd Most Recent Occupancy (As of)(3)(4): | 89.0% (12/31/2011) | ||||
| Anticipated Repayment Date: | NAP | 2nd Most Recent Occupancy (As of)(3)(4): | 85.3% (12/31/2012) | ||||
| Maturity Date: | May 1, 2024 | Most Recent Occupancy (As of)(3)(4): | 80.6% (12/31/2013) | ||||
| IO Period: | 120 months | Current Occupancy (As of)(3)(4): | 92.4% (2/19/2014) | ||||
| Loan Term (Original): | 120 months | ||||||
| Seasoning: | 3 months | Underwriting and Financial Information: | |||||
| Amortization Term (Original): | NAP | ||||||
| Loan Amortization Type: | Interest-only, Balloon | 3rd Most Recent NOI (As of)(5): | $13,488,337 (12/31/2012) | ||||
| Interest Accrual Method: | Actual/360 | 2nd Most Recent NOI (As of)(5): | $13,327,655 (12/31/2013) | ||||
| Call Protection: | L(27),D(86),O(7) | Most Recent NOI (As of)(5): | $13,426,267 (TTM 1/31/2014) | ||||
| Lockbox Type: | Hard/Springing Cash Management | ||||||
Additional Debt(1): | Yes | U/W Revenues(5): | $22,305,970 | ||||
Additional Debt Type(1): | Pari Passu | U/W Expenses(5): | $7,579,912 | ||||
U/W NOI(5): | $14,726,058 | ||||||
U/W NCF(5): | $14,178,531 | ||||||
U/W NOI DSCR(1): | 3.18x | ||||||
Escrows and Reserves(2): | U/W NCF DSCR(1): | 3.06x | |||||
U/W NOI Debt Yield(1): | 14.7% | ||||||
Type: | Initial | Monthly | Cap (If Any) | U/W NCF Debt Yield(1): | 14.2% | ||
| Taxes | $0 | Springing | NAP | As-Is Appraised Value: | $195,000,000 | ||
| Insurance | $0 | Springing | NAP | As-Is Appraisal Valuation Date: | March 28, 2014 | ||
| Replacement Reserves | $0 | Springing | $375,000 | Cut-off Date LTV Ratio(1): | 51.3% | ||
| TI/LC Reserve | $0 | Springing | $883,200 | LTV Ratio at Maturity or ARD(1): | 51.3% | ||
| (1) | The Montgomery Mall Loan Combination, totaling $100,000,000, is comprised of two pari passu notes (Notes A-1 and A-2). The non-controlling Note A-2 had an original principal balance of $46,000,000, has an outstanding principal balance of $46,000,000 as of the Cut-off Date and will be contributed to the WFRBS 2014-C21 Trust. The controlling Note A-1 had an original principal balance of $54,000,000 and was contributed to the WFCM 2014-LC16 Trust. All statistical financial information related to balances per square foot, loan-to-value ratios, debt service coverage ratios and debt yields are based on the Montgomery Mall Loan Combination. |
| (2) | See “Escrows” section. |
| (3) | Historical and current occupancy includes temporary and seasonal tenants. |
| (4) | Former anchor tenant, Boscov’s, vacated the Montgomery Mall Property in 2008. The sponsor acquired the Boscov’s improvements and ground leased the land to Wegmans in October 2011, razed the improvements in 2012 and Wegmans built its improvements in 2012 and 2013. Wegmans executed a ground lease in October 2011 with a commencement in November 2013 for an initial 20-year term through 2033 and 10, five-year extension options through 2083. |
| (5) | See “Cash Flow Analysis” section. |
The Mortgage Loan. The mortgage loan (the “Montgomery Mall Loan Combination”) is evidenced by two pari passu notes (Notes A-1 and A-2) secured by a first mortgage encumbering a regional mall located in North Wales, Pennsylvania (the “Montgomery Mall Property”). The Montgomery Mall Loan Combination was originated on April 22, 2014 by The Royal Bank of Scotland. The Montgomery Mall Loan Combination had an original principal balance of $100,000,000, has an outstanding principal balance as of the Cut-off Date of $100,000,000 and accrues interest at an interest rate of 4.570% per annum. The Montgomery Mall Loan Combination had an initial term of 120 months, has a remaining term of 117 months as of the Cut-off Date, and requires interest-only payments through the term of the Montgomery Mall Loan Combination. The Montgomery Mall Loan Combination matures on May 1, 2024.
Note A-2, which represents the non-controlling interest in the Montgomery Mall Loan Combination and will be contributed to the WFRBS 2014-C21 Trust, had an original principal balance of $46,000,000 and has an outstanding principal balance as of the Cut-off Date of $46,000,000. Note A-1 (the “Montgomery Mall Companion Loan”) had an original principal balance of $54,000,000, was contributed to the WFCM 2014-LC16 Trust and represents the controlling interest in the Montgomery Mall Loan Combination. See “Description of the Mortgage Pool—Additional Indebtedness—The Loan Combinations—The Montgomery Mall Loan Combination” and “The Pooling and Servicing Agreement—Servicing of the Loan Combinations” in the Free Writing Prospectus.
THE INFORMATION IN THIS STRUCTURAL AND COLLATERAL TERM SHEET IS NOT COMPLETE AND MAY BE AMENDED PRIOR TO THE TIME OF SALE. THIS TERM SHEET IS NOT AN OFFER TO SELL THESE SECURITIES AND IT IS NOT A SOLICITATION OF AN OFFER TO BUY THESE SECURITIES IN ANY JURISDICTION WHERE THE OFFER OR SALE IS NOT PERMITTED.
94
MONTGOMERY MALL |
Following the lockout period, the borrower has the right to defease the Montgomery Mall Loan Combination in whole, but not in part, on any due date on or before October 1, 2023. In addition, the Montgomery Mall Loan Combination is prepayable without penalty after October 1, 2023.
Sources and Uses
| Sources | Uses | |||||||
| Original loan combination amount | $100,000,000 | 100.0% | Loan payoff(1) | $79,909,814 | 79.9% | |||
| Closing costs | 329,652 | 0.3 | ||||||
| Return of equity | 19,760,534 | 19.8 | ||||||
| Total Sources | $100,000,000 | 100.0% | Total Uses | $100,000,000 | 100.0% |
| (1) | The Montgomery Mall Property was previously securitized in LBUBS 2004-C7. |
The Property. The Montgomery Mall Property is a two-story regional mall located at the intersection of PA Route 309 and US Route 202, east of Interstate-476 in North Wales, Montgomery County, Pennsylvania. North Wales is approximately 22 miles north of Philadelphia. The Montgomery Mall Property contains 1,109,341 square feet of retail space situated on a 104.9-acre parcel of land, all of which serves as collateral for the Montgomery Mall Loan Combination. The Montgomery Mall Property is anchored by Wegmans, Dick’s Sporting Goods, JC Penney, Sears and Macy’s. The Montgomery Mall Property contains 5,041 parking spaces, resulting in a parking ratio of 4.5 spaces per 1,000 square feet of rentable area. The Montgomery Mall Property was constructed in 1977 and extensively renovated in 1996. In 2008, the former Boscov’s anchor tenant vacated the Montgomery Mall Property. The sponsor acquired the vacant Boscov’s space, razed the improvements and ground leased the land to Wegmans in late 2011. Wegmans built a new 128,086 store and restaurant combination attached to the mall and opened for business in November 2013. The north wing of the mall adjacent to the new Wegmans store is currently undergoing a $17.5 million renovation and re-demising, which is expected to bring new tenants, including two new restaurant tenants. As of December 31, 2013, tenants occupying 10,000 square feet or less had trailing 12-month in-line sales of $306 per square foot with an average occupancy cost of 17.5%. As of February 19, 2014, the Montgomery Mall Property was 92.4% occupied (including temporary tenants) by 108 tenants.
THE INFORMATION IN THIS STRUCTURAL AND COLLATERAL TERM SHEET IS NOT COMPLETE AND MAY BE AMENDED PRIOR TO THE TIME OF SALE. THIS TERM SHEET IS NOT AN OFFER TO SELL THESE SECURITIES AND IT IS NOT A SOLICITATION OF AN OFFER TO BUY THESE SECURITIES IN ANY JURISDICTION WHERE THE OFFER OR SALE IS NOT PERMITTED.
95
MONTGOMERY MALL |
The following table presents certain information relating to tenancy at the Montgomery Mall Property:
Major Tenants
| Tenant Name | Credit Rating (Fitch/Moody’s /S&P)(1) | Tenant NRSF | % of NRSF | Annual U/W Base Rent PSF(2) | Annual U/W Base Rent(2) | % of Total Annual U/W Base Rent | Sales PSF(3) | Occupancy Cost(3)(4) | Lease Expiration Date | ||||
| Anchor Tenants | |||||||||||||
Wegmans(5) | NR/NR/BBB+ | 128,086 | 11.5% | $8.20 | $1,050,000 | 8.9% | NAP | NAP | 11/30/2033(6) | ||||
| Dick’s Sporting Goods | NR/NR/NR | 50,000 | 4.5% | $16.50 | $824,808 | 7.0% | $211 | 7.8% | 1/31/2019(7) | ||||
| JC Penney | NR/Caa1/CCC+ | 166,375 | 15.0% | $3.67 | $611,229 | 5.2% | $94(8) | 7.8% | 3/15/2017(9) | ||||
Sears(5) | B-/Caa1/CCC+ | 169,550 | 15.3% | $0.35 | $60,000 | 0.5% | NAV | NAV | 10/12/2020(10) | ||||
Macy’s(5) | BBB/Baa2/BBB+ | 217,976 | 19.6% | $0.25 | $54,494 | 0.5% | $133 | 2.3% | 7/31/2019(11) | ||||
| Total Anchor Tenants | 731,987 | 66.0% | $3.55 | $2,600,531 | 22.1% | ||||||||
| Other Major Tenants | |||||||||||||
| Forever 21 | NR/NR/NR | 16,362 | 1.5% | $31.45 | $514,536 | 4.4% | $178 | 17.7% | 8/31/2022 | ||||
| Gap/Baby Gap/Gap Kids | BBB-/Baa3/BBB- | 12,538 | 1.1% | $34.00 | $426,292 | 3.6% | $194 | 29.6% | 1/31/2017 | ||||
| H&M | NR/NR/NR | 12,745 | 1.1% | $0.00 | (12) | $0 (12) | 0.0% | $200 | 9.0% | 9/30/2015 | |||
| Total Other Major Tenants | 41,645 | 3.8% | $22.59 | $940,828 | 8.0% | ||||||||
Non-Major Retail Tenants(13) | 251,560 | 22.7% | $38.84 | $8,225,416 | 69.9% | ||||||||
Total Occupied Collateral(13) | 1,025,192 | 92.4% | $11.94 | $11,766,776 | 100.0% | ||||||||
| Total Vacant Space | 84,149 | 7.6% | |||||||||||
| Collateral Total | 1,109,341 | 100.0% | |||||||||||
| (1) | Certain ratings are those of the parent company whether or not the parent guarantees the lease. |
| (2) | Annual U/W Base Rent PSF and Annual U/W Base Rent include contractual rent steps through March 2015. |
| (3) | Sales and occupancy costs are for the trailing 12-month period ending December 31, 2013. |
| (4) | Occupancy costs include base rent, reimbursements and percentage rent, as applicable. |
| (5) | Wegmans, Sears and Macy’s own their own improvements and are lessees under ground leases with the borrower. |
| (6) | Wegmans has 10, 5-year ground lease renewal options. |
| (7) | Dick’s Sporting Goods has three, 5-year lease renewal options. |
| (8) | Sales PSF excludes 17,050 square foot outparcel. |
| (9) | JC Penney has five, 5-year lease renewal options. |
| (10) | Sears has five, 10-year lease renewal options. |
| (11) | Macy’s has consecutive 5-year lease renewal options extending through 2077. |
| (12) | H&M pays percentage rent in-lieu of base rent in an amount equal to 10.0% of gross sales. |
| (13) | Includes 24,414 square feet attributed to temporary tenants that were not included in the Annual U/W Base Rent, along with 15,382 square feet attributed to certain tenants paying a percentage of sales in lieu of base rent, for a total of 39,796 square feet. The Annual U/W Base Rent PSF for Non-Major Retail Tenants and Total Occupied Collateral exclude the square footage attributed to these tenants. |
The following table presents certain information relating to the historical sales and occupancy costs at the Montgomery Mall Property:
Historical Sales (PSF) and Occupancy Costs(1)
| Tenant Name | 2010 | 2011 | 2012 | 2013 |
| Macy’s | $138 | $139 | $134 | $133 |
Sears(2) | NAV | NAV | NAV | NAV |
| JC Penney | $165 | $169 | $127 | $94 |
Wegmans(3) | NAP | NAP | NAP | NAP |
| Dick’s Sporting Goods | $187 | $197 | $205 | $211 |
Forever 21(4) | $319 | $343 | $136 | $178 |
| H&M | $160 | $170 | $209 | $200 |
| Gap/ Baby Gap/ Gap Kids | $232 | $202 | $200 | $194 |
| Total In-line (<10,000 square feet) | NAV | $322 | $319 | $306 |
| Occupancy Costs | NAV | 17.6% | 17.2% | 17.5% |
| (1) | Historical Sales (PSF) and Occupancy Costs were provided by the borrower. |
| (2) | Historical data is unavailable. |
| (3) | Wegmans executed a ground lease in October 2011 with a commencement in November 2013 for an initial term through 2033. |
| (4) | Forever 21 increased its store size from 7,246 square feet to 16,362 square feet in August 2012. |
THE INFORMATION IN THIS STRUCTURAL AND COLLATERAL TERM SHEET IS NOT COMPLETE AND MAY BE AMENDED PRIOR TO THE TIME OF SALE. THIS TERM SHEET IS NOT AN OFFER TO SELL THESE SECURITIES AND IT IS NOT A SOLICITATION OF AN OFFER TO BUY THESE SECURITIES IN ANY JURISDICTION WHERE THE OFFER OR SALE IS NOT PERMITTED.
96
MONTGOMERY MALL |
The following table presents certain information relating to the lease rollover schedule at the Montgomery Mall Property:
Lease Expiration Schedule(1)(2)
Year Ending December 31, | No. of Leases Expiring | Expiring NRSF | % of Total NRSF | Cumulative of Total NRSF | Cumulative % of Total NRSF | Annual U/W Base Rent | Annual U/W Base Rent PSF(3) | |
MTM(4) | 13 | 26,425 | 2.4% | 26,425 | 2.4% | $97,656 | $48.56 | |
| 2014 | 5 | 10,202 | 0.9% | 36,627 | 3.3% | $519,992 | $50.97 | |
| 2015 | 22 | 68,913 | 6.2% | 105,540 | 9.5% | $1,845,071 | $26.77 | |
| 2016 | 11 | 25,697 | 2.3% | 131,237 | 11.8% | $1,047,591 | $40.77 | |
| 2017 | 14 | 217,591 | 19.6% | 348,828 | 31.4% | $2,418,080 | $11.11 | |
| 2018 | 7 | 12,594 | 1.1% | 361,422 | 32.6% | $693,187 | $55.04 | |
| 2019 | 12 | 298,769 | 26.9% | 660,191 | 59.5% | $1,822,174 | $6.10 | |
| 2020 | 3 | 171,222 | 15.4% | 831,413 | 74.9% | $149,231 | $0.87 | |
| 2021 | 5 | 14,428 | 1.3% | 845,841 | 76.2% | $460,842 | $31.94 | |
| 2022 | 2 | 22,370 | 2.0% | 868,211 | 78.3% | $680,357 | $30.41 | |
| 2023 | 8 | 16,823 | 1.5% | 885,034 | 79.8% | $645,261 | $38.36 | |
| 2024 | 5 | 12,072 | 1.1% | 897,106 | 80.9% | $337,334 | $27.94 | |
| Thereafter | 1 | 128,086 | 11.5% | 1,025,192 | 92.4% | $1,050,000 | $8.20 | |
Vacant(5) | 0 | 84,149 | 7.6% | 1,109,341 | 100.0% | $0 | $0.00 | |
| Total/Weighted Average | 108 | 1,109,341 | 100.0% | $11,766,776 | $11.94 |
| (1) | Information obtained from the underwritten rent roll. |
| (2) | Certain tenants may have lease termination options that are exercisable prior to the originally stated expiration date of the subject lease and that are not considered in the Lease Expiration Schedule. |
| (3) | The Annual U/W Base Rent PSF and Total/Weighted Average Annual U/W Base Rent PSF excludes vacant space, square feet attributed to tenants paying percentage rent in lieu of base rent and square footage attributed to temporary tenants. These rents were included in the underwritten percentage rent and other income. |
| (4) | Includes 11 temporary tenants. The rent for temporary tenants has been included in the underwritten other income. |
| (5) | Occupancy includes temporary and seasonal tenants. |
The following table presents historical occupancy percentages at the Montgomery Mall Property:
Historical Occupancy(1)(2)
12/31/2011(3) | 12/31/2012(3) | 12/31/2013(3) | 2/19/2014 | |||
| 89.0% | 85.3% | 80.6% | 92.4% |
| (1) | Former anchor tenant, Boscov’s, vacated the Montgomery Mall Property in 2008. The sponsor acquired the Boscov’s improvements and ground leased the land to Wegmans in October 2011, razed the improvements in 2012 and Wegmans built its improvements in 2012 and 2013. Wegmans executed a ground lease in October 2011 with a commencement in November 2013 for an initial 20-year term through 2033 and 10, five-year extension options through 2083. |
| (2) | Historical and current occupancy includes temporary and seasonal tenants. |
| (3) | Information obtained from the borrower. |
THE INFORMATION IN THIS STRUCTURAL AND COLLATERAL TERM SHEET IS NOT COMPLETE AND MAY BE AMENDED PRIOR TO THE TIME OF SALE. THIS TERM SHEET IS NOT AN OFFER TO SELL THESE SECURITIES AND IT IS NOT A SOLICITATION OF AN OFFER TO BUY THESE SECURITIES IN ANY JURISDICTION WHERE THE OFFER OR SALE IS NOT PERMITTED.
97
MONTGOMERY MALL |
Operating History and Underwritten Net Cash Flow. The following table presents certain information relating to the historical operating performance and the Underwritten Net Cash Flow at the Montgomery Mall Property:
Cash Flow Analysis
| 2012 | 2013 | TTM 1/31/2014 | U/W | U/W $ per SF | ||||||
| Base Rent | $10,866,241 | $10,870,439 | $10,951,433 | $11,766,776 | $10.61 | |||||
| Grossed Up Vacant Space | 0 | 0 | 0 | 5,175,861 | 4.67 | |||||
| Percentage Rent | 522,142 | 423,863 | 413,287 | 406,760 | 0.37 | |||||
| Total Reimbursables | 8,106,786 | 8,053,279 | 8,051,718 | 8,342,537 | 7.52 | |||||
| Other Income | 1,893,470 | 1,815,251 | 1,789,897 | 1,789,897 | 1.61 | |||||
| Less Vacancy & Credit Loss | (72,450) | (80,553) | (81,351) | (5,175,861)(1) | (4.67) | |||||
| Effective Gross Income | $21,316,189 | $21,082,279 | $21,124,984 | $22,305,970 | $20.11 | |||||
| Total Operating Expenses | $7,827,852 | $7,754,624 | $7,698,717 | $7,579,912 | $6.83 | |||||
| Net Operating Income | $13,488,337 | $13,327,655 | $13,426,267 | $14,726,058(2) | $13.27 | |||||
| TI/LC | 0 | 0 | 0 | 361,298 | 0.33 | |||||
| Replacement Reserves | 0 | 0 | 0 | 186,229 | 0.17 | |||||
| Net Cash Flow | $13,488,337 | $13,327,655 | $13,426,267 | $14,178,531(2) | $12.78 | |||||
NOI DSCR(3) | 2.91x | 2.88x | 2.90x | 3.18x | ||||||
NCF DSCR(3) | 2.91x | 2.88x | 2.90x | 3.06x | ||||||
NOI DY(3) | 13.5% | 13.3% | 13.4% | 14.7% | ||||||
NCF DY(3) | 13.5% | 13.3% | 13.4% | 14.2% | ||||||
(1) | The underwritten economic vacancy is 19.5%. The Montgomery Mall Property was 90.2% physically occupied by permanent tenants (92.4% occupied including temporary and seasonal tenants) as of February 19, 2014. |
| (2) | The underwritten NOI is higher than TTM 1/31/2014 due to new leases and renewals; over eight new leases totaling more than $1.0 million in rental income have been signed since August 2013. |
| (3) | DSCRs and debt yields are based on the Montgomery Mall Loan Combination. |
Appraisal. As of the appraisal valuation date of March 28, 2014, the Montgomery Mall Property had an “as-is” appraised value of $195,000,000.
Environmental Matters. According to a Phase I environmental site assessment dated April 3, 2014, there was no evidence of any recognized environmental conditions at the Montgomery Mall Property.
Market Overview and Competition. The Montgomery Mall Property is located at the intersection of PA Route 309 and US Route 202, east of I-476 in North Wales, Pennsylvania. The Montgomery Mall Property is located in the north-central portion of the Philadelphia metropolitan statistical area, situated 22 miles north of Philadelphia. According to the appraisal, the Montgomery Mall Property has a primary trade area that encompasses a 10-mile radius. The 2014 population within a 10- and 15-mile radius were reported at approximately 546,757 and 1,241,241, respectively, and average household income within the same 10- and 15-mile radius were reported at approximately $101,041 and $94,385, respectively.
The appraiser estimated market rent for major and in-line tenants to be $30.32 per square foot on a triple net basis and concluded to an estimate of $7.50 per square foot on a modified gross basis for anchor tenants. The appraiser concluded a vacancy rate of 5.0% and a third party market research report indicated a year-end 2013 suburban Philadelphia submarket vacancy rate of 6.4%.
The following table presents certain information relating to some comparable retail centers provided in the appraisal for the Montgomery Mall Property:
Competitive Set(1)
| Montgomery Mall (Subject) | Willow Grove Park | Plymouth Meeting Mall | King of Prussia Mall | |
| Market | North Wales, PA | Willow Grove, PA | Plymouth Meeting, PA | King of Prussia, PA |
| Distance from Subject | -- | 11 miles | 11 miles | 14 miles |
| Property Type | Regional Mall | Super Regional Mall | Super Regional Mall | Super Regional Mall |
| Year Built/Renovated | 1977/2014 | 1982/2001 | 1966/2009 | 1962/1995 |
| Anchors | Wegmans, Dick’s Sporting Goods, JC Penney, Sears, Macy’s | Macy’s, JC Penney, Bloomingdale’s, Sears, Nordstrom | Macy’s, Boscov’s | Macy’s, JC Penney, Bloomingdales, Sears, Nordstrom, Neiman Marcus, Lord & Taylor |
| Total GLA | 1,109,341 SF | 1,161,700 SF | 927,456 SF | 2,391,105 SF |
| Total Occupancy | 92% | 93% | 76% | 94% |
(1) | Information obtained from the appraisal and underwritten rent roll. |
THE INFORMATION IN THIS STRUCTURAL AND COLLATERAL TERM SHEET IS NOT COMPLETE AND MAY BE AMENDED PRIOR TO THE TIME OF SALE. THIS TERM SHEET IS NOT AN OFFER TO SELL THESE SECURITIES AND IT IS NOT A SOLICITATION OF AN OFFER TO BUY THESE SECURITIES IN ANY JURISDICTION WHERE THE OFFER OR SALE IS NOT PERMITTED.
98
MONTGOMERY MALL |
The Borrower. The borrower is Mall at Montgomery, L.P., a Delaware limited partnership and a single purpose entity with two independent directors. Legal counsel to the borrower delivered a non-consolidation opinion in connection with the origination of the Montgomery Mall Loan Combination. Simon Property Group, L.P. is the guarantor of the nonrecourse carveouts under the Montgomery Mall Loan Combination.
The Sponsor. The sponsor, Simon Property Group (NYSE: SPG) (“SPG”), is an S&P 100 company and currently has interests in more than 325 retail real estate properties in North America, Europe and Asia comprising approximately 243 million square feet. SPG is headquartered in Indianapolis, Indiana and employs approximately 5,500 people in the United States. SPG is the guarantor of certain nonrecourse carveouts under the Montgomery Mall Mortgage Loan. SPG’s recourse liability is capped at $10,000,000 plus all reasonable out-of-pocket costs and expenses incurred by the lender. See “Description of the Mortgage Pool—Non-Recourse Carveout Limitations” and “—Default History, Bankruptcy Issues and Other Proceedings” in the Free Writing Prospectus.
Escrows. No ongoing monthly escrows are required for real estate taxes, insurance, replacement or tenant improvement and leasing commissions reserves so long as no Lockbox Event (as defined below) has occurred and is continuing under the Montgomery Mall Loan Combination. In the event that a Lockbox Event has occurred, the borrower is required to make monthly deposits: (i) for the payment of real estate taxes in an amount equal to one-twelfth of the estimated annual taxes payable and for the payment of insurance in an amount equal to one-twelfth of the estimated annual insurance premiums payable; provided that so long as no event of default has occurred and is continuing, the borrower will not be required to make such deposits for so long as the borrower provides satisfactory evidence to the lender that the taxes have been paid prior to delinquency and the insurance policies are being maintained as part of a reasonably acceptable blanket insurance policy providing coverage to substantially all of the other properties managed by the property manager or its affiliates; (ii) for replacements and repairs in an amount equal to $15,625 (subject to a cap of $375,000); and (iii) for tenant improvements and leasing commissions in an amount equal to $36,800 (subject to a cap of $883,200).
A “Lockbox Event” will commence upon the occurrence of (i) an event of default; (ii) any bankruptcy or insolvency proceeding of the borrower or the property manager (if the property manager is an affiliate of the borrower); or (iii) the debt service coverage ratio based on the trailing four-calendar quarters falling below 1.20x for two consecutive calendar quarters. A Lockbox Event will end with respect to clause (i), upon the acceptance by the lender of a cure of such event of default (which cure the lender is not obligated to accept and may reject or accept in its sole and absolute discretion), provided that the lender has not accelerated the Montgomery Mall Loan Combination, moved for a receiver or commenced foreclosure proceedings; with respect to clause (ii) as it relates to the property manager, if the borrower replaces the property manager pursuant to a replacement management agreement, in accordance with the terms of the Montgomery Mall Loan Combination documents, or such bankruptcy or insolvency proceeding of the property manager is discharged or dismissed within 90 days; or with respect to clause (iii), when a debt service coverage ratio of at least 1.20x has been achieved for two consecutive calendar quarters; provided, however, that (x) no event of default has occurred and is continuing under the loan agreement or any of the other Montgomery Mall Loan Combination documents; (y) the borrower has paid all of the lender’s reasonable out-of-pocket expenses actually incurred in connection with such Lockbox Event including, reasonable attorney’s fees and expenses; and (z) a Lockbox Event may not be cured more than five times in the aggregate during the term of the Montgomery Mall Loan Combination.
Lockbox and Cash Management. The Montgomery Mall Loan Combination requires a lender controlled lockbox, which is already in place, and that the borrower direct tenants to deposit all rents directly into the lockbox account and that the borrower and the property manager deposit all rents received into the lockbox account within two business days of receipt. Prior to the occurrence of a Lockbox Event, all funds on deposit in the lockbox account will be released to the borrower on a weekly basis. Upon the occurrence and continuance of a Lockbox Event, funds on deposit in the lockbox account will be swept on a weekly basis (or on each business day, during the continuance of an event of default) into a lender controlled cash management account.
Property Management. The Montgomery Mall Property is managed by an affiliate of the borrower.
Assumption. The borrower has the right to transfer the Montgomery Mall Property, or greater than 50% of the aggregate interests in the borrower, in one or a series of related transactions to one or more Qualified Transferees (as defined below) (other than a transfer to a Key Principal (as defined below) or any person wholly owned by one or more Key Principals, so long as such Key Principals owned 49% of the aggregate interests in the borrower prior to such transfer), 61 days after the Series 2014-C21 Trust closing date, provided that no event of default has occurred and is continuing and certain other conditions are satisfied, including, but not limited to delivery of an additional insolvency opinion.
The borrower also has the right to transfer the Montgomery Mall Property or 100% of the aggregate interests in the borrower to a transferee that is not a Qualified Transferee, provided that no event of default has occurred and is continuing, the conditions with respect to transfers to a transferee that is not a Qualified Transferee and certain additional conditions are satisfied, including, but not limited to receipt of a rating agency confirmation from DBRS, Moody’s and Morningstar that the transfer will not result in a downgrade, withdrawal or qualification of the respective ratings assigned to the Series 2014-C21 Certificates and similar confirmations with respect to the ratings of any securities backed by the Montgomery Mall Companion Loan.
A “Qualified Transferee” is (a) any person or its affiliate (provided such person owns, directly or indirectly, not less than 51% of such affiliate) who owns and operates (i) at least five shopping centers and (ii) retail properties and shopping centers totaling in the aggregate at least 3,000,000 square feet of gross area; (b) any person who has a net worth in excess of $250,000,000; or (c) any person, provided the lender has received written confirmation from each of DBRS, Moody’s and Morningstar that the transfer to such person will not, in and of itself, cause a downgrade, withdrawal or qualification of the then current ratings of the Series 2014-C21 Certificates and similar confirmations with respect to ratings of any securities backed by the Montgomery Mall Companion Loan; provided, however, that no person will be deemed to be a Qualified Transferee if such person (x) is an embargoed person, (y) except for General Growth Properties or its affiliates, is or has during the previous seven years been the subject of a bankruptcy or
THE INFORMATION IN THIS STRUCTURAL AND COLLATERAL TERM SHEET IS NOT COMPLETE AND MAY BE AMENDED PRIOR TO THE TIME OF SALE. THIS TERM SHEET IS NOT AN OFFER TO SELL THESE SECURITIES AND IT IS NOT A SOLICITATION OF AN OFFER TO BUY THESE SECURITIES IN ANY JURISDICTION WHERE THE OFFER OR SALE IS NOT PERMITTED.
99
MONTGOMERY MALL |
insolvency proceeding or (z) has been convicted in a criminal proceeding for a felony or any crime involving moral turpitude or is an organized crime figure or is reputed to have substantial business or other affiliations with any organized crime figure.
“Key Principal” means any of Simon Property Group, L.P. or Simon Property Group, Inc.
Free Release. Provided that no event of default has occurred and is continuing, the borrower may (i) make transfers of immaterial or non-income producing portions of the Montgomery Mall Property in connection with takings or condemnations of any portion of the Montgomery Mall Property; (ii) make transfers of non-income producing portions of the Montgomery Mall Property to third parties or affiliates of the borrower; and (iii) dedicate portions of the Montgomery Mall Property or grant easements, restrictions, covenants, reservations and rights of way in the ordinary course of business; subject to certain conditions, including: (a) evidence that the transferee is not an affiliate of the borrower; and (b) with respect to any of the transfers described in (ii) and (iii), delivery of an officer’s certificate evidencing that such transfer, conveyance or encumbrance will not result in a material adverse effect on the value of the Montgomery Mall Property, the business operations or financial condition of the borrower or the ability of the borrower to repay the Montgomery Mall Loan Combination.
Real Estate Substitution. Not Permitted.
Subordinate and Mezzanine Indebtedness. Not Permitted.
Ground Lease. None.
Terrorism Insurance. The loan documents require that the “all risk” insurance policy required to be maintained by the borrower provides coverage for terrorism in an amount equal to the full replacement cost of the Montgomery Mall Property or if the Terrorism Risk Insurance Program Reauthorization Act is no longer in effect, the borrower will be required to obtain a stand alone policy providing the same coverage for terrorism; provided, however (a) that the borrower will not be required to pay annual premiums in excess of two times the then-current annual premiums for the “all risk” insurance policy (excluding the catastrophic coverage of flood, earthquake and wind) and (b) that such stand-alone policy may have a deductible that is reasonable for such stand-alone policies with respect to properties similar to and reasonable for the geographic region where the Montgomery Mall Property is located, so long as in no event shall such deductible exceed 5% of the total insured values. The loan documents also require business interruption insurance covering no less than the 18-month period following the occurrence of a casualty event, together with an extended period of indemnity, which shall continue for the lesser of (i) the period of time until income returns to the same level as it was prior to loss and (ii) 365 days from the date that the Montgomery Mall Property is repaired or replaced and operations are resumed.
THE INFORMATION IN THIS STRUCTURAL AND COLLATERAL TERM SHEET IS NOT COMPLETE AND MAY BE AMENDED PRIOR TO THE TIME OF SALE. THIS TERM SHEET IS NOT AN OFFER TO SELL THESE SECURITIES AND IT IS NOT A SOLICITATION OF AN OFFER TO BUY THESE SECURITIES IN ANY JURISDICTION WHERE THE OFFER OR SALE IS NOT PERMITTED.
100
(THIS PAGE INTENTIONALLY LEFT BLANK)
101
| THE BLUFFS |
THE INFORMATION IN THIS STRUCTURAL AND COLLATERAL TERM SHEET IS NOT COMPLETE AND MAY BE AMENDED PRIOR TO THE TIME OF SALE. THIS TERM SHEET IS NOT AN OFFER TO SELL THESE SECURITIES AND IT IS NOT A SOLICITATION OF AN OFFER TO BUY THESE SECURITIES IN ANY JURISDICTION WHERE THE OFFER OR SALE IS NOT PERMITTED.
102
| THE BLUFFS |
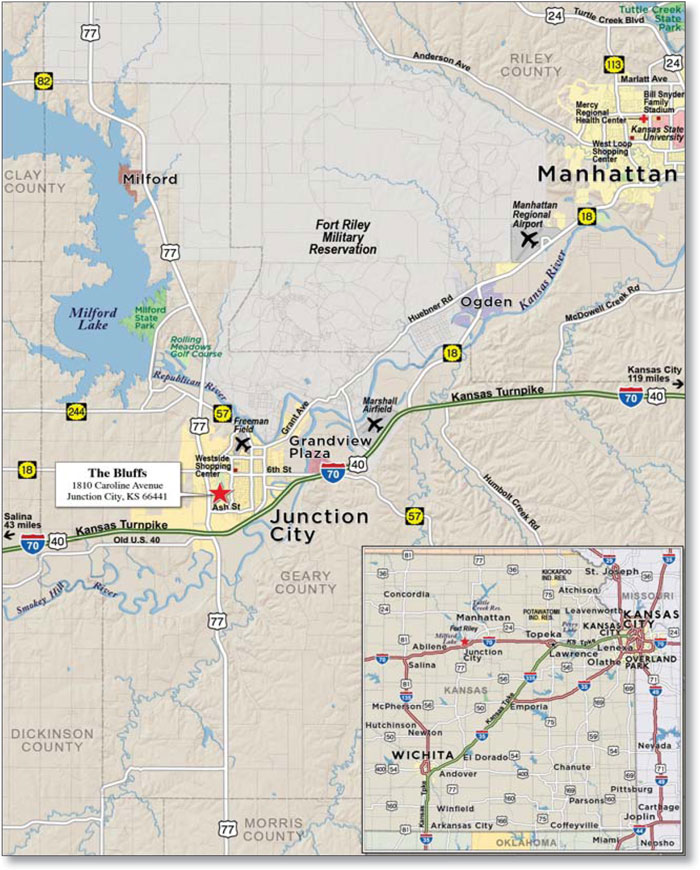
THE INFORMATION IN THIS STRUCTURAL AND COLLATERAL TERM SHEET IS NOT COMPLETE AND MAY BE AMENDED PRIOR TO THE TIME OF SALE. THIS TERM SHEET IS NOT AN OFFER TO SELL THESE SECURITIES AND IT IS NOT A SOLICITATION OF AN OFFER TO BUY THESE SECURITIES IN ANY JURISDICTION WHERE THE OFFER OR SALE IS NOT PERMITTED.
103
| No. 10 – The Bluffs | ||||||
| Loan Information | Property Information | |||||
| Mortgage Loan Seller: | Wells Fargo Bank, National Association | Single Asset/Portfolio: | Single Asset | |||
Credit Assessment (DBRS/Moody’s/Morningstar): | NR/NR/NR | Property Type: | Multifamily | |||
| Original Principal Balance: | $36,225,000 | Specific Property Type: | Garden | |||
| Cut-off Date Principal Balance: | $36,184,577 | Location: | Junction City, KS | |||
| % of Initial Pool Balance: | 2.5% | Size: | 602 units | |||
| Loan Purpose: | Refinance | Cut-off Date Principal Balance Per Unit: | $60,107 | |||
| Borrower Name: | The Bluffs Apartments, LLC | Year Built/Renovated(2): | 2006/NAP | |||
| Sponsor: | Marcel J.C. Arsenault | Title Vesting: | Fee | |||
| Mortgage Rate: | 4.790% | Property Manager: | Riverstone Residential SC, LLC | |||
| Note Date: | June 30, 2014 | 3rd Most Recent Occupancy (As of): | 99.0% (12/31/2011) | |||
| Anticipated Repayment Date: | NAP | 2nd Most Recent Occupancy (As of)(3): | 86.5% (12/31/2012) | |||
| Maturity Date: | July 11, 2024 | Most Recent Occupancy (As of): | 96.0% (12/31/2013) | |||
| IO Period: | None | Current Occupancy (As of): | 91.9% (6/6/2014) | |||
| Loan Term (Original): | 120 months | |||||
| Seasoning: | 1 month | Underwriting and Financial Information: | ||||
| Amortization Term (Original): | 360 months | |||||
| Loan Amortization Type: | Amortizing Balloon | 3rd Most Recent NOI (As of): | $3,305,460 (T9 Ann. 12/31/2012) | |||
| Interest Accrual Method: | Actual/360 | 2nd Most Recent NOI (As of): | $3,122,282 (12/31/2013) | |||
| Call Protection: | L(25),D(91),O(4) | Most Recent NOI (As of): | $3,452,318 (TTM 5/31/2014) | |||
| Lockbox Type: | Soft/Upfront Cash Management | |||||
| Additional Debt: | None | |||||
| Additional Debt Type: | NAP | U/W Revenues: | $5,622,406 | |||
| U/W Expenses: | $2,391,104 | |||||
| U/W NOI: | $3,231,302 | |||||
| U/W NCF: | $3,080,802 | |||||
| U/W NOI DSCR: | 1.42x | |||||
Escrows and Reserves(1): | U/W NCF DSCR: | 1.35x | ||||
| U/W NOI Debt Yield: | 8.9% | |||||
Type: | Initial | Monthly | Cap (If Any) | U/W NCF Debt Yield: | 8.5% | |
| Taxes | $163,064 | $54,356 | NAP | As-Is Appraised Value: | $48,300,000 | |
| Insurance | $58,122 | $14,532 | NAP | As-Is Appraisal Valuation Date: | May 6, 2014 | |
| Replacement Reserves | $0 | $12,542 | NAP | Cut-off Date LTV Ratio: | 74.9% | |
| Deferred Maintenance | $77,888 | $0 | NAP | LTV Ratio at Maturity or ARD: | 61.2% | |
| (1) | See “Escrows” section. |
| (2) | The Bluffs Property was built in phases from 2006 to 2009. |
| (3) | See “Cash Flow Analysis” section. |
The Mortgage Loan. The mortgage loan (“The Bluffs Mortgage Loan”) is evidenced by a single promissory note that is secured by a first mortgage encumbering a multifamily property located in Junction City, Kansas (“The Bluffs Property”). The Bluffs Mortgage Loan was originated on June 30, 2014 by Wells Fargo Bank, National Association. The Bluffs Mortgage Loan had an original principal balance of $36,225,000, has an outstanding principal balance as of the Cut-off Date of $36,184,577 and accrues interest at an interest rate of 4.790% per annum. The Bluffs Mortgage Loan had an initial term of 120 months, has a remaining term of 119 months as of the Cut-off Date and requires payments of principal and interest based on a 30-year amortization schedule. The Bluffs Mortgage Loan matures on July 11, 2024.
Following the lockout period, the borrower has the right to defease The Bluffs Mortgage Loan in whole, but not in part, on any day before April 11, 2024. In addition, The Bluffs Mortgage Loan is prepayable without penalty on or after April 11, 2024.
Sources and Uses
| Sources | Uses | |||||||||
| Original loan amount | $36,225,000 | 98.5 | % | Loan payoff | $35,888,066 | 97.5 | % | |||
| Sponsor’s new cash contribution | 567,879 | 1.5 | Reserves | 299,074 | 0.8 | |||||
| Closing costs | 605,739 | 1.6 | ||||||||
| Total Sources | $36,792,879 | 100.0 | % | Total Uses | $36,792,879 | 100.0 | % |
THE INFORMATION IN THIS STRUCTURAL AND COLLATERAL TERM SHEET IS NOT COMPLETE AND MAY BE AMENDED PRIOR TO THE TIME OF SALE. THIS TERM SHEET IS NOT AN OFFER TO SELL THESE SECURITIES AND IT IS NOT A SOLICITATION OF AN OFFER TO BUY THESE SECURITIES IN ANY JURISDICTION WHERE THE OFFER OR SALE IS NOT PERMITTED.
104
| THE BLUFFS |
The Property. The Bluffs Property is a 602-unit, class A, garden style apartment complex located in Junction City, Kansas, approximately 67 miles west of Topeka, 23 miles southwest of Manhattan and six miles south of Fort Riley. Fort Riley is a 100,000-acre United States Army installation established in 1853, and the tenants at The Bluffs Property are predominately military personnel or civilian contractors. The Bluffs Property consists of 21 three- and four-story buildings constructed in phases from 2006 through 2009. The Bluffs Property comprises 18 studio units, 237 one bedroom/one bathroom units, 291 two bedroom/two bathroom units, and 56 three bedroom/three bathroom units. The Bluffs Property is one of the three competitive properties offering one bedroom units, and no other property in the competitive set offers studio units. Amenities at The Bluffs Property include a washer/dryer in every unit, a residential lounge with game room, theater, banquet room, swimming pool, hot tub, children’s play area, basketball courts, and a 24-hour fitness center. Directly adjacent to The Bluffs Property is a city nature preserve that includes a 1.3 mile hiking trail, fishing pond and picnic area with gazebos. The Bluffs Property also offers fully and partially furnished units. The Bluffs Property provides 200 detached garage parking spaces for rent and 1,164 surface parking spaces, a total of 1,364 parking spaces, equating to a parking ratio of 2.3 spaces per unit.
Military personnel are provided with a Basic Allowance for Housing (“BAH”), which is an allowance, determined by location, pay grade, rank and dependency status, and which may be used to purchase or rent housing off-base. BAH classifications are from E-1, the lowest, to E-9, the highest. According to a representative with the Fort Riley off-base housing authority, the only non-married military personnel permitted to live off-base are those ranked E-5 (sergeant) and higher. A majority of the tenants at The Bluffs Property are higher ranking E4-E6 soldiers (corporals and sergeants), and soldiers with spouses and families.
The borrower acquired The Bluffs Property out of a two-year bankruptcy for $43.5 million in March 2012. The bankruptcy was a result of disputes between the original developers, various mechanics lien claimants and the construction lending syndicate. See “Description of the Mortgage Pool—Prior Default History, Bankruptcy Issues and Other Proceedings” in the Free Writing Prospectus. Despite this distress, prior mismanagement and numerous troop deployments at Fort Riley, The Bluffs Property has maintained an average occupancy of approximately 91.1% since 2007 (excluding nine months of lease-up during the second phase of construction in 2008 and 2009). A partial condemnation is pending in connection with the proposed widening of US Route 77 adjacent to The Bluffs Property. No physical impact on any buildings on The Bluffs Property is evident based on current design proposals. See “Description of the Mortgage Pool—Tenant or Other Third Party Issues—Other Matters” in the Free Writing Prospectus. As of June 6, 2014, The Bluffs Property was 91.9% occupied.
The following table presents certain information relating to the unit mix of The Bluffs Property:
Unit Mix Summary
| Unit Type | No. of Units | % of Total Units | Average Unit Size (SF) | U/W Average Rent | ||
| Studio | 18 | 3.0% | 650 | $686 | ||
| 1 Bedroom/1 Bathroom | 59 | 9.8% | 733 | $732 | ||
| Large 1 Bedroom/1 Bathroom | 178 | 29.6% | 793 | $755 | ||
| 2 Bedroom/2 Bathroom | 263 | 43.7% | 1,012 | $835 | ||
| Large 2 Bedroom/2 Bathroom | 28 | 4.7% | 1,088 | $854 | ||
| 3 Bedroom/2 Bathroom | 56 | 9.3% | 1,237 | $976 | ||
| Total/Weighted Average | 602 | 100.0% | 934 | $811 | ||
The following table presents historical occupancy percentages at The Bluffs Property:
Historical Occupancy
12/31/2011(1) | 12/31/2012(1)(2) | 12/31/2013(1) | 6/6/2014(3) | |||
| 99.0% | 86.5% | 96.0% | 91.9% |
| (1) | Information obtained from the borrower. |
| (2) | The borrower purchased The Bluffs Property in March 2012 out of bankruptcy and did not install Riverstone Residential as property manager until December 2012. |
| (3) | Information obtained from the underwritten rent roll. |
THE INFORMATION IN THIS STRUCTURAL AND COLLATERAL TERM SHEET IS NOT COMPLETE AND MAY BE AMENDED PRIOR TO THE TIME OF SALE. THIS TERM SHEET IS NOT AN OFFER TO SELL THESE SECURITIES AND IT IS NOT A SOLICITATION OF AN OFFER TO BUY THESE SECURITIES IN ANY JURISDICTION WHERE THE OFFER OR SALE IS NOT PERMITTED.
105
| THE BLUFFS |
Operating History and Underwritten Net Cash Flow. The following table presents certain information relating to the historical operating performance and the Underwritten Net Cash Flow at The Bluffs Property:
Cash Flow Analysis
T-9 12/31/2012 Annualized(1) | 2013 | TTM 5/31/2014 | U/W | U/W $ per Unit | |||||||
| Base Rent | $5,187,951 | $5,710,325 | $5,651,219 | $5,367,336 | $8,916 | ||||||
| Grossed Up Vacant Space | 0 | 0 | 0 | 489,300 | 813 | ||||||
| Less Concessions | 0 | 0 | 0 | 0 | 0 | ||||||
| Other Income | 215,275 | 379,406 | 463,623 | 410,000 | 681 | ||||||
| Less Vacancy & Credit Loss | 0 | (715,118) | (354,129) | (644,230)(2) | (1,070) | ||||||
| Effective Gross Income | $5,403,225 | $5,374,613 | $5,760,713 | $5,622,406 | $9,340 | ||||||
| Total Operating Expenses | $2,097,765 | $2,252,331 | $2,308,395 | $2,391,104 | $3,972 | ||||||
| Net Operating Income | $3,305,460 | $3,122,282 | $3,452,318 | $3,231,302 | $5,368 | ||||||
| Replacement Reserves | 0 | 0 | 0 | 150,500 | 250 | ||||||
| Net Cash Flow | $3,305,460 | $3,122,282 | $3,452,318 | $3,080,802 | $5,118 | ||||||
| NOI DSCR | 1.45x | 1.37x | 1.52x | 1.42x | |||||||
| NCF DSCR | 1.45x | 1.37x | 1.52x | 1.35x | |||||||
| NOI DY | 9.1% | 8.6% | 9.5% | 8.9% | |||||||
| NCF DY | 9.1% | 8.6% | 9.5% | 8.5% | |||||||
| (1) | The borrower purchased The Bluffs Property in March 2012 out of bankruptcy; therefore, historical operating statements are only available from April – December 2012. |
| (2) | The underwritten economic vacancy is 11.1%. The Bluffs Property was 91.9% physically occupied as of June 6, 2014. |
Appraisal. As of the appraisal valuation date of May 6, 2014, The Bluffs Property had an aggregate “as-is” appraised value of $48,300,000.
Environmental Matters. According to the environmental site assessment dated May 9, 2014, there was no evidence of any recognized environmental conditions at The Bluffs Property.
Market Overview and Competition. The Bluffs Property is located approximately six miles from the Fort Riley Army base, near the intersection of US Highway 77 and Interstate 70 in Junction City, Kansas. Interstate 70 provides regional access connecting Denver to the west and Topeka and Kansas City to the east. The Bluffs Property is located in northeastern Kansas, within Geary County, and is approximately 67 miles west of Topeka and 130 miles west of Kansas City. The Bluffs Property maintains a heavy dependence on Fort Riley, as approximately 90.0% of the units are occupied by United States military personnel or civilian contractors. Fort Riley was established in 1853 and is one of the nation’s oldest forts. Fort Riley was a major beneficiary of the 2005 Base Realignment and Closure Act (“BRAC”), picking up an extra brigade of troops and approximately $2.0 billion of capital investment. During the 2005 BRAC, the Army ranked their installations from 1-to-97, based on an analysis of 40 attributes, and Fort Riley was ranked 13. Fort Riley is home to “Big Red One”, or the First Infantry, which has been in continuous service since 1917 and is the oldest division in the United States Army. According to the annual summary prepared by Fort Riley, the base has 18,176 military personnel with 24,011 family members, 3,710 retirees, and 7,122 civilian employees. According to the appraisal, the combined population base of 53,019 is estimated to have an annual economic impact of $1.8 billion on the local economy. Additionally, the Army will officially open a class A medical facility on base this year that will serve Fort Riley’s military personnel, their families and the surrounding community. The new $334.0 million facility will include a 263,000 square foot inpatient community hospital, a 289,000 square foot outpatient clinic, a central energy plant, an ambulance garage and parking for 1,600 vehicles. In addition, the Army is constructing a new $42.0 million elementary and middle school on base.
Within a three and five-mile radius of The Bluffs Property, the population is 26,360 and 35,499, respectively and the average household income is $54,610 and $53,065, respectively. The appraisal identified a competitive set of five multifamily properties, three of which are in Junction City and two are in Manhattan, constructed between 2005 and 2011 and exhibiting occupancy rates ranging from 85.0% to 99.0%. The appraiser concluded to a vacancy rate of 10.0% for The Bluffs Property, and no new multifamily construction is currently underway or in the planning stages in the market. The appraiser concluded that monthly market rent is $700 for studio units, $750-$775 for one bedroom/one bathroom units, $850-$875 for two bedroom/two bathroom units and $1,000 for three bedroom/two bathroom units.
THE INFORMATION IN THIS STRUCTURAL AND COLLATERAL TERM SHEET IS NOT COMPLETE AND MAY BE AMENDED PRIOR TO THE TIME OF SALE. THIS TERM SHEET IS NOT AN OFFER TO SELL THESE SECURITIES AND IT IS NOT A SOLICITATION OF AN OFFER TO BUY THESE SECURITIES IN ANY JURISDICTION WHERE THE OFFER OR SALE IS NOT PERMITTED.
106
| THE BLUFFS |
The following table presents certain information relating to some comparable multifamily properties for The Bluffs Property:
Competitive Set
The Bluffs (Subject) | Quinton Point | Hunter’s Ridge | Geary Estates | Highland Ridge | Stone Pointe Apartments | |
| Location | Junction City, KS | Junction City, KS | Junction City, KS | Junction City, KS | Manhattan, KS | Manhattan, KS |
| Distance to Subject | -- | 2.8 Miles | 3.7 Miles | 7.3 Miles | 19.9 Miles | 20.8 Miles |
| Property Type | Garden | Garden | Garden | Garden | Garden | Garden |
| Number of Units | 602 | 192 | 156 | 480 | 252 | 216 |
| Average Rent (per unit) | ||||||
| 1BR | $732-$755 | NAP | $720 | $685 | NAP | NAP |
| 2BR | $835-$854 | $825 | $835 | $800 | $960 | $866-$896 |
| 3BR | $976 | $925 | $895 | NAP | $1,060 | NAP |
| Utilities | Paid by tenant | Trash Included | Water and Sewer Included | Water, Trash, Sewer Included | Water, Trash, Sewer Included | Paid by tenant |
| Total Occupancy | 92% | 91% | 96% | 85% | 99% | 91% |
The Borrower. The borrower is The Bluffs Apartments, LLC, a single purpose entity with an independent director. Legal counsel to the borrower delivered a non-consolidation opinion in connection with the origination of The Bluffs Mortgage Loan. Marcel J.C. Arsenault is the guarantor of certain nonrecourse carveouts under The Bluffs Mortgage Loan.
The Sponsors. The sponsor is Marcel Arsenault, Chairman and CEO of Real Capital Solutions (“RCS”), one of the largest private real estate companies in Colorado. Mr. Arsenault founded RCS in 1984 and has managed over 100 commercial real estate properties valued in excess of $1.0 billion throughout his 25-year career. RCS has evolved from a regional real estate investment company into a nationally-focused investor of workout and distressed assets. As of year-end 2012, RCS had acquired $203 million of assets across the United States totaling 4.5 million square feet. In 2010 and 2011, Mr. Arsenault reported two prior foreclosures. See “Description of the Mortgage Pool—Prior Default History, Bankruptcy Issues and Other Proceedings” in the Free Writing Prospectus.
Escrows. The loan documents provide for upfront escrows in the amount of $163,064 for real estate taxes, $58,122 for insurance and $77,888 for deferred maintenance. The loan documents provide for ongoing monthly reserves in the amount of $54,356 for real estate taxes, $14,532 for insurance and $12,542 for replacement reserves.
Lockbox and Cash Management. The Bluffs Mortgage Loan requires a lender-controlled lockbox account, which is already in place, and that all cash revenues and all other monies received by the borrower or manager relating to The Bluffs Property be deposited into the lockbox account within one business day after receipt. Prior to the occurrence of a Cash Trap Event Period (as defined below), all excess funds on deposit in the lockbox account are distributed to the borrower’s operating account. During a Cash Trap Event Period, all excess funds on deposit in the lockbox account are retained in a lender-controlled cash management account.
A “Cash Trap Event Period” will commence upon the earlier of (i) the occurrence and continuance of an event of default or (ii) the debt service coverage ratio for the trailing 12-month period falling below 1.10x. A Cash Trap Event Period will end, with regard to clause (i), upon the cure of such event of default and with regard to clause (ii), when the debt service coverage ratio is equal to or greater than 1.15x for two consecutive calendar quarters.
Property Management. The Bluffs Property is managed by Riverstone Residential SC, LLC (“Riverstone”). Riverstone is the second largest apartment manager in the United States, managing over 700 multifamily properties. Riverstone manages approximately 2,000 military housing units, including The Bluffs Property and three other properties.
Assumption. The borrower has a two-time right to transfer The Bluffs Property, provided that no event of default has occurred and is continuing and certain other conditions are satisfied, including (i) the lender’s reasonable determination that the proposed transferee and guarantor satisfy the lender’s credit review and underwriting standards, taking into consideration transferee experience, financial strength and general business standing; (ii) execution of a recourse guaranty and an environmental indemnity by an affiliate of the transferee; and (iii) if requested by the lender, rating agency confirmation from DBRS, Moody’s and Morningstar that the transfer will not result in a downgrade, withdrawal or qualification of the respective ratings assigned to the Series 2014-C21 Certificates.
Partial Release. Not permitted.
Real Estate Substitution. Not permitted.
Subordinate and Mezzanine Indebtedness. Not permitted.
Ground Lease. None.
THE INFORMATION IN THIS STRUCTURAL AND COLLATERAL TERM SHEET IS NOT COMPLETE AND MAY BE AMENDED PRIOR TO THE TIME OF SALE. THIS TERM SHEET IS NOT AN OFFER TO SELL THESE SECURITIES AND IT IS NOT A SOLICITATION OF AN OFFER TO BUY THESE SECURITIES IN ANY JURISDICTION WHERE THE OFFER OR SALE IS NOT PERMITTED.
107
| THE BLUFFS |
Terrorism Insurance. The loan documents require that the “all risk” insurance policy required to be maintained by the borrower provides coverage for terrorism in an amount equal to the full replacement cost of The Bluffs Property, as well as business interruption insurance covering no less than the 18-month period following the occurrence of a casualty event, together with a six-month extended period of indemnity.
THE INFORMATION IN THIS STRUCTURAL AND COLLATERAL TERM SHEET IS NOT COMPLETE AND MAY BE AMENDED PRIOR TO THE TIME OF SALE. THIS TERM SHEET IS NOT AN OFFER TO SELL THESE SECURITIES AND IT IS NOT A SOLICITATION OF AN OFFER TO BUY THESE SECURITIES IN ANY JURISDICTION WHERE THE OFFER OR SALE IS NOT PERMITTED.
108
(THIS PAGE INTENTIONALLY LEFT BLANK)
109
| No. 11 – Holiday Inn San Francisco Airport | ||||||||||
| Loan Information | Property Information | |||||||||
| Mortgage Loan Seller: | Liberty Island Group I LLC | Single Asset/Portfolio: | Single Asset | |||||||
Credit Assessment (DBRS/Moody’s/Morningstar): | NR/NR/NR | Property Type: | Hospitality | |||||||
| Original Principal Balance: | $33,000,000 | Specific Property Type: | Full Service | |||||||
| Cut-off Date Principal Balance: | $33,000,000 | Location: | South San Francisco, CA | |||||||
| % of Initial Pool Balance: | 2.3% | Size: | 224 rooms | |||||||
| Loan Purpose: | Refinance | Cut-off Date Principal Balance Per Room: | $147,321 | |||||||
| Borrower Name: | Lotus Hospitality II, Inc. | Year Built/Renovated: | 1968/2012 | |||||||
| Sponsor: | Ganendra Singh | Title Vesting: | Fee | |||||||
| Mortgage Rate: | 4.870% | Property Manager: | G & M Hospitality Inc. | |||||||
| Note Date: | July 2, 2014 | 3rd Most Recent Occupancy (As of): | 79.0% (12/31/2011) | |||||||
| Anticipated Repayment Date: | NAP | 2nd Most Recent Occupancy (As of): | 85.5% (12/31/2012) | |||||||
| Maturity Date: | August 1, 2024 | Most Recent Occupancy (As of): | 86.5% (12/31/2013) | |||||||
| IO Period: | None | Current Occupancy (As of): | 87.1% (3/31/2014) | |||||||
| Loan Term (Original): | 120 months | |||||||||
| Seasoning: | 0 months | |||||||||
| Amortization Term (Original): | 300 months | Underwriting and Financial Information: | ||||||||
| Loan Amortization Type: | Amortizing Balloon | |||||||||
| Interest Accrual Method: | Actual/360 | 3rd Most Recent NOI (As of): | $5,126,962 (12/31/2012) | |||||||
| Call Protection: | L(24),D(92),O(4) | 2nd Most Recent NOI (As of): | $6,016,733 (12/31/2013) | |||||||
| Lockbox Type: | Hard/Springing Cash Management | Most Recent NOI (As of): | $6,454,402 (TTM 3/31/2014) | |||||||
| Additional Debt: | None | |||||||||
| Additional Debt Type: | NAP | U/W Revenues: | $9,832,305 | |||||||
| U/W Expenses: | $5,052,581 | |||||||||
| U/W NOI: | $4,779,724 | |||||||||
| U/W NCF: | $4,386,432 | |||||||||
| U/W NOI DSCR: | 2.09x | |||||||||
Escrows and Reserves: | U/W NCF DSCR: | 1.92x | ||||||||
| U/W NOI Debt Yield: | 14.5% | |||||||||
| U/W NCF Debt Yield: | 13.3% | |||||||||
Type: | Initial | Monthly | Cap (If Any) | As-Is Appraised Value: | $58,400,000 | |||||
| Taxes | $133,324 | $19,046 | NAP | As-Is Appraisal Valuation Date: | February 11, 2014 | |||||
| Insurance | $29,770 | $4,962 | NAP | Cut-off Date LTV Ratio: | 56.5% | |||||
| Replacement Reserve | $32,560 | $32,560 | NAP | LTV Ratio at Maturity or ARD: | 42.1% | |||||
The Holiday Inn San Francisco Airport mortgage loan is evidenced by a single promissory note that is secured by a first mortgage encumbering a 224-room, full service hotel located in South San Francisco, California (the “Holiday Inn San Francisco Airport Property”). The Holiday Inn San Francisco Airport Property was constructed in phases between 1968 and 2006 and features a north tower and south tower connected by a ground floor lobby. The Holiday Inn San Francisco Airport Property was purchased as part of a portfolio deal from Wyndham Hotels in 2003 for $14.4 million. The Holiday Inn San Francisco Airport Property was rebranded to a Holiday Inn by InterContinental Hotels Group in 2009. The Holiday Inn San Francisco Airport Property underwent a total of $12.5 million of renovations since 2003, which included renovations of and additions to the lobby and additional food and beverage areas, as well as renovations related to a franchise renewal required PIP that included extensive interior and façade upgrades. The Holiday Inn San Francisco Airport Property features 100 king bedroom guestrooms and 124 queen bedroom guestrooms. Amenities at the Holiday Inn San Francisco Airport Property include a restaurant and bar, Houlihan’s, which is leased by a third party. The restaurant was completely renovated in 2011 and has a seating capacity of 260 patrons. The Holiday Inn San Francisco Airport Property also offers three meeting rooms and a ballroom, totaling 6,041 square feet of meeting space. The ballroom is divisible into three separate rooms. In 2011, all meeting space underwent renovation.
The Holiday Inn San Francisco Airport Property is located in South San Francisco, California, immediately off of the U.S. Highway 101 South Airport Boulevard Exit and just north of the San Francisco International Airport. San Francisco is a major financial, cultural, and transportation center of the Bay Area and is home to the headquarters of over 30 international financial institutions. According to a third party hospitality report, there are 10 properties in the Holiday Inn San Francisco Airport Property’s competitive set comprising 1,755 rooms. The Holiday Inn San Francisco Airport Property competes primarily for the commercial demand generated by the San Francisco International Airport. The Holiday Inn San Francisco Airport Property is managed by an affiliate of the borrower. The franchise agreement with InterContinental Hotels Group expires in June 2019.
THE INFORMATION IN THIS STRUCTURAL AND COLLATERAL TERM SHEET IS NOT COMPLETE AND MAY BE AMENDED PRIOR TO THE TIME OF SALE. THIS TERM SHEET IS NOT AN OFFER TO SELL THESE SECURITIES AND IT IS NOT A SOLICITATION OF AN OFFER TO BUY THESE SECURITIES IN ANY JURISDICTION WHERE THE OFFER OR SALE IS NOT PERMITTED.
110
| HOLIDAY INN SAN FRANCISCO AIRPORT |
Sources and Uses
| Sources | Uses | ||||||||
| Original loan amount | $33,000,000 | 100.0% | Loan Payoff(1) | $22,644,129 | 68.6 | % | |||
| Reserves | 195,654 | 0.6 | |||||||
| Closing costs | 562,451 | 1.7 | |||||||
| Return of equity | 9,597,766 | 29.1 | |||||||
| Total Sources | $33,000,000 | 100.0% | Total Uses | $33,000,000 | 100.0 | % |
(1) | Loan Payoff consists of the payoff of an existing loan with KeyBank in the amount of approximately $12.0 million, as well as a $10.0 million intercompany debt repayment. |
Operating History and Underwritten Net Cash Flow. The following table presents certain information relating to the historical operating performance and the Underwritten Net Cash Flow at the Holiday Inn San Francisco Airport Property:
Cash Flow Analysis
2012 | 2013 | TTM 3/31/2014 | U/W(1) | U/W $ per Room | ||||||
| Occupancy | 85.5% | 86.5% | 87.1% | 79.0% | ||||||
| ADR | $119.78 | $130.30 | $134.55 | $130.00 | ||||||
| RevPAR | $102.41 | $112.71 | $117.19 | $102.70 | ||||||
| Total Revenue | $9,818,355 | $10,747,209 | $11,083,227 | $9,832,305 | $43,894 | |||||
| Total Department Expenses | 2,098,085 | 2,130,333 | 2,140,695 | 2,089,379 | 9,328 | |||||
| Gross Operating Profit | $7,720,270 | $8,616,876 | $8,942,532 | $7,742,926 | $34,567 | |||||
| Total Undistributed Expenses | 2,325,368 | 2,357,175 | 2,235,480 | 2,454,321 | 10,957 | |||||
| Profit Before Fixed Charges | $5,394,902 | $6,259,701 | $6,707,052 | $5,288,605 | $23,610 | |||||
| Total Fixed Charges | 267,940 | 242,968 | 252,650 | 508,881 | 2,272 | |||||
| Net Operating Income | $5,126,962 | $6,016,733 | $6,454,402 | $4,779,724 | $21,338 | |||||
| FF&E | 0 | 0 | 0 | 393,292 | 1,756 | |||||
| Net Cash Flow | $5,126,962 | $6,016,733 | $6,454,402 | $4,386,432 | $19,582 | |||||
| NOI DSCR | 2.24x | 2.63x | 2.82x | 2.09x | ||||||
| NCF DSCR | 2.24x | 2.63x | 2.82x | 1.92x | ||||||
| NOI DY | 15.5% | 18.2% | 19.6% | 14.5% | ||||||
| NCF DY | 15.5% | 18.2% | 19.6% | 13.3% | ||||||
| (1) | The U/W RevPAR, and U/W Net Operating Income are lower than historicals as the lender capped the occupancy at 79.0%. |
Subject and Market Historical Occupancy, ADR and RevPAR(1)
Competitive Set | Holiday Inn San Francisco Airport | Penetration Factor | ||||||||||||||||
Year | Occupancy | ADR | RevPAR | Occupancy | ADR | RevPAR | Occupancy | ADR | RevPAR | |||||||||
| 12/30/2013 | 85.4% | $126.80 | $108.24 | 86.6% | $130.49 | $112.95 | 101.4% | 102.9% | 104.4% | |||||||||
| 12/30/2012 | 81.2% | $142.90 | $116.04 | 85.5% | $120.11 | $102.76 | 105.4% | 84.1% | 88.6% | |||||||||
| 12/30/2011 | 81.8% | $121.15 | $99.08 | 79.0% | $98.10 | $77.52 | 96.6% | 81.0% | 78.2% | |||||||||
| (1) | Information obtained from a third party hospitality report. According to such third party hospitality report, the competitive set includes the following hotels: Best Western Plus Grosvenor Airport Hotel, Doubletree San Francisco Airport, Radisson San Francisco Airport Bay Front, Holiday Inn Express San Francisco Airport North, Four Point Hotel & Suites San Francisco Airport. |
THE INFORMATION IN THIS STRUCTURAL AND COLLATERAL TERM SHEET IS NOT COMPLETE AND MAY BE AMENDED PRIOR TO THE TIME OF SALE. THIS TERM SHEET IS NOT AN OFFER TO SELL THESE SECURITIES AND IT IS NOT A SOLICITATION OF AN OFFER TO BUY THESE SECURITIES IN ANY JURISDICTION WHERE THE OFFER OR SALE IS NOT PERMITTED.
111
| No. 12 – White Road Plaza | |||||||
| Loan Information | Property Information | ||||||
| Mortgage Loan Seller: | Wells Fargo Bank, National Association | Single Asset/Portfolio: | Single Asset | ||||
Credit Assessment (DBRS/Moody’s/Morningstar): | NR/NR/NR | Property Type: | Retail | ||||
| Original Principal Balance: | $32,000,000 | Specific Property Type: | Anchored | ||||
| Cut-off Date Principal Balance: | $32,000,000 | Location: | San Jose, CA | ||||
| % of Initial Pool Balance: | 2.2% | Size: | 153,493 SF | ||||
| Loan Purpose: | Refinance | Cut-off Date Principal Balance Per SF: | $208.48 | ||||
| Borrower Name: | White Road Partners, LLC | Year Built/Renovated: | 1988/1998 | ||||
Sponsor(1): | Peter W. Doerken | Title Vesting: | Fee | ||||
| Mortgage Rate: | 4.550% | Property Manager: | Doerken Properties, Inc. | ||||
| Note Date: | July 1, 2014 | 3rd Most Recent Occupancy (As of)(5): | 77.4% (12/31/2011) | ||||
| Anticipated Repayment Date: | NAP | 2nd Most Recent Occupancy (As of): | 97.1% (12/31/2012) | ||||
| Maturity Date: | July 11, 2024 | Most Recent Occupancy (As of): | 100.0% (12/31/2013) | ||||
| IO Period: | 60 months | Current Occupancy (As of): | 98.7% (4/30/2014) | ||||
| Loan Term (Original): | 120 months | ||||||
| Seasoning: | 1 month | Underwriting and Financial Information: | |||||
| Amortization Term (Original): | 360 months | ||||||
| Loan Amortization Type: | Interest-only, Amortizing Balloon | 3rd Most Recent NOI (As of): | $2,044,644 (12/31/2012) | ||||
| Interest Accrual Method: | Actual/360 | 2nd Most Recent NOI (As of): | $2,101,592 (12/31/2013) | ||||
| Call Protection: | L(25),D(91),O(4) | Most Recent NOI (As of): | $2,421,500 (TTM 4/30/2014) | ||||
| Lockbox Type: | Hard/Upfront Cash Management | ||||||
| Additional Debt: | None | ||||||
| Additional Debt Type: | NAP | U/W Revenues: | $3,937,258 | ||||
| U/W Expenses: | $1,161,247 | ||||||
U/W NOI(6): | $2,776,011 | ||||||
| U/W NCF: | $2,591,344 | ||||||
Escrows and Reserves: | U/W NOI DSCR: | 1.42x | |||||
| U/W NCF DSCR: | 1.32x | ||||||
| Type: | Initial | Monthly | Cap (If Any) | U/W NOI Debt Yield: | 8.7% | ||
| Taxes | $159,544 | $39,886(2) | NAP | U/W NCF Debt Yield: | 8.1% | ||
Insurance(3) | $0 | Springing | NAP | As-Is Appraised Value: | $44,840,000 | ||
| Replacement Reserves | $0 | $2,558 | $92,096 | As-Is Appraisal Valuation Date: | May 16, 2014 | ||
| TI/LC Reserve | $0 | $12,500 | $300,000 | Cut-off Date LTV Ratio: | 71.4% | ||
Lease Termination Reserve(4) | $0 | Springing | NAP | LTV Ratio at Maturity or ARD: | 65.4% | ||
| (1) | Affiliates of Peter W. Doerken were involved in two prior foreclosures. See “Description of the Mortgage Pool—Default History, Prior Bankruptcy Issues and Other Proceedings” in the Free Writing Prospectus. |
| (2) | Additional ongoing monthly reserves for real estate taxes are required where tenants occupying more than 20,000 square feet (i) are not paying taxes directly to the tax collecting authority or (ii) not being required to reimburse or are not reimbursing the borrower for tax payments. |
| (3) | Ongoing monthly reserves for insurance are not required as long as (i) no event of default has occurred and is continuing; (ii) the White Road Mall Property is covered by an acceptable blanket insurance policy; and (iii) the borrower provides the lender with evidence of renewal of the insurance policies and timely proof of payment of insurance premiums. Springing additional ongoing monthly reserves for insurance are required where tenants occupying more than 20,000 square feet (a) do not pay insurance premiums directly to the insurance company or (b) are not required to reimburse or are not reimbursing the borrower for insurance payments. |
| (4) | In the event that the borrower receives a fee, payment or other compensation from any tenant relating to or in exchange for the termination of the tenant’s lease, the borrower must deposit such fee with lender to be utilized for tenant improvements and leasing commissions related to the re-tenanting of such space. |
| (5) | See “Historical Occupancy” section. |
| (6) | See “Cash Flow Analysis” section. |
The White Road Plaza mortgage loan is evidenced by a single promissory note that is secured by a first mortgage encumbering a 153,493 square foot anchored retail center (the “White Road Plaza Property”) located in San Jose, California. The White Road Plaza Property is made up of 11 single-story retail buildings situated on a 14.1-acre site completed in 1988. The White Road Plaza Property is situated at the intersection of South White Road and Story Road, which report traffic counts of 27,200 vehicles per day and 17,618 vehicles per day, respectively. There are three access points to the White Road Plaza Property along South White Road and two access points along Story Road. The White Road Plaza Property is anchored by the grocer Mi Pueblo, drugstore Rite Aid, and clothing store dd’s Discounts, and includes three pad sites leased by O’Reilly Auto Parts, El Pollo Loco, and Foothill Community Center. The White Road Plaza Property features 631 surface parking spots, resulting in a parking ratio of 4.1 spaces per 1,000 square feet of rentable area. The White Road Plaza Property was 98.7% leased as of April 30, 2014.
THE INFORMATION IN THIS STRUCTURAL AND COLLATERAL TERM SHEET IS NOT COMPLETE AND MAY BE AMENDED PRIOR TO THE TIME OF SALE. THIS TERM SHEET IS NOT AN OFFER TO SELL THESE SECURITIES AND IT IS NOT A SOLICITATION OF AN OFFER TO BUY THESE SECURITIES IN ANY JURISDICTION WHERE THE OFFER OR SALE IS NOT PERMITTED.
112
| WHITE ROAD PLAZA |
Sources and Uses
| Sources | Uses | |||||||
| Original loan amount | $32,000,000 | 100.0% | Loan Payoff(1) | $18,950,812 | 59.2 | % | ||
| Reserve | 159,544 | 0.5 | ||||||
| Closing costs | 461,969 | 1.4 | ||||||
| Return of equity | 12,427,675 | 38.8 | ||||||
| Total Sources | $32,000,000 | 100.0% | Total Uses | $32,000,000 | 100.0 | % | ||
| (1) | The White Road Plaza Property was previously securitized in GSMS 2004-GG2. |
The following table presents certain information relating to the tenancy at the White Road Plaza Property:
Major Tenants
| Tenant Name | Credit Ratng (Fitch/Moody’s/ S&P)(1) | Tenant NRSF | % of NRSF | Annual U/W Base Rent PSF | Annual U/W Base Rent | % of Total Annual U/W Base Rent | Sales PSF(2) | Occupancy Cost(2) | Lease Expiration Date | |||||||
| Anchor Tenants | ||||||||||||||||
Mi Pueblo(3) | NR/NR/NR | 39,880 | 26.0% | $14.49 | $577,995 | 20.5% | $429 | 5.1% | 4/30/2023 | |||||||
| dd’s Discounts | NR/NR/A- | 25,466 | 16.6% | $8.25 | $210,107 | 7.5% | NAV | NAV | 1/31/2025(4) | |||||||
| Rite Aid | B/Caa1/B | 23,672 | 15.4% | $8.47 | $200,502 | 7.1% | $225 | 7.1% | 11/30/2017 | |||||||
| Total Anchor Tenants | 89,018 | 58.0% | $11.11 | $988,604 | 35.1% | |||||||||||
| Major Tenants | ||||||||||||||||
| Foothill Community Health | NR/NR/NR | 7,000 | 4.6% | $25.80 | $180,600 | 6.4% | NAV | NAV | 10/31/2022 | |||||||
| Gen-X Clothing | NR/NR/NR | 9,500 | 6.2% | $16.80 | $159,600 | 5.7% | NAV | NAV | 12/31/2016 | |||||||
| O’Reilly Auto Enterprise | NR/Baa2/BBB | 4,799 | 3.1% | $29.35 | $140,868 | 5.0% | NAV | NAV | 10/31/2018 | |||||||
| Total Major Tenants | 21,299 | 13.9% | $22.59 | $481,068 | 17.1% | |||||||||||
| Non-Major Tenants | 41,176 | 26.8% | $32.71 | $1,347,025 | 47.8% | |||||||||||
| Occupied Collateral Total | 151,493 | 98.7% | $18.59 | $2,816,697 | 100.0% | |||||||||||
| Vacant Space | 2,000 | 1.3% | ||||||||||||||
| Collateral Total | 153,493 | 100.0% | ||||||||||||||
| (1) | Credit Ratings are those of the parent company whether or not the parent guarantees the lease. |
(2) | Sales PSF and Occupancy Costs are for the trailing 12-month period ending December 31, 2013. |
(3) | Mi Pueblo filed for bankruptcy in July 2013 and exited bankruptcy in June 2014. Mi Pueblo affirmed its lease and exercised a lease extension option through April 2023. |
(4) | dd’s Discounts may terminate its lease with 120 days notice if gross sales do not exceed $6,500,000 for any consecutive 12 month period during the first three years of the lease (ending January 31, 2018). The tenant took occupancy in March 2014 and sales information is not yet available. |
THE INFORMATION IN THIS STRUCTURAL AND COLLATERAL TERM SHEET IS NOT COMPLETE AND MAY BE AMENDED PRIOR TO THE TIME OF SALE. THIS TERM SHEET IS NOT AN OFFER TO SELL THESE SECURITIES AND IT IS NOT A SOLICITATION OF AN OFFER TO BUY THESE SECURITIES IN ANY JURISDICTION WHERE THE OFFER OR SALE IS NOT PERMITTED.
113
| WHITE ROAD PLAZA |
The following table presents certain information relating to the lease rollover schedule at the White Road Plaza Property:
Lease Expiration Schedule(1)(2)
Year Ending December 31, | No. of Leases Expiring | Expiring NRSF | % of Total NRSF | Cumulative Expiring NRSF | Cumulative % of Total NRSF | Annual U/W Base Rent | Annual U/W Base Rent PSF(3) | |
| MTM | 3 | 4,936 | 3.2% | 4,936 | 3.2% | $132,425 | $26.83 | |
| 2014 | 1 | 1,000 | 0.7% | 5,936 | 3.9% | $36,283 | $36.28 | |
| 2015 | 6 | 8,689 | 5.7% | 14,625 | 9.5% | $294,683 | $33.91 | |
| 2016 | 6 | 18,402 | 12.0% | 33,027 | 21.5% | $444,721 | $24.17 | |
| 2017 | 5 | 29,452 | 19.2% | 62,479 | 40.7% | $400,503 | $13.60 | |
| 2018 | 5 | 13,758 | 9.0% | 76,237 | 49.7% | $409,430 | $29.76 | |
| 2019 | 0 | 0 | 0.0% | 76,237 | 49.7% | $0 | $0.00 | |
| 2020 | 0 | 0 | 0.0% | 76,237 | 49.7% | $0 | $0.00 | |
| 2021 | 1 | 2,910 | 1.9% | 79,147 | 51.6% | $129,950 | $44.66 | |
| 2022 | 1 | 7,000 | 4.6% | 86,147 | 56.1% | $180,600 | $25.80 | |
| 2023 | 1 | 39,880 | 26.0% | 126,027 | 82.1% | $577,995 | $14.49 | |
| 2024 | 0 | 0 | 0.0% | 126,027 | 82.1% | $0 | $0.00 | |
| Thereafter | 1 | 25,466 | 16.6% | 151,493 | 98.7% | $210,107 | $8.25 | |
| Vacant | 0 | 2,000 | 1.3% | 153,493 | 100.0% | $0 | $0.00 | |
| Total/Weighted Average | 30 | 153,493 | 100.0% | $2,816,697 | $18.59 |
| (1) | Information obtained from the underwritten rent roll. |
| (2) | Certain tenants may have lease termination options that are exercisable prior to the originally stated expiration date of the subject lease and that are not considered in the Lease Expiration Schedule. |
| (3) | Weighted Average Annual U/W Base Rent PSF excludes vacant space. |
The following table presents historical occupancy percentages at the White Road Plaza Property:
Historical Occupancy
12/31/2011(1)(2) | 12/31/2012(1) | 12/31/2013(1) | 4/30/2014(3) | |||
| 77.4% | 97.1% | 100.0% | 98.7% |
| (1) | Information obtained from the borrower. |
| (2) | Occupancy declined in 2011 due to Big Lots (16.6% of the net rentable area) vacating. |
| (3) | Information obtained from the underwritten rent roll. |
Operating History and Underwritten Net Cash Flow. The following table presents certain information relating to the Underwritten Net Cash Flow at the White Road Plaza Property:
Cash Flow Analysis
| 2012 | 2013 | TTM 4/30/2014(1) | U/W(2) | U/W $ per SF | ||||||
| Base Rent | $2,334,577 | $2,481,723 | $2,665,754 | $2,816,697 | $18.35 | |||||
| Grossed Up Vacant Space | 0 | 0 | 0 | 66,000 | 0.43 | |||||
| Total Reimbursables | 789,065 | 824,450 | 909,991 | 1,103,185 | 7.19 | |||||
| Other Income | 750 | 0 | 0 | 95,512 | 0.62 | |||||
| Less Vacancy & Credit Loss | 0 | (5,500) | (5,500) | (144,135)(3) | (0.94) | |||||
| Effective Gross Income | $3,124,392 | $3,300,673 | $3,570,245 | $3,937,258 | $25.65 | |||||
| Total Operating Expenses | $1,079,748 | $1,199,081 | $1,148,745 | $1,161,247 | $7.57 | |||||
| Net Operating Income | $2,044,644 | $2,101,592 | $2,421,500 | $2,776,011 | $18.09 | |||||
| TI/LC | 0 | 0 | 0 | 153,969 | 1.00 | |||||
| Capital Expenditures | 0 | 0 | 0 | 30,699 | 0.20 | |||||
| Net Cash Flow | $2,044,644 | $2,101,592 | $2,421,500 | $2,591,344 | $16.88 | |||||
| NOI DSCR | 1.04x | 1.07x | 1.24x | 1.42x | ||||||
| NCF DSCR | 1.04x | 1.07x | 1.24x | 1.32x | ||||||
| NOI DY | 6.4% | 6.6% | 7.6% | 8.7% | ||||||
| NCF DY | 6.4% | 6.6% | 7.6% | 8.1% |
| (1) | The increase in Base Rent and Net Operating Income is due to dd’s Discount taking occupancy in March 2014. |
| (2) | The increase in U/W Net Operating Income is due to dd’s Discounts taking occupancy in March 2014 and contractual rental increases associated with various other tenants. |
| (3) | The underwritten economic vacancy is 5.0%. The White Road Plaza Property was 98.7% physically occupied as of April 30, 2014. |
THE INFORMATION IN THIS STRUCTURAL AND COLLATERAL TERM SHEET IS NOT COMPLETE AND MAY BE AMENDED PRIOR TO THE TIME OF SALE. THIS TERM SHEET IS NOT AN OFFER TO SELL THESE SECURITIES AND IT IS NOT A SOLICITATION OF AN OFFER TO BUY THESE SECURITIES IN ANY JURISDICTION WHERE THE OFFER OR SALE IS NOT PERMITTED.
114
(THIS PAGE INTENTIONALLY LEFT BLANK)
115
| No. 13 – Oak Park Village Apartments | |||||||
| Loan Information | Property Information | ||||||
| Mortgage Loan Seller: | Basis Real Estate Capital II, LLC | Single Asset/Portfolio: | Single Asset | ||||
Credit Assessment (DBRS/Moody’s/Morningstar): | NR/NR/NR | Property Type: | Multifamily | ||||
| Original Principal Balance: | $29,150,000 | Specific Property Type: | Garden | ||||
| Cut-off Date Principal Balance: | $29,150,000 | Location: | Lansing, MI | ||||
| % of Initial Pool Balance: | 2.0% | Size: | 618 Units | ||||
| Loan Purpose: | Acquisition | Cut-off Date Principal Balance Per Unit: | $47,168 | ||||
| Borrower Name: | OPV Partners, LLC | Year Built/Renovated: | 1977/2009 | ||||
| Sponsors: | Shawn Stafford and Derron Sanders | Title Vesting: | Fee | ||||
| Mortgage Rate: | 4.770% | Property Manager: | MF United Management, LLC | ||||
| Note Date: | May 22, 2014 | 3rd Most Recent Occupancy (As of)(4): | 95.0% (12/31/2011) | ||||
| Anticipated Repayment Date: | NAP | 2nd Most Recent Occupancy (As of)(4): | 93.5% (12/31/2012) | ||||
| Maturity Date: | June 1, 2024 | Most Recent Occupancy (As of)(4): | 95.0% (12/31/2013) | ||||
| IO Period: | 36 months | Current Occupancy (As of): | 97.2% (2/28/2014) | ||||
| Loan Term (Original): | 120 months | ||||||
| Seasoning: | 2 months | Underwriting and Financial Information: | |||||
| Amortization Term (Original): | 360 months | ||||||
| Loan Amortization Type: | Interest-only, Amortizing Balloon | 3rd Most Recent NOI (As of): | $3,017,889 (12/31/2011) | ||||
| Interest Accrual Method: | Actual/360 | 2nd Most Recent NOI (As of): | $2,877,153 (12/31/2012) | ||||
| Call Protection: | L(26),D(91),O(3) | Most Recent NOI (As of): | $2,909,597 (12/31/2013) | ||||
| Lockbox Type: | Springing (Without Established Account) | ||||||
Additional Debt(1): | $4,000,000 | ||||||
Additional Debt Type(1): | Mezzanine | U/W Revenues: | $5,467,897 | ||||
| U/W Expenses: | $2,408,890 | ||||||
| U/W NOI: | $3,059,007 | ||||||
| U/W NCF: | $2,883,495 | ||||||
Escrows and Reserves: | U/W NOI DSCR: | 1.67x | |||||
| U/W NCF DSCR: | 1.58x | ||||||
| Type: | Initial | Monthly | Cap (If Any) | U/W NOI Debt Yield: | 10.5% | ||
| Taxes | $349,506 | $38,834 | NAP | U/W NCF Debt Yield: | 9.9% | ||
| Insurance | $24,511 | $12,255 | NAP | As-Is Appraised Value(5): | $37,000,000 | ||
Replacement Reserves(2) | $0 | Springing | $775,000 | As-Is Appraisal Valuation Date: | November 21, 2013 | ||
| Deferred Maintenance | $15,563 | $0 | NAP | Cut-off Date LTV Ratio(5): | 69.3% | ||
Renovation Reserve/Holdback(3) | $3,500,000 | $0 | NAP | LTV Ratio at Maturity or ARD(5): | 59.9% | ||
| (1) | At closing, the seller, AIMCO Properties, L.P., provided a $4,000,000 mezzanine loan which has a 12.000% interest-only coupon. The U/W NCF debt yield and U/W NCF DSCR based on the total financing of $33,150,000 are 8.7% and1.25x, respectively. The Cut-Off Date LTV Ratio of the aggregate indebtedness is 80.1% and is calculated net of the $3,500,000 Holdback. The Cut-off Date LTV ratio of the aggregate indebtedness without netting out the Holdback is 89.6%. The Cut-off Date Principal Balance Per Unit based on the total financing of $33,150,000 is $53,641. |
| (2) | Monthly replacement reserves in the amount of $14,626 will be collected upon the earlier of (i) May 22, 2015 or (ii) the balance in the Renovation Reserve falling below $465,000. Subsequently, the Replacement Reserve will be capped at $775,000 (with replenishment). |
| (3) | At closing, the lender held back $3,500,000 of loan proceeds ($5,663 per unit) in a Renovation Reserve account, which will be used over the first two loan years to make unit upgrades, replace all windows, repair/resurface parking and carports, replace 30% of townhome roofs, replace/update apartment building entryways, and replace all townhome doors. |
| (4) | Represents the average occupancy over the preceding 12-month period. |
| (5) | The Cut-off Date LTV Ratio and LTV Ratio at Maturity shown are based on the Cut-off Date Balance net of the $3,500,000 holdback and the as-is appraised value of $37,000,000. The Cut-Off Date LTV Ratio and LTV Ratio at Maturity based on the Cut-off Date Balance and the as-is appraised value are 78.8% and 69.4%, respectively. Further, the appraiser concluded to an as-stabilized appraised value of $44,500,000 as of December 1, 2015 based on improvements resulting from the completion of the borrower’s planned $3.5 million renovation of the mortgaged property. The Cut-Off Date LTV Ratio and LTV Ratio at Maturity based on the Cut-off Date Balance and the as-stabilized appraised value are 65.5% and 57.7%, respectively. |
The Oak Park Village Apartments mortgage loan is evidenced by a single promissory note that is secured by a first mortgage encumbering a 618-unit multifamily property located in Lansing, Michigan (“The Oak Park Village Apartments Property”). The Oak Park Village Apartments Property is situated on a 56.2-acre site and is located approximately 6.1 miles south of downtown Lansing, 4.8 miles southwest of Michigan State University, and 9.8 miles southeast of the Capital Region International Airport. The Oak Park Village Apartments Property consists of 223 one bedroom/one bathroom units, 104 two bedroom/one bathroom units, 221 two bedroom/1.5 bathroom units and 70 three bedroom/1.5 bathroom units. Of the 618 total units, 410 are one- two- or three-bedroom townhouse units. Each of the townhouse units includes a full basement and in-unit washer/dryer. The Oak Park Village Apartments Property was built in 1977 and renovated in 2009. Amenities include a clubhouse with leasing center, swimming pool, jogging track, children’s play area, extra storage, laundry facilities and an attached parking structure. The Oak Park Village Apartments Property contains 800 open surface and 600 covered parking spaces, resulting in a parking ratio of 2.3 spaces per unit. As of February 28, 2014, the Oak Park Village Apartments Property was 97.2% occupied.
THE INFORMATION IN THIS STRUCTURAL AND COLLATERAL TERM SHEET IS NOT COMPLETE AND MAY BE AMENDED PRIOR TO THE TIME OF SALE. THIS TERM SHEET IS NOT AN OFFER TO SELL THESE SECURITIES AND IT IS NOT A SOLICITATION OF AN OFFER TO BUY THESE SECURITIES IN ANY JURISDICTION WHERE THE OFFER OR SALE IS NOT PERMITTED.
116
| OAK PARK VILLAGE APARTMENTS |
Sources and Uses
| Sources | Uses | |||||||
| Original senior loan amount | $29,150,000 | 74.1% | Purchase price | $34,500,000 | 87.8% | |||
| Mezzanine loan amount | 4,000,000 | 10.2 | Reserves | 3,889,579 | 9.9% | |||
| Sponsor’s new cash contribution | 6,158,231 | 15.7 | Closing costs | 918,652 | 2.3% | |||
| Total Sources | $39,308,231 | 100.0% | Total Uses | $39,308,231 | 100.0% |
The following table presents certain information relating to the unit mix of the Oak Park Village Apartments Property:
Unit Mix Summary(1)
| Unit Type | No. of Units | % of Total Units | Average Unit Size (SF) | Average Monthly U/W Base Rent | ||
| 1 Bedroom/1 Bathroom | 223 | 36.1% | 726 | $594 | ||
| 2 Bedroom/1 Bathroom | 104 | 16.8% | 916 | $594 | ||
| 2 Bedroom/1.5 Bathroom | 221 | 35.8% | 1,191 | $746 | ||
| 3 Bedroom/1.5 Bathroom | 70 | 11.3% | 1,362 | $886 | ||
| Total/Weighted Average | 618 | 100.0% | 996 | $681 | ||
| (1) Information obtained from the underwritten rent roll. | ||||||
The following table presents historical occupancy percentages at the Oak Park Village Apartments Property:
Historical Occupancy Percentages
12/31/2011(1)(2) | 12/31/2012(1)(2) | 12/31/2013(1)(2) | 2/28/2014(3) | |||
| 95.0% | 93.5% | 95.0% | 97.2% | |||
| (1) Information obtained from the borrower. | ||||||
| (2) Represents the average occupancy over the preceding 12-month period. | ||||||
| (3) Information obtained from the underwritten rent roll. | ||||||
Operating History and Underwritten Net Cash Flow. The following table presents certain information relating to the historical operating performance and the Underwritten Net Cash Flow at the Oak Park Village Apartments Property:
Cash Flow Analysis
| 2011 | 2012 | 2013 | U/W | U/W $ per Unit | ||||||
| Base Rent | $4,946,523 | $5,006,861 | $5,040,235 | $5,050,524 | $8,172 | |||||
| Other Income | 820,165 | 831,729 | 874,328 | 882,119 | 1,427 | |||||
| Less Concessions | (101,602) | (104,823) | (71,469) | (71,192) | (115) | |||||
| Less Vacancy & Credit Loss | (297,604) | (393,968) | (349,245) | (393,554)(1) | (637) | |||||
| Effective Gross Income | $5,367,482 | $5,339,799 | $5,493,849 | $5,467,897 | $8,848 | |||||
| Total Operating Expenses | $2,349,593 | $2,462,646 | $2,584,252 | $2,408,890 | $3,898 | |||||
| Net Operating Income | $3,017,889 | $2,877,153 | $2,909,597 | $3,059,007 | $4,950 | |||||
| Replacement Reserves | 0 | 0 | 0 | 175,512 | 284 | |||||
| Net Cash Flow | $3,017,889 | $2,877,153 | $2,909,597 | $2,883,495 | $4,666 | |||||
| NOI DSCR | 1.65x | 1.57x | 1.59x | 1.67x | ||||||
| NCF DSCR | 1.65x | 1.57x | 1.59x | 1.58x | ||||||
| NOI DY | 10.4% | 9.9% | 10.0% | 10.5% | ||||||
| NCF DY | 10.4% | 9.9% | 10.0% | 9.9% | ||||||
| (1) | The underwritten economic vacancy, not including 1.6% for Credit Loss and model/employee Units is 5.0%. The Oak Park Village Apartments Property was 97.2% physically occupied as of February 28, 2014. |
THE INFORMATION IN THIS STRUCTURAL AND COLLATERAL TERM SHEET IS NOT COMPLETE AND MAY BE AMENDED PRIOR TO THE TIME OF SALE. THIS TERM SHEET IS NOT AN OFFER TO SELL THESE SECURITIES AND IT IS NOT A SOLICITATION OF AN OFFER TO BUY THESE SECURITIES IN ANY JURISDICTION WHERE THE OFFER OR SALE IS NOT PERMITTED.
117
| No. 14 – The Lovejoy | |||||||
| Loan Information | Property Information | ||||||
| Mortgage Loan Seller: | Wells Fargo Bank, National Association | Single Asset/Portfolio: | Single Asset | ||||
Credit Assessment (DBRS/Moody’s/Morningstar): | NR/NR/NR | Property Type: | Office | ||||
| Original Principal Balance: | $24,000,000 | Specific Property Type: | CBD | ||||
| Cut-off Date Principal Balance: | $24,000,000 | Location: | Portland, OR | ||||
| % of Initial Pool Balance: | 1.7% | Size: | 83,422 SF | ||||
| Loan Purpose: | Acquisition | Cut-off Date Principal Balance Per SF: | $287.69 | ||||
| Borrower Names: | Unico BOP Lovejoy LLC | Year Built/Renovated: | 2008/NAP | ||||
Sponsor(1): | Unico Investment Group LLC | Title Vesting: | Fee | ||||
| Mortgage Rate: | 4.310% | Property Manager: | Self-managed | ||||
| Note Date: | June 18, 2014 | 3rd Most Recent Occupancy (As of): | 97.2% (12/31/2011) | ||||
| Anticipated Repayment Date: | NAP | 2nd Most Recent Occupancy (As of): | 100.0% (12/31/2012) | ||||
| Maturity Date: | July 11, 2024 | Most Recent Occupancy (As of): | 100.0% (12/31/2013) | ||||
| IO Period: | 120 months | Current Occupancy (As of): | 96.2% (4/30/2014) | ||||
| Loan Term (Original): | 120 months | ||||||
| Seasoning: | 1 month | Underwriting and Financial Information: | |||||
| Amortization Term (Original): | None | ||||||
| Loan Amortization Type: | Interest-only, Balloon | 3rd Most Recent NOI (As of): | $2,295,672 (12/31/2012) | ||||
| Interest Accrual Method: | Actual/360 | 2nd Most Recent NOI (As of): | $2,498,586 (12/31/2013) | ||||
| Call Protection: | L(25),D(91),O(4) | Most Recent NOI (As of): | $2,547,770 (TTM 3/31/2014) | ||||
| Lockbox Type: | Soft/Springing Cash Management | ||||||
| Additional Debt: | NAP | ||||||
| Additional Debt Type: | NAP | ||||||
| U/W Revenues: | $3,376,893 | ||||||
| U/W Expenses: | $942,787 | ||||||
| U/W NOI: | $2,434,106 | ||||||
| U/W NCF: | $2,275,031 | ||||||
Escrows and Reserves: | U/W NOI DSCR: | 2.32x | |||||
| U/W NCF DSCR: | 2.17x | ||||||
| Type: | Initial | Monthly | Cap (If Any) | U/W NOI Debt Yield: | 10.1% | ||
Taxes(2) | $0 | Springing | NAP | U/W NCF Debt Yield: | 9.5% | ||
Insurance(3) | $0 | Springing | NAP | As-Is Appraised Value: | $38,550,000 | ||
Replacement Reserves(4) | $0 | Springing | NAP | As-Is Appraisal Valuation Date: | May 20, 2014 | ||
| TI/LC Reserve | $0 | $10,428 | $500,000 | Cut-off Date LTV Ratio: | 62.3% | ||
| Significant Tenant Reserve | $0 | Springing(5) | (5) | LTV Ratio at Maturity or ARD: | 62.3% | ||
| (1) | The sponsor was involved in a maturity default in 2010. See “Description of the Mortgage Pool—Default History, Prior Bankruptcy Issues and Other Proceedings” in the Free Writing Prospectus. |
| (2) | Ongoing monthly reserves for real estate taxes are not required as long as (i) no event of default has occurred and is continuing; (ii) the borrower provides the lender with timely proof of payment of real estate taxes; and (iii) net cash flow debt yield is greater than or equal to 6.75%. In addition, ongoing monthly reserves for real estate taxes are required if Ater Wynne, or any replacement tenant for Ater Wynne that is leasing space representing 17.5% or greater of the net rentable area or gross potential rent (a) fails to renew its lease by the earlier of six months prior to lease expiration or the deadline for renewal set forth in such lease; (b) files bankruptcy; (c) terminates its lease; or (d) goes dark, vacates or otherwise fails to occupy its space and fails to pay rent. |
| (3) | Ongoing monthly reserves for insurance are not required as long as (i) no event of default has occurred and is continuing; (ii) The Lovejoy Property is covered by an acceptable blanket insurance policy; (iii) the borrower provides the lender with evidence of renewal of the insurance policies and timely proof of payment of insurance premiums; and (iv) net cash flow debt yield is greater than or equal to 6.75%. In addition, ongoing monthly reserves for insurance are required if Ater Wynne, or any replacement tenant for Ater Wynne that is leasing space representing 17.5% or greater of the net rentable area or gross potential rent (a) fails to renew its lease by the earlier of six months prior to lease expiration or the deadline for renewals set forth in such lease; (b) files bankruptcy; (c) terminates its lease; or (d) goes dark, vacates or otherwise fails to occupy its space and fails to pay rent. |
| (4) | Ongoing monthly replacement reserves of $1,390 are not required as long as (i) no event of default has occurred and is continuing and (ii) The Lovejoy Property is being adequately maintained. |
| (5) | Excess cash flow is required to be deposited into the Significant Tenant Reserve if Ater Wynne or any replacement tenant for Ater Wynne that is leasing space representing 17.5% or greater of the net rentable area or gross potential rent (a) fails to renew its lease by the earlier of six months prior to the lease expiration or the deadline for renewal set forth in such lease; (b) files bankruptcy; (c) terminates its lease; or (d) goes dark, vacates or otherwise fails to occupy its space and fails to pay rent. Deposits to the Significant Tenant Reserve cease in the event (i) the balance of the Significant Tenant Reserve funds equals $30.00 per square foot for the affected space or (ii) the aggregate balance of the Significant Tenant Reserve funds and TI/LC Reserve funds is at least $500,000. |
The Lovejoy mortgage loan is evidenced by a single promissory note that is secured by a first mortgage encumbering three floors of office space totaling 83,422 square feet of net rentable area and one and one half floors of parking comprising 141 spaces within a larger three-unit mixed-use condominium building located in the central business district of Portland, Oregon (“The Lovejoy Property”). The Lovejoy Property is situated within a larger nine-story, LEED Gold Certified mixed-use building that is comprised of a Safeway grocery store located on the ground level, parking on floors three through six and office space on floors seven through nine. Built in 2008, The Lovejoy Property is located in the Pearl District neighborhood and has averaged approximately 98.0%
THE INFORMATION IN THIS STRUCTURAL AND COLLATERAL TERM SHEET IS NOT COMPLETE AND MAY BE AMENDED PRIOR TO THE TIME OF SALE. THIS TERM SHEET IS NOT AN OFFER TO SELL THESE SECURITIES AND IT IS NOT A SOLICITATION OF AN OFFER TO BUY THESE SECURITIES IN ANY JURISDICTION WHERE THE OFFER OR SALE IS NOT PERMITTED.
118
| THE LOVEJOY |
occupancy since 2011. As of 2013, the population within a one-, three- and five-mile radius of The Lovejoy Property was 31,815, 153,745 and 373,964, respectively, and the average household income within the same one-, three- and five-mile radii was $53,892, $67,457 and $71,987, respectively. As of April 30, 2014, The Lovejoy Property was 96.2% occupied by eight tenants.
Sources and Uses
| Sources | Uses | ||||||||
| Original loan amount | $24,000,000 | 62.0 | % | Purchase Price | $38,550,000 | 99.6 | % | ||
| Sponsor’s new cash contribution | 14,693,175 | 38.0 | Closing costs | 143,175 | 0.4 | ||||
| Total Sources | $38,693,175 | 100.0 | % | Total Uses | $38,693,175 | 100.0 | % |
The following table presents certain information relating to the tenancy at The Lovejoy Property:
Major Tenants
Tenant Name | Credit Rating (Fitch/Moody’s/ S&P) | Tenant NRSF | % of NRSF | Annual U/W Base Rent PSF | Annual U/W Base Rent | % of Total Annual U/W Base Rent | Lease Expiration Date |
| Major Tenants | |||||||
Ater Wynne LLP(1) | NR/NR/NR | 36,293 | 43.5% | $28.52 | $1,034,996 | 46.7% | 3/31/2020 |
| Worksource, INC | NR/NR/NR | 15,244 | 18.3% | $24.24 | $369,566 | 16.7% | 9/30/2018 |
| Pacific Cataract and Laser Institute | NR/NR/NR | 10,709 | 12.8% | $30.15 | $322,876 | 14.6% | 4/30/2019 |
| BPM Senior Living Company | NR/NR/NR | 4,597 | 5.5% | $27.00 | $124,119 | 5.6% | 8/31/2017 |
| Total Major Tenants | 66,843 | 80.1% | $27.70 | $1,851,557 | 83.6% | ||
| Non-Major Tenants | 13,401 | 16.1% | $27.15 | $363,821 | 16.4% | ||
| Occupied Collateral Total | 80,244 | 96.2% | $27.61 | $2,215,378 | 100.0% | ||
| Vacant Space | 3,178 | 3.8% | |||||
| Collateral Total | 83,422 | 100.0% | |||||
| (1) | Ater Wynne subleases 6,232 square feet to Equilibrium Capital Group LLC at a rental rate of $2.70 per square foot and 2,380 square feet to SurveyMonkey.com, LLC at a rental rate of $30.00 per square foot. |
The following table presents certain information relating to the lease rollover schedule at The Lovejoy Property:
Lease Expiration Schedule(1)(2)
Year Ending December 31, | No. of Leases Expiring | Expiring NRSF | % of Total NRSF | Cumulative Expiring NRSF | Cumulative % of Total NRSF | Annual U/W Base Rent | Annual U/W Base Rent PSF(3) | |||||||
| MTM | 0 | 0 | 0.0% | 0 | 0.0% | $0 | $0.00 | |||||||
| 2014 | 1 | 4,359 | 5.2% | 4,359 | 5.2% | $113,770 | $26.10 | |||||||
| 2015 | 2 | 6,786 | 8.1% | 11,145 | 13.4% | $189,138 | $27.87 | |||||||
| 2016 | 0 | 0 | 0.0% | 11,145 | 13.4% | $0 | $0.00 | |||||||
| 2017 | 1 | 4,597 | 5.5% | 15,742 | 18.9% | $124,119 | $27.00 | |||||||
| 2018 | 1 | 15,244 | 18.3% | 30,986 | 37.1% | $369,566 | $24.24 | |||||||
| 2019 | 2 | 12,965 | 15.5% | 43,951 | 52.7% | $383,788 | $29.60 | |||||||
| 2020 | 1 | 36,293 | 43.5% | 80,244 | 96.2% | $1,034,996 | $28.52 | |||||||
| 2021 | 0 | 0 | 0.0% | 80,244 | 96.2% | $0 | $0.00 | |||||||
| 2022 | 0 | 0 | 0.0% | 80,244 | 96.2% | $0 | $0.00 | |||||||
| 2023 | 0 | 0 | 0.0% | 80,244 | 96.2% | $0 | $0.00 | |||||||
| 2024 | 0 | 0 | 0.0% | 80,244 | 96.2% | $0 | $0.00 | |||||||
| Thereafter | 0 | 0 | 0.0% | 80,244 | 96.2% | $0 | $0.00 | |||||||
| Vacant | 0 | 3,178 | 3.8% | 83,422 | 100.0% | $0 | $0.00 | |||||||
| Total/Weighted Average | 8 | 83,422 | 100.0% | $2,215,378 | $27.61 |
| (1) | Information obtained from the underwritten rent roll. |
| (2) | Certain tenants may have lease termination options that are exercisable prior to the originally stated expiration date of the subject lease and that are not considered in the Lease Expiration Schedule. |
| (3) | Weighted Average Annual U/W Base Rent PSF excludes vacant space. |
THE INFORMATION IN THIS STRUCTURAL AND COLLATERAL TERM SHEET IS NOT COMPLETE AND MAY BE AMENDED PRIOR TO THE TIME OF SALE. THIS TERM SHEET IS NOT AN OFFER TO SELL THESE SECURITIES AND IT IS NOT A SOLICITATION OF AN OFFER TO BUY THESE SECURITIES IN ANY JURISDICTION WHERE THE OFFER OR SALE IS NOT PERMITTED.
119
| THE LOVEJOY |
The following table presents historical occupancy percentages at The Lovejoy Property:
Historical Occupancy
12/31/2011(1) | 12/31/2012(1) | 12/31/2013(1) | 4/30/2014(2) | |||
| 97.2% | 100.0% | 100.0% | 96.2% | |||
(1) Information obtained from the borrower. | ||||||
| (2) Information obtained from the underwritten rent roll. | ||||||
Operating History and Underwritten Net Cash Flow. The following table presents certain information relating to the historical operating performance and the Underwritten Net Cash Flow at The Lovejoy Property:
Cash Flow Analysis
2012 | 2013 | TTM 3/31/2014 | U/W | U/W $ per SF | ||||||
| Base Rent | $2,148,345 | $2,240,514 | $2,251,552 | $2,215,378 | $26.56 | |||||
| Grossed Up Vacant Space | 0 | 0 | 0 | 85,806 | 1.03 | |||||
| Total Reimbursables | 826,754 | 903,992 | 925,349 | 905,075 | 10.85 | |||||
| Other Income | 281,939 | 283,753 | 285,693 | 285,693 | 3.42 | |||||
| Less Vacancy & Credit Loss | (76,860) | (20,674) | (5,775) | (115,059)(1) | (1.38) | |||||
| Effective Gross Income | $3,180,178 | $3,407,585 | $3,456,820 | $3,376,893 | $40.48 | |||||
| Total Operating Expenses | $884,506 | $908,999 | $909,050 | $942,787 | $11.30 | |||||
| Net Operating Income | $2,295,672 | $2,498,586 | $2,547,770 | $2,434,106 | $29.18 | |||||
| TI/LC | 0 | 0 | 0 | 142,391 | 1.71 | |||||
| Capital Expenditures | 0 | 0 | 0 | 16,684 | 0.20 | |||||
| Net Cash Flow | $2,295,672 | $2,498,586 | $2,547,770 | $2,275,031 | $27.27 | |||||
| NOI DSCR | 2.19x | 2.38x | 2.43x | 2.32x | ||||||
| NCF DSCR | 2.19x | 2.38x | 2.43x | 2.17x | ||||||
| NOI DY | 9.6% | 10.4% | 10.6% | 10.1% | ||||||
| NCF DY | 9.6% | 10.4% | 10.6% | 9.5% |
| (1) | The underwritten economic vacancy is 5.0%. The Lovejoy Property was 96.2% physically occupied as of April 30, 2014. |
THE INFORMATION IN THIS STRUCTURAL AND COLLATERAL TERM SHEET IS NOT COMPLETE AND MAY BE AMENDED PRIOR TO THE TIME OF SALE. THIS TERM SHEET IS NOT AN OFFER TO SELL THESE SECURITIES AND IT IS NOT A SOLICITATION OF AN OFFER TO BUY THESE SECURITIES IN ANY JURISDICTION WHERE THE OFFER OR SALE IS NOT PERMITTED.
120
(THIS PAGE INTENTIONALLY LEFT BLANK)
121
| No. 15 – Oak Court Mall | |||||||
| Loan Information | Property Information | ||||||
| Mortgage Loan Seller: | The Royal Bank of Scotland | Single Asset/Portfolio: | Single Asset | ||||
Credit Assessment (DBRS/Moody’s/Morningstar): | NR/NR/NR | Property Type: | Retail | ||||
Original Principal Balance(1): | $24,000,000 | Specific Property Type: | Regional Mall | ||||
Cut-off Date Principal Balance(1): | $23,884,983 | Location: | Memphis, TN | ||||
| % of Initial Pool Balance: | 1.7% | Size: | 240,197 SF | ||||
| Loan Purpose: | Refinance | Cut-off Date Principal Balance Per SF(1): | $165.73 | ||||
| Borrower Name: | Oak Court Mall, LLC | Year Built/Renovated: | 1988/1995 | ||||
| Sponsor: | Simon Property Group | Title Vesting: | Fee | ||||
| Mortgage Rate: | 4.756% | Property Manager: | Self-managed | ||||
| Note Date: | March 18, 2014 | 3rd Most Recent Occupancy (As of)(2): | 93.2% (12/31/2011) | ||||
| Anticipated Repayment Date: | NAP | 2nd Most Recent Occupancy (As of)(2): | 96.9% (12/31/2012) | ||||
| Maturity Date: | April 1, 2021 | Most Recent Occupancy (As of)(2): | 93.2% (12/31/2013) | ||||
| IO Period: | None | Current Occupancy (As of)(2): | 92.9% (2/18/2014) | ||||
| Loan Term (Original): | 84 months | ||||||
| Seasoning: | 4 months | Underwriting and Financial Information: | |||||
| Amortization Term (Original): | 360 | ||||||
| Loan Amortization Type: | Amortizing Balloon | 3rd Most Recent NOI (As of)(3): | $4,944,851 (12/31/2012) | ||||
| Interest Accrual Method: | Actual/360 | 2nd Most Recent NOI (As of)(3): | $5,246,726 (12/31/2013) | ||||
| Call Protection: | L(28),D(49),O(7) | Most Recent NOI (As of)(3): | $5,236,467 (TTM 1/31/2014) | ||||
| Lockbox Type: | Hard/Springing Cash Management | ||||||
Additional Debt(1): | Yes | U/W Revenues(3): | $8,351,053 | ||||
Additional Debt Type(1): | Pari Passu | U/W Expenses(3): | $3,524,195 | ||||
U/W NOI(3): | $4,826,858 | ||||||
U/W NCF(3): | $4,522,782 | ||||||
U/W NOI DSCR(1): | 1.93x | ||||||
Escrows and Reserves: | U/W NCF DSCR(1): | 1.81x | |||||
U/W NOI Debt Yield(1): | 12.1% | ||||||
Type: | Initial | Monthly | Cap (If Any) | U/W NCF Debt Yield(1): | 11.4% | ||
| Taxes | $0 | Springing | NAP | As-Is Appraised Value: | $61,000,000 | ||
| Insurance | $0 | Springing | NAP | As-Is Appraisal Valuation Date: | February 26, 2014 | ||
| Replacement Reserves | $0 | Springing | $162,000 | Cut-off Date LTV Ratio(1): | 65.3% | ||
| TI/LC Reserve | $0 | Springing | $379,200 | LTV Ratio at Maturity or ARD(1): | 57.7% | ||
| (1) | The Oak Court Mall Loan Combination, totaling $40,000,000, is comprised of two pari passu notes (Notes A-1 and A-2). The controlling Note A-1 had an original principal balance of $24,000,000, has an outstanding principal balance of $23,884,983 as of the Cut-off Date and will be contributed to the WFRBS 2014-C21 Trust. The non-controlling Note A-2 had an original principal balance of $16,000,000 and was contributed to the WFCM 2014-LC16 Trust. All statistical financial information related to balances per square foot, loan-to-value ratios, debt service coverage ratios and debt yields are based on the Oak Court Mall Loan Combination. |
| (2) | See “Historical Occupancy” section. |
| (3) | See “Cash Flow Analysis” section. |
The Oak Court Mall mortgage loan (the “Oak Court Mall Loan Combination”) is evidenced by two pari passu notes (Notes A-1 and A-2) secured by a first mortgage encumbering 240,197 square feet of a 723,014 regional mall located in Memphis, Tennessee (the “Oak Court Mall Property”). Note A-1, which represents the controlling interest in the Oak Court Mall Loan Combination and will be contributed to the WFRBS 2014-C21 Trust, had an original principal balance of $24,000,000 and has an outstanding principal balance as of the Cut-off Date of $23,884,983. Note A-2 had an original principal balance of $16,000,000, was contributed to the WFCM 2014-LC16 Trust and represents the non-controlling interest in the Oak Court Mall Loan Combination. See “Description of the Mortgage Pool—Additional Indebtedness—The Loan Combinations—The Oak Court Mall Loan Combination” and “The Pooling and Servicing Agreement—Servicing of the Loan Combinations” in the Free Writing Prospectus. The Oak Court Mall Property is located approximately eight miles east of downtown Memphis and approximately two miles from the University of Memphis. The Oak Court Mall Property contains 240,197 square feet of retail space situated on a 16.5-acre parcel of land. The Oak Court Mall Property is anchored by Macy’s and two Dillard’s stores (Macy’s and Dillard’s (Women) are not part of the collateral). The Oak Court Mall Property contains 1,626 parking spaces, resulting in a parking ratio of 6.8 spaces per 1,000 square feet of rentable area. The Oak Court Mall Property was constructed in 1988 and extensively renovated in 1995. As of December 31, 2013, tenants occupying 10,000 square feet or less had trailing 12-month in-line sales of $303 per square foot with an average occupancy cost of 15.4%. As of February 18, 2014, the Oak Court Mall Property was 92.9% occupied (including temporary tenants) by 67 tenants.
THE INFORMATION IN THIS STRUCTURAL AND COLLATERAL TERM SHEET IS NOT COMPLETE AND MAY BE AMENDED PRIOR TO THE TIME OF SALE. THIS TERM SHEET IS NOT AN OFFER TO SELL THESE SECURITIES AND IT IS NOT A SOLICITATION OF AN OFFER TO BUY THESE SECURITIES IN ANY JURISDICTION WHERE THE OFFER OR SALE IS NOT PERMITTED.
122
| OAK COURT MALL |
Sources and Uses
| Sources | Uses | |||||||
| Original loan combination amount | $40,000,000 | 100.0% | Return of equity | $39,513,306 | 98.8 | % | ||
| Closing costs | 486,694 | 1.2 | ||||||
| Total Sources | $40,000,000 | 100.0% | Total Uses | $40,000,000 | 100.0 | % |
The following table presents certain information relating to tenancy at the Oak Court Mall Property:
Major Tenants
| Tenant Name | Credit Rating (Fitch/Moody’s /S&P)(1) | Tenant NRSF | % of NRSF | Annual U/W Base Rent PSF(2) | Annual U/W Base Rent(2) | % of Total Annual U/W Base Rent | Sales PSF(3) | Occupancy Cost(3)(4) | Lease Expiration Date | ||||||||
| Anchor Tenants - Not Part of Collateral | |||||||||||||||||
| Macy’s | BBB/Baa2/BBB+ | 385,000 | ANCHOR OWNED - NOT PART OF THE COLLATERAL | ||||||||||||||
| Dillard’s (Women) | BBB-/Ba2/BB+ | 97,817 | ANCHOR OWNED - NOT PART OF THE COLLATERAL | ||||||||||||||
| Anchor Tenants - Collateral | |||||||||||||||||
| Dillard’s (Men) | BBB-/Ba2/BB+ | 50,000 | 20.8% | $6.00 | $300,000 | 6.5% | $117 | 6.6% | 8/12/2015(5) | ||||||||
| Total Anchor Tenants - Collateral | 50,000 | 20.8% | $6.00 | $300,000 | 6.5% | ||||||||||||
| Major Tenants - Collateral | |||||||||||||||||
| Victoria’s Secret | BB+/Ba1/BB+ | 8,500 | 3.5% | $30.00 | $255,000 | 5.6% | $398 | 14.4% | 1/31/2018 | ||||||||
| Hollister Co | NR/NR/NR | 7,163 | 3.0% | $22.00 | $157,586 | 3.4% | $125 | 17.6% | 1/31/2017 | ||||||||
| Shoe Department | NR/NR/NR | 7,466 | 3.1% | $13.39 | $100,000 | 2.2% | NAV | NAV | 2/28/2022 | ||||||||
| Charlotte Russe | NR/NR/NR | 6,500 | 2.7% | $14.00 | $91,000 | 2.0% | $230 | 18.1% | 1/31/2015 | ||||||||
| Total Major Tenants - Collateral | 29,629 | 12.3% | $20.37 | $603,586 | 13.2% | ||||||||||||
Non-Major Retail Tenants - Collateral(6) | 143,485 | 59.7% | $30.77 | $3,688,229 | 80.3% | ||||||||||||
Total Occupied Collateral(6) | 223,114 | 92.9% | $23.02 | $4,591,815 | 100.0% | ||||||||||||
| Total Vacant Space | 17,083 | 7.1% | |||||||||||||||
| Collateral Total | 240,197 | 100.0% | |||||||||||||||
| (1) | Certain ratings are those of the parent company whether or not the parent guarantees the lease. |
| (2) | Annual U/W Base Rent PSF and Annual U/W Base Rent include contractual rent steps through December 2014. |
| (3) | Sales and occupancy costs are for the trailing 12-month period ending December 31, 2013. |
| (4) | Occupancy costs include base rent, reimbursements and percentage rent, as applicable. |
| (5) | Dillard’s (Men) has five, 5-year lease renewal options. |
| (6) | Includes 20,613 square feet attributed to temporary tenants that were not included in the Annual U/W Base Rent, along with 2,998 square feet attributed to tenants paying a percentage of sales in lieu of base rent, for a total of 23,611 square feet. The Annual U/W Base Rent PSF for Non-Major Retail Tenants and Total Occupied Collateral exclude the square footage attributed to these tenants. |
The following table presents certain information relating to the historical sales and occupancy costs at the Oak Court Mall Property:
Historical Sales (PSF) and Occupancy Costs(1)
| Tenant Name | 2010 | 2011 | 2012 | 2013 |
| Dillard’s (Men) | $101 | $104 | $112 | $117 |
| Victoria’s Secret | $341 | $375 | $389 | $398 |
| Hollister Co | $155 | $170 | $168 | $125 |
| Shoe Department | NAV | NAV | NAV | NAV |
| Charlotte Russe | $201 | $211 | $233 | $233 |
| Total In-line (<10,000 square feet) | $278 | $297 | $304 | $303 |
| Occupancy Costs | 16.6% | 15.5% | 14.7% | 15.4% |
| (1) | Historical Sales (PSF) and Occupancy Costs were provided by the borrower. |
THE INFORMATION IN THIS STRUCTURAL AND COLLATERAL TERM SHEET IS NOT COMPLETE AND MAY BE AMENDED PRIOR TO THE TIME OF SALE. THIS TERM SHEET IS NOT AN OFFER TO SELL THESE SECURITIES AND IT IS NOT A SOLICITATION OF AN OFFER TO BUY THESE SECURITIES IN ANY JURISDICTION WHERE THE OFFER OR SALE IS NOT PERMITTED.
123
| OAK COURT MALL |
The following table presents certain information relating to the lease rollover schedule at the Oak Court Mall Property:
Lease Expiration Schedule(1)(2)
Year Ending December 31, | No. of Leases Expiring | Expiring NRSF | % of Total NRSF | Cumulative of Total NRSF | Cumulative % of Total NRSF | Annual U/W Base Rent | Annual U/W Base Rent PSF(3) | |
MTM(4) | 10 | 20,613 | 8.6% | 20,613 | 8.6% | $0 | $0.00 | |
| 2014 | 5 | 5,810 | 2.4% | 26,423 | 11.0% | $262,278 | $45.14 | |
| 2015 | 14 | 100,442 | 41.8% | 126,865 | 52.8% | $1,384,239 | $13.78 | |
| 2016 | 8 | 5,684 | 2.4% | 132,549 | 55.2% | $336,244 | $59.16 | |
| 2017 | 6 | 23,444 | 9.8% | 155,993 | 64.9% | $553,102 | $23.59 | |
| 2018 | 5 | 14,026 | 5.8% | 170,019 | 70.8% | $533,697 | $38.05 | |
| 2019 | 8 | 18,162 | 7.6% | 188,181 | 78.3% | $489,241 | $26.94 | |
| 2020 | 2 | 1,999 | 0.8% | 190,180 | 79.2% | $121,270 | $60.67 | |
| 2021 | 3 | 11,797 | 4.9% | 201,977 | 84.1% | $519,722 | $44.06 | |
| 2022 | 1 | 7,466 | 3.1% | 209,443 | 87.2% | $100,000 | $13.39 | |
| 2023 | 3 | 4,652 | 1.9% | 214,095 | 89.1% | $119,711 | $25.73 | |
| 2024 | 0 | 0 | 0.0% | 214,095 | 89.1% | $0 | $0.00 | |
| Thereafter | 2 | 9,019 | 3.8% | 223,114 | 92.9% | $172,311 | $19.11 | |
| Vacant | 0 | 17,083 | 7.1% | 240,197 | 100.0% | $0 | $0.00 | |
| Total/Weighted Average | 67 | 240,197 | 100.0% | $4,591,815 | $23.02 |
| (1) | Information obtained from the underwritten rent roll. |
| (2) | Certain tenants may have lease termination options that are exercisable prior to the originally stated expiration date of the subject lease and that are not considered in the Lease Expiration Schedule. |
| (3) | The annual and Weighted Average Annual U/W Base Rent PSF excludes vacant space, space attributed to tenants paying percentage rent in lieu of base rent and space attributed to temporary tenants. These rents were included in the underwritten percentage rent and other income. |
| (4) | Includes 10 temporary tenants. The rent for temporary tenants has been included in the underwritten other income. |
The following table presents historical occupancy percentages at the Oak Court Mall Property:
Historical Occupancy(1)
12/31/2011(2) | 12/31/2012(2) | 12/31/2013(2) | 2/18/2014(3) | |||
| 93.2% | 96.9% | 93.2% | 92.9% |
| (1) | Historical and current occupancy includes temporary tenants. |
| (2) | Information obtained from the borrower. |
| (3) | Information obtained from the underwritten rent roll. |
Operating History and Underwritten Net Cash Flow. The following table presents certain information relating to the historical operating performance and the Underwritten Net Cash Flow at the Oak Court Mall Property:
Cash Flow Analysis
| 2012 | 2013 | TTM 1/31/2014 | U/W | U/W $ per SF | ||||||
| Base Rent | $4,569,075 | $4,631,813 | $4,648,237 | $4,591,815 | $19.12 | |||||
| Grossed Up Vacant Space | 0 | 0 | 0 | 2,001,278 | 8.33 | |||||
| Percentage Rent | 258,646 | 191,123 | 172,765 | 90,254 | 0.38 | |||||
| Total Reimbursables | 2,525,208 | 2,643,883 | 2,618,518 | 2,725,427 | 11.35 | |||||
Other Income(1) | 912,101 | 948,206 | 943,557 | 943,557 | 3.93 | |||||
| Less Vacancy & Credit Loss | (19,072) | (28,612) | (20,987) | (2,001,278)(2) | (8.33) | |||||
| Effective Gross Income | $8,245,958 | $8,386,413 | $8,362,090 | $8,351,053 | $34.77 | |||||
| Total Operating Expenses | $3,301,107 | $3,139,687 | $3,125,623 | $3,524,195 | $14.67 | |||||
| Net Operating Income | $4,944,851 | $5,246,726 | $5,236,467 | $4,826,858 | $20.10 | |||||
| TI/LC | 0 | 0 | 0 | 222,837 | 0.93 | |||||
| Replacement Reserves | 0 | 0 | 0 | 81,239 | 0.34 | |||||
| Net Cash Flow | $4,944,851 | $5,246,726 | $5,236,467 | $4,522,782 | $18.83 | |||||
NOI DSCR(3) | 1.97x | 2.09x | 2.09x | 1.93x | ||||||
NCF DSCR(3) | 1.97x | 2.09x | 2.09x | 1.81x | ||||||
NOI DY(3) | 12.4% | 13.2% | 13.2% | 12.1% | ||||||
NCF DY(3) | 12.4% | 13.2% | 13.2% | 11.4% | ||||||
| (1) | Includes rent for temporary tenants. |
| (2) | The underwritten economic vacancy is 19.7%. The Oak Court Mall Property was 92.9% physically occupied as of February 18, 2014. |
| (3) | DSCRs and Debt Yields are based on the Oak Court Mall Loan Combination. |
THE INFORMATION IN THIS STRUCTURAL AND COLLATERAL TERM SHEET IS NOT COMPLETE AND MAY BE AMENDED PRIOR TO THE TIME OF SALE. THIS TERM SHEET IS NOT AN OFFER TO SELL THESE SECURITIES AND IT IS NOT A SOLICITATION OF AN OFFER TO BUY THESE SECURITIES IN ANY JURISDICTION WHERE THE OFFER OR SALE IS NOT PERMITTED.
124
(THIS PAGE INTENTIONALLY LEFT BLANK)
125
WFRBS Commercial Mortgage Trust 2014-C21 | Transaction Contact Information |
VI. Transaction Contact Information
Questions regarding this Structural and Collateral Term Sheet may be directed to any of the following individuals:
| RBS Securities Inc. | Wells Fargo Securities, LLC | ||
| Todd Jaeger - Trading | Tel. (203) 897-2900 | Brigid Mattingly | Tel. (312) 269-3062 |
| Fax (312) 658-0140 | |||
| Adam Ansaldi | Tel. (203) 897-0881 | A.J. Sfarra | Tel. (212) 214-5613 |
| Fax (203) 873-3542 | Fax (212) 214-8970 | ||
| Jim Barnard | Tel. (203) 897-4417 | Alex Wong | Tel. (212) 214-5615 |
| Fax (203) 873-4310 | Fax (212) 214-8970 | ||
THE INFORMATION IN THIS STRUCTURAL AND COLLATERAL TERM SHEET IS NOT COMPLETE AND MAY BE AMENDED PRIOR TO THE TIME OF SALE. THIS TERM SHEET IS NOT AN OFFER TO SELL THESE SECURITIES AND IT IS NOT A SOLICITATION OF AN OFFER TO BUY THESE SECURITIES IN ANY JURISDICTION WHERE THE OFFER OR SALE IS NOT PERMITTED.
126