Exhibit 99.2
Company Update May 5, 2021 Aspen ViewBillings, MT
Forward-Looking Statements, Non-GAAP and Other Information 1 IN GENERAL. This disclaimer applies to this document and the verbal or written comments of any person presenting it. This document, taken together with any such verbal or written comments, is referred to herein as the “Presentation.” Throughout this Presentation, New Senior Investment Group Inc. (NYSE: SNR) is referred to as “New Senior,” the “Company,” “SNR” or “we.”FORWARD-LOOKING STATEMENTS. Certain information in this Presentation may constitute “forward-looking statements” within the meaning of the Private Securities Litigation Reform Act of 1995, including without limitation statements regarding New Senior’s 2021 strategic priorities and expectations with respect to the potential range of 2021 financial results; the expected impact of the COVID-19 pandemic on our business, liquidity, properties, operators and the health systems and populations that we serve; the cost and effectiveness of measures we have taken to respond to the COVID-19 pandemic, including health and safety protocols and system capacity enhancements that are intended to limit the transmission of COVID-19 at our properties; our expected occupancy rates and operating expenses; and the declaration or amount of any future dividend. These statements are not historical facts. They represent management’s current expectations regarding future events and are subject to a number of risks and uncertainties, many of which are beyond our control, that could cause actual results to differ materially from those described in the forward-looking statements. These risks and uncertainties include, but are not limited to, risks and uncertainties relating to the continuing impact of COVID-19 on our operations and the operation of our facilities, including ongoing cases at certain of our facilities, the speed, geographic reach and duration of the COVID-19 pandemic; the legal, regulatory and administrative developments that occur at the federal, state and local levels; the efficacy of our operators’ infectious disease protocols and prevention efforts; the broader impact of the pandemic on local economies and labor markets; the overall demand for our communities in the recovery period following the pandemic; our ability to successfully manage the asset management by third parties; and market conditions generally which affect demand and supply for senior housing. Accordingly, you should not place undue reliance on any forward-looking statements contained herein. For a discussion of these and other risks and important factors that could affect such forward-looking statements, see the sections entitled “Risk Factors” and “Management’s Discussion and Analysis of Financial Condition and Results of Operations” in the Company’s most recent annual and quarterly reports filed with the Securities and Exchange Commission, which are available on the Company’s website (www.newseniorinv.com). New risks and uncertainties emerge from time to time, and it is not possible for us to predict or assess the impact of every factor that may cause our results to differ materially from those anticipated by any forward-looking statements. Forward-looking statements contained herein, and all statements made in this Presentation, speak only as of the date of this Presentation, and the Company expressly disclaims any duty or obligation to release publicly any updates or revisions to any statements contained herein to reflect any change in the Company’s expectations with regard thereto or change in events, conditions or circumstances on which any statement is based.NON-GAAP FINANCIAL INFORMATION. This Presentation includes information based on financial measures that are not recognized under generally accepted accounting principles (“GAAP”), such as NOI, cash NOI, adjusted same store cash NOI, Normalized FFO, AFFO and Normalized FAD. You should use non‐GAAP information in addition to, and not as an alternative to, financial information prepared in accordance with GAAP. See the end of this Presentation for reconciliations to the most comparable GAAP measures and an explanation of each of our non-GAAP measures. Our non-GAAP measures may not be identical or comparable to measures with the same name presented by other companies due to differences in calculation, capital structure or other factors. PAST PERFORMANCE. In all cases where historical results are presented or past performance is described, we note that past performance is not a reliable indicator of future results and performance.GLOSSARY. See the Glossary at the end of this Presentation for an explanation of various terms used herein.
Table of Contents SECTIONS PAGES I. Overview and Executive Summary 3 – 8 II. COVID-19 Situation Update 9 – 12 III. Financial Update 13 – 18 IV. Industry Outlook 19 – 21 V. Appendix 22 – 29 2
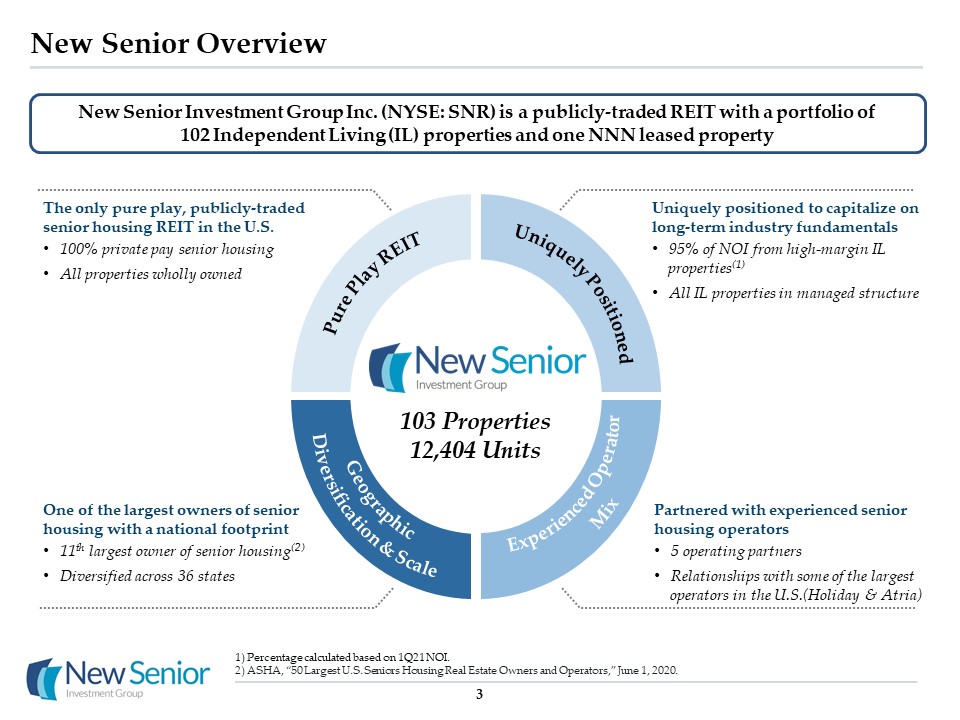
New Senior Overview New Senior Investment Group Inc. (NYSE: SNR) is a publicly-traded REIT with a portfolio of 102 Independent Living (IL) properties and one NNN leased property Pure Play REIT Uniquely Positioned Geographic Diversification & Scale Experienced Operator Mix Uniquely positioned to capitalize on long-term industry fundamentals95% of NOI from high-margin IL properties(1)All IL properties in managed structure The only pure play, publicly-traded senior housing REIT in the U.S.100% private pay senior housingAll properties wholly owned Partnered with experienced senior housing operators5 operating partnersRelationships with some of the largest operators in the U.S.(Holiday & Atria) One of the largest owners of senior housing with a national footprint11th largest owner of senior housing(2)Diversified across 36 states Percentage calculated based on 1Q21 NOI.ASHA, “50 Largest U.S. Seniors Housing Real Estate Owners and Operators,” June 1, 2020. 103 Properties12,404 Units 3
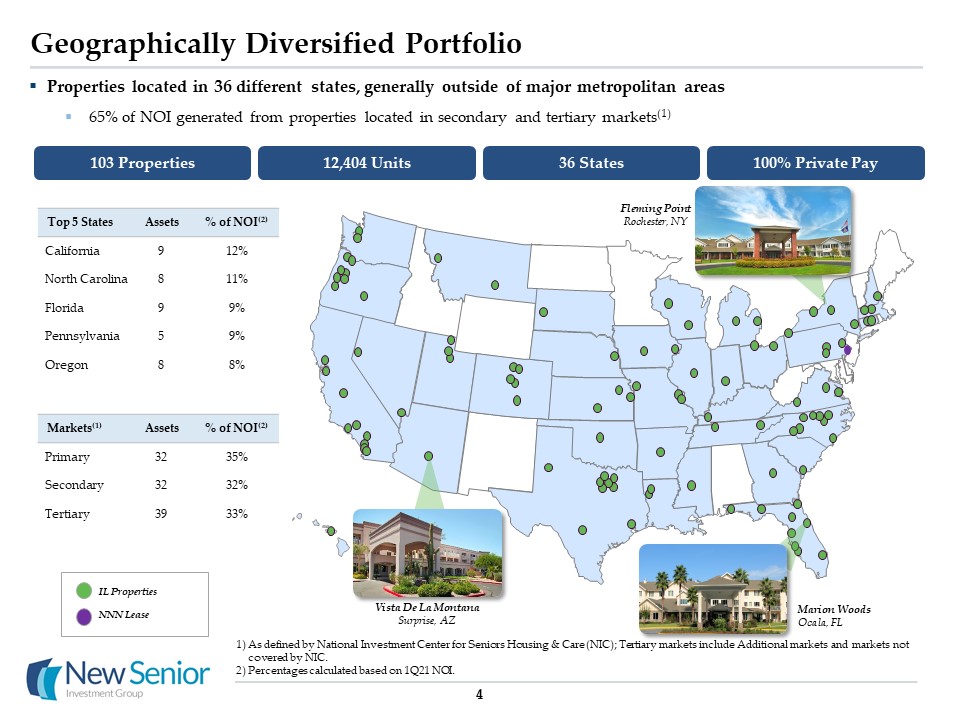
Geographically Diversified Portfolio Properties located in 36 different states, generally outside of major metropolitan areas65% of NOI generated from properties located in secondary and tertiary markets(1) 4 As defined by National Investment Center for Seniors Housing & Care (NIC); Tertiary markets include Additional markets and markets not covered by NIC.Percentages calculated based on 1Q21 NOI. Markets(1) Assets % of NOI(2) Primary 32 35% Secondary 32 32% Tertiary 39 33% IL PropertiesNNN Lease Fleming PointRochester, NY Marion WoodsOcala, FL Top 5 States Assets % of NOI(2) California 9 12% North Carolina 8 11% Florida 9 9% Pennsylvania 5 9% Oregon 8 8% Vista De La MontanaSurprise, AZ 103 Properties 12,404 Units 36 States 100% Private Pay
Executive Summary Dogwood EstatesDenton, TX

1Q21 Results In Line With Guidance Improving Occupancy Trends Recent Highlights 6 Successfully completed the transition of 21 properties to Atria Senior Living on April 1st `Represents a significant step in our ongoing effort to improve operator diversification and alignment Other Business Updates COVID-19 Update Rate of new cases within our portfolio has dropped significantly – only 1 active resident case as of May 3rd Total new cases in April were down 95% from peak in December 2020All properties within our portfolio have had access to the vaccine Majority of properties are operating in a manner largely consistent with the pre-COVID-19 environment 1Q21 Results: Occupancy down 160bps, total same store cash NOI down 16% and AFFO per share of $0.14Occupancy slightly better than quarterly guidance and financial results were in line with guidance2Q21 Guidance: Occupancy up 120bps-150bps, total same store NOI down ~15% and AFFO per share of ~$0.13Quarterly results could represent an earnings trough if we continue to see occupancy recovery Occupancy trends improved significantly throughout 1Q21 – and are continuing to improve in 2Q21 January ending occupancy down 80bps, February down 60bps, March down 20bpsEnding occupancy grew by 40bps in April – first month of growth since pandemic began Saw strong demand as lead and move-in volumes were above pre-pandemic historical averages
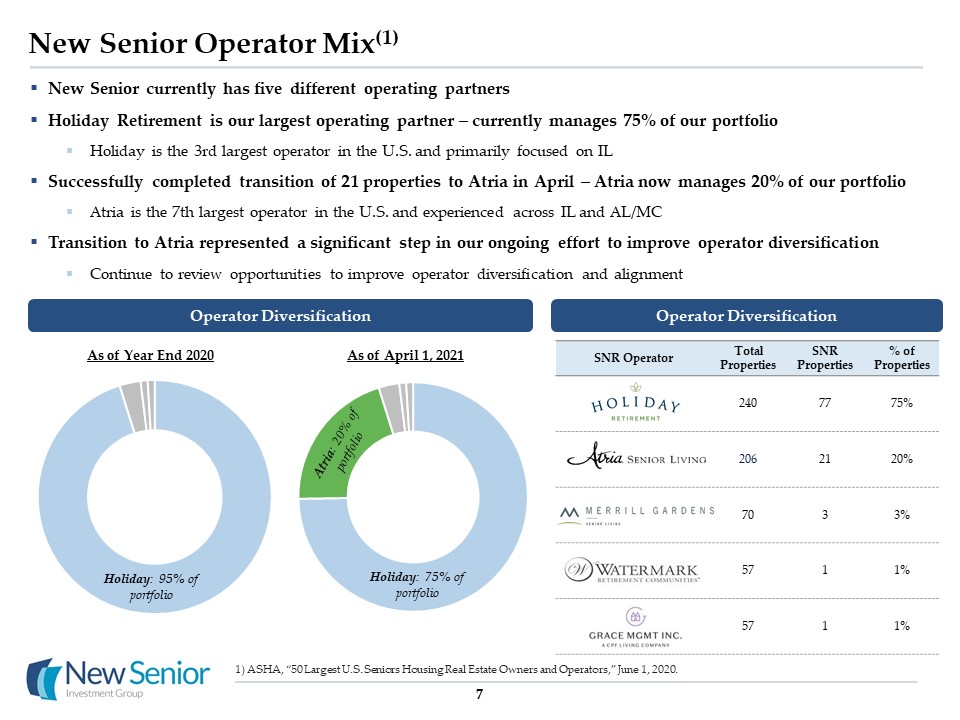
New Senior Operator Mix(1) 7 New Senior currently has five different operating partners Holiday Retirement is our largest operating partner – currently manages 75% of our portfolioHoliday is the 3rd largest operator in the U.S. and primarily focused on IL Successfully completed transition of 21 properties to Atria in April – Atria now manages 20% of our portfolioAtria is the 7th largest operator in the U.S. and experienced across IL and AL/MCTransition to Atria represented a significant step in our ongoing effort to improve operator diversificationContinue to review opportunities to improve operator diversification and alignment Operator Diversification Operator Diversification Holiday: 95% of portfolio Atria: 20% of portfolio Holiday: 75% of portfolio SNR Operator Total Properties SNRProperties % of Properties 240 77 75% 206 21 20% 70 3 3% 57 1 1% 57 1 1% As of Year End 2020 As of April 1, 2021 ASHA, “50 Largest U.S. Seniors Housing Real Estate Owners and Operators,” June 1, 2020.
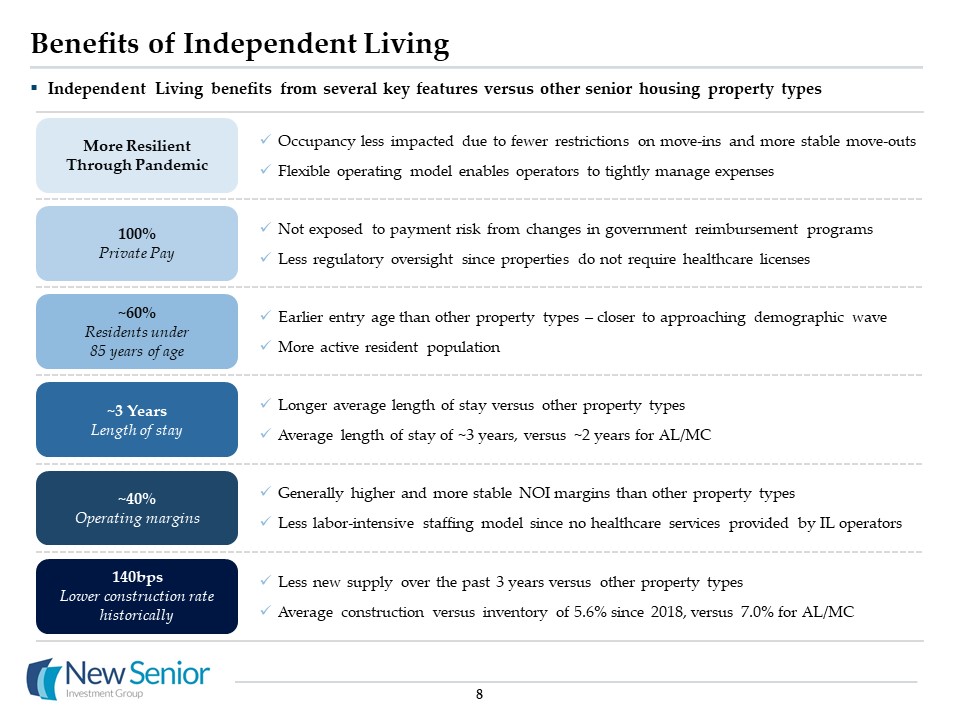
Benefits of Independent Living 8 100% Private Pay ~3 YearsLength of stay ~40% Operating margins ~60% Residents under 85 years of age Not exposed to payment risk from changes in government reimbursement programs Less regulatory oversight since properties do not require healthcare licenses Longer average length of stay versus other property typesAverage length of stay of ~3 years, versus ~2 years for AL/MC Generally higher and more stable NOI margins than other property typesLess labor-intensive staffing model since no healthcare services provided by IL operators Earlier entry age than other property types – closer to approaching demographic waveMore active resident population 140bpsLower construction rate historically Less new supply over the past 3 years versus other property typesAverage construction versus inventory of 5.6% since 2018, versus 7.0% for AL/MC Occupancy less impacted due to fewer restrictions on move-ins and more stable move-outsFlexible operating model enables operators to tightly manage expenses More Resilient Through Pandemic Independent Living benefits from several key features versus other senior housing property types

COVID-19 Situation Update
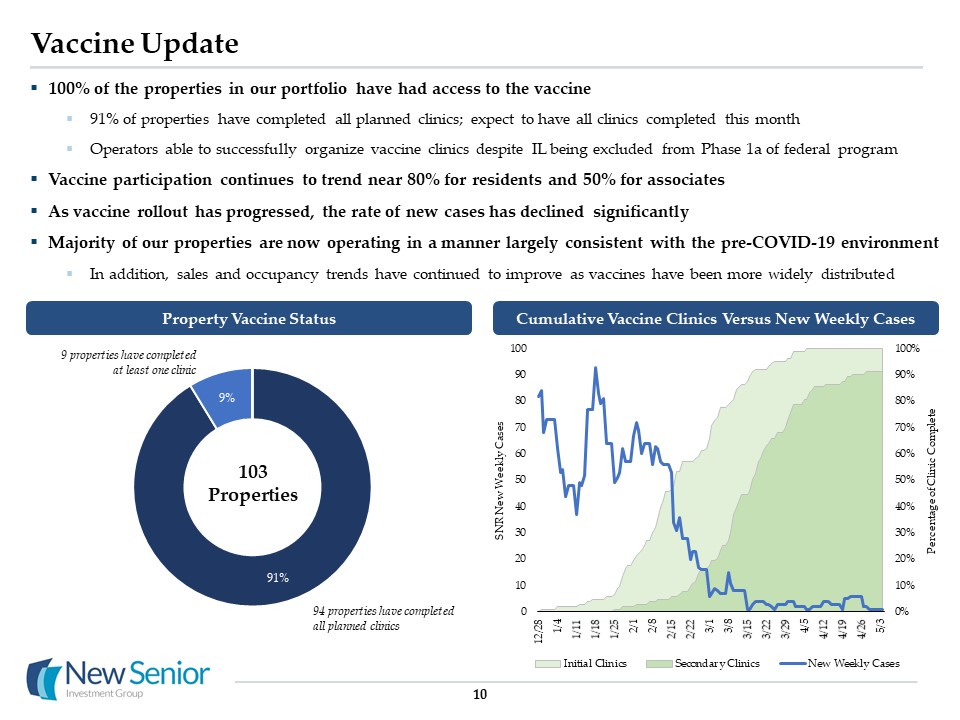
10 Vaccine Update 100% of the properties in our portfolio have had access to the vaccine91% of properties have completed all planned clinics; expect to have all clinics completed this monthOperators able to successfully organize vaccine clinics despite IL being excluded from Phase 1a of federal programVaccine participation continues to trend near 80% for residents and 50% for associates As vaccine rollout has progressed, the rate of new cases has declined significantlyMajority of our properties are now operating in a manner largely consistent with the pre-COVID-19 environmentIn addition, sales and occupancy trends have continued to improve as vaccines have been more widely distributed Property Vaccine Status 103 Properties 94 properties have completed all planned clinics 9 properties have completed at least one clinic Cumulative Vaccine Clinics Versus New Weekly Cases
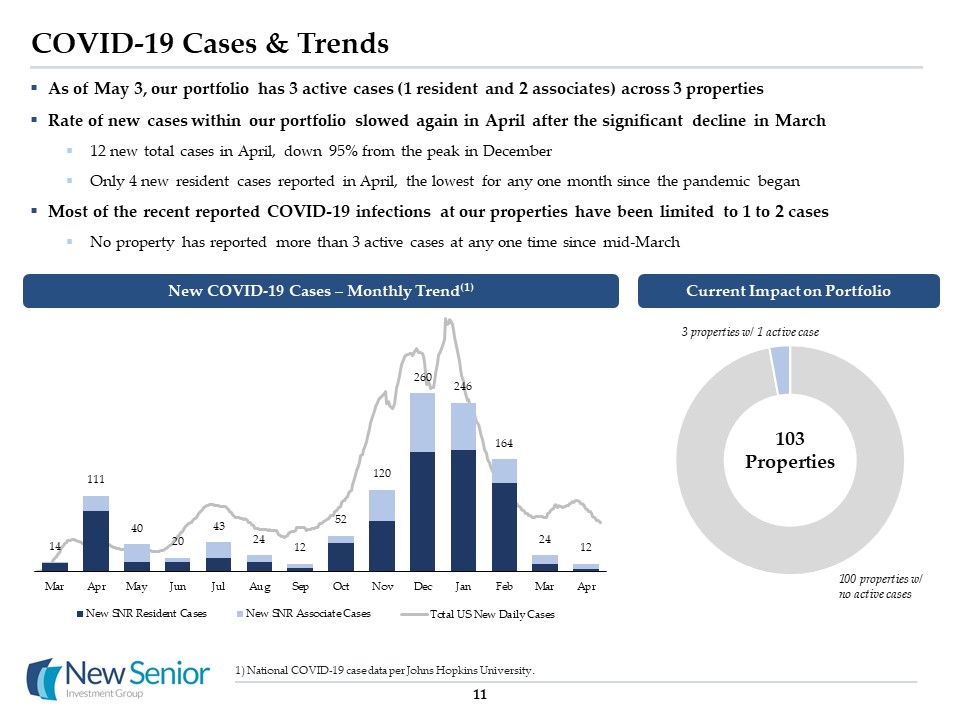
COVID-19 Cases & Trends As of May 3, our portfolio has 3 active cases (1 resident and 2 associates) across 3 propertiesRate of new cases within our portfolio slowed again in April after the significant decline in March12 new total cases in April, down 95% from the peak in DecemberOnly 4 new resident cases reported in April, the lowest for any one month since the pandemic beganMost of the recent reported COVID-19 infections at our properties have been limited to 1 to 2 casesNo property has reported more than 3 active cases at any one time since mid-March 11 New COVID-19 Cases – Monthly Trend(1) Current Impact on Portfolio 100 properties w/ no active cases 3 properties w/ 1 active case 103 Properties National COVID-19 case data per Johns Hopkins University.
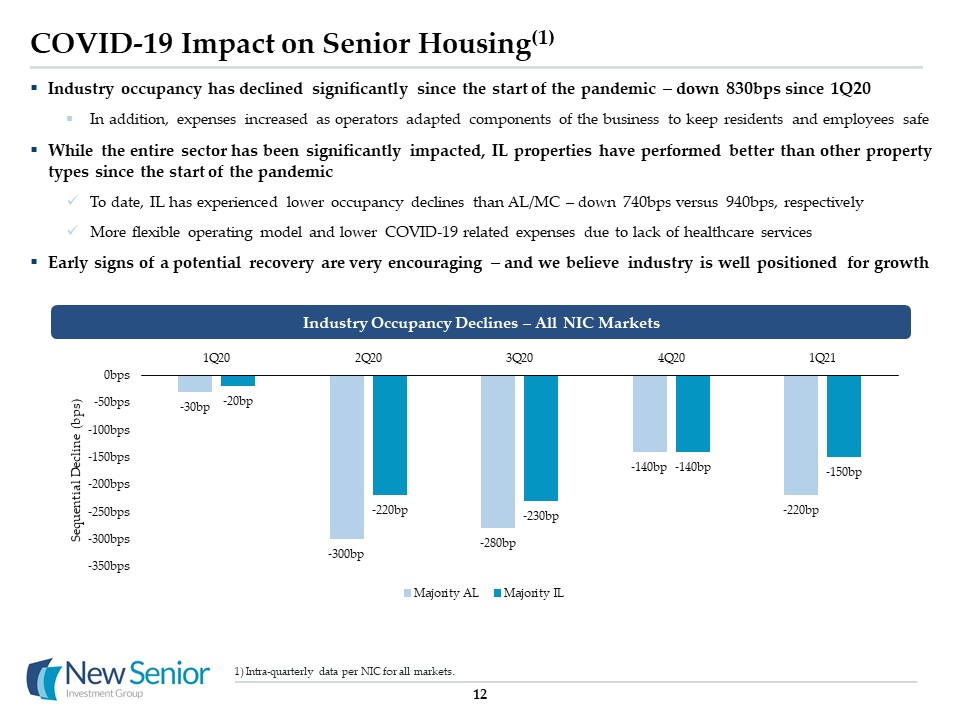
COVID-19 Impact on Senior Housing(1) Industry occupancy has declined significantly since the start of the pandemic – down 830bps since 1Q20In addition, expenses increased as operators adapted components of the business to keep residents and employees safe While the entire sector has been significantly impacted, IL properties have performed better than other property types since the start of the pandemicTo date, IL has experienced lower occupancy declines than AL/MC – down 740bps versus 940bps, respectivelyMore flexible operating model and lower COVID-19 related expenses due to lack of healthcare services Early signs of a potential recovery are very encouraging – and we believe industry is well positioned for growth 12 Intra-quarterly data per NIC for all markets. Industry Occupancy Declines – All NIC Markets
Financial Update PinegateMacon, GA
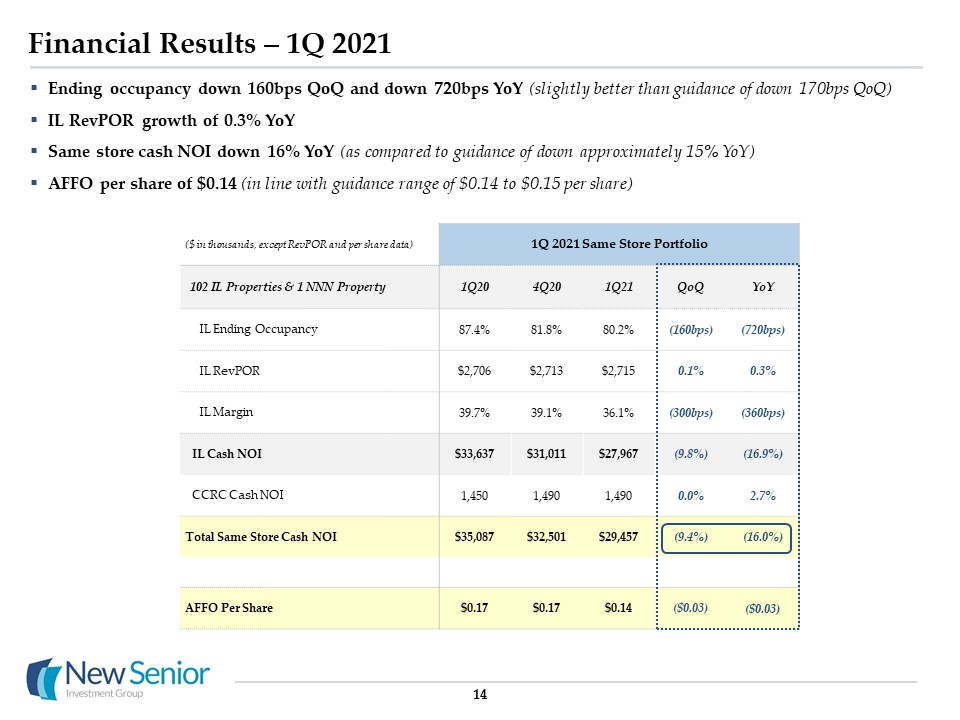
14 Financial Results – 1Q 2021 Ending occupancy down 160bps QoQ and down 720bps YoY (slightly better than guidance of down 170bps QoQ) IL RevPOR growth of 0.3% YoYSame store cash NOI down 16% YoY (as compared to guidance of down approximately 15% YoY)AFFO per share of $0.14 (in line with guidance range of $0.14 to $0.15 per share) ($ in thousands, except RevPOR and per share data) 1Q 2021 Same Store Portfolio 102 IL Properties & 1 NNN Property 1Q20 4Q20 1Q21 QoQ YoY IL Ending Occupancy 87.4% 81.8% 80.2% (160bps) (720bps) IL RevPOR $2,706 $2,713 $2,715 0.1% 0.3% IL Margin 39.7% 39.1% 36.1% (300bps) (360bps) IL Cash NOI $33,637 $31,011 $27,967 (9.8%) (16.9%) CCRC Cash NOI 1,450 1,490 1,490 0.0% 2.7% Total Same Store Cash NOI $35,087 $32,501 $29,457 (9.4%) (16.0%) AFFO Per Share $0.17 $0.17 $0.14 ($0.03) ($0.03)
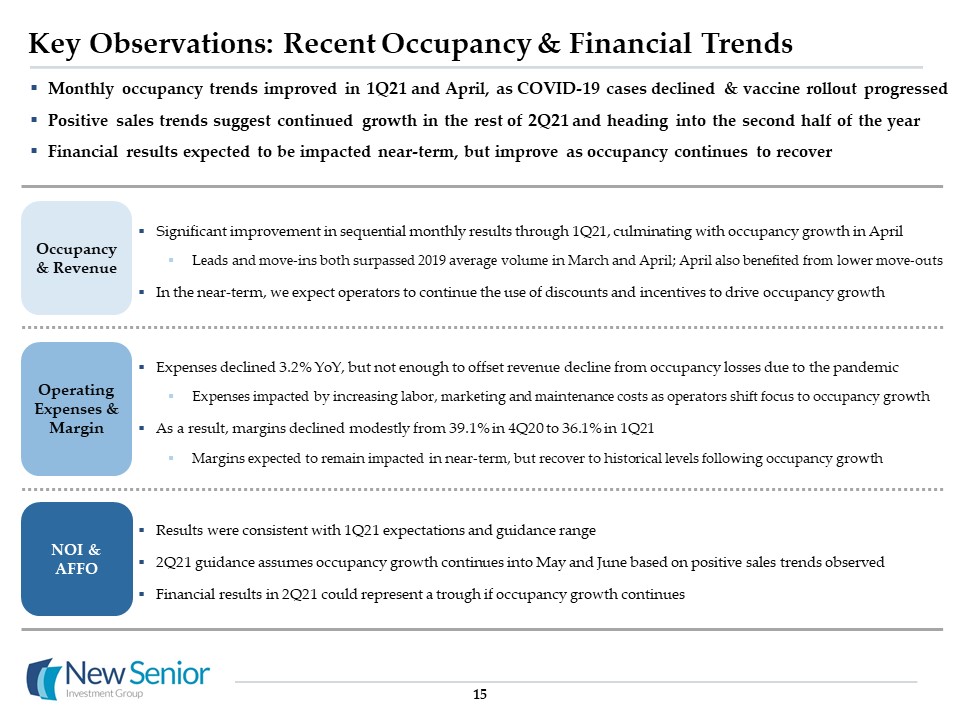
Key Observations: Recent Occupancy & Financial Trends 15 Occupancy & Revenue Results were consistent with 1Q21 expectations and guidance range2Q21 guidance assumes occupancy growth continues into May and June based on positive sales trends observedFinancial results in 2Q21 could represent a trough if occupancy growth continues NOI & AFFO Expenses declined 3.2% YoY, but not enough to offset revenue decline from occupancy losses due to the pandemic Expenses impacted by increasing labor, marketing and maintenance costs as operators shift focus to occupancy growthAs a result, margins declined modestly from 39.1% in 4Q20 to 36.1% in 1Q21 Margins expected to remain impacted in near-term, but recover to historical levels following occupancy growth Operating Expenses & Margin Monthly occupancy trends improved in 1Q21 and April, as COVID-19 cases declined & vaccine rollout progressedPositive sales trends suggest continued growth in the rest of 2Q21 and heading into the second half of the yearFinancial results expected to be impacted near-term, but improve as occupancy continues to recover Significant improvement in sequential monthly results through 1Q21, culminating with occupancy growth in AprilLeads and move-ins both surpassed 2019 average volume in March and April; April also benefited from lower move-outsIn the near-term, we expect operators to continue the use of discounts and incentives to drive occupancy growth
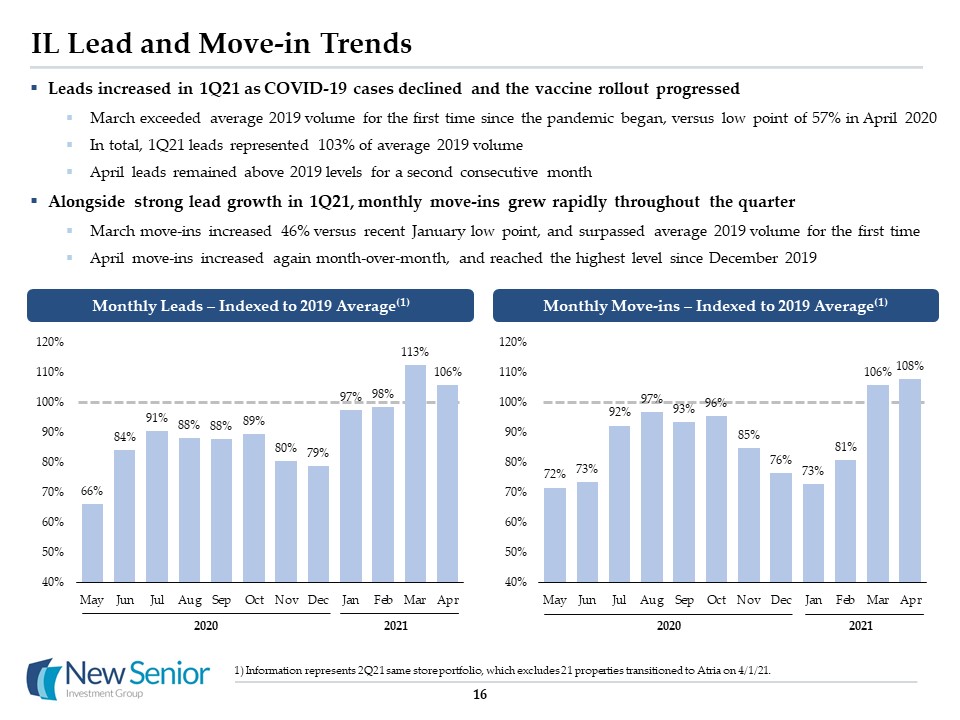
IL Lead and Move-in Trends 16 Leads increased in 1Q21 as COVID-19 cases declined and the vaccine rollout progressedMarch exceeded average 2019 volume for the first time since the pandemic began, versus low point of 57% in April 2020In total, 1Q21 leads represented 103% of average 2019 volumeApril leads remained above 2019 levels for a second consecutive monthAlongside strong lead growth in 1Q21, monthly move-ins grew rapidly throughout the quarterMarch move-ins increased 46% versus recent January low point, and surpassed average 2019 volume for the first timeApril move-ins increased again month-over-month, and reached the highest level since December 2019 Monthly Leads – Indexed to 2019 Average(1) Monthly Move-ins – Indexed to 2019 Average(1) 2020 2021 2020 2021 Information represents 2Q21 same store portfolio, which excludes 21 properties transitioned to Atria on 4/1/21.
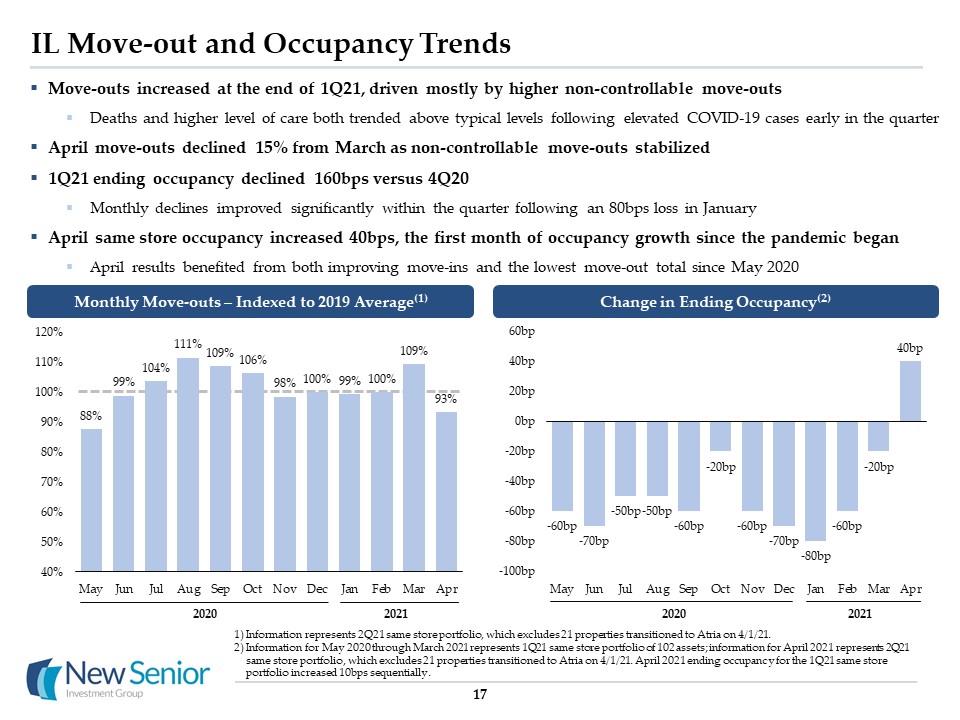
IL Move-out and Occupancy Trends 17 Move-outs increased at the end of 1Q21, driven mostly by higher non-controllable move-outsDeaths and higher level of care both trended above typical levels following elevated COVID-19 cases early in the quarterApril move-outs declined 15% from March as non-controllable move-outs stabilized1Q21 ending occupancy declined 160bps versus 4Q20Monthly declines improved significantly within the quarter following an 80bps loss in JanuaryApril same store occupancy increased 40bps, the first month of occupancy growth since the pandemic beganApril results benefited from both improving move-ins and the lowest move-out total since May 2020 Monthly Move-outs – Indexed to 2019 Average(1) Change in Ending Occupancy(2) 2020 2021 2020 2021 Information represents 2Q21 same store portfolio, which excludes 21 properties transitioned to Atria on 4/1/21.Information for May 2020 through March 2021 represents 1Q21 same store portfolio of 102 assets; information for April 2021 represents 2Q21 same store portfolio, which excludes 21 properties transitioned to Atria on 4/1/21. April 2021 ending occupancy for the 1Q21 same store portfolio increased 10bps sequentially.
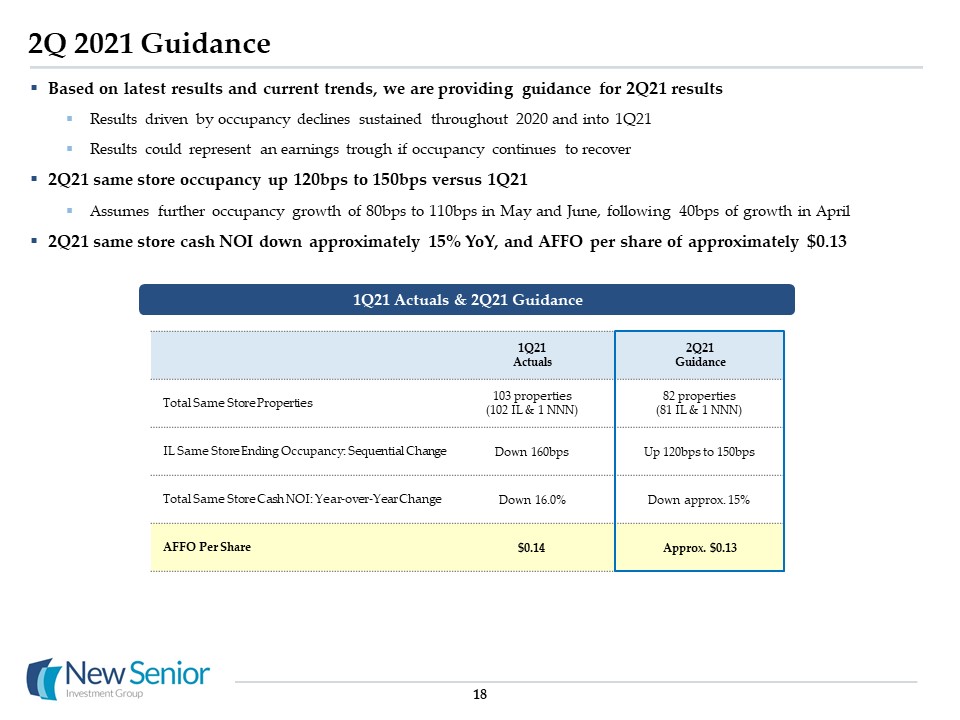
2Q 2021 Guidance 18 Based on latest results and current trends, we are providing guidance for 2Q21 results Results driven by occupancy declines sustained throughout 2020 and into 1Q21Results could represent an earnings trough if occupancy continues to recover2Q21 same store occupancy up 120bps to 150bps versus 1Q21Assumes further occupancy growth of 80bps to 110bps in May and June, following 40bps of growth in April 2Q21 same store cash NOI down approximately 15% YoY, and AFFO per share of approximately $0.13 1Q21 Actuals & 2Q21 Guidance 1Q21Actuals 2Q21Guidance Total Same Store Properties 103 properties(102 IL & 1 NNN) 82 properties(81 IL & 1 NNN) IL Same Store Ending Occupancy: Sequential Change Down 160bps Up 120bps to 150bps Total Same Store Cash NOI: Year-over-Year Change Down 16.0% Down approx. 15% AFFO Per Share $0.14 Approx. $0.13
Industry Outlook Greeley PlaceGreeley, CO
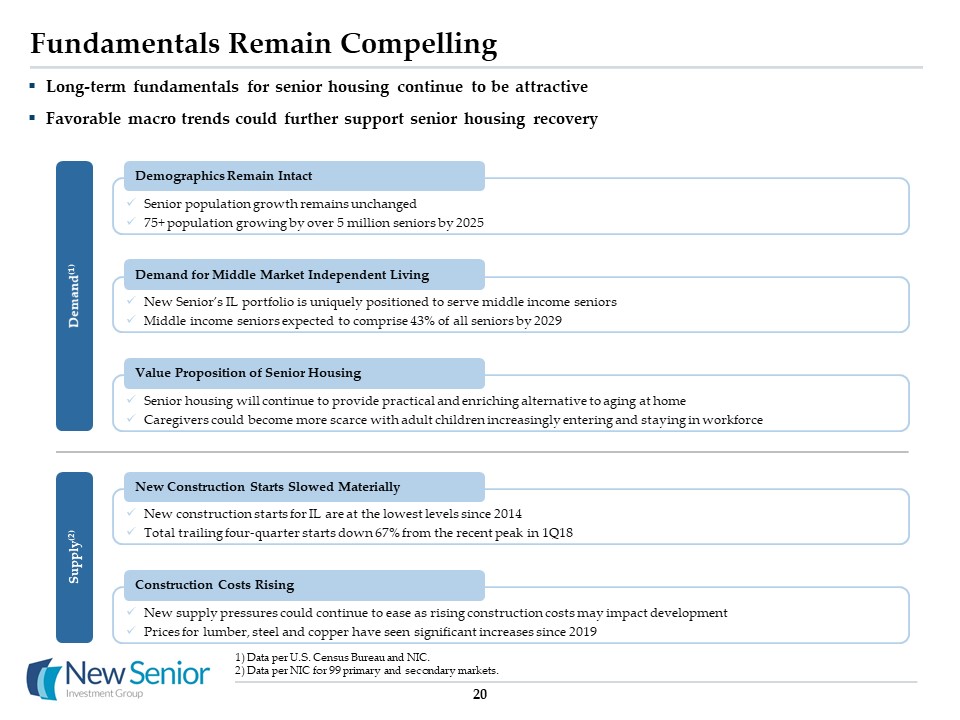
Fundamentals Remain Compelling Long-term fundamentals for senior housing continue to be attractiveFavorable macro trends could further support senior housing recovery 20 Senior population growth remains unchanged75+ population growing by over 5 million seniors by 2025 Demographics Remain Intact New Senior’s IL portfolio is uniquely positioned to serve middle income seniorsMiddle income seniors expected to comprise 43% of all seniors by 2029 Demand for Middle Market Independent Living Senior housing will continue to provide practical and enriching alternative to aging at homeCaregivers could become more scarce with adult children increasingly entering and staying in workforce Value Proposition of Senior Housing New construction starts for IL are at the lowest levels since 2014Total trailing four-quarter starts down 67% from the recent peak in 1Q18 New Construction Starts Slowed Materially New supply pressures could continue to ease as rising construction costs may impact development Prices for lumber, steel and copper have seen significant increases since 2019 Construction Costs Rising Demand(1) Supply(2) Data per U.S. Census Bureau and NIC.Data per NIC for 99 primary and secondary markets.
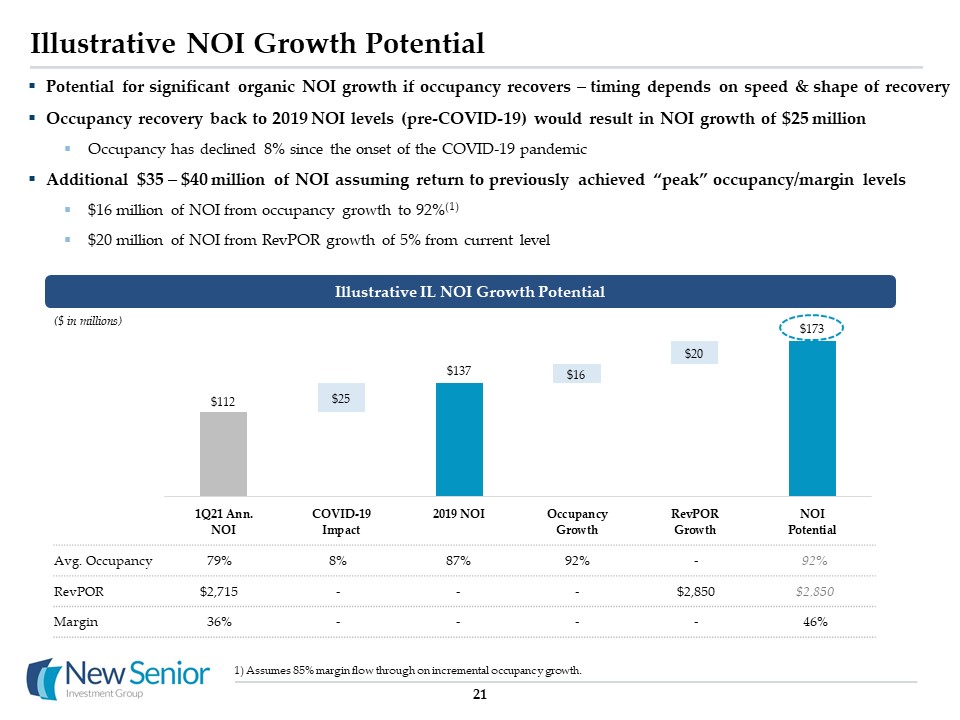
Illustrative NOI Growth Potential Potential for significant organic NOI growth if occupancy recovers – timing depends on speed & shape of recovery Occupancy recovery back to 2019 NOI levels (pre-COVID-19) would result in NOI growth of $25 million Occupancy has declined 8% since the onset of the COVID-19 pandemic Additional $35 – $40 million of NOI assuming return to previously achieved “peak” occupancy/margin levels$16 million of NOI from occupancy growth to 92%(1)$20 million of NOI from RevPOR growth of 5% from current level Illustrative IL NOI Growth Potential Avg. Occupancy 79% 8% 87% 92% - 92% RevPOR $2,715 - - - $2,850 $2,850 Margin 36% - - - - 46% Assumes 85% margin flow through on incremental occupancy growth. ($ in millions) 21

Appendix Augustine LandingJacksonville, FL

Capital Structure, Debt Maturities & Liquidity(1) Debt information is as of 3/31/2021 and based on current unpaid principal balance.Company has two one-year extension options to extend the maturity date on $49 million, subject to a fee of 13bps of the total commitment on the second extension option.Includes the impact of swaps that effectively converted $620 million LIBOR-based floating rate debt to fixed rate debt. 23 Amounts % of Total W.A. Maturity in Years Interest Rate Fixed $1,081 72% 4.3 years 3.9% Floating 419 28% 5.4 years 2.5% Total Debt $1,500 100% 5.1 years 3.5% $1.5 billion of debt as of March 31, 2021Fixed rate exposure of 72%Average LIBOR for 1Q21 was 13bpsCurrent spot rate of 11bpsNo significant debt maturities until 2025 Debt Composition(3) Debt Maturity & Amortization Schedule ($ in millions) ($ in millions) (2) Recent LIBOR Trends 1Q21 average of 13bpsAs of 4/30/21, spot rate of 11bps
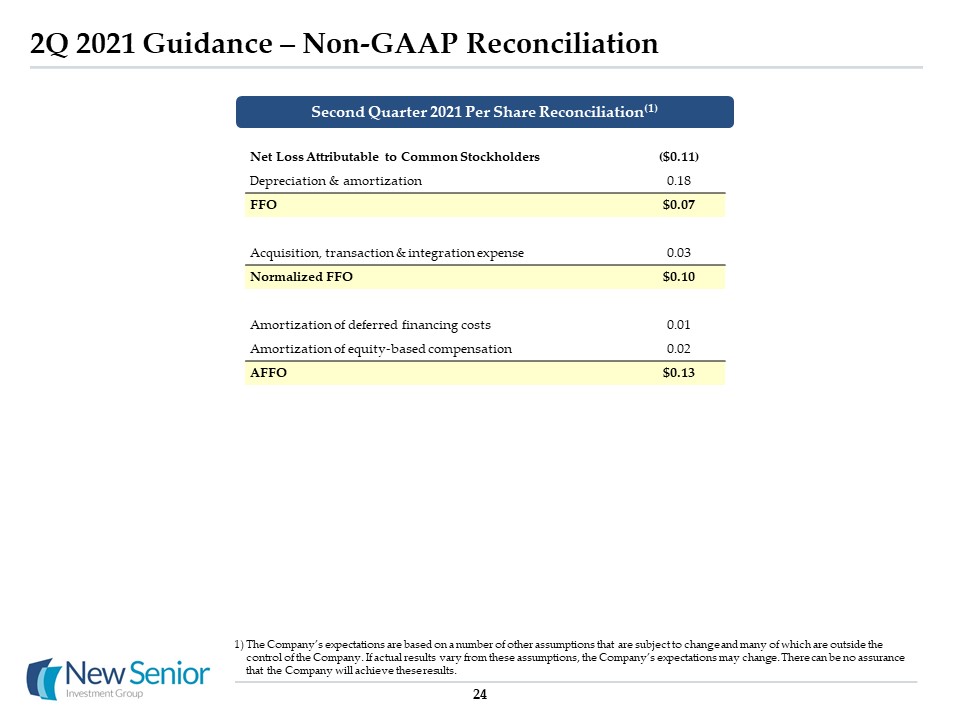
2Q 2021 Guidance – Non-GAAP Reconciliation 24 Net Loss Attributable to Common Stockholders ($0.11) Depreciation & amortization 0.18 FFO $0.07 Acquisition, transaction & integration expense 0.03 Normalized FFO $0.10 Amortization of deferred financing costs 0.01 Amortization of equity-based compensation 0.02 AFFO $0.13 Second Quarter 2021 Per Share Reconciliation(1) The Company’s expectations are based on a number of other assumptions that are subject to change and many of which are outside the control of the Company. If actual results vary from these assumptions, the Company’s expectations may change. There can be no assurance that the Company will achieve these results.
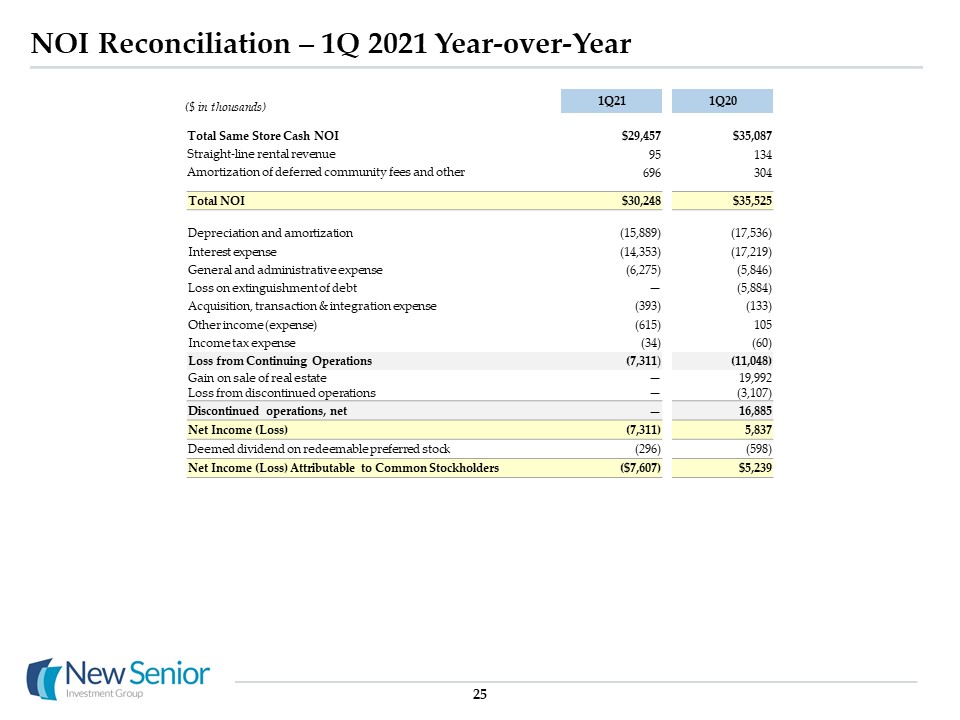
NOI Reconciliation – 1Q 2021 Year-over-Year 25 1Q21 1Q20 Total Same Store Cash NOI $29,457 $35,087 Straight-line rental revenue 95 134 Amortization of deferred community fees and other 696 304 Total NOI $30,248 $35,525 Depreciation and amortization (15,889) (17,536) Interest expense (14,353) (17,219) General and administrative expense (6,275) (5,846) Loss on extinguishment of debt — (5,884) Acquisition, transaction & integration expense (393) (133) Other income (expense) (615) 105 Income tax expense (34) (60) Loss from Continuing Operations (7,311) (11,048) Gain on sale of real estate — 19,992 Loss from discontinued operations — (3,107) Discontinued operations, net — 16,885 Net Income (Loss) (7,311) 5,837 Deemed dividend on redeemable preferred stock (296) (598) Net Income (Loss) Attributable to Common Stockholders ($7,607) $5,239 ($ in thousands)
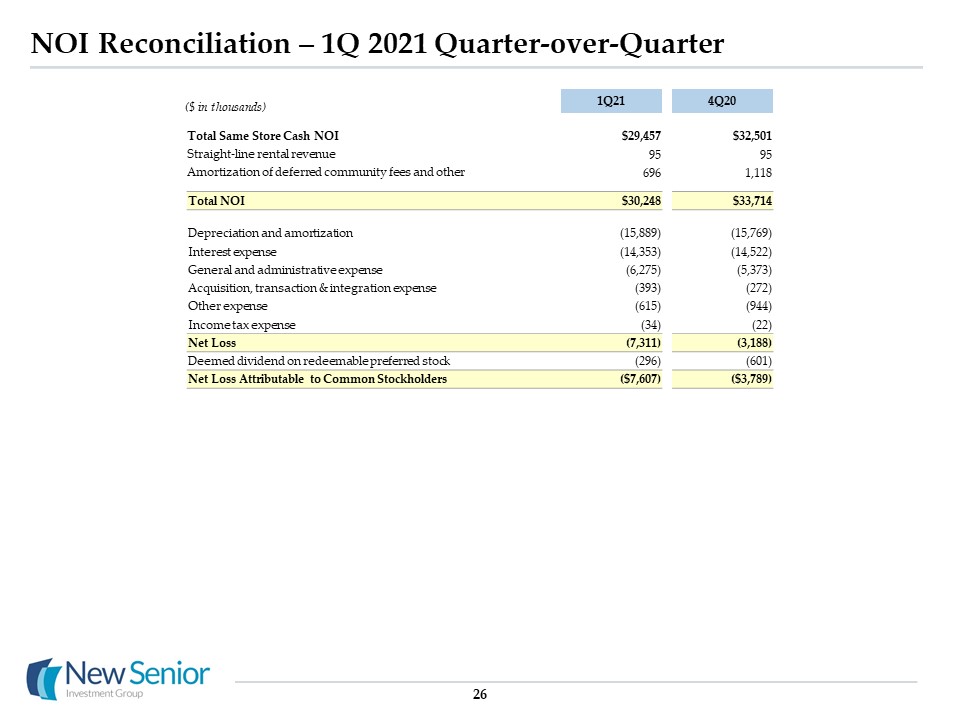
NOI Reconciliation – 1Q 2021 Quarter-over-Quarter 26 1Q21 4Q20 Total Same Store Cash NOI $29,457 $32,501 Straight-line rental revenue 95 95 Amortization of deferred community fees and other 696 1,118 Total NOI $30,248 $33,714 Depreciation and amortization (15,889) (15,769) Interest expense (14,353) (14,522) General and administrative expense (6,275) (5,373) Acquisition, transaction & integration expense (393) (272) Other expense (615) (944) Income tax expense (34) (22) Net Loss (7,311) (3,188) Deemed dividend on redeemable preferred stock (296) (601) Net Loss Attributable to Common Stockholders ($7,607) ($3,789) ($ in thousands)
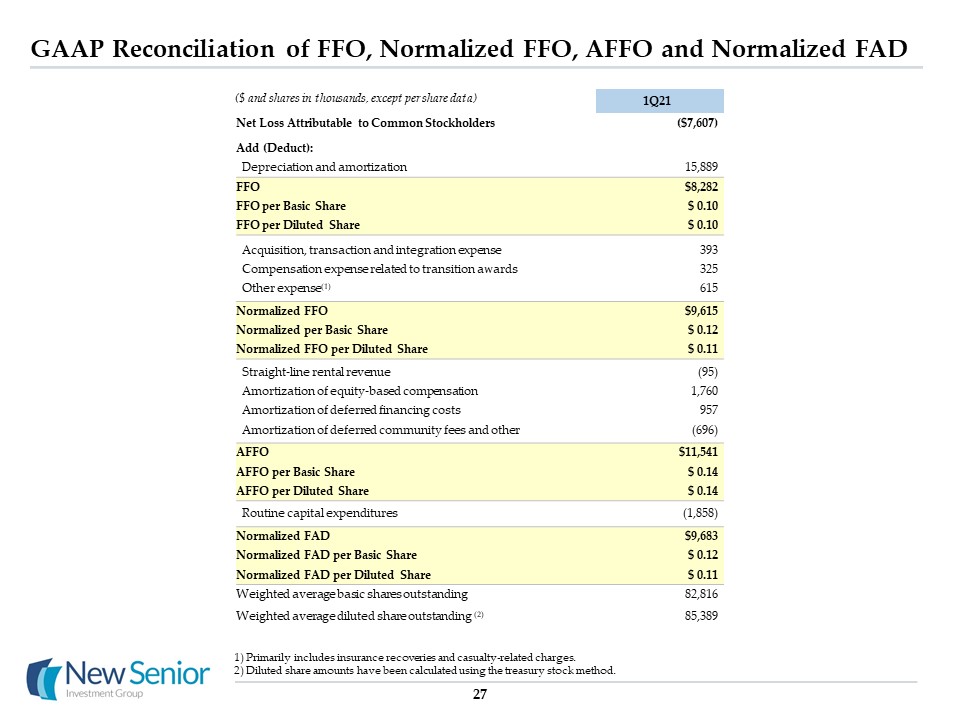
GAAP Reconciliation of FFO, Normalized FFO, AFFO and Normalized FAD 27 Primarily includes insurance recoveries and casualty-related charges.Diluted share amounts have been calculated using the treasury stock method. 1Q21 Net Loss Attributable to Common Stockholders ($7,607) Add (Deduct): Depreciation and amortization 15,889 FFO $8,282 FFO per Basic Share $ 0.10 FFO per Diluted Share $ 0.10 Acquisition, transaction and integration expense 393 Compensation expense related to transition awards 325 Other expense(1) 615 Normalized FFO $9,615 Normalized per Basic Share $ 0.12 Normalized FFO per Diluted Share $ 0.11 Straight-line rental revenue (95) Amortization of equity-based compensation 1,760 Amortization of deferred financing costs 957 Amortization of deferred community fees and other (696) AFFO $11,541 AFFO per Basic Share $ 0.14 AFFO per Diluted Share $ 0.14 Routine capital expenditures (1,858) Normalized FAD $9,683 Normalized FAD per Basic Share $ 0.12 Normalized FAD per Diluted Share $ 0.11 Weighted average basic shares outstanding 82,816 Weighted average diluted share outstanding (2) 85,389 ($ and shares in thousands, except per share data)
Glossary Cash NOI MarginCash NOI margin is equal to Cash NOI divided by Cash Revenue.Discontinued OperationsDiscontinued operations consists of 28 AL/MC properties that represented the entire Managed AL/MC Properties segment prior to the fourth quarter of 2019 and were classified as discontinued operations as of December 31, 2019. The properties were subsequently sold in February 2020. EBITDARMEBITDARM is a non-GAAP measure that represents earnings before interest, taxes, depreciation, amortization, rent and management fees for the period stated unless otherwise noted. We use EBITDARM in determining coverage and as a supplemental measure of the ability of the property to generate sufficient liquidity to meet related obligations to us. For our triple net lease portfolio, all facility financial performance data was derived solely from information provided by operators/tenants without independent verification by us. EBITDARM does not represent net income or cash flow from operations and should not be considered an alternative to those indications. EBITDARM CoverageFacility EBITDARM divided by the aggregate of base rent and any additional rent due to us for the same period. EBITDARM coverage is a supplemental measure of a property’s ability to generate cash flows for the operator/tenant (not for us) to meet the operator’s/tenant’s related rent and other obligations to us. Enterprise ValueEnterprise value is equal to market capitalization plus carrying value of mortgage notes payable, minus cash. FFO, Normalized FFO, AFFO and Normalized FADWe use Funds From Operations ("FFO") and Normalized FFO as supplemental measures of our operating performance. We use the National Association of Real Estate Investment Trusts ("NAREIT") definition of FFO. NAREIT defines FFO as GAAP net income (loss) attributable to common stockholders, which includes loss from discontinued operations, excluding gains (losses) from sales of depreciable real estate assets and impairment charges of depreciable real estate, plus real estate depreciation and amortization, and after adjustments for unconsolidated entities and joint ventures to reflect FFO on the same basis. FFO does not account for debt principal payments and is not intended as a measure of a REIT’s ability to satisfy such payments or any other cash requirements. FFO, Normalized FFO, AFFO and Normalized FAD (continued)Normalized FFO, as defined below, measures the financial performance of our portfolio of assets excluding items that, although incidental to, are not reflective of the day-to-day operating performance of our portfolio of assets. We believe that Normalized FFO is useful because it facilitates the evaluation of our portfolio’s operating performance (i) between periods on a consistent basis and (ii) to the operating performance of other real estate companies. However, comparability may be limited because our calculation of Normalized FFO may differ significantly from that of other companies, or because of features of our business that are not present in other companies.We define Normalized FFO as FFO excluding the following income and expense items, as applicable: (a) acquisition, transaction and integration related expenses; (b) the write off of unamortized discounts, premiums, deferred financing costs, or additional costs, make whole payments and penalties or premiums incurred as the result of early repayment of debt (collectively “Gain (loss) on extinguishment of debt”); (c) incentive compensation to affiliate recognized as a result of sales of real estate; (d) the remeasurement of deferred tax assets; (e) valuation allowance on deferred tax assets, net; (f) termination fee to affiliate; (g) gain on lease termination; (h) compensation expense related to transition awards; (i) litigation proceeds; and (j) other items that we believe are not indicative of operating performance, generally reported as “Other expense (income)” in the Consolidated Statements of Operations. We also use Adjusted FFO (“AFFO”) and Normalized FAD as supplemental measures of our operating performance. We believe AFFO is useful because it facilitates the evaluation of (i) the current economic return on our portfolio of assets between periods on a consistent basis and (ii) our portfolio versus those of other real estate companies that report AFFO. However, comparability may be limited because our calculation of AFFO may differ significantly from that of other companies, or because of features of our business that are not present in other companies. We define AFFO as Normalized FFO excluding the impact of the following: (a) straight-line rental revenue; (b) amortization of above / below market lease intangibles; (c) amortization of deferred financing costs; (d) amortization of premium or discount on mortgage notes payable; (e) amortization of deferred community fees and other, which includes the net change in deferred community fees and other rent discounts or incentives and (f) amortization of equity-based compensation expense. 28
Glossary FFO, Normalized FFO, AFFO and Normalized FAD (continued)We define Normalized FAD as AFFO less routine capital expenditures, which we view as a cost associated with the current economic return. Normalized FAD, which does not reflect debt principal payments and certain other expenses, does not represent cash available for distribution to stockholders. We believe Normalized FAD is useful because it fully reflects the additional economic costs of maintaining the condition of the portfolio.Gross Assets The carrying amount of total assets, after adding back accumulated depreciation and amortization, as reported in our consolidated financial statements. Investment Represents the carrying amount of real estate assets, including intangibles, after adding back accumulated depreciation and amortization, for all assets owned as of the end of the respective reporting period. Net Operating Income (“NOI”) and Cash NOINOI and cash NOI are non-GAAP measures used to evaluate the performance of our properties. We consider NOI and Cash NOI important supplemental measures used to evaluate the operating performance of our properties because they allow investors, analysts and our management to assess our unleveraged property-level operating results and to compare our operating results between periods and to the operating results of other real estate companies on a consistent basis. We define NOI as total revenues less property-level operating expenses, which include property management fees and travel cost reimbursements. We define cash NOI as NOI excluding the effects of straight-line rental revenue, amortization of above / below market lease intangibles and the amortization of deferred community fees and other, which includes the net change in deferred community fees and other rent discounts or incentives. 29 Occupancy For the IL portfolio, occupancy represents the facilities’ average operating occupancy for the applicable period. For the triple net lease portfolio, occupancy is based on the period reported unless otherwise noted. The percentages are calculated based on available beds. All occupancy data was derived solely from information provided by operators/tenants without independent verification by us. RevPORRepresents average cash revenues per occupied bed per month. We use RevPOR to evaluate the revenue generating potential of our senior housing portfolio independent of fluctuating occupancy rates.Same StoreSame store information is intended to enable management to evaluate the performance of a consistent portfolio of real estate in a manner that eliminates variances attributable to changes in the composition of our portfolio over time, due to sales and various other factors. Properties acquired, sold, transitioned to other property managers or between segments, or classified as held for sale or discontinued operations during the comparable periods are excluded from the same store amounts.