Exhibit 99.2
AVOLON
2015 Second Quarter | Earnings Presentation
August 5, 2015
Disclaimer
Concerning Forward-Looking Statements and Non-GAAP Information
AVOLON
This document includes forward-looking statements, beliefs or opinions, including statements with respect to Avolon’s business, financial condition, results of operations and plans. These forward-looking statements involve known and unknown risks and uncertainties, many of which are beyond our control and all of which are based on our management’s current beliefs and expectations about future events. Forward-looking statements are sometimes identified by the use of forward-looking terminology such as “believe,” “expects,” “may,” “will,” “could,” “should,” “shall,” “risk,” “intends,” “estimates,” “aims,” “plans,” “predicts,” “continues,” “assumes,” “positioned” or “anticipates” or the negative thereof, other variations thereon or comparable terminology or by discussions of strategy, plans, objectives, goals, future events or intentions. These forward-looking statements include all matters that are not historical facts. Forward-looking statements may and often do differ materially from actual results. No assurance can be given that such future results will be achieved.
These risks, uncertainties and assumptions include, but are not limited to, the following: general economic and financial conditions; the financial condition of our lessees; our ability to obtain additional capital to finance our growth and operations on attractive terms; decline in the value of our aircraft and market rates for leases; the loss of key personnel; lessee defaults and attempts to repossess aircraft; our ability to regularly sell aircraft; our ability to successfully re-lease our existing aircraft and lease new aircraft; our ability to negotiate and enter into profitable leases; periods of aircraft oversupply during which lease rates and aircraft values decline; changes in the appraised value of our aircraft; changes in interest rates; competition from other aircraft lessors; and the limited number of aircraft and engine manufacturers. These and other important factors, including those discussed under “Item 3. Key Information—Risk Factors” included in our Annual Report on Form 20-F filed with the U.S. Securities and Exchange Commission on March 3, 2015, may cause our actual events or results to differ materially from any future results, performances or achievements expressed or implied by the forward-looking statements contained in this document. Such forward-looking statements contained in this document speak only as of the date of this document. We expressly disclaim any obligation or undertaking to update these forward-looking statements contained in this document to reflect any change in our expectations or any change in events, conditions, or circumstances on which such statements are based unless required to do so by applicable law.
The financial information included herein includes financial information that is not presented in accordance with generally accepted accounting principles in the United States (“GAAP”), including adjusted net income, adjusted return on equity (“adjusted ROE”) and adjusted earnings per share. The Appendix to this presentation includes a reconciliation of adjusted net income, adjusted ROE and adjusted earnings per share with the most directly comparable financial measures calculated in accordance with GAAP. See slides 15 to 17 .
Avolon | Slide 2
Five Essential Pillars for Success
AVOLON
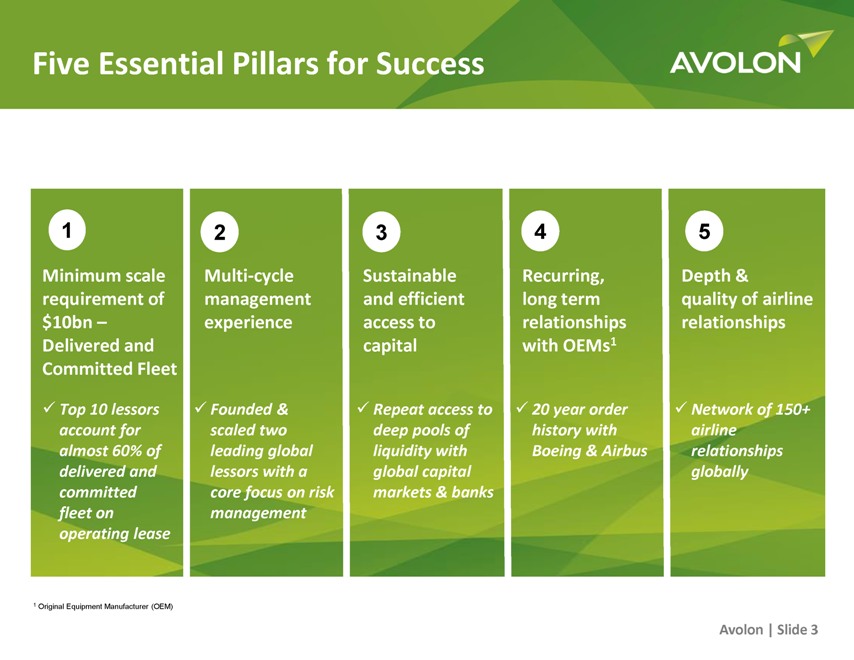
1 Minimum scale requirement of $10bn – Delivered and Committed Fleet Top 10 lessors account for almost 60% of delivered and committed fleet on operating lease
2 Multi-cycle management experience Founded & scaled two leading global lessors with a core focus on risk management
3 Sustainable and efficient access to capital Repeat access to deep pools of liquidity with global capital markets & banks
4 Recurring, long term relationships with OEMs1 20 year order history with Boeing & Airbus
5 Depth & quality of airline relationships Network of 150+ airline relationships globally
1 Original Equipment Manufacturer (OEM)
Avolon | Slide 3
Strong Growth and Disciplined Risk Management
Q2 2015
AVOLON
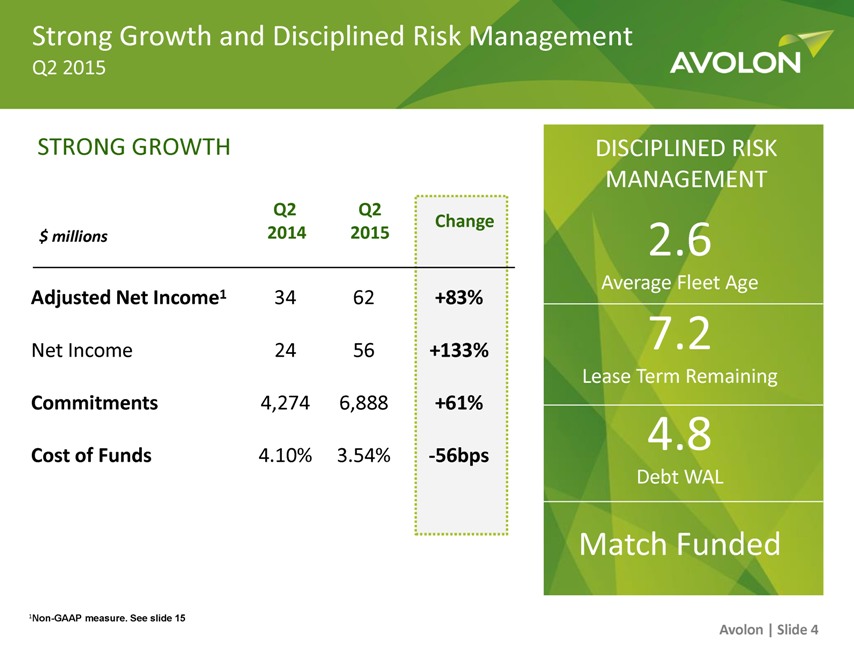
STRONG GROWTH
$ millions Adjusted Net Income1 Net Income Commitments Cost of Funds
Q2 2014 34 24 4,274 4.10%
Q2 2015 62 56 6,888 3.54%
Change +83% +133% +61% -56bps
DISCIPLINED RISK MANAGEMENT 2.6 Average Fleet Age 7.2 Lease Term Remaining 4.8 Debt WAL Match Funded
1Non-GAAP measure. See slide 15 Avolon | Slide 4
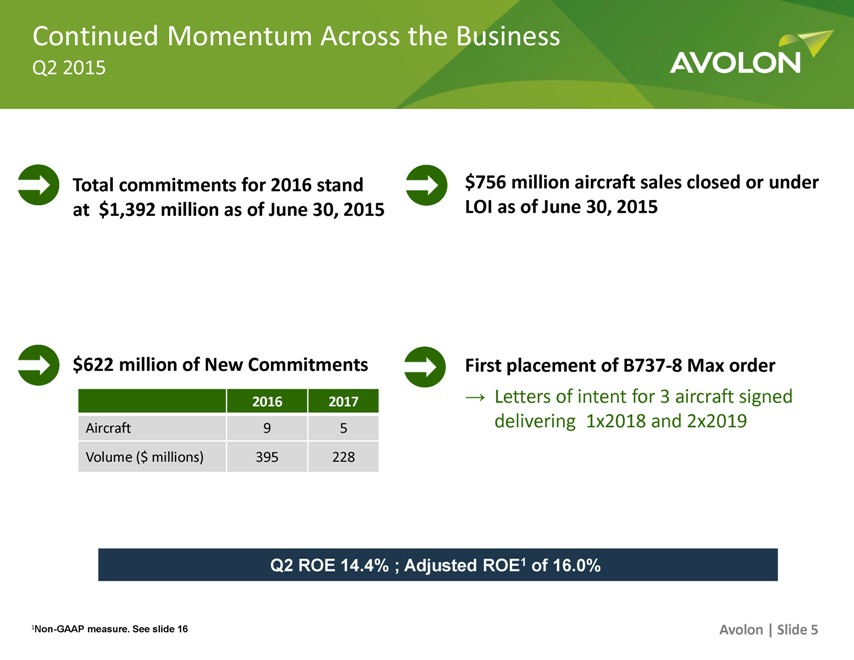
Continued Momentum Across the Business
Q2 2015
AVOLON
Total commitments for 2016 stand at $1,392 million as of June 30, 2015
$756 million aircraft sales closed or under LOI as of June 30, 2015
$622 million of New Commitments First placement of B737-8 Max order
Letters of intent for 3 aircraft signed delivering 1x2018 and 2x2019
Aircraft Volume ($ millions)
2016 9 395
2017 5 228
Q2 ROE 14.4% ; Adjusted ROE1 of 16.0%
1Non-GAAP measure. See slide 16 Avolon | Slide 5
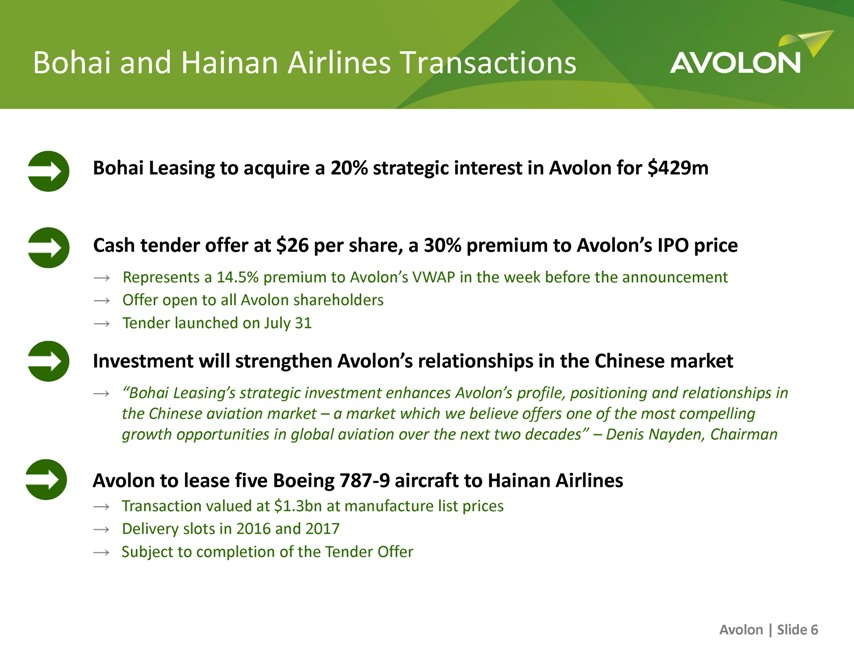
Bohai and Hainan Airlines Transactions AVOLON
Bohai Leasing to acquire a 20% strategic interest in Avolon for $429m
Cash tender offer at $26 per share, a 30% premium to Avolon’s IPO price
Represents a 14.5% premium to Avolon’s VWAP in the week before the announcement
Offer open to all Avolon shareholders
Tender launched on July 31
Investment will strengthen Avolon’s relationships in the Chinese market
“Bohai Leasing’s strategic investment enhances Avolon’s profile, positioning and relationships in the Chinese aviation market – a market which we believe offers one of the most compelling growth opportunities in global aviation over the next two decades” – Denis Nayden, Chairman
Avolon to lease five Boeing 787-9 aircraft to Hainan Airlines
Transaction valued at $1.3bn at manufacture list prices
Delivery slots in 2016 and 2017
Subject to completion of the Tender Offer
Avolon | Slide 6

AVOLON
FINANCIAL HIGHLIGHTS
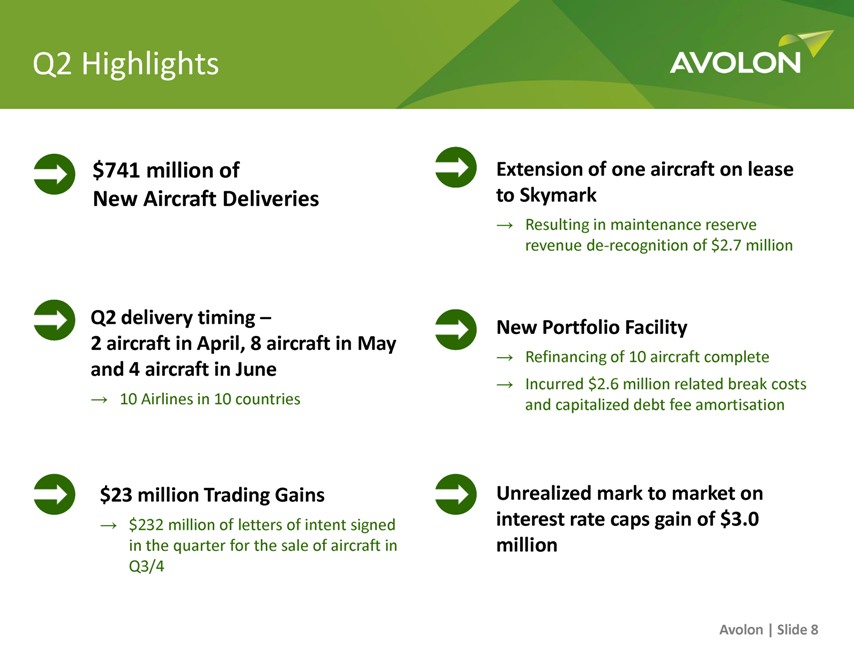
Q2 Highlights
AVOLON
$741 million of New Aircraft Deliveries
Q2 delivery timing – 2 aircraft in April, 8 aircraft in May and 4 aircraft in June
10 Airlines in 10 countries
$23 million Trading Gains
$232 million of letters of intent signed in the quarter for the sale of aircraft in Q3/4
Extension of one aircraft on lease to Skymark
Resulting in maintenance reserve revenue de-recognition of $2.7 million
New Portfolio Facility
Refinancing of 10 aircraft complete
Incurred $2.6 million related break costs and capitalized debt fee amortisation
Unrealized mark to market on interest rate caps gain of $3.0 million
Avolon | Slide 8
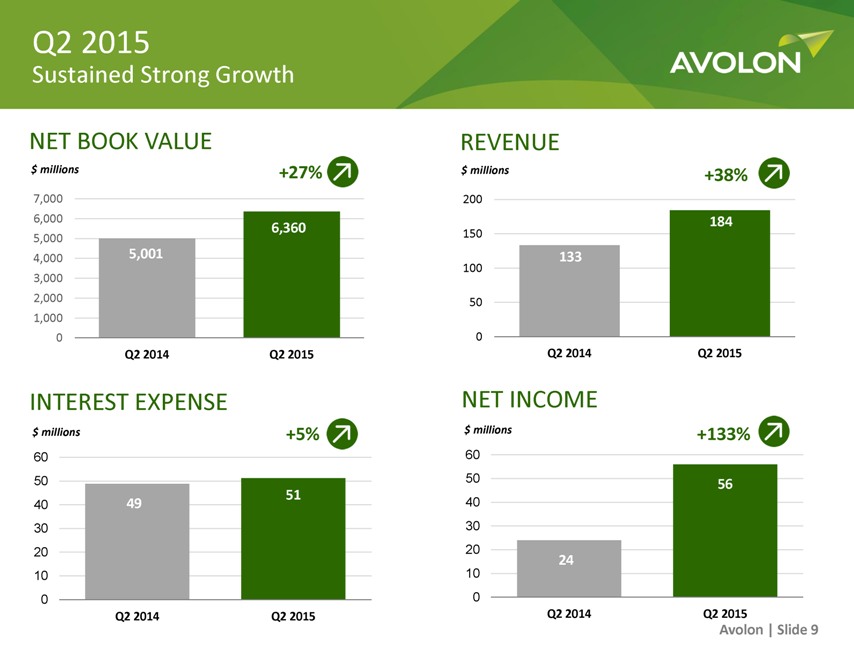
Q2 2015
Sustained Strong Growth
AVOLON
NET BOOK VALUE
$ millions +27%
7,000
6,000 6,360
5,000
4,000 5,001
3,000
2,000
1,000
0
Q2 2014
Q2 2015
INTEREST EXPENSE
$ millions
+5%
60
50 51
40 49
30
20
10
0
Q2 2014
Q2 2015
REVENUE
$ millions
+38%
200 184
150 133
100
50
0
Q2 2014
Q2 2015
NET INCOME
$ millions
+133%
60
50
56
40
30
20
24
10
0
Q2 2014
Q2 2015
Avolon | Slide 9
Generating Attractive Returns AVOLON
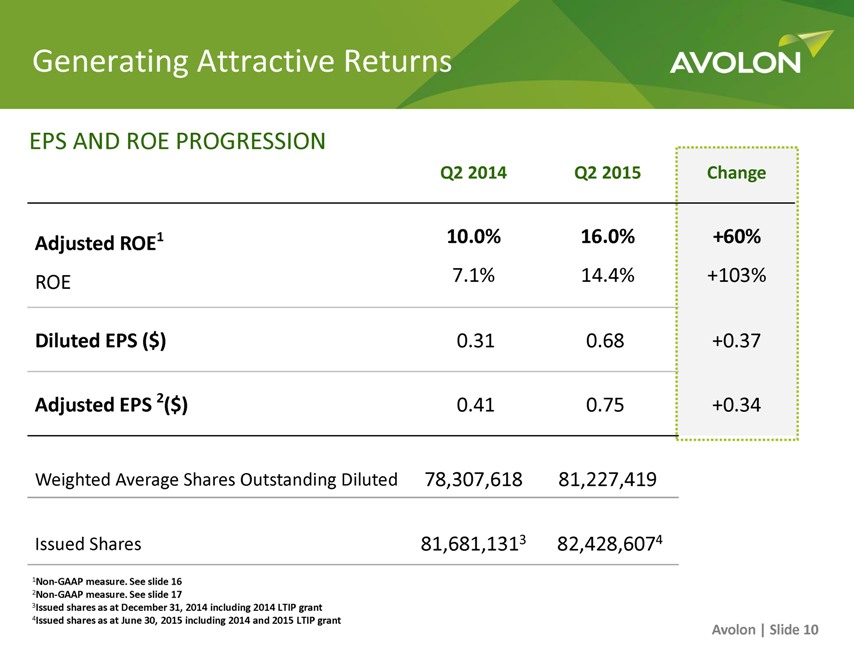
EPS AND ROE PROGRESSION
Q2 2014 Q2 2015 Change
Adjusted ROE1 10.0% 16.0% +60%
ROE 7.1% 14.4% +103%
Diluted EPS ($) 0.31 0.68 +0.37
Adjusted EPS 2($) 0.41 0.75 +0.34
Weighted Average Shares Outstanding Diluted 78,307,618 81,227,419
Issued Shares 81,681,1313 82,428,6074
1Non-GAAP measure. See slide 16
2Non-GAAP measure. See slide 17
3Issued shares as at December 31, 2014 including 2014 LTIP grant
4Issued shares as at June 30, 2015 including 2014 and 2015 LTIP grant
Avolon | Slide 10
Trading Gains – Revising Guidance
AVOLON
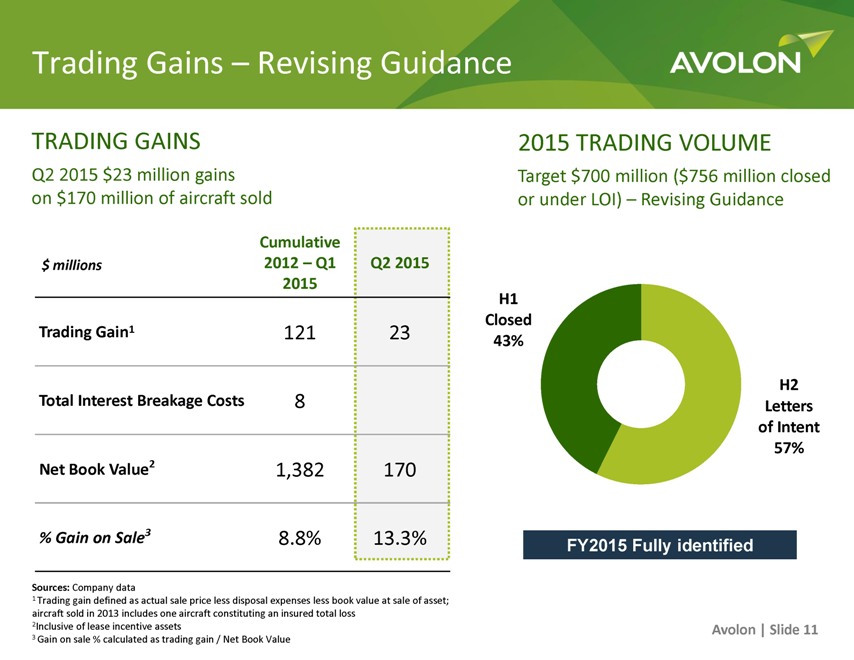
TRADING GAINS
Q2 2015 $23 million gains on $170 million of aircraft sold
$ millions
Cumulative 2012 – Q1 2015
Q2 2015
Trading Gain1 121 23
Total Interest Breakage Costs 8
Net Book Value2 1,382 170
% Gain on Sale3 8.8% 13.3%
Sources: Company data
1 Trading gain defined as actual sale price less disposal expenses less book value at sale of asset; aircraft sold in 2013 includes one aircraft constituting an insured total loss
2Inclusive of lease incentive assets
3 Gain on sale % calculated as trading gain / Net Book Value
2015 TRADING VOLUME
Target $700 million ($756 million closed or under LOI) – Revising Guidance
H1 Closed 43%
H2 Letters of Intent 57%
FY2015 Fully identified
Avolon | Slide 11
Financial Outlook Update
AVOLON
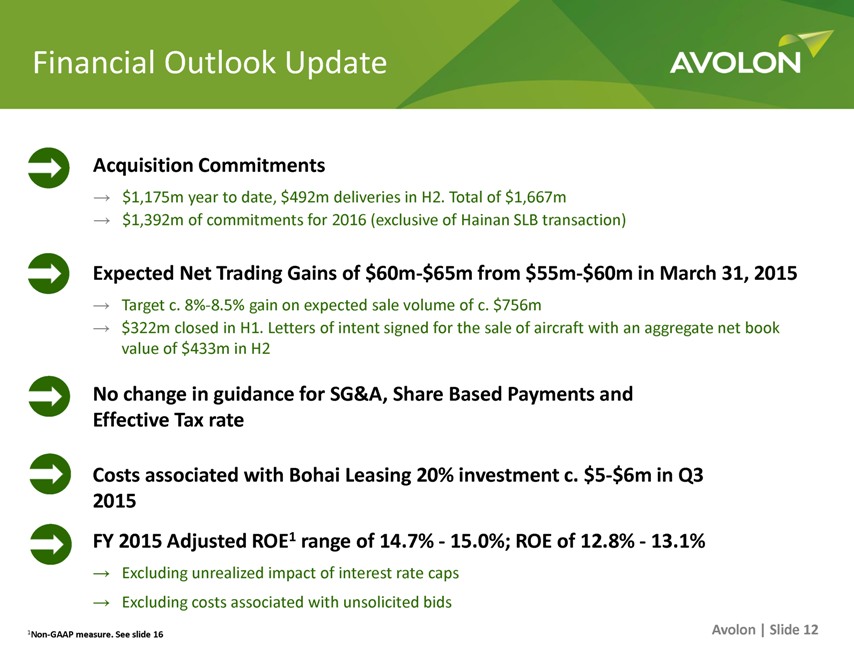
Acquisition Commitments
$1,175m year to date, $492m deliveries in H2. Total of $1,667m
$1,392m of commitments for 2016 (exclusive of Hainan SLB transaction)
Expected Net Trading Gains of $60m-$65m from $55m-$60m in March 31, 2015
Target c. 8%-8.5% gain on expected sale volume of c. $756m
$322m closed in H1. Letters of intent signed for the sale of aircraft with an aggregate net book value of $433m in H2
No change in guidance for SG&A, Share Based Payments and Effective Tax rate
Costs associated with Bohai Leasing 20% investment c. $5-$6m in Q3 2015
FY 2015 Adjusted ROE1 range of 14.7% - 15.0%; ROE of 12.8% - 13.1%
Excluding unrealized impact of interest rate caps
Excluding costs associated with unsolicited bids
1Non-GAAP measure. See slide 16
Avolon | Slide 12
AVOLON
APPENDIX
Find out more at www.avolon.aero
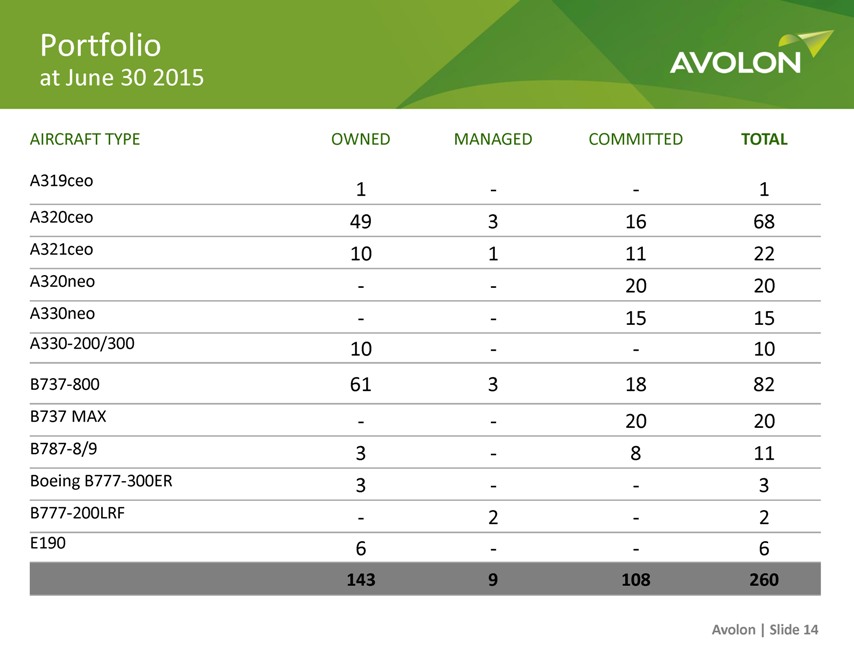
Portfolio
at June 30 2015
AVOLON
AIRCRAFT TYPE OWNED MANAGED COMMITTED TOTAL
A319ceo 1 - -1
A320ceo 49 3 16 68
A321ceo 10 1 11 22
A320neo - - 20 20
A330neo - - 15 15
A330-200/300 10 - - 10
B737-800 61 3 18 82
B737 MAX - - 20 20
B787-8/9 3 - 8 11
Boeing B777-300ER 3 - - 3
B777-200LRF - 2 - 2
E190 6 - - 6
143 9 108 260
Avolon | Slide 14
Reconciliation of Adjusted Net Income
AVOLON
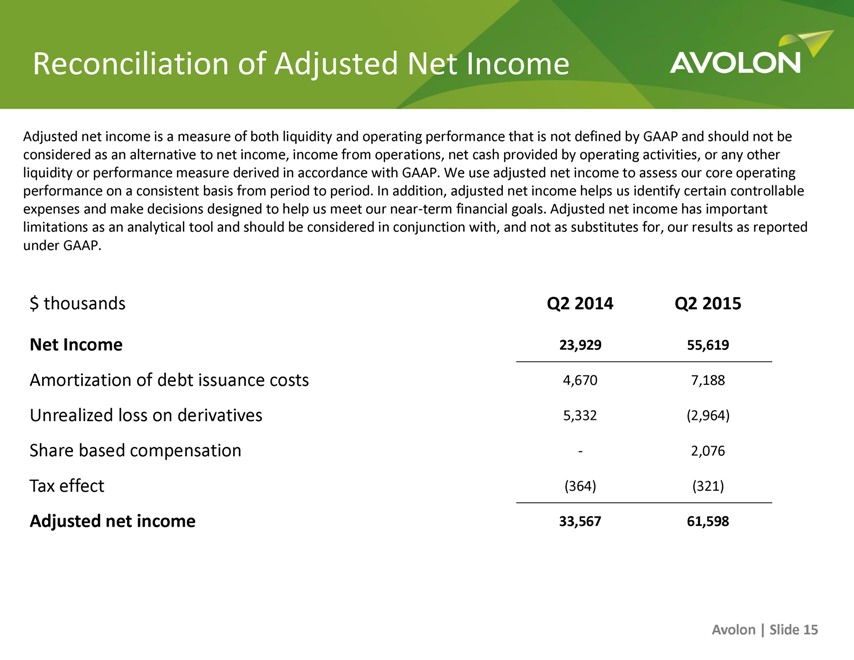
Adjusted net income is a measure of both liquidity and operating performance that is not defined by GAAP and should not be considered as an alternative to net income, income from operations, net cash provided by operating activities, or any other liquidity or performance measure derived in accordance with GAAP. We use adjusted net income to assess our core operating performance on a consistent basis from period to period. In addition, adjusted net income helps us identify certain controllable expenses and make decisions designed to help us meet our near-term financial goals. Adjusted net income has important limitations as an analytical tool and should be considered in conjunction with, and not as substitutes for, our results as reported under GAAP.
$ thousands Q2 2014 Q2 2015
Net Income 23,929 55,619
Amortization of debt issuance costs 4,670 7,188
Unrealized loss on derivatives 5,332 (2,964)
Share based compensation - 2,076
Tax effect (364) (321)
Adjusted net income 33,567 61,598
Avolon | Slide 15

Reconciliation of Adjusted ROE
AVOLON
Adjusted ROE is (Adjusted Net Income) / (Total shareholder’s equity)
Q2 2014 Q2 2015
FY 2015 Guidance FY 2015 Guidance
ROE 7.1% 14.4% 12.8% 13.1%
Amortization of debt issuance costs 1.4% 1.9% 1.4% 1.4%
Unrealized loss on derivatives 1.6% (0.8%) - -
Share based compensation 0.0% 0.5% 0.6% 0.6%
Tax effect (0.1%) (0.1%) (0.1%) (0.1%)
Adjusted ROE 10.0% 16.0% 14.7% 15.0%
Avolon | Slide 16
Reconciliation of Adjusted EPS
AVOLON
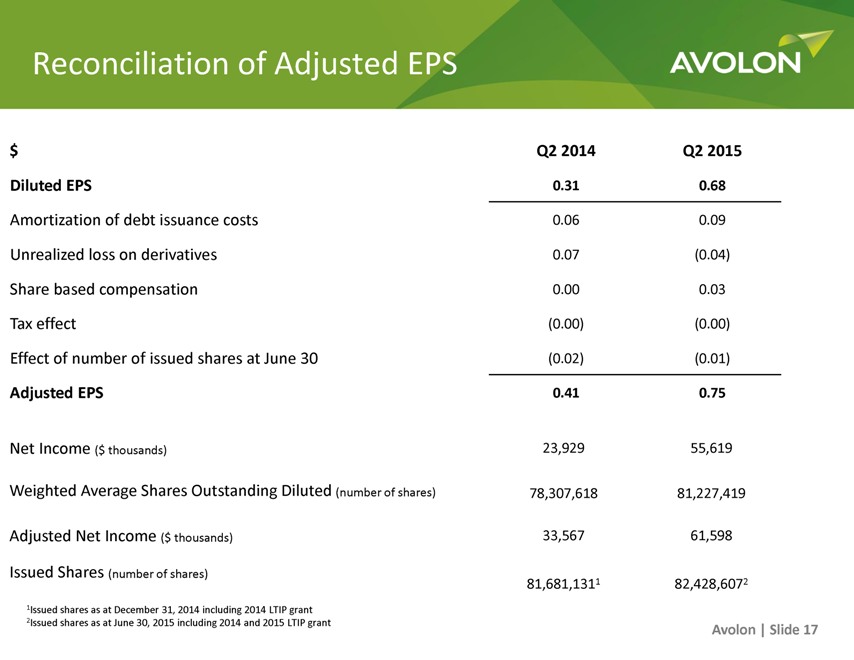
$ Q2 2014 Q2 2015
Diluted EPS 0.31 0.68
Amortization of debt issuance costs 0.06 0.09
Unrealized loss on derivatives 0.07 (0.04)
Share based compensation 0.00 0.03
Tax effect (0.00) (0.00)
Effect of number of issued shares at June 30 (0.02) (0.01)
Adjusted EPS 0.41 0.75
Net Income ($ thousands) 23,929 55,619
Weighted Average Shares Outstanding Diluted (number of shares) 78,307,618 81,227,419
Adjusted Net Income ($ thousands) 33,567 61,598
Issued Shares (number of shares) 81,681,1311 82,428,6072
1 Issued shares as at December 31, 2014 including 2014 LTIP grant
2 Issued shares as at June 30, 2015 including 2014 and 2015 LTIP grant
Avolon | Slide 17
AVOLON
THANK YOU
Find out more at www.avolon.aero


