Exhibit 99.1

Exhibit 99.1
Shell Midstream Partners, L.P.
Investor Day
November 16, 2017
Definitions and Cautionary Note
This presentation includes various “forward-looking statements” within the meaning of the Securities Act of 1933, as amended, and the Securities Exchange Act of 1934, as amended. All statements other than statements of historical fact are, or may be deemed to be, forward-looking statements. Forward-looking statements are statements of future expectations that are based on management’s current expectations and assumptions and involve known and unknown risks and uncertainties that could cause actual results, performance or events to differ materially from those expressed or implied in these statements. Forward-looking statements include, among other things, statements concerning management’s expectations, beliefs, estimates, forecasts, projections and assumptions. You can identify our forward-looking statements by words such as “anticipate”, “indicative”, “believe”, “estimate”, “budget,” “continue,” “potential,” “guidance,” “effort,” “expect”, “forecast”, “goals”, “objectives”, “outlook”, “intend”, “plan”, “predict”, “project”, “seek”, “target”, “begin”, “could”, “may”, “should” or “would” or other similar expressions that convey the uncertainty of future events or outcomes. In accordance with “safe harbor” provisions of the Private Securities Litigation Reform Act of 1995, these statements are accompanied by cautionary language identifying important factors, though not necessarily all such factors, which could cause future outcomes to differ materially from those set forth in forward-looking statements. In particular, expressed or implied statements concerning future actions, future drop downs, volumes, capital requirements, conditions or events, future impact of prior acquisitions, future operating results or the ability to generate sales, the potential exposure of Shell Midstream Partners, L.P. (SHLX) to market risks, and statements relating to expected EBITDA, future growth, income, cash flow and the amount of distributions are forward-looking statements. Forward-looking statements are not guarantees of performance. They involve risks, uncertainties and assumptions. Future actions, conditions or events and future results of operations may differ materially from those expressed in these forward-looking statements. Forward-looking statements speak only as of the date of this presentation, November 16, 2017 and we disclaim any obligation to update such statements for any reason, except as required by law. All forward-looking statements contained in this presentation are expressly qualified in their entirety by the cautionary statements contained or referred to in this paragraph. Many of the factors that will determine these results are beyond our ability to control or predict. These factors include the risk factors described in Part I, Item 1A. “Risk Factors” in our Annual Report on Form10-K for the year ended December 31, 2016, as updated by our subsequent filings with the SEC. If any of those risks occur, it could cause our actual results to differ materially from those contained in any forward-looking statement. Because of these risks and uncertainties, you should not place undue reliance on any forward-looking statement.
Projections Relating to Shell Assets
The assets owned by Royal Dutch Shell (“Shell”) discussed in this presentation represent a currently identified inventory of assets and projects held by Shell that may be appropriate for inclusion in SHLX. The assets do not represent a schedule or list of assets to be offered to SHLX by Shell, and we provide no assurance as to if and when the assets shown may be offered to or acquired by SHLX. Shell is under no obligation to offer any of these assets to SHLX, and SHLX is under no obligation to purchase any of these assets. Any transactions would be subject, among other things, to (a) requisite approval and regulatory clearances, including approval by our Conflicts Committee and Board of Directors; (b) an agreement between us and Shell on the terms and conditions of any proposed transaction, and (c) favorable market, regulatory and tax conditions.
Shell Midstream Partners November 16, 2017 2
Note RegardingNon-GAAP Financials
This presentation includes the terms EBITDA and cash available for distribution. EBITDA and cash available for distribution arenon-GAAP supplemental financial measures that management and external users of our consolidated financial statements, such as industry analysts, investors, lenders and rating agencies, may use to assess:
• our operating performance as compared to other publicly traded partnerships in the midstream energy industry, without regard to historical cost basis or, in the case of EBITDA, financing methods;
• the ability of our business to generate sufficient cash to support our decision to make distributions to our unitholders; • our ability to incur and service debt and fund capital expenditures; and
• the viability of acquisitions and other capital expenditure projects and the returns on investment of various investment opportunities.
We believe that the presentation of EBITDA and cash available for distribution provides useful information to management and investors in assessing our financial condition and results of operations. The GAAP measures most directly comparable to EBITDA and cash available for distribution are net income and net cash provided by operating activities. Thesenon-GAAP measures should not be considered as alternatives to GAAP net income or net cash provided by operating activities. EBITDA and cash available for distribution have important limitations as analytical tools because they exclude some but not all items that affect net income and net cash provided by operating activities. They should not be considered in isolation or as substitutes for analysis of our results as reported under GAAP.
Additionally, because EBITDA and cash available for distribution may be defined differently by other companies in our industry, our definition of EBITDA and cash available for distribution may not be comparable to similarly titled measures of other companies, thereby diminishing their utility. References in this presentation to EBITDA refer to net income before income taxes, net interest expense, gain or loss from disposition of fixed assets, allowance oil reduction to net realizable value, and depreciation, accretion and amortization. References to cash available for distribution refer to (i) EBITDA attributable to SHLX, (ii) plus cash distributed to SHLX from equity investments for the applicable period, and less income from equity investments, (iii) less maintenance capital expenditures attributable to SHLX, net interest paid, cash reserves and income taxes paid, plus net adjustments from volume deficiency payments attributable to SHLX and certainone-time payments not received in net income. Cash available for distribution will not reflect changes in working capital balances.
With respect to the runway of potential acquisitions from our Sponsor discussed in this presentation, projected EBITDA shown means projected earnings before net interest expense, taxes, and depreciation and amortization for such asset during its peak forecasted annual cash flow. SHLX management considered a number of factors for each asset on the runway, including income qualification, potential commercial terms, expected capital requirements, geographic location, estimated operating costs and expected asset performance over a longer period of time. The range of projected EBITDA represents the maximum estimated amount management believes could be realized from potential acquisitions, and is calculated regardless of the date SHLX could acquire the asset in question. Projections are inherently uncertain and actual results and timing of asset acquisition may differ materially.
In addition, we are unable to provide a reconciliation of our forward-looking estimate of projected EBITDA for these assets to the most comparable GAAP financial measure of projected Cash Flow from Operations, because certain information needed to project Cash Flow from Operations on these assets is difficult to estimate and is dependent on future events which are uncertain or outside of our control, including valuation timing, negotiated commercial terms with asset customers, customer utilization of the assets, and the timing and level maintenance capital spending. Any of these factors, alone or combined with a number of other factors, could have a significant impact on projected Cash Flow from Operations. Therefore, the reconciliations of projected EBITDA to projected Cash Flow from Operations is not available without unreasonable effort.
Shell Midstream Partners November 16, 2017 3
John Hollowell
Chief Executive Officer
Shell Midstream Partners November 16, 2017 4
Agenda 01 Shell Midstream Partners: Delivery to Date
02 Key Differentiator: Size and Scale of Sponsor
03 US Business Presence & Midstream Growth Opportunities
04 Updated Runway & Growth Expectations
05 Current Financial Performance
06 Distribution Guidance
07 Q&A
08 Portfolio-Focused Breakout Sessions
Shell Midstream Partners November 16, 2017 5
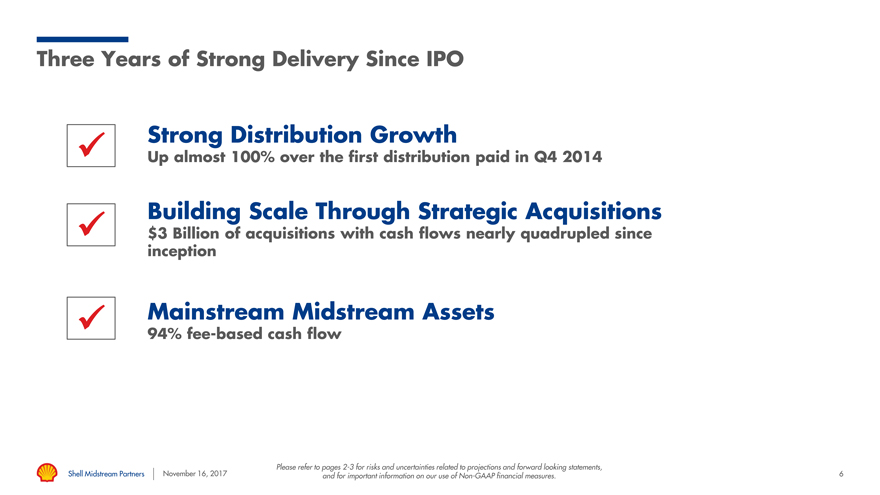
Three Years of Strong Delivery Since IPO
 Strong Distribution Growth
Up almost 100% over the first distribution paid in Q4 2014
Building Scale Through Strategic Acquisitions
 $3 Billion of acquisitions with cash flows nearly quadrupled since inception
 Mainstream Midstream Assets
94%fee-based cash flow
Please refer to pages2-3 for risks and uncertainties related to projections and forward looking statements,
Shell Midstream Partners November 16, 2017 and for important information on our use ofNon-GAAP financial measures. 6
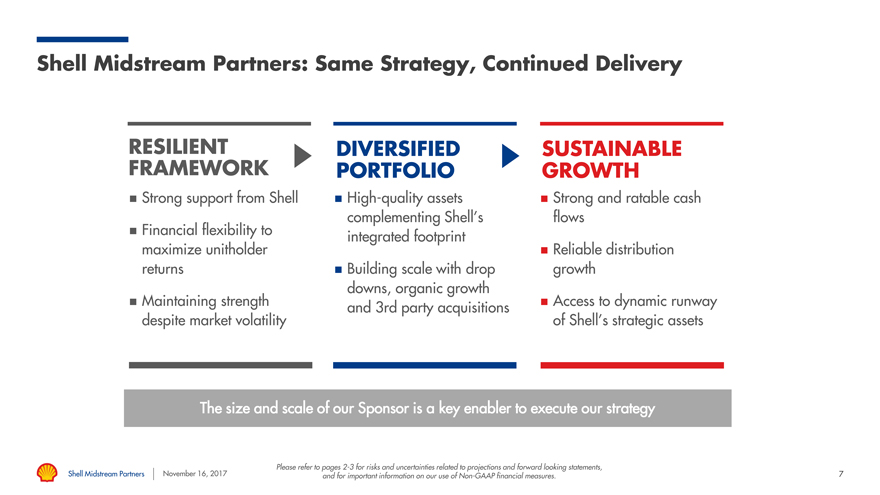
Shell Midstream Partners: Same Strategy, Continued Delivery
RESILIENT DIVERSIFIED SUSTAINABLE FRAMEWORK PORTFOLIO GROWTH
ï® Strong support from Shell ï® High-quality assets ï® Strong and ratable cash complementing Shell’s flows
ï® Financial flexibility to integrated footprint maximize unitholder ï® Reliable distribution returns ï® Building scale with drop growth downs, organic growth ï® Maintaining strength and 3rd party acquisitions ï® Access to dynamic runway despite market volatility of Shell’s strategic assets
The size and scale of our Sponsor is a key enabler to execute our strategy
Please refer to pages2-3 for risks and uncertainties related to projections and forward looking statements,
Shell Midstream Partners November 16, 2017 and for important information on our use ofNon-GAAP financial measures. 7
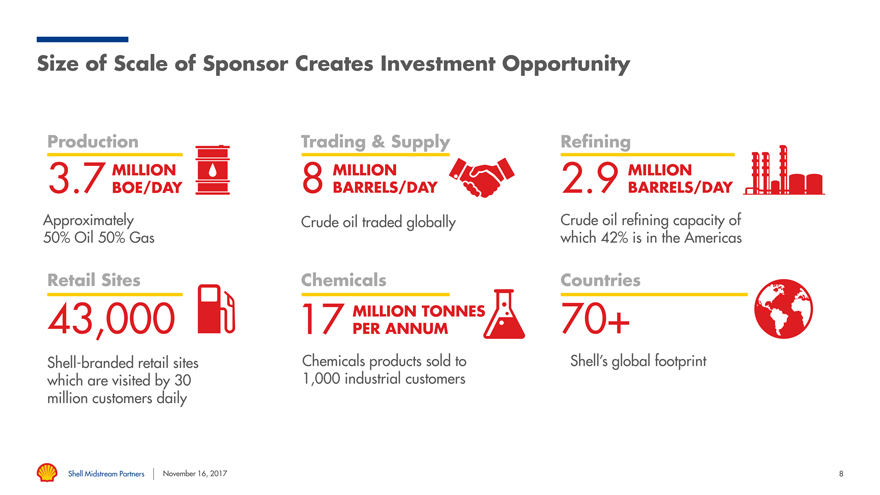
Size of Scale of Sponsor Creates Investment Opportunity
Production Trading & Supply Refining
MILLION MILLION MILLION
3.7 BOE/DAY 8 BARRELS/DAY 2.9 BARRELS/DAY
Approximately Crude oil traded globally Crude oil refining capacity of 50% Oil 50% Gas which 42% is in the Americas
Retail Sites Chemicals Countries
43,000 MILLION TONNES 70+
17 PER ANNUM
Shell-branded retail sites Chemicals products sold to Shell’s global footprint which are visited by 30 1,000 industrial customers million customers daily
Shell Midstream Partners November 16, 2017 8
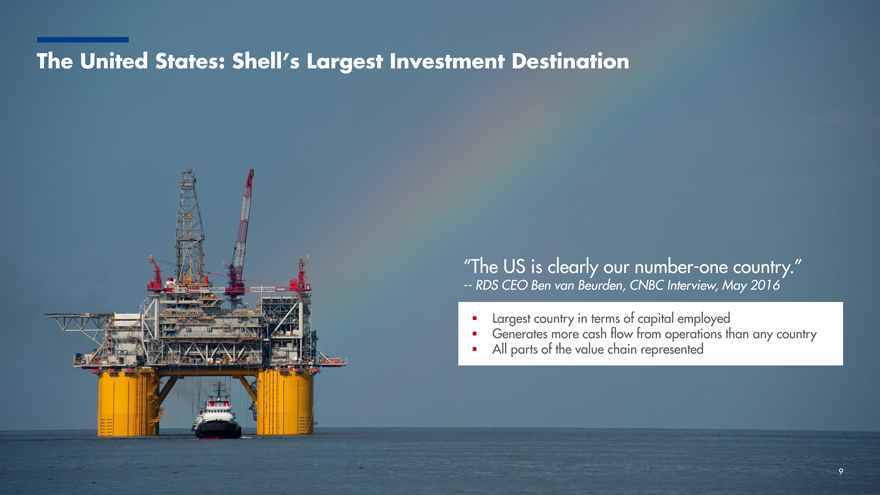
The United States: Shell’s Largest Investment Destination
“The US is clearly ournumber-one country.”
— RDS CEO Ben van Beurden, CNBC Interview, May 2016
ï,§ Largest country in terms of capital employed
ï,§ Generates more cash flow from operations than any country ï,§ All parts of the value chain represented
9
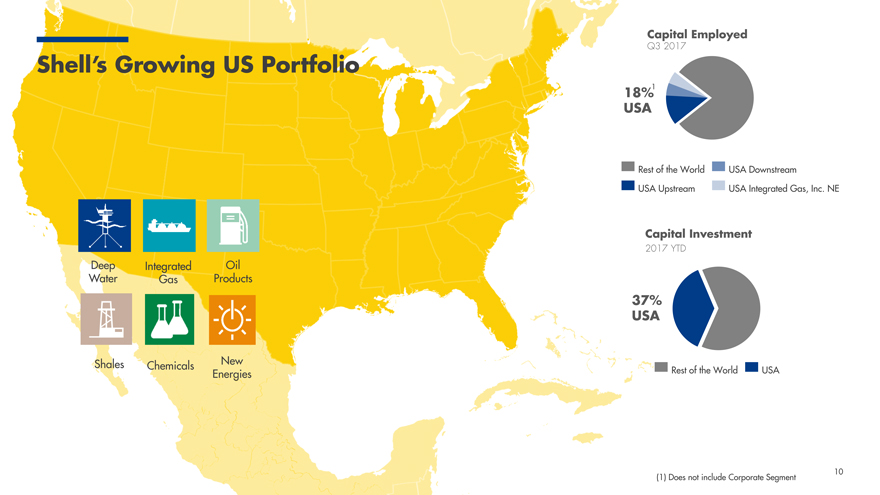
Capital Employed
Shell’s Growing US Portfolio Q3 2017
18%1 USA
Rest of the World USA Downstream
USA Upstream USA Integrated Gas, Inc. NE
Capital Investment
2017 YTD
Deep Integrated Oil Water Gas Products
37% USA
Shales Chemicals New Rest the World USA Energies of
10
(1) Does not include Corporate Segment
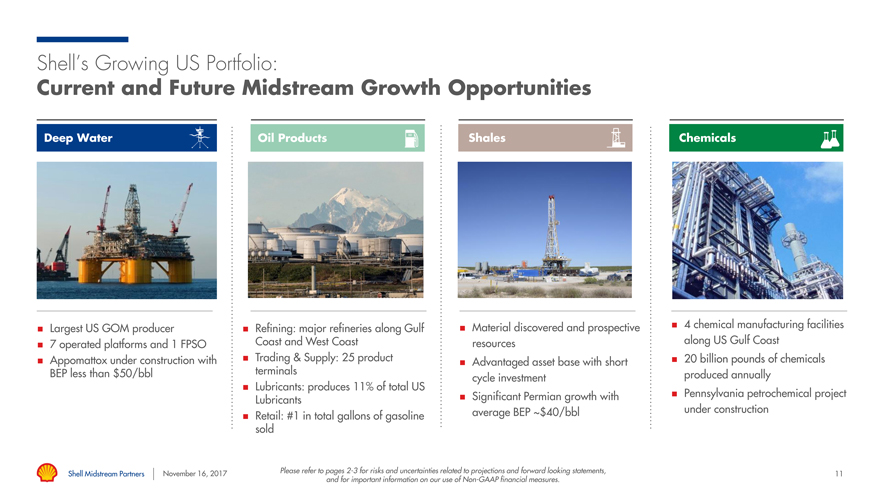
Shell’s Growing US Portfolio:
Current and Future Midstream Growth Opportunities
Deep Water Oil Products Shales Chemicals
ï® Material discovered and prospective ï® 4 chemical manufacturing facilities ï® Largest US GOM producer ï® Refining: major refineries along Gulf 7 and 1 Coast and West Coast resources along US Gulf Coast ï® operated platforms FPSO
ï® Appomattox under construction with ï® Trading & Supply: 25 product short ï® 20 billion pounds of chemicals ï® Advantaged asset base with BEP less than $50/bbl terminals produced annually cycle investment ï® Lubricants: produces 11% of total US
ï® Significant Permian growth with ï® Pennsylvania petrochemical project Lubricants average BEP ~$40/bbl under construction ï® Retail: #1 in total gallons of gasoline sold
Shell Midstream Partners November 16, 2017 Please refer to pages2-3 for risks and uncertainties related to projections and forward looking statements, 11 and for important information on our use ofNon-GAAP financial measures.
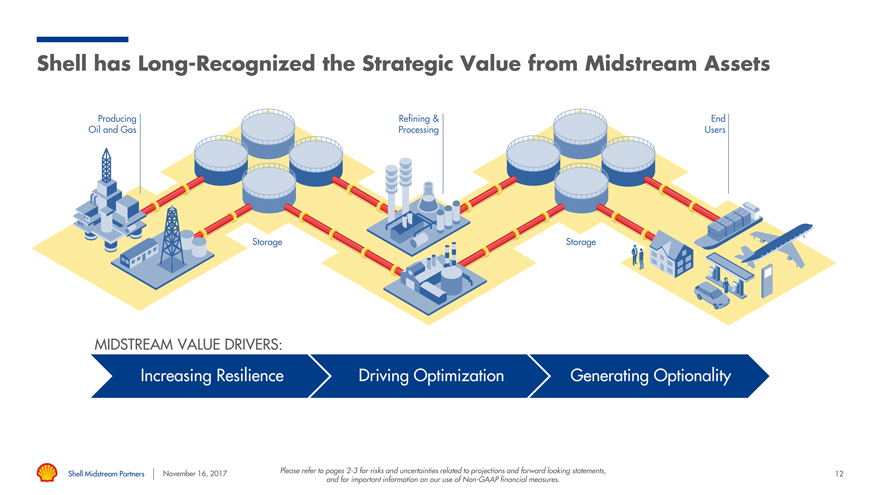
Shell has Long-Recognized the Strategic Value from Midstream Assets
Producing Refining & End Oil and Gas Processing Users
Storage Storage
MIDSTREAM VALUE DRIVERS:
Increasing Resilience Driving Optimization Generating Optionality
Shell Midstream Partners November 16, 2017 Please refer to pages2-3 for risks and uncertainties related to projections and forward looking statements, 12 and for important information on our use ofNon-GAAP financial measures.
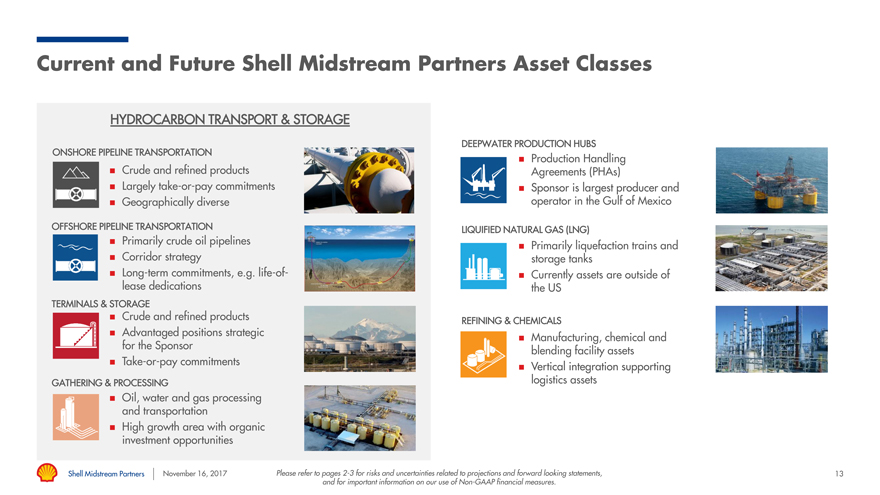
Current and Future Shell Midstream Partners Asset Classes
HYDROCARBON TRANSPORT & STORAGE
DEEPWATER PRODUCTION HUBS ONSHORE PIPELINE TRANSPORTATION
ï® Production Handling ï® Crude and refined products Agreements (PHAs)
ï® Largelytake-or-pay commitments ï® Sponsor is largest producer and ï® Geographically diverse operator in the Gulf of Mexico
OFFSHORE PIPELINE TRANSPORTATION
LIQUIFIED NATURAL GAS (LNG)
ï® Primarily crude oil pipelines Primarily
Corridor strategyï® liquefaction trains and ï® storage tanks ï® Long-term commitments, e.g.life-of-ï® Currently assets are outside of lease dedications the US
TERMINALS & STORAGE
ï® Crude and refined products REFINING & CHEMICALS
ï® Advantaged positions strategic Manufacturing, chemical and
ï®
for the Sponsor blending facility assets
ï®Take-or-pay commitments Vertical supporting ï® integration
GATHERING & PROCESSING logistics assets
ï® Oil, water and gas processing and transportation ï® High growth area with organic investment opportunities
Shell Midstream Partners November 16, 2017 Please refer to pages2-3 for risks and uncertainties related to projections and forward looking statements, 13 and for important information on our use ofNon-GAAP financial measures.
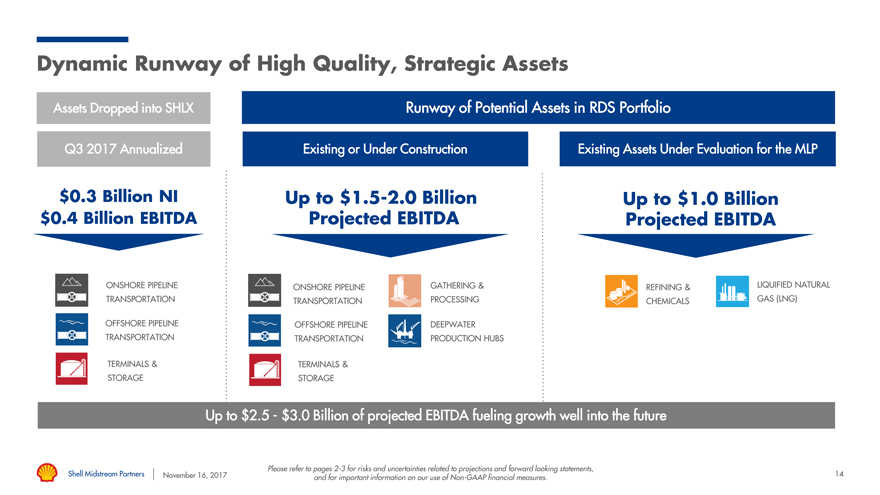
Dynamic Runway of High Quality, Strategic Assets
Assets Dropped into SHLX Runway of Potential Assets in RDS Portfolio
Q3 2017 Annualized Existing or Under Construction Existing Assets Under Evaluation for the MLP
$0.3 Billion NI Up to$1.5-2.0 Billion Up to $1.0 Billion $0.4 Billion EBITDA Projected EBITDA Projected EBITDA
ONSHORE PIPELINE ONSHORE PIPELINE GATHERING & REFINING & LIQUIFIED NATURAL TRANSPORTATION TRANSPORTATION PROCESSING CHEMICALS GAS (LNG)
OFFSHORE PIPELINE OFFSHORE PIPELINE DEEPWATER
TRANSPORTATION TRANSPORTATION PRODUCTION HUBS
TERMINALS & TERMINALS & STORAGE STORAGE
Up to $2.5—$3.0 Billion of projected EBITDA fueling growth well into the future
Please refer to pages2-3 for risks and uncertainties related to projections and forward looking statements,
Shell Midstream Partners November 16, 2017 and for important information on our use ofNon-GAAP financial measures. 14
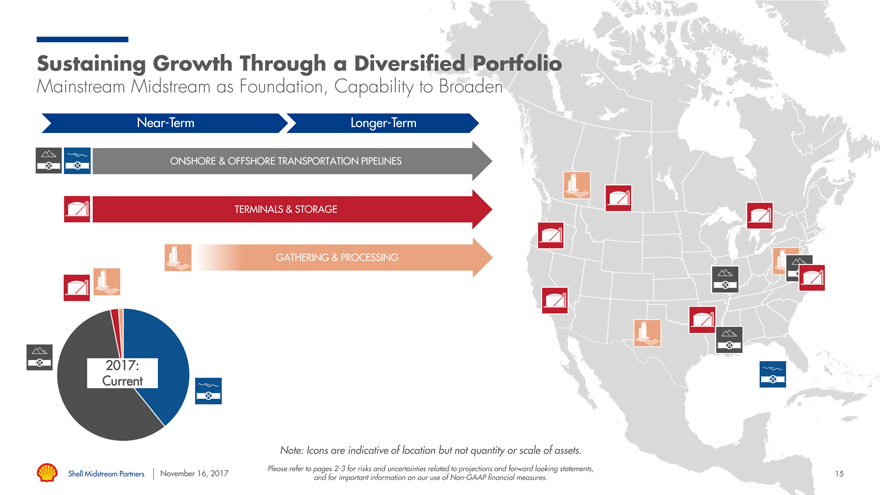
Sustaining Growth Through a Diversified Portfolio
Mainstream Midstream as Foundation, Capability to Broaden
Near-Term Longer-Term
ONSHORE & OFFSHORE TRANSPORTATION PIPELINES
TERMINALS & STORAGE
GATHERING & PROCESSING
2017: Current
Note: Icons are indicative of location but not quantity or scale of assets.
Please refer to pages2-3 for risks and uncertainties related to projections and forward looking statements,
Shell Midstream Partners November 16, 2017 15 and for important information on our use ofNon-GAAP financial measures.
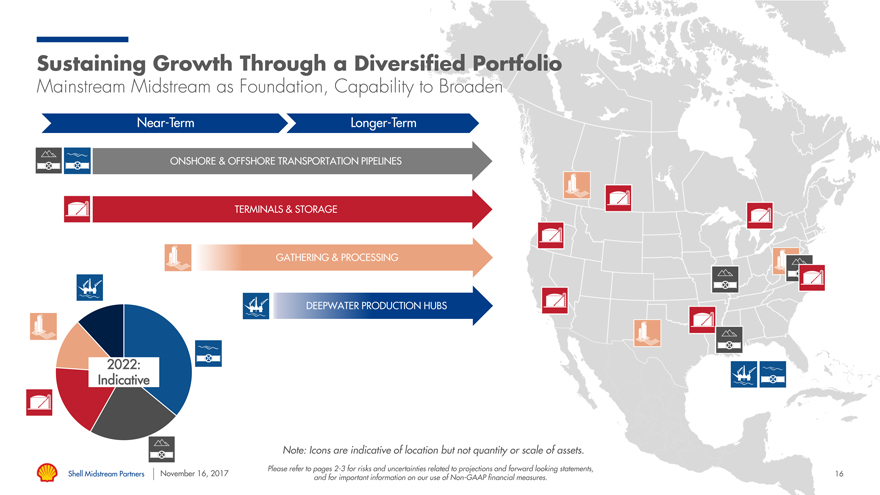
Sustaining Growth Through a Diversified Portfolio
Mainstream Midstream as Foundation, Capability to Broaden
Near-Term Longer-Term
ONSHORE & OFFSHORE TRANSPORTATION PIPELINES
TERMINALS & STORAGE
GATHERING & PROCESSING
DEEPWATER PRODUCTION HUBS
2022: Indicative
Note: Icons are indicative of location but not quantity or scale of assets.
Please refer to pages2-3 for risks and uncertainties related to projections and forward looking statements,
Shell Midstream Partners November 16, 2017 16 and for important information on our use ofNon-GAAP financial measures.
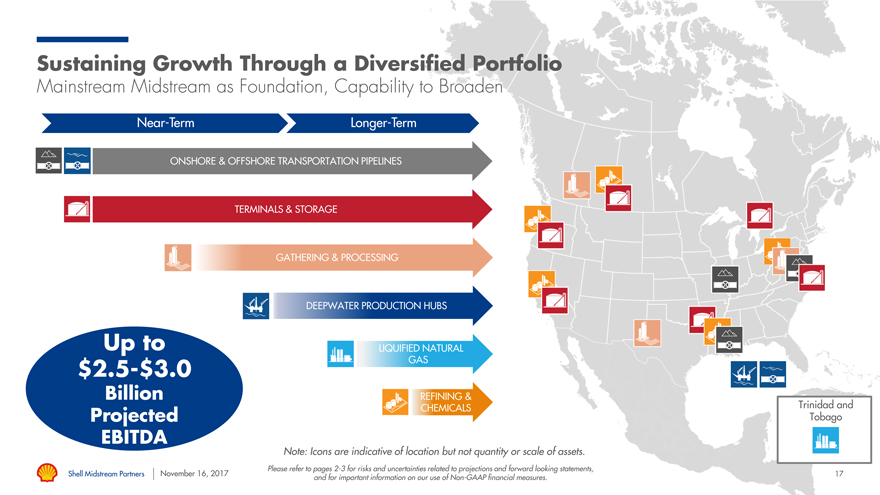
Sustaining Growth Through a Diversified Portfolio
Mainstream Midstream as Foundation, Capability to Broaden
Near-Term Longer-Term
ONSHORE & OFFSHORE TRANSPORTATION PIPELINES
TERMINALS & STORAGE
GATHERING & PROCESSING
DEEPWATER PRODUCTION HUBS
Up to LIQUIFIED NATURAL
$2.5-$3.0 GAS
Billion REFINING &
CHEMICALS Trinidad and
Projected Tobago EBITDA
Note: Icons are indicative of location but not quantity or scale of assets.
Please refer to pages2-3 for risks and uncertainties related to projections and forward looking statements,
Shell Midstream Partners November 16, 2017 17 and for important information on our use ofNon-GAAP financial measures.
Shawn Carsten
Chief Financial Officer
Shell Midstream Partners November 16, 2017 18
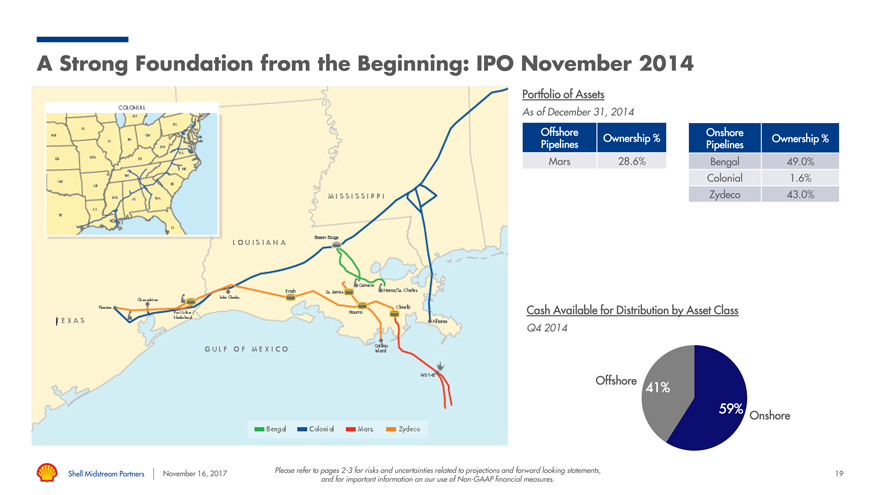
A Strong Foundation from the Beginning: IPO November 2014
Portfolio of Assets
As of December 31, 2014
Offshore Onshore
Ownership % Ownership % Pipelines Pipelines Mars 28.6% Bengal 49.0% Colonial 1.6% Zydeco 43.0%
Cash Available for Distribution by Asset Class
Q4 2014
Offshore 41%
59%
Onshore
Shell Midstream Partners November 16, 2017 Please refer to pages2-3 for risks and uncertainties related to projections and forward looking statements, 19 and for important information on our use ofNon-GAAP financial measures.
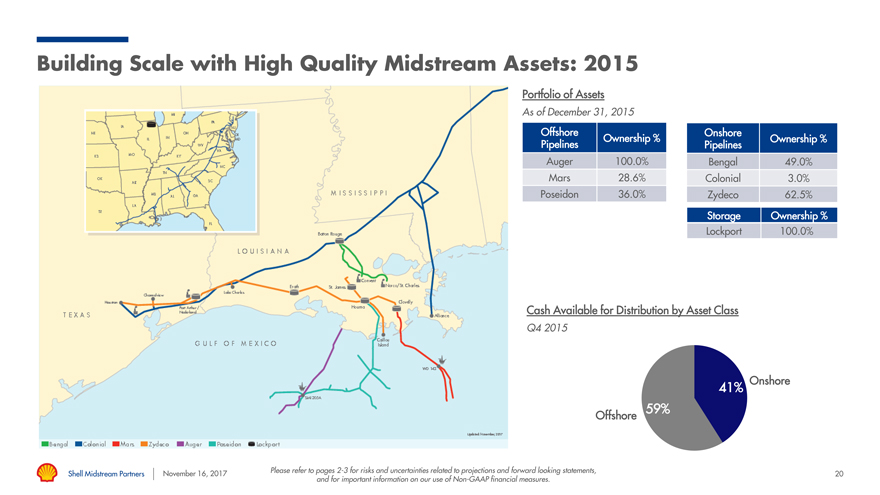
Building Scale with High Quality Midstream Assets: 2015
Portfolio of Assets
As of December 31, 2015
Offshore Onshore
Ownership % Ownership % Pipelines Pipelines
Auger 100.0% Bengal 49.0% Mars 28.6% Colonial 3.0%
Poseidon 36.0% Zydeco 62.5% Storage Ownership % Lockport 100.0%
Cash Available for Distribution by Asset Class
Q4 2015
Onshore
41% 59%
Offshore
Shell Midstream Partners November 16, 2017 Please refer to pages2-3 for risks and uncertainties related to projections and forward looking statements, 20 and for important information on our use ofNon-GAAP financial measures.
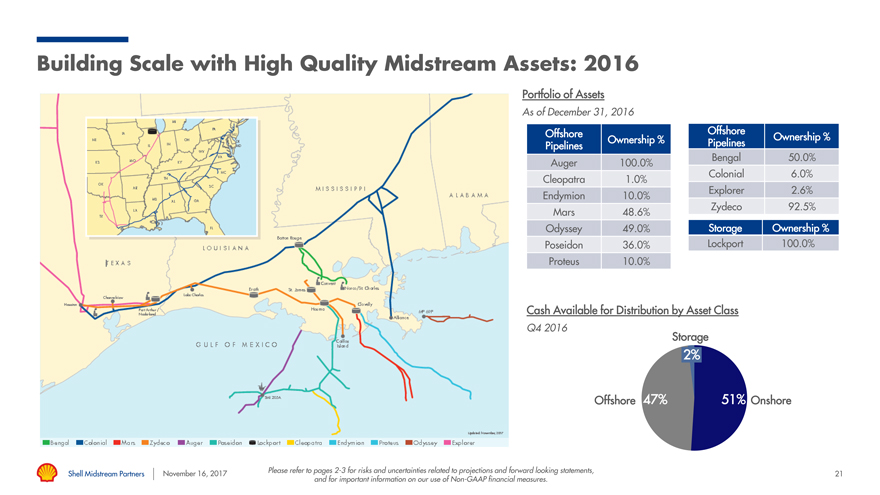
Building Scale with High Quality Midstream Assets: 2016
Portfolio of Assets
As of December 31, 2016
Offshore Offshore
Ownership % Ownership % Pipelines Pipelines Bengal 50.0% Auger 100.0% Colonial 6.0% Cleopatra 1.0% Explorer 2.6% Endymion 10.0% Zydeco 92.5%
Mars 48.6%
Odyssey 49.0% Storage Ownership % Poseidon 36.0% Lockport 100.0% Proteus 10.0%
Cash Available for Distribution by Asset Class
Q4 2016
Storage
2%
Offshore 47% 51% Onshore
Shell Midstream Partners November 16, 2017 Please refer to pages2-3 for risks and uncertainties related to projections and forward looking statements, 21 and for important information on our use ofNon-GAAP financial measures.
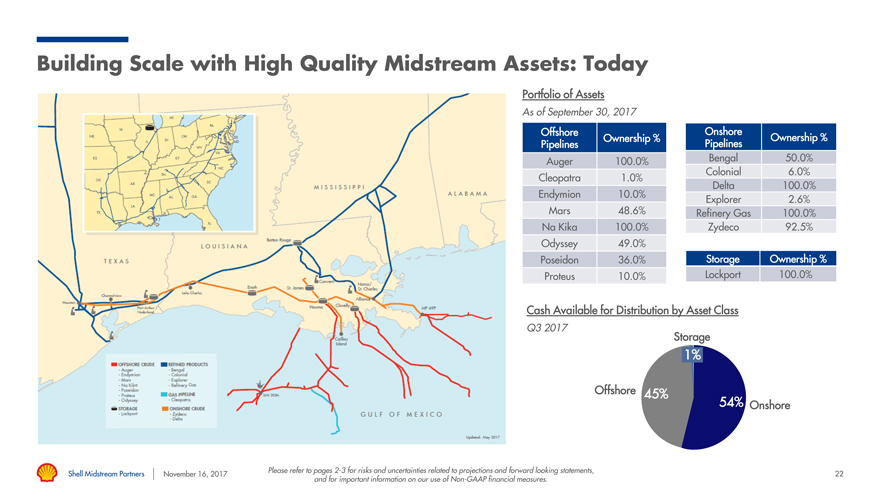
Building Scale with High Quality Midstream Assets: Today
Portfolio of Assets
As of September 30, 2017
Offshore Onshore
Ownership % Ownership % Pipelines Pipelines
Auger 100.0% Bengal 50.0%
Colonial 6.0% Cleopatra 1.0% Delta 100.0% Endymion 10.0% Explorer 2.6% Mars 48.6% Refinery Gas 100.0% Na Kika 100.0% Zydeco 92.5%
Odyssey 49.0%
Poseidon 36.0% Storage Ownership % Proteus 10.0% Lockport 100.0%
Cash Available for Distribution by Asset Class
Q3 2017
Storage
1%
Offshore 45% 54%
Onshore
Shell Midstream Partners Please refer to pages2-3 for risks and uncertainties related to projections and forward looking statements, 22
November 16, 2017 and for important information on our use ofNon-GAAP financial measures.
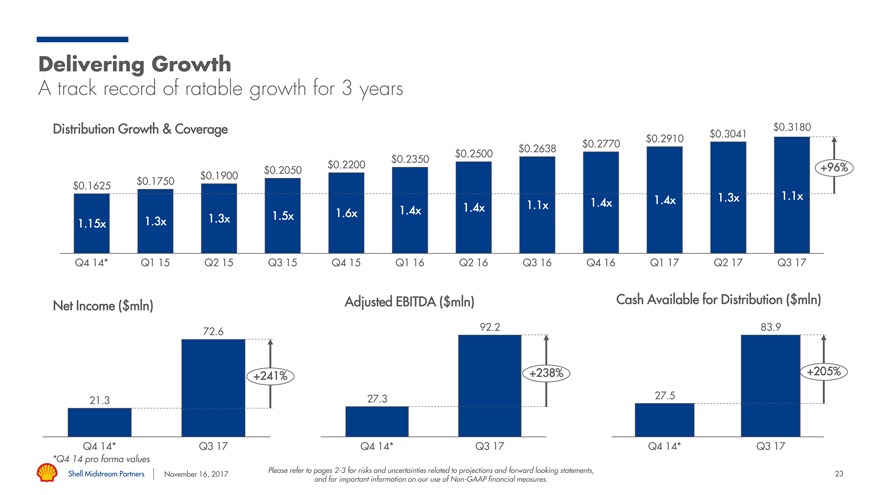
Delivering Growth
A track record of ratable growth for 3 years
Distribution Growth & Coverage $0.3180
$0.2770 $0.2910 $0.3041
$0.2638
$0.2500
$0.2350
$0.2200 +96%
$0.2050
$0.1900
$0.1625 $0.1750
1.4x 1.3x 1.1x
1.4x 1.1x 1.4x
1.6x 1.4x
1.3x 1.5x
1.15x 1.3x
Q4 14* Q1 15 Q2 15 Q3 15 Q4 15 Q1 16 Q2 16 Q3 16 Q4 16 Q1 17 Q2 17 Q3 17
Net Income ($mln) Adjusted EBITDA ($mln) Cash Available for Distribution ($mln)
72.6 92.2 83.9
+241% +238% +205%
21.3 27.3 27.5
Q4 14* Q3 17 Q4 14* Q3 17 Q4 14* Q3 17
*Q4 14 pro forma values
Shell Midstream Partners Please refer to pages2-3 for risks and uncertainties related to projections and forward looking statements, 23
November 16, 2017 and for important information on our use ofNon-GAAP financial measures.
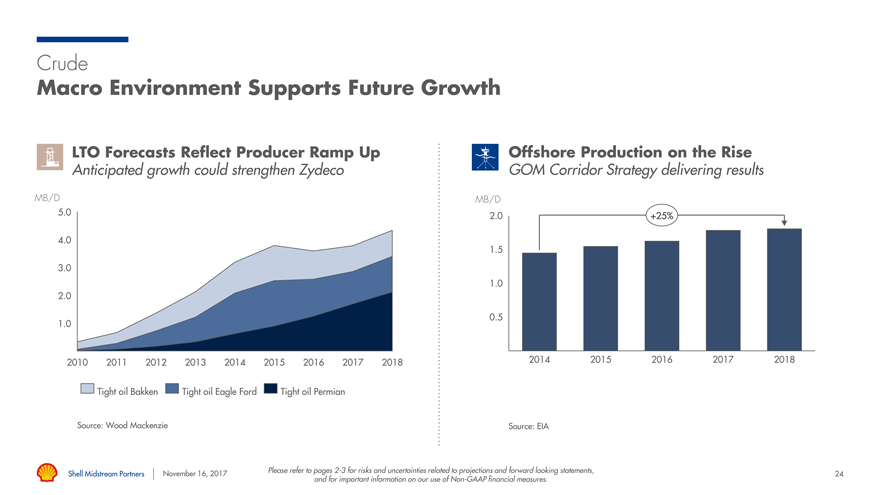
Crude
Macro Environment Supports Future Growth
LTO Forecasts Reflect Producer Ramp Up Offshore Production on the Rise
Anticipated growth could strengthen Zydeco GOM Corridor Strategy delivering results
MB/D MB/D
5.0 2.0 +25%
4.0 1.5
3.0
1.0
2.0
0.5
1.0
2010 2011 2012 2013 2014 2015 2016 2017 2018 2014 2015 2016 2017 2018
Tight oil Bakken Tight oil Eagle Ford Tight oil Permian
Source: Wood Mackenzie Source: EIA
Shell Midstream Partners November 16, 2017 Please refer to pages2-3 for risks and uncertainties related to projections and forward looking statements, 24 and for important information on our use ofNon-GAAP financial measures.
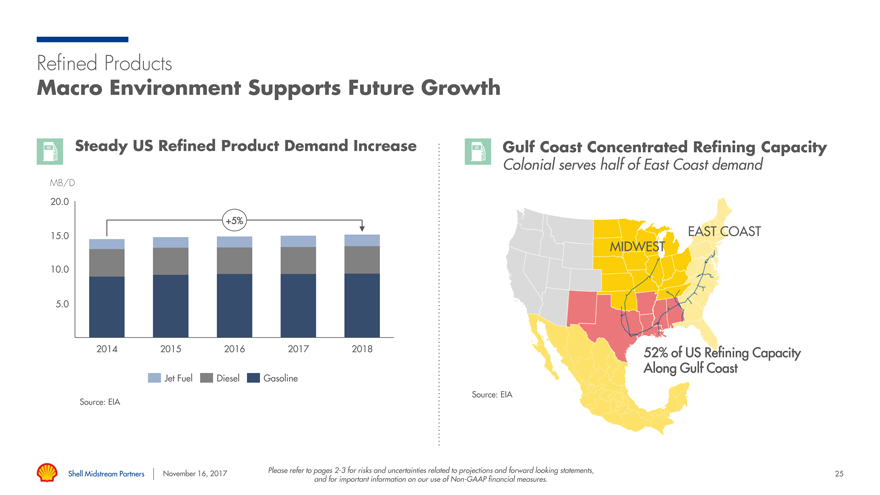
Refined Products
Macro Environment Supports Future Growth
Steady US Refined Product Demand Increase Gulf Coast Concentrated Refining Capacity
Colonial serves half of East Coast demand
MB/D
20.0
+5%
15.0 EAST COAST M
10.0
5.0
2014 2015 2016 2017 2018 52% of US Refining Capacity
Jet Fuel Diesel Gasoline Along Gulf Coast
Source: EIA Source: EIA
Shell Midstream Partners November 16, 2017 Please refer to pages2-3 for risks and uncertainties related to projections and forward looking statements, 25 and for important information on our use ofNon-GAAP financial measures.
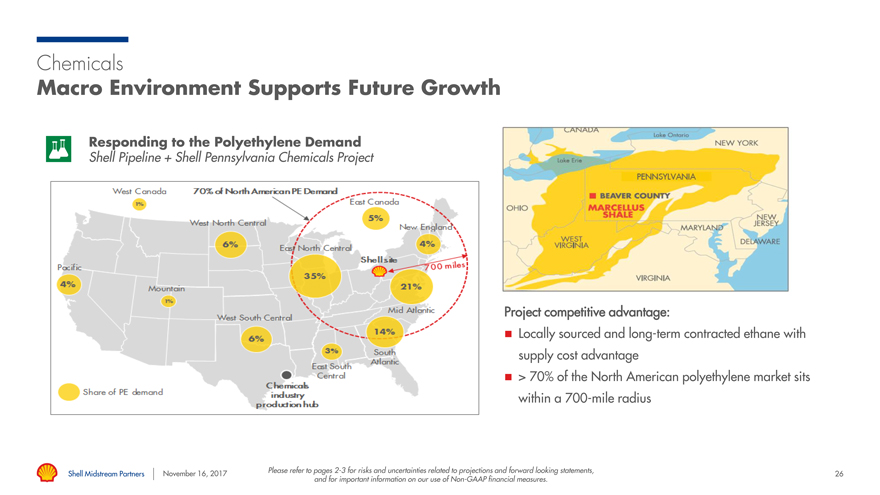
Chemicals
Macro Environment Supports Future Growth
Responding to the Polyethylene Demand
Shell Pipeline + Shell Pennsylvania Chemicals Project
Project competitive advantage:
ï® Locally sourced and long-term contracted ethane with supply cost advantage ï® > 70% of the North American polyethylene market sits within a700-mile radius
Shell Midstream Partners November 16, 2017 Please refer to pages2-3 for risks and uncertainties related to projections and forward looking statements, 26 and for important information on our use ofNon-GAAP financial measures.
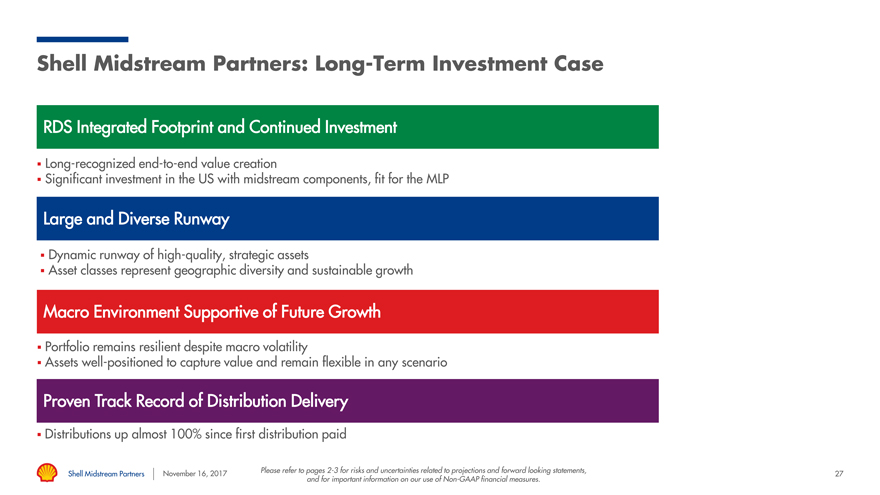
Shell Midstream Partners: Long-Term Investment Case
RDS Integrated Footprint and Continued Investment
ï,§ Long-recognizedend-to-end value creation
ï,§ Significant investment in the US with midstream components, fit for the MLP
Large and Diverse Runway35-40%
ï,§ Dynamic runway of high-quality, strategic assets
ï,§ Asset classes represent geographic diversity and sustainable growth
Macro Environment Supportive of Future Growth
ï,§ Portfolio remains resilient despite macro volatility
ï,§ Assets well-positioned to capture value and remain flexible in any scenario
Proven Track Record of Distribution Delivery
ï,§ Distributions up almost 100% since first distribution paid
Shell Midstream Partners November 16, 2017 Please refer to pages2-3 for risks and uncertainties related to projections and forward looking statements, 27 and for important information on our use ofNon-GAAP financial measures.
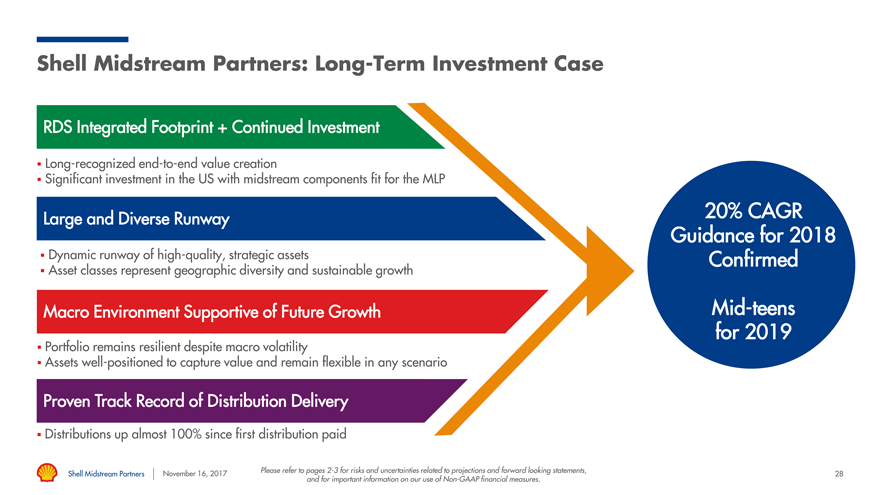
Shell Midstream Partners: Long-Term Investment Case
RDS Integrated Footprint + Continued Investment
ï,§ Long-recognizedend-to-end value creation
ï,§ Significant investment in the US with midstream components fit for the MLP
Large and Diverse Runway35-40% 20% CAGR
Guidance for 2018
ï,§ Dynamic runway of high-quality, strategic assets 2018-2019 Confirmed ï,§ Asset classes represent geographic diversity and sustainable growth
Target
Macro Environment Supportive of Future Growth DistributionMid-teens
for Growth 2019
ï,§ Portfolio remains resilient despite macro volatility
ï,§ Assets well-positioned to capture value and remain flexible in any scenario
Proven Track Record of Distribution Delivery
ï,§ Distributions up almost 100% since first distribution paid
Shell Midstream Partners November 16, 2017 Please refer to pages2-3 for risks and uncertainties related to projections and forward looking statements, 28 and for important information on our use ofNon-GAAP financial measures.

Questions and Answers
Shell Midstream Partners November 16, 2017 29
Kevin Nichols
VP Commercial
Shell Midstream Partners November 16, 2017 30
Deep Dive Roundtables
Capturing the Full Value Chain in the Permian
Jan Sherman
VP Commercial & Land, Shell Unconventionals
Optimizing Value through Trading & Supply
Odeh Khoury
VP Products Americas, Shell Trading & Supply
Owning the Major Corridors in the Gulf of Mexico
Kevin Nichols
VP Commercial, Shell Pipeline
Shell Midstream Partners November 16, 2017 31
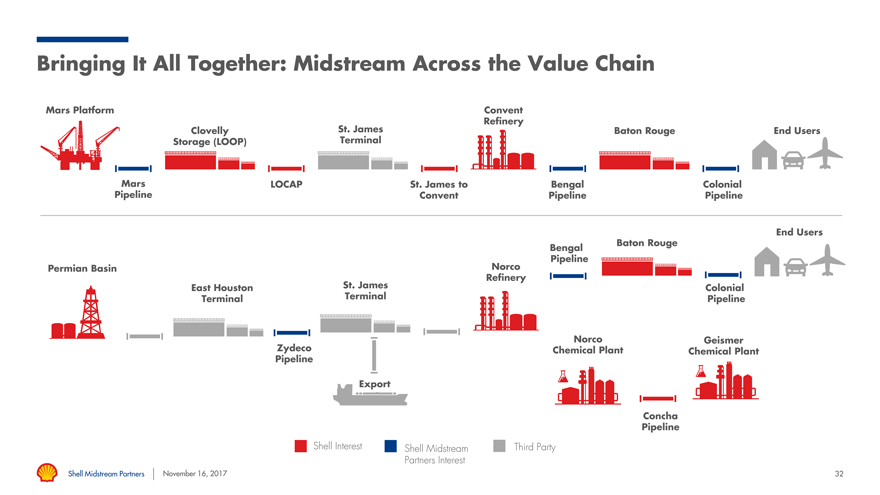
Bringing It All Together: Midstream Across the Value Chain
Mars Platform Convent Refinery
Clovelly St. James Baton Rouge End Users Storage (LOOP) Terminal
Mars LOCAP St. James to Bengal Colonial Pipeline Convent Pipeline Pipeline
End Users Baton Rouge Bengal Pipeline Permian Basin Norco Refinery East Houston St. James Colonial Terminal Terminal Pipeline
Norco Geismer Zydeco Chemical Plant Chemical Plant Pipeline
Export
Concha Pipeline
Shell Interest Shell Midstream Third Party Partners Interest
Shell Midstream Partners November 16, 2017 32

Optimizing Value through Trading & Supply
Odeh Khoury
VP Products Americas, Shell Trading & Supply
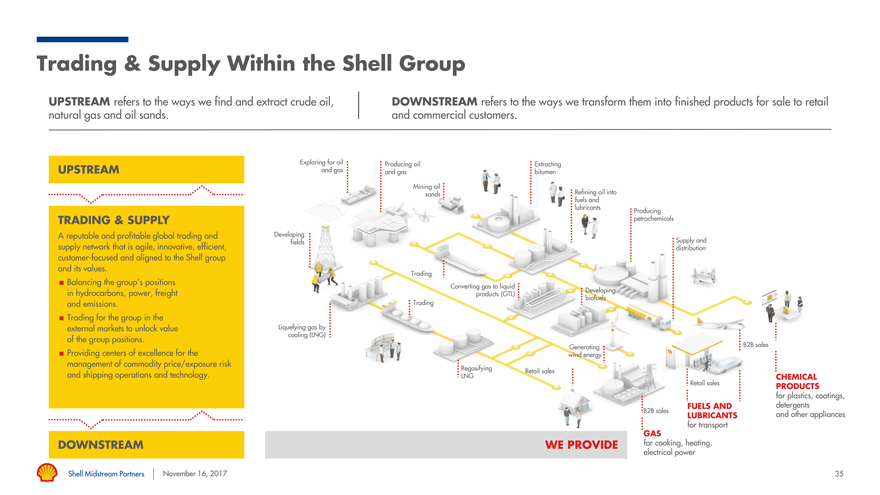
Trading & Supply Within the Shell Group
UPSTREAM refers to the ways we find and extract crude oil, DOWNSTREAM refers to the ways we transform them into finished products for sale to retail natural gas and oil sands. and commercial customers.
Exploring for oil Producing oil Extracting UPSTREAM and gas and gas bitumen Mining oil sands Refining oil into fuels and lubricants
Producing
TRADING & SUPPLY petrochemicals
A reputable and profitable global trading and Developing Supply and
fields
supply network that is agile, innovative, efficient, distribution customer-focused and aligned to the Shell group and its values.
Trading
¼ Balancing the group’s positions
Converting gas to liquid
in hydrocarbons, power, freight Developing
products (GTL) biofuels
and emissions. Trading ¼ Trading for the group in the external markets to unlock value Liquefying gas by
cooling (LNG)
of the group positions.
Generating B2B sales
¼ Providing centers of excellence for the wind energy management of commodity price/exposure risk
Regasifying Retail sales
and shipping operations and technology. LNG CHEMICAL
Retail sales PRODUCTS for plastics, coatings, FUELS AND detergents B2B sales and other appliances
LUBRICANTS for transport
GAS
DOWNSTREAM WE PROVIDE for cooking, heating,
electrical power
Shell Midstream Partners November 16, 2017 35
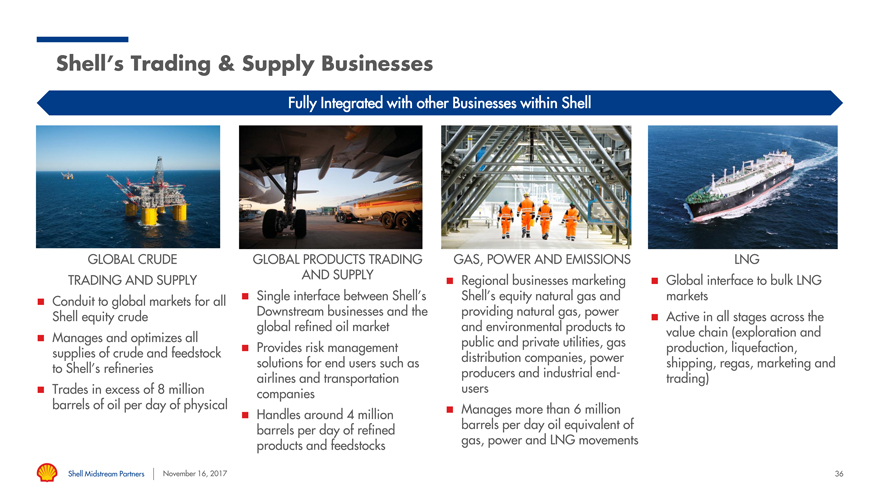
Shell’s Trading & Supply Businesses
Fully Integrated with other Businesses within Shell
GLOBAL CRUDE GLOBAL PRODUCTS TRADING GAS, POWER AND EMISSIONS LNG TRADING AND AND SUPPLY
SUPPLY ï® Regional businesses marketing ï® Global interface to bulk LNG Conduit to global markets all ï® Single interface between Shell’s Shell’s equity natural gas and markets
ï® for
Shell equity Downstream businesses and the providing natural gas, power the crudeï® Active in all stages across global refined oil market and environmental products to value chain (exploration and ï® Manages and optimizes all public and private utilities, gas supplies of crude and feedstock ï® Provides risk management production, liquefaction, solutions for end users such as distribution companies, power shipping, regas, marketing and to Shell’s refineries producers and industrialend-airlines and transportation trading) ï® Trades in excess of 8 million companies users barrels of oil per day of physical ï® Manages more than 6 million ï® Handles around 4 million barrels per day of refined barrels per day oil equivalent of products and feedstocks gas, power and LNG movements
Shell Midstream Partners November 16, 2017 36
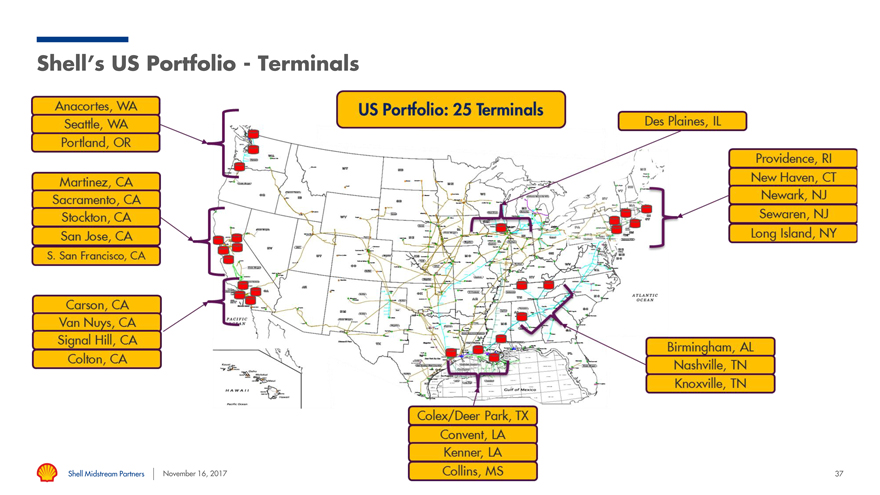
Shell’s US Portfolio—Terminals
US Terminals – Strategic and Reliable
ï,§ Strategically Positioned Assets to Support: ï,§ Integrated supply with Shell refineries
ï,§ Connection to large Shell branded marketing presence ï,§ Competitively advantaged terminal infrastructure and logistics
ï,§ Trading connectivity—Terminal access into all US Market Trading Hubs (West Coast, Gulf Coast, Chicago, NY Harbor) ï,§ Diverse product offering(s)
ï,§ Diverse ‘Modes of Transportation’ optionality
ï,§ 3rd party terminal customer base
ï® Stable“fee-based” Earnings Structure – Consistent performance and profitability in the markets in which these terminals operate ï® High Quality & Well Maintained Assets – Robust Asset Integrity Programs ï® Imbedded Health & Safety Culture – Strong Safety record ï® Compliance – Strong Compliance culture, active monitoring and reporting
Shell Midstream Partners November 16, 2017 38
Owning the Major Corridors in the Gulf of Mexico
Kevin Nichols
VP Commercial, Shell Pipeline
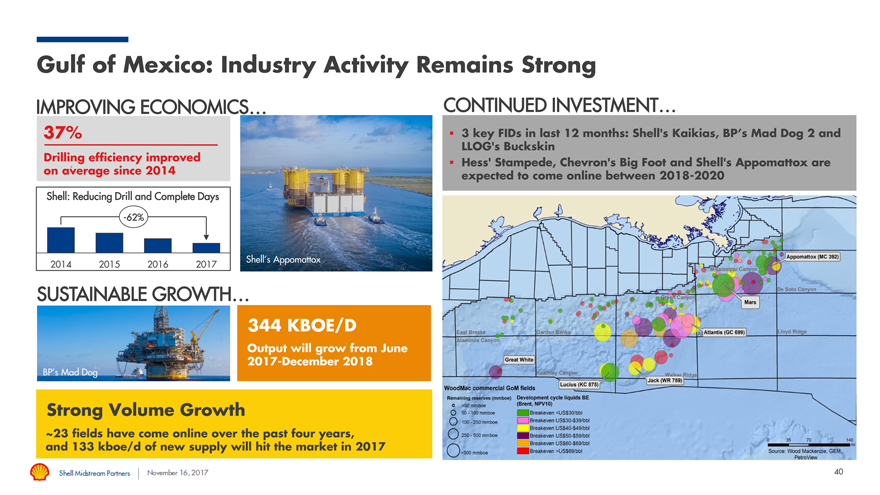
Gulf of Mexico: Industry Activity Remains Strong
IMPROVING ECONOMICS… CONTINUED INVESTMENT…
37% ï,§ 3 key FIDs in last 12 months: Shell’s Kaikias, BP’s Mad Dog 2 and Drilling efficiency improved LLOG’s Buckskin
ï,§ Hess’ Stampede, Chevron’s Big Foot and Shell’s Appomattox are on average since 2014 expected to come online between 2018-2020
Shell: Reducing Drill and Complete Days
-62%
Shell’s Appomattox
2014 2015 2016 2017
SUSTAINABLE GROWTH…
344 KBOE/D
Output will grow from June 2017-December 2018
BP’s Mad Dog
Strong Volume Growth
~23 fields have come online over the past four years, and 133 kboe/d of new supply will hit the market in 2017
40
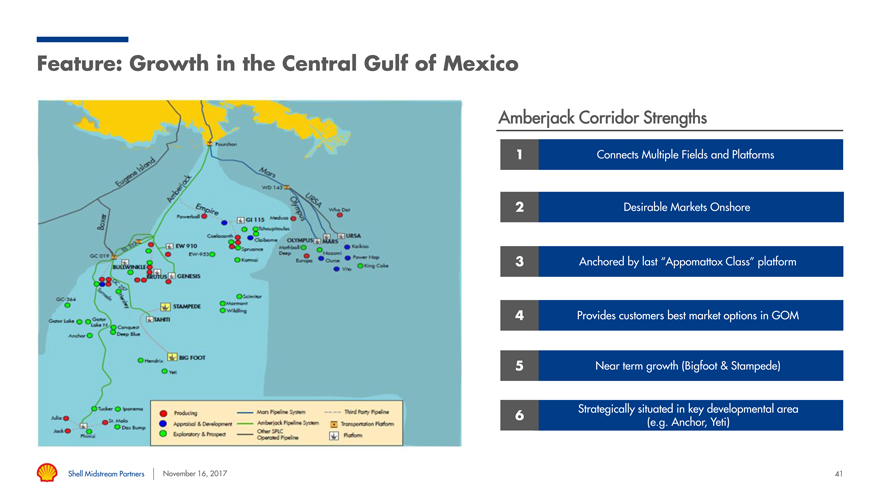
Feature: Growth in the Central Gulf of Mexico
Amberjack Corridor Strengths
1 Connects Multiple Fields and Platforms
2 Desirable Markets Onshore
3 Anchored by last “Appomattox Class” platform
4 Provides customers best market options in GOM
5 Near term growth (Bigfoot & Stampede)
6 Strategically situated in key developmental area (e.g. Anchor, Yeti)
Shell Midstream Partners November 16, 2017 41
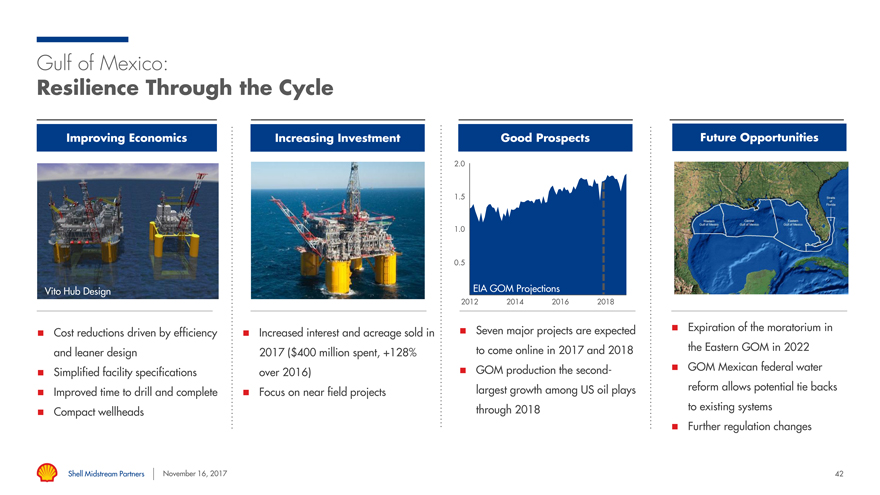
Gulf of Mexico:
Resilience Through the Cycle
Improving Economics Increasing Investment Good Prospects Future Opportunities
2.0
1.5
1.0
0.5
Vito Hub Design EIA GOM Projections
2012 2014 2016 2018
drivenï® Seven major projects are expected ï® Expiration of the moratorium in ï® Cost reductions by efficiency ï® Increased interest and acreage sold in and leaner design 2017 ($400 million spent, +128% to come online in 2017 and 2018 the Eastern GOM in 2022 over 2016)ï® GOM production the second-ï® GOM Mexican federal water ï® Simplified facility specifications largest growth among US oil plays reform allows potential tie backs ï® Improved time to drill and complete ï® Focus on near field projects through 2018 to existing systems ï® Compact wellheads ï® Further regulation changes
Shell Midstream Partners November 16, 2017 42
Capturing the Full Value Chain in the Permian
Jan Sherman
VP Commercial & Land, Shell Unconventionals
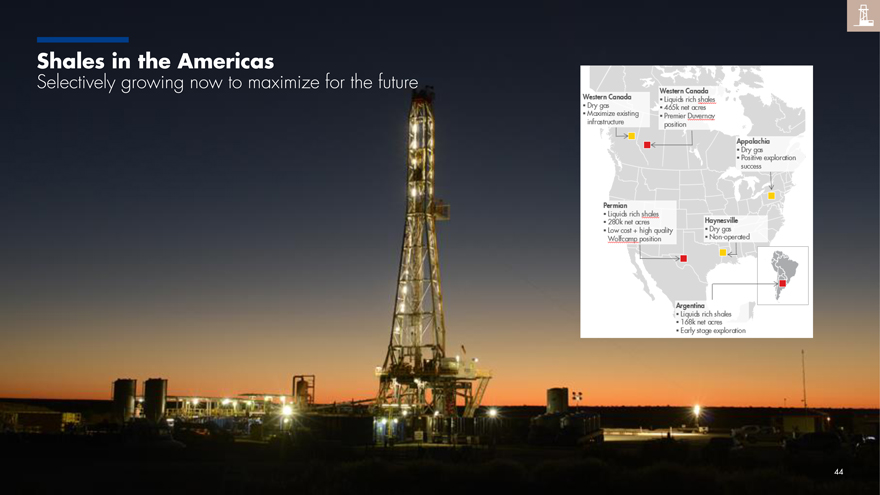
Shales in the Americas
Selectively growing now to maximize for the future
44
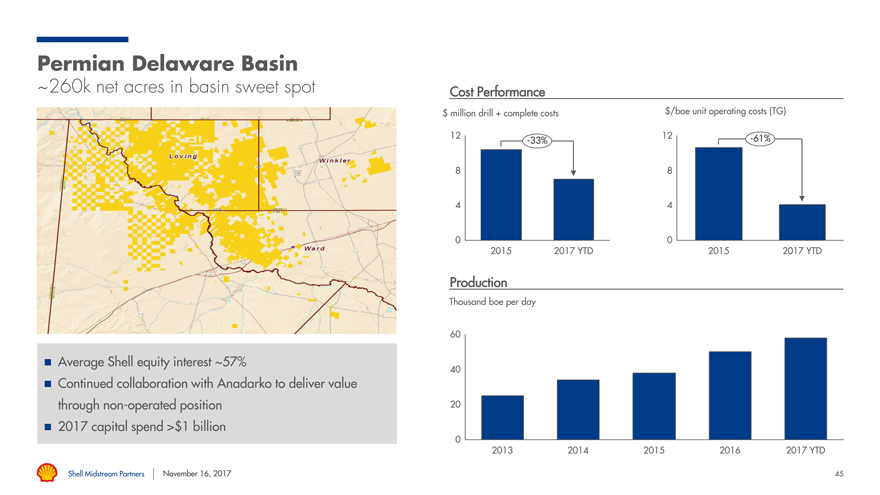
Permian Delaware Basin
~260k net acres in basin sweet spot Cost Performance
$ million drill + complete costs $/boe unit operating costs (TG)
12 12-61%-33%
8 8
4 4
0 0
2015 2017 YTD 2015 2017 YTD
Production
Thousand boe per day
60
ï® Average Shell equity interest ~57%
40
ï® Continued collaboration with Anadarko to deliver value throughnon-operated position 20 ï® 2017 capital spend >$1 billion
0
2013 2014 2015 2016 2017 YTD
Shell Midstream Partners November 16, 2017 45
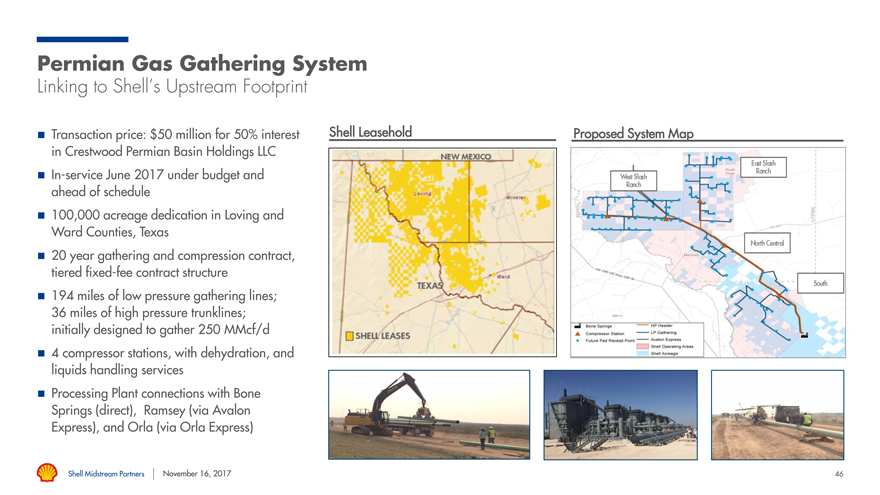
Permian Gas Gathering System
Linking to Shell’s Upstream Footprint
ï® Transaction price: $50 million for 50% interest Shell Leasehold Proposed System Map in Crestwood Permian Basin Holdings LLC
ï®In-service June 2017 under budget and ahead of schedule ï® 100,000 acreage dedication in Loving and Ward Counties, Texas ï® 20 year gathering and compression contract, tieredfixed-fee contract structure ï® 194 miles of low pressure gathering lines; 36 miles of high pressure trunklines; initially designed to gather 250 MMcf/d ï® 4 compressor stations, with dehydration, and liquids handling services ï® Processing Plant connections with Bone Springs (direct), Ramsey (via Avalon Express), and Orla (via Orla Express)
Shell Midstream Partners November 16, 2017 46

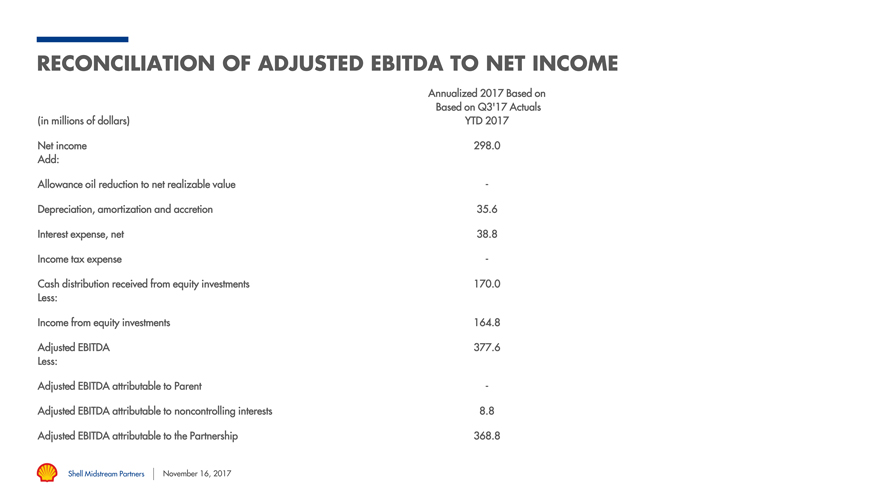
RECONCILIATION OF ADJUSTED EBITDA TO NET INCOME
Annualized 2017 Based on Based on Q3’17 Actuals (in millions of dollars) YTD 2017
Net income 298.0 Add:
Allowance oil reduction to net realizable value— Depreciation, amortization and accretion 35.6 Interest expense, net 38.8 Income tax expense—
Cash distribution received from equity investments 170.0
Less:
Income from equity investments 164.8
Adjusted EBITDA 377.6
Less: Adjusted EBITDA attributable to Parent— Adjusted EBITDA attributable to noncontrolling interests 8.8 Adjusted EBITDA attributable to the Partnership 368.8
Shell Midstream Partners November 16, 2017