UNITED STATES
SECURITIES AND EXCHANGE COMMISSION
Washington, D.C. 20549
_________________
FORM 6-K
REPORT OF FOREIGN PRIVATE ISSUER
PURSUANT TO RULE 13a-16 OR 15d-16 UNDER
THE SECURITIES EXCHANGE ACT OF 1934
Date: August 31, 2023
UBS Group AG
(Registrant's Name)
Bahnhofstrasse 45, 8001 Zurich, Switzerland
(Address of principal executive office)
Commission File Number: 1-36764
UBS AG
(Registrant's Name)
Bahnhofstrasse 45, 8001 Zurich, Switzerland
Aeschenvorstadt 1, 4051 Basel, Switzerland
(Address of principal executive offices)
Commission File Number: 1-15060
Credit Suisse AG
(Registrant's Name)
Paradeplatz 8, 8001 Zurich, Switzerland
(Address of principal executive office)
Commission File Number: 1-33434
Indicate by check mark whether the registrants file or will file annual reports under cover of Form 20-F or Form
40-
F.
Form 20-F
☒
☐
This Form 6-K consists of the 30 June 2023 Pillar 3 Report for UBS Group and significant regulated subsidiaries and
sub-groups, which appears immediately following this page.

Terms used in this report, unless the context requires otherwise
“UBS,” “UBS Group,” “UBS Group AG consolidated,” “Group,” “the Group,” “we,” “us” and “our”
UBS Group AG and its consolidated subsidiaries
“UBS AG” and “UBS AG consolidated”
UBS AG and its consolidated subsidiaries
“Credit Suisse AG” and “Credit Suisse AG consolidated”
Credit Suisse AG and its consolidated subsidiaries
“Credit Suisse Group“ and “Credit Suisse Group AG consolidated”
Pre-acquisition Credit Suisse Group
”Credit Suisse”
Credit Suisse AG and its consolidated subsidiaries, Credit Suisse
Services AG and other small former Credit Suisse Group entities now
directly held by UBS Group AG
“UBS Group AG” and “UBS Group AG standalone”
UBS Group AG on a standalone basis
“Credit Suisse Group AG” and “Credit Suisse Group AG standalone”
Credit Suisse Group AG on a standalone basis
“UBS AG standalone”
UBS AG on a standalone basis
“Credit Suisse AG standalone”
Credit Suisse AG on a standalone basis
“UBS Switzerland AG” and “UBS Switzerland AG standalone”
UBS Switzerland AG on a standalone basis
“UBS Europe SE consolidated”
UBS Europe SE and its consolidated subsidiaries
“UBS Americas Holding LLC” and “UBS Americas Holding LLC consolidated”
UBS Americas Holding LLC and its consolidated subsidiaries
“1m”
One million, i.e., 1,000,000
“1bn”
One billion, i.e., 1,000,000,000
“1trn”
One trillion, i.e., 1,000,000,000,000
In this report, unless the context requires otherwise, references to any gender shall apply to all genders.
Table of contents
UBS Group
4
Section 1
6
Section 2
9
Section 3
10
Section 4
22
Section 5
28
Section 6
33
Section 7
38
Section 8
44
Section 9
Total loss-absorbing capacity
45
Section 10
48
Section 11
51
Section 12
Significant regulated subsidiaries and sub-groups
52
Section 1
53
Section 2
57
Section 3
61
Section 4
68
Section 5
69
Section 6
71
Section 7
75
Section 8
79
Section 9
83
Section 10
87
Section 11
89
Section 12
Appendix
91
93
Contacts
General inquiries
ubs.com/contact
Zurich +41-44-234 1111
London +44-207-567 8000
New York +1-212-821 3000
Hong Kong SAR +852-2971 8888
Singapore +65-6495 8000
Investor Relations
UBS’s Investor Relations team
manages relationships with
institutional investors, research
analysts and credit rating agencies.
ubs.com/investors
Zurich +41-44-234 4100
New York +1-212-882 5734
Media Relations
UBS’s Media Relations team
manages relationships with global
media and journalists.
ubs.com/media
Zurich +41-44-234 8500
mediarelations@ubs.com
London +44-20-7567 4714
ubs-media-relations@ubs.com
New York +1-212-882 5858
mediarelations@ubs.com
Hong Kong SAR +852-2971 8200
sh-mediarelations-ap@ubs.com
Office of the Group Company
Secretary
The Group Company Secretary
handles inquiries directed to the
Chairman or to other members
of the Board of Directors.
UBS Group AG, Office of the
Group Company Secretary
P.O. Box, CH-8098 Zurich,
Switzerland
sh-company-secretary@ubs.com
Zurich +41-44-235 6652
Shareholder Services
UBS’s Shareholder Services team,
a unit of the Group Company
Secretary’s office, manages
relationships with shareholders and
the registration of UBS Group AG
registered shares.
UBS Group AG, Shareholder Services
P.O. Box, CH-8098 Zurich,
Switzerland
sh-shareholder-services@ubs.com
Zurich +41-44-235 6652
US Transfer Agent
For global registered share-related
inquiries in the US.
Computershare Trust Company NA
P.O. Box 505000
Louisville, KY 40233-5000, USA
Shareholder online inquiries:
www-us.computershare.com/
investor/contact
Shareholder website:
computershare.com/investor
Calls from the US
+1-866-305-9566
Calls from outside the US
+1-781-575-2623
TDD for hearing impaired
+1-800-231-5469
TDD for foreign shareholders
+1-201-680-6610
Imprint
Publisher: UBS Group AG, Zurich, Switzerland | ubs.com
Language: English
© UBS 2023. The key symbol and UBS are among the registered and
unregistered trademarks of UBS. All rights reserved.
30 June 2023 Pillar 3 Report |
UBS Group | Introduction and basis for preparation 4
UBS Group
Introduction and basis for preparation
Scope of Basel III Pillar 3 disclosures
The Basel Committee on Banking Supervision (the BCBS) Basel III capital adequacy framework consists of three
complementary pillars. Pillar 1 provides a framework for measuring minimum capital requirements for the credit, market,
operational and non-counterparty-related risks faced by banks. Pillar 2 addresses the principles of the supervisory review
process, emphasizing the need for a qualitative approach to supervising banks. Pillar 3 requires banks to publish a range
of disclosures, mainly covering risk, capital, leverage, liquidity and remuneration.
This report provides Pillar 3 disclosures for the UBS Group, including the acquired Credit Suisse Group, and prudential
key figures and regulatory information for UBS AG consolidated and standalone, UBS Switzerland AG standalone,
UBS Europe SE consolidated, and UBS Americas Holding LLC consolidated, as well as Credit Suisse AG consolidated and
standalone, Credit Suisse (Schweiz) AG consolidated and standalone, Credit Suisse International standalone, and Credit
Suisse Holdings (USA), Inc. consolidated in the respective sections under “Significant regulated subsidiaries and sub-
groups.”
This Pillar 3 Report has been prepared in accordance with Swiss Financial Market Supervisory Authority (FINMA) Pillar 3
disclosure requirements (FINMA Circular 2016/1 “Disclosure – banks”) as revised on 8 December 2021, the underlying
BCBS guidance “Revised Pillar 3 disclosure requirements” issued in January 2015, the “Frequently asked questions on
the revised Pillar 3 disclosure requirements” issued in August 2016, the “Pillar 3 disclosure requirements – consolidated
and enhanced framework” issued in March 2017 and the subsequent “Technical Amendment – Pillar 3 disclosure
requirements – regulatory treatment of accounting provisions” issued in August 2018.
As UBS is considered a systemically relevant bank (an SRB) under Swiss banking law, UBS Group AG, UBS AG, Credit
Suisse AG and Credit Suisse (Schweiz) AG are required to comply with regulations based on the Basel III framework as
applicable to Swiss SRBs on a consolidated basis.
Local regulators may also require the publication of Pillar 3 information at a subsidiary or sub-group level. Where
applicable, these local disclosures are provided under “Holding company and significant regulated subsidiaries and sub-
groups” at
ubs.com/investors
.
Significant regulatory developments, disclosure requireme nts and other changes
Introduction of a public liquidity backstop in Switzerland
In May 2023, the Swiss Federal Council (the SFC) launched a consultation on the introduction of a public liquidity
backstop (the PLB) for systemically important banks (SIBs) which was initially implemented as part of the emergency
ordinance issued in connection with Credit Suisse Group. The proposed legislative changes aim to establish the PLB
instrument as part of ordinary law in order to enable the Swiss government and the Swiss National Bank to support an
SIB domiciled in Switzerland with liquidity in the process of resolution, in line with other financial centers. The introduction
of the PLB is intended to increase the confidence of market participants in the ability of SIBs to become successfully
recapitalized and remain solvent in a crisis. The final proposal is expected to be presented to the Swiss Parliament by the
SFC in September 2023, and, if adopted, legislative changes are expected to come into force by January 2025.
Further developments regarding the acquisition of Credit Suisse Group by UBS
The Swiss Federal Department of Finance (the FDF) is undertaking a review of the circumstances that led to the acquisition
of the Credit Suisse Group by UBS. In May 2023, it convened a group of experts on banking stability to work on strategic
considerations regarding the role of banks and the national framework related to the stability of the Swiss financial
center. The group of experts is expected to present its findings to the FDF in the third quarter of 2023. The experts’
findings will be considered by the SFC in its bi-annual too-big-to-fail (TBTF) review report by April 2024.
30 June 2023 Pillar 3 Report |
UBS Group | Introduction and basis for preparation 5
Impact of our acquisition of Credit Suisse Group on Basel III Pillar 3 disclosures
On 12 June 2023, UBS Group AG acquired Credit Suisse Group AG, succeeding by operation of Swiss law to all assets
and liabilities of Credit Suisse Group AG, and became the direct or indirect shareholder of all of the former direct and
indirect subsidiaries of Credit Suisse Group AG. UBS has accounted for the acquisition as a business combination under
IFRS 3, Business Combinations, applying the acquisition method of accounting. As part of the acquisition method of
accounting, the assets and liabilities of the Credit Suisse Group have been converted from US generally accepted
accounting principles (GAAP) to International Financial Reporting Standards (IFRS) and have been remeasured at fair value
at the acquisition date. The acquisition of the Credit Suisse Group resulted in a USD
237.7bn increase in RWA. As agreed
with FINMA, the aggregation of the advanced measurement approach (AMA) models considering diversification effects
resulted in a USD 10bn reduction in operational risk RWA in the second quarter of 2023. In addition, UBS Group will be
subject to higher too-big-to-fail capital requirements for market share and total exposure after an appropriate transition
period to be agreed with FINMA. The phase in of the increased capital requirements will commence from the end of
2025 and will be completed by the beginning of 2030 at the latest. We enhanced the Pillar 3 report to include the
following disclosures as a result of that acquisition.
–
CR10 – Specialized lending
–
SEC1 – Securitization exposures in the banking book
–
SEC2 – Securitization exposures in the trading book
–
SEC3 – Securitization exposures in the banking book and associated regulatory capital requirements – bank acting as
originator or as sponsor
–
SEC4 – Securitization exposures in the banking book and associated regulatory capital requirements – bank acting as
investor
–
MR1 – Market risk under standardized approach
–
Significant regulated subsidiaries and sub-groups related to Credit Suisse
›
Refer to the “Acquisition of Credit Suisse Group” section and “Note 2 Acquisition of Credit Suisse Group” in the “Consolidated
financial statements” section of the UBS Group second quarter 2023 report, available under “Quarterly reporting” at
ubs.com/investors
, for more information
Frequency and comparability of Pillar 3 disclosures
FINMA has specified the reporting frequency for each disclosure, as outlined in the “Introduction and basis for
preparation” section of the 31 December 2022 Pillar 3 Report, available under “Pillar 3 disclosures” at
ubs.com/investors
.
In line with the FINMA-specified disclosure frequency and requirements for disclosure with regard to comparative periods,
we provide quantitative comparative information as of 31 March 2023 for disclosures required on a quarterly basis and
as of 31 December 2022 for disclosures required on a semi-annual basis. Where specifically required by FINMA and / or
the BCBS, we disclose comparative information for additional reporting dates.
Where required, movement commentary is aligned with the corresponding disclosure frequency required by FINMA and
always refers to the latest comparative period. Throughout this report, signposts are displayed at the beginning of a
section, table or chart –
Semi-annual |
Quarterly |
triangle symbol –
p
p
›
Refer to the 31 March 2023 Pillar 3 Report, available under “Pillar 3 disclosures” at
ubs.com/investors
, for more information about
previously published quarterly movement commentary
›
Refer to the 31 December 2022 Pillar 3 Report, available under “Pillar 3 disclosures” at
ubs.com/investors
, for more information
about previously published semi-annual movement commentary
30 June 2023 Pillar 3 Report |
UBS Group | Key metrics 6
Key metrics
Key metrics of the second quarter of 2023
Quarterly |
The KM1 and KM2 tables below are based on Basel Committee on Banking Supervision (BCBS) Basel III rules. The
KM2 table includes a reference to the total loss-absorbing capacity (TLAC) term sheet, published by the Financial Stability
Board (the FSB). The FSB provides this term sheet at
fsb.org/2015/11/total-loss-absorbing-capacity-tlac-principles-and-
term-sheet
.
Our capital ratios increased, reflecting an increase in our common equity tier 1 (CET1) capital, partly offset by an increase
in risk-weighted assets (RWA). Our leverage ratio decreased, reflecting an increase in the leverage ratio denominator (the
LRD), largely offset by an increase in our CET1 capital.
Our CET1 capital increased by USD 35.7bn to USD 80.3bn, predominantly due to the acquisition of the Credit Suisse
Group, which resulted in an increase of USD 36.1bn as of the acquisition date (including transitional CET1 purchase price
allocation adjustments of USD 5.0bn as described below).
As part of the acquisition of the Credit Suisse Group, the assets acquired and liabilities assumed, including contingent
liabilities, were recognized at fair value as of the acquisition date in accordance with IFRS 3,
Business Combinations
. The
purchase price allocation (PPA) fair value adjustments required under IFRS 3 are recognized as part of negative goodwill
and include effects on financial instruments measured at amortized cost, such as fair value impacts from interest rates
and own credit, that are expected to accrete back to par through the income statement as the instruments are held to
maturity. Similar own-credit-related effects have also been recognized as part of the PPA adjustments on financial liabilities
measured at fair value. As agreed with the Swiss Financial Market Supervisory Authority (FINMA), a transitional common
equity tier 1 (CET1) capital treatment has been applied for certain of these fair value adjustments, given the substantially
temporary nature of the IFRS-3-accounting-driven effects. As such, IFRS equity reductions of USD 5.9bn (pre-tax) and
USD 5.0bn (net of tax) as of the acquisition date have been neutralized for CET1 capital calculation purposes, of which
USD 1.0bn (net of tax) relate to own-credit-related fair value adjustments. The transitional treatment is subject to linear
amortization and will reduce to nil by 30 June 2027.
Our tier 1 capital increased by USD 35.6bn to USD 93.3bn, predominantly reflecting the aforementioned increase in CET1
capital.
The TLAC available as of 30 June 2023 included CET1 capital, additional tier 1 (AT1) capital and non-regulatory capital
elements of TLAC. Under the Swiss systemically relevant bank framework, including transitional arrangements, TLAC
excludes 45% of the gross unrealized gains on debt instruments measured at fair value through other comprehensive
income for accounting purposes, which for regulatory capital purposes are measured at the lower of cost or market value.
This amount was negligible as of 30 June 2023 but is included as available TLAC in the KM2 table in this section.
Our available TLAC increased by USD 85.7bn to USD 196.0bn, mainly reflecting a USD 52.6bn increase in TLAC -eligible
senior unsecured debt and the aforementioned increase in tier 1 capital, slightly offset by a low-trigger loss-absorbing
tier 2 capital instrument of USD 2.4bn that ceased to be eligible as it had less than one year to maturity. The increase of
USD 52.6bn in TLAC-eligible senior unsecured debt was mainly due to the acquisition of the Credit Suisse Group, as 48
TLAC-eligible senior unsecured debt instruments denominated in US dollars, euro, pounds sterling and yen amounting
to USD 53.5bn equivalent that were originally issued by the Credit Suisse Group were assumed as gone concern capital
by the UBS Group. In addition, there was a USD 2.2bn increase in gone concern capital as the nominal amounts of two
TLAC-eligible senior unsecured debt instruments not bought back under a tender offer were eligible again as gone
concern capital in the second quarter of 2023 following the expiration of the tender offer on 4 April 2023. These effects
were partly offset by calls of three TLAC-eligible unsecured debt instruments denominated in US dollars and Swiss francs
amounting to USD 2.4bn equivalent, and interest rate risk hedge, foreign-currency translation and other effects. On 6 July
2023, UBS announced that it would redeem TLAC-eligible senior unsecured debt on 30 July 2023 (ISINs 144A:
US902613AB45 / Reg S: USH42097BS52 with a nominal amount of USD 1.3bn, issued on 30 July 2020). This instrument
remained eligible as gone concern capital as of 30 June 2023.
RWA increased by USD 234.9bn to USD 556.6bn, primarily due to the acquisition of the Credit Suisse Group, which
resulted in an increase in RWA of USD 237.7bn. Excluding that acquisition, RWA decreased by USD 2.8bn, mainly driven
by decreases of USD 5.0bn in operational risk and USD 1.0bn in market risk RWA, partly offset by increases of USD 1.7bn
in credit risk and USD 0.5bn in counterparty credit risk (CCR) RWA.
30 June 2023 Pillar 3 Report |
UBS Group | Key metrics 7
Leverage ratio exposure increased by USD 663.4bn to USD 1,677.9bn, mainly driven by the acquisition of the Credit
Suisse Group, which resulted in an increase of USD 644.4bn in the LRD. Excluding the acquisition of the Credit Suisse
Group, the LRD increased by USD 19.0bn, mainly driven by higher central bank balances, trading portfolio assets,
securities financing transactions, off-balance sheet exposures and derivative exposures, partly offset by a decrease in
lending assets.
The quarterly average liquidity coverage ratio (the LCR) of the UBS Group increased 13.3 percentage points to 175.2%,
remaining above the prudential requirement communicated by the Swiss Financial Market Supervisory Authority (FINMA).
The movement in the average LCR was primarily driven by an increase in high-quality liquid assets (HQLA) of USD 26.9bn
to USD 257.1bn. This increase was substantially related to Credit Suisse HQLA, which were mainly made up of cash and
government bonds. The increase in HQLA was partly offset by a USD 2.8bn increase in net cash outflows to USD 145.0bn,
predominantly attributable to Credit Suisse’s net cash outflows related to customer deposits, credit commitments and
derivatives. These outflows were partly offset by inflows from loans in Credit Suisse, as well as lower outflows from
deposits and prime brokerage transactions of the UBS Group excluding Credit Suisse.
As of 30 June 2023, the net stable funding ratio (the NSFR) of the UBS Group decreased 0.1 percentage points to
117.6%, remaining above the prudential requirement communicated by FINMA. The NSFR for UBS Group excluding
Credit Suisse improved compared with 31 March 2023 and this effect was offset by the acquisition of the Credit Suisse
Group. Available stable funding increased by USD 316.8bn to USD 873.1bn, predominantly driven by the acquisition of
the Credit Suisse Group, mainly reflecting deposit balances, debt securities issued, regulatory capital and, to a lesser
extent, securities financing transactions. The increase in the UBS Group excluding Credit Suisse was predominantly driven
by higher customer deposits and debt securities issued. Required stable funding increased by USD 269.4bn to
USD 742.1bn, substantially reflecting the acquisition of the Credit Suisse Group. This balance predominantly includes
lending assets and, to a lesser extent, derivative balances and trading portfolio assets. Required stable funding in the UBS
Group excluding Credit Suisse decreased slightly, mainly driven by lower trading assets.
30 June 2023 Pillar 3 Report |
UBS Group | Key metrics 8
KM1: Key metrics
USD m, except where indicated
30.6.23
31.3.23
31.12.22
30.9.22
30.6.22
Available capital (amounts)
1
Common Equity Tier 1 (CET1)
1
80,258
44,590
45,457
44,664
44,798
1a
Fully loaded ECL accounting model CET1
80,258
44,590
45,457
44,664
44,794
2
Tier 1
1
93,287
57,694
58,321
59,359
59,907
2a
Fully loaded ECL accounting model Tier 1
93,287
57,694
58,321
59,359
59,902
3
Total capital
1
93,287
58,182
58,806
59,845
60,401
3a
Fully loaded ECL accounting model total capital
93,287
58,182
58,806
59,845
60,396
Risk-weighted assets (amounts)
4
Total risk-weighted assets (RWA)
556,603
321,660
319,585
310,615
315,685
4a
Minimum capital requirement
2
44,528
25,733
25,567
24,849
25,255
4b
Total risk-weighted assets (pre-floor)
556,603
321,660
319,585
310,615
315,685
Risk-based capital ratios as a percentage of RWA
5
CET1 ratio (%)
1
14.42
13.86
14.22
14.38
14.19
5a
Fully loaded ECL accounting model CET1 ratio (%)
14.42
13.86
14.22
14.38
14.19
6
Tier 1 ratio (%)
1
16.76
17.94
18.25
19.11
18.98
6a
Fully loaded ECL accounting model Tier 1 ratio (%)
16.76
17.94
18.25
19.11
18.98
7
Total capital ratio (%)
1
16.76
18.09
18.40
19.27
19.13
7a
Fully loaded ECL accounting model total capital ratio (%)
16.76
18.09
18.40
19.27
19.13
Additional CET1 buffer requirements as a percentage of RWA
8
Capital conservation buffer requirement (%)
2.50
2.50
2.50
2.50
2.50
9
Countercyclical buffer requirement (%)
0.11
0.09
0.07
0.02
0.02
9a
Additional countercyclical buffer for Swiss mortgage loans (%)
0.30
0.27
0.27
0.26
10
Bank G-SIB and / or D-SIB additional requirements (%)
1.00
1.00
1.00
1.00
1.00
11
Total of bank CET1 specific buffer requirements (%)
3
3.61
3.59
3.57
3.52
3.52
12
CET1 available after meeting the bank’s minimum capital requirements (%)
8.76
9.36
9.72
9.88
9.69
Basel III leverage ratio
13
Total Basel III leverage ratio exposure measure
1,677,877
1,014,446
1,028,461
989,787
1,025,422
14
Basel III leverage ratio (%)
1
5.56
5.69
5.67
6.00
5.84
14a
Fully loaded ECL accounting model Basel III leverage ratio (%)
5.56
5.69
5.67
6.00
5.84
Liquidity coverage ratio (LCR)
4
15
Total high-quality liquid assets (HQLA)
257,107
230,208
238,585
240,420
249,364
16
Total net cash outflow
144,973
142,160
145,972
147,832
155,082
16a
of which: cash outflows
275,298
264,653
262,123
263,699
268,641
16b
of which: cash inflows
130,325
122,493
116,151
115,866
113,559
17
LCR (%)
175.24
161.93
163.72
162.68
160.85
Net stable funding ratio (NSFR)
18
Total available stable funding
873,061
556,270
561,431
533,866
551,877
19
Total required stable funding
742,130
472,662
468,496
443,487
456,328
20
NSFR (%)
117.64
117.69
119.84
120.38
120.94
1 As of 1 July 2022, our capital amounts exclude the transitional relief of recognizing ECL allowances and provisions in CET1 capital in accordance with FINMA Circular 2013/1 “Eligible capital – banks”. 2 Calculated
as 8% of total RWA, based on total capital minimum requirements, excluding CET1 buffer requirements. 3 Excludes non-BCBS capital buffer requirements for risk-weighted positions that are directly or indirectly
backed by residential properties in Switzerland. 4 Calculated after the application of haircuts and inflow and outflow rates, as well as, where applicable, caps on Level 2 assets and cash inflows. Calculated based
on an average of 64 data points in the second quarter of 2023 and 64 data points in the first quarter of 2023. For the prior-quarter data points, refer to the respective Pillar 3 Report, available under “Pillar 3
disclosures” at ubs.com/investors, for more information.
KM2: Key metrics – TLAC requirements (at resolution group level)
1
USD m, except where indicated
30.6.23
31.3.23
31.12.22
30.9.22
30.6.22
1
Total loss-absorbing capacity (TLAC) available
2
1a
Fully loaded ECL accounting model TLAC available
2
Total RWA at the level of the resolution group
3
TLAC as a percentage of RWA (%)
3a
Fully loaded ECL accounting model TLAC as a percentage of fully loaded
ECL accounting model RWA (%)
4
Leverage ratio exposure measure at the level of the resolution group
5
TLAC as a percentage of leverage ratio exposure measure (%)
5a
Fully loaded ECL accounting model TLAC as a percentage of fully loaded
ECL accounting model leverage exposure measure (%)
6a
Does the subordination exemption in the antepenultimate paragraph of
Section 11 of the FSB TLAC Term Sheet apply?
No
6b
Does the subordination exemption in the penultimate paragraph of
Section 11 of the FSB TLAC Term Sheet apply?
No
6c
If the capped subordination exemption applies, the amount of funding
issued that ranks pari passu with excluded liabilities and that is
recognized as external TLAC, divided by funding issued that ranks pari
passu with excluded liabilities and that would be recognized as external
TLAC if no cap was applied (%)
N/A – Refer to our response to 6b.
1 Resolution group level is defined as the UBS Group AG consolidated level. 2 As of 1 July 2022, our capital amounts exclude the transitional relief of recognizing ECL allowances and provisions in CET1 capital in
accordance with FINMA Circular 2013/1 “Eligible capital – banks”.
p
30 June 2023 Pillar 3 Report |
UBS Group | Overview of risk-weighted assets 9
Overview of risk-weighted assets
Overview of RWA and capital requirements
Quarterly |
The OV1 table below provides an overview of our risk-weighted assets (RWA) and the related minimum capital
requirements by risk type. The table presented is based on the respective Swiss Financial Market Supervisory Authority
(FINMA) template and empty rows indicate current non-applicability to UBS.
During the second quarter of 2023, RWA increased by USD 234.9bn to USD 556.6bn, primarily due to the acquisition of
the Credit Suisse Group, which resulted in an increase in RWA of USD 237.7bn. Excluding that acquisition, RWA
decreased by USD 2.8bn, mainly driven by decreases of USD 5.0bn in operational risk and USD 1.0bn in market risk RWA,
partly offset by increases of USD 1.7bn in credit risk and USD 0.5bn in counterparty credit risk (CCR) RWA.
Credit risk RWA increased by USD 121.4bn, primarily driven by the acquisition of the Credit Suisse Group, which resulted
in an increase of USD 119.7bn. Excluding that acquisition, credit risk RWA increased by USD 1.7bn, mainly driven by
increases of USD 1.4bn related to currency effects and USD 0.9bn related to model updates, partly offset by a decrease
of USD 0.6bn related to asset size and other movements. Asset size and other movements decreased RWA by USD 0.6bn,
mainly driven by lower RWA on loans in the Investment Bank and on nostro accounts in Group Functions, partly offset
by higher RWA on loans in in Personal & Corporate Banking and Global Wealth Management.
CCR RWA increased by USD 8.4bn, primarily driven by the acquisition of the Credit Suisse Group, which resulted in an
increase of USD 7.9bn. Excluding that acquisition, CCR RWA increased by USD 0.5bn, primarily due to an increase in
asset size and other movements of 2.0bn , mainly as a result of higher RWA from de rivatives in the Investment Bank,
partly offset by a decrease related to model updates of 1.4bn. The model updates primarily related to the recalibration
of certain multipliers as a result of our improvements to models, as well as updates to the internal model method for
derivatives.
Market risk RWA increased by USD 8.5bn, primarily driven by the acquisition of the Credit Suisse Group, which resulted
in an increase of USD 9.5bn. Excluding that acquisition, market risk RWA decreased by USD 1.0bn, driven by a decrease
from asset size and other movements in the Investment Bank’s Global Markets business and a decrease related to ongoing
parameter updates of the value-at-risk (VaR) model.
Operational risk RWA increased by USD 64.0bn, as a result of the acquisition of the Credit Suisse Group. The aggregation
of the advanced measurement approach (AMA) models considering diversification effects resulted in a USD 10bn
reduction in RWA in the second quarter of 2023. The diversification effects were allocated equally to Group Functions
and Corporate Center (Credit Suisse) for the second quarter of 2023 reporting and will be allocated to the business
divisions and Group Items based on the updated Group allocation methodology in the third quarter of 2023.
The flow tables for credit risk, CCR and market risk RWA in the respective sections of this report provide further details
about the movements in RWA in the second quarter of 2023.
›
Refer to the “Introduction and basis for preparation” section of this report for more information about the regulatory standards
applied
›
Refer to the “Capital management” section of the UBS Group second quarter 2023 report, available under ”Quarterly reporting”
at
ubs.com/investors
, for more information about capital management and RWA, including details regarding movements in RWA
during the second quarter of 2023
30 June 2023 Pillar 3 Report |
UBS Group | Overview of risk-weighted assets 10
OV1: Overview of RWA
RWA
Section or table
reference
Minimum
capital
requirements
1
USD m
30.6.23
31.3.23
31.12.22
30.6.23
1
Credit risk (excluding counterparty credit risk)
2
of which: standardized approach (SA)
CR4
2a
of which: non-counterparty-related risk
CR4
3
of which: foundation internal ratings-based (F-IRB) approach
4
of which: supervisory slotting approach
CR10
5
of which: advanced internal ratings-based (A-IRB) approach
CR6
6
Counterparty credit risk
2
5, CCR1, CCR8
7
of which: SA for counterparty credit risk (SA-CCR)
8
of which: internal model method (IMM)
CCR7
8a
of which: value-at-risk (VaR)
CCR7
9
of which: other CCR
10
Credit valuation adjustment (CVA)
5, CCR2
11
Equity positions under the simple risk-weight approach
4, CR10
12
Equity investments in funds – look-through approach
13
Equity investments in funds – mandate-based approach
14
Equity investments in funds – fallback approach
15
Settlement risk
16
Securitization exposures in banking book
17
of which: securitization internal ratings-based approach (SEC-IRBA)
18
of which: securitization external ratings-based approach (SEC-ERBA), including internal assessment
approach (IAA)
19
of which: securitization standardized approach (SEC-SA)
20
Market Risk
6,7
21
of which: standardized approach (SA)
MR1
22
of which: internal models approach (IMA)
MR2
23
Capital charge for switch between trading book and banking book
3
24
Operational risk
25
Amounts below thresholds for deduction (250% risk weight)
4
25a
26
Floor adjustment
5
27
Total
1 Calculated based on 8% of RWA. 2 Excludes settlement risk, which is separately reported in line 15 “Settlement risk.” Includes RWA with central counterparties. The split between the sub-components of
counterparty credit risk refers to the calculation of the exposure measure. 3 Not applicable until the implementation of the final rules on the minimum capital requirements for market risk (the Fundamental Review
of the Trading Book). 4 Includes items subject to threshold deduction treatment that do not exceed their respective threshold and are risk-weighted at 250%. Items subject to threshold deduction treatment include
significant investments in common shares of non-consolidated financial institutions (banks, insurance and other financial entities) and deferred tax assets arising from temporary differences. 5 A floor adjustment is
required when 80% of our Basel I RWA, including the RWA equivalent of the Basel I capital deductions, exceeds our Basel III RWA, including the RWA equivalent of the Basel III capital deductions. The Credit Suisse
Group and the UBS Group were not impacted by the Basel I floor prior to the merger. We do not expect the UBS Group to be subject to a Basel I Floor adjustment going forward.
p
Credit risk
Introduction
Semi-annual |
The parameters applied under the advanced internal ratings-based (A-IRB) approach are generally based on the
same methodologies, data and systems we use for internal credit risk quantification, except where certain treatments are
specified by regulatory requirements. These include, for example, the application of regulatory prescribed floors and
multipliers, and differences with respect to eligibility criteria and exposure definitions. The exposure information presented
in this section may thus differ from our internal management view disclosed in the “Risk management and control”
sections of the quarterly and annual reports. Similarly, the regulatory capital prescribed measure of credit risk exposure
also differs from how it is defined under International Financial Reporting Standards (IFRS).
p
Credit quality of assets
Semi-annual |
The CR1 table below provides a breakdown of defaulted and non-defaulted loans, debt securities and off-
balance sheet exposures. The table includes a split of expected credit loss (ECL) accounting provisions based on the
standardized approach and the internal ratings-based approach.
Increases in net carrying values of Loans and Debt securities, when compared with 31 December 2022, are explained in
the CR3 table in this report. The net carrying value of Off-balance sheet exposures increased by USD 68.5bn to
USD 127.9bn, primarily driven by the acquisition of the Credit Suisse Group, which resulted in an increase of USD 69.9bn.
Excluding that acquisition, Off-balance sheet exposures decreased by USD 1.3bn, primarily related to guarantees in
Personal & Corporate Banking.
›
Refer to the “CR3: Credit risk mitigation techniques – overview” table in this section for more information about the net value
movements related to Loans and Debt securities shown in the table below
›
Refer to “Credit risk” in the “Risk management and control” section of the Annual Report 2022, available under ”Annual
reporting” at
ubs.com/investors
, for more information about the definitions of default and credit impairment and to “Credit risk
exposure categories” in this section for more information about the classification of loans and debt securities
30 June 2023 Pillar 3 Report |
UBS Group | Credit risk 11
CR1: Credit quality of assets
Gross carrying amounts of:
Allowances /
impairments
5
Of which: ECL accounting provisions
for credit losses on SA exposures
Of which: ECL
accounting
provisions for
credit losses on
IRB exposures
Net values
USD m
Defaulted
exposures
1
Non-defaulted
exposures
Allocated in
regulatory
category of
Specific
2
Allocated in
regulatory
category of
General
2
30.6.23
1
Loans
3
2
Debt securities
3
Off-balance sheet exposures
4
4
Total
31.12.22
1
Loans
3
2
Debt securities
3
Off-balance sheet exposures
4
4
Total
1 Defaulted exposures include stage 3 and defaulted purchased credit impaired (PCI) under IFRS 9. Refer to “Note 8 Expected credit loss measurement” in the “Consolidated financial statements” section of the UBS
Group second quarter 2023 for more information about IFRS 9. 2 Specific provisions include stage 3 expected credit loss (ECL) allowances and additional ECL allowances on defaulted PCI assets. General provisions
include stage 1 and 2 ECL allowances and additional ECL allowances on non-defaulted PCI assets. 3 Loan exposure is reported in line with the Pillar 3 definition. Refer to “Credit risk exposure categories” in the
“Credit risk“ section of the 31 December 2022 Pillar 3 Report, available under “Pillar 3 disclosures” at ubs.com/investors, for more information about the classification of loans and debt securities. 4 Off-balance
sheet exposures include unutilized credit facilities, guarantees provided and forward starting loan commitments but exclude prolongations of loans that do not increase the initially committed loan amount. Unutilized
credit facilities exclude unconditionally revocable as well as uncommitted credit facilities, even if they attract RWA. 5 Expected credit loss allowances and provisions amounted to USD 1,868m as of 30 June 2023,
as disclosed in “Note 8 Expected credit loss measurement” in the “Consolidated financial statements” section of the UBS Group second quarter 2023. This Pillar 3 table excludes ECL on securitization on- and off-
balance sheet exposures (30 June 2023: USD 165m; 31 December 2022: n/a), revocable off-balance sheet exposures (30 June 2023: USD 74m; 31 December 2022: USD 40m), ECL on exposures subject to counterparty
credit risk (30 June 2023: USD 5m; 31 December 2022: USD 6m) and ECL on irrevocable committed prolongation of loans that do not give rise to additional credit exposures (30 June 2023: USD 3m; 31 December
2022: USD 2m).
p
Semi-annual |
The CR2 table below presents changes in the stock of defaulted loans, debt securities and off-balance sheet
exposures for the first half of 2023. The total amount of defaulted loans and debt securities was USD 6.0bn as of 30 June
2023, an increase of USD 3.5bn compared with 31 December 2022.
CR2: Changes in stock of defaulted loans, debt securities and off-balance sheet exposures
USD m
For the half year
ended 30.6.23
1
For the half year
ended 31.12.22
1
1
Defaulted loans, debt securities and off-balance sheet exposures as of the beginning of the half year
2
Loans and debt securities that have defaulted since the last reporting period
3
Returned to non-defaulted status
4
Amounts written off
5
Other changes
5a
of which: acquisition of Credit Suisse Group
5b
of which: other
2
6
Defaulted loans, debt securities and off-balance sheet exposures as of the end of the half year
1 Off-balance sheet exposures include unutilized credit facilities, guarantees provided and forward starting loan commitments, but exclude prolongations of loans that do not increase the initially committed loan
amount. Unutilized credit facilities exclude unconditionally revocable and uncommitted credit facilities, even if they attract RWA. 2 Includes primarily partial or full repayments, as well as currency effects.
p
30 June 2023 Pillar 3 Report |
UBS Group | Credit risk 12
Credit risk mitigation
Semi-annual |
secured exposures, with additional information about the security type.
Compared with 31 December 2022, the carrying amount of unsecured loans increased by USD 148.3bn to USD 356.1bn
and unsecured debt securities increased by USD 10.0bn to USD 90.0bn, primarily driven by the acquisition of the Credit
Suisse Group, which resulted in an increase of USD 158.2bn in unsecured loans and USD 11.3bn in unsecured debt
securities. Excluding that acquisition, the carrying amount of unsecured loans decreased by USD 9.8bn to USD 197.9bn,
mainly due to decreases in cash and bank balances at central banks of USD 10.0bn. The carrying amount of unsecured
debt securities decreased by USD 1.3bn to USD 78.7bn, mainly due to high-quality liquid assets (HQLA) maturing.
The carrying amount of partially or fully secured exposures increased by USD 205.7bn to USD 583.7bn, primarily driven
by the acquisition of the Credit Suisse Group, which resulted in an increase of USD 204.4bn. Excluding that acquisition ,
the carrying amount of partially and fully secured exposures increased by USD 1.3bn, mainly as a result of currency effects
in Personal & Corporate Banking.
CR3: Credit risk mitigation techniques – overview
1
Secured portion of exposures partially or fully secured:
USD m
Exposures fully
unsecured: carrying
amount
Exposures partially
or fully secured:
carrying amount
Total: carrying
amount
Exposures secured
by collateral
Exposures secured
by financial
guarantees
Exposures secured
by credit derivatives
30.6.23
1
Loans
2
1a
of which: cash and balances at central
banks
2
Debt securities
3
Total
4
of which: defaulted
31.12.22
1
Loans
2
1a
of which: cash and balances at central
banks
2
Debt securities
3
Total
4
of which: defaulted
1 Exposures in this table represent carrying amounts in accordance with the regulatory scope of consolidation. 2 Loan exposure is reported in line with the Pillar 3 definition. Refer to “Credit risk exposure categories”
in the “Credit risk“ section of the 31 December 2022 Pillar 3 Report, available under “Pillar 3 disclosures” at ubs.com/investors, for more information about the classification of loans and debt securities. 3 Includes
purchased credit-impaired (PCI) positions when defaulted.
p
30 June 2023 Pillar 3 Report |
UBS Group | Credit risk 13
Credit risk under the standardized approach
Introduction
The standardized approach is generally applied where using the A-IRB approach is not feasible. Under the standardized
approach we use, where possible, credit ratings from external credit assessment institutions (ECAIs) to determine the risk
weightings applied to rated counterparties.
Credit risk exposure and credit risk mitigation effects
Semi-annual |
The CR4 table below illustrates the credit risk exposure and effect of credit risk mitigation (CRM) on the
calculation of capital requirements under the standardized approach. Compared with 31 December 2022, exposures
post-credit conversion factors (CCF) and post-CRM increased by USD 102.8bn to USD 173.4bn. RWA increased by
USD 28.9bn to USD 70.8bn, primarily driven by the acquisition of the Credit Suisse Group, which resulted in an increase
of exposures post-CCF and post-CRM by USD 100.7bn and RWA by USD 27.2bn. Excluding that acquisition, exposures
post-CCF and post-CRM increased by USD 2.1bn, and RWA increased by USD 1.7bn.
CR4: Standardized approach – credit risk exposure and credit risk mitigation (CRM) effects
1
Exposures
before CCF and CRM
Exposures
post-CCF and post-CRM
RWA and RWA density
USD m, except where indicated
On-balance
sheet
amount
Off-balance
sheet
amount
Total
On-balance
sheet
amount
Off-balance
sheet
amount
Total
RWA
RWA density
in %
30.6.23
Asset classes
1
Central governments and central banks
2
Banks and securities dealers
3
Public-sector entities and multi-lateral development banks
4
Corporates
2
5
Retail
6
Equity
7
Other assets
7a
of which: non-counterparty related assets
7b
of which: others
8
Total
31.12.22
Asset classes
1
Central governments and central banks
2
Banks and securities dealers
3
Public-sector entities and multi-lateral development banks
4
Corporates
2
5
Retail
6
Equity
7
Other assets
7a
of which: non-counterparty related assets
7b
of which: others
8
Total
1 Exposures in this table represent carrying amounts in accordance with the regulatory scope of consolidation. 2 Loans to corporates secured by residential real estate have been reclassified from asset class Retail
to Corporates. Prior period numbers have been restated accordingly.
p
30 June 2023 Pillar 3 Report |
UBS Group | Credit risk 14
Exposures by asset class and risk weight
Semi-annual |
The CR5 table below shows credit risk exposures under the standardized approach by asset classes and risk
weights applied. Compared with 31 December 2022, exposures increased by USD 102.8bn to USD 173.4bn,
predominantly driven by the acquisition of the Credit Suisse Group, which resulted in an increase of exposures by
USD 100.7bn. Excluding that acquisition, exposures increased by USD 2.1bn, primarily in the Corporates asset class.
CR5: Standardized approach – exposures by asset classes and risk weights
USD m
Risk weight
0%
10%
20%
35%
50%
75%
100%
150%
Others
Total credit
exposures amount
(post-CCF and post-
CRM)
30.6.23
Asset classes
1
Central governments and central banks
2
Banks and securities dealers
3
Public-sector entities and multi-lateral development banks
4
Corporates
1
2
5
Retail
6
Equity
7
Other assets
7a
of which: non-counterparty related assets
7b
of which: others
8
Total
9
of which: secured by real estate
3
10
of which: past due
4
31.12.22
Asset classes
1
Central governments and central banks
2
Banks and securities dealers
3
Public-sector entities and multi-lateral development banks
4
Corporates
1
2
5
Retail
6
Equity
7
Other assets
7a
of which: non-counterparty related assets
7b
of which: others
8
Total
9
of which: secured by real estate
3
10
of which: past due
4
1 Loans to corporates secured by residential real estate have been reclassified from asset class Retail to Corporates. Prior-period numbers have been restated accordingly. 2 Includes exposures secured by credit
derivatives cleared through central counterparties risk-weighted at 2% or 4%. 3 Includes both residential mortgages and claims secured by other properties, such as commercial real estate. 4 Includes exposure to
defaulted counterparties and purchased credit impaired (PCI) positions. Prior-period numbers have been restated accordingly.
p
Credit risk under the advanced internal ratings-based approach
Introduction
Under the A-IRB approach, the required capital for credit risk is quantified through empirical models developed by UBS
Group and Credit Suisse Group to estimate the probability of default (PD), loss given default (LGD), exposure at default
(EAD) and other parameters, subject to Swiss Financial Market Supervisory Authority (FINMA) approval.
Credit risk exposures by portfolio and PD range
Semi-annual |
The
CR6 table below provides information about credit risk exposures under the A-IRB approach, including a
breakdown of the main parameters used in A-IRB models to calculate the capital requirements, presented by portfolio
and PD range across FINMA-defined asset classes.
Compared with 31 December 2022, EAD post-CCF and post-CRM increased by USD 327.0bn to USD 1,035.2bn, and
RWA increased by USD 91.3bn to USD 212.3bn, primarily driven by the acquisition of the Credit Suisse Group, which
resulted in an increase of USD 333.8bn in EAD post-CCF and post-CRM and USD 89.1bn in RWA. Excluding that
acquisition, EAD post-CCF and post-CRM decreased by USD 6.7bn to USD 701.4bn, and RWA increased by USD 2.3bn
to USD 123.2bn across various asset classes.
In the Central governments and central banks asset class, EAD post-CCF and post-CRM increased by USD 35.5bn to
USD 253.2bn, and RWA increased by USD 1.1bn to USD 4.5bn, primarily driven by the acquisition of the Credit Suisse
Group, with an EAD post-CRM impact of USD 48.7bn and an RWA impact of USD 1.2bn. Excluding that acquisition, EAD
post-CCF and post-CRM decreased by USD 13.2bn to USD 204.5bn, primarily driven by decreases in nostros and HQLA
in Group Functions.
30 June 2023 Pillar 3 Report |
UBS Group | Credit risk 15
In the Banks and securities dealers asset class, EAD post-CCF and post-CRM increased by USD 8.9bn to USD 19.8bn, and
RWA increased by USD 1.3bn to USD 7.9bn, primarily driven by the acquisition of the Credit Suisse Group, with an EAD
post-CCF and post-CRM impact of USD 9.7bn and an RWA impact of USD 2.2bn. Excluding that acquisition, EAD post-
CCF and post-CRM decreased by USD 0.8bn to USD 10.1bn, and RWA decreased by USD 0.9bn to USD 5.7bn.
In the Public-sector entities and multi-lateral development banks asset class, EAD post-CCF and post-CRM decreased by
USD 0.1bn to USD 8.6bn, and RWA increased by USD 0.1bn to USD 0.9bn, primarily driven by the acquisition of Credit
Suisse Group, with an EAD post-CCF and post-CRM impact of USD 0.6bn and an RWA impact of USD 0.2bn. Excluding
that acquisition, EAD post-CCF and post-CRM decreased by USD 0.7bn to USD 8.0bn, and RWA decreased by USD 0.1bn
to USD 0.7bn.
In the Corporates: specialized lending asset class, EAD post-CCF and post-CRM increased by USD 32.4bn to USD 61.3bn,
and RWA increased by USD 14.1bn to USD 27.3bn, primarily driven by the acquisition of the Credit Suisse Group, with
an EAD post-CCF and post-CRM impact of USD 31.5bn and an RWA impact of USD 13.9bn. Excluding that acquisition,
EAD post-CCF and post-CRM increased by USD 0.9bn to USD 29.7bn, primarily due to currency effects in Personal &
Corporate Banking. RWA increased by USD 0.3bn to USD 13.4bn, primarily driven by currency effects and business
growth in Personal & Corporate Banking.
In the Corporates: other lending asset class, EAD post-CCF and post-CRM increased by USD 78.5bn to USD 140.1bn ,
and RWA increased by USD 46.5bn to USD 84.5bn, primarily driven by the acquisition of the Credit Suisse Group, with
an EAD post-CRM impact of USD 76.7bn and an RWA impact of USD 45.2bn. Excluding that acquisition, EAD post-CCF
and post-CRM increased by USD 1.8bn to USD 63.4bn, primarily driven by an increase in loans, as well as currency effects,
in Personal & Corporate Banking. RWA increased by USD 1.3bn to USD 39.3bn, primarily due to the phase-in impact
related to updates to the LGD model for private equity and hedge fund financing trades in the Investment Bank.
In the Retail: residential mortgages asset class, EAD post-CCF and post-CRM increased by USD 122.2bn to USD 297.1bn,
and RWA increased by USD 21.6bn to USD 60.0bn, primarily driven by the acquisition of the Credit Suisse Group, with
an EAD post-CCF and post-CRM impact of USD 114.2bn and an RWA impact of USD 18.5bn. Excluding that acquisition,
EAD post-CCF and post-CRM increased by USD 8.0bn to USD 182.8bn, primarily due to currency effects and business
growth in Personal & Corporate Banking and Global Wealth Management. RWA increased by USD 3.1bn to USD 41.5bn,
mainly reflecting currency effects.
In the Retail: qualifying revolving retail exposures (QRRE) asset class, EAD post-CCF and post-CRM increased by USD 0.8bn
to USD 5.7bn, and RWA increased by USD 0.3bn to USD 1.3bn, primarily driven by the acquisition of the Credit Suisse
Group, with an EAD post-CCF and post-CRM impact of USD 0.5bn and an RWA impact of USD 0.2bn. Excluding the
impact of that acquisition, EAD post-CCF and post-CRM increased by USD 0.3bn to USD 5.2bn and RWA increased by
USD 0.1bn to USD 1.1bn.
In the Retail: other retail asset class, EAD post-CRM increased by USD 48.8bn to USD 249.5bn, and RWA increased by
USD 6.4bn to USD 26.0bn, primarily driven by the acquisition of the Credit Suisse Group, with an EAD post-CCF and
post-CRM impact of USD 51.8bn and an RWA impact of USD 7.8bn. Excluding that acquisition, EAD post-CCF and post-
CRM decreased by USD 3.0bn to USD 197.7bn, primarily driven by a decrease in Lombard loans in Global Wealth
Management. RWA decreased by USD 1.4bn to USD 18.2bn, mainly due to the aforementioned reduction in Lombard
loans.
›
Refer to the “Introduction and basis for preparation” section of the 31 March 2023 Pillar 3 Report, available under “Pillar 3
disclosures” at
ubs.com/investors
, for more information about credit risk RWA for the first quarter of 2023, including details
regarding movements in RWA
30 June 2023 Pillar 3 Report |
UBS Group | Credit risk 16
CR6: IRB – Credit risk exposures by portfolio and PD range
USD m, except where indicated
Original on-
balance sheet
gross exposure
Off-balance
sheet exposures
pre-CCF
Total
exposures pre-
CCF
Average CCF
in %
EAD post-CCF
and post-CRM
Average PD
in %
Number of
obligors (in
thousands)
1
Average LGD
in %
Average
maturity in
years
RWA
RWA density
in %
EL
Provisions
2
Central Governments and central banks as of 30.6.23
0.00 to <0.15
<0.1
0.15 to <0.25
<0.1
0.25 to <0.50
<0.1
0.50 to <0.75
<0.1
0.75 to <2.50
<0.1
2.50 to <10.00
<0.1
10.00 to <100.00
<0.1
100.00 (default)
5
<0.1
Subtotal
Central Governments and central banks as of 31.12.22
0.00 to <0.15
<0.1
0.15 to <0.25
<0.1
0.25 to <0.50
0.50 to <0.75
<0.1
0.75 to <2.50
<0.1
2.50 to <10.00
<0.1
10.00 to <100.00
<0.1
100.00 (default)
<0.1
Subtotal
Banks and securities dealers as of 30.6.23
0.00 to <0.15
0.15 to <0.25
0.25 to <0.50
0.50 to <0.75
0.75 to <2.50
2.50 to <10.00
10.00 to <100.00
<0.1
100.00 (default)
5
<0.1
Subtotal
Banks and securities dealers as of 31.12.22
0.00 to <0.15
0.15 to <0.25
0.25 to <0.50
0.50 to <0.75
0.75 to <2.50
2.50 to <10.00
10.00 to <100.00
<0.1
100.00 (default)
Subtotal
30 June 2023 Pillar 3 Report |
UBS Group | Credit risk 17
CR6: IRB – Credit risk exposures by portfolio and PD range (continued)
USD m, except where indicated
Original on-
balance sheet
gross exposure
Off-balance
sheet exposures
pre-CCF
Total
exposures pre-
CCF
Average CCF
in %
EAD post-CCF
and post-CRM
Average PD
in %
Number of
obligors (in
thousands)
1
Average LGD
in %
Average
maturity in
years
RWA
RWA density
in %
EL
Provisions
2
Public sector entities, multilateral developmental banks as of 30.6.23
0.00 to <0.15
0.15 to <0.25
0.25 to <0.50
0.50 to <0.75
<0.1
0.75 to <2.50
<0.1
2.50 to <10.00
<0.1
10.00 to <100.00
100.00 (default)
5
Subtotal
Public sector entities, multilateral developmental banks as of 31.12.22
0.00 to <0.15
0.15 to <0.25
0.25 to <0.50
0.50 to <0.75
<0.1
0.75 to <2.50
2.50 to <10.00
10.00 to <100.00
100.00 (default)
Subtotal
Corporates: specialized lending as of 30.6.23
0.00 to <0.15
0.15 to <0.25
0.25 to <0.50
0.50 to <0.75
0.75 to <2.50
2.50 to <10.00
10.00 to <100.00
<0.1
100.00 (default)
5
<0.1
Subtotal
Corporates: specialized lending as of 31.12.22
0.00 to <0.15
0.15 to <0.25
0.25 to <0.50
0.50 to <0.75
0.75 to <2.50
2.50 to <10.00
10.00 to <100.00
<0.1
100.00 (default)
<0.1
Subtotal
30 June 2023 Pillar 3 Report |
UBS Group | Credit risk 18
CR6: IRB – Credit risk exposures by portfolio and PD range (continued)
USD m, except where indicated
Original on-
balance sheet
gross exposure
Off-balance
sheet exposures
pre-CCF
Total
exposures pre-
CCF
Average CCF
in %
EAD post-CCF
and post-CRM
Average PD
in %
Number of
obligors (in
thousands)
1
Average LGD
in %
Average
maturity in
years
RWA
RWA density
in %
EL
Provisions
2
Corporates: other lending as of 30.6.23
0.00 to <0.15
0.15 to <0.25
0.25 to <0.50
0.50 to <0.75
0.75 to <2.50
2.50 to <10.00
10.00 to <100.00
100.00 (default)
5
Subtotal
Corporates: other lending as of 31.12.22
0.00 to <0.15
0.15 to <0.25
0.25 to <0.50
0.50 to <0.75
0.75 to <2.50
2.50 to <10.00
10.00 to <100.00
100.00 (default)
Subtotal
Retail: residential mortgages as of 30.6.23
0.00 to <0.15
0.15 to <0.25
0.25 to <0.50
0.50 to <0.75
0.75 to <2.50
2.50 to <10.00
10.00 to <100.00
100.00 (default)
5
Subtotal
Retail: residential mortgages as of 31.12.22
0.00 to <0.15
0.15 to <0.25
0.25 to <0.50
0.50 to <0.75
0.75 to <2.50
2.50 to <10.00
10.00 to <100.00
100.00 (default)
Subtotal
30 June 2023 Pillar 3 Report |
UBS Group | Credit risk 19
CR6: IRB – Credit risk exposures by portfolio and PD range (continued)
USD m, except where indicated
Original on-
balance sheet
gross exposure
Off-balance
sheet exposures
pre-CCF
Total
exposures pre-
CCF
Average CCF
in %
EAD post-CCF
and post-CRM
Average PD
in %
Number of
obligors (in
thousands)
1
Average LGD
in %
Average
maturity in
years
RWA
RWA density
in %
EL
Provisions
2
Retail: qualifying revolving retail exposures (QRRE) as of 30.6.23
0.00 to <0.15
0.15 to <0.25
0.25 to <0.50
0.50 to <0.75
0.75 to <2.50
2.50 to <10.00
10.00 to <100.00
100.00 (default)
5
Subtotal
Retail: qualifying revolving retail exposures (QRRE) as of 31.12.22
0.00 to <0.15
0.15 to <0.25
0.25 to <0.50
0.50 to <0.75
0.75 to <2.50
2.50 to <10.00
10.00 to <100.00
100.00 (default)
Subtotal
Retail: other retail as of 30.6.23
3
0.00 to <0.15
0.15 to <0.25
0.25 to <0.50
0.50 to <0.75
0.75 to <2.50
2.50 to <10.00
10.00 to <100.00
100.00 (default)
5
Subtotal
Retail: other retail as of 31.12.22
3
0.00 to <0.15
0.15 to <0.25
0.25 to <0.50
0.50 to <0.75
0.75 to <2.50
2.50 to <10.00
10.00 to <100.00
100.00 (default)
<0.1
Subtotal
Total 30.6.23
4
Total 31.12.22
4
1 Numbers of obligors represent an aggregation of the client relationships in the UBS Group excluding Credit Suisse along with the client relationships in Credit Suisse. RWA calculations are based on the applicable rules and models approved by FINMA for the respective legal entities. Refer to the “Introduction and basis
for preparation” section of this report for more information about the approach applied for regulatory calculations and disclosures. 2 In line with BCBS Pillar 3 disclosure requirements, provisions are only provided for the sub-totals by asset class. Provisions reflect IFRS Expected Credit Losses (ECL) accounting provisions
for credit losses on A-IRB exposures. 3 The “Retail: other retail” asset class includes risk-weighted assets of USD 3.5bn related to a new model for structured margin loans and similar products in Global Wealth Management. The USD 3.5bn was phased in over five quarters until June 2022, and is related to the expected
impact of the model, which is planned to be introduced in the second half of 2023. The associated changes to PD and LGD, as well as a refinement to the asset class allocation, primarily toward the corporate asset class, will only be reflected with the introduction of the new model. 4 Retail asset classes are excluded
from the average maturity, as maturity is not relevant for risk weighting. 5 Includes defaulted purchased credit-impaired (PCI) positions.
p
30 June 2023 Pillar 3 Report |
UBS Group | Credit risk 20
Credit derivatives used as CRM techniques
Semi-annual |
Where credit derivatives are used as credit risk mitigation, the PD of the obligor is in general substituted with
the PD of the hedge provider. In addition, default correlation between the obligor and the hedge provider is taken into
account through the double default approach. The impact of credit derivatives used as CRM techniques on internal
ratings-based (IRB) credit risk has been immaterial for past reporting periods and continued to be immaterial for this
reporting period. Therefore , we have discontinued the disclosure of the “CR7: IRB – effect on RWA of credit derivatives
used as CRM techniques” table, in line with FINMA Circular 2016/6, general principles of disclosure.
›
Refer to the “CCR6: Credit derivatives exposures” table in the “Counterparty credit risk” section of this report for notional and fair
value information about credit derivatives used as CRM
p
RWA flow statements of credit risk exposures under IRB
Quarterly |
across movement categories defined by the Basel Committee on Banking Supervision (the BCBS). These categories are
described in the “Credit risk” section of the 31 December 2022 Pillar 3 Report, available under “Pillar 3 disclosures” at
ubs.com/investors
.
Credit risk RWA under the IRB approach increased by USD 94.3bn to USD 215.7bn during the second quarter of 2023.
The increase in RWA related to acquisitions and disposals was primarily driven by the acquisition of the Credit Suisse
Group, which resulted in an increase of USD 92.5bn. The balance includes credit risk under the advanced IRB approach,
as well as credit risk under the supervisory slotting approach.
The movements in asset size, asset quality and model updates are related to impacts other than the acquisition of the
Credit Suisse Group.
Movements in asset size increased RWA by USD 2.0bn, mainly due to an increase in mortgage loans in Personal &
Corporate Banking, as well as higher balances with central banks. This was partly offset by a reduction in loans and loan
commitments to corporates in the Investment Bank.
Movements in asset quality, including changes in risk density across the overall portfolio, decreased RWA by USD 2.3bn,
mainly due to an improvement in the risk profile in the Investment Bank, partly offset by a slight deterioration in the risk
profile related to mortgage portfolios in Personal & Corporate Banking and Global Wealth Management.
Model updates resulted in an increase of USD 0.9bn, primarily driven by a USD 0.6bn quarterly phase-in impact related
to the LGD model for private equity and hedge fund financing trades, and a USD 0.6bn increase related to a model
update for income-producing real estate.
30 June 2023 Pillar 3 Report |
UBS Group | Credit risk 21
CR8: RWA flow statements of credit risk exposures under IRB
USD m
For the quarter
ended 30.6.23
For the quarter
ended 31.3.23
1
RWA as of the beginning of the quarter
2
Asset size
3
Asset quality
4
Model updates
5
Methodology and policy
5a
of which: regulatory add-ons
6
Acquisitions and disposals
6a
of which: acquisition of Credit Suisse Group
6b
of which: other
7
Foreign exchange movements
8
Other
9
RWA as of the end of the quarter
p
Semi-annual |
The table below provides information about specialized lending exposures, subject to the supervisory slotting
approach. Exposures related to specialized lending for the UBS Group excluding Credit Suisse are included in CR6: IRB –
Credit risk exposures by portfolio and PD range.
CR10: Specialized lending
USD m, except where indicated
On-balance sheet
amount
Off-balance sheet
amount
Risk weight
in %
Exposure amount
1
RWA
EL
30.6.23
Other than high-volatility commercial real estate
Regulatory categories and remaining maturity
Strong
Less than 2.5 years
Equal to or more than 2.5 years
Good
Less than 2.5 years
Equal to or more than 2.5 years
Satisfactory
2
Weak
Default
Total
High-volatility commercial real estate
Regulatory categories and remaining maturity
Strong
Less than 2.5 years
Equal to or more than 2.5 years
Good
Less than 2.5 years
Equal to or more than 2.5 years
Satisfactory
2
Weak
Default
Total
1 Exposure amounts in connection with income-producing real estate. 2 For a portion of the exposure, a risk weight of 120% is applied.
p
Equity exposures
Semi-annual |
CR10: IRB (equities under the simple risk-weight method)
USD m, except where indicated
On-balance sheet
amount
Off-balance sheet
amount
Risk weight
in %
1
Exposure amount
2
RWA
1
30.6.23
Exchange-traded equity exposures
Other equity exposures
Total
31.12.22
Exchange-traded equity exposures
Other equity exposures
Total
1 RWA are calculated post-application of the A-IRB multiplier of 6%, therefore the respective risk weight is higher than 300% and 400%. 2 The exposure amount for equities in the banking book is based on the
net position.
p
30 June 2023 Pillar 3 Report |
UBS Group | Counterparty credit risk 22
Counterparty credit risk
Introduction
Semi-annual I
This section provides information about the exposures subject to the Basel III counterparty credit risk (CCR)
framework. CCR arises from over-the-counter (OTC) derivatives and exchange-traded derivatives (ETDs), securities
financing transactions (SFTs), and long settlement transactions. We determine the regulatory credit exposure on the
majority of our derivatives portfolio by applying the internal model method. For the rest of the derivatives portfolio we
apply the standardized approach for counterparty credit risk (SA-CCR). For the majority of SFTs we determine the
regulatory credit exposure using the value-at-risk (VaR) approach.
For the rest of the SFTs portfolio we apply the
comprehensive approach for credit risk mitigation (CRM).
p
Counterparty credit risk exposure
Semi-annual I
The CCR1 table below presents the methods used to calculate CCR exposure. Compared with 31 December
2022, CCR exposure increased by USD 26.5bn, primarily due to the acquisition of the Credit Suisse Group, which resulted
in an increase of USD 30.0bn. Excluding that acquisition, CCR exposure decreased by USD 3.6bn, primarily on SFTs.
CCR1: Analysis of counterparty credit risk (CCR) exposure by approach
Replacement cost
Potential future
exposure
EEPE
Alpha used for
computing
regulatory EAD
EAD
post-CRM
RWA
30.6.23
1
SA-CCR (for derivatives)
2
Internal model method (for derivatives)
1
3
Simple approach for credit risk mitigation (for SFTs)
4
Comprehensive approach for credit risk mitigation (for SFTs)
5
VaR (for SFTs)
6
Total
31.12.22
1
SA-CCR (for derivatives)
2
Internal model method (for derivatives)
1
3
Simple approach for credit risk mitigation (for SFTs)
4
Comprehensive approach for credit risk mitigation (for SFTs)
5
VaR (for SFTs)
6
Total
1 A conservative treatment for the purpose of calculating exposure profiles is applied to material trades with wrong-way risk features, along with alpha factor of 1.0.
p
Semi-annual |
The CCR2 table below presents the credit valuation adjustment (CVA) capital charge with a breakdown by
standardized and advanced approaches. In addition to the default risk capital requirements for CCR on derivatives, we
add a CVA capital charge to cover the risk of mark-to-market losses associated with the deterioration of counterparty
credit quality. The advanced CVA VaR approach has been used to calculate the CVA capital charge for the majority of
derivatives. Where this is not feasible, the standardized CVA approach has been used.
Compared with 31 December 2022, CVA risk-weighted assets (RWA) increased by USD 5.0bn to USD 9.3bn, primarily
related to the acquisition of the Credit Suisse Group, which resulted in an increase of USD 5.1bn.
CCR2: Credit valuation adjustment (CVA) capital charge
30.6.23
31.12.22
USD m
EAD post-CRM
RWA
EAD post-CRM
RWA
Total portfolios subject to the advanced CVA capital charge
1
(i) VaR component (including the 3× multiplier)
2
(ii) Stressed VaR component (including the 3× multiplier)
3
All portfolios subject to the standardized CVA capital charge
4
Total subject to the CVA capital charge
p
30 June 2023 Pillar 3 Report |
UBS Group | Counterparty credit risk 23
Semi-annual |
We have discontinued the disclosure of the “CCR3: Standardized approach – CCR exposures by regulatory
portfolio and risk weights” table, starting with the 31 December 2022 Pillar 3 Report, on the grounds of materiality. The
majority of our CCR exposures are subject to internal ratings-based (IRB) risk weights or disclosed separately when related
to central counterparties. Our CCR exposures subject to standardized risk weights amounted to USD 10.4bn.
›
Refer to the “CCR4: IRB – CCR exposures by portfolio and PD scale” table and the “CCR8: exposures to central counterparties” in
this section for more information about counterparty credit risk exposures subject to IRB risk weights and central counterparties,
respectively
p
Semi-annual |
The CCR4 table below provides a breakdown of the key parameters used for the calculation of capital
requirements under the advanced internal ratings-based (A-IRB) approach across Swiss Financial Market Supervisory
Authority (FINMA)-defined asset classes.
Compared with 31 December 2022, exposure at default (EAD) post-CRM increased by USD 18.3bn to USD 124.4bn
across the various asset classes, and RWA increased by USD 3.7bn to USD 36.2bn. These increases were primarily driven
by the acquisition of the Credit Suisse Group, which resulted in increases of USD 22.5bn in EAD post-CRM and USD 5.9bn
in RWA. Excluding that acquisition, EAD post-CRM decreased by USD 4.2bn, and RWA decreased by USD 2.2bn.
In the Central governments and central banks asset class, EAD post-CRM decreased by USD 4.0bn to USD 9.8bn, and
RWA decreased by USD 0.3bn to USD 0.8bn, including an increase of USD 0.9bn in EAD post-CRM and USD 0.1bn in
RWA related to the acquisition of the Credit Suisse Group. Excluding that acquisition, EAD post-CRM decreased by
USD 4.9bn, mainly driven by exposure decreases in SFTs and foreign-exchange derivatives, mainly in the Investment Bank.
In the Banks and securities dealers asset class, EAD post-CRM increased by USD 9.3bn to USD 32.2bn, and RWA increased
by USD 2.6bn to USD 8.8bn, primarily driven by the acquisition of the Credit Suisse Group, which resulted in increases
of USD 8.7bn in EAD post-CRM and USD 2.4bn in RWA. Excluding that acquisition, EAD post-CRM increased by
USD 0.6bn, and RWA increased by USD 0.2bn.
In the Public-sector entities and multi-lateral development banks asset class, EAD post-CRM increased by USD 0.2bn to
USD 0.7bn, and RWA slightly increased to USD 0.1bn, primarily driven by the acquisition of the Credit Suisse Group,
which resulted in increase of USD 0.1bn in EAD post-CRM.
In the Corporates: including specialized lending asset class, EAD post-CRM increased by USD 10.2bn to USD 72.9bn, and
RWA increased by USD 1.1bn to USD 25.6bn, primarily driven by the acquisition of the Credit Suisse Group, which
resulted in increases of USD 10.7bn in EAD post-CRM and USD 3.2bn in RWA. Excluding that acquisition, RWA decreased
by USD 2.1bn, mainly due to a decrease in SFTs, primarily as a result of lower volatility reflected in the VaR model and an
improvement in the risk profile, as well as model updates impacting derivatives and SFTs.
In the Retail: other retail asset class, EAD post-CRM increased by USD 2.7bn to USD 8.9bn, and RWA increased by
USD 0.2bn to USD 1.0bn, primarily driven by the acquisition of the Credit Suisse Group, which resulted in increases of
USD 2.2bn in EAD post-CRM and USD 0.2bn in RWA. Excluding that acquisition, EAD post-CRM increased by USD 0.5bn,
mainly driven by an increase in derivatives in Global Wealth Management.
›
Refer to the “CCR7: RWA flow statements of CCR exposures under internal model method (IMM) and value-at-risk (VaR)” table in
this section for more information about RWA, including details of movements in CCR RWA
30 June 2023 Pillar 3 Report |
UBS Group | Counterparty credit risk 24
CCR4: IRB – CCR exposures by portfolio and PD scale
USD m, except where indicated
EAD post-CRM
Average PD
in %
Number of obligors
(in thousands)
5
Average LGD
in %
Average maturity
in years
1
RWA
RWA density
in %
Central governments and central banks as of 30.6.23
0.00 to <0.15
0.15 to <0.25
< 0.1
0.25 to <0.50
< 0.1
0.50 to <0.75
< 0.1
0.75 to <2.50
< 0.1
2.50 to <10.00
< 0.1
10.00 to <100.00
100.00 (default)
Subtotal
Central governments and central banks as of 31.12.22
0.00 to <0.15
0.15 to <0.25
< 0.1
0.25 to <0.50
< 0.1
0.50 to <0.75
0.75 to <2.50
< 0.1
2.50 to <10.00
10.00 to <100.00
100.00 (default)
Subtotal
Banks and securities dealers as of 30.6.23
0.00 to <0.15
0.15 to <0.25
0.25 to <0.50
0.50 to <0.75
< 0.1
0.75 to <2.50
2.50 to <10.00
< 0.1
10.00 to <100.00
< 0.1
100.00 (default)
Subtotal
Banks and securities dealers as of 31.12.22
0.00 to <0.15
0.15 to <0.25
0.25 to <0.50
0.50 to <0.75
< 0.1
0.75 to <2.50
< 0.1
2.50 to <10.00
< 0.1
10.00 to <100.00
100.00 (default)
Subtotal
30 June 2023 Pillar 3 Report |
UBS Group | Counterparty credit risk 25
CCR4: IRB – CCR exposures by portfolio and PD scale (continued)
USD m, except where indicated
EAD post-CRM
Average PD
in %
Number of obligors
(in thousands)
5
Average LGD
in %
Average maturity
in years
1
RWA
RWA density
in %
Public-sector entities and multi-lateral development banks as of 30.6.23
0.00 to <0.15
< 0.1
0.15 to <0.25
< 0.1
0.25 to <0.50
< 0.1
0.50 to <0.75
< 0.1
0.75 to <2.50
< 0.1
2.50 to <10.00
10.00 to <100.00
100.00 (default)
Subtotal
< 0.1
Public-sector entities and multi-lateral development banks as of 31.12.22
0.00 to <0.15
< 0.1
0.15 to <0.25
< 0.1
0.25 to <0.50
< 0.1
0.50 to <0.75
< 0.1
0.75 to <2.50
< 0.1
2.50 to <10.00
10.00 to <100.00
100.00 (default)
Subtotal
< 0.1
Corporates: including specialized lending as of 30.6.23
2
0.00 to <0.15
0.15 to <0.25
0.25 to <0.50
0.50 to <0.75
0.75 to <2.50
2.50 to <10.00
10.00 to <100.00
< 0.1
100.00 (default)
< 0.1
Subtotal
Corporates: including specialized lending as of 31.12.22
2
0.00 to <0.15
0.15 to <0.25
0.25 to <0.50
0.50 to <0.75
0.75 to <2.50
2.50 to <10.00
10.00 to <100.00
100.00 (default)
< 0.1
Subtotal
Retail: other retail as of 30.6.23
3
0.00 to <0.15
0.15 to <0.25
0.25 to <0.50
0.50 to <0.75
0.75 to <2.50
2.50 to <10.00
10.00 to <100.00
< 0.1
100.00 (default)
Subtotal
Retail: other retail as of 31.12.22
0.00 to <0.15
0.15 to <0.25
0.25 to <0.50
0.50 to <0.75
0.75 to <2.50
2.50 to <10.00
10.00 to <100.00
100.00 (default)
Subtotal
Total 30.6.23
4
Total 31.12.22
4
1 Average maturity for defaulted exposures disclosed in the table is not used to calculate RWA. 2 Includes exposures to managed funds. 3 From 30 June 2023 onward, we have further refined the limit information
for Lombard trading clients, which has resulted in a change in the overall numbers of obligors. 4 Retail asset classes are excluded from the average maturity, as they are not subject to maturity treatment. 5 Numbers
of obligors represent an aggregation of the client relationships in the UBS Group excluding Credit Suisse along with the client relationships in Credit Suisse. RWA calculations are based on the applicable rules and
models approved by FINMA for the respective legal entities.
p
30 June 2023 Pillar 3 Report |
UBS Group | Counterparty credit risk 26
Semi-annual |
The CCR5 table below presents a breakdown of collateral posted or received relating to CCR exposures from
derivative transactions and SFTs.
Compared with 31 December 2022, the fair value of collateral received for derivatives increased by USD 47.8bn to
USD 126.1bn, and the fair value of collateral posted for derivatives increased by USD 37.8bn to USD 97.4bn, primarily
driven by the acquisition of the Credit Suisse Group, which resulted in an increase of USD 52.4bn in the fair value of
collateral received and an increase of USD 33.8bn in the fair value of collateral posted. Excluding that acquisition, the fair
value of collateral received decreased by USD 4.6bn, primarily reflecting maturing transactions. The fair value of collateral
posted increased by USD 4.0bn, mainly related to equity securities in Group Treasury.
The fair value of collateral received for SFTs increased by USD 136.3bn to USD 696.1bn, and the fair value of collateral
posted for SFTs increased by USD 133.8bn to USD 565.3bn, primarily driven by the acquisition of the Credit Suisse Group,
which resulted in an increase of USD 105.3bn in the fair value of collateral received and an increase of USD 105.3bn in
the fair value of collateral posted. Excluding that acquisition, the fair value of collateral received increased by USD 31.0bn,
and the fair value of collateral posted increased by USD 28.5bn, mainly related to the increases in equity securities
primarily in the Investment Bank, due to an increase in client activity levels.
CCR5: Composition of collateral for CCR exposure
1
Collateral used in derivative transactions
Collateral used in SFTs
Fair value of collateral received
Fair value of posted collateral
Fair value of
collateral received
Fair value of
posted collateral
USD m
Segregated
Unsegregated
Total
Segregated
Unsegregated
Total
30.6.23
Cash – domestic currency
Cash – other currencies
Sovereign debt
Other debt securities
Equity securities
Other collateral
2
Total
31.12.22
Cash – domestic currency
Cash – other currencies
Sovereign debt
Other debt securities
Equity securities
Other collateral
2
Total
1 This table includes collateral received and posted with and without the right of rehypothecation, but excludes securities placed with central banks related to undrawn credit lines and for payment, clearing and
settlement purposes for which there were no associated liabilities or contingent liabilities. 2 Includes fund investments, asset-backed securities, and mortgage-backed securities. The comparative period has been
adjusted accordingly.
p
Semi-annual |
The CCR6 table below presents an overview of credit risk protection bought or sold through credit derivatives.
Compared with 31 December 2022, notionals for credit derivatives increased by USD 155.7bn to USD 201.2bn for
protection bought and by USD 147.9bn to USD 189.5bn for protection sold, primarily driven by the acquisition of the
Credit Suisse Group, which resulted in an increase of USD 149.8bn for protection bought and USD 140.0bn for protection
sold. Excluding that acquisition, notionals for credit derivatives increased by USD 5.9bn for protection bought and by
USD 7.8bn for protection sold, primarily driven by single-name credit default swaps and index credit default swaps, mostly
due to higher trading volumes in Group Treasury and the Investment Bank.
CCR6: Credit derivatives exposures
30.6.23
31.12.22
USD m
Protection
bought
Protection
sold
Protection
bought
Protection
sold
Notionals
1
Single-name credit default swaps
Index credit default swaps
Total return swaps
Credit options
Total notionals
Fair values
Positive fair value (asset)
Negative fair value (liability)
1 Includes notional amounts for client-cleared transactions.
p
30 June 2023 Pillar 3 Report |
UBS Group | Counterparty credit risk 27
Counterparty credit risk risk-weighted assets
Quarterly |
The CCR7 table below presents a flow statement explaining changes in CCR RWA determined under the IMM for
derivatives and the VaR approach for SFTs.
CCR RWA on derivatives under the IMM increased by USD 4.4bn to USD 20.3bn during the second quarter of 2023. This
included USD 4.3bn of RWA related to the acquisition of the Credit Suisse Group. Excluding the impact of that acquisition,
asset size movements contributed to an increase of USD 2.9bn, mainly due to mark-to-market movements, as well as
higher client activity levels. Asset quality movements contributed to an RWA decrease of USD 1.5bn, mainly due to an
improvement in the risk profile of the Investment Bank. Model updates resulted in a decrease of USD 1.2bn, primarily
driven by a decrease of USD 0.8bn related to the recalibration of certain multipliers as a result of improvements to models,
as well as a USD 0.7bn decrease related to updates to the IMM for derivatives. These decreases were partly offset by an
increase of USD 0.3bn related to a model update for hedge funds.
CCR RWA on SFTs under the VaR approach increased by USD 1.1bn to USD 8.5bn during the second quarter of 2023.
This included USD 1.6bn of RWA related to the acquisition of the Credit Suisse Group. Excluding the impact of that
acquisition, asset size movements contributed to a decrease of USD 0.7bn, mainly due to lower SFT exposures in the
Investment Bank.
›
Refer to “Definitions of credit risk and counterparty credit risk RWA movement table components for CR8 and CCR7” in the
“Credit risk” section of the 31 December 2022 Pillar 3 Report, available under “Pillar 3 disclosures” at
ubs.com/investors
, for
definitions of CCR RWA movement table components
CCR7: RWA flow statements of CCR exposures under internal model method (IMM) and value-at-risk (VaR)
For the quarter ended 30.6.23
For the quarter ended 31.3.23
USD m
Derivatives
SFTs
Total
Derivatives
SFTs
Total
Subject to IMM
Subject to VaR
Subject to IMM
Subject to VaR
1
RWA as of the beginning of the quarter
2
Asset size
3
Credit quality of counterparties
4
Model updates
5
Methodology and policy
5a
of which: regulatory add-ons
6
Acquisitions and disposals
6a
of which: acquisition of Credit Suisse Group
6b
of which: other
7
Foreign exchange movements
8
Other
9
RWA as of the end of the quarter
p
Semi-annual |
The CCR8 table below presents a breakdown of exposures to central counterparties and related RWA.
Compared with 31 December 2022, exposures to qualifying central counterparties increased by USD 21.7bn to
USD 75.6bn, primarily related to the acquisition of the Credit Suisse Group, which resulted in an increase of USD 13.0bn.
Excluding that acquisition, exposures to qualifying central counterparties increased by USD 8.7bn to USD 62.6bn, mainly
reflecting market-driven movements in the Investment Bank.
CCR8: Exposures to central counterparties
30.6.23
31.12.22
USD m
EAD (post-CRM)
RWA
EAD (post-CRM)
RWA
1
Exposures to QCCPs (total)
1
2
Exposures for trades at QCCPs (excluding initial margin and default fund contributions); of which
3
(i) OTC derivatives
4
(ii) Exchange-traded derivatives
5
(iii) Securities financing transactions
6
(iv) Netting sets where cross-product netting has been approved
7
Segregated initial margin
8
Non-segregated initial margin
2
9
Pre-funded default fund contributions
10
Unfunded default fund contributions
11
Exposures to non-QCCPs (total)
12
Exposures for trades at non-QCCPs (excluding initial margin and default fund contributions); of which
13
(i) OTC derivatives
14
(ii) Exchange-traded derivatives
15
(iii) Securities financing transactions
16
(iv) Netting sets where cross-product netting has been approved
17
Segregated initial margin
18
Non-segregated initial margin
2
19
Pre-funded default fund contributions
20
Unfunded default fund contributions
3
1 Qualifying central counterparties (QCCPs) are entities licensed by regulators to operate as CCPs and meet the requirements outlined in FINMA Circular 2017/7. 2 Exposures associated with initial margin, where
the exposures are measured under the IMM or the VaR approach, have been included within the exposures for trades (refer to line 2 for QCCPs and line 12 for non-QCCPs). The exposures for non-segregated initial
margin (refer to line 8 for QCCPs and line 18 for non-QCCPs), i.e., not bankruptcy-remote in accordance with FINMA Circular 2017/7, reflect the replacement costs under SA-CCR multiplied by an alpha factor of 1.4.
The RWA reflect the exposure multiplied by the applied risk weight of derivatives. Under SA-CCR, collateral posted to a segregated, bankruptcy-remote account does not increase the value of replacement costs.
3 Excludes unfunded default fund contributions that are not subject to RWA calculations in line with regulatory guidance.
p
30 June 2023 Pillar 3 Report |
UBS Group | Securitizations 28
Securitizations
Introduction
Semi-annual |
books based on the Basel III securitization framework. In a traditional securitization a pool of loans (or other debt
obligations) is typically transferred to structured entities that have been established to own the loan pool and to issue
tranched securities to third-party investors referencing this pool of loans. In a synthetic securitization legal ownership of
securitized pools of assets is typically retained, but associated credit risk is transferred to structured entities, typically
through guarantees, credit derivatives or credit-linked notes. In both traditional and synthetic securitizations risk is
dependent on the seniority of the retained interest and the performance of the underlying asset pool.
Regulatory capital treatment of securitization structures
For banking book securitizations, the regulatory capital requirements are calculated using the following hierarchy of
approaches: the securitization internal ratings-based approach (SEC-IRBA), the securitization external ratings-based
approach (SEC-ERBA), or the securitization standardized approach (SEC-SA). Otherwise, a 1,250% risk-weight is applied
as a fallback. External ratings used in regulatory capital calculations for securitization risk exposures in the banking book
are obtained from Fitch, Moody’s or S&P.
For trading book securitizations, the regulatory capital requirements are calculated using a ratings-based approach, the
supervisory formula approach or the weighted-average risk-weight approach.
p
Securitization exposures in the banking and trading books
Semi-annual |
The SEC1 and SEC2 tables show the balance sheet carrying values of securitization exposures in the banking
and trading books as of 30 June 2023 and 31 December 2022, respectively. The securitization activity is further broken
down by role (originator, sponsor or investor) and by securitization type (traditional or synthetic). For synthetic
securitization transactions, the amounts disclosed reflect the securitization exposure retained by us. The SEC3 and SEC4
tables provide the regulatory capital requirements associated with the banking book securitization exposures
differentiated by our role in the securitization.
Development of securitization exposures in the first half of 2023
Compared with 31 December 2022, securitization exposures in the banking book increased by USD 62.5bn to
USD 63.9bn, mainly driven by the increase in assets due to the acquisition of the Credit Suisse Group, which resulted in
an increase of USD 61.8bn. The majority of the exposure acquired from the Credit Suisse Group relates to synthetic
wholesale positions, where the Credit Suisse Group acted as originator, and traditional wholesale and retail positions
where the Credit Suisse Group acted as an investor. Excluding the aforementioned acquisition, banking book exposures
related mainly to traditional wholesale securitizations where the UBS Group acts as an investor increased by USD 0.6bn,
while corresponding RWA increased by USD 0.3bn.
Compared with 31 December 2022, securitization exposures in the trading book increased by USD 0.1bn to USD 0.7bn,
mainly driven by the increase in assets due to the acquisition of the Credit Suisse Group, which resulted in an increase of
USD 0.4bn. The majority of the exposure acquired from the Credit Suisse Group relates to traditional wholesale and
traditional retail positions where the Credit Suisse Group acted as an investor. Excluding the aforementioned acquisition,
trading book exposures decreased by USD 0.3bn, while corresponding RWA decreased by USD 0.06bn, mainly related to
traditional wholesale exposures where the UBS Group acts as an investor.
p
30 June 2023 Pillar 3 Report |
UBS Group | Securitizations 29
Semi-annual |
SEC1: Securitization exposures in the banking book
Bank acts as originator
Bank acts as sponsor
Bank acts as investor
Total
USD m
Traditional
Synthetic
Subtotal
Traditional
Synthetic
Subtotal
Traditional
Synthetic
Subtotal
30.6.23
Asset classes
1
Retail (total)
2
of which: residential mortgage
3
of which: credit card receivables
4
of which: other retail exposures
1
5
Wholesale (total)
6
of which: loans to corporates or SME
7
of which: commercial mortgage
8
of which: lease and receivables
9
of which: other wholesale
10
Re-securitization
11
Total securitization / re-securitization
(including retail and wholesale)
31.12.22
Asset classes
1
Retail (total)
2
of which: residential mortgage
3
of which: credit card receivables
4
of which: other retail exposures
1
5
Wholesale (total)
6
of which: loans to corporates or SME
7
of which: commercial mortgage
8
of which: lease and receivables
9
of which: other wholesale
10
Re-securitization
11
Total securitization / re-securitization
(including retail and wholesale)
1 Includes unsecured consumer loans, solar leases and automobile loans.
30 June 2023 Pillar 3 Report |
UBS Group | Securitizations 30
SEC2: Securitization exposures in the trading book
Bank acts as originator
Bank acts as sponsor
Bank acts as investor
Total
USD m
Traditional
Synthetic
Subtotal
Traditional
Synthetic
Subtotal
Traditional
Synthetic
Subtotal
30.6.23
Asset classes
1
Retail (total)
2
of which: residential mortgage
4
of which: other retail exposures
1
5
Wholesale (total)
6
of which: loans to corporates or SME
7
of which: commercial mortgage
9
of which: other wholesale
10
Re-securitization
11
Total securitization / re-securitization
(including retail and wholesale)
31.12.22
Asset classes
1
Retail (total)
2
of which: residential mortgage
4
of which: other retail exposures
1
5
Wholesale (total)
6
of which: loans to corporates or SME
7
of which: commercial mortgage
9
of which: other wholesale
10
Re-securitization
11
Total securitization / re-securitization
(including retail and wholesale)
1 Includes unsecured consumer loans, solar leases and automobile loans.
30 June 2023 Pillar 3 Report |
UBS Group | Securitizations 31
SEC3: Securitization exposures in the banking book and associated regulatory capital requirements – bank acting as originator or as sponsor
USD m
Total
exposure
values
Exposure values (by RW bands)
Exposure values (by regulatory approach)
Total
RWA
RWA (by regulatory approach)
Total capital
charge after
cap
Capital charge after cap
30.6.23
≤20% RW
>20% to
50% RW
>50% to
100% RW
>100% to
<1250% RW
1250% RW
SEC-
IRBA
SEC-
ERBA
SEC-SA
1250%
SEC-
IRBA
SEC-
ERBA
SEC-SA
1250%
SEC-
IRBA
SEC-
ERBA
SEC-SA
1250%
Asset classes
1
Total exposures
2
Traditional securitization
3
of which: securitization
4
of which: retail underlying
5
of which: wholesale
6
of which: re-securitization
7
of which: senior
8
of which: non-senior
9
Synthetic securitization
10
of which: securitization
11
of which: retail underlying
12
of which: wholesale
13
of which: re-securitization
14
of which: senior
15
of which: non-senior
31.12.22
Asset classes
1
Total exposures
2
Traditional securitization
3
of which: securitization
4
of which: retail underlying
5
of which: wholesale
6
of which: re-securitization
7
of which: senior
8
of which: non-senior
9
Synthetic securitization
10
of which: securitization
11
of which: retail underlying
12
of which: wholesale
13
of which: re-securitization
14
of which: senior
15
of which: non-senior
30 June 2023 Pillar 3 Report |
UBS Group | Securitizations 32
SEC4: Securitization exposures in the banking book and associated regulatory capital requirements – bank acting as investor
USD m
Total
exposure
values
Exposure values (by RW bands)
Exposure values (by regulatory approach)
Total
RWA
RWA (by regulatory approach)
Total capital
charge after
cap
Capital charge after cap
30.6.23
≤20% RW
>20% to
50% RW
>50% to
100% RW
>100% to
<1250% RW
1250% RW
SEC-
IRBA
SEC-
ERBA
SEC-SA
1250%
SEC-
IRBA
SEC-
ERBA
SEC-SA
1250%
SEC-
IRBA
SEC-
ERBA
SEC-SA
1250%
Asset classes
1
Total exposures
2
Traditional securitization
3
of which: securitization
4
of which: retail underlying
5
of which: wholesale
6
of which: re-securitization
7
of which: senior
8
of which: non-senior
9
Synthetic securitization
10
of which: securitization
11
of which: retail underlying
12
of which: wholesale
13
of which: re-securitization
14
of which: senior
15
of which: non-senior
31.12.22
Asset classes
1
Total exposures
2
Traditional securitization
3
of which: securitization
4
of which: retail underlying
5
of which: wholesale
6
of which: re-securitization
7
of which: senior
8
of which: non-senior
9
Synthetic securitization
10
of which: securitization
11
of which: retail underlying
12
of which: wholesale
13
of which: re-securitization
14
of which: senior
15
of which: non-senior
p
30 June 2023 Pillar 3 Report |
UBS Group | Market risk 33
Market risk
Overview
Semi-annual |
The amount of capital required to underpin market risk in the regulatory trading book is calculated using a
variety of methods approved by the Swiss Financial Market Supervisory Authority (FINMA). The components contributing
to market risk risk-weighted assets (RWA) are value-at-risk (VaR), stressed value-at-risk (SVaR), an add-on for risks that
are potentially not fully modeled in VaR (risks not in VaR, or RniV), the incremental risk charge (the IRC) and the
securitization framework for securitization positions in the trading book.
p
Securitization positions in the trading book
Semi-annual |
The MR1 table below shows the components of RWA under the standardized approach for market risk. In the
30 June 2023 Pillar 3 report, we have enhanced the disclosure on securitization exposures following the acquisition of
the Credit Suisse Group. In line with regulatory requirements, the standardized approach for market risk is used for the
specific risk on securitization exposures.
Securitization exposures in the trading book is the only relevant disclosure component of market risk under the
standardized approach. Compared with 31
December 2022, securitization exposures subject to market risk RWA
increased by USD
0.6bn to USD 1.1bn, mainly driven by the acquisition of the Credit Suisse Group, which resulted in an
increase of USD 0.7bn. Excluding that acquisition, securitization exposures subject to market risk RWA decreased by
USD 0.06bn to USD 0.4bn as of 30 June 2023.
›
Refer to the “Securitizations” section of this report for more information about the securitization exposures in the trading book
MR1: Market risk under standardized approach
RWA
USD m
30.6.23
31.12.22
Outright products
1
Interest rate risk (general and specific)
2
Equity risk (general and specific)
3
Foreign exchange risk
4
Commodity risk
Options
5
Simplified approach
6
Delta-plus method
7
Scenario approach
8
Securitization
9
Total
p
30 June 2023 Pillar 3 Report |
UBS Group | Market risk 34
Market risk risk-weighted assets
Market risk RWA development in the second quarter of 2023
Quarterly |
The three main components that contribute to market risk RWA are VaR, SVaR and IRC. The VaR and SVaR
components include the RWA charge for RniV.
The MR2 table below provides a breakdown of the movement in market risk RWA in the second quarter of 2023 under
an internal models approach across those components, pursuant to the movement categories defined by the Basel
Committee on Banking Supervision. These categories are described in the “Market risk” section of the 31 December
2022 Pillar 3 Report, available under “Pillar 3 disclosures” at
ubs.com/investors
.
Market risk RWA increased by USD 7.8bn to USD 22.5bn in the second quarter of 2023, primarily as a result of the
acquisition of the Credit Suisse Group. Market Risk RWA excluding that acquisition decreased by USD 1.0bn, driven by a
decrease from asset size and other movements in the Investment Bank’s Global Markets business and a decrease related
to ongoing parameter updates of our VaR model. We are in discussions with FINMA regarding the integration of time
decay into the regulatory VaR, which would replace the current add-on.
The FINMA VaR multiplier derived from backtesting exceptions for market risk RWA was unchanged compared with the
prior quarter, at 3.0, for both the UBS Group excluding Credit Suisse and Credit Suisse.
MR2: RWA flow statements of market risk exposures under an IMA
1
USD m
VaR
Stressed VaR
IRC
CRM
Other
Total RWA
1
RWA as of 31.12.22
1a
Regulatory adjustment
1b
RWA at previous quarter-end (end of day)
2
Movement in risk levels
3
Model updates / changes
4
Methodology and policy
5
Acquisitions and disposals
6
Foreign exchange movements
7
Other
8a
RWA at the end of the reporting period (end of day)
8b
Regulatory adjustment
8c
RWA as of 31.3.23
1
RWA as of 31.3.23
1a
Regulatory adjustment
1b
RWA at previous quarter-end (end of day)
2
Movement in risk levels
3
Model updates / changes
4
Methodology and policy
5
Acquisitions and disposals
5a
of which: acquisition of Credit Suisse Group
5b
of which: other
6
Foreign exchange movements
7
Other
8a
RWA at the end of the reporting period (end of day)
8b
Regulatory adjustment
8c
RWA as of 30.6.23
1 Components that describe movements in RWA are presented in italics.
p
30 June 2023 Pillar 3 Report |
UBS Group | Market risk 35
Regulatory calculation of market risk
Semi-annual |
incremental risk charge (IRC) and comprehensive risk capital charge. The comprehensive risk charge has not been
applicable since 2019, which was the last time UBS had eligible correlation trading positions.
During the first half of 2023, for the UBS Group excluding Credit Suisse, regulatory VaR and SVaR were relatively stable
on average, while the IRC increased on average, driven by exposures in commercial paper in the Investment Bank.
For Credit Suisse, regulatory VaR and SVaR, as well as the IRC, decreased on average, mainly driven by de-risking of the
securitized products portfolio.
MR3: IMA values for trading portfolios
UBS Group excluding Credit Suisse
Credit Suisse
For the six-month period
ended 30.6.23
For the six-month period
ended 31.12.22
For the six-month period
ended 30.6.23
For the six-month period
ended 31.12.22
USD m
VaR (10-day 99%)
1
Maximum value
2
Average value
3
Minimum value
4
Period end
Stressed VaR (10-day 99%)
5
Maximum value
6
Average value
7
Minimum value
8
Period end
Incremental risk charge (99.9%)
9
Maximum value
10
Average value
11
Minimum value
12
Period end
p
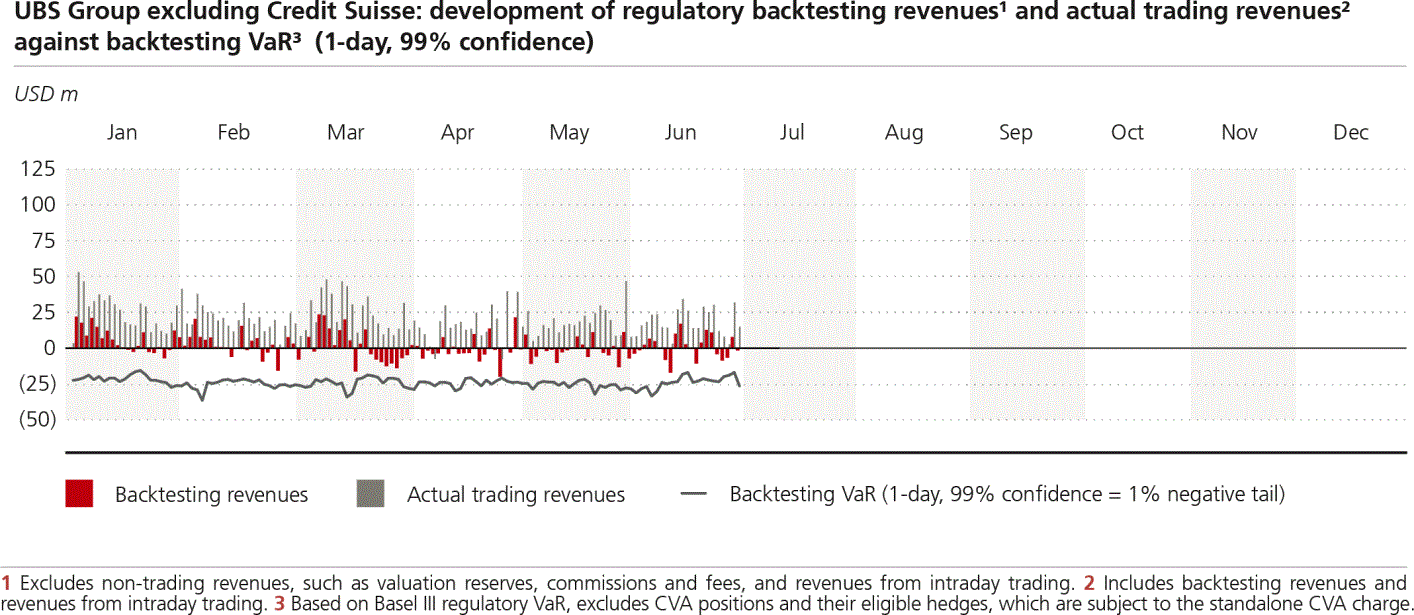
30 June 2023 Pillar 3 Report |
UBS Group | Market risk 36
MR4: Comparison of VaR estimates with gains / losses
Semi-annual |
VaR backtesting is a performance measurement process in which a 1-day VaR prediction is compared with the
realized 1-day profit or loss. We compute backtesting VaR using a 99% confidence level and 1-day holding period for
the regulatory VaR population. Since 99% VaR at UBS is defined as a risk measure that operates on the lower tail of the
profit-or-loss distribution, 99% backtesting VaR is a negative number. Backtesting revenues exclude non-trading
revenues, such as valuation reserves, fees and commissions, and revenues from intraday trading, to provide for a like-for-
like comparison. A backtesting exception occurs when backtesting revenues are lower than the previous day’s backtesting
VaR.
Statistically, given the 99% confidence level, two or three backtesting exceptions a year can be expected. More than four
exceptions could indicate that the VaR model is not performing appropriately, as could too few exceptions over a long
period. However, as noted under “VaR limitations” in the “Risk management and control” section of the Annual Report
2022, a sudden increase (or decrease) in market volatility relative to the lookback window could lead to a higher (or
lower) number of exceptions. Therefore, backtesting exceptions are investigated, as are exceptionally positive backtesting
revenues, with the results reported to senior business management, the Chief Risk Officer and the Chief Market Risk
Officer. Internal and external auditors and relevant regulators are also informed of backtesting exceptions.
The “Development of regulatory backtesting revenues and actual trading revenues against backtesting VaR” charts below
show the development of backtesting VaR against the Group’s backtesting revenues and actual trading revenues for the
first half of 2023.
The actual trading revenues include backtesting and intraday revenues.
For the UBS Group excluding Credit Suisse, there were no new VaR negative backtesting exceptions in the first half of
2023, and the total number of negative backtesting exceptions within the most recent 250-business-day window
remained at one. As these backtesting exceptions remained below five, the FINMA VaR multiplier used to compute
regulatory and stressed VaR RWA was unchanged at three throughout the period.
For Credit Suisse, there were three new negative backtesting exceptions in the first half of 2023, and the total number
of negative backtesting exceptions within the most recent 250-business-day window was unchanged at three. As these
backtesting exceptions remained below five, the FINMA VaR multiplier used to compute regulatory and stressed VaR RWA
was unchanged at three throughout the period.
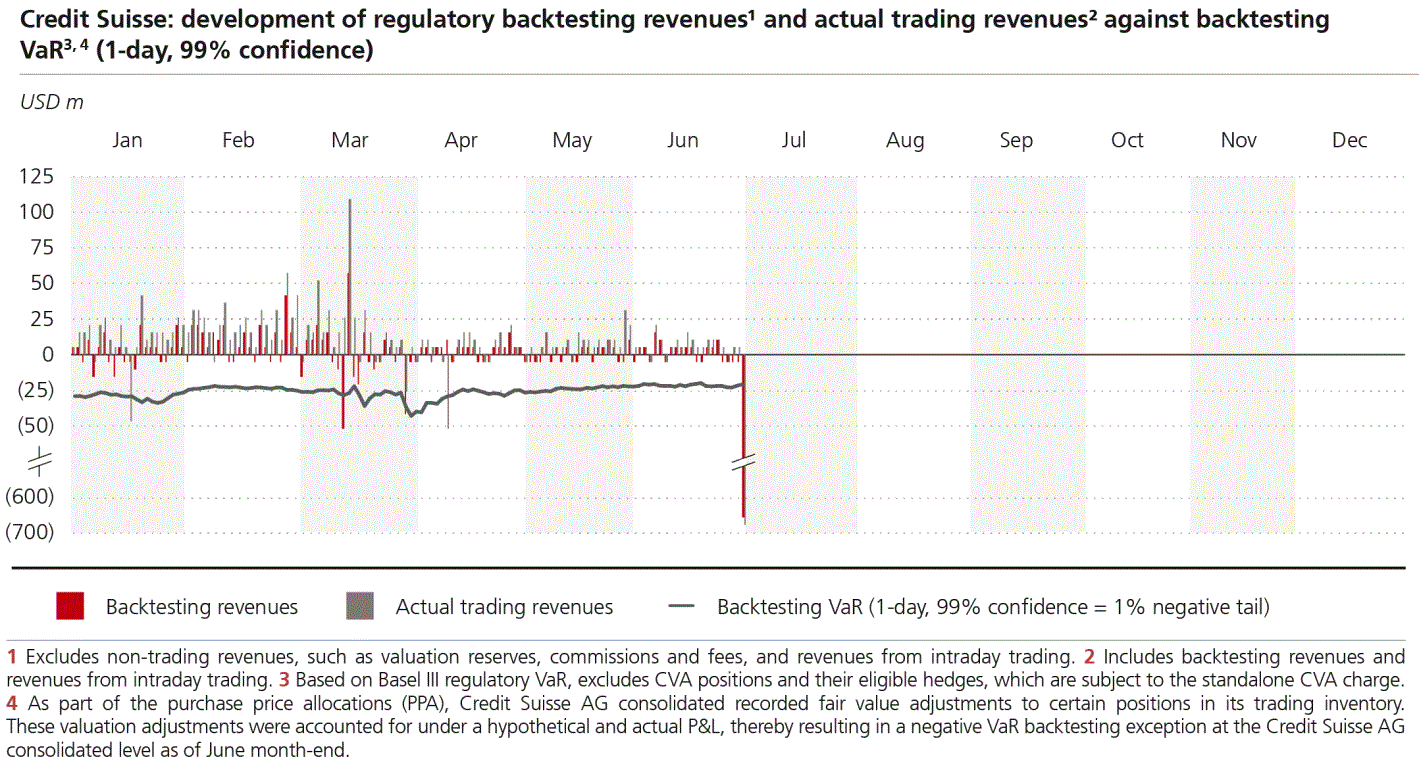
30 June 2023 Pillar 3 Report |
UBS Group | Market risk 37
p
30 June 2023 Pillar 3 Report |
UBS Group | Going and gone concern requirements and eligible capital 38
Going and gone concern requirements and eligible
capital
Quarterly |
The table below provides details of the Swiss systemically relevant bank (SRB) going and gone concern capital
requirements as required by the Swiss Financial Market Supervisory Authority (FINMA ).
›
Refer to the “Capital management” section of the UBS Group second quarter 2023 report, available under ”Quarterly reporting”
at
ubs.com/investors
, for more information about capital management
Swiss SRB going and gone concern requirements and information
As of 30.6.23
RWA
LRD
USD m, except where indicated
in %
in %
Required going concern capital
Total going concern capital
1
1
Common equity tier 1 capital
2
of which: minimum capital
of which: buffer capital
of which: countercyclical buffer
of which: Pillar 2 add-on
Maximum additional tier 1 capital
of which: additional tier 1 capital
of which: additional tier 1 buffer capital
Eligible going concern capital
Total going concern capital
Common equity tier 1 capital
Total loss-absorbing additional tier 1 capital
4
of which: high-trigger loss-absorbing additional tier 1 capital
of which: low-trigger loss-absorbing additional tier 1 capital
Required gone concern capital
Total gone concern loss-absorbing capacity
5,6,7
of which: base requirement including add-ons for market share and LRD
Eligible gone concern capital
Total gone concern loss-absorbing capacity
Total tier 2 capital
of which: non-Basel III-compliant tier 2 capital
TLAC-eligible senior unsecured debt
Total loss-absorbing capacity
Required total loss-absorbing capacity
Eligible total loss-absorbing capacity
Risk-weighted assets / leverage ratio denominator
Risk-weighted assets
Leverage ratio denominator
1 Includes applicable add-ons of 1.44% for risk-weighted assets (RWA) and 0.50% for leverage ratio denominator (LRD). 2 Our minimum CET1 leverage ratio requirement of 3.56% consists of a 1.5% base
requirement, a 1.5% base buffer capital requirement, a 0.25% LRD add-on requirement, a 0.25% market share add-on requirement based on our Swiss credit business and a 0.06% Pillar 2 capital add-on related to
the supply chain funds matter at Credit Suisse. 3 Reflects the FINMA Pillar 2 capital add-on related to the supply chain finance funds matter at Credit Suisse. 4 Includes outstanding low-trigger loss-absorbing
additional tier 1 capital instruments, which are available under the Swiss systemically relevant bank framework to meet the going concern requirements until their first call date. As of their first call date, these
instruments are eligible to meet the gone concern requirements. 5 A maximum of 25% of the gone concern requirements can be met with instruments that have a remaining maturity of between one and two years.
Once at least 75% of the minimum gone concern requirement has been met with instruments that have a remaining maturity of greater than two years, all instruments that have a remaining maturity of between one
and two years remain eligible to be included in the total gone concern capital. 6 From 1 January 2023, the resolvability discount on the gone concern capital requirements for systemically important banks (SIBs) has
been replaced with reduced base gone concern capital requirements equivalent to 75% of the total going concern requirements (excluding countercyclical buffer requirements). 7 As of July 2024, the Swiss Financial
Market Supervisory Authority (FINMA) will have the authority to impose a surcharge of up to 25% of the total going concern capital requirements should obstacles to an SIB’s resolvability be identified in future
resolvability assessments. 8 Includes applicable add-ons of 1.08% for RWA and 0.38% for LRD.
p
30 June 2023 Pillar 3 Report |
UBS Group | Going and gone concern requirements and eligible capital 39
Semi-annual |
countercyclical capital buffer (CCyB) requirement applicable to UBS Group AG consolidated. In the first half of 2023, the
CCyB for Australia was set at 1%, effective from 1 January 2023, the CCyB for Germany was set at 0.75%, effective
from 1 February 2023, the CCyB for France was set at 0.5%, effective from 7 April 2023, the CCyB for the Netherlands
was set at 1%, effective from 25 May 2023, and the CCyB for Sweden was increased from 1% to 2%, effective from
22 June 2023, on private-sector exposures. These updates increased our bank-specific CCyB requirement to 10 basis
points as of 30 June 2023. The acquisition of the Credit Suisse Group further increased our CCyB requirement to 11 basis
points.
›
Refer to the “Risk management and control” section of the Annual Report 2022, available under ”Annual reporting” at
ubs.com/investors
, for further information about the methodology of geographical allocation used
CCyB1 – Geographical distribution of credit exposures used in the countercyclical capital buffer
USD m, except where indicated
30.6.23
Geographical breakdown
Countercyclical buffer
capital buffer rate, %
1
Risk-weighted assets
used in the
computation of the
countercyclical capital
buffer
1
Bank-specific
countercyclical capital
buffer rate, %
Countercyclical
amount
Hong Kong SAR
Luxembourg
United Kingdom
Sweden
Australia
Germany
France
Netherlands
Sum
Total
1 Included private-sector exposures in the countries that are Basel Committee on Banking Supervision (BCBS)-member jurisdictions, under the following categories: “Credit risk,” “Counterparty credit risk,” “Equity
positions in the banking book,” “Settlement risk,” “Securitization exposures in the banking book” and “Amounts below thresholds for deduction,” as well as the corresponding trading book charges included under
“Market Risk.”
p
Explanation of the differences between the IFRS and regulatory scopes of consolidation
Semi-annual |
USD 15,112m; total equity on a standalone basis as of 30 June 2023: USD 28m) represented the most significant entity
that was included in the International Financial Reporting Standards (IFRS) scope of consolidation but not in the regulatory
scope of consolidation. This life insurance entity accounts for most of the difference between the “Balance sheet in
accordance with IFRS scope of consolidation” and the “Balance sheet in accordance with regulatory scope of
consolidation” columns in the CC2 table. The difference is mainly related to financial assets at fair value not held for
trading and other financial liabilities designated at fair value. Further differences are mainly related to other entities that
are not active in banking and finance industries and therefore are not consolidated under the regulatory scope of
consolidation.
In the banking book, certain equity investments are not consolidated under either the IFRS or under the regulatory scope.
As of 30 June 2023, these investments mainly consisted of infrastructure holdings and joint operations (e.g., settlement
and clearing institutions, and stock and financial futures exchanges) and included our participation in SIX Group. These
investments are risk-weighted based on applicable threshold rules.
›
Refer to our legal entity structure, available under “Holding company and significant regulated subsidiaries and sub-groups” at
ubs.com/investors
, for more information about the legal structure of UBS Group, and to “Note 1 Summary of material accounting
policies” in the “Consolidated financial statements” section of the Annual Report 2022, available under “Annual reporting” at
ubs.com/investors
, for more information about the IFRS scope of consolidation
›
Refer to the “Linkage between financial statements and regulatory exposures” section of the 31 December 2022 Pillar 3 Report,
available under “Pillar 3 disclosures” at
ubs.com/investors
, for more information about differences between the IFRS and
regulatory scopes of consolidation
p
30 June 2023 Pillar 3 Report |
UBS Group | Going and gone concern requirements and eligible capital 40
Semi-annual |
The CC2 table below provides a reconciliation of the IFRS balance sheet to the balance sheet according to the
regulatory scope of consolidation as defined by the Basel Committee on Banking Supervision (the BCBS) and FINMA.
Lines in the balance sheet under the regulatory scope of consolidation are expanded and referenced where relevant to
display all components that are used in the “CC1: Composition of regulatory capital” table.
CC2: Reconciliation of accounting balance sheet to balance sheet under the regulatory scope of consolidation
As of 30.6.23
Balance sheet in
accordance with
IFRS scope
of consolidation
Effect of
deconsolidated,
proportionally
consolidated or
additional consolidated
entities for regulatory
consolidation
Balance sheet in
accordance with
regulatory scope of
consolidation
References
1
USD m
Assets
Cash and balances at central banks
Amounts due from banks
Receivables from securities financing transactions
Cash collateral receivables on derivative instruments
Loans and advances to customers
Other financial assets measured at amortized cost
Total financial assets measured at amortized cost
Financial assets at fair value held for trading
of which: assets pledged as collateral that may be sold or repledged by counterparties
Derivative financial instruments
Brokerage receivables
Financial assets at fair value not held for trading
Total financial assets measured at fair value through profit or loss
Financial assets measured at fair value through other comprehensive income
Investments in associates
of which: goodwill
Property, equipment and software
Goodwill and intangible assets
of which: goodwill
of which: intangible assets
Deferred tax assets
of which: deferred tax assets recognized for tax loss carry-forwards and unused tax credits
carried forward
of which: deferred tax assets on temporary differences
Other non-financial assets
of which: net defined benefit pension and other post-employment assets
Total assets
30 June 2023 Pillar 3 Report |
UBS Group | Going and gone concern requirements and eligible capital 41
CC2: Reconciliation of accounting balance sheet to balance sheet under the regulatory scope of consolidation
(continued)
As of 30.6.23
Balance sheet in
accordance with
IFRS scope
of consolidation
Effect of
deconsolidated,
proportionally
consolidated or
additional consolidated
entities for regulatory
consolidation
Balance sheet in
accordance with
regulatory scope of
consolidation
References
1
USD m
Liabilities
Amounts due to banks
Payables from securities financing transactions
Cash collateral payables on derivative instruments
Customer deposits
Debt issued measured at amortized cost
of which: amount eligible for high-trigger loss-absorbing additional tier 1 capital
of which: amount eligible for low-trigger loss-absorbing additional tier 1 capital
of which: amount eligible for low-trigger loss-absorbing tier 2 capital
Other financial liabilities measured at amortized cost
Total financial liabilities measured at amortized cost
Financial liabilities at fair value held for trading
Derivative financial instruments
Brokerage payables designated at fair value
Debt issued designated at fair value
Other financial liabilities designated at fair value
Total financial liabilities measured at fair value through profit or loss
Provisions and contingent liabilities
Other non-financial liabilities
of which: amount eligible for high-trigger loss-absorbing capital (Deferred Contingent
Capital Plan (DCCP))
2
of which: deferred tax liabilities related to goodwill
of which: deferred tax liabilities related to other intangible assets
Total liabilities
Equity
Share capital
Share premium
Treasury shares
Retained earnings
Other comprehensive income recognized directly in equity, net of tax
of which: unrealized gains / (losses) from cash flow hedges
Equity attributable to shareholders
Equity attributable to non-controlling interests
Total equity
Total liabilities and equity
1 References link the lines of this table to the respective reference numbers provided in the “References” column in the “CC1: Composition of regulatory capital” table in this section. 2 The IFRS carrying amount of
total DCCP liabilities was USD 1,548m as of 30 June 2023. Refer to the “Compensation” section of the Annual Report 2022, available under ”Annual reporting” at ubs.com/investors, for more information about the
DCCP.
p
30 June 2023 Pillar 3 Report |
UBS Group | Going and gone concern requirements and eligible capital 42
Semi-annual |
The CC1 table below provides the composition of capital in the format prescribed by the BCBS and FINMA, and
is based on BCBS Basel III rules, unless stated otherwise. Reference is made to items reconciling to the balance sheet
under the regulatory scope of consolidation as disclosed in the “CC2: Reconciliation of accounting balance sheet to
balance sheet under the regulatory scope of consolidation” table in this section.
›
Refer to “Capital and total loss-absorbing capacity instruments of UBS Group AG consolidated and UBS AG consolidated and
standalone – key features” and “UBS Group AG consolidated capital instruments and TLAC-eligible senior unsecured debt,”
available under “Bondholder information” at
ubs.com/investors,
instruments, as well as the full terms and conditions
CC1: Composition of regulatory capital
As of 30.6.23
Amounts
References
1
USD m, except where indicated
Common Equity Tier 1 capital: instruments and reserves
1
Directly issued qualifying common share (and equivalent for non-joint stock companies) capital plus related stock surplus
2
Retained earnings
3
Accumulated other comprehensive income (and other reserves)
5
Common share capital issued by subsidiaries and held by third parties (amount allowed in group CET1)
6
Common Equity Tier 1 capital before regulatory adjustments
Common Equity Tier 1 capital: regulatory adjustments
7
Prudent valuation adjustments
8
Goodwill (net of related tax liability)
9
Other intangibles other than mortgage servicing rights (net of related tax liability)
10
Deferred tax assets that rely on future profitability, excluding those arising from temporary differences (net of related tax liability)
2
11
Cash flow hedge reserve
12
Shortfall of provisions to expected losses
13
Securitization gain on sale
14
Gains and losses due to changes in own credit risk on fair valued liabilities
15
Defined benefit pension fund net assets
16
Investments in own shares (if not already subtracted from paid-in capital on reported balance sheet)
17
Reciprocal cross-holdings in common equity
17a
Qualified holdings where a significant influence is exercised with other owners (CET1 instruments)
17b
Immaterial investments (CET1 items)
18
Investments in the capital of banking, financial and insurance entities that are outside the scope of regulatory consolidation, where the bank
does not own more than 10% of the issued share capital (amount above 10% threshold)
19
Significant investments in the common stock of banking, financial and insurance entities that are outside the scope of regulatory consolidation
(amount above 10% threshold)
20
Mortgage servicing rights (amount above 10% threshold)
21
Deferred tax assets arising from temporary differences (amount above 10% threshold, net of related tax liability)
22
Amount exceeding the 15% threshold
23
Of which: significant investments in the common stock of financials
24
Of which: mortgage servicing rights
25
Of which: deferred tax assets arising from temporary differences
26
Expected losses on equity investment under the PD / LGD approach
26a
Further adjustments to financial statements in accordance with a recognized international accounting standard
26b
Other adjustments
3,4
27
Regulatory adjustments applied to Common Equity Tier 1 due to insufficient Additional Tier 1 and Tier 2 to cover deductions
28
Total regulatory adjustments to Common Equity Tier 1
29
Common Equity Tier 1 capital (CET1)
30 June 2023 Pillar 3 Report |
UBS Group | Going and gone concern requirements and eligible capital 43
CC1: Composition of regulatory capital (continued)
As of 30.6.23
Amounts
References
1
USD m, except where indicated
Additional Tier 1 capital: instruments
30
Directly issued qualifying additional Tier 1 instruments plus related stock surplus
31
Of which: classified as equity under applicable accounting standards
32
Of which: classified as liabilities under applicable accounting standards
34
Additional Tier 1 instruments (and CET1 instruments not included in row 5) issued by subsidiaries and held by third parties (amount allowed in
group AT1)
36
Additional Tier 1 capital before regulatory adjustments
Additional Tier 1 capital: regulatory adjustments
37
Investments in own additional Tier 1 instruments
5
38
Reciprocal cross-holdings in additional Tier 1 instruments
38a
Qualified holdings where a significant influence is exercised with other owners (AT1 instruments)
38b
Immaterial investments (AT1 instruments)
39
Investments in the capital of banking, financial and insurance entities that are outside the scope of regulatory consolidation, where the bank
does not own more than 10% of the issued common share capital of the entity (amount above 10% threshold)
40
Significant investments in the capital of banking, financial and insurance entities that are outside the scope of regulatory consolidation
41
Other adjustments
42
Regulatory adjustments applied to additional Tier 1 due to insufficient Tier 2 to cover deductions
42a
Regulatory adjustments applied to CET1 capital due to insufficient additional Tier 1 to cover deductions
43
Total regulatory adjustments to additional Tier 1 capital
44
Additional Tier 1 capital (AT1)
45
Tier 1 capital (T1 = CET1 + AT1)
Tier 2 capital: instruments and provisions
46
Directly issued qualifying Tier 2 instruments plus related stock surplus
6
48
Tier 2 instruments (and CET1 and AT1 instruments not included in rows 5 or 34) issued by subsidiaries and held by third parties (amount
allowed in group Tier 2)
50
Provisions
51
Tier 2 capital before regulatory adjustments
Tier 2 capital: regulatory adjustments
52
Investments in own Tier 2 instruments
5
53
Reciprocal cross-holdings in Tier 2 instruments and other TLAC liabilities
53a
Qualified holdings where a significant influence is exercised with other owners (T2 instruments and other TLAC instruments)
53b
Immaterial investments (T2 instruments and other TLAC instruments)
54
Investments in the capital and other TLAC liabilities of banking, financial and insurance entities that are outside the scope of regulatory
consolidation, where the bank does not own more than 10% of the issued common share capital of the entity (amount above 10% threshold)
55
Significant investments in the capital and other TLAC liabilities of banking, financial and insurance entities that are outside the scope of
regulatory consolidation (net of eligible short positions)
56
Other adjustments
56a
Excess of the adjustments, which are allocated to the AT1 capital
57
Total regulatory adjustments to Tier 2 capital
58
Tier 2 capital (T2)
59
Total regulatory capital (TC = T1 + T2)
60
Total risk-weighted assets
Capital ratios and buffers
61
Common Equity Tier 1 (as a percentage of risk-weighted assets)
62
Tier 1 (as a percentage of risk-weighted assets)
63
Total capital (as a percentage of risk-weighted assets)
64
Institution-specific buffer requirement (capital conservation buffer plus countercyclical buffer requirements plus higher loss absorbency
requirement, expressed as a percentage of risk-weighted assets)
7
65
Of which: capital conservation buffer requirement
66
Of which: bank-specific countercyclical buffer requirement
67
Of which: higher loss absorbency requirement
68
Common Equity Tier 1 (as a percentage of risk-weighted assets) available after meeting the bank’s minimum capital requirements
Amounts below the thresholds for deduction (before risk weighting)
72
Non-significant investments in the capital and other TLAC liabilities of other financial entities
73
Significant investments in the common stock of financial entities
74
Mortgage servicing rights (net of related tax liability)
75
Deferred tax assets arising from temporary differences (net of related tax liability)
Applicable caps on the inclusion of provisions in Tier 2
76
Provisions eligible for inclusion in Tier 2 in respect of exposures subject to standardized approach (prior to application of cap)
77
Cap on inclusion of provisions in Tier 2 under standardized approach
78
Provisions eligible for inclusion in Tier 2 in respect of exposures subject to internal ratings-based approach (prior to application of cap)
79
Cap for inclusion of provisions in Tier 2 under internal ratings-based approach
1 References link the lines of this table to the respective reference numbers provided in the “References” column in the “CC2: Reconciliation of accounting balance sheet to balance sheet under the regulatory scope
of consolidation” table in this section. 2 IFRS netting for deferred tax assets and liabilities is reversed for items deducted from CET1 capital. 3 Includes USD 803m in compensation-related charge for regulatory
capital purposes. 4 Includes USD 4,897m related to transitional CET1 purchase price allocation adjustments. Refer to the “Key metrics” section of this report for more information. 5 Under IFRS, debt issued and
subsequently repurchased is treated as extinguished. 6 Consists of own instruments held and 45% of the gross unrealized gains on debt instruments measured at fair value through other comprehensive income,
which are measured at the lower of cost or market value for regulatory capital purposes. 7 BCBS requirements are exceeded by our Swiss SRB requirements. Refer to the “Capital, liquidity and funding, and balance
sheet“ section of the Annual Report 2022, available under ”Annual reporting” at ubs.com/investors, for more information about the Swiss SRB requirements.
p
30 June 2023 Pillar 3 Report |
UBS Group | Total loss-absorbing capacity 44
Total loss-absorbing capacity
Resolution group – composition of total loss-absorbing capacity
Semi-annual |
The TLAC1 table below is based on Basel Committee on Banking Supervision (BCBS) rules, and only applicable
to UBS Group AG as the ultimate parent entity of the defined UBS resolution group, to which, in case of resolution,
resolution tools (e.g., a bail-in) are expected to be applied.
In the first half of 2023, our eligible additional tier 1 (AT1) instruments increased by USD 0.2bn, mainly driven by interest
rate risk hedge, foreign currency translation and other effects .
Our eligible tier 2 (T2) instruments decreased by USD 2.4bn, mainly due to a USD 2.4bn T2 capital instrument that ceased
to be eligible as it had less than one year to maturity.
Non-regulatory capital instruments increased by USD 58.2bn, mainly due to the acquisition of the Credit Suisse Group,
as 48 total loss-absorbing capacity (TLAC)-eligible senior unsecured debt instruments denominated in US dollars, euro,
pounds sterling and yen, amounting to USD 53.5bn equivalent, that were originally issued by the Credit Suisse Group
were assumed as gone concern capital by the UBS Group. In addition, an increase of USD 8.6bn was driven by 15 new
issuances of TLAC-eligible senior unsecured debt instruments , denominated in US dollars, euro, Australian dollars and
yen. These effects by calls of three TLAC-eligible unsecured debt instruments denominated in US dollars
��
were partly offsetand Swiss francs amounting to USD 2.4bn equivalent, USD 0.8bn equivalent TLAC-eligible senior unsecured debt that
ceased to be eligible as it had less than one year to maturity, and USD 0.8bn reflecting nominal amounts of two
instruments bought back under a tender offer. On 6 July 2023, UBS announced that it would redeem TLAC-eligible senior
unsecured debt on 30 July 2023 (ISINs 144A: US902613AB45 / Reg S: USH42097BS52 with a nominal amount of
USD 1.3bn, issued on 30 July 2020). This instrument remained eligible as gone concern capital as of 30 June 2023 .
TLAC1: composition for G-SIBs (at resolution group level)
30.6.23
31.12.22
USD m, except where indicated
Regulatory capital elements of TLAC and adjustments
1
Common Equity Tier 1 capital (CET1)
2
Additional Tier 1 capital (AT1) before TLAC adjustments
3
AT1 ineligible as TLAC as issued out of subsidiaries to third parties
4
Other adjustments
5
Total AT1 instruments eligible under the TLAC framework
6
Tier 2 capital (T2) before TLAC adjustments
7
Amortized portion of T2 instruments where remaining maturity > 1 year
8
T2 capital ineligible as TLAC as issued out of subsidiaries to third parties
9
Other adjustments
10
Total T2 instruments eligible under the TLAC framework
11
TLAC arising from regulatory capital
Non-regulatory capital elements of TLAC
12
External TLAC instruments issued directly by the bank and subordinated to excluded liabilities
13
External TLAC instruments issued directly by the bank which are not subordinated to excluded liabilities but meet all other TLAC term sheet
requirements
14
of which: amount eligible as TLAC after application of the caps
15
External TLAC instruments issued by funding vehicles prior to 1 January 2022
16
Eligible ex ante commitments to recapitalize a G-SIB in resolution
17
TLAC arising from non-regulatory capital instruments before adjustments
Non-regulatory capital elements of TLAC: adjustments
18
TLAC before deductions
19
Deductions of exposures between multiple-point-of-entry (MPE) resolution groups that correspond to items eligible for TLAC (not applicable to
SPE G-SIBs)
20
Deduction of investments in own other TLAC liabilities
21
Other adjustments to TLAC
22
TLAC after deductions
Risk-weighted assets and leverage exposure measure for TLAC purposes
23
Total risk-weighted assets adjusted as permitted under the TLAC regime
24
Leverage exposure measure
TLAC ratios and buffers
25
TLAC (as a percentage of risk-weighted assets adjusted as permitted under the TLAC regime)
26
TLAC (as a percentage of leverage exposure)
27
CET1 (as a percentage of risk-weighted assets) available after meeting the resolution group’s minimum capital and TLAC requirements
28
Institution-specific buffer requirement (capital conservation buffer plus countercyclical buffer requirements plus higher loss absorbency
requirement, expressed as a percentage of risk-weighted assets)
29
of which: capital conservation buffer requirement
30
of which: bank-specific countercyclical buffer requirement
31
of which: higher loss absorbency requirement
p
30 June 2023 Pillar 3 Report |
UBS Group | Total loss-absorbing capacity 45
Resolution entity – creditor ranking at legal entity level
Semi-annual |
The TLAC3 table below provides an overview of the creditor ranking structure of the resolution entity,
UBS Group AG, on a standalone basis.
UBS Group AG issues loss-absorbing AT1 capital instruments and TLAC-eligible senior unsecured debt.
UBS Group AG grants Deferred Contingent Capital Plan (DCCP) awards to UBS Group employees, which qualify as
Basel III AT1 capital on a UBS Group consolidated basis and totaled USD 1,912m as of 30 June 2023 (31 December 2022:
USD 1,794m). The related liabilities of UBS Group AG on a standalone basis of USD 1,298m (31 December 2022:
USD 1,365m) are not included in the table below, as these do not give rise to any current claims until the awards are
legally vested.
On 12 June 2023, UBS Group AG formally acquired Credit Suisse Group AG. As a result, the table below includes the
merged positions with Credit Suisse Group AG as they may apply. AT1 instruments formerly issued by Credit Suisse
Group AG in a total amount of USD 17,314m were written down on 19 March 2023.
As of 30 June 2023, the TLAC available on a UBS Group AG consolidated basis amounted to USD 196,040m
(31 December 2022: USD 105,312m).
›
Refer to “Bondholder information” at
ubs.com/investors
›
Refer to the “TLAC1: composition for G-SIBs (at resolution group level)” table in this section for more information about TLAC for
UBS Group AG consolidated
TLAC3: creditor ranking at legal entity level for the resolution entity, UBS Group AG
As of 30.6.23
Creditor ranking
Total
USD m
1
2
3
1
Description of creditor ranking
Common shares
(most junior)
2
Additional Tier 1
Bail-in debt and
pari passu
liabilities (most
senior)
2
Total capital and liabilities net of credit risk mitigation
1
3
Subset of row 2 that are excluded liabilities
4
Total capital and liabilities less excluded liabilities (row 2 minus row 3)
3,4,5
6,7
5
Subset of row 4 that are potentially eligible as TLAC
8
6
Subset of row 5 with 1 year ≤ residual maturity < 2 years
9
7
Subset of row 5 with 2 years ≤ residual maturity < 5 years
8
Subset of row 5 with 5 years ≤ residual maturity < 10 years
9
Subset of row 5 with residual maturity ≥ 10 years, but excluding perpetual securities
10
Subset of row 5 that is perpetual securities
1 No credit risk mitigation is applied to capital and liabilities for UBS Group AG standalone. 2 Common shares including the associated reserves are equal to the equity of UBS Group AG standalone attributable to
shareholders. 3 Includes interest expense accrued on AT1 capital instruments, which is not eligible as TLAC. 4 An AT1 instrument in the amount of USD 2bn was redeemed during the six months ended 30 June
2023. 5 AT1 capital instruments in the total amount of USD 17.3bn formerly issued by Credit Suisse Group AG were written-down on 19 March 2023. 6 Includes interest expense accrued on bail-in debt, interest-
bearing liabilities that consist of loans from UBS AG and UBS Switzerland AG, negative replacement values, and tax and other liabilities that are not excluded liabilities under Swiss law and that rank pari passu to bail-
in debt. 7 Bail-in debt of USD 6.4bn was redeemed and bail-in debt of USD 8.7bn was issued during the six months ended 30 June 2023. 8 Bail-in debt of USD 0.8bn has residual maturity of less than one year
and is not potentially eligible as TLAC. 9 Includes bail-in debt in the amount of USD 1.3bn, the call of which was announced on 6 July 2023 (redemption date 30 July 2023).
p
Leverage ratio
Basel III leverage ratio
Quarterly |
table in section 2 of this report, is calculated by dividing the period-end tier 1 capital by the period-end leverage ratio
denominator (the LRD).
The LRD consists of on-balance sheet assets and off-balance sheet items based on International Financial Reporting
Standards (IFRS). Derivative exposures are adjusted for a number of items, including replacement values and eligible cash
variation margin netting, the current exposure method add-on for potential future exposure and net notional amounts
for written credit derivatives. The LRD also includes an additional charge for counterparty credit risk related to securities
financing transactions (SFTs).
The table below shows the difference between total IFRS assets per the IFRS consolidation scope and the BCBS total on-
balance sheet exposures. Those exposures are the starting point for calculating the BCBS LRD, as shown in the LR2 table
in this section. The difference is due to the application of the regulatory scope of consolidation for the purpose of the
BCBS calculation. In addition, carrying amounts for derivative financial instruments and SFTs are deducted from IFRS total
assets. They are measured differently under BCBS leverage ratio rules and are therefore added back in separate exposure
line items in the LR2 table.
30 June 2023 Pillar 3 Report |
UBS Group | Leverage ratio 46
Difference between the Swiss SRB and BCBS leverage ratio
The LRD is the same under Swiss systemically relevant bank (SRB) and BCBS rules. However, there is a difference in the
capital numerator between the two frameworks. Under BCBS rules only common equity tier 1 and additional tier 1 capital
are included in the numerator. Under Swiss SRB rules UBS is required to meet going and gone concern leverage ratio
requirements. Therefore, depending on the requirement, the numerator includes tier 1 capital instruments, tier 2 capital
instruments and / or total loss-absorbing capacity-eligible senior unsecured debt.
Reconciliation of IFRS total assets to BCBS Basel III total on-balance sheet exposures excluding derivatives and
securities financing transactions
USD m
30.6.23
31.3.23
31.12.22
On-balance sheet exposures
IFRS total assets
Adjustment for investments in banking, financial, insurance or commercial entities that are consolidated for accounting purposes
but outside the scope of regulatory consolidation
Adjustment for investments in banking, financial, insurance or commercial entities that are outside the scope of consolidation for
accounting purposes but consolidated for regulatory purposes
Adjustment for fiduciary assets recognized on the balance sheet pursuant to the operative accounting framework but excluded from
the leverage ratio exposure measure
Less carrying amount of derivative financial instruments in IFRS total assets
Less carrying amount of securities financing transactions in IFRS total assets
Adjustments to accounting values
On-balance sheet items excluding derivatives and securities financing transactions, but including collateral
Asset amounts deducted in determining BCBS Basel III tier 1 capital
Transitional CET1 purchase price allocation adjustments
Total on-balance sheet exposures (excluding derivatives and securities financing transactions)
p
Quarterly |
the acquisition of the Credit Suisse Group , which resulted in an increase of USD 644.4bn.
On-balance sheet exposures (excluding derivatives and SFTs) increased by USD 479.1bn, primarily driven by the acquisition
of the Credit Suisse Group, which resulted in an increase of USD 464.2bn. Excluding that acquisition, on-balance sheet
exposures increased by USD 14.9bn, due to higher central bank balances and trading portfolio assets, partly offset by
lower lending balances.
Derivative exposures increased by USD 49.9bn, primarily driven by the acquisition of the Credit Suisse Group, which
resulted in an increase of USD 48.8bn. Excluding that acquisition, derivative exposures increased by USD 1.1bn, mainly
due to an increase in trading volumes driven by equity option contracts in Global Wealth Management and market-driven
movements on foreign-currency and interest-rate contracts in the Investment Bank.
SFT exposures increased by USD 65.0bn, primarily driven by the acquisition of the Credit Suisse Group, which resulted in
an increase of USD 63.5bn. Excluding that acquisition, SFT exposures increased by USD 1.5bn, due to collateral sourcing
activities.
Off-balance sheet exposures increased by USD 66.0bn, primarily driven by the acquisition of the Credit Suisse Group,
which resulted in an increase of USD 64.6bn. Excluding that acquisition, off-balance sheet exposures increased by
USD 1.4bn, largely due to an increase in credit risk guarantees in Global Wealth Management.
›
Refer to “Leverage ratio denominator” in the “Capital management” section of the UBS Group second quarter 2023 report,
available under ”Quarterly reporting” at
ubs.com/investors
, for more information
30 June 2023 Pillar 3 Report |
UBS Group | Leverage ratio 47
LR1: BCBS Basel III leverage ratio summary comparison
USD m
30.6.23
31.3.23
31.12.22
1
Total consolidated assets as per published financial statements
2
Adjustment for investments in banking, financial, insurance or commercial entities that are consolidated for accounting
purposes but outside the scope of regulatory consolidation
1
3
Adjustment for fiduciary assets recognized on the balance sheet pursuant to the operative accounting framework but excluded
from the leverage ratio exposure measure
4
Adjustments for derivative financial instruments
5
Adjustment for securities financing transactions (i.e., repos and similar secured lending)
6
Adjustment for off-balance sheet items (i.e., conversion to credit equivalent amounts of off-balance sheet exposures)
7
Other adjustments
7a
of which: Transitional CET1 purchase price allocation adjustments
7b
of which: consolidated entities under the regulatory scope of consolidation
8
Leverage ratio exposure (leverage ratio denominator)
1 Includes assets that are deducted from tier 1 capital.
LR2: BCBS Basel III leverage ratio common disclosure
USD m, except where indicated
30.6.23
31.3.23
31.12.22
On-balance sheet exposures
1
On-balance sheet items (excluding derivatives and securities financing transactions (SFTs), but including collateral)
2
(Asset amounts deducted in determining Basel III Tier 1 capital)
2a
Transitional CET1 purchase price allocation adjustments
3
Total on-balance sheet exposures (excluding derivatives and SFTs)
Derivative exposures
4
Replacement cost associated with all derivatives transactions (i.e., net of eligible cash variation margin)
5
Add-on amounts for PFE associated with all derivatives transactions
6
Gross-up for derivatives collateral provided where deducted from the balance sheet assets pursuant to the operative
accounting framework
7
(Deductions of receivables assets for cash variation margin provided in derivatives transactions)
8
(Exempted QCCP leg of client-cleared trade exposures)
9
Adjusted effective notional amount of all written credit derivatives
1
10
(Adjusted effective notional offsets and add-on deductions for written credit derivatives)
2
11
Total derivative exposures
Securities financing transaction exposures
12
Gross SFT assets (with no recognition of netting), after adjusting for sale accounting transactions
13
(Netted amounts of cash payables and cash receivables of gross SFT assets)
14
CCR exposure for SFT assets
15
Agent transaction exposures
16
Total securities financing transaction exposures
Other off-balance sheet exposures
17
Off-balance sheet exposure at gross notional amount
18
(Adjustments for conversion to credit equivalent amounts)
19
Total off-balance sheet items
Total exposures (leverage ratio denominator)
Capital and total exposures (leverage ratio denominator)
20
Tier 1 capital
21
Total exposures (leverage ratio denominator)
Leverage ratio
22
Basel III leverage ratio (%)
1 Includes protection sold, including agency transactions. 2 Protection sold can be offset with protection bought on the same underlying reference entity, provided that the conditions according to the Basel III
leverage ratio framework and disclosure requirements are met.
p
30 June 2023 Pillar 3 Report |
UBS Group | Liquidity and funding 48
Liquidity and funding
Liquidity coverage ratio
Quarterly |
We monitor the liquidity coverage ratio (the LCR) in all significant currencies in order to manage any currency
mismatch between high-quality liquid assets (HQLA) and the net expected cash outflows in times of stress.
p
Pillar 3 disclosure requirement
Second quarter 2023 report section
Disclosure
Second quarter 2023 report page number
Concentration of funding sources
Balance sheet and off-balance sheet
Liabilities by product and currency
58
High-quality liquid assets
Quarterly |
HQLA must be easily and immediately convertible into cash at little or no loss of value, especially during a period
of stress. HQLA are assets that are of low risk and are unencumbered. Other characteristics of HQLA are ease and certainty
of valuation, low correlation with risky assets, listing of the assets on a developed and recognized exchange, existence of
an active and sizable market for the assets, and low volatility. Our HQLA predominantly consist of assets that qualify as
Level 1 in the LCR framework, including cash, central bank reserves and government bonds. In the second quarter of
2023, our HQLA increased following the acquisition of the Credit Suisse Group, but the composition thereof was
unchanged.
High-quality liquid assets (HQLA)
Average 2Q23
1
Average 1Q23
1
USD bn, except where indicated
Level 1
weighted
liquidity
value
2
Level 2
weighted
liquidity
value
2
Total
weighted
liquidity
value
2
Level 1
weighted
liquidity
value
2
Level 2
weighted
liquidity
value
2
Total
weighted
liquidity
value
2
Cash balances
3
Securities (on- and off-balance sheet)
Total HQLA
4
1 Calculated based on an average of 64 data points in the second quarter of 2023 and 64 data points in the first quarter of 2023. 2 Calculated after the application of haircuts and, where applicable, caps on Level 2
assets. 3 Includes cash and balances with central banks and other eligible balances as prescribed by FINMA. 4 Calculated in accordance with FINMA requirements.
p
30 June 2023 Pillar 3 Report |
UBS Group | Liquidity and funding 49
LCR development during the second quarter of 2023
Quarterly |
The quarterly average LCR of the UBS Group increased 13.3 percentage points to 175.2%, remaining above the
prudential requirement communicated by the Swiss Financial Market Supervisory Authority (FINMA). This average was
calculated based on a simple average of 64 data points in the second quarter of 2023, which includes Credit Suisse’s
business activity from the acquisition date to 30 June 2023, i.e., 15 business days from 12 June 2023. The post-
acquisition, 15-day average LCR of the UBS Group was 199.5%.
›
Refer to the “Acquisition of Credit Suisse Group” section of the UBS Group second quarter 2023 report, available under “Quarterly
reporting” at
ubs.com/investors
, report for more information
The movement in the average LCR was primarily driven by an increase in HQLA of USD 26.9bn to USD 257.1bn. This
increase was substantially related to the Credit Suisse HQLA, which were mainly made up of cash and government bonds.
The 15-day average HQLA of the UBS Group following the acquisition of the Credit Suisse Group was USD 372.1bn.
The increase in HQLA was partly offset by a USD 2.8bn increase in net cash outflows to USD 145.0bn, predominantly
attributable to Credit Suisse’s net cash outflows related to customer deposits, credit commitments and derivatives. These
outflows were partly offset by inflows from loans in Credit Suisse, as well as lower outflows from deposits and prime
brokerage transactions of the UBS Group excluding Credit Suisse. The 15-day average net cash outflows of the UBS
Group following the acquisition of the Credit Suisse Group was USD 186.5bn.
LIQ1: Liquidity coverage ratio
Average 2Q23
1
Average 1Q23
1
USD bn, except where indicated
Unweighted
value
Weighted
value
2
Unweighted
value
Weighted
value
2
High-quality liquid assets (HQLA)
1
Total HQLA
Cash outflows
2
Retail deposits and deposits from small business customers
3
of which: stable deposits
4
of which: less stable deposits
5
Unsecured wholesale funding
6
of which: operational deposits (all counterparties)
7
of which: non-operational deposits (all counterparties)
8
of which: unsecured debt
9
Secured wholesale funding
10
Additional requirements:
11
of which: outflows related to derivatives and other transactions
12
of which: outflows related to loss of funding on debt products
3
13
of which: committed credit and liquidity facilities
14
Other contractual funding obligations
15
Other contingent funding obligations
16
Total cash outflows
Cash inflows
17
Secured lending
18
Inflows from fully performing exposures
19
Other cash inflows
20
Total cash inflows
Average 2Q23
1
Average 1Q23
1
USD bn, except where indicated
Total adjusted
value
4
Total adjusted
value
4
Liquidity coverage ratio (LCR)
21
Total HQLA
22
Net cash outflows
23
LCR (%)
1 Calculated based on an average of 64 data points in the second quarter of 2023 and 64 data points in the first quarter of 2023. 2 Calculated after the application of haircuts and inflow and outflow rates.
3 Includes outflows related to loss of funding on asset -backed securities, covered bonds, other structured financing instruments, asset-backed commercial papers, structured entities (conduits), securities investment
vehicles and other such financing facilities. 4 Calculated after the application of haircuts and inflow and outflow rates, as well as, where applicable, caps on Level 2 assets and cash inflows.
p
30 June 2023 Pillar 3 Report |
UBS Group | Liquidity and funding 50
Net stable funding ratio
Net stable funding ratio development during the second quarter of 2023
Semi-annual |
As of 30 June 2023, the net stable funding ratio (the NSFR) of the UBS Group decreased by 0.1 percentage
points to 117.6%, remaining above the prudential requirement communicated by FINMA. The NSFR for the UBS Group
excluding Credit Suisse improved compared with 31 March 2023, and this effect was offset by the acquisition of the
Credit Suisse Group.
Available stable funding increased by USD 316.8bn to USD 873.1bn, predominantly driven by the acquisition of the Credit
Suisse Group, mainly reflecting deposit balances, debt securities issued, regulatory capital and, to a lesser extent, securities
financing transactions. The increase in the UBS Group excluding Credit Suisse was predominantly driven by higher
customer deposits and debt securities issued.
Required stable funding increased by USD 269.4bn to USD 742.1bn, substantially reflecting the acquisition of the Credit
Suisse Group. This balance predominantly includes lending assets and, to a lesser extent, derivative balances and trading
portfolio assets. Required stable funding in the UBS Group excluding Credit Suisse decreased slightly, mainly driven by
lower trading assets.
LIQ2: Net stable funding ratio (NSFR)
30.6.23
31.3.23
Unweighted value by residual maturity
Unweighted value by residual maturity
USD bn
No Maturity
< 6 months
6 months to
< 1 year
≥ 1 year
Weighted
Value
No Maturity
< 6 months
6 months to
< 1 year
≥ 1 year
Weighted
Value
Available Stable Funding (ASF) Item
1
Capital:
87.0
10.3
97.2
56.8
10.9
67.6
2
Regulatory Capital
87.0
9.8
96.7
56.8
10.3
67.1
3
Other Capital Instruments
0.5
0.5
0.6
0.6
4
Retail deposits and deposits from small business
customers:
381.6
16.9
13.2
373.7
289.0
8.6
11.7
281.2
5
Stable deposits
36.2
34.4
34.4
32.6
6
Less stable deposits
345.4
16.9
13.2
339.3
254.6
8.6
11.7
248.5
7
Wholesale Funding:
536.8
58.2
235.7
389.4
322.1
33.4
105.7
201.1
8
Operational Deposits
76.8
38.4
49.4
24.7
9
Other wholesale funding
460.0
58.2
235.7
351.0
272.7
33.4
105.7
176.4
10
Liabilities with matching interdependent assets
3.9
4.0
11
Other liabilities:
47.5
142.2
0.1
2.1
12.7
42.3
96.0
0.0
3.1
6.4
12
NSFR derivative liabilities
2.1
1
13
All other liabilities and equity not included in the
above categories
47.5
142.2
0.1
2.1
12.7
42.3
96.0
0.0
1.0
6.4
14
Total ASF
873.1
556.3
Required Stable Funding (RSF) Item
15
Total NSFR high-quality liquid assets (HQLA)
30.9
28.2
16
Deposits held at other financial institutions for
operational purposes
16.4
8.5
9.3
5.0
17
Performing loans and securities:
49.8
302.1
61.4
505.6
575.1
46.4
164.4
25.8
318.9
356.9
18
Performing loans to financial institutions secured by
Level 1 HQLA or Level 2a HQLA
78.4
1.9
0.2
9.6
33.3
1.7
0.0
6.3
19
Performing loans to financial institutions secured by
Level 2b HQLA or non-HQLA and unsecured
performing loans to financial institutions
80.3
11.3
67.0
88.0
62.8
5.8
38.3
53.6
20
Performing loans to non-financial corporate clients,
loans to retail and small business customers, and
loans to sovereigns, central banks and PSEs, of which:
117.9
25.5
175.7
216.0
56.6
11.5
109.7
126.5
21
With a risk weight of less than or equal to 35%
under Basel II standardised approach for credit risk
2.5
0.1
9.6
7.3
0.5
0.2
2.2
2.1
22
Performing residential mortgages, of which:
23.2
20.3
244.4
200.9
8.4
5.5
157.7
117.3
23
With a risk weight of less than or equal to 35%
under Basel II standardised approach for credit risk
11.2
10.5
220.7
169.6
7.4
5.3
140.7
101.9
24
Securities that are not in default and do not qualify as
HQLA, including exchange-traded equities
49.8
2.3
2.4
18.3
60.6
46.4
3.2
1.4
13.2
53.2
25
Assets with matching interdependent liabilities
4.0
3.9
26
Other assets:
44.6
56.2
0.1
142.0
120.0
37.1
44.7
0.1
81.1
80.0
27
Physical traded commodities, including gold
1.8
1.5
0.6
0.5
28
Assets posted as initial margin for derivative contracts
and contributions to default funds of CCPs
38.9
1
33.1
26.4
1
22.4
29
NSFR derivative assets
0.5
1
0.5
30
NSFR derivative liabilities before deduction of variation
margin posted
79.8
1
16.0
45.7
1
9.1
31
All other assets not included in the above categories
42.8
56.2
0.1
22.8
68.9
36.6
44.7
0.1
9.0
47.9
32
Off-balance sheet items
16.6
9.5
141.2
7.7
18.1
7.8
35.3
2.6
33
Total RSF
742.1
472.7
34
Net Stable Funding Ratio (%)
117.6
117.7
1 The ≥ 1 year maturity bucket includes balances for which differentiation by maturity is not required.
p
30 June 2023 Pillar 3 Report |
UBS Group | Requirements for global systemically important banks and related indicators 51
Requirements for global systemically important banks
and related indicators
Semi-annual |
The Financial Stability Board (the FSB) has determined that UBS is a global systemically important bank (a G-SIB),
using an indicator-based methodology adopted by the Basel Committee on Banking Supervision (the BCBS). Banks that
qualify as G-SIBs are required to disclose 13 indicators for assessing the systemic importance of G-SIBs as defined by the
BCBS. These indicators are used for the G-SIB score calculation and cover five categories: size, cross-jurisdictional activity,
interconnectedness, substitutability / financial institution infra structure, and complexity.
Based on the published indicators, G-SIBs are subject to additional common equity tier 1 (CET1) capital buffer
requirements in a range from 1.0% to 3.5%. In November 2022, the FSB confirmed that, based on the year-end 2021
indicators, the additional CET1 capital buffer requirement for the UBS Group will remain at 1.0%. An updated assessment
from the FSB will become available in November 2023.
BCBS requirements are minimum requirements that regulators must put in place in their respective jurisdictions. Based
on the BCBS assessment in 2022, the Swiss SRB capital requirements exceed the BCBS requirements. Following the
acquisition of the Credit Suisse Group, the BCBS may change the G-SIB buffer requirement in its upcoming assessment.
Even if this resulted in the highest G-SIB buffer requirement currently assigned to any bank, which is 2.5%, UBS would
not be affected by these additional G-SIB requirements, as the Swiss SRB capital requirement would still be higher. As
our Swiss systemically relevant bank Basel
III capital requirements exceed the BCBS requirements, including the G-SIB
buffer, we are not affected by these additional G-SIB requirements.
The BCBS introduced a leverage ratio buffer for G-SIBs as a part of the finalization of the Basel
III framework announced
in December 2017. The leverage ratio buffer is set at 50% of risk-weighted higher-loss absorbency requirements.
Implementation of the final Basel
III framework in Switzerland is expected to enter into force on 1
January 2025. We do
not expect these changes to increase our additional CET1 capital buffer requirement.
Our G-SIB indicators as of 31 December 2022 were published in July 2023 under “Pillar 3 disclosures” at
ubs.com/investors
.
p
30 June 2023 Pillar 3 Report |
Significant regulated subsidiaries and sub-groups | Introduction 52
Significant regulated subsidiaries
and sub-groups
Introduction
Scope of disclosures in this section
The sections below include capital and other regulatory information as of 30 June 2023 for UBS AG consolidated, UBS AG
standalone, UBS Switzerland AG standalone, UBS Europe SE consolidated, UBS Americas Holding LLC consolidated,
Credit Suisse AG consolidated, Credit Suisse AG standalone, Credit Suisse (Schweiz) AG consolidated, Credit Suisse
(Schweiz) AG standalone, Credit Suisse International standalone and Credit Suisse Holdings (USA), Inc. consolidated.
Capital information in the following sections is based on Pillar 1 capital requirements. Entities may be subject to significant
additional Pillar 2 requirements, which represent additional amounts of capital considered necessary and are agreed with
regulators based on the risk profile of the respective entity.
UBS Americas Holding LLC consolidated and Credit Suisse Holdings (USA), Inc. consolidated
Recent events in the US banking market
In May 2023, the Federal Reserve Board (the FRB) and the Federal Deposit Insurance Corporation (the FDIC) released
reports that covered the circumstances leading to the closing of certain banking organizations following the events in
the banking market in March 2023. The reports noted shortcomings in the supervisory agencies’ execution of examination
programs, including escalation of supervisory issues and staffing. They also raised concerns related to the regulatory
framework, including the Federal Reserve’s Tailoring Rule and other topics, such as interest rate risk management. UBS
expects these developments to impact the regulatory environment in the US, where UBS maintains significant operations.
Federal Reserve Board releases stress test results
In June 2023, the Federal Reserve Board released the results of its 2023 Dodd–Frank Act Stress Test (DFAST). UBS’s US
intermediate holding company, UBS Americas Holding LLC, and Credit Suisse’s intermediate holding, Credit Suisse
Holdings (USA), Inc., exceeded the minimum capital requirements under the severely adverse scenario. Following the
completion of the annual DFAST and the Comprehensive Capital Analysis and Review (CCAR), UBS Americas Holding
LLC was assigned a stress capital buffer (an SCB) of 9.1% (previously 4.8%) under the SCB rule as of 1 October 2023,
resulting in a total common equity tier 1 (CET1) capital requirement of 13.6%. Credit Suisse Holdings (USA), Inc. was
assigned an SCB of 7.2% (previously 9.0%), resulting in a total CET1 capital requirement of 11.7%.
US authorities consult on final Basel III implementation
In July 2023, US banking regulators, including the FRB, the FDIC and the Office of the Comptroller of the Currency (the
OCC), issued a public consultation on a proposal that would implement the final components of the Basel III capital
standards for US banking organizations and foreign-owned intermediate holding companies, such as UBS Americas
Holding LLC and Credit Suisse Holdings (USA), Inc. Among others, the proposed rules would end the use of the internal
model approach for credit risk by the largest banking organizations and would introduce instead a new standardized
approach. In addition, the proposed rules for operational risks would replace the advanced measurement approach with
a standardized measure. The proposal calls for a three-year transition period, starting on 1 July 2025, and full
implementation by 1 July 2028. The impact on UBS will depend on new or revised regulatory interpretations, changes in
business growth, market conditions and other factors.
30 June 2023 Pillar 3 Report |
Significant regulated subsidiaries and sub-groups | UBS AG consolidated 53
UBS AG consolidated
Key metrics of the second quarter of 2023
Quarterly |
The table below is based on Basel Committee on Banking Supervision (BCBS) Basel III rules and International
Financial Reporting Standards (IFRS).
During the second quarter of 2023, tier 1 capital decreased by USD 0.1bn to USD 55.0bn. Common equity tier 1 (CET1)
capital increased by USD 0.5bn to USD 43.3bn, mainly reflecting operating profit before tax of USD 1.5bn, with
associated current tax expenses of USD 0.4bn, and positive effects from foreign currency translation of USD 0.2bn, partly
offset by additional dividend accruals of USD 0.9bn. Additional tier 1 (AT1) capital decreased by USD 0.6bn, mainly driven
by one high-trigger loss-absorbing AT1 capital instrument previously on-lent from the Group to UBS AG that was
transferred to Credit Suisse AG on 30 June 2023.
Risk-weighted assets (RWA) increased by USD 2.2bn to USD 323.4bn during the second quarter of 2023, primarily driven
by credit risk and counterparty credit risk, mainly as a result of an increase in loans and loan commitments in Personal &
Corporate Banking and Global Wealth Management, partly offset by decreases in market risk and non-counterparty-
related risk RWA.
Leverage ratio exposure increased by USD 30.3bn to USD 1,048.3bn, mainly driven by higher central bank balances,
lending and trading portfolio assets, as well as increases in securities financing transactions , derivatives and off-balance
sheet exposures.
Correspondingly, the CET1 capital ratio of UBS AG consolidated increased to 13.4% from 13.3%, reflecting the
aforementioned increase in the CET1 capital, largely offset by the increase in RWA. The Basel III leverage ratio decreased
to 5.2% from 5.4%, mainly reflecting the higher leverage ratio exposure.
In the second quarter of 2023, the average liquidity coverage ratio (the LCR) of UBS AG consolidated stood at 170.9%.
This average LCR was calculated based on the average for the 15 business days from the formal acquisition date of
Credit Suisse Group on 12 June 2023 until the end of the second quarter of 2023.
As of 30 June 2023, the net stable funding ratio of UBS AG consolidated stood at 118.2%.
30 June 2023 Pillar 3 Report |
Significant regulated subsidiaries and sub-groups | UBS AG consolidated 54
KM1: Key metrics
USD m, except where indicated
30.6.23
Available capital (amounts)
1
Common Equity Tier 1 (CET1)
1
1a
Fully loaded ECL accounting model CET1
2
Tier 1
1
2a
Fully loaded ECL accounting model Tier 1
3
Total capital
1
3a
Fully loaded ECL accounting model total capital
Risk-weighted assets (amounts)
4
Total risk-weighted assets (RWA)
4a
Minimum capital requirement
2
4b
Total risk-weighted assets (pre-floor)
Risk-based capital ratios as a percentage of RWA
5
CET1 ratio (%)
1
5a
Fully loaded ECL accounting model CET1 ratio (%)
6
Tier 1 ratio (%)
1
6a
Fully loaded ECL accounting model Tier 1 ratio (%)
7
Total capital ratio (%)
1
7a
Fully loaded ECL accounting model total capital ratio (%)
Additional CET1 buffer requirements as a percentage of RWA
8
Capital conservation buffer requirement (%)
9
Countercyclical buffer requirement (%)
9a
Additional countercyclical buffer for Swiss mortgage loans (%)
10
Bank G-SIB and / or D-SIB additional requirements (%)
3
11
Total of bank CET1 specific buffer requirements (%)
4
12
CET1 available after meeting the bank’s minimum capital requirements (%)
Basel III leverage ratio
13
Total Basel III leverage ratio exposure measure
14
Basel III leverage ratio (%)
1
14a
Fully loaded ECL accounting model Basel III leverage ratio (%)
Liquidity coverage ratio (LCR)
5
15
Total high-quality liquid assets (HQLA)
16
Total net cash outflow
16a
of which: cash outflows
16b
of which: cash inflows
17
LCR (%)
170.94
Net stable funding ratio (NSFR)
18
Total available stable funding
564,491
19
Total required stable funding
477,615
20
NSFR (%)
118.19
1 As of 1 July 2022, our capital amounts exclude the transitional relief of recognizing ECL allowances and provisions in CET1 capital in accordance with FINMA Circular 2013/1 “Eligible capital – banks”. 2 Calculated
as 8% of total RWA, based on total capital minimum requirements, excluding CET1 buffer requirements. 3 Swiss SRB going and gone concern requirements and information for UBS AG consolidated are provided
below in this section. 4 Excludes non-BCBS capital buffer requirements for risk-weighted positions that are directly or indirectly backed by residential properties in Switzerland. 5 Calculated after the application of
haircuts and inflow and outflow rates, as well as, where applicable, caps on Level 2 assets and cash inflows. Calculated based on an average of 15 data points in the second quarter of 2023 from the formal acquisition
date of Credit Suisse Group as of 12 June 2023.
p
30 June 2023 Pillar 3 Report |
Significant regulated subsidiaries and sub-groups | UBS AG consolidated 55
Swiss SRB going and gone concern requirements and information
Quarterly |
The tables below provide details of the Swiss systemically relevant bank RWA- and leverage ratio denominator-
based going and gone concern requirements and information as required by the Swiss Financial Market Supervisory
Authority (FINMA). Details regarding eligible gone concern instruments are provided below.
In November 2022, the Swiss Federal Council adopted amendments to the Banking Act and the Banking Ordinance,
which entered into force as of 1 January 2023. The amendments replaced the resolvability discount on the gone concern
capital requirements for systemically important banks (SIBs), including UBS, with reduced base gone concern capital
requirements equivalent to 75% of the total going concern requirements (excluding countercyclical buffer requirements).
In addition, as of July 2024, FINMA will have the authority to impose a surcharge of up to 25% of the total going concern
capital requirements based on obstacles to the SIB’s resolvability identified in future resolvability assessments. UBS AG’s
consolidated total gone concern requirements remained substantially unchanged in the second quarter of 2023 as a
result of these changes. Outstanding high- and low-trigger loss-absorbing tier 2 capital instruments, non-Basel III-
compliant tier 2 capital instruments and total loss-absorbing capacity-eligible senior unsecured debt instruments are
eligible to meet gone concern requirements until one year before maturity.
More information about the going and gone concern requirements and information is provided in the “UBS AG
consolidated total loss-absorbing capacity and leverage ratio information ” section of the Annual Report 2022, available
under “Annual reporting” at
ubs.com/investors.
Swiss SRB going and gone concern requirements and information
As of 30.6.23
RWA
LRD
USD m, except where indicated
in %
in %
Required going concern capital
Total going concern capital
1
1
Common equity tier 1 capital
2
of which: minimum capital
of which: buffer capital
of which: countercyclical buffer
Maximum additional tier 1 capital
of which: additional tier 1 capital
of which: additional tier 1 buffer capital
Eligible going concern capital
Total going concern capital
Common equity tier 1 capital
Total loss-absorbing additional tier 1 capital
of which: high-trigger loss-absorbing additional tier 1 capital
of which: low-trigger loss-absorbing additional tier 1 capital
3
Required gone concern capital
Total gone concern loss-absorbing capacity
4,5,6
of which: base requirement including add-ons for market share and LRD
Eligible gone concern capital
Total gone concern loss-absorbing capacity
Total tier 2 capital
of which: non-Basel III-compliant tier 2 capital
TLAC-eligible senior unsecured debt
Total loss-absorbing capacity
Required total loss-absorbing capacity
Eligible total loss-absorbing capacity
Risk-weighted assets / leverage ratio denominator
Risk-weighted assets
Leverage ratio denominator
1 Includes applicable add-ons of 1.44% for risk-weighted assets (RWA) and 0.50% for leverage ratio denominator (LRD). 2 UBS AG’s minimum CET1 leverage ratio requirement of 3.5% consists of a 1.5% base
requirement, a 1.5% base buffer capital requirement, a 0.25% LRD add-on requirement and a 0.25% market share add-on requirement based on the Swiss credit business. 3 Existing outstanding low-trigger
additional tier 1 capital instruments qualify as going concern capital at the UBS AG consolidated level, as agreed with FINMA, until their first call date. As of their first call date, these instruments are eligible to meet
the gone concern requirements. 4 A maximum of 25% of the gone concern requirements can be met with instruments that have a remaining maturity of between one and two years. Once at least 75% of the
minimum gone concern requirement has been met with instruments that have a remaining maturity of greater than two years, all instruments that have a remaining maturity of between one and two years remain
eligible to be included in the total gone concern capital. 5 From 1 January 2023, the resolvability discount on the gone concern capital requirements for systemically important banks (SIBs) has been replaced with
reduced base gone concern capital requirements equivalent to 75% of the total going concern requirements (excluding countercyclical buffer requirements). 6 As of July 2024, FINMA will have the authority to
impose a surcharge of up to 25% of the total going concern capital requirements should obstacles to an SIB’s resolvability be identified in future resolvability assessments. 7 Includes applicable add-ons of 1.08%
for RWA and 0.38% for LRD.
30 June 2023 Pillar 3 Report |
Significant regulated subsidiaries and sub-groups | UBS AG consolidated 56
Swiss SRB going and gone concern information
USD m, except where indicated
30.6.23
31.3.23
31.12.22
Eligible going concern capital
Total going concern capital
Total tier 1 capital
Common equity tier 1 capital
Total loss-absorbing additional tier 1 capital
of which: high-trigger loss-absorbing additional tier 1 capital
of which: low-trigger loss-absorbing additional tier 1 capital
Eligible gone concern capital
Total gone concern loss-absorbing capacity
Total tier 2 capital
of which: low-trigger loss-absorbing tier 2 capital
of which: non-Basel III-compliant tier 2 capital
TLAC-eligible senior unsecured debt
Total loss-absorbing capacity
Total loss-absorbing capacity
Risk-weighted assets / leverage ratio denominator
Risk-weighted assets
Leverage ratio denominator
Capital and loss-absorbing capacity ratios (%)
Going concern capital ratio
of which: common equity tier 1 capital ratio
Gone concern loss-absorbing capacity ratio
Total loss-absorbing capacity ratio
Leverage ratios (%)
Going concern leverage ratio
of which: common equity tier 1 leverage ratio
Gone concern leverage ratio
Total loss-absorbing capacity leverage ratio
p
30 June 2023 Pillar 3 Report |
Significant regulated subsidiaries and sub-groups | UBS AG standalone 57
UBS AG standalone
Key metrics of the second quarter of 2023
Quarterly |
The table below is based on Basel Committee on Banking Supervision (BCBS) Basel III rules and International
Financial Reporting Standards (IFRS).
During the second quarter of 2023, tier 1 capital decreased by USD 0.2bn to USD 65.6bn. Common equity tier 1 (CET1)
capital increased by USD 0.4bn to USD 53.9bn, mainly reflecting operating profit before tax, largely offset by additional
accruals for capital returns to UBS Group AG. Additional tier 1 (AT1) capital decreased by USD 0.6bn, mainly driven by
one high-trigger loss-absorbing AT1 capital instrument previously on-lent from the Group to UBS AG that was transferred
to Credit Suisse AG on 30 June 2023.
Phase-in risk-weighted assets (RWA) decreased by USD 4.9bn to USD 343.4bn during the second quarter of 2023,
primarily driven by a decrease in participation RWA, partly offset by an increase in credit and counterparty credit risk.
Leverage ratio exposure increased by USD 16.8bn to USD 606.2bn, mainly driven by higher lending balances, central
bank balances, trading portfolio assets and derivative exposure , partly offset by lower other non-financial assets.
Correspondingly, the CET1 capital ratio of UBS AG standalone increased to 15.7% from 15.4%, primarily reflecting the
decrease in RWA. The firm’s Basel III leverage ratio decreased to 10.8% from 11.2%, mainly reflecting the higher leverage
ratio exposure.
In the second quarter of 2023, the quarterly average liquidity coverage ratio (the LCR) of UBS AG standalone increased
18.9 percentage points to 208.0%, remaining above the prudential requirement communicated by the Swiss Financial
Market Supervisory Authority (FINMA). The increase in average LCR was mainly driven by a decrease in net cash outflows
of USD 5.3bn to USD 47.1bn due to lower outflows from prime brokerage and higher inflows from securities financing
transactions. High-quality liquid assets were stable at USD 97.7bn.
As of 30 June 2023, the net stable funding ratio increased by 1.2 percentage points to 89.4%, remaining above the
prudential requirement communicated by FINMA. Available stable funding decreased by USD 1.1bn to USD 253.9bn,
largely driven by lower equity, mainly due to the dividend distribution in April 2023, substantially offset by an increase in
debt issued and higher customer deposits. Required stable funding decreased by USD 5.1bn to USD 283.9bn, mainly
driven by the release of the prior-year dividend accrual following the dividend distribution and lower investments in
subsidiaries and trading assets, partly offset by higher lending assets, largely due to funding provided to Credit Suisse,
and higher derivative balances.
30 June 2023 Pillar 3 Report |
Significant regulated subsidiaries and sub-groups | UBS AG standalone 58
KM1: Key metrics
USD m, except where indicated
30.6.23
31.3.23
31.12.22
30.9.22
30.6.22
Available capital (amounts)
1
Common Equity Tier 1 (CET1)
1
1a
Fully loaded ECL accounting model CET1
2
Tier 1
1
2a
Fully loaded ECL accounting model Tier 1
3
Total capital
1
3a
Fully loaded ECL accounting model total capital
Risk-weighted assets (amounts)
2
4
Total risk-weighted assets (RWA)
4a
Minimum capital requirement
3
4b
Total risk-weighted assets (pre-floor)
Risk-based capital ratios as a percentage of RWA
2
5
CET1 ratio (%)
1
5a
Fully loaded ECL accounting model CET1 ratio (%)
6
Tier 1 ratio (%)
1
6a
Fully loaded ECL accounting model Tier 1 ratio (%)
7
Total capital ratio (%)
1
7a
Fully loaded ECL accounting model total capital ratio (%)
Additional CET1 buffer requirements as a percentage of RWA
8
Capital conservation buffer requirement (%)
9
Countercyclical buffer requirement (%)
9a
Additional countercyclical buffer for Swiss mortgage loans (%)
10
Bank G-SIB and / or D-SIB additional requirements (%)
4
11
Total of bank CET1 specific buffer requirements (%)
5
12
CET1 available after meeting the bank’s minimum capital requirements (%)
Basel III leverage ratio
13
Total Basel III leverage ratio exposure measure
14
Basel III leverage ratio (%)
1
14a
Fully loaded ECL accounting model Basel III leverage ratio (%)
Liquidity coverage ratio (LCR)
6
15
Total high-quality liquid assets (HQLA)
16
Total net cash outflow
16a
of which: cash outflows
16b
of which: cash inflows
17
LCR (%)
207.98
Net stable funding ratio (NSFR)
7
18
Total available stable funding
253,927
254,983
254,433
241,505
244,791
19
Total required stable funding
283,937
288,991
280,166
263,308
265,597
20
NSFR (%)
89.43
88.23
90.82
91.72
92.17
1 As of 1 July 2022, our capital amounts exclude the transitional relief of recognizing ECL allowances and provisions in CET1 capital in accordance with FINMA Circular 2013/1 “Eligible capital – banks”. 2 Based
on phase-in rules for RWA. Refer to “Swiss SRB going and gone concern requirements and information” below for more information. 3 Calculated as 8% of total RWA, based on total capital minimum requirements,
excluding CET1 buffer requirements. 4 Swiss SRB going and gone concern requirements and information for UBS AG standalone are provided below in this section. 5 Excludes non-BCBS capital buffer requirements
for risk-weighted positions that are directly or indirectly backed by residential properties in Switzerland. 6 Calculated after the application of haircuts and inflow and outflow rates, as well as, where applicable, caps
on Level 2 assets and cash inflows. Calculated based on an average of 64 data points in the second quarter of 2023 and 64 data points in the first quarter of 2023. For the prior-quarter data points, refer to the
respective Pillar 3 Report, available under “Pillar 3 disclosures” at ubs.com/investors, for more information. 7 In accordance with Art. 17h para. 3 and 4 of the Liquidity Ordinance, UBS AG standalone is required to
maintain a minimum NSFR of at least 80% without taking into account excess funding of UBS Switzerland AG and 100% after taking into account such excess funding.
p
30 June 2023 Pillar 3 Report |
Significant regulated subsidiaries and sub-groups | UBS AG standalone 59
Swiss SRB going and gone concern requirements and information
Quarterly |
The tables below provide details of the Swiss systemically relevant bank RWA- and leverage ratio denominator-
based going and gone concern requirements and information as required by FINMA. Details regarding eligible gone
concern instruments are provided below.
Following the amendments to the Banking Act and the Banking Ordinance that entered into force as of 1 January 2023,
UBS AG standalone is subject to a gone concern capital requirement based on the sum of: (i) the nominal value of the
gone concern instruments issued by UBS entities and held by the parent firm; (ii) 75% of the capital requirements resulting
from third-party exposure on a standalone basis; and (iii) a buffer requirement equal to 30% of the Group’s gone concern
capital requirement on UBS AG’s consolidated exposure. A transitional period until 2024 has been granted for the buffer
requirement. The gone concern capital coverage ratio reflects how much gone concern capital is available to meet the
gone concern requirement. Outstanding high- and low-trigger loss-absorbing tier 2 capital instruments, non-Basel III-
compliant tier 2 capital instruments and total loss-absorbing capacity-eligible senior unsecured debt instruments are
eligible to meet gone concern requirements until one year before maturity.
More information about the going and gone concern requirements and information is provided in the “UBS AG
standalone” section of the 31 December 2022 Pillar 3 Report, available under “Pillar 3 disclosures” at
ubs.com/investors.
Swiss SRB going and gone concern requirements and information
As of 30.6.23
RWA, phase-in
RWA, fully applied as of 1.1.28
LRD
USD m, except where indicated
in %
in %
in %
Required going concern capital
Total going concern capital
1
1
1
Common equity tier 1 capital
of which: minimum capital
of which: buffer capital
of which: countercyclical buffer
Maximum additional tier 1 capital
of which: additional tier 1 capital
of which: additional tier 1 buffer capital
Eligible going concern capital
Total going concern capital
Common equity tier 1 capital
Total loss-absorbing additional tier 1 capital
of which: high-trigger loss-absorbing additional tier 1 capital
of which: low-trigger loss-absorbing additional tier 1 capital
Risk-weighted assets / leverage ratio denominator
Risk-weighted assets
Leverage ratio denominator
Required gone concern capital
2
Higher of RWA- or LRD-based
Total gone concern loss-absorbing capacity
Eligible gone concern capital
Total gone concern loss-absorbing capacity
Gone concern capital coverage ratio
1 Includes applicable add-ons of 1.44% for risk-weighted assets (RWA) and 0.50% for leverage ratio denominator (LRD). 2 A maximum of 25% of the gone concern requirements can be met with instruments that
have a remaining maturity of between one and two years. Once at least 75% of the minimum gone concern requirement has been met with instruments that have a remaining maturity of greater than two years, all
instruments that have a remaining maturity of between one and two years remain eligible to be included in the total gone concern capital.
30 June 2023 Pillar 3 Report |
Significant regulated subsidiaries and sub-groups | UBS AG standalone 60
Swiss SRB going and gone concern information
USD m, except where indicated
30.6.23
31.3.23
31.12.22
Eligible going concern capital
Total going concern capital
Total tier 1 capital
Common equity tier 1 capital
Total loss-absorbing additional tier 1 capital
of which: high-trigger loss-absorbing additional tier 1 capital
of which: low-trigger loss-absorbing additional tier 1 capital
Eligible gone concern capital
Total gone concern loss-absorbing capacity
Total tier 2 capital
of which: low-trigger loss-absorbing tier 2 capital
of which: non-Basel III-compliant tier 2 capital
TLAC-eligible senior unsecured debt
Total loss-absorbing capacity
Total loss-absorbing capacity
Denominators for going and gone concern ratios
Risk-weighted assets, phase-in
of which: investments in Switzerland-domiciled subsidiaries
1
of which: investments in foreign-domiciled subsidiaries
1
Risk-weighted assets, fully applied as of 1.1.28
of which: investments in Switzerland-domiciled subsidiaries
1
of which: investments in foreign-domiciled subsidiaries
1
Leverage ratio denominator
Capital and loss-absorbing capacity ratios (%)
Going concern capital ratio, phase-in
of which: common equity tier 1 capital ratio, phase-in
Going concern capital ratio, fully applied as of 1.1.28
of which: common equity tier 1 capital ratio, fully applied as of 1.1.28
Leverage ratios (%)
Going concern leverage ratio
of which: common equity tier 1 leverage ratio
Capital coverage ratio (%)
Gone concern capital coverage ratio
1 Net exposures for direct and indirect investments including holding of regulatory capital instruments in Switzerland-domiciled subsidiaries and for direct and indirect investments including holding of regulatory
capital instruments in foreign-domiciled subsidiaries are risk-weighted at 225% and 300%, respectively, for the current year. Risk weights will gradually increase by 5 percentage points per year for Switzerland-
domiciled investments and 20 percentage points per year for foreign-domiciled investments until the fully applied risk weights of 250% and 400%, respectively, are applied.
p
30 June 2023 Pillar 3 Report |
Significant regulated subsidiaries and sub-groups | UBS Switzerland AG standalone 61
UBS Switzerland AG standalone
Key metrics of the second quarter of 2023
Quarterly |
The table below is based on Basel Committee on Banking Supervision (BCBS) Basel III rules and International
Financial Reporting Standards (IFRS).
During the second quarter of 2023, common equity tier 1 (CET1) capital was broadly stable at CHF 12.4bn, mainly as
operating profit was largely offset by additional dividend accruals.
Total risk-weighted assets (RWA) decreased by CHF 0.9bn to CHF 107.2bn, mainly driven by lower RWA from credit and
counterparty credit risk RWA.
Leverage ratio exposure was broadly unchanged compared with the first quarter of 2023.
The quarterly average liquidity coverage ratio (the LCR) of UBS Switzerland AG increased 0.5 percentage points to
142.4%, remaining above the prudential requirement communicated by the Swiss Financial Market Supervisory Authority
(FINMA). The movement in the average LCR was driven by a CHF 5.7bn decrease in average net cash outflows due to
lower average outflows from customer deposits. The effect of lower average net cash outflows was largely offset by
CHF 7.7bn lower average high-quality liquid assets due to lower cash balances with the Swiss National Bank,
predominantly resulting from a decrease in customer deposits and an ordinary dividend payout to UBS AG in April 2023.
As of 30 June 2023, the net stable funding ratio increased by 1.1 percentage points to 134.8%, remaining above the
prudential requirement communicated by FINMA. Available stable funding decreased by CHF 1.1bn to CHF 219.7bn,
mainly driven by lower equity due to the dividend distribution in April 2023, partly offset by higher customer deposits.
Required stable funding decreased by CHF 2.1bn to CHF 163.0bn, mainly driven by the release of the prior-year dividend
accrual following the dividend distribution.
30 June 2023 Pillar 3 Report |
Significant regulated subsidiaries and sub-groups | UBS Switzerland AG standalone 62
KM1: Key metrics
CHF m, except where indicated
30.6.23
31.3.23
31.12.22
30.9.22
30.6.22
Available capital (amounts)
1
Common Equity Tier 1 (CET1)
1
1a
Fully loaded ECL accounting model CET1
2
Tier 1
1
2a
Fully loaded ECL accounting model Tier 1
3
Total capital
1
3a
Fully loaded ECL accounting model total capital
Risk-weighted assets (amounts)
4
Total risk-weighted assets (RWA)
4a
Minimum capital requirement
2
4b
Total risk-weighted assets (pre-floor)
Risk-based capital ratios as a percentage of RWA
5
CET1 ratio (%)
1
5a
Fully loaded ECL accounting model CET1 ratio (%)
6
Tier 1 ratio (%)
1
6a
Fully loaded ECL accounting model Tier 1 ratio (%)
7
Total capital ratio (%)
1
7a
Fully loaded ECL accounting model total capital ratio (%)
Additional CET1 buffer requirements as a percentage of RWA
8
Capital conservation buffer requirement (%)
9
Countercyclical buffer requirement (%)
9a
Additional countercyclical buffer for Swiss mortgage loans (%)
10
Bank G-SIB and / or D-SIB additional requirements (%)
3
11
Total of bank CET1 specific buffer requirements (%)
4
12
CET1 available after meeting the bank’s minimum capital requirements (%)
Basel III leverage ratio
13
Total Basel III leverage ratio exposure measure
14
Basel III leverage ratio (%)
1
14a
Fully loaded ECL accounting model Basel III leverage ratio (%)
Liquidity coverage ratio (LCR)
5
15
Total high-quality liquid assets (HQLA)
16
Total net cash outflow
16a
of which: cash outflows
16b
of which: cash inflows
17
LCR (%)
Net stable funding ratio (NSFR)
6
18
Total available stable funding
219,728
220,838
221,689
224,149
225,178
19
Total required stable funding
163,021
165,152
162,306
158,853
156,232
20
NSFR (%)
134.79
133.72
136.59
141.10
144.13
1 As of 1 July 2022, our capital amounts exclude the transitional relief of recognizing ECL allowances and provisions in CET1 capital in accordance with FINMA Circular 2013/1 “Eligible capital – banks”. 2 Calculated
as 8% of total RWA, based on total capital minimum requirements, excluding CET1 buffer requirements. 3 Swiss SRB going and gone concern requirements and information for UBS Switzerland AG are provided
below. 4 Excludes non-BCBS capital buffer requirements for risk-weighted positions that are directly or indirectly backed by residential properties in Switzerland. 5 Calculated after the application of haircuts and
inflow and outflow rates, as well as, where applicable, caps on Level 2 assets and cash inflows. Calculated based on an average of 64 data points in the second quarter of 2023 and 64 data points in the first quarter
of 2023. For the prior-quarter data points, refer to the respective Pillar 3 Report, available under “Pillar 3 disclosures” at ubs.com/investors, for more information. 6 UBS Switzerland AG is required to maintain a
minimum NSFR of at least 100% on an ongoing basis, as defined by Art. 17h para. 1 of the Liquidity Ordinance. A portion of the excess funding is needed to fulfill the NSFR requirement of UBS AG.
p
30 June 2023 Pillar 3 Report |
Significant regulated subsidiaries and sub-groups | UBS Switzerland AG standalone 63
Swiss SRB going and gone concern requirements and information
Quarterly |
to capital regulations on a standalone basis. As of 30 June 2023, the going concern capital and leverage ratio
requirements for UBS Switzerland AG standalone were 15.13% (including a countercyclical buffer of 0.83%) and 5.00%,
respectively.
The Swiss SRB framework and requirements applicable to UBS Switzerland AG standalone are the same as those
applicable to UBS Group AG consolidated, with the exception of a lower gone concern requirement, corresponding to
62% of the Group’s gone concern requirement.
The gone concern requirements were 8.87% for the RWA-based requirement and 3.10% for the leverage ratio
denominator-based requirement.
Swiss SRB going and gone concern requirements and information
As of 30.6.23
RWA
LRD
CHF m, except where indicated
in %
in %
Required going concern capital
Total going concern capital
1
1
Common equity tier 1 capital
of which: minimum capital
of which: buffer capital
of which: countercyclical buffer
Maximum additional tier 1 capital
of which: additional tier 1 capital
of which: additional tier 1 buffer capital
Eligible going concern capital
Total going concern capital
Common equity tier 1 capital
Total loss-absorbing additional tier 1 capital
of which: high-trigger loss-absorbing additional tier 1 capital
Required gone concern capital
2
Total gone concern loss-absorbing capacity
of which: base requirement
of which: additional requirement for market share and LRD
Eligible gone concern capital
Total gone concern loss-absorbing capacity
TLAC-eligible senior unsecured debt
Total loss-absorbing capacity
Required total loss-absorbing capacity
Eligible total loss-absorbing capacity
Risk-weighted assets / leverage ratio denominator
Risk-weighted assets
Leverage ratio denominator
1 Includes applicable add-ons of 1.44% for risk-weighted assets (RWA) and 0.50% for leverage ratio denominator (LRD). 2 A maximum of 25% of the gone concern requirements can be met with instruments that
have a remaining maturity of between one and two years. Once at least 75% of the minimum gone concern requirement has been met with instruments that have a remaining maturity of greater than two years, all
instruments that have a remaining maturity of between one and two years remain eligible to be included in the total gone concern capital.
p
30 June 2023 Pillar 3 Report |
Significant regulated subsidiaries and sub-groups | UBS Switzerland AG standalone 64
Swiss SRB loss-absorbing capacity
Quarterly |
Swiss SRB going and gone concern information
CHF m, except where indicated
30.6.23
31.3.23
31.12.22
Eligible going concern capital
Total going concern capital
Total tier 1 capital
Common equity tier 1 capital
Total loss-absorbing additional tier 1 capital
of which: high-trigger loss-absorbing additional tier 1 capital
Eligible gone concern capital
Total gone concern loss-absorbing capacity
TLAC-eligible senior unsecured debt
Total loss-absorbing capacity
Total loss-absorbing capacity
Risk-weighted assets / leverage ratio denominator
Risk-weighted assets
Leverage ratio denominator
Capital and loss-absorbing capacity ratios (%)
Going concern capital ratio
of which: common equity tier 1 capital ratio
Gone concern loss-absorbing capacity ratio
Total loss-absorbing capacity ratio
Leverage ratios (%)
Going concern leverage ratio
of which: common equity tier 1 leverage ratio
Gone concern leverage ratio
Total loss-absorbing capacity leverage ratio
p
30 June 2023 Pillar 3 Report |
Significant regulated subsidiaries and sub-groups | UBS Switzerland AG standalone 65
Capital instruments
Quarterly |
Capital instruments of UBS Switzerland AG – key features
Presented according to issuance date.
Share capital
Additional tier 1 capital
1
Issuer
UBS Switzerland AG, Switzerland
UBS Switzerland AG,
Switzerland
UBS Switzerland AG,
Switzerland
UBS Switzerland AG,
Switzerland
UBS Switzerland AG,
Switzerland
UBS Switzerland AG,
Switzerland
UBS Switzerland AG,
Switzerland
UBS Switzerland AG,
Switzerland
UBS Switzerland AG,
Switzerland
2
Unique identifier (e.g., CUSIP, ISIN or
Bloomberg identifier for private placement)
–
–
3
Governing law(s) of the instrument
Swiss
Swiss
3a
Means by which enforceability requirement of
Section 13 of the TLAC Term Sheet is achieved
(for other TLAC-eligible instruments governed
by foreign law)
n/a
n/a
Regulatory treatment
4
Transitional Basel III rules
1
CET1 – going concern capital
Additional tier 1 capital
5
Post-transitional Basel III rules
2
CET1 – going concern capital
Additional tier 1 capital
6
Eligible at solo / group / group and solo
UBS Switzerland AG consolidated
and standalone
UBS Switzerland AG consolidated and standalone
7
Instrument type (types to be specified by each
jurisdiction)
Ordinary shares
Loan
3
8
Amount recognized in regulatory capital
(currency in million, as of most recent reporting
date)
1
CHF 10.0
CHF 1,000
CHF 825
USD 425
CHF 475
CHF 500
CHF 700
CHF 675
CHF 825
9
Par value of instrument (currency in million)
CHF 10.0
CHF 1,000
CHF 825
USD 425
CHF 475
CHF 500
CHF 700
CHF 675
CHF 825
10
Accounting classification
4
Equity attributable to UBS
Switzerland AG shareholders
Due to banks held at amortized cost
11
Original date of issuance
–
18 December 2017
12 December 2018
12 December 2018
11 December 2019
29 October 2020
11 March 2021
2 June 2021
2 June 2021
12
Perpetual or dated
–
Perpetual
13
Original maturity date
–
–
14
Issuer call subject to prior supervisory approval
–
Yes
30 June 2023 Pillar 3 Report |
Significant regulated subsidiaries and sub-groups | UBS Switzerland AG standalone 66
Capital instruments of UBS Switzerland AG – key features (continued)
Presented according to issuance date.
Share capital
Additional tier 1 capital
15
Optional call date, contingent call dates and
redemption amount
–
First optional
repayment date:
18 December 2022
5
First optional
repayment date:
12 December 2023
First optional
repayment date:
12 December 2023
First optional
repayment date:
11 December 2024
First optional
repayment date:
29 October 2025
First optional
repayment date:
11 March 2026
First optional
repayment date:
2 June 2026
First optional
repayment date:
2 June 2028
Repayable at any time after the first optional repayment date.
Repayment subject to FINMA approval. Optional repayment amount: principal amount, together with any accrued and unpaid interest
thereon.
Repayable on the
first optional
repayment date or
on any of every
second interest
payment date
thereafter.
Repayment subject
to FINMA approval.
Optional repayment
amount: principal
amount, together
with any accrued
and unpaid interest
thereon.
Repayable on the
first optional
repayment date or
on any interest
payment date
thereafter.
Repayment subject
to FINMA approval.
Optional repayment
amount: principal
amount, together
with any accrued
and unpaid interest
thereon.
16
Subsequent call dates, if applicable
–
Early repayment possible due to a tax or regulatory event. Repayment due to a tax event subject to FINMA approval.
Repayment amount: principal amount, together with accrued and unpaid interest.
30 June 2023 Pillar 3 Report |
Significant regulated subsidiaries and sub-groups | UBS Switzerland AG standalone 67
Capital instruments of UBS Switzerland AG – key features (continued)
Presented according to issuance date.
Share capital
Additional tier 1 capital
Coupons
17
Fixed or floating dividend / coupon
–
Floating
18
Coupon rate and any related index
–
3-month SARON
Compound
+ 250 bps
per annum quarterly
3-month SARON
Compound
+ 489 bps
per annum quarterly
3-month SOFR
Compound
+ 561 bps
per annum quarterly
3-month SARON
Compound
+ 433 bps
per annum quarterly
3-month SARON
Compound
+ 397 bps
per annum quarterly
3-month SARON
Compound
+ 337 bps
per annum quarterly
3-month SARON
Compound
+ 307 bps
per annum quarterly
3-month SARON
Compound
+ 308 bps
per annum quarterly
19
Existence of a dividend stopper
–
No
20
Fully discretionary, partially discretionary or
mandatory
Fully discretionary
Fully discretionary
21
Existence of step-up or other incentive to
redeem
–
No
22
Non-cumulative or cumulative
Non-cumulative
Non-cumulative
23
Convertible or non-convertible
–
Non-convertible
24
If convertible, conversion trigger(s)
–
–
25
If convertible, fully or partially
–
–
26
If convertible, conversion rate
–
–
27
If convertible, mandatory or optional conversion
–
–
28
If convertible, specify instrument type
convertible into
–
–
29
If convertible, specify issuer of instrument it
converts into
–
–
30
Write-down feature
–
Yes
31
If write-down, write-down trigger(s)
–
Trigger: CET1 ratio is less than 7%
FINMA determines a write-down necessary to ensure UBS Switzerland AG’s viability; or UBS Switzerland AG receives a commitment of governmental support that FINMA determines
necessary to ensure UBS Switzerland AG‘s viability. Subject to applicable conditions.
32
If write-down, fully or partially
–
Fully
33
If write-down, permanent or temporary
–
Permanent
34
If temporary write-down, description of write-
up mechanism
–
–
34a
Type of subordination
Statutory
Contractual
35
Position in subordination hierarchy in
liquidation (specify instrument type immediately
senior to instrument in the insolvency creditor
hierarchy of the legal entity concerned)
Unless otherwise stated in the
articles of association, once debts
are paid back, the assets of the
liquidated company are divided
between the shareholders pro
rata based on their contributions
and considering the preferences
attached to certain categories of
shares (Art. 745, Swiss Code of
Obligations)
Subject to any obligations that are mandatorily preferred by law, each obligation of UBS Switzerland AG that is unsubordinated or is subordinated and not ranked junior (such as all
classes of share capital) or at par (such as tier 1 instruments)
36
Non-compliant transitioned features
–
–
37
If yes, specify non-compliant features
–
–
1 Based on Swiss SRB (including transitional arrangement) requirements. 2 Based on Swiss SRB requirements applicable as of 1 January 2020. 3 Loans granted by UBS AG, Switzerland. 4 As applied in UBS Switzerland AG‘s financial statements under Swiss GAAP. 5 The entity decided not to trigger the call
option. There is no expected date for the repayment.
p
30 June 2023 Pillar 3 Report |
Significant regulated subsidiaries and sub-groups | UBS Europe SE consolidated 68
UBS Europe SE consolidated
Quarterly |
liquidity of UBS Europe SE consolidated based on Basel Committee on Banking Supervision Pillar 1 requirements and in
accordance with EU regulatory rules and International Financial Reporting Standards (IFRS).
During the second quarter of 2023, common equity tier 1 capital and total capital remained stable, at EUR 2.4bn and
EUR 3.0bn, respectively. Risk-weighted assets increased by EUR 0.6bn to EUR 11.1bn, as a result of an increase in credit
risk, mainly driven by an increase in securities financing transactions. Leverage ratio exposure increased by EUR 1.4bn to
EUR 49.4bn, mainly reflecting increase s in balances with central banks, trading inventory and holdings of high-quality
liquid assets (HQLA).
The average liquidity coverage ratio remained well above the regulatory requirements of 100%, at 152.4%. The ratio
decreased 2.6 percentage points, with a EUR 0.3bn decrease in HQLA, while net cash outflows were stable. The net
stable funding ratio decreased by 8.9 percentage points to 144.9%, with a EUR 0.5bn increase in required stable funding,
which was partly due to clients increasing their Asian market exposure.
KM1: Key metrics
1
EUR m, except where indicated
30.6.23
31.3.23
2
31.12.22
30.9.22
2
30.6.22
2
Available capital (amounts)
1
Common Equity Tier 1 (CET1)
2
Tier 1
3
Total capital
Risk-weighted assets (amounts)
4
Total risk-weighted assets (RWA)
4a
Minimum capital requirement
3
Risk-based capital ratios as a percentage of RWA
5
CET1 ratio (%)
6
Tier 1 ratio (%)
7
Total capital ratio (%)
Additional CET1 buffer requirements as a percentage of RWA
8
Capital conservation buffer requirement (%)
9
Countercyclical buffer requirement (%)
10
Bank G-SIB and / or D-SIB additional requirements (%)
11
Total of bank CET1 specific buffer requirements (%)
12
CET1 available after meeting the bank’s minimum capital requirements (%)
4
Basel III leverage ratio
13
Total Basel III leverage ratio exposure measure
14
Basel III leverage ratio (%)
5
Liquidity coverage ratio (LCR)
6
15
Total high-quality liquid assets (HQLA)
16
Total net cash outflow
17
LCR (%)
Net stable funding ratio (NSFR)
18
Total available stable funding
19
Total required stable funding
20
NSFR (%)
1 Based on applicable EU regulatory rules. 2 Comparative figures have been restated to align with the regulatory reports as submitted to the European Central Bank (the ECB). 3 Calculated as 8% of total RWA,
based on total capital minimum requirements, excluding CET1 buffer requirements. 4 This represents the CET1 ratio that is available for meeting buffer requirements. It is calculated as the CET1 ratio minus 4.5%
and after considering, where applicable, CET1 capital that has been used to meet tier 1 and / or total capital ratio requirements under Pillar 1. 5 On the basis of tier 1 capital. 6 Figures are calculated on a 12
‑
month
average.
p
30 June 2023 Pillar 3 Report |
Significant regulated subsidiaries and sub-groups | UBS Americas Holding LLC consolidated 69
UBS Americas Holding LLC consolidated
Quarterly |
leverage ratios of UBS Americas Holding LLC consolidated, based on Basel Committee on Banking Supervision (BCBS)
Pillar 1 requirements and in accordance with US Basel III rules.
Effective 1 October 2022, and through 30 September 2023, UBS Americas Holding LLC is subject to a stress capital buffer
(an SCB) of 4.8%, in addition to the minimum capital requirements. The SCB was determined by the Federal Reserve
Board following the completion of the 2022 Comprehensive Capital Analysis and Review (the CCAR) based on Dodd–
Frank Act Stress Test (DFAST) results and planned future dividends. Based on the results of the 2023 CCAR, the SCB has
been adjusted to 9.1% effective 1 October 2023. The SCB, which replaces the static capital conservation buffer of 2.5%,
is subject to change on an annual basis or as otherwise determined by the Federal Reserve Board.
During the second quarter of 2023, common equity tier 1 capital decreased by USD 0.3bn, due to operating losses and
preferred share dividend payments to UBS AG. Risk-weighted assets decreased by USD 1.8bn to USD 70.1bn, driven by
decreases in market risk. Leverage ratio exposure, calculated on an average basis, decreased by USD 2.0bn to
USD 186.3bn, primarily due to lower lending activity levels.
The average liquidity coverage ratio increased 5.1 percentage points, driven by a USD 1.6bn reduction in net cash
outflows, primarily from an increase in secured lending, partly offset by a USD 1.3bn decrease in high-quality liquid assets.
The first public disclosure of the net stable funding ratio (the NSFR) is for the second quarter of 2023. The average NSFR
for the second quarter of 2023 was 126.5%.
KM1: Key metrics
USD m, except where indicated
30.6.23
31.3.23
31.12.22
1
30.9.22
30.6.22
Available capital (amounts)
1
Common Equity Tier 1 (CET1)
2
Tier 1
3
Total capital
Risk-weighted assets (amounts)
4
Total risk-weighted assets (RWA)
4a
Minimum capital requirement
2
Risk-based capital ratios as a percentage of RWA
5
CET1 ratio (%)
6
Tier 1 ratio (%)
7
Total capital ratio (%)
Additional CET1 buffer requirements as a percentage of RWA
8
BCBS capital conservation buffer requirement (%)
8a
US stress capital buffer requirement (%)
9
Countercyclical buffer requirement (%)
10
Bank G-SIB and / or D-SIB additional requirements (%)
11
BCBS total of bank CET1 specific buffer requirements (%)
11a
US total bank specific capital buffer requirements (%)
12
CET1 available after meeting the bank’s minimum capital requirements (%)
3
Basel III leverage ratio
13
Total Basel III leverage ratio exposure measure
14
Basel III leverage ratio (%)
4
14a
Total Basel III supplementary leverage ratio exposure measure
14b
Basel III supplementary leverage ratio (%)
4
Liquidity coverage ratio (LCR)
5
15
Total high-quality liquid assets (HQLA)
6
16
Total net cash outflow
7
6
17
LCR (%)
6
Net stable funding ratio (NSFR)
5,8
18
Total available stable funding
19
Total required stable funding
7
20
NSFR (%)
1 Comparative information has been aligned with UBS Americas Holding LLC’s final 2022 audited financial statements. 2 Calculated as 8% of total RWA, based on total minimum capital requirements, excluding
CET1 buffer requirements. 3 This represents the CET1 ratio that is available for meeting buffer requirements. It is calculated as the CET1 ratio minus 4.5%. 4 On the basis of tier 1 capital. 5 Figures are calculated
on a quarterly average. 6 Comparative information for 31 March 2023 has been restated for revisions to HQLA and net cash outflows. 7 Reflected at 85% of the full amount in accordance with the Federal Reserve
tailoring rule. 8 The net stable funding ratio requirement became effective as of 1 July 2021 and related disclosures came into effect in the second quarter of 2023.
p
30 June 2023 Pillar 3 Report |
Significant regulated subsidiaries and sub-groups | UBS Americas Holding LLC consolidated 70
Material sub-group entity – creditor ranking at legal entity level
Semi-annual |
The TLAC2 table below provides an overview of the creditor ranking structure of UBS Americas Holding LLC on
a standalone basis.
As of 30 June 2023, UBS Americas Holding LLC had a total loss-absorbing capacity of USD 22.8bn after regulatory capital
deductions and adjustments. This amount included tier 1 capital of USD 15.4bn and USD 7.4bn of internal long-term
debt that is eligible as internal TLAC issued to UBS AG, a wholly owned subsidiary of the UBS Group AG resolution entity.
TLAC2: Material sub-group entity – creditor ranking at legal entity level
As of 30.6.23
Creditor ranking
Total
USD m
1
2
3
4
1
Is the resolution entity the creditor / investor?
No
No
No
No
2
Description of creditor ranking
Common Equity
(most junior)
1
Preferred Shares
(Additional tier 1)
Subordinated
debt
Unsecured loans and
other pari passu
liabilities (most senior)
3
Total capital and liabilities net of credit risk mitigation
4
Subset of row 3 that are excluded liabilities
5
Total capital and liabilities less excluded liabilities (row 3 minus row 4)
6
Subset of row 5 that are eligible as TLAC
7
Subset of row 6 with 1 year ≤ residual maturity < 2 years
8
Subset of row 6 with 2 years ≤ residual maturity < 5 years
9
Subset of row 6 with 5 years ≤ residual maturity < 10 years
10
Subset of row 6 with residual maturity ≥ 10 years, but excluded perpetual
securities
11
Subset of row 6 that is perpetual securities
1 Equity attributable to shareholders, which includes share premium and reserves.
p
30 June 2023 Pillar 3 Report |
Significant regulated subsidiaries and sub-groups | Credit Suisse AG consolidated 71
Credit Suisse AG consolidated
Key metrics of the second quarter of 2023
Quarterly |
The table below is based on Basel Committee on Banking Supervision (BCBS) Basel III rules.
During the second quarter of 2023, the common equity tier 1 (CET1) capital of Credit Suisse AG consolidated decreased
by CHF 8.7bn to CHF 45.5bn, driven by a net loss of CHF 8.9bn. Tier 1 capital decreased by CHF 8.2bn to CHF 46.0bn,
reflecting the aforementioned decrease in CET1 capital, partially offset by a CHF 0.5bn increase in additional tier 1 (AT1)
capital. The increase in AT1 capital was mainly driven by one loss-absorbing AT1 capital instrument of CHF 0.5bn,
denominated in Singapore dollars and downstreamed from UBS Group AG to Credit Suisse AG standalone.
Risk-weighted assets (RWA) decreased by CHF 25.8bn to CHF 217.1bn during the second quarter of 2023, primarily in
credit risk and operational risk.
Leverage ratio exposure decreased by CHF 69.8bn to CHF 585.7bn, mainly driven by lower lending and trading portfolio
assets, as well as decreases in derivative exposures and securities financing transactions.
Correspondingly, the CET1 capital ratio of Credit Suisse AG consolidated decreased to 21.0% from 22.3%, mainly
reflecting a decrease in CET1 capital, primarily due to the aforementioned net loss, partially offset by the decrease in
RWA. The firm’s Basel III leverage ratio decreased to 7.9% from 8.3%, mainly reflecting the decrease in CET1 capital,
primarily due to aforementioned net loss, partially offset by the lower leverage ratio exposure.
In the second quarter of 2023, the quarterly average liquidity coverage ratio (the LCR) of Credit Suisse AG consolidated
increased 73.8 percentage points to 256.7%, remaining above the prudential requirement communicated by the Swiss
Financial Market Supervisory Authority (FINMA). The increase in the average LCR was driven by a CHF 13.6bn increase in
high-quality liquid assets (HQLA) to CHF 131.7bn, mainly reflecting the benefits from the liquidity facilities from the Swiss
National Bank.
As of 30 June 2023, the net stable funding ratio (the NSFR) of Credit Suisse AG consolidated increased 11.3 percentage
points to 120.1%, remaining above the prudential requirement communicated by FINMA. The increase in the NSFR mainly
reflected lower required stable funding, primarily related to a decrease in the firm’s loan portfolio, a decrease in the
trading portfolio and a decrease in the derivatives portfolio.
Applicable rules and methodologies
In 2022, in light of the bank’s transformation, FINMA reduced the size of the capital surcharges for the bank’s market
share and its size in accordance with the Capital Adequacy Ordinance. This resulted in a lower total capital requirement
for Credit Suisse and its domestic subsidiaries. As a result of the merger with UBS, these surcharges will increase by the
end of 2023 to align with UBS’s current surcharges.
30 June 2023 Pillar 3 Report |
Significant regulated subsidiaries and sub-groups | Credit Suisse AG consolidated 72
KM1: Key metrics
CHF m, except where indicated
30.6.23
31.3.23
31.12.22
30.9.22
30.6.22
Available capital (amounts)
1
Common Equity Tier 1 (CET1)
1
1a
Fully loaded CECL accounting model CET1
2
Tier 1
1
2a
Fully loaded CECL accounting model Tier 1
3
Total capital
1
3a
Fully loaded CECL accounting model total capital
Risk-weighted assets (amounts)
4
Total risk-weighted assets (RWA)
4a
Minimum capital requirement
2
4b
Total risk-weighted assets (pre-floor)
Risk-based capital ratios as a percentage of RWA
5
CET1 ratio (%)
1
5a
Fully loaded CECL accounting model CET1 ratio (%)
6
Tier 1 ratio (%)
1
6a
Fully loaded CECL accounting model Tier 1 ratio (%)
7
Total capital ratio (%)
1
7a
Fully loaded CECL accounting model total capital ratio (%)
Additional CET1 buffer requirements as a percentage of RWA
8
Capital conservation buffer requirement (%)
9
Countercyclical buffer requirement (%)
9a
Additional countercyclical buffer for Swiss mortgage loans (%)
10
Bank G-SIB and / or D-SIB additional requirements (%)
3
11
Total of bank CET1 specific buffer requirements (%)
4
12
CET1 available after meeting the bank’s minimum capital requirements (%)
Basel III leverage ratio
13
Total Basel III leverage ratio exposure measure
14
Basel III leverage ratio (%)
1
14a
Fully loaded CECL accounting model Basel III leverage ratio (%)
Liquidity coverage ratio (LCR)
5
15
Total high-quality liquid assets (HQLA)
16
Total net cash outflow
16a
of which: cash outflows
16b
of which: cash inflows
17
LCR (%)
Net stable funding ratio (NSFR)
18
Total available stable funding
19
Total required stable funding
20
NSFR (%)
1 Credit Suisse has a transitional relief of recognizing CECL allowances and provisions in CET1 capital in accordance with FINMA Circular 2013/1 “Eligible capital – banks” until June 30, 2024. The fully loaded US
GAAP CECL accounting model excludes the transitional relief. 2 Calculated as 8% of total RWA, based on total capital minimum requirements, excluding CET1 buffer requirements. 3 Swiss SRB going and gone
concern requirements and information for Credit Suisse AG consolidated are provided below in this section. 4 Excludes non-BCBS capital buffer requirements for risk-weighted positions that are directly or indirectly
backed by residential properties in Switzerland. 5 Calculated based on an average of 61 data points in the second quarter of 2023, 64 data points in the first quarter of 2023, 65 data points in the fourth quarter of
2022, 66 data points in the third quarter of 2022 and 62 data points in the second quarter of 2022.
30 June 2023 Pillar 3 Report |
Significant regulated subsidiaries and sub-groups | Credit Suisse AG consolidated 73
Swiss SRB going and gone concern requirements and information
Quarterly |
The tables below provide details about the Swiss systemically relevant bank (SRB) RWA- and leverage ratio
denominator (LRD)-based going and gone concern requirements and information as required by FINMA. Details regarding
eligible gone concern instruments are provided below.
Credit Suisse AG consolidated is considered an SRB under Swiss banking law and is subject to capital regulations on a
consolidated basis. As of 30 June 2023, the going concern capital and leverage ratio requirements for Credit Suisse AG
consolidated were 14.81% and 5.06%, respectively.
The gone concern requirements were 10.19% for the RWA-based requirement and 3.75% for the LRD-based
requirement.
Swiss SRB going and gone concern requirements and information
As of 30.6.23
RWA
LRD
CHF m, except where indicated
in %
in %
Required going concern capital
Total going concern capital
1
1
Common equity tier 1 capital
2
of which: minimum capital
of which: buffer capital
of which: countercyclical buffer
of which: Pillar 2 add-on
3
3
Maximum additional tier 1 capital
of which: additional tier 1 capital
of which: additional tier 1 buffer capital
Eligible going concern capital
Total going concern capital
Common equity tier 1 capital
Total loss-absorbing additional tier 1 capital
of which: high-trigger loss-absorbing additional tier 1 capital
Required gone concern capital
4
Total gone concern loss-absorbing capacity
of which: base requirement including add-ons for market share and LRD
5
5
Eligible gone concern capital
Total gone concern loss-absorbing capacity
TLAC-eligible senior unsecured debt
Total loss-absorbing capacity
Required total loss-absorbing capacity
Eligible total loss-absorbing capacity
Risk-weighted assets / leverage ratio denominator
Risk-weighted assets
Leverage ratio denominator
1 Includes applicable add-ons of 0.72% for risk-weighted assets (RWA) and 0.25% for leverage ratio denominator (LRD). 2 Our minimum CET1 leverage ratio requirement of 3.56% consists of a 1.5% base
requirement, a 1.5% base buffer capital requirement, a 0.125% LRD add-on requirement, a 0.125% market share add-on requirement based on our Swiss credit business and a Pillar 2 add-on of 0.306%. 3 Reflects
the FINMA Pillar 2 capital add-on related to the supply chain finance funds matter at Credit Suisse. 4 A maximum of 25% of the gone concern requirements can be met with instruments that have a remaining
maturity of between one and two years. Once at least 75% of the minimum gone concern requirement has been met with instruments that have a remaining maturity of greater than two years, all instruments that
have a remaining maturity of between one and two years remain eligible to be included in the total gone concern capital. 5 The gone concern requirement after the application of the reduction for the use of higher-
quality capital instruments is floored at 10% and 3.75% for the RWA- and LRD-based requirements, respectively.
30 June 2023 Pillar 3 Report |
Significant regulated subsidiaries and sub-groups | Credit Suisse AG consolidated 74
Swiss SRB going and gone concern information
CHF m, except where indicated
30.6.23
31.3.23
31.12.22
Eligible going concern capital
Total going concern capital
Total tier 1 capital
Common equity tier 1 capital
Total loss-absorbing additional tier 1 capital
of which: high-trigger loss-absorbing additional tier 1 capital
of which: low-trigger loss-absorbing additional tier 1 capital
Eligible gone concern capital
Total gone concern loss-absorbing capacity
TLAC-eligible senior unsecured debt
Total loss-absorbing capacity
Total loss-absorbing capacity
Risk-weighted assets / leverage ratio denominator
Risk-weighted assets
Leverage ratio denominator
Capital and loss-absorbing capacity ratios (%)
Going concern capital ratio
of which: common equity tier 1 capital ratio
Gone concern loss-absorbing capacity ratio
Total loss-absorbing capacity ratio
Leverage ratios (%)
Going concern leverage ratio
of which: common equity tier 1 leverage ratio
Gone concern leverage ratio
Total loss-absorbing capacity leverage ratio
p
30 June 2023 Pillar 3 Report |
Significant regulated subsidiaries and sub-groups | Credit Suisse AG standalone 75
Credit Suisse AG standalone
Key metrics of the second quarter of 2023
Quarterly |
The table below is based on Basel Committee on Banking Supervision (BCBS) Basel III rules.
During the second quarter of 2023, the common equity tier 1 (CET1) capital of Credit Suisse AG standalone decreased
by CHF 5.8bn to CHF 28.4bn. This was mainly driven by a net loss of CHF 6.1bn, which included CHF 2.7bn of
participation impairments. Tier 1 capital decreased by CHF 5.4bn to CHF 28.9bn, reflecting the aforementioned decrease
in CET1 capital, partially offset by a CHF 0.5bn increase in additional tier 1 (AT1) capital. The increase in AT1 capital was
mainly driven by one loss-absorbing AT1 capital instrument of CHF 0.5bn, denominated in Singapore dollars and
downstreamed from UBS Group AG to Credit Suisse AG standalone.
Phase-in risk-weighted assets (RWA) decreased by CHF 31.3bn to CHF 199.5bn during the second quarter of 2023,
primarily driven by a decrease in credit risk due to lower lending exposures and a decrease in participation RWA due to
the impairment of investments in Switzerland- and foreign-domiciled subsidiaries, as well as a decrease in operational
risk RWA.
Leverage ratio exposure decreased by CHF 80.1bn to CHF 362.1bn, mainly driven by lower lending and central bank
balances, as well as decreases in securities financing transactions and trading assets.
Correspondingly, the CET1 capital ratio of Credit Suisse AG standalone decreased to 14.2% from 14.8%, mainly
reflecting the decrease in CET1 capital. The firm’s Basel III leverage ratio increased to 8.0% from 7.7%, mainly reflecting
the lower leverage ratio exposure, partially offset by the decrease in CET1 capital.
In the second quarter of 2023, the quarterly average liquidity coverage ratio (the LCR) of Credit Suisse AG standalone
increased 222.3 percentage points to 390.9%, remaining above the prudential requirement communicated by the Swiss
Financial Market Supervisory Authority (FINMA). The increase in the average LCR was driven by an CHF 11.8bn increase
in high-quality liquid assets (HQLA) to CHF 63.2bn, mainly due to an increase in cash held at central banks, and a decrease
in net cash outflows. The net cash outflows decreased by CHF 14.3bn to CHF 16.2bn , driven by lower outflows from
unsecured wholesale funding, partly offset by lower inflows from secured lending and other cash inflows.
As of 30 June 2023, the net stable funding ratio (the NSFR) of Credit Suisse AG standalone increased 10.7 percentage
points to 100.1%, remaining above the prudential requirement communicated by FINMA. The movement in the NSFR
was driven by a decrease in required stable funding of CHF 22.8bn to CHF 168.1bn, primarily due to decreases in the
firm’s loan portfolio and other assets. Available stable funding decreased by CHF 2.4bn to CHF 168.3bn, mainly due to
decreases in the capital and debt portfolio, partly offset by an increase in deposits.
During the second quarter of 2023, the total assets of Credit Suisse AG standalone decreased to CHF 315.5bn, compared
with CHF 378.0bn as of the end of the first quarter of 2023.
Applicable rules and methodologies
In October 2017, FINMA issued a decree (the 2017 FINMA Decree) specifying the treatment of investments in subsidiaries
for capital adequacy purposes for Credit Suisse AG standalone. As of the end of the second quarter of 2023, Credit
Suisse AG standalone financed Swiss subsidiaries with a carrying value of CHF 17.5bn and foreign subsidiaries with a
carrying value of CHF 18.2bn.
The 2017 FINMA Decree also applied an adjustment (referred to as a regulatory filter) as an impact on CET1 capital arising
from the accounting change under applicable Swiss banking rules for Credit Suisse AG standalone’s participations in
subsidiaries, from the portfolio valuation method to the individual valuation method. In contrast to the accounting
treatment, the regulatory filter permits Credit Suisse to measure the regulatory capital position as if Credit Suisse AG
standalone had maintained the portfolio valuation method. As of the end of the second quarter of 2023, the CET1 capital
impact from the regulatory filter was CHF 6.2bn. The related RWA increase from higher total participation values subject
to risk weighting was CHF 16.3bn, reflecting the different risk-weights for these direct participations.
The valuation of a bank parent company’s participations in subsidiaries is reviewed for potential impairment on at least
an annual basis, as of December 31, and at any other time that events or circumstances indicate that the value(s) of any
participation(s) may be impaired. As a result of the acquisition of Credit Suisse Group AG by UBS Group AG and
anticipated changes in strategy in the future, reliable financial plans are no longer available for the valuation of Credit
Suisse AG standalone’s participations in subsidiaries. In the second quarter of 2023, the valuation of Credit Suisse AG
standalone’s participations was calculated using alternative estimates of fair value based on the subsidiaries’ financial
positions as of the end of the second quarter of 2023, and included for the more significant participations (i) estimations
of recoverable amounts in liquidation and (ii) valuations based on a multiple of book value, earnings or assets under
management and custody. For certain other participations, a valuation based on net asset value was applied.
30 June 2023 Pillar 3 Report |
Significant regulated subsidiaries and sub-groups | Credit Suisse AG standalone 76
Once financial plans reflecting UBS’s strategy for each subsidiary are available, a reassessment of the valuation methods
used will be required and may result in reverting to the previously used valuation methods of income approach or market
approach or a combination of the two, or using alternative methods. The consideration of UBS-approved financial plans
could impact the valuations of subsidiaries, potentially resulting in material changes to these valuations in the future.
In 2022, in light of the bank’s transformation, FINMA reduced the size of the capital surcharges for the bank’s market
share and its size in accordance with the Capital Adequacy Ordinance (the CAO). This resulted in a lower total capital
requirement for Credit Suisse and its domestic subsidiaries. As a result of the merger with UBS, these surcharges will
increase by the end of 2023 to align with UBS’s current surcharges. In addition, Credit Suisse AG standalone is allowed
to temporarily use capital buffers until the end of 2025, in line with the CAO and regulatory guidance by FINMA. This
allows the bank to have effective and efficient capital management during the strategic transformation.
KM1: Key metrics
CHF m, except where indicated
30.6.23
31.3.23
31.12.22
30.9.22
30.6.22
Available capital (amounts)
1
Common Equity Tier 1 (CET1)
1
1a
Fully loaded CECL accounting model CET1
2
Tier 1
1
2a
Fully loaded CECL accounting model Tier 1
3
Total capital
1
3a
Fully loaded CECL accounting model total capital
Risk-weighted assets (amounts)
4
Total risk-weighted assets (RWA)
4a
Minimum capital requirement
2
4b
Total risk-weighted assets (pre-floor)
Risk-based capital ratios as a percentage of RWA
5
CET1 ratio (%)
1
5a
Fully loaded CECL accounting model CET1 ratio (%)
6
Tier 1 ratio (%)
1
6a
Fully loaded CECL accounting model Tier 1 ratio (%)
7
Total capital ratio (%)
1
7a
Fully loaded CECL accounting model total capital ratio (%)
Additional CET1 buffer requirements as a percentage of RWA
8
Capital conservation buffer requirement (%)
9
Countercyclical buffer requirement (%)
9a
Additional countercyclical buffer for Swiss mortgage loans (%)
10
Bank G-SIB and / or D-SIB additional requirements (%)
3
11
Total of bank CET1 specific buffer requirements (%)
4
12
CET1 available after meeting the bank’s minimum capital requirements (%)
Basel III leverage ratio
13
Total Basel III leverage ratio exposure measure
14
Basel III leverage ratio (%)
1
14a
Fully loaded CECL accounting model Basel III leverage ratio (%)
Liquidity coverage ratio (LCR)
5
15
Total high-quality liquid assets (HQLA)
16
Total net cash outflow
16a
of which: cash outflows
16b
of which: cash inflows
6
6
17
LCR (%)
Net stable funding ratio (NSFR)
7
18
Total available stable funding
19
Total required stable funding
20
NSFR (%)
1 Credit Suisse has a transitional relief of recognizing CECL allowances and provisions in CET1 capital in accordance with FINMA Circular 2013/1 “Eligible capital – banks” until June 30, 2024. The fully loaded US
GAAP CECL accounting model excludes the transitional relief. 2 Calculated as 8% of total RWA, based on total capital minimum requirements, excluding CET1 buffer requirements. 3 Swiss SRB going and gone
concern requirements and information for Credit Suisse AG standalone are provided below in this section. 4 Excludes non-BCBS capital buffer requirements for risk-weighted positions that are directly or indirectly
backed by residential properties in Switzerland. 5 Calculated based on an average of 61 data points in the second quarter of 2023, 64 data points in the first quarter of 2023, 65 data points in the fourth quarter of
2022, 66 data points in the third quarter of 2022 and 62 data points in the second quarter of 2022. 6 In accordance with LCR rules, cash inflows are capped at 75% of cash outflows, which is calculated on a daily
basis for the purpose of the Pillar 3 disclosures. 7 Based on the Liquidity Ordinance, Credit Suisse AG standalone is allowed to fulfill the minimum NSFR of 100% by taking into consideration any excess funding of
Credit Suisse (Schweiz) AG standalone, and Credit Suisse AG standalone has an NSFR requirement of at least 80% without taking into consideration any such excess funding. Credit Suisse (Schweiz) AG must always
fulfill the NSFR of at least 100% on a standalone basis.
p
30 June 2023 Pillar 3 Report |
Significant regulated subsidiaries and sub-groups | Credit Suisse AG standalone 77
Swiss SRB going and gone concern requirements and information
Quarterly |
The tables below provide details of the Swiss systemically relevant bank RWA- and leverage ratio denominator-
based going and gone concern requirements and information as required by FINMA. Details regarding eligible gone
concern instruments are provided below.
Following the amendments to the Banking Act and the Banking Ordinance that entered into force as of 1 January 2023,
Credit Suisse AG standalone is subject to a gone concern capital requirement based on the sum of: (i) the nominal value
of the gone concern instruments issued by Credit Suisse entities and held by the parent firm; (ii) 75% of the capital
requirements resulting from third-party exposure on a standalone basis; and (iii) a buffer requirement equal to 30% of
Credit Suisse AG standalone’s gone concern capital requirement on Credit Suisse AG’s consolidated exposure. A
transitional period until 2024 has been granted for the buffer requirement. The gone concern capital coverage ratio
reflects how much gone concern capital is available to meet the gone concern requirement. Outstanding high- and low-
trigger loss-absorbing tier 2 capital instruments and total loss-absorbing capacity-eligible senior unsecured debt
instruments are eligible to meet gone concern requirements until one year before maturity.
Swiss SRB going and gone concern requirements and information
As of 30.6.23
RWA, phase-in
RWA, fully applied as of 1.1.28
LRD
CHF m, except where indicated
in %
in %
in %
Required going concern capital
Total going concern capital
1
1
1
Common equity tier 1 capital
2
of which: minimum capital
of which: buffer capital
of which: countercyclical buffer
of which: Pillar 2 add-on
3
3
3
Maximum additional tier 1 capital
of which: additional tier 1 capital
of which: additional tier 1 buffer capital
Eligible going concern capital
Total going concern capital
Common equity tier 1 capital
Total loss-absorbing additional tier 1 capital
of which: high-trigger loss-absorbing additional tier 1 capital
of which: low-trigger loss-absorbing additional tier 1 capital
Risk-weighted assets / leverage ratio denominator
Risk-weighted assets
Leverage ratio denominator
Required gone concern capital
4
Higher of RWA- or LRD-based
Total gone concern loss-absorbing capacity
Eligible gone concern capital
Total gone concern loss-absorbing capacity
TLAC-eligible senior unsecured debt
Gone concern capital coverage ratio
1 Includes applicable add-ons of 0.72% for risk-weighted assets (RWA) and 0.25% for leverage ratio denominator (LRD). 2 Our minimum CET1 leverage ratio requirement of 3.74% consists of a 1.5% base
requirement, a 1.5% base buffer capital requirement, a 0.125% LRD add-on requirement, a 0.125% market share add-on requirement based on our Swiss credit business and a Pillar 2 add-on of 0.495%. 3 Reflects
the FINMA Pillar 2 capital add-on related to the supply chain finance funds matter at Credit Suisse. 4 A maximum of 25% of the gone concern requirements can be met with instruments that have a remaining
maturity of between one and two years. Once at least 75% of the minimum gone concern requirement has been met with instruments that have a remaining maturity of greater than two years, all instruments that
have a remaining maturity of between one and two years remain eligible to be included in the total gone concern capital.
30 June 2023 Pillar 3 Report |
Significant regulated subsidiaries and sub-groups | Credit Suisse AG standalone 78
Swiss SRB going and gone concern information
CHF m, except where indicated
30.6.23
31.3.23
31.12.22
Eligible going concern capital
Total going concern capital
Total tier 1 capital
Common equity tier 1 capital
Total loss-absorbing additional tier 1 capital
of which: high-trigger loss-absorbing additional tier 1 capital
of which: low-trigger loss-absorbing additional tier 1 capital
Eligible gone concern capital
Total gone concern loss-absorbing capacity
TLAC-eligible senior unsecured debt
Total loss-absorbing capacity
Total loss-absorbing capacity
Risk-weighted assets / leverage ratio denominator
Risk-weighted assets, phase-in
of which: investments in Switzerland-domiciled subsidiaries
1
of which: investments in foreign-domiciled subsidiaries
1
Risk-weighted assets fully applied as of 1.1.28
of which: investments in Switzerland-domiciled subsidiaries
1
of which: investments in foreign-domiciled subsidiaries
1
Leverage ratio denominator
Capital and loss-absorbing capacity ratios (%)
Going concern capital ratio, phase-in
of which: common equity tier 1 capital ratio, phase-in
Going concern capital ratio, fully applied as of 1.1.28
of which: common equity tier 1 capital ratio, fully applied as of 1.1.28
Leverage ratios (%)
Going concern leverage ratio
of which: common equity tier 1 leverage ratio
Capital coverage ratio (%)
Gone concern capital coverage ratio
1 Net exposures for direct and indirect investments including holding of regulatory capital instruments in Switzerland-domiciled subsidiaries and for direct and indirect investments including holding of regulatory capital
instruments in foreign-domiciled subsidiaries are risk-weighted at 225% and 300%, respectively, for the current year. Risk weights will gradually increase by 5 percentage points per year for Switzerland-domiciled
investments and 20 percentage points per year for foreign-domiciled investments until the fully applied risk weights of 250% and 400%, respectively, are applied.
p
30 June 2023 Pillar 3 Report |
Significant regulated subsidiaries and sub-groups | Credit Suisse (Schweiz) AG consolidated 79
Credit Suisse (Schweiz) AG consolidated
Key metrics of the second quarter of 2023
Quarterly
| The table below is based on Basel Committee on Banking Supervision (BCBS) Basel III rules.
During the second quarter of 2023, the common equity tier 1 (CET1) capital of Credit Suisse (Schweiz) AG consolidated
increased by CHF 0.4bn to CHF 13.0bn, mainly driven by a decrease in CET1 deductions. Tier 1 capital increased by
CHF 0.4bn to CHF 16.1bn, reflecting the aforementioned increase in CET1 capital.
Risk-weighted assets (RWA) decreased by CHF 2.0bn to CHF 88.1bn during the second quarter of 2023, primarily driven
by a decrease in credit risk, partly offset by an increase in participation RWA.
Leverage ratio exposure increased by CHF 4.9bn to CHF 256.0bn, mainly driven by higher central bank balances, partly
offset by lower lending exposure.
Correspondingly, the CET1 capital ratio of Credit Suisse (Schweiz) AG consolidated increased to 14.7% from 14.0%,
mainly reflecting the aforementioned increase in CET1 capit al. The firm’s Basel III leverage ratio was stable at 6.3%.
In the second quarter of 2023, the quarterly average liquidity coverage ratio (the LCR) of Credit Suisse (Schweiz) AG
consolidated decreased 3.3 percentage points to 140.2%, remaining above the prudential requirement communicated
by the Swiss Financial Market Supervisory Authority (FINMA). The movement in the average LCR was driven by an increase
in net cash outflows of CHF 5.0bn to CHF 30.6bn due to lower inflows from loans, partly offset by lower cash outflows.
This was mostly offset by a CHF 6.1bn increase in high-quality liquid assets (HQLA) to CHF 42.9bn, mainly due to an
increase in cash held at central banks.
As of 30 June 2023, the net stable funding ratio (the NSFR) of Credit Suisse (Schweiz) AG consolidated increased
4.2 percentage points to 109.0%, remaining above the prudential requirement communicated by FINMA. The movement
in the NSFR was driven by a decrease in required stable funding of CHF 3.7bn to CHF 123.9bn, mainly due to a decrease
in the loan portfolio. Available stable funding increased by CHF 1.3bn to CHF 135.1bn, primarily due to increases in
deposits
.
30 June 2023 Pillar 3 Report |
Significant regulated subsidiaries and sub-groups | Credit Suisse (Schweiz) AG consolidated 80
KM1: Key metrics
CHF m, except where indicated
30.6.23
31.3.23
31.12.22
30.9.22
30.6.22
Available capital (amounts)
1
1
Common Equity Tier 1 (CET1)
2
1a
Fully loaded CECL accounting model CET1
2
Tier 1
2
2a
Fully loaded CECL accounting model Tier 1
3
Total capital
2
3a
Fully loaded CECL accounting model total capital
Risk-weighted assets (amounts)
4
Total risk-weighted assets (RWA)
4a
Minimum capital requirement
3
4b
Total risk-weighted assets (pre-floor)
Risk-based capital ratios as a percentage of RWA
5
CET1 ratio (%)
2
5a
Fully loaded CECL accounting model CET1 ratio (%)
6
Tier 1 ratio (%)
2
6a
Fully loaded CECL accounting model Tier 1 ratio (%)
7
Total capital ratio (%)
2
7a
Fully loaded CECL accounting model total capital ratio (%)
Additional CET1 buffer requirements as a percentage of RWA
8
Capital conservation buffer requirement (%)
9
Countercyclical buffer requirement (%)
9a
Additional countercyclical buffer for Swiss mortgage loans (%)
10
Bank G-SIB and / or D-SIB additional requirements (%)
4
11
Total of bank CET1 specific buffer requirements (%)
5
12
CET1 available after meeting the bank’s minimum capital requirements (%)
Basel III leverage ratio
13
Total Basel III leverage ratio exposure measure
14
Basel III leverage ratio (%)
2
14a
Fully loaded CECL accounting model Basel III leverage ratio (%)
Liquidity coverage ratio (LCR)
6
15
Total high-quality liquid assets (HQLA)
16
Total net cash outflow
16a
of which: cash outflows
16b
of which: cash inflows
17
LCR (%)
Net stable funding ratio (NSFR)
18
Total available stable funding
19
Total required stable funding
20
NSFR (%)
1 Net income and dividend accruals will only be recognized in the fourth quarter of 2023. 2 Credit Suisse has a transitional relief of recognizing CECL allowances and provisions in CET1 capital in accordance with
FINMA Circular 2013/1 “Eligible capital – banks” until June 30, 2024. The fully loaded US GAAP CECL accounting model excludes the transitional relief. 3 Calculated as 8% of total RWA, based on total capital
minimum requirements, excluding CET1 buffer requirements. 4 Swiss SRB going and gone concern requirements and information for Credit Suisse (Schweiz) AG consolidated are provided below in this section.
5 Excludes non-BCBS countercyclical capital buffer requirements for risk-weighted positions that are directly or indirectly backed by residential properties in Switzerland. 6 Calculated based on an average of 61 data
points in the second quarter of 2023, 64 data points in the first quarter of 2023, 65 data points in the fourth quarter of 2022, 66 data points in the third quarter of 2022 and 62 data points in the second quarter of
2022.
p
30 June 2023 Pillar 3 Report |
Significant regulated subsidiaries and sub-groups | Credit Suisse (Schweiz) AG consolidated 81
Swiss SRB going and gone concern requirements and information
Quarterly |
law and is subject to capital regulations on a consolidated basis. As of 30 June 2023, the going concern capital and
leverage ratio requirements for Credit Suisse (Schweiz) AG consolidated were 14.33% (including a countercyclical buffer
of 0.75%) and 4.75%, respectively.
The Swiss SRB framework and requirements applicable to Credit Suisse (Schweiz) AG consolidated differ from those
applicable to UBS Group AG in terms of lower add-on requirements for market share and size and in terms of the gone
concern requirement being 62% of the going concern requirement (excluding countercyclical buffer requirements).
The gone concern requirements were 8.42% for the RWA-based requirement and 2.95% for the leverage ratio
denominator-based requirement.
Swiss SRB going and gone concern requirements and information
As of 30.6.23
RWA
LRD
CHF m, except where indicated
in %
in %
Required going concern capital
Total going concern capital
1
1
Common equity tier 1 capital
of which: minimum capital
of which: buffer capital
of which: countercyclical buffer
Maximum additional tier 1 capital
of which: additional tier 1 capital
of which: additional tier 1 buffer capital
Eligible going concern capital
2
Total going concern capital
Common equity tier 1 capital
Total loss-absorbing additional tier 1 capital
of which: high-trigger loss-absorbing additional tier 1 capital
Required gone concern capital
3
Total gone concern loss-absorbing capacity
of which: base requirement
of which: additional requirement for market share and LRD
Eligible gone concern capital
Total gone concern loss-absorbing capacity
TLAC-eligible senior unsecured debt
Total loss-absorbing capacity
Required total loss-absorbing capacity
Eligible total loss-absorbing capacity
Risk-weighted assets / leverage ratio denominator
Risk-weighted assets
Leverage ratio denominator
1 Includes applicable add-ons of 0.72% for risk-weighted assets (RWA) and 0.25% for leverage ratio denominator (LRD). 2 Net income and dividend accruals will only be recognized in the fourth quarter of 2023.
3 The gone-concern requirement of Credit Suisse (Schweiz) AG consolidated is 62% of the going-concern requirement (excluding countercyclical buffer requirements). A maximum of 25% of the gone concern
requirements can be met with instruments that have a remaining maturity of between one and two years. Once at least 75% of the minimum gone concern requirement has been met with instruments that have a
remaining maturity of greater than two years, all instruments that have a remaining maturity of between one and two years remain eligible to be included in the total gone concern capital.
p
30 June 2023 Pillar 3 Report |
Significant regulated subsidiaries and sub-groups | Credit Suisse (Schweiz) AG consolidated 82
Swiss SRB loss-absorbing capacity
Quarterly |
Swiss SRB going and gone concern information
CHF m, except where indicated
30.6.23
31.3.23
31.12.22
Eligible going concern capital
1
Total going concern capital
Total tier 1 capital
Common equity tier 1 capital
Total loss-absorbing additional tier 1 capital
of which: high-trigger loss-absorbing additional tier 1 capital
Eligible gone concern capital
Total gone concern loss-absorbing capacity
TLAC-eligible senior unsecured debt
Total loss-absorbing capacity
Total loss-absorbing capacity
Risk-weighted assets / leverage ratio denominator
Risk-weighted assets
Leverage ratio denominator
Capital and loss-absorbing capacity ratios (%)
Going concern capital ratio
of which: common equity tier 1 capital ratio
Gone concern loss-absorbing capacity ratio
Total loss-absorbing capacity ratio
Leverage ratios (%)
Going concern leverage ratio
of which: common equity tier 1 leverage ratio
Gone concern leverage ratio
Total loss-absorbing capacity leverage ratio
1 Net income and dividend accruals will only be recognized in the fourth quarter of 2023.
p
30 June 2023 Pillar 3 Report |
Significant regulated subsidiaries and sub-groups | Credit Suisse (Schweiz) AG standalone 83
Credit Suisse (Schweiz) AG standalone
Key metrics of the second quarter of 2023
Quarterly |
The table below is based on Basel Committee on Banking Supervision (BCBS) Basel III rules.
During the second quarter of 2023, the common equity tier 1 (CET1) capital of Credit Suisse (Schweiz) AG standalone
was stable at CHF 11.9bn. Tier 1 capital was stable at CHF 15.0bn.
Risk-weighted assets (RWA) decreased by CHF 3.0bn to CHF 87.4bn during the second quarter of 2023, primarily driven
by lower credit risk.
Leverage ratio exposure increased by CHF 4.7bn to CHF 254.0bn, mainly driven by higher central bank balances, partly
offset by lower lending exposure.
Correspondingly, the CET1 capital ratio of Credit Suisse (Schweiz) AG standalone increased to 13.6% from 13.1%, mainly
reflecting the decrease in RWA. The firm’s Basel III leverage ratio decreased to 5.9% from 6.0%, mainly reflecting the
higher leverage ratio exposure.
In the second quarter of 2023, the quarterly average liquidity coverage ratio (the LCR) of Credit Suisse (Schweiz) AG
standalone decreased 3.2 percentage points to 138.2%, remaining above the prudential requirement communicated by
the Swiss Financial Market Supervisory Authority (FINMA). The movement in the average LCR was driven by an increase
in net cash outflows of CHF 5.0bn to CHF 31.0bn due to lower inflows from loans, partially offset by lower cash outflows
from deposits. This was mostly offset by a CHF 6.1bn increase in high-quality liquid assets (HQLA) to CHF 42.9bn, mainly
due to an increase in cash held at central banks.
As of 30 June 2023, the net stable funding ratio (the NSFR) of Credit Suisse (Schweiz) AG standalone increased
3.7 percentage points to 109.7%, remaining above the prudential requirement communicated by FINMA. The movement
in the NSFR was driven by a decrease in required stable funding of CHF 2.9bn to CHF 121.7bn, mainly due to a decrease
in the loan portfolio. Available stable funding increased by CHF 1.5bn to CHF 133.5bn, primarily due to increases in
deposits.
As of 30 June 2023, Credit Suisse (Schweiz) AG standalone held assets with a carrying value of CHF 948m that are
pledged under the covered bonds program of Credit Suisse AG and for which the related liabilities of CHF 567m as of
30 June 2023 are reported by Credit Suisse AG.
30 June 2023 Pillar 3 Report |
Significant regulated subsidiaries and sub-groups | Credit Suisse (Schweiz) AG standalone 84
KM1: Key metrics
CHF m, except where indicated
30.6.23
31.3.23
31.12.22
30.9.22
30.6.22
Available capital (amounts)
1
1
Common Equity Tier 1 (CET1)
2
1a
Fully loaded CECL accounting model CET1
2
Tier 1
2
2a
Fully loaded CECL accounting model Tier 1
3
Total capital
2
3a
Fully loaded CECL accounting model total capital
Risk-weighted assets (amounts)
4
Total risk-weighted assets (RWA)
4a
Minimum capital requirement
3
4b
Total risk-weighted assets (pre-floor)
Risk-based capital ratios as a percentage of RWA
5
CET1 ratio (%)
2
5a
Fully loaded CECL accounting model CET1 ratio (%)
6
Tier 1 ratio (%)
2
6a
Fully loaded CECL accounting model Tier 1 ratio (%)
7
Total capital ratio (%)
2
7a
Fully loaded CECL accounting model total capital ratio (%)
Additional CET1 buffer requirements as a percentage of RWA
8
Capital conservation buffer requirement (%)
9
Countercyclical buffer requirement (%)
9a
Additional countercyclical buffer for Swiss mortgage loans (%)
10
Bank G-SIB and / or D-SIB additional requirements (%)
4
11
Total of bank CET1 specific buffer requirements (%)
5
12
CET1 available after meeting the bank’s minimum capital requirements (%)
Basel III leverage ratio
13
Total Basel III leverage ratio exposure measure
14
Basel III leverage ratio (%)
2
14a
Fully loaded CECL accounting model Basel III leverage ratio (%)
Liquidity coverage ratio (LCR)
6
15
Total high-quality liquid assets (HQLA)
16
Total net cash outflow
16a
of which: cash outflows
16b
of which: cash inflows
17
LCR (%)
Net stable funding ratio (NSFR)
7
18
Total available stable funding
19
Total required stable funding
20
NSFR (%)
1 Net income and dividend accruals will only be recognized in the fourth quarter of 2023. 2 Credit Suisse has a transitional relief of recognizing CECL allowances and provisions in CET 1 capital in accordance with
FINMA Circular 2013/1 “Eligible capital – banks” until June 30, 2024. The fully loaded US GAAP CECL accounting model excludes the transitional relief. 3 Calculated as 8% of total RWA, based on total capital
minimum requirements, excluding CET1 buffer requirements. 4 Swiss SRB going and gone concern requirements and information for Credit Suisse (Schweiz) AG standalone are provided below in this section.
5 Excludes non-BCBS countercyclical capital buffer requirements for risk-weighted positions that are directly or indirectly backed by residential properties in Switzerland. 6 Calculated based on an average of 61 data
points in the second quarter of 2023 , 64 data points in the first quarter of 2023, 65 data points in the fourth quarter of 2022, 66 data points in the third quarter of 2022 and 62 data points in the second quarter of
2022. 7 Based on the Liquidity Ordinance, Credit Suisse AG standalone is allowed to fulfill the minimum NSFR of 100% by taking into consideration any excess funding of Credit Suisse (Schweiz) AG standalone,
and Credit Suisse AG standalone has an NSFR requirement of at least 80% without taking into consideration any such excess funding. Credit Suisse (Schweiz) AG must always fulfill the NSFR of at least 100% on a
standalone basis.
p
30 June 2023 Pillar 3 Report |
Significant regulated subsidiaries and sub-groups | Credit Suisse (Schweiz) AG standalone 85
Swiss SRB going and gone concern requirements and information
Quarterly |
law and is subject to capital regulations on a standalone basis. As of 30 June 2023, the going concern capital and leverage
ratio requirements for Credit Suisse (Schweiz) AG standalone were 14.34% (including a countercyclical buffer of 0.76%)
and 4.75%, respectively.
The Swiss SRB framework and requirements applicable to Credit Suisse (Schweiz) AG consolidated differ from those
applicable to UBS Group AG in terms of lower add-on requirements for market share and size and in terms of the gone
concern requirement being 62% of the going concern requirement (excluding countercyclical buffer requirements).
The gone concern requirements were 8.42% for the RWA-based requirement and 2.95% for the leverage ratio
denominator-based requirement.
Swiss SRB going and gone concern requirements and information
As of 30.6.23
RWA
LRD
CHF m, except where indicated
in %
in %
Required going concern capital
Total going concern capital
1
1
Common equity tier 1 capital
of which: minimum capital
of which: buffer capital
of which: countercyclical buffer
Maximum additional tier 1 capital
of which: additional tier 1 capital
of which: additional tier 1 buffer capital
Eligible going concern capital
2
Total going concern capital
Common equity tier 1 capital
Total loss-absorbing additional tier 1 capital
of which: high-trigger loss-absorbing additional tier 1 capital
Required gone concern capital
3
Total gone concern loss-absorbing capacity
of which: base requirement
of which: additional requirement for market share and LRD
Eligible gone concern capital
Total gone concern loss-absorbing capacity
TLAC-eligible senior unsecured debt
Total loss-absorbing capacity
Required total loss-absorbing capacity
Eligible total loss-absorbing capacity
Risk-weighted assets / leverage ratio denominator
Risk-weighted assets
Leverage ratio denominator
1 Includes applicable add-ons of 0.72% for risk-weighted assets (RWA) and 0.25% for leverage ratio denominator (LRD). 2 Net income and dividend accruals will only be recognized in the fourth quarter of 2023.
3 The gone-concern requirement of Credit Suisse (Schweiz) AG standalone is 62% of the going-concern requirement (excluding countercyclical buffer requirements). A maximum of 25% of the gone concern
requirements can be met with instruments that have a remaining maturity of between one and two years. Once at least 75% of the minimum gone concern requirement has been met with instruments that have a
remaining maturity of greater than two years, all instruments that have a remaining maturity of between one and two years remain eligible to be included in the total gone concern capital.
p
30 June 2023 Pillar 3 Report |
Significant regulated subsidiaries and sub-groups | Credit Suisse (Schweiz) AG standalone 86
Swiss SRB loss-absorbing capacity
Quarterly |
Swiss SRB going and gone concern information
CHF m, except where indicated
30.6.23
31.3.23
31.12.22
Eligible going concern capital
1
Total going concern capital
Total tier 1 capital
Common equity tier 1 capital
Total loss-absorbing additional tier 1 capital
of which: high-trigger loss-absorbing additional tier 1 capital
Eligible gone concern capital
Total gone concern loss-absorbing capacity
TLAC-eligible senior unsecured debt
Total loss-absorbing capacity
Total loss-absorbing capacity
Risk-weighted assets / leverage ratio denominator
Risk-weighted assets
Leverage ratio denominator
Capital and loss-absorbing capacity ratios (%)
Going concern capital ratio
of which: common equity tier 1 capital ratio
Gone concern loss-absorbing capacity ratio
Total loss-absorbing capacity ratio
Leverage ratios (%)
Going concern leverage ratio
of which: common equity tier 1 leverage ratio
Gone concern leverage ratio
Total loss-absorbing capacity leverage ratio
1 Net income and dividend accruals will only be recognized in the fourth quarter of 2023.
p
30 June 2023 Pillar 3 Report |
Significant regulated subsidiaries and sub-groups | Credit Suisse International standalone 87
Credit Suisse International standalone
Quarterly |
The table below provides information about the regulatory capital components, capital ratios, leverage ratio and
liquidity of Credit Suisse International standalone based on Basel Committee on Banking Supervision (BCBS) Pillar 1
requirements and in accordance with UK Prudential Regulatory Authority regulations and International Financial
Reporting Standards (IFRS).
During the second quarter of 2023, the common equity tier 1 capital of Credit Suisse International standalone decreased
by USD 0.4bn to USD 14.6bn from USD 15.0bn . Total capital decreased by USD 0.4bn to USD 15.8bn from USD 16.2bn
in the first quarter of 2023. Risk-weighted assets decreased by USD 0.4bn to USD 48.6bn from USD 49.0bn in the first
quarter of 2023. Leverage ratio exposure decreased by USD 14.3bn to USD 98.4bn, mainly reflecting a material decrease
in reverse repos due to lower high-quality liquid asset (HQLA) sourcing. Additionally, there was a reduction in derivative
exposures due to lower trading volumes across multiple counterparties, and a drop in inventory.
The average liquidity coverage ratio was 197.0%, compared with 162.8% in the first quarter of 2023. The increase was
driven by a USD 3.4bn reduction in outflows, primarily due to a reduction in outflows from the historical look-back
approach (HLBA), which was partly offset by a reduction in inflows. HQLA decreased by USD 3.8bn, largely due a
reduction in government securities held.
The net stable funding ratio (the NSFR) of Credit Suisse International standalone remained well above the regulatory
requirements of 100%, at 128.1%, and was stable compared with the first quarter of 2023. Overall, there was a
reduction in required stable funding, mainly driven by decreases in derivative exposures and trading inventory assets, with
a reduction in available stable funding, mainly driven by a decrease in long-term funding.
KM1: Key metrics
USD m, except where indicated
30.6.23
31.3.23
31.12.22
1
30.9.22
30.6.22
Available capital (amounts)
1
Common Equity Tier 1 (CET1)
2
Tier 1
3
Total capital
Risk-weighted assets (amounts)
4
Total risk-weighted assets (RWA)
4a
Minimum capital requirement
2
Risk-based capital ratios as a percentage of RWA
5
CET1 ratio (%)
6
Tier 1 ratio (%)
7
Total capital ratio (%)
Additional CET1 buffer requirements as a percentage of RWA
8
BCBS capital conservation buffer requirement (%)
9
Countercyclical buffer requirement (%)
10
Bank G-SIB and / or D-SIB additional requirements (%)
11
BCBS total of bank CET1 specific buffer requirements (%)
12
CET1 available after meeting the bank’s minimum capital requirements (%)
3
Basel III leverage ratio
13
Total Basel III leverage ratio exposure measure
14
Basel III leverage ratio (%)
4
Liquidity coverage ratio (LCR)
5
15
Total high-quality liquid assets (HQLA)
16
Total net cash outflow
17
LCR (%)
Net stable funding ratio (NSFR)
6
18
Total available stable funding
19
Total required stable funding
20
NSFR (%)
1 Comparative information has been aligned with Credit Suisse International standalone’s final 2022 audited financial statements. 2 Calculated as 8% of total RWA, based on total minimum capital requirements,
excluding CET1 buffer requirements. 3 This represents the CET1 ratio that is available for meeting buffer requirements. It is calculated as the CET1 ratio minus 4.5% and after considering, where applicable, CET1
capital that was used to meet the BIS additional tier 1 minimum requirement of 1.5% and/or the BIS tier 2 minimum requirement of 2% under Pillar 1. 4 On the basis of tier 1 capital. 5 Based on Pillar 1
requirements; calculated using a 12-month average. 6 The net stable funding ratio requirement became effective as of 1 January 2022 and related disclosures came into effect in the first quarter of 2023.
p
30 June 2023 Pillar 3 Report |
Significant regulated subsidiaries and sub-groups | Credit Suisse International standalone 88
Material sub-group entity – creditor ranking at legal entity level
Semi-annual |
a standalone basis.
As of 30 June 2023, Credit Suisse International had a total loss-absorbing capacity (TLAC) of USD 20.4bn after regulatory
capital deductions and adjustments. This amount included tier 1 capital, excluding minority interests, of USD 15.8bn and
USD 4.6bn of internal long-term debt that was eligible as internal TLAC issued to Credit Suisse AG, a wholly owned
subsidiary of the UBS Group AG resolution entity.
TLAC2: Material sub-group entity – creditor ranking at legal entity level
As of 30.6.23
Creditor ranking
Total
USD m
1
2
3
4
1
Is the resolution entity the creditor / investor?
No
No
No
No
2
Description of creditor ranking
Common Equity
(most junior)
1
Preferred Shares
(Additional tier 1)
Subordinated
debt
Unsecured loans and
other pari passu
liabilities (most senior)
3
Total capital and liabilities net of credit risk mitigation
4
Subset of row 3 that are excluded liabilities
5
Total capital and liabilities less excluded liabilities (row 3 minus row 4)
6
Subset of row 5 that are eligible as TLAC
7
Subset of row 6 with 1 year ≤ residual maturity < 2 years
8
Subset of row 6 with 2 years ≤ residual maturity < 5 years
9
Subset of row 6 with 5 years ≤ residual maturity < 10 years
10
Subset of row 6 with residual maturity ≥ 10 years, but excluded perpetual
securities
11
Subset of row 6 that is perpetual securities
1 Equity attributable to shareholders, which includes share premium and reserves.
p
30 June 2023 Pillar 3 Report |
Significant regulated subsidiaries and sub-groups | Credit Suisse Holdings (USA), Inc. consolidated 89
Credit Suisse Holdings (USA), Inc. consolidated
Quarterly |
ratios of Credit Suisse Holdings (USA), Inc. consolidated, based on Basel Committee on Banking Supervision (BCBS) Pillar 1
requirements and in accordance with US Basel III rules.
Effective 1 October 2022 and through 30 September 2023, Credit Suisse Holdings (USA), Inc. is subject to a stress capital
buffer (an SCB) of 9.0%, in addition to the minimum capital requirements. The SCB was determined by the Federal
Reserve Board (the FRB) following the completion of the 2022 Comprehensive Capital Analysis and Review (the CCAR)
based on Dodd–Frank Act Stress Test (DFAST) results and planned future dividends. Based on the results of the 2023
CCAR, the SCB has been adjusted to 7.2% effective 1 October 2023. The SCB, which replaces the static capital
conservation buffer of 2.5%, is subject to change on an annual basis or as otherwise determined by the FRB.
During the second quarter of 2023, the common equity tier 1 (CET1) ratio of Credit Suisse Holdings (USA), Inc.
consolidated increased to 50.5% from 39.3%, as risk-weighted assets (RWA) decreased by USD 10.4bn to USD 21.3bn,
which outpaced losses for the quarter. The decrease in RWA was driven by decrease s of USD 6.6bn in market risk RWA
and USD 3.8bn in credit risk RWA. Leverage ratio exposure, calculated on an average basis, decreased by USD 13.0bn to
USD 42.8bn, due to reductions in virtually all asset categories , driven by overall business and risk reductions.
The average liquidity coverage ratio (the LCR) of Credit Suisse Holdings (USA), Inc. consolidated increased
153.6 percentage points to 293.0%, mostly driven by a USD 5.9bn decrease in net cash outflows, the largest components
of which were reductions in unsecured funding and a reduction of mark-to-market risk on derivatives.
The net stable funding ratio (the NSFR) of Credit Suisse Holdings (USA), Inc. consolidated remained well above the
regulatory requirements of 100%, at 219.6% for the second quarter of 2023, an increase of 29.8 percentage points
compared with 189.8% in the first quarter of 2023. The NSFR was driven by a USD 3.1bn decrease in required stable
funding, which was due to a reduction of the loans and securities held and a decrease in deferred tax assets. This was
partly offset by a USD 2.5bn decrease in available stable funding, which was mainly due to changes in the wholesale
funding tenor structure, as well as a small reduction in regulatory capital.
KM1: Key metrics
1
USD m, except where indicated
30.6.23
31.3.23
31.12.22
30.9.22
30.6.22
Available capital (amounts)
1
Common Equity Tier 1 (CET1)
2
Tier 1
3
Total capital
Risk-weighted assets (amounts)
4
Total risk-weighted assets (RWA)
4a
Minimum capital requirement
2
Risk-based capital ratios as a percentage of RWA
5
CET1 ratio (%)
6
Tier 1 ratio (%)
7
Total capital ratio (%)
Additional CET1 buffer requirements as a percentage of RWA
8
BCBS capital conservation buffer requirement (%)
9
Countercyclical buffer requirement (%)
10
Bank G-SIB and / or D-SIB additional requirements (%)
11
BCBS total of bank CET1 specific buffer requirements (%)
11a
US total bank specific capital buffer requirements (%)
12
CET1 available after meeting the bank’s minimum capital requirements (%)
3
Basel III leverage ratio
13
Total Basel III leverage ratio exposure measure
14
Basel III leverage ratio (%)
4
14a
Total Basel III supplementary leverage ratio exposure measure
14b
Basel III supplementary leverage ratio (%)
4
Liquidity coverage ratio (LCR)
5
15
Total high-quality liquid assets (HQLA)
16
Total net cash outflow
17
LCR (%)
Net stable funding ratio (NSFR)
18
Total available stable funding
19
Total required stable funding
20
NSFR (%)
1 The net stable funding ratio requirement became effective as of 1 July 2021 and related disclosures came into effect in the second quarter of 2023. 2 Calculated as 8% of total RWA, based on total minimum
capital requirements, excluding CET1 buffer requirements. 3 Reflects the CET1 ratio that is available for meeting buffer requirements. Calculated as the CET1 ratio less the BIS CET1 ratio minimum requirement of
4.5% and after considering, where applicable, CET1 capital that was used to meet the BIS additional tier 1 minimum requirement of 1.5% and/or the BIS tier 2 minimum requirement of 2% under Pillar 1. 4 On the
basis of tier 1 capital. 5 Figures are calculated on a quarterly average.
p
30 June 2023 Pillar 3 Report |
Significant regulated subsidiaries and sub-groups | Credit Suisse Holdings (USA), Inc. consolidated 90
Material sub-group entity – creditor ranking at legal entity level
Semi-annual |
The TLAC2 table below provides an overview of the creditor ranking structure of Credit Suisse Holdings (USA),
Inc. on a consolidated basis.
As of 30 June 2023, Credit Suisse Holdings (USA), Inc. had a total loss-absorbing capacity (TLAC) of USD 14.3bn after
regulatory capital deductions and adjustments. This amount included tier 1 capital, excluding minority interests, of
USD 11.3bn and USD 3.0bn of internal long-term debt that was eligible as internal TLAC issued to Credit Suisse AG, a
wholly owned subsidiary of the UBS Group AG resolution entity.
TLAC2: Material sub-group entity – creditor ranking at legal entity level
As of 30.6.23
Creditor ranking
Total
USD m
1
2
3
4
1
Is the resolution entity the creditor / investor?
No
No
No
No
2
Description of creditor ranking
Common Equity
(most junior)
1
Preferred Shares
Subordinated
debt
Unsecured loans and
other pari passu
liabilities (most senior)
3
Total capital and liabilities net of credit risk mitigation
4
Subset of row 3 that are excluded liabilities
5
Total capital and liabilities less excluded liabilities (row 3 minus row 4)
6
Subset of row 5 that are eligible as TLAC
7
Subset of row 6 with 1 year ≤ residual maturity < 2 years
8
Subset of row 6 with 2 years ≤ residual maturity < 5 years
9
Subset of row 6 with 5 years ≤ residual maturity < 10 years
10
Subset of row 6 with residual maturity ≥ 10 years, but excluded perpetual
securities
11
Subset of row 6 that is perpetual securities
1 Equity attributable to shareholders, which includes share premium and reserves.
p
30 June 2023 Pillar 3 Report |
Appendix 91
Appendix
Abbreviations frequently used in our financial reports
A
ABS asset-backed securities
AG Aktiengesellschaft
AGM Annual General Meeting of
shareholders
A-IRB advanced internal ratings-
based
AIV alternative investment
vehicle
ALCO Asset and Liability
Committee
AMA advanced measurement
approach
AML anti-money laundering
AoA Articles of Association
APM alternative performance
measure
ARR alternative reference rate
ARS auction rate securities
ASF available stable funding
AT1 additional tier 1
AuM assets under management
B
BCBS Basel Committee on
Banking Supervision
BIS Bank for International
Settlements
BoD Board of Directors
C
CAO Capital Adequacy
Ordinance
CCAR Comprehensive Capital
Analysis and Review
CCF credit conversion factor
CCP central counterparty
CCR counterparty credit risk
CCRC Corporate Culture and
Responsibility Committee
CDS credit default swap
CEA Commodity Exchange Act
CEO Chief Executive Officer
CET1 common equity tier 1
CFO Chief Financial Officer
CGU cash-generating unit
CHF Swiss franc
CIO Chief Investment Office
C&ORC Compliance & Operational
Risk Control
CRM credit risk mitigation (credit
risk) or comprehensive risk
measure (market risk)
CST combined stress test
CUSIP Committee on Uniform
Security Identification
Procedures
CVA credit valuation adjustment
D
DBO defined benefit obligation
DCCP Deferred Contingent
Capital Plan
DE&I diversity, equity and
inclusion
DFAST Dodd–Frank Act Stress Test
DM discount margin
DOJ US Department of Justice
DTA deferred tax asset
DVA debit valuation adjustment
E
EAD exposure at default
EB Executive Board
EC European Commission
ECB European Central Bank
ECL expected credit loss
EGM Extraordinary General
Meeting of shareholders
EIR effective interest rate
EL expected loss
EMEA Europe, Middle East and
Africa
EOP Equity Ownership Plan
EPS earnings per share
ESG environmental, social and
governance
ESR environmental and social
risk
ETD exchange-traded derivatives
ETF exchange-traded fund
EU European Union
EUR euro
EURIBOR Euro Interbank Offered Rate
EVE economic value of equity
EY Ernst & Young Ltd
F
FA financial advisor
FCA UK Financial Conduct
Authority
FDIC Federal Deposit Insurance
Corporation
FINMA Swiss Financial Market
Supervisory Authority
FMIA Swiss Financial Market
Infrastructure Act
FSB Financial Stability Board
FTA Swiss Federal Tax
Administration
FVA funding valuation
adjustment
FVOCI fair value through other
comprehensive income
FVTPL fair value through profit or
loss
FX foreign exchange
G
GAAP generally accepted
accounting principles
GBP pound sterling
GCRG Group Compliance,
Regulatory & Governance
GDP gross domestic product
GEB Group Executive Board
GHG greenhouse gas
GIA Group Internal Audit
GRI Global Reporting Initiative
G-SIB global systemically
important bank
H
HQLA
high-quality liquid assets
I
IAS International Accounting
Standards
IASB International Accounting
Standards Board
IBOR interbank offered rate
IFRIC International Financial
Reporting Interpretations
Committee
IFRS International Financial
Reporting Standards
IRB internal ratings-based
IRRBB interest rate risk in the
banking book
ISDA International Swaps and
Derivatives Association
ISIN International Securities
Identification Number
30 June 2023 Pillar 3 Report |
Appendix 92
Abbreviations frequently used in our financial reports (continued)
K
KRT Key Risk Taker
L
LAS liquidity-adjusted stress
LCR liquidity coverage ratio
LGD loss given default
LIBOR London Interbank Offered
Rate
LLC limited liability company
LoD lines of defense
LRD leverage ratio denominator
LTIP Long-Term Incentive Plan
LTV loan-to-value
M
M&A mergers and acquisitions
MRT Material Risk Taker
N
NII net interest income
NSFR net stable funding ratio
NYSE New York Stock Exchange
O
OCA own credit adjustment
OCI other comprehensive
income
OECD Organisation for Economic
Co-operation and
Development
OTC over-the-counter
P
PCI purchased credit-impaired
PD probability of default
PIT point in time
P&L profit or loss
Q
QCCP Qualifying central
counterparty
R
RBC risk-based capital
RbM risk-based monitoring
REIT real estate investment trust
RMBS residential mortgage-
backed securities
RniV risks not in VaR
RoCET1 return on CET1 capital
RoU right-of-use
rTSR relative total shareholder
return
RWA risk-weighted assets
S
SA standardized approach or
société anonyme
SA-CCR standardized approach for
counterparty credit risk
SAR Special Administrative
Region of the People’s
Republic of China
SDG Sustainable Development
Goal
SEC US Securities and Exchange
Commission
SFC Swiss Federal Council
SFT securities financing
transaction
SI sustainable investing or
sustainable investment
SIBOR Singapore Interbank
Offered Rate
SICR significant increase in credit
risk
SIX SIX Swiss Exchange
SME small and medium-sized
entities
SMF Senior Management
Function
SNB Swiss National Bank
SOR Singapore Swap Offer Rate
SPPI solely payments of principal
and interest
SRB systemically relevant bank
SRM specific risk measure
SVaR stressed value-at-risk
T
TBTF too big to fail
TCFD Task Force on Climate-
related Financial Disclosures
TIBOR Tokyo Interbank Offered
Rate
TLAC total loss-absorbing capacity
TTC through the cycle
U
USD US dollar
V
VaR value-at-risk
VAT
value added tax
This is a general list of the abbreviations frequently used in our financial reporting. Not all of the listed abbreviations may
appear in this particular report.
30 June 2023 Pillar 3 Report |
Appendix 93
Cautionary Statement |
of an offer to buy or sell any securities or other financial instruments in Switzerland, the United States or any other jurisdiction. No investment decision relating
to securities of or relating to UBS Group AG, UBS AG or their affiliates should be made on the basis of this report. Refer to UBS’s most recent Annual Report on
Form 20-
F,
quarterly reports and other information furnished to or filed with the US Securities and Exchange Commission on Form 6-K, available at
ubs.com/investors
, for additional information.
Rounding |
disclosed in text and tables are calculated on the basis of unrounded figures. Absolute changes between reporting periods disclosed in the text, which can be
derived from numbers presented in related tables, are calculated on a rounded basis.
Tables |
available as of the relevant date or for the relevant period. Zero values generally indicate that the respective figure is zero on an actual or rounded basis. Values
that are zero on a rounded basis can be either negative or positive on an actual basis.

UBS Group AG
P.O. Box
CH-8098 Zurich
ubs.com
SIGNATURES
Pursuant to the requirements of the Securities Exchange Act of 1934, the registrants have duly caused this
report to be signed on their behalf by the undersigned, thereunto duly authorized.
UBS Group AG
By: _/s/ David Kelly _____________
Name: David Kelly
Title: Managing Director
By: _/s/ Ella Campi ______________
Name: Ella Campi
Title: Executive Director
UBS AG
By: _/s/ David Kelly _____________
Name: David Kelly
Title: Managing Director
By: _/s/ Ella Campi ______________
Name: Ella Campi
Title: Executive Director
Credit Suisse AG
By: _/s/ Simon Grimwood __________
Name: Simon Grimwood
Title: Chief Financial Officer
By: _/s/ Damian Vogel _____________
Name: Damian Vogel
Title: Chief Risk Officer
Date: August 31, 2023