 December 2014 Partnership Overview Exhibit 99.1 |
 Cautionary Statements 2 This presentation may contain forward-looking statements within the meaning of U.S. federal securities laws. These statements can be identified by the use of forward-looking terminology including “may,” “believe,” “will,” “expect,” “anticipate,” “estimate,” “continue,” or other similar words. These statements discuss future expectations, contain projections of results of operations or of financial condition, or state other “forward-looking” information. These forward-looking statements involve risks and uncertainties. When considering these forward-looking statements, you should keep in mind the risk factors and other cautionary statements in this presentation. The risks noted throughout this presentation could cause our actual results to differ materially from those contained in any forward-looking statement. A forward-looking statement may include a statement of the assumptions or bases underlying the forward-looking statement. USD Partners LP (“USDP” or the “Partnership”) believes that it has chosen these assumptions or bases in good faith and that they are reasonable. You are cautioned not to place undue reliance on any forward-looking statements. Except as required by law, USDP undertakes no obligation to revise or update any forward-looking statement. You should also understand that it is not possible to predict or identify all such factors and should not consider the following list to be a complete statement of all potential risks and uncertainties: Changes in general economic conditions; competitive conditions in our industry; actions taken by our customers and competitors; the supply of, and demand for, crude oil and biofuel rail terminalling services; our ability to successfully implement our business plan; our ability to complete growth projects on time and on budget; the price and availability of debt and equity financing; operating hazards and other risks incidental to handling crude oil and biofuels; natural disasters, weather-related delays, casualty losses and other matters beyond our control; interest rates; labor relations; large customer defaults; change in availability and cost of capital; changes in tax status; the effect of existing and future laws and government regulations; changes in insurance markets impacting cost and the level and types of coverage available; disruptions due to equipment interruption or failure at our facilities or third-party facilities on which our business is dependent; the effects of future litigation; and the factors discussed in the “Risk Factors” section of the Partnership’s final prospectus in connection with its initial public offering, filed with the Securities and Exchange Commission on October 10, 2014 (File No. 333-198500) (the “IPO Prospectus”). |
 1. Overview of USD Group LLC (“USDG”) 4 2. Overview of USD Partners LP (“USDP”) 13 3. Financial Overview 20 Appendix 25 Table of Contents 3 |
 1. Overview of USD Group LLC (“USDG”) 4 |
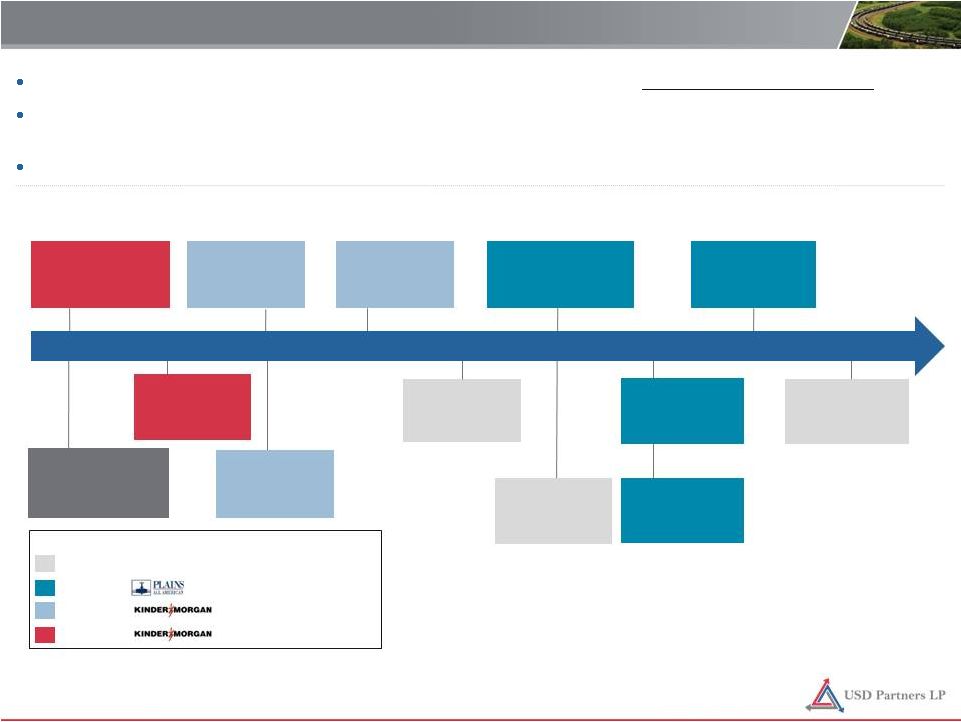 A pioneer of the hydrocarbon-by-rail concept, USDG has always focused on providing sustainable industry solutions USDG has a proven history building and operating unit train-capable terminals with an aggregate capacity of over 725,000 bpd and has safely and efficiently handled over 155 million barrels of liquid hydrocarbons Since 2010, USDG has monetized approximately $700 million of assets to high quality third party MLPs A Proven Developer and Industry Innovator 5 Terminal Start Dates Deer Park Terminal, TX Loading / Storage Facility West Colton Terminal, CA Ethanol Terminal Baltimore Terminal, MD Ethanol Terminal St. James Terminal, LA Crude / Condensate Terminal Hardisty Terminal, Canada Crude Oil Terminal Van Hook Terminal, ND Crude Oil Terminal Eagle Ford Terminal, TX Crude Oil Terminal Dallas / Ft. Worth Terminal, TX Ethanol Terminal Niobrara Terminal, CO Crude Oil Terminal Bayport Terminal, TX Railcar Storage and Staging Terminal Lomita Terminal, CA Ethanol Terminal Linden Terminal, NJ Ethanol Terminal 2000 2007 2008 2014 2011 2012 2010 2004 2006 Initial Terminal Assets of USDP Assets Sold to in December 2012 for ~$500 million¹ Assets Sold to in January 2010 for ~$195 million Assets Sold to in April 2006 for ~$48 million Legend: San Antonio Terminal, TX Ethanol Terminal 1. Bakersfield Terminal not shown in timeline due to early stage of development, but was included in sale to Plains All American. |
 Independent, Third Party Provider of Logistics Solutions Focused on industry solutions / macro solutions Aligned with our customers Proven Operator with Extensive Track Record Among the first companies to successfully develop hydrocarbon-by-rail terminals Longstanding relationships with companies in both railroad and energy industries Financial Flexibility Significant “dry powder” to pursue third party acquisitions and / or organic growth projects Strategic partnership with Energy Capital Partners (“ECP”) provides increased liquidity, financial flexibility and access to additional resources Strong Safety Record Loaded or handled over 155 million barrels of liquid hydrocarbons with no reportable spills 1 Key Competitive Advantages 1. As defined by the U.S. Department of Transportation Pipeline and Hazardous Materials Safety Administration. 6 Nationally recognized by National Safety Council, Burlington Northern Santa Fe Railway and Canadian Pacific Railway for outstanding safety record – All USDG facilities meet or exceed all current government safety regulations – Deep understanding of capital intensive and highly engineered projects |
 Industry Dynamics U.S. and Canadian crude oil production has increased significantly in recent years Increased crude oil production will lead to logistics infrastructure opportunities across multiple products, including: Compelling Industry Dynamics 7 Crude Oil Flows to U.S. Refining Centers North America Rail Network North America Crude Oil Pipeline Network Source: Canadian Association of Petroleum Producers, U.S. Energy Information Administration, Association of American Railroads. Infrastructure and logistic services opportunities will arise, including additional rail terminals, storage, blending, diluent recovery, trucking and gathering systems – Refined petroleum products – Natural gas liquids (“NGLs”) – Frac sand – Biofuels |
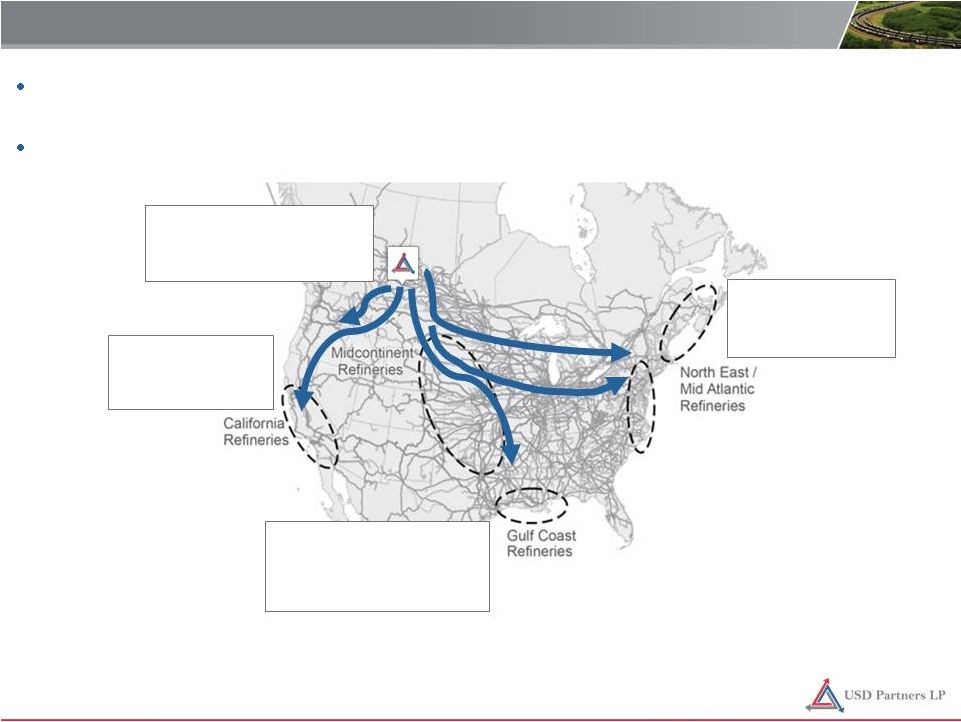 USDG believes there are substantial opportunities in the U.S. and Canada for both origination and destination terminals for crude oil, refined products and NGLs Current regional imbalances have created multiple unit train per day crude-by-rail terminal opportunities Significant Rail-Related Energy Opportunities 8 Western Canada Origination ~1.8 MMBpd expected increase in oil sands production over the next 10 years East Coast Destination Substantial refining capacity plus potential ability to export overseas West Coast Destination Substantial refining capacity plus potential ability to export overseas Gulf Coast Destination 1.5 MMBpd of heavy crude imports from Mexico and Venezuela could potentially be displaced with crude oil from Canada Source: Canadian Association of Petroleum Producers, U.S. Energy Information Administration, Association of American Railroads. Note: Heavy crude oil imports from Mexico and Venezuela per the EIA. Average monthly data from January 2014 to December 5, 2014 shown. |
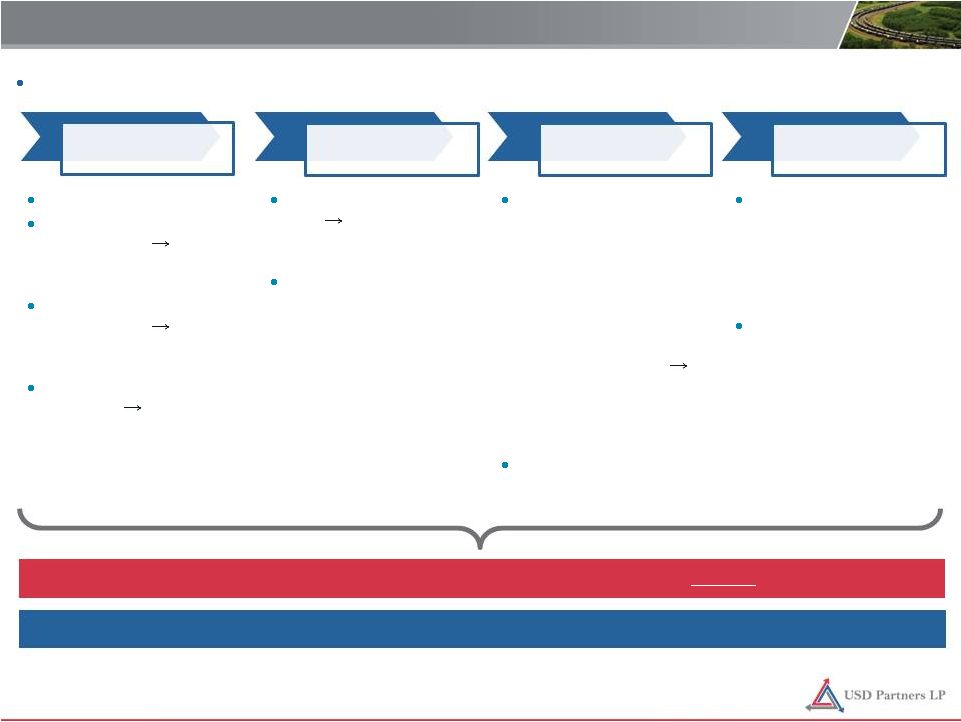 Rail enables a number of advantages for both producers / shippers and refiners Sustainable Advantages of Rail 9 Rail is a Long-Term, Sustainable Energy Infrastructure Solution North American Rail Carloads of Petroleum and Petroleum Products Have Doubled Since Early 2011 Ability to offer tailored takeaway capacity – Accessible for small and mid-sized producers and early stage production areas Increased ability to expand capacity Source: Association of American Railroads (U.S. Monthly Rail Traffic Data for Petroleum and Petroleum Products Carloads). Cost Speed Scalability Market Optionality Shorter development time ~1 year vs. multiple years for pipeline Faster deployment of infrastructure – Significant rail infrastructure already in-place – Fewer right-of-way, permitting and regulatory issues or constraints Option to reach markets with best netbacks and margins on shorter notice – Ability to choose destination once train is loaded – Faster physical delivery of product 9 days from Western Canada to the Gulf Coast vs. 30 – 45 days via pipeline Preserves ability to export crude oil Less capital required Reduced shipper commitments 3 – 7 years vs. 10+ years for pipelines Reduced financial commitments Lower fixed costs / minimal “no flow” financial risk Reduced cost of feedstock Access to domestic feedstock vs. higher priced imports |
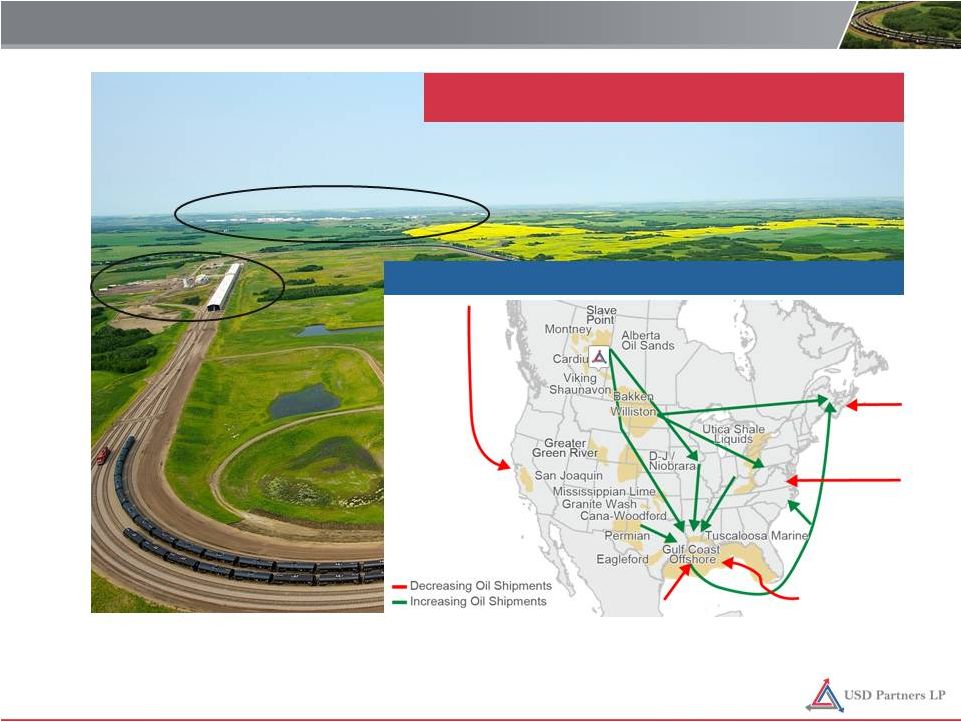 Hardisty Crude Oil Hub: The Cushing of Canada 10 Hardisty Crude Oil Storage Hub USD’s Hardisty Rail Terminal Changes in Crude Oil Flows Gibson has Over 5 MMbbls of Storage at the Hardisty Hub with an Additional 2 MMbbls of Storage Under Construction Source: Gibson Energy Inc., U.S. Energy Information Administration. |
 Hardisty Phase II Selected Growth Opportunities 11 Expand the Hardisty Rail Terminal to accommodate one additional 120-railcar unit train per day Targeting bitumen from Western Canada Endeavor to seek multi-year, take-or-pay agreements with new or existing customers Targeting 2017 to commence operations, barring any unanticipated financing, permitting, construction or other hurdles – Seeking multi-year, take-or-pay agreements with new or existing customers – Targeting late 2015 / early 2016 to commence operations, barring any unanticipated financing, permitting, construction or other hurdles – Expect similar operating cash flow profile to Hardisty I with additional cost and design efficiencies Hardisty Phase III Expand the Hardisty Rail Terminal to accommodate two additional 120-railcar unit trains per day Targeting heavy crude from Western Canada Currently in process of contracting, designing, engineering and permitting Hardisty Phase II |
 On September 22 nd , USDG announced the successful closing of a partnership with Energy Capital Partners, an energy infrastructure-focused private equity firm with over $13 billion in capital commitments As part of this transaction, ECP purchased a meaningful equity interest in USDG, who utilized the resulting proceeds to realign its shareholder base, fund several existing growth projects and strengthen its balance sheet to allow for additional flexibility to pursue its goal of providing rail-related energy infrastructure solutions Energy Capital Partners (“ECP”) Overview 12 Renewable Generation Environmental Infrastructure Energy Services ECP has extensive midstream and MLP experience. For example, funds affiliated with ECP have invested a significant amount of capital in Summit Midstream Partners, LLC, Summit Midstream Partners, LP’s majority owner and its general partner. – ECP has indicated an intention to invest over $1.0 billion of additional equity capital in USDG, subject to market and other conditions Fossil Generation Midstream Oil and Gas |
 2. Overview of USD Partners LP (“USDP”) 13 |
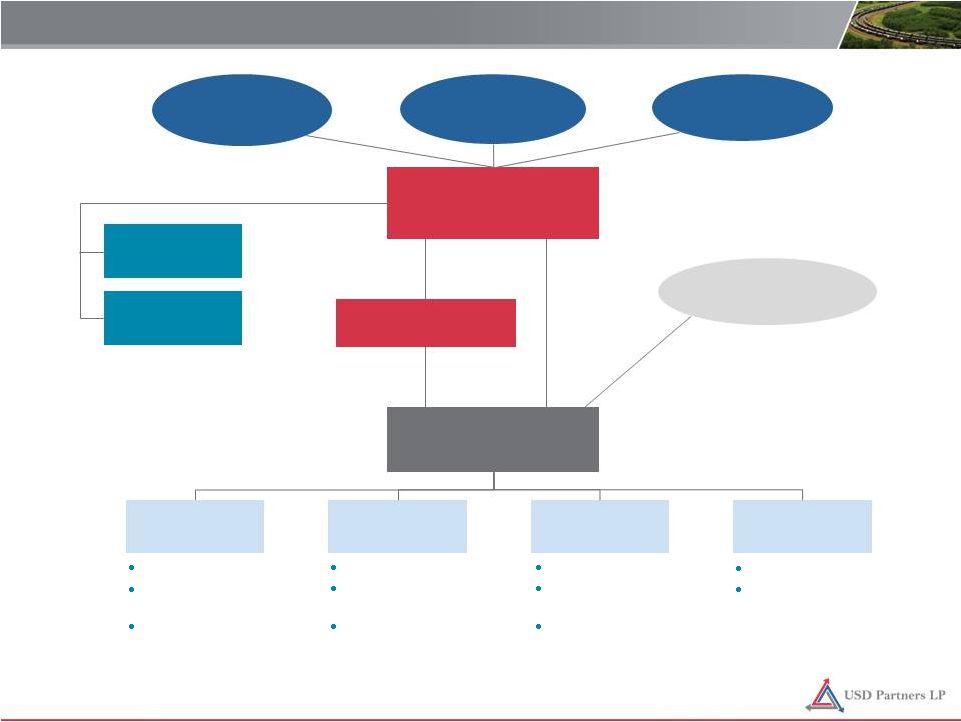 Hardisty Phases II & III USDP: Partnership Structure & Overview 14 USD Group LLC (USDG) USD Partners GP LLC (GP & IDRs) Public Unitholders Hardisty Rail Terminal (Phase I) San Antonio Rail Terminal West Colton Rail Terminal Railcar Fleet Services 100% Ownership Interest 100% Ownership Interest Assets Remaining at USDG 2.0% GP Interest & IDRs USD Partners LP (the Partnership) NYSE: USDP Other Strategic Projects Energy Capital Partners USD Holdings LLC & Management Goldman Sachs 54.1% LP Interest (Common Units and Subordinated Units) 43.9% LP Interest 2 Ethanol (Destination) 20,000 Bpd design capacity 100% fee-based 1. 172,629 bpd = 2 trains loaded per day * 120 railcars per train * approximately 720 barrels per railcar. 2. Includes 250,000 Class A Units (~1% of total units) beneficially owned by certain management team members subject to certain vesting and other conversion requirements. 3,799 railcar fleet 100% take-or-pay Ethanol (Destination) 13,000 Bpd design capacity 100% fee-based Crude Oil (Origination) 172,629 Bpd design capacity 100% take-or-pay contracts 1 |
 USDG has an extensive history as a proven developer of hydrocarbon-by-rail facilities ECP involvement at the USDG level strengthens our Sponsor’s financial position, providing a source of potential capital for third party acquisitions and development projects USDP: Investment Highlights 15 Relationship with Our Sponsor Strategically Located Assets Stable and Predictable Cash Flows Multiple Growth Levers Located near critical supply and demand centers Hardisty Rail Terminal is the only crude-by-rail terminal with unit train capabilities located in the Hardisty hub, one of the major crude oil supply centers in North America San Antonio and West Colton rail terminals are the closest ethanol terminals to key gasoline blending terminals in their areas of operation 100% of our terminal revenue is fee-based and ~83% is from investment grade counterparties or their subsidiaries Substantially all rail terminalling capacity at our Hardisty Rail Terminal is contracted under multi-year, take-or-pay agreements with inflation-based rate escalators and automatic renewal provisions Pursue drop downs from our Sponsor Pursue organic growth initiatives that complement, optimize or improve the profitability of our assets Pursue acquisitions of energy-related rail terminals and high quality, complementary midstream infrastructure from third parties (with or without our Sponsor) Financial Flexibility Conservative leverage (1.1x net debt to NTM Adjusted EBITDA) and $58.9 million of cash on the balance sheet¹ Access to debt and equity capital markets provides significant financial flexibility to effectively execute growth strategy 1. Based on USDP balance sheet as of 10/31/2014 and the Partnership’s estimated Adjusted EBITDA for the 12 month period ending September 30, 2015 included in the IPO Prospectus. Adjusted EBITDA is a non-GAAP financial measure. For a discussion of EBITDA and the most comparable measures calculated in accordance with GAAP, see the Appendix. |
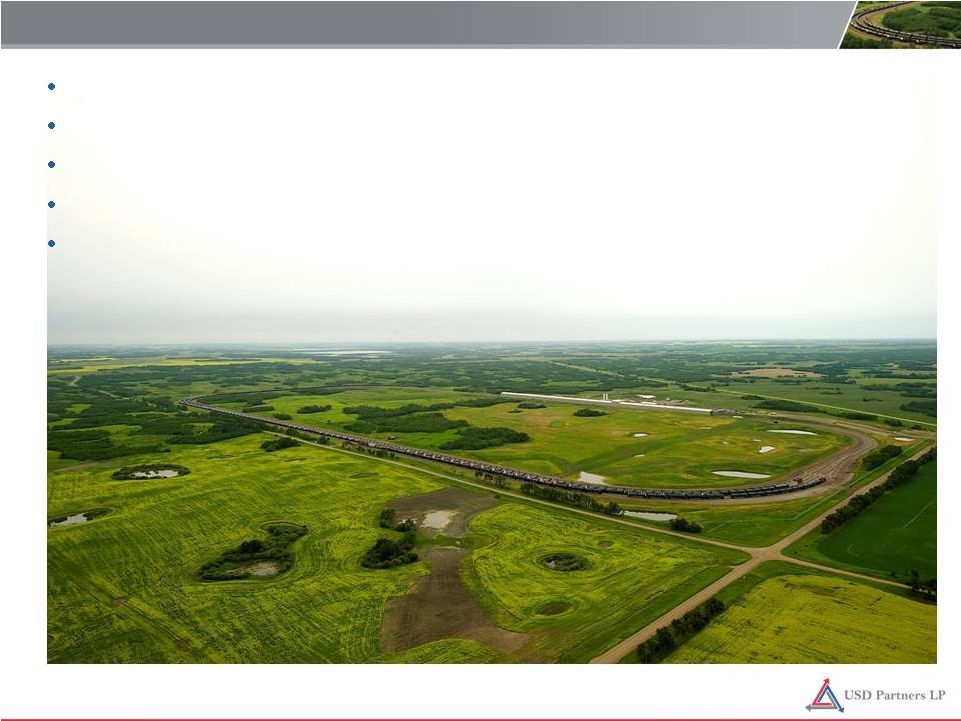
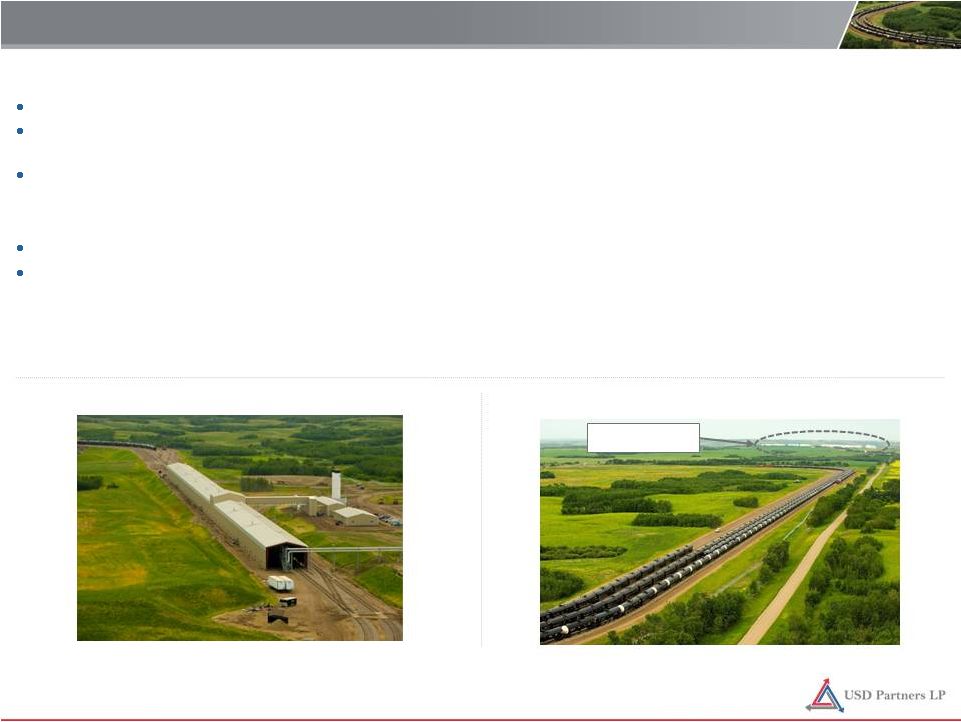 Strategically Located Assets: Hardisty Rail Terminal 16 Overview of the Hardisty Rail Terminal Origination terminal that commenced operations on June 30, 2014 Only unit train capable crude-by-rail terminal located at the Hardisty hub, the primary location for storing and originating crude oil from Alberta’s Crude Oil Basin Receives inbound deliveries via direct pipeline connection to the Gibson Energy Inc. (“Gibson”) Hardisty storage terminal Connected to CP Railroad’s North Main Line, which offers connectivity to all key refining markets in North America Ability to load up to two 120-railcar unit trains per day Hardisty Rail Terminal Located within Close Proximity to the Hardisty Hub Hardisty Hub Source: Gibson Energy Inc. (Hardisty hub operational storage capacity figures). – Fixed loading rack with 30 railcar loading positions – Unit train staging area – Loop tracks capable of holding 5 unit trains simultaneously – Gibson has over 5 MMbbls of storage at the Hardisty hub, with an additional 2 MMbbls of storage under construction – Provides access to most major pipeline systems in the Hardisty complex |
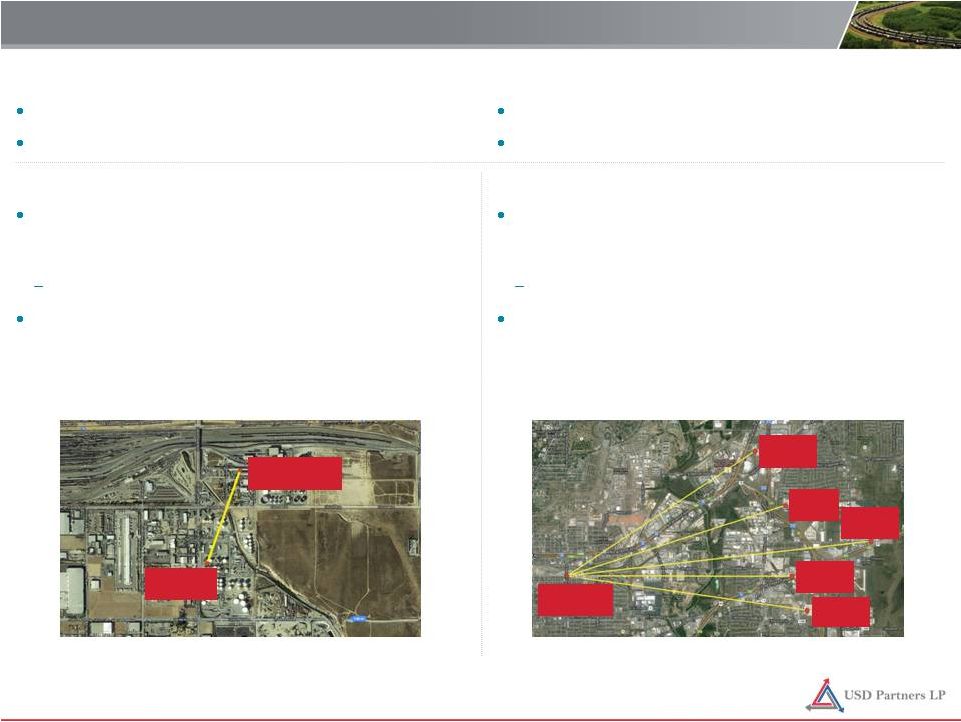 West Colton Rail Terminal Blending Facilities Strategically Located Assets: Ethanol Destination Terminals 17 Infrastructure Needs Addressed by Our Ethanol Destination Terminals Fragmented production Pipelines disadvantaged and trucks uneconomical Significant regional imbalances Regulatory pressures regarding gasoline blending Overview of the West Colton Rail Terminal Unit train-capable destination terminal that transloads ethanol received by rail from regional and other producers at a max rate of 13,000 Bpd Located within one mile of the gasoline blending terminals that supply the greater San Bernardino and Riverside County-Inland Empire region of Southern California and the only rail terminal within a 10-mile radius of the gasoline blending terminals Overview of the San Antonio Rail Terminal Unit train-capable destination terminal that transloads ethanol received by rail from Midwestern producers at a max rate of 20,000 Bpd Located within five miles of San Antonio’s gasoline blending terminals and the only ethanol rail terminal within a 20-mile radius of the gasoline blending terminals San Antonio Rail Terminal Blending Facilities Blending Facilities Blending Facilities Blending Facilities Blending Facilities 20 railcar offloading positions and 3 truck loading positions 20 railcar offloading positions and 3 truck loading positions |
 USDP’s ability to provide railcars gives customers additional incentives to commit to USDP’s terminals, as end customers can find it difficult to procure railcars themselves without the economies of scale and relationships with railcar providers USDP has entered into master fleet services agreements with a number of its rail terminal customers for the use of its leased railcars on a fee-based, take-or-pay basis for periods ranging from 5 to 9 years A Strategic Asset: Our Railcar Fleet 18 Total Railcars (as of 09/30/14) Currently Available for Service In Production or on Order Coiled and Insulated General Purpose Constructed in 2013 and 2014 3,799 2,919 2,108 66% 800 1,691 As of September 30, 2014, the weighted-average remaining contract life of railcars dedicated to Hardisty rail terminal was 6.7 years; the weighted-average contract life of the entire fleet was 5.3 years |
 USDG is committed to safe, efficient and reliable operations that comply with environmental and safety regulations All USDG facilities meet or exceed all government safety regulations and are in compliance with all recently enacted orders regarding the movement of crude-by-rail USDG has been nationally recognized by the National Safety Council, Burlington Northern Santa Fe Railway, and Canadian Pacific Railways, among others, for its outstanding safety record Since inception, USDG has loaded and / or handled over 155 MMbbls of liquid hydrocarbons with no reportable spills as defined by the U.S. Department of Transportation (DOT) Pipeline and Hazardous Materials Safety Administration (PHMSA) Strong Safety Record 19 Organization Time Period Recognition National Safety Council 2006–2014 (Nine Consecutive Years) Superior Safety Performance Award Canadian Pacific Railways 2013 Safe Shipper Award Burlington Northern Santa Fe Railway 2011–2012 (Two Consecutive Years) Stewardship Award |
 3. Financial Overview 20 |
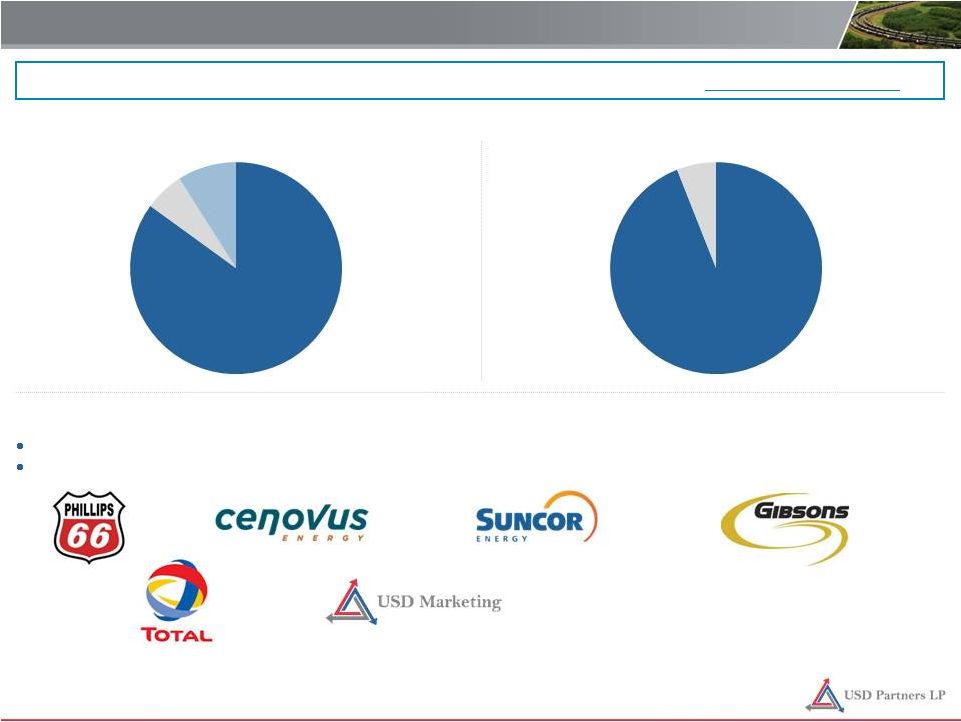 Stable and Predictable Cash Flows: Fee-Based Contracts 21 Estimated Adjusted EBITDA by Contract Type Terminalling Customers Note: Adjusted EBITDA is a non-GAAP measure. Charts represent breakout of the Partnership’s estimated Adjusted EBITDA for the twelve month period ending September 30, 2015 included in the IPO Prospectus. Take-or-Pay 94% Other Fee-Based 6% 6 out of 8 are subsidiaries of investment grade customers No single customer represents more than 18% of estimated Adjusted EBITDA J. Aron & Company Estimated Adjusted EBITDA by Asset Hardisty Crude Terminal 85% USD Rail 9% Ethanol Terminals 6% Our fee-based contracts provide stable and predictable cash flows with 94% from take-or-pay |
 Financial Flexibility Financial Flexibility: Positioned to Pursue Growth 22 Debt and Liquidity 1. Calculated based on Total Debt and Net Debt divided by the Partnership’s estimated Adjusted EBITDA for the twelve month period ending September 30, 2015 included in the IPO Prospectus. ($ in millions) As of 10/31/2014 Cash and Cash Equivalents $58.9 Revolving Credit Facility Capacity 200.0 Less: Funded Borrowings 0.0 Available Liquidity $258.9 Borrowings on Revolver $0.0 Term Loan 100.1 Total Debt $100.1 Net Debt 41.2 Total Debt / Estimated NTM Adjusted EBITDA¹ 2.6x Net Debt / Estimated NTM Adjusted EBITDA¹ 1.1x In connection with the IPO, USDP entered into a $300 million senior secured credit agreement consisting of a $100 million term loan (drawn in Canadian dollars) and a $200 million revolving credit facility (undrawn) Revolving credit facility capacity will expand to $300 million as the term loan is repaid Revolving credit facility capacity can be further increased by $100 million As of 10/31/2014, the Partnership had $58.9 million of cash on the balance sheet to fund potential future growth initiatives and for general partnership purposes |
 Strategic Flexibility: Multiple Growth Levers 23 Pursue Drop Down Acquisitions from USDG USDG has a strong track record of developing high-quality assets that align with USDP’s vision and strategy Two identified potential drop downs from USDG: Hardisty Phase II and Hardisty Phase III – USDG is in the process of designing, engineering, permitting and is currently negotiating contracts with third parties with respect to Hardisty Phase II Pursue Third Party Acquisitions with Stable and Predictable Cash Flows USDP intends to acquire energy-related rail terminals and high-quality, complementary midstream infrastructure assets from third parties – Acquisitions will be pursued jointly with, or independently from, USDG Pursue Organic Growth Initiatives USDP will analyze and pursue operational efficiencies that complement, optimize or improve the profitability of its assets – Currently in the process of seeking permits to construct a pipeline directly from the West Colton Rail Terminal to Kinder Morgan, Inc.’s gasoline blending terminals, which may result in additional cash flow and long-term volume commitments Expect to Achieve Mid-Teens Distribution Growth CAGR over the Next 5 Years |
 Investment Highlights 24 Strategically Located Assets Stable and Predictable Cash Flows Financial Flexibility Multiple Growth Levers Relationship with USDG / ECP |
 Appendix 25 |
 Total Quarterly Distribution Per Unit Target Amount Marginal % Interest in Distributions Unitholders General Partner Minimum Quarterly Distribution $0.287500 98% 2% First Target Distribution > $0.287500 $0.330625 98% 2% Second Target Distribution > $0.330625 $0.359375 85% 15% Third Target Distribution > $0.359375 $0.431250 75% 25% Thereafter > $0.431250 50% 50% Additional Unit Information 26 Subordinated LP Units Number of Units / % of Total 10,463,545 subordinated units / 49.0% of total units outstanding Subordination Period Subordinated units will convert in 5 separate equal tranches beginning no earlier than January 1, 2015 assuming distributions equal or exceed the MDQ for the prior 4 quarter period, there are no arrearages owed on common units, and the adjusted operating surplus generated during the prior 4 quarter period equals or exceeds the MDQ on all common, Class A, subordinated and GP units on a fully diluted basis A tranche of subordinated units will not convert more than once per year Class A Units Number of Units / % of Total 250,000 Class A units / 1.2% of total units outstanding Summary Terms Maximum number of common units into which Class A units could convert is 406,250 Vest in 4 equal annual installments beginning no earlier than January 1, 2015 Upon vesting, units are convertible into common units based on a factor that will be tied to the level of distribution growth for the applicable year – If USDP does not grow its distributions per unit, then Class A units will be forfeited – Conversion factor will not exceed 1.25x for the first tranche, 1.5x for the second, 1.75x for the third and 2.0x for the final tranche |
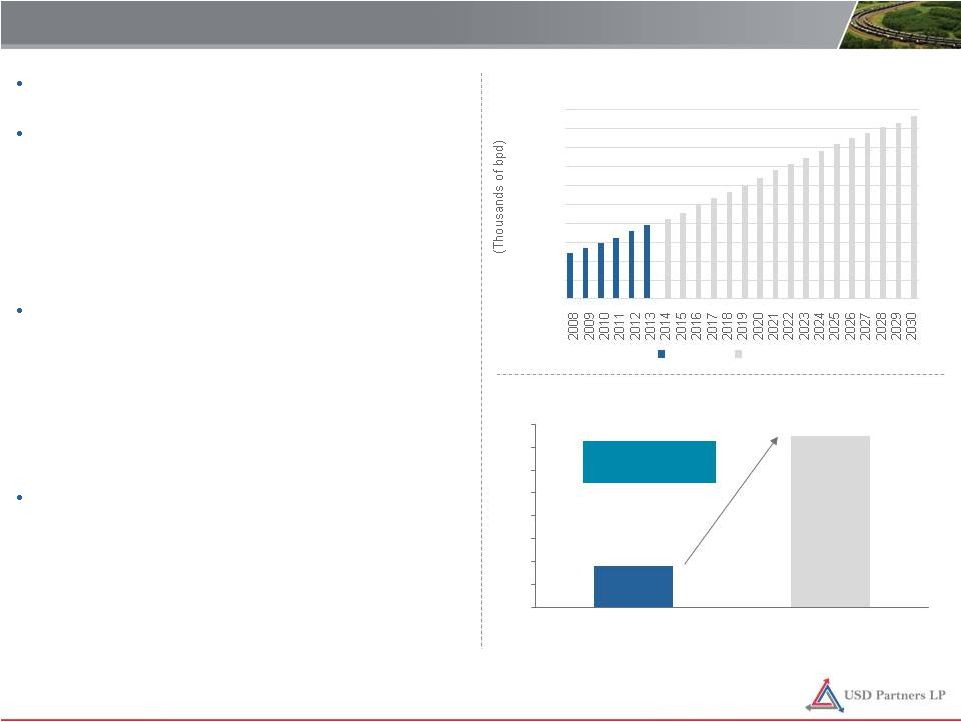 Increased oil sands production creates need for sustainable takeaway solution A faster, scalable solution to growing production Sustainability of Rail: Western Canada Producer Perspective 27 Expected Growth in Western Canadian Oil Sands Production Typical Time to Market: Hardisty to U.S. Gulf Coast 7% CAGR Through 2020 5% CAGR Through 2030 ~9 days ~30–45 days Source: Canadian Association of Petroleum Producers (2014 Canadian Crude Oil Production Forecast). 0 500 1,000 1,500 2,000 2,500 3,000 3,500 4,000 4,500 5,000 Actual Projected 0 5 10 15 20 25 30 35 40 Rail Pipeline – Ability to choose destination once train is loaded, maximizing netbacks and margins – Rail solution preserves quality of heavy barrel and ability to export from Gulf Coast – Only a portion of rail transportation costs require long-term commitments (railroads are typically contracted on a spot basis) – Pipeline customers bear greater risks of changes in regional differentials – Lower “no-flow” financial risk – Utilizes existing infrastructure and rights-of-way – ~1 year development time vs. multiple years for pipeline – Faster physical delivery to attractive end markets – Accessible to small and mid-sized producers and early stage production areas Offers increased flexibility and market optionality Reduced shipper commitments / risk ~4x Longer Market Exposure 7% CAGR Through 2020 5% CAGR Through 2030 |
 Provides access to cheaper domestic crude feedstock to displace more expensive heavy imports Sustainability of Rail: U.S. Gulf Coast Refiner Perspective 28 Volumes of Imported Heavy Crude into the U.S. Landed Cost of Imported Refinery Crude Inputs Refinery Crude Oil Input Quality Source: U.S. Energy Information Administration. Note: “Landed Cost” = The dollar per barrel price of crude oil at the port of discharge. Includes charges associated with the purchase, transportation, and insuring of a cargo from the purchase point to the port of discharge. Does not include charges incurred at the discharge port (e.g., import tariffs or fees, wharfage charges, and demurrage). 1. Notated 2014YTD figures represent a simple average of monthly weighted averages through September (latest available as of December 18, 2014). Imported heavy crude volumes include data through December 5, 2014. Lower API ~1.5 million bpd of Displacement Opportunity 15 20 25 30 35 East Coast (PADD1) Midwest (PADD2) Gulf Coast (PADD3) TX Gulf Coast Rockies (PADD4) West Coast (PADD5) 2012 2013 2014YTD¹ 1,000 1,200 1,400 1,600 1,800 2,000 2,200 2,400 2,600 2,800 2010 2011 2012 2013 2014 Canada Venezuela + Mexico $84 $84 $87 $102 $99 $94 $102 $99 $94 $- $20 $40 $60 $80 $100 $120 2012 2013 2014YTD¹ Canada Mexico Venezula – Opportunity for blending to optimize feedstock – Maximizes margins (reducing costs associated with diluents) – Improves product distribution Preserves the quality of a heavy barrel – ~$87/bbl average landed cost from Canada vs. ~$94/bbl from Mexico and Venezuela¹ – Strong demand for heavy crude oil (lower API) in U.S. Gulf Coast |
 Non-GAAP Measures 29 We define Adjusted EBITDA as net income before the following items: depreciation and amortization, interest and other income, interest and other expense, gains and losses on derivative contracts, foreign currency transaction gains and losses, unrecovered reimbursable freight costs, income and withholding taxes, non-cash compensation expense related to our equity compensation programs, discontinued operations and adjustments related to deferred revenue associated with minimum volume commitments. Adjusted EBITDA is used as both a supplemental financial performance measure by management and by external users of our financial statements, such as investors and commercial banks. Our management and external users use Adjusted EBITDA in a number of ways to assess our combined financial and operating performance, and we believe this measure is helpful to management and external users in identifying trends in our performance. Adjusted EBITDA helps management identify controllable expenses and make decisions designed to help us meet our current financial goals and optimize our financial performance, while neutralizing the impact of capital structure on results. Accordingly, we believe this metric measures our financial performance based on operational factors that management can impact in the short-term, namely our cost structure and expenses. We believe that the presentation of Adjusted EBITDA provides information useful to investors in assessing our financial condition and results of operations. The GAAP measures most directly comparable to Adjusted EBITDA are net income attributable to us and cash flow from operating activities. Adjusted EBITDA should not be considered an alternative to Net income attributable, Cash flow from operating activities or any other measure of financial performance or liquidity presented in accordance with GAAP. Adjusted EBITDA excludes some, but not all, items that affect Net income, and these measures may vary among other companies. As a result, Adjusted EBITDA may not be comparable to similarly titled measures of other companies. For a reconciliation of our estimated Adjusted EBITDA for the twelve months ending September 30, 2015 to our estimated net income for the twelve months ending September 30, 2015, please see page 75 of the IPO Prospectus. |