
Exhibit 99.1 Jefferies Virtual Healthcare Conference Alistair Macdonald Chief Executive Officer June 3, 2020
Forward-Looking Statements and Non-GAAP Financial Measures Forward-Looking Statements Except for historical information, all of the statements, expectations, and assumptions contained in this EBITDA, adjusted EBITDA, and adjusted EBITDA margin. We also include in this presentation non-GAAP presentation are forward-looking statements as that term is defined in the Private Securities Litigation Reform Act financial measures to illustrate our leverage profile, including net debt and net leverage. A “non-GAAP financial of 1995, including the expected impact of the COVID-19 pandemic on our business, financial results and financial measure” is generally defined as a numerical measure of a company’s financial performance that excludes or condition, anticipated financial results for the second quarter and full year 2020, the potential lifetime value of end- includes amounts from the most directly comparable measure calculated and presented in accordance with GAAP to-end wins, and plans for cost savings and capital deployment. Actual results might differ materially from those in the statements of operations, balance sheets, or statements of cash flows of the Company. explicit or implicit in the forward-looking statements. Important factors that could cause actual results to differ The Company defines adjusted revenue and segment adjusted revenue as GAAP revenue and segment revenue, materially include, but are not limited to: reliance on key personnel; principal investigators and patients; general respectively, adjusted to include revenue eliminated as a result of purchase accounting. and international economic, political, and other risks, including currency and stock market fluctuations and the uncertain economic environment; risks related to the COVID-19 pandemic; the Company's ability to adequately The Company defines adjusted net income (including adjusted diluted earnings per share) as net income price its contracts and not overrun cost estimates; any adverse effects from the Company's customer or (including diluted earnings per share) excluding acquisition-related deferred revenue adjustments; acquisition- therapeutic area concentration; the Company's ability to maintain or generate new business awards; the related amortization; restructuring and other costs; transaction and integration-related expenses; share-based Company's ability to increase its market share, grow its business, and execute its growth strategies; the compensation expense; loss on extinguishment of debt; and other income (expense), net. After giving effect to Company's backlog not being indicative of future revenues and its ability to realize the anticipated future revenue these items, the Company has also included an adjustment to its income tax rate to reflect the expected long-term reflected in its backlog; fluctuations in the Company's operating results and effective income tax rate; risks related income tax rate and impact of the base erosion and anti-abuse tax. to the Company's information systems and cybersecurity; changes and costs of compliance with regulations related to data privacy; risks related to the United Kingdom’s withdrawal from the European Union; risks related to EBITDA represents earnings before interest, taxes, depreciation and amortization. The Company defines adjusted the Company's transfer pricing policies; failure to perform services in accordance with contractual requirements, EBITDA, both at the company and segment level, as EBITDA, further adjusted to exclude expenses and regulatory requirements and ethical considerations; risks relating to litigation and government investigations; risks transactions that the Company believes are not representative of its core operations, namely: acquisition-related associated with the Company's early phase clinical facilities; insurance risk; risks of liability resulting from harm to deferred revenue adjustments; restructuring and other costs; transaction and integration-related expenses; asset patients; success of investments in the Company's customers’ business or drugs; foreign currency exchange rate impairment charges; share-based compensation expense; other income (expense), net; and loss on fluctuations; risks associated with acquired businesses, including the ability to integrate acquired operations, extinguishment of debt. The Company presents EBITDA and adjusted EBITDA because it believes they are useful products, and technologies in our business; risks related to the Company's income tax expense and tax reform; metrics for investors as they are commonly used by investors, analysts and debt holders to measure the risks relating to the Company's intellectual property; risks associated with the Company's acquisition strategy; Company's ability to fund capital expenditures and meet working capital requirements. failure to realize the full value of goodwill and intangible assets; restructuring risk; potential violations of anti- Each of the non-GAAP measures noted above are used by management and the Board to evaluate the corruption and anti-bribery laws; risks related to the Company's dependence on third parties; downgrades of the Company's core operating results because they exclude certain items whose fluctuations from period-to-period do Company's credit ratings; competition in the biopharmaceutical services industry; changes in outsourcing trends; not necessarily correspond to changes in the core operations of the business. Adjusted net income (including regulatory risks; trends in the Company's customers’ businesses; the Company's ability to keep pace with rapid adjusted diluted earnings per share) and adjusted EBITDA are used by management and the Board to assess the technological change; risks related to the Company's indebtedness; fluctuations in the Company's financial results performance of the Company's business. and stock price; and other risk factors set forth in the Company's Annual Report on Form 10-K for the fiscal year ended December 31, 2019 as updated by the Company’s Quarterly Report on Form 10-Q for the quarter ended Non-GAAP measures have limitations in that they do not reflect all of the amounts associated with the Company's March 31, 2020, and other SEC filings, copies of which are available free of charge on the Company's website at results of operations as determined in accordance with GAAP. Also, other companies might calculate these investor.syneoshealth.com. The Company assumes no obligation and does not intend to update these forward- measures differently. Investors are encouraged to review the reconciliations of the non-GAAP financial measures looking statements, except as required by law. to their most directly comparable GAAP measures included in the Appendix of this presentation. Non-GAAP Financial Measures In addition to the financial measures prepared in accordance with U.S. Generally Accepted Accounting Principles ("GAAP"), this presentation contains certain non-GAAP financial measures, including adjusted revenue, segment adjusted revenue, adjusted net income (including adjusted diluted earnings per share), 2

Market Leader Purpose-Built for Biopharmaceutical Acceleration Clinical Solutions TOP % of 3 74% CRO TTM # 1 Adjusted CCO Only Revenue 26% end-to-end biopharma Commercial Solutions product development organization in the world >$75B >90% combined market of FDA approved Novel Syneos One™ opportunity by 2022 New Drugs and EMA growing at a compound marketing authorized annual growth rate of products developed or ~6%1 commercialized by Syneos Health2 Note: Revenue split is based on TTM Adjusted Revenue through March 31, 2020. For a reconciliation of the presented financial measures, please reference slide 18 in the Appendix. 1. Management estimates incorporating public filings and other available documents. CRO defined as Phase I – IV Clinical Development only and excludes pre-clinical, lab, and other services. CCO defined as Advisory, Field Sales, and healthcare Communications exclusive of media buying. Estimates include outsourced reimbursable out of pocket expenses. 2. Represents products approved by the US Food and Drug Administration and the European Medicine Agency between January 1, 2015, and December 31, 2019. 3
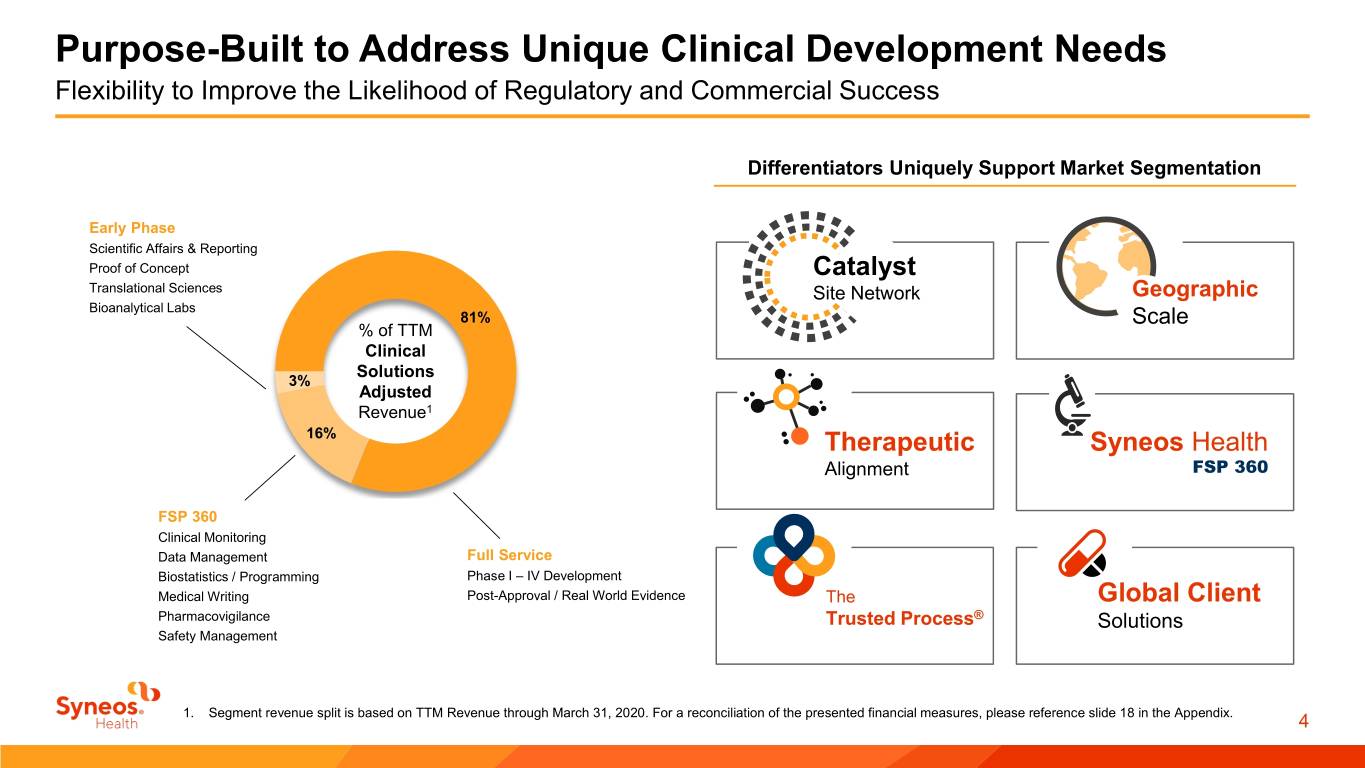
Purpose-Built to Address Unique Clinical Development Needs Flexibility to Improve the Likelihood of Regulatory and Commercial Success Differentiators Uniquely Support Market Segmentation Early Phase Scientific Affairs & Reporting Proof of Concept Catalyst Translational Sciences Site Network Geographic Bioanalytical Labs 81% Scale % of TTM Clinical Solutions 3% Adjusted Revenue1 16% Therapeutic Syneos Health Alignment FSP 360 FSP 360 Clinical Monitoring Data Management Full Service Biostatistics / Programming Phase I – IV Development Medical Writing Post-Approval / Real World Evidence The Global Client Pharmacovigilance Trusted Process® Solutions Safety Management 1. Segment revenue split is based on TTM Revenue through March 31, 2020. For a reconciliation of the presented financial measures, please reference slide 18 in the Appendix. 4

Expanding Clinical Share Positions for Continued Growth Share Strength and Opportunity 3 Strategic wins with Top 30 Pharma since Q1 18 <5% ~15% Strong position with 21 - 50 Market ~10% Market where flexibility matters Share Market Share Share Top 20 Pharma 21 - 50 Pharma SMID CRO Market Outsourced Clinical Spend1 Leading position SYNH Clinical Solutions Adjusted Revenue2 in the SMID market SYNH Market Weight (8%)1 1. Management estimates based on Evaluate pharma and analyst research 2. For the trailing twelve months period ended March 31, 2020 3. Top 20 and 21-50 Large Pharma defined by prior year R&D spend from EvaluatePharma and excludes medical device companies. 5

Building Momentum with Large Pharma Preferred Provider Wins with Top 30 Pharma Demonstrate the Strength of our Unique Capabilities … you won this work because you understand our goals and vision, the combination of your clinical and “commercial capabilities, and the fact that you consider patients as your customers truly differentiates you ” - Global Head of Therapeutic Unit R&D, Top 30 Pharma 1 Clinical Scale 2 CRO + CCO 3 Syneos One™ Full-service Oncology Full-service Clinical Syneos One driven award to optimize delivery of a portfolio portfolio award from preferred provider of Oncology assets for an established Clinical customer customer who primarily relationship (one of two • Leveraging insights-driven Syneos One product used our consulting providers) from one of development model to de-risk & accelerate development services previously our largest Commercial • Early strategic engagement to inform critical drug customers development decision making • Cross-functional teams from sponsor and Syneos Health will share therapeutic expertise and product development insights Q2 2018 Q3 2019 Q4 2019 6

Commercial Industry Leader Positioned for the Modern Market Unparalleled Breadth of Capabilities Uniquely Positioned for a Dynamic Market Deployment Solutions Field-Based Promotional Solutions and Clinical Teams Strategy Design Recruiting 61% Sales Operations Market >15% Growth 2 Engagement Center Leader in SMID revenue Medication Adherence % of TTM Commercial Solutions 1 9% Revenue Integrated Launch Solutions Experience 30% Consulting Communications Pricing and Market Access Advertising The Global Client Commercial Strategy and Planning Public Relations Trusted Process® Solutions Medical Affairs Advisory Medical Communications Risk Management Multi-Channel Solutions Digital, Naming / Branding Kinapse … significant influence in Large Pharma preferred provider wins 1. Segment revenue split is based on TTM Revenue through March 31, 2020. 2. For the trailing twelve months period ended March 31, 2020, as compared to the trailing twelve months period ended March 31, 2019 7
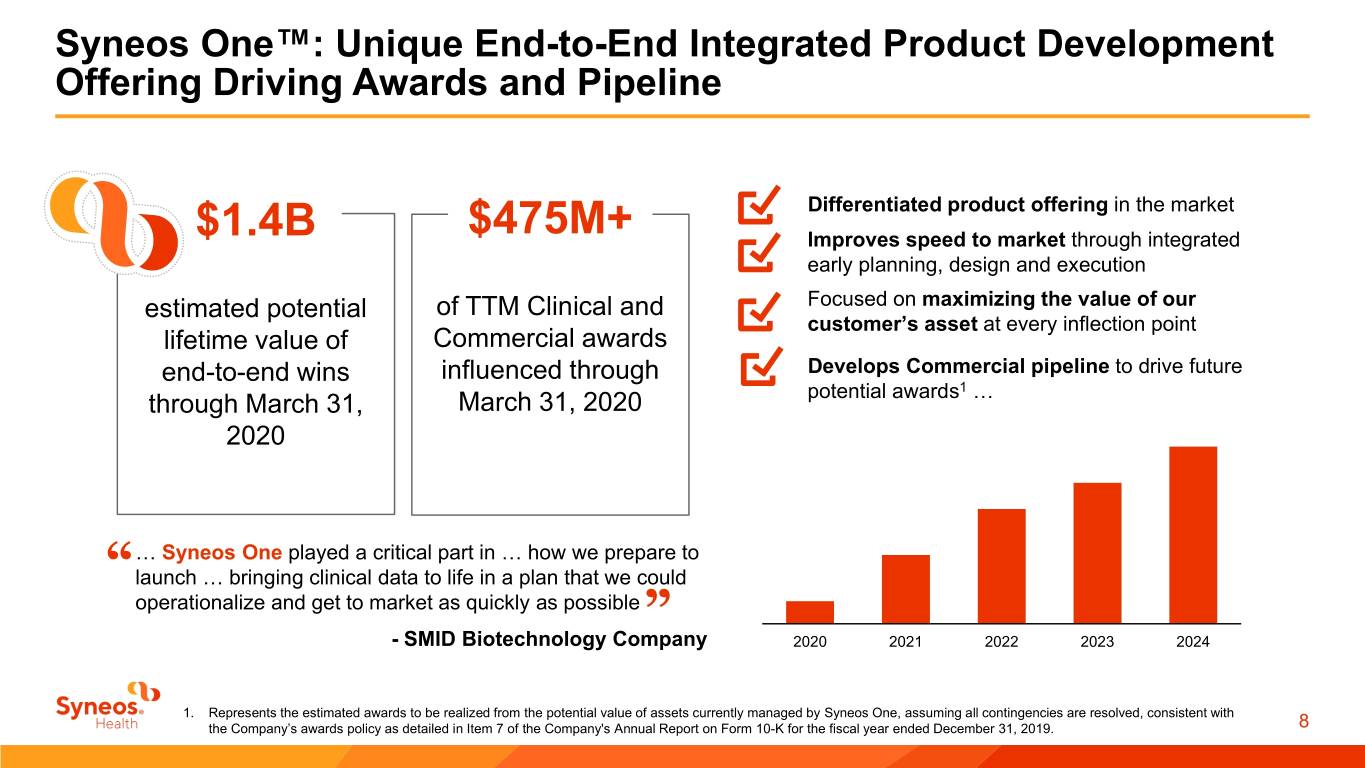
Syneos One™: Unique End-to-End Integrated Product Development Offering Driving Awards and Pipeline Differentiated product offering in the market $1.4B $475M+ Improves speed to market through integrated early planning, design and execution estimated potential of TTM Clinical and Focused on maximizing the value of our customer’s asset at every inflection point lifetime value of Commercial awards end-to-end wins influenced through Develops Commercial pipeline to drive future potential awards1 … through March 31, March 31, 2020 2020 … Syneos One played a critical part in … how we prepare to “launch … bringing clinical data to life in a plan that we could operationalize and get to market as quickly as possible ” - SMID Biotechnology Company 2020 2021 2022 2023 2024 1. Represents the estimated awards to be realized from the potential value of assets currently managed by Syneos One, assuming all contingencies are resolved, consistent with the Company’s awards policy as detailed in Item 7 of the Company's Annual Report on Form 10-K for the fiscal year ended December 31, 2019. 8
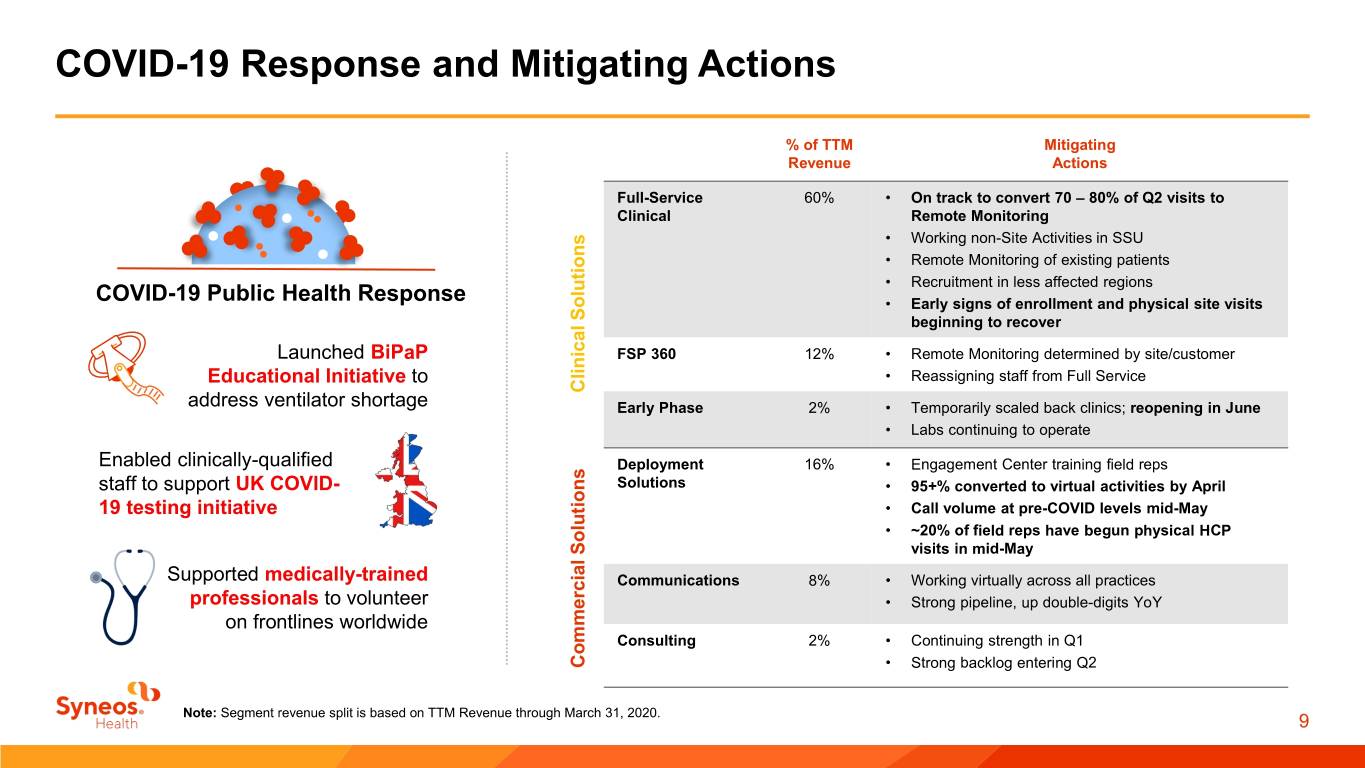
COVID-19 Response and Mitigating Actions % of TTM Mitigating Revenue Actions Full-Service 60% • On track to convert 70 – 80% of Q2 visits to Clinical Remote Monitoring • Working non-Site Activities in SSU • Remote Monitoring of existing patients • Recruitment in less affected regions COVID-19 Public Health Response • Early signs of enrollment and physical site visits beginning to recover Launched BiPaP FSP 360 12% • Remote Monitoring determined by site/customer Educational Initiative to • Reassigning staff from Full Service ClinicalSolutions address ventilator shortage Early Phase 2% • Temporarily scaled back clinics; reopening in June • Labs continuing to operate Enabled clinically-qualified Deployment 16% • Engagement Center training field reps staff to support UK COVID- Solutions • 95+% converted to virtual activities by April 19 testing initiative • Call volume at pre-COVID levels mid-May • ~20% of field reps have begun physical HCP visits in mid-May Supported medically-trained Communications 8% • Working virtually across all practices professionals to volunteer • Strong pipeline, up double-digits YoY on frontlines worldwide Consulting 2% • Continuing strength in Q1 Commercial Solutions Commercial �� Strong backlog entering Q2 Note: Segment revenue split is based on TTM Revenue through March 31, 2020. 9
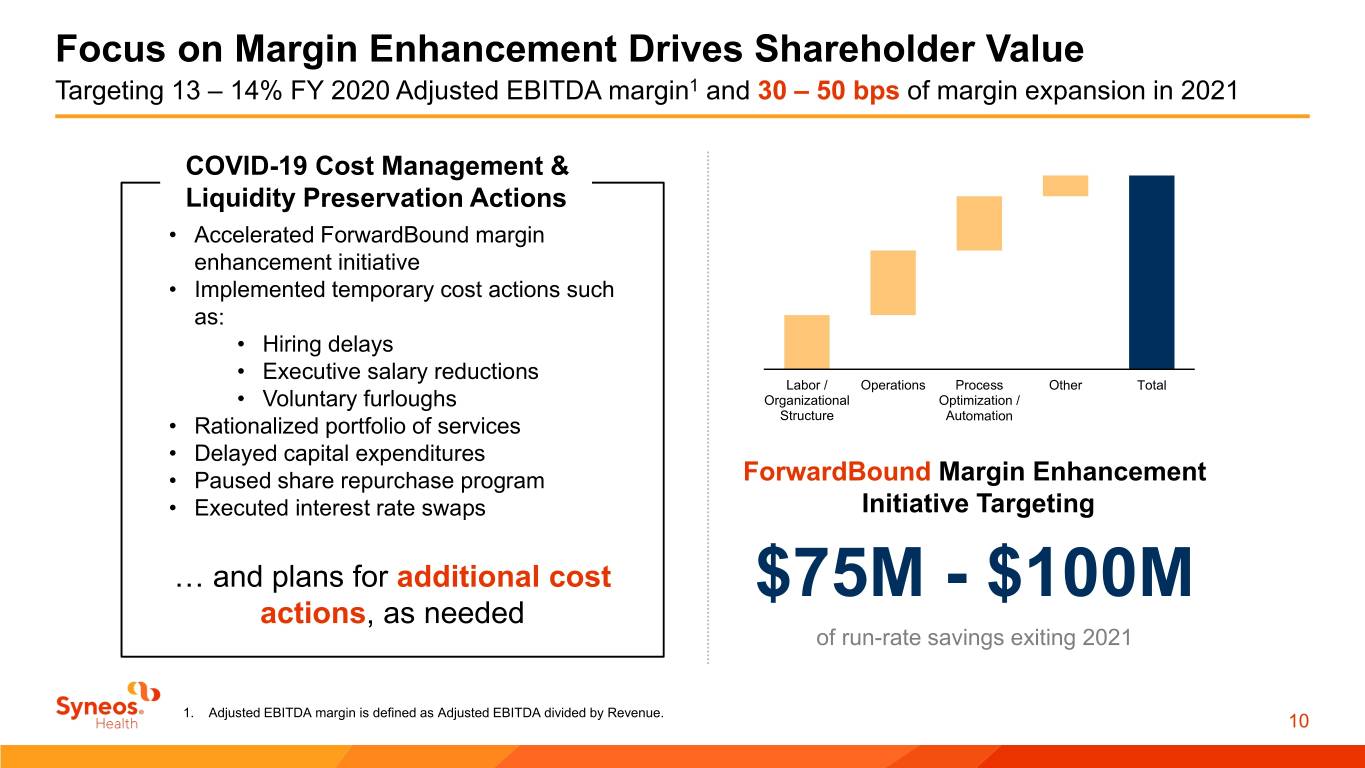
Focus on Margin Enhancement Drives Shareholder Value Targeting 13 – 14% FY 2020 Adjusted EBITDA margin1 and 30 – 50 bps of margin expansion in 2021 COVID-19 Cost Management & Liquidity Preservation Actions • Accelerated ForwardBound margin enhancement initiative • Implemented temporary cost actions such as: • Hiring delays • Executive salary reductions Labor / Operations Process Other Total • Voluntary furloughs Organizational Optimization / Structure Automation • Rationalized portfolio of services • Delayed capital expenditures • Paused share repurchase program ForwardBound Margin Enhancement • Executed interest rate swaps Initiative Targeting … and plans for additional cost actions, as needed $75M - $100M of run-rate savings exiting 2021 1. Adjusted EBITDA margin is defined as Adjusted EBITDA divided by Revenue. 10

Balanced Approach to Capital Deployment Successfully Managing our Capital Structure and Related Costs Debt Reduction Tuck-in Acquisitions Share and Management and Strategic Partnerships Repurchases Redeemed 7.5% Senior Notes in Q4 2019 Continue to review tuck-in acquisition and Board approved extension of the program through expanded Term Loan A facility strategic partnership opportunities that: to December 31, 2020, and raised authorization by $50.0M to $300.0M • Add capabilities Term loan debt repayments of $472.8M Ability to make Opportunistic share since Merger closing, net of initial $183.6M • Strengthen geographic footprint repurchases under remaining $136.3M draw on the AR Securitization facility • Enhance therapeutic depth authorization A/R securitization facility to borrow up to Repurchased $163.7M from January 1, $275.0M provides further capital flexibility 2018 to March 31, 2020 at a weighted and interest rate savings average price of $42.03 Paused share repurchase program for Q2 Drew $300M on revolving credit facility to 2020 supplement cash reserves, leaving a remaining capacity of $280.8M as of March 31, 2020 2.5x – 3.0x net leverage target by EOY 2021 11

Q2 2020 Outlook $M (except margin, growth rate, and per share data) Guidance Range Growth Rate Revenue1,2 $ 1,000 - $ 1,020 (14.4) % – (12.7) % Adjusted EBITDA $ 107 - $ 117 (30.4) % – (23.9) % Adjusted EBITDA Margin3 10.7% - 11.5% Adjusted Diluted EPS $ 0.48 - $0.52 (35.1) % – (29.7) % Note: Financial guidance takes into account a number of factors, including the Company’s sales pipeline, existing backlog and expectations of net awards, trends in cancellations and delays, current foreign currency exchange rates, expected interest rates, and expected tax rate. 1. Revenue guidance assumes foreign exchange currency rates as of May 28, 2020. 2. No deferred revenue adjustment is anticipated in Q2 2020. However, the growth rate for revenue assumes an add-back of deferred revenue eliminated in purchase accounting of approximately $1.6M for Q2 2019. 3. Adjusted EBITDA margin is defined as Adjusted EBITDA divided by Revenue. For a reconciliation of the presented financial measures, please reference slides 16 – 17 in the Appendix of this presentation. 12

Investment Summary: Driving Shareholder Value Comprehensive Fit-for-Purpose Unique Syneos One™ Product Development Insights across Clinical product offering solutions and Commercial $ $ $ Increasing share and Value creation Balanced momentum via capital deployment with Margin Enhancement Large Pharma 13

Shortening the Distance From Lab to Life®.

Appendix 15
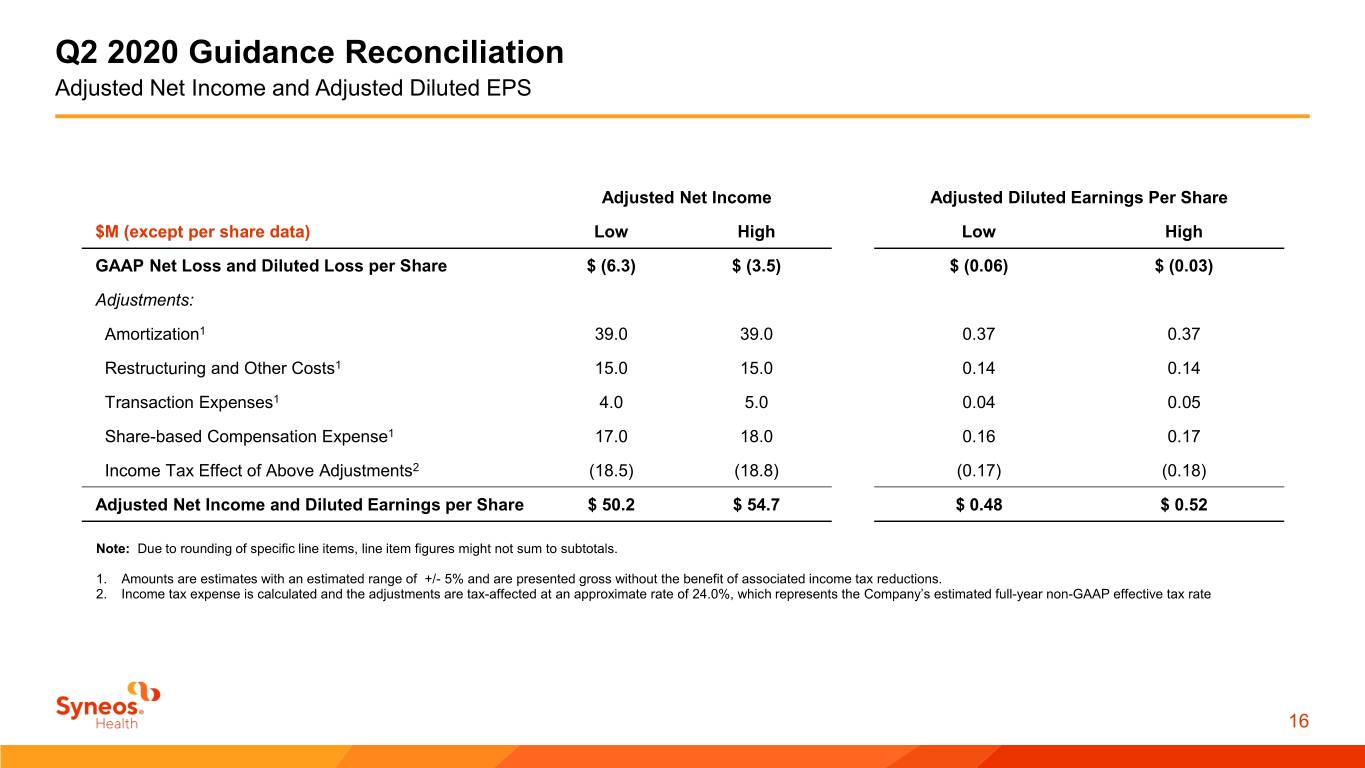
Q2 2020 Guidance Reconciliation Adjusted Net Income and Adjusted Diluted EPS Adjusted Net Income Adjusted Diluted Earnings Per Share $M (except per share data) Low High Low High GAAP Net Loss and Diluted Loss per Share $ (6.3) $ (3.5) $ (0.06) $ (0.03) Adjustments: Amortization1 39.0 39.0 0.37 0.37 Restructuring and Other Costs1 15.0 15.0 0.14 0.14 Transaction Expenses1 4.0 5.0 0.04 0.05 Share-based Compensation Expense1 17.0 18.0 0.16 0.17 Income Tax Effect of Above Adjustments2 (18.5) (18.8) (0.17) (0.18) Adjusted Net Income and Diluted Earnings per Share $ 50.2 $ 54.7 $ 0.48 $ 0.52 Note: Due to rounding of specific line items, line item figures might not sum to subtotals. 1. Amounts are estimates with an estimated range of +/- 5% and are presented gross without the benefit of associated income tax reductions. 2. Income tax expense is calculated and the adjustments are tax-affected at an approximate rate of 24.0%, which represents the Company’s estimated full-year non-GAAP effective tax rate 16

Q2 2020 Guidance Reconciliation Adjusted EBITDA $M Low High GAAP Net Loss $ (6.3) $ (3.5) Adjustments: Interest Expense, Net1 23.0 25.0 Income Tax Expense1 (2.7) (1.5) Depreciation1 18.0 20.0 Amortization1 39.0 39.0 EBITDA 71.0 79.0 Restructuring and Other Costs1 15.0 15.0 Transaction Expenses1 4.0 5.0 Share-based Compensation Expense1 17.0 18.0 Adjusted EBITDA $ 107.0 $ 117.0 Note: Due to rounding of specific line items, line item figures might not sum to subtotals. 1. Amounts are estimates with an estimated range of +/- 5% and are presented gross without the benefit of associated income tax reductions. 17
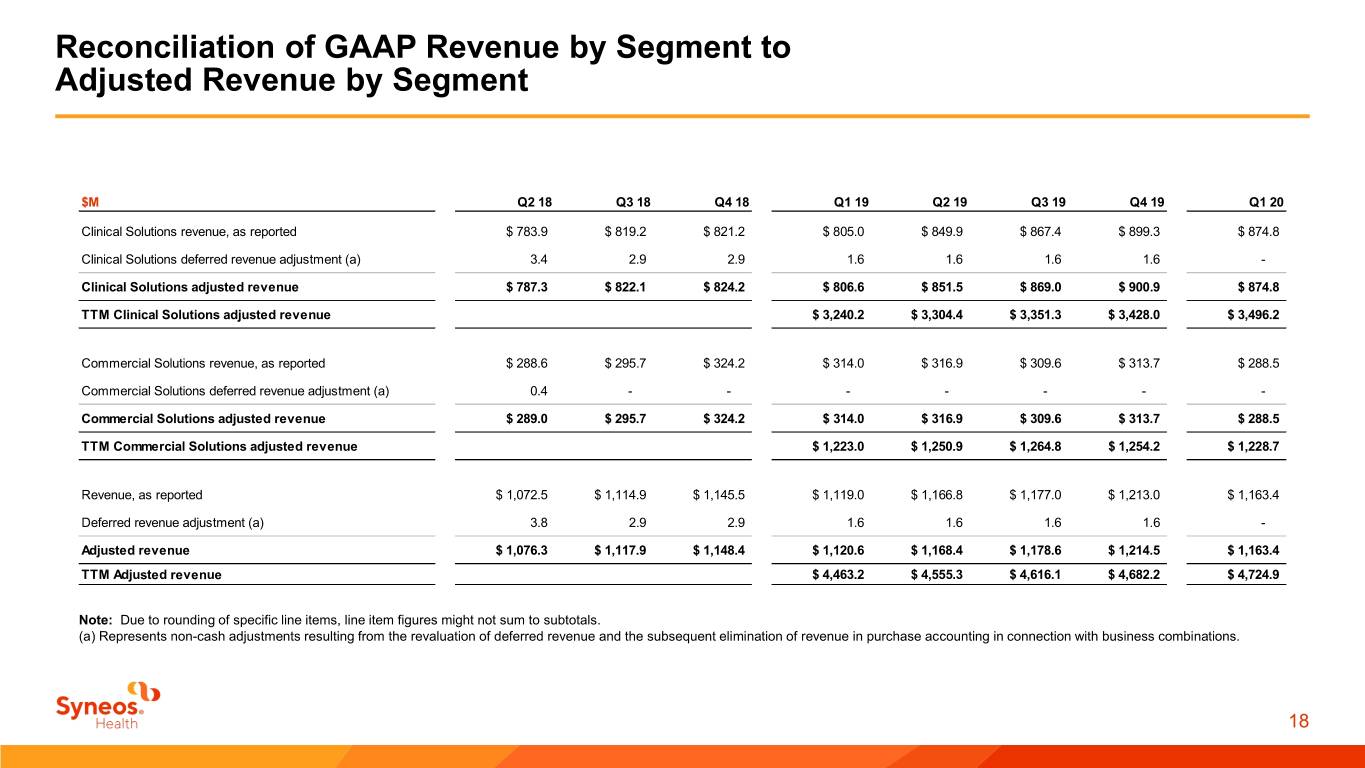
Reconciliation of GAAP Revenue by Segment to Adjusted Revenue by Segment $M Q2 18 Q3 18 Q4 18 Q1 19 Q2 19 Q3 19 Q4 19 Q1 20 Clinical Solutions revenue, as reported $ 783.9 $ 819.2 $ 821.2 $ 805.0 $ 849.9 $ 867.4 $ 899.3 $ 874.8 Clinical Solutions deferred revenue adjustment (a) 3.4 2.9 2.9 1.6 1.6 1.6 1.6 - Clinical Solutions adjusted revenue $ 787.3 $ 822.1 $ 824.2 $ 806.6 $ 851.5 $ 869.0 $ 900.9 $ 874.8 TTM Clinical Solutions adjusted revenue $ 3,240.2 $ 3,304.4 $ 3,351.3 $ 3,428.0 $ 3,496.2 Commercial Solutions revenue, as reported $ 288.6 $ 295.7 $ 324.2 $ 314.0 $ 316.9 $ 309.6 $ 313.7 $ 288.5 Commercial Solutions deferred revenue adjustment (a) 0.4 - - - - - - - Commercial Solutions adjusted revenue $ 289.0 $ 295.7 $ 324.2 $ 314.0 $ 316.9 $ 309.6 $ 313.7 $ 288.5 TTM Commercial Solutions adjusted revenue $ 1,223.0 $ 1,250.9 $ 1,264.8 $ 1,254.2 $ 1,228.7 Revenue, as reported $ 1,072.5 $ 1,114.9 $ 1,145.5 $ 1,119.0 $ 1,166.8 $ 1,177.0 $ 1,213.0 $ 1,163.4 Deferred revenue adjustment (a) 3.8 2.9 2.9 1.6 1.6 1.6 1.6 - Adjusted revenue $ 1,076.3 $ 1,117.9 $ 1,148.4 $ 1,120.6 $ 1,168.4 $ 1,178.6 $ 1,214.5 $ 1,163.4 TTM Adjusted revenue $ 4,463.2 $ 4,555.3 $ 4,616.1 $ 4,682.2 $ 4,724.9 Note: Due to rounding of specific line items, line item figures might not sum to subtotals. (a) Represents non-cash adjustments resulting from the revaluation of deferred revenue and the subsequent elimination of revenue in purchase accounting in connection with business combinations. 18

Shortening the Distance From Lab to Life®.


