OPC ENERGY LTD.
Report of the Board of Directors regarding the Company’s Matters
for the three‑month period ended March 31, 2024
The Board of Directors of OPC Energy Ltd. (hereinafter – “the Company”) is pleased to present herein the Report of the Board of Directors regarding the activities of the Company and its investee companies (hereinafter together – “the Group”), as at March 31, 2024 and for the three‑month period then ended (the Period of the Report”).
Except for the data reviewed in the Company’s interim consolidated financial statements as at March 31, 2024 (hereinafter – “the Interim Statements”) that is included in this report below, the data appearing in the Report of the Board of Directors has not been audited or reviewed by the Company’s auditing CPAs.
This Report of the Board of Directors is submitted on the assumption that the interim reports and all parts of the Company’s Periodic Report for 2023, which was published on March 12, 2024 (Reference No.: 2024‑01‑021301) (“the Periodic Report for 2023”), are before the reader and references to the Company’s reports include the information presented therein by means of reference.
Main financial parameters (in millions of shekels)
| | | | For the | |
| | | | Three Months Ended | |
| | | | | |
| | | | | | | | | | | |
| | | | | | | | | | | |
Consolidated | Adjusted EBITDA after proportionate | | | | | | | | | |
| consolidation | | | 345 | | | | 275 | | | | 25 | % |
| Net income | | | 15 | | | | 79 | | | | (81 | %) |
| Adjusted net income | | | 26 | | | | 103 | | | | (75 | %) |
| FFO | | | 262 | | | | 197 | | | | 33 | % |
Israel | Adjusted EBITDA | | | 170 | | | | 118 | | | | 44 | % |
| FFO | | | 209 | | | | 141 | | | | 48 | % |
U.S. | Adjusted EBITDA after proportionate | | | | | | | | | | | | |
| consolidation | | | 178 | | | | 164 | | | | 9 | % |
| FFO | | | 90 | | | | 107 | | | | (16 | %) |
| Adjusted EBITDA after proportionate | | | | | | | | | | | | |
| consolidation – energy transition | | | 179 | | | | 181 | | | | (1 | %) |
| Adjusted EBITDA – renewable energies | | | 28 | | | | 7 | | | | 300 | % |
| | | | | | | | | | | | | | |
| * | Adjusted EBITDA, adjusted EBITDA after proportionate consolidation, adjusted net income and FFO are not recognized in accordance with IFRS – for definitions and the manner of their calculation – see Sections 4A and 4B to the Report of the Board of Directors for 2023. |
| 1 | The Executive Summary below is presented solely for convenience and it is not a substitute for reading the full detail (including with reference to the matters referred to in the Summary) as stated in this report with all its parts (including warnings relating to “forward‑looking” information as it is defined in the Securities Law, 1968 (“the Securities Law”) definitions or explanations with respect to the indices for measurement of the results and including the information included by means of reference, as applicable). This Summary includes estimates, plans and assessment of the Company, which constitute “forward‑looking” information regarding which there is no certainty it will materialize and the readers are directed to the detail presented in this report below. |
| 1. | Executive Summary (Cont.) |
Main developments in the first quarter and thereafter
| Israel | Increase of 44% in the adjusted EBITDA compared with the corresponding quarter last year Memorandum of principles with Intel for construction of power plant with a capacity of 450‑650 megawatts – in March 2024 a non‑binding memorandum of principles was signed for supply of electricity to Intel’s facilities in Kiryat Gat, including the facilities presently being constructed, for a period of 20 years from the operation date. Continued development of the Ramat Beka solar project with a capacity of 245 megawatts with integration of storage (1,375 megawatts per hour) – advancement of the development on the National Infrastructures Committee, after the government approved in February 2024 its consent to advance the project. Government decision regarding the Hadera 2 project – in April 2024 the Israeli government rejected the plan for construction of a power plant on land adjacent to the Hadera power plant. As at the date of the report, the Company is studying the rejection response and based thereon it will consider taking action regarding the matter, including legal action. Supplementary arrangements and approval of supply license for Rotem – in March 2024, a decision of the Electricity Authority was received regarding supplementary arrangements for Rotem, by force of which, among other things, Rotem is expected to receive a supply license. The decision will take effect from July 1, 2024. Sale of electricity to consumers of Partner Communications Ltd. (“Partner”) that are household consumers and small businesses and decision regarding “smart meters” – in February 2024, an agreement was signed with Partner that will permit that will permit diversification of the mix of the Company’s customers. In April 2024, a decision was made by the Electricity Authority that will permit the Company to also sell electricity to household consumers without a smart meter and assignment thereof to a private conventional supplier, commencing from November 1, 2024. |
| | |
| U.S. | Increase of about 9% in adjusted EBITDA compared with the corresponding quarter last year. Memorandum of principles for an investment of $300 million in the renewable energy activities of the CPV Group in the U.S. – in April 2024, a non‑binding memorandum of principles was signed for an investment of $300 million in exchange for an issuance of 32.6% of the ordinary rights in these activities, which reflects a value “before the money” of $620 million. Completion of construction of the Stagecoach project with a capacity of 102 megawatts – as at the approval date of the report, the project reached commercial operation and an agreement was signed with a tax partner (PTC), in the amount of about $52 million. |
| | |
| Group headquarters | Issuance of a new series of debentures (Series D) – in January 2024, debentures (Series D) were issued, in the amount of NIS 200 million with an average of life of 6.4 years and an annual interest rate of 6.2%. |
| 1. | Executive Summary (Cont.) |
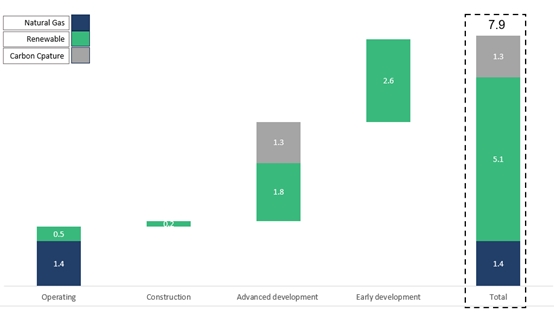
Portfolio of about 9.9 GW and about 1.4 GWh of storage (for details – see Section 5 below)
United States (*)
| (*) | In addition, the CPV Group has additional projects in the area of carbon capture with a scope about 5GW in initial development stages. |
Israel (**)
| (**) | As at the date of the report, the initial development does not include the Hadera 2 project with a capacity of about 850 megawatts, due to the Government’s decision to reject the plan )for details see Section 5 below(. |
That stated with respect to the development stages, capacities and expectations regarding construction of the development projects constitutes “forward‑looking” information as it is defined in the Securities Law, which is based on the Company’s estimates at the date of the report and regarding which there is no certainty they will be realized. Ultimately, there could be changes in the characteristics of the projects and/or delays due to regulatory and/or operating factors and/or realization of one or more of the risk factors to which the Company is exposed, as stated in Part A of the Periodic Report for 2023. Advancement of the development projects is subject to the discretion of the Company’s competent organs and existence (fulfillment) of additional conditions, as stated in Part A of the Periodic Report for 2023.
| 2. | Brief description of the areas of activity |
The Company is a public company the securities of which are listed for trade on the Tel Aviv Stock Exchange Ltd. (hereinafter – “the Stock Exchange”).
For details regarding the Group’s activity segments in the period of the report – see Part 2 of the Report of the Board of Directors that is included in the Periodic Report for 2023 (“Report of the Board of Directors for 2023”) and Note 27 to the annual financial statements.
| 3. | Main Developments in the Business Environment |
| A. | Macro‑economic environment (particularly inflation and interest) – for details regarding the business environment and the macro‑economic situation in which the Group companies operate, significant changes that occurred in 2022–2023 and the impact thereof on the Group’s activities – see Section 3.1A of the Report of the Board of Directors for 2023. |
In the first quarter of 2024, in the U.S. in the interest‑rate decisions made in January and March 2024 the interest rate remained unchanged. In addition, in the interest‑rate decision made in May 2024 the interest rate once again remain unchanged at the level of 5.5%, where based on the estimates published by the U.S. Federal Reserve Bank during 2024, three rate reductions of 0.25% each are expected, down to a rate of about 4.6%. In Israel, in the January 2024 interest decision Bank of Israel decided to reduce the interest rate to 4.5% while thereafter in the interest‑rate decisions made in February and April 2024 it left the rate unchanged, where according to the forecasts published by Bank of Israel, the interest rate will continue to gradually decline in 2024 and will stabilize in the first quarter of 2025 in the range of 3.75% to 4%.
Set forth below is data with reference to the currency exchange rate, Consumer Price Index (CPI) in Israel and in the U.S. the interest rates of Bank of Israel and the interest rates of the Fed in U.S.:
| | | | | | | | | | |
| | | | | | | | | | |
| Dollar/shekel exchange rate* | | | | | | | | | |
| At the end of the prior year | | | 3.627 | | | | 3.519 | | | | 3.1 | % |
| At March 31 | | | 3.681 | | | | 3.615 | | | | 1.8 | % |
| Average January– March | | | 3.664 | | | | 3.536 | | | | 3.6 | % |
| | | | | | | | | | | | | |
| * | The dollar/shekel exchange rate shortly before the approval date of the report (on May 16, 2024, is 3.681. |
| | | | | | | | | Bank of | | | | |
| | | | | | | | | Israel | | | Federal | |
| | | Israeli | | | U.S. | | | interest | | | interest | |
| | | | | | | | | | | | | |
| | | | | | | | | | | | | |
| At May 16, 2024 | | | 113.2 | | | | 313.5 | | | | 4.5 | % | | | 5.25%–5.50 | % |
| At March 31, 2024 | | | 111.6 | | | | 310.3 | | | | 4.5 | % | | | 5.25%–5.50 | % |
| At December 31, 2023 | | | 111.3 | | | | 307.1 | | | | 4.75 | % | | | 5.25%–5.50 | % |
| At March 31, 2023 | | | 108.9 | | | | 300.8 | | | | 4.25 | % | | | 4.75%–5.00 | % |
| At December 31, 2022 | | | 107.7 | | | | 297.7 | | | | 3.25 | % | | | 4.25%–4.50 | % |
| Change in the first quarter of 2024 | | | 0.3 | % | | | 1.0 | % | | | (0.25 | %) | | | 0 | % |
| Change in the first quarter of 2023 | | | 1.1 | % | | | 1.1 | % | | | 1 | % | | | 0.5 | % |
| | | | | | | | | | | | | | | | | |
For details regarding credit linked to the CPI or to prime – see Section 9(B) of the Report of the Board of Directors for 2023. For additional details regarding impacts of the changes in the macro‑economic environment on the results of the Group’s activities – see Section 11 of the Report of the Board of Directors for 2023.
| 3. | Main Developments in the Business Environment (Cont.) |
| B. | Domestic and geopolitical instability in the defense (security) situation in Israel – 2023 was characterized by significant instability against the background of internal domestic events and geopolitical defense (security) matters. As stated in the Report of the Board of Directors for 2023, as at the approval date of this report, the war that broke out on October 7, 2023 is still ongoing. In this regard, it is noted that against the background of the War and the geo‑political defense (security) instability, in April 2024 the State of Israel withstood an air strike of missiles from Iran. The war and the security situation led to impacts and restrictions on the Israeli economy that include, among other things and based on the actual situation, reduction of economic activities, a large call for military reserves duty (soldiers), limitations on gatherings in work places and public areas, restrictions on carrying on classes in the educational system, temporary closing of air traffic routs, etc. As at the approval date of the report, most of the said restrictions had been gradually relaxed, according to the security situation existing in the State and the relevant combat areas. |
In addition, as at the approval date of the report the War has had external (consequential) impacts including, among others, interruptions in the marine routes to Israel due to attacks on commercial and supply ships and a significant cutback of the activities of the foreign airline companies in Israel. These impacts could have an adverse impact on the arrival of equipment and foreign teams to Israel (including equipment and teams required for purposes of maintenance and construction of the Group’s activity sites in Israel) and the time schedules for their arrival.
Furthermore, as at the approval date of the report the War could impact Israel’s foreign relations which, in turn, could also impact the State’s economic situation. The said events involve significant uncertainty and could impact the macro‑economic environment, including a negative impact on the strength of the Israeli economy and the financial position of the State of Israel, including possible unfavorable changes in Israel’s credit rating (in February 2024, the international rating company “Moody’s” announced a reduction of Israel’s credit rating to a level of A2 with a negative rating outlook and in April 2024 the international rating company S&P gave notice of a reduction of the credit rating of Israel to a level of A+ with a negative rating outlook) and of the Israeli financial institutions, particularly the Israeli banking system (as at the publication date of the report, both “Moody’s” and S&P reduced the credit rating of some of the Israeli banks), adversely affect investments in the Israeli economy and trigger a removal of money and investments from Israel, increase the costs of the financing sources in Israel, cause a weakening of the exchange rate of the shekel against the other currencies (particularly the dollar), harm the activities of the business sector and create instability in the Israeli capital market (including increased volatility, falling prices of traded securities, and limited liquidity and accessibility). Also, the possible impacts of the War, including events such as the Iranian attack, could impact the possibility of acquiring insurance policies covering war and terrorist risks to the Group’s assets in Israel or a significant worsening of the terms of these policies. To the extent the above estimates materialize, wholly or partly, or in a case of a worsening of the security situation, this could negatively impact the Company’s activities and the activities of the Company’s customers and suppliers in Israel (including physical harm or curtailment of activities) and could also negatively impact the results of the Company’s activities and the availability and cost of the capital and financing sources that are required by the Company, mainly for purposes of supporting its continued business growth. As at the approval date of the report, there is no certainty regarding the duration or extent of the impact of these items. For details regarding the significance of the War on the Group’s business activities and results – see Section 12, below.
| C. | Global events and broad impacts on raw‑material prices and the supply chain – for details – see Section 3.1C of the Report of the Board of Directors for 2023. |
| 3. | Main Developments in the Business Environment (Cont.) |
| D. | Update of the electricity tariffs – on February 1, 2024, the annual update to the tariff for 2024 for electricity consumers of Israel Electric Company entered into effect. Pursuant to the decision, the generation component was updated to NIS 0.3007 per kilowatt hour, a decrease of 1.1% compared with the generation component at the end of 2023 – this being mainly due to the surplus receipts expected from sale of the Eshkol power plant, which led to a reduction in the generation sector. In addition, as part of the said tariff update decision, it was noted that pursuant to the decision designation of the receipts from sale of Eshkol was determined – the surplus receipts from the sale will first be used to cover expenses incurred during the war, including costs of diesel oil, and only thereafter will the surplus receipts be used to cover non‑recurring past expenses. |
Set forth below is data regarding the annual weighted‑average generation component (the prices are denominated in agurot per kilowatt hours):
| | | | | | | | | |
| | | | | | | | | | |
| January–March average | | | 30.18 | | | | 30.94 | | | | (2.5 | %) |
| | | | | | | | | | | | | |
It is noted that the results of the Group’s activities in Israel are materially impacted by changes in the electricity generation component tariff, in such a manner that an increase in the electricity generation component has a positive impact on the Group’s result, and vice‑versa.
| E. | Supplementary arrangements and granting of a supply license to Rotem – further to that stated in Section 3.2E of the Report of the Board of Directors for 2023 regarding a proposed decision regarding the matter of supplementary arrangements and imposition of certain covenants on Rotem (“the Hearing”), on March 13, 2024 a decision of the Electricity Authority was announced further to the Hearing (“the Decision”). In general, the arrangements in the Decision are not significantly different than the arrangements included in the Hearing, which include, among other things, imposition of certain covenants on Rotem, including with respect to the matter of deviations from the consumption plans and the market model, along with provision of a supply license to Rotem (if it meets the conditions for receipt of a license), this being against the background of the intention of the Electricity Authority to consolidate in many respects the regulation applicable to Rotem with that of other bilateral electricity generators, and thus, to permit Rotem to operate in the energy market in a manner similar and equal to the said generators. |
Further the decision of the Electricity Authority regarding “extension of dates for construction of electricity generation facilities throughout Israel and an additional extension in the area surrounding western part of the south region and the northern border due to the defense (security) situation”, which was published on March 26, 2024, as part of which the start date for application of the market model regulation to private generators was extended to July 1, 2024, on April 11, 2024 a decision of the Electricity Authority was published postponing the application date of the decision determining the supplemental arrangements and granting a supply license to Rotem to July 1, 2024 (in place of May 1, 2024)2. As at the approval date of the report, Rotem had filed a request to receive a supplier license that is in the processes in the Electricity Authority. For additional details – see Section 7.3.18.5 of Part A of the Periodic Report for 2023.
| 2 | https://www.gov.il/he/departments/policies/68805 |
3. Main Developments in the Business Environment (Cont.)
| 3.2 | Activities in Israel (Cont.) |
| F. | Decision regarding the matter of “smart meters” |
On April 10, 2024, the Electricity Authority published a Decision according to which it will be possible to assign household consumers without a “smart meter” to private transactions based a normative consumption model of a household consumer. The Decision will enter into effect on July 1, 2024 with respect to virtual suppliers (which do not have means of generation) and on November 1, 2024 with respect to conventional suppliers (which have means of generation, such as the Company), unless the dates are advanced due to a notification of the critical service supplier of early completion of the preparations necessary for purposes of implementation of the benchmarks. The Decision permits the Company to increase the diversity of its customers by means of selling electricity directly and/or indirectly to all households.
| G. | Bilateral market regulation for generation facilities in the transmission network |
|
| On April 17, 2024, the Electricity Authority published a public call with respect to principles for a bilateral market regulation for generation facilities in the transmission network. Pursuant to the public call, the Electricity Authority is considering determination of a regulation whereby facilities for generation of renewable energy and storage facilities that are connected to the transmission network will be permitted to sell the electricity generated in bilateral transactions pursuant to a mechanism whereby the generator will sign a deal with a virtual supplier for sale of availability, which will convey the supplier a right to acquire energy from the network at the market price, in a capacity that will conform to the facility’s technology through use of a “conformance coefficient”, as detailed in the public call, in every year up to the amount of the capacity stated in the availability certificate it acquired from the generator, and the generator will commit to operate in accordance with the market model. In addition, the supplier and the generator will sign a financial hedging transaction covering the energy generated in the facility. According to the public call, in the first stage it will apply solely to generation facilities using renewable energy, including with integrated storage, and to independent storage facilities that are connected to the transmission network, provided that certain conditions specified in the public call have been met. |
It is noted that the Ramat Beka solar project that is being developed by the Company might operate under this regulation, to the extent it is actually advanced and subject to the final regulations that will be determined (if any).
For additional details regarding developments of the Group’s activities in Israel – see Section 5 below.
| 3.3 | Activities in the U.S. |
| H. | Electricity and natural gas prices |
The results of the activities of the CPV Group are impacted to a significant extent by the electricity prices in effect in the areas in which the Group’s power plants operate. The main factors impacting the electricity prices are demand for electricity, available generation capacity (supply) and the natural gas price in the area in which the power plant operates.
With respect to the area of “energy transition” activities, in general, the natural gas price is significant in determination of the price of the electricity in most of the regions in which the power plants of the CPV Group operate that are powered by natural gas. For the most part, in the existing production mix, over time, to the extent the natural‑gas prices are higher, the marginal energy prices will also be higher, and will have a positive impact on the energy margins of the CPV Group due to the high efficiency of the power plants it owns compared with other power plants operating in the relevant activity markets (the impact could be different between the projects taking into account their characteristics and the area (region) in which they are located).
Electricity prices
The following table summarizes the average electricity prices in each of the main regions in which the power plants in the area of energy transition activities of the CPV Group are active (the prices are denominated in dollars per megawatt hour)*:
| | | For the | |
| | | Three Months Ended | |
| Region | | | |
| | | | | | | | | |
| | | | | | | | | | |
| PJM West (Shore, Maryland) | | | 32.61 | | | | 33.13 | | | | (2 | %) |
| PJM AEP Dayton (Fairview) | | | 29.56 | | | | 31.05 | | | | (5 | %) |
| New York Zone G (Valley) | | | 40.22 | | | | 42.09 | | | | (4 | %) |
| Mass Hub (Towantic) | | | 43.93 | | | | 50.57 | | | | (13 | %) |
| PJM ComEd (Three Rivers) | | | 26.17 | | | | N/A | | | | N/A | |
| | | | | | | | | | | | | |
| * | Based on Day‑Ahead prices as published by the relevant ISO. |
| 3. | Main Developments in the Business Environment (Cont.) |
| 3.3 | Activities in the U.S. (Cont.) |
| H. | Electricity and natural gas prices (Cont.) |
It is noted that the actual electricity prices of the power plants of the CPV Group could be higher or lower than the regional price shown in the above table due to the existence of a Power Basis (the difference between the power plant’s specific electricity price and the regional price). The Power Basis is a function of transport pressures, local cost of electricity generation, local demand for electricity, losses in the transmission lines and additional factors. For details regarding the Power Basis data for 2021–2023 – see Section 3.3H to the Report of the Board of Directors for 2023.
The moderate decline in the electricity prices in the period of the report compared with the corresponding period last year stems mainly from the decline in the natural gas prices in the activity regions of the CPV Group, as detailed below. The said decline in the electricity prices was more moderate than the decline in the natural gas prices due to supply and demand trends in the activity areas of the CPV Group: an increase in the demand for electricity as a result of electrification in the transportation, real estate and industry sectors, and due to the increase in the demand for electricity in the data‑center sector, as a result of the transition to “cloud” and growth in the Artificial Intelligence activities. At the same time, there was a decline in the available capacity as a result of closing of old, inefficient and polluting conventional power plants (mainly coal‑powered power plants), on the one hand, and limited new supply of power plants due to a relatively slow entry rate of renewable energies and a lack of construction of new conventional power plants, on the other hand. For details regarding the EPA regulations relating to emissions – see Section I, below.
Natural gas prices
Set forth below are the average natural gas in each of the main markets in which the power plants of the CPV Group operate (the prices are denominated in dollars per MMBtu)*:
| | | For the | |
| | | Three Months Ended | |
| Region | | | |
| | | | | | | | | |
| | | | | | | | | | |
| Texas Eastern M‑3 (Shore, Valley – 70%) | | | 2.90 | | | | 2.93 | | | | (1 | %) |
| Transco Zone 5 North (Maryland) | | | 3.70 | | | | 3.19 | | | | 16 | % |
| Texas Eastern M‑2 (Fairview) | | | 2.02 | | | | 2.25 | | | | (10 | %) |
| Dominion South Pt (Valley – 30%) | | | 1.86 | | | | 2.22 | | | | (16 | %) |
| Algonquin City Gate (Towantic) | | | 4.26 | | | | 5.13 | | | | (17 | %) |
| Chicago City Gate (Three Rivers) | | | 2.85 | | | | N/A | | | | N/A | |
| | | | | | | | | | | | | |
*Source: The Day‑Ahead prices at gas Midpoints as reported in Platt’s Gas Daily. It is clarified that the actual gas prices of the power plants of the CPV Group could be significantly different.
In general, in the period of the report, the natural gas prices were a bit lower compared with the corresponding period last year due to the relatively warm winter. Regarding the Maryland power plant, which is located in the Transco Zone 5 region, which was more resilient with respect to the demand for natural gas in the period of the report, the natural gas prices increased compared with the corresponding period last year.
| 3. | Main Developments in the Business Environment (Cont.) |
| 3.3 | Activities in the U.S. (Cont.) |
| H. | Electricity and natural gas prices (Cont.) |
Electricity margin in the operating markets of the CPV Group (Spark Spread)
Spark Spread is the difference between the price of the electricity in the relevant area (zone) and the price of the natural gas (used for generation of the electricity) in the relevant area (zone). The Spark Spread is calculated based on the following formula:
Spark Spread ($/MWh) = price of the electricity ($/MWh) – [the gas price ($/MMBtu) x thermal conversion ratio (MMBtu/MWh)]
Set forth below are the average Spark Spread margins for each of the main markets in the power plants of the CPV Group are operating (the prices are denominated in dollars per megawatt/hour)*:
| | | | For the | |
| | | | Three Months Ended | |
| | | | | |
| | | | | | | | | |
| | | | | | | | | | |
| Shore | | | | | | | | | | | | |
| Maryland | | | | | | | | | | | | |
| Valley | | | | | | | | | | | | |
| Towantic | | | | | | | | | | | | |
| Fairview | | | | | | | | | | | | |
| Three Rivers | | | | | | | | | | | | |
| * | Based on electricity prices as shown in the above table, with a discount for the thermal conversion ratio (heat rate) of 6.9 MMBtu/MWh for Maryland, Shore and Valley, and a thermal conversion ratio of 6.5 MMBtu/MWh for Three Rivers, Towantic and Fairview. It is clarified that the actual energy margins of the power plants of the CPV Group could be significantly different due to, among other things, the existence of Power Basis as described in the above. |
The moderate decrease in the electricity margins (Spark Spread) in the period of the report compared with the corresponding period last year, as shown by the above table, corresponds to the trend of a decrease in the natural gas prices along with a more moderate decline in the electricity prices. Regarding the Maryland power plant, most the decline in the electricity margin stems from an increase in the gas prices, as detailed above.
It is noted that the hedging plans of the electricity margins in the power plants of the CPV Group that are powered by natural gas is intended to reduce the fluctuations of the CPV Group’s electricity margin resulting from changes in the natural gas and electricity prices in the energy market (for details regarding agreements hedging of the electricity margin of the CPV Group – see Section 4E below).
For details regarding a forecast of the EOX company for the end of first quarter of 2024 of electricity and natural gas prices to the in the activity areas of CPV group until the end of 2024 and for the years 2025-2026 – see Appendix A below.
3 | For additional details regarding the energy margin of the CPV Group – see Section 4E below. |
| 3. | Main Developments in the Business Environment (Cont.) |
| | 3.3 | Activities in the U.S. (Cont.) |
Capacity is a component that is paid by regulatory bodies that manage demand and loads (system operators) for electricity generators, with respect to their ability to generate energy at the required times for purposes of reliability of the system. This revenue component is an additional component, separate and apart from the component based on the energy prices (which is paid in respect of sale of the electricity). Definition of the capacity component, as stated, including entitlement to revenue for seeing to availability of the electricity, including provisions regarding bonus or penalty payments, are governed by the tariffs determined by the FERC of every market. Accordingly, NY‑ISO, PJM and ISO‑NE publish mandatory public tenders for determination of the capacity tariffs. It is noted that, in the nature of things, an increase in the capacity prices favorably impacts CPV’s results, and vice‑versa. The extent of the impact on the overall results changes as a function of the energy margins, which is the most significant component of the gross profit (margin for generation of the electricity and the sale thereof) – this being taking into account that the weight of the capacity component is usually lower than the weight of the energy margin component.
PJM market
In the PJM market, the capacity payments vary between the market’s sub‑regions, as a function of local supply and demand and transmission capabilities.
Set forth below are the capacity tariffs in the sub‑regions that are relevant to the CPV Group’s power plants and in the general market (the prices are denominated in dollars per megawatt per day). It can be seen in the following table that generally the capacity prices have declined from period to period.
| | | | | |
| | | | | |
| | | | | |
| Fairview, Maryland, Maple Hill | | | | |
| | | | | |
Source: PJM
4 | The Three Rivers power plant, which commenced commercial operation in July 2023, is entitled to capacity payments, from this date. |
| 3. | Main Developments in the Business Environment (Cont.) |
| 3.3 | Activities in the U.S. (Cont.) |
| I. | Capacity revenues (Cont.) |
Changes in the format of the capacity tenders of PJM
In October 2023, PJM submitted to FERC changes in the format for the capacity market for the purpose of applying the changes to the tenders planned for July 2024 (for a one‑year period that starts in the middle of 2025). The proposed changes include changes in the modeling of risks, a recognition process for the source of the capacity, requirements for examination of generators, a ceiling for an annual penalty on the performance levels and a ceiling for recognized bids. In the first quarter of 2024, FERC approved some of the PJM’s proposed changes, including in connection with the level/quota of the availability permitted to be sold, examination requirements for generators and conformance of planning parameters with the increase in the weight of the winter risk reliability parameter and at the same time rejected other proposed changes. In the estimation of the CPV Group, as at the date of the report, the proposed changes that were approved, are expected to have a positive impact on the capacity tariffs5.
NYISO market
Similar to the PJM market, in the NYISO market capacity payments are made in the framework of a central mechanism for acquisition of capacity. In the NYISO market, there are a number of submarkets, wherein there could be various capacity demands as a function of local supply and demand and transmission capability. NYISO makes seasonal tenders in every spring for the upcoming summer (the months of May through October) and in the fall for the upcoming winter (the months of November through April). In addition, there are supplemental monthly tenders for the balance of the capacity not sold in the seasonal tenders. The power plants are permitted to assure the capacity tariffs in the seasonal tender, the monthly tender or through bilateral sales.
Set forth below are the capacity prices determined in the seasonal tenders in NYISO market, the capacity prices rose compared with prior periods – this being mainly due to exit from the system of power plants and an anticipated increase in demand (the prices are denominated in dollars per megawatt per day):
Source: NYISO – the Company’s processing in order to convert from dollars for kilowatt per month to dollars for megawatt per day.
It is noted that the Valley power plant is located in Area G (Lower Hudson Valley) and the actual capacity prices for the Valley power plants are impacted by the seasonal tenders, the monthly tenders and the SPOT prices, with variable capacity prices every month, as well as bilateral agreements with energy suppliers in the market.
| 5 | That stated in this Section regarding the estimate of the CPV Group constitutes “forward‑looking” information as it is defined in the Securities Law, regarding which there is no certainty it will be realized and that depends on the content of the final arrangements that will be provided (if any) and the manner of their application. |
| 3. | Main Developments in the Business Environment (Cont.) |
| 3.3 | Activities in the U.S. (Cont.) |
| I. | Capacity revenues (Cont.) |
ISO‑NE market
The Towantic power plant, which operates in this market, participated for the first time in a capacity tender for 2018–2019 at a price of $313.97 MW/day and determination of the tariff for seven years in respect of 725 megawatts linked to the Handy Whtiman Price Index, which will apply up to May 2025.
Similar to the PJM market, in the ISO‑NE market capacity payments are made as part of a central mechanism for acquisition of capacity. In the ISO‑NE market, there are a number of submarkets, in which there should be capacity requirements that differ as a function of local supply and demand and transport capacity. ISO‑NE executes forward tenders for a period of one year, commencing from June 1, three years from the year of the tender. In addition, there are supplementary monthly and annual tenders for the balance of the capacity not sold in the forward tenders. The power plants are permitted to guarantee the capacity payments in the forward tenders, the supplementary tenders or through bilateral sales.
Set forth below are the capacity payments determined in the sub‑regions that are relevant to the Towantic power plant (the prices are denominated in dollars per megawatt per day):
Source: NE‑ISO – the Company’s processing in order to convert from dollars for kilowatt per month to dollars for megawatt per day.
It is noted that the actual availability prices for the Towantic power plant are impacted by forward tenders, supplementary annual tenders, monthly tenders with availability prices that change every month and bilaterial agreements with energy suppliers in the market.
| J. | Additional information regarding the activities in the U.S. |
| 1. | Further to that stated in Section 17.1 of Part A of the Periodic Report for 2023, as part of the activities of the CPV Group to strengthen its position as a significant player in the energy transition area through, among other things, holding and managing effective and reliable conventional means (natural gas), which will support the rising demand for electricity in the U.S., the CPV Group is examining business possibilities/opportunities with respect to increasing its holdings in certain of the power plants it holds, subject to formulation of appropriate terms with the other holders in the said power plants. As at the date of the report, there is no certainty that these activities will be executed and/or will come to fruition. |
| 3. | Main Developments in the Business Environment (Cont.) |
| 3.3 | Activities in the U.S. (Cont.) |
| J. | Additional information regarding the activities in the U.S. (Cont.) |
| 2. | Further to that stated in Section 8.1.4 of Part A of the Periodic Report for 2023, in April 2024 the U.S. EPA (Environmental Protection Agency) published final emissions’ regulations in the framework of the Clean Air Act. Pursuant to the new rules, up to January 1, 2032, a reduction of emissions will be required at a carbon‑capture rate of 90% for coal‑fired generation facilities that are expected to operate after 2039 and new baseload natural gas-fired power plants (that were not under construction as at May 2023). Less stringent requirements were provided for, among other things, existing coal‑fired generation facilities that integrate natural‑gas fired generation that are expected to discontinue their operations prior to 2039. For new gas turbines, the regulations require that full baseload (as defined) generation through use of natural gas combustion will be executed with maximum utilization of efficient technologies in order to limit emissions to no more than 800 lbs. CO2/MWh-gross until January 1, 2032 and thereafter a reduction to 100 lbs. CO2/MWh-gross via 90% carbon capture or co-firing with hydrogen. Efficiency requirements and reduced emission restrictions were provided with respect to gas turbines that generate at a partial baseload or a low baseload. The various states have two years to develop compliance plans for the existing coal plants but compliance for new natural gas plants (the construction of which started after 2023) is immediate. As at the date of the report, several state Attorneys General have filed appeals challenging the new rules. |
The development portfolio of the CPV Group, which includes wind energy and solar projects, with a scope of more than 4.4 gigawatts, and natural gas projects with carbon capture with a scope of about 1.3 gigawatts, are expected to benefit from a significant tailwind due the regulation, to the extent it is implemented in the manner it was published (or at all). In addition, in the estimation of the CPV Group its active natural‑gas powered power plants are expected to have a significant competitive advantage under the said regulation in light of their high level of efficiency along with entry barriers that are expected to be created in the market for construction of new natural‑gas powered power plants.
As at the approval date of the report, there is no certainty regarding the actual impacts of the said new regulation on the market and on the CPV Group, and the matter depends on, among other things, the policies and the manner of implementation of the rules by the relevant electricity authorities and entities and/or on legal proceedings in connection therewith.
For additional details regarding developments of the Group’s activities in the U.S. – see Section 5.
| 4. | Analysis of the results of operations for the Three Months Ended March 31, 2024 (in millions of NIS) |
The Group’s activities in Israel and the United States are subject to seasonal fluctuations.
In Israel, the TAOZ tariffs are supervised (controlled) and published by the Electricity Authority. Generally, the electricity tariffs in Israel in the summer and the winter are higher than those in the transition seasons. It is noted that acquisition of the gas, which constitutes the main cost in this activity area, is not impacted by seasonality of the TAOZ (or the demand hours’ brackets).
In the United States, the electricity tariffs are not supervised (controlled) and are impacted by the demand for electricity, which is generally high in the summer and the winter periods compared with the average and they are materially impacted by the natural gas prices, which are usually higher in the winter compared with the annual average. In addition, in connection with renewable energy projects, in wind projects the wind speeds tend to be higher in the winter and lower in the summer, whereas in solar projects the radiation from the sun tends to be higher in the spring and summer months and lower in the fall and winter months.
| 4. | Analysis of the results of operations for the Three Months Ended March 31, 2024 (in millions of NIS) (Cont.) |
| | | For the Three Months Ended | |
| | | |
| | | | | | | |
| | | | | | | |
| Revenues from sales and provision of services (1) | | | 638 | | | | 519 | |
| Cost of sales and provision of services (without depreciation and amortization) (2) | | | (430 | ) | | | (364 | ) |
| Depreciation and amortization | | | (74 | ) | | | (48 | ) |
| Gross profit | | | 134 | | | | 107 | |
| Administrative and general expenses | | | (61 | ) | | | (59 | ) |
| Share in earnings of associated companies | | | 72 | | | | 85 | |
| Business development expenses | | | (12 | ) | | | (15 | ) |
| Compensation for lost revenues (in the Zomet power plant) | | | 26 | | | | – | |
| Other expenses, net | | | (56 | ) | | | – | |
| Operating income | | | 103 | | | | 118 | |
| Financing expenses, net | | | (61 | ) | | | (18 | ) |
| Income before taxes on income | | | 42 | | | | 100 | |
| Taxes on income expenses | | | (27 | ) | | | (21 | ) |
| Net income for the period | | | 15 | | | | 79 | |
| Adjustments | | | 11 | | | | 24 | |
Adjusted net income for the period7 | | | 26 | | | | 103 | |
| | | | | | | | | |
Attributable to: | | | | | | | | |
| The Company’s shareholders | | | 25 | | | | 79 | |
| Holders of non‑controlling interests | | | 1 | | | | 24 | |
| 6 | The results of the associated companies in the U.S. (mainly in the Energy Transition segment) are presented in the category “Company’s share in earnings of associated companies”. |
7 | Adjusted net income or loss – net income or loss in accordance with IFRS plus or minus the adjustments detailed in Section G below. It is emphasized that “adjusted income or loss” as stated in this report is not a recognized data item that is recognized under IFRS or under any other set of generally accepted accounting principles as an index for measuring financial performance and should not be considered as a substitute for income or loss or other terms provided in accordance with IFRS. It is possible that the Company’s definitions of “adjusted income or loss” are different than those used by other companies. Nonetheless, the Company believes that the “adjusted income or loss” provides information that is useful to management and investors by means of eliminating certain line items (categories) that do not constitute an indication of the Company’s ongoing business activities. |
| 4. | Analysis of the results of operations for the Three Months Ended March 31, 2024 (in millions of NIS) (Cont.) |
| A. | Statement of income (Cont.) |
(1) Changes in revenues:
| | For the Three | | |
| | | Months Ended | | |
| | | | | |
| | | | | | | | |
Revenues in Israel | | | | | | | |
| Revenues from sale of energy to private customers | | | 300 | | | | 300 | | The updated amount is based on an increase of about NIS 25 million, in respect of consolidation of Gat for the first time starting from the second quarter of 2023, offset by a decrease of about NIS 25 million deriving from a decrease in the generation component and a decline in customer consumption (most of which as part of the virtual supplier activities). |
| Revenues from sale of energy to the System Operator and to other suppliers | | | 46 | | | | 13 | | Most of the increase, in the amount of about NIS 34 million, stems from the commercial operation of Zomet at the end of the second quarter of 2023, and an increase of about NIS 8 million due to the initial consolidation of Gat starting from the second quarter of 2023. |
| Revenues in respect of capacity payments | | | 42 | | | | – | | Most of the increase stems from the commercial operation of Zomet at the end of the second quarter of 2023. |
| Revenues from sale of energy at cogeneration tariff | | | 19 | | | | 10 | | Most of the increase stems from an increase in the quantity generated that is sold at the cogeneration tariff. |
| Revenues from sale of steam | | | 17 | | | | 17 | | |
| Other revenues | | | 7 | | | | 8 | | |
| Total revenues from sale of energy and others in Israel (without infrastructure services) | | | 431 | | | | 348 | | |
| Revenues from private customers in respect of infrastructure services | | | 101 | | | | 116 | | The decrease, stems mainly from a decrease in the infrastructure tariff and a decrease in customer consumption, in the amounts of about NIS 7 million and about NIS 16 million, respectively. On the other hand, there was an increase of about NIS 8 million due to consolidation of Gat for the first time starting from the second quarter of 2023. |
| Total revenues in Israel | | | 532 | | | | 464 | | |
| | | | | | | | | | |
Revenues in the U.S. | | | | | | | | | |
| Revenues from sale of electricity from renewable energy | | | 56 | | | | 24 | | The increase derives mainly from the first‑time consolidation and commercial operation of Mountain Wind and Maple Hill projects in the second and fourth quarters of 2023, respectively. |
| Revenues from provision of services (as part of the other segment) and other revenues | | | 50 | | | | 31 | | The increase stems mainly from an increase in the scope of the services provided to projects. |
| Total revenues in the U.S. | | | 106 | | | | 55 | | |
| | | | | | | | | | |
| Total revenues | | | 638 | | | | 519 | | |
| 4. | Analysis of the results of operations for the Three Months Ended March 31, 2024 (in millions of NIS) (Cont.) |
| A. | Statement of income (Cont.) |
| (2) | Changes in the cost of sales and provision of services (not including depreciation and amortization): |
Cost of Sales and Provision of Services | | For the Three Months Ended | | |
| | | | | |
| | | | | | | | |
Cost of sales in Israel | | | | | | | |
| Natural gas and diesel oil | | | 154 | | | | 133 | | The increase stems mainly from the consolidation of Gat for the first time and commercial operation of Zomet starting from the second quarter of 2023, in the aggregate amount of about NIS 43 million, and an increase in the natural gas tariff as a result of an increase in the shekel/dollar exchange rate, in the amount of about NIS 5 million. In addition, there was an increase of about NIS 18 million, as described in Note 28C(3) to the annual financial statements. On the other hand, there was a decrease of about NIS 27 million, deriving from a decrease in the quantity of the gas consumed against the background of maintenance work at the Rotem power plant in the first quarter of 2024 and a decrease, in the amount of about NIS 18 million, due to entry of the Energean agreement into effect commencing from the end of the first quarter of 2023, and a decrease in the gas tariff deriving from a decline in the generation tariff. |
| Expenses in respect of acquisition of energy | | | 59 | | | | 43 | | Most of the increase stems from an increase of about NIS 35 million against the background of maintenance work at the Rotem power plant in the first quarter of 2024. On the other hand, there was a decrease, in the amount of about NIS 24 million, stemming from a decline in customer consumption in the period of the report, most of which as part of the virtual supplier activities. |
| Cost of transmission of gas | | | 14 | | | | 7 | | The increase stems mainly from the first‑time consolidation of Gat and the commercial operation of Zomet starting from the second quarter of 2023. |
| Salaries and related expenses | | | 10 | | | | 7 | | |
| Operating expenses | | | 28 | | | | 14 | | The increase stems mainly from the first‑time consolidation of Gat and the commercial operation of Zomet starting from the second quarter of 2023. |
| Other expenses | | | 5 | | | | 12 | | |
| Total cost of sales in Israel without infrastructure services | | | 270 | | | | 216 | | |
| Expenses in respect of infrastructure services | | | 101 | | | | 116 | | See the explanation in the “Revenues” section in respect of infrastructure services. |
| Total cost of sales in Israel | | | 371 | | | | 332 | | |
| 4. | Analysis of the results of operations for the Three Months Ended March 31, 2024 (in millions of NIS) (Cont.) |
| A. | Statement of income (Cont.) |
| (2) | Changes in the cost of sales and provision of services (not including depreciation and amortization): (Cont.) |
Cost of sales and services in the U.S. | | | |
| Cost of sales in respect of sale of electricity from renewable energy | 16 | 8 | The increase stems mainly from the first‑time consolidation and commercial operation of the Mountain Wind and Maple Hill projects starting from the second and fourth quarters of 2023, respectively. |
| Cost in respect provision of services (as part of the “others” segment) and other costs | 43 | 24 | Most of the increase is parallel to the increase in the scope of the services provided to projects. |
| Total cost of sales and provision of services in the U.S. | 59 | 32 | |
| Total cost of sales and provision of services | 430 | 364 | |
| 4. | Analysis of the results of operations for the Three Months Ended March 31, 2024 (in millions of NIS) (Cont.) |
| B. | EBITDA, FFO and net cash flows after service of the project debt |
For details regarding “EBITDA indices”, “EBITDA after adjusted proportionate consolidation”, “FFO” and “net cash flows after service of the project debt” – see Section 4B to the Report of the Board of Directors for 2023.
The said indices are not recognized in accordance with International Financial Reporting Standards (IFRS) as indices for measurement of financial performances and are not intended to be considered a replacement for gross profit or loss and operating income, cash flows from operation activities or other terms relating to operating performances or liquidity indices in accordance with IFRS.
EBITDA calculations, including adjusted EBITDA after proportionate consolidation (in millions of NIS):
| | | For the | |
| | | Three Months Ended | |
| | | | |
| | | | | | | |
| | | | | | | |
| Revenues from sales and provision of services | | | 638 | | | | 519 | |
| Cost of sales (without depreciation and amortization) | | | (430 | ) | | | (364 | ) |
| Administrative and general expenses (without depreciation and amortization) | | | (58 | ) | | | (55 | ) |
| Business development expenses | | | (12 | ) | | | (15 | ) |
| Share in income of associated companies | | | 72 | | | | 85 | |
| Compensation for lost revenues (in the Zomet power plant) | | | 26 | | | | – | |
| Consolidated EBITDA | | | 236 | | | | 170 | |
| Elimination of the share in income of associated companies | | | (72 | ) | | | (85 | ) |
| Addition of the share of Group in proportionate EBITDA of associated | | | | | | | | |
| companies (1) | | | 168 | | | | 160 | |
| EBITDA after proportionate consolidation | | | 332 | | | | 245 | |
| Adjustments for consolidated companies (see detail in Section G below) | | | – | | | | 7 | |
| Adjustments for associated companies (see detail in Section G below) (1) | | | 13 | | | | 23 | |
| Adjusted EBITDA after proportionate consolidation | | | 345 | | | | 275 | |
| 4. | Analysis of the results of operations for the Three Months Ended March 31, 2024 (in millions of NIS) (Cont.) |
| B. | EBITDA, FFO and net cash flows after service of the project debt (Cont.) |
| (1) | Calculation of the Group’s share in the proportionate EBITDA of associated companies (in millions of NIS): |
For the three months ended March 31, 2024 | | | | | | | | | | | | | | | | | | | | | |
| | | | | | | | | | | | | | | | | | | | | | |
| Revenues from sales of energy | | | 58 | | | | 61 | | | | 31 | | | | 43 | | | | 102 | | | | 14 | | | | 309 | |
| Cost of natural gas | | | 29 | | | | 36 | | | | 23 | | | | 30 | | | | 45 | | | | 12 | | | | 175 | |
| Carbon emissions tax (RGGI) | | | – | | | | 8 | | | | 5 | | | | 10 | | | | 17 | | | | – | | | | 40 | |
| Cost of sales – other expenses (without | | | | | | | | | | | | | | | | | | | | | | | | | | | | |
| depreciation and amortization) | | | 1 | | | | 1 | | | | 1 | | | | 1 | | | | 2 | | | | – | | | | 6 | |
| Gain on realization of transactions hedging | | | | | | | | | | | | | | | | | | | | | | | | | | | | |
| the electricity margins | | | 11 | | | | 4 | | | | 7 | | | | 7 | | | | 35 | | | | 9 | | | | 73 | |
| Net energy margin | | | 39 | | | | 20 | | | | 9 | | | | 9 | | | | 73 | | | | 11 | | | | 161 | |
| Revenues from capacity payments | | | 4 | | | | 28 | | | | 3 | | | | 4 | | | | 14 | | | | 1 | | | | 54 | |
| Other income | | | 1 | | | | 3 | | | | 1 | | | | 1 | | | | 1 | | | | – | | | | 7 | |
| Gross profit | | | 44 | | | | 51 | | | | 13 | | | | 14 | | | | 88 | | | | 12 | | | | 222 | |
| Fixed costs (without depreciation and | | | | | | | | | | | | | | | | | | | | | | | | | | | | |
| amortization) | | | 3 | | | | 4 | | | | 3 | | | | 5 | | | | 16 | | | | 4 | | | | 35 | |
| Administrative and general expenses | | | | | | | | | | | | | | | | | | | | | | | | | | | | |
| (without depreciation and amortization) | | | 1 | | | | 1 | | | | 1 | | | | 1 | | | | 2 | | | | – | | | | 6 | |
| Group’s share in proportionate adjusted | | | | | | | | | | | | | | | | | | | | | | | | | | | | |
| EBITDA of associated companies | | | 40 | | | | 46 | | | | 9 | | | | 8 | | | | 70 | | | | 8 | | | | 181 | |
For the three months ended March 31, 2023 | | | | | | | | | | | | | | | | | | | | | |
| | | | | | | | | | | | | | | | | | | | | | |
| Revenues from sales of energy | | | 59 | | | | 57 | | | | 40 | | | | 34 | | | | 82 | | | | – | | | | 272 | |
| Cost of natural gas | | | 30 | | | | 39 | | | | 27 | | | | 23 | | | | 40 | | | | – | | | | 159 | |
| Carbon emissions tax (RGGI) | | | – | | | | 6 | | | | 6 | | | | 6 | | | | 10 | | | | – | | | | 28 | |
| Cost of sales – other expenses (without | | | | | | | | | | | | | | | | | | | | | | | | | | | | |
| depreciation and amortization) | | | 1 | | | | 1 | | | | 2 | | | | 1 | | | | 1 | | | | – | | | | 6 | |
| Gain on realization of transactions hedging | | | | | | | | | | | | | | | | | | | | | | | | | | | | |
| the electricity margins | | | 24 | | | | – | | | | 3 | | | | 5 | | | | 51 | | | | – | | | | 83 | |
| Net energy margin | | | 52 | | | | 11 | | | | 8 | | | | 9 | | | | 82 | | | | – | | | | 162 | |
| Revenues from capacity payments | | | 8 | | | | 24 | | | | 6 | | | | 8 | | | | 11 | | | | – | | | | 57 | |
| Other income | | | – | | | | – | | | | 1 | | | | 1 | | | | 1 | | | | – | | | | 3 | |
| Gross profit | | | 60 | | | | 35 | | | | 15 | | | | 18 | | | | 94 | | | | – | | | | 222 | |
| Fixed costs (without depreciation and | | | | | | | | | | | | | | | | | | | | | | | | | | | | |
| amortization) | | | 3 | | | | 3 | | | | 3 | | | | 8 | | | | 16 | | | | – | | | | 33 | |
| Administrative and general expenses | | | | | | | | | | | | | | | | | | | | | | | | | | | | |
| (without depreciation and amortization) | | | 1 | | | | 1 | | | | 1 | | | | 1 | | | | 2 | | | | – | | | | 6 | |
| Group’s share in proportionate adjusted | | | | | | | | | | | | | | | | | | | | | | | | | | | | |
| EBITDA of associated companies | | | 56 | | | | 31 | | | | 11 | | | | 9 | | | | 76 | | | | – | | | | 183 | |
| | | | | | | | | | | | | | | | | | | | | | | | | | | | | |
| * | At the Shore power plant – gas transport costs (totaling in the first quarter of 2024 and 2023 about NIS 6 million) that are classified in accordance with IFRS 16 as depreciation expenses and, accordingly, are not included in the adjusted EBITDA. |
| ** | It is noted that as at the approval date of the report, in Pennsylvania RGGI is not imposed. For details regarding a legal proceeding underway regarding the matter and possible implications of imposition of RGGI on costs of the Fairview power plant and the electricity prices throughout the PJM – see Section 8.1.5B of Part A of the Periodic Report for 2023. |
| 4. | Analysis of the results of operations for the Three Months Ended March 31, 2024 (in millions of NIS) (Cont.) |
| B. | EBITDA, FFO and net cash flows after service of the project debt (Cont.) |
| (2) | Set forth below is a breakdown of the adjusted EBITDA after proportionate consolidation data broken down by the subsidiaries (on a consolidated basis) and the associated companies (on a proportionate basis, based on the rate of the holdings of the CPV Group therein) (in NIS millions): |
| | | For the | | | For the | |
| | | Three months ended | | | Three months ended | |
| Basis of
| | | | | | |
| presentation | | Adjusted | | | | | | Adjusted | | | | |
| in the | | EBITDA | | | | | | EBITDA | | | | |
| Company’s | | after | | | | | | after | | | | |
| financial | | proportionate | | | | | | proportionate | | | | |
| statements | | | | | | | | | | | | |
| | | | | | | | | | | | | | |
| Total operating projects (1) | Consolidated | | | 178 | | | | 176 | | | | 127 | | | | 145 | |
| Business development costs, | | | | | | | | | | | | | | | | | |
| headquarters in Israel and others | Consolidated | | | (8 | ) | | | 33 | | | | (9 | ) | | | (4 | ) |
| Total Israel | | | | 170 | | | | 209 | | | | 118 | | | | 141 | |
| | | | | | | | | | | | | | | | | | |
| Total operating projects (1) | Associate | | | 181 | | | | 126 | | | | 183 | | | | 138 | |
| Other costs | Consolidated | | | (2 | ) | | | (2 | ) | | | (2 | ) | | | (1 | ) |
| Total energy transition in the U.S. | | | | 179 | | | | 124 | | | | 181 | | | | 139 | |
| Total operating projects (1) | Consolidated | | | 37 | | | | 30 | | | | 16 | | | | 14 | |
| Business development and other costs | Consolidated | | | (9 | ) | | | (32 | ) | | | (9 | ) | | | (15 | ) |
| Total renewable energy in the U.S. | | | | 28 | | | | (2 | ) | | | 7 | | | | (1 | ) |
| Total activities as part of the “others” | | | | | | | | | | | | | | | | | |
| segment | Consolidated | | | (5 | ) | | | (5 | ) | | | – | | | | – | |
Headquarters in the United States8 | Consolidated | | | (24 | ) | | | (27 | ) | | | (24 | ) | | | (31 | ) |
| Total United States | | | | 178 | | | | 90 | | | | 164 | | | | 107 | |
| | | | | | | | | | | | | | | | | | |
| Company headquarters (not allocated | | | | | | | | | | | | | | | | | |
| to the segments) | Consolidated | | | (3 | ) | | | (37 | ) | | | (7 | ) | | | (51 | ) |
| | | | | | | | | | | | | | | | | | |
| Total consolidated | | | | 345 | | | | 262 | | | | 275 | | | | 197 | |
| | | | | | | | | | | | | | | | | | |
| (1) | See Section 4B(3) below. |
8 | After elimination of management fees between the CPV Group and the Company, in the amounts of about NIS 7 million and about NIS 6 million for the three months ended March 31, 2024 and 2023, respectively. |
| 4. | Analysis of the results of operations for the Three Months Ended March 31, 2024 (in millions of NIS) (Cont.) |
| B. | EBITDA, FFO and net cash flows after service of the project debt (Cont.) |
| (3) | Set forth below is additional information regarding the revenues, net (in Israel net of infrastructure services and in the U.S. – revenues from sale of energy, availability and other), adjusted EBITDA after proportionate consolidation, FFO and net cash flows after service of the project debt of the Group’s active power plants broken down by activity segments and subsidiaries (on a consolidated basis) and the associated companies (on a proportionate basis, based on the rate of the holdings of the CPV Group therein) (in NIS millions): |
|
|
|
| For the Three Months Ended March 31, 2024 |
|
| For the Three Months Ended March 31, 2023 |
|
| | Basis of
| | | | | Adjusted | | |
| | | Net cash | | |
| | | Adjusted | | |
| | | Net cash | |
| | presentation
| | | | | EBITDA | | |
| | | flows | | |
| | | EBITDA | | |
| | | flows | |
| | in the
| | | | | after | | |
| | | after | | |
| | | after | | |
| | | after | |
| Main | | Company’s
| | | | | proportionate | | |
| | | service of | | |
| | | proportionate | | |
| | | service of | |
| projects in | | financial | | Net | | | consol- | | |
| | | project | | | Net | | | consol- | | |
| | | project | |
| operation | | | | | | | | | | | | | debt | | | revenues | | | idation | | | | | | debt | |
| |
| | | | | | | | | | | | | | | | | | | | | | | | |
Rotem9 | | Consolidated | | | 213 | | | | 76 | | | | 101 | | | | 101 | | | | 221 | | | | 101 | | | | 127 | | | | 127 | |
Hadera10 | | Consolidated | | | 83 | | | | 29 | | | | 10 | | | | (28 | ) | | | 80 | | | | 26 | | | | 18 | | | | 7 | |
Zomet11, 12 | | Consolidated | | | 74 | | | | 57 | | | | 39 | | | | 39 | | | | – | | | | – | | | | – | | | | – | |
Gat11 | | Consolidated | | | 36 | | | | 16 | | | | 26 | | | | 26 | | | | – | | | | – | | | | – | | | | – | |
| Total operating | | | | | | | | | | | | | | | | | | | | | | | | | | | | | | | | | | |
| projects in Israel | | | | | 406 | | | | 178 | | | | 176 | | | | 138 | | | | 301 | | | | 127 | | | | 145 | | | | 134 | |
| Fairview | | Associated (25%) | | | 63 | | | | 40 | | | | 37 | | | | 20 | | | | 67 | | | | 56 | | | | 50 | | | | (1 | ) |
| Towantic | | Associated (26%) | | | 92 | | | | 46 | | | | 40 | | | | (1 | ) | | | 81 | | | | 31 | | | | 17 | | | | (27 | ) |
Maryland13 | | Associated (25%) | | | 35 | | | | 9 | | | | (5 | ) | | | – | | | | 47 | | | | 11 | | | | 16 | | | | 9 | |
Shore14 | | Associated (37.5%) | | | 48 | | | | 8 | | | | (5 | ) | | | (5 | ) | | | 43 | | | | 9 | | | | (8 | ) | | | (8 | ) |
| Valley | | Associated (50%) | | | 117 | | | | 70 | | | | 55 | | | | 17 | | | | 94 | | | | 76 | | | | 63 | | | | 21 | |
Three Rivers11 | | Associated (10%) | | | 15 | | | | 8 | | | | 4 | | | | 9 | | | | – | | | | – | | | | – | | | | – | |
| | | | | | | | | | | | | | | | | | | | | | | | | | | | | | | | | | |
Total energy transition in the U.S.15 | | | | | 370 | | | | 181 | | | | 126 | | | | 40 | | | | 332 | | | | 183 | | | | 138 | | | | (6 | ) |
| Keenan | | Consolidated | | | 23 | | | | 15 | | | | 13 | | | | 1 | | | | 24 | | | | 16 | | | | 14 | | | | 3 | |
Mountain Wind11 | | Consolidated | | | 23 | | | | 15 | | | | 11 | | | | (3 | ) | | | – | | | | – | | | | – | | | | – | |
Maple Hill16 | | Consolidated | | | 8 | | | | 7 | | | | 6 | | | | 6 | | | | – | | | | – | | | | – | | | | – | |
| Total renewable | | | | | | | | | | | | | | | | | | | | | | | | | | | | | | | | | | |
| energy in the U.S. | | | | | 54 | | | | 37 | | | | 30 | | | | 4 | | | | 24 | | | | 16 | | | | 14 | | | | 3 | |
9 | Not including a deduction of repayment of loans to shareholders of Rotem before the Veridis transaction and payments of intercompany taxes in the consolidated tax reconciliation statement. In the first quarter of 2024, planned maintenance was performed at the Rotem power plant. For details – see Section 4C. |
10 | In the period of the report, the net cash flows after service of the Hadera project debt includes early repayment of the long‑term loans, in the amount of about NIS 25 million, further to receipt of compensation from the construction contractor at the end of 2023, as detailed in Note 28A(4) to the annual financial statements. |
11 | The financial results of the projects were included starting from the initial consolidation or the commercial operation dates, as applicable, which occurred in 2023. For details regarding the capacity tariffs in the Zomet power plant, particularly in 2023, see Section 7.13 of Part A of the Periodic Report for 2023. |
12 | In the first quarter of 2024, the financial results of the Zomet power plant include compensation, in the amount of about NIS 26 million, in respect of lost revenues caused due to delay in the commercial operation date. For additional details – see Note 8A(2) to the interim statements. |
13 | The FFO in the period of the report includes a payment for upgrading of the facilities at the Maryland power plant, in the amount of about NIS 8 million. |
14 | The FFO in the first quarter of 2023 includes a payment, in the amount of about NIS 9 million, in respect of significant planned maintenance work performed. |
15 | It is noted that the financing agreements of the CPV Group including mechanisms of the “cash sweep” type in the framework of which all or part of the free cash flows from the project is designated for repayment of the loan principal on a current basis in addition to the predetermined minimum repayment schedule with respect to every long‑term loan. Accordingly, there could be an acceleration of execution of repayments upon occurrence of certain events and there are limitations on distributions to the owners. |
16 | The financial results of Maple Hill were included starting from the commercial operation date, from November 2023. |
| 4. | Analysis of the results of operations for the Three Months Ended March 31, 2024 (in millions of NIS) (Cont.) |
| C. | Analysis of the change in adjusted EBITDA – Israel segment |
Set forth below is an analysis of the change in adjusted EBITDA in Israel in the period of the report compared with the corresponding period last year (in NIS millions):
| 1. | Energy margin – the increase stems mainly from a decrease in the natural gas prices, in the amount of about NIS 18 million, as a result of the entry into effect of the Energean agreement commencing from the end of the first quarter of 2023. On the other hand, there was an increase in the natural gas price due to the strengthening of the dollar against shekel, in the amount of about NIS 5 million. |
| 2. | Availability (operational) – the decrease stems mainly from a shutdown of the Rotem power plant in March 2024 for purposes of planned maintenance work, which lasted for 17 days (as stated in Section 7.11.1 of Part A of the Periodic Report for 2023), which had a negative impact on Rotem’s results for the period of the report and compared with the corresponding period last year. |
It is noted that during above‑mentioned period, sale of electricity to Rotem’s customers continued, where Rotem purchased electricity from the System Operator in order to supply the full demand of its customers during the shutdown.
| 3. | Commercial operation of Zomet – in the period of the report, planned maintenance was performed a number of times at the Zomet power plant which had a negative impact on the power plant’s availability (for details – see Section 4H) and on its results accordingly. |
| 4. | One‑time events – for details regarding events in the first quarter of 2023 – see Note 28C(3) to the annual financial statements. |
In addition, in the first quarter of 2024, an amendment to the agreement was signed with Zomet’s construction contractor, in the framework of which the construction contractor paid Zomet compensation, in the amount of about NIS 26 million (about $7 million) in respect of a loss of revenues caused to Zomet due to delay in the commercial operation date of the power plant. For additional details – see Note 8A(2) to the interim financial statements.
| 4. | Analysis of the results of operations for the Three Months Ended March 31, 2024 (in millions of NIS) (Cont.) |
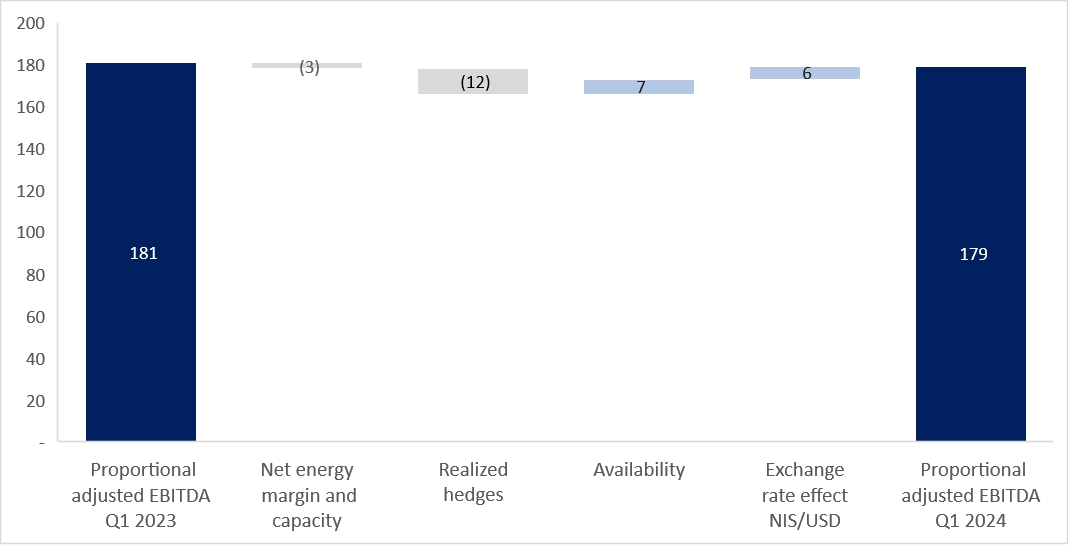
| D. | Analysis of the change in adjusted EBITDA after proportionate consolidation – energy transition segment in the U.S. |
Set forth below is an analysis of the change in the adjusted EBITDA after proportionate consolidation in the energy transition segment in the U.S. in the period of the report compared with the corresponding period last year (in millions of NIS):
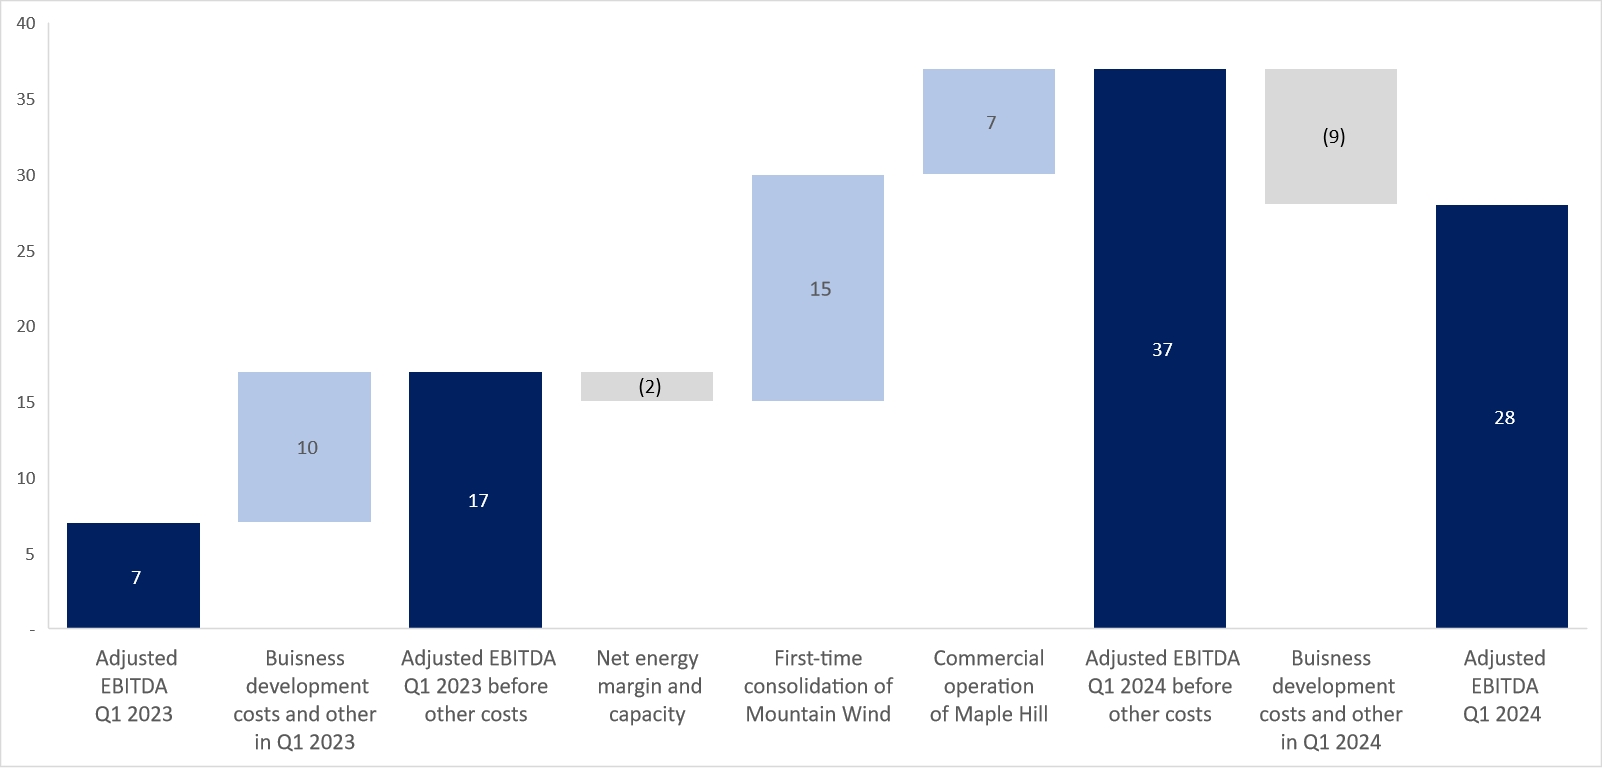
Renewable energy segment
Set forth below is an analysis of the change in the adjusted EBITDA from activities in the renewable energy segment in the period of the report compared with the corresponding period last year (in millions of NIS):
| 4. | Analysis of the results of operations for the Three Months Ended March 31, 2024 (in millions of NIS) (Cont.) |
| E. | Additional details regarding electricity hedges and guaranteed capacity payments in the Energy Transition segment in the U.S. |
As part of its policy for management of the exposures, the CPV Group is in the practice, from time to time, of entering into hedging agreements, which reduce the fluctuations in the electricity margins. In addition, the capacity revenues for the nominal capacity of the power plants running on natural gas are determined for certain future periods, as detailed in Section 3.3I above.
Set forth below is the scope of the hedging for the rest of 2024 and for 2025 as at the date of the report (the data presented in the tables below is on the basis of the rate of holdings of the CPV Group in the associated companies)17.
| | | April – December | | | | |
| | | | | | | |
| | | | | | | |
| Expected generation (MWh) | | 6,959,248 | | | 9,344,436 | |
| | | | | | | |
| Net scope of the hedged energy margin (% of the power plant’s capacity based on the expected generation) (*) | | 57% |
| | 31% |
|
| | | | | | | |
| Net hedged energy margin (millions of $) | | ≈ 53.7 (≈ NIS 196 million) | | | ≈ 49.9 (≈ NIS 182 million) | |
| | | | | | | |
| Net hedged energy margin (MWh/$) | | 13.49 | | | 17.29 | |
| | | | | | | |
| Net market prices of energy margin (MWh/$) (**) | | 16.74 | | | 20.92 | |
| | | | | | | |
| | (*) | Pursuant to the policy for hedging electricity margins as at the date of the report, in general the CPV Group seeks to hedge up to 50% of the scope of the expected generation. The actual hedge rate could ultimately be different. |
| | (**) | The net energy margin is the energy margin (Spark Spread) plus/minus Power Basis less carbon tax and other variable costs. For details regarding the manner of calculation of the electricity margin (Spark Spread) – see Section 3.3H above. The market prices of the net hedged energy are based on future contracts for electricity and natural gas. |
Set forth below is the scope of the secured capacity revenues for the rest of 2024 and for 2025 as at the date of the report:
| | | April – December | | | | |
| | | | | | | |
| | | | | | | |
| Scope of the secured capacity revenues | | | | | | |
| (% of the power plant’s capacity) | | 89% |
| | 46% |
|
| | | | | | | |
| Capacity payments (millions of $) | | ≈ 44 (≈ NIS 160 million) | | | ≈ 26 (≈ NIS 95 million) | |
17 | The estimated percentages and the actual hedged energy margins could change due to new hedges and/or sales of capacity made or as a result of market conditions or the hedging policy of the CPV Group. |
| 4. | Analysis of the results of operations for the Three Months Ended March 31, 2024 (in millions of NIS) (Cont.) |
| F. | Analysis of the change in net income (in millions of NIS) |
| (1) | Most of the increase stems from depreciation expenses of the Gat power plant (about NIS 4 million) and Mountain Wind (about NIS 6 million) power plant which were consolidated for the first time in the second quarter of 2023, and the Zomet power plant (about NIS 12 million) and Maple Hill (about NIS 5 million) that were commercially operated in the second and fourth quarters of 2023, respectively. |
| (2) | Most of the increase stems from financing expenses relating to acquisition of the Gat power plant, in the amount of about NIS 7 million, to acquisition of the Mountain Wind power plant, in the amount of about NIS 5 million, the commercial operation of the Zomet power plant, in the amount of about NIS 20 million and financing expenses that were recorded in the statement of income in respect of the financing framework of a renewable energy project in the U.S., in the amount of about NIS 9 million. |
| (3) | An increase in other expenses in the first quarter of 2024, in the amount of about NIS 25 million, stems from an impairment of value of Gnrgy. For additional details regarding impairment of value of Gnrgy and an agreement in connection with Gnrgy shares – see Note 6B to the interim statements and the Company’s Immediate Report dated May 5, 2024 (Reference No.: 2024‑01‑046917). In addition, there was an increase, in the amount of about NIS 31 million, stemming from a loss from impairment of value of Hadera 2 due to the government’s decision to reject the plan – for additional details see Note 10F to the interim financial statements. |
| 4. | Analysis of the results of operations for the Three Months Ended March 31, 2024 (in millions of NIS) (Cont.) |
| G. | Adjustments to EBITDA after proportionate consolidation and net income (in millions of NIS) |
| | | For the Three Months Ended | | |
| | | | |
| | | | | | | | |
| | | | | | | | |
| Change in the fair value of derivative financial instruments (presented as part of the Company’s share of income of associated companies in the U.S.) | | | 13 | | | | 23 | | Represents the change in the fair value of derivative financial instruments that are used in programs for hedging electricity margins of the transition generation energies segment in the U.S. and that were not designated for hedge accounting – for details see Section E above. |
| Net expenses, not in the ordinary course of business and/or of a non‑recurring nature | | | – | | | | 7 | | In 2023, represents test runs and other activities executed prior to the commercial operation of the Zomet power plant, which took place in June 2023. |
| Total adjustments to EBITDA after proportionate consolidation | | | 13 | | | | 30 | | |
| | | | | | | | | | |
| Tax impact in respect of the adjustments | | | (2 | ) | | | (6 | ) | |
| Total adjustments to net income for the period | | | 11 | | | | 24 | | |
| 4. | Analysis of the results of operations for the Three Months Ended March 31, 2024 (in millions of NIS) (Cont.) |
| H. | Detail generation (in millions of kilowatt/hours) |
Set forth below is detail of the generation of the power plants and wind plants in Israel and the U.S.:
Israel
| | | | | | For the Three Months Ended March 31, 2024 | | | For the Three Months Ended March 31, 2023 | |
| | | | | | | | | | | | Actual | | | | | | | | | | | | | | | Actual | |
| | | | | | Potential | | | Net | | | calculated | | | Actual | | | Potential | | | Net | | | Actual | | | calculated | |
| | | | | | electricity | | | electricity | | | generation | | | availability | | | electricity | | | electricity | | | generation | | | availability | |
| | | Capacity | | | generation | | | generation | | | percentage | | | percentage | | | generation | | | generation | | | percentage | | | percentage | |
| | | | | | | | | | | | | | | | | | | | | | | | | | | | |
| | | | | | | | | | | | | | | | | | | | | | | | | | | | |
| Rotem | | | 466 | | | | 964 | | | | 685 | | | | 71.0 | % | | | 82.0 | % | | | 958 | | | | 910 | | | | 95.1 | % | | | 99.9 | % |
| Hadera | | | 144 | | | | 268 | | | | 258 | | | | 96.4 | % | | | 96.4 | % | | | 258 | | | | 252 | | | | 97.6 | % | | | 97.6 | % |
| Gat | | | 75 | | | | 159 | | | | 141 | | | | 88.7 | % | | | 87.9 | % | | | – | | | | – | | | | – | | | | – | |
| Zomet | | | 396 | | | | 818 | | | | 136 | | | | 16.6 | % | | | 83.5 | % | | | – | | | | – | | | | – | | | | – | |
| (1) | The generation potential is the net generation capability adjusted for temperature and humidity. |
| (2) | The actual net generation in the period. |
| (3) | The actual generation percentage is the net electricity generated divided by the generation potential. |
| 4. | Results of operations for the Period Ended March 31, 2024 (in millions of NIS) (Cont.) |
| H. | Detail generation (in millions of kilowatt/hours) (Cont.) |
Set forth below is detail of the generation of the power plants and wind plants in Israel and the U.S.: (Cont.)
U.S.
| | | | | | For the Three Months Ended March 31, 2024 | | | For the Three Months Ended March 31, 2023 | |
| | | | | | Potential | | | Net | | | Actual | | | Actual | | | Potential | | | Net | | | Actual | | | Actual | |
| | | | | | electricity | | | electricity | | | generation | | | availability | | | electricity | | | electricity | | | generation | | | availability | |
| | | Capacity | | | generation | | | generation | | | percentage | | | percentage | | | generation | | | generation | | | percentage | | | percentage | |
| | | | | | | | | | | | | | | | | | | | | | | | | | | | |
| | | | | | Energy transition projects (natural gas) | |
| | | | | | | | | | | | | | | | | | | | | | | | | | | | |
| Fairview | | | 1,050 | | | | 2,349 | | | | 2,139 | | | | 92.7 | % | | | 99.9 | % | | | 2,323 | | | | 2,166 | | | | 95.0 | % | | | 100.0 | % |
| Towantic | | | 805 | | | | 1,759 | | | | 1,477 | | | | 80.1 | % | | | 99.1 | % | | | 1,740 | | | | 1,333 | | | | 73.1 | % | | | 95.7 | % |
| Maryland | | | 745 | | | | 1,483 | | | | 832 | | | | 50.7 | % | | | 90.5 | % | | | 1,619 | | | | 1,191 | | | | 73.5 | % | | | 99.5 | % |
| Shore | | | 725 | | | | 1,600 | | | | 1,011 | | | | 63.0 | % | | | 98.9 | % | | | 1,235 | | | | 826 | | | | 52.1 | % | | | 77.0 | % |
| Valley | | | 720 | | | | 1,656 | | | | 1,411 | | | | 89.8 | % | | | 97.4 | % | | | 1,638 | | | | 1,161 | | | | 74.7 | % | | | 83.1 | % |
Three Rivers | | | 1,258 | | | | 2,746 | | | | 1,677 | | | | 62.7 | % | | | 75.8 | % | | | – | | | | – | | | | – | | | | – | |
| | | | | | For the Three Months Ended | |
| | | | | | | | | | |
| | | Capacity | | | Net electricity generation | |
| | | | | | | |
| | | Renewable energy projects | |
| | | | | | | | | | |
| Keenan II | | | 152 | | | | 64 | | | | 60 | |
Mountain Wind | | | 82 | | | | 61 | | | | – | |
| Maple Hill | | | 126 | | | | 29 | | | | – | |
| (1) | The potential generation is the gross generation capability during the period after planned maintenance and less the electricity used for the power plant’s internal purposes. |
| (2) | The net generation of electricity is the gross generation during the period less the electricity used for the power plant’s internal purposes. |
| (3) | The actual generation percentage is the quantity of the net electricity generated in the facilities compared with the maximum quantity that can be generated in the period. |
| (*) | It is noted that the generation data of the Gat, Zomet, Three Rivers, Mountain Wind and Maple Hill power plants were included starting from the initial consolidation date or the commercial operation date, as applicable, which took place in 2023. |
| 5. | Initiation and Construction Projects |
| | A. | Initiation and construction projects in Israel and in the U.S. |
| 1. | Main details with reference to construction projects in Israel (held at 100% ownership by OPC Israel, which is 80% held by the Company)18: |
| Power | | | | | | | | | | Date/ | | | | Total | | construction |
| plants/ | | | | | | | | | | expectation | | | | expected | | cost as at |
| facilities | | | | | | | | | | of the start | | | | construction | | March 31, |
| for | | | | | | | | | | of the | | Main | | cost | | 2024 |
| generation | | | | Capacity | | | | | | commercial | | customer/ | | (NIS | | (NIS |
| | | | | | | | | | | | | | | | |
| | | | | | | | | | | | | | | | | |
| OPC Sorek 2 Ltd. (“Sorek 2”) | | Under construction | | ≈ 87 | | On the premises of the Sorek B seawater desalination facility | | Powered by natural gas, cogeneration | | The second half of 202419 | | Yard consumers and the System Operator | | ≈ 200 | | ≈ 152 |
| 18 | That stated in connection with projects that have not yet reached operation (including generation facilities on the premises of the consumers) including with reference to the expected operation date, the technologies and/or the anticipated cost of the investment, is “forward‑looking” information, as it is defined in the Securities Law, which is based on, among other things, the Company’s estimates and assumptions as at the approval date of the report and regarding which there is no certainty it will be realized (in whole or in part). Completion of the said projects (or any one of them) may not occur or may occur in a manner different than that stated above, among other things due to dependency on various factors, including those that are not under the Company’s control, including assurance of connection to the network and output of electricity from the project sites and/or connection to the infrastructures (including gas infrastructures), receipt of permits, completion of planning processes and licensing, completion of construction work, final costs in respect of development, construction, equipment and acquisition of rights in land, the proper functioning of the equipment and/or the terms of undertakings with main suppliers (including lenders), and there is no certainty they will be fulfilled, the manner of their fulfillment, the extent of their impact or what their final terms will be. Ultimately technical, operational or other delays and/or breakdowns and/or an increase in expenses could be caused, this being as a result of, among other things, factors as stated above or as a result of occurrence of one or more of the risk factors the Company is exposed to, including construction risks (including force majeure events and the War and its impacts), regulatory, licensing or planning risks, macro‑economic changes, delays and increased costs due relating to the supply chain and changes in raw‑material prices and etc. For additional details regarding risk factors – see Section 19 of Part A of the Periodic Report for 2023. It is further clarified that delays in completion of the projects beyond the date originally planned for this could impact the ability of the Company and the Group companies to comply with their obligations to third parties, including authorities, conditions of permits, lenders, yard consumers, customers and others, in connection with the projects, and cause a charge for additional costs, payment of compensation or starting of proceedings (including under guarantees provided). |
19 | It is noted that a delay in the commercial operation beyond the original contractual date, which is not considered a justified delay as defined in the project agreements, could trigger payment of monthly compensation at a limited graduated rate (taking into account the length of the delay, where a delay after full utilization of the compensation ceiling could give rise to a cancellation right). It is clarified that in the initial delay period, the amount of the compensation for an unjustified delay is not material. It is noted that the construction contractor of the Sorek 2 project delivered a force majeure notification due to the outbreak of the War, and Sorek 2 project delivered on its behalf a force majeure notification to the initiator of the desalination facility. The construction work, its completion the commercial operation date and the costs involved with the construction could be adversely impacted by the War and/or its impacts. It is further noted that based on a decision of the Electricity Authority, dates were extended, among other things, as part of the arrangement that applies to the project due to the defense (security) such that an extension of was allowed for the date for a financial closing. As at the date of the report, completion of the construction and operation of the Sorek 2 generation facility are subject to fulfillment of conditions and factors that do not yet exist, including reaching a financial closing. Ultimately, the date expected for completion of the construction and commencement of the operation, as shown in the table could be delayed as a result of, among other things, a delay in completion of the construction work (including construction of the desalination facility), delays in receipt of the required permits, disruptions in arrival of equipment, force majeure events, occurrence of risk factors to which the Company is exposed, including delays relating to the war or its consequences. It is clarified that delays as stated could impact the project’s costs and could also trigger and increase in costs (beyond the expected cost indicated above) and/or could constitute non‑compliance with liabilities to third parties. |
| 5. | Initiation and Construction Projects (Cont.) |
| | A. | Initiation and construction projects in Israel and in the U.S. (Cont.) |
| 1. | Main details with reference to construction projects in Israel (held at 100% ownership by OPC Israel, which is 80% held by the Company)18: (Cont.) |
For additional details regarding projects in the advanced and initial development stage in Israel (Ramat Beka, Intel and Rotem 2), and facilities for generation of electricity on the consumer’s premises in various construction and development stages – see Section 6A to the Report of the Board of Directors for 2023.
Hadera 2 – further to that stated in Section 7.3.15 of Part A of the Periodic Report for 2023, on April 17, 2024 the Government of Israel rejected the plan. As at the approval date of the report, the Company is studying the Government’s decision and based thereon it will consider taking action in connection with the decision, including legal action. For additional details – see Note 10F to the interim statements.
Sorek tender – further to that stated in Section 7.3.6 of Part A of the Periodic Report for 2023, on March 18, 2024 the Electricity Authority published a decision regarding “qualification of bidders in the Sorek tender to receive a generation license considering sectorial and economy‑wide business concentration aspects” whereby it was decided that OPC Power Plants is in compliance with the requirements of the Electricity Sector Regulations (Advancement of Competition in the Generation Sector) (Temporary Order), 2021 regarding the Sorek tender, and the Authority accepted the recommendation of the Business Concentration Committee and determines that the bidders (including OPC Power Plants) comply with the requirements regarding considerations of economy‑wide business concentration considerations. In addition, the submission date for the tender was updated by the Tenders Committee to September 12, 2024.
Renewable energy in Israel – as part of the Company’s strategy to expand its activities in the generation and supply sector utilizing renewable sources in Israel, as stated in Section 7.9 of Part A of the Annual Report for 2023, the Company engages in and/or attempts to engage in transactions for acquisition of rights in renewable energy projects in Israel (particularly solar and/or storage) and/or acquisition of rights in lands designated for projects as stated, including as part of projects in the framework of joint ventures with holders of rights in projects or lands as stated, including by means of submission of bids in tenders, such as tenders of Israel Lands Authority for land intended for solar projects similar to tenders of Israel Lands Authority that were made in connection with the Ramat Beka project. As at the approval date of the report, there is no certainty regarding the scope of the Company’s undertakings in transactions as stated and/or execution of projects as stated if they are advanced by the Company based on its said activities (the completion of which is subject to fulfillment of various preconditions, including completion of development, planning, licensing and financing processes similar to projects of this type that are in the development stages).
| 5. | Initiation and Construction Projects (Cont.) |
| | A. | Initiation and construction projects in Israel and in the U.S. (Cont.) |
| 2. | Main details regarding construction projects in the area of renewable energy using solar technology in the U.S. (held 100% by the CPV Group, which is 70% held by the Company)20: |
20 | Details with respect to the scope of the investments in the United States were translated from dollars and presented in NIS based on the currency rate of exchange on March 31, 2024 – $1 = NIS 3.681. The information presented below regarding projects under construction, including with respect to the expected commercial structure, the projected commercial operation date, the expected construction cost, an undertaking with a tax partner and/or the expected results of the activities for the first full calendar year (revenues, EBITDA, investments of the tax partner and cash flows after the tax partner) includes “forward‑looking” information, as it is defined in the Securities Law, regarding which there is no certainty it will materialize (in whole or in part), including due to factors that are not under the control of the CPV Group. The information is based on, among other things, estimates of the CPV Group as at the approval date of the report, the realization of which is not certain, and which might not be realized due to factors, such as: delays in receipt of permits, an increase in the construction costs, delays in execution of the construction work and/or technical or operational malfunctions, problems or delays regarding signing an agreement for connection to the network or connection of the project to transmission or other infrastructures, an increase in costs due to the commercial conditions in the agreements with main suppliers (such as equipment suppliers and contractors), problems signing an investment agreement with a Tax Equity Partner regarding part of the cost of the project and utilization of the tax benefits (if relevant), problems signing commercial agreements for of the potential revenues from the project, terms of the commercial agreements, conditions of the energy market, regulatory changes or legislative changes (including changes impacting main suppliers of the projects), an increase in the financing expenses, unforeseen expenses, macro‑economic changes, weather events, including delays and an increase in costs of undertakings in the supply chain, transport and an increase in raw‑material prices, etc. Completion of the projects in accordance with the said estimates is subject to the fulfillment of conditions which as at the approval date of the report had not yet been fulfilled (fully or partly) and, therefore, there is no certainty they will be completed in accordance with that stated. Construction delays could even impact the ability of the companies to comply with liabilities to third parties in connection with the projects (including based on guarantees provided in favor of those third parties). |
| 5. | Initiation and Construction Projects (Cont.) |
| | A. | Initiation and construction projects in Israel and in the U.S. (Cont.) |
| 2. | Main details regarding construction projects in the area of renewable energy using solar technology in the U.S. (held 100% by the CPV Group, which is 70% held by the Company)20 (Cont.) |
|
|
|
|
|
|
|
|
|
|
|
| Total |
|
|
| Total |
|
|
|
| | |
|
|
|
|
|
|
|
|
|
|
|
| expected |
|
|
| construction |
|
|
|
| | |
|
|
|
|
|
|
|
|
|
|
|
| construction |
|
|
| cost |
|
|
|
| | |
|
|
|
|
|
|
|
|
|
| Regulated |
| cost21 |
|
|
| as at |
|
|
|
| | |
|
|
|
|
|
| Expected |
|
|
| market |
| for 100% |
| Tax |
| March 31, |
|
|
|
| | |
|
|
|
|
|
| commercial |
|
|
| after |
| of the project |
| equity |
| 2024 |
|
|
|
| | |
|
| Capacity |
|
|
| operation |
| Commercial |
| the PPA |
| (NIS |
| (NIS |
| (NIS |
| Expectation for a first full calendar year |
| Project |
| |
| Location |
| date |
| |
| period |
| |
| |
| |
| in the period of the PPA agreements |
|
|
|
|
|
|
|
|
|
|
|
|
|
|
|
|
|
|
|
|
| | Cash flows |
|
|
|
|
|
|
|
|
|
|
|
|
|
|
|
|
|
|
|
|
|
| after tax |
|
|
|
|
|
|
|
|
|
|
|
|
|
|
|
|
|
| Revenues |
| EBITDA |
| partner |
|
|
|
|
|
|
|
|
|
|
|
|
|
|
|
|
|
| (NIS |
| (NIS |
| (NIS |
|
|
|
|
|
|
|
|
|
|
|
|
|
|
|
|
|
| |
| |
| |
|
|
|
|
|
|
|
|
|
|
|
|
|
|
|
|
|
|
|
|
|
|
|
| CPV Stagecoach Solar LLC (“Stagecoach”) |
| 102 MWdc |
| Georgia |
| Second quarter of 2024 (prior to the approval date of the report). |
| Long-term PPA (including green certificates)22 |
| SREC |
| ≈ 414 (≈ $112 million) |
| ≈ 192 (≈ $52 million)23 |
| ≈ 391 (≈ $106 million) |
| ≈ 24 (≈ $7 million) |
| ≈ 17 (≈ $5 million) | | ≈ 16 (≈ $4 million) |
21 | Not including initiation fees and reimbursement of pre‑construction development expenses to the CPV Group. In projects that are entitled to tax benefits of the ITC type, the Company’s estimate regarding the scope of the investment of the tax partner also includes the initiation fees and reimbursement of the development expenses on the basis of calculations that are customary in agreements with tax partners. The expected cost of the investment in the project is subject to changes as a result of, among other things, the final costs involved with supply of the solar panels (including as a result of changes that might apply in the Customs tariffs applicable to import of the panels designated for projects under construction), the construction work and/or the connection of the project, including financing costs of projects in the construction period deriving from financing of the development, as detailed in Note 16B(5) to the annual financial statements. |
22 | The project has signed an agreement for supply of electricity with a local utility company for a period of 30 years from the start of the commercial operation, for supply of all of the electricity expected to be generated by the project in the said period. In addition, the project contracted with a global company for sale of 100% of the solar renewable energy certificates and hedging of the electricity price with a fixed price for a period of 20 years from the start date of the commercial operation. |
23 | As at the approval date of the report, the CPV Group has signed an agreement with a tax partner in a PTC format, where about $43 million out of the said amount was received shortly after the commercial operation date of the project and the balance will be received over a period of 10 years. For additional details – see Note 8A(3) to the interim financial statements. |
| 5. | Initiation and Construction Projects (Cont.) |
| | A. | Initiation and construction projects in Israel and in the U.S. (Cont.) |
| 2. | Main details regarding construction projects in the area of renewable energy using solar technology in the U.S. (held 100% by the CPV Group, which is 70% held by the Company)20 (Cont.) |
|
|
|
|
|
|
|
|
|
|
|
| Total |
|
|
| Total |
|
|
|
| | |
|
|
|
|
|
|
|
|
|
|
|
| expected |
|
|
| construction |
|
|
|
| | |
|
|
|
|
|
|
|
|
|
|
|
| construction |
|
|
| cost |
|
|
|
| | |
|
|
|
|
|
|
|
|
|
| Regulated |
| |
|
|
| as at |
|
|
|
| | |
|
|
|
|
|
| Expected |
|
|
| market |
| for 100% |
| Tax |
| March 31, |
|
|
|
| | |
|
|
|
|
|
| commercial |
|
|
| after |
| of the project |
| equity |
| 2024 |
|
|
|
| | |
|
| Capacity |
|
|
| operation |
| Commercial |
| the PPA |
| (NIS |
| (NIS |
| (NIS |
| Expectation for a first full calendar year |
| Project |
| |
| Location |
| date |
| |
| period |
| |
| |
| |
| in the period of the PPA agreements |
|
|
|
|
|
|
|
|
|
|
|
|
|
|
|
|
|
|
|
|
| | Cash flows |
|
|
|
|
|
|
|
|
|
|
|
|
|
|
|
|
|
|
|
|
|
| after tax |
|
|
|
|
|
|
|
|
|
|
|
|
|
|
|
|
|
| Revenues |
| EBITDA |
| partner |
|
|
|
|
|
|
|
|
|
|
|
|
|
|
|
|
|
| (NIS |
| (NIS |
| (NIS |
|
|
|
|
|
|
|
|
|
|
|
|
|
|
|
|
|
| |
| |
| |
|
|
|
|
|
|
|
|
|
|
|
|
|
|
|
|
|
|
|
|
|
|
|
| CPV Backbone Solar, LLC (“Backbone”) |
| 179 MWdc |
| Maryland |
| Second half of 2025 |
| Long-term PPA24 (including green certificates) |
| PJM + MD SRECs |
| ≈ 1,119 (≈ $304 million) |
| ≈ 479 (≈ $130 million)25 |
| ≈ 400 (≈ $109 million) |
| ≈ 79 (≈ $21 million) |
| ≈ 65 (≈ $15 million) |
| ≈ 45 (≈ $12 million) |
24 | The project has signed a connection agreement and electricity supply agreement with the global e‑commerce company for a period of 10 years from the start of the commercial operation, for supply of 90% of the electricity expected to be generated by the project in the said period, and sale of solar renewable energy certificates, which is valid up to 2035. The balance of the project’s capacity (10%) will be used for supply to active customers, retail supply of electricity of the CPV Group or for sale in the market. |
25 | The project is located on a former coal mine and, therefore, it is expected to be entitled to enlarged tax benefits of 40% in accordance with the IRA Law. The CPV Group intends to act to sign an agreement with a tax partner (Equity Tax) in respect of about 40% of the cost of the project and use of the tax credits that are available to the project (subject to appropriate regulatory arrangements). That stated regarding the intention of the CPV Group to sign an agreement with a tax partner (equity tax), including the scope thereof and/or the scope of the tax benefits, includes “forward‑looking” information as it is defined in the Securities Law, which based on estimates, assessments and plans of the CPV Group proximate to the date of the report and regarding which there is no certainty they will materialize (in whole or in part). The said estimates and assessment might not materialize or might change due to a range of circumstances, including changes in the provisions of the law or regulations and locating a tax partner that will be interested in contracting with the project, which are not dependent on the Company and there is no certainty regarding their realization. |
| 5. | Initiation and Construction Projects (Cont.) |
B. Additional details regarding development projects in the U.S.
Set forth below is a summary of the scope of the development projects (in megawatts) in the United States as at the approval date of the report26:
| | | Advanced | | | Preliminary | | | | |
| | | | | | | | | |
| | | | | | | | | | |
Solar28 | | | 1,550 | | | | 1,600 | | | | 3,150 | |
| Wind (1) | | | 250 | | | | 1,000 | | | | 1,250 | |
| Total renewable energy | | | 1,800 | | | | 2,600 | | | | 4,400 | |
| | | | | | | | | | | | | |
| Carbon capture projects (natural gas | | | | | | | | | | | | |
| with reduced emissions) (2) | | | 1,300 | | | | 5,000 | | | | 6,300 | |
| | * | It is noted that out of the total backlog of the development projects, as stated above, about 1,100 megawatts of renewable energy are in the PJM market in the advanced development stage, and about 4,700 megawatts (of which about 1,300 megawatts are renewable energy) are in the preliminary development stage. |
26 | The information presented in this section with reference to development projects of the CPV Group, including regarding the status of the projects and/or their characteristics (the capacity, technology, the possibility for integrated carbon capture, expected construction date etc.), constitutes “forward‑looking” information as it is defined in the Securities Law, regarding which there is no certainty it will be realized or the manner in which it will be realized. It is clarified that as at the approval date of the report there is no certainty regarding the actual execution of the development projects (in whole or in part), and their progress and the rate of their progress is subject to, among other things, completion of development and licensing processes, obtain control over the lands, signing agreements (such as equipment and construction agreements), execution of construction processes, completion of the connection process, assurance of financing and/or receipt of various regulatory approvals and permits. In addition, advancement of the development projects is subject to the discretion of the competent authorities of the CPV Group and of the Company. |
27 | In general, the CPV Group views projects that in its estimation are in a period of up to two years or up to three years to the start of the construction as projects in the advanced development stage (there is no certainty the development projects, including projects in the advanced stage, will be executed). That stated is impacted by, among other things, the scope of the project and the technology, and could change based on specific characteristics of a certain project, as well as from the external circumstances that are relevant to the project, such as the anticipated activities’ market or regulatory circumstances, including, projects that are designated to operate in the PJM market could be impacted by the changes in the connection processes as part of the proposed change described in Section 8.1.2.2(A) of Part A to the Periodic Report for 2023, and their progress could be delayed as a result of these proposed changes. It is clarified that in the early development stages (in particular), the scope of the projects and their characteristics are subject to changes, if and to the extent they reach advanced stages. |
28 | The capacities in the solar technology included in this report are denominated in MWdc. The capacities in the solar technology projects in the advanced development stages and in the early development stages are about 1,200 MWac and about 1,300 MWac. |
| 5. | Initiation and Construction Projects (Cont.) |
B. Additional details regarding development projects in the U.S. (Cont.)
| (1) | Includes the Rogue’s Wind wind project, with a capacity of 114 megawatts in Pennsylvania, which signed a long‑term PPA agreement, which as at the approval date of the report the terms have which have been improved and which is in an advanced stage of development, the start date of which is expected to be in the upcoming months. In the estimation of the CPV Group, the expected cost of the investment in the project is estimated at about NIS 1.2 billion (about $0.3 billion), the investment of the tax partner is estimated at about NIS 0.5 billion (about $0.1 billion). The EBITDA for a full calendar year in the period of the project’s PPA agreement is estimated at about NIS 68 million (about $18 million)29. |
| (2) | For details – see Section 6C of the Report of the Board of Directors for 2023. |
| 29 | The information stated with reference to the projected start date of the construction, the expected cost of the investment, investment of a tax partner and/or the scope of the EBITDA estimated for the Rogues Wind wind project constitutes “forward‑looking” information as it is defined in the Securities Law, which is based on estimates of the CPV Group as at the date of the report, and regarding which there is no certainty they will materialize. The actual said parameters (to the extent the project is completed) could be different (in whole or in part) due to, among other things, changes in the project’s commercial structure, changes in the terms of the PPA, changes in the conditions in the energy market, delays in the start date or the completion date of the construction, regulatory changes, or as a result of realization of one or more of the risk factors to which the CPV Group is exposed. Completion of the project is subject to various conditions, including, development and licensing processes, signing of agreements (such as equipment and construction agreements), execution of construction processes, assurance of a (grid) connection process, assurance of financing and/or receipt of regulatory approvals and various permits. It is noted that non‑compliance with dates (timetables) or a lack of progress of the project could impact, among other things, compliance with obligations under the PPA agreement (which are secured by guarantees). |
6. Financial Position as at March 31, 2024 (in millions of NIS)
| | | | | | | |
| | | | | | | | |
| Current Assets | | | | | | | |
| | | | | | | | |
| Cash and cash equivalents | | | 838 | | | | 1,007 | | For additional information – see the Company’s consolidated statements of cash flows in the interim financial statements and Part 7 below. |
| | | | | | | | | | |
| Short-term restricted cash and deposits | | | 3 | | | | 2 | | |
| | | | | | | | | | |
| Trade receivables | | | 248 | | | | 247 | | |
| | | | | | | | | | |
| Receivables and debit balances | | | 378 | | | | 404 | | Most of the decrease stems from a decline, in the amount of about NIS 18 million, relating to an amount receivable from Energean (for additional details – see Note 28C(3) to the annual financial statements). |
| | | | | | | | | | |
| Short-term derivative financial instruments | | | 13 | | | | 12 | | |
| | | | | | | | | | |
| Total current assets | | | 1,480 | | | | 1,672 | | |
| 6. | Financial Position as at March 31, 2024 (in millions of NIS) (Cont.) |
| | | | | | | |
| | | | | | | | |
| Non-Current Assets | | | | | | | |
| | | | | | | | |
| Long-term deposits and restricted cash | | | 58 | | | | 59 | | |
| | | | | | | | | | |
| Long-term prepaid expenses and other receivable | | | 205 | | | | 190 | | |
| | | | | | | | | | |
| Investments in associated companies | | | 2,577 | | | | 2,550 | | The increase stems mainly from equity earnings of the CPV Group, in the amount of about NIS 72 million and from an increase in the shekel/dollar exchange rate, in the amount of about NIS 39 million, offset by other comprehensive loss, in the amount of about NIS 83 million. For additional details regarding investments in associated companies – see Section 4D above. |
| | | | | | | | | | |
| Deferred tax assets | | | 35 | | | | 57 | | |
| | | | | | | | | | |
| Long-term derivative financial instruments | | | 58 | | | | 51 | | |
| | | | | | | | | | |
| Property, plant and equipment | | | 6,395 | | | | 6,243 | | Most of the increase stems from investments in Israel and the U.S. (mainly in construction and development projects), in the amount of about NIS 75 million and about NIS 126 million, respectively, and an increase of about NIS 29 million, in property, plant and equipment in the U.S. due to an increase in the shekel/dollar exchange rate. This increase was partly offset by a loss from impairment of value with respect to the Hadera 2 project, in amount of about NIS 31 million, and was offset by depreciation expenses on property, plant and equipment. |
| | | | | | | | | |
|
| Right-of use assets and long-term deferred expenses | | | 627 | | | | 631 | |
|
| | | | | | | | | |
|
| Intangible assets | | | 1,145 | | | | 1,165 | |
|
| | | | | | | | | |
|
| Total non-current assets | | | 11,100 | | | | 10,946 | |
|
| | | | | | | | | |
|
| Total assets | | | 12,580 | | | | 12,618 | |
|
| 6. | Financial Position as at March 31, 2024 (in millions of NIS) (Cont.) |
| | | | | | | |
| | | | | | | | |
| Current Liabilities | | | | | | | |
| | | | | | | | |
| Loans and credit from banks and financial institutions (including current maturities) | | | 164 | | | | 391 | | Most of the decrease stems from a short‑term credit framework repaid by OPC Israel Holdings, in the amount of NIS 200 million, and a decrease in the current maturity of the Zomet loan, in the amount of about NIS 28 million. |
| | | | | | | | | | |
| Current maturities of loans from holders of non-controlling interests and debentures | | | 29 | | | | 32 | | |
| | | | | | | | | | |
| Current maturities of debentures | | | 201 | | | | 192 | | |
| | | | | | | | | | |
| Trade payables | | | 267 | | | | 257 | | |
| | | | | | | | | | |
| Payables and other credit balances | | | 402 | | | | 403 | | |
| | | | | | | | | | |
| Short-term derivative financial instruments | | | 7 | | | | 8 | | |
| | | | | | | | | | |
| Total current liabilities | | | 1,070 | | | | 1,283 | | |
| 6. | Financial Position as at March 31, 2024 (in millions of NIS) (Cont.) |
| | | | | | | |
| | | | | | | | |
| Non-Current Liabilities | | | | | | | |
| | | | | | | | |
| Long-term loans from banks and financial institutions | | | 2,898 | | | | 2,865 | | Most of the increase stems from update of the current maturities of a loan in Zomet, in the amount of about NIS 28 million. |
| | | | | | | | | | |
| Long-term loans and debentures from holders of non-controlling interests | | | 442 | | | | 422 | | |
| | | | | | | | | | |
| Debentures | | | 1,743 | | | | 1,647 | | Most of the increase, in the amount of about NIS 197 million, derives from issuance of the debentures (Series D). On the other hand, there was a decrease deriving from repayment of debentures, in the amount of about NIS 96 million. |
| | | | | | | | | | |
| Long-term lease liabilities | | | 200 | | | | 204 | | |
| | | | | | | | | | |
| Long-term derivate financial instruments | | | 49 | | | | 58 | | |
| | | | | | | | | | |
| Other long-term liabilities | | | 414 | | | | 399 | | |
| | | | | | | | | | |
| Liabilities for deferred taxes | | | 490 | | | | 498 | | |
| | | | | | | | | | |
| Total non-current liabilities | | | 6,236 | | | | 6,093 | | |
| | | | | | | | | | |
| Total liabilities | | | 7,306 | | | | 7,376 | | |
| | | | | | | | | | |
| Total equity | | | 5,274 | | | | 5,242 | | The increase in the equity stems mainly from the net income, in the amount of about NIS 15 million, and other comprehensive income in the amount of about NIS 16 million, deriving mostly from translation differences in respect of the activities in the U.S., in the amount of about NIS 65 million, offset by the share in the other comprehensive loss of associated companies, in the amount of about NIS 62 million, stemming primarily from application of hedge accounting to transactions hedging electricity margins in the U.S. |
7. Liquidity and sources of financing (in NIS millions)
| | For the | | |
| | | | | |
| | | | | | | |
| | | | | | | | |
| Cash flows provided by operating activities | | | 263 | | | | 103 | | Most of the increase in the cash flows provided by operating activities stems from an increase in cash‑basis income, in the amount of about NIS 83 million, and an increase in the Group’s working capital, in the amount of about NIS 60 million. In addition, in the period of the report, dividends were paid from associated companies in the U.S., in the amount of about NIS 18 million. |
| | | | | | | | | | |
| Cash flows used in investing activities | | | (247 | ) | | | (263 | ) | Most of the decrease in the cash used in investing activities in the period of the report stems from acquisition of the Gat power plant, for a consideration of about NIS 268 million in the corresponding period last year. On the other hand, in the corresponding period last year the Group received cash, in the amounts of about NIS 125 million and about NIS 73 million, in respect of release of short‑term deposits and release of collaterals relating to hedging electricity margins in the CPV Group, respectively. In addition, there was an increase in investments in property, plant and equipment in the U.S. and in Israel, in the aggregate amount of about NIS 37 million. |
| | | | | | | | | | |
| Cash flows provided by (used in) financing activities | | | (197 | ) | | | 779 | | Most of the increase in the cash flows used in financing activities stems from amounts received in the corresponding period last year: (1) about NIS 452 million, in respect of a swap of shares of transaction and investment with Veridis; (2) long‑term loans, in the amount of about NIS 450 million, for purposes of financing the acquisition of the Gat power plant transaction; (3) a receipt, in the amount of about NIS 197 million, in respect of investments and loans from holders of non‑controlling interests in the CPV Group; and (4) a receipt, in the amount of about NIS 100 million, relating to withdrawals from Zomet’s financing agreement framework. In addition, in the period of the report the Group repaid short‑term loans and frameworks, in the amount of about NIS 204 million, there was an increase in payments of debentures of about NIS 80 million, and, there was an increase of about NIS 32 million relating to repayment of long‑term loans (including early repayment in Hadera, in the amount of about NIS 25 million). On the other hand, in the corresponding period last year, the Group repaid a loan to the prior holders of the rights in the Gat power plant, in the amount of about NIS 303 million, and in the period of the report the Company raised about NIS 198 million, resulting from an issuance of debentures (Series D). |
For additional details – see the Company’s condensed consolidated interim financial statements of cash flows in the Company’s interim financial statements.
As at March 31, 2024 and 2023 and December 31, 2023, the Group’s working capital (current assets less current liabilities) amounted to about NIS 410 million, about NIS 825 million and about NIS 382 million, respectively.
As at March 31, 2024, there were no warning signs pursuant to Regulation 10(B)(14) of the Securities Regulations (Periodic and Immediate Reports), 1970, that require publication (presentation) of a forecasted statement of cash flows for the Company.
8. Adjusted financial debt, net
| A. | Compositions of the adjusted financial debt, net |
For details regarding the definition of the net financial debt, adjusted net financial debt and leverage ratio – see Part 9A of the Report of the Board of Directors for 2023.
Set forth below is detail of the Group’s leverage ratio:
| | As at December 31, 2023(2) |
| | | |
| 4.9 | | 4.9 |
| (1) | After elimination of debt under construction in the Renewable Energies segment in the U.S. of about NIS 151 million, as detailed in the following table. With respect to the Zomet power plant, based on the forecast data as detailed in Section 1 of the Report of the Board of Directors for 2023 and with respect to Three Rivers based on linear articles of the actual results commencing from the commercial operation date (July 2023). |
| (2) | For details of the manner of the calculation – see Section 9A of the Report of the Board of Directors for 2023. |
| 8. | Adjusted financial debt, net (Cont.) |
| A. | Compositions of the adjusted financial debt, net (Cont.) |
The following table details the financial debt, net, as at March 31, 2024 (in millions of NIS)30:
| |
| | | | | | | | | | | Cash and cash | | | Derivative | | | | |
| Method of | | | | | | | | | | | equivalents | | | financial | | | | |
| presentation
| | | | | and deposits | | | instruments | | | | |
| in the | | Debt | | | Weighted- | | | Final | | | (including | | | for hedging | | | | |
| Company’s | | (including | | | average | | | repayment | | | restricted cash | | | principal | | | | |
| financial | | interest | | | interest | | | date of | | | used for debt | | | and/or | | | Net | |
Name of project | | | | | | | | | | | | | | | | | | | |
| | | | | | | | | | | | | | | | | | | | |
| Rotem | Consolidated | | | – | | | | – | | | | – | | | | 37 | | | | – | | | | (37 | ) |
| Hadera | Consolidated | | | 605 | | | | 4.9 | % | | | 2037 | | | | 71 | | | | 39 | | | | 495 | |
| Zomet | Consolidated | | | 1,109 | | | | 6.55 | % | | | 2042 | | | | 46 | | | | – | | | | 1,063 | |
| Gat | Consolidated | | | 434 | | | | 6.65 | % | | | 2039 | | | | 37 | | | | – | | | | 397 | |
| Headquarters and others – Israel (2) | Consolidated | | | 9 | | | | | | | | | | | | 72 | | | | – | | | | (63 | ) |
| Total Israel | | | | 2,157 | | | | 6.1 | % | | | | | | | 263 | | | | 39 | | | | 1,855 | |
| Keenan | Consolidated | | | 278 | | | | 3.3 | % | | | 2030 | | | | 2 | | | | 20 | | | | 256 | |
| Mountain Wind | Consolidated | | | 269 | | | | 5.5 | % | | | 2028 | | | | 8 | | | | 8 | | | | 253 | |
| Financing of renewable energy | | | | | | | | | | | | | | | | | | | | | | | | | |
| projects (3) | Consolidated | | | 362 | | | | 6.9 | % | | | 2027 | | | | 212 | | | | (1 | ) | | | 151 | |
| Total renewable energy | | | | 909 | | | | 5.4 | % | | |
|
|
|
| 222 | | | | 27 | | | | 660 | |
| Fairview (Cash Sweep 40%) | Associate 25% | | | 319 | | | | 5.9 | % | | | 06/2025 | | | | 26 | | | | 4 | | | | 289 | |
| Towantic (Cash Sweep 100%) | Associate 26% | | | 304 | | | | 5.8 | % | | | 06/2025 | | | | 45 | | | | 7 | | | | 252 | |
| Maryland (Cash Sweep 75%) | Associate 25% | | | 316 | | | | 7.1 | % | | | 2028 | | | | 27 | | | | 9 | | | | 280 | |
| Shore (4) (Cash Sweep 100%) | Associate 37.5% | | | 608 | | | | 5.3 | % | | | 03+12/2025 |
| | | 103 | | | | 16 | | | | 489 | |
| Valley (Cash Sweep 100%) | Associate 50% | | | 681 | | | | 10.8 | % | | | 05/2026 | | | | 84 | | | | – | | | | 597 | |
| Three Rivers (Cash Sweep 100%) | Associate 10% | | | 272 | | | | 5.4 | % | | | 2028 | | | | 22 | | | | 22 | | | | 228 | |
Total energy transition (5) | | | | 2,500 | | | | 7.2 | % | | | | | | | 307 | | | | 58 | | | | 2,135 | |
| Headquarters and others – U.S. | Consolidated | | | – | | | | – | | | | – | | | | 38 | | | | – | | | | (38 | ) |
| Total U.S. |
| | | 3,409 | | | | | | | |
| | | | 567 | | | | 85 | | | | 2,757 | |
| Total Energy headquarters (6) |
| | | 1,948 | | | | 2.5%–6.2% (weighted average 3%)
|
|
|
|
|
|
|
| 368 |
|
|
| – |
|
|
| 1,580 |
|
| Total |
| | | 7,514 | | | | | | | |
| | | | 1,198 | | | | 124 | | | | 6,192 | |
| (1) | Includes restricted cash, in the amount of about NIS 53 million, in Hadera and in the energy transition segment, the amounts of about NIS 274 million. |
| (2) | Includes mainly balances of cash and cash equivalents in OPC Israel Holdings and OPC Power Plants. |
| (3) | For details – see Note 16B(5) to the annual financial statements. |
| (4) | It is noted that as part of the financial agreements, an historical debt‑service coverage ratio financial covenant of 1:1 during the last four quarters was determined for Shore. As at the date of the report, Shore is in compliance with the covenant (1.18). |
| For details regarding disclosure included in the financial statements of Shore as at March 31, 2024, which are attached to the Company’s interim financial statements, relating to circumstances that raise material doubts with respect to the ability of Shore to continue to operate as a “going concern” – see Note 11 to the interim financial statements. |
| (5) | The rate (%) of the Cash Sweep mechanism is in accordance with the estimate of the CPV Group and it could change based on the provisions of the financing agreements of the projects. |
30 | In addition, the Group has a liability to holders of non‑controlling interests, the balance of which as at March 31, 2024 is about NIS 471 million. |
| (6) | Includes balances of debt and cash in the Company and cash in ICG Energy Inc. (available for use for all the Group’s needs). |
| 8. | Adjusted financial debt, net (Cont.) |
| A. | Compositions of the adjusted financial debt, net (Cont.) |
The following table details the financial debt, net, as at December 31, 2023 (in millions of NIS):
| |
| | | | | Cash and cash | | | Derivative | | | | |
| Method of | | | | | equivalents | | | financial | | | | |
| presentation | | | | | and deposits | | | instruments | | | | |
| in the | | Debt | | | (including | | | for hedging | | | | |
| Company’s | | (including | | | restricted cash | | | principal | | | | |
| financial | | interest | | | used for debt | | | and/or | | | Net | |
Name of project | | | | | | | | | | | | | |
| | | | | | | | | | | | | | |
| Rotem | Consolidated | | | – | | | | 9 | | | | – | | | | (9 | ) |
| Hadera | Consolidated | | | 642 | | | | 98 | | | | 37 | | | | 507 | |
| Zomet | Consolidated | | | 1,111 | | | | 94 | | | | – | | | | 1,017 | |
| Gat | Consolidated | | | 434 | | | | 12 | | | | – | | | | 422 | |
| Headquarters and others – Israel | Consolidated | | | 202 | | | | 160 | | | | – | | | | 42 | |
| Total Israel | | | | 2,389 | | | | 373 | | | | 37 | | | | 1,979 | |
| Keenan | Consolidated | | | 285 | | | | 1 | | | | 18 | | | | 266 | |
| Mountain Wind | Consolidated | | | 256 | | | | 11 | | | | 4 | | | | 241 | |
| Financing construction of renewable | | | | | | | | | | | | | | | | | |
| energy projects | Consolidated | | | 329 | | | | 327 | | | | (7 | ) | | | 9 | |
| Total renewable energy | | | | 870 | | | | 339 | | | | 15 | | | | 516 | |
| Fairview | Associate | | | 334 | | | | 25 | | | | 6 | | | | 303 | |
| Towantic | Associate | | | 339 | | | | 44 | | | | 7 | | | | 288 | |
| Maryland | Associate | | | 304 | | | | 26 | | | | 8 | | | | 270 | |
| Shore | Associate | | | 599 | | | | 105 | | | | 19 | | | | 475 | |
| Valley | Associate | | | 708 | | | | 66 | | | | – | | | | 642 | |
| Three Rivers | Associate | | | 271 | | | | 21 | | | | 20 | | | | 230 | |
| Total energy transition | | | | 2,555 | | | | 287 | | | | 60 | | | | 2,208 | |
| Headquarters and others – U.S. | Consolidated | | | – | | | | 12 | | | | – | | | | (12 | ) |
| Total U.S. | | | | 3,425 | | | | 638 | | | | 75 | | | | 2,712 | |
| Total Energy headquarters | | | | 1,853 | | | | 336 | | | | – | | | | 1,517 | |
| Total | | | | 7,667 | | | | 1,347 | | | | 112 | | | | 6,208 | |
| B. | Interest and linkage bases |
For additional information regarding the interest and linkage bases – see Part 9B of the Report of the Board of Directors for 2023.
The Company and its investee companies are subject to financial covenants provided in their financing agreements and trust certificates. As at the date of the financial statements, the Company and its investee companies were in compliance with all the financial covenants provided. For detail regarding the covenants for violation, relating to significant loans and debentures – see Note 7C to the interim financial statements31:
31 | For a description of the main provisions of material loans of the Company and the investee companies – see Note 16 to the annual financial statements. |
Movement in the adjusted financial debt, net, for the period ended March 31, 2024:
| (*) | Includes the amount of about NIS 55 million in respect of current payments and the amount of about NIS 271 million in respect of payments relating to construction projects. |
| (**) | In respect of translation of the net financial debt of the U.S. which is denominated in dollars into the Company’s functional currency. |
| 9. | Additional events in the Company’ areas of activities in the period of the report and thereafter |
| A. | Undertaking to purchase an insurance policy covering directors and officers – on March 31, 2024, a decision of the Board of Directors entered into effect (after approval by the Remuneration Committee) in connection with renewal of the Company’s undertaking to purchase an insurance policy covering directors and officers32, this being in accordance with the provisions of the Companies Regulations (Leniencies in Transactions with Interested Parties), 200033 and the provisions of the Company’s remuneration policy34. For additional details – see the Company’s Immediate Report dated March 31, 2024 (Reference No.: 2024‑01‑035499). |
| B. | Non‑binding memorandum of principles for investment of $300 million in the Company’s renewable‑energy activities in the U.S. – on April 15, 2024, CPV Renewable Power LP (a corporation wholly‑owned by the CPV Group), which manages its renewable energy activities35 (“CPV Renewable”), signed a non‑binding memorandum of principles (“the Memorandum of Principles”) with a private equity fund (“the Investor”) that invests in infrastructures in North America with respect to a potential investment of $300 million in CPV Renewable, which is engaged in operation, construction and development of renewable energy project in the U.S. (“the Potential Transaction”)36. |
Pursuant to the Memorandum of Principles, on the completion date of the Potential Transaction, the Investor will invest an aggregate amount of $300 million (“the Investment Amount”) in CPV Renewable in exchange for an issuance of 32.6% of the ordinary rights in CPV Renewable37 (which reflects a value “before the money” for CPV Renewable of $620 million). The Investment Amount will serve for, among other things, shareholders’ equity for expansion of existing projects and development projects in the advanced stages, development expenses, opportune acquisitions and other general corporate purposes as will be defined in the relevant transaction documents.
Pursuant to the Memorandum of Principles, the final Potential Transaction documents will include, among other things, customary representations and declarations and preconditions for completion of the transaction. In addition, the Memorandum of Principles includes provisions that will be determined as part of the final shareholders’ agreement of CPV Renewable relating to, among other things, the composition of the Board of Directors and the voting rights (based on the economic interest of each party), decisions that will require a special majority38, restrictions on the transfer of holdings, future investments of money and provision of collaterals, development and construction budgets and provisions covering provision of management services by the CPV Group.
According to the Memorandum of Principles, CPV Renewable is required to carry on exclusive negotiations with the Investor regarding the Potential Transaction for a period of 60 days, which could be extended by an additional 30 days under certain conditions.
| 32 | Including Side A coverage. |
33 | Regulation 1B(1) and Regulations 1A(1)–1B(5) of the Leniency Regulations with respect to the Company’s CEO and officers that the controlling shareholder could be considered as having a personal interest in their remuneration. |
34 | Regarding the Company’s remuneration policy, including provisions relating insurance of officers’ liability – see Appendix A (including Section 17.1 of the policy) to the Report Summoning the General Meeting published by the Company on June 6, 2021 (Reference No.: 2021‑01‑035761), which is included herein by means of reference. |
| 35 | Including the Keenan power plant, which is included in the area of the CPV Group’s renewable energy activities. |
36 | CPV Renewable is active in the Company’s area of activities in renewable energies in the U.S. and does not have holdings in the areas of natural gas and carbon capture of the CPV Group. |
37 | Subject to adjustments that will be determined. |
38 | Such as (an open list) a merger, dissolution, interested‑party transactions and material transactions, decisions and transactions as will be defined in the final agreement. |
| 9. | Additional events in the Company’ areas of activities in the period of the report and thereafter (Cont.) |
| Activities in the U.S. (Cont.) |
The Company believes that cooperation with the Investor, as stated in this report, will help to realize the Company’s growth targets in the area of renewable energy in the U.S.
As at the approval date of the report, signing of the Potential Transaction and formulation of the final conditions (if it is ultimately executed) are subject to completion of a due diligence examination by the Investor, completion of the negotiations between the parties and formulation of a final binding agreement in connection with the Potential Transaction that are agreed to by the parties. Accordingly, as at the approval date of the report, there is no certainty that the Potential Transaction will ultimately be executed or with respect to its final conditions (if it is ultimately executed), which could be different than that stated above39. In addition, if the final agreements are ultimately signed, there is no certainty that the transaction will be completed, since completion of the transaction, as stated, is expected to be subject to the fulfillment of preconditions, including receipt of consents of third parties and regulatory approvals, where necessary and non‑occurrence of the risk factors to which the Company’s activities are exposed, as detailed in Section 8.21 of Part A of the Periodic Report for 2023. For additional details regarding CPV Renewable – see Section 8.1 of Part A of the Periodic Report for 2023.
| C. | Updates to Section 8.18 of Part A of the Periodic Report (Human Resources of the CPV Group): |
| (1) | In May 2024, it was decided to appoint Mr. Sherman Knight (presently the President and Deputy CEO of Commerce) to the position of CEO of the CPV Group, who will replace Mr. Gary Lambert in this position – this being effective starting from January 1, 2025. Commencing from the said date, Mr. Lambert will serve as the Executive Vice‑Chairman to the Chairman of the Board of Directors of the CPV Group. |
| (2) | In April 2024, a partial exercise of the profit‑participation units granted to employees of the CPV Group was made by means of acquisition of the exercised units by the CPV Group, as stated in Note 7E to the interim financial statements. |
| 10. | Debentures (Series B), (Series C) and (Series D) |
In the period of the report, there were no material changes in the details of the outstanding series of debentures issued by the Company and that were offered to the public based on a prospectus, the details of the trustees for the debentures, the conditions for calling the debentures for immediate repayment, the Company’s compliance with these conditions and the collaterals for the debentures, except for issuance of new debentures (Series D), as detailed in Part 10 to the Report of the Board of Directors for 2023 and Note 17 to the annual financial statements.
As at the date of the report, the Company is in compliance with all the conditions of the debentures (Series B), (Series C) and (Series D) and the trust certificates. The Company was not required to take any action in accordance with the request of the trustees for the said debentures.
39 | As at the date of the report, there is no certainty regarding the final terms of the agreement covering the Potential Transaction (in whole or in part, including the economic and legal terms), and accordingly there is no certainty regarding the scope and nature of the impacts (including the accounting impacts on the Company’s financial statements or other consequences) of the Potential Transaction to the Company, should it ultimately be executed. |
| 11. | Impacts of changes in the macro‑economic environment on the Group’s activities and its results |
For details – see Part 11 of the Report of the Board of Directors for 2023.
| 12. | The significance of the war in Israel to the Group’s business activities |
For details regarding the main consequences of the War to the Group’s business activities in Israel since the outbreak of the War – see Part 12 of the Report of the Board of Directors for 2023.
As at the approval date of the report, there is significant uncertainty regarding the development of the War, its scope and duration. Furthermore, there is significant uncertainty with respect to the impacts of the War on macro‑economic and financial factors in Israel, including the situation in the Israeli capital market. Accordingly, at this stage it is not possible to estimate the extent of the impact of the War on the Group and on its results.
As a group operating in Israel, continuation of the War, expansion of the scope thereof and/or a worsening of the defense (security) situation in Israel could well have an unfavorable impact on the Group’s activities, results and liquidity, including due to impacts, as stated, on significant suppliers and customers of the Group and/or on macro‑economic factors and the capital market. For additional details regarding the risk factors to which the Company is exposed, including as a result of risks relating the defense (security) situation in Israel, changes in the currency exchange rates, instability and/or access to the capital market and macro‑economic changes – see Section 19 of Part A of the Periodic Report for 2023.
13. Material valuations
Acquisition of the Gat power plant transaction
Further to that stated in Note 25E(1) to the annual financial statements, in the period of the report the Company completed the valuation for determination of the fair value of the identified assets and liabilities of the Gat Power Plant and determination of the amount of the goodwill and the manner of allocation thereof to the cash‑generating units, by means of an external independent appraiser (BDO Ziv Haft), without there having been a change in allocation of the acquisition cost compared to December 31, 2023. For details with respect to the valuation – see Section 13A of the Report of the Board of Directors for 2023.
The Company has a policy for making contributions that places emphasis on activities in the periphery and non-profit organizations that operate in the field of education.
The Group’s expenses in respect of contributions in the period of the report amounted to about NIS 2.3 million.
Set forth below is detail of contributions of more than NIS 50 thousand and indication of the relationship to the recipient of the contribution (in NIS thousands):
| Recipient of the | | Amount of the | | Relationship to the |
| | | | Recipient of the Contribution |
| | | | | |
| “Password for Every Student” Society | | | 1,000 | | “Password for Every Student” also receives contributions from parties related indirectly to the Company’s controlling shareholder (including from the Israel Corporation Group). The Company’s CEO is a representative of the project’s Steering Committee without compensation. |
| “Rahashei Lev” Society | | | 300 | | For the sake of good order, it is noted that as the Company was informed, commencing from November 2022, the daughter of Mr. Yosef Tena, an external director of the Company, is employed by the Tel‑Aviv Medical Center in the name of Sorosky. |
| “Running to Give” Society | | | 120 | | For the sake of good order, it is noted that a relative of the Company’s CEO serves as Chairman of the Society without compensation. |
Yair Caspi | Giora Almogy |
| Chairman of the Board of Directors | CEO |
Date: May 20, 2024
Appendix A
Additional Information regarding Activities of the Energy Transition Segment in the U.S.
EOX Forecast of Natural Gas and Electricity Prices until the end of 2024 and for the years 2025 – 2026
As additional background with respect to the activities of the Energy Transition Segment in the U.S. and in order to assist regarding accessibility to additional available external data, presented below are forecasts of electricity and natural gas prices in the regions in which the power plants of the CPV Group in the Energy Transition segment in the U.S. operate, which were prepared by the EOX Company1 and it is based on future market prices of electricity and natural gas.
The data in the tables below reflect forecasts of the electricity and natural gas prices as received from EOX, where with reference to the forecast of the electricity prices the information was processed by the CPV Group in the following manner:
In the peak hours electricity is sold in the maximum scope;
Sale of the balance of the electricity is made in the off‑peak hours.
The electricity margin appearing in the table below is calculated based on the following formula:
Electricity margin ($/MWh) = the electricity price ($/MWh) – [the gas price ($/MMBTU) X the thermal conversion ratio* (heat rate) (MMBTU/MWh)]
| * | Assumption of a thermal conversion ratio (heat rate) of 6.9 MMBTU/MWh for Maryland, Shore and Valley, and a thermal conversion ratio (heat rate) of 6.5 MMBTU/MWh for Three Rivers, Towantic and Fairview. |
The data included in this Appendix below is based on forecasts of electricity and gas prices made by EOX – a market consulting company that provides information and data services in the area of the Company’s activities in the U.S. in the Energy Transition area, and it is presented as additional background and in order to assist accessibility to available external data regarding the area of activities. It is clarified and emphasized that in light of the fact these are market forecasts, quite naturally the Company is not able to make (and did not make) an independent examination of the forecasts or the underlying data. It is clarified that there are additional entities that provide similar information services that might provide forecasts that differ from these prices. The Company does not undertake to update data as stated.
In addition, it is emphasized that forecasts are involved regarding which there is no certainty with respect to the accuracy or actual viability thereof. The electricity and natural gas prices (in the market, in general, and of the power plants of the CPV Group, in particular) might be different, even significantly, from that presented as a result of various factors, including, macro‑economic factors, regulatory changes, geopolitical events (including global events) that impact the supply and demand of natural gas and electricity, weather events, events relating to the electricity sector in the U.S. (demand, availability of power plants, operational events, proper functioning of the electricity grid, transmission infrastructures) and/or failures in (problems with) the assumptions and estimates that form the basis of the forecast.
40 EOX is a subsidiary of a commodity broker, OTC Global Holdings, which publishes forward prices for the electricity and natural gas markets based on trading data in the futures markets. The futures prices are an objective way of estimating the future expectation with respect to electricity and natural gas prices since they represent transactions with entities operating in these markets involving buying and selling futures contracts at specific prices.
| | | For the | | | | | | | |
| | | nine | | | | | | | |
| | | months | | | For | | | For | |
| | | April- | | | the | | | the | |
| | | December, | | | year | | | year | |
| | | | | | | | | |
| | | | | | | | | | |
Fairview | | | | | | | | | |
| Gas price (Texas Eastern M2, as of 2026 M3) | | | 1.66 | | | | 2.56 | | | | 3.59 | |
| Electricity price AEP Dayton (AD)) | | | 39.63 | | | | 47.70 | | | | 51.14 | |
| Electricity margin | | | 28.87 | | | | 31.07 | | | | 27.77 | |
| | | | | | | | | | | | | |
Towantic | | | | | | | | | | | | |
| Gas price (Algoniquin City Gate) | | | 3.00 | | | | 5.30 | | | | 5.75 | |
| Electricity price Mass Hub) | | | 45.04 | | | | 61.38 | | | | 62.32 | |
| Electricity margin | | | 25.54 | | | | 26.96 | | | | 24.93 | |
| | | | | | | | | | | | | |
Maryland | | | | | | | | | | | | |
| Gas price (Transco Zone 5) | | | 2.54 | | | | 4.17 | | | | 4.39 | |
| Electricity price (PJM West Hub) | | | 43.75 | | | | 53.60 | | | | 58.09 | |
| Electricity margin | | | 26.25 | | | | 24.81 | | | | 27.82 | |
| | | | | | | | | | | | | |
Shore | | | | | | | | | | | | |
| Gas price (Texas Eastern M3) | | | 1.97 | | | | 3.26 | | | | 3.59 | |
| Electricity price (PJM West Hub) | | | 43.75 | | | | 53.60 | | | | 58.09 | |
| Electricity margin | | | 30.17 | | | | 31.13 | | | | 33.29 | |
| | | | | | | | | | | | | |
Valley | | | | | | | | | | | | |
| Gas price (Texas Eastern M3 – 70%, Dominion South Pt – 30%) | | | 1.88 | | | | 3.02 | | | | 3.34 | |
| Electricity price (New York Zone G) | | | 41.50 | | | | 56.25 | | | | 61.84 | |
| Electricity margin | | | 28.55 | | | | 35.38 | | | | 38.77 | |
| | | | | | | | | | | | | |
Three Rivers | | | | | | | | | | | | |
| Gas price (Chicago City Gate) | | | 2.20 | | | | 3.46 | | | | 3.78 | |
| Electricity price (PJM ComEd) | | | 38.41 | | | | 45.00 | | | | 48.97 | |
| Electricity margin | | | 24.10 | | | | 22.53 | | | | 24.37 | |
Set forth below is gross (raw) data as included in the forecast of EOX (without processing)
Transco Zn5 Dlvd M2M Fwd | Chicago CG M2M | Texas Eastern M-2 M2M Fwd | Algonqui n CG M2M Fwd | Dominion S Pt M2M Fwd | Texas Eastern M-3 M2M Fwd | Mass Hub M2M OPk | Mass Hub M2M Pk | Contract Date |
| 1.50 | 1.38 | 1.32 | 1.58 | 1.33 | 1.41 | 23.98 | 25.14 | 1/3/2024 |
| 1.57 | 1.45 | 1.22 | 1.58 | 1.28 | 1.34 | 25.59 | 27.54 | 1/4/2024 |
| 2.07 | 1.60 | 1.32 | 1.58 | 1.35 | 1.42 | 25.53 | 28.86 | 1/5/2024 |
| 2.24 | 1.81 | 1.45 | 2.41 | 1.47 | 1.63 | 33.14 | 42.81 | 1/6/2024 |
| 2.65 | 2.13 | 1.72 | 2.75 | 1.71 | 1.99 | 41.26 | 64.51 | 1/7/2024 |
| 2.63 | 2.21 | 1.72 | 2.55 | 1.73 | 1.97 | 36.35 | 54.28 | 1/8/2024 |
| 2.57 | 2.09 | 1.49 | 1.84 | 1.50 | 1.58 | 31.66 | 42.33 | 1/9/2024 |
| 2.55 | 2.09 | 1.39 | 1.82 | 1.43 | 1.54 | 33.41 | 40.94 | 1/10/2024 |
| 2.76 | 2.69 | 1.90 | 4.46 | 1.92 | 2.22 | 49.40 | 54.56 | 1/11/2024 |
| 3.81 | 3.73 | 2.69 | 8.02 | 2.58 | 4.00 | 76.36 | 82.47 | 1/12/2024 |
| 6.12 | 4.61 | 3.18 | 11.43 | 2.86 | 5.89 | 99.74 | 107.08 | 1/1/2025 |
| 5.75 | 4.45 | 3.08 | 10.25 | 2.76 | 5.12 | 91.69 | 98.39 | 1/2/2025 |
| 3.83 | 3.13 | 2.69 | 5.09 | 2.56 | 2.94 | 61.79 | 63.74 | 1/3/2025 |
| 3.42 | 2.86 | 2.33 | 3.50 | 2.33 | 2.46 | 41.78 | 50.48 | 1/4/2025 |
| 3.82 | 2.89 | 2.29 | 2.91 | 2.30 | 2.45 | 31.66 | 41.31 | 1/5/2025 |
| 3.71 | 3.03 | 2.31 | 3.04 | 2.34 | 2.57 | 35.53 | 48.98 | 1/6/2025 |
| 3.79 | 3.17 | 2.46 | 3.47 | 2.45 | 2.69 | 52.14 | 76.58 | 1/7/2025 |
| 3.72 | 3.19 | 2.40 | 3.32 | 2.39 | 2.71 | 37.56 | 60.04 | 1/8/2025 |
| 3.38 | 3.02 | 2.15 | 2.70 | 2.17 | 2.26 | 32.13 | 47.27 | 1/9/2025 |
| 3.44 | 3.02 | 2.06 | 2.82 | 2.10 | 2.25 | 34.61 | 45.09 | 1/10/2025 |
| 3.97 | 3.59 | 2.44 | 5.87 | 2.46 | 2.98 | 58.02 | 62.92 | 1/11/2025 |
| 5.14 | 4.51 | 3.29 | 9.15 | 3.13 | 4.73 | 77.72 | 85.94 | 1/12/2025 |
| 6.26 | 5.32 | 3.83 | 12.58 | 3.45 | 6.57 | 99.88 | 116.23 | 1/1/2026 |
| 5.67 | 5.12 | 3.68 | 11.73 | 3.34 | 6.17 | 94.37 | 105.34 | 1/2/2026 |
| 4.75 | 3.63 | 3.03 | 5.80 | 2.94 | 3.51 | 50.44 | 66.91 | 1/3/2026 |
| 3.89 | 3.15 | 2.55 | 3.65 | 2.55 | 2.70 | 37.21 | 48.63 | 1/4/2026 |
| 4.00 | 3.04 | 2.40 | 3.07 | 2.46 | 2.58 | 35.98 | 42.76 | 1/5/2026 |
| 4.01 | 3.19 | 2.48 | 3.23 | 2.49 | 2.74 | 35.70 | 51.83 | 1/6/2026 |
| 4.22 | 3.38 | 2.66 | 3.60 | 2.64 | 2.91 | 45.45 | 73.91 | 1/7/2026 |
| 4.18 | 3.42 | 2.60 | 3.55 | 2.60 | 2.91 | 43.29 | 66.73 | 1/8/2026 |
| 3.61 | 3.38 | 2.27 | 2.91 | 2.32 | 2.44 | 35.68 | 50.66 | 1/9/2026 |
| 3.58 | 3.31 | 2.24 | 3.02 | 2.26 | 2.42 | 38.91 | 47.88 | 1/10/2026 |
| 3.44 | 3.82 | 2.71 | 5.69 | 2.72 | 3.20 | 49.19 | 64.55 | 1/11/2026 |
| 5.02 | 4.66 | 3.48 | 10.18 | 3.37 | 4.98 | 69.68 | 82.34 | 1/12/2026 |
East NY ZnG M2M OPk | East NY ZnG M2M Pk | PJM ComEd M2MS OPk | PJM ComEd M2MS Pk | AEP- Dayton M2M OPk | AEP- Dayton M2M Pk | PJM West M2M OPk | PJM West M2M Pk | Contract Date |
| 23.70 | 27.24 | 12.48 | 20.88 | 18.86 | 24.81 | 22.50 | 25.63 | 1/3/2024 |
| 23.20 | 27.50 | 17.17 | 25.68 | 22.84 | 29.63 | 24.60 | 32.20 | 1/4/2024 |
| 23.99 | 28.72 | 19.39 | 30.02 | 23.24 | 34.33 | 24.18 | 36.05 | 1/5/2024 |
| 28.85 | 38.67 | 25.31 | 39.50 | 26.27 | 40.76 | 26.77 | 42.22 | 1/6/2024 |
| 40.01 | 61.52 | 36.99 | 62.88 | 37.41 | 64.70 | 38.11 | 66.15 | 1/7/2024 |
| 33.53 | 53.60 | 30.92 | 55.65 | 32.24 | 56.82 | 33.25 | 59.13 | 1/8/2024 |
| 31.89 | 43.00 | 27.02 | 44.38 | 30.05 | 46.90 | 31.06 | 48.46 | 1/9/2024 |
| 32.40 | 40.20 | 26.68 | 38.23 | 31.63 | 43.58 | 32.89 | 45.55 | 1/10/2024 |
| 38.92 | 45.74 | 31.34 | 38.35 | 38.37 | 43.92 | 40.19 | 47.50 | 1/11/2024 |
| 58.57 | 67.62 | 36.53 | 45.42 | 43.92 | 49.82 | 48.21 | 54.88 | 1/12/2024 |
| 80.70 | 91.13 | 47.81 | 56.71 | 53.72 | 61.76 | 61.29 | 70.24 | 1/1/2025 |
| 83.39 | 87.25 | 38.93 | 47.77 | 44.83 | 51.90 | 52.55 | 60.73 | 1/2/2025 |
| 46.61 | 55.67 | 33.99 | 41.36 | 39.89 | 46.10 | 42.51 | 49.68 | 1/3/2025 |
| 37.33 | 44.43 | 29.40 | 39.34 | 35.50 | 45.29 | 37.31 | 46.91 | 1/4/2025 |
| 35.88 | 44.63 | 28.87 | 42.53 | 33.45 | 47.31 | 35.16 | 49.43 | 1/5/2025 |
| 36.18 | 50.24 | 29.54 | 47.49 | 32.61 | 51.06 | 34.62 | 53.47 | 1/6/2025 |
| 51.77 | 74.17 | 38.57 | 67.37 | 41.52 | 71.58 | 43.88 | 74.79 | 1/7/2025 |
| 39.08 | 52.77 | 33.96 | 61.26 | 36.62 | 65.22 | 38.82 | 67.83 | 1/8/2025 |
| 32.68 | 49.13 | 30.06 | 47.58 | 33.67 | 52.40 | 35.93 | 55.06 | 1/9/2025 |
| 38.38 | 42.28 | 29.99 | 41.74 | 35.46 | 48.41 | 38.37 | 51.87 | 1/10/2025 |
| 42.75 | 57.61 | 36.12 | 43.59 | 42.28 | 49.51 | 45.94 | 53.37 | 1/11/2025 |
| 66.35 | 70.39 | 41.02 | 47.74 | 47.82 | 54.09 | 53.13 | 59.99 | 1/12/2025 |
| 84.02 | 95.89 | 50.14 | 61.30 | 56.09 | 68.50 | 65.95 | 77.87 | 1/1/2026 |
| 79.95 | 83.76 | 46.12 | 51.32 | 51.76 | 56.86 | 61.57 | 66.87 | 1/2/2026 |
| 51.82 | 71.54 | 37.81 | 43.91 | 42.03 | 48.85 | 47.58 | 54.79 | 1/3/2026 |
| 38.72 | 50.00 | 32.59 | 42.19 | 36.40 | 46.42 | 39.09 | 50.44 | 1/4/2026 |
| 39.09 | 46.87 | 33.57 | 43.41 | 36.56 | 47.89 | 39.41 | 51.61 | 1/5/2026 |
| 40.11 | 55.65 | 32.56 | 49.64 | 35.25 | 53.97 | 37.75 | 57.55 | 1/6/2026 |
| 53.66 | 79.16 | 43.32 | 73.98 | 45.46 | 76.35 | 48.72 | 80.43 | 1/7/2026 |
| 51.03 | 73.21 | 40.69 | 65.65 | 42.53 | 68.38 | 45.65 | 72.73 | 1/8/2026 |
| 38.02 | 54.91 | 32.60 | 50.75 | 35.36 | 55.87 | 38.38 | 58.96 | 1/9/2026 |
| 40.27 | 46.75 | 33.07 | 47.12 | 38.70 | 52.10 | 41.42 | 55.30 | 1/10/2026 |
| 48.28 | 60.83 | 37.46 | 47.67 | 42.67 | 52.27 | 46.60 | 56.22 | 1/11/2026 |
| 71.07 | 80.05 | 48.77 | 54.16 | 54.98 | 59.16 | 60.84 | 64.76 | 1/12/2026 |
56