Exhibit 99.1


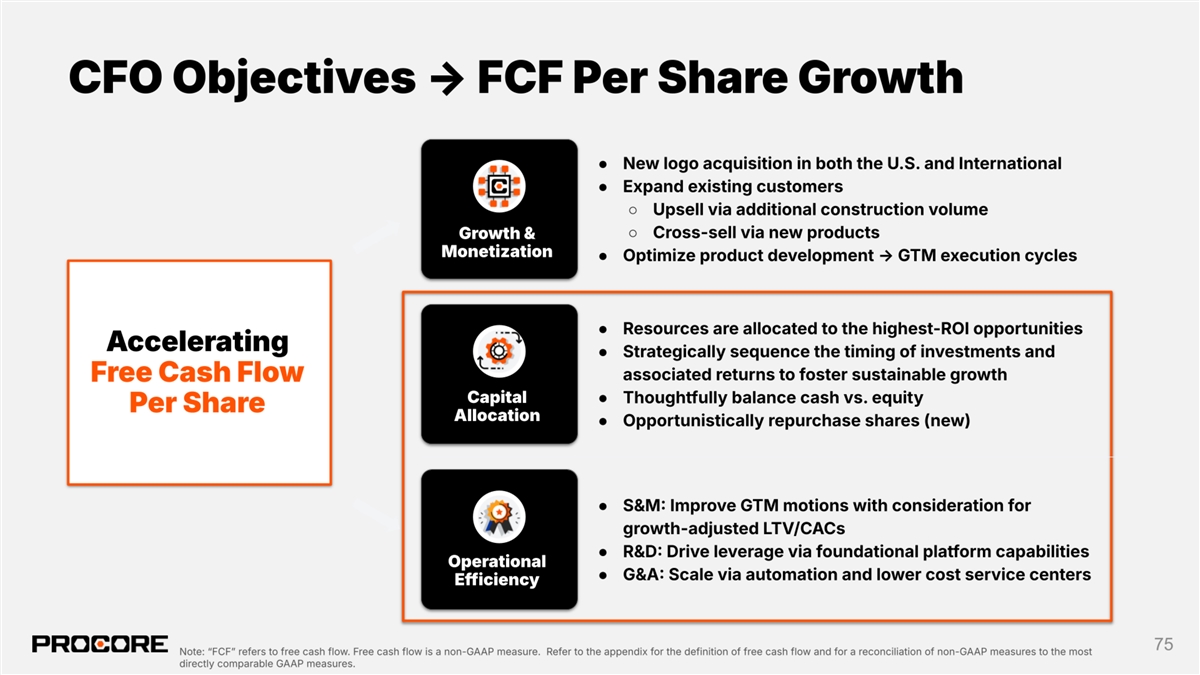

Capital Allocation Capital Allocation Priorities The first lever and investment priority continues to be organic 1. Payment and efficient revenue growth. + Organic & We have significant opportunity as the technology leader + Bul Efficient Growth s serving Construction. Our sufficient capital enables us to fund business objectives and continue generating free cash flow. The second lever is investment in M&A. 2. Payments Our M&A strategy primarily focuses on accelerating our + M&A product roadmap with smaller, tuck in companies that are + Bullet two typically from our App Marketplace and already integrated in the Procore platform. + Bullet three 3. The third lever is returning capital to shareholders. Payment Our guiding principle is to repurchase shares to provide Capital Return notable accretion to per-share targets and optimize s long-term shareholder value. 76 Note: “FCFˮ refers to free cash flow. Free cash flow is a non-GAAP measure. Refer to the appendix for the definition of free cash flow and for a reconciliation of non-GAAP measures to the most directly comparable GAAP measures.

Capital Allocation + $300M stock repurchase authorization + 1 year term + To be deployed opportunistically depending on market conditions + Represents approx 40% of our cash, cash Stock 1 equivalents, and marketable securities balance Repurchase + Represents 3% of our market capitalization as of November 15, 2024 Our guiding principle is notable accretion to per share targets to optimize long-term shareholder value 1 Balance as of September 30, 2024. Note: The program does not obligate Procore to acquire any particular amount of stock, and may be suspended or discontinued at any time at Procoreʼs discretion. 77
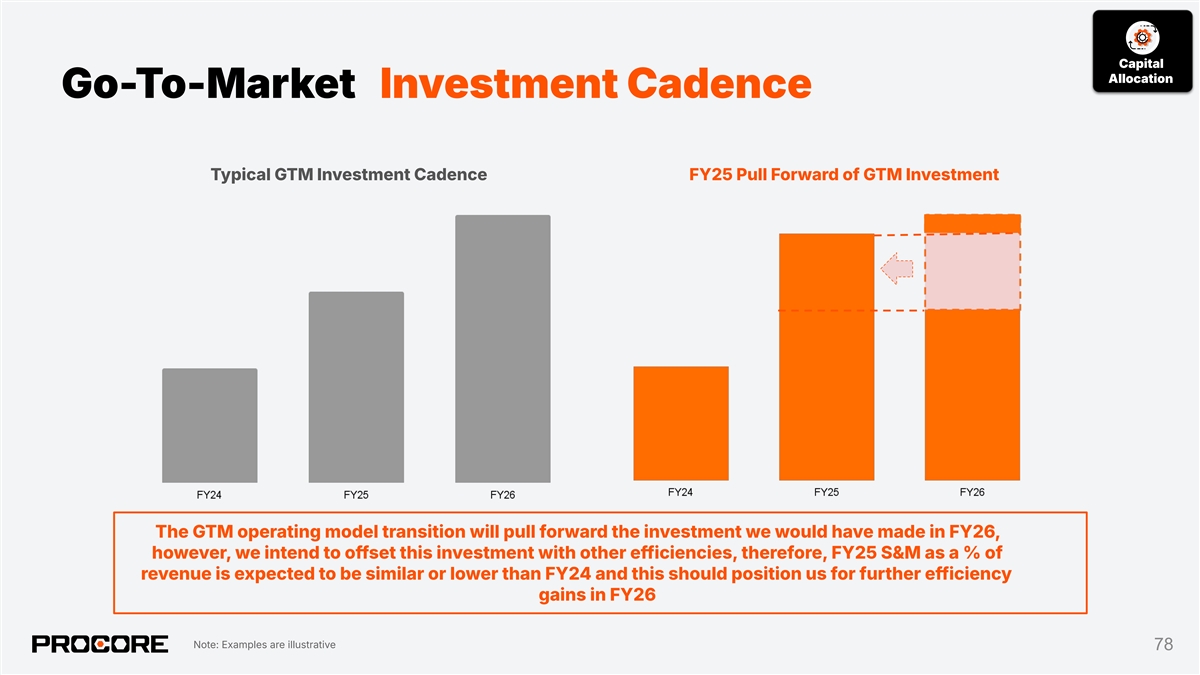
Capital Allocation Go-To-Market Investment Cadence Typical GTM Investment Cadence FY25 Pull Forward of GTM Investment The GTM operating model transition will pull forward the investment we would have made in FY26, however, we intend to offset this investment with other efficiencies, therefore, FY25 S&M as a % of revenue is expected to be similar or lower than FY24 and this should position us for further efficiency gains in FY26 Note: Examples are illustrative 78

Operational Efficiency Operational Efficiency Non-GAAP Operating Non-GAAP Operating Margin Profit/Loss Note: Operating profit/loss and margin are non-GAAP measures. FY24E uses the high end of our guidance range. FY25E is based on our initial FY25 guidance. Shows fiscal year non-GAAP operating profit/(loss) and non-GAAP operating profit/(loss) as a % of revenue. Non-GAAP operating expenses and operating margin are calculated as operating expenses excluding stock-based compensation, amortization of acquired intangible assets, employer payroll tax related to employee stock transactions, and acquisition-related expenses. Refer to the appendix for a reconciliation of non-GAAP financial measures to the most directly comparable GAAP financial measures. 79

Operational Efficiency Progression of Efficiency 40% FCF Margins Commitment to margin Best in class vertical margins expansion, disciplined equity management and 25% FCF Margins ultimately free cash flow per Realize further efficiencies via thoughtful onshore and offshore initiatives share improvement GAAP Profitability Equity discipline combined with operating efficiency Capital Return Program Return excess cash opportunistically based on market conditions to optimize FCF per share Non-GAAP Profitability Prioritizing operating efficiency in addition to top line growth Equity Management Shift compensation towards less equity; maintain dilution rates of 1%3% depending on revenue growth Consistent Free Cash Flow Obtain scale in both GTM and operating efficiency; business begins to consistently generate excess cash Note: The top three gray bars (referring to 40% FCF margins, 25% FCF margins, and GAAP Profitability) refer to forward-looking goals, and are not financial guidance. We have no timeline for when we may achieve any of these goals, and there is no assurance that we will achieve any or all of these goals. “FCFˮ refers to free cash flow. Free cash flow is a non-GAAP measure. Refer to the 80 appendix for the definition of free cash flow and for a reconciliation of non-GAAP measures to the most directly comparable GAAP measures.

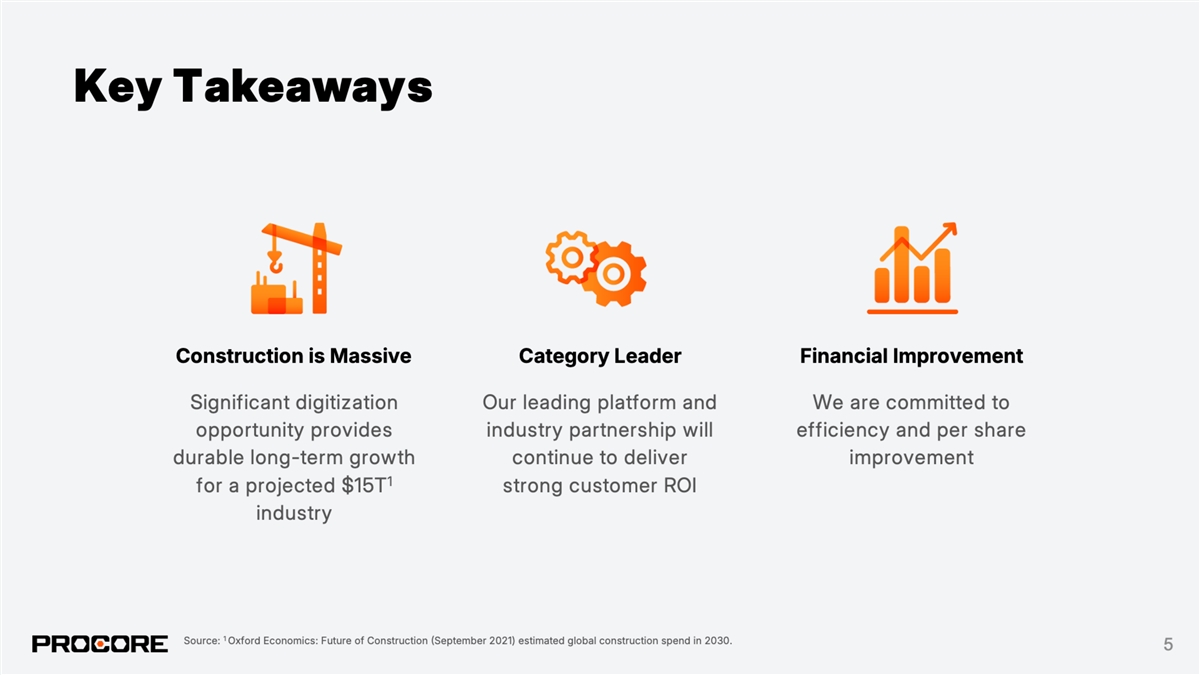
Key Takeaways Construction is Massive Category Leader Financial Improvement Significant digitization Our leading platform and We are committed to opportunity provides industry partnership will efficiency and per share durable long-term growth continue to deliver improvement 1 for a projected $15T strong customer ROI industry 1 Source: Oxford Economics: Future of Construction September 2021) estimated global construction spend in 2030. 81


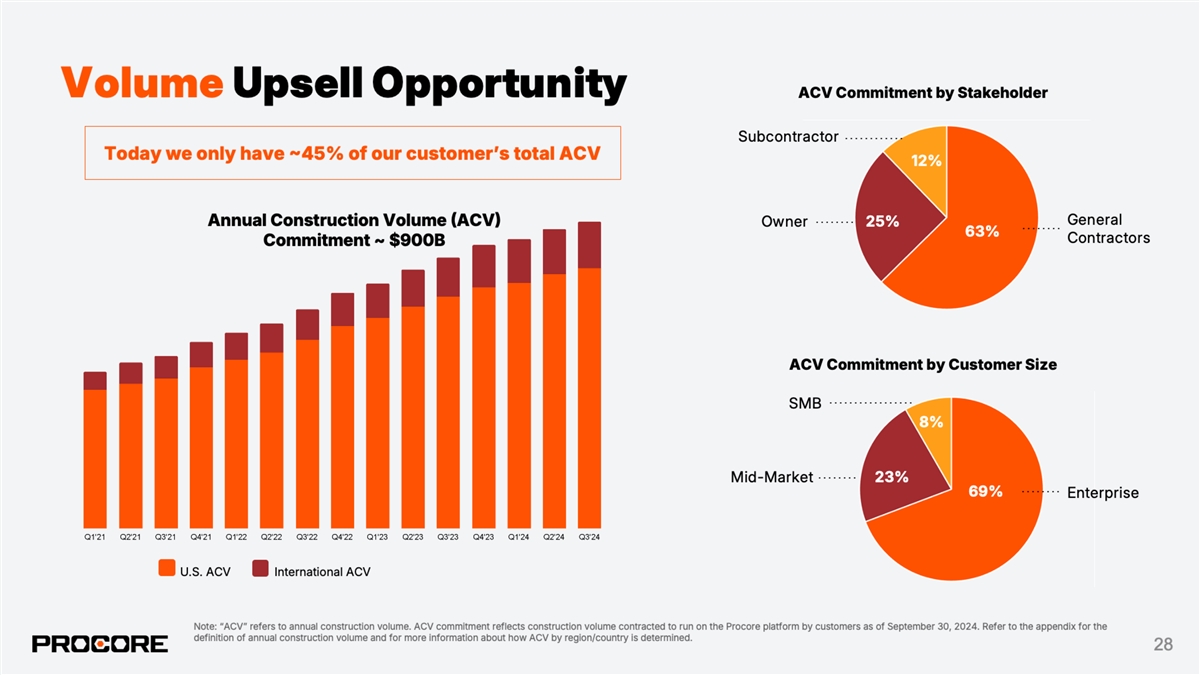
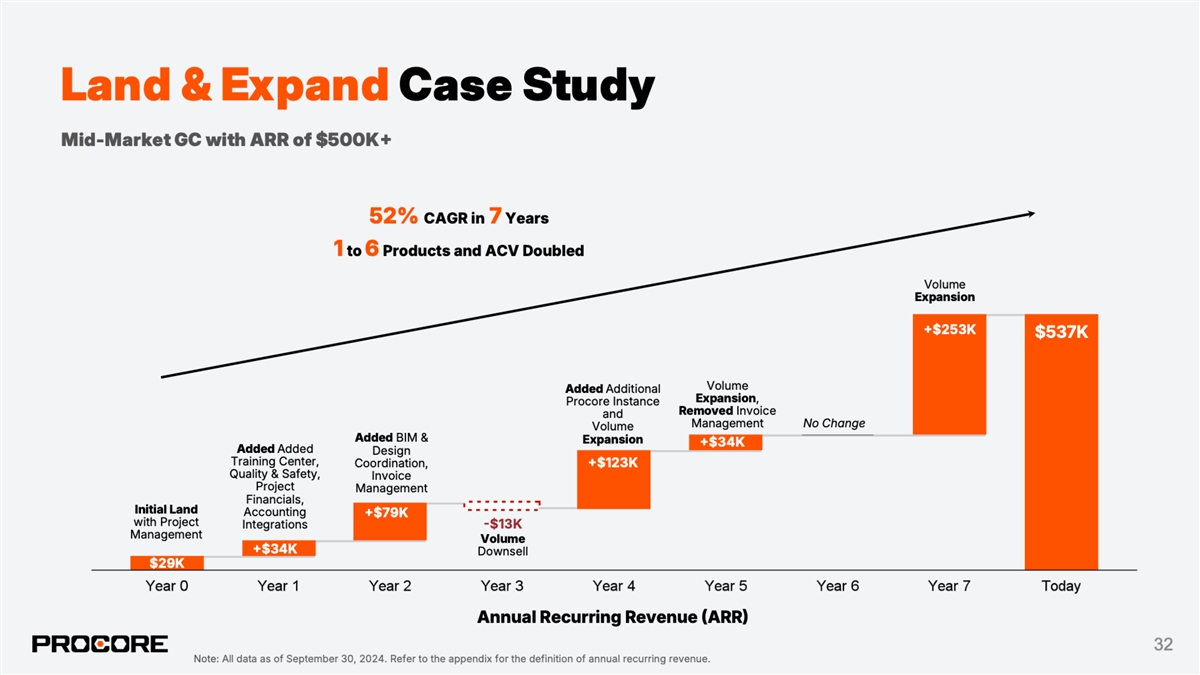
References and Definitions ANNUAL CONSTRUCTION VOLUME ACV When we refer to ACV with respect to our customers, we define ACV as the annual construction volume that our customers have contracted to run on the Procore platform. When we refer to ACV with respect to a geographic location (such as a region or a country), we define ACV as the actual or projected annual construction volume spend in that particular location. Our estimates of the construction industryʼs ACV with respect to a specific geographic location are calculated by us using data from the U.S. Census Bureau, international government statistics agencies, advisory firms, Oxford Economics estimates, and D&B Hoovers data, and are limited to the following countries: Australia (as of Q1 2024, Canada (as of October 2023, France (as of 2023, Germany (as of 2023, Ireland (as of 2023, New Zealand (as of June 2024, Saudi Arabia (as of 2023, Spain (as of 2023, United Arab Emirates (as of 2022, United Kingdom (as of 2022, United States (as of July 2024. Please note that more countries are served than are represented by our data. When we refer to Rest of World ROW ACV, we define ACV as the projected global construction ACV as of 2030 (see definition of TAM for details about how this is calculated), minus projected ACV for our active go-to-market countries (which are countries where we are actively pursuing new customers and which do not include countries where we only sell via inbound demand). ANNUAL RECURRING REVENUE ARR We define ARR at the end of a particular period as the annualized dollar value of our subscriptions from the specified customer or customers as of such period end date. For multi-year subscriptions, ARR at the end of a particular period is measured by using the stated contractual subscription fees as of the period end date on which ARR is measured. For example, if ARR is measured during the first year of a multi-year contract, the first-year subscription fees are used to calculate ARR. ARR at the end of a particular period includes the annualized dollar value of subscriptions for which the term has not ended, and subscriptions for which we are negotiating a subscription renewal. ARR should be viewed independently of revenue determined in accordance with GAAP and does not represent our U.S. GAAP revenue on an annualized basis. ARR is not intended to be a replacement or forecast of revenue. ANNUALIZED REVENUE RUN RATE Annualized Revenue Run Rate is measured by multiplying Procoreʼs quarterly revenue as of a given date by the number four. 85

References and Definitions CUSTOMER COUNT We define the number of customers at the end of a particular period as the number of entities that have entered into one or more subscriptions with us that have recurring charges for which the term has not ended, or with which we are negotiating a subscription renewal. An entity with multiple subsidiaries, segments, or divisions, is defined and counted as a single customer, even if there are multiple separate subscriptions. Customer count metrics exclude customers acquired from business combinations that do not have standard Procore annual contracts. FREE CASH FLOW FCF We define free cash flow as net cash provided by operating activities, less purchases of property and equipment and capitalized software development costs. We believes free cash flow is an important liquidity measure of the cash (if any) that is available, after our operating activities and capital expenditures. We use free cash flow in conjunction with traditional GAAP measures to assess our liquidity and evaluate the effectiveness of our business strategies. GROSS RETENTION RATE GRR To calculate our GRR at the end of a particular period, we first calculate the ARR from the cohort of active customers at the end of the period 12 months prior to the end of the period selected. We then calculate the value of ARR from any customers whose subscriptions terminated and were not renewed during the 12 months preceding the end of the period selected, which we refer to as cancellations. To calculate GRR, we divide (a) the total prior period ARR minus cancellations by (b) the total prior period ARR. TOTAL ADDRESSABLE MARKET TAM We view the construction industryʼs ACV as the primary factor informing our TAM because our revenue is driven by the value of the ACV that our customers have contracted to run on the Procore platform, and because changes in ACV are generally correlated with our revenue and growth opportunity. Our estimate of global construction ACV as of 2030 is based on a projection developed by Oxford Economics (see Oxford Economics: Future of Construction September 2021, estimated global construction spend in 2030. Refer to the definition of Annual Construction Volume ACV) for more information about how we calculate ACV with respect to a particular region or country. TOTAL ANNUAL RECURRING REVENUE TOTAL ARR We define Total ARR as the aggregate ARR across all given customer contracts in a referenced customer cohort. 86