Exhibit (c)(v)

Presentation to the Board of Directors of Medley Management Inc . August 2, 2018 Project Integrate
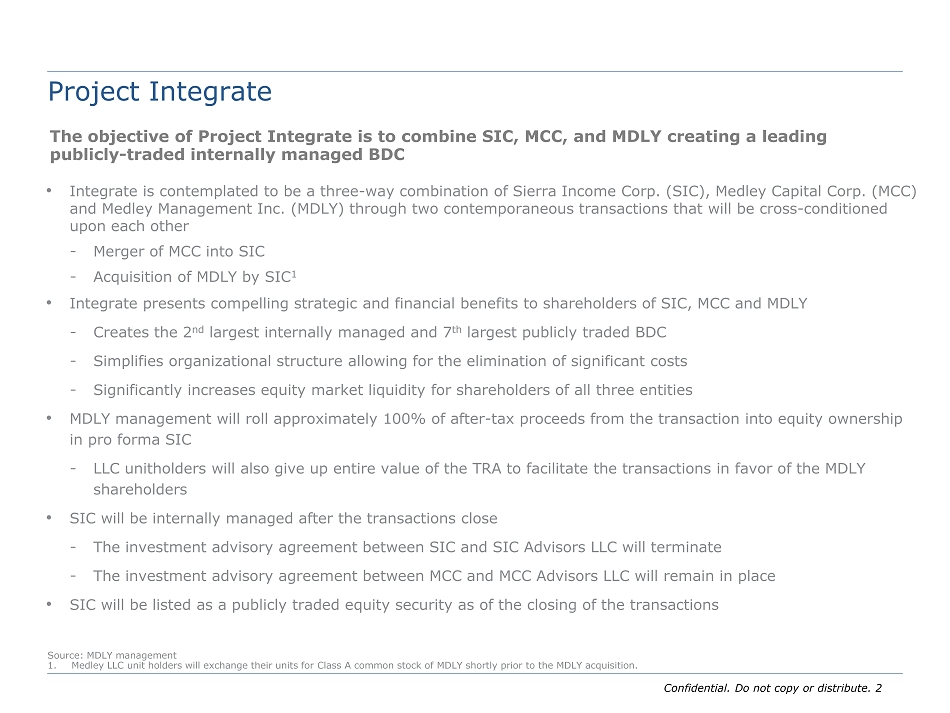
Confidential . Do not copy or distribute. 2 The objective of Project Integrate is to combine SIC, MCC, and MDLY creating a leading publicly - traded internally managed BDC Project Integrate • Integrate is contemplated to be a three - way combination of Sierra Income Corp. (SIC), Medley Capital Corp. (MCC) and Medley Management Inc. (MDLY) through two contemporaneous transactions that will be cross - conditioned upon each other - Merger of MCC into SIC - Acquisition of MDLY by SIC 1 • Integrate presents compelling strategic and financial benefits to shareholders of SIC, MCC and MDLY - Creates the 2 nd largest internally managed and 7 th largest publicly traded BDC - Simplifies organizational structure allowing for the elimination of significant costs - Significantly increases equity market liquidity for shareholders of all three entities • MDLY management will roll approximately 100% of after - tax proceeds from the transaction into equity ownership in pro forma SIC - LLC unitholders will also give up entire value of the TRA to facilitate the transactions in favor of the MDLY shareholders • SIC will be internally managed after the transactions close - The investment advisory agreement between SIC and SIC Advisors LLC will terminate - The investment advisory agreement between MCC and MCC Advisors LLC will remain in place • SIC will be listed as a publicly traded equity security as of the closing of the transactions Source: MDLY management 1. Medley LLC unit holders will exchange their units for Class A common stock of MDLY shortly prior to the MDLY acquisition.

Confidential . Do not copy or distribute. 3 Transaction Overview Update Source: MDLY management Transaction Steps • Immediately prior to the two transactions: - Exchange of Units : the Units of Medley LLC held by insiders (including unvested units which will accelerate upon a transaction) would be exchanged for an equal number of shares of Class A Common Stock in accordance with the terms of the existing Exchange Agreement • As a result of the exchange, Medley LLC will be wholly owned by MDLY • Immediately following the Exchange: - BDC Merger : MCC will merge with and into SIC, with SIC surviving the merger (the “BDC Merger”) • In the BDC Merger, each issued and outstanding share of MCC common stock will be converted into the right to receive 0.8050 shares of SIC common stock - MDLY Acquisition : MDLY acquisition will be accomplished by a merge into a newly formed wholly owned merger subsidiary of SIC, Sierra Management, with Sierra Management surviving the merger (the “MDLY Merger” and, together with the BDC Merger, the “Mergers”) • In the MDLY Merger: • each share of Class A Common Stock owned by public shareholders would be converted into the right to receive $4.09 total cash consideration (including $ 0.65 special cash dividend pre - closing) and 0.3836 shares of SIC • each share of Class A Common Stock owned by the previous LLC unitholders would be converted into the right to receive $ 3.79 total cash consideration (including $ 0.35 special cash dividend pre - closing) and 0.3836 shares of SIC • each share of Class B Common Stock would be canceled Framework analysis updated for estimated June 30, 2018 results and holds other transaction assumptions consistent with prior presentation

Confidential . Do not copy or distribute. 4 Additional Terms and Required Approvals Transaction Overview Update (cont.) Additional Terms • NYSE or NASDAQ Listing : SIC will apply to be publicly traded effective upon consummation of the Mergers • Incentive Plan : SIC will adopt an incentive plan on substantially the same terms as MDLY and MDLY RSUs will be exchanged for 0.8532 SIC RSUs each subject to the same vesting terms • Employment Contracts : At closing, SIC will enter into employment contracts with the executive team as described in the following pages • The Investment Advisory Contract : Although SIC will be internally managed following the exchange and Mergers, an investment advisory contract between SIC and MCC Advisors will remain in effect - Keeping the advisory contract in place allows MDLY to satisfy its contractual obligations for the $ 123 million bond issuance, the Tax Receivable Agreement and to Strategic Capital Advisory Agreement Required Approvals • Merger Agreements : The BDC Merger will require the approval of the MDLY, MCC and SIC Boards, special committees and shareholders • SEC Approval : Will require exemptive relief from the SEC • Hart - Scott - Rodino Act : Antitrust filing with the Department of Justice and Federal Trade Commission (unless exemption available) Source: MDLY management

Confidential . Do not copy or distribute. 5 Current Structure Source: MDLY management SIC Advisory Contract SIC Advisors Other Advisory Entities Private Fund and SMAs, Etc. MDLY (NYSE: MDLY) Unitholders Medley LLC Bonds MCC (NYSE : MCC ) MCC Advisors Advisory Contract Advisory Contracts

Confidential . Do not copy or distribute. 6 Pro Forma Structure Source: MDLY management 1. Assumes SEC staff confirms SIC can rely on existing no - action relief permitting a BDC to own a registered investment advisor. 2. Based on MDLY management proposal and current MCC, SIC and MDLY estimates per MDLY management. Pro Forma SIC Transaction Highlights • SIC is the acquirer of both MDLY and MCC • MCC acquired by SIC for stock − 0.8050 SIC shares per MCC share − Total value to MCC shareholders depends on the market valuation of SIC − $5.90 NAV per MCC share based on SIC 6/30/2018 pro forma NAV 2 • MDLY acquired by SIC for cash and stock − Class A Shareholders − $4.09 cash consideration (including $0.65 special cash dividend pre - closing) and 0.3836 shares of SIC per MDLY share to public − Total value to MDLY Class A shareholders depends on the market valuation of SIC − For example, consideration translates to $6.90 per MDLY share assuming BDC median ~1x price to 6/30/2018 NAV on a pro forma basis 2 − LLC Unitholders − $3.79 cash consideration (including $ 0.35 special cash dividend pre - closing) and 0.3836 shares of SIC per MDLY share to public − Total value to MDLY LLC unitholders depends on the market valuation of SIC − For example, consideration translates to $ 6.60 per MDLY share assuming BDC median ~1x price to 6/30/2018 NAV on a pro forma basis 2 − MDLY RSUs to vest over time into SIC shares at a 0.8532 exchange ratio; assumes holders receive $0.35 special cash dividend − LLC unitholders to receive 0% of the TRA value (versus 85% share in contractual agreement) − Approximately 100% of management’s after - tax proceeds will be rolled 2 A B C SIC (Ticker: TBD) MDLY (NYSE : MDLY) 1 Medley LLC Advisory Contracts Other Advisory Entities Private Fund and SMAs, Etc. Bonds A B C MCC Portfolio SIC Portfolio Advisory Contract MCC Advisors

Confidential . Do not copy or distribute. 7 Integrate creates the 2 nd largest internally managed and 7 th largest publicly traded BDC Transaction Rationale • Consistent with asset management industry - wide push for scale that is driving strategic consolidation among alternative credit managers • Creates a single larger consolidated balance sheet with which to face potential borrowers, lenders and other constituents in the market − Preserves value of MDLY as an asset management growth engine which has the potential to drive growth in NII and book value over time • Creates more liquid, publicly - traded equity security − $2.0 billion of assets / $1.1 billion NAV − Broadly held with 6.2% ownership by current Medley LLC unit holders 1 • Internalization simplifies organizational structure and potentially drives upside to future valuation − 1.47x median price - to - NAV valuation of internally managed publicly - traded BDCs versus 0.98x for externally managed BDCs 2 − $6.8 million estimated expense savings through synergies and elimination of public company costs 1 • MDLY management expects Integrate to be financially compelling to current MDLY Class A shareholders − $4.09 total cash consideration (including $0.65 special cash dividend pre - closing) and 0.3836 shares of SIC to Class A shareholders − Total value to MDLY shareholders depends on the market valuation of SIC − For example, consideration translates to $6.90 per MDLY Class A share ( assuming BDC median ~1x price to 6/30/2018E NAV on a pro forma basis) 1 Source: MDLY management. MCC, SIC and MDLY estimates per MDLY management. 1. Based on MDLY management proposal and current MCC, SIC and MDLY estimates per MDLY management. 2. SNL Financial as of 25 - Jul - 2018 .
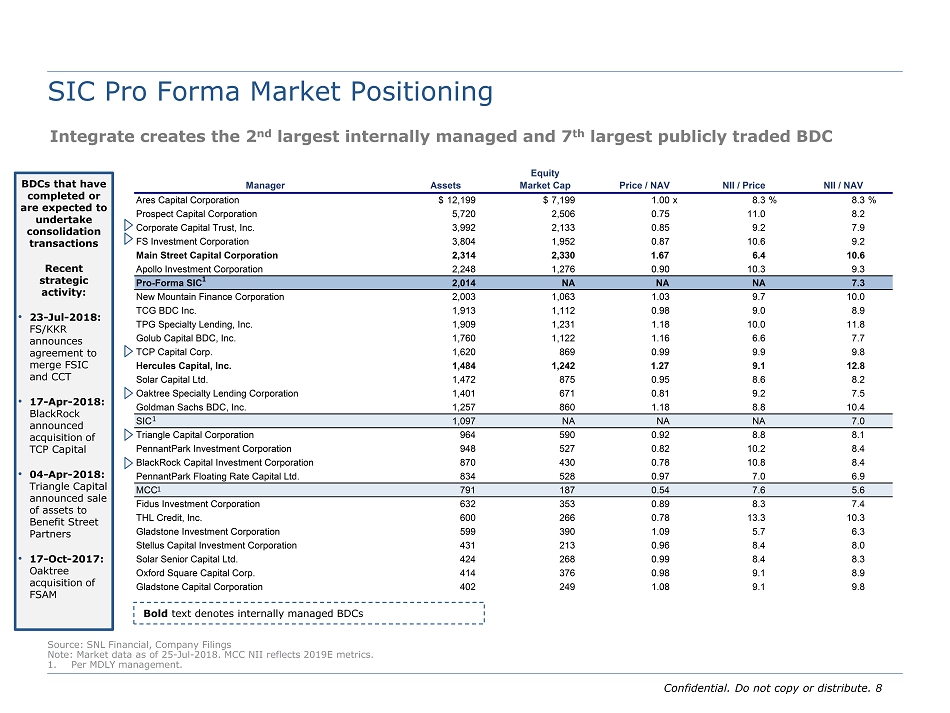
Confidential . Do not copy or distribute. 8 Equity Manager Assets Market Cap Price / NAV NII / Price NII / NAV Ares Capital Corporation $12,199 $7,199 1.00x 8.3% 8.3% Prospect Capital Corporation 5,720 2,506 0.75 11.0 8.2 Corporate Capital Trust, Inc. 3,992 2,133 0.85 9.2 7.9 FS Investment Corporation 3,804 1,952 0.87 10.6 9.2 Main Street Capital Corporation 2,314 2,330 1.67 6.4 10.6 Apollo Investment Corporation 2,248 1,276 0.90 10.3 9.3 Pro-Forma SIC 2,014 NA NA NA 7.3 New Mountain Finance Corporation 2,003 1,063 1.03 9.7 10.0 TCG BDC Inc. 1,913 1,112 0.98 9.0 8.9 TPG Specialty Lending, Inc. 1,909 1,231 1.18 10.0 11.8 Golub Capital BDC, Inc. 1,760 1,122 1.16 6.6 7.7 TCP Capital Corp. 1,620 869 0.99 9.9 9.8 Hercules Capital, Inc. 1,484 1,242 1.27 9.1 12.8 Solar Capital Ltd. 1,472 875 0.95 8.6 8.2 Oaktree Specialty Lending Corporation 1,401 671 0.81 9.2 7.5 Goldman Sachs BDC, Inc. 1,257 860 1.18 8.8 10.4 SIC 1,097 NA NA NA 7.0 Triangle Capital Corporation 964 590 0.92 8.8 8.1 PennantPark Investment Corporation 948 527 0.82 10.2 8.4 BlackRock Capital Investment Corporation 870 430 0.78 10.8 8.4 PennantPark Floating Rate Capital Ltd. 834 528 0.97 7.0 6.9 MCC 791 187 0.54 7.6 5.6 Fidus Investment Corporation 632 353 0.89 8.3 7.4 THL Credit, Inc. 600 266 0.78 13.3 10.3 Gladstone Investment Corporation 599 390 1.09 5.7 6.3 Stellus Capital Investment Corporation 431 213 0.96 8.4 8.0 Solar Senior Capital Ltd. 424 268 0.99 8.4 8.3 Oxford Square Capital Corp. 414 376 0.98 9.1 8.9 Gladstone Capital Corporation 402 249 1.08 9.1 9.8 SIC Pro Forma Market Positioning Source: SNL Financial, Company Filings Note: Market data as of 25 - Jul - 2018 . MCC NII reflects 2019E metrics. 1. Per MDLY management. Bold text denotes internally managed BDCs BDCs that have completed or are expected to undertake consolidation transactions Recent strategic activity: • 23 - Jul - 2018: FS/KKR announces agreement to merge FSIC and CCT • 17 - Apr - 2018: BlackRock announced acquisition of TCP Capital • 04 - Apr - 2018 : Triangle Capital announced sale of assets to Benefit Street Partners • 17 - Oct - 2017 : Oaktree acquisition of FSAM 1 1 1 Integrate creates the 2 nd largest internally managed and 7 th largest publicly traded BDC

Confidential . Do not copy or distribute. 9 Transaction Sources and Uses ($ in millions) Source: MDLY management. MCC, SIC and MDLY estimates per MDLY management. Note: MDLY shares, Unvested RSUs, and Unvested LLC Units outstanding provided by MDLY management as of 11 - Jul - 2018 . 1. MDLY acquired with a cash and stock mix for the Class A shareholders and LLC unitholders. Assumes restricted LLC units vest immedi ate ly prior to close. Holders of MDLY Unvested RSUs will vest over time into SIC stock. Transaction fees of $15.0mm per MDLY management. $123.4mm of debt (gross of OID) to roll - over as part of transac tion per MDLY management . 2. SIC cash balance per MDLY management adjusted to include $46.5mm of cash collateral from unwound Total Return Swap (“TRS”). 3. MCC acquired with a 100% stock consideration. Stock consideration reflects full exchange of all MCC shares. 3 Transaction Highlights • Public: $4.09 cash consideration including $0.65 special cash dividend and 0.3836 shares of SIC per MDLY share • LLC Unitholders: $3.79 cash consideration including $0.35 special cash dividend and 0.3836 shares of SIC per MDLY share • Unvested MDLY RSUs: 0.8532 SIC RSUs; assumes holders receive $0.35 special cash dividend • MCC acquired by SIC for 0.8050 SIC shares per MCC share Sources & Uses 1 Sources Uses MDLY Balance Sheet Cash $24.4 Cash Consideration to Class A Shareholders $19.1 SIC Cash 2 69.7 Special Dividend to Class A Shareholders 3.6 SIC Debt 38.4 Total Cash Consideration to Class A Shareholders $22.8 Cash Consideration to LLC Unitholders $85.4 Special Dividend to LLC Unitholders 8.7 Total Cash Consideration to LLC Unitholders $94.1 Special Dividend to RSUs $0.6 Transaction Fees $15.0 Total Sources $132.5 Total Uses $132.5 Memo Items: - 30.4023 mm MDLY shares exchanged for 11.6631 mm SIC Shares (0.3836 x exchange ratio) - 1.7552 mm Unvested MDLY RSUs to vest over time into 1.4975 mm SIC shares (0.8532 x exchange ratio) - 54.4742 mm MCC shares exchanged for 43.1782 mm SIC Shares (0.8050 x exchange ratio)

Confidential . Do not copy or distribute. 10 Summary of Key Metrics | Selected Financial Assumptions ($ in millions, except per share data) Source: MDLY management. MCC, SIC and MDLY estimates per MDLY management. Note: MDLY shares, Unvested RSUs, and Restricted LLC Units outstanding provided by MDLY management as of 11 - Jul - 2018 . 1. Represents Core EBITDA following adjusting P&L for impact of closing Foundation (~$0.1mm net impact annually) per MDLY management. 2. SIC Net Investment Income projection per MDLY management. 3. Per MDLY management. 4. MCC projections provided by MDLY management as of 11 - July - 2018. 5. Per MDLY management. Selected Financial Assumptions Other Key Assumptions 5 • $6.8mm estimated expense savings through synergies and elimination of public company costs • $7.5mm of incremental GAAP compensation • $15.0mm of transaction costs • $2.3mm of incremental pre - tax financing costs at SIC MDLY Financial Metrics Per Share Total Core 2019E EBITDA 1 $1.19 $38.2 Core 2019E Pre-Tax Net Income 0.82 26.5 Class A Shareholder EPS $0.55 Shares Outstanding Total Total Class A Shares 5.563 Unvested RSUs 1.755 LLC Units 23.333 Restricted LLC Units 1.506 Total Shares Outstanding 32.157 SIC Financial Metrics Per Share Total 2019E Net Investment Income 2 $0.50 $48.8 Q2 2018E Net Asset Value 7.27 704.0 Memo: Yield (NAV) - 6.9% Shares Outstanding 3 Total Total Shares Outstanding 96.785 MCC Financial Metrics Per Share Total 2019E Net Investment Income 4 $0.36 $19.7 Q2 2018E Net Asset Value 6.43 350.2 Memo: Yield (NAV) - 5.6% Shares Outstanding 3 Total Total Shares Outstanding 54.474

Confidential . Do not copy or distribute. 11 Illustrative Pro Forma Shares Outstanding Source: MDLY management. MCC, SIC and MDLY estimates per MDLY management. 1. MDLY shares , Unvested RSUs , and Restricted LLC Units outstanding per MDLY management. SIC and MCC shares per MDLY management . Pro Forma Shares Outstanding 1 Pro Forma Ownership 1 SIC 63.2 % MCC 28.2 % LLC Unitholders 6.2 % Class A Shares 1.4 % Unvested RSUs 1.0 % Shares % SIC SIC Standalone Shares 96.785 63.2% MCC Shares Outstanding 46.717 (x) Exchange Ratio 0.8050x MCC Shares Exchanged to SIC Shares 37.607 MCC Foundation Shares 7.757 (x) Exchange Ratio 0.8050x SIC Shares Issued to Foundation 6.244 (-) MCC Shares Retired Post-Foundation Closing (0.673) New SIC Shares 43.178 28.2% MDLY Shares Outstanding 32.157 (-) Unvested RSUs (1.755) Shares Receiving Cash / Stock Mix 30.402 LLC Units (inc. Restricted LLC Units) 24.839 (x) Exchange Ratio 0.3836x New SIC Shares 9.529 6.2% Total Class A Shares 5.563 (x) Exchange Ratio 0.3836x New SIC Shares 2.134 1.4% Unvested RSUs 1.755 (x) Exchange Ratio 0.8532x New SIC Unvested RSUs 1.498 1.0% Fully Diluted SIC Shares 153.124 100.0%

Confidential . Do not copy or distribute. 12 Illustrative Pro Forma Income Statement Source: MDLY management. MCC, SIC and MDLY estimates per MDLY management. 1. Financial projections for MDLY, MCC and SIC per MDLY management. 2. Per MDLY management . 3. Assumes unitholders receive 0% of TRA value. Pro Forma 2019E Income Statement 1 Pro Forma SIC NII SIC BDC NII $48.8 (+) MCC NII 19.7 (+) MDLY A-T Net Income 23.9 (-) P-T Net Synergies (0.7) (-) P-T Cost of Financing (2.3) PF SIC NII $89.4 PF SIC NII Per Share $0.50 $0.58 Accretion / (Dilution) to SIC 15.7% PF MCC NII Per Share $0.36 $0.47 Accretion / (Dilution) to MCC 29.8% MDLY A-T Net Income Medley Mgmt. LLC Core Pre-Tax Net Income $26.5 (-) Basis Step-Up Amortization 2 (18.6) MDLY Taxable Net Income $7.9 (-) Tax Expense 2 (2.6) MDLY After-Tax Net Income $5.3 (+) Basis Step-Up Amortization 2 18.6 (-) TRA Payment to Unitholders 3 0.0 MDLY After-Tax Net Income $23.9

Confidential . Do not copy or distribute. 13 Illustrative Pro Forma Balance Sheet Walk Based on Q2 2018E ($ in millions, except per share data) Source: Estimates per MDLY management. Note: Bargain purchase calculated based on SIC standalone NAVPS (price of $5.85 per share). MDLY investment value based on SI C s tandalone NAVPS (price of $6.23 per share). 1. Per MDLY management. 2. SIC stand - alone balance sheet per MDLY management adjusted for unwind of TRS and transfer of $46.5mm of TRS cash collateral from Other Assets to Cash & Cash Equivalents. 3. Per MDLY management, TRS is assumed to be unwound. • SIC records bargain purchase gain of $31.2mm 1 • $15.0mm of transaction costs 1 • Assumes $123.3mm of SIC total return swap included in regulatory debt ratio and is ultimately unwound 2 (+) Transaction SIC (+) MCC Considerations / SIC Est. Standalone 2 Est. Standalone (+) MDLY Adjustments Pro Forma Assets: Cash & Cash Equivalents 2 $99 $144 $(70) $173 Investment Assets 991 635 $200 (24) 1,802 Goodwill Other Assets 13 10 23 Total Assets $1,103 $789 $200 $(94) $1,998 Liabilities: Existing Debt $381 $277 $657 New Debt $38 38 SBA Debentures 148 148 Other Liabilities 19 14 33 Total Liabilities $399 $439 $0 $38 $876 Equity: Net Assets $704 $350 $200 $(133) $1,122 Total Equity $704 $350 $200 $(133) $1,122 Total Liabilities and Equity $1,103 $789 $200 $(94) $1,998 Key Metrics Memo: Bargain Purchase Gain $31.2 $31.2 Memo: Total Return Swap 3 $123.3 GAAP Debt / NAV 0.54x 1.21x 0.75x Regulatory Debt / NAV 0.72 0.79 0.62 Shares Outstanding 96.785 54.474 153.124 NAV per Share $7.27 $6.43 $7.33
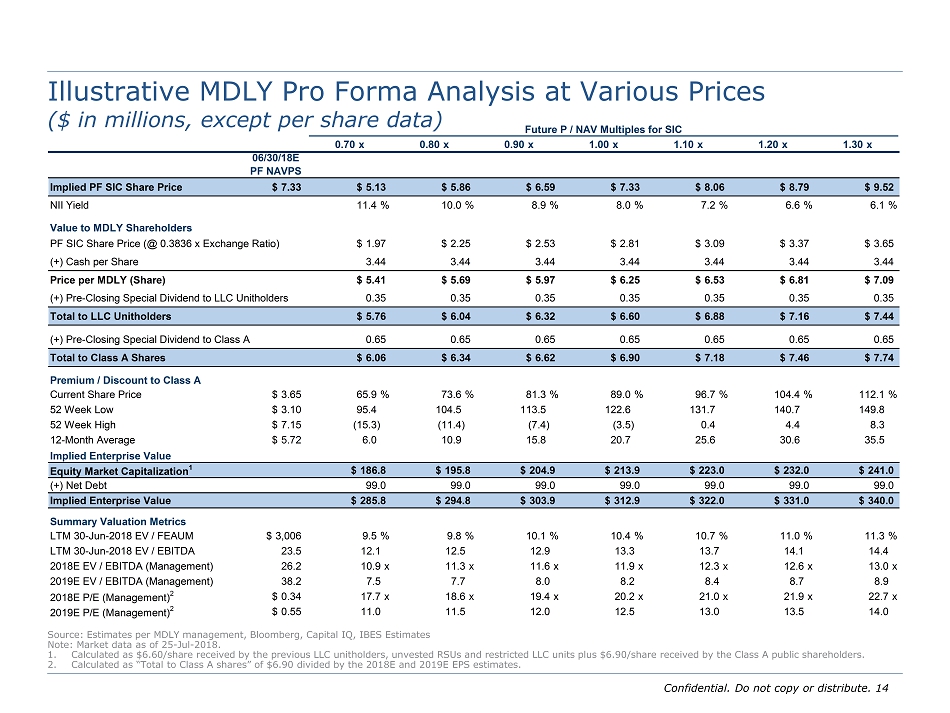
Confidential . Do not copy or distribute. 14 Illustrative MDLY Pro Forma Analysis at Various Prices ($ in millions, except per share data) Source: Estimates per MDLY management, Bloomberg, Capital IQ, IBES Estimates Note: Market data as of 25 - Jul - 2018 . 1. Calculated as $6.60/share received by the previous LLC unitholders, unvested RSUs and restricted LLC units plus $6.90/share r ece ived by the Class A public shareholders. 2. Calculated as “Total to Class A shares” of $6.90 divided by the 2018E and 2019E EPS estimates. Future P / NAV Multiples for SIC 0.70x 0.80x 0.90x 1.00x 1.10x 1.20x 1.30x 06/30/18E PF NAVPS Implied PF SIC Share Price $7.33 $5.13 $5.86 $6.59 $7.33 $8.06 $8.79 $9.52 NII Yield 11.4% 10.0% 8.9% 8.0% 7.2% 6.6% 6.1% Value to MDLY Shareholders PF SIC Share Price (@ 0.3836 x Exchange Ratio) $1.97 $2.25 $2.53 $2.81 $3.09 $3.37 $3.65 (+) Cash per Share 3.44 3.44 3.44 3.44 3.44 3.44 3.44 Price per MDLY (Share) $5.41 $5.69 $5.97 $6.25 $6.53 $6.81 $7.09 (+) Pre-Closing Special Dividend to LLC Unitholders 0.35 0.35 0.35 0.35 0.35 0.35 0.35 Total to LLC Unitholders $5.76 $6.04 $6.32 $6.60 $6.88 $7.16 $7.44 (+) Pre-Closing Special Dividend to Class A 0.65 0.65 0.65 0.65 0.65 0.65 0.65 Total to Class A Shares $6.06 $6.34 $6.62 $6.90 $7.18 $7.46 $7.74 Premium / Discount to Class A Current Share Price $3.65 65.9% 73.6% 81.3% 89.0% 96.7% 104.4% 112.1% 52 Week Low $3.10 95.4 104.5 113.5 122.6 131.7 140.7 149.8 52 Week High $7.15 (15.3) (11.4) (7.4) (3.5) 0.4 4.4 8.3 12-Month Average $5.72 6.0 10.9 15.8 20.7 25.6 30.6 35.5 Implied Enterprise Value Equity Market Capitalization 1 $186.8 $195.8 $204.9 $213.9 $223.0 $232.0 $241.0 (+) Net Debt 99.0 99.0 99.0 99.0 99.0 99.0 99.0 Implied Enterprise Value $285.8 $294.8 $303.9 $312.9 $322.0 $331.0 $340.0 Summary Valuation Metrics LTM 30-Jun-2018 EV / FEAUM $3,006 9.5% 9.8% 10.1% 10.4% 10.7% 11.0% 11.3% LTM 30-Jun-2018 EV / EBITDA 23.5 12.1 12.5 12.9 13.3 13.7 14.1 14.4 2018E EV / EBITDA (Management) 26.2 10.9x 11.3x 11.6x 11.9x 12.3x 12.6x 13.0x 2019E EV / EBITDA (Management) 38.2 7.5 7.7 8.0 8.2 8.4 8.7 8.9 2018E P/E (Management) 2 $0.34 17.7x 18.6x 19.4x 20.2x 21.0x 21.9x 22.7x 2019E P/E (Management) 2 $0.55 11.0 11.5 12.0 12.5 13.0 13.5 14.0

Confidential . Do not copy or distribute. 15 Named Executives and Compensation Source: Most recent proxy statements, MDLY management Note: Management team and board of Sierra Income Corp will be consistent with the wholly owned asset management entity. Remains a Manager of the SBIC as well as on the investment committee of MOF II . • The following is consistent with publicly traded peers, and at or below the peer median in value for each of the executives Pro Forma Sierra Income Corp. Management Position Salary % Bonus % Stock Award % Other % Total Chairman and CEO - Brook Taube $600,000 15.6% $1,200,000 31.3% $2,000,000 52.1% $38,686 1.0% $3,838,686 Vice Chairman, Head of Strategy and Board Member - Seth Taube 480,000 21.2% 600,000 26.4% 1,150,000 50.7% 39,195 1.7% 2,269,195 President - Jeffrey Tonkel 480,000 21.2% 600,000 26.5% 1,150,000 50.7% 36,671 1.6% 2,266,671 CFO - Richard Allorto 360,000 21.2% 450,000 26.5% 850,000 50.0% 38,605 2.3% 1,698,605 General Counsel - John Fredericks 360,000 21.2% 450,000 26.5% 850,000 50.0% 39,832 2.3% 1,699,832 Total Executive Compensation $2,280,000 19.4% $3,300,000 28.0% $6,000,000 51.0% $192,989 1.6% $11,772,989 Pro Forma Sierra Income Corp. Management / GAAP Expense Position Salary % Bonus % Stock Award % Other % Total Chairman and CEO - Brook Taube $600,000 26.8% $1,200,000 53.6% $400,000 17.9% $38,686 1.7% $2,238,686 Vice Chairman, Head of Strategy and Board Member - Seth Taube 480,000 35.6% 600,000 44.5% 230,000 17.0% 39,195 2.9% 1,349,195 President - Jeffrey Tonkel 480,000 35.6% 600,000 44.6% 230,000 17.1% 36,671 2.7% 1,346,671 CFO - Richard Allorto 360,000 35.3% 450,000 44.2% 170,000 16.7% 38,605 3.8% 1,018,605 General Counsel - John Fredericks 360,000 35.3% 450,000 44.1% 170,000 16.7% 39,832 3.9% 1,019,832 Total Executive Compensation $2,280,000 32.7% $3,300,000 47.3% $1,200,000 17.2% $192,989 2.8% $6,972,989
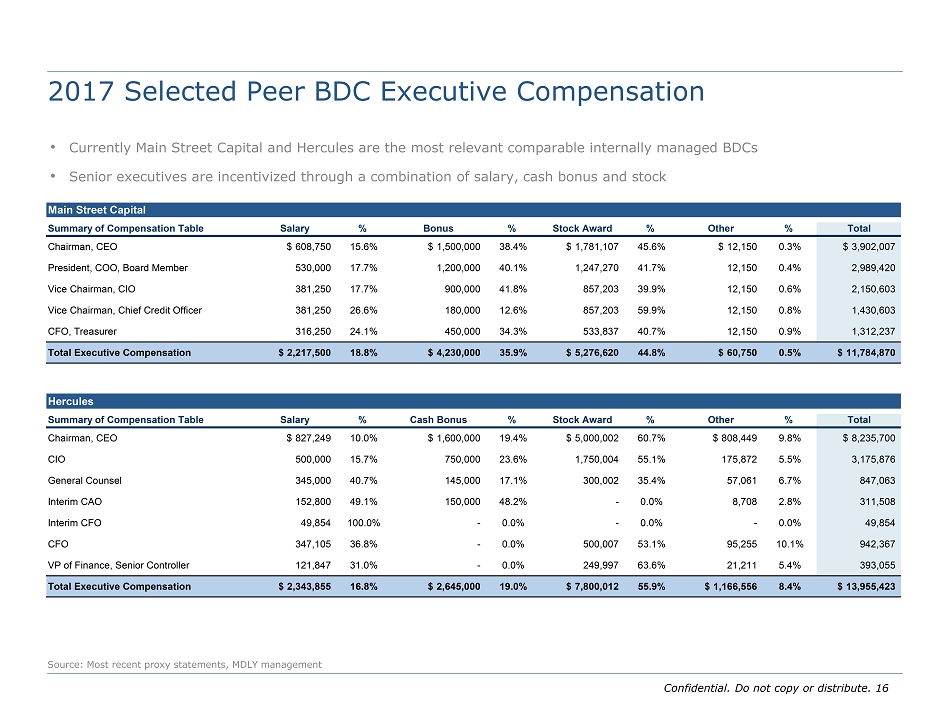
Confidential . Do not copy or distribute. 16 2017 Selected Peer BDC Executive Compensation Source: Most recent proxy statements, MDLY management • Currently Main Street Capital and Hercules are the most relevant comparable internally managed BDCs • Senior executives are incentivized through a combination of salary, cash bonus and stock Main Street Capital Summary of Compensation Table Salary % Bonus % Stock Award % Other % Total Chairman, CEO $608,750 15.6% $1,500,000 38.4% $1,781,107 45.6% $12,150 0.3% $3,902,007 President, COO, Board Member 530,000 17.7% 1,200,000 40.1% 1,247,270 41.7% 12,150 0.4% 2,989,420 Vice Chairman, CIO 381,250 17.7% 900,000 41.8% 857,203 39.9% 12,150 0.6% 2,150,603 Vice Chairman, Chief Credit Officer 381,250 26.6% 180,000 12.6% 857,203 59.9% 12,150 0.8% 1,430,603 CFO, Treasurer 316,250 24.1% 450,000 34.3% 533,837 40.7% 12,150 0.9% 1,312,237 Total Executive Compensation $2,217,500 18.8% $4,230,000 35.9% $5,276,620 44.8% $60,750 0.5% $11,784,870 Hercules Summary of Compensation Table Salary % Cash Bonus % Stock Award % Other % Total Chairman, CEO $827,249 10.0% $1,600,000 19.4% $5,000,002 60.7% $808,449 9.8% $8,235,700 CIO 500,000 15.7% 750,000 23.6% 1,750,004 55.1% 175,872 5.5% 3,175,876 General Counsel 345,000 40.7% 145,000 17.1% 300,002 35.4% 57,061 6.7% 847,063 Interim CAO 152,800 49.1% 150,000 48.2% - 0.0% 8,708 2.8% 311,508 Interim CFO 49,854 100.0% - 0.0% - 0.0% - 0.0% 49,854 CFO 347,105 36.8% - 0.0% 500,007 53.1% 95,255 10.1% 942,367 VP of Finance, Senior Controller 121,847 31.0% - 0.0% 249,997 63.6% 21,211 5.4% 393,055 Total Executive Compensation $2,343,855 16.8% $2,645,000 19.0% $7,800,012 55.9% $1,166,556 8.4% $13,955,423

Appendix A: Selected Public Company Comparables

Confidential . Do not copy or distribute. 18 Comparison of Selected BDCs ($ in millions, except per share data) Source: SNL Financial, Company Filings Note: Market data as of 25 - Jul - 2018 . MCC NII reflects 2019E metrics. 1. Per MDLY management. Equity Closing Annualized Market Price % of 52 FMV of FMV / Price / Debt / Div. Div. / NII / NII / Cap 25-Jul-18 Wk High Portfolio Cost NAV Equity Yield NAV Price NAV Externally Managed BDCs Ares Capital Corporation $7,199 $16.90 98.8% $12,199 100.3% 1.00x 0.69x 9.0% 9.0% 8.3% 8.3% Prospect Capital Corporation 2,506 6.91 82.6 5,720 97.5 0.75 0.71 10.4 7.8 11.0 8.2 Corporate Capital Trust, Inc. 2,133 16.90 88.9 3,992 96.4 0.85 0.64 9.5 8.1 9.2 7.9 FS Investment Corporation 1,952 7.95 86.9 3,804 102.1 0.87 0.76 9.6 8.3 10.6 9.2 Apollo Investment Corporation 1,276 5.90 91.6 2,248 99.1 0.90 0.56 10.2 9.2 10.3 9.3 TPG Specialty Lending, Inc. 1,231 19.19 88.3 1,909 100.7 1.18 0.80 8.1 9.6 10.0 11.8 Golub Capital BDC, Inc. 1,122 18.74 94.9 1,760 101.2 1.16 0.86 6.8 7.9 6.6 7.7 TCG BDC Inc. 1,112 17.78 87.6 1,913 99.6 0.98 0.71 8.3 8.2 9.0 8.9 New Mountain Finance Corporation 1,063 14.00 95.2 2,003 101.4 1.03 0.94 9.7 10.0 9.7 10.0 TCP Capital Corp. 869 14.77 86.7 1,620 98.4 0.99 0.88 9.7 9.7 9.9 9.8 Goldman Sachs BDC, Inc. 860 21.42 92.3 1,257 98.4 1.18 0.72 8.4 9.9 8.8 10.4 Oaktree Specialty Lending Corporation 671 4.76 80.5 1,401 84.3 0.81 0.70 8.0 6.5 9.2 7.5 PennantPark Floating Rate Capital Ltd. 528 13.62 93.0 834 100.6 0.97 0.60 1.7 1.6 7.0 6.9 PennantPark Investment Corporation 527 7.42 94.6 948 91.1 0.82 0.76 9.7 8.0 10.2 8.4 BlackRock Capital Investment Corporation 430 5.95 77.6 870 99.2 0.78 0.56 12.1 9.4 10.8 8.4 Gladstone Investment Corporation 390 11.87 96.8 599 102.4 1.09 0.70 6.8 7.4 5.7 6.3 Oxford Square Capital Corp. 376 7.44 99.5 414 98.0 0.98 0.16 10.8 10.5 9.1 8.9 Fidus Investment Corporation 353 14.43 84.7 632 103.4 0.89 0.65 10.8 9.6 8.3 7.4 Solar Senior Capital Ltd. 268 16.71 90.8 424 98.4 0.99 0.52 8.4 8.4 8.4 8.3 THL Credit, Inc. 266 8.13 79.6 600 96.5 0.78 0.81 13.3 10.3 13.3 10.3 Gladstone Capital Corporation 249 9.27 93.2 402 88.0 1.08 0.77 9.1 9.8 9.1 9.8 Stellus Capital Investment Corporation 213 13.35 93.4 431 101.2 0.96 1.13 10.2 9.8 8.4 8.0 Externally Managed BDC Median 91.2% 99.1% 0.98x 0.71x 9.5% 9.1% 9.1% 8.4% Internally Managed BDCs Main Street Capital Corporation $2,330 $39.50 94.5% $2,314 107.3% 1.67x 0.67x 5.8% 9.6% 6.4% 10.6% Hercules Capital, Inc. 1,242 13.58 97.2 1,484 94.1 1.27 0.79 9.1 11.6 9.1 12.8 Internally Managed BDC Median 95.9% 100.7% 1.47x 0.73x 7.5% 10.6% 7.8% 11.7% Median - All BDCs 92.0% 99.1% 0.98x 0.71x 9.3% 9.3% 9.1% 8.4% SIC 1 NA NA NA 1,001 91.6 NA 0.55 NA 8.9 6.9 6.9 MCC 1 187 3.44 51.7 637 85.7 0.49 1.14 11.6 5.7 7.6 3.7

Confidential . Do not copy or distribute. 19 Comparison of Selected Alternative Asset Managers ($ in millions, except per share data) Source: MDLY historical financial information per MDLY management, MDLY estimates per MDLY management, Bloomberg, Capital IQ, Co mpany Filings for U.S. alternative managers, IBES Estimates Note: Financial information per latest available public filings. For Ares, enterprise value is pro forma for $275mm of prefer red units issued after 2016 Q1 filing. Projected figures and 5 - year EPS CAGR based on IBES median estimates and/or other Wall Street research. All research estimates have been calendarized to December. ENI represents the earnings of the management company, including change in the embedded value of carry and gains on principal investments. Equity market cap based on diluted shares ou tstanding . Market data as of 25 - Jul - 2018. Equity Closing % of Calendarized Enterprise Value Multiples Dividend Market Enterprise Price 52 Week Yield Company Cap Value 25-Jul-2018 High 2018E 2019E AUM FEAUM 2018E 2019E 2018E MDLY $117 $216 $3.65 51.0% 11.9x 6.6x 4.3% 7.3% 8.2x 5.7x 21.9% U.S. Alternative Managers - ENI Basis¹ Blackstone $44,847 $43,958 $36.05 96.1% 11.8x 10.9x 9.8% 12.8% 11.3x 10.0x 6.2% KKR 24,163 24,533 27.74 99.6 17.3 15.5 13.9 20.5 10.8 9.1 2.1 Apollo 14,666 15,368 35.38 94.7 19.0 11.0 6.2 8.4 16.8 10.2 6.5 Carlyle 8,627 9,174 23.85 92.1 10.2 7.8 4.6 7.3 9.3 7.0 5.2 Oaktree 6,810 6,692 42.05 86.7 11.1 9.8 5.5 6.6 10.6 9.3 6.8 Ares 4,983 5,757 21.10 81.3 12.7 10.8 5.1 7.7 12.2 11.0 5.3 Median - U.S. Alternative Asset Managers - ENI Basis 93.4% 12.2x 10.8x 5.9% 8.0% 11.0x 9.7x 5.8% P/E Multiples EV / EBITDA Multiples
Appendix B: Selected Public Company Compensation Comparables

Confidential . Do not copy or distribute. 21 Main Street Capital Summary of Compensation Table Salary % Bonus % Stock Award % Other % Total Exec. Comp Expense Chairman, CEO $608,750 15.6% $1,500,000 38.4% $1,781,107 45.6% $12,150 0.3% $3,902,007 33.1% 5.5% President, COO, Board Member 530,000 17.7% 1,200,000 40.1% 1,247,270 41.7% 12,150 0.4% 2,989,420 25.4 4.2 Vice Chairman, CIO 381,250 17.7% 900,000 41.8% 857,203 39.9% 12,150 0.6% 2,150,603 18.2 3.1 Vice Chairman, Chief Credit Officer 381,250 26.6% 180,000 12.6% 857,203 59.9% 12,150 0.8% 1,430,603 12.1 2.0 CFO, Treasurer 316,250 24.1% 450,000 34.3% 533,837 40.7% 12,150 0.9% 1,312,237 11.1 1.9 Total Executive Compensation $2,217,500 18.8% $4,230,000 35.9% $5,276,620 44.8% $60,750 0.5% $11,784,870 Hercules Summary of Compensation Table Salary % Cash Bonus % Stock Award % Other % Total Exec. Comp Expense Chairman, CEO $827,249 10.0% $1,600,000 19.4% $5,000,002 60.7% $808,449 9.8% $8,235,700 59.0% 8.7% CIO 500,000 15.7% 750,000 23.6% 1,750,004 55.1% 175,872 5.5% 3,175,876 22.8 3.4 General Counsel 345,000 40.7% 145,000 17.1% 300,002 35.4% 57,061 6.7% 847,063 6.1 0.9 Interim CAO 152,800 49.1% 150,000 48.2% - 0.0% 8,708 2.8% 311,508 2.2 0.3 Interim CFO 49,854 100.0% - 0.0% - 0.0% - 0.0% 49,854 0.4 0.1 CFO 347,105 36.8% - 0.0% 500,007 53.1% 95,255 10.1% 942,367 6.8 1.0 VP of Finance, Senior Controller 121,847 31.0% - 0.0% 249,997 63.6% 21,211 5.4% 393,055 2.8 0.4 Total Executive Compensation $2,343,855 16.8% $2,645,000 19.0% $7,800,012 55.9% $1,166,556 8.4% $13,955,423 Main Street & Hercules Cash Stock Median: Comp / Total Expenses 2.8% 4.4% 7.9% 0.7% 15.8% 7.9% 7.9% Median: Comp / FEAUM 1 0.1 0.2 0.4 0.0 0.7 0.4 0.4 % of Total % of Total 2017 Selected Peer Industry Comparables Source: Most recent proxy statements, MDLY management
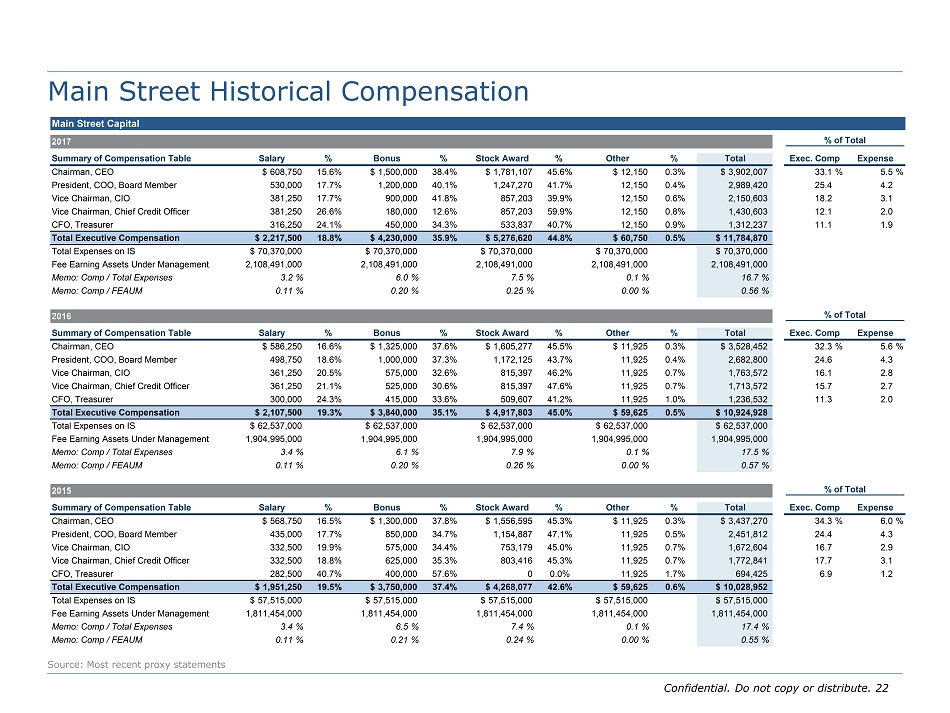
Confidential . Do not copy or distribute. 22 Main Street Historical Compensation Source: Most recent proxy statements Main Street Capital 2017 % of Total Summary of Compensation Table Salary % Bonus % Stock Award % Other % Total Exec. Comp Expense Chairman, CEO $608,750 15.6% $1,500,000 38.4% $1,781,107 45.6% $12,150 0.3% $3,902,007 33.1% 5.5% President, COO, Board Member 530,000 17.7% 1,200,000 40.1% 1,247,270 41.7% 12,150 0.4% 2,989,420 25.4 4.2 Vice Chairman, CIO 381,250 17.7% 900,000 41.8% 857,203 39.9% 12,150 0.6% 2,150,603 18.2 3.1 Vice Chairman, Chief Credit Officer 381,250 26.6% 180,000 12.6% 857,203 59.9% 12,150 0.8% 1,430,603 12.1 2.0 CFO, Treasurer 316,250 24.1% 450,000 34.3% 533,837 40.7% 12,150 0.9% 1,312,237 11.1 1.9 Total Executive Compensation $2,217,500 18.8% $4,230,000 35.9% $5,276,620 44.8% $60,750 0.5% $11,784,870 Total Expenses on IS $70,370,000 $70,370,000 $70,370,000 $70,370,000 $70,370,000 Fee Earning Assets Under Management 2,108,491,000 2,108,491,000 2,108,491,000 2,108,491,000 2,108,491,000 Memo: Comp / Total Expenses 3.2% 6.0% 7.5% 0.1% 16.7% Memo: Comp / FEAUM 0.11% 0.20% 0.25% 0.00% 0.56% 2016 % of Total Summary of Compensation Table Salary % Bonus % Stock Award % Other % Total Exec. Comp Expense Chairman, CEO $586,250 16.6% $1,325,000 37.6% $1,605,277 45.5% $11,925 0.3% $3,528,452 32.3% 5.6% President, COO, Board Member 498,750 18.6% 1,000,000 37.3% 1,172,125 43.7% 11,925 0.4% 2,682,800 24.6 4.3 Vice Chairman, CIO 361,250 20.5% 575,000 32.6% 815,397 46.2% 11,925 0.7% 1,763,572 16.1 2.8 Vice Chairman, Chief Credit Officer 361,250 21.1% 525,000 30.6% 815,397 47.6% 11,925 0.7% 1,713,572 15.7 2.7 CFO, Treasurer 300,000 24.3% 415,000 33.6% 509,607 41.2% 11,925 1.0% 1,236,532 11.3 2.0 Total Executive Compensation $2,107,500 19.3% $3,840,000 35.1% $4,917,803 45.0% $59,625 0.5% $10,924,928 Total Expenses on IS $62,537,000 $62,537,000 $62,537,000 $62,537,000 $62,537,000 Fee Earning Assets Under Management 1,904,995,000 1,904,995,000 1,904,995,000 1,904,995,000 1,904,995,000 Memo: Comp / Total Expenses 3.4% 6.1% 7.9% 0.1% 17.5% Memo: Comp / FEAUM 0.11% 0.20% 0.26% 0.00% 0.57% 2015 % of Total Summary of Compensation Table Salary % Bonus % Stock Award % Other % Total Exec. Comp Expense Chairman, CEO $568,750 16.5% $1,300,000 37.8% $1,556,595 45.3% $11,925 0.3% $3,437,270 34.3% 6.0% President, COO, Board Member 435,000 17.7% 850,000 34.7% 1,154,887 47.1% 11,925 0.5% 2,451,812 24.4 4.3 Vice Chairman, CIO 332,500 19.9% 575,000 34.4% 753,179 45.0% 11,925 0.7% 1,672,604 16.7 2.9 Vice Chairman, Chief Credit Officer 332,500 18.8% 625,000 35.3% 803,416 45.3% 11,925 0.7% 1,772,841 17.7 3.1 CFO, Treasurer 282,500 40.7% 400,000 57.6% 0 0.0% 11,925 1.7% 694,425 6.9 1.2 Total Executive Compensation $1,951,250 19.5% $3,750,000 37.4% $4,268,077 42.6% $59,625 0.6% $10,028,952 Total Expenses on IS $57,515,000 $57,515,000 $57,515,000 $57,515,000 $57,515,000 Fee Earning Assets Under Management 1,811,454,000 1,811,454,000 1,811,454,000 1,811,454,000 1,811,454,000 Memo: Comp / Total Expenses 3.4% 6.5% 7.4% 0.1% 17.4% Memo: Comp / FEAUM 0.11% 0.21% 0.24% 0.00% 0.55%
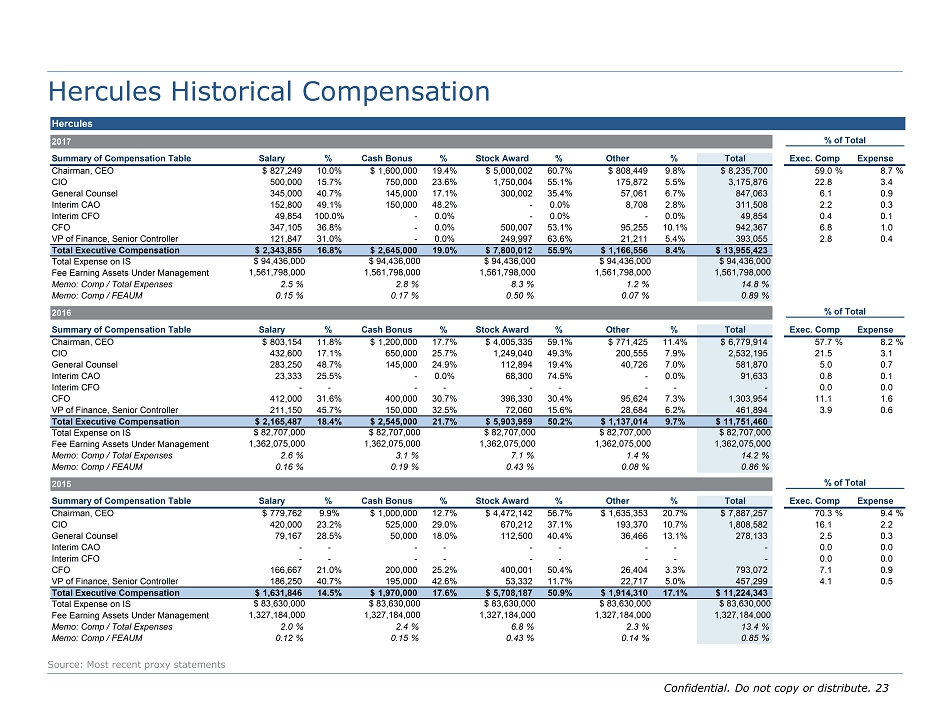
Confidential . Do not copy or distribute. 23 Hercules Historical Compensation Source: Most recent proxy statements Hercules 2017 % of Total Summary of Compensation Table Salary % Cash Bonus % Stock Award % Other % Total Exec. Comp Expense Chairman, CEO $827,249 10.0% $1,600,000 19.4% $5,000,002 60.7% $808,449 9.8% $8,235,700 59.0% 8.7% CIO 500,000 15.7% 750,000 23.6% 1,750,004 55.1% 175,872 5.5% 3,175,876 22.8 3.4 General Counsel 345,000 40.7% 145,000 17.1% 300,002 35.4% 57,061 6.7% 847,063 6.1 0.9 Interim CAO 152,800 49.1% 150,000 48.2% - 0.0% 8,708 2.8% 311,508 2.2 0.3 Interim CFO 49,854 100.0% - 0.0% - 0.0% - 0.0% 49,854 0.4 0.1 CFO 347,105 36.8% - 0.0% 500,007 53.1% 95,255 10.1% 942,367 6.8 1.0 VP of Finance, Senior Controller 121,847 31.0% - 0.0% 249,997 63.6% 21,211 5.4% 393,055 2.8 0.4 Total Executive Compensation $2,343,855 16.8% $2,645,000 19.0% $7,800,012 55.9% $1,166,556 8.4% $13,955,423 Total Expense on IS $ 94,436,000 $ 94,436,000 $ 94,436,000 $ 94,436,000 $ 94,436,000 Fee Earning Assets Under Management 1,561,798,000 1,561,798,000 1,561,798,000 1,561,798,000 1,561,798,000 Memo: Comp / Total Expenses 2.5% 2.8% 8.3% 1.2% 14.8% Memo: Comp / FEAUM 0.15% 0.17% 0.50% 0.07% 0.89% 2016 % of Total Summary of Compensation Table Salary % Cash Bonus % Stock Award % Other % Total Exec. Comp Expense Chairman, CEO $803,154 11.8% $1,200,000 17.7% $4,005,335 59.1% $771,425 11.4% $6,779,914 57.7% 8.2% CIO 432,600 17.1% 650,000 25.7% 1,249,040 49.3% 200,555 7.9% 2,532,195 21.5 3.1 General Counsel 283,250 48.7% 145,000 24.9% 112,894 19.4% 40,726 7.0% 581,870 5.0 0.7 Interim CAO 23,333 25.5% - 0.0% 68,300 74.5% - 0.0% 91,633 0.8 0.1 Interim CFO - - - - - - - - - 0.0 0.0 CFO 412,000 31.6% 400,000 30.7% 396,330 30.4% 95,624 7.3% 1,303,954 11.1 1.6 VP of Finance, Senior Controller 211,150 45.7% 150,000 32.5% 72,060 15.6% 28,684 6.2% 461,894 3.9 0.6 Total Executive Compensation $2,165,487 18.4% $2,545,000 21.7% $5,903,959 50.2% $1,137,014 9.7% $11,751,460 Total Expense on IS $ 82,707,000 $ 82,707,000 $ 82,707,000 $ 82,707,000 $ 82,707,000 Fee Earning Assets Under Management 1,362,075,000 1,362,075,000 1,362,075,000 1,362,075,000 1,362,075,000 Memo: Comp / Total Expenses 2.6% 3.1% 7.1% 1.4% 14.2% Memo: Comp / FEAUM 0.16% 0.19% 0.43% 0.08% 0.86% 2015 % of Total Summary of Compensation Table Salary % Cash Bonus % Stock Award % Other % Total Exec. Comp Expense Chairman, CEO $779,762 9.9% $1,000,000 12.7% $4,472,142 56.7% $1,635,353 20.7% $7,887,257 70.3% 9.4% CIO 420,000 23.2% 525,000 29.0% 670,212 37.1% 193,370 10.7% 1,808,582 16.1 2.2 General Counsel 79,167 28.5% 50,000 18.0% 112,500 40.4% 36,466 13.1% 278,133 2.5 0.3 Interim CAO - - - - - - - - - 0.0 0.0 Interim CFO - - - - - - - - - 0.0 0.0 CFO 166,667 21.0% 200,000 25.2% 400,001 50.4% 26,404 3.3% 793,072 7.1 0.9 VP of Finance, Senior Controller 186,250 40.7% 195,000 42.6% 53,332 11.7% 22,717 5.0% 457,299 4.1 0.5 Total Executive Compensation $1,631,846 14.5% $1,970,000 17.6% $5,708,187 50.9% $1,914,310 17.1% $11,224,343 Total Expense on IS $ 83,630,000 $ 83,630,000 $ 83,630,000 $ 83,630,000 $ 83,630,000 Fee Earning Assets Under Management 1,327,184,000 1,327,184,000 1,327,184,000 1,327,184,000 1,327,184,000 Memo: Comp / Total Expenses 2.0% 2.4% 6.8% 2.3% 13.4% Memo: Comp / FEAUM 0.12% 0.15% 0.43% 0.14% 0.85%