
I N V ESTO R P R ES E N TAT I O N March 11, 2016 Exhibit 99.1
2 FOWARD-LOOKING STATEMENTS AND NON-GAAP FINANCIAL MEASURES Certain statements contained in this Presentation constitute forward-looking statements as such term is defined in Section 27A of the Securities Act of 1933, as amended, and Section 21E of the Securities Exchange Act of 1934, as amended. Forward-looking statements are not guarantees of future performance. They represent our intentions, plans, expectations and beliefs and are subject to numerous assumptions, risks and uncertainties. Our future results, financial condition and business may differ materially from those expressed in these forward-looking statements. You can find many of these statements by looking for words such as “approximates,” “believes,” “expects,” “anticipates,” “estimates,” “intends,” “plans,” “would,” “may” or other similar expressions in this Presentation. Many of the factors that will determine the outcome of these and our other forward-looking statements are beyond our ability to control or predict; these factors include, among others, appropriate project and corporate-level cap rates, the Company’s ability to complete its active development and redevelopment projects within the timetable or estimated costs currently projected, the Company’s ability to undertake in the projects in its planned expansion and future redevelopment pipeline and the Company’s ability to achieve the estimated unleveraged returns for such projects. For further discussion of factors that could materially affect the outcome of our forward-looking statements, see “Risk Factors” involved in our Annual Report on Form 10-K for the year ended December 31, 2015, as amended. This presentation also contains non-GAAP financial measures, including but not limited to Recurring Funds from Operations, Funds from Operations, or FFO, and Net Operating Income, or NOI. Reconciliations of these non-GAAP financial measures to the most directly comparable GAAP measures can be found in our quarterly supplemental disclosure package and in filings made with the SEC which are available on our website at www.uedge.com.
3 INVESTMENT HIGHLIGHTS 1. High quality portfolio concentrated in the Washington, DC to Boston corridor with the New York Metropolitan Region representing two-thirds of total NOI • Weighted Average Population / Income (3 miles) 174,800 / $90,300(1) • Average Supermarket Sales PSF $739(2) • Average Base Rent PSF $19.45(3) 2. Embedded growth opportunities from redevelopment and anchor repositioning projects 3. Proven management team and experienced board 4. Strong balance sheet • 5.8x Net Debt to Adjusted EBITDA(4) • 28.9% Net Debt to Total Market Capitalization • Weighted average term of total debt of approximately 5.8 years(5) • Significant liquidity with $169 million of cash and full availability on $500 million line of credit(5) 5. Three year plan to increase Net Asset Value by $5–$6/share and to increase Recurring FFO to $1.45–$1.50/share in 2018(6) • Generate annual same property NOI growth of 2–3%(7) • Create $200–$300 million of value from redevelopment and repositioning 6. Long-term objective is to grow NAV and FFO by approximately 7% each year on a per share basis (1) Source: Sites USA, 2014E 3-mile ring; weighted by 2015 NOI (2) Based on the 12 reporting supermarkets with at least one full year of operations as of December 31, 2015. Excludes one grocer that has an executed lease termination agreement (3) Based on average annual rent PSF excluding warehouses, ground leased properties and storage (4) Based on TTM adjusted EBITDA and net debt as of December 31, 2015 (5) Data as of December 31, 2015 (6) Does not include any acquisition or disposition activity (7) Contractual rent increases of ~1.2% annually, signed leases where rent has not commenced, rent growth and higher recoveries Est. Est. % Est. Value Cost Yield Creation Status Active $123M 13% $163M Most projects have executed leases and are fully approved Pipeline $193M 8% $183M Planning, leasing and public process underway Total $316M 10% $346M Future $400M – $500M Planning
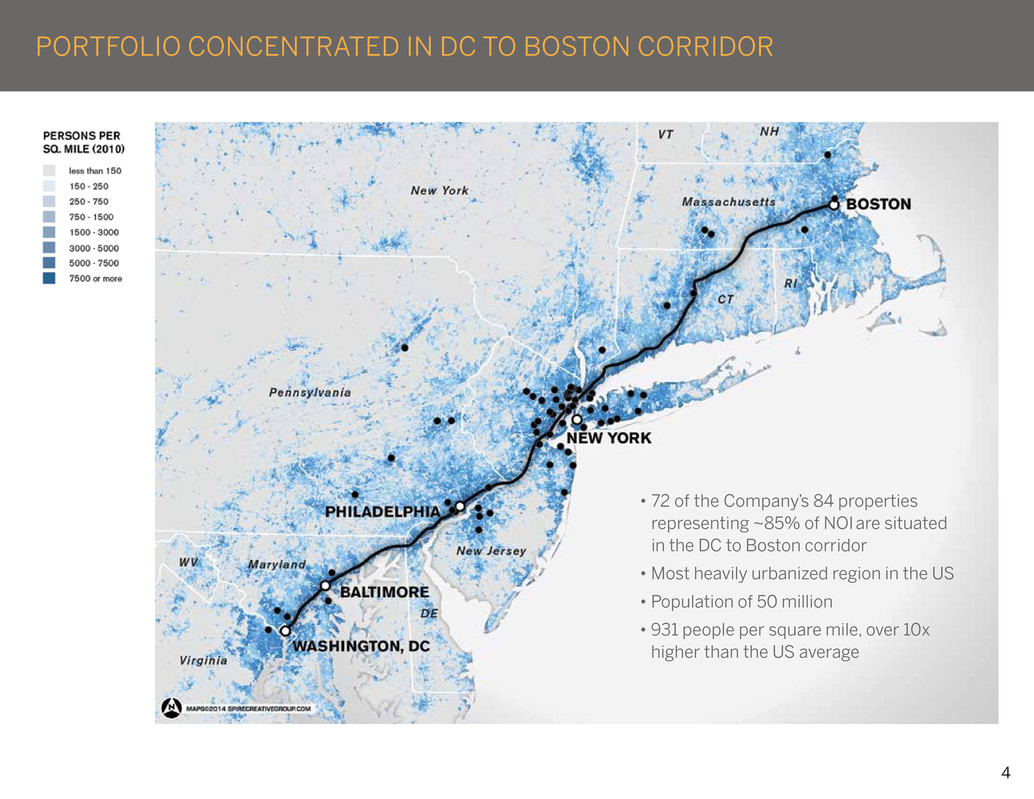
4 • 72 of the Company’s 84 properties representing ~85% of NOI are situated in the DC to Boston corridor • Most heavily urbanized region in the US • Population of 50 million • 931 people per square mile, over 10x higher than the US average PORTFOLIO CONCENTRATED IN DC TO BOSTON CORRIDOR
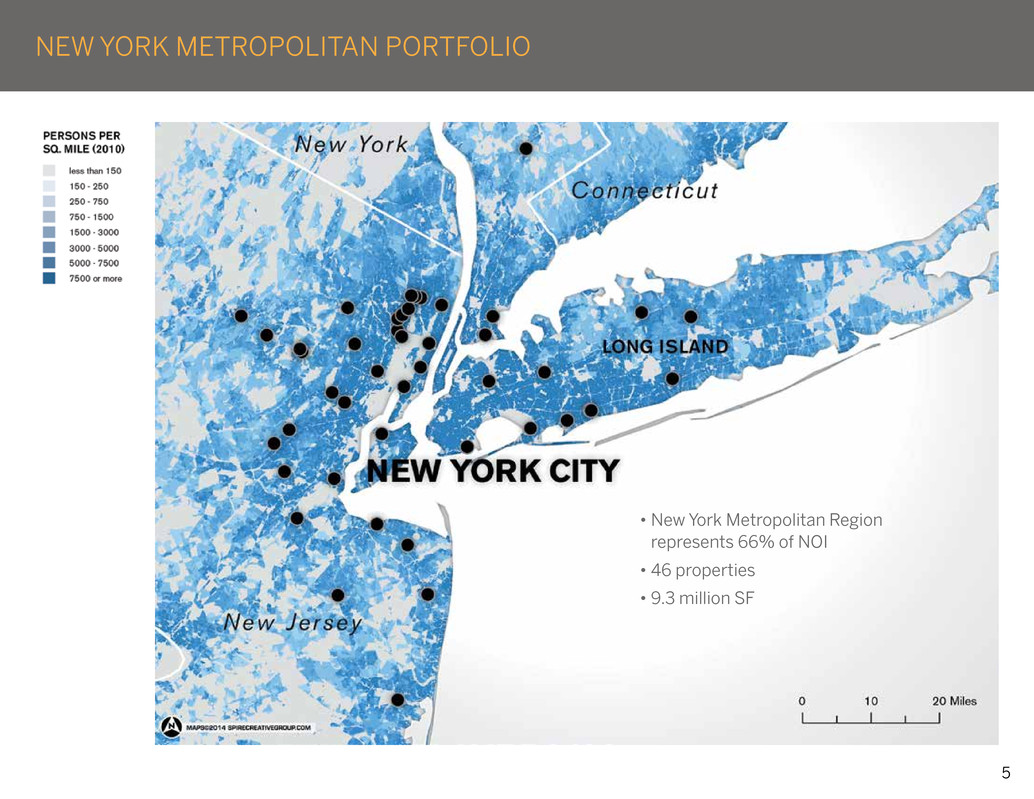
5 • New York Metropolitan Region represents 66% of NOI • 46 properties • 9.3 million SF NEW YORK METROPOLITAN PORTFOLIO
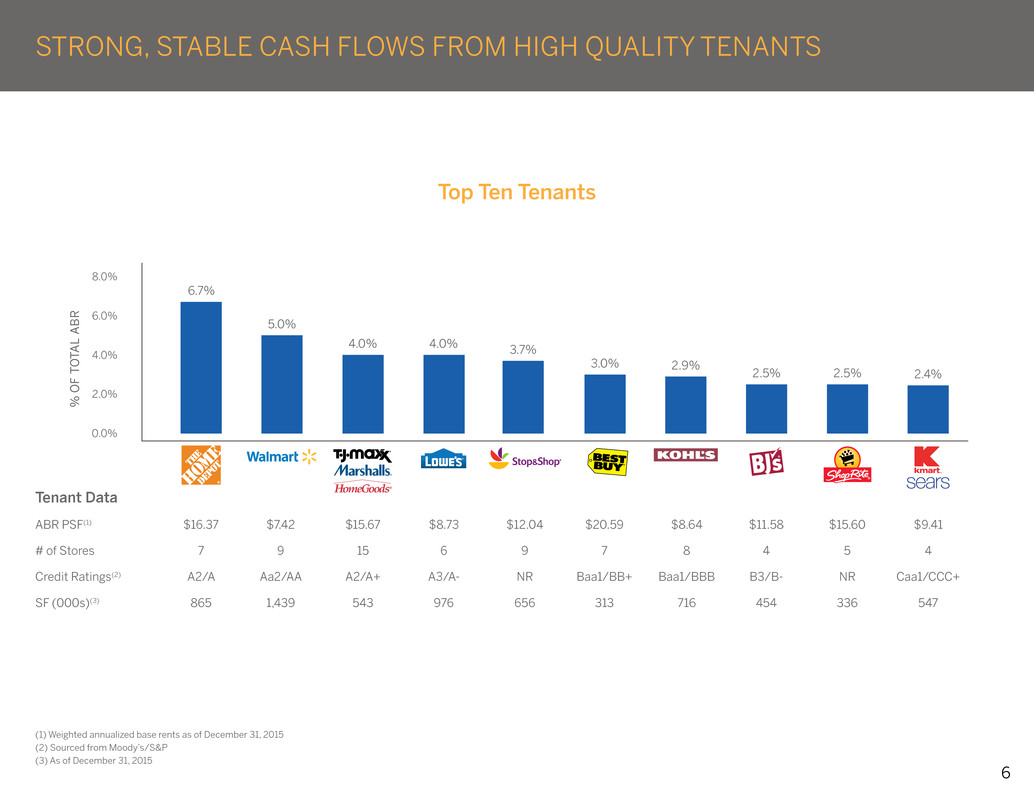
6 STRONG, STABLE CASH FLOWS FROM HIGH QUALITY TENANTS (1) Weighted annualized base rents as of December 31, 2015 (2) Sourced from Moody’s/S&P (3) As of December 31, 2015 Tenant Data ABR PSF(1) $16.37 $7.42 $15.67 $8.73 $12.04 $20.59 $8.64 $11.58 $15.60 $9.41 # of Stores 7 9 15 6 9 7 8 4 5 4 Credit Ratings(2) A2/A Aa2/AA A2/A+ A3/A- NR Baa1/BB+ Baa1/BBB B3/B- NR Caa1/CCC+ SF (000s)(3) 865 1,439 543 976 656 313 716 454 336 547 8.0% 6.0% 4.0% 2.0% 0.0% % O F TO TA L AB R 3.7%4.0%4.0% 5.0% 6.7% 2.9%3.0% 2.4%2.5%2.5% Top Ten Tenants
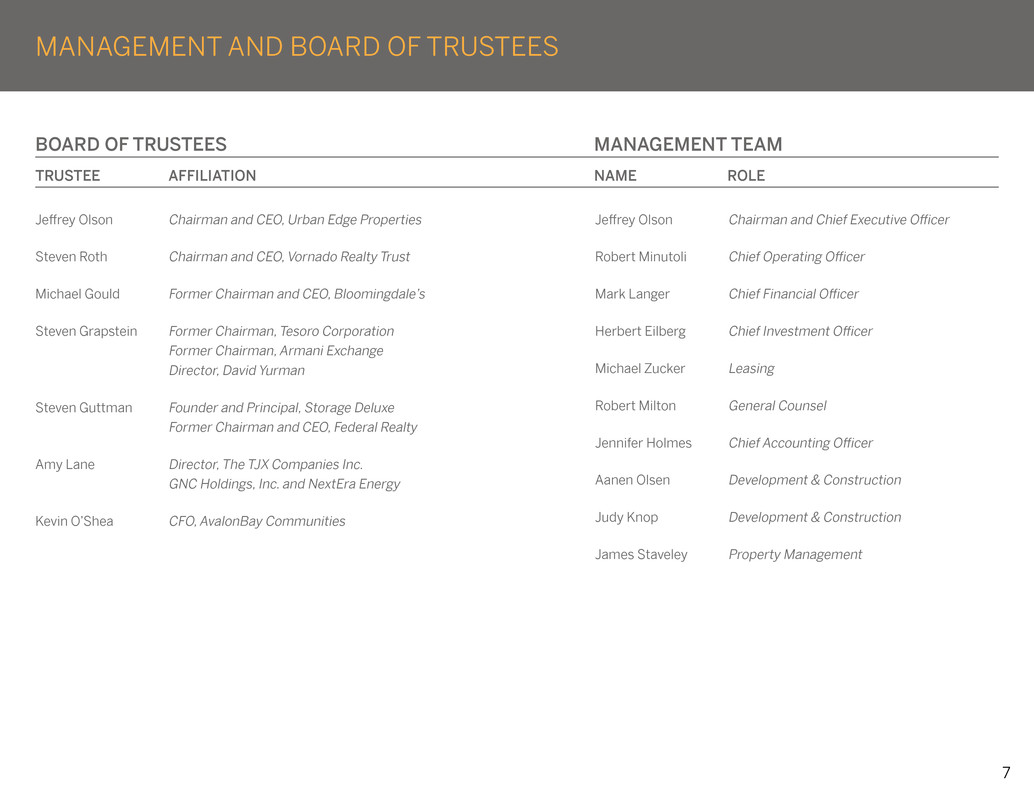
7 MANAGEMENT AND BOARD OF TRUSTEES Jeffrey Olson Chairman and CEO, Urban Edge Properties Steven Roth Chairman and CEO, Vornado Realty Trust Michael Gould Former Chairman and CEO, Bloomingdale’s Steven Grapstein Former Chairman, Tesoro Corporation Former Chairman, Armani Exchange Director, David Yurman Steven Guttman Founder and Principal, Storage Deluxe Former Chairman and CEO, Federal Realty Amy Lane Director, The TJX Companies Inc. GNC Holdings, Inc. and NextEra Energy Kevin O’Shea CFO, AvalonBay Communities Jeffrey Olson Chairman and Chief Executive Officer Robert Minutoli Chief Operating Officer Mark Langer Chief Financial Officer Herbert Eilberg Chief Investment Officer Michael Zucker Leasing Robert Milton General Counsel Jennifer Holmes Chief Accounting Officer Aanen Olsen Development & Construction Judy Knop Development & Construction James Staveley Property Management BOARD OF TRUSTEES MANAGEMENT TEAM TRUSTEE AFFILIATION NAME ROLE

8 $600 $500 $400 $300 $200 $100 $0 2016 $16 4.4%Weighted Average Interest Rate 2017 $17 4.4% 2018(2) $73 4.6% 2019 $17 4.4% 2020 $535 4.1% 2021 $120 4.7% 2022 $3 4.9% 2023 $303 3.6% 2024 $121 4.4% Thereafter $10 6.4% BALANCE SHEET: SIGNIFICANT LIQUIDITY, LOW LEVERAGE Key Leverage Metrics(1) Net Debt to Adjusted EBITDA 5.8x Adjusted EBITDA to Fixed Charges 2.6x Net Debt to Total Market Capitalization 28.9% Weighted Average Term to Maturity 5.8 years Debt Maturities ($ in millions) Balance Sheet Strategy Net Debt to Adjusted EBITDA <6.0x Adjusted EBITDA to Fixed Charges >2.5x Access to Multiple Sources of Capital Extending Average Debt Maturities Liquidity Cash at December 31, 2015 $169M Line of Credit Capacity $500M Total Liquidity $669M (1) As of December 31, 2015 (2) Excludes $10.8M pertaining to Englewood mortgage as asset is in final stages of foreclosure
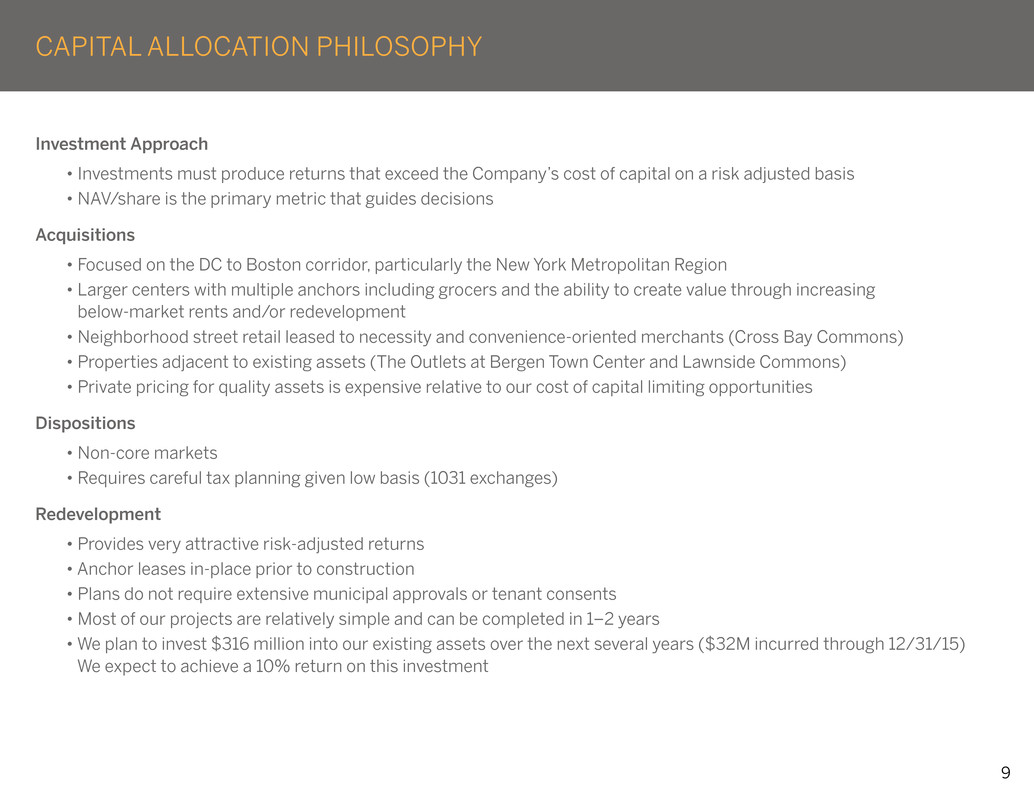
9 CAPITAL ALLOCATION PHILOSOPHY Investment Approach • Investments must produce returns that exceed the Company’s cost of capital on a risk adjusted basis • NAV/share is the primary metric that guides decisions Acquisitions • Focused on the DC to Boston corridor, particularly the New York Metropolitan Region • Larger centers with multiple anchors including grocers and the ability to create value through increasing below-market rents and/or redevelopment • Neighborhood street retail leased to necessity and convenience-oriented merchants (Cross Bay Commons) • Properties adjacent to existing assets (The Outlets at Bergen Town Center and Lawnside Commons) • Private pricing for quality assets is expensive relative to our cost of capital limiting opportunities Dispositions • Non-core markets • Requires careful tax planning given low basis (1031 exchanges) Redevelopment • Provides very attractive risk-adjusted returns • Anchor leases in-place prior to construction • Plans do not require extensive municipal approvals or tenant consents • Most of our projects are relatively simple and can be completed in 1–2 years • We plan to invest $316 million into our existing assets over the next several years ($32M incurred through 12/31/15) We expect to achieve a 10% return on this investment

10 DEVELOPMENT, REDEVELOPMENT AND ANCHOR REPOSITIONING PROJECTS ACTIVE PROJECTS Dollars in thousands Est. Gross Est. % Est. Value Est. Compl. Property Project Description Cost(1) Yield Creation(2) Year(1) Leasing Status(3) Hackensack Commons Retenanting vacant grocer (59K sf) and $4,500 47% $36,300 2017 99 Ranch executed (79%) 15K sf of shops (74K sf leasing workload) East Hanover Warehouse Renovating and retenanting 24,000 11% 21,700 2016 62% executed (518K sf leasing workload) Bruckner Commons Renovating and retenanting 38,400 8% 20,400 2018 ShopRite LOI (37%) (130K sf leasing workload) Freeport Commons Home Depot renewing (100K sf) and 500 186% 18,100 2017/2021 Executed expanding (55K sf) Walnut Creek (Olympic Blvd.) Anthropologie replacing 4,400 20% 16,600 2016 Executed Barnes & Noble (31K sf) Outlets at Montehiedra Converting to outlet/value hybrid 20,800 13% 16,300 2017 52% executed (117K sf leasing workload) West End Commons Adding La-Z-Boy and 20K+/- sf 8,900 13% 13,500 2017 38% executed (La-Z-Boy) of shop space (33K sf leasing workload) 38% in lease negotiation Garfield Commons Adding Burlington Coat, PetSmart 18,800 8% 9,900 2017 Burlington and and 17K+/- sf of shop space PetSmart executed (80%) (85K sf leasing workload) Walnut Creek (Mt. Diablo Road) Z Gallerie replacing Anthropologie 600 47% 6,200 2017 Executed (7K sf) East Hanover REI Adding Panera Bread (5K sf) 500 45% 2,200 2016 Open Rockaway River Commons Adding Popeyes (3K sf) 100 94% 1,300 2017 Executed on approved pad Governors Commons Adding restaurant pad for 1,300 9% 500 2017 Executed Bubba’s 33 (9K sf) TOTAL $122,800 13% $163,000 (1) Estimated completion year and potential investment are subject to change resulting from uncertainties inherent in the development process and not wholly under the Company’s control (2) Estimates the impact on net asset value by dividing the incremental NOI from the projects by the capitalization rate estimated to apply upon completion of the project and subtracting all project costs necessary to achieve the projected NOI (3) Leasing status reflects the % of redevelopment project GLA that is leased or under letter of intent
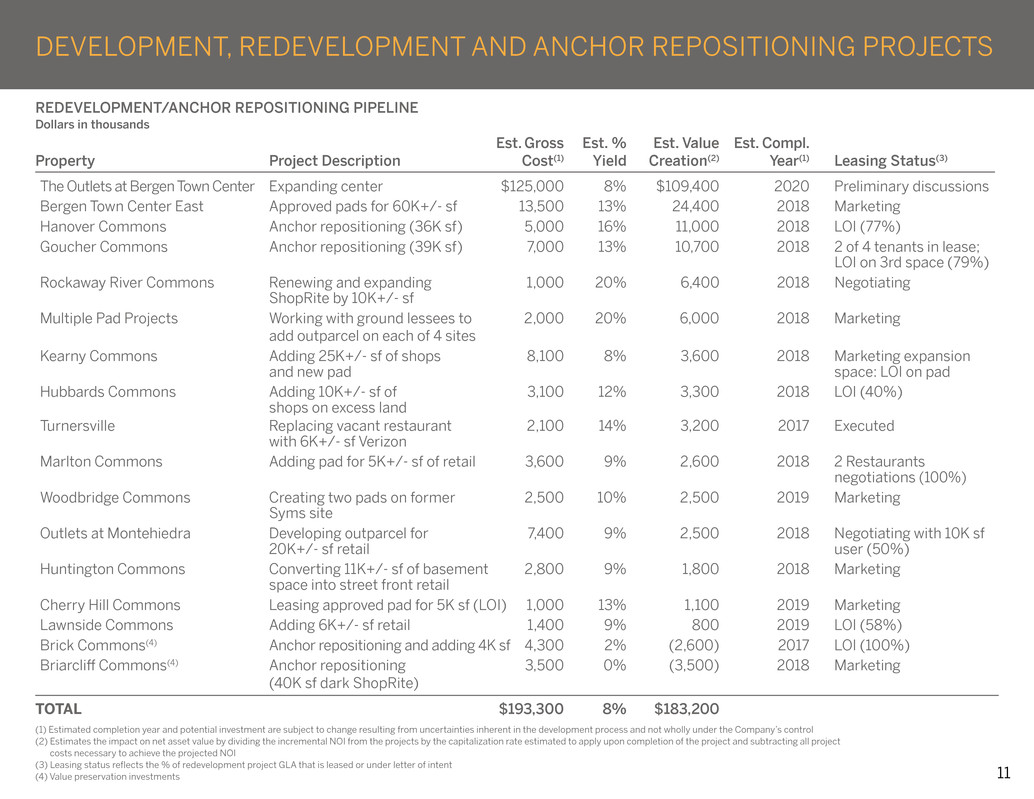
11 DEVELOPMENT, REDEVELOPMENT AND ANCHOR REPOSITIONING PROJECTS REDEVELOPMENT/ANCHOR REPOSITIONING PIPELINE Dollars in thousands Est. Gross Est. % Est. Value Est. Compl. Property Project Description Cost(1) Yield Creation(2) Year(1) Leasing Status(3) The Outlets at Bergen Town Center Expanding center $125,000 8% $109,400 2020 Preliminary discussions Bergen Town Center East Approved pads for 60K+/- sf 13,500 13% 24,400 2018 Marketing Hanover Commons Anchor repositioning (36K sf) 5,000 16% 11,000 2018 LOI (77%) Goucher Commons Anchor repositioning (39K sf) 7,000 13% 10,700 2018 2 of 4 tenants in lease; LOI on 3rd space (79%) Rockaway River Commons Renewing and expanding 1,000 20% 6,400 2018 Negotiating ShopRite by 10K+/- sf Multiple Pad Projects Working with ground lessees to 2,000 20% 6,000 2018 Marketing add outparcel on each of 4 sites Kearny Commons Adding 25K+/- sf of shops 8,100 8% 3,600 2018 Marketing expansion and new pad space: LOI on pad Hubbards Commons Adding 10K+/- sf of 3,100 12% 3,300 2018 LOI (40%) shops on excess land Turnersville Replacing vacant restaurant 2,100 14% 3,200 2017 Executed with 6K+/- sf Verizon Marlton Commons Adding pad for 5K+/- sf of retail 3,600 9% 2,600 2018 2 Restaurants negotiations (100%) Woodbridge Commons Creating two pads on former 2,500 10% 2,500 2019 Marketing Syms site Outlets at Montehiedra Developing outparcel for 7,400 9% 2,500 2018 Negotiating with 10K sf 20K+/- sf retail user (50%) Huntington Commons Converting 11K+/- sf of basement 2,800 9% 1,800 2018 Marketing space into street front retail Cherry Hill Commons Leasing approved pad for 5K sf (LOI) 1,000 13% 1,100 2019 Marketing Lawnside Commons Adding 6K+/- sf retail 1,400 9% 800 2019 LOI (58%) Brick Commons(4) Anchor repositioning and adding 4K sf 4,300 2% (2,600) 2017 LOI (100%) Briarcliff Commons(4) Anchor repositioning 3,500 0% (3,500) 2018 Marketing (40K sf dark ShopRite) TOTAL $193,300 8% $183,200 (1) Estimated completion year and potential investment are subject to change resulting from uncertainties inherent in the development process and not wholly under the Company’s control (2) Estimates the impact on net asset value by dividing the incremental NOI from the projects by the capitalization rate estimated to apply upon completion of the project and subtracting all project costs necessary to achieve the projected NOI (3) Leasing status reflects the % of redevelopment project GLA that is leased or under letter of intent (4) Value preservation investments
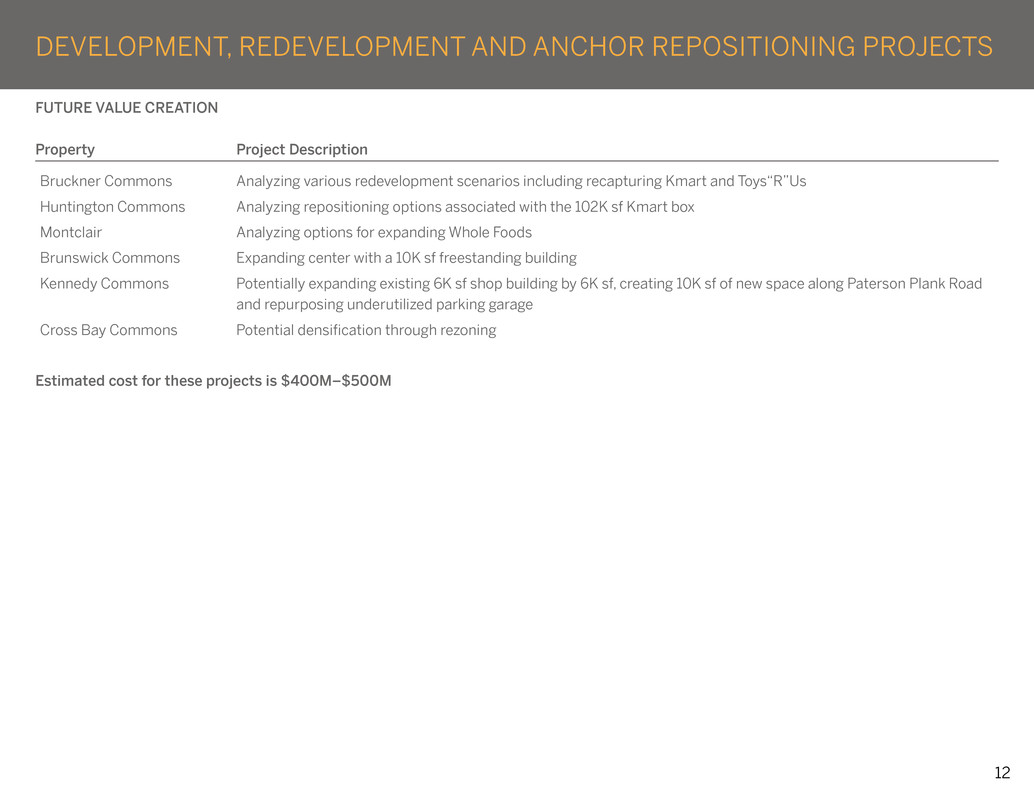
12 DEVELOPMENT, REDEVELOPMENT AND ANCHOR REPOSITIONING PROJECTS FUTURE VALUE CREATION Property Project Description Bruckner Commons Analyzing various redevelopment scenarios including recapturing Kmart and Toys“R”Us Huntington Commons Analyzing repositioning options associated with the 102K sf Kmart box Montclair Analyzing options for expanding Whole Foods Brunswick Commons Expanding center with a 10K sf freestanding building Kennedy Commons Potentially expanding existing 6K sf shop building by 6K sf, creating 10K sf of new space along Paterson Plank Road and repurposing underutilized parking garage Cross Bay Commons Potential densification through rezoning Estimated cost for these projects is $400M–$500M

ACT I V E
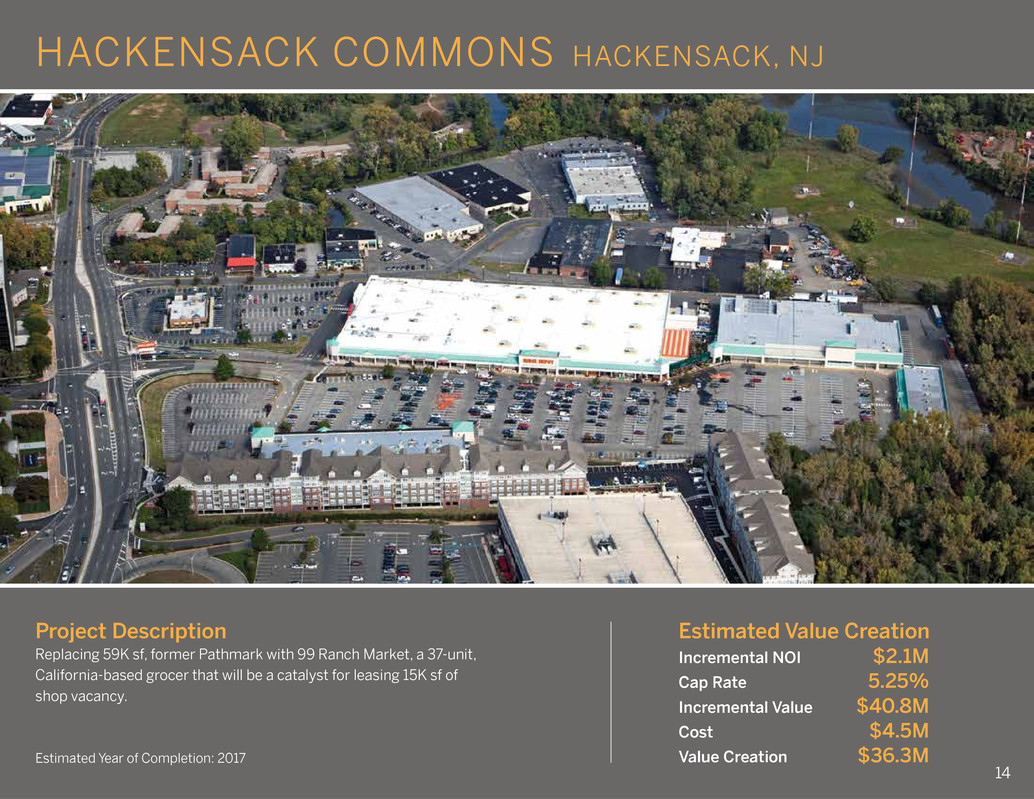
14 Estimated Year of Completion: 2017 Estimated Value Creation Incremental NOI $2.1M Cap Rate 5.25% Incremental Value $40.8M Cost $4.5M Value Creation $36.3M Project Description Replacing 59K sf, former Pathmark with 99 Ranch Market, a 37-unit, California-based grocer that will be a catalyst for leasing 15K sf of shop vacancy. HACKENSACK COMMONS HACKENSACK, NJ
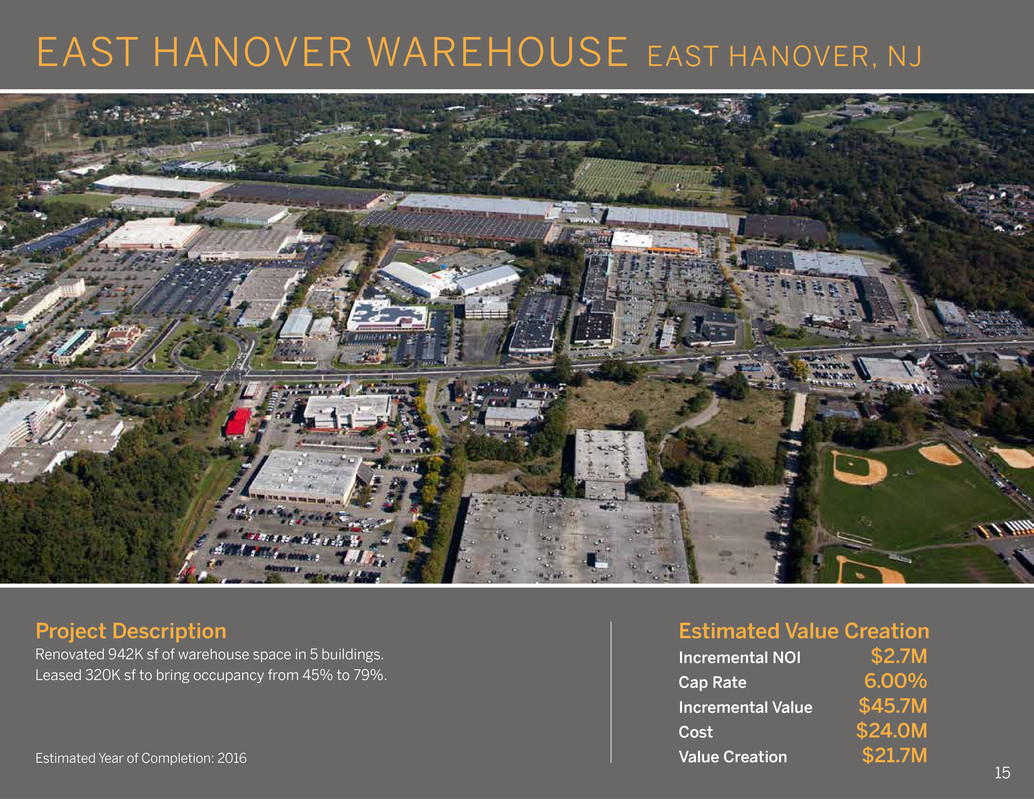
15 Estimated Year of Completion: 2016 Estimated Value Creation Incremental NOI $2.7M Cap Rate 6.00% Incremental Value $45.7M Cost $24.0M Value Creation $21.7M Project Description Renovated 942K sf of warehouse space in 5 buildings. Leased 320K sf to bring occupancy from 45% to 79%. EAST HANOVER WAREHOUSE EAST HANOVER, NJ

16 Estimated Year of Completion: 2018 (1) 2016 NOI is expected to decrease by $2.5M due to tenant closures during redevelopment. Incremental NOI is based on future stabilized NOI before redevelopment started Estimated Value Creation Incremental NOI(1) $2.9M Cap Rate 5.00% Incremental Value $58.7M Cost $38.4M Value Creation $20.4M Project Description Substantially renovating and releasing three buildings comprising 107K sf of retail and 50K sf of second level office space. LOI in place with ShopRite to take the former Key Food building as the chain’s first unit in the Bronx. BRUCKNER COMMONS BRONX, NY
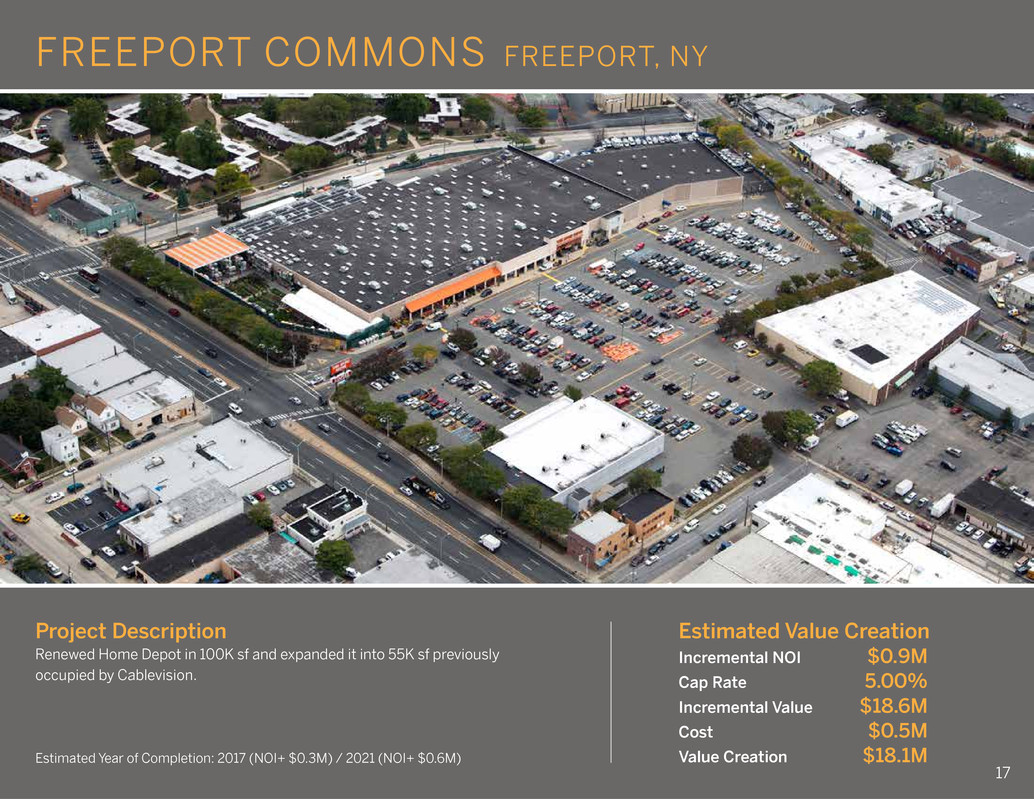
17 Estimated Year of Completion: 2017 (NOI+ $0.3M) / 2021 (NOI+ $0.6M) Estimated Value Creation Incremental NOI $0.9M Cap Rate 5.00% Incremental Value $18.6M Cost $0.5M Value Creation $18.1M Project Description Renewed Home Depot in 100K sf and expanded it into 55K sf previously occupied by Cablevision. FREEPORT COMMONS FREEPORT, NY
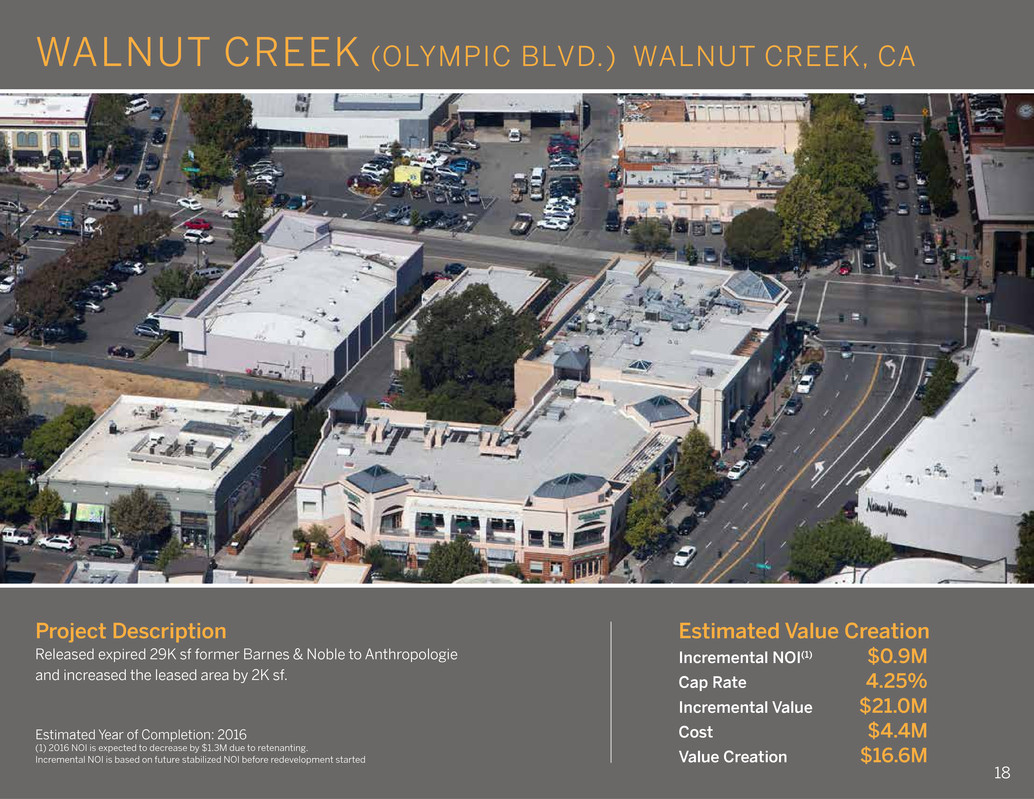
Estimated Year of Completion: 2016 (1) 2016 NOI is expected to decrease by $1.3M due to retenanting. Incremental NOI is based on future stabilized NOI before redevelopment started Estimated Value Creation Incremental NOI(1) $0.9M Cap Rate 4.25% Incremental Value $21.0M Cost $4.4M Value Creation $16.6M Project Description Released expired 29K sf former Barnes & Noble to Anthropologie and increased the leased area by 2K sf. WALNUT CREEK (OLYMPIC BLVD.) WALNUT CREEK, CA 18
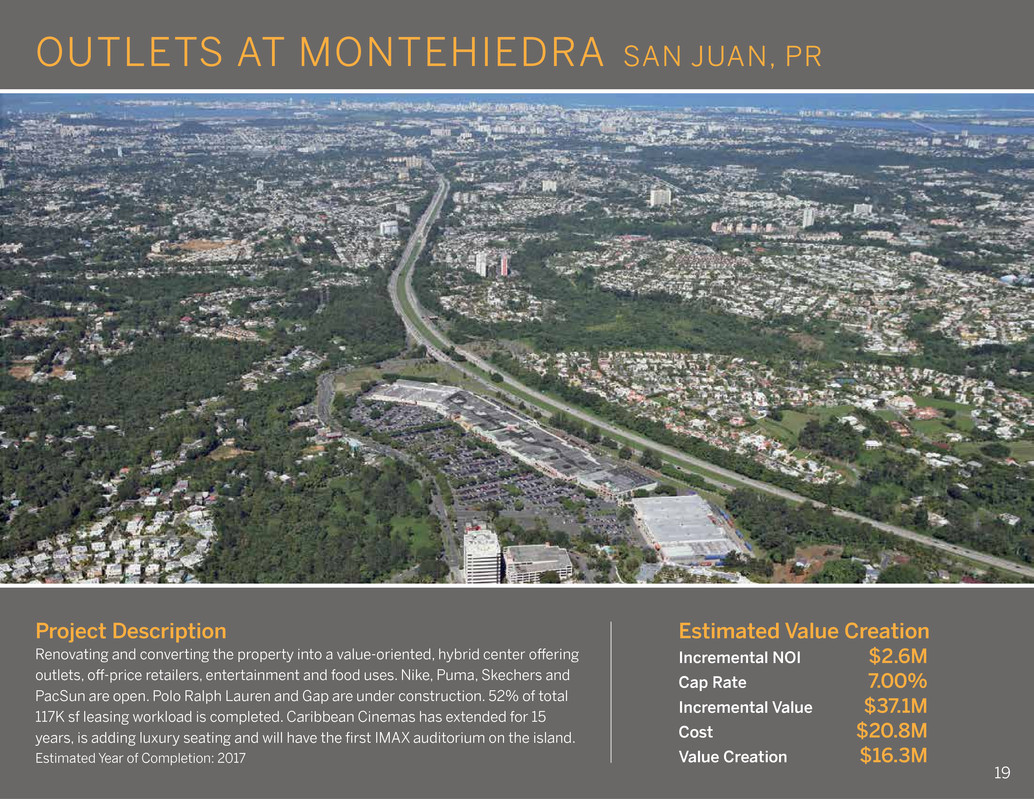
19 Estimated Year of Completion: 2017 Estimated Value Creation Incremental NOI $2.6M Cap Rate 7.00% Incremental Value $37.1M Cost $20.8M Value Creation $16.3M Project Description Renovating and converting the property into a value-oriented, hybrid center offering outlets, off-price retailers, entertainment and food uses. Nike, Puma, Skechers and PacSun are open. Polo Ralph Lauren and Gap are under construction. 52% of total 117K sf leasing workload is completed. Caribbean Cinemas has extended for 15 years, is adding luxury seating and will have the first IMAX auditorium on the island. OUTLETS AT MONTEHIEDRA SAN JUAN, PR
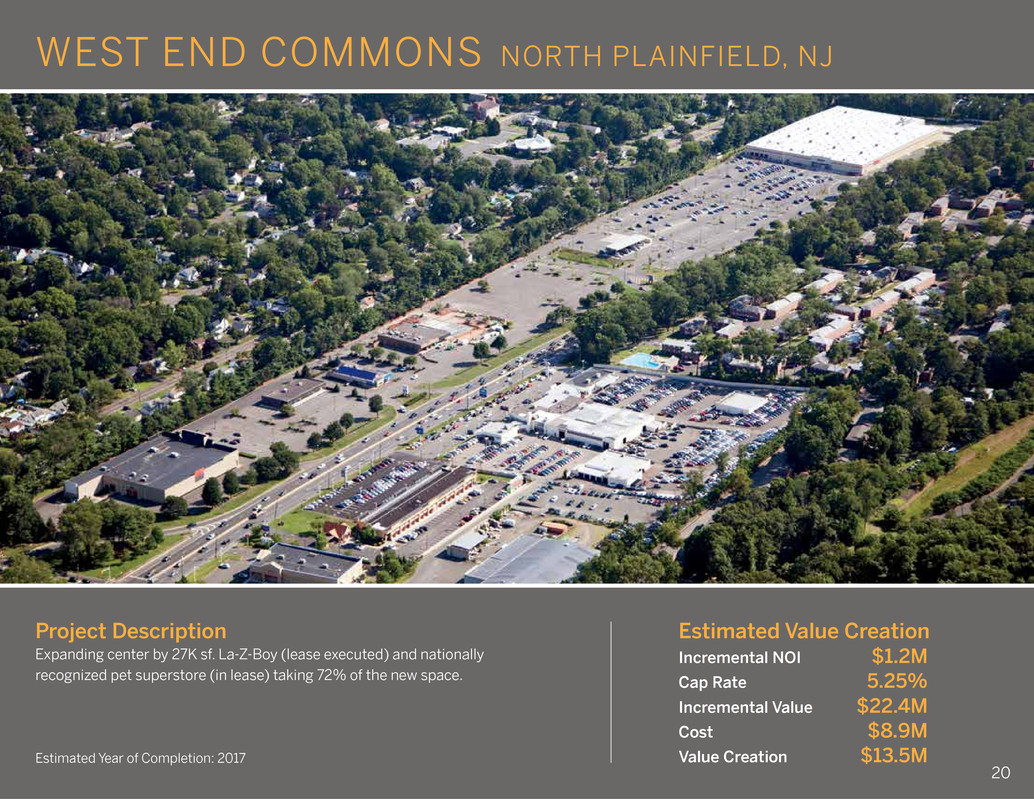
20 Estimated Year of Completion: 2017 Estimated Value Creation Incremental NOI $1.2M Cap Rate 5.25% Incremental Value $22.4M Cost $8.9M Value Creation $13.5M Project Description Expanding center by 27K sf. La-Z-Boy (lease executed) and nationally recognized pet superstore (in lease) taking 72% of the new space. WEST END COMMONS NORTH PLAINFIELD, NJ
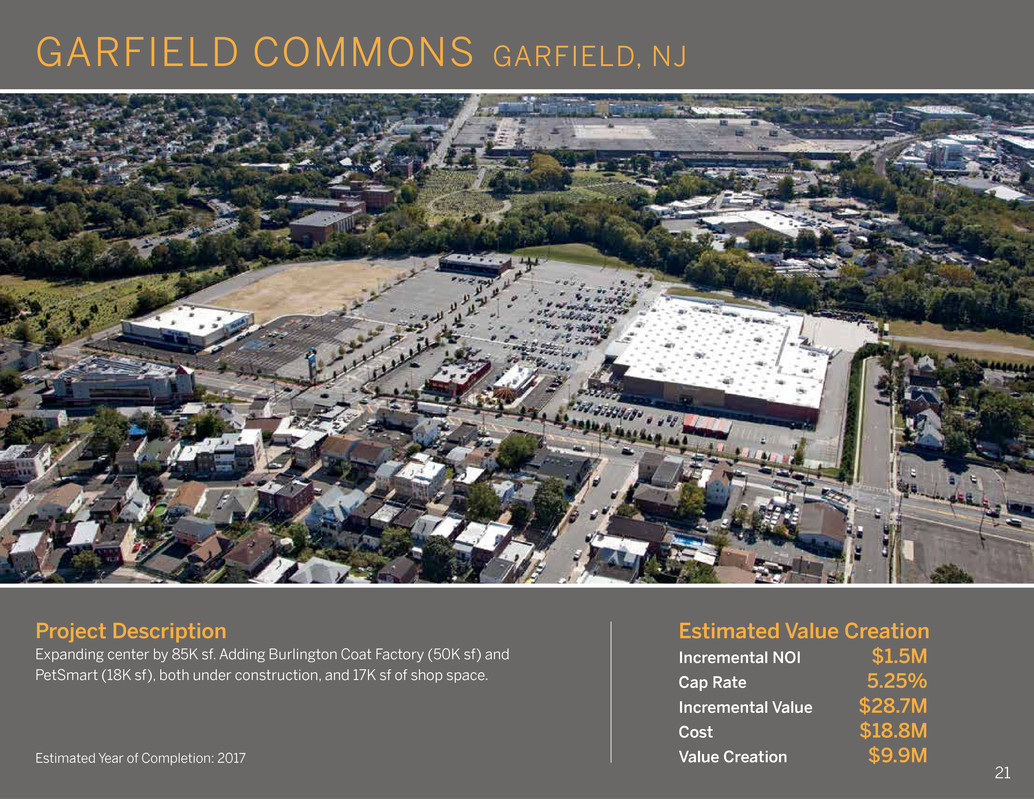
21 Estimated Year of Completion: 2017 Estimated Value Creation Incremental NOI $1.5M Cap Rate 5.25% Incremental Value $28.7M Cost $18.8M Value Creation $9.9M Project Description Expanding center by 85K sf. Adding Burlington Coat Factory (50K sf) and PetSmart (18K sf), both under construction, and 17K sf of shop space. GARFIELD COMMONS GARFIELD, NJ
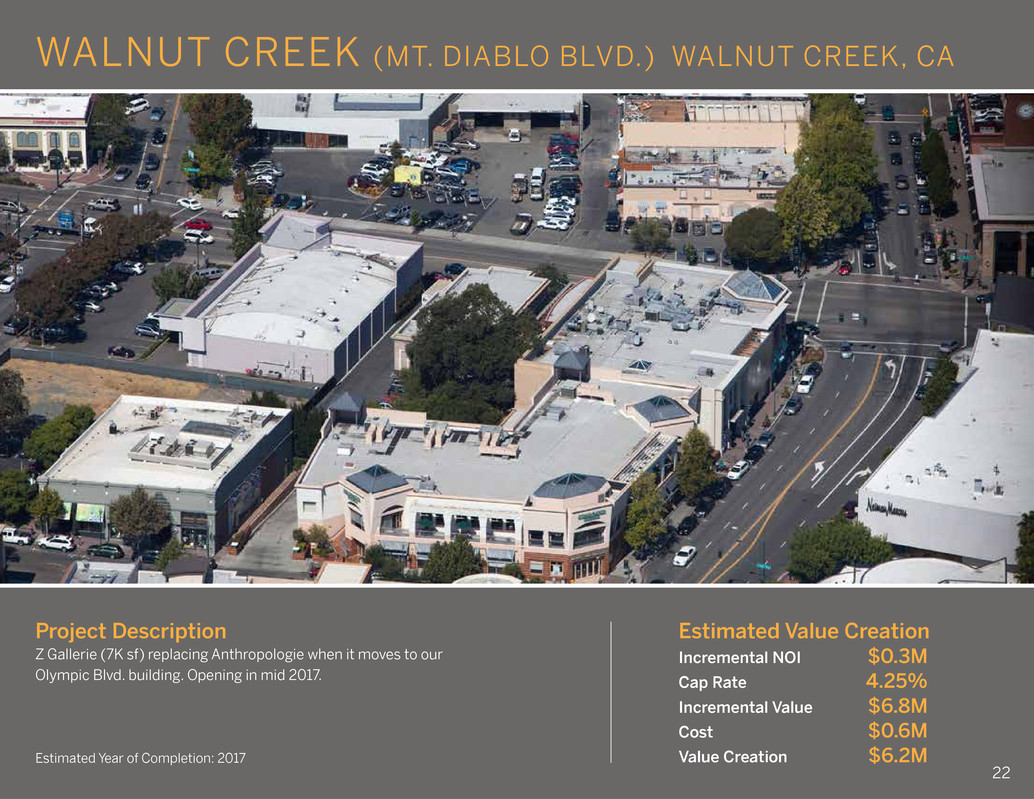
222 Estimated Year of Completion: 2017 Estimated Value Creation Incremental NOI $0.3M Cap Rate 4.25% Incremental Value $6.8M Cost $0.6M Value Creation $6.2M Project Description Z Gallerie (7K sf) replacing Anthropologie when it moves to our Olympic Blvd. building. Opening in mid 2017. WALNUT CREEK (MT. DIABLO BLVD.) WALNUT CREEK, CA
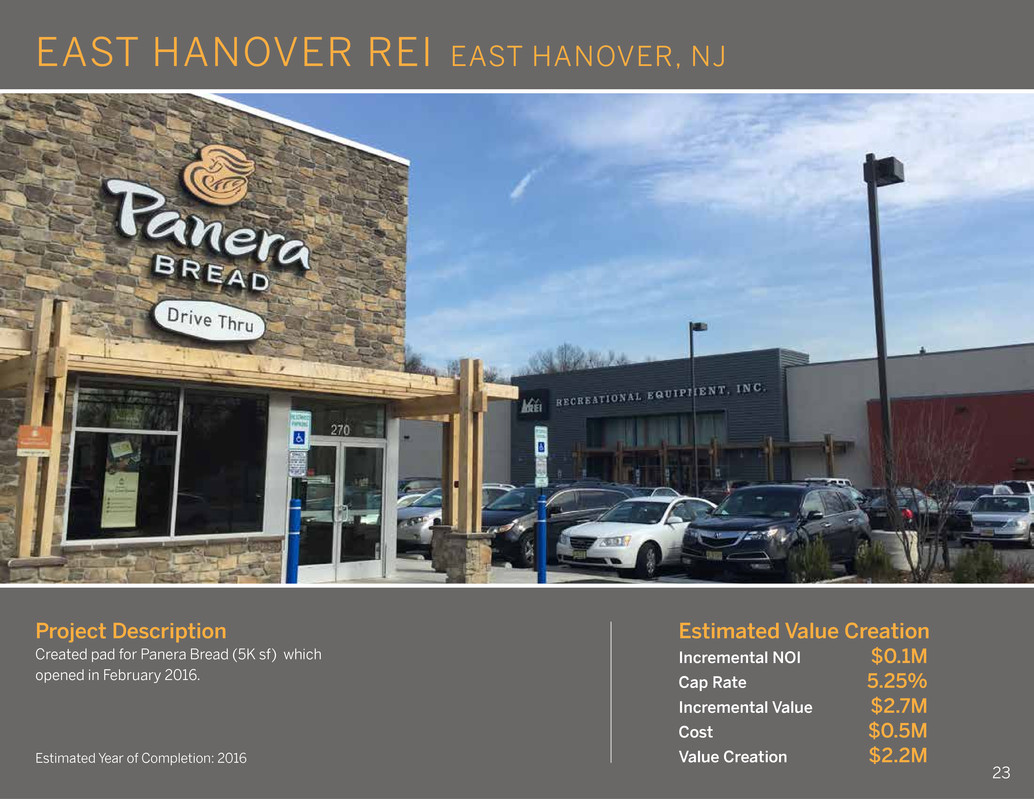
23 Estimated Year of Completion: 2016 Estimated Value Creation Incremental NOI $0.1M Cap Rate 5.25% Incremental Value $2.7M Cost $0.5M Value Creation $2.2M Project Description Created pad for Panera Bread (5K sf) which opened in February 2016. EAST HANOVER REI EAST HANOVER, NJ
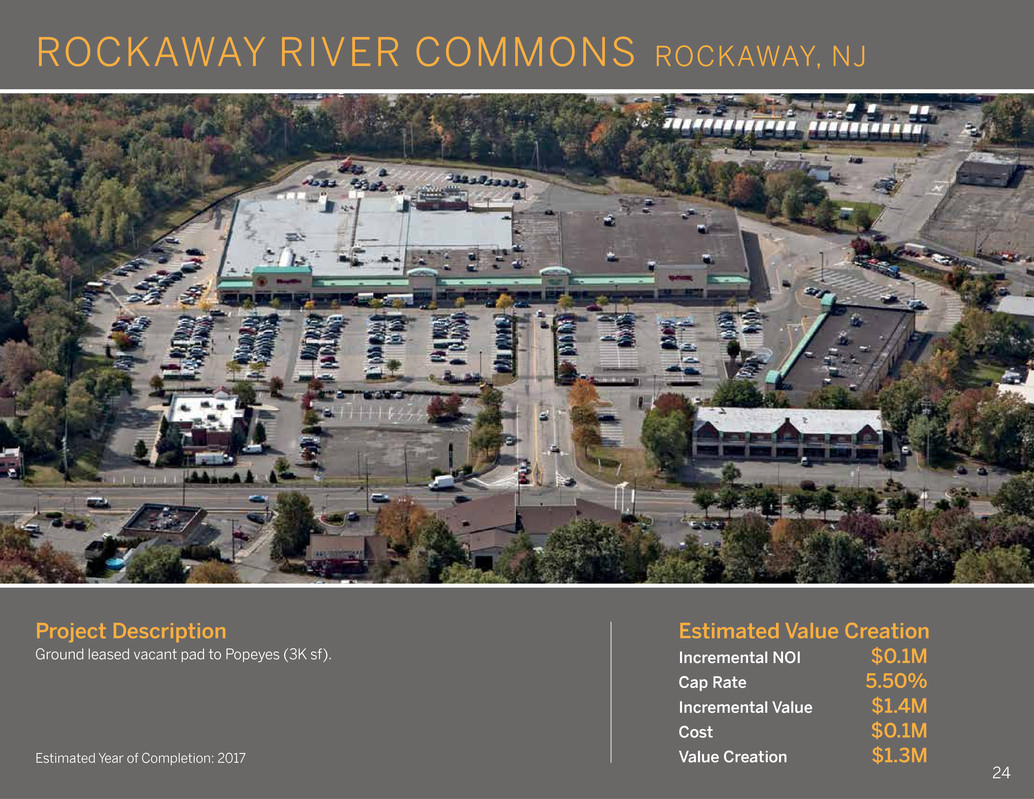
24 Estimated Year of Completion: 2017 Estimated Value Creation Incremental NOI $0.1M Cap Rate 5.50% Incremental Value $1.4M Cost $0.1M Value Creation $1.3M Project Description Ground leased vacant pad to Popeyes (3K sf). ROCKAWAY RIVER COMMONS ROCKAWAY, NJ
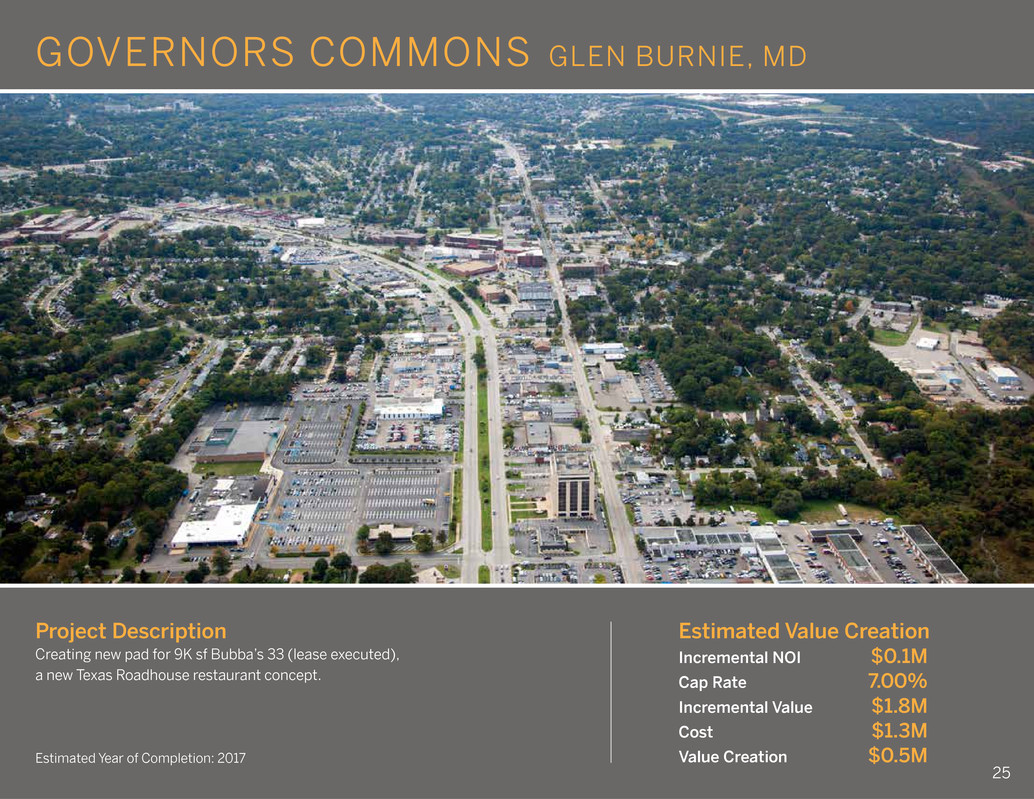
25 Estimated Year of Completion: 2017 Estimated Value Creation Incremental NOI $0.1M Cap Rate 7.00% Incremental Value $1.8M Cost $1.3M Value Creation $0.5M Project Description Creating new pad for 9K sf Bubba’s 33 (lease executed), a new Texas Roadhouse restaurant concept. GOVERNORS COMMONS GLEN BURNIE, MD

P I P E L I N E

Estimated Year of Completion: 2020 Estimated Value Creation Incremental NOI $9.4M Cap Rate 4.00% Incremental Value $234.4M Cost $125.0M Value Creation $109.4M Project Description Expanding center to capture continuing demand for space from outlets, off-price retailers and food uses. THE OUTLETS AT BERGEN TOWN CENTER PARAMUS, NJ 27
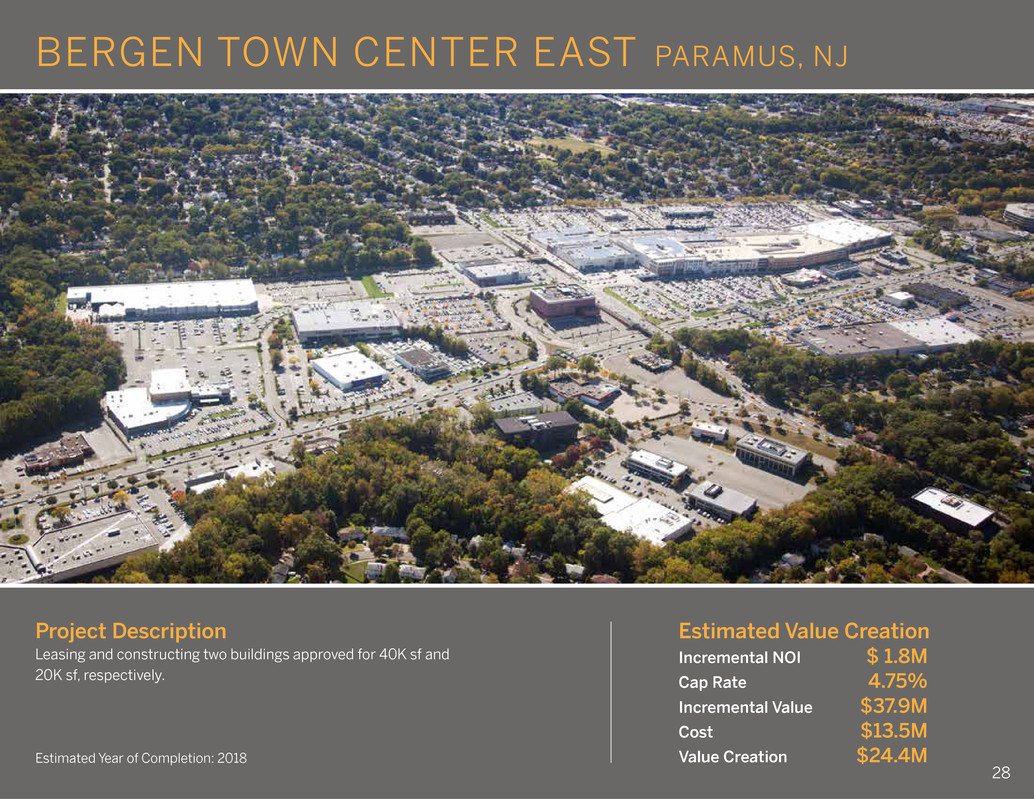
28 BERGEN TOWN CENTER EAST PARAMUS, NJ Project Description Leasing and constructing two buildings approved for 40K sf and 20K sf, respectively. Estimated Value Creation Incremental NOI $ 1.8M Cap Rate 4.75% Incremental Value $37.9M Cost $13.5M Value Creation $24.4MEstimated Year of Completion: 2018 28
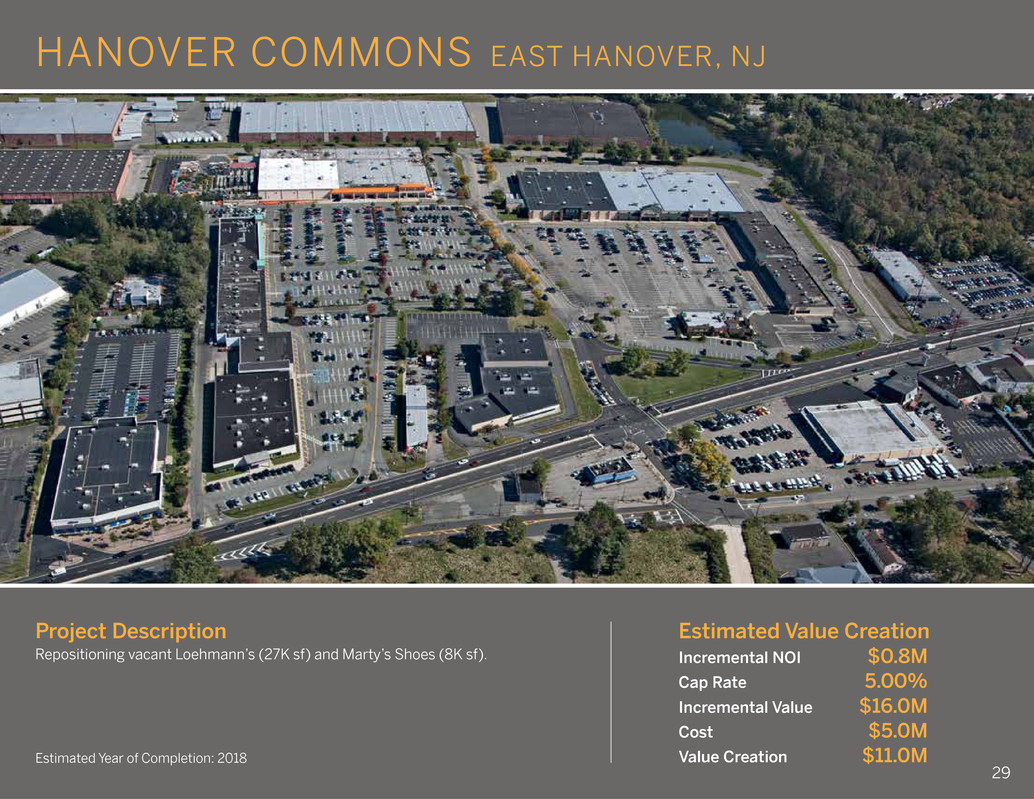
HANOVER COMMONS EAST HANOVER, NJ Project Description Repositioning vacant Loehmann’s (27K sf) and Marty’s Shoes (8K sf). Estimated Value Creation Incremental NOI $0.8M Cap Rate 5.00% Incremental Value $16.0M Cost $5.0M Value Creation $11.0MEstimated Year of Completion: 2018 29
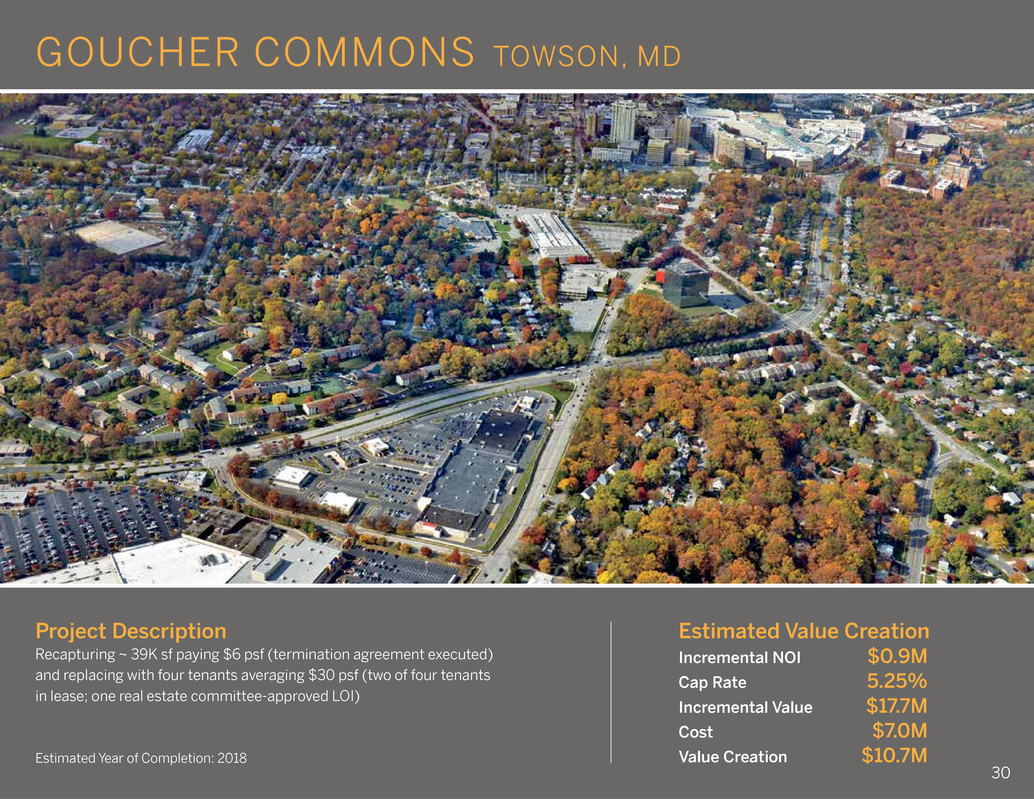
30 Estimated Year of Completion: 2018 Estimated Value Creation Incremental NOI $0.9M Cap Rate 5.25% Incremental Value $17.7M Cost $7.0M Value Creation $10.7M Project Description Recapturing ~ 39K sf paying $6 psf (termination agreement executed) and replacing with four tenants averaging $30 psf (two of four tenants in lease; one real estate committee-approved LOI) GOUCHER COMMONS TOWSON, MD

31 Estimated Year of Completion: 2018 Estimated Value Creation Incremental NOI $0.4M Cap Rate 5.50% Incremental Value $7.4M Cost $1.0M Value Creation $6.4M Project Description Negotiating existing ShopRite renewal and expansion by 10K sf. ROCKAWAY RIVER COMMONS ROCKAWAY, NJ
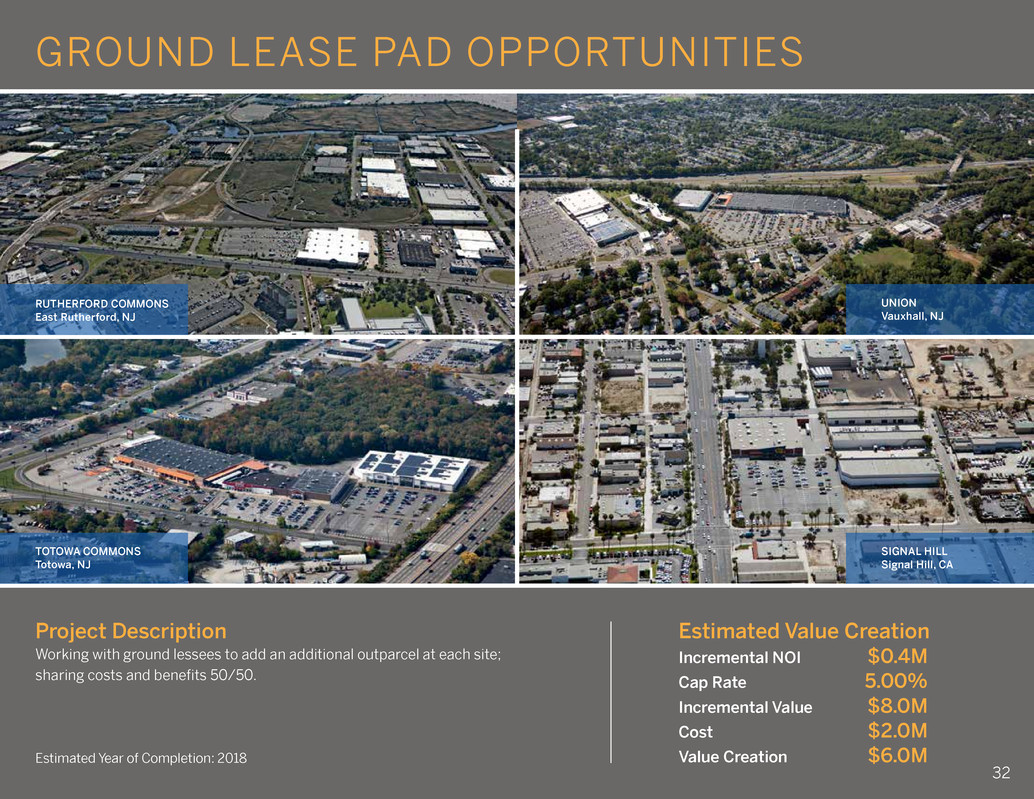
32 Estimated Year of Completion: 2018 Estimated Value Creation Incremental NOI $0.4M Cap Rate 5.00% Incremental Value $8.0M Cost $2.0M Value Creation $6.0M Project Description Working with ground lessees to add an additional outparcel at each site; sharing costs and benefits 50/50. TOTOWA COMMONS Totowa, NJ RUTHERFORD COMMONS East Rutherford, NJ SIGNAL HILL Signal Hill, CA UNION Vauxhall, NJ GROUND LEASE PAD OPPORTUNITIES
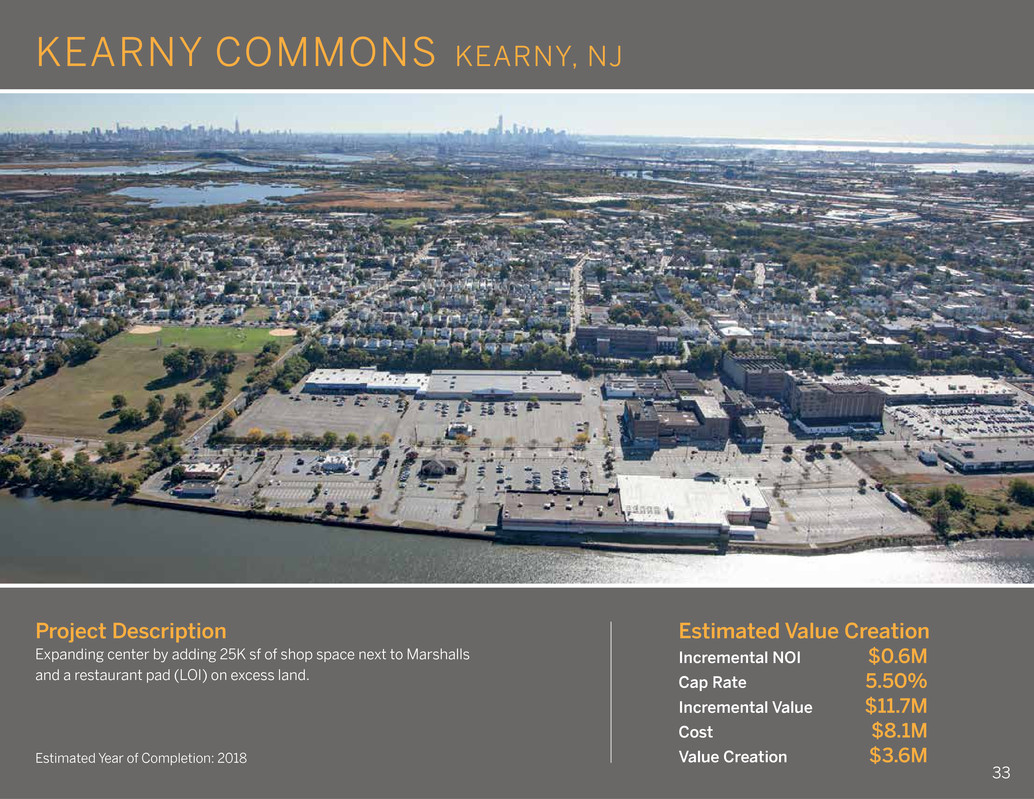
33 Estimated Year of Completion: 2018 Estimated Value Creation Incremental NOI $0.6M Cap Rate 5.50% Incremental Value $11.7M Cost $8.1M Value Creation $3.6M Project Description Expanding center by adding 25K sf of shop space next to Marshalls and a restaurant pad (LOI) on excess land. KEARNY COMMONS KEARNY, NJ
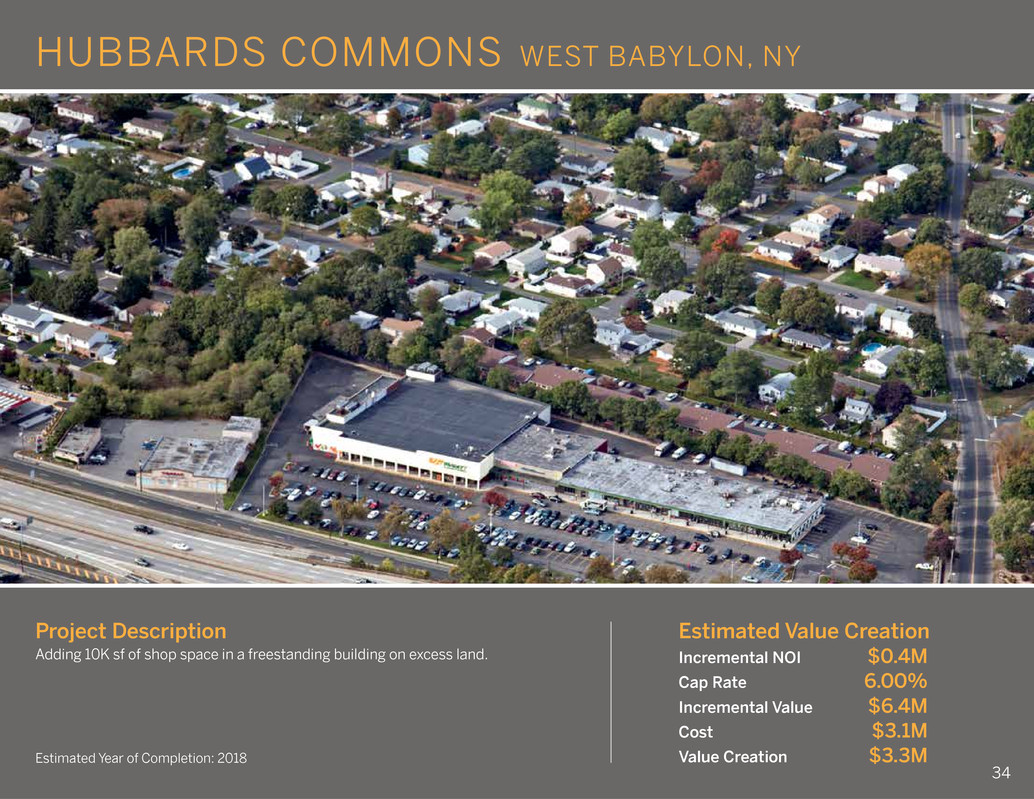
34 Estimated Year of Completion: 2018 Estimated Value Creation Incremental NOI $0.4M Cap Rate 6.00% Incremental Value $6.4M Cost $3.1M Value Creation $3.3M Project Description Adding 10K sf of shop space in a freestanding building on excess land. HUBBARDS COMMONS WEST BABYLON, NY
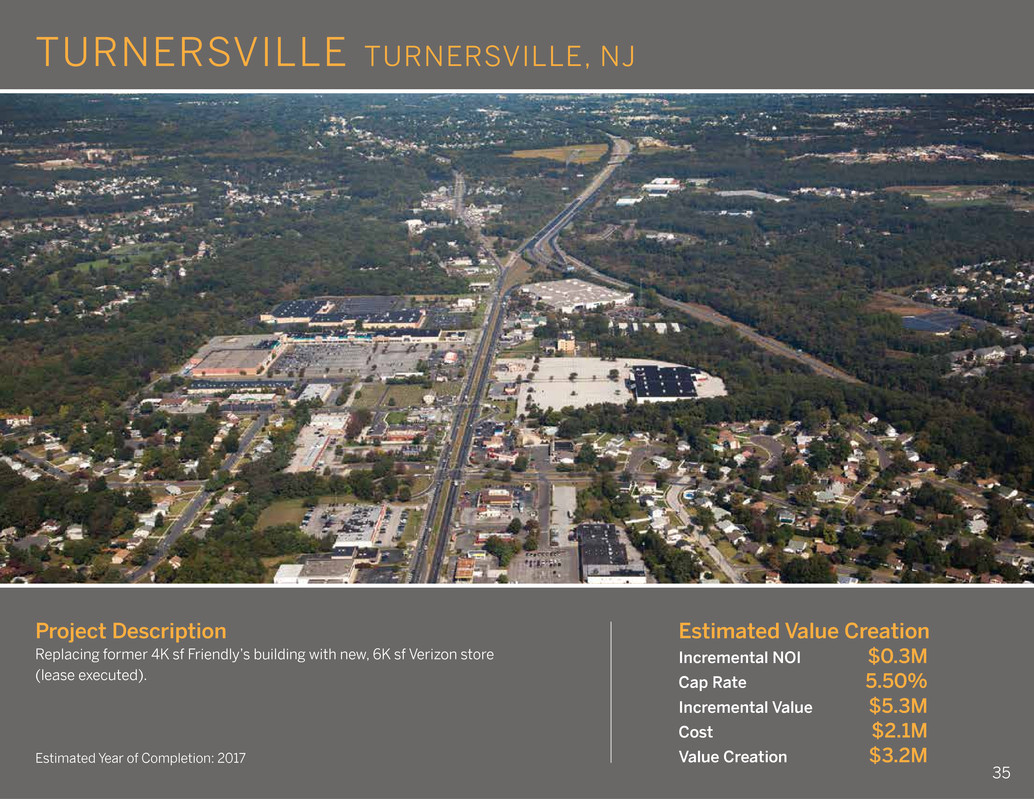
35 Estimated Year of Completion: 2017 Estimated Value Creation Incremental NOI $0.3M Cap Rate 5.50% Incremental Value $5.3M Cost $2.1M Value Creation $3.2M Project Description Replacing former 4K sf Friendly’s building with new, 6K sf Verizon store (lease executed). TURNERSVILLE TURNERSVILLE, NJ

36 Estimated Year of Completion: 2018 Estimated Value Creation Incremental NOI $0.3M Cap Rate 5.25% Incremental Value $6.2M Cost $3.6M Value Creation $2.6M Project Description Creating new pad for two restaurants totaling 5K sf (both in lease). MARLTON COMMONS MARLTON, NJ

37 Estimated Year of Completion: 2019 Estimated Value Creation Incremental NOI $0.3M Cap Rate 5.00% Incremental Value $5.0M Cost $2.5M Value Creation $2.5M Project Description Replacing former Syms building (36K sf) with two pads for restaurants or other uses. WOODBRIDGE COMMONS WOODBRIDGE, NJ

Estimated Year of Completion: 2018 Estimated Value Creation Incremental NOI $0.7M Cap Rate 7.00% Incremental Value $9.9M Cost $7.4M Value Creation $2.5M Project Description Marketing outparcel with 20K+/- sf of development potential. Negotiating with 10K sf users (50%). OUTLETS AT MONTEHIEDRA SAN JUAN, PR 38
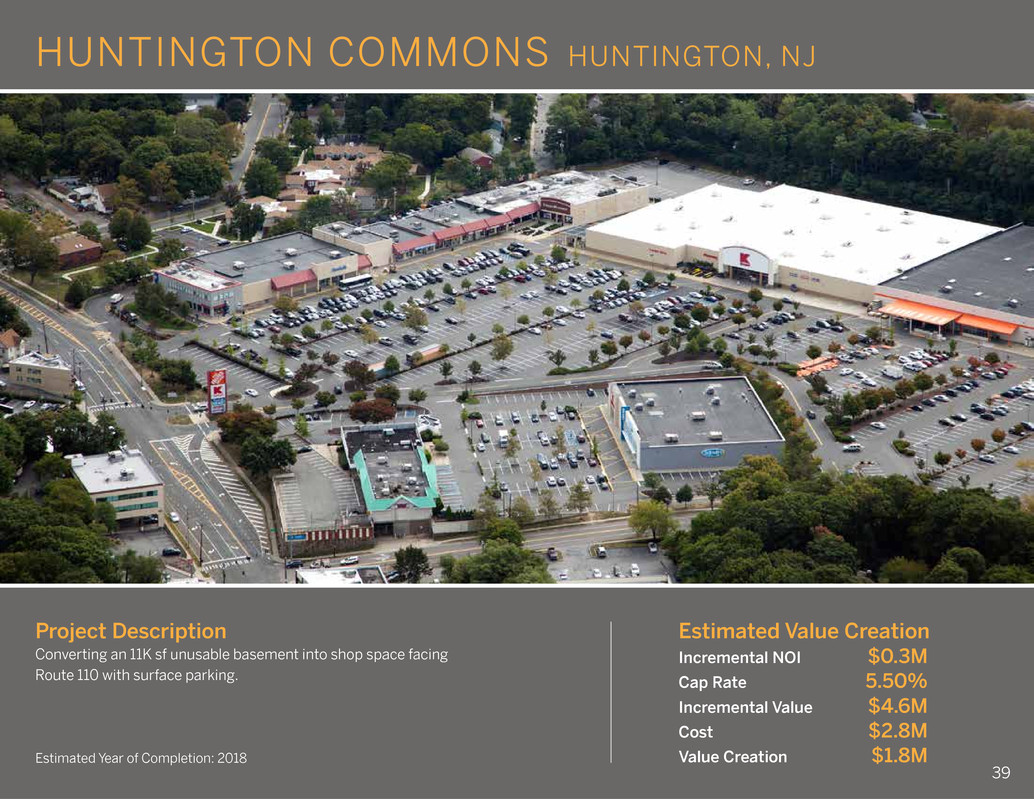
39 Estimated Year of Completion: 2018 Estimated Value Creation Incremental NOI $0.3M Cap Rate 5.50% Incremental Value $4.6M Cost $2.8M Value Creation $1.8M Project Description Converting an 11K sf unusable basement into shop space facing Route 110 with surface parking. HUNTINGTON COMMONS HUNTINGTON, NJ
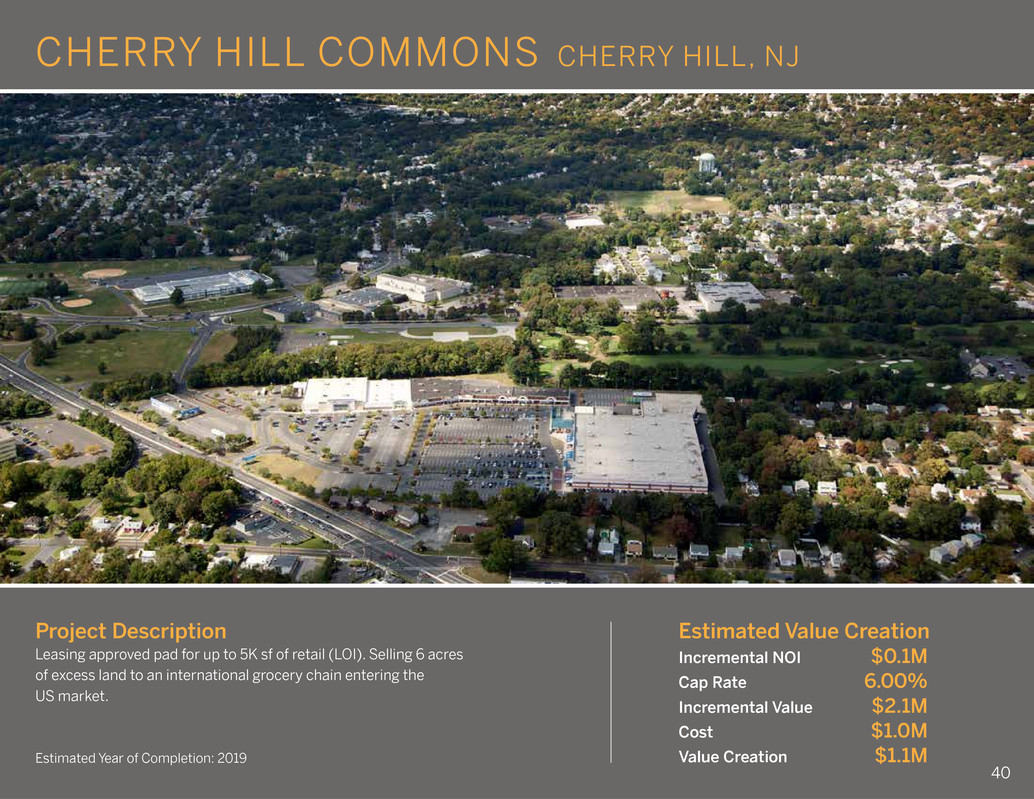
CHERRY HILL COMMONS CHERRY HILL, NJ Project Description Leasing approved pad for up to 5K sf of retail (LOI). Selling 6 acres of excess land to an international grocery chain entering the US market. Estimated Value Creation Incremental NOI $0.1M Cap Rate 6.00% Incremental Value $2.1M Cost $1.0M Value Creation $1.1MEstimated Year of Completion: 2019 40
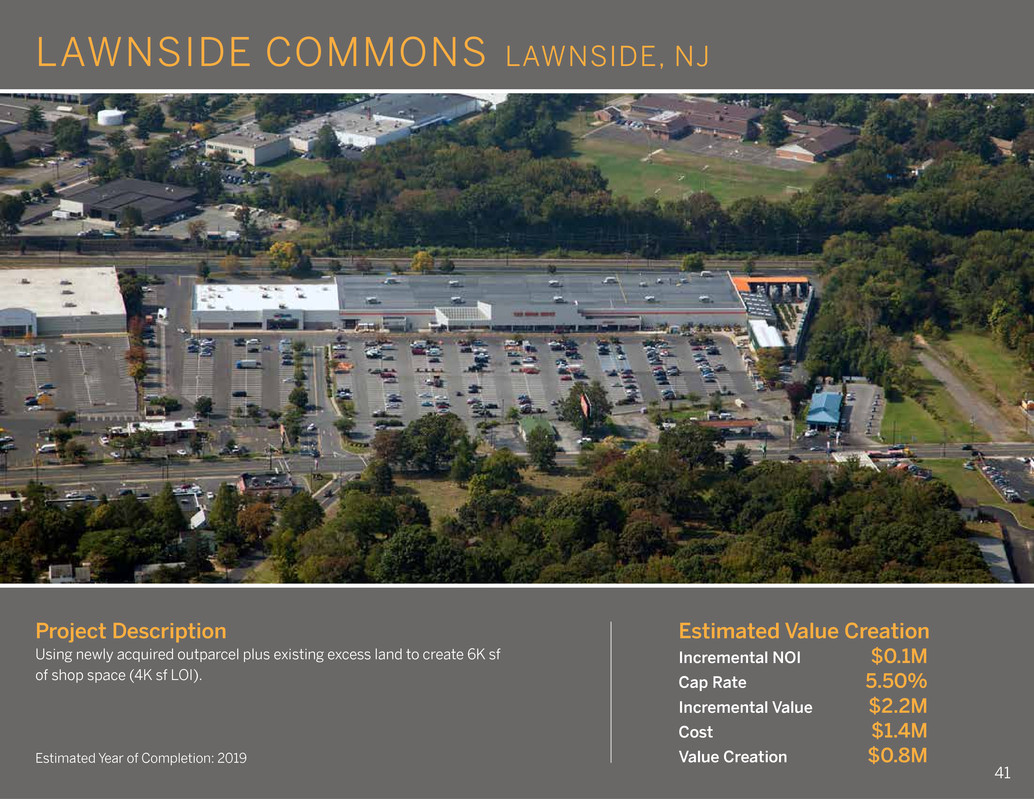
41 Estimated Value Creation Incremental NOI $0.1M Cap Rate 5.50% Incremental Value $2.2M Cost $1.4M Value Creation $0.8MEstimated Year of Completion: 2019 Project Description Using newly acquired outparcel plus existing excess land to create 6K sf of shop space (4K sf LOI). LAWNSIDE COMMONS LAWNSIDE, NJ

42 Project Description Expanding center by 4K sf and repositioning anchor with a national retailer (LOI). Estimated Value Creation Incremental NOI $0.1M Cap Rate 5.00% Incremental Value $1.7M Cost $4.3M Value Creation ($2.6M)Estimated Year of Completion: 2017 BRICK COMMONS BRICKTOWN, NJ

43 Estimated Value Creation Cost $3.5M Value Creation ($3.5M) Estimated Year of Completion: 2018 Project Description Leasing dark, but rent-paying, ShopRite box to a new anchor tenant. BRIARCLIFF COMMONS MORRIS PLAINS, NJ

F U T U R E
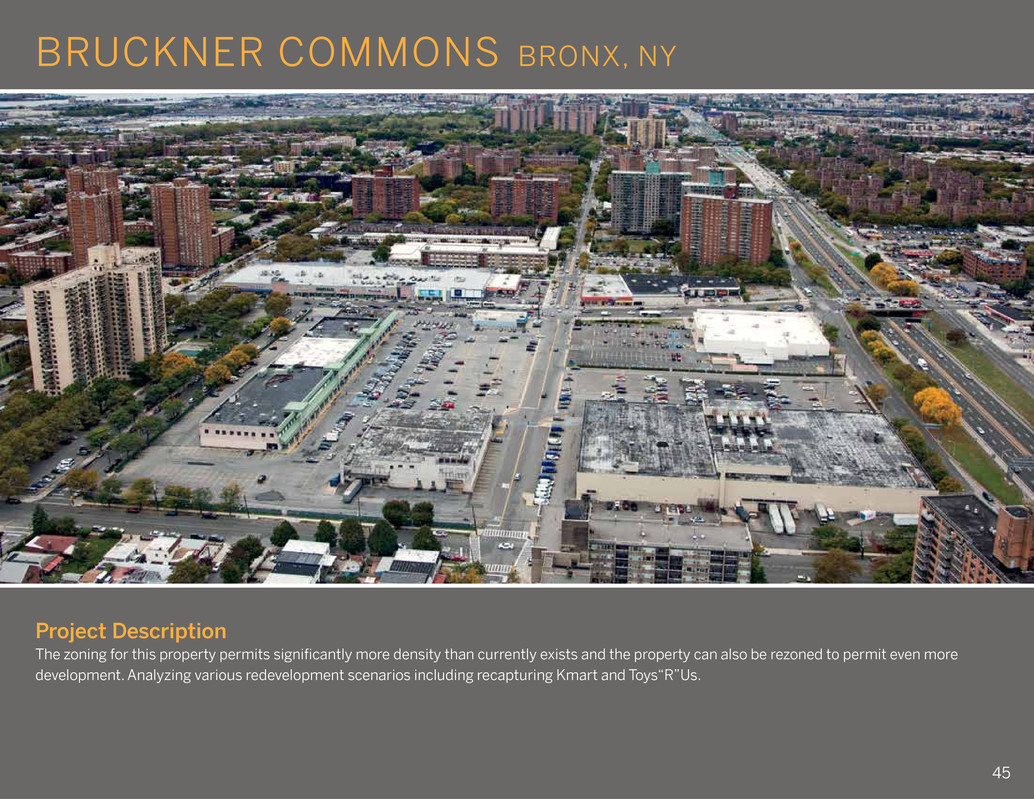
Project Description The zoning for this property permits significantly more density than currently exists and the property can also be rezoned to permit even more development. Analyzing various redevelopment scenarios including recapturing Kmart and Toys“R”Us. BRUCKNER COMMONS BRONX, NY 45
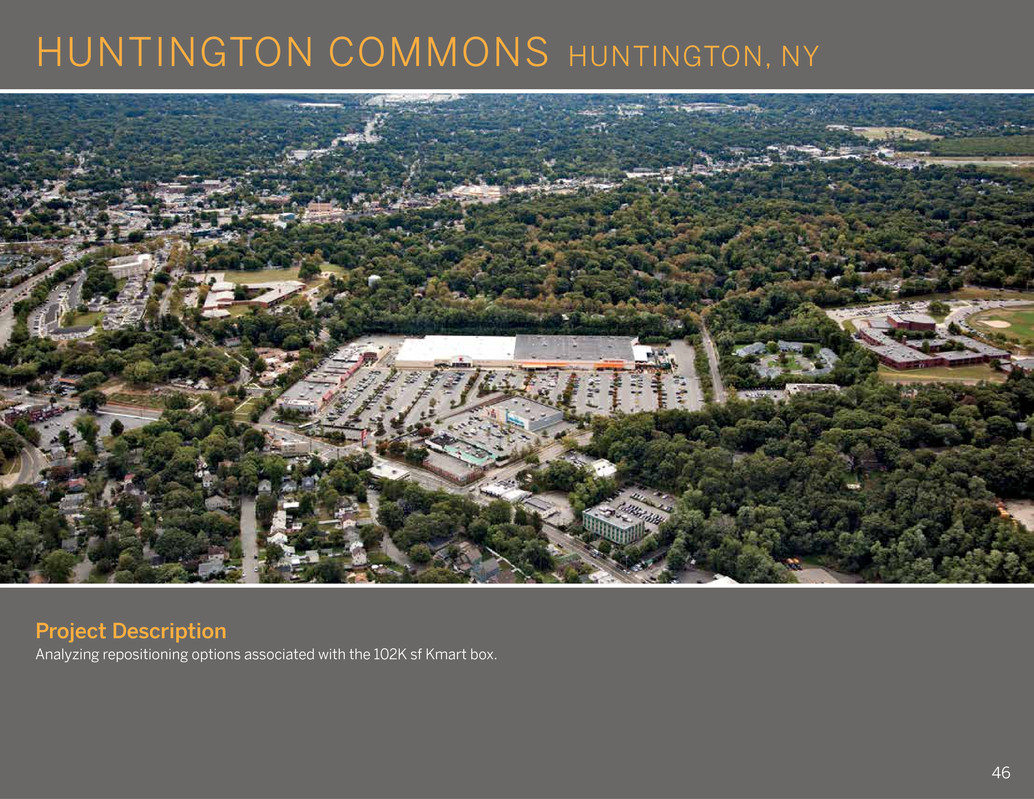
Project Description Analyzing repositioning options associated with the 102K sf Kmart box. HUNTINGTON COMMONS HUNTINGTON, NY 46
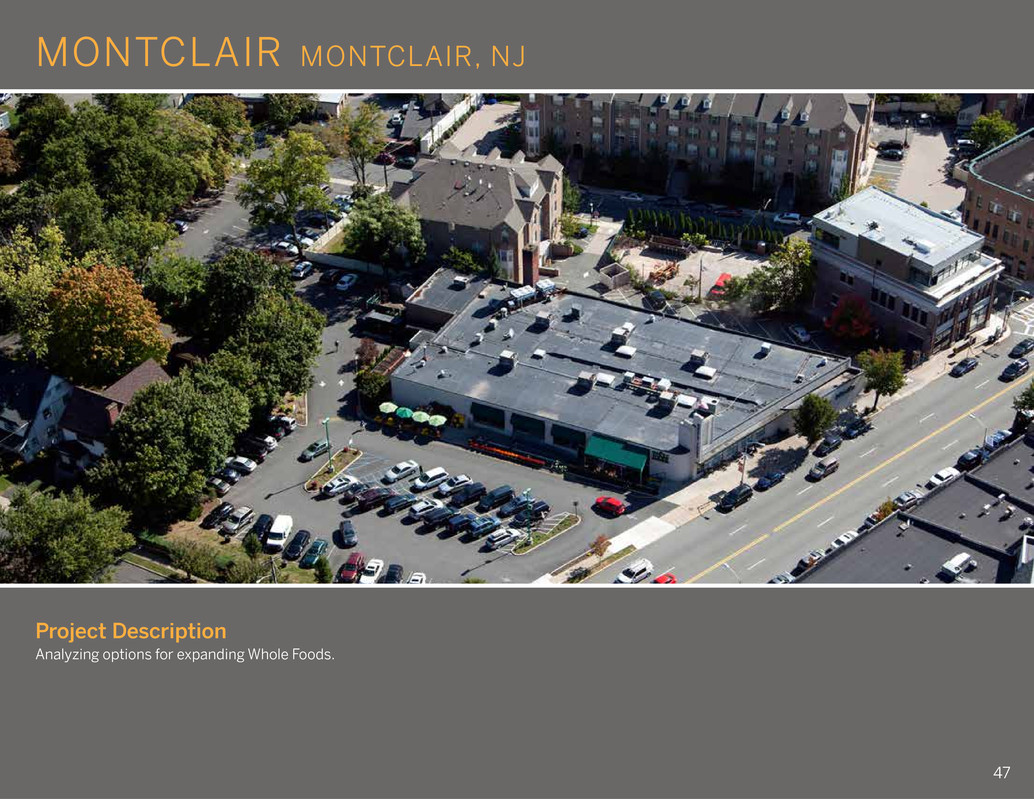
Project Description Analyzing options for expanding Whole Foods. MONTCLAIR MONTCLAIR, NJ 47
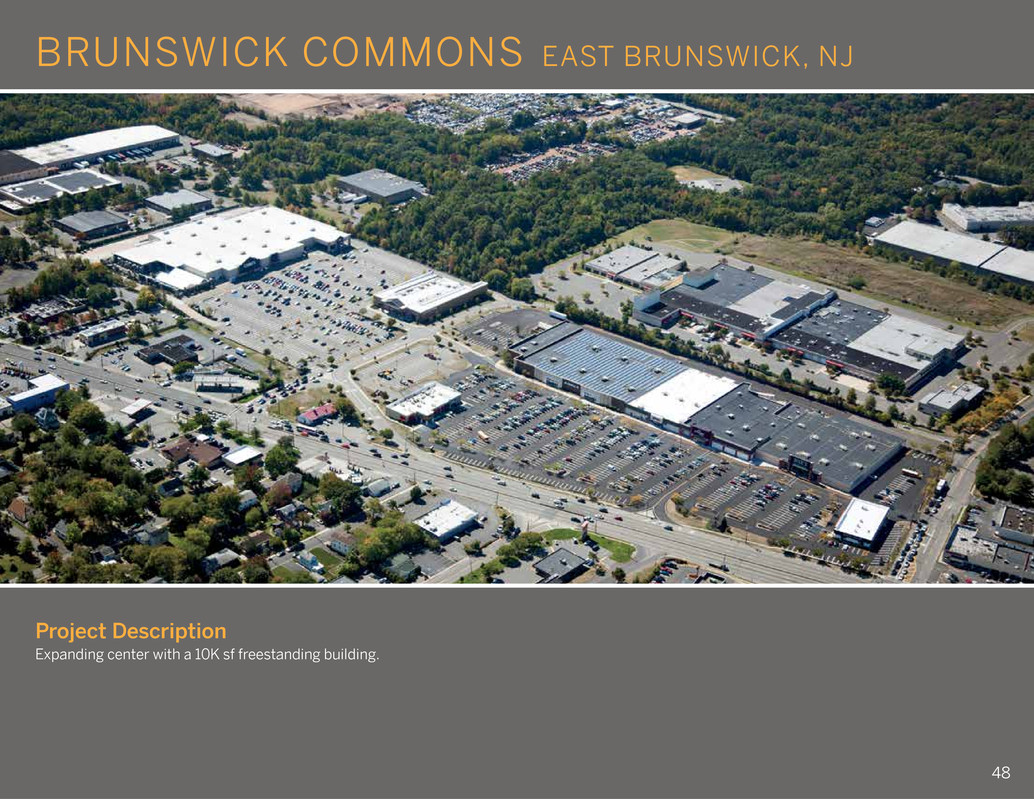
Project Description Expanding center with a 10K sf freestanding building. BRUNSWICK COMMONS EAST BRUNSWICK, NJ 48
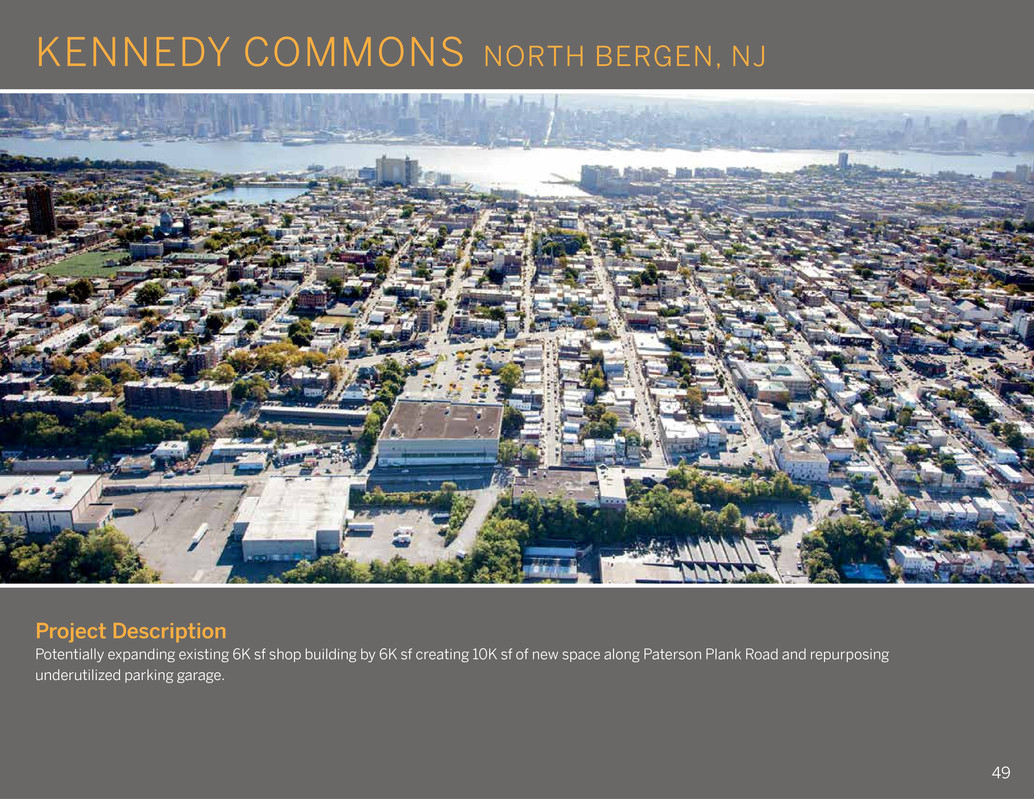
Project Description Potentially expanding existing 6K sf shop building by 6K sf creating 10K sf of new space along Paterson Plank Road and repurposing underutilized parking garage. KENNEDY COMMONS NORTH BERGEN, NJ 49
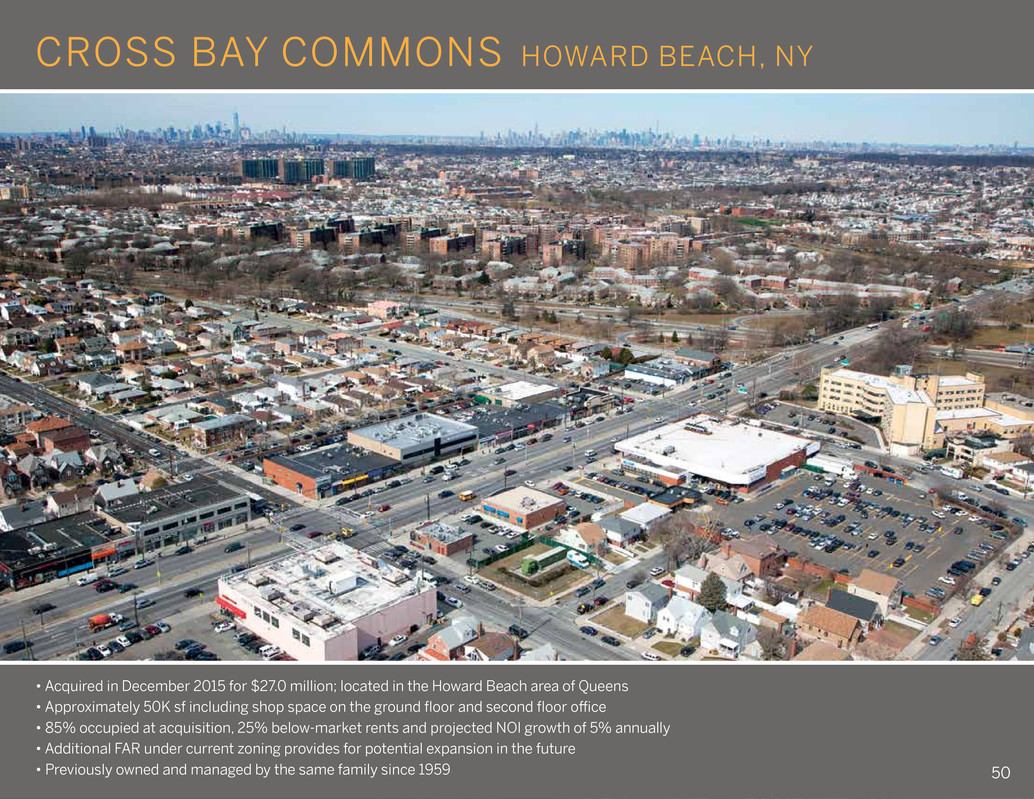
CROSS BAY COMMONS HOWARD BEACH, NY • Acquired in December 2015 for $27.0 million; located in the Howard Beach area of Queens • Approximately 50K sf including shop space on the ground floor and second floor office • 85% occupied at acquisition, 25% below-market rents and projected NOI growth of 5% annually • Additional FAR under current zoning provides for potential expansion in the future • Previously owned and managed by the same family since 1959 50
888 Seventh Avenue New York, NY 10019 212.956.2556 www.uedge.com


