Exhibit 99.2
|
|
| |
| |
| URBAN EDGE PROPERTIES |
| |
| SUPPLEMENTAL DISCLOSURE |
| PACKAGE |
| |
| March 31, 2020 |
| |
| |
|
|
| |
| |
| |
| |
| Urban Edge Properties |
| 888 7th Avenue, New York, NY 10019 |
| NY Office: 212-956-2556 |
| www.uedge.com |
| |
|
| |
| URBAN EDGE PROPERTIES |
| SUPPLEMENTAL DISCLOSURE |
| March 31, 2020 |
| (unaudited) |
| | |
| TABLE OF CONTENTS |
| | Page |
| Press Release | |
| First Quarter 2020 Earnings Press Release | 1 |
| | |
| Overview | |
| Summary Financial Results and Ratios | 10 |
| | |
| Consolidated Financial Statements | |
| Consolidated Balance Sheets | 11 |
| Consolidated Statements of Income | 12 |
| | |
| Non-GAAP Financial Measures and Supplemental Data | |
| Supplemental Schedule of Net Operating Income | 13 |
| Earnings Before Interest, Taxes, Depreciation and Amortization for Real Estate (EBITDAre) | 14 |
| Funds from Operations | 15 |
| Market Capitalization, Debt Ratios and Liquidity | 16 |
| Additional Disclosures | 17 |
| | |
| Leasing Data | |
| Tenant Concentration - Top Twenty-Five Tenants | 18 |
| Leasing Activity | 19 |
| Retail Portfolio Lease Expiration Schedules | 20 |
| | |
| Property Data | |
| Property Status Report | 22 |
| Property Acquisitions and Dispositions | 25 |
| Development, Redevelopment and Anchor Repositioning Projects | 26 |
| | |
| Debt Schedules | |
| Debt Summary | 28 |
| Mortgage Debt Summary | 29 |
| Debt Maturity Schedule | 30 |
| | |
| Business Update | |
| COVID-19 | 31 |
|
| | |
| | | |
| | |
| | |
| Urban Edge Properties | For additional information: |
| 888 Seventh Avenue | Mark Langer, EVP and |
| New York, NY 10019 | Chief Financial Officer |
| 212-956-2556 | |
| | |
| | |
| | | |
| | FOR IMMEDIATE RELEASE: | |
| | | |
| Urban Edge Properties Reports First Quarter 2020 Results |
NEW YORK, NY, April 29, 2020 - Urban Edge Properties (NYSE: UE) (the "Company") today announced its results for the quarter ended March 31, 2020.
"As the situation related to the COVID-19 pandemic continues to rapidly evolve, our focus remains on the health and safety of our employees, our tenants, the communities in which we operate, and UE’s stakeholders,” said Jeff Olson, Chairman and Chief Executive Officer. “We thank everyone who is on the frontlines and performing essential work during this challenging time. We also appreciate the outstanding dedication and effort of our entire team in all they are doing, both for UE and for our local communities."
"Looking ahead, our strong balance sheet, significant liquidity of $1 billion and low leverage structure consisting of single asset, non-recourse mortgages on only 32 of our 78 properties position us well to weather the disruption in our sector. We have a strong and diversified tenant base that is anchored by high-volume, value and essential retailers. Our experienced management team is cycle-tested, having been through many downturns, and is tackling the challenges in front of us, while taking prudent steps to preserve liquidity, reduce expenses and best position the Company for the long term," Mr. Olson concluded.
Financial Results(1)(2)
| |
| • | Generated net income of $51.3 million, or $0.40 per diluted share, for the first quarter of 2020 compared to net income of $27.9 million, or $0.22 per diluted share, for the first quarter of 2019. |
| |
| • | Generated Funds from Operations applicable to diluted common shareholders ("FFO") of $34.8 million, or $0.27 per share, for the quarter compared to $36.5 million, or $0.29 per share, for the first quarter of 2019. |
| |
| • | Generated FFO as Adjusted of $34.9 million, or $0.28 per share, for the quarter compared to $37.1 million, or $0.29 per share, for the first quarter of 2019. |
Operating Results(1)(3)
| |
| • | Reported a decline of 0.7% in same-property cash Net Operating Income ("NOI") including properties in redevelopment compared to the first quarter of 2019. This metric was negatively impacted by 230 basis points due to an increase in bad debt expense. |
| |
| • | Reported a decline of 1.1% in same-property cash NOI excluding properties in redevelopment compared to the first quarter of 2019. This metric was negatively impacted by 240 basis points due to an increase in bad debt expense. |
| |
| • | Reported same-property portfolio occupancy of 93.4%, an increase of 30 basis points compared to December 31, 2019 and a decrease of 100 basis points compared to March 31, 2019. |
| |
| • | Reported consolidated portfolio occupancy of 92.8%, a decrease of 10 basis points compared to December 31, 2019 and a decrease of 110 basis points compared to March 31, 2019. |
| |
| • | Executed 34 new leases, renewals and options totaling 588,000 square feet ("sf") during the quarter. Same-space leases totaled 586,000 sf and generated average rent spreads of 19.1% on a GAAP basis and 9.2% on a cash basis. |
Balance Sheet and Liquidity(1)(4)(5)(6)
The Company maintains one of the strongest and most liquid balance sheets in the sector. The Company has $643 million of cash on hand and 46 unencumbered properties that generated approximately $20 million of NOI in the first quarter, providing significant liquidity to navigate the evolving market environment. In addition, other than its line of credit, the Company’s outstanding indebtedness is made up entirely of 32 separate non-recourse mortgages aggregating $1.6 billion which provide flexibility on an asset-by-asset basis.
Balance sheet highlights as of March 31, 2020, include:
| |
| • | Total liquidity of approximately $1 billion, comprising $643 million of cash on hand and $350 million available under our revolving credit agreement. |
| |
| • | In March, the Company drew $250 million on its $600 million revolving credit facility, which does not expire until 2024. |
| |
| • | Net debt to Adjusted Earnings before interest, tax, depreciation and amortization for real estate ("EBITDAre") of 5.9x. |
| |
| • | Total market capitalization of approximately $3.0 billion, comprised of 122.9 million fully-diluted common shares valued at $1.1 billion and $1.9 billion of debt. |
| |
| • | Net debt to total market capitalization of 42%. |
Development and Redevelopment
During the quarter, the Company executed a lease with ShopRite at Huntington Commons and leases with Bed Bath & Beyond and buybuy Baby at Plaza at Woodbridge.
The Company has $52.8 million of active redevelopment projects under way, of which $16 million remains to be funded. These projects are expected to generate an 8% unleveraged yield.
The Company’s previously communicated plan to spend approximately $100 to $125 million annually over the next three years on redevelopment initiatives is being reevaluated. The Company is under no obligation to execute and fund any of the projects currently identified in its redevelopment pipeline. The Company has updated many of its active project stabilization dates to reflect the impact of the COVID-19 outbreak on its contractors, tenants and vendors.
Acquisition and Disposition Activity
In February, the Company acquired Kingswood Center and Kingswood Crossing for $165 million. The properties are located along Kings Highway in the Midwood neighborhood of Brooklyn, NY. The properties encompass more than 335,000 sf, including 106,000 sf of retail space anchored by leading retailers including TJ Maxx, Target and Marshalls, and 133,000 sf of Class A office space. The retail space is 100% occupied and the office space is 65% occupied. The properties include over 250 below grade parking spaces, across 98,000 sf, and the potential to add up to 60,000 sf of office or residential development. As part of the acquisitions, the Company assumed a $65.5 million mortgage that matures in 2028.
During the quarter, the Company sold three non-core properties for $61 million. The weighted average cap rate on properties sold during the quarter was approximately 7.6%.
Proceeds from the dispositions, in addition to proceeds generated from some of the Company’s non-core asset sales in 2019, were used to acquire Kingswood Center and Kingswood Crossing via 1031 exchanges and allowed for the deferral of capital gains resulting from these sales.
Financing and Investing Activities
During the quarter, the Company’s Board of Trustees authorized a share repurchase program for up to $200 million of the Company’s common shares. Total purchases made under the program to date aggregate 5.9 million common shares at a weighted average share price of $9.22 for a total of $54.1 million.
Dividend Policy
As a result of COVID-19 and the future uncertainties it has generated, the Company has temporarily suspended quarterly dividend distributions. The Company’s Board of Trustees will continue to monitor the Company’s financial performance and economic outlook and, at a later date, intends to reinstate a regular quarterly dividend of at least the amount required to continue qualifying as a REIT for US federal income tax purposes.
COVID-19 Business Update
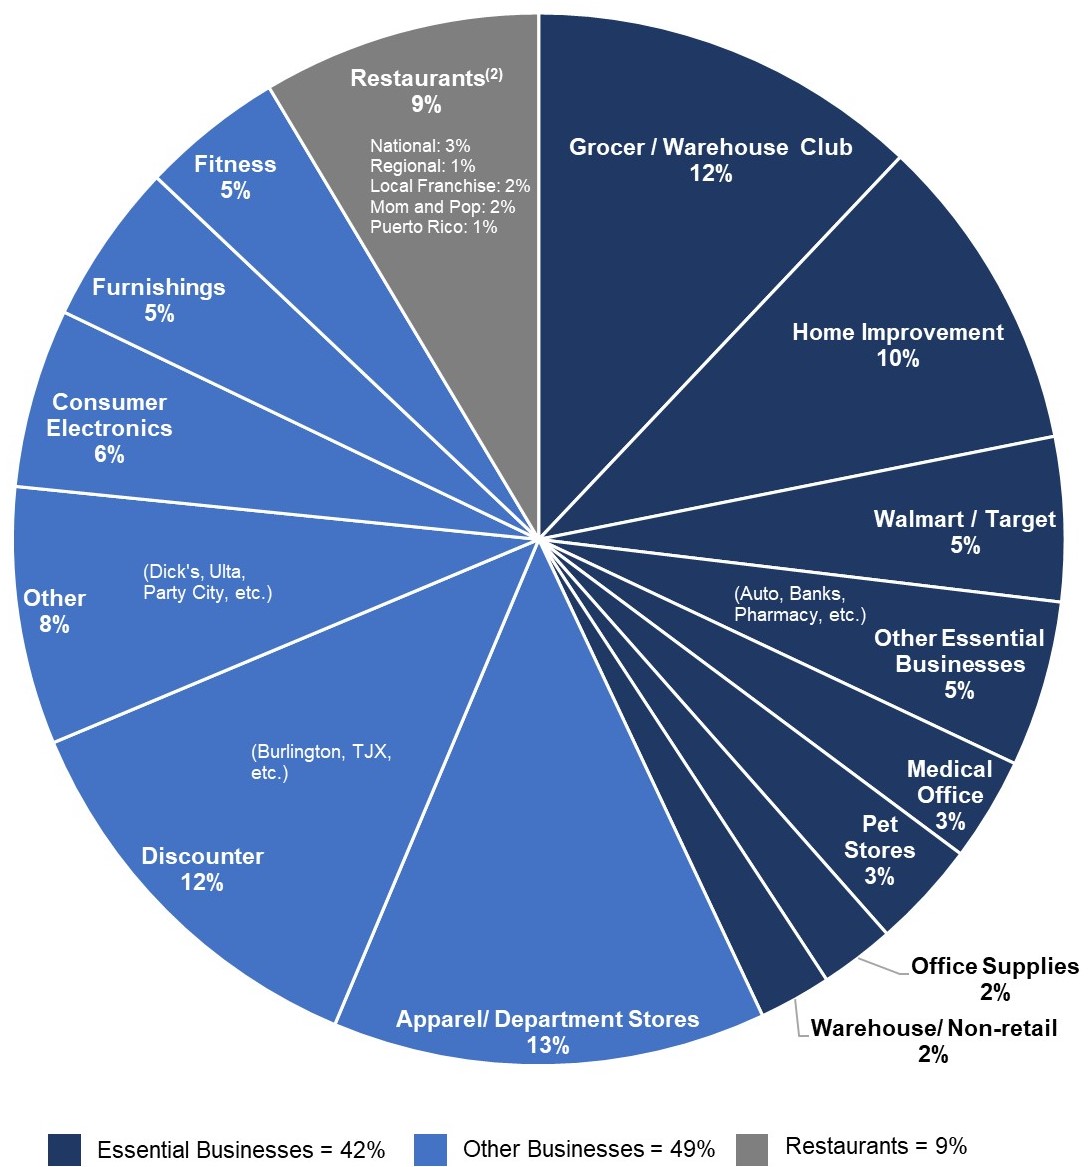
As of April 27, 2020, the Company has collected 56% of April 2020 base rents and monthly tenant expense reimbursements and 55% of the portfolio’s gross leasable area (46% as measured by annualized base rent ("ABR")) remained open for business. The Company has evaluated all of the tenant categories that comprise total ABR and believes that approximately 42% is derived from essential businesses. Additional information related to the COVID-19 outbreak is included in this quarterly supplemental disclosure package beginning on page 31.
(1) Refer to "Non-GAAP Financial Measures" and "Operating Metrics" for definitions and additional detail.
(2) Refer to page 5 for a reconciliation of net income to FFO and FFO as Adjusted for the quarter ended March 31, 2020.
(3) Refer to page 6 for a reconciliation of net income to Cash NOI and Same-Property Cash NOI for the quarter ended March 31, 2020.
(4) Refer to page 7 for a reconciliation of net income to EBITDAre and annualized Adjusted EBITDAre for the quarter ended March 31, 2020.
(5) Net debt as of March 31, 2020 is calculated as total consolidated debt of $1.9 billion less total cash and cash equivalents, including restricted cash, of $642.6 million.
(6) Refer to page 16 for the calculation of market capitalization as of March 31, 2020.
Non-GAAP Financial Measures
The Company uses certain non-GAAP performance measures, in addition to the primary GAAP presentations, as we believe these measures improve the understanding of the Company's operational results. We continually evaluate the usefulness, relevance, limitations, and calculation of our reported non-GAAP performance measures to determine how best to provide relevant information to the investing public, and thus such reported measures are subject to change. The Company's non-GAAP performance measures have limitations as they do not include all items of income and expense that affect operations, and accordingly, should always be considered as supplemental financial results. The following non-GAAP measures are commonly used by the Company and investing public to understand and evaluate our operating results and performance:
| |
| • | FFO: The Company believes FFO is a useful, supplemental measure of its operating performance that is a recognized metric used extensively by the real estate industry and, in particular real estate investment trusts ("REITs"). FFO, as defined by the National Association of Real Estate Investment Trusts ("Nareit") and the Company, is net income (computed in accordance with GAAP), excluding gains (or losses) from sales of depreciable real estate and land when connected to the main business of a REIT, impairments on depreciable real estate or land related to a REIT's main business and rental property depreciation and amortization expense. The Company believes that financial analysts, investors and shareholders are better served by the presentation of comparable period operating results generated from FFO primarily because it excludes the assumption that the value of real estate assets diminishes predictably. FFO does not represent cash flows from operating activities in accordance with GAAP, should not be considered an alternative to net income as an indication of our performance, and is not indicative of cash flow as a measure of liquidity or our ability to make cash distributions. |
| |
| • | FFO as Adjusted: The Company provides disclosure of FFO as Adjusted because it believes it is a useful supplemental measure of its core operating performance that facilitates comparability of historical financial periods. FFO as Adjusted is calculated by making certain adjustments to FFO to account for items the Company does not believe are representative of ongoing core operating results, including non-comparable revenues and expenses. The Company's method of calculating FFO as Adjusted may be different from methods used by other REITs and, accordingly, may not be comparable to such other REITs. |
| |
| • | Cash NOI: The Company uses cash NOI internally to make investment and capital allocation decisions and to compare the unlevered performance of our properties to our peers. The Company believes cash NOI is useful to investors as a performance measure because, when compared across periods, cash NOI reflects the impact on operations from trends in occupancy rates, rental rates, operating costs and acquisition and disposition activity on an unleveraged basis, providing perspective not immediately apparent from net income. The Company calculates cash NOI using net income as defined by GAAP reflecting only those income and expense items that are incurred at the property level, adjusted for non-cash rental income and expense, and income or expenses that we do not believe are representative of ongoing operating results, if any. In addition, the Company uses cash NOI margin, calculated as cash NOI divided by total revenue, which the Company believes is useful to investors for similar reasons. |
| |
| • | Same-property Cash NOI: The Company provides disclosure of cash NOI on a same-property basis, which includes the results of properties that were owned and operated for the entirety of the reporting periods being compared, which total 73 properties for the quarters ended March 31, 2020 and 2019. Information provided on a same-property basis excludes properties under development, redevelopment or that involve anchor repositioning where a substantial portion of the gross leasable area ("GLA") is taken out of service and also excludes properties acquired or sold during the periods being compared. As such, same-property cash NOI assists in eliminating disparities in net income due to the development, redevelopment, acquisition or disposition of properties during the periods presented, and thus provides a more consistent performance measure for the comparison of the operating performance of the Company's properties. While there is judgment surrounding changes in designations, a property is removed from the same-property pool when it is designated as a redevelopment property because it is undergoing significant renovation or retenanting pursuant to a formal plan that is expected to have a significant impact on its operating income. A development or redevelopment property is moved back to the same-property pool once a substantial portion of the NOI growth expected from the development or redevelopment is reflected in both the current and comparable prior year period, generally one year after at least 80% of the expected NOI from the project is realized on a cash basis. Acquisitions are moved into the same-property pool once we have owned the property for the entirety of the comparable periods and the property is not under significant development or redevelopment. The Company has also provided disclosure of cash NOI on a same-property basis adjusted to include redevelopment properties. Same-property |
cash NOI may include other adjustments as detailed in the Reconciliation of Net Income to cash NOI and same-property cash NOI included in the tables accompanying this press release.
| |
| • | EBITDAre and Adjusted EBITDAre: EBITDAre and Adjusted EBITDAre are supplemental, non-GAAP measures utilized by us in various financial ratios. The White Paper on EBITDAre, approved by Nareit's Board of Governors in September 2017, defines EBITDAre as net income (computed in accordance with GAAP), adjusted for interest expense, income tax expense, depreciation and amortization, losses and gains on the disposition of depreciated property, impairment write-downs of depreciated property and investments in unconsolidated joint ventures, and adjustments to reflect the entity's share of EBITDAre of unconsolidated joint ventures. EBITDAre and Adjusted EBITDAre are presented to assist investors in the evaluation of REITs, as a measure of the Company's operational performance as they exclude various items that do not relate to or are not indicative of our operating performance and because they approximate key performance measures in our debt covenants. Accordingly, the Company believes that the use of EBITDAre and Adjusted EBITDAre, as opposed to income before income taxes, in various ratios provides meaningful performance measures related to the Company's ability to meet various coverage tests for the stated periods. Adjusted EBITDAre may include other adjustments not indicative of operating results as detailed in the Reconciliation of Net Income to EBITDAre and Adjusted EBITDAre included in the tables accompanying this press release. The Company also presents the ratio of net debt (net of cash) to annualized Adjusted EBITDAre as of March 31, 2020, and net debt (net of cash) to total market capitalization, which it believes is useful to investors as a supplemental measure in evaluating the Company's balance sheet leverage. The presentation of EBITDAre and Adjusted EBITDAre is consistent with EBITDA and Adjusted EBITDA as presented in prior periods. |
The Company believes net income is the most directly comparable GAAP financial measure to the non-GAAP performance measures outlined above. Reconciliations of these measures to net income have been provided in the tables accompanying this press release.
Operating Metrics
The Company presents certain operating metrics related to our properties, including occupancy, leasing activity and rental rates. Operating metrics are used by the Company and are useful to investors in facilitating an understanding of the operational performance for our properties.
Occupancy metrics represent the percentage of occupied gross leasable area based on executed leases (including properties in development and redevelopment) and include leases signed, but for which rent has not yet commenced. Same-property portfolio occupancy includes properties that have been owned and operated for the entirety of the reporting periods being compared, which total 73 properties for the quarters ended March 31, 2020 and 2019. Occupancy metrics presented for the Company's same-property portfolio excludes properties under development, redevelopment or that involve anchor repositioning where a substantial portion of the gross leasable area is taken out of service and also excludes properties acquired within the past 12 months or properties sold during the periods being compared.
Executed new leases, renewals and exercised options are presented on a same-space basis. Same-space leases represent those leases signed on spaces for which there was a previous lease.
Reconciliation of Net Income to FFO and FFO as Adjusted
The following table reflects the reconciliation of net income to FFO and FFO as Adjusted for the quarters ended March 31, 2020 and 2019, respectively. Net income is considered the most directly comparable GAAP measure. Refer to "Non-GAAP Financial Measures" on page 3 for a description of FFO and FFO as Adjusted.
|
| | | | | | | |
| | Quarter Ended March 31, |
| | 2020 | | 2019 |
| Net income | $ | 51,288 |
| | $ | 27,892 |
|
| Less net income attributable to noncontrolling interests in: | | | |
| Operating partnership | (2,308 | ) | | (2,355 | ) |
| Consolidated subsidiaries | — |
| | — |
|
| Net income attributable to common shareholders | 48,980 |
| | 25,537 |
|
| Adjustments: | | | |
| Rental property depreciation and amortization | 23,281 |
| | 21,623 |
|
| Gain on sale of real estate | (39,775 | ) | | (16,953 | ) |
| Real estate impairment loss | — |
| | 3,958 |
|
| Limited partnership interests in operating partnership | 2,308 |
| | 2,355 |
|
| FFO Applicable to diluted common shareholders | 34,794 |
|
| 36,520 |
|
FFO per diluted common share(1) | 0.27 |
| | 0.29 |
|
| Adjustments to FFO: | | | |
| Transaction, severance and other expenses | 126 |
| | 248 |
|
| Executive transition costs | — |
| | 375 |
|
| Tenant bankruptcy settlement income | — |
| | (27 | ) |
| FFO as Adjusted applicable to diluted common shareholders | $ | 34,920 |
|
| $ | 37,116 |
|
FFO as Adjusted per diluted common share(1) | $ | 0.28 |
| | $ | 0.29 |
|
| | | | |
Weighted Average diluted common shares(1) | 126,756 |
| | 126,504 |
|
(1) Weighted average diluted shares used to calculate FFO per share and FFO as Adjusted per share for the quarter ended March 31, 2020 are higher than the GAAP weighted average diluted shares as a result of the dilutive impact of LTIP and OP units which may be redeemed for our common shares.
Reconciliation of Net Income to Cash NOI and Same-Property Cash NOI
The following table reflects the reconciliation of net income to cash NOI, same-property cash NOI and same-property cash NOI including properties in redevelopment for the quarters ended March 31, 2020 and 2019, respectively. Net income is considered the most directly comparable GAAP measure. Refer to "Non-GAAP Financial Measures" on page 3 for a description of cash NOI and same-property cash NOI.
|
| | | | | | | |
| | Quarter Ended March 31, |
| (Amounts in thousands) | 2020 | | 2019 |
| Net income | $ | 51,288 |
| | $ | 27,892 |
|
| Management and development fee income from non-owned properties | (314 | ) | | (352 | ) |
| Other expense | 255 |
| | 230 |
|
| Depreciation and amortization | 23,471 |
| | 21,830 |
|
| General and administrative expense | 9,847 |
| | 10,580 |
|
Casualty and impairment loss(1) | — |
| | 3,958 |
|
| Gain on sale of real estate | (39,775 | ) | | (16,953 | ) |
| Interest income | (1,683 | ) | | (2,506 | ) |
| Interest and debt expense | 17,175 |
| | 16,536 |
|
| Income tax expense | 100 |
| | 202 |
|
| Non-cash revenue and expenses | (2,695 | ) | | (2,074 | ) |
| Cash NOI | 57,669 |
|
| 59,343 |
|
| Adjustments: | | | |
Non-same property cash NOI(2) | (3,113 | ) | | (4,183 | ) |
| Tenant bankruptcy settlement income and lease termination income | (3 | ) | | (27 | ) |
| Same-property cash NOI | $ | 54,553 |
| | $ | 55,133 |
|
| Cash NOI related to properties being redeveloped | 696 |
| | 524 |
|
| Same-property cash NOI including properties in redevelopment | $ | 55,249 |
| | $ | 55,657 |
|
(1) The quarter ended March 31, 2019 reflects a real estate impairment charge recognized on our property in Westfield, NJ.
(2) Non-same property cash NOI includes cash NOI related to properties being redeveloped and properties acquired or disposed in the period.
Reconciliation of Net Income to EBITDAre and Adjusted EBITDAre
The following table reflects the reconciliation of net income to EBITDAre and Adjusted EBITDAre for the quarters ended March 31, 2020 and 2019, respectively. Net income is considered the most directly comparable GAAP measure. Refer to "Non-GAAP Financial Measures" on page 3 for a description of EBITDAre and Adjusted EBITDAre.
|
| | | | | | | |
| | Quarter Ended March 31, |
| (Amounts in thousands) | 2020 | | 2019 |
| Net income | $ | 51,288 |
| | $ | 27,892 |
|
| Depreciation and amortization | 23,471 |
| | 21,830 |
|
| Interest and debt expense | 17,175 |
| | 16,536 |
|
| Income tax expense | 100 |
| | 202 |
|
| Gain on sale of real estate | (39,775 | ) | | (16,953 | ) |
| Real estate impairment loss | — |
| | 3,958 |
|
| EBITDAre | 52,259 |
|
| 53,465 |
|
| Adjustments for Adjusted EBITDAre: | | | |
| Transaction, severance and other expenses | 126 |
| | 248 |
|
| Executive transition costs | — |
|
| 375 |
|
| Tenant bankruptcy settlement income | — |
|
| (27 | ) |
| Adjusted EBITDAre | $ | 52,385 |
|
| $ | 54,061 |
|
ADDITIONAL INFORMATION
For a copy of the Company’s supplemental disclosure package, please access the "Investors" section of our website at www.uedge.com. Our website also includes other financial information, including our Annual Report on Form 10-K, Quarterly Reports on Form 10-Q, Current Reports on Form 8-K, and amendments to those reports.
ABOUT URBAN EDGE
Urban Edge Properties is a NYSE listed real estate investment trust focused on managing, acquiring, developing, and redeveloping retail real estate in urban communities, primarily in the New York metropolitan region. Urban Edge owns 78 properties totaling 15.1 million square feet of gross leasable area.
FORWARD-LOOKING STATEMENTS
Certain statements contained in this Press Release constitute forward-looking statements as such term is defined in Section 27A of the Securities Act of 1933, as amended, and Section 21E of the Securities Exchange Act of 1934, as amended. Forward-looking statements are not guarantees of future performance. They represent our intentions, plans, expectations and beliefs and are subject to numerous assumptions, risks and uncertainties. Our actual future results, financial condition and business may differ materially from those expressed in these forward-looking statements. You can find many of these statements by looking for words such as “approximates,” “believes,” “expects,” “anticipates,” “estimates,” “intends,” “plans,” “would,” “may” or other similar expressions in this Press Release. Many of the factors that will determine the outcome of forward-looking statements are beyond our ability to control or predict and include, among others: (i) the economic, political and social impact of, and uncertainty relating to, the COVID-19 pandemic, including (a) the effectiveness or lack of effectiveness of governmental relief in providing assistance to large and small businesses, particularly our retail tenants, that have suffered significant declines in revenues as a result of mandatory business shut-downs, “shelter-in-place” or “stay-at-home” orders and social distancing practices, as well as to individuals adversely impacted by the COVID-19 pandemic, (b) the duration of any such orders or other formal recommendations for social distancing and the speed and extent to which revenues of our retail tenants recover following the lifting of any such orders or recommendations, (c) the potential impact of any such events on the obligations of the Company’s tenants to make rent and other payments or honor other commitments under existing leases, (d) the potential adverse impact on returns from redevelopment projects, and (e) the broader impact of the severe economic contraction and increase in unemployment that has occurred in the short term and negative consequences that will occur if these trends are not quickly reversed; (ii) the loss or bankruptcy of major tenants, particularly in light of the adverse impact to the financial health of many retailers that has occurred and continues to occur as a result of the COVID-19 pandemic; (iii) the ability and willingness of the Company’s tenants to renew their leases with the Company upon expiration, the Company’s ability to re-lease its properties on the same or better terms, or at all, in the event of non-renewal or in the event the Company exercises its right to replace an existing tenant, particularly, in light of the adverse impact to the financial health of many retailers that has occurred and continues to occur as a result of the COVID-19 pandemic and the significant uncertainty as to when and the conditions under which potential tenants will be able to operate physical retail locations in future; (iv) the impact of e-commerce on our tenants’ business; (v) macroeconomic conditions, such as a disruption of, or lack of access to the capital markets, as well as the recent significant decline in the Company’s share price from prices prior to the spread of the COVID-19 pandemic; (vi) the Company’s success in implementing its business strategy and its ability to identify, underwrite, finance, consummate and integrate diversifying acquisitions and investments; (vii) changes in general economic conditions or economic conditions in the markets in which the Company competes, and their effect on the Company’s revenues, earnings and funding sources, and on those of its tenants; (viii) increases in the Company’s borrowing costs as a result of changes in interest rates and other factors, including the potential phasing out of LIBOR after 2021; (ix) the Company’s ability to pay down, refinance, restructure or extend its indebtedness as it becomes due and potential limitations on the Company’s ability to borrow funds under its existing credit facility as a result of covenants relating to the Company’s financial results in the second quarter of 2020 or future quarters; (x) potentially higher costs associated with the Company’s development, redevelopment and anchor repositioning projects, and the Company’s ability to lease the properties at projected rates; (xi) the Company’s liability for environmental matters; (xii) damage to the Company’s properties from catastrophic weather and other natural events, and the physical effects of climate change; (xiii) the Company’s ability and willingness to maintain its qualification as a REIT in light of economic, market, legal, tax and other considerations; (xiv) information technology security breaches; and (xv) the loss of key executives. For further discussion of factors that could materially affect the outcome of our forward-looking statements, see “Risk Factors” in Part I, Item 1A, of our Annual Report on Form 10-K for the year ended December 31, 2019 and the other documents filed by the Company with the Securities and Exchange Commission.
For these statements, we claim the protection of the safe harbor for forward-looking statements contained in the Private Securities Litigation Reform Act of 1995. You are cautioned not to place undue reliance on our forward-looking statements, which speak only as of the date of this Press Release. All subsequent written and oral forward-looking statements attributable to us or any person acting on our behalf are expressly qualified in their entirety by the cautionary statements contained or referred to in this section. We do not undertake any obligation to release publicly any revisions to our forward-looking statements to reflect events or circumstances occurring after the date of this Press Release.
|
| | | |
| URBAN EDGE PROPERTIES | | | |
| ADDITIONAL DISCLOSURES | | | |
| As of March 31, 2020 | | | |
| | | | |
Basis of Presentation
The information contained in the Supplemental Disclosure Package does not purport to disclose all items required by GAAP and is unaudited information. This Supplemental Disclosure Package should be read in conjunction with the Company's Annual Report on Form 10-K for the year ended December 31, 2019 and the Quarterly Report on Form 10-Q for the quarter ended March 31, 2020. The results of operations of any property acquired are included in the Company's financial statements since the date of acquisition, although such properties may be excluded from certain metrics disclosed in this Supplemental Disclosure Package.
Non-GAAP Financial Measures and Forward-Looking Statements
For additional information regarding non-GAAP financial measures and forward-looking statements, please see pages 3 and 8 of this Supplemental Disclosure Package.
|
| | |
| URBAN EDGE PROPERTIES | | |
| SUMMARY FINANCIAL RESULTS AND RATIOS | | |
| For the quarter ended March 31, 2020 (unaudited) | |
| (in thousands, except per share, sf, rent psf and financial ratio data) | | |
| | | |
|
| | | | |
| | | Quarter ended |
| Summary Financial Results | | March 31, 2020 |
| Total revenue | | $ | 93,360 |
|
| General & administrative expenses (G&A) | | $ | 9,847 |
|
| Net income attributable to common shareholders | | $ | 48,980 |
|
| Earnings per diluted share | | $ | 0.40 |
|
Adjusted EBITDAre(7) | | $ | 52,385 |
|
| Funds from operations (FFO) | | $ | 34,794 |
|
| FFO per diluted common share | | $ | 0.27 |
|
| FFO as Adjusted | | $ | 34,920 |
|
| FFO as Adjusted per diluted common share | | $ | 0.28 |
|
| Total dividends paid per share | | $ | 0.22 |
|
| Stock closing price low-high range (NYSE) | | $7.28 to $19.82 |
|
Weighted average diluted shares used in EPS computations(1) | | 121,051 |
|
Weighted average diluted common shares used in FFO computations(1) | | 126,756 |
|
| | | |
| Summary Property, Operating and Financial Data | | |
| # of Total properties / # of Retail properties | | 78 / 77 |
|
Gross leasable area (GLA) sf - retail portfolio(3)(5) | | 14,178,000 |
|
Weighted average annual rent psf - retail portfolio(3)(5) | | $ | 19.66 |
|
| Consolidated occupancy at end of period | | 92.8 | % |
Consolidated retail portfolio occupancy at end of period(5) | | 92.3 | % |
Same-property portfolio occupancy at end of period(2) | | 93.4 | % |
Same-property portfolio physical occupancy at end of period(4)(2) | | 92.1 | % |
Same-property cash NOI growth(2) | | (1.1 | )% |
| Same-property cash NOI growth, including redevelopment properties | | (0.7 | )% |
| Cash NOI margin - total portfolio | | 64.0 | % |
| Expense recovery ratio - total portfolio | | 93.6 | % |
New, renewal and option rent spread - cash basis(8) | | 9.2 | % |
New, renewal and option rent spread - GAAP basis(8) | | 19.1 | % |
Net debt to total market capitalization(6) | | 41.7 | % |
Net debt to Adjusted EBITDAre(6) | | 5.9 | x |
Adjusted EBITDAre to interest expense(7) | | 3.2 | x |
Adjusted EBITDAre to fixed charges(7) | | 2.9 | x |
| | | |
(1) Weighted average diluted shares used to calculate FFO per share and FFO as Adjusted per share for the quarter ended March 31, 2020 are higher than the GAAP weighted average diluted shares as a result of the dilutive impact of LTIP and OP units which may be redeemed for our common shares. The computation of weighted average shares reflects 4.5 million of shares repurchased during the quarter.
(2) The same-property pool for both cash NOI and occupancy includes properties the Company consolidated, owned and operated for the entirety of both periods being compared and excludes properties under development, redevelopment or that involve anchor repositioning where a substantial portion of the GLA is taken out of service and also excludes properties acquired or sold during the periods being compared.
(3) GLA - retail portfolio excludes 943,000 square feet of warehouses and 133,000 square feet of self-storage. The weighted average annual rent per square foot for our retail portfolio and warehouses was $18.72.
(4) Physical occupancy includes tenants that have access to their leased space and includes dark and paying tenants.
(5) Our retail portfolio includes shopping centers and malls and excludes warehouses and self-storage.
(6) See computation for the quarter ended March 31, 2020 on page 16. Adjusted EBITDAre is annualized for purposes of calculating net debt to Adjusted EBITDAre.
(7) See computation on page 14.
(8) See computation on page 19.
|
| | |
| URBAN EDGE PROPERTIES | | |
| CONSOLIDATED BALANCE SHEETS | | |
| As of March 31, 2020 (unaudited) and December 31, 2019 | | |
| (in thousands, except share and per share amounts) | | |
| | | |
|
| | | | | | | |
| | March 31, | | December 31, |
| | 2020 | | 2019 |
| ASSETS | | | |
|
| Real estate, at cost: | |
| | |
|
| Land | $ | 529,809 |
| | $ | 515,621 |
|
| Buildings and improvements | 2,336,405 |
| | 2,197,076 |
|
| Construction in progress | 28,629 |
| | 28,522 |
|
| Furniture, fixtures and equipment | 7,016 |
| | 7,566 |
|
| Total | 2,901,859 |
| | 2,748,785 |
|
| Accumulated depreciation and amortization | (686,139 | ) | | (671,946 | ) |
| Real estate, net | 2,215,720 |
| | 2,076,839 |
|
| Right-of-use assets | 79,962 |
| | 81,768 |
|
| Cash and cash equivalents | 622,667 |
| | 432,954 |
|
| Restricted cash | 19,976 |
| | 52,182 |
|
| Tenant and other receivables | 19,006 |
| | 21,565 |
|
| Receivable arising from the straight-lining of rents | 74,348 |
| | 73,878 |
|
| Identified intangible assets, net of accumulated amortization of $32,359 and $30,942, respectively | 59,810 |
| | 48,121 |
|
| Deferred leasing costs, net of accumulated amortization of $16,291 and $16,560, respectively | 21,105 |
| | 21,474 |
|
| Deferred financing costs, net of accumulated amortization of $4,008 and $3,765, respectively | 3,634 |
| | 3,877 |
|
| Prepaid expenses and other assets | 27,372 |
| | 33,700 |
|
| Total assets | $ | 3,143,600 |
| | $ | 2,846,358 |
|
| | | | |
| LIABILITIES AND EQUITY | |
| | |
|
| Liabilities: | | | |
| Mortgages payable, net | $ | 1,616,853 |
| | $ | 1,546,195 |
|
| Unsecured credit facility borrowings | 250,000 |
| | — |
|
| Lease liabilities | 78,334 |
| | 79,913 |
|
| Accounts payable, accrued expenses and other liabilities | 69,350 |
| | 76,644 |
|
| Identified intangible liabilities, net of accumulated amortization of $65,074 and $62,610, respectively | 130,840 |
| | 128,830 |
|
| Total liabilities | 2,145,377 |
| | 1,831,582 |
|
| Commitments and contingencies | | | |
| Shareholders’ equity: | | | |
| Common shares: $0.01 par value; 500,000,000 shares authorized and 117,956,031 and 121,370,125 shares issued and outstanding, respectively | 1,179 |
| | 1,213 |
|
| Additional paid-in capital | 986,489 |
| | 1,019,149 |
|
| Accumulated deficit | (30,243 | ) | | (52,546 | ) |
| Noncontrolling interests: | | | |
| Operating partnership | 40,374 |
| | 46,536 |
|
| Consolidated subsidiaries | 424 |
| | 424 |
|
| Total equity | 998,223 |
| | 1,014,776 |
|
| Total liabilities and equity | $ | 3,143,600 |
| | $ | 2,846,358 |
|
|
| | |
| URBAN EDGE PROPERTIES | | |
| CONSOLIDATED STATEMENTS OF INCOME | | |
| For the quarters ended March 31, 2020 and 2019 (unaudited) | |
| (in thousands, except share and per share amounts) | | |
| | | |
|
| | | | | | | |
| | Quarter Ended March 31, |
| | 2020 | | 2019 |
| REVENUE | | | |
| Rental revenue | $ | 93,000 |
| | $ | 97,308 |
|
| Management and development fees | 314 |
| | 352 |
|
| Other income | 46 |
| | 72 |
|
| Total revenue | 93,360 |
| | 97,732 |
|
| EXPENSES | | | |
| Depreciation and amortization | 23,471 |
| | 21,830 |
|
| Real estate taxes | 14,966 |
| | 15,477 |
|
| Property operating | 14,537 |
| | 17,061 |
|
| General and administrative | 9,847 |
| | 10,580 |
|
| Casualty and impairment loss | — |
| | 3,958 |
|
| Lease expense | 3,434 |
| | 3,655 |
|
| Total expenses | 66,255 |
| | 72,561 |
|
| Gain on sale of real estate | 39,775 |
| | 16,953 |
|
| Interest income | 1,683 |
| | 2,506 |
|
| Interest and debt expense | (17,175 | ) | | (16,536 | ) |
| Income before income taxes | 51,388 |
| | 28,094 |
|
| Income tax expense | (100 | ) | | (202 | ) |
| Net income | 51,288 |
| | 27,892 |
|
| Less net income attributable to noncontrolling interests in: | | | |
| Operating partnership | (2,308 | ) | | (2,355 | ) |
| Consolidated subsidiaries | — |
| | — |
|
| Net income attributable to common shareholders | $ | 48,980 |
| | $ | 25,537 |
|
| | | | |
| Earnings per common share - Basic: | $ | 0.40 |
| | $ | 0.22 |
|
| Earnings per common share - Diluted: | $ | 0.40 |
| | $ | 0.22 |
|
| Weighted average shares outstanding - Basic | 120,966 |
| | 116,274 |
|
| Weighted average shares outstanding - Diluted | 121,051 |
| | 126,504 |
|
|
| | |
| URBAN EDGE PROPERTIES | | |
| SUPPLEMENTAL SCHEDULE OF NET OPERATING INCOME | | |
| For the quarters ended March 31, 2020 and 2019 | |
| (in thousands) | | |
| | | |
|
| | | | | | | | | |
| | Quarter Ended March 31, | | Percent Change |
| | 2020 | | 2019 | |
Total cash NOI(1) | | | | | |
| Total revenue | $ | 90,113 |
| | $ | 94,978 |
| | (5.1)% |
| Total property operating expenses | (32,444 | ) | | (35,635 | ) | | (9.0)% |
| Cash NOI - total portfolio | $ | 57,669 |
| | $ | 59,343 |
| | (2.8)% |
| | | | | | |
| Cash NOI margin (Cash NOI / Total revenue) | 64.0 | % | | 62.5 | % |
|
|
| | | | | | |
| | | | | | |
Same-property cash NOI(1) | | | | | |
| Property rentals | $ | 63,583 |
| | $ | 62,515 |
| | |
| Tenant expense reimbursements | 23,829 |
| | 25,702 |
| | |
| Bad debt expense | (1,315 | ) | | 10 |
| | |
| Total revenue | 86,097 |
|
| 88,227 |
| | |
| Real estate taxes | (14,631 | ) | | (14,373 | ) | | |
| Property operating | (13,891 | ) | | (15,815 | ) | | |
| Lease expense | (3,022 | ) | | (2,906 | ) | | |
| Total property operating expenses | (31,544 | ) | | (33,094 | ) | | |
Same-property cash NOI(1) | $ | 54,553 |
| | $ | 55,133 |
| | (1.1)% |
| | | | | | |
| Cash NOI related to properties being redeveloped | $ | 696 |
| | $ | 524 |
| | |
Same-property cash NOI including properties in redevelopment(1) | $ | 55,249 |
| | $ | 55,657 |
| | (0.7)% |
| | | | | | |
| Same-property physical occupancy | 92.1 | % | | 93.5 | % | | |
| Same-property leased occupancy | 93.4 | % | | 94.4 | % | | |
| Number of properties included in same-property analysis | 73 |
| | | | |
| | | | | | |
(1) Refer to page 6 for a reconciliation of net income to cash NOI and same-property cash NOI.
|
| | |
| URBAN EDGE PROPERTIES | | |
| EARNINGS BEFORE INTEREST, TAXES, DEPRECIATION and AMORTIZATION for REAL ESTATE (EBITDAre) |
| For the quarters ended March 31, 2020 and 2019 | |
| (in thousands) | | |
| | | |
|
| | | | | | | |
| | Quarter Ended March 31, |
| | 2020 | | 2019 |
| Net income | $ | 51,288 |
| | $ | 27,892 |
|
| Depreciation and amortization | 23,471 |
| | 21,830 |
|
| Interest expense | 16,469 |
| | 15,816 |
|
| Amortization of deferred financing costs | 706 |
| | 720 |
|
| Income tax expense | 100 |
| | 202 |
|
| Gain on sale of real estate | (39,775 | ) | | (16,953 | ) |
| Real estate impairment loss | — |
| | 3,958 |
|
| EBITDAre | 52,259 |
|
| 53,465 |
|
| Adjustments for Adjusted EBITDAre: | | | |
| Transaction, severance and other expenses | 126 |
| | 248 |
|
| Executive transition costs | — |
| | 375 |
|
| Tenant bankruptcy settlement income | — |
| | (27 | ) |
| Adjusted EBITDAre | $ | 52,385 |
| | $ | 54,061 |
|
| | | | |
| Interest expense | $ | 16,469 |
| | $ | 15,816 |
|
| | | | |
| Adjusted EBITDAre to interest expense | 3.2 | x | | 3.4 | x |
| | | | |
| Fixed charges | | | |
| Interest expense | $ | 16,469 |
| | $ | 15,816 |
|
| Scheduled principal amortization | 1,828 |
| | 1,144 |
|
| Total fixed charges | $ | 18,297 |
| | $ | 16,960 |
|
| | | | |
| Adjusted EBITDAre to fixed charges | 2.9 | x | | 3.2 | x |
| | | | |
|
| | |
| URBAN EDGE PROPERTIES | | |
| FUNDS FROM OPERATIONS | |
| For the quarters ended March 31, 2020 | |
| (in thousands, except per share amounts) | | |
| | | |
|
| | | | | | | |
| | Quarter Ended March 31, 2020 |
| | (in thousands) | | (per share)(2) |
| Net income | $ | 51,288 |
| | $ | 0.40 |
|
| Less net income attributable to noncontrolling interests in: | | | |
| Operating partnership | (2,308 | ) | | (0.02 | ) |
| Consolidated subsidiaries | — |
| | — |
|
| Net income attributable to common shareholders | 48,980 |
| | 0.38 |
|
| Adjustments: | | | |
| Rental property depreciation and amortization | 23,281 |
| | 0.18 |
|
| Real estate impairment loss | — |
| | — |
|
| Gain on sale of real estate | (39,775 | ) | | (0.31 | ) |
Limited partnership interests in operating partnership(1) | 2,308 |
| | 0.02 |
|
| FFO applicable to diluted common shareholders | 34,794 |
|
| 0.27 |
|
| | | | |
| Transaction, severance and other expenses | 126 |
| | — |
|
| FFO as Adjusted applicable to diluted common shareholders | $ | 34,920 |
|
| $ | 0.28 |
|
| | | | |
| Weighted average diluted shares used to calculate EPS | 121,051 |
| | |
| Assumed conversion of OP and LTIP Units to common shares | 5,705 |
| | |
| Weighted average diluted common shares - FFO | 126,756 |
| | |
(1) Represents earnings allocated to LTIP and OP unitholders for unissued common shares, which have been excluded for purposes of calculating earnings per diluted share for the periods presented because they are anti-dilutive.
(2) Individual items may not add up due to total rounding.
|
| | |
| URBAN EDGE PROPERTIES | | |
| MARKET CAPITALIZATION, DEBT RATIOS AND LIQUIDITY | | |
| As of March 31, 2020 | | |
| (in thousands, except share amounts) | | |
| | | |
|
| | | |
| | March 31, 2020 |
| Closing market price of common shares | $ | 8.81 |
|
| | |
| Basic common shares | 117,956,031 |
|
| OP and LTIP units | 4,971,944 |
|
| Diluted common shares | 122,927,975 |
|
| | |
| Equity market capitalization | $ | 1,082,995 |
|
| | |
| | |
Total consolidated debt(1) | $ | 1,876,443 |
|
| Cash and cash equivalents including restricted cash | (642,643 | ) |
| Net debt | $ | 1,233,800 |
|
| | |
| Net Debt to annualized Adjusted EBITDAre | 5.9 | x |
| | |
Total consolidated debt(1) | $ | 1,876,443 |
|
| Equity market capitalization | 1,082,995 |
|
| Total market capitalization | $ | 2,959,438 |
|
| | |
| Net debt to total market capitalization at applicable market price | 41.7 | % |
| | |
| | |
| Cash and cash equivalents including restricted cash | $ | 642,643 |
|
| Available under unsecured credit facility | 350,000 |
|
| Total liquidity | $ | 992,643 |
|
| | |
(1) Total consolidated debt excludes unamortized debt issuance costs of $9.6 million.
|
| | |
| URBAN EDGE PROPERTIES | | |
| ADDITIONAL DISCLOSURES | |
| (in thousands) | | |
| | | |
|
| | | | | | | | |
| | | Quarter Ended March 31, |
| | | 2020 | | 2019 |
| Rental revenue: | | | | |
| Property rentals | | $ | 69,290 |
| | $ | 69,534 |
|
| Tenant expense reimbursements | | 25,134 |
| | 28,259 |
|
| Bad debt expense | | (1,424 | ) | | (485 | ) |
| Total rental revenue | | $ | 93,000 |
| | $ | 97,308 |
|
| | | | | |
| Certain non-cash items: | | | |
|
Straight-line rental income(1) | | $ | 674 |
| | $ | 330 |
|
Amortization of below-market lease intangibles, net(1) | | 2,249 |
| | 2,360 |
|
Lease expense GAAP adjustments(2) | | (228 | ) | | (307 | ) |
Reserves on receivables from straight-line rents(5) | | — |
| | (308 | ) |
Amortization of deferred financing costs(4) | | (706 | ) | | (720 | ) |
Capitalized interest(4) | | 125 |
| | 565 |
|
Share-based compensation expense(3) | | (3,248 | ) | | (3,664 | ) |
| | | | | |
Capital expenditures: (6) | | | | |
| Development and redevelopment costs | | $ | 4,188 |
| | $ | 21,068 |
|
| Maintenance capital expenditures | | 1,469 |
| | 3,137 |
|
| Leasing commissions | | 273 |
| | 591 |
|
| Tenant improvements and allowances | | 881 |
| | 2,413 |
|
| Total capital expenditures | | $ | 6,811 |
| | $ | 27,209 |
|
| | | | | |
| | | March 31, 2020 | | December 31, 2019 |
| Accounts payable, accrued expenses and other liabilities: | | |
| Deferred tenant revenue | | $ | 20,571 |
| | $ | 26,224 |
|
| Accrued interest payable | | 10,202 |
| | 9,729 |
|
| Accrued capital expenditures and leasing costs | | 7,470 |
| | 7,893 |
|
| Security deposits | | 6,192 |
| | 5,814 |
|
| Deferred tax liability, net | | 5,183 |
| | 5,137 |
|
| Accrued payroll expenses | | 2,996 |
| | 5,851 |
|
| Other liabilities and accrued expenses | | 16,736 |
| | 15,996 |
|
| Total accounts payable and accrued expenses | | $ | 69,350 |
| | $ | 76,644 |
|
| | | | | |
(1) Amounts included in the financial statement line item "Rental revenue" in the consolidated statements of income.
(2) GAAP adjustments consist of amortization of below-market ground lease intangibles and straight-line lease expense. Amounts are included in the financial statement line item "Lease expense" in the consolidated statements of income.
(3) Amounts included in the financial statement line item "General and administrative" in the consolidated statements of income.
(4) Amounts included in the financial statement line item "Interest and debt expense" in the consolidated statements of income.
(5) Amount included in the financial statement line item "Rental revenue" for the quarter ended March 31, 2019.
(6) Amounts presented on a cash basis. Amounts for the quarter ended March 31, 2019 have been reclassified to conform with current period presentation.
|
| | |
| URBAN EDGE PROPERTIES | | |
| TENANT CONCENTRATION - TOP TWENTY-FIVE TENANTS | |
| As of March 31, 2020 | | |
| | | |
| | | |
|
| | | | | | | | | | | | | |
| | | | | | | | |
| Tenant | Number of stores | Square feet | % of total square feet | Annualized base rent ("ABR") | % of total ABR | Weighted average ABR per square foot | Average remaining term of ABR(1) |
| The Home Depot, Inc. | 6 |
| 808,926 |
| 5.4% | $ | 14,813,946 |
| 5.6% | $ | 18.31 |
| 15.4 |
The TJX Companies, Inc.(2) | 21 |
| 688,219 |
| 4.6% | 13,808,775 |
| 5.2% | 20.06 |
| 5.2 |
| Lowe's Companies, Inc. | 6 |
| 976,415 |
| 6.5% | 8,575,004 |
| 3.3% | 8.78 |
| 7.5 |
| Best Buy Co., Inc. | 8 |
| 359,476 |
| 2.4% | 7,763,921 |
| 2.9% | 21.60 |
| 5.3 |
| Walmart Inc. | 5 |
| 727,376 |
| 4.8% | 7,650,309 |
| 2.9% | 10.52 |
| 8.2 |
| Burlington Stores, Inc. | 7 |
| 415,828 |
| 2.8% | 7,163,233 |
| 2.7% | 17.23 |
| 8.8 |
Ahold Delhaize(3) | 7 |
| 509,634 |
| 3.4% | 7,082,120 |
| 2.7% | 13.90 |
| 7.1 |
| Kohl's Corporation | 7 |
| 633,345 |
| 4.2% | 6,528,542 |
| 2.5% | 10.31 |
| 4.2 |
| PetSmart, Inc. | 11 |
| 256,733 |
| 1.7% | 6,363,255 |
| 2.4% | 24.79 |
| 4.2 |
| BJ's Wholesale Club | 4 |
| 454,297 |
| 3.0% | 5,771,563 |
| 2.2% | 12.70 |
| 8.1 |
| Target Corporation | 3 |
| 335,937 |
| 2.2% | 5,290,952 |
| 2.0% | 15.75 |
| 12.6 |
| Wakefern (ShopRite) | 4 |
| 296,018 |
| 2.0% | 5,241,942 |
| 2.0% | 17.71 |
| 12.2 |
| LA Fitness International LLC | 5 |
| 245,266 |
| 1.6% | 4,275,983 |
| 1.6% | 17.43 |
| 8.3 |
The Gap, Inc.(4) | 10 |
| 151,239 |
| 1.0% | 4,202,204 |
| 1.6% | 27.79 |
| 2.9 |
| Staples, Inc. | 9 |
| 186,030 |
| 1.2% | 4,134,032 |
| 1.6% | 22.22 |
| 2.9 |
| Whole Foods Market, Inc. | 2 |
| 100,682 |
| 0.7% | 3,759,050 |
| 1.4% | 37.34 |
| 10.7 |
| Century 21 | 1 |
| 156,649 |
| 1.0% | 3,394,181 |
| 1.3% | 21.67 |
| 6.8 |
Sears Holdings Corporation(5) | 2 |
| 321,917 |
| 2.1% | 3,313,959 |
| 1.3% | 10.29 |
| 25.1 |
| Bob's Discount Furniture | 4 |
| 170,931 |
| 1.1% | 3,222,108 |
| 1.2% | 18.85 |
| 6.3 |
| 24 Hour Fitness | 1 |
| 53,750 |
| 0.4% | 2,564,520 |
| 1.0% | 47.71 |
| 11.8 |
| URBN (Anthropologie) | 1 |
| 31,450 |
| 0.2% | 2,201,500 |
| 0.8% | 70.00 |
| 8.5 |
Bed Bath & Beyond Inc.(6) | 5 |
| 149,879 |
| 1.0% | 2,098,009 |
| 0.8% | 14.00 |
| 3.2 |
| Raymour & Flanigan | 3 |
| 179,370 |
| 1.2% | 2,029,599 |
| 0.8% | 11.32 |
| 8.5 |
| Dick's Sporting Goods, Inc. | 2 |
| 100,695 |
| 0.7% | 1,941,672 |
| 0.7% | 19.28 |
| 3.8 |
Hudson's Bay Company (Saks) | 2 |
| 59,143 |
| 0.4% | 1,921,776 |
| 0.7% | 32.49 |
| 3.5 |
| | | | | | | | |
| Total/Weighted Average | 136 |
| 8,369,205 |
| 55.6% | $ | 135,112,155 |
| 51.2% | $ | 16.14 |
| 8.3 |
| | | | | | | | |
(1) In years excluding tenant renewal options. The weighted average is based on ABR.
(2) Includes Marshalls (14), T.J. Maxx (4), HomeGoods (2) and Homesense (1).
(3) Includes Stop & Shop (6) and Giant Food (1).
(4) Includes Old Navy (7), Gap (2) and Banana Republic (1).
(5) Includes Kmart (2).
(6) Includes Harmon Face Values (3) and Bed Bath & Beyond (2).
Note: Amounts shown in the table above include all retail properties including those in redevelopment on a cash basis other than tenants in free rent periods which are shown at their initial cash rent.
|
| | |
| URBAN EDGE PROPERTIES | | |
| LEASING ACTIVITY | |
| For the quarter ended March 31, 2020 | |
| | | |
| | | |
|
| | | | | | | |
| | Quarter Ended March 31, 2020 |
| | GAAP(2) | | Cash(1) |
| New leases | | | |
| Number of new leases executed | 9 |
| | 9 |
|
| Total square feet | 133,674 |
| | 133,674 |
|
| Number of same space leases | 8 |
| | 8 |
|
| Same space square feet | 131,332 |
| | 131,332 |
|
| Prior rent per square foot | $ | 15.58 |
| | $ | 16.57 |
|
| New rent per square foot | $ | 21.37 |
| | $ | 19.79 |
|
| Same space weighted average lease term (years) | 15.4 |
| | 15.4 |
|
| Same space TIs per square foot | N/A |
| | $ | 61.66 |
|
| Rent spread | 37.2 | % | | 19.4 | % |
| | | | |
| Renewals & Options | | | |
| Number of leases executed | 25 |
| | 25 |
|
| Total square feet | 454,543 |
| | 454,543 |
|
| Number of same space leases | 25 |
| | 25 |
|
| Same space square feet | 454,543 |
| | 454,543 |
|
| Prior rent per square foot | $ | 12.81 |
| | $ | 13.25 |
|
| New rent per square foot | $ | 14.43 |
| | $ | 13.99 |
|
| Same space weighted average lease term (years) | 7.4 |
| | 7.4 |
|
| Same space TIs per square foot | N/A |
| | $ | — |
|
| Rent spread | 12.6 | % | | 5.6 | % |
| | | | |
| Total New Leases and Renewals & Options | | | |
| Number of leases executed | 34 |
| | 34 |
|
| Total square feet | 588,217 |
| | 588,217 |
|
| Number of same space leases | 33 |
| | 33 |
|
| Same space square feet | 585,875 |
| | 585,875 |
|
| Prior rent per square foot | $ | 13.43 |
| | $ | 14.00 |
|
| New rent per square foot | $ | 15.99 |
| | $ | 15.29 |
|
| Same space weighted average lease term (years) | 9.2 |
| | 9.2 |
|
| Same space TIs per square foot | N/A |
| | $ | 13.82 |
|
| Rent spread | 19.1 | % | | 9.2 | % |
(1) Rents are not calculated on a straight-line (GAAP) basis. Previous/expiring rent is the rent at expiry and includes any percentage rent paid. New rent is the rent paid at commencement.
(2) Rents are calculated on a straight-line (GAAP) basis.
|
| | |
| URBAN EDGE PROPERTIES | | |
| RETAIL PORTFOLIO LEASE EXPIRATION SCHEDULE | |
| As of March 31, 2020 | | |
| | | |
| | | |
|
| | | | | | | | | | | | | | | | | | | | | | | | | | |
| | ANCHOR TENANTS (SF>=10,000) | SHOP TENANTS (SF<10,000) | TOTAL TENANTS |
Year(1) | # of leases | Square Feet | % of Total SF | Weighted Avg ABR PSF(2) | # of leases | Square Feet | % of Total SF | Weighted Avg ABR PSF(2) | # of leases | Square Feet | % of Total SF | Weighted Avg ABR PSF(2) |
| | | | | | | | | | | | | |
| M-T-M | 2 |
| 29,000 |
| 0.2 | % | $ | 7.94 |
| 28 |
| 68,000 |
| 2.9% | $ | 45.62 |
| 30 |
| 97,000 |
| 0.7 | % | $ | 34.36 |
|
| 2020 | 8 |
| 187,000 |
| 1.6 | % | 20.65 |
| 59 |
| 145,000 |
| 6.3% | 37.84 |
| 67 |
| 332,000 |
| 2.3 | % | 28.16 |
|
| 2021 | 20 |
| 478,000 |
| 4.0 | % | 21.85 |
| 73 |
| 234,000 |
| 10.2% | 32.55 |
| 93 |
| 712,000 |
| 5.0 | % | 25.37 |
|
| 2022 | 22 |
| 837,000 |
| 7.1 | % | 14.64 |
| 63 |
| 166,000 |
| 7.2% | 35.21 |
| 85 |
| 1,003,000 |
| 7.1 | % | 18.04 |
|
| 2023 | 35 |
| 1,395,000 |
| 11.8 | % | 17.81 |
| 54 |
| 164,000 |
| 7.1% | 35.78 |
| 89 |
| 1,559,000 |
| 11.0 | % | 19.70 |
|
| 2024 | 34 |
| 1,268,000 |
| 10.7 | % | 18.07 |
| 66 |
| 227,000 |
| 9.8% | 34.16 |
| 100 |
| 1,495,000 |
| 10.6 | % | 20.51 |
|
| 2025 | 24 |
| 991,000 |
| 8.3 | % | 15.33 |
| 43 |
| 160,000 |
| 6.9% | 34.69 |
| 67 |
| 1,151,000 |
| 8.1 | % | 18.02 |
|
| 2026 | 10 |
| 493,000 |
| 4.1 | % | 11.53 |
| 56 |
| 186,000 |
| 8.1% | 35.49 |
| 66 |
| 679,000 |
| 4.8 | % | 18.09 |
|
| 2027 | 12 |
| 532,000 |
| 4.5 | % | 16.32 |
| 37 |
| 164,000 |
| 7.1% | 34.40 |
| 49 |
| 696,000 |
| 4.9 | % | 20.58 |
|
| 2028 | 10 |
| 359,000 |
| 3.0 | % | 23.65 |
| 28 |
| 110,000 |
| 4.8% | 41.49 |
| 38 |
| 469,000 |
| 3.3 | % | 27.84 |
|
| 2029 | 28 |
| 1,386,000 |
| 11.7 | % | 18.97 |
| 34 |
| 129,000 |
| 5.6% | 43.25 |
| 62 |
| 1,515,000 |
| 10.7 | % | 21.04 |
|
| 2030 | 14 |
| 980,000 |
| 8.3 | % | 13.27 |
| 23 |
| 83,000 |
| 3.6% | 39.59 |
| 37 |
| 1,063,000 |
| 7.5 | % | 15.32 |
|
| Thereafter | 31 |
| 2,245,000 |
| 18.9 | % | 15.07 |
| 15 |
| 71,000 |
| 3.1% | 34.45 |
| 46 |
| 2,316,000 |
| 16.3 | % | 15.66 |
|
| Subtotal/Average | 250 |
| 11,180,000 |
| 94.2 | % | $ | 16.64 |
| 579 |
| 1,907,000 |
| 82.7% | $ | 37.14 |
| 829 |
| 13,087,000 |
| 92.3 | % | $ | 19.63 |
|
| Vacant | 18 |
| 692,000 |
| 5.8 | % | N/A |
| 143 |
| 399,000 |
| 17.3% | N/A |
| 161 |
| 1,091,000 |
| 7.7 | % | N/A |
|
| Total/Average | 268 |
| 11,872,000 |
| 100 | % | N/A |
| 722 |
| 2,306,000 |
| 100% | N/A |
| 990 |
| 14,178,000 |
| 100 | % | N/A |
|
| | | | | | | | | | | | | |
(1) Year of expiration excludes tenant renewal options.
(2) Weighted average annual base rent per square foot is calculated by annualizing tenants' in-place, contractual, cash-basis rent including ground rent and excludes tenant reimbursements, concessions and storage rent.
Note: Amounts shown in table above include both current leases and signed leases that have not commenced on vacant spaces for all retail properties (including properties in redevelopment). The average base rent for our 943,000 square-foot warehouse property (excluded from the table above) is $5.73 per square foot as of March 31, 2020. The table also excludes 133,000 square feet of self-storage.
|
| | |
| URBAN EDGE PROPERTIES | | |
| RETAIL PORTFOLIO LEASE EXPIRATION SCHEDULE ASSUMING EXERCISE OF ALL RENEWALS AND OPTIONS |
| As of March 31, 2020 | | |
| | | |
| | | |
|
| | | | | | | | | | | | | | | | | | | | | | | | | | |
| | ANCHOR TENANTS (SF>=10,000) | SHOP TENANTS (SF<10,000) | TOTAL TENANTS |
Year(1) | # of leases | Square Feet | % of Total SF | Weighted Avg ABR PSF(2) | # of leases | Square Feet | % of Total SF | Weighted Avg ABR PSF(2) | # of leases | Square Feet | % of Total SF | Weighted Avg ABR PSF(2) |
| | | | | | | | | | | | | |
| M-T-M | 2 |
| 29,000 |
| 0.2 | % | $ | 7.94 |
| 28 |
| 68,000 |
| 2.9% | $ | 45.62 |
| 30 |
| 97,000 |
| 0.7 | % | $ | 34.36 |
|
| 2020 | 5 |
| 142,000 |
| 1.2 | % | 17.01 |
| 55 |
| 134,000 |
| 5.8% | 39.17 |
| 60 |
| 276,000 |
| 2.0 | % | 27.77 |
|
| 2021 | 8 |
| 160,000 |
| 1.3 | % | 20.49 |
| 56 |
| 157,000 |
| 6.8% | 34.33 |
| 64 |
| 317,000 |
| 2.2 | % | 27.35 |
|
| 2022 | 3 |
| 87,000 |
| 0.7 | % | 10.91 |
| 39 |
| 101,000 |
| 4.4% | 41.13 |
| 42 |
| 188,000 |
| 1.3 | % | 27.15 |
|
| 2023 | 8 |
| 221,000 |
| 1.9 | % | 21.30 |
| 31 |
| 76,000 |
| 3.3% | 41.24 |
| 39 |
| 297,000 |
| 2.1 | % | 26.40 |
|
| 2024 | 4 |
| 72,000 |
| 0.6 | % | 17.35 |
| 42 |
| 121,000 |
| 5.3% | 37.87 |
| 46 |
| 193,000 |
| 1.4 | % | 30.22 |
|
| 2025 | 9 |
| 284,000 |
| 2.4 | % | 17.91 |
| 28 |
| 90,000 |
| 3.9% | 37.12 |
| 37 |
| 374,000 |
| 2.6 | % | 22.53 |
|
| 2026 | 5 |
| 136,000 |
| 1.1 | % | 13.22 |
| 40 |
| 115,000 |
| 5.0% | 40.99 |
| 45 |
| 251,000 |
| 1.8 | % | 25.94 |
|
| 2027 | 5 |
| 114,000 |
| 1.0 | % | 18.64 |
| 29 |
| 73,000 |
| 3.2% | 29.70 |
| 34 |
| 187,000 |
| 1.3 | % | 22.96 |
|
| 2028 | 7 |
| 363,000 |
| 3.1 | % | 15.73 |
| 26 |
| 81,000 |
| 3.5% | 38.98 |
| 33 |
| 444,000 |
| 3.1 | % | 19.97 |
|
| 2029 | 15 |
| 463,000 |
| 3.9 | % | 21.66 |
| 25 |
| 85,000 |
| 3.7% | 46.78 |
| 40 |
| 548,000 |
| 3.9 | % | 25.56 |
|
| 2030 | 12 |
| 315,000 |
| 2.7 | % | 22.90 |
| 19 |
| 68,000 |
| 2.9% | 40.83 |
| 31 |
| 383,000 |
| 2.7 | % | 26.08 |
|
| Thereafter | 167 |
| 8,794,000 |
| 74.1 | % | 23.53 |
| 161 |
| 738,000 |
| 32.0% | 43.59 |
| 328 |
| 9,532,000 |
| 67.2 | % | 25.08 |
|
| Subtotal/Average | 250 |
| 11,180,000 |
| 94.2 | % | $ | 22.51 |
| 579 |
| 1,907,000 |
| 82.7% | $ | 40.86 |
| 829 |
| 13,087,000 |
| 92.3 | % | $ | 25.19 |
|
| Vacant | 18 |
| 692,000 |
| 5.8 | % | N/A |
| 143 |
| 399,000 |
| 17.3% | N/A |
| 161 |
| 1,091,000 |
| 7.7 | % | N/A |
|
| Total/Average | 268 |
| 11,872,000 |
| 100 | % | N/A |
| 722 |
| 2,306,000 |
| 100% | N/A |
| 990 |
| 14,178,000 |
| 100 | % | N/A |
|
| | | | | | | | | | | | | |
(1) Year of expiration includes tenant renewal options.
(2) Weighted average annual base rent per square foot is calculated by annualizing tenants' in-place, contractual, cash-basis rent including ground rent and excludes tenant reimbursements, concessions and storage rent and is adjusted assuming all option rents specified in the underlying leases are exercised. Weighted average annual base rent for leases whose future option rent is based on fair market value or CPI is reported at the last stated option rent in the respective lease.
Note: Amounts shown in table above include both current leases and signed leases that have not commenced on vacant spaces for all retail properties (including properties in redevelopment). The average base rent for our 943,000 square-foot warehouse property (excluded from the table above) assuming exercise of all options at future tenant rent is $6.87 per square foot as of March 31, 2020. The table also excludes 133,000 square feet of self-storage.
|
| | |
| URBAN EDGE PROPERTIES | | |
| PROPERTY STATUS REPORT |
| As of March 31, 2020 | | |
| (dollars in thousands, except per sf amounts) | | |
| | | |
|
| | | | | | |
| Property | Total Square Feet (1) | Percent Leased(1) | Weighted Average ABR PSF(2) | Mortgage Debt(7) | Major Tenants |
| | | | | | |
| SHOPPING CENTERS AND MALLS: | | |
| California: | | | | | |
Vallejo (leased through 2043)(3) | 45,000 |
| 100.0% | 12.00 | — | Best Buy |
| Walnut Creek (Olympic) | 31,000 |
| 100.0% | 70.00 | — | Anthropologie |
Walnut Creek (Mt. Diablo)(4) | 7,000 |
| —% | — | — |
|
| Connecticut: | | | | | |
| Newington | 189,000 |
| 100.0% | 9.97 | — | Walmart, Staples |
| Maryland: | | | | | |
| Towson (Goucher Commons) | 155,000 |
| 98.6% | 24.48 | — | Staples, HomeGoods, Tuesday Morning, Five Below, Ulta, Kirkland's, Sprouts, DSW |
| Rockville | 94,000 |
| 98.0% | 27.21 | — | Regal Entertainment Group |
Wheaton (leased through 2060)(3) | 66,000 |
| 100.0% | 16.70 | — | Best Buy |
| Massachusetts: | | | | | |
Cambridge (leased through 2033)(3) | 48,000 |
| 100.0% | 24.57 | — | PetSmart, A.C. Moore |
Revere (Wonderland Marketplace)(6) | 140,000 |
| 100.0% | 13.16 | — | Big Lots, Planet Fitness, Marshalls, Get Air |
| Missouri: | | | | | |
| Manchester | 131,000 |
| 100.0% | 11.22 | $12,500 | Academy Sports, Bob's Discount Furniture, Pan-Asia Market |
| New Hampshire: | | | | | |
Salem (leased through 2102)(3) | 39,000 |
| 100.0% | 10.51 | — | Fun City (lease not commenced) |
| New Jersey: | | | | | |
| Bergen Town Center - East, Paramus | 253,000 |
| 97.5% | 21.78 | — | Lowe's, REI, Kirkland's, Best Buy |
| Bergen Town Center - West, Paramus | 1,059,000 |
| 97.7% | 33.47 | $300,000 | Target, Century 21, Whole Foods Market, Burlington, Marshalls, Nordstrom Rack, Saks Off 5th, HomeGoods, H&M, Bloomingdale's Outlet, Nike Factory Store, Old Navy, Neiman Marcus Last Call Studio |
| Brick (Brick Commons) | 278,000 |
| 94.7% | 19.32 | $50,000 | Kohl's, ShopRite, Marshalls, Kirkland's |
Carlstadt (leased through 2050)(3) | 78,000 |
| 100.0% | 24.39 | — | Stop & Shop |
| Cherry Hill (Plaza at Cherry Hill) | 422,000 |
| 73.0% | 14.43 | $28,930 | LA Fitness, Aldi, Raymour & Flanigan, Restoration Hardware, Total Wine, Guitar Center, Sam Ash Music |
| East Brunswick (Brunswick Commons) | 427,000 |
| 100.0% | 14.52 | $63,000 | Lowe's, Kohl's, Dick's Sporting Goods, P.C. Richard & Son, T.J. Maxx, LA Fitness |
| East Hanover (200 - 240 Route 10 West) | 343,000 |
| 96.1% | 22.12 | $63,000 | The Home Depot, Dick's Sporting Goods, Saks Off Fifth, Marshalls, Paper Store |
| East Hanover (280 Route 10 West) | 28,000 |
| 100.0% | 34.71 | — | REI |
| East Rutherford | 197,000 |
| 98.3% | 12.72 | $23,000 | Lowe's |
| Garfield (Garfield Commons) | 289,000 |
| 100.0% | 15.22 | $40,300 | Walmart, Burlington, Marshalls, PetSmart, Ulta |
| Hackensack | 275,000 |
| 99.4% | 23.68 | $66,400 | The Home Depot, Staples, Petco, 99 Ranch |
| Hazlet | 95,000 |
| 100.0% | 3.70 | — | Stop & Shop(5) |
| Jersey City (Hudson Mall) | 382,000 |
| 80.8% | 17.82 | $23,445 | Marshalls, Big Lots, Retro Fitness, Staples, Old Navy |
| Jersey City (Hudson Commons) | 236,000 |
| 100.0% | 13.53 | $28,862 | Lowe's, P.C. Richard & Son |
| Kearny (Kearny Commons) | 114,000 |
| 100.0% | 21.85 | — | LA Fitness, Marshalls, Ulta |
| Lodi (Route 17 North) | 171,000 |
| —% | — | — | |
| Lodi (Washington Street) | 85,000 |
| 87.6% | 22.06 | — | Blink Fitness, Aldi |
| Manalapan | 208,000 |
| 100.0% | 19.32 | — | Best Buy, Bed Bath & Beyond, Raymour & Flanigan, PetSmart, Avalon Flooring (lease not commenced) |
| Marlton (Marlton Commons) | 218,000 |
| 100.0% | 15.97 | $37,400 | Kohl's, ShopRite, PetSmart |
|
| | |
| URBAN EDGE PROPERTIES | | |
| PROPERTY STATUS REPORT |
| As of March 31, 2020 | | |
| (dollars in thousands, except per sf amounts) | | |
| | | |
|
| | | | | | |
| Property | Total Square Feet (1) | Percent Leased(1) | Weighted Average ABR PSF(2) | Mortgage Debt(7) | Major Tenants |
| Middletown (Town Brook Commons) | 231,000 |
| 96.9% | 13.93 | $31,400 | Kohl's, Stop & Shop |
| Millburn | 104,000 |
| 98.8% | 26.87 | $23,694 | Trader Joe's, CVS, PetSmart |
| Montclair | 21,000 |
| 100.0% | 32.00 | — | Whole Foods Market |
Morris Plains (Briarcliff Commons) (6) | 182,000 |
| 70.8% | 25.59 | — | Kohl's |
| North Bergen (Kennedy Commons) | 62,000 |
| 100.0% | 14.36 | — | Food Bazaar |
| North Bergen (Tonnelle Commons) | 410,000 |
| 99.5% | 21.83 | $100,000 | Walmart, BJ's Wholesale Club, PetSmart, Staples |
| North Plainfield (West End Commons) | 241,000 |
| 99.1% | 11.34 | $25,100 | Costco, The Tile Shop, La-Z-Boy, Petco, Da Vita Dialysis |
Paramus (leased through 2033)(3) | 63,000 |
| 100.0% | 47.18 | — | 24 Hour Fitness |
| Rockaway (Rockaway River Commons) | 189,000 |
| 91.5% | 14.26 | $27,800 | ShopRite, T.J. Maxx |
South Plainfield (Stelton Commons) (leased through 2039)(3) | 56,000 |
| 96.3% | 21.36 | — | Staples, Party City |
| Totowa | 271,000 |
| 100.0% | 17.52 | $50,800 | The Home Depot, Bed Bath & Beyond, buybuy Baby, Marshalls, Staples |
| Turnersville | 98,000 |
| 100.0% | 10.06 | — | At Home, Verizon Wireless |
| Union (2445 Springfield Ave) | 232,000 |
| 100.0% | 17.85 | $45,600 | The Home Depot |
| Union (West Branch Commons) | 278,000 |
| 96.2% | 16.63 | — | Lowe's, Burlington, Office Depot |
| Watchung (Greenbrook Commons) | 170,000 |
| 94.9% | 18.15 | $26,871 | BJ's Wholesale Club |
| Westfield (One Lincoln Plaza) | 22,000 |
| 89.9% | 33.00 | $4,730 | Five Guys, PNC Bank |
| Woodbridge (Woodbridge Commons) | 225,000 |
| 94.7% | 13.04 | $22,100 | Walmart, Charisma Furniture |
| Woodbridge (Plaza at Woodbridge) | 337,000 |
| 89.5% | 18.01 | $55,340 | Best Buy, Raymour & Flanigan, Lincoln Tech, Retro Fitness, Bed Bath & Beyond and buybuy Baby (lease not commenced) |
| New York: | | | | | |
| Bronx (Gun Hill Commons) | 81,000 |
| 90.9% | 36.48 | $24,418 | Planet Fitness, Aldi |
| Bronx (Bruckner Commons) | 375,000 |
| 82.1% | 27.08 | — | Kmart, ShopRite, Burlington |
| Bronx (Shops at Bruckner) | 114,000 |
| 72.1% | 38.80 | $10,823 | Marshalls, Old Navy |
Brooklyn (Kingswood Center)(6) | 130,000 |
| 99.1% | 35.06 | $72,356 | T.J. Maxx, New York Sports Clubs, Visiting Nurse Service of NY |
Brooklyn (Kingswood Crossing)(6) | 110,000 |
| 59.1% | 43.47 | — | Target, Marshalls |
| Buffalo (Amherst Commons) | 311,000 |
| 98.1% | 10.94 | — | BJ's Wholesale Club, T.J. Maxx, Burlington, HomeGoods, LA Fitness |
Commack (leased through 2021)(3) | 47,000 |
| 100.0% | 20.69 | — | PetSmart, Ace Hardware |
Dewitt (Marshall Plaza) (leased through 2041)(3) | 46,000 |
| 100.0% | 22.38 | — | Best Buy |
Freeport (Meadowbrook Commons) (leased through 2040)(3) | 44,000 |
| 100.0% | 22.31 | — | Bob's Discount Furniture |
| Freeport (Freeport Commons) | 173,000 |
| 100.0% | 22.23 | $43,100 | The Home Depot, Staples |
| Huntington (Huntington Commons) | 204,000 |
| 76.4% | 20.35 | — | Marshalls, Old Navy, Petco, ShopRite (lease not commenced) |
| Inwood (Burnside Commons) | 100,000 |
| 96.5% | 19.42 | — | Stop & Shop |
| Mt. Kisco (Mt. Kisco Commons) | 189,000 |
| 96.9% | 16.94 | $13,359 | Target, Stop & Shop |
New Hyde Park (leased through 2029)(3) | 101,000 |
| 100.0% | 21.93 | — | Stop & Shop |
| Queens (Cross Bay Commons) | 46,000 |
| 77.7% | 41.71 | — | |
Rochester (Henrietta) (leased through 2056)(3) | 165,000 |
| 100.0% | 4.63 | — | Kohl's |
| Staten Island (Forest Commons) | 165,000 |
| 96.3% | 23.42 | — | Western Beef, Planet Fitness, Mavis Discount Tire, NYC Public School |
|
| | |
| URBAN EDGE PROPERTIES | | |
| PROPERTY STATUS REPORT |
| As of March 31, 2020 | | |
| (dollars in thousands, except per sf amounts) | | |
| | | |
|
| | | | | | |
| Property | Total Square Feet (1) | Percent Leased(1) | Weighted Average ABR PSF(2) | Mortgage Debt(7) | Major Tenants |
Yonkers Gateway Center
| 448,000 |
| 97.3% | 17.30 | $29,717 | Burlington, Marshalls, Homesense, Best Buy, DSW, PetSmart, Alamo Drafthouse Cinema |
| Pennsylvania: | | | | | |
| Bensalem (Marten Commons) | 185,000 |
| 96.6% | 13.88 | — | Kohl's, Ross Dress for Less, Staples, Petco |
| Broomall | 169,000 |
| 100.0% | 10.31 | — | Giant Food, Planet Fitness, A.C. Moore, PetSmart |
| Glenolden (MacDade Commons) | 102,000 |
| 100.0% | 12.81 | — | Walmart |
| Lancaster (Lincoln Plaza) | 228,000 |
| 100.0% | 4.94 | — | Lowe's, Community Aid, Mattress Firm |
Springfield (leased through 2025)(3) | 41,000 |
| 100.0% | 22.99 | — | PetSmart |
Wilkes-Barre (461-499 Mundy Street)(6) | 179,000 |
| 78.4% | 13.57 | — | Bob's Discount Furniture, Ross Dress for Less, Marshalls, Petco, Tuesday Morning |
Wyomissing (leased through 2065)(3) | 76,000 |
| 100.0% | 14.70 | — | LA Fitness, PetSmart |
| South Carolina: | | | | | |
Charleston (leased through 2063)(3) | 45,000 |
| 100.0% | 15.10 | — | Best Buy |
| Virginia: | | | | | |
Norfolk (leased through 2069)(3) | 114,000 |
| 100.0% | 7.79 | — | BJ's Wholesale Club |
| Puerto Rico: | | | | | |
| Las Catalinas | 356,000 |
| 53.6% | 45.40 | $128,822 | Forever 21, Old Navy |
| Montehiedra | 539,000 |
| 94.1% | 18.45 | $112,876 | Kmart, The Home Depot, Marshalls, Caribbean Cinemas, Tiendas Capri, Old Navy |
| Total Shopping Centers and Malls | 14,178,000 |
| 92.3% | $19.66 | $1,585,743 | |
| WAREHOUSES: | | | | | |
| East Hanover Warehouses | 943,000 |
| 100.0% | 5.73 | $40,700 | J & J Tri-State Delivery, Foremost Groups, PCS Wireless, Fidelity Paper & Supply, Meyer Distributing, Consolidated Simon Distributors, Givaudan Flavors, Reliable Tire, LineMart |
| Total Urban Edge Properties | 15,121,000 |
| 92.8% | $18.72 | $1,626,443 | |
(1) Percent leased is expressed as the percentage of gross leasable area subject to a lease. The Company excludes 133,000 sf of self-storage from the report above.
(2) Weighted average annual base rent per square foot is the current base rent on an annualized basis. It includes executed leases for which rent has not commenced and excludes tenant expense reimbursements, free rent periods, concessions and storage rent. Excluding ground leases where the Company is the lessor, the weighted average annual rent per square foot for our retail portfolio is $21.81 per square foot.
(3) The Company is a lessee under a ground or building lease. Ground and building lease terms include exercised options and options that may be exercised in future periods. For building leases, the total square feet disclosed for the building will revert to the lessor upon lease expiration. At Salem, the ground lease is for a portion of the parking area only.
(4) Our ownership of Walnut Creek (Mt. Diablo) is 95%.
(5) The tenant never commenced operations at this location but continues to pay rent.
(6) Not included in the same-property pool for the purposes of calculating same-property cash NOI.
(7) Mortgage debt balances exclude unamortized debt issuance costs.
|
| | |
| URBAN EDGE PROPERTIES | | |
| PROPERTY ACQUISITIONS AND DISPOSITIONS | |
| For the quarter ended March 31, 2020 | | |
| (dollars in thousands) | | |
| | | |
|
| | | | | | | | | | |
| 2020 Property Acquisitions: | | | | | | |
| | | | | | | | |
| Date Acquired | Property Name | City | State | GLA | | Price(1) | |
| 2/12/2020 | Kingswood Center | Brooklyn | NY | 130,000 |
| | $ | 88,800 |
| |
| 2/12/2020 | Kingswood Crossing | Brooklyn | NY | 110,000 |
| | 76,000 |
| |
| | | | | | | | |
| 2020 Property Dispositions: | | | | | | |
| | | | | | | | |
| Date Disposed | Property Name | City | State | GLA | | Price | |
| 1/24/2020 | Signal Hill | Signal Hill | CA | 45,000 |
| | $ | 16,600 |
| |
| 1/31/2020 | Easton Commons | Bethlehem | PA | 153,000 |
| | 12,534 |
| |
| 3/12/2020 | Lawnside Commons | Lawnside | NJ | 151,000 |
| | 31,550 |
| |
(1) Excludes $2.5 million of transaction costs related to property acquisitions.
|
| | |
| URBAN EDGE PROPERTIES | | |
| DEVELOPMENT, REDEVELOPMENT AND ANCHOR REPOSITIONING PROJECTS | |
| As of March 31, 2020 | | |
| (in thousands, except square footage data) | | |
| | | |
|
| | | | | | | | | |
| ACTIVE PROJECTS | Estimated Gross Cost(1) | | Incurred as of 3/31/20 | Target Stabilization(2) | Description and status |
Kearny Commons(3) | $ | 11,600 |
| | $ | 9,800 |
| 1Q21 | Expanding by 22,000 sf to accommodate a 10,000 sf Ulta (open) and other tenants as well as adding a freestanding Starbucks (open) |
Tonnelle Commons(3) | 10,800 |
| | 10,500 |
| 4Q21 | 102,000± sf, adding CubeSmart self-storage facility on excess land (open) |
The Plaza at Woodbridge(3) | 8,900 |
| | 500 |
| 2Q21 | Backfill former Toys "R" Us space with Bed Bath and Beyond and buybuy Baby |
Huntington Commons(3) | 5,900 |
| | 4,500 |
| 1Q21 | Converting 11,000± sf basement space into street-front retail |
Garfield Commons - Phase II(3) | 4,900 |
| | 3,700 |
| 1Q21 | 18,000± sf of shops (Five Below open; balance of space under construction) |
The Plaza at Woodbridge(3) | 4,100 |
| | 4,100 |
| 2Q22 | Repurposing 82,000 sf of unused basement space into self-storage (open) |
Mt. Kisco Commons(3) | 3,000 |
| | 2,800 |
| 1Q21 | Converting former sit-down restaurant into a Chipotle (open) and another quick service restaurant (under construction) |
Wilkes-Barre(4) | 2,200 |
| | 700 |
| 2Q21 | New Panera Bread pad |
Salem(3) | 1,400 |
| | 200 |
| 1Q21 | Retenanting former Babies "R" Us with Fun City |
| | | | | | |
| Total | $ | 52,800 |
| (5)(6) | $ | 36,800 |
| |
| | | | | | |
(1) Estimated gross cost includes the allocation of internal costs such as labor, interest and taxes.
(2) Target Stabilization reflects the first quarter in which at least 80% of the expected cash NOI from the project has commenced. A project achieving Target Stabilization is classified as Completed whether or not all costs have been expended and remains listed as a Completed project for one year in the table on page 27. The Target Stabilization date is an estimate and is subject to change resulting from uncertainties inherent in the development process and not wholly under the Company's control. Construction activity is currently prohibited or significantly curtailed as a result of COVID-19. The estimated stabilization dates shown reflect our best estimate assuming activity is allowed to resume in the second half of 2020.
(3) Results from these properties are included in our same-property metrics.
(4) Results from this property are included in non-same property Cash NOI and excluded in our same-property metrics and same-property including redevelopment metrics.
(5) The estimated, unleveraged yield for total Active projects is 8% based on total estimated project costs and the incremental, unleveraged NOI directly attributable to the projects unless otherwise noted. The incremental, unleveraged NOI for Active projects excludes NOI generated outside the project scope such as the impact on future lease rollovers or on the long-term value of the property. The unleveraged yield for projects related to vacant spaces as a result of bankruptcy is based on the total cash NOI directly attributable to the project and the estimated project costs.
(6) In March 2020, LA Fitness notified the Company of its intention to terminate its recently executed 39,000 sf lease at the Shops at Bruckner. The Company is in active dialogue with them to further assess their plans at this location. Due to the termination notice, the Company removed this lease from the schedule of active projects which reduced gross costs by $22.6 million, the amount previously attributed to this redevelopment. The Company also reduced its leased occupancy for the quarter ended March 31, 2020 to account for this termination.
|
| | |
| URBAN EDGE PROPERTIES | | |
| DEVELOPMENT, REDEVELOPMENT AND ANCHOR REPOSITIONING PROJECTS | |
| As of March 31, 2020 | | |
| (in thousands, except square footage data) | | |
| | | |
|
| | | | | | | | | |
| COMPLETED PROJECTS | Estimated Gross Cost(1) | | Incurred as of 3/31/20 | Stabilization(2) | Description and status |
Bergen Town Center-Phase I(3) | $ | 60,300 |
| | $ | 60,400 |
| 3Q19 | Added Burlington (open) to the main mall and 15,000± sf adjacent to REI (Kirkland’s open in 10,000 sf); expanded Kay (open): replaced bank with Cava Grill (open) and Sticky's Finger Joint (open); replaced east deck and upgraded west deck (complete) |
| Briarcliff Commons | 7,900 |
| | 7,200 |
| 3Q19 | Renovated façade; tenant repositioned; added Chick-fil-A (open) |
West Branch Commons(3) | 5,300 |
| | 5,300 |
| 3Q19 | Retenanted former Toys "R" Us with Burlington (open) |
Amherst Commons(3) | 4,900 |
| | 4,900 |
| 3Q19 | Retenanted former Toys "R" Us with Burlington (open) |
Gun Hill Commons(3) | 1,700 |
| | 1,700 |
| 4Q19 | Expanded Aldi (open) |
Bergen Town Center-Phase IIC(3) | 1,600 |
| | 1,100 |
| 3Q19 | Lands' End (open) and Chopt (open) replaced dressbarn |
Woodbridge Commons(3) | 1,300 |
| | 1,300 |
| 2Q19 | Charisma Furniture (open) replaced Syms |
Rockaway River Commons - Phase III(3) | 800 |
| | 800 |
| 2Q19 | Expanded ShopRite by 6,000± sf at its expense |
| Total | $ | 83,800 |
| (4) | $ | 82,700 |
| | |
|
| | |
FUTURE REDEVELOPMENT(5) | Location | Opportunity |
| Lodi | Lodi, NJ | Redevelop entire center for retail and/or warehouse; develop outparcel building |
| Bergen Town Center | Paramus, NJ | Develop a mix of uses including residential, hotel, and/or office; common area improvements and enhancements to improve merchandising |
| The Plaza at Cherry Hill | Cherry Hill, NJ | Renovating center |
| The Outlets at Montehiedra | San Juan, PR | Developing 20,000± sf retail on excess land; marketing |
| Marlton Commons | Marlton, NJ | Develop new small shop space and renovate façade |
| Briarcliff Commons | Morris Plains, NJ | Retenant former ShopRite box, add pad site, common area improvements |
| Hudson Mall | Jersey City, NJ | Develop a mix of uses surrounding Hudson Mall as well as redeveloping parts of the mall to create a retail destination and retenant former Toys "R" Us box |
| Wilkes-Barre | Wilkes-Barre, PA | Retenant former Babies "R" Us box |
Shops at Bruckner(6) | Bronx, NY | Retenant end-cap anchor space, reposition small shops, facade renovations and common area improvements |
| Brick Commons | Bricktown, NJ | Develop new pad |
| Huntington Commons | Huntington, NY | Retenant former Kmart box with ShopRite (executed) |
| Brunswick Commons | East Brunswick, NJ | Develop new pad |
| Las Catalinas Mall | Caguas, PR | Retenant former Kmart box |
(1) Estimated gross cost includes the allocation of internal costs such as labor, interest and taxes.
(2) Stabilization reflects the first quarter in which at least 80% of the expected cash NOI from the project has commenced. A project achieving Stabilization is classified as Completed whether or not all costs have been expended and remains listed as a Completed project for one year in the table above.
(3) Results from these properties are included in our same-property metrics.
(4) The estimated unleveraged yield for Completed projects is 7% based on the total estimated project costs of and the incremental unleveraged NOI expected from the projects. The incremental unleveraged NOI for Completed projects excludes NOI generated outside the project scope such as the impact on future lease rollovers or on the long-term value of the property. The unleveraged yield for projects related to vacant spaces as a result of bankruptcy is based on the total cash NOI directly attributable to the project and the estimated project costs.
(5) The Company has identified future redevelopment opportunities which are, or will soon be, in preliminary planning phases and as such, may not ultimately become active projects. Proceeding with these investments is subject to many factors outside of the Company's control, and it is possible that municipal or other approvals may delay or suspend our ability to proceed with such plans. The execution of these projects is discretionary and we are under no current obligation to fund these projects.
(6) In March 2020, LA Fitness notified the Company of its intention to terminate its recently executed 39,000 sf lease, and the Company is in active dialogue with them to further assess their plans at this location.
|
| | |
| URBAN EDGE PROPERTIES | | |
| DEBT SUMMARY | |
| As of March 31, 2020 and December 31, 2019 | | |
| (in thousands) | | |
| | | |
|
| | | | | | | |
| | March 31, 2020 | | December 31, 2019 |
| Secured fixed rate debt | $ | 1,457,292 |
| | $ | 1,386,748 |
|
| Secured variable rate debt | 169,151 |
| | 169,500 |
|
| Unsecured variable rate debt | 250,000 |
| | — |
|
| Total debt | $ | 1,876,443 |
| | $ | 1,556,248 |
|
| | | | |
| % Secured fixed rate debt | 77.7 | % | | 89.1 | % |
| % Secured variable rate debt | 9.0 | % | | 10.9 | % |
| % Unsecured variable rate debt | 13.3 | % | | — | % |
| Total | 100 | % | | 100 | % |
| | | | |
| | | | |
| Secured mortgage debt | $ | 1,626,443 |
| | $ | 1,556,248 |
|
Unsecured debt(1) | 250,000 |
| | — |
|
| Total debt | $ | 1,876,443 |
| | $ | 1,556,248 |
|
| | | | |
| % Secured mortgage debt | 87 | % |
| 100 | % |
| % Unsecured mortgage debt | 13 | % | | N/A |
|
| Total | 100 | % | | 100 | % |
| | | | |
| Weighted average remaining maturity on secured mortgage debt | 5.3 years |
| | 5.7 years |
|
| Weighted average remaining maturity on unsecured debt | 3.8 years |
| | N/A |
|
| | | | |
| | | | |
| Total market capitalization (see page 16) | $ | 2,959,438 |
| | |
| | | | |
| % Secured mortgage debt | 55 | % | | |
| % Unsecured debt | 8 | % | | |
| Total debt: Total market capitalization | 63 | % | | |
| | | | |
| | | | |
Weighted average interest rate(2) | | | |
| Secured mortgage debt | 4.07 | % | | 4.04 | % |
| Unsecured debt (revolving credit facilities) | 2.00 | % | | — | % |
| Total debt | 3.80 | % | | 4.04 | % |
| | | | |
Note: All amounts and calculations exclude unamortized debt issuance costs on mortgages payable.
(1) In March 2020, the Company borrowed $250 million under its revolving credit agreement and $350 million remains available for withdrawal. The agreement has a maturity date of January 29, 2024 with two six-month extension options. Borrowings under the agreement bear interest at LIBOR plus an applicable margin of 1.05% to 1.50% and an annual facility fee of 15 to 30 basis points based on our current leverage ratio.
(2) Weighted average interest rate is calculated based on balances outstanding at the respective dates.
|
| | |
| URBAN EDGE PROPERTIES | | |
| MORTGAGE DEBT SUMMARY | |
| As of March 31, 2020 (unaudited) and December 31, 2019 | | |
| (dollars in thousands) | | |
| | | |
|
| | | | | | | | | | | |
| Debt Instrument | Maturity Date | Rate | March 31, 2020 | December 31, 2019 | Percent of Mortgage Debt at March 31, 2020 |
| Montehiedra (senior loan) | 7/6/21 | 5.33 | % | $ | 82,876 |
| $ | 83,202 |
| 5.1 | % |
| Montehiedra (junior loan) | 7/6/21 | 3.00 | % | 30,000 |
| 30,000 |
| 1.8 | % |
Cherry Hill (Plaza at Cherry Hill)(4) | 5/24/22 | 3.18 | % | 28,930 |
| 28,930 |
| 1.8 | % |
Westfield (One Lincoln Plaza)(4) | 5/24/22 | 3.18 | % | 4,730 |
| 4,730 |
| 0.3 | % |
Woodbridge (Plaza at Woodbridge)(4) | 5/25/22 | 3.18 | % | 55,340 |
| 55,340 |
| 3.4 | % |
| Bergen Town Center - West, Paramus | 4/8/23 | 3.56 | % | 300,000 |
| 300,000 |
| 18.5 | % |
| Bronx (Shops at Bruckner) | 5/1/23 | 3.90 | % | 10,823 |
| 10,978 |
| 0.7 | % |
Jersey City (Hudson Mall)(3) | 12/1/23 | 5.07 | % | 23,445 |
| 23,625 |
| 1.4 | % |
Yonkers Gateway Center(5) | 4/6/24 | 4.16 | % | 29,717 |
| 30,122 |
| 1.8 | % |
Las Catalinas(7) | 8/6/24 | 4.43 | % | 128,822 |
| 129,335 |
| 7.9 | % |
Jersey City (Hudson Commons)(1) | 11/15/24 | 3.48 | % | 28,862 |
| 29,000 |
| 1.8 | % |
Watchung(1) | 11/15/24 | 3.48 | % | 26,871 |
| 27,000 |
| 1.7 | % |
Bronx (1750-1780 Gun Hill Road)(1) | 12/1/24 | 3.48 | % | 24,418 |
| 24,500 |
| 1.5 | % |
| Brick | 12/10/24 | 3.87 | % | 50,000 |
| 50,000 |
| 3.1 | % |
| North Plainfield | 12/10/25 | 3.99 | % | 25,100 |
| 25,100 |
| 1.5 | % |
| Middletown | 12/1/26 | 3.78 | % | 31,400 |
| 31,400 |
| 1.9 | % |
| Rockaway | 12/1/26 | 3.78 | % | 27,800 |
| 27,800 |
| 1.7 | % |
| East Hanover (200 - 240 Route 10 West) | 12/10/26 | 4.03 | % | 63,000 |
| 63,000 |
| 3.9 | % |
| North Bergen (Tonnelle Ave) | 4/1/27 | 4.18 | % | 100,000 |
| 100,000 |
| 6.1 | % |
| Manchester | 6/1/27 | 4.32 | % | 12,500 |
| 12,500 |
| 0.8 | % |
| Millburn | 6/1/27 | 3.97 | % | 23,694 |
| 23,798 |
| 1.5 | % |
| Totowa | 12/1/27 | 4.33 | % | 50,800 |
| 50,800 |
| 3.1 | % |
| Woodbridge (Woodbridge Commons) | 12/1/27 | 4.36 | % | 22,100 |
| 22,100 |
| 1.4 | % |
| East Brunswick | 12/6/27 | 4.38 | % | 63,000 |
| 63,000 |
| 3.9 | % |
| East Rutherford | 1/6/28 | 4.49 | % | 23,000 |
| 23,000 |
| 1.4 | % |
Brooklyn (Kingswood Center)(6) | 2/6/28 | 5.07 | % | 72,356 |
| — |
| 4.4 | % |
| Hackensack | 3/1/28 | 4.36 | % | 66,400 |
| 66,400 |
| 4.1 | % |
| Marlton | 12/1/28 | 3.86 | % | 37,400 |
| 37,400 |
| 2.3 | % |
| East Hanover Warehouses | 12/1/28 | 4.09 | % | 40,700 |
| 40,700 |
| 2.5 | % |
| Union (2445 Springfield Ave) | 12/10/28 | 4.01 | % | 45,600 |
| 45,600 |
| 2.8 | % |
| Freeport (Freeport Commons) | 12/10/29 | 4.07 | % | 43,100 |
| 43,100 |
| 2.6 | % |
| Garfield | 12/1/30 | 4.14 | % | 40,300 |
| 40,300 |
| 2.5 | % |
Mt Kisco(2) | 11/15/34 | 6.40 | % | 13,359 |
| 13,488 |
| 0.8 | % |
| Total mortgage debt | | 4.07 | % | $ | 1,626,443 |
| $ | 1,556,248 |
| 100 | % |
| Unamortized debt issuance costs | | | (9,590 | ) | (10,053 | ) | |
| Total mortgage debt, net | | | $ | 1,616,853 |
| $ | 1,546,195 |
| |
| |
(1) | Bears interest at one month LIBOR plus 190 bps. |
| |
(2) | The mortgage payable balance on the loan secured by Mt Kisco includes $0.9 million of unamortized debt discount as of both March 31, 2020 and December 31, 2019. The effective interest rate including amortization of the debt discount is 7.30% as of March 31, 2020. |
| |
(3) | The mortgage payable balance on the loan secured by Hudson Mall includes $0.9 million and $1.0 million of unamortized debt premium as of March 31, 2020 and December 31, 2019, respectively. The effective interest rate including amortization of the debt premium is 3.85% as of March 31, 2020. |
| |
(4) | Bears interest at one month LIBOR plus 160 bps. |
| |
(5) | The mortgage payable balance on the loan secured by Yonkers Gateway Center includes $0.5 million and $0.6 million of unamortized debt premium as of both March 31, 2020 and December 31, 2019, respectively. The effective interest rate including amortization of the debt premium is 3.70% as of March 31, 2020. |
| |
(6) | The mortgage payable balance on the loan secured by Kingswood Center includes $6.9 million of unamortized debt premium as of March 31, 2020. The effective interest rate including amortization of the debt premium is 3.44% as of March 31, 2020. |
| |
(7) | In April 2020, we notified the servicer of the non-recourse mortgage loan on Las Catalinas Mall in Puerto Rico that cash flow would be insufficient to make the April debt service payment and that we were unwilling to fund the shortfalls. The loan is in default, is subject to incremental default interest while the outstanding balance remains unpaid, and the lender has the ability to accelerate the full loan balance. We currently remain in active negotiations with the special servicer and no determination has been made as to the timing or ultimate resolution of this matter. |
|
| | |
| URBAN EDGE PROPERTIES | | |
| DEBT MATURITY SCHEDULE | |
| As of March 31, 2020 (unaudited) | | |
| (dollars in thousands) | | |
| | | |
|
| | | | | | | | | | | | | | | | | | | |
| | | | | | | | | |
| | Secured Debt | | Unsecured Debt | | | |
| Year | Amortization | Balloon Payments | Premium/(Discount) Amortization | | Revolving Credit Facilities | Total | Weighted Average Interest rate at maturity | Percent of Debt Maturing |
2020(1) | $ | 5,431 |
| $ | — |
| $ | 905 |
| | $ | — |
| $ | 6,336 |
| 4.4% | 0.3 | % |
| 2021 | 9,095 |
| 112,876 |
| 1,206 |
| | — |
| 123,177 |
| 4.7% | 6.6 | % |
| 2022 | 12,339 |
| 87,041 |
| 1,206 |
| | — |
| 100,586 |
| 3.3% | 5.4 | % |
| 2023 | 14,627 |
| 329,432 |
| 1,182 |
| | — |
| 345,241 |
| 3.7% | 18.4 | % |
| 2024 | 12,976 |
| 261,366 |
| 849 |
| | 250,000 |
| 525,191 |
| 3.1% | 28.0 | % |
| 2025 | 9,107 |
| 23,260 |
| 814 |
| | — |
| 33,181 |
| 4.1% | 1.8 | % |
| 2026 | 8,888 |
| 115,104 |
| 814 |
| | — |
| 124,806 |
| 4.0% | 6.6 | % |
| 2027 | 5,877 |
| 259,525 |
| 814 |
| | — |
| 266,216 |
| 4.3% | 14.2 | % |
| 2028 | 5,147 |
| 264,822 |
| 14 |
| | — |
| 269,983 |
| 4.4% | 14.4 | % |
| Thereafter | 9,948 |
| 72,133 |
| (355 | ) | | — |
| 81,726 |
| 4.3% | 4.3 | % |
| Total | $ | 93,435 |
| $ | 1,525,559 |
| $ | 7,449 |
| | $ | 250,000 |
| $ | 1,876,443 |
| 3.8% | 100 | % |
| | Unamortized debt issuance costs | | (9,590 | ) | | |
| | Total outstanding debt, net | | $ | 1,866,853 |
| | |
(1) Remainder of 2020.
|
| | |
| URBAN EDGE PROPERTIES | | |
| COVID-19 BUSINESS UPDATE | |
| | | |
Business Update
As the COVID-19 pandemic continues to evolve, we are carefully monitoring the situation and have taken precautions to protect the safety, health and well-being of our employees, tenants and stakeholders. Urban Edge’s management team is in discussions with all of its tenants to assess their current business plans and ability to comply with their lease agreements due to the operational disruptions caused by the COVID-19 pandemic. The purpose of this COVID-19 Business Update is to provide additional relevant operational and financial information in light of the evolving environment.
Community Outreach
In response to the COVID-19 pandemic, Urban Edge mobilized a task force that has been working closely with local municipal leaders to address immediate needs of those living in the neighborhoods served by our properties. Our focus has been to utilize our assets and skillsets in partnership with other organizations to support those in need. These efforts have included:
| |
| • | Launching the RAP4Bronx initiative out of Bruckner Commons in partnership with Bronx Community Board 9, Bronx Private Industry Council, The Skyline Charitable Foundation and York Studios to support the hardest hit district within the Bronx with essential items and meal distribution; |
| |
| • | Delivering hot meals to hospitals, police and EMS teams in Bergen County, Yonkers, the Bronx and Jersey City, and purchasing these meals from our tenants to support their businesses; |
| |
| • | Donating critical personal protective equipment to local organizations, such as the Hogar Cuna San Cristobal Orphanage in Puerto Rico, the Paramus Food Pantry and the Montefiore Medical Center; |
| |
| • | Donating and delivering personal care, cleaning, and food supplies to organizations such as the Office of Aging in Yonkers, Paramus Food Pantry in Bergen County, and AngelaCares in Jersey City; and |
| |
| • | Raising funds from employees and the community in support of a number of hospitals, local food organizations and other entities, such as the Hackensack Hospital COVID-19 Relief Fund, the RAP4Bronx efforts, and the Hogar Cuna San Cristobal Orphanage. |
Urban Edge has been focused on supporting our local communities and is taking action to safeguard the health of our tenants, shoppers and employees.
Status of April Rent Collections and Relief Requests as of April 27, 2020
| |
| • | Collected approximately 56% of April base rents and monthly tenant expense reimbursements. |
| |
| • | April collections and the status of tenants open for business by property type were as follows: |
|
| | | | | |
| | % Collected | | % of GLA Open | | % Open by ABR |
| Strips | 63% | | 56% | | 53% |
| Malls* | 37% | | 31% | | 22% |
| Malls - Puerto Rico | 21% | | 21% | | 11% |
| Warehouses | 74% | | 98% | | 98% |
| Total portfolio | 56% | | 55% | | 46% |
* includes Bergen Town Center and Hudson Mall |
| |
| • | Approximately 42% of portfolio ABR as of March 31, 2020 pertains to tenants that provide essential goods or services. We have collected approximately 88% of April base rents and monthly tenant expense reimbursements from these tenants, compared to 36% from other businesses and 26% from restaurants. |
| |
| • | Rent relief requests have been received from 489 tenants, comprising approximately 39% of overall portfolio ABR. |
We are working closely with our tenants through individual outreach to understand their financial position and provide our small, local and regional operators information on assistance programs. We have a dedicated COVID-19 page on our website that provides resources to our tenant community.
|
| | |
| URBAN EDGE PROPERTIES | | |
| COVID-19 BUSINESS UPDATE | |
| | | |
Liquidity Position and Redevelopment Update
Our balance sheet is strong and uniquely positioned with $643 million of cash at March 31, 2020, 46 unencumbered properties and no corporate debt. There are no cross-default provisions and no corporate encumbrances providing us with significant flexibility. Relevant updates regarding our liquidity considering the COVID-19 impact on our business include the following:
| |
| • | Borrowed $250 million under our existing $600 million revolving credit agreement in March 2020. |
| |
| • | We have $52.8 million of active redevelopment projects under way. Approximately $16 million of that amount remains to be funded, which we expect to occur over the next six to eighteen months depending on any restrictions on construction activity. |
| |
| • | The Company’s previously communicated plan to spend approximately $100 to $125 million annually over the next three years on redevelopment initiatives is being reevaluated. The Company is under no obligation to execute and fund any of the projects currently identified in its redevelopment pipeline. |
| |
| • | Updated the estimated stabilization dates of our active development projects based on construction delays expected due to COVID-19 restrictions. |
|
| | |
| URBAN EDGE PROPERTIES | | |
| COVID-19 BUSINESS UPDATE | |
| As of March 31, 2020 | | |
| | | |
Portfolio Composition
As of March 31, 2020, our portfolio composition is well diversified and includes approximately 42% of portfolio ABR pertaining to tenants that provide essential goods or services. Essential businesses are tenants that supply or provide consumers with any basic necessity goods or services, such as food, medical, health care and critical financial services. While some restaurants are deemed to be essential businesses, we have excluded them from the category. The purpose of this section is to provide insight into the Company's portfolio composition by both tenant category and tenant type in light of the evolving environment.
Portfolio Composition by Tenant Category(1)
(1) Percentage of total portfolio ABR as of March 31, 2020.
(2) 5% of portfolio ABR is attributable to restaurants which have remained open through April 27, 2020.
|
| | |
| URBAN EDGE PROPERTIES | | |
| COVID-19 BUSINESS UPDATE | |
| As of March 31, 2020 | | |
| | | |
Small Shop Composition by Tenant Category(1)
Small Shop Composition by Tenant Type(1)
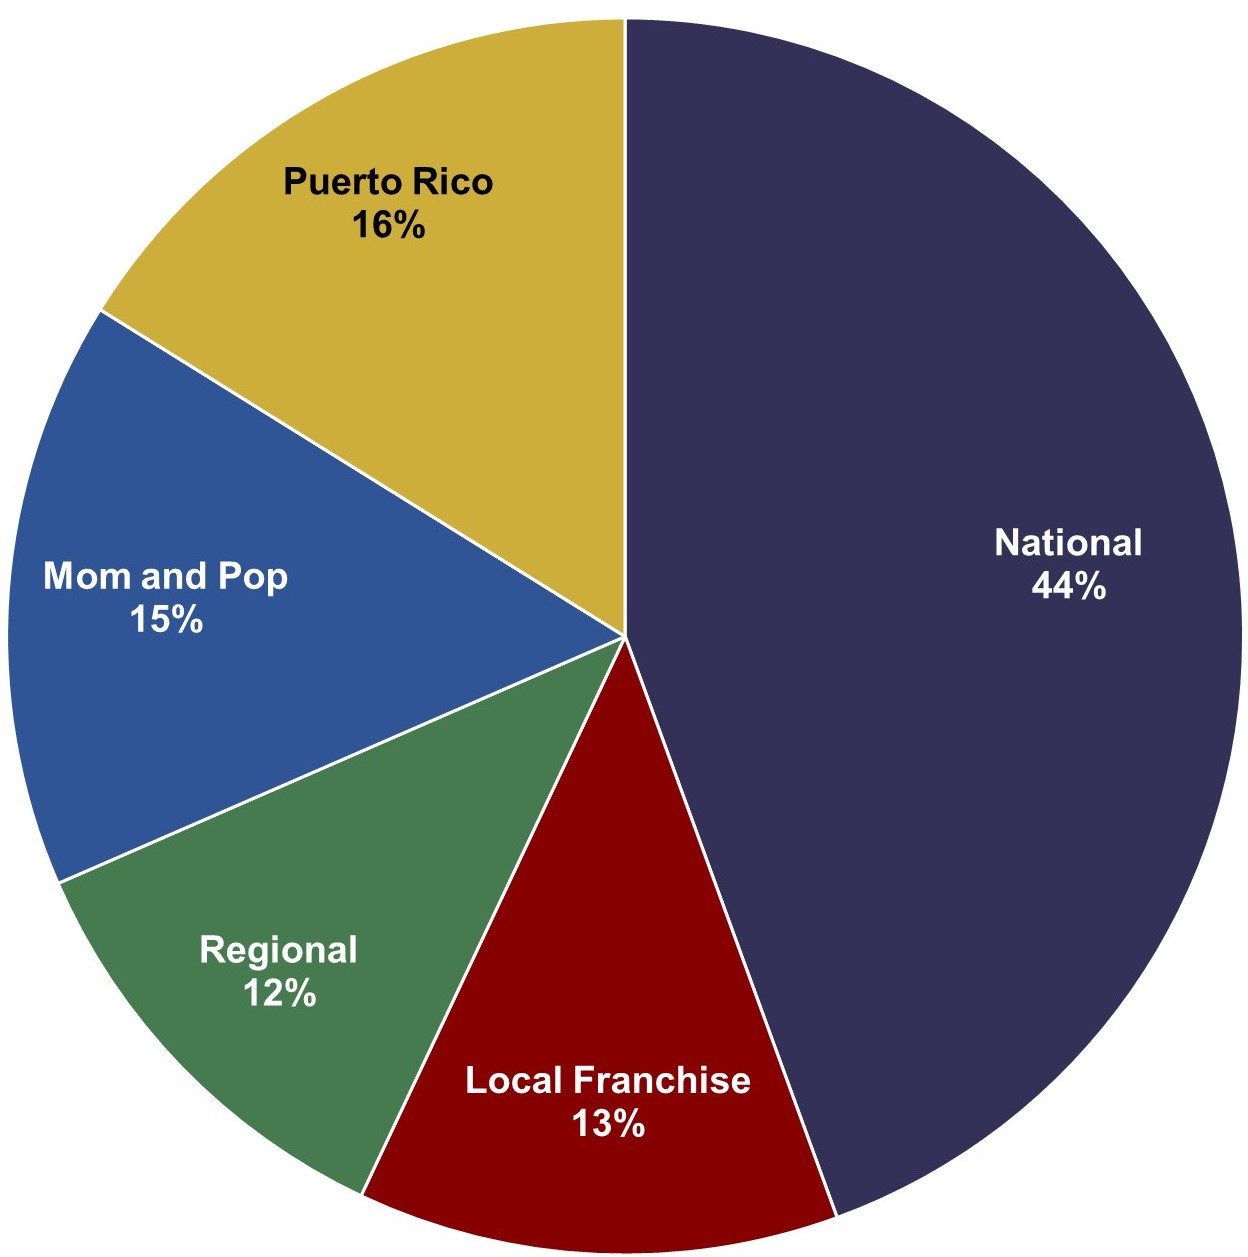
|
| |
| | |
| | |
| | |
| | |
| | |
| | |
(1) | Percentage of total small shop ABR as of March 31, 2020. Small shops represent 27% of portfolio ABR as of March 31, 2020.
|
(2) | Category includes Auto, Pharmacy, Pet Stores, and other necessity retailers.
|
| | |