Exhibit 99.2
| | |
|
|
| URBAN EDGE PROPERTIES |
|
| SUPPLEMENTAL DISCLOSURE |
| PACKAGE |
|
| March 31, 2023 |
|
|
| | |
|
|
|
|
| Urban Edge Properties |
| 888 7th Avenue, New York, NY 10019 |
| NY Office: 212-956-2556 |
| www.uedge.com |
|
| | | | | |
| URBAN EDGE PROPERTIES |
| SUPPLEMENTAL DISCLOSURE |
| March 31, 2023 |
| (unaudited) |
| |
| TABLE OF CONTENTS |
| Page |
| Press Release | |
| First Quarter 2023 Earnings Press Release | 1 |
| |
| Overview | |
| Summary Financial Results and Ratios | 12 |
| |
| Consolidated Financial Statements | |
| Consolidated Balance Sheets | 13 |
| Consolidated Statements of Income | 14 |
| |
| Non-GAAP Financial Measures and Supplemental Data | |
| Supplemental Schedule of Net Operating Income | 15 |
| Earnings Before Interest, Taxes, Depreciation and Amortization for Real Estate (EBITDAre) | 16 |
| Funds from Operations | 17 |
| Market Capitalization, Debt Ratios and Liquidity | 18 |
| Additional Disclosures | 19 |
| |
| Leasing Data | |
| Tenant Concentration - Top Twenty-Five Tenants | 21 |
| Leasing Activity | 22 |
| Leases Executed but Not Yet Rent Commenced | 23 |
| Retail Portfolio Lease Expiration Schedules | 24 |
| |
| Property Data | |
| Property Status Report | 26 |
| Property Acquisitions and Dispositions | 29 |
| Development, Redevelopment and Anchor Repositioning Projects | 30 |
| |
| Debt Schedules | |
| Debt Summary | 32 |
| Mortgage Debt Summary | 33 |
| Debt Maturity Schedule | 34 |
| | | | | | | | |
| | |
| |
| Urban Edge Properties | For additional information: |
| 888 Seventh Avenue | Mark Langer, EVP and |
| New York, NY 10019 | Chief Financial Officer |
| 212-956-2556 | |
| |
| |
| | |
| FOR IMMEDIATE RELEASE: | |
| | |
| Urban Edge Properties Reports Strong First Quarter 2023 Results |
NEW YORK, NY, May 9, 2023 - Urban Edge Properties (NYSE: UE) (the "Company") today announced its results for the quarter ended March 31, 2023.
“Urban Edge achieved a strong start to 2023 as we continued to execute on our growth strategy," said Jeff Olson, Chairman and CEO. "We are very pleased with the momentum of our leasing activity, highlighted by our signed but not open pipeline which has grown for the fourth consecutive quarter, increasing by $10 million to $31 million since the first quarter of 2022, and representing approximately 13% of current annualized NOI. In addition, we are thrilled with the successful refinancing of our mortgage loan secured by Bergen Town Center which has reduced our debt maturities through 2025 to $235 million, less than 15% of our current outstanding indebtedness. Our team continues to focus on executing the many exciting growth opportunities across our portfolio, and we are on track with our plan to increase our NOI by at least 20% over the next three years.”
Financial Results(1)(2)
•Generated a net loss attributable to common shareholders of $19.1 million, or $(0.16) per diluted share, for the first quarter of 2023 compared to net income of $9.5 million, or $0.08 per diluted share, for the first quarter of 2022. The net loss was driven by a non-cash impairment charge of $34.1 million, or $0.28 per diluted share, reducing the carrying value of Kingswood Center, an office and retail property located in Brooklyn, NY.
•Generated Funds from Operations ("FFO") applicable to diluted common shareholders of $38.6 million, or $0.32 per share, for the quarter compared to $34.2 million, or $0.28 per share, for the first quarter of 2022.
•Generated FFO as Adjusted applicable to diluted common shareholders of $39.0 million, or $0.32 per share, for the quarter compared to $34.5 million, or $0.28 per share, for the first quarter of 2022. Our strong first quarter results were driven by rent commencements on new leases, higher net recovery income, and lower general and administrative expenses.
Operating Results(1)(3)
•Increased same-property Net Operating Income ("NOI"), including properties in redevelopment, by 6.3% compared to the first quarter of 2022. The increase was primarily due to rent commencements on new leases and higher net recovery income. Excluding the collection of amounts previously deemed uncollectible, the increase would have been 6.2% compared to the first quarter of 2022.
•Increased same-property NOI, excluding properties in redevelopment, by 5.1% compared to the first quarter of 2022. The increase was primarily due to rent commencements on new leases and higher net recovery income. Excluding the collection of amounts previously deemed uncollectible, the increase would have been 4.8% compared to the first quarter of 2022.
•Reported same-property portfolio leased occupancy of 95.3%, an increase of 240 basis points compared to March 31, 2022 and a decrease of 20 basis points compared to December 31, 2022.
•Reported consolidated portfolio leased occupancy, excluding Sunrise Mall, of 94.6%, an increase of 420 basis points compared to March 31, 2022 and a decrease of 20 basis points compared to December 31, 2022.
•Executed 42 new leases, renewals and options totaling 430,000 sf during the quarter. Same-space leases totaled 412,000 sf and generated an average rent spread of 7.5% on a cash basis.
Financing Activity
On April 6, 2023, the Company successfully refinanced the mortgage secured by its property, Bergen Town Center, with a new 7-year fixed rate, $290 million loan. The proceeds from the new loan were used to pay down the Company's previous mortgage on the property which had an outstanding balance of $300 million. The refinancing of this loan reduces the Company's debt maturing through 2025 to $235 million, representing less than 15% of outstanding indebtedness.
Balance Sheet and Liquidity(1)(4)(5)
Balance sheet highlights as of March 31, 2023 include:
•Total liquidity of approximately $911 million, comprised of $111 million of cash on hand and $800 million available under our revolving credit agreement.
•Mortgages payable of $1.7 billion, with a weighted average term to maturity of 3.9 years. Approximately 91% of our outstanding debt is fixed rate. The weighted average term to maturity increased to 5.1 years upon the refinancing of Bergen Town Center.
•Total market capitalization of approximately $3.5 billion, comprised of 122.6 million fully-diluted common shares valued at $1.8 billion and $1.7 billion of debt.
•Net debt to total market capitalization of 45%.
Leasing, Development and Redevelopment
The Company recently received site plan approval from the Paramus Planning Board to develop 456 apartments on the east side of Bergen Town Center. The project features an impressive architectural design with numerous amenities. It is located within a short walk to two major supermarkets; with immediate access to NJ State highways only nine miles from New York City and offers a place to live, work, play and shop.
During the quarter, the Company executed 111,000 sf of new leases, including a 25,400 sf lease with Burlington at Huntington Commons.
The Company has $217.7 million of active redevelopment projects under way, with estimated remaining costs to complete of $150.0 million. The active redevelopment projects are expected to generate an approximate 12% unleveraged yield.
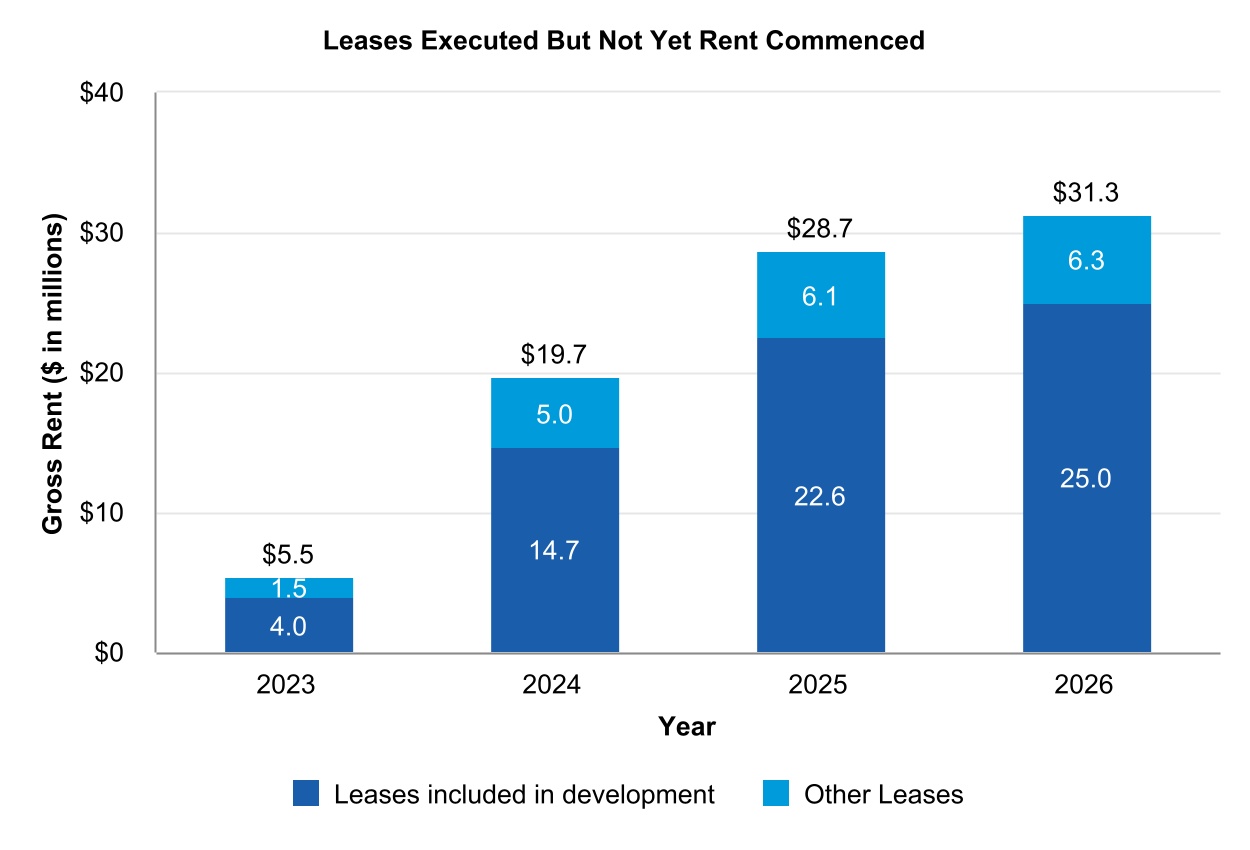
As of March 31, 2023, the Company has signed leases that have not yet rent commenced that are expected to generate an additional $31.3 million of future annual gross rent, representing approximately 13% of current annualized NOI. Approximately $5.5 million of this amount is expected to be recognized in the remainder of 2023.
Non-Cash Impairment
During the three months ended March 31, 2023, the Company recognized a non-cash impairment charge of approximately $34 million, or $0.28 per share, related to Kingswood Center, an office and retail property in Brooklyn, New York, which the Company acquired in February 2020. Two-thirds of Kingswood Center’s 130,000 sf of gross leasable area consists of office space that has been significantly impacted by the COVID-19 pandemic, causing declines in occupancy. The property has $66 million of non-recourse mortgage debt outstanding that matures in February 2028. The mortgage was recently transferred to special servicing at the Company's request considering the 2023 projected NOI will not cover debt service. The projected negative cash flow of the property is reflected in the 2023 annual guidance outlined in this release as well as the FFO as Adjusted target of $1.35 per diluted share for 2025 and the NOI growth targets that were outlined during the Company’s April 18th Investor Day.
2023 Earnings Guidance
The Company is reiterating its updated 2023 full-year guidance ranges for FFO and FFO as Adjusted provided in our recent press release and investor presentation on April 18th, estimating FFO of $1.13 to $1.17 per diluted share, and FFO as Adjusted of $1.14 to $1.18 per diluted share. This is an increase of $0.02 per diluted share at the midpoint compared to the previous guidance provided in our fourth quarter 2022 results. A reconciliation of the range of estimated earnings, FFO and FFO as Adjusted, as well as the assumptions used in our forecasting can be found on page 4 of this release.
Earnings Conference Call Information
The Company will host an earnings conference call and audio webcast on May 9, 2023 at 8:30am ET. All interested parties can access the earnings call by dialing 1-877-407-9716 (Toll Free) or 1-201-493-6779 (Toll/International) using conference ID 13736844. The call will also be webcast and available in listen-only mode on the investors page of our website: www.uedge.com. A replay will be available at the webcast link on the investors page for one year following the conclusion of the call. A telephonic replay of the call will also be available starting May 9, 2023 at 11:30am ET through May 23, 2023 at 11:59pm ET by dialing 1-844-512-2921 (Toll Free) or 1-412-317-6671 (Toll/International) using conference ID 13736844.
(1) Refer to "Non-GAAP Financial Measures" and "Operating Metrics" for definitions and additional detail.
(2) Refer to page 7 for a reconciliation of net income to FFO and FFO as Adjusted for the quarter ended March 31, 2023.
(3) Refer to page 8 for a reconciliation of net income to NOI and Same-Property NOI for the quarter ended March 31, 2023.
(4) Net debt as of March 31, 2023 is calculated as total consolidated debt of $1.7 billion less total cash and cash equivalents, including restricted cash, of $111 million.
(5) Refer to page 18 for the calculation of market capitalization as of March 31, 2023.
2023 Earnings Guidance
The Company is reiterating its updated 2023 full-year guidance ranges provided for FFO and FFO as Adjusted in our recent release on April 18th, 2023, estimating FFO of $1.13 to $1.17 per diluted share, and FFO as Adjusted of $1.14 to $1.18 per diluted share. Below is a summary of the Company's 2023 outlook, assumptions used in our forecasting, and a reconciliation of the range of estimated earnings, FFO, and FFO as Adjusted per diluted share.
| | | | | | | | | | | | | | |
| | Previous Guidance | | Revised Guidance |
| Net income per diluted share | | $0.27 - $0.33 | | $0.03 - $0.06 |
| Net income attributable to common shareholders per diluted share | | $0.26 - $0.32 | | $0.03 - $0.06 |
| FFO per diluted share | | $1.10 - $1.16 | | $1.13 - $1.17 |
| FFO as adjusted per diluted share | | $1.11 - $1.17 | | $1.14 - $1.18 |
The Company's full year FFO outlook is based on the following assumptions:
•Same-property NOI growth, including properties in redevelopment, of 0.0% to 2.0%
•Same-property NOI growth, including properties in redevelopment, adjusted for the collection of amounts previously deemed uncollectible of 1.5% to 3.5%
•No new acquisitions or dispositions
•Recurring G&A expenses ranging from $34.5 million to $36.5 million
•Interest and debt expense ranging from $71.0 million to $72.5 million
•Excludes items that impact FFO comparability, including gain/loss on extinguishment of debt, transaction, severance, litigation, or any one-time items outside of the ordinary course of business
| | | | | | | | | | | | | | | | | | | | | | | |
| Guidance 2023E | | Per Diluted Share(1) |
| (in thousands, except per share amounts) | Low | | High | | Low | | High |
| Net income | $ | 3,700 | | | $ | 7,700 | | | $ | 0.03 | | | $ | 0.06 | |
| Less net (income) loss attributable to noncontrolling interests in: | | | | | | | |
| Operating partnership | (400) | | | (400) | | | — | | | — | |
| Consolidated subsidiaries | 600 | | | 600 | | | — | | | — | |
| Net income attributable to common shareholders | 3,900 | | | 7,900 | | | 0.03 | | | 0.06 | |
| Adjustments: | | | | | | | |
| Rental property depreciation and amortization | 101,100 | | | 101,100 | | | 0.82 | | | 0.82 | |
| Gain on sale of real estate | (400) | | | (400) | | | — | | | — | |
| Real estate impairment loss | 34,100 | | | 34,100 | | | 0.28 | | | 0.28 | |
| Limited partnership interests in operating partnership | 400 | | | 400 | | | — | | | — | |
| FFO Applicable to diluted common shareholders | 139,100 | | | 143,100 | | | 1.13 | | | 1.17 | |
| Adjustments to FFO: | | | | | | | |
| Transaction, severance and litigation expenses | 1,100 | | | 1,100 | | | 0.01 | | | 0.01 | |
| | | | | | | |
| FFO as Adjusted applicable to diluted common shareholders | $ | 140,200 | | | $ | 144,200 | | | $ | 1.14 | | | $ | 1.18 | |
| | | | | | | |
| | | | | | | |
(1) Amounts may not foot due to rounding.
The Company is providing a projection of anticipated net income solely to satisfy the disclosure requirements of the Securities and Exchange Commission. The Company's projections are based on management’s current beliefs and assumptions about the Company's business, and the industry and the markets in which it operates; there are known and unknown risks and uncertainties associated with these projections. There can be no assurance that our actual results will not differ from the guidance set forth above. The Company assumes no obligation to update publicly any forward-looking statements, including its 2023 earnings guidance, whether as a result of new information, future events or otherwise. Please refer to the “Forward-Looking Statements” disclosures on page 10 of this document and “Risk Factors” disclosed in the Company's annual and quarterly reports filed with the Securities and Exchange Commission for more information.
Non-GAAP Financial Measures
The Company uses certain non-GAAP performance measures, in addition to the primary GAAP presentations, as we believe these measures improve the understanding of the Company's operational results. We continually evaluate the usefulness, relevance, limitations, and calculation of our reported non-GAAP performance measures to determine how best to provide relevant information to the investing public, and thus such reported measures are subject to change. The Company's non-GAAP performance measures have limitations as they do not include all items of income and expense that affect operations, and accordingly, should always be considered as supplemental financial results. Additionally, the Company's computation of non-GAAP metrics may not be comparable to similarly titled non-GAAP metrics reported by other REITs or real estate companies that define these metrics differently and, as a result, it is important to understand the manner in which the Company defines and calculates each of its non-GAAP metrics. The following non-GAAP measures are commonly used by the Company and investing public to understand and evaluate our operating results and performance:
•FFO: The Company believes FFO is a useful, supplemental measure of its operating performance that is a recognized metric used extensively by the real estate industry and, in particular real estate investment trusts ("REITs"). FFO, as defined by the National Association of Real Estate Investment Trusts ("Nareit") and the Company, is net income (computed in accordance with GAAP), excluding gains (or losses) from sales of depreciable real estate and land when connected to the main business of a REIT, impairments on depreciable real estate or land related to a REIT's main business, earnings from consolidated partially owned entities and rental property depreciation and amortization expense. The Company believes that financial analysts, investors and shareholders are better served by the presentation of comparable period operating results generated from FFO primarily because it excludes the assumption that the value of real estate assets diminishes predictably. FFO does not represent cash flows from operating activities in accordance with GAAP, should not be considered an alternative to net income as an indication of our performance, and is not indicative of cash flow as a measure of liquidity or our ability to make cash distributions.
•FFO as Adjusted: The Company provides disclosure of FFO as Adjusted because it believes it is a useful supplemental measure of its core operating performance that facilitates comparability of historical financial periods. FFO as Adjusted is calculated by making certain adjustments to FFO to account for items the Company does not believe are representative of ongoing core operating results, including non-comparable revenues and expenses. The Company's method of calculating FFO as Adjusted may be different from methods used by other REITs and, accordingly, may not be comparable to such other REITs.
•NOI: The Company uses NOI internally to make investment and capital allocation decisions and to compare the unlevered performance of our properties to our peers. The Company believes NOI is useful to investors as a performance measure because, when compared across periods, NOI reflects the impact on operations from trends in occupancy rates, rental rates, operating costs and acquisition and disposition activity on an unleveraged basis, providing perspective not immediately apparent from net income. The Company calculates NOI using net income as defined by GAAP reflecting only those income and expense items that are incurred at the property level, adjusted for non-cash rental income and expense, impairments on depreciable real estate or land, and income or expenses that we do not believe are representative of ongoing operating results, if any. In addition, the Company uses NOI margin, calculated as NOI divided by total property revenue, which the Company believes is useful to investors for similar reasons.
•Same-property NOI: The Company provides disclosure of NOI on a same-property basis, which includes the results of properties that were owned and operated for the entirety of the reporting periods being compared, which total 70 properties for the three months ended March 31, 2023 and 2022. Information provided on a same-property basis excludes properties under development, redevelopment or that involve anchor repositioning where a substantial portion of the gross leasable area ("GLA") is taken out of service and also excludes properties acquired or sold during the periods being compared. As such, same-property NOI assists in eliminating disparities in net income due to the development, redevelopment, acquisition or disposition of properties during the periods presented, and thus provides a more consistent performance measure for the comparison of the operating performance of the Company's properties. While there is judgment surrounding changes in designations, a property is removed from the same-property pool when it is designated as a redevelopment property because it is undergoing significant renovation or retenanting pursuant to a formal plan that is expected to have a significant impact on its operating income. A development or redevelopment property is moved back to the same-property pool once a substantial portion of the NOI growth expected from the development or redevelopment is reflected in both the current and comparable prior year period, generally one year after at least 80% of the expected NOI from the project is realized on a cash basis. Acquisitions are moved into the same-property pool once we have owned the property for the entirety of the comparable periods and the property is not under significant development or redevelopment. The Company has also provided disclosure of NOI on a same-property basis adjusted to include redevelopment properties. Same-property NOI may include other adjustments as detailed in
the Reconciliation of Net Income to NOI and same-property NOI included in the tables accompanying this press release. We also present this metric excluding the collection of amounts previously deemed uncollectible.
•EBITDAre and Adjusted EBITDAre: EBITDAre and Adjusted EBITDAre are supplemental, non-GAAP measures utilized by us in various financial ratios. The White Paper on EBITDAre, approved by Nareit's Board of Governors in September 2017, defines EBITDAre as net income (computed in accordance with GAAP), adjusted for interest expense, income tax (benefit) expense, depreciation and amortization, losses and gains on the disposition of depreciated property, impairment write-downs of depreciated property and investments in unconsolidated joint ventures, and adjustments to reflect the entity's share of EBITDAre of unconsolidated joint ventures. EBITDAre and Adjusted EBITDAre are presented to assist investors in the evaluation of REITs, as a measure of the Company's operational performance as they exclude various items that do not relate to or are not indicative of our operating performance and because they approximate key performance measures in our debt covenants. Accordingly, the Company believes that the use of EBITDAre and Adjusted EBITDAre, as opposed to income before income taxes, in various ratios provides meaningful performance measures related to the Company's ability to meet various coverage tests for the stated periods. Adjusted EBITDAre may include other adjustments not indicative of operating results as detailed in the Reconciliation of Net Income to EBITDAre and Adjusted EBITDAre included in the tables accompanying this press release. The Company also presents the ratio of net debt (net of cash) to annualized Adjusted EBITDAre as of March 31, 2023, and net debt (net of cash) to total market capitalization, which it believes is useful to investors as a supplemental measure in evaluating the Company's balance sheet leverage. The presentation of EBITDAre and Adjusted EBITDAre is consistent with EBITDA and Adjusted EBITDA as presented in prior periods.
The Company believes net income is the most directly comparable GAAP financial measure to the non-GAAP performance measures outlined above. Reconciliations of these measures to net income have been provided in the tables accompanying this press release.
Operating Metrics
The Company presents certain operating metrics related to our properties, including occupancy, leasing activity and rental rates. Operating metrics are used by the Company and are useful to investors in facilitating an understanding of the operational performance for our properties.
Occupancy metrics represent the percentage of occupied gross leasable area based on executed leases (including properties in development and redevelopment) and include leases signed, but for which rent has not yet commenced. Same-property portfolio leased occupancy includes properties that have been owned and operated for the entirety of the reporting periods being compared, which total 70 properties for the three months ended March 31, 2023 and 2022. Occupancy metrics presented for the Company's same-property portfolio excludes properties under development, redevelopment or that involve anchor repositioning where a substantial portion of the gross leasable area is taken out of service and also excludes properties acquired within the past 12 months or properties sold during the periods being compared.
Executed new leases, renewals and exercised options are presented on a same-space basis. Same-space leases represent those leases signed on spaces for which there was a previous lease.
The Company occasionally provides disclosures by tenant categories which include anchors, shops and industrial/self-storage. Anchors and shops are further broken down by local, regional and national tenants. We define anchor tenants as those who have a leased area of >10,000 sf. Local tenants are defined as those with less than five locations. Regional tenants are those with five or more locations in a single region. National tenants are defined as those with five or more locations and operate in two or more regions.
Reconciliation of Net Income (Loss) to FFO and FFO as Adjusted
The following table reflects the reconciliation of net income (loss) to FFO and FFO as Adjusted for the three months ended March 31, 2023 and 2022. Net income (loss) is considered the most directly comparable GAAP measure. Refer to "Non-GAAP Financial Measures" on page 5 for a description of FFO and FFO as Adjusted.
| | | | | | | | | | | | | | | |
| Three Months Ended March 31, | | |
| (in thousands, except per share amounts) | 2023 | | 2022 | | | | |
| Net income (loss) | $ | (20,146) | | | $ | 9,534 | | | | | |
| Less net (income) loss attributable to noncontrolling interests in: | | | | | | | |
| Operating partnership | 788 | | | (387) | | | | | |
| Consolidated subsidiaries | 240 | | | 339 | | | | | |
| Net income (loss) attributable to common shareholders | (19,118) | | | 9,486 | | | | | |
| Adjustments: | | | | | | | |
| Rental property depreciation and amortization | 24,809 | | | 24,298 | | | | | |
| Limited partnership interests in operating partnership | (788) | | | 387 | | | | | |
Gain on sale of real estate(2) | (356) | | | — | | | | | |
Real estate impairment loss(3) | 34,055 | | | — | | | | | |
| FFO Applicable to diluted common shareholders | 38,602 | | | 34,171 | | | | | |
FFO per diluted common share(1) | 0.32 | | | 0.28 | | | | | |
| Adjustments to FFO: | | | | | | | |
| Transaction, severance and litigation expenses | 407 | | | 497 | | | | | |
| Reinstatement of receivables arising from the straight-lining of rents, net | (36) | | | (87) | | | | | |
| | | | | | | |
| Tenant bankruptcy settlement income | — | | | (36) | | | | | |
| | | | | | | |
| | | | | | | |
| | | | | | | |
| FFO as Adjusted applicable to diluted common shareholders | $ | 38,973 | | | $ | 34,545 | | | | | |
FFO as Adjusted per diluted common share(1) | $ | 0.32 | | | $ | 0.28 | | | | | |
| | | | | | | |
Weighted Average diluted common shares(1) | 122,447 | | | 122,187 | | | | | |
(1) Weighted average diluted shares used to calculate FFO per share and FFO as Adjusted per share for the three months ended March 31, 2023 and 2022 are higher than the GAAP weighted average diluted shares as a result of the dilutive impact of LTIP and OP units which may be redeemed for our common shares.
(2) The gain on sale of real estate for the three months ended March 31, 2023 relates to the release of escrow funds from a property disposed of in a prior period.
(3) During the three months ended March 31, 2023, the Company recognized an impairment charge reducing the carrying value of Kingswood Center, an office and retail property located in Brooklyn, NY.
Reconciliation of Net Income (Loss) to NOI and Same-Property NOI
The following table reflects the reconciliation of net income (loss) to NOI, same-property NOI and same-property NOI including properties in redevelopment for the three months ended March 31, 2023 and 2022. Net income (loss) is considered the most directly comparable GAAP measure. Refer to "Non-GAAP Financial Measures" on page 5 for a description of NOI and same-property NOI.
| | | | | | | | | | | | | | | |
| Three Months Ended March 31, | | |
| (in thousands) | 2023 | | 2022 | | | | |
| Net income (loss) | $ | (20,146) | | | $ | 9,534 | | | | | |
| | | | | | | |
| Other expense (income) | 226 | | | (439) | | | | | |
| Depreciation and amortization | 25,084 | | | 24,527 | | | | | |
| General and administrative expense | 9,058 | | | 11,121 | | | | | |
| Gain on sale of real estate | (356) | | | — | | | | | |
| Interest income | (511) | | | (205) | | | | | |
| Interest and debt expense | 15,293 | | | 14,004 | | | | | |
| | | | | | | |
| Income tax expense | 706 | | | 905 | | | | | |
| Real estate impairment loss | 34,055 | | | — | | | | | |
| Non-cash revenue and expenses | (2,263) | | | (2,385) | | | | | |
| NOI | 61,146 | | | 57,062 | | | | | |
| Adjustments: | | | | | | | |
Non-same property NOI and other(1) | (5,466) | | | (4,394) | | | | | |
| Sunrise Mall net operating loss | 1,014 | | | 1,354 | | | | | |
| Tenant bankruptcy settlement income and lease termination income | (8) | | | (110) | | | | | |
Same-property NOI(2) | $ | 56,686 | | | $ | 53,912 | | | | | |
| NOI related to properties being redeveloped | 5,232 | | | 4,339 | | | | | |
Same-property NOI including properties in redevelopment(3) | $ | 61,918 | | | $ | 58,251 | | | | | |
(1) Non-same property NOI includes NOI related to properties being redeveloped and properties acquired or disposed in the period.
(2) Excluding the collection of amounts previously deemed uncollectible, the increase would have been 4.8% compared to the first quarter of
2022.
(3) Excluding the collection of amounts previously deemed uncollectible, the increase would have been 6.2% compared to the first quarter of
2022.
Reconciliation of Net Income (Loss) to EBITDAre and Adjusted EBITDAre
The following table reflects the reconciliation of net income (loss) to EBITDAre and Adjusted EBITDAre for the three months ended March 31, 2023 and 2022. Net income (loss) is considered the most directly comparable GAAP measure. Refer to "Non-GAAP Financial Measures" on page 5 for a description of EBITDAre and Adjusted EBITDAre.
| | | | | | | | | | | | | | | |
| Three Months Ended March 31, | | |
| (in thousands) | 2023 | | 2022 | | | | |
| Net income (loss) | $ | (20,146) | | | $ | 9,534 | | | | | |
| Depreciation and amortization | 25,084 | | | 24,527 | | | | | |
| Interest and debt expense | 15,293 | | | 14,004 | | | | | |
| Income tax expense | 706 | | | 905 | | | | | |
| Gain on sale of real estate | (356) | | | — | | | | | |
| Real estate impairment loss | 34,055 | | | — | | | | | |
| EBITDAre | 54,636 | | | 48,970 | | | | | |
| Adjustments for Adjusted EBITDAre: | | | | | | | |
| Transaction, severance and litigation expenses | 407 | | | 497 | | | | | |
| Reinstatement of receivables arising from the straight-lining of rents, net | (36) | | | (87) | | | | | |
| | | | | | | |
| Tenant bankruptcy settlement income | — | | | (36) | | | | | |
| | | | | | | |
| | | | | | | |
| Adjusted EBITDAre | $ | 55,007 | | | $ | 49,344 | | | | | |
ADDITIONAL INFORMATION
For a copy of the Company’s supplemental disclosure package, please access the "Investors" section of our website at www.uedge.com. Our website also includes other financial information, including our Annual Report on Form 10-K, Quarterly Reports on Form 10-Q, Current Reports on Form 8-K, and any amendments to those reports.
The Company uses, and intends to continue to use, the “Investors” page of its website, which can be found at www.uedge.com as a means of disclosing material nonpublic information and of complying with its disclosure obligations under Regulation FD, including, without limitation, through the posting of investor presentations that may include material nonpublic information. Accordingly, investors should monitor the “Investors” page, in addition to following the Company's press releases, SEC filings, public conference calls, presentations and webcasts. The information contained on, or that may be accessed through, our website is not incorporated by reference into, and is not a part of, this document.
ABOUT URBAN EDGE
Urban Edge Properties is a NYSE listed real estate investment trust focused on owning, managing, acquiring, developing, and redeveloping retail real estate in urban communities, primarily in the Washington, D.C. to Boston corridor. Urban Edge owns 76 properties totaling 17.2 million square feet of gross leasable area.
FORWARD-LOOKING STATEMENTS
Certain statements contained herein constitute forward-looking statements as such term is defined in Section 27A of the Securities Act of 1933, as amended, and Section 21E of the Securities Exchange Act of 1934, as amended. Forward-looking statements are not guarantees of future performance. They represent our intentions, plans, expectations and beliefs and are subject to numerous assumptions, risks and uncertainties. Our future results, financial condition, business and targeted occupancy may differ materially from those expressed in these forward-looking statements. You can identify many of these statements by words such as “approximates,” “believes,” “expects,” “anticipates,” “estimates,” “intends,” “plans,” “would,” “may” or other similar expressions in this Press Release. Many of the factors that will determine the outcome of forward-looking statements are beyond our ability to control or predict and include, among others: (i) the economic, political and social impact of, and uncertainty relating to, the ongoing COVID-19 pandemic and related COVID-19 variants; (ii) the loss or bankruptcy of major tenants; (iii) the ability and willingness of the Company’s tenants to renew their leases with the Company upon expiration and the Company’s ability to re-lease its properties on the same or better terms, or at all, in the event of non-renewal or in the event the Company exercises its right to replace an existing tenant; (iv) the impact of e-commerce on our tenants’ business; (v) macroeconomic conditions, such as rising inflation and disruption of, or lack of access to, the capital markets, as well as potential volatility in the Company’s share price; (vi) the Company’s success in implementing its business strategy and its ability to identify, underwrite, finance, consummate and integrate diversifying acquisitions and investments; (vii) changes in general economic conditions or economic conditions in the markets in which the Company competes, and their effect on the Company’s revenues, earnings and funding sources, and on those of its tenants; (viii) increases in the Company’s borrowing costs as a result of changes in interest rates, rising inflation, and other factors, including the discontinuation of USD LIBOR, which will be replaced by SOFR after June 30, 2023; (ix) the Company’s ability to pay down, refinance, hedge, restructure or extend its indebtedness as it becomes due and potential limitations on the Company’s ability to borrow funds under its existing credit facility as a result of covenants relating to the Company’s financial results; (x) potentially higher costs associated with the Company’s development, redevelopment and anchor repositioning projects, and the Company’s ability to lease the properties at projected rates; (xi) the Company’s liability for environmental matters; (xii) damage to the Company’s properties from catastrophic weather and other natural events, and the physical effects of climate change; (xiii) the Company’s ability and willingness to maintain its qualification as a REIT in light of economic, market, legal, tax and other considerations; (xiv) information technology security breaches; (xv) the loss of key executives; and (xvi) the accuracy of methodologies and estimates regarding our environmental, social and governance (“ESG”) metrics, goals and targets, tenant willingness and ability to collaborate towards reporting ESG metrics and meeting ESG goals and targets, and the impact of governmental regulation on our ESG efforts. For further discussion of factors that could materially affect the outcome of our forward-looking statements, see “Risk Factors” in Part I, Item 1A, of the Company's Annual Report on Form 10-K for the year ended December 31, 2022.
We claim the protection of the safe harbor for forward-looking statements contained in the Private Securities Litigation Reform Act of 1995 for any forward-looking statements included in this Press Release. You are cautioned not to place undue reliance on forward-looking statements, which speak only as of the date of this Press Release. All subsequent written and oral forward-looking statements attributable to us or any person acting on our behalf are expressly qualified in their entirety by the cautionary statements contained or referred to in this section. We do not undertake any obligation to release publicly any revisions to our forward-looking statements to reflect events or circumstances occurring after the date of this Press Release.
| | | | | | | | | | | |
| URBAN EDGE PROPERTIES | | | |
| ADDITIONAL INFORMATION | | | |
| As of March 31, 2023 | | | |
Basis of Presentation
The information contained in the Supplemental Disclosure Package does not purport to disclose all items required by GAAP and is unaudited. This Supplemental Disclosure Package should be read in conjunction with the Company's Annual Report on Form 10-K for the year ended December 31, 2022 and Quarterly Report on Form 10-Q for the quarter ended March 31, 2023. The results of operations of any property acquired are included in the Company's financial statements since the date of acquisition, although such properties may be excluded from certain metrics disclosed in this Supplemental Disclosure Package.
Non-GAAP Financial Measures and Forward-Looking Statements
For additional information regarding non-GAAP financial measures and forward-looking statements, please see pages 5 and 10 of this Supplemental Disclosure Package.
| | | | | | | | |
| URBAN EDGE PROPERTIES | | |
| SUMMARY FINANCIAL RESULTS AND RATIOS | | |
| For the three months ended March 31, 2023 (unaudited) | |
| (in thousands, except per share, sf, rent psf and financial ratio data) | | |
| | | | | | | | | | |
| | Three Months Ended | | |
| Summary Financial Results | | March 31, 2023 | | |
| Total revenue | | $ | 99,441 | | | |
| General & administrative expenses (G&A) | | $ | 9,058 | | | |
Recurring G&A(10) | | $ | 8,651 | | | |
| Net loss attributable to common shareholders | | $ | (19,118) | | | |
| Earnings (loss) per diluted share | | $ | (0.16) | | | |
Adjusted EBITDAre(7) | | $ | 55,007 | | | |
| Funds from operations (FFO) | | $ | 38,602 | | | |
| FFO per diluted common share | | $ | 0.32 | | | |
| FFO as Adjusted | | $ | 38,973 | | | |
| FFO as Adjusted per diluted common share | | $ | 0.32 | | | |
| Total dividends paid per share | | $ | 0.16 | | | |
| Stock closing price low-high range (NYSE) | | $13.44 to $16.31 | | |
Weighted average diluted shares used in EPS computations(1) | | 117,450 | | | |
Weighted average diluted common shares used in FFO computations(1) | | 122,447 | | | |
| | | | |
| Summary Property, Operating and Financial Data | | | | |
| # of Total properties / # of Retail properties | | 76 / 73 | | |
Gross leasable area (GLA) sf - retail portfolio(3)(5) | | 14,498,000 | | | |
Weighted average annual rent psf - retail portfolio(3)(5) | | $ | 19.90 | | | |
Consolidated portfolio leased occupancy at end of period(9) | | 90.2 | % | | |
Consolidated retail portfolio leased occupancy at end of period(5) | | 94.1 | % | | |
Same-property portfolio leased occupancy at end of period(2) | | 95.3 | % | | |
Same-property physical occupancy at end of period(4)(2) | | 91.2 | % | | |
Same-property NOI growth(2) | | 5.1 | % | | |
| Same-property NOI growth, including redevelopment properties | | 6.3 | % | | |
| NOI margin | | 63.0 | % | | |
| Same-property expense recovery ratio | | 83.5 | % | | |
| Same-property, including redevelopment, expense recovery ratio | | 81.9 | % | | |
New, renewal and option rent spread - cash basis(8) | | 7.5 | % | | |
New, renewal and option rent spread - GAAP basis(8) | | 10.5 | % | | |
Net debt to total market capitalization(6) | | 44.7 | % | | |
Net debt to Adjusted EBITDAre(6) | | 7.2 | x | | |
Adjusted EBITDAre to interest expense(7) | | 3.8 | x | | |
Adjusted EBITDAre to fixed charges(7) | | 2.8 | x | | |
| | | | |
(1) Weighted average diluted shares used to calculate FFO per share and FFO as Adjusted per share for the three months ended March 31, 2023 is higher than the GAAP weighted average diluted shares as a result of the dilutive impact of LTIP and OP units which may be redeemed for our common shares.
(2) The same-property pool for both NOI and occupancy includes properties the Company consolidated, owned and operated for the entirety of both periods being compared and excludes properties under development, redevelopment or that involve anchor repositioning where a substantial portion of the GLA is taken out of service and also excludes properties acquired or sold during the periods being compared.
(3) GLA - retail portfolio excludes 1.3 million square feet of industrial properties, 1.2 million square feet for Sunrise Mall and 132,000 square feet of self-storage. The weighted average annual rent per square foot for our industrial portfolio was $8.89.
(4) Physical occupancy includes tenants that have access to their leased space and includes dark and paying tenants.
(5) Our retail portfolio includes shopping centers and malls (excluding Sunrise Mall) and excludes industrial and self-storage.
(6) See computation for the quarter ended March 31, 2023 on page 18. Adjusted EBITDAre is annualized for purposes of calculating net debt to Adjusted EBITDAre.
(7) See computation on page 16.
(8) See computation on page 22.
(9) Excluding Sunrise Mall, consolidated portfolio leased occupancy is 94.6%.
(10) Recurring G&A for the quarter ended March 31, 2023 excludes $0.4 million of transaction, severance and litigation expenses.
| | | | | | | | |
| URBAN EDGE PROPERTIES | | |
| CONSOLIDATED BALANCE SHEETS | | |
| As of March 31, 2023 (unaudited) and December 31, 2022 | | |
| (in thousands, except share and per share amounts) | | |
| | | | | | | | | | | |
| | March 31, | | December 31, |
| | 2023 | | 2022 |
| ASSETS | | | |
| Real estate, at cost: | | | |
| Land | $ | 531,594 | | | $ | 535,770 | |
| Buildings and improvements | 2,469,064 | | | 2,468,385 | |
| Construction in progress | 292,915 | | | 314,190 | |
| Furniture, fixtures and equipment | 8,804 | | | 8,539 | |
| Total | 3,302,377 | | | 3,326,884 | |
| Accumulated depreciation and amortization | (801,391) | | | (791,485) | |
| Real estate, net | 2,500,986 | | | 2,535,399 | |
| Operating lease right-of-use assets | 62,386 | | | 64,161 | |
| Cash and cash equivalents | 62,142 | | | 85,518 | |
| Restricted cash | 49,044 | | | 43,256 | |
| Tenant and other receivables | 15,800 | | | 17,523 | |
| Receivable arising from the straight-lining of rents | 65,543 | | | 64,713 | |
| Identified intangible assets, net of accumulated amortization of $42,613 and $40,983, respectively | 60,181 | | | 62,856 | |
| Deferred leasing costs, net of accumulated amortization of $20,529 and $20,107, respectively | 27,649 | | | 26,799 | |
| Prepaid expenses and other assets | 79,913 | | | 77,207 | |
| Total assets | $ | 2,923,644 | | | $ | 2,977,432 | |
| | | |
| LIABILITIES AND EQUITY | | | |
| Liabilities: | | | |
| Mortgages payable, net | $ | 1,686,897 | | | $ | 1,691,690 | |
| Operating lease liabilities | 58,103 | | | 59,789 | |
| Accounts payable, accrued expenses and other liabilities | 94,766 | | | 102,519 | |
| Identified intangible liabilities, net of accumulated amortization of $42,719 and $40,816, respectively | 91,389 | | | 93,328 | |
| Total liabilities | 1,931,155 | | | 1,947,326 | |
| Commitments and contingencies | | | |
| Shareholders’ equity: | | | |
| Common shares: $0.01 par value; 500,000,000 shares authorized and 117,571,250 and 117,450,951 shares issued and outstanding, respectively | 1,174 | | | 1,173 | |
| Additional paid-in capital | 1,010,522 | | | 1,011,293 | |
| Accumulated other comprehensive income | 341 | | | 629 | |
| Accumulated deficit | (74,034) | | | (36,104) | |
| Noncontrolling interests: | | | |
| Operating partnership | 40,262 | | | 39,209 | |
| Consolidated subsidiaries | 14,224 | | | 13,906 | |
| Total equity | 992,489 | | | 1,030,106 | |
| Total liabilities and equity | $ | 2,923,644 | | | $ | 2,977,432 | |
| | | | | | | | |
| URBAN EDGE PROPERTIES | | |
| CONSOLIDATED STATEMENTS OF INCOME | | |
| For the three months ended March 31, 2023 and 2022 (unaudited) | |
| (in thousands, except per share amounts) | | |
| | | | | | | | | | | | | | | |
| Three Months Ended March 31, | | |
| | 2023 | | 2022 | | | | |
| REVENUE | | | | | | | |
| Rental revenue | $ | 99,354 | | | $ | 99,416 | | | | | |
| Other income | 87 | | | 785 | | | | | |
| Total revenue | 99,441 | | | 100,201 | | | | | |
| EXPENSES | | | | | | | |
| Depreciation and amortization | 25,084 | | | 24,527 | | | | | |
| Real estate taxes | 15,677 | | | 15,975 | | | | | |
| Property operating | 17,426 | | | 21,205 | | | | | |
| General and administrative | 9,058 | | | 11,121 | | | | | |
| Real estate impairment loss | 34,055 | | | — | | | | | |
| Lease expense | 3,155 | | | 3,135 | | | | | |
| Total expenses | 104,455 | | | 75,963 | | | | | |
| Gain on sale of real estate | 356 | | | — | | | | | |
| Interest income | 511 | | | 205 | | | | | |
| Interest and debt expense | (15,293) | | | (14,004) | | | | | |
| | | | | | | |
| Income (loss) before income taxes | (19,440) | | | 10,439 | | | | | |
| Income tax expense | (706) | | | (905) | | | | | |
| Net income (loss) | (20,146) | | | 9,534 | | | | | |
| Less net (income) loss attributable to noncontrolling interests in: | | | | | | | |
| Operating partnership | 788 | | | (387) | | | | | |
| Consolidated subsidiaries | 240 | | | 339 | | | | | |
| Net income (loss) attributable to common shareholders | $ | (19,118) | | | $ | 9,486 | | | | | |
| | | | | | | |
| Earnings (loss) per common share - Basic: | $ | (0.16) | | | $ | 0.08 | | | | | |
| Earnings (loss) per common share - Diluted: | $ | (0.16) | | | $ | 0.08 | | | | | |
| Weighted average shares outstanding - Basic | 117,450 | | | 117,330 | | | | | |
| Weighted average shares outstanding - Diluted | 117,450 | | | 117,393 | | | | | |
| | | | | | | | |
| URBAN EDGE PROPERTIES | | |
| SUPPLEMENTAL SCHEDULE OF NET OPERATING INCOME | | |
| For the three months ended March 31, 2023 and 2022 | |
| (in thousands) | | |
| | | | | | | | | | | | | | | | | | | | | | | |
| Three Months Ended March 31, | | Percent Change | | | | |
| 2023 | | 2022 | | | | | | |
Composition of NOI(1) | | | | | | | | | | | |
| Property rentals | $ | 71,435 | | | $ | 69,807 | | | | | | | | | |
| Tenant expense reimbursements | 26,208 | | | 27,903 | | | | | | | | | |
| Rental revenue deemed uncollectible | (551) | | | (685) | | | | | | | | | |
| Total property revenue | 97,092 | | | 97,025 | | | 0.1% | | | | | | |
| Real estate taxes | (15,677) | | | (15,975) | | | | | | | | | |
| Property operating | (17,908) | | | (21,660) | | | | | | | | | |
| Lease expense | (2,361) | | | (2,329) | | | | | | | | | |
| Total property operating expenses | (35,946) | | | (39,963) | | | (10.1)% | | | | | | |
NOI(1) | $ | 61,146 | | | $ | 57,062 | | | 7.2% | | | | | | |
| | | | | | | | | | | |
| NOI margin (NOI / Total property revenue) | 63.0 | % | | 58.8 | % | | | | | | | | |
| | | | | | | | | | | |
| | | | | | | | | | | |
Same-property NOI(1)(2) | | | | | | | | | | | |
| Property rentals | $ | 64,233 | | | $ | 63,092 | | | | | | | | | |
| Tenant expense reimbursements | 24,035 | | | 25,717 | | | | | | | | | |
| Rental revenue deemed uncollectible | (71) | | | (616) | | | | | | | | | |
| Total property revenue | 88,197 | | | 88,193 | | | | | | | | | |
| Real estate taxes | (14,209) | | | (13,852) | | | | | | | | | |
| Property operating | (14,428) | | | (17,580) | | | | | | | | | |
| Lease expense | (2,874) | | | (2,849) | | | | | | | | | |
| Total property operating expenses | (31,511) | | | (34,281) | | | | | | | | | |
Same-property NOI(1)(2) | $ | 56,686 | | | $ | 53,912 | | | 5.1% | | | | | | |
| | | | | | | | | | | |
NOI related to properties being redeveloped(2) | $ | 5,232 | | | $ | 4,339 | | | | | | | | | |
Same-property NOI including properties in redevelopment(1) | $ | 61,918 | | | $ | 58,251 | | | 6.3% | | | | | | |
| | | | | | | | | | | |
| Same-property physical occupancy | 91.2 | % | | 89.1 | % | | | | | | | | |
| Same-property leased occupancy | 95.3 | % | | 92.9 | % | | | | | | | | |
| Number of properties included in same-property analysis | 70 | | | | | | | | | | | |
| | | | | | | | | | | |
(1) NOI excludes non-cash revenue and expenses. Refer to page 8 for a reconciliation of net income to NOI and same-property NOI.
(2) Excludes NOI related to properties acquired or disposed in the comparative periods and Sunrise Mall.
| | | | | | | | |
| URBAN EDGE PROPERTIES | | |
| EARNINGS BEFORE INTEREST, TAXES, DEPRECIATION and AMORTIZATION for REAL ESTATE (EBITDAre) |
| For the three months ended March 31, 2023 and 2022 | |
| (in thousands) | | |
| | | | | | | | | | | | | | | |
| Three Months Ended March 31, | | |
| 2023 | | 2022 | | | | |
| Net income (loss) | $ | (20,146) | | | $ | 9,534 | | | | | |
| Depreciation and amortization | 25,084 | | | 24,527 | | | | | |
| Interest expense | 14,337 | | | 13,259 | | | | | |
| Amortization of deferred financing costs | 956 | | | 745 | | | | | |
| Income tax expense | 706 | | | 905 | | | | | |
| Gain on sale of real estate | (356) | | | — | | | | | |
| Real estate impairment loss | 34,055 | | | — | | | | | |
| EBITDAre | 54,636 | | | 48,970 | | | | | |
| Adjustments for Adjusted EBITDAre: | | | | | | | |
| Transaction, severance and litigation expenses | 407 | | | 497 | | | | | |
| Reinstatement of receivables arising from the straight-lining of rents, net | (36) | | | (87) | | | | | |
| | | | | | | |
| Tenant bankruptcy settlement income | — | | | (36) | | | | | |
| | | | | | | |
| | | | | | | |
| Adjusted EBITDAre | $ | 55,007 | | | $ | 49,344 | | | | | |
| | | | | | | |
| Interest expense | $ | 14,337 | | | $ | 13,259 | | | | | |
| | | | | | | |
| Adjusted EBITDAre to interest expense | 3.8 | x | | 3.7 | x | | | | |
| | | | | | | |
| Fixed charges | | | | | | | |
| Interest expense | $ | 14,337 | | | $ | 13,259 | | | | | |
| Scheduled principal amortization | 4,976 | | | 4,370 | | | | | |
| Total fixed charges | $ | 19,313 | | | $ | 17,629 | | | | | |
| | | | | | | |
| Adjusted EBITDAre to fixed charges | 2.8 | x | | 2.8 | x | | | | |
| | | | | | | |
| | | | | | | | |
| URBAN EDGE PROPERTIES | | |
| FUNDS FROM OPERATIONS | |
| For the three months ended March 31, 2023 | |
| (in thousands, except per share amounts) | | |
| | | | | | | | | | | | | | | |
| Three Months Ended March 31, 2023 | | |
| (in thousands) | | (per share)(2) | | | | |
| Net income (loss) | $ | (20,146) | | | $ | (0.16) | | | | | |
| Less net (income) loss attributable to noncontrolling interests in: | | | | | | | |
| Operating partnership | 788 | | | 0.01 | | | | | |
| Consolidated subsidiaries | 240 | | | — | | | | | |
| Net income (loss) attributable to common shareholders | (19,118) | | | (0.15) | | | | | |
| Adjustments: | | | | | | | |
| Rental property depreciation and amortization | 24,809 | | | 0.20 | | | | | |
Gain on sale of real estate(3) | (356) | | | — | | | | | |
Limited partnership interests in operating partnership(1) | (788) | | | (0.01) | | | | | |
Real estate impairment loss(4) | 34,055 | | | 0.28 | | | | | |
| FFO applicable to diluted common shareholders | 38,602 | | | 0.32 | | | | | |
| Adjustments to FFO: | | | | | | | |
| | | | | | | |
| Transaction, severance and litigation expenses | 407 | | | — | | | | | |
| Reinstatement of receivables arising from the straight-lining of rents, net | (36) | | | — | | | | | |
| | | | | | | |
| | | | | | | |
| FFO as Adjusted applicable to diluted common shareholders | $ | 38,973 | | | $ | 0.32 | | | | | |
| | | | | | | |
| Weighted average diluted shares used to calculate EPS | 117,450 | | | | | | | |
| Assumed conversion of OP and LTIP Units to common shares | 4,997 | | | | | | | |
| Weighted average diluted common shares - FFO | 122,447 | | | | | | | |
| | | | | | | |
(1) Represents earnings allocated to LTIP and OP unitholders for unissued common shares, which have been excluded for purposes of calculating earnings per diluted share for the periods presented because they are anti-dilutive.
(2) Individual items may not add up due to total rounding.
(3) The gain on sale of real estate for the three months ended March 31, 2023 relates to the release of escrow funds from a property disposed of in a prior period.
(4) During the three months ended March 31, 2023, the Company recognized an impairment charge reducing the carrying value of Kingswood Center, an office and retail property located in Brooklyn, NY.
| | | | | | | | |
| URBAN EDGE PROPERTIES | | |
| MARKET CAPITALIZATION, DEBT RATIOS AND LIQUIDITY | | |
| As of March 31, 2023 | | |
| (in thousands, except share amounts) | | |
| | | | | |
| March 31, 2023 |
| Closing market price of common shares | $ | 15.06 | |
| |
| Basic common shares | 117,571,250 | |
| OP and LTIP units | 5,046,501 | |
| Diluted common shares | 122,617,751 | |
| |
| Equity market capitalization | $ | 1,846,623 | |
| |
| |
Total consolidated debt(1) | $ | 1,694,219 | |
| Cash and cash equivalents including restricted cash | (111,186) | |
| Net debt | $ | 1,583,033 | |
| |
Net Debt to annualized Adjusted EBITDAre(2) | 7.2 | x |
| |
Total consolidated debt(1) | $ | 1,694,219 | |
| Equity market capitalization | 1,846,623 | |
| Total market capitalization | $ | 3,540,842 | |
| |
| Net debt to total market capitalization at applicable market price | 44.7 | % |
| |
| |
| Cash and cash equivalents including restricted cash | $ | 111,186 | |
| Available under unsecured credit facility | 800,000 | |
| Total liquidity | $ | 911,186 | |
| |
(1) Total consolidated debt excludes unamortized debt issuance costs of $7.3 million.
(2) Net debt to Adjusted EBITDAre is calculated based on first quarter 2023 annualized Adjusted EBITDAre.
| | | | | | | | |
| URBAN EDGE PROPERTIES | | |
| ADDITIONAL DISCLOSURES | |
| (in thousands) | | |
| | | | | | | | | | | | | | | | | | |
| | Three Months Ended March 31, | | |
| | 2023 | | 2022 | | | | |
| Rental Revenue: | | | | | | | | |
Property rentals(1) | | $ | 73,780 | | | $ | 72,366 | | | | | |
| Tenant expense reimbursements | | 26,125 | | | 27,735 | | | | | |
| Rental revenue deemed uncollectible | | (551) | | | (685) | | | | | |
| Total rental revenue | | $ | 99,354 | | | $ | 99,416 | | | | | |
Composition of Rental Revenue for the Quarter Ended March 31, 2023
| | | | | |
| (in thousands) | Three Months Ended March 31, 2023 |
| Collected property rentals and tenant expense reimbursements from first quarter billings | $ | 93,979 | |
| Uncollected property rentals and tenant expense reimbursements from first quarter billings | |
| Uncollectible | 1,353 | |
| Collectible | 2,316 | |
Total property rentals and tenant expense reimbursements before non-cash adjustments from first quarter billings(2) | 97,648 | |
Non-cash adjustments(3) | 2,257 | |
| Rental revenue deemed uncollectible | (551) | |
| Total rental revenue recognized | $ | 99,354 | |
Composition of Rental Revenue Deemed (Collectible) Uncollectible
| | | | | | | |
| (in thousands) | | | Three Months Ended March 31, 2023 |
| Rental revenue deemed (collectible) uncollectible | | | |
| Amounts billed in first quarter deemed uncollectible | | | $ | 1,353 | |
| Amounts billed prior to first quarter now deemed uncollectible | | | 346 | |
| Recovery of amounts deemed uncollectible in prior periods | | | (1,148) | |
Total rental revenue deemed uncollectible(4) | | | $ | 551 | |
Tenant and Other Receivables
| | | | | | | | |
| | As of March 31, 2023 |
| (in thousands) | | |
| Tenant and other receivables billed | | $ | 30,082 | |
| Revenue deemed uncollectible | | (14,282) | |
| Tenant and other receivables deemed collectible | | $ | 15,800 | |
(1) Percentage rents for the three months ended March 31, 2023 and 2022 were $0.8 million and $1.2 million, respectively.
(2) Total first quarter billings include $3.9 million of gross amounts billed for leases with rental revenue being recognized on a cash-basis. As of March 31, 2023, the Company had 78 leases with rental revenue being recognized on a cash-basis, which represented approximately 3.5% of total portfolio ABR.
(3) Amount comprises straight-line rents, amortization of lease intangibles, credits for tenant abatements and accrued unbilled amounts during the first quarter.
(4) Rental revenue deemed uncollectible pertaining to cash basis tenants was an expense of $0.1 million consisting of $0.7 million of charges, offset by $0.6 million of amounts recovered in the quarter.
| | | | | | | | |
| URBAN EDGE PROPERTIES | | |
| ADDITIONAL DISCLOSURES | |
| (in thousands) | | |
Status of Rent Deferrals
As of March 31, 2023, the Company has executed or approved deferral agreements amounting to $11.7 million with a weighted average remaining payback period of 27 months and has collected 98% of the deferral payments due:
| | | | | | | | | | | | | | | | | | |
| As of March 31, 2023 | | |
| (in thousands) | Unbilled(1) | Rebilled and Collected | Rebilled and Uncollected | Total | | | | |
Accrual basis(2) | $ | — | | $ | 8,151 | | $ | 26 | | $ | 8,177 | | | | | |
| Cash basis | 1,671 | | 1,742 | | 153 | | 3,566 | | | | | |
| Total | $ | 1,671 | | $ | 9,893 | | $ | 179 | | $ | 11,743 | | | | | |
| | | | | | | | | | | | | | | | | | |
| | Three Months Ended March 31, | | |
| | 2023 | | 2022 | | | | |
| Certain Non-Cash Items: | | | | | | | | |
Straight-line rents(3) | | $ | 830 | | | $ | 511 | | | | | |
Amortization of below-market lease intangibles, net(3) | | 1,508 | | | 1,974 | | | | | |
Lease expense GAAP adjustments(4) | | (75) | | | (99) | | | | | |
Amortization of deferred financing costs(5) | | (956) | | | (745) | | | | | |
Capitalized interest(5) | | 2,669 | | | 1,733 | | | | | |
Share-based compensation expense(6) | | (2,007) | | | (2,597) | | | | | |
| | | | | | | | |
Capital Expenditures:(7) | | | | | | | | |
| Development and redevelopment costs | | $ | 15,515 | | | $ | 15,562 | | | | | |
| Maintenance capital expenditures | | 6,683 | | | 3,318 | | | | | |
| Leasing commissions | | 657 | | | 155 | | | | | |
| Tenant improvements and allowances | | 1,516 | | | 198 | | | | | |
| Total capital expenditures | | $ | 24,371 | | | $ | 19,233 | | | | | |
| | | | | | | | |
| | | | | | | | | | | | | | |
| | March 31, 2023 | | December 31, 2022 |
| Accounts Payable, Accrued Expenses and Other Liabilities: | | | | |
| Deferred tenant revenue | | $ | 28,104 | | | $ | 28,468 | |
| Accrued capital expenditures and leasing costs | | 33,753 | | | 35,732 | |
| Accrued interest payable | | 10,812 | | | 10,789 | |
| Other liabilities and accrued expenses | | 7,906 | | | 6,939 | |
| Security deposits | | 8,174 | | | 8,048 | |
| Accrued payroll expenses | | 2,998 | | | 9,527 | |
| Finance lease liability | | 3,019 | | | 3,016 | |
| Total accounts payable, accrued expenses and other liabilities | | $ | 94,766 | | | $ | 102,519 | |
(1) Unbilled amounts are for rent deferrals which have been executed or approved but are not yet due based on the repayment terms.
(2) Includes vacated and inactive tenants
(3) Amounts included in the financial statement line item "Rental revenue" on the consolidated statements of income. During the three months ended March 31, 2023 and 2022, the Company reinstated less than $0.1 million and $0.1 million, respectively, of receivables arising from the straight-lining of rents, net of write-offs for tenants moved back to accrual basis accounting.
(4) Amounts consist of amortization of below-market ground lease intangibles and straight-line lease expense, and are included in the financial statement line item "Lease expense" on the consolidated statements of income.
(5) Amounts included in the financial statement line item "Interest and debt expense" on the consolidated statements of income.
(6) Amounts included in the financial statement line item "General and administrative" on the consolidated statements of income.
(7) Amounts presented on a cash basis.
| | | | | | | | |
| URBAN EDGE PROPERTIES | | |
| TENANT CONCENTRATION - TOP TWENTY-FIVE TENANTS | |
| As of March 31, 2023 | | |
| | | | | | | | | | | | | | | | | | | | | | | |
| | | | | | | |
| Tenant | Number of stores | Square feet | % of total square feet | Annualized base rent ("ABR") | % of total ABR | Weighted average ABR per square foot | Average remaining term of ABR(1) |
| The Home Depot | 6 | | 808,926 | | 4.7 | % | $ | 16,103,093 | | 5.6 | % | $ | 19.91 | | 12.9 | |
The TJX Companies(2) | 20 | | 616,400 | | 3.6 | % | 12,989,278 | | 4.5 | % | 21.07 | | 4.8 | |
| Lowe's Companies | 6 | | 976,415 | | 5.7 | % | 8,946,256 | | 3.1 | % | 9.16 | | 4.8 | |
| Kohl's | 8 | | 767,345 | | 4.5 | % | 8,560,023 | | 3.0 | % | 11.16 | | 6.8 | |
| Best Buy | 8 | | 359,551 | | 2.1 | % | 8,394,123 | | 2.9 | % | 23.35 | | 4.7 | |
| Walmart | 5 | | 708,435 | | 4.2 | % | 7,479,449 | | 2.6 | % | 10.56 | | 5.2 | |
| Burlington | 7 | | 415,828 | | 2.4 | % | 7,200,733 | | 2.5 | % | 17.32 | | 5.8 | |
| ShopRite | 5 | | 361,058 | | 2.1 | % | 6,424,644 | | 2.2 | % | 17.79 | | 10.6 | |
| PetSmart | 10 | | 228,869 | | 1.3 | % | 5,843,768 | | 2.0 | % | 25.53 | | 3.4 | |
| BJ's Wholesale Club | 4 | | 454,297 | | 2.7 | % | 5,771,563 | | 2.0 | % | 12.70 | | 7.1 | |
Ahold Delhaize (Stop & Shop) | 5 | | 362,696 | | 2.1 | % | 5,454,430 | | 1.9 | % | 15.04 | | 5.7 | |
| Target Corporation | 3 | | 335,937 | | 2.0 | % | 5,290,952 | | 1.8 | % | 15.75 | | 9.6 | |
| LA Fitness | 6 | | 287,420 | | 1.7 | % | 5,053,088 | | 1.8 | % | 17.58 | | 6.5 | |
Amazon(3) | 3 | | 145,279 | | 0.9 | % | 4,717,885 | | 1.6 | % | 32.47 | | 8.0 | |
The Gap(4) | 11 | | 166,032 | | 1.0 | % | 4,693,166 | | 1.6 | % | 28.27 | | 2.6 | |
| Staples | 8 | | 167,832 | | 1.0 | % | 3,510,725 | | 1.2 | % | 20.92 | | 2.5 | |
| Bob's Discount Furniture | 4 | | 170,931 | | 1.0 | % | 3,251,494 | | 1.1 | % | 19.02 | | 4.0 | |
| Dick's Sporting Goods | 4 | | 185,910 | | 1.1 | % | 2,746,609 | | 1.0 | % | 14.77 | | 0.8 | |
| 24 Hour Fitness | 1 | | 53,750 | | 0.3 | % | 2,700,000 | | 0.9 | % | 50.23 | | 8.8 | |
| Anthropologie | 1 | | 31,450 | | 0.2 | % | 2,531,725 | | 0.9 | % | 80.50 | | 5.5 | |
| Planet Fitness | 5 | | 101,046 | | 0.6 | % | 2,475,296 | | 0.9 | % | 24.50 | | 7.8 | |
| Raymour & Flanigan | 4 | | 215,254 | | 1.3 | % | 2,370,497 | | 0.8 | % | 11.01 | | 5.6 | |
| Nordstrom | 2 | | 66,561 | | 0.4 | % | 2,345,180 | | 0.8 | % | 35.23 | | 1.9 | |
| Best Way Trucking | 1 | | 188,587 | | 1.1 | % | 2,288,974 | | 0.8 | % | 12.14 | | 5.0 | |
Bed Bath & Beyond(5) | 6 | | 167,413 | | 1.0 | % | 2,271,187 | | 0.8 | % | 13.57 | | 6.4 | |
| | | | | | | |
| Total/Weighted Average | 143 | | 8,343,222 | | 49.0% | $ | 139,414,138 | | 48.3% | $ | 16.71 | | 6.4 |
| | | | | | | |
(1) In years excluding tenant renewal options. The weighted average is based on ABR.
(2) Includes Marshalls (13), T.J. Maxx (3), HomeGoods (3) and Homesense (1).
(3) Includes Whole Foods (2) and Amazon Fresh (1).
(4) Includes Old Navy (8), Gap (2) and Banana Republic (1).
(5) Includes Harmon Face Values (3), Bed Bath & Beyond (1), Bed Bath & Beyond and buybuy Baby combination store (1), and buybuy Baby (1). This tenant filed for Chapter 11 bankruptcy protection on April 23, 2023 and generates approximately $3.6 million in annual gross rent.
Note: Amounts shown in the table above include all retail properties, including those in redevelopment, on a cash basis other than tenants in free rent periods which are shown at their initial cash rent. The table excludes executed leases that have not yet rent commenced.
| | | | | | | | |
| URBAN EDGE PROPERTIES | | |
| LEASING ACTIVITY | |
| For the three months ended March 31, 2023 | | |
| | | | | | | | | | | | | | | |
| Three Months Ended March 31, 2023 | | |
| GAAP(2) | | Cash(1) | | | | |
| New Leases | | | | | | | |
| Number of new leases executed | 14 | | | 14 | | | | | |
| Total square feet | 110,977 | | | 110,977 | | | | | |
| Number of same space leases | 8 | | | 8 | | | | | |
| Same space square feet | 92,627 | | | 92,627 | | | | | |
| Prior rent per square foot | $ | 18.75 | | | $ | 19.22 | | | | | |
| New rent per square foot | $ | 24.20 | | | $ | 22.61 | | | | | |
| Same space weighted average lease term (years) | 9.8 | | | 9.8 | | | | | |
| Same space TIs per square foot | N/A | | $ | 15.92 | | | | | |
| Rent spread | 29.1 | % | | 17.6 | % | | | | |
| | | | | | | |
| Renewals & Options | | | | | | | |
| Number of leases executed | 28 | | | 28 | | | | | |
| Total square feet | 318,876 | | | 318,876 | | | | | |
| Number of same space leases | 28 | | | 28 | | | | | |
| Same space square feet | 318,876 | | | 318,876 | | | | | |
| Prior rent per square foot | $ | 22.70 | | | $ | 22.72 | | | | | |
| New rent per square foot | $ | 24.08 | | | $ | 23.86 | | | | | |
| Same space weighted average lease term (years) | 4.7 | | | 4.7 | | | | | |
| Same space TIs per square foot | N/A | | $ | — | | | | | |
| Rent spread | 6.1 | % | | 5.0 | % | | | | |
| | | | | | | |
| Total New Leases and Renewals & Options | | | | | | | |
| Number of leases executed | 42 | | | 42 | | | | | |
| Total square feet | 429,853 | | | 429,853 | | | | | |
| Number of same space leases | 36 | | | 36 | | | | | |
| Same space square feet | 411,503 | | | 411,503 | | | | | |
| Prior rent per square foot | $ | 21.81 | | | $ | 21.93 | | | | | |
| New rent per square foot | $ | 24.10 | | | $ | 23.58 | | | | | |
| Same space weighted average lease term (years) | 5.9 | | | 5.9 | | | | | |
| Same space TIs per square foot | N/A | | $ | 3.58 | | | | | |
| Rent spread | 10.5 | % | | 7.5 | % | | | | |
| | | | | | | |
(1) Rents are not calculated on a straight-line (GAAP) basis. Previous/expiring rent is the rent at expiry. New rent is the rent paid at commencement.
(2) Rents are calculated on a straight-line (GAAP) basis.
| | | | | | | | |
| URBAN EDGE PROPERTIES | | |
| LEASES EXECUTED BUT NOT YET RENT COMMENCED | | |
| As of March 31, 2023 | | |
The Company has signed leases that have not yet rent commenced that are expected to generate an incremental $31.3 million of future annual gross rent, representing approximately 13% of annualized NOI as of March 31, 2023. Approximately $25.0 million of this amount pertains to leases included in Active Redevelopment Projects on page 30. National, regional and industrial tenants represent 85% of the leased but not yet rent commenced pipeline. The below table illustrates the incremental gross rent expected to be recognized in the remainder of 2023 and the next three years, in the respective periods, from commencement of these leases.
Gross rents illustrated in the table above and their impact on same-property metrics in the respective years, based on the current 2023 same-property pool, are as follows:
| | | | | | | | | | | | | | | | | | | | | | | |
| (in thousands) | 2023 | | 2024 | | 2025 | | 2026 |
| Same-property | $ | 4,700 | | | $ | 16,700 | | | $ | 21,100 | | | $ | 22,500 | |
The below table summarizes the changes in annualized gross rent from leases executed but not yet rent commenced since December 31, 2022:
| | | | | |
| (in thousands) | Annualized Gross Rent |
| Leases executed but not yet rent commenced as of December 31, 2022 | $ | 28,600 | |
| Less: Leases commenced during the first quarter | (800) | |
| Plus: Leases executed during the first quarter | 3,500 | |
| Leases executed but not yet rent commenced as of March 31, 2023 | $ | 31,300 | |
| | | | | | | | |
| URBAN EDGE PROPERTIES | | |
| RETAIL PORTFOLIO LEASE EXPIRATION SCHEDULE | |
| As of March 31, 2023 | | |
| | | | | | | | | | | | | | | | | | | | | | | | | | | | | | | | | | | | | | |
| ANCHOR TENANTS (SF>=10,000) | SHOP TENANTS (SF<10,000) | TOTAL TENANTS |
Year(1) | # of leases | Square Feet | % of Total SF | Weighted Avg ABR PSF(2) | # of leases | Square Feet | % of Total SF | Weighted Avg ABR PSF(2) | # of leases | Square Feet | % of Total SF | Weighted Avg ABR PSF(2) |
| | | | | | | | | | | | |
| M-T-M | 1 | | 18,000 | | 0.1 | % | $ | 20.18 | | 28 | | 77,000 | | 3.1% | $ | 28.61 | | 29 | | 95,000 | | 0.7% | $ | 27.01 | |
| 2023 | 11 | | 348,000 | | 2.9 | % | 19.64 | | 45 | | 112,000 | | 4.5% | 41.47 | | 56 | | 460,000 | | 3.2% | 24.96 | |
| 2024 | 32 | | 1,087,000 | | 9.0 | % | 19.28 | | 78 | | 229,000 | | 9.3% | 35.05 | | 110 | | 1,316,000 | | 9.1% | 22.02 | |
| 2025 | 27 | | 1,063,000 | | 8.8 | % | 15.96 | | 64 | | 209,000 | | 8.5% | 37.64 | | 91 | | 1,272,000 | | 8.8% | 19.52 | |
| 2026 | 20 | | 663,000 | | 5.5 | % | 18.62 | | 80 | | 265,000 | | 10.7% | 36.88 | | 100 | | 928,000 | | 6.4% | 23.84 | |
| 2027 | 22 | | 839,000 | | 7.0 | % | 12.64 | | 81 | | 282,000 | | 11.4% | 33.58 | | 103 | | 1,121,000 | | 7.7% | 17.90 | |
| 2028 | 26 | | 994,000 | | 8.3 | % | 19.88 | | 56 | | 208,000 | | 8.4% | 40.14 | | 82 | | 1,202,000 | | 8.3% | 23.39 | |
| 2029 | 35 | | 1,555,000 | | 12.9 | % | 19.54 | | 48 | | 182,000 | | 7.4% | 39.83 | | 83 | | 1,737,000 | | 12.0% | 21.67 | |
| 2030 | 17 | | 1,117,000 | | 9.3 | % | 12.79 | | 29 | | 103,000 | | 4.2% | 47.85 | | 46 | | 1,220,000 | | 8.4% | 15.75 | |
| 2031 | 15 | | 955,000 | | 7.9 | % | 15.55 | | 18 | | 70,000 | | 2.8% | 33.71 | | 33 | | 1,025,000 | | 7.1% | 16.79 | |
| 2032 | 9 | | 296,000 | | 2.5 | % | 15.73 | | 41 | | 137,000 | | 5.5% | 33.29 | | 50 | | 433,000 | | 3.0% | 21.29 | |
| 2033 | 16 | | 615,000 | | 5.1 | % | 14.77 | | 30 | | 104,000 | | 4.2% | 36.33 | | 46 | | 719,000 | | 5.0% | 17.89 | |
| Thereafter | 29 | | 1,997,000 | | 16.7 | % | 16.03 | | 28 | | 122,000 | | 5.0% | 37.01 | | 57 | | 2,119,000 | | 14.4% | 17.24 | |
| Subtotal/Average | 260 | | 11,547,000 | | 96.0 | % | $ | 16.75 | | 626 | | 2,100,000 | | 85.0% | $ | 37.26 | | 886 | | 13,647,000 | | 94.1 | % | $ | 19.90 | |
| Vacant | 18 | | 479,000 | | 4.0 | % | N/A | 151 | | 372,000 | | 15.0% | N/A | 169 | | 851,000 | | 5.9 | % | N/A |
| Total/Average | 278 | | 12,026,000 | | 100.0 | % | N/A | 777 | | 2,472,000 | | 100.0% | N/A | 1,055 | | 14,498,000 | | 100.0 | % | N/A |
| | | | | | | | | | | | |
(1) Year of expiration excludes tenant renewal options.
(2) Weighted average annual base rent per square foot is calculated by annualizing tenants' base cash rent, including ground rent, and excludes tenant reimbursements and concessions and storage rent.
Note: Amounts shown in the table above include both current leases and signed leases that have not commenced on vacant spaces for all retail properties (excludes Sunrise Mall and includes properties in redevelopment) and excludes 132,000 sf of self-storage space. The average base rent for our 1,345,000 square-foot warehouse properties (excluded from the table above) is $8.89 per square foot as of March 31, 2023.
| | | | | | | | |
| URBAN EDGE PROPERTIES | | |
| RETAIL PORTFOLIO LEASE EXPIRATION SCHEDULE ASSUMING EXERCISE OF ALL OPTIONS |
| As of March 31, 2023 | | |
| | | | | | | | | | | | | | | | | | | | | | | | | | | | | | | | | | | | | | |
| ANCHOR TENANTS (SF>=10,000) | SHOP TENANTS (SF<10,000) | TOTAL TENANTS |
Year(1) | # of leases | Square Feet | % of Total SF | Weighted Avg ABR PSF(2) | # of leases | Square Feet | % of Total SF | Weighted Avg ABR PSF(2) | # of leases | Square Feet | % of Total SF | Weighted Avg ABR PSF(2) |
| | | | | | | | | | | | |
| M-T-M | 1 | | 18,000 | | 0.1 | % | $ | 20.18 | | 28 | | 77,000 | | 3.1% | $ | 28.61 | | 29 | | 95,000 | | 0.7% | $ | 27.01 | |
| 2023 | 7 | | 173,000 | | 1.4 | % | 20.06 | | 33 | | 82,000 | | 3.3% | 43.95 | | 40 | | 255,000 | | 1.8% | 27.74 | |
| 2024 | 5 | | 122,000 | | 1.0 | % | 20.68 | | 56 | | 145,000 | | 5.9% | 36.69 | | 61 | | 267,000 | | 1.8% | 29.37 | |
| 2025 | 10 | | 288,000 | | 2.4 | % | 20.38 | | 38 | | 108,000 | | 4.4% | 42.55 | | 48 | | 396,000 | | 2.7% | 26.43 | |
| 2026 | 6 | | 103,000 | | 0.9 | % | 24.25 | | 42 | | 122,000 | | 4.9% | 41.67 | | 48 | | 225,000 | | 1.6% | 33.69 | |
| 2027 | 3 | | 42,000 | | 0.3 | % | 23.74 | | 39 | | 112,000 | | 4.5% | 31.68 | | 42 | | 154,000 | | 1.1% | 29.52 | |
| 2028 | 5 | | 295,000 | | 2.5 | % | 15.56 | | 39 | | 115,000 | | 4.7% | 39.11 | | 44 | | 410,000 | | 2.8% | 22.17 | |
| 2029 | 14 | | 410,000 | | 3.4 | % | 23.46 | | 28 | | 94,000 | | 3.8% | 45.60 | | 42 | | 504,000 | | 3.5% | 27.59 | |
| 2030 | 10 | | 281,000 | | 2.3 | % | 20.97 | | 27 | | 93,000 | | 3.8% | 42.48 | | 37 | | 374,000 | | 2.6% | 26.32 | |
| 2031 | 11 | | 291,000 | | 2.4 | % | 22.80 | | 27 | | 80,000 | | 3.2% | 40.82 | | 38 | | 371,000 | | 2.6% | 26.68 | |
| 2032 | 6 | | 239,000 | | 2.0 | % | 17.26 | | 30 | | 94,000 | | 3.8% | 38.88 | | 36 | | 333,000 | | 2.3% | 23.36 | |
| 2033 | 16 | | 488,000 | | 4.1 | % | 28.80 | | 18 | | 58,000 | | 2.3% | 55.09 | | 34 | | 546,000 | | 3.8% | 31.60 | |
| Thereafter | 166 | | 8,797,000 | | 73.2 | % | 22.86 | | 221 | | 920,000 | | 37.3% | 45.91 | | 387 | | 9,717,000 | | 66.8% | 25.04 | |
| Subtotal/Average | 260 | | 11,547,000 | | 96.0 | % | $ | 22.69 | | 626 | | 2,100,000 | | 85.0 | % | $ | 42.93 | | 886 | | 13,647,000 | | 94.1 | % | $ | 25.81 | |
| Vacant | 18 | | 479,000 | | 4.0 | % | N/A | 151 | | 372,000 | | 15.0% | N/A | 169 | | 851,000 | | 5.9 | % | N/A |
| Total/Average | 278 | | 12,026,000 | | 100.0 | % | N/A | 777 | | 2,472,000 | | 100.0% | N/A | 1,055 | | 14,498,000 | | 100.0 | % | N/A |
| | | | | | | | | | | | |
(1) Year of expiration includes tenant renewal options.
(2) Weighted average annual base rent per square foot is calculated by annualizing tenants' base cash rent, including ground rent, and excludes tenant reimbursements and concessions and storage rent and is adjusted for assumed exercised options using option rents specified in the underlying leases. Weighted average annual base rent for leases whose future option rent is based on fair market value or CPI is reported at the last stated option rent in the respective lease.
Note: Amounts shown in table above include both current leases and signed leases that have not commenced on vacant spaces for all retail properties (excludes Sunrise Mall and includes properties in redevelopment) and excludes 132,000 sf of self-storage space. The average base rent for our 1,345,000 square-foot warehouse properties assuming exercise of all options at future tenant rent (excluded from the table above) is $10.55 per square foot as of March 31, 2023.
| | | | | | | | |
| URBAN EDGE PROPERTIES | | |
| PROPERTY STATUS REPORT | | |
| As of March 31, 2023 | | |
| (dollars in thousands, except per sf amounts) | | |
| | | | | | | | | | | | | | | | | |
| Property | Total Square Feet (1) | Percent Leased(1) | Weighted Average ABR PSF(2) | Mortgage Debt(7) | Major Tenants |
| | | | | |
| RETAIL PORTFOLIO: | | |
| California: | | | | | |
Walnut Creek (Mt. Diablo)(4) | 7,000 | | 43.8% | 72.00 | — | Sweetgreen |
| Walnut Creek (Olympic) | 31,000 | | 100.0% | $80.50 | — | Anthropologie |
| Connecticut: | | | | | |
| Newington Commons | 189,000 | | 90.0% | 9.55 | — | Walmart, Staples |
| Maryland: | | | | | |
| Goucher Commons | 155,000 | | 90.0% | 23.94 | — | Sprouts, HomeGoods, Five Below, Ulta, Kirkland's, DSW, Golf Galaxy (lease not commenced) |
| Rockville Town Center | 94,000 | | 98.0% | 16.82 | — | Regal Entertainment Group |
Wheaton (leased through 2060)(3) | 66,000 | | 100.0% | 18.35 | — | Best Buy |
| Woodmore Towne Centre | 712,000 | | 98.4% | 18.04 | $117,200 | Costco, Wegmans, At Home, Best Buy, LA Fitness, Nordstrom Rack |
| Massachusetts: | | | | | |
Cambridge (leased through 2033)(3) | 48,000 | | 100.0% | 28.06 | — | PetSmart, Central Rock (lease not commenced) |
The Shops at Riverwood(6) | 76,000 | | 100.0% | 24.42 | $21,466 | Price Rite, Planet Fitness, Goodwill |
| Wonderland Marketplace | 140,000 | | 100.0% | 13.76 | — | Big Lots, Planet Fitness, Marshalls, Get Air |
| Missouri: | | | | | |
| Manchester Plaza | 131,000 | | 100.0% | 11.82 | $12,500 | Pan-Asia Market, Academy Sports, Bob's Discount Furniture |
| New Hampshire: | | | | | |
Salem (leased through 2102)(3) | 39,000 | | 100.0% | 10.20 | — | Fun City |
| New Jersey: | | | | | |
| Bergen Town Center - East | 253,000 | | 93.8% | 22.39 | — | Lowe's, REI, Best Buy |
| Bergen Town Center - West | 1,051,000 | | 91.0% | 31.43 | $300,000 | Target, Whole Foods Market, Burlington, Marshalls, Nordstrom Rack, Saks Off 5th, HomeGoods, H&M, Bloomingdale's Outlet, Nike Factory Store, Old Navy, Kohl's |
Briarcliff Commons(6) | 176,000 | | 94.7% | 23.72 | — | Uncle Giuseppe's, Kohl's |
| Brick Commons | 273,000 | | 98.7% | 20.93 | $48,401 | ShopRite, Kohl's, Marshalls, Old Navy |
| Brunswick Commons | 427,000 | | 100.0% | 15.06 | $63,000 | Lowe's, Kohl's, Dick's Sporting Goods, P.C. Richard & Son, T.J. Maxx, LA Fitness |
Carlstadt Commons (leased through 2050)(3) | 78,000 | | 98.3% | 24.06 | — | Stop & Shop |
| Garfield Commons | 298,000 | | 100.0% | 16.01 | $40,130 | Walmart, Burlington, Marshalls, PetSmart, Ulta |
| Greenbrook Commons | 170,000 | | 100.0% | 18.83 | $25,452 | BJ's Wholesale Club, Aldi (lease not commenced) |
| Hackensack Commons | 275,000 | | 99.4% | 25.75 | $66,400 | The Home Depot, 99 Ranch, Staples, Petco |
| Hanover Commons | 343,000 | | 99.3% | 21.61 | $62,176 | The Home Depot, Dick's Sporting Goods, Saks Off 5th, Marshalls |
| Hazlet | 95,000 | | 100.0% | 3.96 | — | Stop & Shop(5) |
| Hudson Commons | 236,000 | | 100.0% | 13.99 | $27,344 | Lowe's, P.C. Richard & Son |
| Hudson Mall | 382,000 | | 84.9% | 18.14 | $21,184 | Marshalls, Big Lots, Retro Fitness, Staples, Old Navy |
| Kearny Commons | 121,000 | | 100.0% | 24.17 | — | LA Fitness, Marshalls, Ulta |
| Kennedy Commons | 62,000 | | 100.0% | 15.46 | — | Food Bazaar |
| Lodi Commons | 43,000 | | 100.0% | 20.25 | — | Dollar Tree |
| Manalapan Commons | 208,000 | | 69.3% | 21.15 | — | Best Buy, Raymour & Flanigan, PetSmart, Avalon Flooring |
| Marlton Commons | 214,000 | | 100.0% | 16.69 | $37,234 | ShopRite, Kohl's, PetSmart |
| Millburn | 104,000 | | 89.5% | 28.96 | $22,369 | Trader Joe's, CVS, PetSmart |
| | | | | | | | |
| URBAN EDGE PROPERTIES | | |
| PROPERTY STATUS REPORT | | |
| As of March 31, 2023 | | |
| (dollars in thousands, except per sf amounts) | | |
| | | | | | | | | | | | | | | | | |
| Property | Total Square Feet (1) | Percent Leased(1) | Weighted Average ABR PSF(2) | Mortgage Debt(7) | Major Tenants |
| Montclair | 18,000 | | 100.0% | 32.00 | $7,250 | Whole Foods Market |
Paramus (leased through 2033)(3) | 63,000 | | 100.0% | 49.97 | — | 24 Hour Fitness |
| Plaza at Cherry Hill | 422,000 | | 82.1% | 15.32 | $29,000 | Aldi, LA Fitness, Raymour & Flanigan, Total Wine, Guitar Center, Sam Ash Music |
| Plaza at Woodbridge | 332,000 | | 91.6% | 19.04 | $52,947 | Best Buy, Raymour & Flanigan, Lincoln Tech, Retro Fitness, Bed Bath & Beyond and buybuy Baby |
| Rockaway River Commons | 189,000 | | 96.8% | 15.17 | $27,161 | ShopRite, T.J. Maxx |
| Rutherford Commons | 197,000 | | 98.2% | 12.97 | $23,000 | Lowe's |
Stelton Commons (leased through 2039)(3) | 56,000 | | 100.0% | 21.78 | — | Staples, Party City |
| Tonnelle Commons | 410,000 | | 100.0% | 21.95 | $98,438 | BJ's Wholesale Club, Walmart, PetSmart |
| Totowa Commons | 271,000 | | 93.4% | 18.25 | $50,800 | The Home Depot, Bed Bath & Beyond, buybuy Baby, Staples |
| Town Brook Commons | 231,000 | | 97.0% | 13.41 | $30,678 | Stop & Shop, Kohl's |
| Union (Vauxhall) | 232,000 | | 100.0% | 17.85 | $45,600 | The Home Depot |
| West Branch Commons | 279,000 | | 98.7% | 16.13 | — | Lowe's, Burlington |
| West End Commons | 241,000 | | 100.0% | 11.80 | $24,544 | Costco, The Tile Shop, La-Z-Boy, Petco, Da Vita Dialysis |
| Woodbridge Commons | 225,000 | | 100.0% | 13.52 | $22,100 | Walmart, Dollar Tree, Advance Auto Parts |
| New York: | | | | | |
| Amherst Commons | 311,000 | | 80.3% | 10.90 | — | BJ's Wholesale Club, Burlington, LA Fitness |
Bruckner Commons(6) | 394,000 | | 75.6% | 34.05 | — | ShopRite, Burlington, Target (lease not commenced) |
| Shops at Bruckner | 115,000 | | 100.0% | 38.38 | $8,847 | Marshalls, Old Navy, Five Below, Aldi (lease not commenced) |
| Burnside Commons | 100,000 | | 90.7% | 17.49 | — | Bingo Wholesale (leased not commenced) |
| Cross Bay Commons | 45,000 | | 87.1% | 43.96 | — | Northwell Health |
Dewitt (leased through 2041)(3) | 46,000 | | 100.0% | 19.36 | — | Best Buy |
| Forest Commons | 165,000 | | 96.6% | 24.92 | — | Western Beef, Planet Fitness, Advance Auto Parts, NYC Public School |
| Freeport Commons | 173,000 | | 100.0% | 26.32 | $43,100 | The Home Depot, Staples |
| Gun Hill Commons | 81,000 | | 100.0% | 37.65 | $24,065 | Aldi, Planet Fitness |
Henrietta Commons (leased through 2056)(3) | 165,000 | | 97.9% | 4.62 | — | Kohl's |
| Huntington Commons | 207,000 | | 94.6% | 21.31 | — | ShopRite, Marshalls, Old Navy, Petco, Burlington (lease not commenced) |
| Kingswood Center | 129,000 | | 86.6% | 27.64 | $69,714 | T.J. Maxx, Visiting Nurse Service of NY |
| Kingswood Crossing | 107,000 | | 69.5% | 41.86 | — | Target, Marshalls, Maimonides Medical |
Meadowbrook Commons (leased through 2040)(3) | 44,000 | | 100.0% | 22.31 | — | Bob's Discount Furniture |
| Mount Kisco Commons | 189,000 | | 99.2% | 17.31 | $11,598 | Target, Stop & Shop |
New Hyde Park (leased through 2029)(3) | 101,000 | | 100.0% | 21.93 | — | Stop & Shop |
Yonkers Gateway
| 448,000 | | 94.1% | 16.04 | $24,537 | Burlington, Marshalls, Homesense, Best Buy, DSW, PetSmart, Alamo Drafthouse Cinema |
| | | | | |
| | | | | |
| | | | | |
| | | | | | | | |
| URBAN EDGE PROPERTIES | | |
| PROPERTY STATUS REPORT | | |
| As of March 31, 2023 | | |
| (dollars in thousands, except per sf amounts) | | |
| | | | | | | | | | | | | | | | | |
| Property | Total Square Feet (1) | Percent Leased(1) | Weighted Average ABR PSF(2) | Mortgage Debt(7) | Major Tenants |
| | | | | |
| Pennsylvania: | | | | | |
Broomall Commons(6) | 168,000 | | 75.8% | 16.40 | — | Amazon Fresh, Planet Fitness, PetSmart, Nemours Children's Hospital |
| Lincoln Plaza | 228,000 | | 100.0% | 5.27 | — | Lowe's, Community Aid, Mattress Firm |
| MacDade Commons | 102,000 | | 100.0% | 12.93 | — | Walmart |
| Marten Commons | 185,000 | | 96.6% | 14.85 | — | Kohl's, Ross Dress for Less, Staples, Petco |
Springfield (leased through 2025)(3) | 41,000 | | 100.0% | 25.29 | — | PetSmart |
| Wilkes-Barre Commons | 184,000 | | 100.0% | 12.93 | — | Bob's Discount Furniture, Ross Dress for Less, Marshalls, Petco, Wren Kitchens |
Wyomissing (leased through 2065)(3) | 76,000 | | 100.0% | 14.70 | — | LA Fitness, PetSmart |
| South Carolina: | | | | | |
Charleston (leased through 2063)(3) | 45,000 | | 100.0% | 15.96 | — | Best Buy |
| Virginia: | | | | | |
Norfolk (leased through 2069)(3) | 114,000 | | 100.0% | 7.79 | — | BJ's Wholesale Club |
| Puerto Rico: | | | | | |
| Las Catalinas Mall | 355,000 | | 86.0% | 30.11 | $118,401 | Sector Sixty6 (lease not commenced), Forever 21, Old Navy |
The Outlets at Montehiedra(6) | 517,000 | | 94.4% | 20.10 | $77,057 | The Home Depot, Marshalls, Caribbean Cinemas, Tiendas Capri, Old Navy, Ralph's Food Warehouse (lease not commenced), T.J. Maxx (lease not commenced) |
| Total Retail Portfolio | 14,498,000 | | 94.1% | $19.90 | $1,653,693 | |
| INDUSTRIAL: | | | | | |
| Hanover Warehouses | 1,218,000 | | 100.0% | 8.47 | $40,526 | J & J Tri-State Delivery, Foremost Groups, PCS Wireless, Fidelity Paper & Supply, Decker Tape, Givaudan Flavors, Reliable Tire, Nutra-Med, Bestway Trucking |
| Lodi Route 17 | 127,000 | | 100.0% | 12.97 | — | AAA Wholesale Group |
| Total Industrial | 1,345,000 | | 100.0% | $8.89 | $40,526 | |
| | | | | |
Sunrise Mall (leased through 2069)(4)(6) | 1,228,000 | | 33.4% | 8.36 | — | Macy's, Dick's Sporting Goods, Dave & Buster's, Raymour & Flanigan, Home Goods |
| | | | | |
| Total Urban Edge Properties | 17,071,000 | | 90.2% | $18.63 | $1,694,219 | |
(1) Percent leased is expressed as the percentage of gross leasable area subject to a lease, excluding temporary tenants. The Company excludes 132,000 sf of self-storage from the report above.
(2) Weighted average annual base rent per square foot including ground leases and executed leases for which rent has not commenced is calculated by annualizing tenants' current base rent (excluding any free rent periods), and excluding tenant reimbursements, concessions and storage rent. Excluding the ground leases where the Company is the lessor, the weighted average annual base rent per square foot for our retail portfolio is $21.77 per square foot.
(3) The Company is a lessee under a ground or building lease. The total square feet disclosed for the building will revert to the lessor upon lease expiration.
(4) We own 95% of Walnut Creek (Mt. Diablo) and 82.5% of Sunrise Mall with the remaining portions in each case owned by joint venture partners.
(5) The tenant never commenced operations at this location but continues to pay rent.
(6) Not included in the same-property pool for the purposes of calculating same-property NOI for the quarter ended March 31, 2023 and 2022.
(7) Mortgage debt balances exclude unamortized debt issuance costs.
| | | | | | | | |
| URBAN EDGE PROPERTIES | | |
| PROPERTY ACQUISITIONS AND DISPOSITIONS | |
| For the three months ended March 31, 2023 | | |
| (dollars in thousands) | | |
| | | | | | | | | | | | | | | | | | | | |
| 2023 Property Acquisitions: | | | | | |
| | | | | | |
| None. | | | | | | |
| | | | | | |
| | | | | | |
| | | | | | |
| | | | | | |
| 2023 Property Dispositions: | | | | | |
| | | | | | |
| None. | | | | | | |
| | | | | | | | |
| URBAN EDGE PROPERTIES | | |
| DEVELOPMENT, REDEVELOPMENT AND ANCHOR REPOSITIONING PROJECTS | |
| As of March 31, 2023 | | |
| (in thousands, except square footage data) | | |
| | | | | | | | | | | | | | | | | |
| Active Projects | Estimated Gross Cost(1) | | Incurred as of 3/31/23 | Target Stabilization(2) | Description and Status |
Bergen Town Center (Phase B)(3) | $ | 44,300 | | | $ | 5,200 | | 2Q25 | Ground-up development of an 80,000 sf medical office building for Hackensack Meridian Health on a vacant outparcel facing Route 4 |
Bruckner Commons (Phase A)(5) | 38,700 | | | 4,600 | | 2Q25 | Retenanting former Kmart box with Target |
Las Catalinas(3) | 13,400 | | | 12,700 | | 3Q23 | Retenanting former Kmart box with Sector Sixty6 |
Huntington Commons (Phase B)(3) | 13,300 | | | 5,200 | | 2Q24 | Backfilling the relocated Marshalls box with Burlington (24,000 sf), as well as additional center repositioning and renovations |
The Outlets at Montehiedra (Phase C)(5) | 12,600 | | | 700 | | 3Q24 | Demising and retenanting former Kmart box with Ralph's Food Warehouse and Urology Hub |
The Outlets at Montehiedra (Phase D)(5) | 10,600 | | | 9,100 | | 2Q23 | Constructing new 14,000 sf building for Walgreens and Global Mattress and new 3,000 sf pad for Arby's |
Broomall Commons (Phase B)(5) | 10,300 | | | 3,700 | | 4Q23 | Retenanting 19,000 sf former A.C. Moore with Nemours Children's Hospital and backfilling remaining 41,000 sf |
Hudson Mall(3) | 9,700 | | | 5,900 | | 1Q24 | Retenanting former Toys "R" Us box |
Shops at Bruckner (Phase B)(3) | 9,100 | | | 6,700 | | 4Q23 | Retenanting with Aldi and Lot Less |
Marlton Commons(3) | 7,300 | | | 800 | | 3Q24 | Redeveloping Friendly's with new 10,700± sf multi-tenant pad (First Watch and Cava executed) |
Burnside Commons(3) | 6,900 | | 1,900 | | 1Q24 | Retenanting anchor vacancy with Bingo Wholesale |
The Outlets at Montehiedra (Phase D)(5) | 6,800 | | 100 | | 2Q24 | Retenanting 24,000 sf of vacant Kmart box with T.J. Maxx |
Brick Commons(3) | 4,500 | | 1,000 | | 3Q24 | Replacing Santander Bank with two quick service restaurants (Shake Shack and First Watch executed) |
Huntington Commons (Phase C)(3) | 4,200 | | 400 | | 1Q24 | Redemising former Outback to create three small shop spaces (Cycle Bar, GolfTec and IStretch+ executed) |
Walnut Creek(3) | 3,500 | | 2,100 | | 4Q23 | Retenanting former Z Gallerie with Sweetgreen (open) and remaining 4,000 sf |
East Hanover Warehouses (Phase A)(3) | 3,300 | | 2,800 | | 3Q23 | Retenanting 187,000 sf of warehouse space with Bestway Trucking Service |
Goucher Commons(3) | 3,100 | | — | | 2Q24 | Backfilling 22,000± sf Staples box with Golf Galaxy |
Plaza at Cherry Hill (Phase A)(3) | 2,800 | | 1,000 | | 2Q23 | Relocating and expanding Total Wine |
East Hanover Warehouses (Phase B)(3) | 2,800 | | 100 | | 3Q23 | Retenanting 99,000 sf vacancy with Decker Tape |
Briarcliff Commons (Phase B)(5) | 2,700 | | 2,400 | | 3Q23 | Developing new 4,000± sf pad for CityMD |
Greenbrook Commons(3) | 2,600 | | 200 | | 2Q24 | Backfilling Unique Thrift with Aldi |
The Outlets at Montehiedra (Phase B)(5) | 2,200 | | 100 | | 2Q24 | Developing new 6,000± sf pad for Texas Roadhouse |
Yonkers Gateway Center(3) | 1,700 | | 700 | | 3Q23 | Retenanting end cap space with Wren Kitchens |
Plaza at Cherry Hill (Phase B)(3) | 1,300 | | 300 | | 4Q23 | Backfilling 25,000 sf vacancy with Savers Thrift |
| Total | $ | 217,700 | | (4) | $ | 67,700 | | |
| | | | | |
(1) Estimated gross cost includes the allocation of internal costs such as labor, interest and taxes.
(2) Target Stabilization reflects the first quarter in which at least 80% of the expected NOI from the project has commenced. A project achieving Target Stabilization is classified as Completed whether or not all costs have been expended and remains listed as a Completed project for one year in the table on page 31. The Target Stabilization date is an estimate and is subject to change resulting from uncertainties inherent in the development process and not wholly under the Company's control.
(3) Results from these properties are included in our same-property metrics for the quarter ended March 31, 2023.
(4) The estimated, unleveraged yield for total Active projects is 12% based on total estimated project costs and the incremental, unleveraged NOI directly attributable to the projects unless otherwise noted. The incremental, unleveraged NOI for Active projects excludes NOI generated outside the project scope such as the impact on future lease rollovers or on the long-term value of the property. The unleveraged yield for projects related to vacant spaces is based on the total NOI directly attributable to the project and the estimated project costs.
(5) Results from these properties are included in our same-property including redevelopment metrics for the quarter ended March 31, 2023.
| | | | | | | | |
| URBAN EDGE PROPERTIES | | |
| DEVELOPMENT, REDEVELOPMENT AND ANCHOR REPOSITIONING PROJECTS | |
| As of March 31, 2023 | | |
| (in thousands, except square footage data) | | |
| | | | | | | | | | | | | | | | | |
| Completed Projects | Estimated Gross Cost(1) | | Incurred as of 3/31/23 | Stabilization(2) | Description |
Mt. Kisco(3) | $ | 3,100 | | | $ | 2,800 | | 1Q23 | Converted former sit-down restaurant into Chipotle and Dunkin' |
Bergen Town Center (Phase A)(3) | 25,600 | | | 25,500 | | 4Q22 | Retenanted former Century 21 box with Kohl's |
Huntington Commons (Phase A)(3) | 23,000 | | | 23,000 | | 4Q22 | Retenanted former Kmart box with ShopRite and Marshalls |
Kearny Commons(3) | 11,900 | | | 11,600 | | 4Q22 | Expanded by 22,000 sf to accommodate a 10,000 sf Ulta and small shops as well as added a freestanding Starbucks |
Shops at Bruckner (Phase A)(3) | 6,200 | | | 4,100 | | 4Q22 | Relocated Jimmy Jazz to former Carter's space and retenanted former Jimmy Jazz and Danice spaces with Five Below; renovated façade and upgraded common areas |
Wilkes Barre (Phase B)(3) | 2,400 | | | 2,200 | | 3Q22 | Retenanted former Babies "R" Us box with Wren Kitchens |
Lodi (Route 17 North)(3) | 11,700 | | | 11,500 | | 2Q22 | Converted former National Wholesale Liquidator space into 127,000 sf industrial space for AAA Wholesale Group |
Broomall Commons (Phase A)(6) | 6,700 | | | 6,700 | | 2Q22 | Retenanted 44,000± sf of the former Giant Food space with Amazon Fresh |
Tonnelle Commons (Phase B)(3) | 3,000 | | | 2,600 | | 2Q22 | Retenanted former Staples with Five Below and Skechers |
| | | | | |
| Total | $ | 93,600 | | (4) | $ | 90,000 | | | |
| | | | | | | | |
Future Redevelopment(5) | Location | Opportunity |
Bergen Town Center(3) | Paramus, NJ | Develop a mix of uses including residential, hotel, and/or office; common area improvements and enhancements to improve merchandising |
Brunswick Commons(3) | East Brunswick, NJ | Develop new pad |
Hudson Mall(3) | Jersey City, NJ | Reposition mall with redevelopment and renovation opportunities including retail and amenity upgrades and consideration of alternate uses |
The Plaza at Cherry Hill(3) | Cherry Hill, NJ | Renovate exterior of center and common areas |
| Sunrise Mall | Massapequa, NY | Redevelop mall including consideration of alternate uses |
(1) Estimated gross cost includes the allocation of internal costs such as labor, interest and taxes.
(2) Stabilization reflects the first quarter in which at least 80% of the expected NOI from the project has commenced. A project achieving Stabilization is classified as Completed whether or not all costs have been expended and remains listed as a Completed project for one year in the table above.
(3) Results from these properties are included in our same-property metrics for the quarter ended March 31, 2023.
(4) The estimated unleveraged yield for Completed projects is 10% based on total estimated project costs and the incremental, unleveraged NOI directly attributable to the projects unless otherwise noted. The incremental, unleveraged NOI for Completed projects excludes NOI generated outside the project scope such as the impact on future lease rollovers or on the long-term value of the property. The unleveraged yield for projects related to vacant spaces as a result of bankruptcy is based on the total NOI directly attributable to the project and the estimated project costs.
(5) The Company has identified future redevelopment opportunities which are, or will soon be, in planning phases and as such, may not ultimately become active projects. Proceeding with these investments is subject to many factors outside of the Company's control, and it is possible that municipal or other approvals may delay or suspend our ability to proceed with such plans. The execution of these projects is discretionary and we are under no current obligation to fund these projects.
(6) Results from these properties are included in our same-property including redevelopment metrics for the quarter ended March 31, 2023.
| | | | | | | | |
| URBAN EDGE PROPERTIES | | |
| DEBT SUMMARY | |
| As of March 31, 2023 and December 31, 2022 | | |
| (in thousands) | | |
| | | | | | | | | | | |
| March 31, 2023 | | December 31, 2022 |
| Secured fixed rate debt | $ | 1,535,411 | | | $ | 1,540,293 | |
| Secured variable rate debt | 158,808 | | | 159,198 | |
| Total debt | $ | 1,694,219 | | | $ | 1,699,491 | |
| | | |
| % Secured fixed rate debt | 90.6 | % | | 90.6 | % |
| % Secured variable rate debt | 9.4 | % | | 9.4 | % |
| Total | 100 | % | | 100 | % |
| | | |
| | | |
| Secured mortgage debt | $ | 1,694,219 | | | $ | 1,699,491 | |
Unsecured debt(1) | — | | | — | |
| Total debt | $ | 1,694,219 | | | $ | 1,699,491 | |
| | | |
| % Secured mortgage debt | 100 | % | | 100 | % |
| % Unsecured mortgage debt | — | | | — | |
| Total | 100 | % | | 100 | % |
| | | |
| Weighted average remaining maturity on secured mortgage debt | 3.9 years | | 4.1 years |
| Weighted average remaining maturity on unsecured debt | N/A | | N/A |
| | | |
| | | |
| Total market capitalization (see page 18) | $ | 3,540,842 | | | |
| | | |
| % Secured mortgage debt | 47.8 | % | | |
| % Unsecured debt | — | % | | |
| Total debt: Total market capitalization | 47.8 | % | | |
| | | |
| | | |
Weighted average interest rate on secured mortgage debt(2) | 4.31 | % | | 4.28 | % |
| | | |
Note: All amounts and calculations exclude unamortized debt issuance costs on mortgages payable.
(1) No amounts are currently outstanding on our unsecured $800 million line of credit. The agreement has a maturity date of February 9, 2027 with two six-month extension options. Borrowings under the agreement bear interest at SOFR plus an applicable margin of 1.05% to 1.50% and an annual facility fee of 15 to 30 basis points based on our current leverage ratio.
(2) Weighted average interest rate is calculated based on balances outstanding at the respective dates.
| | | | | | | | |
| URBAN EDGE PROPERTIES | | |
| MORTGAGE DEBT SUMMARY | |
| As of March 31, 2023 and December 31, 2022 | | |
| (dollars in thousands) | | |
| | | | | | | | | | | | | | | | | |
| Property | Maturity Date | Rate | March 31, 2023 | December 31, 2022 | Percent of Mortgage Debt at March 31, 2023 |
Bergen Town Center(5) | 4/8/2023 | 3.56 | % | $ | 300,000 | | $ | 300,000 | | 17.9 | % |
Shops at Bruckner(6) | 5/1/2023 | 3.90 | % | 8,847 | | 9,020 | | 0.5 | % |
| Hudson Mall | 12/1/2023 | 5.07 | % | 21,184 | | 21,380 | | 1.3 | % |
| Yonkers Gateway Center | 4/6/2024 | 4.16 | % | 24,537 | | 24,996 | | 1.4 | % |
Hudson Commons(1) | 11/15/2024 | 6.53 | % | 27,344 | | 27,482 | | 1.6 | % |
Greenbrook Commons(1) | 11/15/2024 | 6.53 | % | 25,452 | | 25,581 | | 1.5 | % |
Gun Hill Commons(1) | 12/1/2024 | 6.53 | % | 24,065 | | 24,188 | | 1.4 | % |
| Brick Commons | 12/10/2024 | 3.87 | % | 48,401 | | 48,636 | | 2.9 | % |
Plaza at Cherry Hill(2) | 6/15/2025 | 8.50 | % | 29,000 | | 29,000 | | 1.7 | % |
| West End Commons | 12/10/2025 | 3.99 | % | 24,544 | | 24,658 | | 1.4 | % |
| Las Catalinas Mall | 2/1/2026 | 4.43 | % | 118,401 | | 119,633 | | 7.0 | % |
| Town Brook Commons | 12/1/2026 | 3.78 | % | 30,678 | | 30,825 | | 1.8 | % |
| Rockaway River Commons | 12/1/2026 | 3.78 | % | 27,161 | | 27,291 | | 1.6 | % |
| Hanover Commons | 12/10/2026 | 4.03 | % | 62,176 | | 62,453 | | 3.7 | % |
| Tonnelle Commons | 4/1/2027 | 4.18 | % | 98,438 | | 98,870 | | 5.8 | % |
| Manchester Plaza | 6/1/2027 | 4.32 | % | 12,500 | | 12,500 | | 0.7 | % |
| Millburn Gateway Center | 6/1/2027 | 3.97 | % | 22,369 | | 22,489 | | 1.3 | % |
Plaza at Woodbridge(3) | 6/8/2027 | 5.26 | % | 52,947 | | 52,947 | | 3.1 | % |
| Totowa Commons | 12/1/2027 | 4.33 | % | 50,800 | | 50,800 | | 3.0 | % |
| Woodbridge Commons | 12/1/2027 | 4.36 | % | 22,100 | | 22,100 | | 1.3 | % |
| Brunswick Commons | 12/6/2027 | 4.38 | % | 63,000 | | 63,000 | | 3.7 | % |
| Rutherford Commons | 1/6/2028 | 4.49 | % | 23,000 | | 23,000 | | 1.4 | % |
| Kingswood Center | 2/6/2028 | 5.07 | % | 69,714 | | 69,935 | | 4.1 | % |
| Hackensack Commons | 3/1/2028 | 4.36 | % | 66,400 | | 66,400 | | 3.9 | % |
| East Hanover Warehouses | 12/1/2028 | 4.09 | % | 40,526 | | 40,700 | | 2.4 | % |
| Marlton Commons | 12/1/2028 | 3.86 | % | 37,234 | | 37,400 | | 2.2 | % |
| Union (Vauxhall) | 12/10/2028 | 4.01 | % | 45,600 | | 45,600 | | 2.7 | % |
| The Shops at Riverwood | 6/24/2029 | 4.25 | % | 21,466 | | 21,466 | | 1.3 | % |
| Freeport Commons | 12/10/2029 | 4.07 | % | 43,100 | | 43,100 | | 2.5 | % |
| The Outlets at Montehiedra | 6/1/2030 | 5.00 | % | 77,057 | | 77,531 | | 4.5 | % |
Montclair(4) | 8/15/2030 | 3.15 | % | 7,250 | | 7,250 | | 0.4 | % |
| Garfield Commons | 12/1/2030 | 4.14 | % | 40,130 | | 40,300 | | 2.4 | % |
| Woodmore Towne Centre | 1/6/2032 | 3.39 | % | 117,200 | | 117,200 | | 6.9 | % |
| Mount Kisco Commons | 11/15/2034 | 6.40 | % | 11,598 | | 11,760 | | 0.7 | % |
| Total mortgage debt | | 4.31 | % | $ | 1,694,219 | | $ | 1,699,491 | | 100.0 | % |
| Unamortized debt issuance costs | | | (7,322) | | (7,801) | | |
| Total mortgage debt, net | | | $ | 1,686,897 | | $ | 1,691,690 | | |
| | | | | |
(1)Bears interest at one month London Interbank Offered Rate ("LIBOR") plus 190 bps.
(2)Bears interest at one month Prime Rate plus 50 bps.
(3)Bears interest at one month Secured Overnight Financing Rate (“SOFR”) plus 226 bps. The variable component of the debt is hedged with an interest rate cap agreement to limit SOFR to a maximum of 3%, which expires July 1, 2023.
(4)Bears interest at LIBOR plus 257 bps. The fixed and variable components of the debt are hedged with an interest rate swap agreement, fixing the rate at 3.15%, which expires at the maturity of the loan.
(5)On April 6, 2023, the Company refinanced the $300 million loan for Bergen Town Center that matured on April 8, 2023 with a new $290 million loan at a fixed interest rate of 6.3%, maturing April 10, 2030.
(6)On May 1, 2023 the Company entered into a forbearance agreement to extend the loan maturity date by 30 days to June 1, 2023, with an option to extend for an additional 30 days to July 1, 2023.
| | | | | | | | |
| URBAN EDGE PROPERTIES | | |
| DEBT MATURITY SCHEDULE | |
| As of March 31, 2023 | |
| (dollars in thousands) | | |
| | | | | | | | | | | | | | | | | | | | | | | |
| | | | | | | |
| Year | Amortization | Balloon Payments | Premium/(Discount) Amortization | | Total | Weighted Average Interest rate at maturity | Percent of Debt Maturing |
2023(1)(2) | $ | 15,907 | | $ | 329,436 | | $ | 882 | | | $ | 346,225 | | 3.7% | 20.6 | % |
| 2024 | 21,827 | | 143,706 | | 847 | | | 166,380 | | 5.2% | 9.8 | % |
| 2025 | 19,612 | | 52,260 | | 811 | | | 72,683 | | 5.9% | 4.3 | % |
| 2026 | 14,496 | | 214,246 | | 811 | | | 229,553 | | 4.2% | 13.5 | % |
| 2027 | 9,505 | | 306,455 | | 811 | | | 316,771 | | 4.4% | 18.7 | % |
| 2028 | 8,097 | | 264,822 | | 15 | | | 272,934 | | 4.4% | 16.1 | % |
| 2029 | 5,711 | | 57,724 | | (60) | | | 63,375 | | 4.2% | 3.7 | % |
| 2030 | 3,170 | | 101,042 | | (60) | | | 104,152 | | 4.6% | 6.1 | % |
| 2031 | 1,203 | | 117,200 | | (60) | | | 118,343 | | 3.4% | 7.0 | % |
| Thereafter | 3,981 | | — | | (178) | | | 3,803 | | 6.4% | 0.2 | % |
| Total | $ | 103,509 | | $ | 1,586,891 | | $ | 3,819 | | | $ | 1,694,219 | | 4.3% | 100 | % |
| Unamortized debt issuance costs | | (7,322) | | | |
| Total outstanding debt, net | | $ | 1,686,897 | | | |
(1) Remainder of 2023.
(2) On April 6, 2023, the Company refinanced the $300 million loan for Bergen Town Center that matured on April 8, 2023, reducing our balloon payments due in the remainder of 2023 to approximately $29 million.