Exhibit 99.2 First Quarter 2020 Earnings Update May 4, 2020
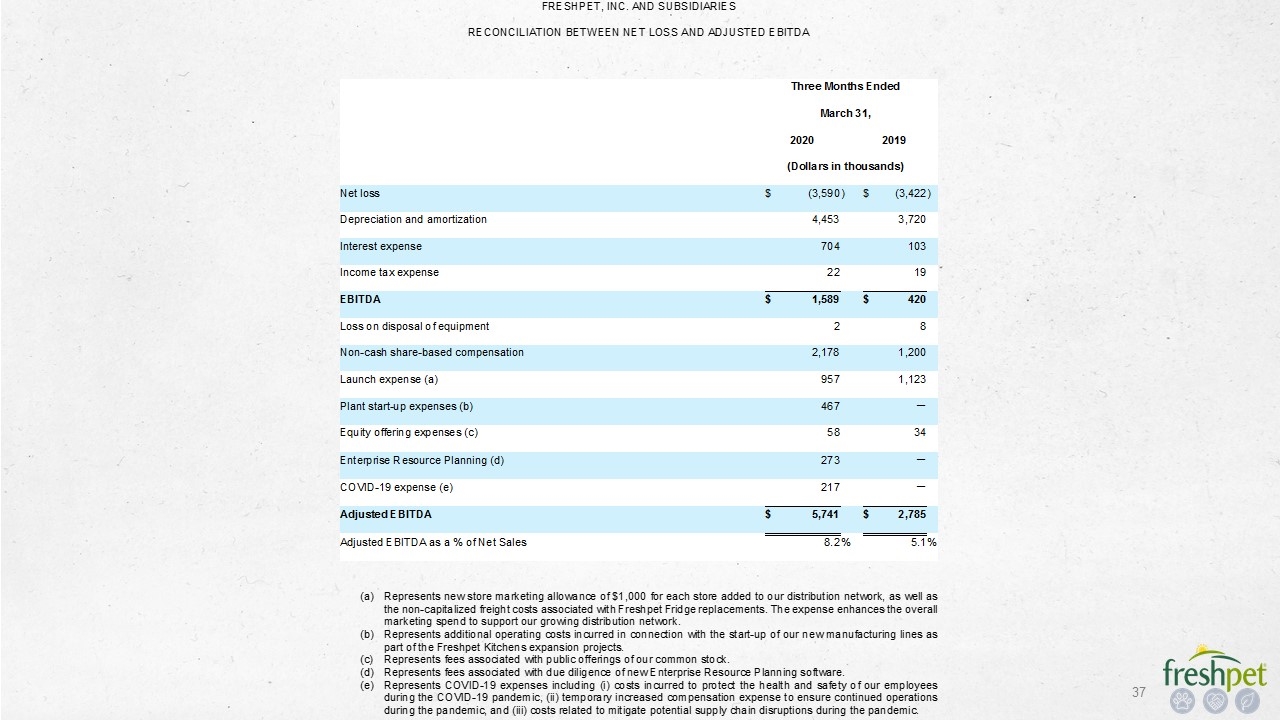
Forward Looking Statements & Non-GAAP Measures Forward-Looking Statements Certain statements in this presentation constitute “forward-looking” statements, which include any statements related to the novel coronavirus ("COVID-19"), the Freshpet Kitchens Expansion, and the Company's general operating and economic environment. These statements are based on management's current opinions, expectations, beliefs, plans, objectives, assumptions or projections regarding future events or future results. These forward-looking statements are only predictions, not historical fact, and involve certain risks and uncertainties, as well as assumptions. Actual results, levels of activity, performance, achievements and events could differ materially from those stated, anticipated or implied by such forward-looking statements. While Freshpet believes that its assumptions are reasonable, it is very difficult to predict the impact of known factors, and, of course, it is impossible to anticipate all factors that could affect actual results. There are many risks and uncertainties that could cause actual results to differ materially from forward-looking statements made herein including, most prominently, the risks discussed under the heading “Risk Factors” in the Company's latest annual report on Form 10-K and quarterly reports on Form 10-Q filed with the Securities and Exchange Commission. Such forward-looking statements are made only as of the date of this presentation. Freshpet undertakes no obligation to publicly update or revise any forward-looking statement because of new information, future events or otherwise, except as otherwise required by law. If we do update one or more forward-looking statements, no inference should be made that we will make additional updates with respect to those or other forward-looking statements. Non-GAAP Measures Freshpet uses certain non-GAAP financial measures, including EBITDA, Adjusted EBITDA, Adjusted EBITDA as a % of net sales, Adjusted Gross Profit, Adjusted Gross Profit as a % of net sales (Adjusted Gross Margin), Adjusted SG&A and Adjusted SG&A as a % of net sales. These non-GAAP financial measures should be considered as supplements to GAAP reported measures, should not be considered replacements for, or superior to, GAAP measures and may not be comparable to similarly named measures used by other companies. Freshpet defines EBITDA as net income (loss) plus interest expense, income tax expense and depreciation and amortization expense, and Adjusted EBITDA as EBITDA plus gain (loss) on disposal of equipment, plant start-up expenses, non-cash share-based compensation, launch expense, fees related to equity offerings, COVID-19 expenses, and fees associated with due diligence of new enterprise resource planning ("ERP") software.
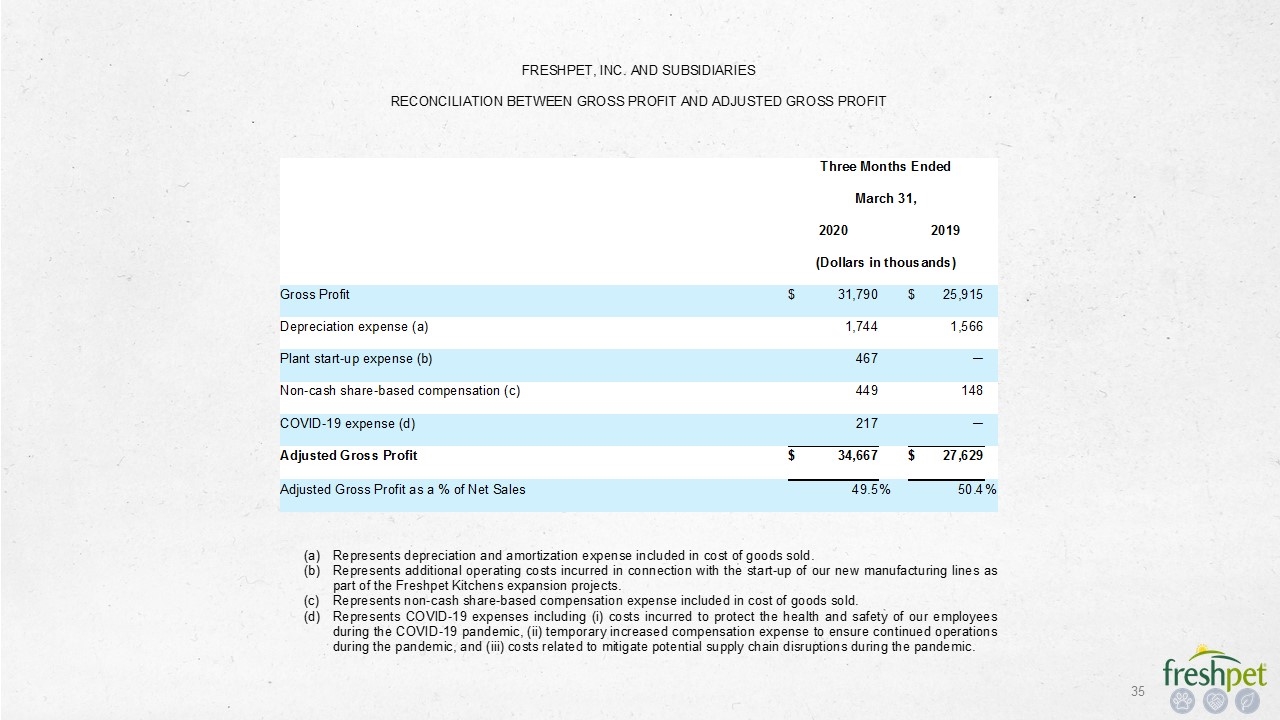
Forward Looking Statements & Non-GAAP Measures (cont.) Freshpet defines Adjusted Gross Profit as gross profit before depreciation expense, plant start-up costs, COVID-19 expenses and non-cash share-based compensation, and Adjusted SG&A as SG&A expenses before depreciation and amortization expense, non-cash share-based compensation, launch expense, gain (loss) on disposal of equipment, fees related to equity offerings, and fees associated with due diligence of new ERP software. Management believes that the non-GAAP financial measures are meaningful to investors because they provide a view of the Company with respect to ongoing operating results. Non-GAAP financial measures are shown as supplemental disclosures in this presentation because they are widely used by the investment community for analysis and comparative evaluation. They also provide additional metrics to evaluate the Company’s operations and, when considered with both the Company’s GAAP results and the reconciliation to the most comparable GAAP measures, provide a more complete understanding of the Company’s business than could be obtained absent this disclosure. Adjusted EBITDA is also an important component of internal budgeting and setting management compensation. The non-GAAP measures are not and should not be considered an alternative to the most comparable GAAP measures or any other figure calculated in accordance with GAAP, or as an indicator of operating performance. The Company’s calculation of the non-GAAP financial measures may differ from methods used by other companies. Management believes that the non-GAAP measures are important to an understanding of the Company's overall operating results in the periods presented. The non-GAAP financial measures are not recognized in accordance with GAAP and should not be viewed as an alternative to GAAP measures of performance. Certain of these measures present the company’s guidance for fiscal year 2020, for which the Company has not yet completed its internal or external audit procedures. The Company does not provide guidance for the most directly comparable GAAP measure and similarly cannot provide a reconciliation to such measure without unreasonable effort due to the unavailability of reliable estimates for certain items. These items are not within the Company’s control and may vary greatly between periods and could significantly impact future financial results.
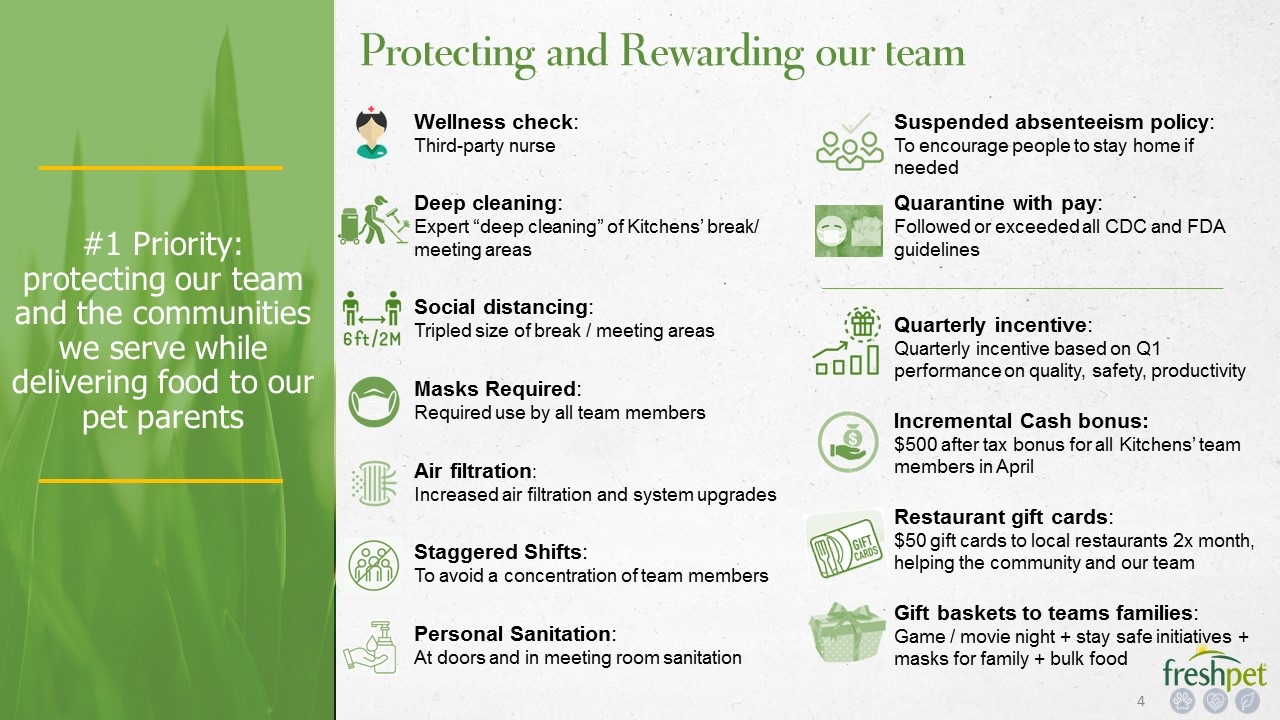
#1 Priority: protecting our team and the communities we serve while delivering food to our pet parents Protecting and Rewarding our team Wellness check: Third-party nurse Deep cleaning: Expert “deep cleaning” of Kitchens’ break/ meeting areas Social distancing: Tripled size of break / meeting areas Masks Required: Required use by all team members Air filtration: Increased air filtration and system upgrades Staggered Shifts: To avoid a concentration of team members Personal Sanitation: At doors and in meeting room sanitation Suspended absenteeism policy: To encourage people to stay home if needed Quarantine with pay: Followed or exceeded all CDC and FDA guidelines Quarterly incentive: Quarterly incentive based on Q1 performance on quality, safety, productivity Incremental Cash bonus: $500 after tax bonus for all Kitchens’ team members in April Restaurant gift cards: $50 gift cards to local restaurants 2x month, helping the community and our team Gift baskets to teams families: Game / movie night + stay safe initiatives + masks for family + bulk food
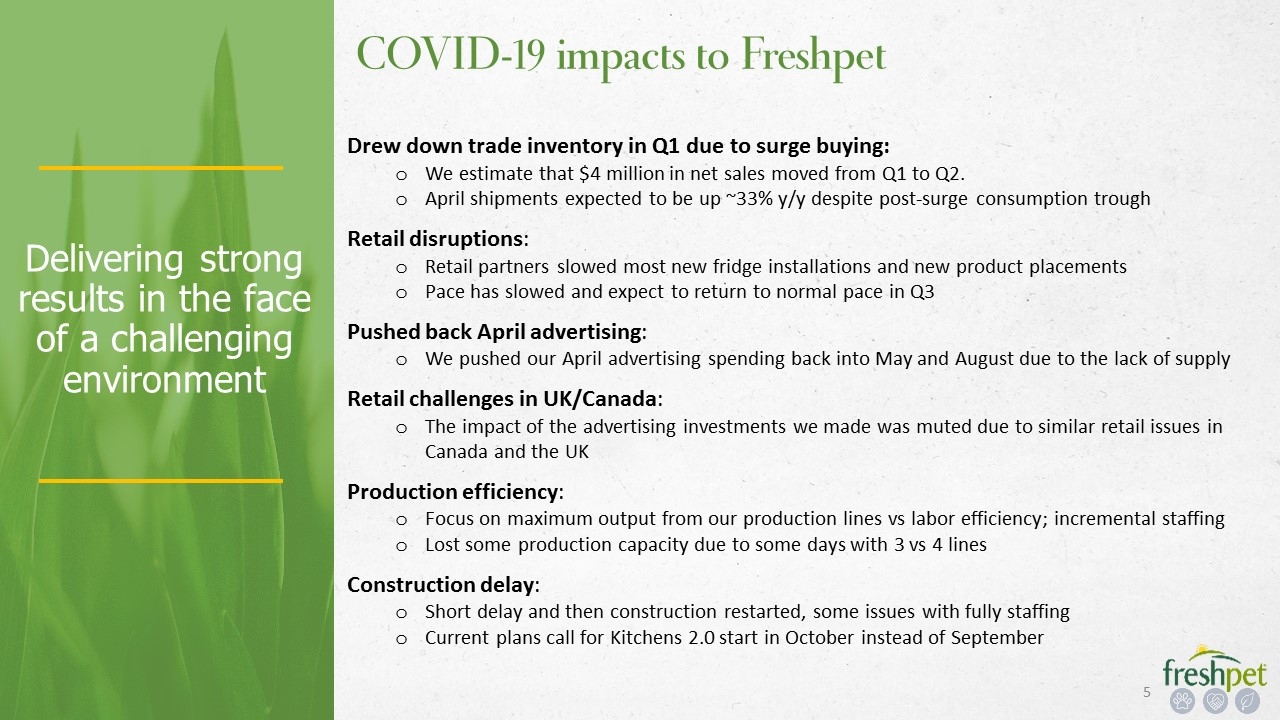
Delivering strong results in the face of a challenging environment COVID-19 impacts to Freshpet Drew down trade inventory in Q1 due to surge buying: We estimate that $4 million in net sales moved from Q1 to Q2. April shipments expected to be up ~33% y/y despite post-surge consumption trough Retail disruptions: Retail partners slowed most new fridge installations and new product placements Pace has slowed and expect to return to normal pace in Q3 Pushed back April advertising: We pushed our April advertising spending back into May and August due to the lack of supply Retail challenges in UK/Canada: The impact of the advertising investments we made was muted due to similar retail issues in Canada and the UK Production efficiency: Focus on maximum output from our production lines vs labor efficiency; incremental staffing Lost some production capacity due to some days with 3 vs 4 lines Construction delay: Short delay and then construction restarted, some issues with fully staffing Current plans call for Kitchens 2.0 start in October instead of September
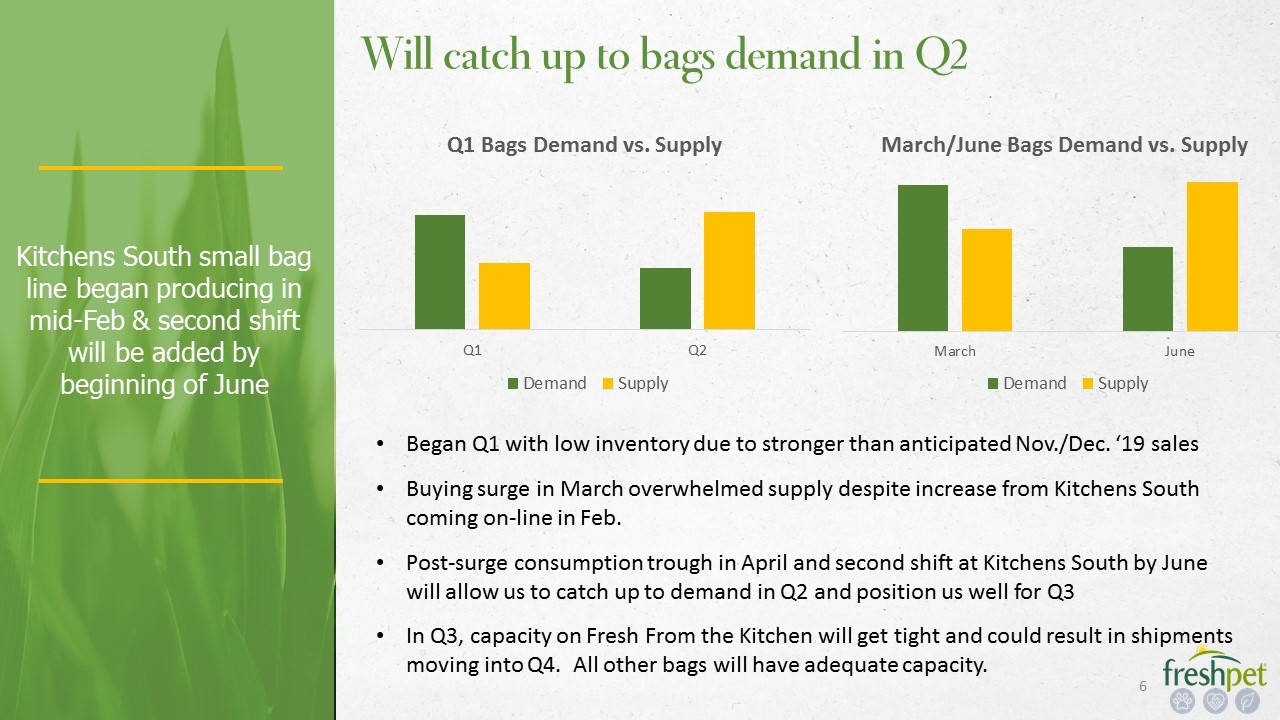
Kitchens South small bag line began producing in mid-Feb & second shift will be added by beginning of June Will catch up to bags demand in Q2 Began Q1 with low inventory due to stronger than anticipated Nov./Dec. ‘19 sales Buying surge in March overwhelmed supply despite increase from Kitchens South coming on-line in Feb. Post-surge consumption trough in April and second shift at Kitchens South by June will allow us to catch up to demand in Q2 and position us well for Q3 In Q3, capacity on Fresh From the Kitchen will get tight and could result in shipments moving into Q4. All other bags will have adequate capacity.
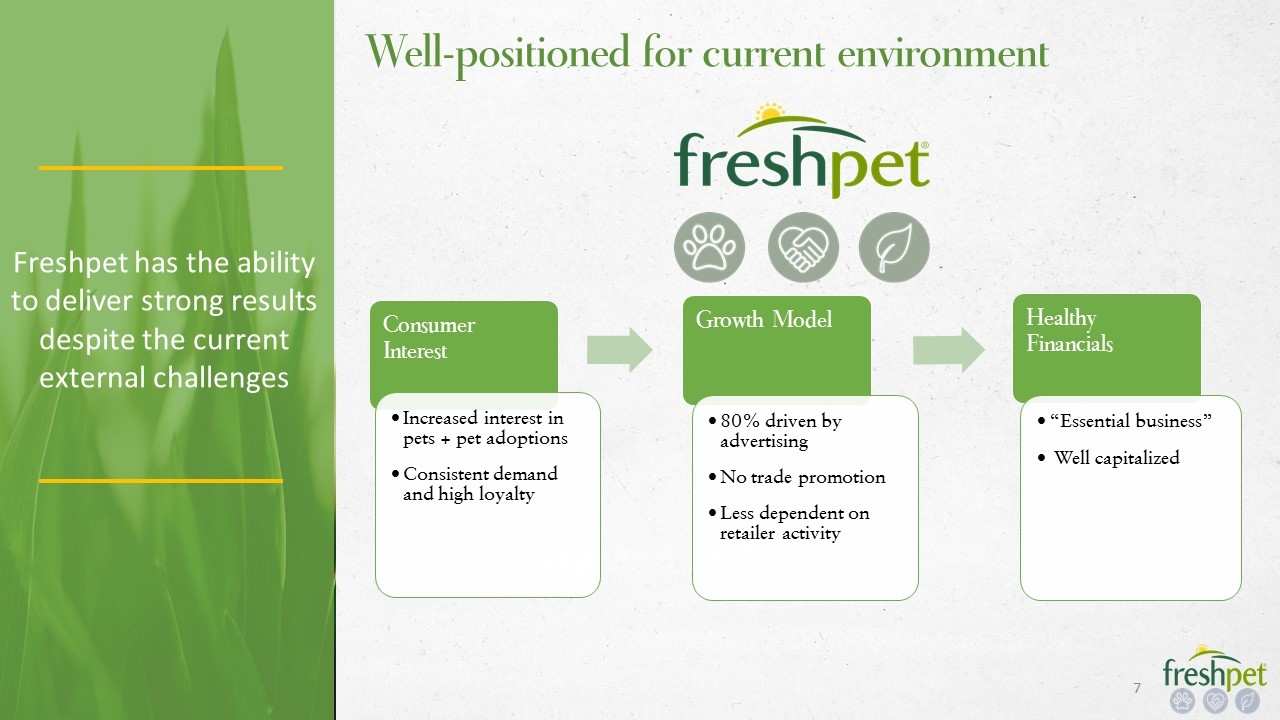
Freshpet has the ability to deliver strong results despite the current external challenges Well-positioned for current environment Growth Model 80% driven by advertising Consumer Interest Healthy Financials “Essential business” Well capitalized Less dependent on retailer activity Consistent demand and high loyalty Increased interest in pets + pet adoptions No trade promotion
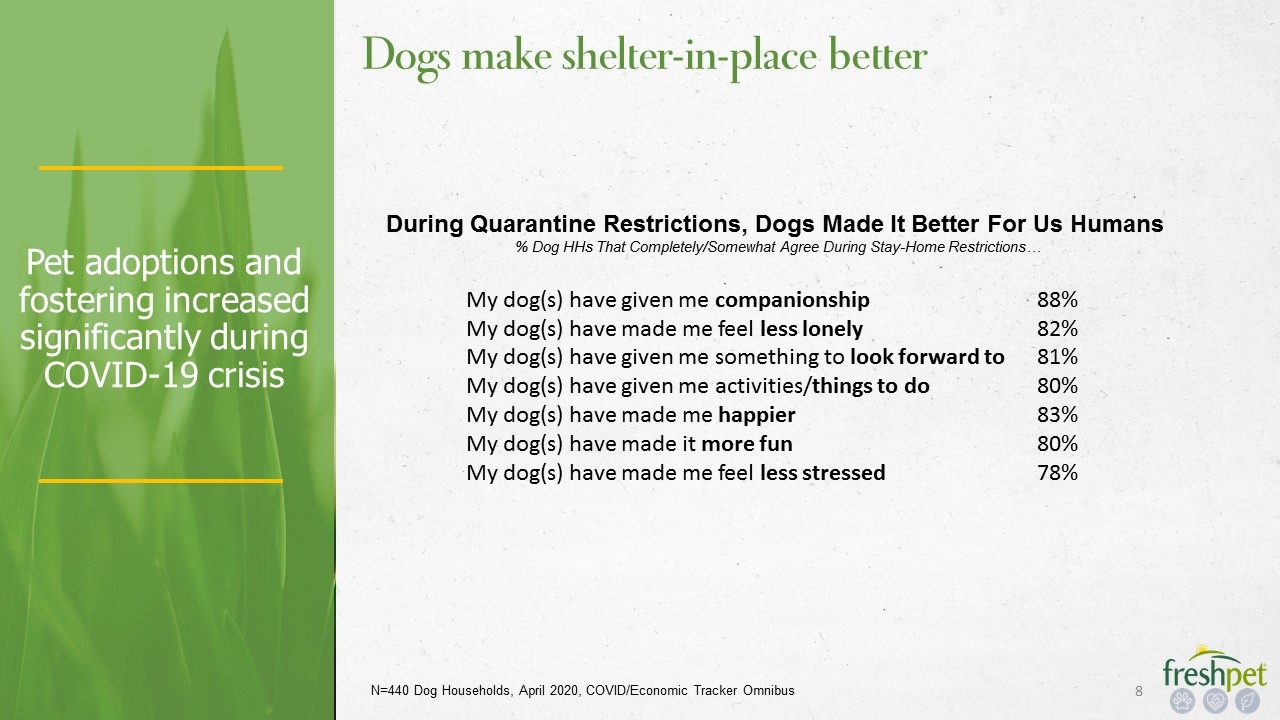
Pet adoptions and fostering increased significantly during COVID-19 crisis Dogs make shelter-in-place better My dog(s) have given me companionship 88% My dog(s) have made me feel less lonely 82% My dog(s) have given me something to look forward to 81% My dog(s) have given me activities/things to do 80% My dog(s) have made me happier 83% My dog(s) have made it more fun 80% My dog(s) have made me feel less stressed 78% During Quarantine Restrictions, Dogs Made It Better For Us Humans % Dog HHs That Completely/Somewhat Agree During Stay-Home Restrictions… N=440 Dog Households, April 2020, COVID/Economic Tracker Omnibus
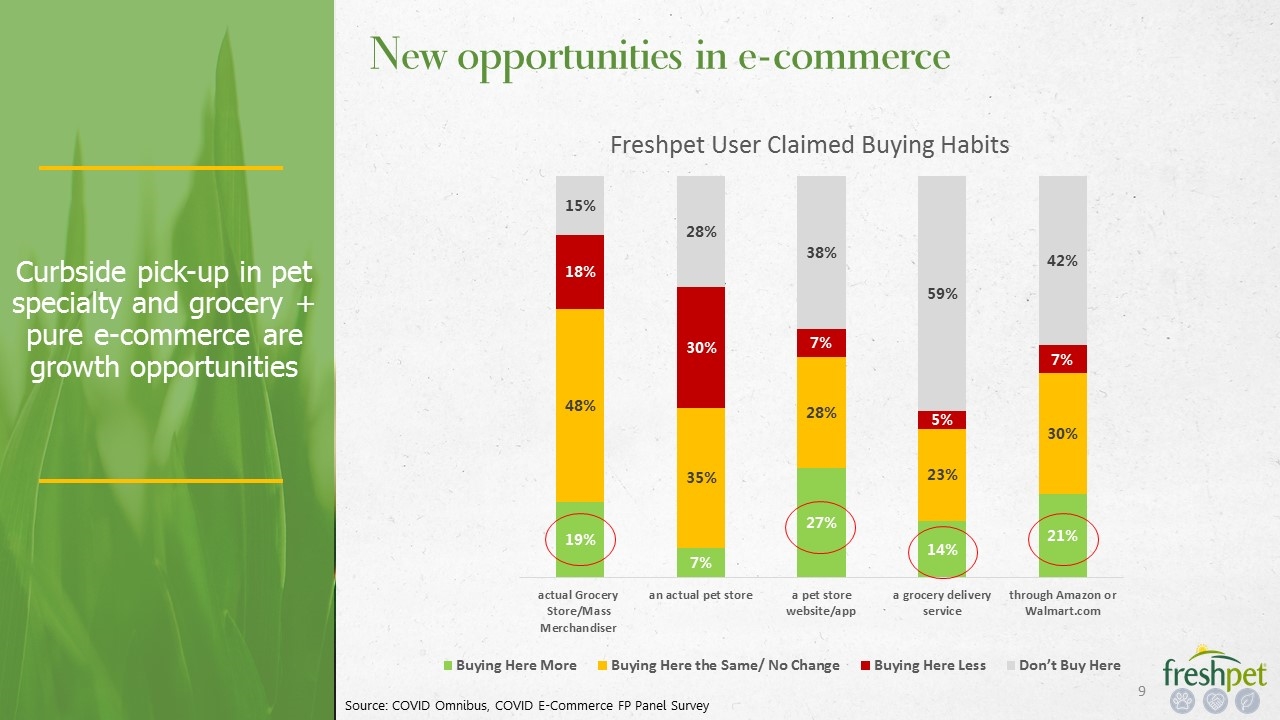
Curbside pick-up in pet specialty and grocery + pure e-commerce are growth opportunities New opportunities in e-commerce Source: COVID Omnibus, COVID E-Commerce FP Panel Survey
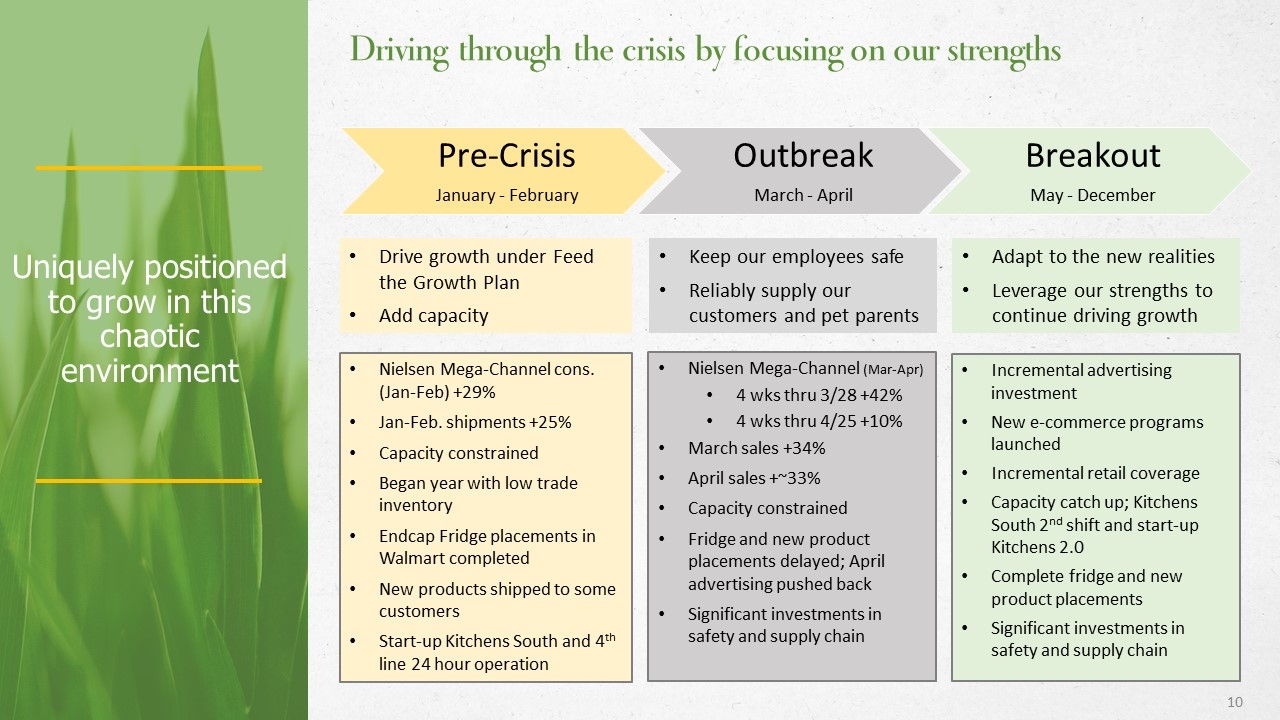
Uniquely positioned to grow in this chaotic environment Driving through the crisis by focusing on our strengths Nielsen Mega-Channel cons. (Jan-Feb) +29% Jan-Feb. shipments +25% Capacity constrained Began year with low trade inventory Endcap Fridge placements in Walmart completed New products shipped to some customers Start-up Kitchens South and 4th line 24 hour operation Nielsen Mega-Channel (Mar-Apr) 4 wks thru 3/28 +42% 4 wks thru 4/25 +10% March sales +34% April sales +~33% Capacity constrained Fridge and new product placements delayed; April advertising pushed back Significant investments in safety and supply chain Incremental advertising investment New e-commerce programs launched Incremental retail coverage Capacity catch up; Kitchens South 2nd shift and start-up Kitchens 2.0 Complete fridge and new product placements Significant investments in safety and supply chain Drive growth under Feed the Growth Plan Add capacity Keep our employees safe Reliably supply our customers and pet parents Adapt to the new realities Leverage our strengths to continue driving growth Pre-Crisis January - February Outbreak March - April Breakout May - December
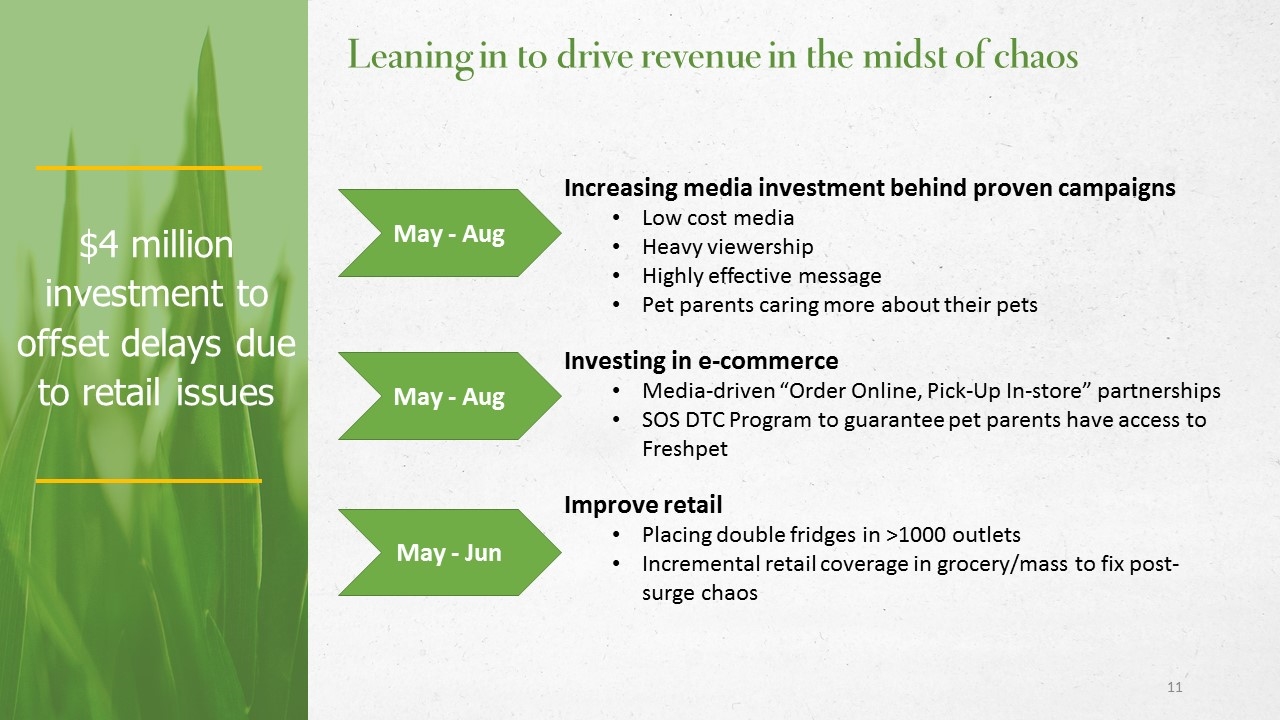
$4 million investment to offset delays due to retail issues Leaning in to drive revenue in the midst of chaos Increasing media investment behind proven campaigns Low cost media Heavy viewership Highly effective message Pet parents caring more about their pets Investing in e-commerce Media-driven “Order Online, Pick-Up In-store” partnerships SOS DTC Program to guarantee pet parents have access to Freshpet Improve retail Placing double fridges in >1000 outlets Incremental retail coverage in grocery/mass to fix post-surge chaos May - Aug May - Aug May - Jun
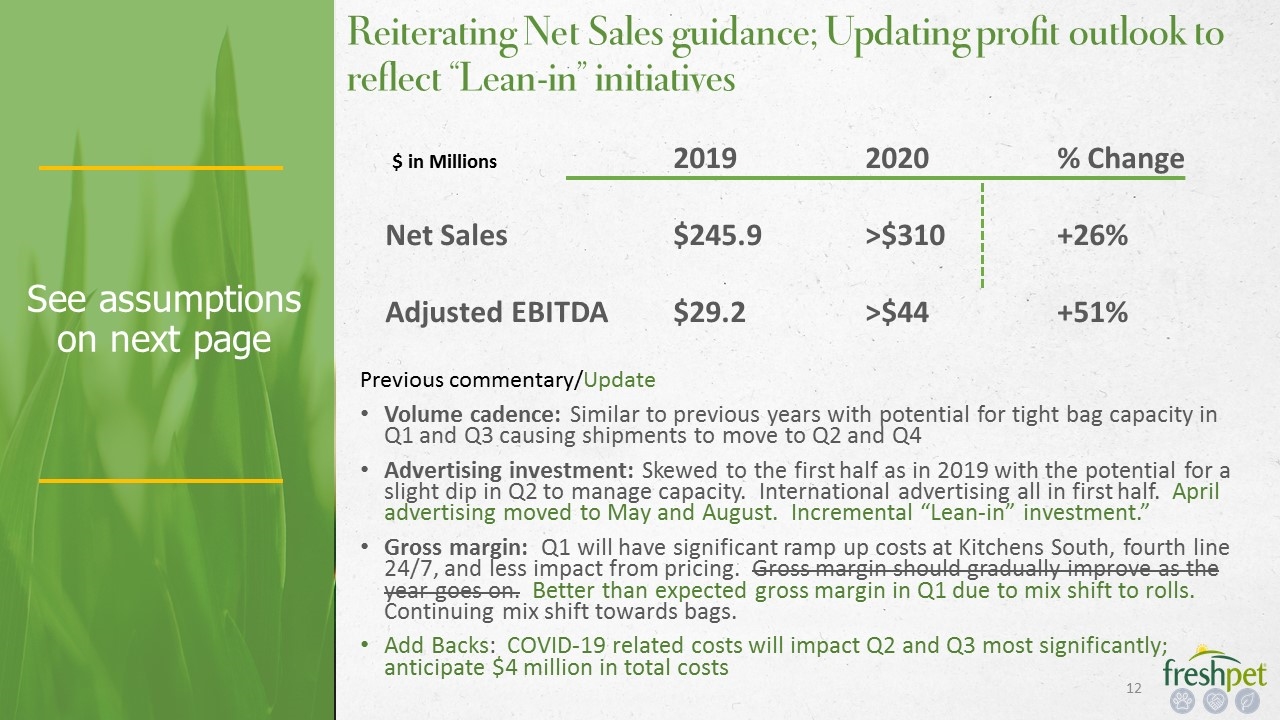
See assumptions on next page Reiterating Net Sales guidance; Updating profit outlook to reflect “Lean-in” initiatives 20192020% Change Net Sales$245.9>$310+26% Adjusted EBITDA$29.2>$44+51% $ in Millions Volume cadence: Similar to previous years with potential for tight bag capacity in Q1 and Q3 causing shipments to move to Q2 and Q4 Advertising investment: Skewed to the first half as in 2019 with the potential for a slight dip in Q2 to manage capacity. International advertising all in first half. April advertising moved to May and August. Incremental “Lean-in” investment.” Gross margin: Q1 will have significant ramp up costs at Kitchens South, fourth line 24/7, and less impact from pricing. Gross margin should gradually improve as the year goes on. Better than expected gross margin in Q1 due to mix shift to rolls. Continuing mix shift towards bags. Add Backs: COVID-19 related costs will impact Q2 and Q3 most significantly; anticipate $4 million in total costs Previous commentary/Update
Reiterating 2020 net sales guidance and lowering Adj. EBITDA guidance to reflect incremental investment Guidance assumptions Our guidance considers the following factors. We believe we have made reasonable assumptions about each factor. However, the external environment is very dynamic so we want investors to understand the basis for our guidance: Supply: We do not encounter any significant supply interruptions – either upstream from us or in our facilities Costs: The costs that we incur to manage the COVID-19 crisis total $4 million and are concentrated in Q2 and Q3 Media Effectiveness: The effectiveness of our media investment is not adversely impacted by the changing consumer environment Shopping Behavior: The presence of significant restrictions on shopping in stores doesn’t prevent reasonable consumption and replenishment patterns similar to what we have seen historically Retailer Activity: Retailers resume a significant portion of their fridge placements and new item distribution in Q3 Customer Credit: We have no major customer credit issues as a result of the COVID-19 crisis This is not an all-inclusive list. For that, please consult the Risks section of our latest SEC filings.
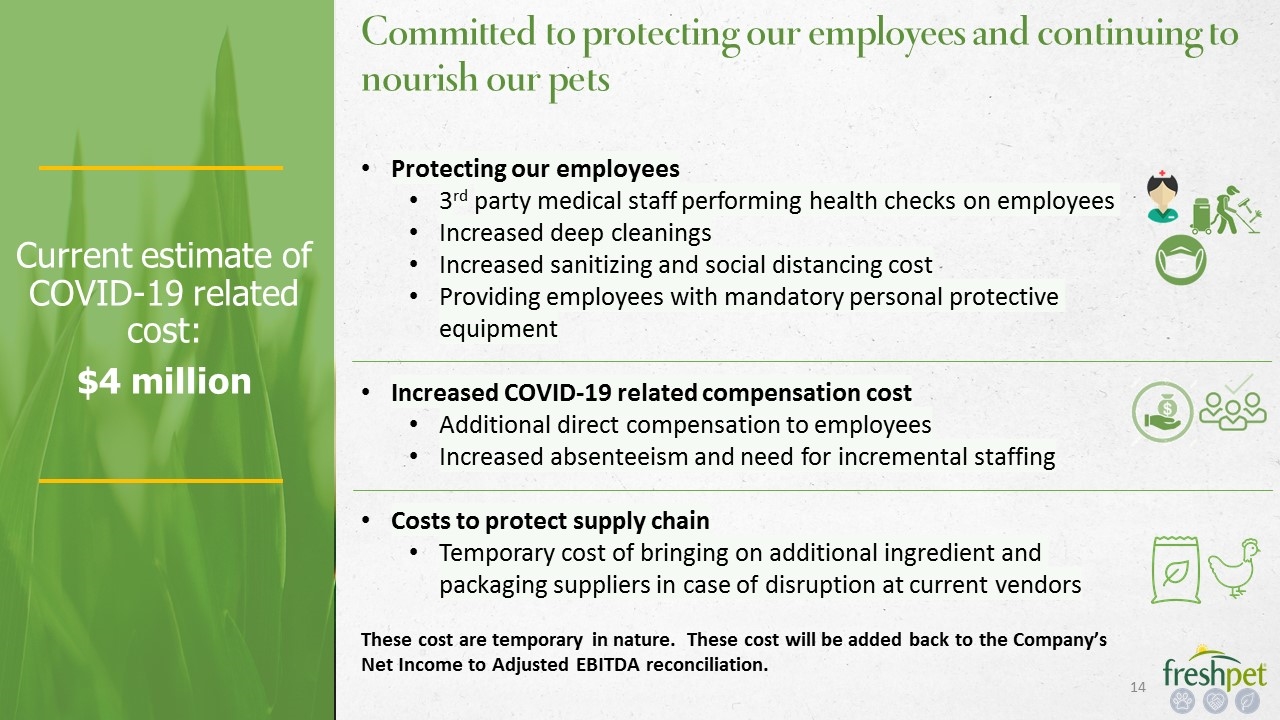
Current estimate of COVID-19 related cost: $4 million Protecting our employees 3rd party medical staff performing health checks on employees Increased deep cleanings Increased sanitizing and social distancing cost Providing employees with mandatory personal protective equipment Increased COVID-19 related compensation cost Additional direct compensation to employees Increased absenteeism and need for incremental staffing Costs to protect supply chain Temporary cost of bringing on additional ingredient and packaging suppliers in case of disruption at current vendors These cost are temporary in nature. These cost will be added back to the Company’s Net Income to Adjusted EBITDA reconciliation. Committed to protecting our employees and continuing to nourish our pets
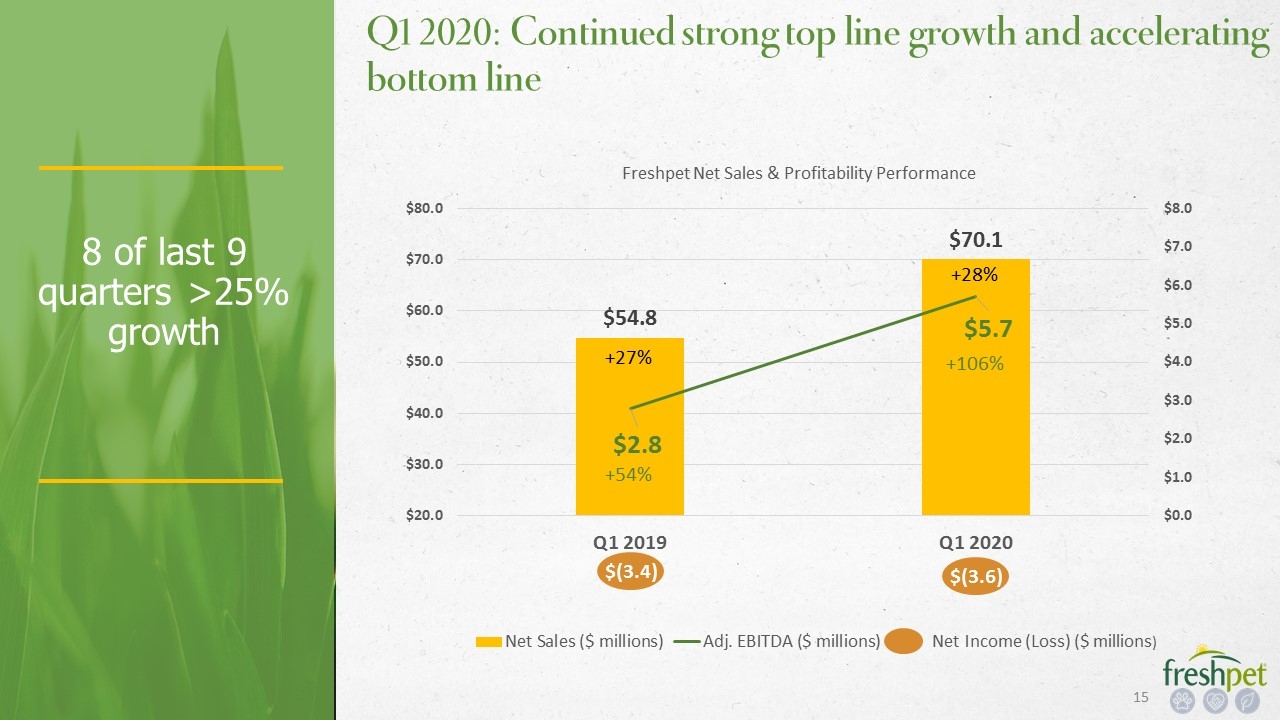
8 of last 9 quarters >25% growth Q1 2020: Continued strong top line growth and accelerating bottom line +27% +28% +106% Net Income (Loss) ($ millions) $(3.6) $(3.4) +54%
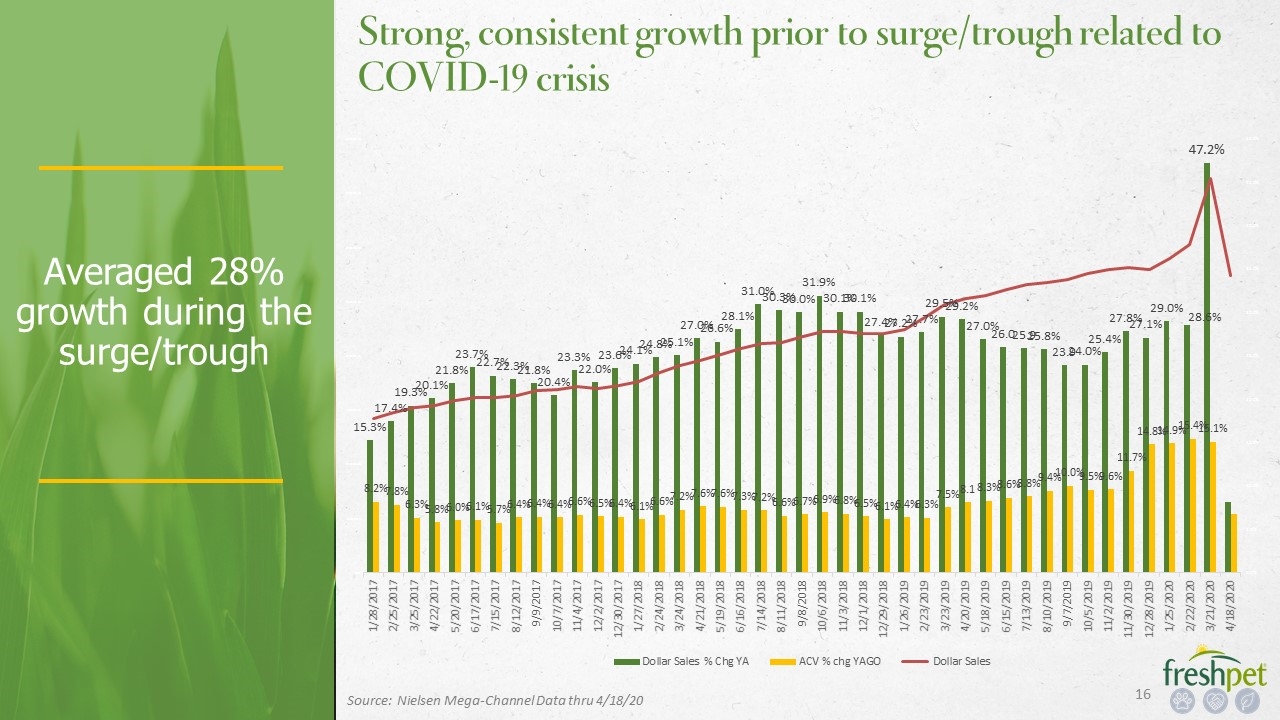
Averaged 28% growth during the surge/trough Strong, consistent growth prior to surge/trough related to COVID-19 crisis Source: Nielsen Mega-Channel Data thru 4/18/20
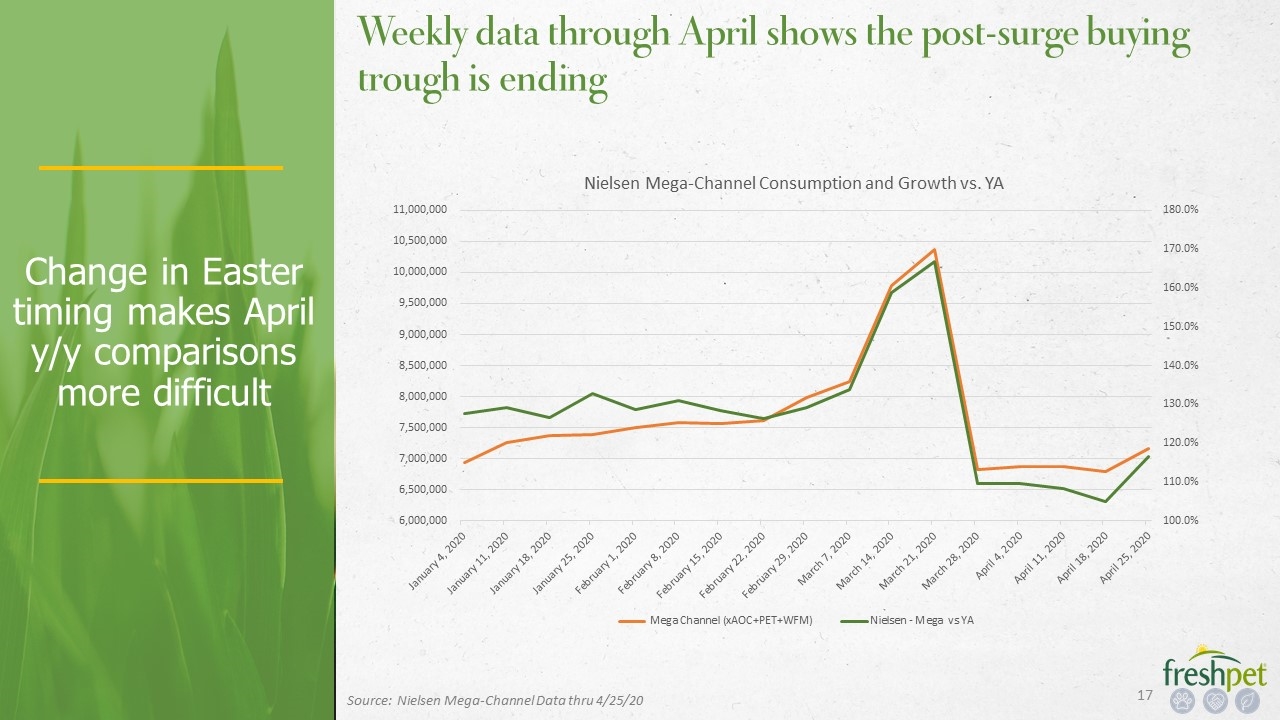
Change in Easter timing makes April y/y comparisons more difficult Weekly data through April shows the post-surge buying trough is ending Source: Nielsen Mega-Channel Data thru 4/25/20
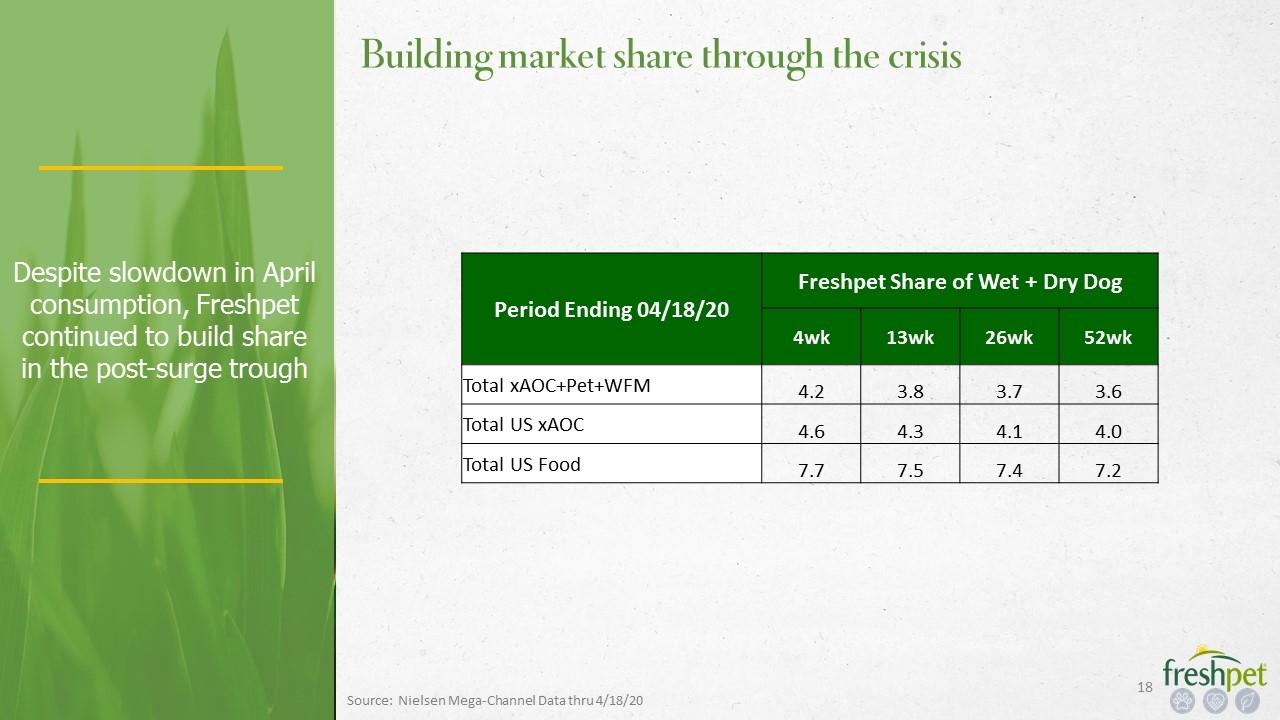
Despite slowdown in April consumption, Freshpet continued to build share in the post-surge trough Building market share through the crisis Period Ending 04/18/20 Freshpet Share of Wet + Dry Dog 4wk 13wk 26wk 52wk Total xAOC+Pet+WFM 4.2 3.8 3.7 3.6 Total US xAOC 4.6 4.3 4.1 4.0 Total US Food 7.7 7.5 7.4 7.2 Source: Nielsen Mega-Channel Data thru 4/18/20
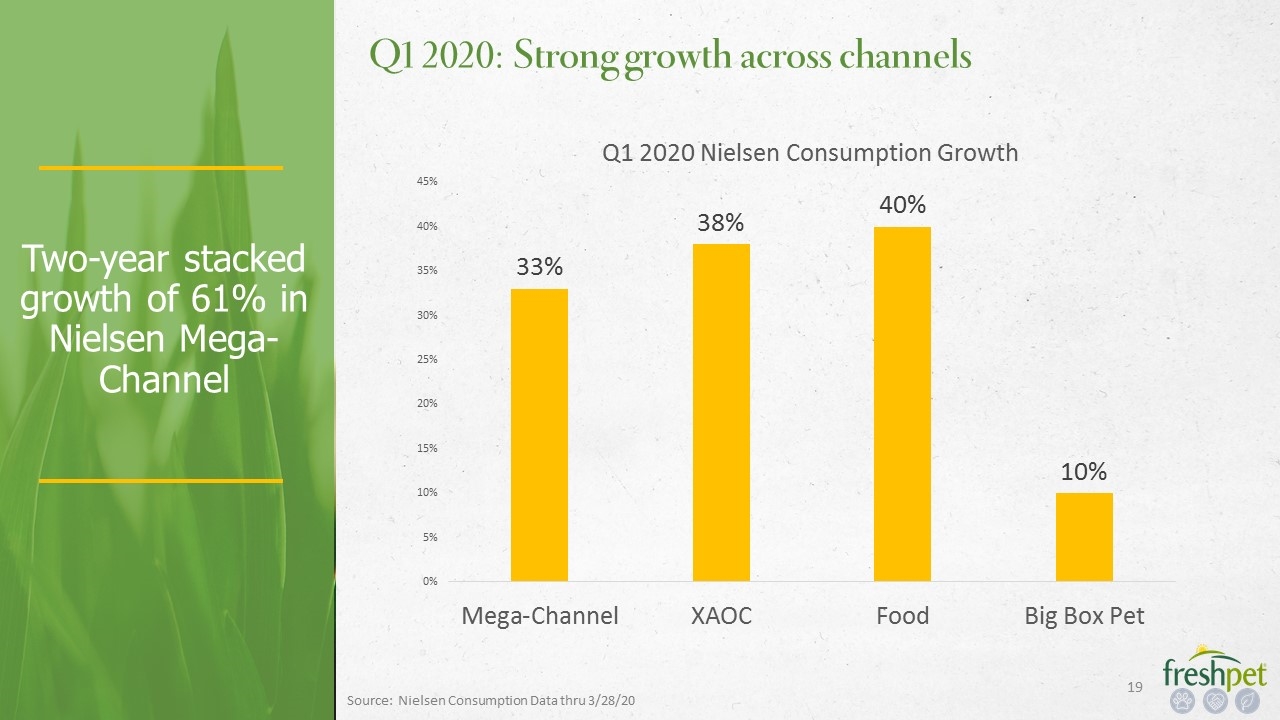
Two-year stacked growth of 61% in Nielsen Mega-Channel Q1 2020: Strong growth across channels Source: Nielsen Consumption Data thru 3/28/20
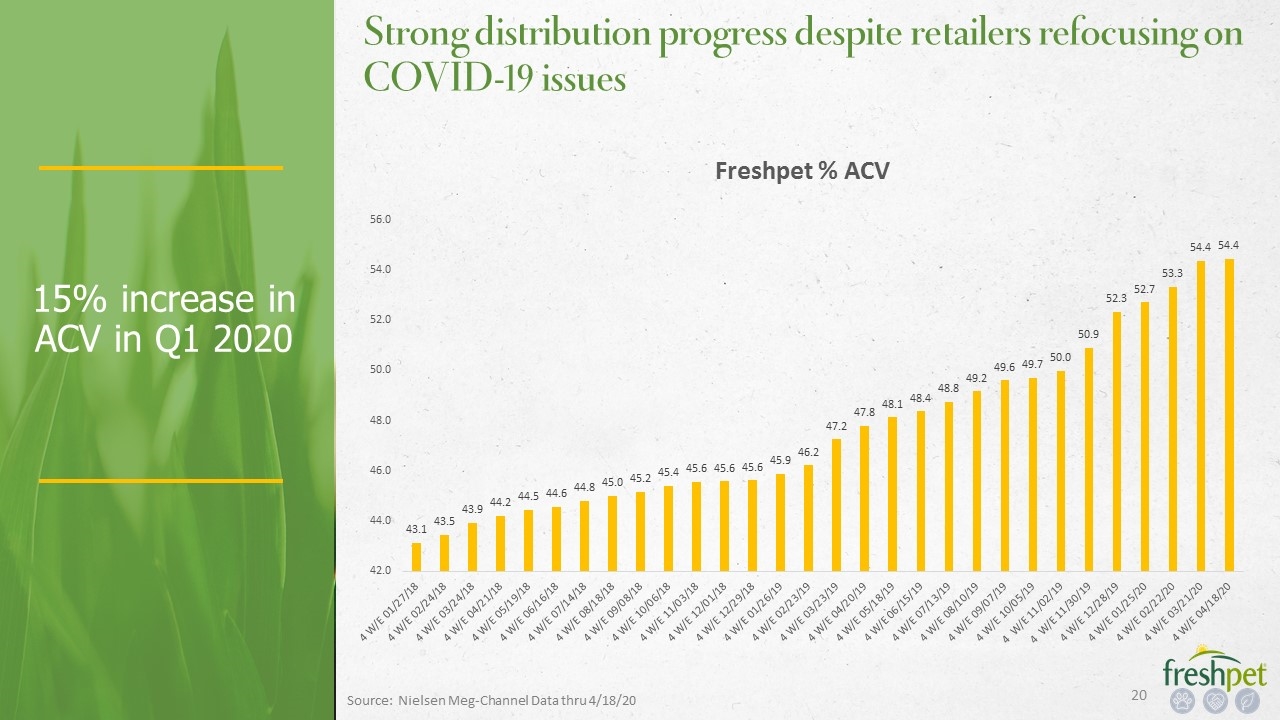
15% increase in ACV in Q1 2020 Strong distribution progress despite retailers refocusing on COVID-19 issues Source: Nielsen Meg-Channel Data thru 4/18/20
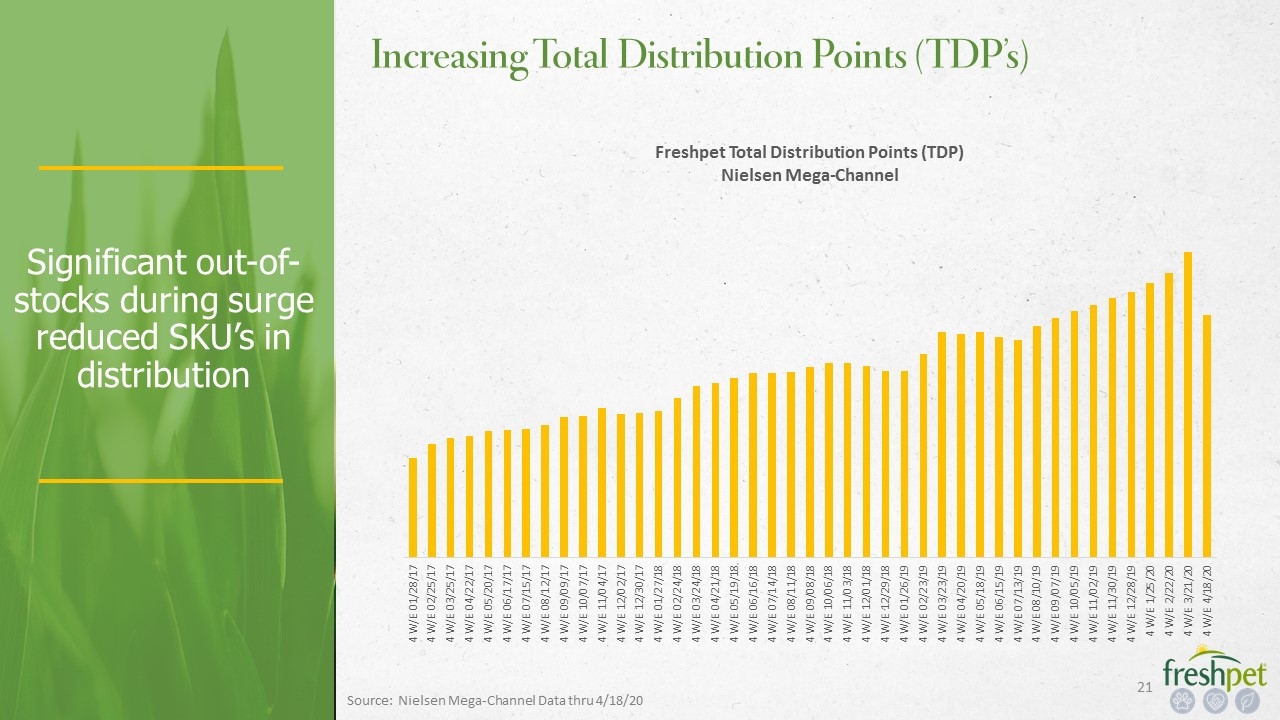
Significant out-of-stocks during surge reduced SKU’s in distribution Increasing Total Distribution Points (TDP’s) Source: Nielsen Mega-Channel Data thru 4/18/20
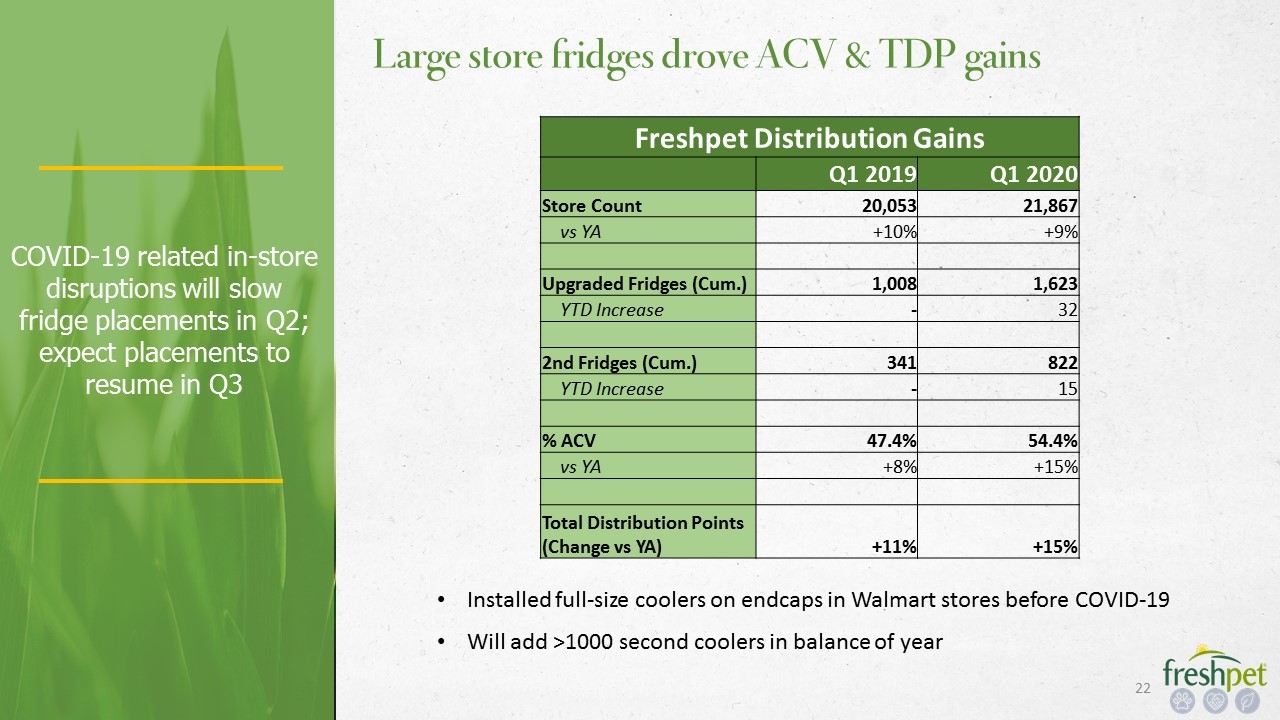
COVID-19 related in-store disruptions will slow fridge placements in Q2; expect placements to resume in Q3 Large store fridges drove ACV & TDP gains Freshpet Distribution Gains Q1 2019 Q1 2020 Store Count 20,053 21,867 vs YA +10% +9% Upgraded Fridges (Cum.) 1,008 1,623 YTD Increase - 32 2nd Fridges (Cum.) 341 822 YTD Increase - 15 % ACV 47.4% 54.4% vs YA +8% +15% Total Distribution Points (Change vs YA) +11% +15% Installed full-size coolers on endcaps in Walmart stores before COVID-19 Will add >1000 second coolers in balance of year
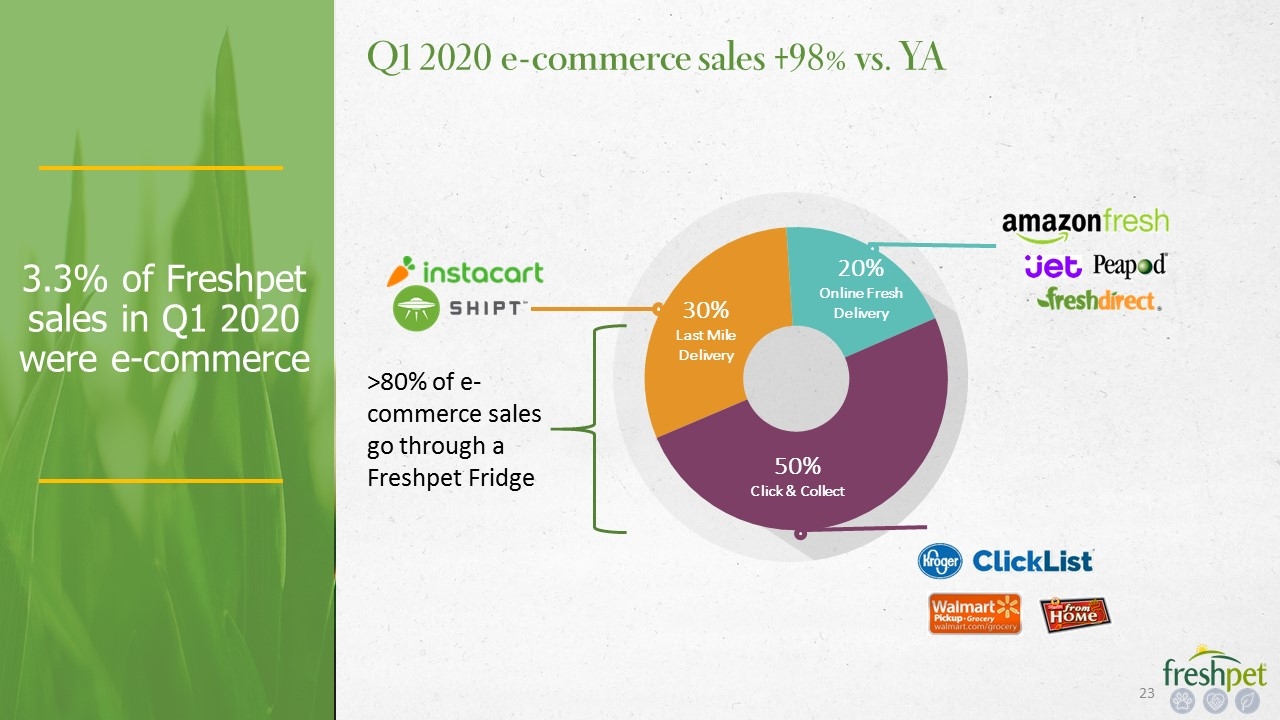
3.3% of Freshpet sales in Q1 2020 were e-commerce Q1 2020 e-commerce sales +98% vs. YA 30% Last Mile Delivery 50% Click & Collect 20% Online Fresh Delivery >80% of e-commerce sales go through a Freshpet Fridge
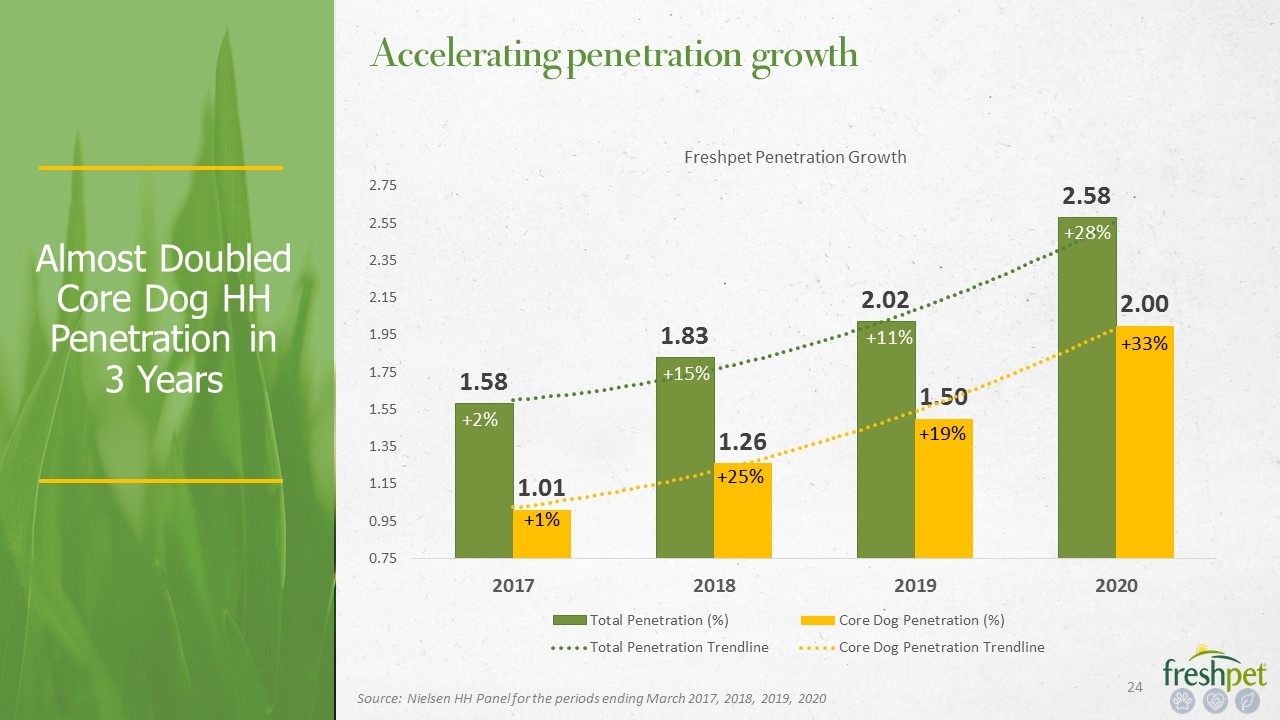
Almost Doubled Core Dog HH Penetration in 3 Years Accelerating penetration growth Source: Nielsen HH Panel for the periods ending March 2017, 2018, 2019, 2020 +33% +28% +1% +11% +15% +2%
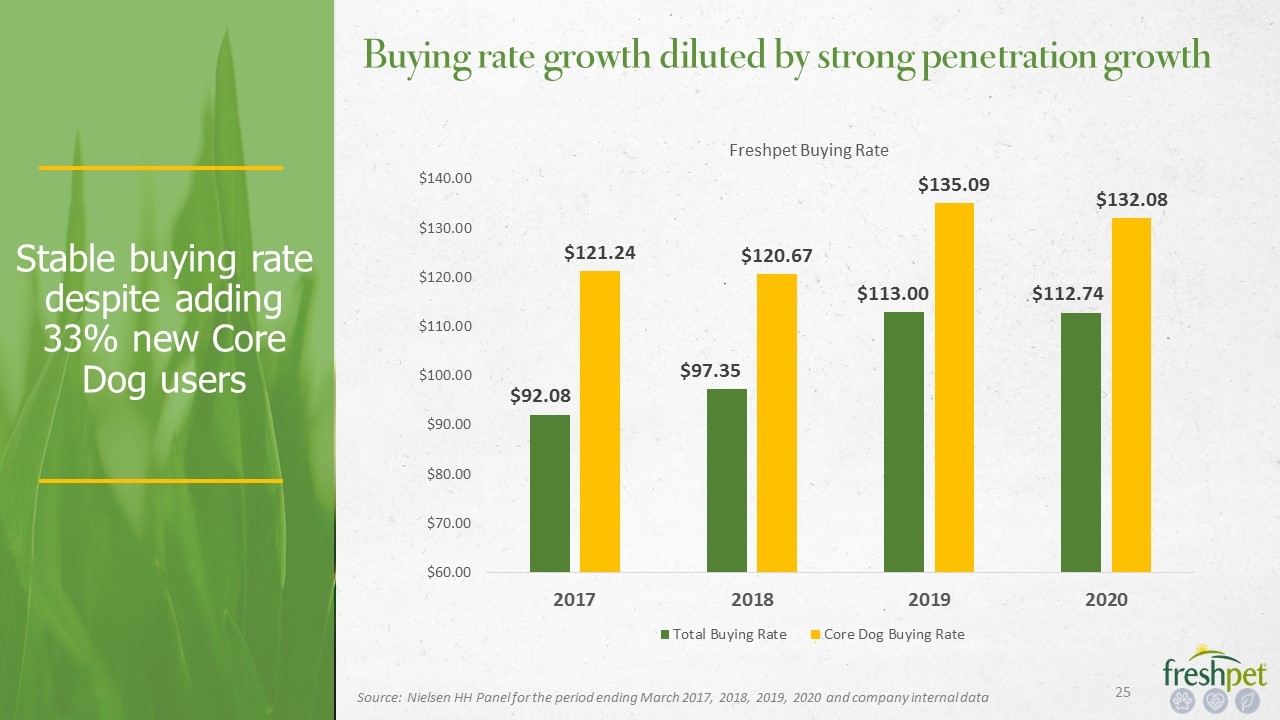
Stable buying rate despite adding 33% new Core Dog users Buying rate growth diluted by strong penetration growth Source: Nielsen HH Panel for the period ending March 2017, 2018, 2019, 2020 and company internal data
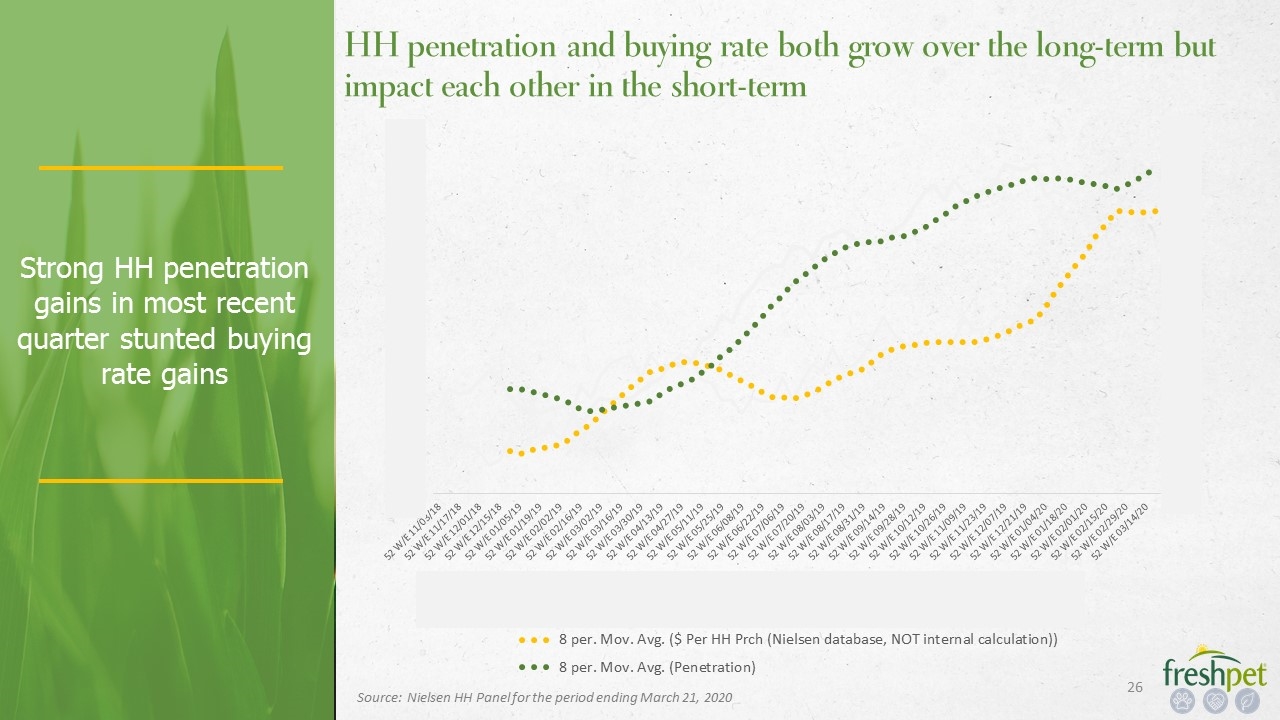
Strong HH penetration gains in most recent quarter stunted buying rate gains HH penetration and buying rate both grow over the long-term but impact each other in the short-term Source: Nielsen HH Panel for the period ending March 21, 2020
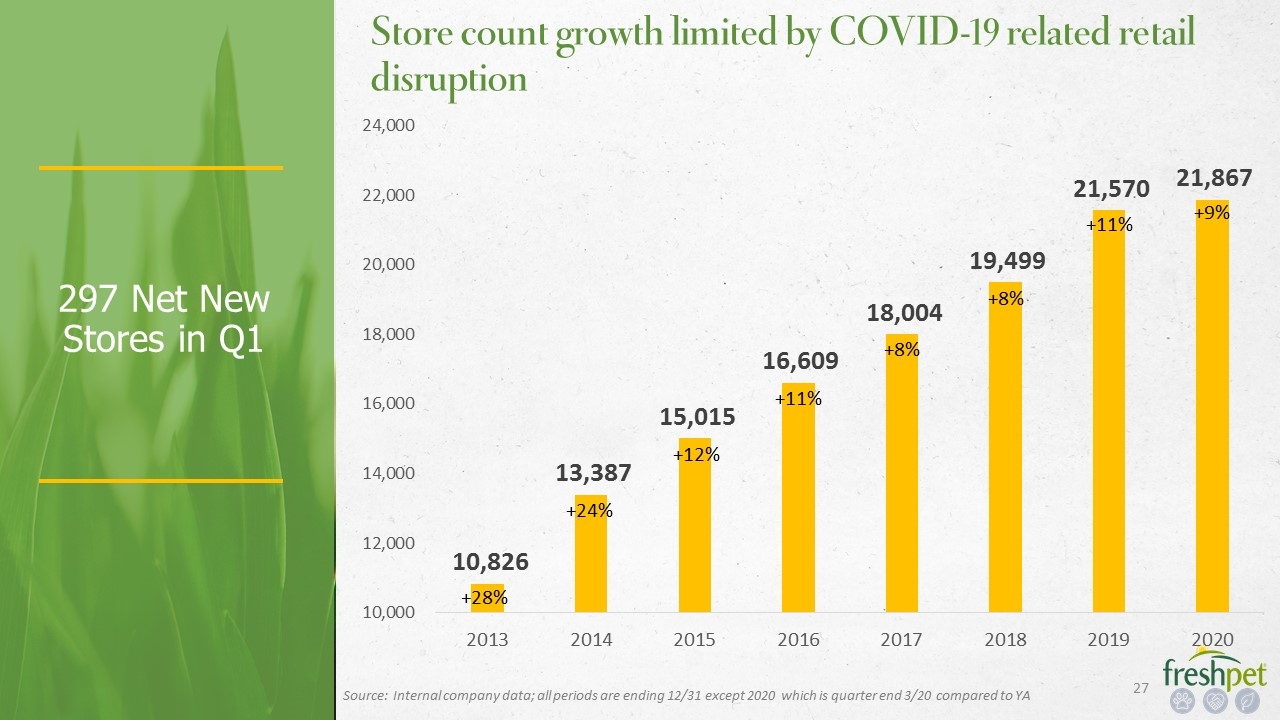
297 Net New Stores in Q1 Store count growth limited by COVID-19 related retail disruption +11% +8% +8% +11% +12% +24% +28% Source: Internal company data; all periods are ending 12/31 except 2020 which is quarter end 3/20 compared to YA +9%
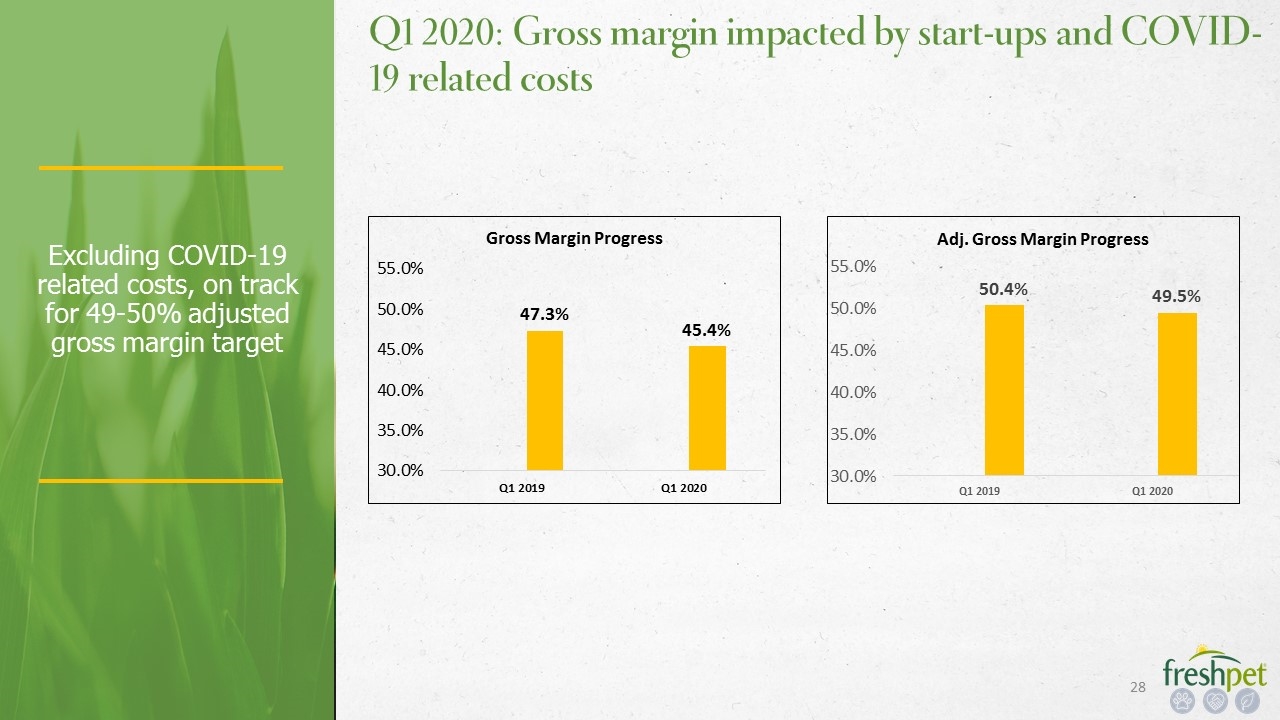
Q1 2020: Gross margin impacted by start-ups and COVID-19 related costs Excluding COVID-19 related costs, on track for 49-50% adjusted gross margin target
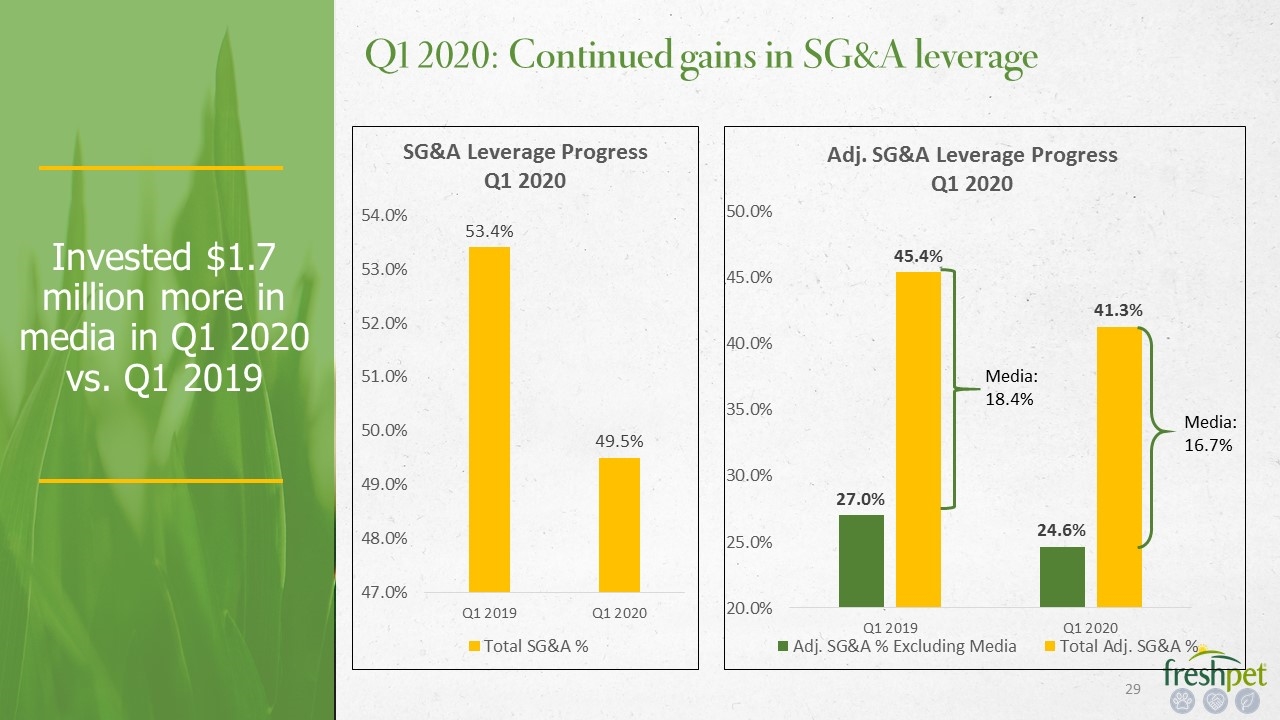
Invested $1.7 million more in media in Q1 2020 vs. Q1 2019 Q1 2020: Continued gains in SG&A leverage Media: 16.7% Media: 18.4%
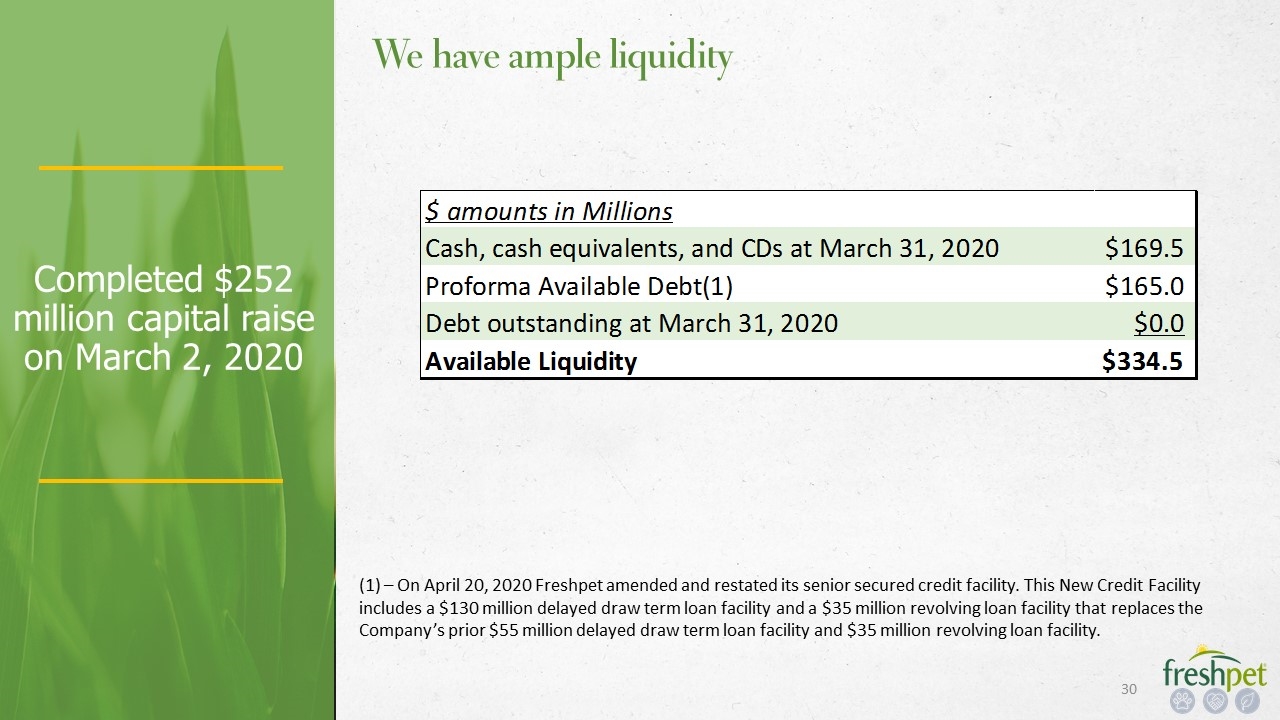
Completed $252 million capital raise on March 2, 2020 We have ample liquidity (1) – On April 20, 2020 Freshpet amended and restated its senior secured credit facility. This New Credit Facility includes a $130 million delayed draw term loan facility and a $35 million revolving loan facility that replaces the Company’s prior $55 million delayed draw term loan facility and $35 million revolving loan facility.
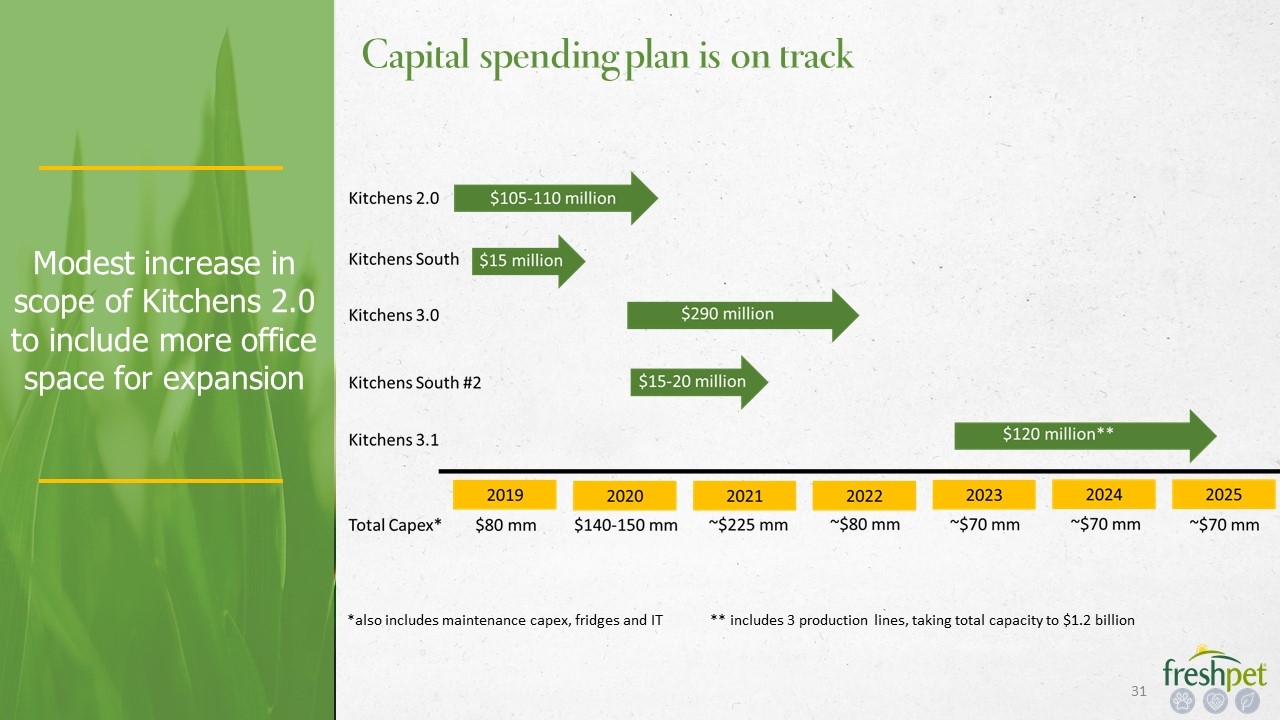
Modest increase in scope of Kitchens 2.0 to include more office space for expansion Capital spending plan is on track *also includes maintenance capex, fridges and IT ** includes 3 production lines, taking total capacity to $1.2 billion
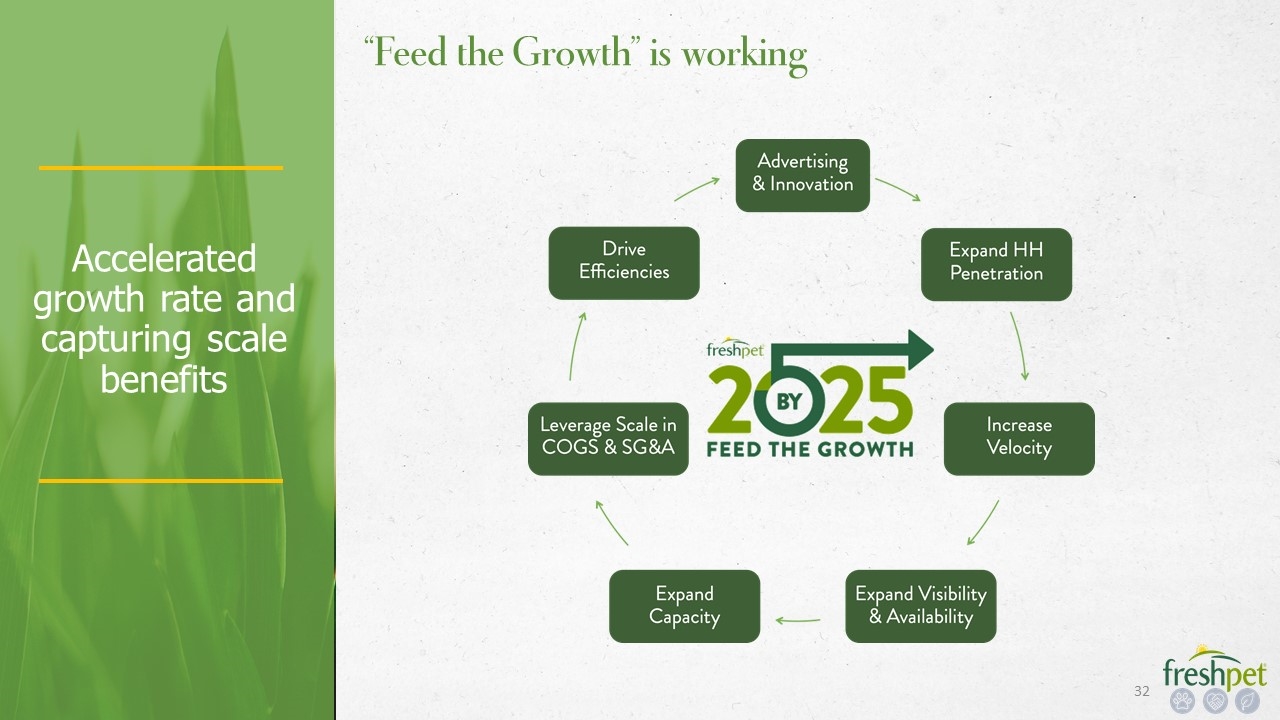
Accelerated growth rate and capturing scale benefits “Feed the Growth” is working

Appendix
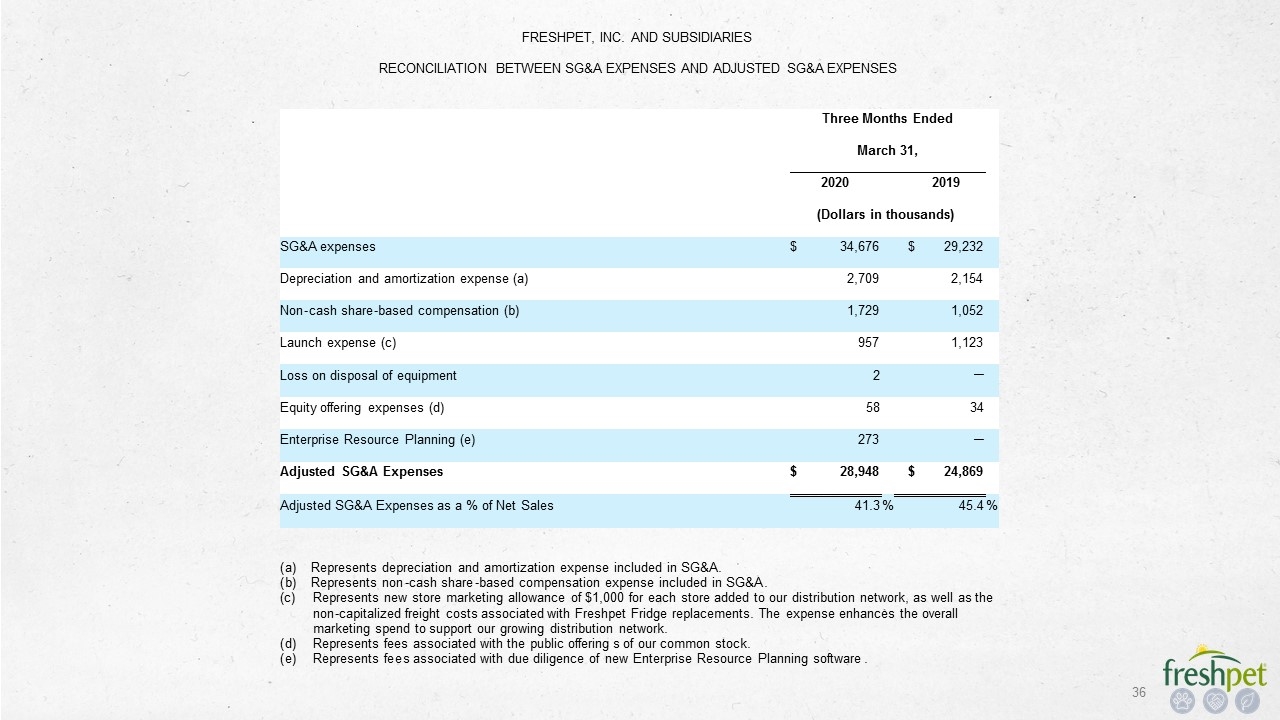
FRESHPET, INC. AND SUBSIDIARIES RECONCILIATION BETWEEN SG&A EXPENSES AND ADJUSTED SG&A EXPENSES Three Months Ended March 31, 2020 2019 (Dollars in thousands) SG&A expenses $ 34,676 $ 29,232 Depreciation and amortization expense (a) 2,709 2,154 Non - cash share - based compensation (b) 1,729 1,052 Launch expense (c) 957 1,123 Loss on disposal of equipment 2 — Equity offering expenses (d) 58 34 Enterprise Resource Planning (e) 273 — Adjusted SG&A Expenses $ 28,948 $ 24,869 Adjusted SG&A Expenses as a % of Net Sales 41.3 % 45.4 % ( a ) Represents depreciation and amortization expense included in SG&A. ( b ) Represents non - cash share - based compensation expense included in SG&A . (c ) Represents new store marketing allowance of $1,000 for each store added to our distribution network, as well as the non - capitalized freight costs associated with Freshpet Fridge replacements. The expense enhances the overall marketing spend to support our growing distribution network. ( d ) Represents fees associated with the public offering s of our common stock. ( e ) Represents fe e s associated with due diligence of new Enterprise Resource Planning software .
