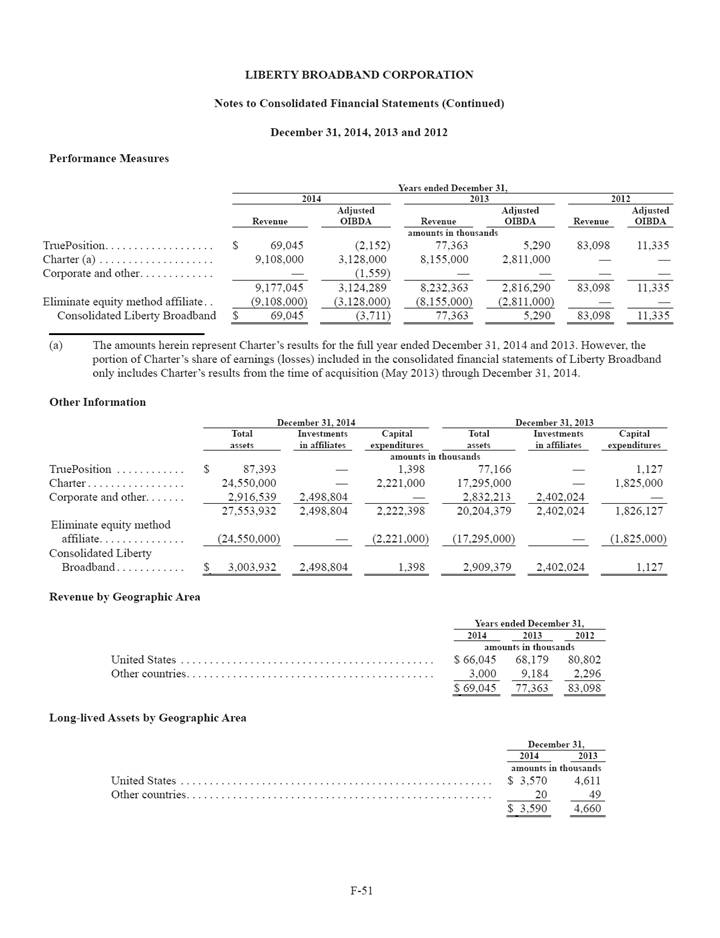
| LIBERTY BROADBAND CORPORATION Notes to Consolidated Financial Statements (Continued) December 31, 2014, 2013 and 2012 Performance Measures Years ended December 31, 2014 2013 2012 Adjusted Adjusted Adjusted Revenue OIBDA Revenue OIBDA Revenue OIBDA amounts in thousands TruePosition . . . . . . . . . . . . . . . . . . . $ 69,045 (2,152) 77,363 5,290 83,098 11,335 Charter (a) . . . . . . . . . . . . . . . . . . . . 9,108,000 3,128,000 8,155,000 2,811,000 — — Corporate and other . . . . . . . . . . . . . — (1,559) — — — — 9,177,045 3,124,289 8,232,363 2,816,290 83,098 11,335 Eliminate equity method affiliate . . (9,108,000) (3,128,000) (8,155,000) (2,811,000) — — Consolidated Liberty Broadband $ 69,045 (3,711) 77,363 5,290 83,098 11,335 (a) The amounts herein represent Charter’s results for the full year ended December 31, 2014 and 2013. However, the portion of Charter’s share of earnings (losses) included in the consolidated financial statements of Liberty Broadband only includes Charter’s results from the time of acquisition (May 2013) through December 31, 2014. Other Information December 31, 2014 December 31, 2013 Total Investments Capital Total Investments Capital assets in affiliates expenditures assets in affiliates expenditures amounts in thousands TruePosition . . . . . . . . . . . . $ 87,393 — 1,398 77,166 — 1,127 Charter . . . . . . . . . . . . . . . . . 24,550,000 — 2,221,000 17,295,000 — 1,825,000 Corporate and other. . . . . . . 2,916,539 2,498,804 — 2,832,213 2,402,024 — 27,553,932 2,498,804 2,222,398 20,204,379 2,402,024 1,826,127 Eliminate equity method affiliate. . . . . . . . . . . . . . . (24,550,000) — (2,221,000) (17,295,000) — (1,825,000) Consolidated Liberty Broadband . . . . . . . . . . . . $ 3,003,932 2,498,804 1,398 2,909,379 2,402,024 1,127 Revenue by Geographic Area Years ended December 31, 2014 2013 2012 amounts in thousands United States . . . . . . . . . . . . . . . . . . . . . . . . . . . . . . . . . . . . . . . . . . . . $ 66,045 68,179 80,802 Other countries . . . . . . . . . . . . . . . . . . . . . . . . . . . . . . . . . . . . . . . . . . . 3,000 9,184 2,296 $ 69,045 77,363 83,098 Long-lived Assets by Geographic Area December 31, 2014 2013 amounts in thousands United States . . . . . . . . . . . . . . . . . . . . . . . . . . . . . . . . . . . . . . . . . . . . . . . . . . . . . . $ 3,570 4,611 Other countries . . . . . . . . . . . . . . . . . . . . . . . . . . . . . . . . . . . . . . . . . . . . . . . . . . . . . 20 49 $ 3,590 4,660 F-51 |