UNITED STATES
SECURITIES AND EXCHANGE COMMISSION
Washington, D.C. 20549
FORM N-CSR
CERTIFIED SHAREHOLDER REPORT OF REGISTERED
MANAGEMENT INVESTMENT COMPANIES
Investment Company Act file number 811-22979
Goldman Sachs MLP and Energy Renaissance Fund
(Exact name of registrant as specified in charter)
71 South Wacker Drive,
Chicago, Illinois 60606
(Address of principal executive offices) (Zip code)
| | |
Copies to: |
Caroline Kraus | | Stephen H. Bier, ESQ. |
Goldman, Sachs & Co. | | Allison M. Fumai, ESQ. |
200 West Street | | Dechert LLP |
New York, New York 10282 | | 1095 Avenue of the Americas |
| | New York, NY 10036-6797 |
(Name and address of agents for service)
Registrant’s telephone number, including area code: (312) 655-4400
Date of fiscal year end: November 30
Date of reporting period: November 30, 2014
| ITEM 1. | REPORTS TO STOCKHOLDERS. |
| | The Annual Report to Stockholders is filed herewith. |
Goldman Sachs Closed-End Funds

| | | | |
| | |
| Annual Report | | | | November 30, 2014 |
| | |
| | | | MLP and Energy Renaissance Fund |
| | | | MLP Income Opportunities Fund |

Goldman Sachs Closed-End Funds
| n | | MLP AND ENERGY RENAISSANCE FUND |
| n | | MLP INCOME OPPORTUNITIES FUND |
| | | | |
TABLE OF CONTENTS | | | | |
| |
Principal Investment Strategies and Risks | | | 1 | |
| |
Investment Process | | | 3 | |
| |
Portfolio Management Discussion and Performance Summaries | | | 4 | |
| |
Schedule of Investments | | | 16 | |
| |
Financial Statements | | | 18 | |
| |
Financial Highlights | | | 24 | |
| |
Notes to Financial Statements | | | 28 | |
| |
Report of Independent Registered Public Accounting Firm | | | 40 | |
| |
Other Information | | | 41 | |
| |
Privacy Notice | | | 48 | |
| |
| | | | |
| | | | |
| | | |
| NOT FDIC-INSURED | | May Lose Value | | No Bank Guarantee |
GOLDMAN SACHS CLOSED-END FUNDS
Principal Investment Strategies and Risks
This is not a complete list of risks that may affect the Funds. For additional information concerning the risks applicable to the Funds, please see the Funds’ Prospectuses.
The Goldman Sachs MLP and Energy Renaissance Fund invests primarily in master limited partnership (“MLP”) and other energy investments. The Fund’s equity investments are subject to market risk, which means that the value of the securities in which it invests may go up or down in response to numerous factors, including the prospects of individual companies, particular sectors and/or general economic conditions. Investments in MLPs are subject to certain additional risks, including risks related to limited control and limited rights to vote, potential conflicts of interest, cash flow risks, dilution risks, limited liquidity, risks related to the general partner’s right to force sales at undesirable times or prices, interest rate sensitivity and for MLPs with smaller capitalizations, lower trading volume and abrupt or erratic price movements. MLPs are also subject to risks relating to their complex tax structure, including the risk that an MLP could lose its tax status as a partnership, resulting in a reduction in the value of the Fund’s investment in the MLP and lower income to the Fund. MLPs are also subject to the risk that to the extent that a distribution received from an MLP is treated as a return of capital, the Fund’s adjusted tax basis in the MLP interests may be reduced, which may increase the Fund’s tax liability upon the sale of the MLP interests or upon subsequent distributions in respect of such interests. The Fund’s strategy of investing primarily in MLPs, resulting in its being taxed as a regular corporation, or “C” corporation, involves complicated accounting, tax and valuation issues. Many MLPs in which the Fund invests operate facilities within the energy sector and are also subject to risks affecting that sector. Because the Fund concentrates its investments in the energy sector, the Fund is subject to greater risk of loss as a result of adverse economic, business or other developments affecting industries within that sector than if its investments were more diversified across different industries. The Fund may invest in private investment in public equities (“PIPEs”) which may be deemed illiquid. The securities of mid- and small-capitalization companies involve greater risks than those associated with larger, more established companies and may be subject to more abrupt or erratic price movements. The Fund may invest in MLPs with smaller capitalizations which may have limited financial resources and less liquidity. The Fund may invest in private companies, or companies prior to their initial public offering, which are not subject to Securities and Exchange Commission (“SEC”) reporting and are more vulnerable to market conditions. The Fund is non-diversified and may invest a larger percentage of its assets in fewer issuers than diversified funds. Accordingly, the Fund may be more susceptible to adverse developments affecting any single issuer held in its portfolio and to greater losses resulting from these developments.
Shares of closed-end investment companies frequently trade at a discount from their net asset value (“NAV”) and the Fund cannot predict whether its shares will trade at, below or above NAV or the initial public offering price. The Fund is subject to leverage risk, which involves risks and special considerations including the likelihood of greater volatility of NAV, market price and dividend rate of the shares than a comparable portfolio without leverage; the risk that fluctuations in interest rates on borrowings and short-term debt or in the interest or dividend rates on any leverage that the Fund must pay will reduce returns; the effect of leverage in a declining market, which is likely to cause a greater decline in the NAV of the shares than if the Fund were not leveraged, which may result in a greater decline in the market price of the shares. The Fund’s investments in derivative instruments can be illiquid, may disproportionately increase losses, and may have a potentially large impact on Fund performance. Investments in derivative instruments may be harder to value, subject to greater volatility and more likely subject to changes in tax treatment than other investments. An investment in the Fund is not appropriate for all investors and is not intended to be a complete investment program. The Fund is designed as a long-term investment and not as a trading vehicle.
1
GOLDMAN SACHS CLOSED-END FUNDS
The Goldman Sachs MLP Income Opportunities Fund invests primarily in master limited partnership (“MLP”) investments. The Fund’s equity investments are subject to market risk, which means that the value of the securities in which it invests may go up or down in response to numerous factors, including the prospects of individual companies, particular sectors and/or general economic conditions. Investments in MLPs are subject to certain additional risks, including risks related to limited control and limited rights to vote, potential conflicts of interest, cash flow risks, dilution risks, limited liquidity, risks related to the general partner’s right to force sales at undesirable times or prices, interest rate sensitivity and for MLPs with smaller capitalizations, lower trading volume and abrupt or erratic price movements. MLPs are also subject to risks relating to their complex tax structure, including the risk that an MLP could lose its tax status as a partnership, resulting in a reduction in the value of the Fund’s investment in the MLP and lower income to the Fund. MLPs are also subject to the risk that to the extent that a distribution received from an MLP is treated as a return of capital, the Fund’s adjusted tax basis in the MLP interests may be reduced, which may increase the Fund’s tax liability upon the sale of the MLP interests or upon subsequent distributions in respect of such interests. The Fund’s strategy of investing primarily in MLPs, resulting in its being taxed as a regular corporation, or “C” corporation, involves complicated accounting, tax and valuation issues. Many MLPs in which the Fund invests operate facilities within the energy sector and are also subject to risks affecting that sector. Because the Fund concentrates its investments in the energy sector, the Fund is subject to greater risk of loss as a result of adverse economic, business or other developments affecting industries within that sector than if its investments were more diversified across different industries. The Fund may invest in private investment in public equities (“PIPEs”) which may be deemed illiquid. The securities of mid- and small-capitalization companies involve greater risks than those associated with larger, more established companies and may be subject to more abrupt or erratic price movements. The Fund is non-diversified and may invest a larger percentage of its assets in fewer issuers than diversified funds. Accordingly, the Fund may be more susceptible to adverse developments affecting any single issuer held in its portfolio and to greater losses resulting from these developments.
Shares of closed-end investment companies frequently trade at a discount from their net asset value (“NAV”) and the Fund cannot predict whether its shares will trade at, below or above NAV or the initial public offering price. The Fund is subject to leverage risk, which involves risks and special considerations including the likelihood of greater volatility of NAV, market price and dividend rate of the shares than a comparable portfolio without leverage; the risk that fluctuations in interest rates on borrowings and short-term debt or in the interest or dividend rates on any leverage that the Fund must pay will reduce returns; the effect of leverage in a declining market, which is likely to cause a greater decline in the NAV of the shares than if the Fund were not leveraged, which may result in a greater decline in the market price of the shares. The Fund’s investments in derivative instruments can be illiquid, may disproportionately increase losses, and may have a potentially large impact on Fund performance. Investments in derivative instruments may be harder to value, subject to greater volatility and more likely subject to changes in tax treatment than other investments. An investment in the Fund is not appropriate for all investors and is not intended to be a complete investment program. The Fund is designed as a long-term investment and not as a trading vehicle.
2
GOLDMAN SACHS CLOSED-END FUNDS
What Differentiates Goldman Sachs’ MLP Funds
Investment Process?
The MLP and Energy Renaissance Fund and MLP Income Opportunities Fund (each, a “Fund” and collectively, “the Funds”) each seek a high level of total return with an emphasis on current distributions to shareholders. MLP Income Opportunities Fund seeks to achieve its investment objectives by investing primarily in Master Limited Partnerships (“MLPs”). The MLP and Energy Renaissance Fund seeks to achieve its investment objective by investing in MLPs and other energy investments. We seek to invest in quality companies with well located assets (exposed to what we believe are favorable commodities and geographies), strong balance sheets, and experienced management teams. We view an MLP as a company, not just a collection of assets, as we emphasize cash flow based valuation metrics and focus on balance sheet liabilities. We seek to avoid being overly myopic by assessing the entire energy value chain (from producers to users) to estimate the impact on midstream assets.

| n | | To capture the full energy chain, we analyze energy production and user trends that ultimately impact income opportunities. |
| n | | We rigorously assess companies on both the asset and equity level. |

First, we analyze overall energy trends through capital spending shifts and drilling trends, in addition to regional supply and demand imbalances.
| n | | Top-Down Sector Selection |
Secondly, we establish the impact of macro and regional trends on energy infrastructure.
| n | | Bottom-Up Security Selection |
Finally, we select names by evaluating a company’s management, assets, expected returns and technicals.

| n | | Our team of MLP dedicated investment professionals includes lead portfolio managers averaging 10 years of investment experience. |
| n | | Ability to leverage energy-related resources across GSAM Equity, Fixed Income and Commodity groups, as well as utilize risk management resources. |
| n | | Unique investment approach stemming from a more holistic view across the extremes of the energy value chain, corporate access, broader valuation understanding, and resource advantages. |
3
PORTFOLIO RESULTS
Goldman Sachs MLP and Energy Renaissance Fund
Investment Objective And Principal Strategy
The Fund seeks a high level of total return with an emphasis on current distributions to shareholders. The Fund seeks to achieve its investment objective by investing primarily in master limited partnership (“MLP”) and other energy investments. It concentrates its investments in the energy sector, with an emphasis on midstream MLP investments. Under normal market conditions, the Fund will invest at least 80% of its managed assets in master limited partnerships (“MLPs”) and other energy investments. The Fund’s MLP investments may include, but are not limited to, MLPs structured as limited partnerships (“LPs”) or limited liability companies (“LLCs”); MLPs that are organized as LPs or LLCs, but taxed as “C” corporations; equity securities that represent an indirect interest in an MLP issued by an MLP affiliate, including institutional units (“I-Units”) and MLP general partner or managing member interests; “C” corporations whose predominant assets are interests in MLPs; MLP equity securities, including MLP common units, MLP subordinated units, MLP convertible subordinated units and MLP preferred units; private investments in public equities (“PIPEs”) issued by MLPs; MLP debt securities; and other U.S. and non-U.S. equity and fixed income securities and derivative instruments that provide exposure to the MLP market, including pooled investment vehicles that primarily hold MLP interests and exchange-traded notes (“ETNs”). The Fund’s other energy investments may include equity and fixed income securities of U.S. and non-U.S. companies other than MLPs that (i) are classified by a third party as operating within the oil and gas storage, transportation, refining, marketing, drilling, exploration or production sub-industries or (ii) have at least 50% of their assets, income, sales or profits committed to, or derived from, the exploration, development, production, gathering, transportation (including marine), transmission, terminal operation, processing, storage, refining, distribution, mining or marketing of natural gas, natural gas liquids (including propane), crude oil, refined petroleum products, coal, electricity or other energy sources, energy-related equipment or services.
Portfolio Management Discussion and Analysis
Below, the Goldman Sachs Energy and Infrastructure Team discusses the Goldman Sachs MLP and Energy Renaissance Fund’s (the “Fund”) performance and positioning for the period since its inception on September 26, 2014 through November 30, 2014 (the “Reporting Period”).
| Q | | How did the Fund perform during the Reporting Period? |
| A | | During the Reporting Period, the Fund’s cumulative total return based on its net asset value (“NAV”) was -15.28%. The Fund’s cumulative total return based on market price was -8.77% for the same period. As of November 30, 2014, the Fund’s NAV was $15.91 and its market price was $17.11. |
| Q | | How did energy master limited partnerships (“MLPs”) overall perform during the Reporting Period? |
| A | | During the Reporting Period, energy MLPs, as represented by the Alerian MLP Total Return Index (the “Alerian Index”), declined 6.63%, driven by uncertainties about falling crude oil prices and how the decline would affect energy MLP revenues. Fears about an oversupplied crude oil market, combined with weaker global demand, fueled a 29.3% decline in West Texas Intermediate (“WTI”) crude oil prices during the Reporting Period. At its meeting on November 27, 2014, the Organization of the Petroleum Exporting Countries (“OPEC”) stated it would maintain production at 30 million barrels per day, leading to a 10.8% drop in WTI crude oil prices on November 28, 2014.1 |
| | During the Reporting Period overall, the Alerian Index (-6.63%) underperformed the S&P 500® Index (+4.65%) and outperformed the AMEX Energy Select Sector Index (-13.3%).2 The Alerian Index underperformed the utilities (+10.3%) and real estate investment trust (“REIT”) (+10.9%) sectors, as represented by the Philadelphia Stock Exchange |
| | 2 | | The S&P 500® Index is a diverse index that includes 500 American companies that represent over 70% of the total market capitalization of the U.S. stock market. The AMEX Energy Select Sector Index (IXE) is a modified market capitalization-based index intended to track the movements of companies that are components of the S&P 500® Index and are involved in the development or production of energy products. |
4
PORTFOLIO RESULTS
| | (PHLX) Utility Sector Index and the FTSE NAREIT (Financial Times London Stock Exchange National Association of Real Estate Investment Trusts) U.S. Real Estate Index, respectively.3 |
| Q | | What was the Fund’s current distribution rate at the end of the Reporting Period? |
| A | | On November 3, 2014, the Fund declared a dividend of $0.32 per unit. As of November 30, 2014, the Fund’s current annualized distribution rate based on its NAV was 8.05%. The Fund’s current annualized distribution rate based on its market price was 7.48% on November 30, 2014. |
| Q | | What key factors were responsible for the Fund’s performance during the Reporting Period? |
| A | | During the Reporting Period, the decline in crude oil prices and security section drove the Fund’s performance. More specifically, Fund holdings correlated with crude oil prices were hurt by the decline in WTI during the Reporting Period. We continued to seek investment opportunities among what we consider to be quality companies with strong management teams, strong balance sheets and favorable commodity and geographical exposures (asset footprint). |
| Q | | What individual holdings detracted from the Fund’s performance during the Reporting Period? |
| A | | Seadrill Partners LLC, Emerge Energy Services LP and Legacy Reserves LP detracted most from Fund performance during the Reporting Period. |
| | Seadrill Partners LLC (SDLP) is a growth-oriented limited liability company formed by Seadrill Limited (SDRL) to own, operate and acquire offshore drilling rigs. During the Reporting Period, the offshore drilling rig market was severely weakened by falling crude oil prices. This hurt SDLP’s unit price despite the company’s current average remaining contract term of 3.5 years. In addition, after the release of third quarter results on November 26, 2014, parent company SDRL suspended its dividend, citing deterioration in the offshore drilling rig market. However, we note that as reflected in their third quarter conference call presentation, SDLP does not have any exposure to the spot market and, as mentioned previously, its rigs have a current average remaining contract term of 3.5 years with the earliest contract renewal slated for 2015. (The spot market is also called the “cash market” or “physical market,” because prices are settled in cash on the spot at current market prices as opposed to forward prices.) During the Reporting Period, SDLP was down 44.5% on a total return basis. As of November 30, 2014, SDLP had a yield of 13.1%. |
| | Emerge Energy Services LP (EMES) is engaged in two business segments. The first is the mining, processing and distributing of silica sand used for the hydraulic fracturing of oil and gas wells. The second is the processing of transmix and the distribution of refined products. During the Reporting Period, EMES faced significant headwinds from the volatility in the crude oil market. In our opinion, the company’s unit price was pressured by fears that frac sand prices would drop if drilling is curtailed because of lower crude oil prices. That said, in its earnings announcement on October 30, 2014, EMES management reiterated that sand supply at its existing facilities, approximately 8.2 million tons, is already under contract with an average remaining term of 4.2 years. During the Reporting Period, EMES was down 43.4% on a total return basis. As of November 30, 2014, EMES had a yield of 8.6%. |
| | Legacy Reserves LP (LGCY) is an independent oil and natural gas partnership formed to own and operate oil and natural gas properties. LGCY is focused on the acquisition and exploitation of oil and natural gas properties primarily in the Permian Basin, mid-continental and Rockies regions of the United States. Despite its strong near-term hedge book (which the company uses to help offset risks), LGCY was strongly affected by the drop in crude oil prices and declined 38.3% on a total return basis during the Reporting Period. As of November 30, 2014, LGCY had a yield of 13.7%. |
| Q | | What individual holdings added to the Fund’s performance during the Reporting Period? |
| A | | During the Reporting Period, the Fund benefited from its investments in Shell Midstream Partners LP, Energy Transfer Partners LP and CVR Energy. |
| | | Shell Midstream Partners LP (SHLX) is a fee-based, growth-oriented energy MLP formed by Royal Dutch Shell to own, operate, develop and acquire pipelines and other midstream4 assets. SHLX’s initial assets consisted of interests in entities which own crude oil and refined products pipelines that |
| | 3 | | The PHLX Utility Sector Index is composed of geographically diverse public U.S. utility stocks. The FTSE NAREIT U.S. Real Estate Index series is a family of REIT performance indexes that span the commercial real estate space across the U.S. economy, offering exposure to all investment and property sectors. |
| | 4 | | The midstream component of the energy industry has historically been defined as those companies providing products or services that help link the supply side (i.e., energy producers) and the demand side (i.e., energy end-users) for any type of energy commodity. Such midstream businesses can include, but are not limited to, those that process, store, market and transport various energy commodities. |
5
PORTFOLIO RESULTS
| | transport growing onshore and offshore crude oil production to the U.S. Gulf Coast’s refining markets and deliver refined products from those markets to major demand centers. Following its initial public offering (“IPO”) on October 29, 2014, SHLX rose 58.8% on a total return basis through the remainder of the Reporting Period. |
| | Energy Transfer Partners LP (ETP) owns and operates a diversified portfolio of primarily midstream energy assets. It operates through five segments: intrastate transportation and storage; interstate transportation; midstream; natural gas liquids transportation and services; and retail marketing. ETP appreciated after the release of third quarter earnings that beat consensus expectations and the announcement of continued distribution growth. We believe increased organic growth in the Bakken, Eagle Ford and Eaglebine areas were also viewed positively by the market. During the Reporting Period, ETP was up 8.4% on a total return basis. As of November 30, 2014, ETP had a yield of 6.0%. |
| | CVR Energy (CVI) is engaged in petroleum refining and the production of ammonia and urea ammonia nitrate fertilizer through its limited partnership interests in CVR Partners, LP and CVR Refining, LP. CVI’s share price rose during the Reporting Period, driven by the increase in crack spreads (the difference between wholesale petroleum product prices and crude oil prices) and better than expected third quarter earnings. In our view, the assets of CVI’s refining business are attractively positioned in the mid-continental United States and could potentially benefit from strong crude oil supply growth in the U.S. and Canada. During the Reporting Period, CVI appreciated 3.9% on a total return basis. As of November 30, 2014, CVI had a yield of 6.4%. |
| Q | | Were there any notable purchases or sales during the Reporting Period? |
| A | | As the Fund launched on September 26, 2014, the Energy and Infrastructure Team focused on investing the proceeds from its IPO during the Reporting Period. |
| Q | | How did the Fund use derivatives and similar instruments during the Reporting Period? |
| A | | During the Reporting Period, the Fund did not use derivatives or similar instruments. |
| Q | | How did the Fund use leverage during the Reporting Period? |
| A | | The Fund used a credit facility in an effort to enhance the Fund’s yield. During the Reporting Period, the credit facility represented an average of 26.26% of the Fund’s managed assets. The use of this leverage exacerbated the Fund’s underperformance during the Reporting Period. As of November 30, 2014, the credit facility represented 26.60% of the Fund’s managed assets.5 |
| Q | | What is the Fund’s tactical view and strategy for the months ahead? |
| A | | Although the price of WTI crude oil declined precipitously during the Reporting Period, we believe overall production volumes will continue growing across oil, natural gas liquids and dry natural gas — albeit at lower levels than were expected when crude oil prices were close to $100 a barrel. However, we acknowledge that a sustained period of depressed crude oil prices may lead to a reduction in crude oil production. This, in our view, may detract from energy MLP performance. On the other hand, the energy MLP sector is benefiting from a decline in overall commodities prices. Lower commodities prices have incentivized an increase in U.S. production capacity for petrochemicals and fertilizers, which rely on midstream businesses for the delivery of fuel and feedstocks. Additional tailwinds for the energy MLP sector may include increased merger and acquisition activity, greater investor interest and growing U.S. government support for the U.S. energy sector. That said, and despite our positive outlook, investors should, in our view, remain mindful that the energy MLP sector is facing more challenges beyond lower crude oil prices. Finally, we believe investors should recognize a growing dispersion in performance. Rising U.S. production has changed the energy landscape, proving beneficial to some regions and detrimental to others. As the dispersion between the energy “haves” and “have nots” has increased, we believe rigorous fundamental analysis is essential in seeking to take advantage of the powerful energy revolution theme that we believe persists. |
| | 5 | | On October 17, 2014, the MLP and Energy Renaissance Fund entered into a committed revolving line of credit facility, with a major U.S. financial institution that expires on October 16, 2015. |
6
FUND BASICS
Goldman Sachs MLP and Energy Renaissance Fund
as of November 30, 2014
| | | | | | |
| | FUND SNAPSHOT | |
| | | As of November 30, 2014 | | | |
| | Market Price1 | | $ | 17.11 | |
| | Net Asset Value (NAV)1 | | $ | 15.91 | |
| | Premium (Discount) to NAV2 | | | 7.54 | % |
| | Leverage3 | | | 26.60 | % |
| | Distribution Rate - Market Price4 | | | 7.48 | % |
| | | Distribution Rate - NAV4 | | | 8.05 | % |
| | 1 | | The Market Price is the price at which the Fund’s common shares are trading on the NYSE. The Market Price of the Fund’s common shares will fluctuate and, at the time of sale, common shares may be worth more or less than the original investment or the Fund’s then current net asset value (“NAV”). This amount is derived by dividing the total value of all the securities, less liabilities and all other assets, in the Fund’s portfolio, by the number of Fund shares outstanding. The Fund cannot predict whether its common shares will trade at, above or below NAV. Shares of closed-end investment companies frequently trade at a discount from their NAV, which may increase investors’ risk of loss. |
| | 2 | | The premium/discount to NAV is calculated as the market price divided by the NAV of the Fund minus 1, expressed as a percentage. If this value is positive, the Fund is trading at a premium to its NAV. If the value is negative, the Fund is trading at a discount to its NAV. |
| | 3 | | The Fund is permitted to obtain leverage using any form or combination of financial leverage instruments, including through funds borrowed from banks or other financial institutions (i.e., a credit facility), margin facilities or notes issued by the Fund and the leverage attributable to similar transactions entered into by the Fund. The Fund’s use of leverage through a credit facility is calculated as a percentage of the Fund’s Managed Assets (as defined in the Fund’s Prospectus). |
| | 4 | | The Distribution Rate is calculated by annualizing the most recent distribution amount declared divided by the most recent closing Market Price or NAV. The Distribution Rate is subject to change and is not an indication of Fund performance. A portion of the Fund’s distributions will likely be treated for tax purposes as a return of capital. A return of capital is not taxable and results in a reduction in the tax basis of a shareholder’s investment. The final determination regarding the nature of the distributions will be made after the end of the Fund’s fiscal year when the Fund can determine its earnings and profits. The final tax status of the distribution may differ substantially, and will be made available to shareholders after the close of each calendar year. The proportion of distributions that are treated as taxable distributions may also vary and or increase in future years. The ultimate composition of these distributions may vary due to a variety of factors including projected income and expenses, depreciation and depletion, and any tax elections made by the MLP. |
| | | | | | | | | | |
| | PERFORMANCE REVIEW | |
| | | September 26, 2014–November 30, 2014 | | Fund Total Return
(based on NAV)5 | | | Fund Total Return
(based on Market Price)5 | |
| | | Common Shares | | | -15.28 | % | | | -8.77 | % |
| | 5 | | Total returns are calculated assuming purchase of a share at the market price or NAV on the first day and sale of a share at the market price or NAV on the last day of each period reported. Dividends and distributions, if any, are assumed, for purposes of this calculation, to be reinvested at prices obtained under the Fund’s dividend reinvestment plan. The Total Returns based on NAV and Market Price do not reflect brokerage commissions or sales charges in connection with the purchase or sale of Fund shares, which if included would lower the performance shown above. The NAV used in the Total Return calculation includes all management fees, interest expense (if any) and operating expenses incurred by the Fund. Operating expenses include custody, accounting and administrative services, professional fees, transfer agency fees, registration, printing and mailing costs and Trustee fees. Total returns for periods less than one full year are not annualized. |
The returns set forth in the tables above represent past performance. Past performance does not guarantee future results. The Fund’s investment returns and principal value will fluctuate. Current performance may be lower or higher than the performance quoted above. Please visit our web site at www.GSAMFUNDS.com to obtain the most recent month-end returns. Closed-end funds, unlike open-end funds, are not continuously offered. Once issued in a public offering, shares of closed-end funds are traded in the open market through a stock exchange.
7
FUND BASICS
| | | | | | | | |
| | TOP TEN HOLDINGS AS OF 11/30/146 |
| | | Holding | | % of Net Assets | | | Line of Business |
| | Energy Transfer Partners LP | | | 18.1 | % | | Diversified Midstream |
| | Goldman Sachs Financial Square
Fund — Money Market Fund | | | 12.2 | | | Investment Company |
| | Emerge Energy Services LP | | | 7.7 | | | Other |
| | NuStar Energy LP | | | 7.7 | | | Liquids, Pipelines & Terminalling |
| | Regency Energy Partners LP | | | 7.3 | | | Natural Gas and NGL Infrastructure |
| | Buckeye Partners LP | | | 7.1 | | | Liquids, Pipelines & Terminalling |
| | Teekay Offshore Partners LP (PIPE) | | | 5.9 | | | Marine Transportation and Services |
| | Crescent Point Energy Corp. | | | 5.0 | | | Exploration and Production |
| | Seadrill Partners LLC | | | 4.5 | | | Offshore Oilfield Services |
| | | Kinder Morgan, Inc. | | | 3.8 | | | Natural Gas Pipelines |
| | 6 | | The top 10 holdings may not be representative of the Fund’s future investments. |
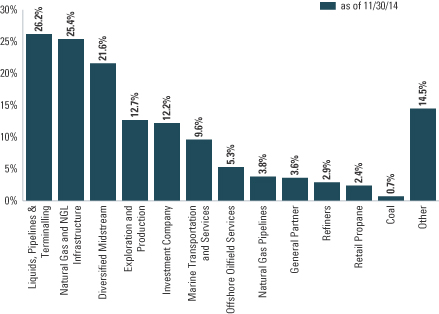
| | 7 | | The Fund is actively managed and, as such, its composition may differ over time. Consequently, the Fund’s overall sector allocations may differ from the percentages contained in the graph above. The percentage shown for each investment category reflects the value of investments in that category as a percentage of total net assets. The graph depicts the Fund’s investments but may not represent the Fund’s market exposure due to the exclusion of certain derivatives, if any, as listed in the Additional Investment Information section of the Schedule of Investments. Sector allocations are defined by GSAM and may differ from sector allocations used by the Alerian Total Return Index. |
8
PORTFOLIO RESULTS
Goldman Sachs MLP Income Opportunities Fund
Investment Objective and Principal Strategy
The Fund seeks a high level of total return with an emphasis on current distributions to shareholders. The Fund seeks to achieve its investment objective by investing primarily in master limited partnerships (“MLPs”). Under normal market conditions, the Fund will invest at least 80% of its managed assets in MLP investments. The Fund’s MLP investments may include, but are not limited to, MLPs structured as limited partnerships (“LPs”) or limited liability companies (“LLCs”); MLPs that are organized as LPs or LLCs, but taxed as “C” corporations; equity securities that represent an indirect interest in an MLP issued by an MLP affiliate, including institutional units (“I-Units”) and MLP general partner or managing member interests; “C” corporations whose predominant assets are interests in MLPs; MLP equity securities, including MLP common units, MLP subordinated units, MLP convertible subordinated units and MLP preferred units; private investments in public equities (“PIPEs”) issued by MLPs; MLP debt securities; and other U.S. and non-U.S. equity and fixed income securities and derivative instruments that provide exposure to the MLP market, including pooled investment vehicles that primarily hold MLP interests and exchange-traded notes (“ETNs”). The Fund currently expects to concentrate its investments in the energy sector, with an emphasis on midstream MLP investments, including companies that are engaged in the treatment, gathering, compression, processing, transportation, transmission, fractionation, storage and terminalling of natural gas, natural gas liquids, crude oil, refined products or coal.
Portfolio Management Discussion and Analysis
Below, the Goldman Sachs Energy and Infrastructure Team discusses the Goldman Sachs MLP Income Opportunities Fund’s (the “Fund”) performance and positioning for the one-year period ended November 30, 2014 (the “Reporting Period”).
| Q | | How did the Fund perform during the Reporting Period? |
| A | | During the Reporting Period, the Fund’s average annual total return based on its net asset value (“NAV”) was 7.31%. The Fund’s average annual total return based on market price was -0.14% for the same period. As of November 30, 2014, the Fund’s NAV was $19.19 and its market price was $18.74. |
| Q | | How did energy master limited partnerships (“MLPs”) overall perform during the Reporting Period? |
| A | | During the Reporting Period overall, the Alerian MLP Total Return Index (the “Alerian Index”), representing energy MLPs, returned 12.87%, underperforming the S&P 500® Index (+16.86%) and outperforming the AMEX Energy Select Sector Index (-7.8%).6 The Alerian Index underperformed the utilities (+24.8%) and real estate investment trust (“REIT”) (+27.2%) sectors, as represented by the Philadelphia Stock Exchange (PHLX) Utility Sector Index and the FTSE NAREIT (Financial Times London Stock Exchange National Association of Real Estate Investment Trusts) U.S. Real Estate Index, respectively.7 |
| | The Alerian Index had a strong start to the Reporting Period, reaching an all-time high on August 29, 2014. However, a drop in crude oil prices during the last three months of the Reporting Period was a significant headwind for energy MLPs. The Alerian Index declined 8.5% between September 1, 2014 and November 28, 2014 as larger than expected U.S. production growth, combined with weaker than expected demand growth in developing countries, put significant downward pressure on crude oil prices. After hitting a high of $106.83 on June 20, 2014, the price of West Texas Intermediate (“WTI”) crude oil fell 38.1% through November 30, 2014, ending the Reporting Period at $66.15 a |
| | 6 | | The S&P 500® Index is a diverse index that includes 500 American companies that represent over 70% of the total market capitalization of the U.S. stock market. The AMEX Energy Select Sector Index (IXE) is a modified market capitalization-based index intended to track the movements of companies that are components of the S&P 500® Index and are involved in the development or production of energy products. |
| | 7 | | The PHLX Utility Sector Index is composed of geographically diverse public U.S. utility stocks. The FTSE NAREIT U.S. Real Estate Index series is a family of REIT performance indexes that span the commercial real estate space across the U.S. economy, offering exposure to all investment and property sectors. |
9
PORTFOLIO RESULTS
| | barrel.8 The final days of the Reporting Period were particularly volatile. At its meeting on November 27, 2014, the Organization of the Petroleum Exporting Countries (“OPEC”) said it would maintain production at 30 million barrels per day, which led to a 10.8% drop in WTI crude oil prices on November 28, 2014.9 |
| | U.S. production growth continued to increase, as U.S. crude oil production increased 14.4% on a year-over-year basis, driven largely by acceleration in fast growing areas of operation, such as the Bakken, Eagle Ford and Permian Basins. U.S. natural gas production increased 9.1% over the same period on strong production growth from liquids rich basins and improved drilling results from dry areas, such as the Marcellus Shale. U.S. natural gas liquid production experienced a marginal year-over-year increase, up 0.5%.8 |
| | During the Reporting Period, the energy MLP sector saw strong investment inflows, as there were $21.1 billion of inflows through exchange traded funds (“ETFs”), exchange traded notes (“ETNs”), open-end funds, and closed-end funds. This compares with $17.8 billion of inflows during the same timeframe a year earlier.8 The increase in inflows was supportive of energy MLPs during the Reporting Period. |
| | Additionally, declining interest rates also served as a tailwind for energy MLPs, as the yield on the 10-year U.S. Treasury note fell 59 basis points from 2.75% to 2.16% during the Reporting Period. (A basis point is 1/100th of a percentage point.) |
| Q | | What was the Fund’s current distribution rate at the end of the Reporting Period? |
| A | | On November 3, 2014, the Fund declared a dividend of $0.33 per unit. As of November 30, 2014, the Fund’s current annualized distribution rate based on its NAV was 6.88%. The Fund’s current annualized distribution rate based on its market price was 7.04% on November 30, 2014. |
| Q | | What key factors were responsible for the Fund’s performance during the Reporting Period? |
| A | | Security selection, combined with the decline in crude oil prices, drove the Fund’s performance during the Reporting Period. The Fund continued to seek to invest in the securities of what we consider to be quality companies with strong management teams, strong balance sheets and favorable commodity and geographical exposures (asset footprint). |
| Q | | What individual holdings added to the Fund’s performance during the Reporting Period? |
| A | | During the Reporting Period, the Fund benefited from its investments in Valero Energy Partners LP, Emerge Energy Services LP and NGL Energy Partners LP. |
| | Valero Energy Partners LP (VLP) is a fee-based, growth-oriented, traditional energy MLP formed by Valero Energy to own, operate, develop and acquire crude oil and refined petroleum products pipelines, terminals and other transportation and logistics assets. During its fiscal third quarter, VLP delivered strong throughput and revenue growth. It also closed a drop-down of assets from its parent, Valero Energy. (Drop-down refers to the act of a parent company selling MLP-qualified assets to the associated MLP with favorable terms. Once an MLP is spun off from its integrated parent company, additional assets may be placed into the MLP to increase the capital base. Other drop-downs may occur when the General Partner acquires another company with certain assets more suitable for the MLP than its own balance sheet.) In June 2014, VLP acquired the Texas Crude Systems Business for a total cash consideration of $154 million. On October 14, 2014, VLP increased its quarterly distribution by nearly 8% to $0.24 per unit. Following its initial public offering (“IPO”) on December 11, 2013, VLP was up 51.5% on a total return basis for the remainder of the Reporting Period. As of November 30, 2014, VLP had a yield of 2.3%. |
| | Emerge Energy Services LP (EMES). EMES is engaged in two business segments. The first is the mining, processing and distributing of silica sand used for the hydraulic fracturing of oil and gas wells. The second is the processing of transmix and the distribution of refined products. EMES reported strong earnings growth during the Reporting Period, driven by record sand production levels. In its earnings announcement on October 30, 2014, management reiterated that sand supply at its existing facilities, approximately 8.2 million tons, is already under contract with an average remaining term of 4.2 years. During the Reporting Period, EMES was up 71.3% on a total return basis. As of November 30, 2014, EMES had a yield of 8.6%. |
| | 9 | | Source: U.S. Energy Information Administration. Data as of latest published figures at the reflecting September 2014 versus September 2013 levels. |
10
PORTFOLIO RESULTS
| | NGL Energy Partners LP (NGL) is a diversified midstream10 energy MLP, which focuses on water services, crude oil logistics, natural gas liquids logistics and retail businesses. NGL also provides solutions for upstream companies, such as marketing crude oil, marketing natural gas liquids and treating produced and flow back water disposal or recycling. During the Reporting Period, NGL benefited from strategic acquisitions, most notably the acquisition of Transmontaigne in July 2014. Through its limited partnership subsidiary, Transmontaigne Partners LP, Transmontaigne provides integrated terminalling, storage, transportation and related services for customers engaged in the distribution and marketing of petroleum products, crude oil, chemicals, fertilizers and other liquid products. During the Reporting Period, NGL was up 14.1% on a total return basis. As of November 30, 2014, NGL had a yield of 7.0%. |
| Q | | What individual holdings detracted from the Fund’s performance during the Reporting Period? |
| A | | North Atlantic Drilling, Seadrill Partners LLC and Hoegh LNG Partners detracted from the Fund’s returns during the Reporting Period. |
| | North Atlantic Drilling (NADL) is a Norway-headquartered provider of offshore drilling services focused on the Russian Arctic basin (Kara Sea). Several factors influenced NADL’s poor performance during the Reporting Period. One was the soft demand environment for offshore drillers, which was partly due to weakness in the crude oil markets. Although NADL’s rigs have strong contract coverage with an average contract length of 4.25 years (not including client options for extensions), the company’s share price was still hurt by deteriorating market sentiment for offshore drillers. The imposition of economic sanctions on Russia also contributed to the stock’s weakness. NADL’s biggest customer, Russian oil company Rosneft, was significantly impacted by the economic sanctions, raising concern that NADL could lose its largest customer and be forced to re-contract a large portion of its fleet in a particularly weak environment. As a result, NADL announced a dividend cut during its third quarter earnings release, which further pressured its stock price. Between its IPO on January 29, 2014 and the end of the Reporting Period, NADL was down 69.5% on a total return basis. |
| | Seadrill Partners LLC (SDLP) is a growth-oriented limited liability company formed by Seadrill Limited (SDRL) to own, operate and acquire offshore drilling rigs. During the Reporting Period, the offshore drilling rig market was severely weakened by falling crude oil prices. This hurt SDLP’s unit price despite the company’s current average remaining contract term of 3.5 years. In addition, after the release of third quarter results on November 26, 2014, parent company SDRL suspended its dividend, citing deterioration in the offshore drilling rig market. However, we note that as reflected in their third quarter conference call presentation, SDLP does not have any exposure to the spot market and, as mentioned previously, its rigs have a current average remaining contract term of 3.5 years with the earliest contract renewal slated for 2015. (The spot market is also called the “cash market” or “physical market,” because prices are settled in cash on the spot at current market prices as opposed to forward prices.) During the Reporting Period, SDLP was down 44.5% on a total return basis. As of November 30, 2014, SDLP had a yield of 13.1%. |
| | Hoegh LNG Partners (HMLP) is a growth-oriented energy MLP formed by Hoegh LNG Holdings, a major floating liquefied natural gas service provider. HMLP seeks to own, operate and acquire floating storage regasification units (“FSRUs”), liquefied natural gas carriers and other liquefied natural gas infrastructure assets under long-term charters of five or more years. The share price of HMLP declined following the company’s IPO on August 27, 2014, largely because of overall energy market weakness. At the end of the Reporting Period, however, we remained positive on HMLP, given its modern fleet of purpose-built FSRUs, which have long-term regasification contracts at attractive cash flow yields. Furthermore, in our view, the company has a strong management team with a successful track record in the capital markets and shipping industry. After its IPO, HMLP was down 27.4% on a total return basis for the remainder of the Reporting Period. As of November 30, 2014, HMLP had a yield of 7.3%. |
| Q | | Were there any notable purchases or sales during the Reporting Period? |
| A | | During the Reporting Period, we initiated a position in NGL Energy Partners LP (NGL). As mentioned previously, NGL is a diversified midstream energy MLP that focuses on water services, crude oil logistics, natural gas liquids logistics and retail business. NGL also provides solutions for upstream companies, such as marketing crude oil, marketing natural gas liquids and treating produced and flow back water |
| | 10 | | The midstream component of the energy industry has historically been defined as those companies providing products or services that help link the supply side (i.e., energy producers) and the demand side (i.e., energy end-users) for any type of energy commodity. Such midstream businesses can include, but are not limited to, those that process, store, market and transport various energy commodities. |
11
PORTFOLIO RESULTS
| | disposal or recycling. The company operates its business through four business segments: crude oil logistics, water services, natural gas liquids logistics and retail propane. As of November 30, 2014, NGL’s weighting in the Fund was 6.0%. |
| | We also added a position in Teekay Offshore Partners LP (TOO). TOO provides marine transportation, oil production and storage services to the offshore oil industry. It owns interests in shuttle tankers, floating production, storage and offloading units, floating storage and offtake units and conventional oil tankers. TOO operates through five segments: shuttle tanker; floating production; storage and offloading; conventional tanker; and floating storage and offtake. As of November 30, 2014, TOO had a yield of 8.4% and its Fund weighting was 5.4%. |
| | During the Reporting Period, we sold the Fund’s holding in MarkWest Energy Partners LP (MWE). MWE is engaged in the gathering, processing and transportation of natural gas; the transportation, fractionation, storage and marketing of natural gas liquids; and the gathering and transportation of crude oil. It operates through four segments: Southwest, Northeast, Liberty and Utica. We exited the position and reallocated the proceeds to companies we view in a more favorable manner. |
| | In addition, we sold the Fund’s holding in EnLink Midstream Partners LP (ENLK). ENLK is a diversified midstream company that focuses on providing midstream energy services, including gathering, transmission, processing, fractionation and marketing, to producers of natural gas, natural gas liquids, crude oil and condensate. We sold the position and reallocated the proceeds to companies that we view more positively. |
| Q | | How did the Fund use derivatives and similar instruments during the Reporting Period? |
| A | | During the Reporting Period, the Fund did not use derivatives or similar instruments. |
| Q | | How did the Fund use leverage during the Reporting Period? |
| A | | The Fund used a credit facility in seeking to enhance the Fund’s yield. During the Reporting Period, the credit facility represented an average of 21.36% of the Fund’s managed assets. The use of this leverage hampered the Fund’s performance during the Reporting Period. As of November 30, 2014, the credit facility represented 26.20% of the Fund’s managed assets.11 |
| Q | | What is the Fund’s tactical view and strategy for the months ahead? |
| A | | Although the price of WTI crude oil declined precipitously during the Reporting Period, we believe overall production volumes will continue growing across oil, natural gas liquids and dry natural gas — albeit at lower levels than were expected when crude oil prices were close to $100 a barrel. However, we acknowledge that a sustained period of depressed crude oil prices may lead to a reduction in crude oil production. This, in our view, may detract from energy MLP performance. On the other hand, the energy MLP sector is benefiting from a decline in overall commodities prices. Lower commodities prices have incentivized an increase in U.S. production capacity for petrochemicals and fertilizers, which rely on midstream businesses for the delivery of fuel and feedstocks. Additional tailwinds for the energy MLP sector may include increased merger and acquisition activity, greater investor interest and growing U.S. government support for the U.S. energy sector. That said, and despite our positive outlook, investors should, in our view, remain mindful that the energy MLP sector is facing more challenges beyond lower crude oil prices. Finally, we believe investors should recognize a growing dispersion in performance. Rising U.S. production has greatly altered the energy landscape, proving beneficial to some regions and detrimental to others. As the dispersion between the energy “haves” and “have nots” has increased, we believe rigorous fundamental analysis is essential to take advantage of the powerful energy revolution theme that we believe persists. |
| | 11 | | On December 19, 2013, the MLP Income Opportunities Fund entered into a committed revolving line of credit facility with a major U.S. financial institution. The Credit Facility was amended on July 28, 2014 and expires on July 28, 2015. |
12
FUND BASICS
Goldman Sachs MLP Income Opportunities Fund
as of November 30, 2014
| | | | | | |
| | FUND SNAPSHOT | |
| | | As of November 30, 2014 | | | |
| | Market Price1 | | $ | 18.74 | |
| | Net Asset Value (NAV)1 | | $ | 19.19 | |
| | Premium (Discount) to NAV2 | | | -2.34 | % |
| | Leverage3 | | | 26.20 | % |
| | Distribution Rate - Market Price4 | | | 7.04 | % |
| | | Distribution Rate - NAV4 | | | 6.88 | % |
| | 1 | | The Market Price is the price at which the Fund’s common shares are trading on the NYSE. The Market Price of the Fund’s common shares will fluctuate and, at the time of sale, common shares may be worth more or less than the original investment or the Fund’s then current net asset value (“NAV”). This amount is derived by dividing the total value of all the securities, less liabilities and all other assets, in the Fund’s portfolio, by the number of Fund shares outstanding. The Fund cannot predict whether its common shares will trade at, above or below NAV. Shares of closed-end investment companies frequently trade at a discount from their NAV, which may increase investors’ risk of loss. |
| | 2 | | The premium/discount to NAV is calculated as the market price divided by the NAV of the Fund minus 1, expressed as a percentage. If this value is positive, the Fund is trading at a premium to its NAV. If the value is negative, the Fund is trading at a discount to its NAV. |
| | 3 | | The Fund is permitted to obtain leverage using any form or combination of financial leverage instruments, including through funds borrowed from banks or other financial institutions (i.e., a credit facility), margin facilities or notes issued by the Fund and the leverage attributable to similar transactions entered into by the Fund. The Fund’s use of leverage through a credit facility is calculated as a percentage of the Fund’s Managed Assets (as defined in the Fund’s Prospectus). |
| | 4 | | The Distribution Rate is calculated by annualizing the most recent distribution amount declared divided by the most recent closing Market Price or NAV. The Distribution Rate is subject to change and is not an indication of Fund performance. A portion of the Fund’s distributions will likely be treated for tax purposes as a return of capital. A return of capital is not taxable and results in a reduction in the tax basis of a shareholder’s investment. The final determination regarding the nature of the distributions will be made after the end of the Fund’s fiscal year when the Fund can determine its earnings and profits. The final tax status of the distribution may differ substantially, and will be made available to shareholders after the close of each calendar year. The proportion of distributions that are treated as taxable distributions may also vary and or increase in future years. The ultimate composition of these distributions may vary due to a variety of factors including projected income and expenses, depreciation and depletion, and any tax elections made by the MLP. |
| | | | | | | | | | |
| | PERFORMANCE REVIEW | |
| | | December 1, 2013–November 30, 2014 | | Fund Total Return
(based on NAV)5 | | | Fund Total Return
(based on Market Price)5 | |
| | | Common Shares | | | 7.31 | % | | | -0.14 | % |
| | 5 | | Total returns are calculated assuming purchase of a share at the market price or NAV on the first day and sale of a share at the market price or NAV on the last day of each period reported. Dividends and distributions, if any, are assumed, for purposes of this calculation, to be reinvested at prices obtained under the Fund’s dividend reinvestment plan. The Total Returns based on NAV and Market Price do not reflect brokerage commissions or sales charges in connection with the purchase or sale of Fund shares, which if included would lower the performance shown above. The NAV used in the Total Return calculation includes all management fees, interest expense (if any) and operating expenses incurred by the Fund. Operating expenses include custody, accounting and administrative services, professional fees, transfer agency fees, registration, printing and mailing costs and Trustee fees. Total returns for periods less than one full year are not annualized. |
The returns set forth in the tables above represent past performance. Past performance does not guarantee future results. The Fund’s investment returns and principal value will fluctuate. Current performance may be lower or higher than the performance quoted above. Please visit our web site at www.GSAMFUNDS.com to obtain the most recent month-end returns. Closed-end funds, unlike open-end funds, are not continuously offered. Once issued in a public offering, shares of closed-end funds are traded in the open market through a stock exchange.
13
FUND BASICS
| | | | | | | | |
| | TOP TEN HOLDINGS AS OF 11/30/146 |
| | | Holding | | % of Net Assets | | | Line of Business |
| | NGL Energy Partners LP | | | 6.0 | % | | Diversified Midstream |
| | Teekay Offshore Partners LP | | | 5.5 | | | Marine Transportation and Services |
| | Hoegh LNG Partners LP | | | 5.1 | | | Marine Transportation and Services |
| | Energy Transfer Partners LP | | | 5.0 | | | Diversified Midstream |
| | Compressco Partners LP | | | 4.8 | | | Other |
| | Targa Resources Partners LP | | | 4.7 | | | Diversified Midstream |
| | Alliance Holdings GP LP | | | 4.6 | | | General Partner |
| | Williams Partners LP | | | 4.6 | | | Diversified Midstream |
| | DCP Midstream Partners LP | | | 4.5 | | | Natural Gas and NGL Infrastructure |
| | | CrossAmerica Partners LP | | | 4.1 | | | Liquids, Pipelines & Terminalling |
| | 6 | | The top 10 holdings may not be representative of the Fund’s future investments. |
14
FUND BASICS
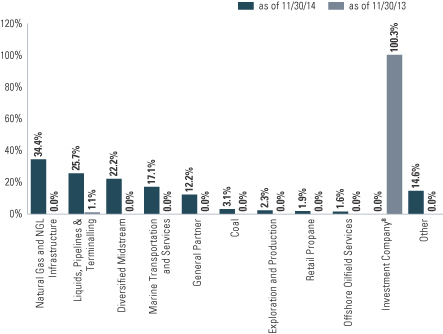
| | 7 | | The Fund is actively managed and, as such, its composition may differ over time. Consequently, the Fund’s overall sector allocations may differ from the percentages contained in the graph above. The percentage shown for each investment category reflects the value of investments in that category as a percentage of total net assets. The graph depicts the Fund’s investments but may not represent the Fund’s market exposure due to the exclusion of certain derivatives, if any, as listed in the Additional Investment Information section of the Schedule of Investments. Sector allocations are defined by GSAM and may differ from sector allocations used by the Alerian Total Return Index. |
| | 8 | | The Fund, which launched on Tuesday, November 26, 2013, had only just begun investing the proceeds from its initial public offering and as such, as of Friday, November 29, 2013, the last business day of the Fund’s prior fiscal year end, there was a significant portion of the portfolio in an investment company. |
15
GOLDMAN SACHS MLP AND ENERGY RENAISSANCE FUND
Schedule of Investments
November 30, 2014
| | | | | | | | |
Shares | | | Description | | Value | |
| | | | | | | | |
| | Common Stocks – 128.7% | | | | |
| | Coal – 0.7% | | | | |
| | 501,000 | | | Foresight Energy LP | | $ | 8,817,600 | |
| | |
| | Diversified Midstream – 21.6% | | | | |
| | 3,450,000 | | | Energy Transfer Partners LP | | | 224,836,500 | |
| | 800,000 | | | Targa Resources Partners LP | | | 43,864,000 | |
| | | | | | | | |
| | | | | | | 268,700,500 | |
| | |
| | Exploration and Production – 12.7% | | | | |
| | 600,000 | | | Baytex Energy Corp. | | | 13,358,986 | |
| | 2,364,500 | | | Crescent Point Energy Corp. | | | 61,888,487 | |
| | 2,208,996 | | | Legacy Reserves LP | | | 39,386,399 | |
| | 2,529,803 | | | Memorial Production Partners LP | | | 34,810,089 | |
| | 720,000 | | | New Source Energy Partners LP | | | 8,395,200 | |
| | | | | | | | |
| | | | | | | 157,839,161 | |
| | |
| | General Partner – 3.6% | | | | |
| | 150,200 | | | Alliance Holdings GP LP | | | 10,067,906 | |
| | 750,000 | | | CVR Energy, Inc. | | | 34,905,000 | |
| | | | | | | | |
| | | | | | | 44,972,906 | |
| | |
| | Liquids, Pipelines & Terminalling – 26.2% | | | | |
| | 1,145,700 | | | Buckeye Partners LP | | | 88,069,959 | |
| | 357,967 | | | CrossAmerica Partners LP | | | 11,816,491 | |
| | 1,950,000 | | | JP Energy Partners LP*(a) | | | 28,470,000 | |
| | 209,406 | | | Magellan Midstream Partners LP | | | 17,357,663 | |
| | 1,712,300 | | | NuStar Energy LP | | | 95,888,800 | |
| | 491,470 | | | PBF Logistics LP | | | 11,220,260 | |
| | 361,249 | | | Plains All American Pipeline LP | | | 18,586,261 | |
| | 863,900 | | | Shell Midstream Partners LP* | | | 31,549,628 | |
| | 527,520 | | | Sprague Resources LP(a) | | | 11,853,374 | |
| | 269,893 | | | TransMontaigne Partners LP | | | 9,961,751 | |
| | | | | | | | |
| | | | | | | 324,774,187 | |
| | |
| | Marine Transportation and Services – 9.6% | | | | |
| | 1,690,022 | | | Capital Product Partners LP | | | 13,215,972 | |
| | 134,700 | | | Golar LNG Partners LP | | | 4,431,630 | |
| | 1,000,000 | | | Navios Maritime Midstream Partners LP*(a) | | | 13,090,000 | |
| | 575,000 | | | Teekay Offshore Partners LP | | | 14,783,250 | |
| | 2,873,563 | | | Teekay Offshore Partners LP (PIPE)(b) | | | 73,879,305 | |
| | | | | | | | |
| | | | | | | 119,400,157 | |
| | |
| | Natural Gas and NGL Infrastructure – 25.4% | | | | |
| | 1,693,250 | | | Antero Midstream Partners LP* | | | 46,886,092 | |
| | 1,177,779 | | | Atlas Pipeline Partners LP | | | 38,678,262 | |
| | 758,239 | | | Crestwood Midstream Partners LP | | | 15,225,439 | |
| | 822,100 | | | DCP Midstream Partners LP | | | 39,386,811 | |
| | 677,192 | | | EnLink Midstream Partners LP | | | 18,886,885 | |
| | 500,000 | | | ONEOK Partners LP | | | 22,040,000 | |
| | 1,453,812 | | | QEP Midstream Partners LP(a) | | | 23,333,683 | |
| | 3,200,000 | | | Regency Energy Partners LP | | | 91,168,000 | |
| | 135,000 | | | USA Compression Partners LP | | | 2,565,000 | |
| | 251,000 | | | Western Gas Partners LP | | | 17,803,430 | |
| | | | | | | | |
| | | | | | | 315,973,602 | |
| | |
| | Natural Gas Pipelines – 3.8% | | | | |
| | 1,134,120 | | | Kinder Morgan, Inc. | | | 46,895,862 | |
| | |
| | Offshore Oilfield Services – 5.3% | | | | |
| | 3,341,000 | | | Seadrill Partners LLC | | | 56,529,720 | |
| | 555,859 | | | Transocean Partners LLC | | | 8,715,869 | |
| | | | | | | | |
| | | | | | | 65,245,589 | |
| | |
| | Common Stocks – (continued) | | | | |
| | Other – 14.5% | | | | |
| | 727,800 | | | Alon USA Partners LP | | $ | 12,408,990 | |
| | 548,184 | | | Compressco Partners LP | | | 11,199,399 | |
| | 513,855 | | | CVR Refining LP | | | 11,453,828 | |
| | 1,500,000 | | | Emerge Energy Services LP(a) | | | 96,225,000 | |
| | 1,927,300 | | | Northern Tier Energy LP | | | 46,023,924 | |
| | 182,049 | | | OCI Partners LP | | | 3,094,833 | |
| | | | | | | | |
| | | | | | | 180,405,974 | |
| | |
| | Refiners – 2.9% | | | | |
| | 611,400 | | | PBF Energy, Inc. Class A | | | 17,278,164 | |
| | 453,252 | | | Western Refining, Inc. | | | 18,633,190 | |
| | | | | | | | |
| | | | | | | 35,911,354 | |
| | |
| | Retail Propane – 2.4% | | | | |
| | 648,700 | | | AmeriGas Partners LP | | | 29,963,453 | |
| | |
| | TOTAL COMMON STOCKS | | | | |
| | (Cost $1,790,802,329) | | $ | 1,598,900,345 | |
| | |
| | | | | | | | |
| | Investment Company(a) – 12.2% | | | | |
| | 151,657,333 | | | Goldman Sachs Financial Square Fund — Money Market Fund | | | | |
| | (Cost $151,657,333) | | $ | 151,657,333 | |
| | |
| | TOTAL INVESTMENTS – 140.9% | | | | |
| | (Cost $1,942,459,662) | | $ | 1,750,557,678 | |
| | |
| | BORROWINGS – (36.2)% | | $ | (450,000,000 | ) |
| | |
| OTHER ASSETS AND
OTHER LIABILITIES – (4.7)% | | $ | (57,940,822 | ) |
| | |
| | NET ASSETS – 100.0% | | $ | 1,242,616,856 | |
| | |
| | |
| The percentage shown for each investment category reflects the value of investments in that category as a percentage of net assets. |
* | | Newly issued security: non-income producing. |
(a) | | Represents an Affiliated Issuer/Fund. |
(b) | | Restricted securities are not registered under the Securities Act of 1933 and are subject to legal restrictions on resale. These securities generally may be resold in transactions exempt from registration or to the public if the securities are subsequently registered. Disposal of these securities may involve time consuming negotiations and prompt sale at an acceptable price may be difficult. See additional details below: |
| | | | | | | | |
| Restricted Security | | Acquisition
Date | | | Cost | |
Teekay Offshore Partners LP (PIPE) | | | 11/24/2014 | | | $ | 74,999,994 | |
| | | | |
|
Investment Abbreviations: |
GP | | —General Partnership |
LP | | —Limited Partnership |
PIPE | | —Private Investment in Public Equity |
|
| | |
| 16 | | The accompanying notes are an integral part of these financial statements. |
GOLDMAN SACHS MLP INCOME OPPORTUNITIES FUND
Schedule of Investments
November 30, 2014
| | | | | | | | |
Shares | | | Description | | Value | |
| | | | | | | | |
| | Common Stocks – 135.1% | |
| | Coal – 3.1% | |
| | 273,840 | | | Alliance Resource Partners LP | | $ | 12,613,070 | |
| | 756,380 | | | Foresight Energy LP | | | 13,312,288 | |
| | | | | | | | |
| | | | | | | 25,925,358 | |
| | |
| | Diversified Midstream – 22.2% | |
| | 2,500,000 | | | CorEnergy Infrastructure Trust, Inc. | | | 16,675,000 | |
| | 647,500 | | | Energy Transfer Partners LP | | | 42,197,575 | |
| | 1,450,000 | | | NGL Energy Partners LP | | | 50,605,000 | |
| | 722,000 | | | Targa Resources Partners LP | | | 39,587,260 | |
| | 750,000 | | | Williams Partners LP | | | 38,805,000 | |
| | | | | | | | |
| | | | | | | 187,869,835 | |
| | |
| | Exploration and Production – 2.3% | |
| | 820,456 | | | Memorial Production Partners LP | | | 11,289,474 | |
| | 730,118 | | | New Source Energy Partners LP | | | 8,513,176 | |
| | | | | | | | |
| | | | | | | 19,802,650 | |
| | |
| | General Partner – 12.2% | |
| | 586,115 | | | Alliance Holdings GP LP | | | 39,287,288 | |
| | 276,000 | | | Targa Resources Corp. | | | 31,502,640 | |
| | 632,600 | | | The Williams Cos., Inc. | | | 32,737,050 | |
| | | | | | | | |
| | | | | | | 103,526,978 | |
| | |
| | Liquids, Pipelines & Terminalling – 25.7% | |
| | 390,000 | | | Buckeye Partners LP | | | 29,979,300 | |
| | 1,053,448 | | | CrossAmerica Partners LP(a) | | | 34,774,318 | |
| | 262,500 | | | Magellan Midstream Partners LP | | | 21,758,625 | |
| | 412,614 | | | NuStar Energy LP | | | 23,106,384 | |
| | 550,449 | | | Plains All American Pipeline LP | | | 28,320,601 | |
| | 818,614 | | | Sprague Resources LP(a) | | | 18,394,257 | |
| | 531,100 | | | Tesoro Logistics LP | | | 30,416,097 | |
| | 750,000 | | | Valero Energy Partners LP | | | 31,290,000 | |
| | | | | | | | |
| | | | | | | 218,039,582 | |
| | |
| | Marine Transportation and Services – 17.1% | |
| | 1,056,000 | | | Capital Product Partners LP | | | 8,257,920 | |
| | 895,079 | | | Dynagas LNG Partners LP | | | 16,030,865 | |
| | 583,100 | | | Golar LNG Partners LP | | | 19,183,990 | |
| | 2,330,985 | | | Hoegh LNG Partners LP(a) | | | 42,890,124 | |
| | 535,000 | | | KNOT Offshore Partners LP | | | 11,834,200 | |
| | 1,800,000 | | | Teekay Offshore Partners LP | | | 46,278,000 | |
| | | | | | | | |
| | | | | | | 144,475,099 | |
| | |
| | Natural Gas and NGL Infrastructure – 34.4% | |
| | 445,250 | | | Access Midstream Partners LP | | | 27,908,270 | |
| | 1,387,521 | | | American Midstream Partners LP(a) | | | 30,969,469 | |
| | 855,000 | | | Atlas Pipeline Partners LP | | | 28,078,200 | |
| | 1,000,000 | | | Crestwood Midstream Partners LP | | | 20,080,000 | |
| | 790,000 | | | DCP Midstream Partners LP | | | 37,848,900 | |
| | 1,000,000 | | | Dominion Midstream Partners LP* | | | 31,050,000 | |
| | 450,000 | | | ONEOK Partners LP | | | 19,836,000 | |
| | 1,109,861 | | | Regency Energy Partners LP | | | 31,619,940 | |
| | 650,140 | | | Summit Midstream Partners LP | | | 29,516,356 | |
| | |
| | Common Stocks – (continued) | |
| | Natural Gas and NGL Infrastructure – (continued) | |
| | 824,600 | | | USA Compression Partners LP | | $ | 15,667,400 | |
| | 258,269 | | | Western Gas Partners LP | | | 18,319,020 | |
| | | | | | | | |
| | | | | | | 290,893,555 | |
| | |
| | Offshore Oilfield Services – 1.6% | |
| | 800,000 | | | Seadrill Partners LLC | | | 13,536,000 | |
| | |
| | Other – 14.6% | |
| | 2,000,000 | | | Compressco Partners LP(a) | | | 40,860,000 | |
| | 862,050 | | | CVR Refining LP | | | 19,215,095 | |
| | 427,100 | | | Emerge Energy Services LP | | | 27,398,465 | |
| | 1,025,000 | | | Northern Tier Energy LP | | | 24,477,000 | |
| | 695,704 | | | OCI Partners LP | | | 11,826,968 | |
| | | | | | | | |
| | | | | | | 123,777,528 | |
| | |
| | Retail Propane – 1.9% | |
| | 348,477 | | | AmeriGas Partners LP | | | 16,096,153 | |
| | |
| | TOTAL COMMON STOCKS – 135.1% | | | | |
| | (Cost $1,070,229,616) | | $ | 1,143,942,738 | |
| | |
| | BORROWINGS – (35.5)% | | $ | (301,000,000 | ) |
| | |
| OTHER ASSETS AND
OTHER LIABILITIES – 0.4% | | $ | 3,891,960 | |
| | |
| | NET ASSETS – 100.0% | | $ | 846,834,698 | |
| | |
| | |
| The percentage shown for each investment category reflects the value of investments in that category as a percentage of net assets. |
* | | Newly issued security: non-income producing. |
(a) | | Represents an Affiliated Issuer. |
| | |
|
Investment Abbreviations: |
GP | | —General Partnership |
LP | | —Limited Partnership |
|
| | |
| The accompanying notes are an integral part of these financial statements. | | 17 |
GOLDMAN SACHS CLOSED-END FUNDS
Statements of Assets and Liabilities
November 30, 2014
| | | | | | | | | | |
| | | | | MLP and Energy
Renaissance Fund | | | MLP Income
Opportunities Fund | |
| | Assets: | |
| | Investments of unaffiliated issuers, at value (cost $1,559,679,142 and $902,864,825) | | $ | 1,425,928,288 | | | $ | 976,054,570 | |
| | Investments of affiliated issuers and funds, at value (cost $382,780,520 and $167,364,791) | | | 324,629,390 | | | | 167,888,168 | |
| | Cash | | | 92,782 | | | | 25,747,632 | |
| | Receivables: | | | | | | | | |
| | Investments sold | | | 67,603,512 | | | | 2,225,919 | |
| | Dividends | | | 2,945,833 | | | | 180,883 | |
| | Prepaid federal income taxes | | | — | | | | 4,096,843 | |
| | Prepaid state and local income taxes | | | — | | | | 970,834 | |
| | Deferred financing costs | | | 302,466 | | | | 97,387 | |
| | Other assets | | | 3,910 | | | | 198,095 | |
| | Total assets | | | 1,821,506,181 | | | | 1,177,460,331 | |
| | | | | | | | | | |
| | Liabilities: | |
| | Payables: | | | | | | | | |
| | Borrowings on credit facility | | | 450,000,000 | | | | 301,000,000 | |
| | Investments purchased | | | 124,741,305 | | | | — | |
| | Management fees | | | 1,512,837 | | | | 999,608 | |
| | Offering costs | | | 1,051,032 | | | | — | |
| | Interest on borrowings | | | 573,672 | | | | 291,202 | |
| | Federal income tax | | | 555,632 | | | | — | |
| | State and local income tax | | | 33,338 | | | | — | |
| | Deferred taxes, net | | | — | | | | 27,642,741 | |
| | Accrued expenses | | | 421,509 | | | | 692,082 | |
| | Total liabilities | | | 578,889,325 | | | | 330,625,633 | |
| | | | | | | | | | |
| | Net Assets: | |
| | Paid-in capital | | | 1,463,953,543 | | | | 800,958,414 | |
| | Undistributed (Distributions in excess of) net investment income, net of taxes | | | 4,064,651 | | | | (16,938,871 | ) |
| | Accumulated net realized gain (loss), net of taxes | | | (33,490,299 | ) | | | 16,729,096 | |
| | Net unrealized gain (loss), net of taxes | | | (191,911,039 | ) | | | 46,086,059 | |
| | NET ASSETS | | $ | 1,242,616,856 | | | $ | 846,834,698 | |
| | Shares Outstanding $0.001 par value (unlimited shares authorized): | | | 78,122,014 | | | | 44,130,160 | |
| | Net asset value | | | $15.91 | | | | $19.19 | |
| | |
| 18 | | The accompanying notes are an integral part of these financial statements. |
GOLDMAN SACHS CLOSED-END FUNDS
Statements of Operations
For the Fiscal Year Ended November 30, 2014
| | | | | | | | | | |
| | | | | MLP and Energy
Renaissance Fund(a) | | | MLP Income
Opportunities Fund | |
| | Investment income: | |
| | Dividends — unaffiliated issuers (Includes tax withheld of $294,619, and $0) | | $ | 31,378,771 | | | $ | 69,398,959 | |
| | Dividends — affiliated issuers and funds | | | 2,757,569 | | | | 6,838,633 | |
| | Less: return of capital on dividends | | | (25,620,370 | ) | | | (60,827,275 | ) |
| | Total investment income | | | 8,515,970 | | | | 15,410,317 | |
| | | | | | | | | | |
| | Expenses: | |
| | Management fees | | | 2,949,912 | | | | 11,593,540 | |
| | Interest on borrowings | | | 636,823 | | | | 3,101,242 | |
| | Professional fees | | | 118,226 | | | | 670,199 | |
| | Trustee fees | | | 50,000 | | | | 156,250 | |
| | Amortization of deferred financing costs | | | 42,534 | | | | 147,613 | |
| | Printing and mailing costs | | | 33,000 | | | | 87,379 | |
| | Custody, accounting and administrative services | | | 20,887 | | | | 103,816 | |
| | Transfer Agent fees | | | 3,165 | | | | 24,304 | |
| | Other | | | 16,916 | | | | 234,262 | |
| | Total operating expenses, before taxes and expense reductions | | | 3,871,463 | | | | 16,118,605 | |
| | Less — expense reductions | | | (9,114 | ) | | | — | |
| | Net operating expenses, after expense reductions but before taxes | | | 3,862,349 | | | | 16,118,605 | |
| | NET INVESTMENT INCOME (LOSS), BEFORE TAXES | | | 4,653,621 | | | | (708,288 | ) |
| | Current tax (expense)/benefit | | | (588,970 | ) | | | 763,167 | |
| | Deferred tax expense | | | — | | | | (25,274 | ) |
| | NET INVESTMENT INCOME, NET OF TAXES | | | 4,064,651 | | | | 29,605 | |
| | | | | | | | | | |
| | Realized and unrealized gain (loss) from transactions: | |
| | Net realized gain (loss) from: | | | | | | | | |
| | Investments — unaffiliated issuers | | | (33,070,600 | ) | | | 26,286,845 | |
| | Investments — affiliated issuers | | | — | | | | 471,146 | |
| | Foreign currency transactions | | | (419,699 | ) | | | — | |
| | Current tax expense | | | — | (b) | | | (10,038,490 | ) |
| | Deferred tax benefit | | | — | (b) | | | 9,595 | |
| | Net change in unrealized gain (loss) on: | | | | | | | | |
| | Investments — unaffiliated issuers | | | (133,750,854 | ) | | | 73,188,090 | |
| | Investments — affiliated issuers | | | (58,151,130 | ) | | | 523,377 | |
| | Foreign currency translation | | | (9,055 | ) | | | — | |
| | Deferred tax expense | | | — | (b) | | | (27,627,063 | ) |
| | Net realized and unrealized gain (loss), net of taxes | | | (225,401,338 | ) | | | 62,813,500 | |
| | NET INCREASE (DECREASE) IN NET ASSETS RESULTING FROM OPERATIONS | | $ | (221,336,687 | ) | | $ | 62,843,105 | |
| | (a) | | Commenced operations on September 26, 2014. |
| | (b) | | The net tax benefit was fully offset by a 100% valuation allowance recorded as of November 30, 2014. |
| | |
| The accompanying notes are an integral part of these financial statements. | | 19 |
GOLDMAN SACHS MLP AND ENERGY RENAISSANCE FUND
Statement of Changes in Net Assets
For the Period Ended November 30, 2014(a)
| | | | | | |
| | | | | | |
| | From operations: | | | | |
| | Net investment income, net of taxes | | $ | 4,064,651 | |
| | Net realized loss, net of taxes | | | (33,490,299 | ) |
| | Net change in unrealized loss, net of taxes | | | (191,911,039 | ) |
| | Net decrease in net assets resulting from operations | | | (221,336,687 | ) |
| | | | | | |
| | Distributions to shareholders: | | | | |
| | From return of capital | | | (24,986,048 | ) |
| | | | | | |
| | From share transactions: | | | | |
| | Proceeds from sales of common shares | | | 1,491,254,733 | |
| | Reinvestment of distributions | | | 707,905 | |
| | Offering costs charged to paid-in capital | | | (3,123,047 | ) |
| | Net increase in net assets resulting from share transactions | | | 1,488,839,591 | |
| | TOTAL INCREASE | | | 1,242,516,856 | |
| | | | | | |
| | Net assets: | | | | |
| | Beginning of period | | $ | 100,000 | |
| | End of period | | $ | 1,242,616,856 | |
| | Undistributed net investment income, net of taxes | | $ | 4,064,651 | |
| | (a) | | Commenced operations on September 26, 2014. |
| | |
| 20 | | The accompanying notes are an integral part of these financial statements. |
GOLDMAN SACHS MLP INCOME OPPORTUNITIES FUND
Statements of Changes in Net Assets
| | | | | | | | | | |
| | | | | For the Fiscal
Year Ended
November 30, 2014 | | | For the Period Ended
November 30, 2013(a) | |
| | From operations: | |
| | Net investment income (loss), net of taxes | | $ | 29,605 | | | $ | (203,208 | ) |
| | Net realized gain, net of taxes | | | 16,729,096 | | | | — | |
| | Net change in unrealized gain, net of taxes | | | 46,084,404 | | | | 1,655 | |
| | Net increase (decrease) in net assets resulting from operations | | | 62,843,105 | | | | (201,553 | ) |
| | | | | | | | | | |
| | Distributions to shareholders: | |
| | From net investment income | | | (16,765,268 | ) | | | — | |
| | From return of capital | | | (40,162,638 | ) | | | — | |
| | Total distributions to shareholders | | | (56,927,906 | ) | | | — | |
| | | | | | | | | | |
| | From share transactions: | |
| | Proceeds from sales of common shares | | | 53,669,549 | | | | 789,116,500 | |
| | Offering costs charged to paid-in capital | | | (112,397 | ) | | | (1,652,600 | ) |
| | Net increase in net assets resulting from share transactions | | | 53,557,152 | | | | 787,463,900 | |
| | TOTAL INCREASE | | | 59,472,351 | | | | 787,262,347 | |
| | | | | | | | | | |
| | Net assets: | |
| | Beginning of year | | | 787,362,347 | | | | 100,000 | |
| | End of year | | $ | 846,834,698 | | | $ | 787,362,347 | |
| | Distributions in excess of net investment income, net of taxes | | $ | (16,938,871 | ) | | $ | (203,208 | ) |
| | (a) | | Commenced operations on November 26, 2013. |
| | |
| The accompanying notes are an integral part of these financial statements. | | 21 |
GOLDMAN SACHS MLP AND ENERGY RENAISSANCE FUND
Statement of Cash Flows
For the Period Ended November 30, 2014(a)
| | | | | | |
| | | | | | |
| | Increase/(Decrease) in cash — Cash flows from operating activities: | | | | |
| | Net decrease in net assets from operations | | $ | (221,336,687 | ) |
| | Adjustments to reconcile net increase in net assets from operations to net cash received from/(used in) operating activities: | | | | |
| | Purchase of investment securities | | | (2,304,799,353 | ) |
| | Proceeds from disposition of investment securities | | | 449,726,054 | |
| | Proceeds from merger | | | 5,580,000 | |
| | Purchase of short term investment securities, net | | | (151,657,333 | ) |
| | Net realized loss from investment securities | | | 33,070,600 | |
| | Net change in unrealized loss on investment securities | | | 191,901,984 | |
| | Increase in dividends and interest receivable | | | (2,945,833 | ) |
| | Increase in receivables for investments sold | | | (67,603,512 | ) |
| | Increase in other assets | | | (3,910 | ) |
| | Increase in deferred financing costs | | | (302,466 | ) |
| | Increase in payable for investments purchased | | | 124,741,305 | |
| | Increase in management fees payable | | | 1,512,837 | |
| | Increase in interest on borrowings payable | | | 573,672 | |
| | Increase in offering costs | | | 1,051,032 | |
| | Increase in accrued expenses and other liabilities | | | 421,509 | |
| | Increase in Federal Income tax payable | | | 555,632 | |
| | Increase in State and Local income tax payable | | | 33,338 | |
| | Increase in return of capital on dividends | | | 25,620,370 | |
| | Net cash used in operating activities | | | (1,913,860,761 | ) |
| | | | | | |
| | Cash flows from financing activities: | | | | |
| | Increase in borrowings on credit facility payable | | | 450,000,000 | |
| | Proceeds from sales of common shares | | | 1,491,254,733 | |
| | Cash distributions paid | | | (24,278,143 | ) |
| | Offering costs charged to paid-in capital | | | (3,123,047 | ) |
| | Net cash provided by from financing activities | | | 1,913,853,543 | |
| | NET DECREASE IN CASH | | $ | (7,218 | ) |
| | | | | | |
| | Cash: | | | | |
| | Beginning of period | | $ | 100,000 | |
| | End of period | | $ | 92,782 | |
| | Supplemental disclosure | | | | |
| | Cash paid for interest and related fees | | $ | 63,151 | |
| | Reinvestment of distributions | | $ | 707,905 | |
| | (a) | | Commenced operations on September 26, 2014. |
| | |
| 22 | | The accompanying notes are an integral part of these financial statements. |
GOLDMAN SACHS MLP INCOME OPPORTUNITIES FUND
Statement of Cash Flows
For the Fiscal Year Ended November 30, 2014
| | | | | | |
| | | | | | |
| | Increase/(Decrease) in cash — Cash flows from operating activities: | |
| | Net increase in net assets from operations | | $ | 62,843,105 | |
| | Adjustments to reconcile net increase in net assets from operations to net cash received from/(used in) operating activities: | | | | |
| | Purchase of investment securities | | | (1,710,892,019 | ) |
| | Proceeds from disposition of investment securities | | | 615,384,589 | |
| | Sale of short term investment securities, net | | | 789,216,500 | |
| | Net realized gain from investment securities | | | (26,757,991 | ) |
| | Net change in unrealized gain on investment securities | | | (73,711,467 | ) |
| | Increase in dividends receivable | | | (180,883 | ) |
| | Increase in receivables for investments sold | | | (2,225,919 | ) |
| | Increase in prepaid Federal income tax | | | (4,096,843 | ) |
| | Increase in prepaid State and Local income tax | | | (970,834 | ) |
| | Increase in other assets | | | (198,095 | ) |
| | Increase in deferred financing costs | | | (97,387 | ) |
| | Decrease in payable for investments purchased | | | (176,470 | ) |
| | Decrease in amounts owed to affiliates | | | (7,723,314 | ) |
| | Increase in interest on borrowings payable | | | 291,202 | |
| | Decrease in accrued expenses and other liabilities | | | (1,055,804 | ) |
| | Increase in deferred tax, net | | | 27,642,741 | |
| | Increase in return of capital on dividends | | | 60,827,275 | |
| | Net cash used in operating activities | | | (271,881,614 | ) |
| | | | | | |
| | Cash flows from financing activities: | |
| | Increase in borrowings on credit facility payable | | | 301,000,000 | |
| | Proceeds from sales of common shares | | | 53,669,549 | |
| | Cash distributions paid | | | (56,927,906 | ) |
| | Offering costs charged to paid-in capital | | | (112,397 | ) |
| | Net cash provided by from financing activities | | | 297,629,246 | |
| | NET INCREASE IN CASH | | $ | 25,747,632 | |
| | | | | | |
| | Cash: | |
| | Beginning of year | | $ | — | |
| | End of year | | $ | 25,747,632 | |
| | Supplemental disclosure | | | | |
| | Cash paid for interest and related fees | | $ | 2,810,040 | |
| | |
| The accompanying notes are an integral part of these financial statements. | | 23 |
GOLDMAN SACHS MLP AND ENERGY RENAISSANCE FUND
Financial Highlights
Selected Data for a Share Outstanding Throughout the Period
| | | | | | | | | | | | | | | | | | | | | | | | | | |
| | | | | | | | From
investment operations | | | | | | | |
| | | Year - Share Class | | Net asset
value,
beginning
of period | | | Net
investment
income(a) | | | Net realized and unrealized loss | | | Total from
investment
operations | | | Distributions
to shareholders
from return of
capital | | | Offering
costs | |
| | FOR THE PERIOD ENDED NOVEMBER 30, | |
| | 2014 - Common Shares(h) | | $ | 19.10 | | | $ | 0.05 | | | $ | (2.88 | ) | | $ | (2.83 | ) | | $ | (0.32 | ) | | $ | (0.04 | ) |
| | (a) | | Calculated based on the average shares outstanding methodology. |
| | (b) | | Total returns are calculated assuming purchase of a share at the market price or NAV on the first day and sale of a share at the market price or NAV on the last day of the period reported. Dividends and distributions, if any, are assumed, for purposes of this calculation, to be reinvested at prices obtained under the Fund’s dividend reinvestment plan. Total return does not reflect brokerage commissions or sales charges in connection with the purchase or sales charges in connection with the purchase or sale of Fund shares. Total returns for periods less than one full year are not annualized. |
| | (c) | | Annualized with the exception of tax expenses. |
| | (d) | | Current tax estimate for the ratio calculation is derived from the net investment income (loss), and realized and unrealized gains (losses). |
| | (e) | | Current tax estimate for the ratio calculation is derived from net investment income (loss) only. |
| | (f) | | The Fund’s portfolio turnover rate is calculated in accordance with regulatory requirements, without regard to transactions involving short term investments and certain derivatives. If such transactions were included, the Fund’s portfolio turnover rate may be higher. |
| | (g) | | Calculated by dividing the Fund’s Managed Assets by the amount of borrowings outstanding under the credit facility at period end. |
| | (h) | | Commenced operations on September 26, 2014. |
| | |
| 24 | | The accompanying notes are an integral part of these financial statements. |
GOLDMAN SACHS MLP AND ENERGY RENAISSANCE FUND
| | | | | | | | | | | | | | | | | | | | | | | | | | | | | | | | | | | | | | | | | | | | | | | | | | | | | | | | | | | | | | | | |
| | | | | | | | | | | | | Total returns(b) | | | | | | | | | | Ratio of expenses to average net assets(c) | | | | | | | | | | | | | | | | |
| | | Net asset
value, end
of period | | | | | Market
price, end
of period | | | | | Based on
market
price | | | | | Based on
net asset
value | | | | | Net assets,
end of
period
(in 000s) | | | | | Before interest
expense
and
tax benefit/
(expenses) | | | | | After interest
expense and before
tax benefit/
(expenses) | | | | | After interest
expense
and
tax benefit/
(expenses)(d) | | | | | Ratio of
net investment
income
to average
net assets(c)(e) | | | | | Portfolio
turnover
rate(f) | | | | | Asset coverage, end of period per $1,000(g) | |
| | | | | | | | | | | | | | | | | | | | | | | | | | | | | | | | | | | | | | | | | | | | | | | | | | | | | | | | | | | | | | | | |
| | $ | 15.91 | | | | | $ | 17.11 | | | | | | (8.77)% | | | | | | (15.28)% | | | | | $ | 1,242,617 | | | | | | 1.30 | % | | | | | 1.60 | % | | | | | 1.65 | % | | | | | 1.69 | % | | | | | 36 | % | | | | $ | 3,761 | |
| | |
| The accompanying notes are an integral part of these financial statements. | | 25 |
GOLDMAN SACHS MLP INCOME OPPORTUNITIES FUND
Financial Highlights
Selected Data for a Share Outstanding Throughout Each Period
| | | | | | | | | | | | | | | | | | | | | | | | | | | | | | | | | | |
| | | | | | | | From
investment operations | | | Distributions
to shareholders | | | | |
| | | Year - Share Class | | Net asset
value,
beginning
of period | | | Net
investment
income(a) | | | Net realized
and unrealized
gain | | | Total from
investment
operations | | | From net
investment
income | | | From
capital | | | Total
distributions | | | Offering
costs | |
| | FOR THE FISCAL YEAR ENDED NOVEMBER 30, | |
| | 2014 - Common Shares | | $ | 19.06 | | | $ | — | (g) | | $ | 1.42 | | | $ | 1.42 | | | $ | (0.38 | ) | | | (0.91 | ) | | $ | (1.29 | ) | | $ | — | (g) |
| | | | | | | | | | | | | | | | | | | | | | | | | | | | | | | | | | |
| | FOR THE PERIOD ENDED NOVEMBER 30, | |
| | 2013 - Common Shares(h) | | | 19.10 | | | | — | (g) | | | — | (g) | | | — | | | | — | | | | — | | | | — | | | | (0.04 | ) |
| | (a) | | Calculated based on the average shares outstanding methodology. |
| | (b) | | Total returns are calculated assuming purchase of a share at the market price or NAV on the first day and sale of a share at the market price or NAV on the last day of the period reported. Dividends and distributions, if any, are assumed, for purposes of this calculation, to be reinvested at prices obtained under the Fund’s dividend reinvestment plan. Total return does not reflect brokerage commissions or sales charges in connection with the purchase or sale of Fund shares. Total returns for periods less than one full year are not annualized. |
| | (c) | | Current and deferred tax expense/benefit for the ratio calculation is derived from the net investment income (loss), and realized and unrealized gains (losses). |
| | (d) | | Current and deferred tax expense/benefit for the ratio calculation is derived from net investment income (loss) only. |
| | (e) | | The Fund’s portfolio turnover rate is calculated in accordance with regulatory requirements, without regard to transactions involving short term investments and certain derivatives. If such transactions were included, the Fund’s portfolio turnover rate may be higher. |
| | (f) | | Calculated by dividing the Fund’s Managed Assets by the amount of borrowings outstanding under the credit facility at period end. |
| | (g) | | Amount is less than $0.005 per share. |
| | (h) | | Commenced operations on November 26, 2013. |
| | (i) | | Annualized with the exception of tax expenses. |
| | (j) | | Amount is less than 0.005% per share. |
| | |
| 26 | | The accompanying notes are an integral part of these financial statements. |
GOLDMAN SACHS MLP INCOME OPPORTUNITIES FUND
| | | | | | | | | | | | | | | | | | | | | | | | | | | | | | | | | | | | | | | | | | | | | | | | | | | | | | | | | | | | | | | | |
| | | | | | | | | | | | | Total returns(b) | | | | | | | | | | Ratio of expenses to average net assets | | | | | | | | | | | | | | | | |
| | | Net asset
value, end
of period | | | | | Market
price, end
of period | | | | | Based on market
price | | | | | Based on
net asset
value | | | | | Net assets,
end of
period
(in 000s) | | | | | Before interest
expense and tax benefit/
(expenses) | | | | | After interest
expense
and before
tax benefit/
(expenses) | | | | | After interest
expense and
tax benefit/
(expenses)(c) | | | | | Ratio of
net investment
income/(loss)
to average
net assets(d) | | | | | Portfolio
turnover
rate(e) | | | | | Asset
coverage,
end of
period
per $1,000(f) | |
| | | | | | | | | | | | | | | | | | | | | | | | | | | | | | | | | | | | | | | | | | | | | | | | | | | | | | | | | | | | | | | | |
| | $ | 19.19 | | | | | $ | 18.74 | | | | | | (0.14 | )% | | | | | 7.31 | % | | | | $ | 846,835 | | | | | | 1.41 | % | | | | | 1.75 | % | | | | | 5.76 | % | | | | | — | (j) | | | | | 54 | % | | | | $ | 3,813 | |
| | | | | | | | | | | | | | | | | | | | | | | | | | | | | | | | | | | | | | | | | | | | | | | | | | | | | | | | | | | | | | | | |
| | | | | | | | | | | | | | | | | | | | | | | | | | | | | | | | | | | | | | | | | | | | | | | | | | | | | | | | | | | | | | | | |
| | | 19.06 | | | | | | 20.00 | | | | | | 4.71 | | | | | | (0.21 | ) | | | | | 787,362 | | | | | | 1.11 | (i) | | | | | 1.11 | (i) | | | | | 1.11 | (i) | | | | | (1.11 | )(i) | | | | | — | | | | | | — | |
| | |
| The accompanying notes are an integral part of these financial statements. | | 27 |
GOLDMAN SACHS CLOSED-END FUNDS
Notes to Financial Statements
November 30, 2014
The Goldman Sachs MLP and Energy Renaissance Fund, and the Goldman Sachs MLP Income Opportunities Fund (each, a “Fund” and collectively, the “Funds”) are non-diversified, closed-end management investment companies registered under the Investment Company Act of 1940, as amended (the “1940 Act”) and the Securities Act of 1933 as amended (the “1933 Act”). The Goldman Sachs MLP and Energy Renaissance Fund was organized as a Delaware statutory trust on July 7, 2014, and the Goldman Sachs MLP Income Opportunities Fund was organized as a Delaware statutory trust on June 18, 2013. The shares of the Goldman Sachs MLP and Energy Renaissance Fund, and the Goldman Sachs MLP Income Opportunities Fund are listed on the New York Stock Exchange (“NYSE”) and trade under the symbols “GER” and “GMZ”, respectively.
The Goldman Sachs MLP and Energy Renaissance Fund commenced operations on September 26, 2014. Prior to its commencement of operations, the Fund had no operating history other than the sale to Goldman Sachs Group, Inc. of an aggregate of 5,236 Common Shares for $100,000 related to the Fund’s organization. The Goldman Sachs MLP and Energy Renaissance Fund issued 70,000,000 shares of common stock in its initial public offering (“IPO”). These shares were issued at $20.00 per share. The Goldman Sachs MLP Income Opportunities Fund commenced operations on November 26, 2013.
Goldman Sachs Asset Management, L.P. (“GSAM”), an affiliate of Goldman, Sachs & Co., serves as investment adviser to each Fund pursuant to each Fund’s respective management agreement (each, an “Agreement”).
|
| 2. SIGNIFICANT ACCOUNTING POLICIES |
The financial statements have been prepared in accordance with accounting principles generally accepted in the United States of America (“GAAP”) and require management to make estimates and assumptions that may affect the reported amounts and disclosures. Actual results may differ from those estimates and assumptions.
A. Investment Valuation — The Funds’ valuation policy is to value investments at fair value.
B. Investment Income and Investments — Investment income includes interest income and dividend income, net of any foreign withholding taxes, less any amounts reclaimable. Interest income is accrued daily and adjusted for amortization of premiums and accretion of discounts. Dividend income is recognized on ex-dividend date or, for certain foreign securities, as soon as such information is obtained subsequent to the ex-dividend date. Investment transactions are reflected on trade date. Realized gains and losses are calculated using the average cost method for partnership investments and the First In First Out method for all other investments. Investment transactions are recorded on the following business day for daily net asset value (“NAV”) calculations. Distributions from Master Limited Partnerships (“MLPs”) are generally recorded based on the characterization reported on the Fund’s schedule K-1 received from the MLPs. The Funds record their pro-rata share of the income/loss and capital gains/losses, allocated from the underlying partnerships and adjust the cost basis of the underlying partnerships accordingly.
C. Expenses — Expenses incurred by the Funds, which may not specifically relate to the Funds, may be shared with other registered investment companies having management agreements with GSAM or its affiliates, as appropriate. These expenses are allocated to the Funds on a straight-line and/or pro-rata basis depending upon the nature of the expenses and are accrued daily.
D. Offering and Organization Costs — Offering costs of $0.04 per share were offset against paid-in-capital in excess of par on the date of commencement of operations as well as the date the underwriters exercised an option to purchase additional Common Shares (“shares”). Organization costs paid in connection with the organization of the Funds and offering expenses (other than sales load) that exceed $0.04 per share were borne by GSAM.
E. Distributions to Shareholders — Over the long term, the Funds make distributions to their shareholders each fiscal quarter at a rate that is approximately equal to the distributions the Funds receive from the MLPs and other securities in which they invest, less any operating expenses incurred by the Funds. To permit the Funds to maintain more stable quarterly distributions, the distributions for any particular quarterly period may be more or less than the amount of net investment income actually earned by the Funds. The Funds estimate that only a portion of the distributions paid to shareholders will be treated as dividend income. The remaining portion of the Funds’ distribution, which may be significant, is expected to be a return of capital. These estimates are based on the Funds’ operating results during the period, and their final federal income tax characterization may differ.
28
GOLDMAN SACHS CLOSED-END FUNDS
|
| 2. SIGNIFICANT ACCOUNTING POLICIES (continued) |
The characterization of distributions to shareholders for financial reporting purposes is determined in accordance with federal income tax rules, which may differ from GAAP. Certain components of the Funds’ net assets on the Statements of Assets and Liabilities reflect permanent GAAP/Tax differences based on the appropriate tax character.
F. Income Taxes — The Funds do not intend to qualify as regulated investment companies pursuant to Subchapter M of the Internal Revenue Code, but will rather be taxed as corporations. As a result, the Funds are obligated to pay federal, state and local income tax on their taxable income.
The Funds invest primarily in MLPs, which generally are treated as partnerships for federal income tax purposes. As a limited partner in the MLPs, the Funds must report their allocable share of the MLPs’ taxable income or loss in computing their own taxable income or loss. The Funds’ tax expense or benefit is included in the Statements of Operations based on the component of income or gains/losses to which such expense or benefit relates. Deferred income taxes reflect the net tax effects of temporary differences between the carrying amounts of assets and liabilities for financial reporting purposes and the amounts used for income tax purposes. Such temporary differences are principally: (i) taxes on unrealized gains/losses, which are attributable to the temporary difference between fair market value and tax basis, (ii) the net tax effects of temporary differences between the carrying amounts of assets and liabilities for financial reporting and income tax purposes, and (iii) the net tax benefit of accumulated net operating losses and capital loss carryforwards. The Funds will accrue a deferred income tax liability balance, at the currently effective statutory United States (“U.S.”) federal income tax rate (currently 35%) plus an estimated state and local income tax rate, for their future tax liability associated with the capital appreciation of their investments and the distributions received by the Funds on interests of MLPs considered to be return of capital and for any net operating gains. The Funds may also record a deferred tax asset balance, which reflects an estimate of the Funds’ future tax benefit associated with net operating losses and/or unrealized losses.
To the extent the Funds have a deferred tax asset, consideration is given to whether or not a valuation allowance, which would offset the value of some or all of the deferred tax asset balance, is required. A valuation allowance is required if based on the evaluation criterion provided by Accounting Standards Codification (“ASC”) 740, Income Taxes (ASC 740) it is more likely than not that some portion, or all, of the deferred tax asset will not be realized. The factors considered in assessing the Funds’ valuation allowance include: the nature, frequency and severity of current and cumulative losses, the duration of the statutory carryforward periods and the associated risks that operating and capital loss carryforwards may expire unutilized. From time to time, as new information becomes available, the Funds will modify their estimates or assumptions regarding the deferred tax liability or asset.
Unexpected significant decreases in cash distributions from the Funds’ MLP investments or significant declines in the fair value of their investments may change the Funds’ assessment regarding the recoverability of their deferred tax assets and may result in a valuation allowance. If a valuation allowance is required to reduce any deferred tax asset in the future, it could have a material impact on the Funds’ NAV and results of operations in the period it is recorded. The Funds will rely to some extent on information provided by MLPs, which may not be provided to the Funds on a timely basis, to estimate operating income/loss and gains/losses and current taxes and deferred tax liabilities and/or asset balances for purposes of daily reporting of net asset values and financial statement reporting.
It is the Funds’ policy to classify interest and penalties associated with underpayment of federal and state income taxes, if any, as income tax expense on their Statements of Operations. The Funds anticipate filing income tax returns in the U.S. federal jurisdiction and various states, and such returns are subject to examination by the tax jurisdictions. The Funds have reviewed all major jurisdictions and concluded that there is no significant impact on their net assets and no tax liability resulting from unrecognized tax benefits or expenses relating to uncertain tax positions expected to be taken on their tax returns.
Return of Capital Estimates — Distributions received from the Funds’ investments in MLPs generally are comprised of income and return of capital. The Funds record investment income and return of capital based on estimates made at the time such distributions are received. Such estimates are based on historical information available from each MLP and other industry sources. These estimates may subsequently be revised based on information received from MLPs after their tax reporting periods are concluded.
29
GOLDMAN SACHS CLOSED-END FUNDS
Notes to Financial Statements (continued)
November 30, 2014
|
| 3. INVESTMENTS AND FAIR VALUE MEASUREMENTS |
The fair value of a financial instrument is the amount that would be received to sell an asset or paid to transfer a liability in an orderly transaction between market participants at the measurement date (i.e., the exit price). GAAP establishes a fair value hierarchy that prioritizes the inputs to valuation techniques used to measure fair value. The hierarchy gives the highest priority to unadjusted quoted prices in active markets for identical assets or liabilities (Level 1 measurements) and the lowest priority to unobservable inputs (Level 3 measurements). The levels used for classifying investments are not necessarily an indication of the risk associated with investing in these investments. The three levels of the fair value hierarchy are described below:
Level 1 — Unadjusted quoted prices in active markets that are accessible at the measurement date for identical, unrestricted assets or liabilities;
Level 2 — Quoted prices in markets that are not active or financial instruments for which significant inputs are observable (including, but not limited to, quoted prices for similar investments, interest rates, foreign exchange rates, volatility and credit spreads), either directly or indirectly;
Level 3 — Prices or valuations that require significant unobservable inputs (including GSAM’s assumptions in determining fair value measurement).
The Trustees have adopted Valuation Procedures that govern the valuation of the portfolio investments held by the Funds, including investments for which market quotations are not readily available. The Trustees have delegated to GSAM day-to-day responsibility for implementing and maintaining internal controls and procedures related to the valuation of the Funds’ portfolio investments. To assess the continuing appropriateness of pricing sources and methodologies, GSAM regularly performs price verification procedures and issues challenges as necessary to third party pricing vendors or brokers, and any differences are reviewed in accordance with the Valuation Procedures.
A. Level 1 and Level 2 Fair Value Investments — The valuation techniques and significant inputs used in determining the fair values for investments classified as Level 1 and Level 2 are as follows:
Equity Securities — Equity securities and investment companies traded on a U.S. securities exchange or the NASDAQ system, or those located on certain foreign exchanges, including but not limited to the Americas, are valued daily at their last sale price or official closing price on the principal exchange or system on which they are traded. If no sale occurs, equity securities and exchange traded investment companies are valued at the last bid price for long positions and at the last ask price for short positions. Investments in investment companies (other than those that are exchange traded) are valued at the NAV on the valuation date. To the extent these investments are actively traded, they are classified as Level 1 of the fair value hierarchy, otherwise they are generally classified as Level 2.
Unlisted equity securities for which market quotations are available are valued at the last sale price on the valuation date, or if no sale occurs, at the last bid price. Securities traded on certain foreign securities exchanges are valued daily at fair value determined by an independent fair value service (if available) under Valuation Procedures approved by the Trustees and consistent with applicable regulatory guidance. The independent fair value service takes into account multiple factors including, but not limited to, movements in the securities markets, certain depositary receipts, futures contracts and foreign currency exchange rates that have occurred subsequent to the close of the foreign securities exchange. These investments are generally classified as Level 2 of the fair value hierarchy.
Subordinated Units and Private Investments — Subordinated units and private investments in public equities (“PIPEs”) are valued the same as other equity securities as noted above. A Liquidity Value Adjustment (LVA) may be applied to securities which are subject to transfer restrictions or which convert publicly traded securities in the future when certain conditions are met. Subordinated units and PIPEs are classified as Level 2 until such time as the transfer restriction is removed.
Investments in Money Market Funds — Investments in the Goldman Sachs Financial Square Money Market Fund are valued at the NAV of the Institutional Share class on the day of valuation. Because each Fund invests primarily in other mutual funds that fluctuate in value, the Funds’ shares will correspondingly fluctuate in value. These investments are generally classified as Level 1 of the fair value hierarchy.
30
GOLDMAN SACHS CLOSED-END FUNDS
|
| 3. INVESTMENTS AND FAIR VALUE MEASUREMENTS (continued) |
The Goldman Sachs Financial Square Money Market Fund may invest in debt securities which, if market quotations are readily available, are valued daily on the basis of quotations supplied by dealers or an independent pricing service approved by the Trustees. The pricing services may use valuation models or matrix pricing, which consider: (i) yield or price with respect to bonds that are considered comparable in characteristics such as rating, interest rate and maturity date or (ii) quotations from securities dealers to determine current value. Short-term debt obligations that mature in sixty days or less and that do not exhibit signs of credit deterioration are valued at amortized cost, which approximates fair value. With the exception of treasury securities, which are generally classified as Level 1, these investments are generally classified as Level 2 of the fair value hierarchy.
B. Level 3 Fair Value Investments — To the extent that the aforementioned significant inputs are unobservable, or if quotations are not readily available, or if GSAM believes that such quotations do not accurately reflect fair value, the fair value of the Funds’ investments may be determined under Valuation Procedures approved by the Trustees. GSAM, consistent with its procedures and applicable regulatory guidance, may make an adjustment to the most recent valuation prices of either domestic or foreign securities in light of significant events to reflect what it believes to be the fair value of the securities at the time of determining a Fund’s NAV. Significant events which could affect a large number of securities in a particular market may include, but are not limited to: significant fluctuations in U.S. or foreign markets; market dislocations; market disruptions; or unscheduled market closings. Significant events which could also affect a single issuer may include, but are not limited to: corporate actions such as reorganizations, mergers and buy-outs; ratings downgrades; and bankruptcies.
C. Fair Value Hierarchy — The following is a summary of the Funds’ investments and derivatives classified in the fair value hierarchy as of November 30, 2014:
| | | | | | | | | | | | |
|
| GOLDMAN SACHS MLP AND ENERGY RENAISSANCE FUND | |
| | | |
| Investment Type | | Level 1 | | | Level 2 | | | Level 3 | |
| Assets | | | | | | | | | | | | |
Common Stocks(a) | | | | | | | | | | | | |
MLP’s | | | | | | | | | | | | |
Europe | | $ | 26,305,972 | | | $ | — | | | $ | — | |
North America | | | 1,240,509,790 | | | | 73,879,305 | | | | — | |
Corporations | | | | | | | | | | | | |
Europe | | | 65,245,589 | | | | — | | | | — | |
North America | | | 192,959,689 | | | | — | | | | — | |
Investment Company | | | 151,657,333 | | | | — | | | | — | |
| Total | | $ | 1,676,678,373 | | | $ | 73,879,305 | | | $ | — | |
31
GOLDMAN SACHS CLOSED-END FUNDS
Notes to Financial Statements (continued)
November 30, 2014
|
| 3. INVESTMENTS AND FAIR VALUE MEASUREMENTS (continued) |
| | | | | | | | | | | | |
|
| GOLDMAN SACHS MLP INCOME OPPORTUNITIES FUND | |
| | | |
| Investment Type | | Level 1 | | | Level 2 | | | Level 3 | |
| Assets | | | | | | | | | | | | |
Common Stocks(a) | | | | | | | | | | | | |
MLP’s | | | | | | | | | | | | |
Europe | | $ | 36,122,985 | | | $ | — | | | $ | — | |
North America | | | 1,013,369,063 | | | | — | | | | — | |
Corporations | | | | | | | | | | | | |
Europe | | | 13,536,000 | | | | — | | | | — | |
North America | | | 80,914,690 | | | | — | | | | — | |
| Total | | $ | 1,143,942,738 | | | $ | — | | | $ | — | |
| (a) | | Amounts are disclosed by continent to highlight the impact of time zone differences between local market close and the calculation of net asset value. Security valuations are based on the principal exchange or system on which they are traded, which may differ from country of domicile. |
For further information regarding security characteristics, see the Schedules of Investments.
Currently, the highest marginal federal income tax rate for a corporation is 35%. The Funds may also be subject to a 20% alternative minimum tax to the extent that their alternative minimum tax exceeds their regular federal income tax. Total income taxes are computed by applying the federal statutory rate plus a blended state income tax rate. During the year ended November 30, 2014, the Goldman Sachs MLP Income Opportunities Fund re-evaluated its blended state income tax rate, increasing the rate from 2.18% to 2.48% due to anticipated state apportionment of income and gains. The Goldman Sachs MLP and Energy Renaissance Fund blended state income tax rate for the period ended November 30, 2014 was 2.10%.
The reconciliation between the federal statutory income tax rate of 35% and the effective tax rate on net investment income/ loss and realized and unrealized gain/loss is as follows:
| | | | | | | | |
| | |
| | | Goldman Sachs MLP and Energy Renaissance Fund | | | Goldman Sachs
MLP Income Opportunities Fund | |
Application of statutory income tax rate | | $ | (77,261,701 | ) | | $ | 34,855,755 | |
State income taxes, net of federal benefit | | | (4,691,276 | ) | | | 2,442,858 | |
Change in estimated state tax rate, net of federal tax benefit (expense) | | | — | | | | (604 | ) |
Effect of Permanent Differences | | | (926,241 | ) | | | (379,944 | ) |
| Total current and deferred income tax expense/(benefit), net | | $ | (82,879,218 | ) | | $ | 36,918,065 | |
32
GOLDMAN SACHS CLOSED-END FUNDS
At November 30, 2014, components of the Funds’ deferred tax assets and liabilities are as follows:
| | | | | | | | |
| | |
| | | Goldman Sachs
MLP and Energy Renaissance Fund | | | Goldman Sachs
MLP Income Opportunities Fund | |
Deferred tax assets: | | | | | | | | |
Net unrealized losses on investment securities (tax basis) | | $ | 71,517,415 | | | $ | — | |
Capital loss carryforward (tax basis) — Expiration — November 30, 2019 | | | 11,950,773 | | | | — | |
Valuation Allowance | | | (83,468,188 | ) | | | — | |
Total Deferred Tax assets | | | — | | | | — | |
| Deferred tax liabilities: | | | | | | | | |
Net unrealized gains on investment securities (tax basis) | | $ | — | | | $ | 27,642,741 | |
The Funds review the recoverability of their deferred tax assets based upon the weight of the available evidence. When assessing, the Funds’ management considers available carrybacks, reversing temporary taxable differences, and tax planning, if any. As a result of their analysis of the recoverability of their deferred tax assets, the Funds recorded the following valuation allowances as of November 30, 2014:
| | | | |
Goldman Sachs MLP and Energy Renaissance Fund | | $ | 83,468,188 | |
Goldman Sachs MLP Income Opportunities Fund | | $ | — | |
As of November 30, 2014, components of each Fund’s deferred tax expense are as follows:
| | | | | | | | |
| | |
| | | Goldman Sachs
MLP and Energy Renaissance Fund | | | Goldman Sachs
MLP Income Opportunities Fund | |
| Deferred tax expense: | | | | | | | | |
Federal | | $ | 78,743,573 | | | $ | 25,813,654 | |
State | | | 4,724,615 | | | | 1,829,087 | |
Valuation allowance | | $ | (83,468,188 | ) | | $ | — | |
| Total | | $ | — | | | $ | 27,642,741 | |
For the fiscal year ended November 30, 2014, the Funds do not have any interest or penalties associated with the underpayment of any income taxes.
At November 30, 2014, gross unrealized appreciation and depreciation of investments, based on cost for federal income tax purposes was as follows:
| | | | | | | | |
| | |
| | | Goldman Sachs
MLP and Energy Renaissance Fund | | | Goldman Sachs
MLP Income Opportunities Fund | |
Tax Cost | | $ | 1,943,317,936 | | | $ | 1,070,187,783 | |
Gross unrealized gain | | | 50,171,974 | | | | 154,025,842 | |
Gross unrealized loss | | | (242,932,232 | ) | | | (80,270,887 | ) |
Net unrealized gain (loss) | | $ | (192,760,258 | ) | | $ | 73,754,955 | |
Any difference between cost amounts for financial statement and federal income tax purposes is due primarily to wash sales and timing differences related to the tax treatment of partnership investments.
For the fiscal year ended November 30, 2014, the Goldman Sachs MLP and Energy Renaissance Fund’s distributions are estimated to be comprised of 100% return of capital and for the Goldman Sachs MLP Income Opportunities Fund, the distributions
33
GOLDMAN SACHS CLOSED-END FUNDS
Notes to Financial Statements (continued)
November 30, 2014
are estimated to be comprised of 29.45% from taxable income and 70.55% return of capital. Shareholders will be informed of the final tax characterization of the distributions in February 2015. The initial tax year is September 26, 2014 to November 30, 2014 for the Goldman Sachs MLP and Energy Renaissance Fund, for which it has not yet filed any tax returns, and is open for examination by U.S. and state tax authorities. For the Goldman Sachs MLP Income Opportunities Fund all tax years since inception remain open for examination by U.S. and state tax authorities. Management of the Funds is not aware of any tax positions for which it is reasonably possible that the total amounts of unrecognized tax benefits or expenses will significantly change in the next 12 months.
|
| 5. AGREEMENTS AND AFFILIATED TRANSACTIONS |
A. Management Agreement — Under each Fund’s Agreement, GSAM manages each Fund, subject to the general supervision of the Trustees. As compensation for the services rendered pursuant to the respective Agreement, the assumption of the expenses related thereto and administration of the Fund’s business affairs, including providing facilities, GSAM is entitled to a management fee, accrued daily and paid monthly, equal to an annual percentage rate of 1.00% of each Fund’s average daily managed assets for the fiscal year ended November 30, 2014. Managed assets are defined as total assets of the fund (including any assets attributable to borrowings for investment purposes) minus the sum of all accrued liabilities, (other than liabilities representing indebtedness for investment purposes).
B. Other Transactions with Affiliates — For the fiscal year ended November 30, 2014, Goldman Sachs did not earn any brokerage commissions from portfolio transactions on behalf of the Funds.
An investment by a fund representing greater than 5% of the voting securities of an issuer makes that issuer an affiliated person (as defined by the 1940 Act) of such fund. The following tables provide information about the investment in shares of issuers of which the Funds are affiliates for the fiscal year ended November 30, 2014:
| | | | | | | | | | | | | | | | | | | | | | | | | | |
| | | |
| Goldman Sachs MLP and Energy Renaissance Fund | | | | | | | | | | | | | |
| Name of Affiliated Issuer | | | | Number of
Shares Held
Beginning
of Period | | | Shares
Bought | | | Shares Sold | | | Number of
Shares Held End of Period | | | Value at End of Period | | | Dividend
Income | |
Emerge Energy Services LP | | | | | — | | | | 1,500,000 | | | | — | | | | 1,500,000 | | | $ | 96,225,000 | | | $ | 2,070,000 | |
JP Energy Partners LP | | | | | — | | | | 1,950,000 | | | | — | | | | 1,950,000 | | | | 28,470,000 | | | | — | |
Navios Maritime Midstream Partners LP | | | | | — | | | | 1,000,000 | | | | — | | | | 1,000,000 | | | | 13,090,000 | | | | — | |
QEP Midstream Partners LP | | | | | — | | | | 1,453,812 | | | | — | | | | 1,453,812 | | | | 23,333,683 | | | | 436,144 | |
Sprague Resources LP | | | | | — | | | | 527,520 | | | | — | | | | 527,520 | | | | 11,853,374 | | | | 229,568 | |
| | | | | | | | | | | | | | | | | | | | | | | | | | |
34
GOLDMAN SACHS CLOSED-END FUNDS
|
| 5. AGREEMENTS AND AFFILIATED TRANSACTIONS (continued) |
| | | | | | | | | | | | | | | | | | | | | | | | | | |
| | | |
| Goldman Sachs MLP Income Opportunities Fund | | | | | | | | | | | | | |
| Name of Affiliated Issuer | | | | Number of
Shares Held
Beginning
of Year | | | Shares
Bought | | | Shares Sold | | | Number of
Shares
Held End of Year | | | Value at End of Year | | | Dividend
Income | |
American Midstream Partners LP | | | | | — | | | | 1,462,521 | | | | (75,000 | ) | | | 1,387,521 | | | $ | 30,969,469 | | | $ | 2,043,926 | |
Compressco Partners LP | | | | | — | | | | 2,000,000 | | | | — | | | | 2,000,000 | | | | 40,860,000 | | | | 920,000 | |
CrossAmerica Partners LP | | | | | — | | | | 1,053,448 | | | | — | | | | 1,053,448 | | | | 34,774,318 | | | | 2,184,191 | |
Hoegh LNG Partners LP | | | | | — | | | | 2,330,985 | | | | — | | | | 2,330,985 | | | | 42,890,124 | | | | 427,411 | |
Sprague Resources LP | | | | | 500,000 | | | | 318,614 | | | | — | | | | 818,614 | | | | 18,394,257 | | | | 1,263,105 | |
As of November 30, 2014, the Goldman Sachs MLP and Energy Renaissance Fund was invested in the Institutional Shares of the Goldman Sachs Financial Square Money Market Fund. This Underlying Fund is considered to be affiliated with the Fund. GSAM has contractually agreed to waive irrevocably a portion of any underlying Fund’s management fee in an amount equal to the management fee paid to GSAM due to the Fund’s investment in several affiliated funds for which it also serves as investment advisor. For the period ended November 30, 2014, GSAM waived $9,114 of such Fund’s management fee. The table below shows the transactions in and earnings from investments in all affiliated funds for the fiscal year ended November 30, 2014:
| | | | | | | | | | | | | | | | | | | | |
| Underlying Fund | | Market
Value
9/26/14 | | | Purchases
at Cost | | | Proceeds
from Sales | | | Market
Value
11/30/14 | | | Dividend
Income | |
Goldman Sachs Financial Square Funds — Money Market Fund | | $ | — | | | $ | 1,354,697,647 | | | $ | (1,203,040,314 | ) | | $ | 151,657,333 | | | $ | 21,857 | |
Goldman Sachs Financial Square Funds — Government Fund | | $ | — | | | $ | 400,000,299 | | | $ | (400,000,299 | ) | | $ | — | | | $ | — | |
Goldman Sachs Financial Square Funds — Prime Obligations Fund | | $ | — | | | $ | 204,000,439 | | | $ | (204,000,439 | ) | | $ | — | | | $ | — | |
The Funds may purchase securities from, or sell securities to, an affiliated fund provided the affiliation is solely due to having a common investment adviser, common officers, or common trustees. For the fiscal year ended November 30, 2014, the purchase and sale transactions for the Goldman Sachs MLP and Energy Renaissance Fund and the Goldman Sachs MLP Income Opportunities Fund with an affiliated fund in compliance with Rule 17a-7 under the 1940 Act were $14,638,409 and $—, respectively.
C. Financing Agreements — On October 17, 2014, the Goldman Sachs MLP and Energy Renaissance Fund entered into a committed revolving line of credit facility, (the “Credit Facility”) with a major U.S. financial institution that expires on October 16, 2015. The Credit Facility provides for borrowings in an aggregate amount up to $670,000,000. Borrowings under the Credit Facility bear interest subject to the Fund’s election of variable rates (i.e. LIBOR or Federal Funds Rate) plus market spreads. The Fund pays an unused commitment fee of 0.10% when the loan is in excess of 85% of the $670,000,000 balance and 0.20% per annum at all other times. Interest is accrued daily and paid quarterly. Costs incurred in connection with obtaining the Credit Facility have been recorded as deferred financing costs on the Statement of Assets and Liabilities and are being amortized over the life of the Credit Facility. The average outstanding balance and weighted average annual interest rate for the period during which the Credit Facility was utilized during the period ended November 30, 2014 were $482,317,073 and 1.082%, respectively. As of November 30, 2014, there was $450,000,000 of outstanding borrowings under the Credit Facility at a weighted average annual interest rate of 1.081%.
On December 19, 2013, the Goldman Sachs MLP Income Opportunities Fund entered into a committed revolving line of credit facility, (the “Credit Facility”) with a major financial institution. The Credit facility was amended on July 28, 2014 and expires on July 28, 2015. The Credit Facility provides for borrowings in an aggregate amount up to $395,000,000. Borrowings
35
--
GOLDMAN SACHS CLOSED-END FUNDS
Notes to Financial Statements (continued)
November 30, 2014
|
| 5. AGREEMENTS AND AFFILIATED TRANSACTIONS (continued) |
under the Credit Facility bear interest subject to the Fund’s election of variable rates (i.e. LIBOR or Federal Funds Rate) plus market spreads. The Fund pays an unused commitment fee of 0.35% per annum. Interest is accrued daily and paid quarterly. Costs incurred in connection with obtaining the Credit Facility have been recorded as deferred financing costs on the Statement of Assets and Liabilities and are being amortized over the life of the Credit Facility. The average outstanding balance and weighted average annual interest rate for the period during which the Credit Facility was utilized during the fiscal year ended November 30, 2014 were $252,963,930 and 1.085%, respectively. As of November 30, 2014, there was $301,000,000 of outstanding borrowings under the Credit Facility at a weighted average annual interest rate of 1.084%.
|
| 6. PORTFOLIO SECURITIES TRANSACTIONS |
The cost of purchases and proceeds from sales and maturities of long-term securities for the fiscal year ended November 30, 2014, were as follows:
| | | | | | | | | | |
| Fund | | | | Purchases | | | Sales | |
Goldman Sachs MLP and Energy Renaissance | | | | $ | 2,304,799,353 | | | $ | 449,726,054 | |
Goldman Sachs MLP Income Opportunities | | | | | 1,710,892,019 | | | | 615,384,538 | |
The Funds’ risks include, but are not limited to, the following:
Foreign Custody Risk — A Fund that invests in foreign securities may hold such securities and foreign currency with foreign
banks, agents, and securities depositories appointed by the Fund’s custodian (each a “Foreign Custodian”). In some countries,
Foreign Custodians may be subject to little or no regulatory oversight or independent evaluation of their operations. Further, the
laws of certain countries may place limitations on a Fund’s ability to recover its assets if a Foreign Custodian enters into
bankruptcy.
Investments in Other Investment Companies — As a shareholder of another investment company, including an exchange traded fund (“ETF”), a Fund will directly bear its proportionate share of any net management fees and other expenses paid by such other investment companies, in addition to the fees and expenses regularly borne by the Fund. ETFs are subject to risks that do not apply to conventional mutual funds, including but not limited to the following: (i) the market price of the ETF’s shares may trade at a premium or a discount to their NAV; and (ii) an active trading market for an ETF’s shares may not develop or be maintained.
Leverage Risk — The use of leverage creates an opportunity for increased net investment income dividends, but also creates risks for the investors. There is no assurance that each Fund’s intended leveraging strategy will be successful. Leverage involves risks and special considerations, including the likelihood of greater volatility of NAV, market price and dividend rate than a comparable portfolio without leverage; the risk that fluctuations in interest rates on borrowings and short-term debt or in the interest or dividend rates on any leverage that a Fund must pay will reduce the Fund’s return; the effect of leverage in a declining market, which is likely to cause a greater decline in the NAV than if the Fund was not leveraged, which may result in a greater decline in the market price; the investment advisory fees payable to the Investment Adviser will be higher than if the Fund did not use financial leverage; and that leverage may increase operating costs, which may reduce total return.
Liquidity Risk — The Funds may make investments, including MLPs, that are illiquid or that may become less liquid in response to market developments or adverse investor perceptions. Illiquid investments may be more difficult to value.
Market and Credit Risks — An investment in a Fund represents an indirect investment in the securities owned by the Fund, a significant portion of which are traded on a national securities exchange. The value of these securities, like other investments, may move up or down, sometimes rapidly and unpredictably. Each Fund will utilize leverage, which magnifies the market risk.
36
GOLDMAN SACHS CLOSED-END FUNDS
|
| 7. OTHER RISKS (continued) |
Additionally, a Fund may also be exposed to credit risk in the event that an issuer fails to perform or that an institution or entity with which the Fund has unsettled or open transactions defaults.
Market Discount Risk — Shares of closed-end investment companies frequently trade at a discount from their NAV. This characteristic is a risk separate and distinct from the risk that a Fund’s NAV could decrease as a result of its investment activities and may be greater for investors expecting to sell their shares in a relatively short period of time following completion of the Fund’s initial offering. Although the value of a Fund’s net assets is generally considered by market participants in determining whether to purchase or sell shares, whether investors will realize gains or losses upon the sale of their shares will depend entirely upon whether the market price of the shares at the time of sale is above or below the investor’s adjusted tax cost basis for the shares. Because the market price of the shares will be determined by factors such as (i) NAV, (ii) dividend and distribution levels and their stability (which will in turn be affected by levels of dividend and interest payments by a Fund’s portfolio holdings, the timing and success of the Fund’s investment strategies, regulations affecting the timing and character of Fund distributions, Fund expenses and other factors), (iii) supply of and demand for the shares, (iv) trading volume of the shares, (v) general market, interest
rate and economic conditions and (vi) other factors that may be beyond the control of the Fund. A Fund cannot predict whether the shares will trade at, below or above NAV or at, below or above the IPO price.
Master Limited Partnership Risk — Investments in securities of MLPs involve risks that differ from investments in common stocks, including risks related to limited control and limited rights to vote on matters affecting the MLP, risks related to potential conflicts of interest between the MLP and the MLP’s general partner, cash flow risks, dilution risks, limited liquidity and risks related to the general partner’s right to require unit-holders to sell their common units at an undesirable time or price.
Non-Diversification Risk — Each Fund is non-diversified, meaning that each is permitted to invest a larger percentage of its assets in fewer issuers than diversified mutual funds. Thus, a Fund may be more susceptible to adverse developments affecting any single issuer held in their portfolios, and may be more susceptible to greater losses because of these developments.
Private Investment Risk — The Funds may invest in PIPE securities. PIPE transactions typically involve the purchase of securities directly from a publicly traded company or its affiliates in a private placement transaction, typically at a discount to the market price of the company’s common stock. In a PIPE transaction, the Funds may bear the price risk from the time of pricing until the time of closing. Equity issued in this manner is often subject to transfer restrictions and is therefore less liquid than equity issued through a registered public offering. The Funds may be subject to lock-up agreements that prohibit transfers for a fixed period of time. In addition, because the sale of the securities in a PIPE transaction is not registered under the Securities Act, the securities are “restricted” and cannot be immediately resold into the public markets. The ability of the Funds to freely transfer restricted shares is conditioned upon, among other things, the SEC’s preparedness to declare the resale registration statement effective and the issuer’s right to suspend the Fund’s use of the resale registration statement if the issuer is pursuing a transaction or some other material non-public event is occurring. Accordingly, PIPE securities may be subject to risks associated with illiquid securities.
Portfolio Concentration Risk — Each Fund concentrates its investments in the energy sector, and will therefore be susceptible to adverse economic, environmental, business, regulatory or other occurrences affecting that sector. The energy sector has historically experienced substantial price volatility. MLPs and other companies operating in the energy sector are subject to specific risks, including, among others, fluctuations in commodity prices; reduced consumer demand for commodities such as oil, natural gas or petroleum products; reduced availability of natural gas or other commodities for transporting, processing, storing or delivering; slowdowns in new construction; extreme weather or other natural disasters; and threats of attack by terrorists on energy assets. Additionally, changes in the regulatory environment for energy companies may adversely impact their profitability. Over time, depletion of natural gas reserves and other energy reserves may also affect the profitability of energy companies.
Strategy Risk — Each Fund’s strategy of investing primarily in MLPs, results in its being taxed as a corporation, or “C” corporation, rather than as a regulated investment company for U.S. federal income tax purposes, is a relatively new investment strategy for funds. This strategy involves complicated accounting, tax and valuation issues. Volatility in the NAV may be
37
GOLDMAN SACHS CLOSED-END FUNDS
Notes to Financial Statements (continued)
November 30, 2014
|
| 7. OTHER RISKS (continued) |
experienced because of the use of estimates at various times during a given year that may result in unexpected and potentially significant consequences for the Funds and their shareholders.
Tax Risks — Tax risks associated with investments in a Fund include, but are not limited to, the following:
Fund Structure Risk. Unlike traditional mutual funds that are structured as regulated investment companies for U.S. federal income tax purposes, the Funds will be taxable as regular corporations, or “C” corporations, for U.S. federal income tax purposes. This means the Funds generally will be subject to U.S. federal income tax on their taxable income at the rates applicable to corporations (currently a maximum rate of 35%), and will also be subject to state and local income taxes.
MLP Tax Risk. MLPs are generally treated as partnerships for U.S. federal income tax purposes. Partnerships do not pay U.S. federal income tax at the partnership level. Rather, each partner is allocated a share of the partnership’s income, gains, losses, deductions and expenses. A change in current tax law or a change in the underlying business mix of a given MLP could result in an MLP being treated as a corporation for U.S. federal income tax purposes, which would result in the MLP being required to pay U.S. federal income tax (as well as state and local income taxes) on its taxable income. This would have the effect of reducing the amount of cash available for distribution by the MLP and could result in a reduction in the value of the Funds’ investment in the MLP and lower income to each Fund.
To the extent a distribution received by a Fund from an MLP is treated as a return of capital, the Fund’s adjusted tax basis in the interests of the MLP will be reduced, which may increase the Fund’s tax liability upon the sale of the interests in the MLP or upon subsequent distributions in respect of such interests.
Tax Estimation/NAV Risk. In calculating a Fund’s NAV, the Fund will, among other things, include its current taxes and deferred tax liability and/or asset balances and related valuation balances, if any. A Fund may accrue a deferred income tax liability balance, at the currently effective statutory U.S. federal income tax rate (currently 35%) plus an estimated state and local income tax rate, for its future tax liability associated with the capital appreciation of its investments and the distributions received by the Funds on interests of MLPs considered to be return of capital and for any net operating gains. Any deferred tax liability balance will reduce a Fund’s NAV which could have an effect on the market price of the shares. The Funds may also record a deferred tax asset balance, which reflects an estimate of a Fund’s future tax benefit associated with net operating losses and/or unrealized losses. Any deferred tax asset balance will increase a Fund’s NAV to the extent it exceeds any valuation allowance, which could have an effect on the market price of the shares. Each Fund will rely to some extent on information provided by MLPs, which may not be provided to the Funds on a timely basis, to estimate current and deferred tax liability and/or asset balances for purposes of financial statement reporting and determining its NAV. The daily estimate of a Fund’s current and deferred tax liability and/or asset balances used to calculate each Fund’s NAV could vary significantly from the Fund’s actual tax liability or benefit, and, as a result, the determination of the Fund’s actual tax liability or benefit may have a material impact on the Fund’s NAV. From time to time, a Fund may modify its estimates or assumptions regarding their current and deferred tax liability and/or asset balances as new information becomes available, which modifications in estimates or assumptions may have a material impact on the Fund’s NAV.
Under the Trust’s organizational documents, its Trustees, officers, employees and agents are indemnified, to the extent permitted by the Act and state law, against certain liabilities that may arise out of performance of their duties to the Funds. Additionally, in the course of business, each Fund enters into contracts that contain a variety of indemnification clauses. A Fund’s maximum exposure under these arrangements is unknown, as this would involve future claims that may be made against the Fund that have not yet occurred. However, GSAM believes the risk of loss under these arrangements to be remote.
38
GOLDMAN SACHS CLOSED-END FUNDS
Subsequent events after the Statements of Assets and Liabilities date have been evaluated through the date the financial statements were issued. GSAM has concluded that there is no impact requiring adjustment or disclosure in the financial statements.
| | |
| 10. SUMMARY OF SHARE TRANSACTIONS | | |
Share activity is as follows:
| | | | | | | | |
| | | Goldman Sachs MLP and Energy Renaissance Fund | |
| | | | |
| | | For the Period Ended
November 30, 2014(a) | |
| | | | |
| | | Shares | | | Dollars | |
| | | | |
| Common Shares | | | | | | | | |
Proceeds from sales of common shares | | | 78,081,400 | | | $ | 1,491,254,733 | |
Reinvestment of distributions | | | 40,614 | | | | 707,905 | |
Offering costs charged to paid in capital | | | (— | ) | | | (3,123,047 | ) |
Total increase | | | 78,122,014 | | | | 1,488,839,591 | |
| | | | | | | | | | | | | | | | |
| | | Goldman Sachs MLP Income Opportunities Fund | |
| | | | |
| | | For the Fiscal Year Ended
November 30, 2014 | | | For the Period Ended
November 30, 2013(b) | |
| | | | |
| | | Shares | | | Dollars | | | Shares | | | Dollars | |
| | | | |
| Common Shares | | | | | | | | | | | | | | | | |
Proceeds from sales of common shares | | | 2,809,924 | | | $ | 53,669,549 | | | | 41,320,236 | | | $ | 789,116,500 | |
Offering costs charged to paid in capital | | | (— | ) | | | (112,397 | ) | | | (— | ) | | | (1,652,600 | ) |
Total increase | | | 2,809,924 | | | | 53,557,152 | | | | 41,320,236 | | | | 787,463,900 | |
| (a) | | Commenced operations on September 26, 2014. |
| (b) | | Commenced operations on November 26, 2013. |
39
Report of Independent Registered Public
Accounting Firm
To the Board of Trustees and Shareholders of
Goldman Sachs MLP and Energy Renaissance Fund and Goldman Sachs MLP Income Opportunities Fund:
In our opinion, the accompanying statements of assets and liabilities, including the schedules of investments, and the related
statements of operations and of changes in net assets and of cash flows and the financial highlights present fairly, in all material respects, the financial position of Goldman Sachs MLP and Energy Renaissance Fund and Goldman Sachs MLP Income Opportunities Fund (the “Funds”), at November 30, 2014, the results of their operations, the changes in their net assets, cash flows and the financial highlights for the periods indicated, in conformity with accounting principles generally accepted in the United States of America. These financial statements and financial highlights (hereafter referred to as “financial statements”) are the responsibility of the Funds’ management. Our responsibility is to express an opinion on these financial statements based on our audits. We conducted our audits of these financial statements in accordance with the standards of the Public Company Accounting Oversight Board (United States). Those standards require that we plan and perform the audit to obtain reasonable assurance about whether the financial statements are free of material misstatement. An audit includes examining, on a test basis, evidence supporting the amounts and disclosures in the financial statements, assessing the accounting principles used and significant estimates made by management, and evaluating the overall financial statement presentation. We believe that our audits, which included confirmation of securities at November 30, 2014, by correspondence with the custodian and transfer agent of the investment company, provide a reasonable basis for our opinion.
PricewaterhouseCoopers LLP
Boston, Massachusetts
January 28, 2015
40
GOLDMAN SACHS MLP AND ENERGY RENAISSANCE FUND
Statement Regarding Basis for Approval of Management Agreement (Unaudited)
Background
The Goldman Sachs MLP and Energy Renaissance Fund (the “Fund”) is a newly-organized closed-end management investment company that commenced investment operations on September 26, 2014. At a meeting held on August 14, 2014 (the “Meeting”) in connection with the Fund’s organization, the Trustees, including all of the Trustees present who are not parties to the Fund’s investment management agreement (the “Management Agreement”) or “interested persons” (as defined in the Investment Company Act of 1940, as amended) of any party thereto (the “Independent Trustees”) approved the Management Agreement with Goldman Sachs Asset Management, L.P. (the “Investment Adviser”).
At the Meeting the Trustees reviewed the Management Agreement, including information regarding the terms of the Management Agreement; the nature, extent and quality of the Investment Adviser’s anticipated services; the fees and expenses to be paid by the Fund; a comparison of the Fund’s proposed management fees and anticipated expenses with those paid by other similar closed-end funds; and potential benefits to be derived by the Investment Adviser and its affiliates from their relationships with the Fund.
In evaluating the Management Agreement at the Meeting, the Trustees relied upon their knowledge, resulting from their meetings and other interactions throughout the year, of the Investment Adviser, its affiliates, their services and the Fund (the Trustees also oversee other funds in the Goldman Sachs fund complex). In conjunction with these meetings, the Trustees received written materials and oral presentations on the topics covered, and were advised by their independent legal counsel regarding their responsibilities and other regulatory requirements related to the approval of registered fund investment management agreements under applicable law. In addition, the Investment Adviser and its affiliates provided the Independent Trustees with a written response to a formal request for information sent on behalf of the Independent Trustees by their independent legal counsel. During the course of their deliberations, the Independent Trustees met in executive sessions with their independent legal counsel, without representatives of the Investment Adviser or its affiliates present. The Independent Trustees also discussed the broad range of other investment choices that are available to Fund investors, including the availability of comparable funds managed by other advisers.
Nature, Extent and Quality of the Services Provided Under the Management Agreement and Investment Performance
As part of their review, the Trustees considered the nature, extent and quality of the services to be provided by the Investment Adviser. In this regard, the Trustees considered both the investment advisory services and non-advisory services that would be provided to the Fund by the Investment Adviser and its affiliates. The Trustees also considered information about the Fund’s structure, investment objective, strategies and other characteristics. The Trustees noted the experience and capabilities of the portfolio management team. The Trustees concluded that the Investment Adviser would be able to commit substantial financial and other resources to the Fund.
In this regard, the Trustees noted that, although the Fund was new (and therefore had no performance data to evaluate), the Investment Adviser had experience managing other accounts with similar investment objectives and policies, and had recently launched an open-end mutual fund and a closed-end mutual fund that invested primarily in master limited partnerships (“MLPs”). The Trustees considered the investment performance of those funds and that of a composite of the Investment Adviser’s separately managed accounts that invest primarily in MLPs. The Trustees concluded that the Investment Adviser’s management of the Fund likely would benefit the Fund and its shareholders.
41
GOLDMAN SACHS MLP AND ENERGY RENAISSANCE FUND
Statement Regarding Basis for Approval of Management Agreement (Unaudited) (continued)
Costs of Services to be Provided and Profitability
The Trustees considered the contractual terms of the Management Agreement and the fee rate payable by the Fund thereunder. In this regard, the Trustees considered information on the services to be rendered by the Investment Adviser to the Fund, which included both advisory and administrative services that were directed to the needs and operations of the Fund as a closed-end fund.
In particular, the Trustees reviewed information on the proposed management fee and the Fund’s projected total operating expense ratios (as a percentage of both managed and net assets), and those were compared to similar information for comparable closed-end funds advised by other, unaffiliated investment management firms, as well as the peer group and category medians. The comparisons of the Fund’s management fee rate and net operating expense ratios were based on reports by a third-party provider of investment company data. In addition, the Trustees considered comparisons of the Fund’s management fee rate to the rates charged by the Investment Adviser to the open-end fund, the closed-end fund and other accounts it manages with investment objectives and policies similar to those of the Fund. The Trustees believed that this information was useful in evaluating the reasonableness of the management fees and total expenses expected to be paid by the Fund.
In addition, the Trustees recognized that there was not yet profitability data to evaluate for the Fund, but considered the Investment Adviser’s representation that such data would be provided after the Fund commenced operations.
The Trustees noted the competitive nature of the fund marketplace, and that many of the Fund’s shareholders would be investing in the Fund in part because of the Fund’s relationship with the Investment Adviser. They also noted that shareholders would be able to sell their Fund shares in the secondary market if they believe that the Fund fees and expenses are too high or if they are dissatisfied with the performance of the Fund.
The Trustees also took into account that the Fund intends to use leverage, which would increase total assets and thus the amount of fees received by the Investment Adviser under the Management Agreement (because the fees are calculated based on total managed assets). In this regard, the Trustees took into account that the Investment Adviser has a financial incentive for the Fund to make continuous use of leverage, which may create a conflict of interest between the Investment Adviser, on the one hand, and the Fund’s shareholders, on the other. In this regard, the Trustees considered information provided by the Investment Adviser and the presentations by portfolio managers and determined that the Fund’s use of leverage would be appropriate and in the best interests of the Fund’s shareholders.
Economies of Scale
The Trustees noted that the Fund will not have management fee breakpoints. They considered the Fund’s projected asset levels and information comparing the contractual management fee rate charged by the Investment Adviser with fee rates charged to other closed-end funds in the peer group. The Trustees recognized that if the assets of the Fund increase over time, the Fund and its shareholders could realize economies of scale as certain Fund expenses become a smaller percentage of overall assets. They further recognized that, because the Fund is a closed-end fund with no current plans to increase its assets (other than incurring leverage for investment purposes or engaging in future efforts to raise capital), any other significant growth in its assets would generally occur through appreciation in the value of the Fund’s investment portfolio, rather than sales of beneficial shares of the Fund.
42
GOLDMAN SACHS MLP AND ENERGY RENAISSANCE FUND
Statement Regarding Basis for Approval of Management Agreement (Unaudited) (continued)
Other Benefits to the Investment Adviser and Its Affiliates
The Trustees also considered the other benefits expected to be derived by the Investment Adviser and its affiliates from their relationship with the Fund, including: (a) brokerage commissions earned by Goldman, Sachs & Co. (“Goldman Sachs”) for executing securities transactions on behalf of the Fund; (b) research received by the Investment Adviser from broker-dealers in exchange for executing certain transactions on behalf of the Fund; (c) trading efficiencies resulting from aggregation of orders of the Fund with those for other funds or accounts managed by the Investment Adviser; (d) the Investment Adviser’s ability to leverage the infrastructure designed to service the Fund on behalf of its other clients; (e) the Investment Adviser’s ability to cross-market other products and services to Fund shareholders; (f) Goldman Sachs’ retention of certain fees as a member of the underwriting syndicate; (g) the Investment Adviser’s ability to negotiate better pricing with custodians on behalf of its other clients, as a result of the relationship with the Fund; and (h) the possibility that the working relationship between the Investment Adviser and the Fund’s third party service providers may cause those service providers to be open to doing business with other areas of Goldman Sachs.
Conclusion
In connection with their consideration of the Management Agreement for the Fund at the Meeting, the Trustees gave weight to various factors, but did not identify any particular factor as controlling their decision. After deliberation and consideration of the information provided, including the factors described above, the Trustees concluded, in the exercise of their business judgment, that the management fee that would be payable by the Fund was reasonable in light of the services to be provided to it by the Investment Adviser, the Investment Adviser’s anticipated costs and the Fund’s reasonably anticipated asset levels. The Trustees unanimously concluded that the Investment Adviser’s management likely would benefit the Fund and its shareholders and that the Management Agreement should be approved with respect to the Fund.
43
GOLDMAN SACHS CLOSED-END FUNDS
Trustees and Officers (Unaudited)
Independent Trustees
| | | | | | | | | | |
Name
and Age1 | | Position(s) Held with the Funds | | Term of Office and
Length of
Time Served2,3 | | Principal Occupation(s)
During Past 5 Years | | Number of
Portfolios in
Fund Complex
Overseen by
Trustee4 | | Other
Directorships Held by Trustee5 |
Ashok N. Bakhru Age: 72 | | Chairman of the Board of Trustees | | Class I Since Inception | | Mr. Bakhru is retired. He was formerly Director, Apollo Investment Corporation (a business development company) (2008-2013); President, ABN Associates (a management and financial consulting firm) (1994-1996 and 1998-2012); Trustee, Scholarship America (1998-2005); Trustee, Institute for Higher Education Policy (2003-2008); Director, Private Equity Investors — III and IV (1998-2007), and Equity-Linked Investors II (April 2002-2007). Chairman of the Board of Trustees — Goldman Sachs Fund Complex. | | 117 | | None |
John P. Coblentz, Jr. Age: 73 | | Trustee | | Class III Since Inception | | Mr. Coblentz is retired. Formerly, he was Partner, Deloitte & Touche LLP (1975-2003); Director, Emerging Markets Group, Ltd. (2004-2006); and Director, Elderhostel, Inc. (2006-2012). Trustee — Goldman Sachs Fund Complex. | | 117 | | None |
Richard P. Strubel Age: 75 | | Trustee | | Class II Since Inception | | Mr. Strubel is retired. Formerly, he was Director, Cardean Learning Group (provider of educational services via the internet) (2003-2008); and Director, Gildan Activewear Inc. (a clothing marketing and manufacturing company) (2000-2014). He serves as Trustee Emeritus, The University of Chicago (1987-Present). Trustee — Goldman Sachs Fund Complex. | | 117 | | The Northern Trust Mutual Fund Complex (56 Portfolios) (Chairman of the Board of Trustees) |
| | | | | | | | | | |
44
GOLDMAN SACHS CLOSED-END FUNDS
Trustees and Officers (Unaudited) (continued)
Interested Trustees
| | | | | | | | | | |
Name
and Age1 | | Position(s) Held with the Trust | | Term of Office and
Length of
Time Served2,3 | | Principal Occupation(s) During Past 5 Years | | Number of
Portfolios in
Fund Complex
Overseen by
Trustee4 | | Other Directorships Held by Trustee5 |
James A. McNamara* Age: 52 | | President and Trustee | | Class II Since Inception | | Managing Director, Goldman Sachs (December 1998-Present); Director of Institutional Fund Sales, GSAM (April 1998-December 2000); and Senior Vice President and Manager, Dreyfus Institutional Service Corporation (January 1993- April 1998). President — Goldman Sachs Fund Complex (November 2007-Present); Senior Vice President — Goldman Sachs Fund Complex (May 2007-November 2007); and Vice President — Goldman Sachs Fund Complex (2001-2007). Trustee — Goldman Sachs Fund Complex (November 2007-Present and December 2002-May 2004). | | 116 | | None |
| | | | | | | | | | |
| * | | Mr. McNamara is considered to be an “Interested Trustee” because he holds a position with Goldman Sachs and/or owns securities issued by The Goldman Sachs Group, Inc. He also holds comparable positions with certain other companies of which Goldman Sachs, GSAM or an affiliate thereof is the investment adviser, administrator and/or distributor. |
| 1 | | Each Trustee may be contacted by writing to the Trustee, c/o Goldman Sachs, 200 West Street, New York, New York, 10282, Attn: Caroline Kraus. |
| 2 | | After a Trustee’s initial term, each Trustee is expected to serve a three-year term concurrent with the class of Trustees in which he or she serves: |
| | Class | | I Trustees serve an initial term until the first annual shareholder meeting subsequent to their election called for the purpose of electing Trustees and until a successor is duly elected and qualifies. |
| | Class | | II Trustees serve an initial term until the second annual shareholder meeting called for the purpose of electing Trustees and until a successor is duly elected and qualifies. |
| | Class | | III Trustees serve an initial term until the third annual shareholder meeting called for the purpose of electing Trustees and until a successor is duly elected and qualifies. |
| 3 | | With respect to the Goldman Sachs MLP Income Opportunities Fund, each Trustee has served since 2013. With respect to the Goldman Sachs MLP and Energy Renaissance Fund, each Trustee has served since 2014. |
| 4 | | The Goldman Sachs Fund Complex includes the Funds, Goldman Sachs Trust (“GST”), Goldman Sachs Trust II (“GSTII”) and Goldman Sachs Variable Insurance Trust (“GSVIT”). The Goldman Sachs Fund Complex also includes, with respect to Messrs. Bakhru, Coblentz and Strubel, the Goldman Sachs BDC, Inc. (“GSBDC”). As of November 30, 2014, each of the Funds consisted of one portfolio, GST consisted of 94 portfolios (88 of which offered shares to the public), GSTII consisted of 6 portfolios (one of which offered shares to the public), and GSVIT consisted of 14 portfolios. GSBDC did not offer shares to the public. |
| 5 | | This column includes only directorships of companies required to report to the SEC under the Securities Exchange Act of 1934 (i.e., “public companies”) or other investment companies registered under the Act. |
45
GOLDMAN SACHS CLOSED-END FUNDS
Trustees and Officers (Unaudited) (continued)
Officers of the Trust*
| | | | | | |
Name, Address and Age1 | | Position(s) Held With the Funds | | Term and
Length of
Time Served1,2 | | Principal Occupation(s) During Past 5 Years |
James A. McNamara Age: 52 200 West Street New York, NY 10282 | | Trustee and President | | Since Inception | | Managing Director, Goldman Sachs (December 1998-Present); Director of Institutional Fund Sales, GSAM (April 1998-December 2000); and Senior Vice President and Manager, Dreyfus Institutional Service Corporation (January 1993-April 1998). President, Goldman Sachs Fund Complex (November 2007-Present); Senior Vice President, Goldman Sachs Fund Complex (May 2007-November 2007); and Vice President, Goldman Sachs Fund Complex (2001-2007). Trustee — Goldman Sachs Fund Complex (November 2007-Present and December 2002-May 2004). |
Caroline L. Kraus Age: 37 200 West Street New York, NY 10282 | | Secretary | | Since Inception | | Vice President, Goldman Sachs (August 2006-Present); Associate General Counsel, Goldman Sachs (2012-Present); Assistant General Counsel, Goldman Sachs (August 2006-December 2011) and Associate, Weil, Gotshal & Manges, LLP (2002-2006). Secretary — Goldman Sachs Fund Complex (August 2012-Present); and Assistant Secretary — Goldman Sachs Fund Complex (June 2012-August 2012). |
Scott M. McHugh Age: 43 200 West Street New York, NY 10282 | | Principal Financial Officer and Treasurer | | Since Inception | | Vice President, Goldman Sachs (February 2007-Present); Assistant Treasurer of certain mutual funds administered by DWS Scudder (2005-2007); and Director (2005-2007), Vice President (2000-2005) and Assistant Vice President (1998-2000), Deutsche Asset Management or its predecessor (1998-2007). Principal Financial Officer — the Fund; Treasurer — Goldman Sachs Fund Complex (October 2009-Present); Senior Vice President — Goldman Sachs Fund Complex (November 2009-Present); and Assistant Treasurer — Goldman Sachs Fund Complex (May 2007-October 2009). |
| | | | | | |
| 1 | | Officers hold office at the pleasure of the Board or until their successors are duly elected and qualified or until his or her earlier death, inability to serve, removal or designation. Each officer holds comparable positions with certain other companies of which Goldman Sachs, GSAM or an affiliate thereof is the investment adviser, administrator and/or distributor. |
| 2 | | With respect to the Golden Sachs MLP Income Opportunities Fund, each officer has served since 2013. With respect to the Goldman Sachs MLP and Energy Renaissance Fund, each officer has served since 2014. |
| * | | Represents a partial list of officers of the Fund. Additional information about all the officers is available in the Fund’s Statement of Additional Information, which can be obtained from Goldman Sachs free of charge by calling this toll-free number (in the United States): 1-800-292-4726. |
46
GOLDMAN SACHS CLOSED-END FUNDS
ADDITIONAL INFORMATION (Unaudited)
A. Dividend Reinvestment Plan — Under each Fund’s Dividend Reinvestment Plan, dividends and/or distributions to a holder of shares will automatically be reinvested in additional shares of the Funds. Each registered shareholder may elect to have dividends and distributions distributed in cash (i.e., “opt-out”) rather than participate in the Dividend Reinvestment Plan. For any registered shareholder that does not so elect (each, a “Participant” and collectively, “Participants”), dividends and/or distributions on such shareholder’s shares will be reinvested by Computershare Trust Company, N.A. (the “Plan Agent”), as agent for shareholders in administering the Dividend Reinvestment Plan, in additional shares, as set forth below. Participation in the Dividend Reinvestment Plan is completely voluntary, and may be terminated or resumed at any time without penalty by Internet, telephone or notice if received and processed by the Plan Agent prior to the dividend record rate; otherwise such termination or resumption will be effective with respect to any subsequently declared dividend or other distribution. Participants who hold their shares through a broker or other nominee and who wish to elect to receive any dividends and distributions in cash must contact their broker or nominee. The Plan Agent will open an account for each holder of shares under the Dividend Reinvestment Plan in the same name in which such holder of shares is registered. Whenever a Fund declares a dividend or other distribution (together, a “Dividend”) payable in cash, non-participants in the Dividend Reinvestment Plan will receive cash and Participants will receive the equivalent in shares. The shares will be acquired by the Plan Agent for the Participants’ accounts, depending upon the circumstances described below, either through (i) receipt of additional unissued but authorized shares from the Fund (“Newly Issued shares”) or (ii) by purchase of outstanding shares on the open market (“Open-Market Purchases”) on the NYSE or elsewhere. If, on the payment date for any Dividend, the net asset value (“NAV”) per share is equal to or less than the closing market price plus estimated per share fees (which include any applicable brokerage commissions the Plan Agent is required to pay) (such condition often referred to as a “premium”), the Plan Agent will invest the Dividend amount in Newly Issued shares on behalf of the Participants. The number of Newly Issued shares to be credited to each Participant’s account will be determined by dividing the dollar amount of the Dividend by the NAV per share on the payment date; provided that, if the NAV is less than or equal to 95% of the closing market value on the payment date, the dollar amount of the Dividend will be divided by 95% of the closing market price per share on the payment date. If, on the payment date for any Dividend, the NAV per share is greater than the closing market price per share plus per share fees (such condition referred to as a “market discount”), the Plan Agent will invest the Dividend amount in shares acquired on behalf of the Participants in Open-Market Purchases. In the event of a market discount on the payment date for any Dividend, the Plan Agent (or Plan Agent’s broker) will have until the last business day before the next date on which the shares trade on an “exdividend” basis or 30 days after the payment date for such Dividend, whichever is sooner (the “Last Purchase Date”), to invest the Dividend amount in shares acquired in Open-Market Purchases. Open-market purchases may be made on any securities exchange where shares are traded, in the over-the-counter market or in negotiated transactions, and may be on such terms as to price, delivery and otherwise as the Plan Agent shall determine. It is contemplated that the Funds will pay quarterly Dividends. If, before the Plan Agent has completed its Open-Market Purchases, the market price per share exceeds the NAV per share, the average per share purchase price paid by the Plan Agent may exceed the NAV of the shares, resulting in the acquisition of fewer shares than if the Dividend had been paid in Newly Issued shares on the Dividend payment date. Because of the foregoing difficulty with respect to Open-Market Purchases, the Dividend Reinvestment Plan provides that if the Plan Agent is unable to invest the full Dividend amount in Open-Market Purchases during the purchase period or if the market discount shifts to a market premium during the purchase period, the Plan Agent may cease making Open-Market Purchases and may invest the uninvested portion of the Dividend amount in Newly Issued shares at the NAV per share at the close of business on the Last Purchase Date provided that, if the NAV is less than or equal to 95% of the then current market price per share; the dollar amount of the Dividend will be divided by 95% of the market price on the payment date.
More information about each Fund’s dividend reinvestment plan can be found in the applicable Fund’s prospectus.
B. Fund Certification — The Funds are listed for trading on the NYSE. The Funds will file their annual chief executive officer certification regarding compliance with the NYSE’s listing standards no more than 30 days after the Funds’ first annual shareholder meeting.
47
PRIVACY NOTICE
(Applicable only to individual, joint, and individual retirement account (IRA) investors)
The Goldman Sachs financial services companies endeavor to maintain the highest standards of confidentiality and to respect the privacy of our client relationships. In that regard, we are providing this Privacy Notice to our clients in accordance with Title V of the Gramm-Leach-Bliley Act of 1999 and its implementing regulations. This notice supplements any privacy policies or statements that we may provide in connection with specific products or services.
The Information We Collect About You. The non-public personal information we collect about you (your “Information”) comes primarily from the account applications or other forms you submit to us. We may also collect Information about your transactions and experiences with us, our affiliates, or others relating to the products or services we provide. Also, depending on the products or services you require, we may obtain additional Information from consumer reporting agencies.
Our Disclosure Policies. We do not disclose your Information to anyone, except as permitted by law. This may include sharing your Information with non-affiliated companies that perform support services for your account or process your transactions with us or our affiliates. It may also include sharing your Information with our affiliates to bring you the full range of services and products available from the Goldman Sachs family of financial services companies, including our U.S. and international brokerage, asset management, advisory, and trust services companies. Additionally, it may include disclosing your Information pursuant to your express consent, to fulfill your instructions, or to comply with applicable laws and regulations.
Our Information Security Policies. We limit access to your Information to those of our employees and service providers who are involved in offering or administering the products or services that we offer. We maintain physical, electronic, and procedural safeguards that are designed to comply with federal standards to safeguard your Information.
If our relationship ends, we will continue to treat your Information as described in this Privacy Notice.
This notice is being provided on behalf of the following affiliates of The Goldman Sachs Group, Inc.:
Goldman Sachs Asset Management, L.P.
Goldman Sachs Asset Management International
GS Investment Strategies, LLC
Goldman Sachs Hedge Fund Strategies, LLC
The family of funds managed by the affiliates listed above.
48
FUND PROFILE
Goldman Sachs Closed-End Funds

Goldman Sachs is a premier financial services firm, known since 1869 for creating thoughtful and customized investment solutions in complex global markets.
Today, the Investment Management Division of Goldman Sachs serves a diverse set of clients worldwide, including private institutions, public entities and individuals. With approximately $1.02 trillion in assets under supervision as of December 31, 2014, Goldman Sachs Asset Management (“GSAM”) has portfolio management teams located around the world and our investment professionals bring firsthand knowledge of local markets to every investment decision. GSAM’s assets under supervision includes assets supervised by Goldman Sachs Asset Management, L.P. and its Investment Advisory Affiliates.
| | |
| GOLDMAN SACHS CLOSED-END FUNDS |
|
| MLP and Energy Renaissance Fund |
|
MLP Income Opportunities Fund |
| | |
TRUSTEES Ashok N. Bakhru, Chairman John P. Coblentz, Jr. James A. McNamara Richard P. Strubel | | OFFICERS James A. McNamara, President Scott M. McHugh, Principal Financial Officer and Treasurer Caroline L. Kraus, Secretary |
| |
GOLDMAN SACHS ASSET MANAGEMENT, L.P. Investment Adviser | | DECHERT LLP Legal Counsel |
| |
COMPUTERSHARE TRUST COMPANY, N.A AND COMPUTERSHARE INC. Transfer Agent, Registrar and Dividend Reinvestment Plan Agent | | STATE STREET BANK AND TRUST COMPANY Custodian PRICEWATERHOUSECOOPERS LLP Independent Registered Public Accounting Firm |
| |
Goldman Sachs Asset Management, L.P., 200 West Street, New York, New York 10282
The reports concerning the Funds included in this shareholder report may contain certain forward-looking statements about the factors that may affect the performance of the Funds in the future. These statements are based on Fund management’s predictions and expectations concerning certain future events and their expected impact on the Funds, such as performance of the economy as a whole and of specific industry sectors, changes in the levels of interest rates, the impact of developing world events, and other factors that may influence the future performance of the Funds. Management believes these forward-looking statements to be reasonable, although they are inherently uncertain and difficult to predict. Actual events may cause adjustments in portfolio management strategies from those currently expected to be employed.
A description of the policies and procedures that the Funds use to determine how to vote proxies relating to portfolio securities and information regarding how a Fund voted proxies relating to portfolio securities for the most recent 12-month period ended June 30, are available (I) without charge, upon request by calling 1-855-807-2742; and (II) on the Securities and Exchange Commission (“SEC’’) web site at http://www.sec.gov.
The Funds file their complete schedule of portfolio holdings with the SEC for the first and third quarters of each fiscal year on Forms N-Q. The Funds’ Form N-Q are available on the SEC’s web site at http://www.sec.gov within 60 days after the Funds’ first and third fiscal quarters. The Funds’ Forms N-Q may be reviewed and copied at the SEC’s Public Reference Room in Washington, D.C., and information on the operation of the Public Reference Room may also be obtained by calling 1-800-SEC-0330. Form N-Q may be obtained upon request and without charge by calling 1-855-807-2742.
Fund holdings and allocations shown are as of November 30, 2014 and may not be representative of future investments. Fund holdings should not be relied on in making investment decisions and should not be construed as research or investment advice regarding particular securities. Current and future holdings are subject to risk.
The portfolio risk management process includes an effort to monitor and manage risk, but does not imply low risk.
Views and opinions expressed are for informational purposes only and do not constitute a recommendation by GSAM to buy, sell, or hold any security. Views and opinions are current as of the date of this presentation and may be subject to change, they should not be construed as investment advice.
Economic and market forecasts presented herein reflect a series of assumptions and judgments as of the date of this presentation and are subject to change without notice. These forecasts do not take into account the specific investment objectives, restrictions, tax and financial situation or other needs of any specific client. Actual data will vary and may not be reflected here. These forecasts are subject to high levels of uncertainty that may affect actual performance.
Accordingly, these forecasts should be viewed as merely representative of a broad range of possible outcomes. These forecasts are estimated, based on assumptions, and are subject to significant revision and may change materially as economic and market conditions change. Goldman Sachs has no obligation to provide updates or changes to these forecasts. Case studies and examples are for illustrative purposes only. This communication is not an offer to sell these securities and is not a solicitation to buy these securities in any jurisdiction where the offer or sale is not permitted.
“Alerian MLP Index”, “Alerian MLP Total Return Index”, “AMZ” and “AMZX” are trademarks of Alerian and their use is granted under a license from Alerian. Notice is hereby given in accordance with Section 23(c) of the Investment Company Act of 1940, as amended, that from time to time, the Fund may purchase, at market prices, shares of its common stock in the open market.
This report is transmitted to the Funds’ shareholders only. It is not a prospectus. Investors should consider their investment goals, time horizons and risk tolerance before investing in the Funds. An investment in a Fund is not appropriate for all investors, and the Funds are not intended to be complete investment programs. Investors should carefully review and consider the Funds’ investment objectives, risks, charges and expenses before investing.
© 2014 Goldman Sachs. All rights reserved. 151628.MF.MED.TMPL/1/2015 MLPCEFAR-15 /41K
| | (a) | As of the end of the period covered by this report, the Registrant has adopted a code of ethics that applies to the Registrant’s principal executive officer, principal financial officer, principal accounting officer or controller, or persons performing similar functions, regardless of whether these individuals are employed by the Registrant or a third party (the “Code of Ethics”). |
| | (b) | During the period covered by this report, no amendments were made to the provisions of the Code of Ethics. |
| | (c) | During the period covered by this report, the Registrant did not grant any waivers, including an implicit waiver, from any provision of the Code of Ethics. |
| | (d) | A copy of the Code of Ethics is available as provided in Item 12(a)(1) of this report. |
| ITEM 3. | AUDIT COMMITTEE FINANCIAL EXPERT. |
| | The Registrant’s board of trustees has determined that the Registrant has at least one “audit committee financial expert” (as defined in Item 3 of Form N-CSR) serving on its audit committee. John P. Coblentz, Jr. is the “audit committee financial expert” and is “independent” (as each term is defined in Item 3 of Form N-CSR). |
| ITEM 4. | PRINCIPAL ACCOUNTANT FEES AND SERVICES. |
Table 1 — Items 4(a) - 4(d). The Registrant commenced operations on September 26, 2014. The accountant fees below reflect the aggregate fees billed by the Registrant during the fiscal year ended November 30, 2014.
| | | | | | |
| | | 2014 | | | Description of Services Rendered |
Audit Fees: | | | | | | |
• PricewaterhouseCoopers LLP (“PwC”) | | $ | 48,000 | | | Financial Statement audits. |
Audit-Related Fees: | | | | | | |
• PwC | | $ | 0 | | | Other attest services. |
Tax Fees: | | | | | | |
• PwC | | $ | 2,500 | | | Tax compliance services provided in connection with the preparation and review of Registrant’s tax returns. |
Table 2 — Items 4(b)(c) & (d). Non-Audit Services to the Registrant’s service affiliates * that were pre-approved by the Audit Committee of the Registrant pursuant to Rule 2-01(c)(7)(ii) of Regulation S-X during the fiscal year ended November 30, 2014.
| | | | | | |
| | | 2014 | | | Description of Services Rendered |
Audit-Related Fees: | | | | | | |
• PwC | | $ | 1,486,420 | | | Internal control review performed in accordance with Statement on Standards for Attestation Engagements No. 16. These fees are borne by the Registrant’s Adviser. |
| * | These include the advisor (excluding sub-advisors) and any entity controlling, controlled by or under common control with the advisor that provides ongoing services to the registrant (hereinafter referred to as “service affiliates”). |
Item 4(e)(1) — Audit Committee Pre-Approval Policies and Procedures
Pre-Approval of Audit and Non-Audit Services Provided to Goldman Sachs MLP and Energy Renaissance Fund. The Audit and Non-Audit Services Pre-Approval Policy (the “Policy”) adopted by the Audit Committee of the Board of Trustees of Goldman Sachs MLP and Energy Renaissance Fund (the “Fund”) sets forth the procedures and the conditions pursuant to which services performed by an independent auditor for the Fund may be pre-approved. Services may be pre-approved specifically by the Audit Committee as a whole or, in certain circumstances, by the Audit Committee Chairman or the person designated as the Audit Committee Financial Expert. In addition, subject to specified cost limitations, certain services may be pre-approved under the provisions of the Policy. The Policy provides that the Audit Committee will consider whether the services provided by an independent auditor are consistent with the Securities and Exchange Commission’s rules on auditor independence. The Policy provides for periodic review and pre-approval by the Audit Committee of the services that may be provided by the independent auditor.
De Minimis Waiver. The pre-approval requirements of the Policy may be waived with respect to the provision of non-audit services that are permissible for an independent auditor to perform, provided (1) the aggregate amount of all such services provided constitutes no more than five percent of the total amount of revenues subject to pre-approval that was paid to the independent auditors during the fiscal year in which the services are provided; (2) such services were not recognized by the Fund at the time of the engagement to be non-audit services; and (3) such services are promptly brought to the attention of the Audit Committee and approved prior to the completion of the audit by the Audit Committee or by one or more members of the Audit Committee to whom authority to grant such approvals has been delegated by the Audit Committee, pursuant to the pre-approval provisions of the Policy.
Pre-Approval of Non-Audit Services Provided to the Fund’s Investment Advisers. The Policy provides that, in addition to requiring pre-approval of audit and non-audit services provided to the Fund, the Audit Committee will pre-approve those non-audit services provided to the Fund’s investment advisers (and entities controlling, controlled by or under common control with the investment advisers that provide ongoing services to the Fund) where the engagement relates directly to the operations or financial reporting of the Fund.
Item 4(e)(2) — 0% of the audit-related fees, tax fees and other fees listed in Table 1 were approved by the Registrant’s Audit Committee pursuant to the “de minimis” exception of Rule 2-01(c)(7)(i)(C) of Regulation S-X. In addition, 0% of the non-audit services to the Registrant’s service affiliates listed in Table 2 were approved by the Registrant’s Audit Committee pursuant to the “de minimis” exception of Rule 2-01(c)(7)(i)(C) of Regulation S-X.
Item 4(f) — Not applicable.
Item 4(g) Aggregate Non-Audit Fees Disclosure
The Registrant commenced operations on September 26, 2014. The aggregate non-audit fees billed to the Registrant by PwC for the twelve months ended November 30, 2014 were $2,500. The aggregate non-audit fees billed to Registrant’s adviser and service affiliates by PwC for non-audit services for the twelve months ended December 31, 2013 and December 31, 2012 were approximately $9.8 million and $10.0 million respectively. With regard to the aggregate non-audit fees billed to the Registrant’s adviser and service affiliates, the 2013 amounts include fees for non-audit services required to be pre-approved [see Table 2] and fees for non-audit services that did not require pre-approval since they did not directly relate to the Registrant’s operations or financial reporting. The figures for these entities are not yet available for the twelve months ended December 31, 2014.
Item 4(h) — The Registrant’s Audit Committee has considered whether the provision of non-audit services to the Registrant’s investment adviser and service affiliates that did not require pre-approval pursuant to paragraph (c)(7)(ii) of Rule 2-01 of Regulation S-X is compatible with maintaining the auditors’ independence.
| ITEM 5. | AUDIT COMMITTEE OF LISTED REGISTRANTS. |
| | The Registrant has a separately-designated standing Audit Committee established in accordance with Section 3(a)(58)(A) of the Securities Exchange Act of 1934, as amended. The members of the Audit Committee are Ashok N. Bakhru, John P. Coblentz, Jr. and Richard P. Strubel, each a Trustee of the Registrant. |
| ITEM 6. | SCHEDULE OF INVESTMENTS. |
| | Schedule of Investments is included as part of the Report to Stockholders filed under Item 1. |
| ITEM 7. | DISCLOSURE OF PROXY VOTING POLICIES AND PROCEDURES FOR CLOSED-END MANAGEMENT INVESTMENT COMPANIES. |
The Registrant has delegated the voting of portfolio securities to Goldman Sachs Asset Management L.P. (the “Investment Adviser”). For client accounts for which the Investment Adviser has voting discretion, the Investment Adviser has adopted policies and procedures (the “Proxy Voting Policy”) for the voting of proxies. Under the Proxy Voting Policy, the Investment Adviser’s guiding principles in performing proxy voting are to make decisions that favor proposals that tend to maximize a company’s shareholder value and are not influenced by conflicts of interest. To implement these guiding principles for investments in publicly-traded equities, the Investment Adviser has developed customized proxy voting guidelines (the “Guidelines”) that it generally applies when voting on behalf of client accounts. These Guidelines address a wide variety of individual topics, including, among other matters, shareholder voting rights, anti-takeover defenses, board structures, the election of directors, executive and director compensation, reorganizations, mergers, issues of corporate social responsibility and various shareholder proposals.
The Proxy Voting Policy, including the Guidelines, is reviewed periodically to ensure that it continues to be consistent with the Investment Adviser’s guiding principles. The Guidelines embody the positions and factors the Investment Adviser generally considers important in casting proxy votes.
The Investment Adviser has retained a third-party proxy voting service (“Proxy Service”), currently Institutional Shareholder Services, to assist in the implementation and administration of certain proxy voting-related functions including, without limitation, operational, recordkeeping and reporting services. The Proxy Service also prepares a written analysis and recommendation (a “Recommendation”) of each proxy vote that reflects the Proxy Service’s application of the Guidelines to particular proxy issues. While it is the Investment Adviser’s policy generally to follow the Guidelines and Recommendations from the Proxy Service, the Investment Adviser’s portfolio management teams (“Portfolio Management Teams”) may on certain proxy votes seek approval to diverge from the Guidelines or a Recommendation by following an “override” process. Such decisions are subject to a review and approval process, including a determination that the decision is not influenced by any conflict of interest. A Portfolio Management Team that receives approval through the override process to cast a proxy vote that diverges from the Guidelines and/or a Recommendation may vote differently than other Portfolio Management Teams that did not seek to override the vote. In forming their views on particular matters, the Portfolio Management Teams are also permitted to consider applicable regional rules and practices, including codes of conduct and other guides, regarding proxy voting, in addition to the Guidelines and Recommendations. The Investment Adviser may hire other service providers to replace or supplement the Proxy Service with respect to any of the services the Investment Adviser currently receives from the Proxy Service.
From time to time, the Investment Adviser may face regulatory, compliance, legal or logistical limits with respect to voting securities that it may purchase or hold for client accounts, which can affect the Investment Adviser’s ability to vote such proxies, as well as the desirability of voting such proxies. Among other limits, federal, state and foreign regulatory restrictions or company specific ownership limits, as well as legal matters related to consolidated groups, may restrict the total percentage of an issuer’s voting securities that the Investment Adviser can hold for clients and the nature of the Investment Adviser’s voting in such securities. The Investment Adviser’s ability to vote proxies may also be affected by, among other things: (i) late receipt of meeting notices; (ii) requirements to vote proxies in person: (iii) restrictions on a foreigner’s ability to exercise votes; (iv) potential difficulties in translating the proxy; (v) requirements to provide local agents with unrestricted powers of attorney to facilitate voting instructions; and (vi) requirements that investors who exercise their voting rights surrender the right to dispose of their holdings for some specified period in proximity to the shareholder meeting.
The Investment Adviser conducts periodic due diligence meetings with the Proxy Service which include, but are not limited to, a review of the Proxy Service’s general organizational structure, new developments with respect to research and technology, work flow improvements and internal due diligence with respect to conflicts of interest.
The Investment Adviser has adopted policies and procedures designed to prevent conflicts of interest from influencing its proxy voting decisions that the Investment Adviser makes on behalf of a client account and to help ensure that such decisions are made in accordance with the Investment Adviser’s fiduciary obligations to its clients. These policies and procedures include the Investment Adviser’s use of the Guidelines and Recommendations from the Proxy Service, the override approval process previously discussed, and the establishment of information barriers between the Investment Adviser and other businesses within The Goldman Sachs Group, Inc. Notwithstanding such proxy voting policies and procedures, actual proxy voting decisions of the Investment Adviser may have the effect of benefitting the interests of other clients or businesses of other divisions or units of Goldman Sachs and/or its affiliates, provided that the Investment Adviser believes such voting decisions to be in accordance with its fiduciary obligations.
Voting decisions with respect to fixed income securities and the securities of privately held issuers generally will be made by the Registrant’s managers based on their assessment of the particular transactions or other matters at issue.
Information regarding how the Registrant voted proxies relating to portfolio securities during the most recent 12-month period ending June 30, 2015 will be available on or through the Registrant’s website at www.gsamfunds.com and on the SEC’s website at www.sec.gov.
| ITEM 8. | PORTFOLIO MANAGERS OF CLOSED-END MANAGEMENT INVESTMENT COMPANIES. |
Item 8(a)(1)
| | | | | | |
Name | | Title | | Length of Time Served | | Principal Occupation(s) During Past 5 Years |
| Kyri Loupis | | Lead Portfolio Manager | | Since 2014 | | Mr. Loupis joined the Investment Adviser in 2009 and is a portfolio manager and head of the Energy & Infrastructure team. Prior to joining the Investment Adviser he spent over eight years at Lehman Brothers covering the energy sector, from 2000-2006 in the Investment Banking Division, and from 2006-2009 in the Private Equity group, where he co-founded an energy investment fund with a focus in MLPs. |
| | | |
| Ganesh V. Jois, CFA | | Portfolio Manager | | Since 2014 | | Mr. Jois joined the Investment Adviser in 2009 and is a research analyst and portfolio manager for the Energy & Infrastructure Team. Prior to joining the Investment Adviser, he was at Citigroup Investment Research covering MLPs, where he helped initiate coverage on several MLPs and had coverage responsibility for nearly 20 MLPs. Between 2003 and 2005, he worked in the Financial Advisory Services practice of Deloitte & Touche |
| | | |
| Matthew Cooper | | Research Analyst | | Since 2014 | | Mr. Cooper joined the Investment Adviser in 2013 and is a research analyst for the Energy & Infrastructure Team. Prior to joining the Investment Adviser, he worked in the Commodities Origination and Structuring group at Merrill Lynch beginning in 2011. Between 2007 and 2009 he worked as a research analyst in the Private Equity Group at Lehman Brothers covering the energy sector. Prior to that he worked as an Investment Banker in the Energy and Power Group at Merrill Lynch & Co. |
Item 8(a)(2)
The following tables disclose other accounts within each type of category listed below for which the portfolio managers are jointly and primarily responsible for day to day portfolio management, as of November 30, 2014, unless otherwise noted.
| | | | | | | | | | | | | | | | | | | | | | | | | | | | | | | | | | | | | | | | | | | | | | | | |
Number of Other Accounts Managed and Total Assets by Account Type | | | Number of Accounts and Total Assets for
Which Advisory Fee is Performance Based | |
| | | Registered
Investment
Companies | | | Other Pooled
Investment
Vehicles | | | Other
Accounts | | | Registered
Investment
Companies | | | Other Pooled
Investment
Vehicles | | | Other
Accounts | |
Name of Portfolio Manager | | Number
of
Accounts | | | Assets
Managed | | | Number
of
Accounts | | | Assets
Managed | | | Number
of
Accounts | | | Assets
Managed | | | Number
of
Accounts | | | Assets
Managed | | | Number
of
Accounts | | | Assets
Managed | | | Number
of
Accounts | | | Assets
Managed | |
Kyri Loupis | | | 4 | | | $ | 5,457,375,736 | | | | 3 | | | $ | 1,405,830,347 | | | | 3606 | | | $ | 8,084,279,782 | | | | 0 | | | | 0 | | | | 0 | | | | 0 | | | | 0 | | | | 0 | |
Ganesh V. Jois, CFA | | | 4 | | | $ | 5,457,375,736 | | | | 3 | | | $ | 1,405,830,347 | | | | 3606 | | | $ | 8,084,279,782 | | | | 0 | | | | 0 | | | | 0 | | | | 0 | | | | 0 | | | | 0 | |
Matthew Cooper | | | 4 | | | $ | 5,457,375,736 | | | | 3 | | | $ | 1,405,830,347 | | | | 3606 | | | $ | 8,084,279,782 | | | | 0 | | | | 0 | | | | 0 | | | | 0 | | | | 0 | | | | 0 | |
Item 8(a)(3) —
Compensation for portfolio managers of the Investment Adviser is comprised of a base salary and discretionary variable compensation. The base salary is fixed from year to year. Year-end discretionary variable compensation is primarily a function of each portfolio manager’s individual performance and his or her contribution to overall team performance; the performance of the Investment Adviser and Goldman Sachs; the team’s net revenues for the past year which in part is derived from advisory fees, and for certain accounts, performance-based fees; and anticipated compensation levels among competitor firms. Portfolio managers are rewarded, in part, for their delivery of investment performance, measured on a pre-tax basis, which is reasonably expected to meet or exceed the expectations of clients and fund shareholders in terms of: excess return over an applicable benchmark, peer group ranking, risk management and factors specific to certain funds such as yield or regional focus. Performance is judged over 1-, 3- and 5-year time horizons.
For compensation purposes, the benchmark for the Registrant is the Alerian MLP Index Total Return.
The discretionary variable compensation for portfolio managers is also significantly influenced by: (1) effective participation in team research discussions and process; and (2) management of risk in alignment with the targeted risk parameter and investment objective of the Registrant. Other factors may also be considered including: (1) general client/shareholder orientation and (2) teamwork and leadership. Portfolio managers may receive equity-based awards as part of their discretionary variable compensation.
Other Compensation — In addition to base salary and discretionary variable compensation, the Investment Adviser has a number of additional benefits in place including (1) a 401k program that enables employees to direct a percentage of their pretax salary and bonus income into a tax-qualified retirement plan; and (2) investment opportunity programs in which certain professionals may participate subject to certain eligibility requirements.
Item 8(b)(4)
The following table shows the portfolio managers’ ownership of securities in the Fund as of November 30, 2014:
| | |
Name of Portfolio Manager | | Dollar Range of Equity Securities
Beneficially Owned by Portfolio Manager |
Kyri Loupis | | $100,001 - $500,000 |
Ganesh V. Jois, CFA | | $50,001 - $100,000 |
Matthew Cooper | | $10,001 - $50,000 |
| ITEM 9. | PURCHASES OF EQUITY SECURITIES BY CLOSED-END MANAGEMENT INVESTMENT COMPANY AND AFFILIATED PURCHASERS. |
| | There have been no purchases of equity securities by or on behalf of the Registrant of shares or other units of any registered class of the Registrant’s equity securities. |
| ITEM 10. | SUBMISSION OF MATTERS TO A VOTE OF SECURITY HOLDERS. |
| | There have been no material changes to the procedures by which shareholders may recommend nominees to the registrant’s board of trustees. |
| ITEM 11. | CONTROLS AND PROCEDURES. |
| | (a) | The registrant’s principal executive and principal financial officers, or persons performing similar functions have concluded that the registrant’s disclosure controls and procedures (as defined in Rule 30a-3(c) under the Investment Company Act of 1940, as amended (the “1940 Act”)) are effective as of a date within 90 days of the filing of this report that includes the disclosure required by this paragraph, based on the evaluation of these controls and procedures required by Rule 30a-3(b) under the 1940 Act and 15d-15(b) under the Securities Exchange Act of 1934, as amended. |
| | (b) | There were no changes in the registrant’s internal control over financial reporting (as defined in Rule 30a-3(d) under the 1940 Act) that occurred during the registrant’s second fiscal quarter of the period covered by this report that have materially affected, or are reasonably likely to materially affect, the registrant’s internal control over financial reporting. |
| | | | |
| (a)(1) | | The Registrant’s Code of Ethics for Principal Executive and Senior Financial Officers is filed herewith. |
| | |
| (a)(2) | | Exhibit 99.CERT | | Certifications pursuant to Section 302 of the Sarbanes-Oxley Act of 2002 filed herewith. |
| | |
| (b) | | Exhibit 99.906CERT | | Certifications pursuant to Section 906 of the Sarbanes-Oxley Act of 2002 filed herewith. |
SIGNATURES
Pursuant to the requirements of the Securities Exchange Act of 1934 and the Investment Company Act of 1940, the registrant has duly caused this report to be signed on its behalf by the undersigned, thereunto duly authorized.
| | | | |
| | | | Goldman Sachs MLP and Energy Renaissance Fund |
| | |
| By: | | | | /s/ James A. McNamara |
| | | | James A. McNamara |
| | | | President/Principal Executive Officer |
| | | | Goldman Sachs MLP and Energy Renaissance Fund |
| | |
| Date: | | | | February 6, 2015 |
Pursuant to the requirements of the Securities Exchange Act of 1934 and the Investment Company Act of 1940, this report has been signed below by the following persons on behalf of the registrant and in the capacities and on the dates indicated.
| | | | |
| By: | | | | /s/ James A. McNamara |
| | | | James A. McNamara |
| | | | President/Principal Executive Officer |
| | | | Goldman Sachs MLP and Energy Renaissance Fund |
| | |
| Date: | | | | February 6, 2015 |
| | |
| By: | | | | /s/ Scott McHugh |
| | | | Scott McHugh |
| | | | Principal Financial Officer |
| | | | Goldman Sachs MLP and Energy Renaissance Fund |
| | |
| Date: | | | | February 6, 2015 |