UNITED STATES
SECURITIES AND EXCHANGE COMMISSION
Washington, D.C. 20549
FORMN-CSR
CERTIFIED SHAREHOLDER REPORT OF REGISTERED
MANAGEMENT INVESTMENT COMPANIES
Investment Company Act file number 811-22979
Goldman Sachs MLP and Energy Renaissance Fund
(Exact name of registrant as specified in charter)
200 West Street,
New York, NY 10282
(Address of principal executive offices) (Zip code)
| | |
Copies to: |
Caroline Kraus, ESQ. | | Stephen H. Bier, ESQ. |
Goldman Sachs & Co. LLC | | Allison M. Fumai, ESQ. |
200 West Street | | Dechert LLP |
New York, New York 10282 | | 1095 Avenue of the Americas |
| | New York, NY 10036-6797 |
(Name and address of agents for service)
Registrant’s telephone number, including area code: (212) 902-1000
Date of fiscal year end: November 30
Date of reporting period: November 30, 2018
| ITEM 1. | REPORTS TO STOCKHOLDERS. |
| | The Annual Report to Shareholders is filed herewith. |
Goldman Sachs Closed-End Funds

| | | | |
| | |
| Annual Report | | | | November 30, 2018 |
| | |
| | | | MLP and Energy Renaissance Fund MLP Income Opportunities Fund |
It is our intention that beginning on January 1, 2021, paper copies of the Funds’ annual and semi-annual shareholder reports will no longer be sent by mail, unless you specifically request paper copies of the reports from a Fund or from your financial intermediary. Instead, the reports will be made available on a website, and you will be notified by mail each time a report is posted and provided with a website link to access the report.
If you already elected to receive shareholder reports electronically, you will not be affected by this change and you need not take any action. At any time, you may elect to receive reports and certain communications from a Fund electronically by calling Computershare toll-free 1-855-807-2742, by logging into your Investor Center account at www.computershare.com/investor and going to “Communication Preferences” or by contacting your financial intermediary.
You may elect to receive all future shareholder reports in paper free of charge by calling Computershare toll-free 1-855-807-2742, by logging into your Investor Center account at www.computershare.com/investor and going to “Communication Preferences” or by contacting your financial intermediary. Your election to receive reports in paper will apply to all Goldman Sachs Funds in which you are invested and may apply to all funds held with your financial intermediary.

Goldman SachsClosed-End Funds
| ∎ | | MLP AND ENERGY RENAISSANCE FUND |
| ∎ | | MLP INCOME OPPORTUNITIES FUND |
| | | | |
| | | |
| NOT FDIC-INSURED | | May Lose Value | | No Bank Guarantee |
GOLDMAN SACHSCLOSED-END FUNDS
What Differentiates Goldman Sachs’Closed-End Funds Investment Process?
The MLP and Energy Renaissance Fund and MLP Income Opportunities Fund (each, a “Fund” and collectively, the “Funds”)each seek a high level of total return with an emphasis on current distributions to shareholders. The MLP and Energy Renaissance Fund seeks to achieve its investment objective by investing in Master Limited Partnerships (“MLPs”) and other energy investments. The MLP Income Opportunities Fund seeks to achieve its investment objective by investing primarily in MLPs. We seek to invest in quality companies with well located assets (exposed to what we believe are favorable commodities and geographies), strong balance sheets, and experienced management teams. We view an MLP as a company, not just a collection of assets, as we emphasize cash flow based valuation metrics and focus on balance sheet liabilities. We seek to avoid being overly myopic by assessing the entire energy value chain (from producers to users) to estimate the impact on midstream assets.

| ∎ | | To capture the full energy value chain, we analyze energy production and user trends that ultimately impact income opportunities. |
| ∎ | | We rigorously assess companies on both the asset and equity level. |

| ∎ | | Macro Trend Analysis First, we analyze overall energy trends through capital spending shifts and drilling trends, in addition to regional supply and demand imbalances. |
| ∎ | | Top-Down Sector Selection Secondly, we establish the impact of macro and regional trends on energy infrastructure. |
| ∎ | | Bottom-Up Security Selection Finally, we select investments by evaluating a company’s management, assets, expected returns and technicals. |

| ∎ | | Our team of MLP dedicated investment professionals includes lead portfolio managers averaging over 14 years of investment experience. |
| ∎ | | Ability to leverage energy-related resources across GSAM Equity, Fixed Income and Commodity groups, as well as utilize risk management resources. |
| ∎ | | Unique investment approach stemming from a more holistic view across the extremes of the energy value chain, corporate access, broader valuation understanding, and resource advantages. |
1
MARKET REVIEW
Goldman SachsClosed-End Funds
Market Review
Energy MLPs, as represented by the Alerian MLP Index,1 generated a total return of 1.21% during the12-month period ended November 30, 2018 (the “Reporting Period”) overall. The Alerian MLP Index outperformed the AMEX Energy Select Sector Index (“IXE”)(-1.64%) and underperformed the S&P 500® Index (+6.27%).2 In addition, the Alerian MLP Index underperformed utilities (+1.65%) and real estate investment trusts (“REITs”) (+3.87%), as represented by the Philadelphia Stock Exchange (PHLX) Utility Sector Index and the FTSE NAREIT (National Association of Real Estate Investment Trusts) U.S. Real Estate Index Series, respectively.3 (All index returns are presented on a total return basis.)
In energy markets, West Texas Intermediate (“WTI”) crude oil prices rallied during the first half of the Reporting Period, rising 16.79%. They stabilized above $65 per barrel near the end of May 2018, as the global supply/demand story continued to strengthen due to worldwide supply constraints and robust demand expectations. Crude oil prices continued to move higher during the summer, and the price of WTI crude oil reached $75 per barrel at Septembermonth-end — the highest level since the 2014-2015 commodity price collapse. Crude oil prices fell sharply thereafter, declining 30.47% by the conclusion of the Reporting Period. The weakness was driven by market concerns around slowing global economic growth, in addition to investor uncertainty around ongoing trade tensions and how they could potentially weaken global crude oil demand. Meanwhile, the market’s oversupply worries increased amid unexpectedly strong Saudi Arabian production, which rose from 10.42 million barrels per day in June 2018 to 11.02 million barrels per day in November, and amid mounting U.S. crude oil production, which grew by nearly 1.5 million barrels per day between the beginning of January and the end of November 2018.4 In the second half of the Reporting Period, Iranian sanction waivers provided by the U.S. tempered a widely expected decline in Iranian crude oil production, further adding to the market’s oversupply concerns. For the Reporting Period overall, WTI and Brent crude oil prices fell 11.27% and 7.65%, respectively.5
As for natural gas prices, they fell to a low of $2.56 per million British thermal units (“MMbtu”) in February 2018, down 29.55% from their January 2018 highs, due to the mild winter and to investors’ oversupply concerns. These oversupply concerns were driven by elevated levels of natural gas associated with crude oil drilling throughout the U.S., especially in the Permian Basin. After February, natural gas prices rebounded somewhat, rising 15.67% to finish May 2018 at $2.95 per MMbtu. In the second half of the Reporting Period, they experienced a strong recovery, climbing 56.23% to $4.61 per MMbtu. Much of that increase came during November 2018, which was approximately 22% colder than the seasonally adjusted average. Because of the cold weather, natural gas demand accelerated, leading to early draws from natural gas inventories, which dropped to multi-year lows. This, in turn, caused a surge in natural gas prices in spite of strong 2018 production growth, which has been
| 1 | | The Alerian MLP Index is a composite of prominent energy MLPs that captures about 85% of the total float-adjusted market capitalization of the energy MLP sector. |
| 2 | | The AMEX Energy Select Sector Index (IXE) is a modified market capitalization-based index intended to track the movements of companies that are components of the S&P 500® Index and are involved in the development or production of energy products. The S&P 500® Index is a diverse index that includes 500 American companies that represent more than 70% of the total market capitalization of the U.S. stock market. |
| 3 | | The PHLX Utility Sector Index is composed of geographically diverse public U.S. utility stocks. The FTSE NAREIT U.S. Real Estate Index Series is an index that spans the commercial real estate space across the U.S. economy, offering exposure to all investment and property sectors. |
| 4 | | Source (except where noted) of production data: Bloomberg. |
| 5 | | Source of crude oil and natural gas price data: Bloomberg. |
2
MARKET REVIEW
largely driven by increases in associated gas. (Associated gas is a byproduct of crude oil production.)
As for the energy MLP market, it started the Reporting Period strongly, following two months of weak performance. In October and November 2017, before the Reporting Period began, heavytax-loss harvesting in energy infrastructure investments, concerns surrounding tax reform and fears around the Organization of the Petroleum Exporting Countries (“OPEC”) quotas not being extended had driven the market to its lowest level since February 2016. Investors returned to the energy MLP market in the opening weeks of the Reporting Period, as they sought to take advantage of depressed valuations amid continuing healthy fundamentals. The market experienced heavy investment inflows, helping the Alerian MLP Index post a gain of 17.62% between the start of the Reporting Period and January 23, 2018. Investor sentiment then reversed and continued to weigh on the energy MLP market through March. In our view, there were four reasons for the shift in sentiment. First, investor appetite for high-yielding assets diminished as the market adjusted for rising interest rates. Second, from January 26th through February 13th, crude oil prices dropped approximately 11%, as oversupply concerns mounted and the U.S. dollar strengthened, hindering the performance of energy-related securities broadly. Third, thesell-off in crude oil prices coincided with weak earnings from several large integrated energy companies, pushing the IXE down approximately 13.01% from January 26th through February 13th. Fourth, and what we consider the most impactful, the Federal Energy Regulatory Commission (“FERC”) announced a surprise policy revision on March 15th. The revised policy mandated that regulated interstate natural gas and liquids pipelines owned by energy MLPs could no longer claim an income tax allowance in theircost-of-service methodology (a method used to set rates for pipeline customers). The policy change also potentially applies to liquids pipelines’cost-of-service calculation on inflation-indexed pipelines, which will be revisited in the FERC’s five-year review (expected to commence in 2021). At first, the scope of the policy revision was unclear to investors, driving a nearly 10%intra-day decline in the Alerian MLP Index, which then rebounded to end March 15th with a loss of 4.56%. Between March 15th and March 31st, the Alerian MLP Index recorded a decline of 7.97%. We believe investors overreacted to the FERC announcement, as the policy revision should affect only a subset of energy infrastructure companies. Between March 31st and May 31st, the energy MLP market recovered from its FERC-related lows, with the Alerian MLP Index climbing back abovepre-announcement levels, as investors continued to digest and understand the impact of the policy revision. In addition, toward the end of May, investor sentiment grew more positive overall, which we attribute to the strong fundamental backdrop for U.S. energy infrastructure, continued earnings momentum, and management teams’ increased focus on investor concerns, such as complex corporate structures, balance sheet management and capital market reliance.
The Alerian MLP Index continued to rise during June 2018 and through the end of September, benefiting from a supportive market backdrop for crude oil. Underinvestment in the energy space following the 2014-2015 commodity price collapse, coupled with geopolitical pressures, had resulted in decreased global crude oil production. This, paired with strong global demand, pushed crude oil supply from surplus to shortage, and consequently, WTI crude oil prices rallied from a low of $30 per barrel in 2016 to more than $70 per barrel in September 2018 and the first half of October 2018. U.S. shale producers responded to the shortage by increasing their drilling, which drove U.S. production toall-time highs during the Reporting Period and allowed the U.S. to capture a larger percentage of the global energy market. The record production started to strain U.S. energy infrastructure capacity, with pipeline bottlenecks arising in key U.S. production basins during the Reporting Period, suggesting the
3
MARKET REVIEW
need for additional energy infrastructure. This environment was favorable for midstream6 assets, helping the Alerian MLP Index to move higher. In addition, the energy MLP market overall benefited from clarifications by the FERC, provided in July 2018, regarding a number of open questions, including the final process by which natural gas and liquid pipelines owned by energy MLPs could implement the income tax adjustment and handle the accumulated deferred income tax. First, natural gas and liquids pipelines that chose to eliminate their tax allowance could also, according to the FERC, eliminate their accumulated deferred income tax, which might have a favorable impact on a pipeline’s rate base and thus mitigate any potential rate impact that could arise from higher than expected returns on equity for certain interstate regulated pipelines. Second, although the FERC reiterated its belief that the inclusion of a tax allowance in a pipeline’scost-of-service methodology would result in a “double recovery” of income tax costs, the commission said the pipeline could choose to reflect the 21% corporate tax rate passed into law by the Tax Cuts and Jobs Act, which became effective on January 1, 2018, instead of eliminating the tax allowance completely. For pipeline companies that choose to reduce their income tax allowance to the new 21% corporate rate, the FERC has guaranteed a three-year moratorium on rate investigations as long as the pipeline is not overearning relative to the FERC’s allowable return on equity threshold. The market considered the FERC’s clarifications to be favorable for impacted energy MLPs, as they helped remove some regulatory uncertainty that had weighed on the energy MLP market.
In October 2018, the energy sector and the broader equity market experienced substantial weakness due to investor concerns around global economic growth, rising interest rates and U.S.-China trade tensions. The S&P 500® Index ended the month down 6.8%, while the IXE and the Alerian MLP Index fell 11.3% and 8.0%, respectively. The decline in the IXE, which is inherently more sensitive to commodity prices, and in the Alerian MLP Index can be partially attributed to a 10.8%drop in WTI crude oil prices during October, which was, in turn, driven by the possibility that slowing global economic growth could soften crude oil demand and that U.S. sanction waivers could reduce losses in Iranian supply. In November 2018, the energy MLP sector remained relatively resilient, despite weakness in the broader energy sector. In our view, this was a function of continued momentum in midstream earnings results and persistent growth in U.S. crude oil and natural gas production. For October and November overall, the Alerian MLP Index fell 8.7%.
The energy MLP market was further hampered during the second half of the Reporting Period by weak investment flows. In the third quarter of 2018, actively managedopen-end energy MLP mutual funds, exchange traded funds (“ETFs”) and exchange traded notes (“ETNs”) experienced net investment outflows of $589 million.7 This marked the first ever quarter of net investment outflows since the inception of the Alerian MLP Index in 2006. The weakness was driven by $833 million of investment outflows from ETFs and ETNs, partially offset by investment inflows from actively managedopen-end mutual funds. In our opinion, regulatory uncertainty sidelined some investors despite energy MLPs’ strong operational results during the Reporting Period. We also noticed general investor apathy towards energy MLPs and energy infrastructure securities broadly given their relative underperformance versus other equity market segments during the last couple of years. Despite recent investor pessimism, we
| 6 | | The midstream component of the energy industry is usually defined as those companies providing products or services that help link the supply side, i.e. energy producers, and the demand side, i.e. energy end-users, for any type of energy commodity. Such midstream businesses can include, but are not limited to, those that process, store, market and transport various energy commodities. |
| 7 | | Source of investment flows data: U.S. Capital Advisors. |
4
MARKET REVIEW
note that energy MLPs continue to benefit from strong corporate execution, healthy macroeconomic factors and inexpensive valuations during the Reporting Period.
In other noteworthy news during the Reporting Period, a Colorado ballot measure — Colorado Proposition 112 — pressured midstream companies with exposure to that state’s oil and gas industry. Colorado Proposition 112 was an initiative that would have required future drilling permits to have a minimum setback of 2,500 feet from publicly occupied spaces, such as homes, schools, hospitals, parks and water sources. If it was passed by voters in November, the proposition may have effectively eliminated Colorado’s oil and gas industry, as little to no new development would occur after 2020 and natural production decline rates would reduce existing production over time. Uncertainty around the vote was an overhang for Alerian MLP Index constituents with Colorado exposure (approximately 10% of the Alerian MLP Index), starting in August 2018, as they sold off on fears the ballot measure would pass. On November 6th, Colorado Proposition 112 was defeated, with 56% of total votes in opposition to the proposed drilling regulation. We considered this a positive outcome for midstream owners and operators with revenue exposure to Colorado’s oil and gas production.
Finally, the Tax Cuts and Jobs Act has implications for energy MLPs and pooled investment vehicles, such as the Funds, that are structured as “C” corporations.
| • | | Implications for Energy MLPs. The energy MLP structure remains intact and the asset class also preserves itstax-advantageous position relative to entities structured as “C” corporations (albeit to a slightly lesser extent). Additionally, “C” corporation investors may benefit from a reduction in the corporate tax rate. A new income tax deduction for individuals, generally applicable to income from energy MLPs, may also benefit energy MLP investors. |
| • | | Implications for “C” corporation funds. Tax alterations that may impact “C” corporation funds include the reduction in the U.S. corporate tax rate and changes with respect to the utilization of net operating losses. |
Looking Ahead
When the Reporting Period started and through the end of September 2018, the global supply and demand picture appeared relatively healthy, supporting a 27.61% and 30.12% increase in WTI and Brent crude oil prices, respectively, despite some modest macro-related volatility along the way. However, during the last two months of the Reporting Period, WTI and Brent crude oil prices fell 30.47% and 29.03%, respectively, on lowered investor expectations for crude oil demand from the emerging markets, unexpectedly strong supply growth from the U.S. and Saudi Arabia, and Iranian sanction waivers. As of September 2018, which was the latest available data at the end of the Reporting Period, the U.S. was the largest producer of crude oil in the world at 11.47 million barrels per day and was exporting in excess of two million barrels per day of crude oil to global markets.8 Furthermore, according to net import/export figures during the week starting Sunday, November 25th, the U.S. became a net exporter of crude oil and petroleum products for the first time in 75 years.8 Although this data was reported in only a single week, we believe it is a milestone in the general trend towards U.S. energy independence and is a positive indicator for U.S. energy export infrastructure demand. The strength in U.S. production has resulted in increased throughput and utilization on U.S. midstream infrastructure and, in turn, has positively impacted the earnings power of
| 8 | | Source: U.S. Energy Information Administration. |
5
MARKET REVIEW
U.S.-based energy infrastructure assets. Over the course of the Reporting Period, we saw strong results from midstream companies, who by and large continued to meet and/or beat consensus expectations. We believe this positive earnings momentum should continue in 2019, supported by ongoing strength in U.S. crude oil and natural gas production, which we expect to grow by 10.85% and 8.03%, respectively, in 2019.9
At the end of the Reporting Period, we, along with the broader market, were focused on the upcoming December 6, 2018 “OPEC+” meeting at which supply-side concerns were likely to be a key topic of discussion. (OPEC+ is composed of the OPEC andnon-OPEC oil producing countries.) Leading into the meeting, market participants generally anticipated a production cut, though there was uncertainty around its size and whether it would address global oversupply expectations for 2019. (The December 6th meeting resulted in asix-month agreement to reduce production by 1.2 million barrels per day, effective January 1, 2019, and a plan to revisit the agreement during April 2019. Of that production cut, 0.8 million barrels per day are the responsibility of OPEC countries and 0.4 million barrels per day are the responsibility ofnon-OPEC countries, such as Russia.10) In our view, output limits should help global oversupply concerns, though it is unclear if global supply and demand will actually be balanced in 2019. Overall, market participants appear to have differing views about crude oil demand from the emerging markets, conformity with imposed OPEC cuts during 2019 and continued growth in U.S. production. We believe the uncertainty is likely to keep crude oil prices range-bound between $45 and $60 per barrel during the 2019 calendar year. In our view, this range is supportive for continued U.S. production growth and therefore, U.S.-based midstream assets. We base this view on two observations. First, U.S. crude oil production rose by nearly 1.3 million barrels per day during 2017, a time when crude oil prices averaged approximately $51 per barrel — which is in line with crude oil prices at the end of the Reporting Period. This suggests to us that a $45 to $60 per barrel price may be sufficient for producers to continue drilling at a healthy pace. Second, the forward curve for crude oil at the end of the Reporting Period indicated thatone-year forward prices could be close to $52 per barrel. (The forward curve is a function graph that defines the prices at which a contract for future delivery or payment can be concluded on the present day.One-year forward prices are the implied prices one year from the present day.) Accordingly, we expect U.S. crude oil producers to move aggressively to lock in that price, which we think would allow for continued production growth.
Beyond the macro environment, we continued to see positive trends at the company level during the Reporting Period. Companies were showing what we believe is increased capital discipline, which has historically been a point of contention between management teams and investors. Many energy MLPs have either cut or reduced distribution growth rates to maintain higher distribution coverage, thus retaining more capital within their businesses. In many cases, this action was taken with the goal of moving to a more self-funding11 model in order to rely less on the equity capital markets to fund growth. Also, many energy MLPs have become more selective about the capital projects they undertake and are choosing to invest only in what they consider their highest return opportunities. In our opinion, this shift should result in healthier balance sheets and ultimately stronger and more sustainable returns for unitholders. On another front, management teams appear to be addressing complexities around their
| 9 | | Based on data sourced from the U.S. Energy Information Administration. |
| 11 | | Self-funding means that organically generated cash flow in excess of distributions will be the source of funding for potential growth opportunities rather than reliance on the equity capital markets. |
6
MARKET REVIEW
corporate structure, with consolidation becoming an increasingly common theme. Consolidation transactions can come in many forms, such as abuy-in of incentive distribution rights12 by the limited partner or a roll up13 of assets between the limited partner and the general partner. We believe these strategies could help address the cost of capital burden associated with the general partner/limited partner relationship. During the Reporting Period, we saw several high-profile simplification transactions14 occur, and we believe structural simplifications may well contribute to positive performance for the sector as entities pursue less complex corporate structures and seek to align management and shareholder interests. This may boost investor sentiment and increase interest from institutional investors who have historically avoided energy infrastructure assets entirely. In our view, these trends may continue going forward, lowering hurdle rates15 and potentially strengthening returns on invested capital.
In our view, a number of the aforementioned factors may address investor concerns that have weighed on energy MLP valuations during the last several years. However, we believe there is a clear disconnect between the market’s distributable cash flow/unit expectations and current valuations. Based on multiple valuation metrics, such as enterprisevalue-to-earnings before interest, taxes, depreciation and amortization (“EBITDA”),16price-to-earnings ratios and the spread (difference in yields) versus10-year U.S. Treasury securities, energy MLPs remain cheap compared to historical averages, as well as relative to other income-oriented asset classes, such as REITs and utilities. We believe the market environment and increased discipline from management teams should warrant multiple expansion and appreciation in asset prices, with a reversion to historical levels suggesting to us that there is significant upside potential for energy MLPs.
| 12 | | Incentive distribution rights allow a general partner to receive incrementally larger percentages of an energy MLP’s total distributions as the energy MLP grows the distribution beyond established targets. |
| 13 | | A roll up is a process used by which assets are merged. The principal aim of a roll up is to reduce costs through economies of scale. |
| 14 | | A simplification transaction is when multiple entities controlled by the same corporate parent simplify their corporate structure through actions such as mergers, acquisitions or reduction of incentive distribution rights. |
| 15 | | A hurdle rate is the minimum rate of return on a project or investment required by an investor. The hurdle rate denotes appropriate compensation for the level of risk present; riskier projects generally have higher hurdle rates than those that are deemed to be less risky. |
| 16 | | Enterprise value is the market value of debt, common equity and preferred equity minus the value of cash. Enterprise value/EBITDA is a financial ratio that measures a company’s value. |
7
PORTFOLIO RESULTS
Goldman Sachs MLP and Energy Renaissance Fund
Investment Objective and Principal Strategy
The Fund seeks a high level of total return with an emphasis on current distributions to shareholders. The Fund seeks to achieve its investment objective by investing primarily in master limited partnership (“MLP”) and other energy investments. The Fund intends to use leverage to seek to achieve its investment objective. It concentrates its investments in the energy sector, with an emphasis on midstream MLP investments. Under normal market conditions, the Fund will invest at least 80% of its managed assets in MLPs and other energy investments. The Fund’s MLP investments may include, but are not limited to, MLPs structured as limited partnerships (“LPs”) or limited liability companies (“LLCs”); MLPs that are organized as LPs or LLCs, but taxed as “C” corporations; equity securities that represent an indirect interest in an MLP issued by an MLP affiliate, including institutional units and MLP general partner or managing member interests; “C” corporations whose predominant assets are interests in MLPs; MLP equity securities, including MLP common units, MLP subordinated units, MLP convertible subordinated units and MLP preferred units; private investments in public equities issued by MLPs; MLP debt securities; and other U.S. and non-U.S. equity and fixed income securities and derivative instruments that provide exposure to the MLP market, including pooled investment vehicles that primarily hold MLP interests and exchange-traded notes. The Fund’s other energy investments may include equity and fixed income securities of U.S. and non-U.S. companies other than MLPs that (i) are classified by a third party as operating within the oil and gas storage, transportation, refining, marketing, drilling, exploration or production sub-industries or (ii) have at least 50% of their assets, income, sales or profits committed to, or derived from, the exploration, development, production, gathering, transportation (including marine), transmission, terminal operation, processing, storage, refining, distribution, mining or marketing of natural gas, natural gas liquids (including propane), crude oil, refined petroleum products, coal, electricity or other energy sources, energy-related equipment or services.
Portfolio Management Discussion and Analysis
Below, the Goldman Sachs Energy and Infrastructure Team discusses the Goldman Sachs MLP and Energy Renaissance Fund’s (the “Fund”) performance and positioning for the 12-month period ended November 30, 2018 (the “Reporting Period”).
| Q | | How did the Fund perform during the Reporting Period? |
| A | | During the Reporting Period, the Fund’s average annual total return based on its net asset value (“NAV”) was 6.31%. The Fund’s average annual total return based on market price was 3.86% for the same period. By way of reference, the Alerian MLP Index1 had an average annual total return of 1.21% during the Reporting Period. By comparison, the Cushing® MLP High Income Index2 had an average annual total return of -2.46% for the Reporting Period. As of November 30, 2018, the Fund’s NAV was $5.80, and its market price was $5.31. |
| | 1 | | Source: Alerian. The Alerian MLP Index is a composite of prominent energy MLPs that captures about 85% of the total float-adjusted market capitalization of the energy MLP sector. |
| | 2 | | Source: Cushing® Asset Management. The Cushing® MLP High Income Index tracks the performance of 30 publicly traded energy and shipping MLP securities with an emphasis on current yield. |
| Q | | What was the Fund’s current distribution rate at the end of the Reporting Period? |
| A | | During the Reporting Period overall, the Fund declared dividends totaling $0.64 per unit. We note that this matches the $0.64 per unit of declared distributions for the 12 months ended November 30, 2017. As of November 30, 2018, the Fund’s current annualized distribution rate based on its NAV was 11.03%. The Fund’s current annualized distribution rate based on its market price was 12.05% on November 30, 2018. |
| Q | | What key factors were responsible for the Fund’s performance during the Reporting Period? |
| A | | Security selection, the macro environment in the crude oil and natural gas markets, and the regulatory environment drove the Fund’s performance during the Reporting Period. Securities with the greatest exposure to commodity prices and volumes were the Fund’s best performers, as commodity |
8
PORTFOLIO RESULTS
| | prices rallied from the beginning of the Reporting Period through September 2018. Conversely, securities with a lower beta to commodity prices were the worst Fund performers. (In this context, having a lower beta means these securities tended to be less correlated to commodity prices.) |
| | | Regarding its exposures, the Fund was positively impacted by positions in the petroleum pipeline transportation and the gathering and processing subsectors.3 These subsectors benefited from record U.S. natural gas and crude oil production, with the gathering and processing subsector seeing the most direct benefit as it is closest to the wellhead and, therefore, experienced the greatest fluctuation in volumes. On the negative side, the natural gas pipeline transportation subsector was the worst performer amid investor concerns about project completions as well as questions around leverage and distribution growth potential. |
| Q | | What individual holdings added to the Fund’s performance during the Reporting Period? |
| A | | During the Reporting Period, the Fund’s holdings of Energy Transfer Partners, L.P., Williams Partners L.P. and Crestwood Equity Partners LP contributed positively to performance. |
| | | The Fund’s top contributor was Energy Transfer Partners, L.P. (ETP), which offers natural gas, natural gas liquids, crude oil and refined products transportation and storage services. At the beginning of the Reporting Period, ETP benefited from its first quarter 2018 earnings announcement, which included stronger than market expected results for its interstate and intrastate transportation/storage segment. During the second half of the Reporting Period, its shares rose on the announcement of a simplification transaction4 in which ETP’s general partner, Energy Transfer Equity, L.P., would acquire its remaining public stake in ETP in a deal valued at $60.3 billion. The transaction was viewed positively by the market, which expects it to generate annual savings of more than $1.5 billion for the combined entity and to align investor and management interests. Because we shared this constructive view, the Fund maintained its exposure to ETP through a position in the combined entity, known as Energy Transfer L.P., at the end of the Reporting Period. |
| | | Williams Partners L.P. (WPZ), an energy infrastructure company focused on connecting North America’s natural gas and natural gas liquids market, also added to the Fund’s performance during the Reporting Period. The company benefited most from its merger with parent company Williams Companies (WMB), which acquired WPZ at a 7% premium and in an all stock-for-unit transaction valued at $10.5 billion. Market participants appeared to believe the merger would provide immediate benefits to shareholders, while also simplifying the company’s corporate structure, streamlining its governance and preserving its investment grade credit rating. By the end of the Reporting Period, we had exited the Fund’s position in WPZ and WMB to allocate capital to higher yielding names. |
| | | Crestwood Equity Partners LP (CEQP), which has both a natural gas and storage business and a natural gas liquids and crude oil services business, was another notable contributor to the Fund’s returns during the Reporting Period. The company reported solid first and second quarter 2018 results, driven by new projects in the Permian and Bakken Basins. CEQP was also helped by increased profits from its Bakken Basin investments and additional growth opportunities in the Delaware and Powder River Basins, as producer activity there remained strong. We added to the Fund’s position in CEQP during the Reporting Period because we believe it offers favorable exposure to a potential increase in crude oil prices. |
| Q | | What individual holdings detracted from the Fund’s performance during the Reporting Period? |
| A | | Investments in Energy Transfer L.P., Buckeye Partners, L.P. and Shell Midstream Partners, L.P. detracted from the Fund’s returns. |
| | | The top detractor from Fund performance during the Reporting Period was Energy Transfer L.P. (ET), which engages in natural gas midstream,5 liquid transportation and storage businesses. In our opinion, its shares were challenged by technical (supply/demand) selling pressure after a simplification transaction, discussed earlier, in which Energy Transfer Equity, L.P. acquired its remaining public stake in ETP and became the combined entity known as ET. We also believe that toward the end of the Reporting Period, shares of ET were hurt by the broad decline in crude oil and natural gas |
| | 3 | | Sector and subsector allocations are defined by GSAM and may differ from sector allocations used by the Alerian MLP Index. |
| | 4 | | A simplification transaction is when multiple entities controlled by the same corporate parent simplify their corporate structure through actions such as mergers, acquisitions or reduction of incentive distribution rights. |
| | 5 | | The midstream component of the energy industry is usually defined as those companies providing products or services that help link the supply side, i.e. energy producers, and the demand side, i.e. energy end-users, for any type of energy commodity. Such midstream businesses can include, but are not limited to, those that process, store, market and transport various energy commodities. |
9
PORTFOLIO RESULTS
| | liquid prices. At the conclusion of the Reporting Period, the Fund continued to hold ET because of our positive view on the company. |
| | | The Fund was further hampered by an investment in Buckeye Partners, L.P. (BPL), an operator of refined product pipelines and terminals. BPL reported earnings in the first, second and third quarters of 2018 that missed consensus expectations, citing challenging market conditions and contract expirations. Additionally, in its third quarter earnings announcement, the company said it would implement a distribution cut of approximately 40% as it sought to improve its distribution coverage ratio.6 We decided to trim the Fund’s position in BPL in order to allocate capital to higher yielding names. |
| | | Another detractor from Fund performance was Shell Midstream Partners, L.P. (SHLX), which owns, operates, develops and acquires pipelines and other midstream assets. Its shares declined after the company’s announcement of a sizable equity offering in the unfavorable market environment. Additionally, the company’s failure to address its incentive distribution rights7 continued to be a point of contention within its investor base during the Reporting Period. We had initiated a Fund position in the stock after the equity offering announcement because we believed the company was trading at attractive valuations and had strong distribution growth potential. For the same reasons, the Fund continued to hold the stock at the end of the Reporting Period. |
| Q | | Were there any notable purchases or sales during the Reporting Period? |
| A | | In addition to the purchase of SHLX, mentioned previously, the Fund purchased MPLX LP (MPLX), which acquires, owns, operates and develops crude oil, refined products and other hydrocarbon-based product pipelines. We established the position over the course of the Reporting Period, as MPLX was trading at what we considered to be attractive levels based on its healthy fundamentals, strong distribution coverage ratio and robust growth plan. |
| | | By the end of the Reporting Period, the Fund exited its investment in Plains All American Pipeline, L.P. (PAA), a partnership involved in intrastate crude oil pipeline transportation and terminalling storage activities, in addition to the gathering and marketing of crude oil, refined products and natural gas liquids. We first reduced the position after PAA’s fourth quarter 2017 announcement of a distribution cut, keeping a modest weighting to maintain the Fund’s exposure to the Permian Basin. In early May 2018, we eliminated the position and reallocated the assets to higher yielding opportunities. |
| | | The Fund also sold its investment in TransMontaigne Partners LP (TLP) during the Reporting Period. TLP provides integrated terminalling, storage, transportation and related services for customers engaged in the distribution and marketing of light and heavy refined petroleum products. In July 2018, TLP received a cash buyout offer from its private equity sponsor at a 13% premium. We maintained the Fund’s position in the stock, as we expected TLP to receive a potential sweetener on top of the buyout premium. (A sweetener is an added incentive aimed at making a transaction more attractive.) Once the sweetener was provided, we sold the holding to reallocate the capital to what we viewed as more attractively valued companies. |
| Q | | How did the Fund use derivatives and similar instruments during the Reporting Period? |
| A | | During the Reporting Period, the Fund did not use derivatives or similar instruments. |
| Q | | How did the Fund use leverage during the Reporting Period? |
| A | | The Fund is permitted to obtain leverage using any form or combination of financial leverage instruments, including through funds borrowed from banks or other financial institutions (i.e., a credit facility), margin facilities or notes issued by the Fund and the leverage attributable to similar transactions entered into by the Fund, and it reserves the right to obtain leverage to the extent permitted by the Investment Company Act of 1940. During the Reporting Period, the Fund obtained leverage through a margin facility.8 The use of this leverage added to the Fund’s performance during the Reporting Period. During the Reporting Period, the Fund’s leverage was maintained at a level between 29% and 34%. As of November 30, 2018, the margin facility represented 33.53% of the Fund’s managed assets. |
| | 6 | | The distribution coverage ratio is an energy MLP’s distributable cash flow divided by the total amount of distributions it has paid out. It is an indication of an energy MLP’s ability to maintain its current cash distribution level. |
| | 7 | | Incentive distribution rights allow a general partner to receive incrementally larger percentages of an energy MLP’s total distributions as the energy MLP grows the distribution beyond established targets. |
| | 8 | | The Fund currently has a fixed/floating rate margin loan facility with a major financial institution. |
10
FUND BASICS
Goldman Sachs MLP and Energy Renaissance Fund
as of November 30, 2018

| | | | | | |
| | FUND SNAPSHOT | |
| | | As of November 30, 2018 | | | |
| | Net Asset Value (NAV)1 | | $ | 5.80 | |
| | Market Price1 | | $ | 5.31 | |
| | Premium (Discount) to NAV2 | | | -8.45 | % |
| | Leverage3 | | | 33.53 | % |
| | Distribution Rate – NAV4 | | | 11.03 | % |
| | | Distribution Rate – Market Price4 | | | 12.05 | % |
| | 1 | | The Market Price is the price at which the Fund’s common shares are trading on the NYSE. The Market Price of the Fund’s common shares will fluctuate and, at the time of sale, common shares may be worth more or less than the original investment or the Fund’s then current net asset value (“NAV”). The NAV is the market value of one share of the Fund. This amount is derived by dividing the total value of all the securities in the Fund’s portfolio, plus any other assets, less any liabilities, by the number of Fund shares outstanding. The Fund cannot predict whether its common shares will trade at, above or below NAV. Shares ofclosed-end investment companies frequently trade at a discount from their NAV, which may increase investors’ risk of loss. |
| | 2 | | The premium/discount to NAV is calculated as the market price divided by the NAV of the Fund minus 1, expressed as a percentage. If this value is positive, the Fund is trading at a premium to its NAV. If the value is negative, the Fund is trading at a discount to its NAV. |
| | 3 | | The Fund is permitted to obtain leverage using any form or combination of financial leverage instruments, including through funds borrowed from banks or other financial institutions (i.e., a credit facility), margin facilities or notes issued by the Fund and the leverage attributable to similar transactions entered into by the Fund. The Fund’s use of leverage through a credit facility is calculated as a percentage of the Fund’s Managed Assets. Managed Assets are defined as total assets of the Fund (including assets attributable to borrowings for investment purposes) minus the sum of the Fund’s accrued liabilities (other than liabilities representing borrowings for investment purposes). |
| | 4 | | The Distribution Rate is calculated by annualizing the most recent distribution amount declared divided by the most recent closing Market Price or NAV. The Distribution Rate is subject to change and is not an indication of Fund performance. A portion of the Fund’s distributions will likely be treated for tax purposes as a return of capital. A return of capital is not taxable and results in a reduction in the tax basis of a shareholder’s investment. The final determination regarding the nature of the distributions will be made after the end of the Fund’s fiscal year when the Fund can determine its earnings and profits. The final tax status of the distribution may differ substantially and will be made available to shareholders after the close of each calendar year. The proportion of distributions that are treated as taxable distributions may also vary and/or increase in future years. The ultimate composition of these distributions may vary due to a variety of factors including projected income and expenses, depreciation and depletion, and any tax elections made by the MLP. |
| | | | | | | | | | |
| | PERFORMANCE REVIEW | |
| | | December 1, 2017–November 30, 2018 | | Fund Total Return
(based on NAV)5 | | | Fund Total Return
(based on Market Price)5 | |
| | | Common Shares | | | 6.31 | % | | | 3.86 | % |
| | 5 | | Total returns are calculated assuming purchase of a share at the market price or NAV on the first day and sale of a share at the market price or NAV on the last day of each period reported. Dividends and distributions, if any, are assumed, for purposes of this calculation, to be reinvested at prices obtained under the Fund’s dividend reinvestment plan. The Total Returns based on NAV and Market Price do not reflect brokerage commissions or sales charges in connection with the purchase or sale of Fund shares, which if included would lower the performance shown above. The NAV used in the Total Return calculation includes all management fees, interest expense (if any) and operating expenses incurred by the Fund. Operating expenses include custody, accounting and administrative services, professional fees, transfer agency fees, registration, printing and mailing costs and Trustee fees. Total returns for periods less than one full year are not annualized. |
The returns set forth in the tables above represent past performance. Past performance does not guarantee future results. The Fund’s investment returns and principal value will fluctuate. Current performance may be lower or higher than the performance quoted above. Please visit our web site at www.GSAMFUNDS.com/CEF to obtain the most recentmonth-end returns.Closed-end funds, unlikeopen-end funds, are not continuously offered. Once issued in a public offering, shares ofclosed-end funds are traded in the open market through a stock exchange.
11
FUND BASICS
| | | | | | | | |
| | TOP TEN HOLDINGS AS OF 11/30/186 |
| | | Holding | | % of Net Assets | | | Line of Business |
| | Energy Transfer LP | | | 19.1 | % | | Pipeline Transportation | Natural Gas |
| | DCP Midstream LP | | | 14.8 | | | Gathering + Processing |
| | Targa Resources Corp. | | | 13.7 | | | Gathering + Processing |
| | MPLX LP | | | 12.1 | | | Gathering + Processing |
| | Western Gas Partners LP | | | 9.4 | | | Gathering + Processing |
| | Sunoco LP | | | 8.6 | | | Marketing | Wholesale |
| | NuStar Energy LP | | | 8.6 | | | Pipeline Transportation | Petroleum |
| | Crestwood Equity Partners LP | | | 7.1 | | | Gathering + Processing |
| | Shell Midstream Partners L.P. | | | 6.4 | | | Pipeline Transportation | Petroleum |
| | | PBF Logistics LP | | | 6.2 | | | Pipeline Transportation | Petroleum |
| | 6 | | The top 10 holdings may not be representative of the Fund’s future investments. |
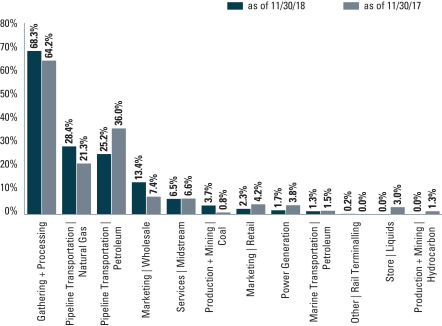
| | 7 | | The Fund is actively managed and, as such, its composition may differ over time. Consequently, the Fund’s overall sector allocations may differ from the percentages contained in the graph above. The percentage shown for each investment category reflects the value of investments in that category as a percentage of total net assets. As a result of borrowings, the percentages may add to an amount in excess of 100%. Sector allocations are defined by GSAM and may differ from sector allocations used by the Alerian MLP Index. |
12
PORTFOLIO RESULTS
Goldman Sachs MLP Income Opportunities Fund
Investment Objective and Principal Strategy
The Fund seeks a high level of total return with an emphasis on current distributions to shareholders. The Fund seeks to achieve its investment objective by investing primarily in master limited partnerships (“MLPs”). The Fund intends to use leverage to seek to achieve its investment objective. Under normal market conditions, the Fund will invest at least 80% of its managed assets in MLP investments. The Fund’s MLP investments may include, but are not limited to, MLPs structured as limited partnerships (“LPs”) or limited liability companies (“LLCs”); MLPs that are organized as LPs or LLCs, but taxed as “C” corporations; equity securities that represent an indirect interest in an MLP issued by an MLP affiliate, including institutional units and MLP general partner or managing member interests; “C” corporations whose predominant assets are interests in MLPs; MLP equity securities, including MLP common units, MLP subordinated units, MLP convertible subordinated units and MLP preferred units; private investments in public equities issued by MLPs; MLP debt securities; and other U.S. and non-U.S. equity and fixed income securities and derivative instruments that provide exposure to the MLP market, including pooled investment vehicles that primarily hold MLP interests and exchange-traded notes. The Fund currently expects to concentrate its investments in the energy sector, with an emphasis on midstream MLP investments, including companies that are engaged in the treatment, gathering, compression, processing, transportation, transmission, fractionation, storage and terminalling of natural gas, natural gas liquids, crude oil, refined products or coal.
Portfolio Management Discussion and Analysis
Below, the Goldman Sachs Energy and Infrastructure Team discusses the Goldman Sachs MLP Income Opportunities Fund’s (the “Fund”) performance and positioning for the 12-month period ended November 30, 2018 (the “Reporting Period”).
| Q | | How did the Fund perform during the Reporting Period? |
| A | | During the Reporting Period, the Fund’s average annual total return based on its net asset value (“NAV”) was 4.83%. The Fund’s average annual total return based on market price was 4.44% for the same period. By way of reference, the Alerian MLP Index1 had an average annual total return of 1.21% during the Reporting Period. By comparison, the Cushing® MLP High Income Index2 had an average annual total return of -2.46% for the Reporting Period. As of November 30, 2018, the Fund’s NAV was $8.39, and its market price was $7.96. |
| Q | | What was the Fund’s current distribution rate at the end of the Reporting Period? |
| A | | During the Reporting Period overall, the Fund declared dividends totaling $0.84 per unit. We note that this matches the $0.84 per unit of declared distributions for the 12 months ended November 30, 2017. As of November 30, 2018, the Fund’s current annualized distribution rate based on its NAV was 10.01%. The Fund’s current annualized distribution rate based on its market price was 10.55% on November 30, 2018. |
| Q | | What key factors were responsible for the Fund’s performance during the Reporting Period? |
| A | | Security selection, the macro environment in the crude oil and natural gas markets, and the regulatory environment drove the Fund’s performance during the Reporting Period. Securities with the greatest exposure to commodity prices and volumes were the Fund’s best performers, as commodity prices rallied from the beginning of the Reporting Period through September 2018. Conversely, securities with a lower beta to commodity prices were the worst Fund performers. (In this context, having a lower beta means these securities tended to be less correlated to commodity prices.) |
| | Regarding its exposures, the Fund was positively impacted by positions in the petroleum pipeline transportation and the gathering and processing subsectors.3 These subsectors benefited from record U.S. natural gas and crude oil production, with the gathering and processing subsector |
| | 1 | | Source: Alerian. The Alerian MLP Index is a composite of prominent energy MLPs that captures about 85% of the total float-adjusted market capitalization of the energy MLP sector. |
| | 2 | | Source: Cushing® Asset Management. The Cushing® MLP High Income Index tracks the performance of 30 publicly traded energy and shipping MLP securities with an emphasis on current yield. |
| | 3 | | Sector and subsector allocations are defined by GSAM and may differ from sector allocations used by the Alerian MLP Index. |
13
PORTFOLIO RESULTS
| | seeing the most direct benefit as it is closest to the wellhead and, therefore, experienced the greatest fluctuation in volumes. On the negative side, the natural gas pipeline transportation subsector was the worst performer amid investor concerns about project completions as well as questions around leverage and distribution growth potential. |
| Q | | What individual holdings added to the Fund’s performance during the Reporting Period? |
| A | | During the Reporting Period, the Fund’s holdings of Energy Transfer Partners, L.P.; Targa Resources Corp. and Plains All American Pipeline L.P. contributed positively to returns. |
| | Energy Transfer Partners, L.P. (ETP), which offers natural gas, natural gas liquids, crude oil and refined products transportation and storage services, added most to the Fund’s performance. At the beginning of the Reporting Period, ETP benefited from its first quarter 2018 earnings announcement, which included stronger than market expected results for its interstate and intrastate transportation/storage segment. During the second half of the Reporting Period, its shares rose on the announcement of a simplification transaction4 in which ETP’s general partner, Energy Transfer Equity, L.P., would acquire its remaining public stake in ETP in a deal valued at $60.3 billion. The transaction was viewed positively by the market, which expects it to generate annual savings of more than $1.5 billion for the combined entity and to align investor and management interests. Because we shared this constructive view, the Fund maintained its exposure to ETP through a position in the combined entity, known as Energy Transfer L.P., at the end of the Reporting Period. |
| | Another notable contributor during the Reporting Period was Targa Resources Corp. (TRGP), an independent midstream5 services provider that is primarily engaged in gathering, storing, processing and transporting oil, natural gas and refined petroleum products. TRGP benefited from rising crude oil prices during the first half of the Reporting Period and from positive fundamentals in the natural gas liquids market during the second half of the Reporting Period. We trimmed the Fund’s position in TRGP by the end of the Reporting Period to allocate capital to companies with what we considered more attractive valuations. |
| | The Fund was also helped during the Reporting Period by its investment in Plains All American Pipeline L.P. (PAA), which is involved in intrastate crude oil pipeline transportation and terminalling storage activities, in addition to the gathering and marketing of crude oil, refined products and natural gas liquids. PAA benefited from its leading position in the Permian Basin, where takeaway capacity constraints drove widening price differentials and higher crude oil prices led to volume growth. Additionally, widening price differentials and higher crude oil prices boosted profitability in PAA’s marketing and transportation segments. During the Reporting Period, we eliminated the Fund’s position in PAA and reallocated the capital to higher yielding opportunities. We first reduced the size of the position after PAA announced a distribution cut in the fourth quarter of 2017 but kept a modest weighting to maintain the Fund’s exposure to the Permian Basin. In early May 2018, we eliminated the holding completely. |
| Q | | What individual holdings detracted from the Fund’s performance during the Reporting Period? |
| A | | Investments in Energy Transfer L.P., EQM Midstream Partners, LP and Buckeye Partners, L.P. hurt the Fund’s performance during the Reporting Period. |
| | The Fund’s top detractor was Energy Transfer L.P. (ET), which engages in natural gas midstream, liquid transportation and storage businesses. In our opinion, its shares were challenged by technical (supply/demand) selling pressure after a simplification transaction, discussed earlier, in which Energy Transfer Equity, L.P. acquired its remaining public stake in ETP and became the combined entity known as ET. We also believe that toward the end of the Reporting Period, shares of ET were hurt by the broad decline in crude oil and natural gas liquid prices. At the conclusion of the Reporting Period, the Fund continued to hold ET because of our constructive view on the company. |
| | EQM Midstream Partners, LP (EQM), which acquires, owns and develops midstream natural gas assets in the Appalachian Basin, also hampered Fund returns. EQM’s shares declined after the company announced a reduction in production forecasts and also because of increased market concerns |
| | 4 | | A simplification transaction is when multiple entities controlled by the same corporate parent simplify their corporate structure through actions such as mergers, acquisitions or reduction of incentive distribution rights. |
| | 5 | | The midstream component of the energy industry is usually defined as those companies providing products or services that help link the supply side, i.e. energy producers, and the demand side, i.e. energy end-users, for any type of energy commodity. Such midstream businesses can include, but are not limited to, those that process, store, market and transport various energy commodities. |
14
PORTFOLIO RESULTS
| | about the treatment of incentive distribution rights6 in a potential simplification transaction. We added to the Fund’s position in EQM during the Reporting Period, as we thought its valuations were attractive and because the company offered what we considered to be a high and stable yield. |
| | Another key detractor was Buckeye Partners, L.P. (BPL), an operator of refined product pipelines and terminals. BPL reported earnings in the first, second and third quarters of 2018 that missed consensus expectations, citing challenging market conditions and contract expirations. Additionally, in its third quarter earnings announcement, the company said it would implement a distribution cut of approximately 40% as it sought to improve its distribution coverage ratio.7 We decided to add to the Fund’s position in BPL during the Reporting Period, as we believed the stock was trading below its fundamental value. |
| Q | | Were there any notable purchases or sales during the Reporting Period? |
| A | | During the Reporting Period, the Fund initiated a position in Sunoco LP (SUN), which distributes motor fuel to convenience stores, independent dealers, commercial customers and distributors. We added the position, as we believe SUN offers an attractive and sustainable yield and has strong fundamentals. |
| | Another purchase made during the Reporting Period was Shell Midstream Partners, L.P. (SHLX), which owns, operates, develops and acquires pipelines and other midstream assets. We established the position when SHLX was trading at what we considered to be attractive levels after it made an equity offering announcement. Additionally, we continue to believe SHLX has strong distribution growth potential. |
| | In addition to the sale of PAA, mentioned previously, we exited the Fund’s position in Hoegh LNG Partners L.P. (HMLP), a provider of floating liquefied natural gas services. We decided to eliminate HMLP due to our uncertainty about its distribution sustainability, and reallocated the capital to companies we believed had higher distribution growth potential. |
| Q | | How did the Fund use derivatives and similar instruments during the Reporting Period? |
| A | | During the Reporting Period, the Fund did not use derivatives or similar instruments. |
| Q | | How did the Fund use leverage during the Reporting Period? |
| A | The Fund is permitted to obtain leverage using any form or combination of financial leverage instruments, including through funds borrowed from banks or other financial institutions (i.e., a credit facility), margin facilities or notes issued by the Fund and the leverage attributable to similar transactions entered into by the Fund, and it reserves the right to obtain leverage to the extent permitted by the Investment Company Act of 1940. During the Reporting Period, the Fund obtained leverage through a margin facility.8 The use of this leverage added to the Fund’s performance during the Reporting Period. During the Reporting Period, the Fund’s leverage was maintained at a level between 29% and 34%. As of November 30, 2018, the margin facility represented 33.52% of the Fund’s managed assets. |
| | 6 | | Incentive distribution rights allow a general partner to receive incrementally larger percentages of an energy MLP’s total distributions as the energy MLP grows the distribution beyond established targets. |
| | 7 | | The distribution coverage ratio is an energy MLP’s distributable cash flow divided by the total amount of distributions it has paid out. It is an indication of an energy MLP’s ability to maintain its current cash distribution level. |
| | 8 | | The Fund currently has a fixed/floating rate margin loan facility with a major financial institution. |
15
FUND BASICS
Goldman Sachs MLP Income Opportunities Fund
as of November 30, 2018

| | | | | | |
| | FUND SNAPSHOT | |
| | | As of November 30, 2018 | | | |
| | Net Asset Value (NAV)1 | | $ | 8.39 | |
| | Market Price1 | | $ | 7.96 | |
| | Premium (Discount) to NAV2 | | | -5.13 | % |
| | Leverage3 | | | 33.52 | % |
| | Distribution Rate – NAV4 | | | 10.01 | % |
| | | Distribution Rate – Market Price4 | | | 10.55 | % |
| | 1 | | The Market Price is the price at which the Fund’s common shares are trading on the NYSE. The Market Price of the Fund’s common shares will fluctuate and, at the time of sale, common shares may be worth more or less than the original investment or the Fund’s then current net asset value (“NAV”). The NAV is the market value of one share of the Fund. This amount is derived by dividing the total value of all the securities in the Fund’s portfolio, plus any other assets, less any liabilities, by the number of Fund shares outstanding. The Fund cannot predict whether its common shares will trade at, above or below NAV. Shares ofclosed-end investment companies frequently trade at a discount from their NAV, which may increase investors’ risk of loss. |
| | 2 | | The premium/discount to NAV is calculated as the market price divided by the NAV of the Fund minus 1, expressed as a percentage. If this value is positive, the Fund is trading at a premium to its NAV. If the value is negative, the Fund is trading at a discount to its NAV. |
| | 3 | | The Fund is permitted to obtain leverage using any form or combination of financial leverage instruments, including through funds borrowed from banks or other financial institutions (i.e., a credit facility), margin facilities or notes issued by the Fund and the leverage attributable to similar transactions entered into by the Fund. The Fund’s use of leverage through a credit facility is calculated as a percentage of the Fund’s Managed Assets. Managed Assets are defined as total assets of the Fund (including assets attributable to borrowings for investment purposes) minus the sum of the Fund’s accrued liabilities (other than liabilities representing borrowings for investment purposes). |
| | 4 | | The Distribution Rate is calculated by annualizing the most recent distribution amount declared divided by the most recent closing Market Price or NAV. The Distribution Rate is subject to change and is not an indication of Fund performance. A portion of the Fund’s distributions will likely be treated for tax purposes as a return of capital. A return of capital is not taxable and results in a reduction in the tax basis of a shareholder’s investment. The final determination regarding the nature of the distributions will be made after the end of the Fund’s fiscal year when the Fund can determine its earnings and profits. The final tax status of the distribution may differ substantially and will be made available to shareholders after the close of each calendar year. The proportion of distributions that are treated as taxable distributions may also vary and/or increase in future years. The ultimate composition of these distributions may vary due to a variety of factors including projected income and expenses, depreciation and depletion, and any tax elections made by the MLP. |
16
FUND BASICS
| | | | | | | | | | |
| | PERFORMANCE REVIEW | |
| | | December 1, 2017–November 30, 2018 | | Fund Total Return
(based on NAV)5 | | | Fund Total Return
(based on Market Price)5 | |
| | | Common Shares | | | 4.83 | % | | | 4.44 | % |
| | 5 | | Total returns are calculated assuming purchase of a share at the market price or NAV on the first day and sale of a share at the market price or NAV on the last day of each period reported. Dividends and distributions, if any, are assumed, for purposes of this calculation, to be reinvested at prices obtained under the Fund’s dividend reinvestment plan. The Total Returns based on NAV and Market Price do not reflect brokerage commissions or sales charges in connection with the purchase or sale of Fund shares, which if included would lower the performance shown above. The NAV used in the Total Return calculation includes all management fees, interest expense (if any) and operating expenses incurred by the Fund. Operating expenses include custody, accounting and administrative services, professional fees, transfer agency fees, registration, printing and mailing costs and Trustee fees. Total returns for periods less than one full year are not annualized. |
The returns set forth in the tables above represent past performance. Past performance does not guarantee future results. The Fund’s investment returns and principal value will fluctuate. Current performance may be lower or higher than theperformance quoted above. Please visit our web site at www.GSAMFUNDS.com/CEF to obtain the most recentmonth-end returns.Closed-end funds, unlikeopen-end funds, are not continuously offered. Once issued in a public offering, shares ofclosed-end funds are traded in the open market through a stock exchange.
| | | | | | | | |
| | TOP TEN HOLDINGS AS OF 11/30/186 |
| | | Holding | | % of Net Assets | | | Line of Business |
| | Energy Transfer LP | | | 17.9 | % | | Pipeline Transportation | Natural Gas |
| | EQM Midstream Partners, LP | | | 12.0 | | | Pipeline Transportation | Natural Gas |
| | MPLX LP | | | 11.7 | | | Gathering + Processing |
| | Alliance Resource Partners LP | | | 9.6 | | | Production + Mining | Coal |
| | Sunoco LP | | | 9.0 | | | Marketing | Wholesale |
| | Targa Resources Corp. | | | 9.0 | | | Gathering + Processing |
| | DCP Midstream LP | | | 8.6 | | | Gathering + Processing |
| | Shell Midstream Partners L.P. | | | 7.6 | | | Pipeline Transportation | Petroleum |
| | Western Gas Partners LP | | | 6.3 | | | Gathering + Processing |
| | | USA Compression Partners LP | | | 5.9 | | | Services | Midstream |
| | 6 | | The top 10 holdings may not be representative of the Fund’s future investments. |
17
FUND BASICS
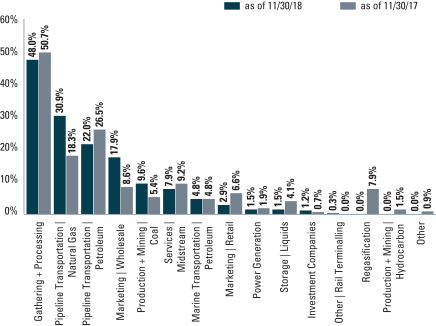
| | 7 | | The Fund is actively managed and, as such, its composition may differ over time. Consequently, the Fund’s overall sector allocations may differ from the percentages contained in the graph above. The percentage shown for each investment category reflects the value of investments in that category as a percentage of total net assets. As a result of borrowings, the percentages may add to an amount in excess of 100%. Sector allocations are defined by GSAM and may differ from sector allocations used by the Alerian MLP Index. |
18
GOLDMAN SACHS MLP AND ENERGY RENAISSANCE FUND
Schedule of Investments
November 30, 2018
| | | | | | | | |
| Shares | | | Description | | Value | |
| Common Stocks – 150.7% | | | |
| Gathering + Processing – 68.3% | | | |
| | 525,033 | | | Antero Midstream GP LP | | $ | 7,775,739 | |
| | 683,913 | | | Antero Midstream Partners LP | | | 18,917,033 | |
| | 389,715 | | | CNX Midstream Partners LP | | | 7,053,841 | |
| | 1,109,498 | | | Crestwood Equity Partners LP | | | 32,952,091 | |
| | 2,004,770 | | | DCP Midstream LP | | | 68,322,562 | |
| | 1,211,582 | | | Enable Midstream Partners LP | | | 16,162,504 | |
| | 1,683,205 | | | MPLX LP | | | 55,764,582 | |
| | 560,600 | | | Sanchez Midstream Partners LP | | | 1,653,770 | |
| | 1,412,000 | | | Targa Resources Corp. | | | 63,017,560 | |
| | 975,901 | | | Western Gas Partners LP | | | 43,369,040 | |
| | | | | | | | |
| | | | | | | 314,988,722 | |
| | |
| Marine Transportation | Petroleum – 1.3% | | | |
| | 304,737 | | | KNOT Offshore Partners LP | | | 6,106,929 | |
| | |
| Marketing | Retail – 2.3% | | | |
| | 280,500 | | | AmeriGas Partners LP | | | 10,423,380 | |
| | 10,000 | | | Suburban Propane Partners LP | | | 233,600 | |
| | | | | | | | |
| | | | | | | 10,656,980 | |
| | |
| Marketing | Wholesale – 13.4% | | | |
| | 832,573 | | | CrossAmerica Partners LP | | | 13,138,002 | |
| | 487,869 | | | Sprague Resources LP | | | 8,693,825 | |
| | 1,422,327 | | | Sunoco LP | | | 39,768,263 | |
| | | | | | | | |
| | | | | | | 61,600,090 | |
| | |
| Other | Rail Terminalling – 0.2% | | | |
| | 96,186 | | | USD Partners LP | | | 1,008,991 | |
| | |
| Pipeline Transportation | Natural Gas – 28.4% | | | |
| | 6,037,500 | | | Energy Transfer LP | | | 87,966,375 | |
| | 947,421 | | | Enterprise Products Partners LP | | | 24,869,801 | |
| | 379,055 | | | EQM Midstream Partners LP | | | 18,065,761 | |
| | | | | | | | |
| | | | | | | 130,901,937 | |
| | |
| Pipeline Transportation | Petroleum – 25.2% | | | |
| | 70,000 | | | Andeavor Logistics LP | | | 2,612,400 | |
| | 527,500 | | | Buckeye Partners LP | | | 15,592,900 | |
| | 1,638,764 | | | NuStar Energy LP | | | 39,608,926 | |
| | 1,427,957 | | | PBF Logistics LP | | | 28,673,377 | |
| | 1,573,930 | | | Shell Midstream Partners LP | | | 29,652,841 | |
| | | | | | | | |
| | | | | | | 116,140,444 | |
| | |
| Power Generation – 1.7% | | | |
| | 272,679 | | | Enviva Partners LP | | | 7,834,068 | |
| | |
| Production + Mining | Coal – 3.7% | | | |
| | 854,864 | | | Alliance Resource Partners LP | | | 16,798,078 | |
| | |
| Services | Midstream – 6.2% | | | |
| | 1,378,095 | | | CSI Compressco LP | | | 5,774,218 | |
| | 1,584,960 | | | USA Compression Partners LP | | | 22,918,522 | |
| | | | | | | | |
| | | | | | | 28,692,740 | |
| | |
| | TOTAL COMMON STOCKS | | | | |
| | (Cost $770,207,002) | | $ | 694,728,979 | |
| | |
| Shares | | | Dividend
Rate | | Value | |
| Preferred Stock(a)(b) – 0.3% | | | |
| Services | Midstream – 0.3% | | | |
| | CSI Compressco LP | |
| | 104,872 | | | 20.660% | | $ | 1,197,318 | |
| | (Cost $967,158) | | | | |
| | |
| | TOTAL INVESTMENTS – 151.0% | | | | |
| | (Cost $771,174,160) | | $ | 695,926,297 | |
| | |
| | BORROWINGS – (50.5)% | | | (232,500,000 | ) |
| | |
| OTHER LIABILITIES IN EXCESS OF
OTHER ASSETS – (0.5)% | | | (2,488,236 | ) |
| | |
| | NET ASSETS – 100.0% | | $ | 460,938,061 | |
| | |
| | |
| The percentage shown for each investment category reflects the value of investments in that category as a percentage of net assets. |
(a) | | Significant unobservable inputs were used in the valuation of this portfolio security; i.e. Level 3. |
(b) | | Pay-in-kind securities. Payments made are in shares. |
| | | | |
|
Investment Abbreviations: |
GP | | —General Partnership |
LP | | —Limited Partnership |
|
| | |
| The accompanying notes are an integral part of these financial statements. | | 19 |
GOLDMAN SACHS MLP INCOME OPPORTUNITIES FUND
Schedule of Investments
November 30, 2018
| | | | | | | | |
| Shares | | | Description | | Value | |
| Common Stocks – 147.1% | | | |
| Gathering + Processing – 48.0% | | | |
| | 675,000 | | | Antero Midstream Partners LP | | $ | 18,670,500 | |
| | 275,000 | | | CNX Midstream Partners LP | | | 4,977,500 | |
| | 937,500 | | | DCP Midstream LP | | | 31,950,000 | |
| | 930,000 | | | Enable Midstream Partners LP | | | 12,406,200 | |
| | 1,312,500 | | | MPLX LP | | | 43,483,125 | |
| | 650,000 | | | Sanchez Midstream Partners LP | | | 1,917,500 | |
| | 230,000 | | | Summit Midstream Partners LP | | | 2,826,700 | |
| | 750,000 | | | Targa Resources Corp. | | | 33,472,500 | |
| | 200,000 | | | Western Gas Equity Partners LP | | | 5,796,000 | |
| | 525,000 | | | Western Gas Partners LP | | | 23,331,000 | |
| | | | | | | | |
| | | | | | | 178,831,025 | |
| | |
| Marine Transportation | Petroleum – 4.8% | | | |
| | 1,824,557 | | | Capital Product Partners LP | | | 4,397,182 | |
| | 665,000 | | | KNOT Offshore Partners LP | | | 13,326,600 | |
| | | | | | | | |
| | | | | | | 17,723,782 | |
| | |
| Marketing | Retail – 2.9% | | | |
| | 137,500 | | | AmeriGas Partners LP | | | 5,109,500 | |
| | 250,000 | | | Suburban Propane Partners LP | | | 5,840,000 | |
| | | | | | | | |
| | | | | | | 10,949,500 | |
| | |
| Marketing | Wholesale – 17.9% | | | |
| | 950,000 | | | CrossAmerica Partners LP | | | 14,991,000 | |
| | 350,000 | | | Global Partners LP | | | 6,048,000 | |
| | 685,000 | | | Sprague Resources LP | | | 12,206,700 | |
| | 1,200,000 | | | Sunoco LP | | | 33,552,000 | |
| | | | | | | | |
| | | | | | | 66,797,700 | |
| | |
| Other | Rail Terminalling – 0.3% | | | |
| | 115,443 | | | USD Partners LP | | | 1,210,997 | |
| | |
| Pipeline Transportation | Natural Gas – 30.9% | | | |
| | 4,575,000 | | | Energy Transfer LP | | | 66,657,750 | |
| | 150,000 | | | Enterprise Products Partners LP | | | 3,937,500 | |
| | 937,500 | | | EQM Midstream Partners LP | | | 44,681,250 | |
| | | | | | | | |
| | | | | | | 115,276,500 | |
| | |
| Pipeline Transportation | Petroleum – 22.0% | | | |
| | 187,500 | | | Andeavor Logistics LP | | | 6,997,500 | |
| | 300,000 | | | Buckeye Partners LP | | | 8,868,000 | |
| | 325,000 | | | Delek Logistics Partners LP | | | 9,906,000 | |
| | 200,000 | | | NuStar Energy LP | | | 4,834,000 | |
| | 1,045,000 | | | PBF Logistics LP | | | 20,983,600 | |
| | 1,500,000 | | | Shell Midstream Partners LP | | | 28,260,000 | |
| | 50,000 | | | Valero Energy Partners LP | | | 2,103,500 | |
| | | | | | | | |
| | | | | | | 81,952,600 | |
| | |
| Power Generation – 1.5% | | | |
| | 195,000 | | | Enviva Partners LP | | | 5,602,350 | |
| | |
| Production + Mining | Coal – 9.6% | | | |
| | 1,825,000 | | | Alliance Resource Partners LP | | | 35,861,250 | |
| | |
| Services | Midstream – 7.7% | | | |
| | 1,677,319 | | | CSI Compressco LP | | | 7,027,967 | |
| | |
| Common Stocks – (continued) | | | |
| Services | Midstream – (continued) | | | |
| | 1,512,500 | | | USA Compression Partners LP | | | 21,870,750 | |
| | | | | | | | |
| | | | | | | 28,898,717 | |
| | |
| Storage | Liquids – 1.5% | | | |
| | 90,600 | | | Martin Midstream Partners LP | | | 961,266 | |
| | 112,500 | | | TransMontaigne Partners LP | | | 4,621,500 | |
| | | | | | | | |
| | | | | | | 5,582,766 | |
| | |
| TOTAL COMMON STOCKS
(Cost $589,093,233) | | $ | 548,687,187 | |
| | |
| | |
| Shares | | | Dividend
Rate | | Value | |
| Preferred Stock(a)(b) – 0.2% | | | |
| Services | Midstream – 0.2% | | | |
| | CSI Compressco LP | |
| | 78,993 | | | 20.660% | | $ | 901,865 | |
| | (Cost $728,493) | | | | |
| | |
| | |
| Shares | | | Distribution
Rate | | Value | |
| Investment Company(c) – 1.2% | | | |
| Goldman Sachs Financial Square Government Fund –
Institutional Shares |
|
| | 4,377,236 | | | 2.131% | | $ | 4,377,236 | |
| | (Cost $4,377,236) | | | | |
| | |
| | TOTAL INVESTMENTS – 148.5% | | | | |
| | (Cost $594,198,962) | | $ | 553,966,288 | |
| | |
| | BORROWINGS – (50.4)% | | | (188,000,000 | ) |
| | |
| OTHER ASSETS IN EXCESS OF OTHER
LIABILITIES – 1.9% | | | 6,929,345 | |
| | |
| | NET ASSETS – 100.0% | | $ | 372,895,633 | |
| | |
| | |
| The percentage shown for each investment category reflects the value of investments in that category as a percentage of net assets. |
(a) | | Significant unobservable inputs were used in the valuation of this portfolio security; i.e. Level 3. |
(b) | | Pay-in-kind securities. |
(c) | | Represents an affiliated fund. |
| | | | |
|
Investment Abbreviations: |
LP | | —Limited Partnership |
|
| | |
| 20 | | The accompanying notes are an integral part of these financial statements. |
GOLDMAN SACHS CLOSED-END FUNDS
Statements of Assets and Liabilities
November 30, 2018
| | | | | | | | | | |
| | | | | MLP and Energy
Renaissance
Fund | | | MLP Income
Opportunities
Fund | |
| | Assets: | | | | | | | | |
| | Investments of unaffiliated issuers, at value (cost $771,174,160 and $589,821,726, respectively) | | | $695,926,297 | | | | $549,589,052 | |
| | Investments of affiliated issuers, at value (cost $0 and $4,377,236, respectively) | | | — | | | | 4,377,236 | |
| | Cash | | | 4,314,372 | | | | 6,327,478 | |
| | Receivables: | | | | | | | | |
| | Investments sold | | | 3,672,303 | | | | 11,602,167 | |
| | Current taxes | | | 45,443 | | | | 1,820,811 | |
| | Dividends | | | — | | | | 10,330 | |
| | Prepaid state and local franchise taxes | | | 53,182 | | | | 37,325 | |
| | Other assets | | | 1,785 | | | | 1,369 | |
| | Total assets | | | 704,013,382 | | | | 573,765,768 | |
| | | | | | | | | | |
| | Liabilities: | | | | | | | | |
| | Payables: | | | | | | | | |
| | Borrowings on credit facility | | | 232,500,000 | | | | 188,000,000 | |
| | Investments purchased | | | 4,638,211 | | | | 7,405,028 | |
| | Interest on borrowing | | | 1,431,025 | | | | 1,152,013 | |
| | Management fees | | | 592,643 | | | | 475,525 | |
| | Deferred taxes, net | | | 3,078,392 | | | | 3,244,239 | |
| | Accrued expenses | | | 835,050 | | | | 593,330 | |
| | Total liabilities | | | 243,075,321 | | | | 200,870,135 | |
| | | | | | | | | | |
| | Net Assets: | | | | | | | | |
| | Paid-in capital | | | 1,281,936,548 | | | | 685,193,901 | |
| | Total distributable earnings (loss) | | | (820,998,487 | ) | | | (312,298,268 | ) |
| | NET ASSETS | | | $460,938,061 | | | | $372,895,633 | |
| | Shares Outstanding $0.001 par value (unlimited shares authorized): | | | 79,474,880 | | | | 44,428,432 | |
| | Net asset value per share | | | $5.80 | | | | $8.39 | |
| | |
| The accompanying notes are an integral part of these financial statements. | | 21 |
GOLDMAN SACHS CLOSED-END FUNDS
Statements of Operations
For the Fiscal Year Ended November 30, 2018
| | | | | | | | | | |
| | | | | MLP and Energy
Renaissance Fund | | | MLP Income
Opportunities
Fund | |
| | Investment income: | | | | |
| | Dividends — unaffiliated issuers | | $ | 67,625,099 | | | $ | 55,765,383 | |
| | Dividends — affiliated issuers | | | 20,988 | | | | 54,471 | |
| | Less: Return of Capital on Dividends | | | (65,720,433 | ) | | | (52,490,666 | ) |
| | Total investment income | | | 1,925,654 | | | | 3,329,188 | |
| | | | | | | | | | |
| | Expenses: | | | | | | | | |
| | Management fees | | | 7,548,460 | | | | 6,073,770 | |
| | Interest on borrowings | | | 6,417,922 | | | | 5,345,249 | |
| | Professional fees | | | 564,176 | | | | 580,197 | |
| | Trustee fees | | | 159,474 | | | | 159,474 | |
| | Custody, accounting and administrative services | | | 97,956 | | | | 98,302 | |
| | Printing and mailing costs | | | 75,803 | | | | 58,744 | |
| | Transfer Agency fees | | | 17,502 | | | | 15,005 | |
| | Franchise Expense | | | 99 | | | | 24,599 | |
| | Other | | | 201,361 | | | | 99,605 | |
| | Total operating expenses, before income taxes | | | 15,082,753 | | | | 12,454,945 | |
| | Less — expense reductions | | | (2,007 | ) | | | (5,066 | ) |
| | Net operating expenses, before income taxes | | | 15,080,746 | | | | 12,449,879 | |
| | NET INVESTMENT LOSS, BEFORE INCOME TAXES | | | (13,155,092 | ) | | | (9,120,691 | ) |
| | Deferred tax benefit/(expense) | | | 1,192,051 | | | | (1,322,168 | ) |
| | NET INVESTMENT LOSS, NET OF TAXES | | | (11,963,041 | ) | | | (10,442,859 | ) |
| | | | | | | | | | |
| | Realized and unrealized gain (loss): | | | | | | | | |
| | Net realized gain from: | | | | | | | | |
| | Investments — unaffiliated issuers | | | 66,760,513 | | | | 29,843,778 | |
| | Deferred tax benefit/(expense) | | | (6,049,512 | ) | | | 4,326,260 | |
| | Net change in unrealized gain (loss) on: | | | | | | | | |
| | Investments — unaffiliated issuers | | | (19,633,252 | ) | | | (3,965,356 | ) |
| | Deferred tax benefit/(expense) | | | 1,779,069 | | | | (574,832 | ) |
| | Net realized and unrealized gain, net of taxes | | | 42,856,818 | | | | 29,629,850 | |
| | NET INCREASE IN NET ASSETS RESULTING FROM OPERATIONS | | $ | 30,893,777 | | | $ | 19,186,991 | |
| | |
| 22 | | The accompanying notes are an integral part of these financial statements. |
GOLDMAN SACHS CLOSED-END FUNDS
Statements of Changes in Net Assets
| | | | | | | | | | |
| | | | | MLP and Energy Renaissance Fund | |
| | | | | For the Fiscal
Year Ended
November 30, 2018 | | | For the Fiscal
Year Ended
November 30, 2017 | |
| | From operations: | | | | | | | | |
| | Net investment loss, net of taxes | | $ | (11,963,041 | ) | | $ | (16,633,864 | ) |
| | Net realized gain, net of taxes | | | 60,711,001 | | | | 67,054,963 | |
| | Net change in unrealized loss, net of taxes | | | (17,854,183 | ) | | | (119,525,531 | ) |
| | Net increase (decrease) in net assets resulting from operations | | | 30,893,777 | | | | (69,104,432 | ) |
| | | | | | | | | | |
| | Distributions to shareholders: | | | | | | | | |
| | From distributable earnings | | | (34,469,539 | ) | | | (28,073,816 | )(a) |
| | From return of capital | | | (16,339,876 | ) | | | (22,551,925 | ) |
| | Total distributions to shareholders | | | (50,809,415 | ) | | | (50,625,741 | ) |
| | | | | | | | | | |
| | From share transactions: | | | | | | | | |
| | Increase from reinvestment of distributions | | | 1,411,129 | | | | 1,614,875 | |
| | TOTAL DECREASE | | | (18,504,509 | ) | | | (118,115,298 | ) |
| | | | | | | | | | |
| | Net assets:(b) | | | | | | | | |
| | Beginning of year | | | 479,442,570 | | | | 597,557,868 | |
| | End of year | | $ | 460,938,061 | | | $ | 479,442,570 | |
| | (a) | | Prior year information has been revised to conform to current year presentation. Distributions to shareholders consisted solely of net investment income for the fiscal year ended November 30, 2017. |
| | (b) | | Prior year information has been revised to conform with current year presentation. Distributions in excess of net investment loss, net of taxes was $(43,723,443) as of November 30, 2017. |
| | |
| The accompanying notes are an integral part of these financial statements. | | 23 |
GOLDMAN SACHS CLOSED-END FUNDS
Statements of Changes in Net Assets(continued)
| | | | | | | | | | |
| | | | | MLP Income Opportunities Fund | |
| | | | | For the Fiscal
Year Ended
November 30, 2018 | | | For the Fiscal
Year Ended
November 30, 2017 | |
| | From operations: | | | | | | | | |
| | Net investment loss, net of taxes | | $ | (10,442,859 | ) | | $ | (7,040,747 | ) |
| | Net realized gain, net of taxes | | | 34,170,038 | | | | 76,370,723 | |
| | Net change in unrealized loss, net of taxes | | | (4,540,188 | ) | | | (96,371,825 | ) |
| | Net increase (decrease) in net assets resulting from operations | | | 19,186,991 | | | | (27,041,849 | ) |
| | | | | | | | | | |
| | Distributions to shareholders: | | | | | | | | |
| | From distributable earnings | | | (15,402,572 | ) | | | (37,266,710 | )(a) |
| | From return of capital | | | (21,917,311 | ) | | | — | |
| | Total distributions to shareholders | | | (37,319,883 | ) | | | (37,266,710 | ) |
| | | | | | | | | | |
| | From share transactions: | | | | | | | | |
| | Increase from reinvestment of distributions | | | — | | | | 769,844 | |
| | TOTAL DECREASE | | | (18,132,892 | ) | | | (63,538,715 | ) |
| | | | | | | | | | |
| | Net assets:(b) | | | | | | | | |
| | Beginning of year | | | 391,028,525 | | | | 454,567,240 | |
| | End of year | | $ | 372,895,633 | | | $ | 391,028,525 | |
| | (a) | | Prior year information has been revised to conform to current year presentation. Distributions to shareholders consisted solely of net investment income for the fiscal year ended November 30, 2017. |
| | (b) | | Prior year information has been revised to conform with current year presentation. Distributions in excess of net investment loss, net of taxes was $(63,952,328) as of November 30, 2017. |
| | |
| 24 | | The accompanying notes are an integral part of these financial statements. |
GOLDMAN SACHS MLP AND ENERGY RENAISSANCE FUND
Statement of Cash Flows
For the Fiscal Year Ended November 30, 2018
| | | | | | |
| | | | | | |
| | Increase/(Decrease) in cash – Cash flows provided by operating activities: | | | | |
| | Net increase in net assets from operations | | $ | 30,893,777 | |
| | Adjustments to reconcile net increase in net assets from operations to net cash provided by/(used in) operating activities: | | | | |
| | Payments for purchases of investments | | | (450,993,103 | ) |
| | Proceeds from sales of investment securities | | | 455,951,132 | |
| | Corporate actions purchases and sales, net | | | 70 | |
| | Proceeds from sales of short term investments, net | | | 3,784 | |
| | Return of capital on dividends | | | 65,720,433 | |
| | (Increase) Decrease in Assets: | | | | |
| | Receivable for investments sold | | | (2,489,103 | ) |
| | Receivable for dividends | | | 3,785 | |
| | Receivable for current taxes | | | (2,651 | ) |
| | Prepaid state and local franchise tax | | | (2 | ) |
| | Other assets | | | 9,904 | |
| | Increase (Decrease) in Liabilities: | | | | |
| | Payable for investments purchased | | | 3,096,921 | |
| | Deferred tax, net | | | 3,078,392 | |
| | Management fees payable | | | (7,731 | ) |
| | Interest on borrowings payable | | | 313,000 | |
| | Accrued expenses | | | (13,986 | ) |
| | Net realized (gain) loss on: | | | | |
| | Investments | | | (66,760,513 | ) |
| | Net change in unrealized (gain) loss on: | | | | |
| | Investments | | | 19,633,252 | |
| | Net cash provided by operating activities | | | 58,437,361 | |
| | | | | | |
| | Cash flows provided by financing activities: | | | | |
| | Proceeds from borrowing facility | | | 37,500,000 | |
| | Repayment of borrowing facility | | | (45,000,000 | ) |
| | Cash distributions paid | | | (49,398,286 | ) |
| | Net cash used in financing activities | | | (56,898,286 | ) |
| | Net increase in cash | | $ | 1,539,075 | |
| | | | | | |
| | Cash: | | | | |
| | Beginning of year | | | 2,775,297 | |
| | End of year | | $ | 4,314,372 | |
| | Supplemental disclosure: | | | | |
| | Cash paid for interest and related fees | | | 7,595,244 | |
| | Cash received for breakage fees | | | (1,490,322 | ) |
| | Cash paid for income taxes | | | 100 | |
| | Reinvestment of distributions | | | 1,411,129 | |
| | |
| The accompanying notes are an integral part of these financial statements. | | 25 |
GOLDMAN SACHS MLP INCOME OPPORTUNITIES FUND
Statement of Cash Flows(continued)
For the Fiscal Year Ended November 30, 2018
| | | | | | |
| | | | | | |
| | Increase/(Decrease) in cash – Cash flows provided by operating activities: | | | | |
| | Net increase in net assets from operations | | $ | 19,186,991 | |
| | Adjustments to reconcile net increase in net assets from operations to net cash provided by/(used in) operating activities: | | | | |
| | Payments for purchases of investments | | | (385,297,053 | ) |
| | Proceeds from sales of investment securities | | | 381,670,825 | |
| | Corporate actions purchases and sales, net | | | (9,634 | ) |
| | Purchase of short term investment securities, net | | | (1,642,567 | ) |
| | Return of capital on dividends | | | 52,490,666 | |
| | (Increase) Decrease in Assets: | | | | |
| | Receivable for investments sold | | | (7,388,378 | ) |
| | Receivable for dividends | | | 5,866 | |
| | Receivable for current taxes | | | 246,162 | |
| | Other assets | | | 3,567 | |
| | Increase (Decrease) in Liabilities: | | | | |
| | Payable for investments purchased | | | 3,130,568 | |
| | Deferred tax, net | | | (2,429,260 | ) |
| | Management fees payable | | | (7,010 | ) |
| | Interest on borrowings payable | | | 272,094 | |
| | Accrued expenses | | | (24,204 | ) |
| | Net realized (gain) loss on: | | | | |
| | Investments | | | (29,843,778 | ) |
| | Net change in unrealized (gain) loss on: | | | | |
| | Investments | | | 3,965,356 | |
| | Net cash provided by operating activities | | | 34,330,211 | |
| | | | | | |
| | Cash flows provided by financing activities: | | | | |
| | Proceeds from borrowing facility | | | 20,000,000 | |
| | Repayment of borrowing facility | | | (20,000,000 | ) |
| | Cash distributions paid | | | (37,319,883 | ) |
| | Net cash used in financing activities | | | (37,319,883 | ) |
| | Net decrease in cash | | $ | (2,989,672 | ) |
| | | | | | |
| | Cash: | | | | |
| | Beginning of year | | | 9,317,150 | |
| | End of year | | $ | 6,327,478 | |
| | Supplemental disclosure: | | | | |
| | Cash paid for interest and related fees | | | 6,081,988 | |
| | Cash received for breakage fees | | | (1,008,833 | ) |
| | Cash paid for income taxes | | | 100 | |
| | |
| 26 | | The accompanying notes are an integral part of these financial statements. |
GOLDMAN SACHS MLP AND ENERGY RENAISSANCE FUND
Financial Highlights
Selected Share Data for a Share Outstanding Throughout Each Period
| | | | | | | | | | | | | | | | | | | | | | |
| | | | | Goldman Sachs MLP and Energy Renaissance Fund | |
| | | | | Year Ended November 30 | | | Period Ended
November 30
2014(a) | |
| | | | | 2018 | | | 2017 | | | 2016 | | | 2015 | |
| | Per Share Data | |
| | Net asset value, beginning of period | | $ | 6.05 | | | $ | 7.56 | | | $ | 7.45 | | | $ | 15.91 | | | $ | 19.10 | |
| | Net investment income (loss)(b) | | | (0.15 | ) | | | (0.21 | ) | | | (0.13 | ) | | | 0.09 | | | | 0.05 | |
| | Net realized and unrealized gain (loss) | | | 0.54 | | | | (0.66 | ) | | | 0.88 | | | | (7.22 | ) | | | (2.88 | ) |
| | Total from investment operations | | | 0.39 | | | | (0.87 | ) | | | 0.75 | | | | (7.13 | ) | | | (2.83 | ) |
| | Distributions to shareholders from net investment income | | | (0.43 | ) | | | (0.35 | ) | | | — | | | | — | | | | — | |
| | Distributions to shareholders from return of capital | | | (0.21 | ) | | | (0.29 | ) | | | (0.64 | ) | | | (1.33 | ) | | | (0.32 | ) |
| | Total distributions | | | (0.64 | ) | | | (0.64 | ) | | | (0.64 | ) | | | (1.33 | ) | | | (0.32 | ) |
| | Offering costs | | | — | | | | — | | | | — | | | | — | | | | (0.04 | ) |
| | Net asset value, end of period | | | 5.80 | | | | 6.05 | | | | 7.56 | | | | 7.45 | | | | 15.91 | |
| | Market price, end of period | | $ | 5.31 | | | $ | 5.67 | | | $ | 7.09 | | | $ | 7.52 | | | $ | 17.11 | |
| | Total return based on net asset value(c) | | | 6.31 | % | | | (12.32 | )% | | | 12.13 | % | | | (46.86 | )% | | | (15.28 | )% |
| | Total return based on market price(c) | | | 3.86 | % | | | (12.38 | )% | | | 4.20 | % | | | (50.18 | )% | | | (8.77 | )% |
| | Net assets, end of period (in 000s) | | $ | 460,938 | | | $ | 479,443 | | | $ | 597,558 | | | $ | 587,452 | | | $ | 1,242,617 | |
| | Ratio of net expenses to average net assets after interest expense and tax benefit/(expenses)(d) | | | 3.46 | % | | | 2.79 | % | | | 3.29 | % | | | 2.25 | % | | | 1.65 | %(e) |
| | Ratio of net expenses to average net assets after interest expense and before tax benefit/(expenses) | | | 2.88 | % | | | 3.03 | % | | | 3.01 | % | | | 2.31 | % | | | 1.60 | %(e) |
| | Ratio of total expenses to average net assets before interest expense and tax benefit/(expenses) | | | 1.65 | % | | | 1.68 | % | | | 1.75 | % | | | 1.62 | % | | | 1.30 | %(e) |
| | Ratio of net investment income (loss) to average net assets(f) | | | (2.28 | )% | | | (2.78 | )% | | | (2.01 | )% | | | 0.75 | % | | | 1.69 | %(e) |
| | Portfolio turnover rate(g) | | | 61 | % | | | 31 | % | | | 64 | % | | | 113 | % | | | 36 | % |
| | Asset coverage, end of period per $1,000(h) | | $ | 2,983 | | | $ | 2,998 | | | $ | 3,339 | | | $ | 3,076 | | | $ | 3,761 | |
| | (a) | | Commenced operations on September 26, 2014. |
| | (b) | | Calculated based on the average shares outstanding methodology. |
| | (c) | | Total returns are calculated assuming purchase of a share at the market price or NAV on the first day and sale of a share at the market price or NAV on the last day of the period reported. Dividends and distributions, if any, are assumed, for purposes of this calculation, to be reinvested at prices obtained under the Fund’s dividend reinvestment plan. Total return does not reflect brokerage commissions or sales charges in connection with the purchase or sale of Fund shares. Total returns for periods less than one full year are not annualized. |
| | (d) | | Current and deferred tax expense/benefit for the ratio calculation is derived from the net investment income (loss), and realized and unrealized gains (losses). |
| | (e) | | Annualized with the exception of tax expenses. |
| | (f) | | Current and deferred tax expense/benefit for the ratio calculation is derived from the net investment income (loss) only. |
| | (g) | | The Fund’s portfolio turnover rate is calculated in accordance with regulatory requirements, without regard to transactions involving short term investments. If such transactions were included, the Fund’s portfolio turnover rate may be higher. |
| | (h) | | Calculated by dividing the Fund’s Managed Assets by the amount of borrowings outstanding under the credit facility at period end. |
| | |
| The accompanying notes are an integral part of these financial statements. | | 27 |
GOLDMAN SACHS MLP INCOME OPPORTUNITIES FUND
Financial Highlights(continued)
Selected Share Data for a Share Outstanding Throughout Each Year
| | | | | | | | | | | | | | | | | | | | | | |
| | | | | Goldman Sachs MLP Income Opportunities Fund | |
| | | | | Year Ended November 30, | |
| | | | | 2018 | | | 2017 | | | 2016 | | | 2015 | | | 2014 | |
| | Per Share Data | | | | | | | | | | | | | | | | | | | | |
| | Net asset value, beginning of year | | $ | 8.80 | | | $ | 10.25 | | | $ | 10.33 | | | $ | 19.19 | | | $ | 19.06 | |
| | Net investment income (loss)(a) | | | (0.24 | ) | | | (0.17 | ) | | | (0.09 | ) | | | 0.03 | | | | — | (b) |
| | Net realized and unrealized gain (loss) | | | 0.67 | | | | (0.44 | ) | | | 0.85 | | | | (7.52 | ) | | | 1.42 | |
| | Total from investment operations | | | 0.43 | | | | (0.61 | ) | | | 0.76 | | | | (7.49 | ) | | | 1.42 | |
| | Distributions to shareholders from net investment income | | | (0.35 | ) | | | (0.84 | ) | | | — | | | | — | | | | (0.38 | ) |
| | Distributions to shareholders from return of capital | | | (0.49 | ) | | | — | | | | (0.84 | ) | | | (1.37 | ) | | | (0.91 | ) |
| | Total distributions | | | (0.84 | ) | | | (0.84 | ) | | | (0.84 | ) | | | (1.37 | ) | | | (1.29 | ) |
| | Offering costs | | | — | | | | — | | | | — | | | | — | | | | — | (b) |
| | Net asset value, end of year | | | 8.39 | | | | 8.80 | | | | 10.25 | | | | 10.33 | | | | 19.19 | |
| | Market price, end of year | | $ | 7.96 | | | $ | 8.38 | | | $ | 9.61 | | | $ | 10.25 | | | $ | 18.74 | |
| | Total return based on net asset value(c) | | | 4.83 | % | | | (6.57 | )% | | | 9.26 | % | | | (40.43 | )% | | | 7.31 | % |
| | Total return based on market price(c) | | | 4.44 | % | | | (4.83 | )% | | | 2.95 | % | | | (39.47 | )% | | | (0.14 | )% |
| | Net assets, end of year (in 000s) | | $ | 372,896 | | | $ | 391,029 | | | $ | 454,567 | | | $ | 458,092 | | | $ | 846,835 | |
| | Ratio of net expenses to average net assets after interest expense and tax benefit/(expenses)(d) | | | 2.38 | % | | | 3.16 | % | | | 3.00 | % | | | (2.49 | )% | | | 5.76 | % |
| | Ratio of net expenses to average net assets after interest expense and before tax benefit/(expenses) | | | 2.96 | % | | | 3.02 | % | | | 2.90 | % | | | 2.24 | % | | | 1.75 | % |
| | Ratio of total expenses to average net assets before interest expense and tax benefit/(expenses) | | | 1.69 | % | | | 1.71 | % | | | 1.80 | % | | | 1.62 | % | | | 1.41 | % |
| | Ratio of net investment income (loss) to average net assets(e) | | | (2.48 | )% | | | (1.53 | )% | | | (0.96 | )% | | | 0.17 | % | | | — | %(f) |
| | Portfolio turnover rate(g) | | | 64 | % | | | 50 | % | | | 83 | % | | | 66 | % | | | 54 | % |
| | Asset coverage, end of period per $1,000(h) | | $ | 2,983 | | | $ | 3,080 | | | $ | 3,349 | | | $ | 3,279 | | | $ | 3,813 | |
| | (a) | | Calculated based on the average shares outstanding methodology. |
| | (b) | | Amount is less than $0.005 per share. |
| | (c) | | Total returns are calculated assuming purchase of a share at the market price or NAV on the first day and sale of a share at the market price or NAV on the last day of the period reported. Dividends and distributions, if any, are assumed, for purposes of this calculation, to be reinvested at prices obtained under the Fund’s dividend reinvestment plan. Total return does not reflect brokerage commissions or sales charges in connection with the purchase or sale of Fund shares. |
| | (d) | | Current and deferred tax expense/benefit for the ratio calculation is derived from the net investment income (loss), and realized and unrealized gains (losses). |
| | (e) | | Current and deferred tax expense/benefit for the ratio calculation is derived from the net investment income (loss) only. |
| | (f) | | Amount is less than 0.005% per share. |
| | (g) | | The Fund’s portfolio turnover rate is calculated in accordance with regulatory requirements, without regard to transactions involving short term investments. If such transactions were included, the Fund’s portfolio turnover rate may be higher. |
| | (h) | | Calculated by dividing the Fund’s Managed Assets by the amount of borrowings outstanding under the credit facility at period end. |
| | |
| 28 | | The accompanying notes are an integral part of these financial statements. |
GOLDMAN SACHS CLOSED-END FUNDS
Notes to Financial Statements
November 30, 2018
The Goldman Sachs MLP and Energy Renaissance Fund, and the Goldman Sachs MLP Income Opportunities Fund (each, a “Fund” and collectively, the “Funds”) arenon-diversified,closed-end management investment companies registered under the Investment Company Act of 1940, as amended (the “1940 Act”) and the Securities Act of 1933, as amended (the “1933 Act”). The Goldman Sachs MLP and Energy Renaissance Fund was organized as a Delaware statutory trust on July 7, 2014, and the Goldman Sachs MLP Income Opportunities Fund was organized as a Delaware statutory trust on June 18, 2013. The shares of the Goldman Sachs MLP and Energy Renaissance Fund and the Goldman Sachs MLP Income Opportunities Fund are listed on the New York Stock Exchange (“NYSE”) and trade under the symbols “GER” and “GMZ,” respectively.
Goldman Sachs Asset Management, L.P. (“GSAM”), an affiliate of Goldman Sachs & Co. LLC, serves as investment adviser to each Fund pursuant to each Fund’s respective management agreement (each, an “Agreement”).
|
| 2. SIGNIFICANT ACCOUNTING POLICIES |
The financial statements have been prepared in accordance with accounting principles generally accepted in the United States of America (“GAAP”) and require management to make estimates and assumptions that may affect the reported amounts and disclosures. Actual results may differ from those estimates and assumptions.
A. Investment Valuation — The Funds’ valuation policy is to value investments at fair value.
B. Investment Income and Investments — Investment income includes interest income, dividend income, net of any foreign withholding taxes, and less any amounts reclaimable. Interest income is accrued daily and adjusted for amortization of premiums and accretion of discounts. Dividend income is recognized onex-dividend date or, for certain foreign securities, as soon as such information is obtained subsequent to theex-dividend date. Investment transactions are reflected on trade date. Realized gains and losses are calculated using identified cost. Investment transactions are recorded on the following business day for daily net asset value (“NAV”) calculations. Distributions from master limited partnerships (“MLPs”) are generally recorded based on the characterization reported on a Fund’s scheduleK-1 received from the MLPs. The Funds record theirpro-rata share of the income/loss and capital gains/losses, allocated from the underlying partnerships and adjust the cost basis of the underlying partnerships accordingly.
C. Expenses — Expenses incurred by the Funds, which may not specifically relate to the Funds, may be shared with other registered investment companies having management agreements with GSAM or its affiliates, as appropriate. These expenses are allocated to the Funds on a straight-line and/orpro-rata basis depending upon the nature of the expenses and are accrued daily.
D. Distributions to Shareholders — While each Fund seeks to distribute substantially all of the Fund’s distributable cash flow received as cash distributions from MLPs, interest payments received on debt securities owned by the Fund and other payments on securities owned by the Fund, less Fund expenses, in order to permit the Fund to maintain more stable quarterly distributions, the distributions paid by the Fund may be more or less than the amount of net distributable earnings actually earned by the Fund. These distributions could include a return of a shareholder’s invested capital which would reduce such Fund’s NAV. The Funds estimate that only a portion of the distributions paid to shareholders will be treated as dividend income. The remaining portion of the Funds’ distribution, which may be significant, is expected to be a return of capital. These estimates are based on the Funds’ operating results during the period, and their final federal income tax characterization that may differ.
The characterization of distributions to shareholders for financial reporting purposes is determined in accordance with federal income tax rules, which may differ from GAAP. Certain components of the Funds’ net assets on the Statements of Assets and Liabilities reflect permanent GAAP/Tax differences based on the appropriate tax character.
E. Income Taxes — The Funds do not intend to qualify as regulated investment companies pursuant to Subchapter M of the Internal Revenue Code of 1986, as amended, but will rather be taxed as corporations. As a result, the Funds are obligated to pay federal, state and local income tax on their taxable income. The Funds invest primarily in MLPs, which generally are treated as partnerships for federal income tax purposes. As a limited partner in the MLPs, the Funds must report their allocable share of the MLPs’ taxable income or loss in computing their own taxable income or loss. The Funds’ tax expense or benefit is included in the
29
GOLDMAN SACHS CLOSED-END FUNDS
Notes to Financial Statements(continued)
November 30, 2018
|
| 2. SIGNIFICANT ACCOUNTING POLICIES (continued) |
Statements of Operations based on the component of income or gains/losses to which such expense or benefit relates. Deferred income taxes reflect the net tax effects of temporary differences between the carrying amounts of assets and liabilities for financial reporting purposes and the amounts used for income tax purposes. Such temporary differences are principally: (i) taxes on unrealized gains/losses, which are attributable to the temporary difference between fair market value and tax basis, (ii) the net tax effects of temporary differences between the carrying amounts of assets and liabilities for financial reporting and income tax purposes, and (iii) the net tax benefit of accumulated net operating losses and capital loss carryforwards. The Funds will accrue a deferred income tax liability balance, at the currently effective statutory United States (“U.S.”) federal income tax rate plus an estimated state and local income tax rate, for their future tax liability associated with the capital appreciation of its investments and the distributions received by the Funds on interests of MLPs considered to be return of capital and for any net operating gains. The Funds may also record a deferred tax asset balance, which reflects an estimate of the Funds’ future tax benefit associated with net operating losses and/or unrealized losses.
To the extent the Funds have a deferred tax asset, consideration is given to whether or not a valuation allowance, which would offset the value of some or all of the deferred tax asset balance, is required. A valuation allowance is required if based on the evaluation criterion provided by Accounting Standards Codification (“ASC”) 740, Income Taxes (ASC 740) it is more likely than not that some portion, or all, of the deferred tax asset will not be realized. The factors considered in assessing the Funds’ valuation allowance include: the nature, frequency and severity of current and cumulative losses, the duration of the statutory carryforward periods and the associated risks that operating and capital loss carryforwards may expire unutilized. From time to time, as new information becomes available, the Funds will modify their estimates or assumptions regarding the deferred tax liability or asset. Unexpected significant decreases in cash distributions from the Funds’ MLP investments or significant declines in the fair value of their investments may change the Funds’ assessment regarding the recoverability of their deferred tax assets and may result in a valuation allowance. If a valuation allowance is required to reduce any deferred tax asset in the future, it could have a material impact on the Funds’ NAV and results of operations in the period it is recorded. The Funds will rely to some extent on information provided by the MLPs, which may not be provided to the Funds on a timely basis, to estimate operating income/loss and gains/losses and current taxes and deferred tax liabilities and/or asset balances for purposes of daily reporting of NAVs and financial statement reporting.
It is the Funds’ policy to classify interest and penalties associated with underpayment of federal and state income taxes, if any, as income tax expense on their Statements of Operations. The Funds anticipate filing income tax returns in the U.S. federal jurisdiction and various states, and such returns are subject to examination by the tax jurisdictions. The Funds have reviewed all major jurisdictions and concluded that there is no significant impact on their net assets and no tax liability resulting from unrecognized tax benefits or expenses relating to uncertain tax positions expected to be taken on their tax returns.
Return of Capital Estimates —Distributions received from the Funds’ investments in MLPs generally are comprised of income and return of capital. The Funds record investment income and return of capital based on estimates made at the time such distributions are received. Such estimates are based on historical information available from each MLP and other industry sources. These estimates may subsequently be revised based on information received from MLPs after their tax reporting periods are concluded.
|
| 3. INVESTMENTS AND FAIR VALUE MEASUREMENTS |
The fair value of a financial instrument is the amount that would be received to sell an asset or paid to transfer a liability in an orderly transaction between market participants at the measurement date (i.e., the exit price); the Funds’ policy is to use the market approach. GAAP establishes a fair value hierarchy that prioritizes the inputs to valuation techniques used to measure fair value. The hierarchy gives the highest priority to unadjusted quoted prices in active markets for identical assets or liabilities (Level 1 measurements) and the lowest priority to unobservable inputs (Level 3 measurements). The levels used for classifying investments are not necessarily an indication of the risk associated with investing in these investments. The three levels of the fair value hierarchy are described below:
Level 1 — Unadjusted quoted prices in active markets that are accessible at the measurement date for identical, unrestricted assets or liabilities;
30
GOLDMAN SACHS CLOSED-END FUNDS
|
| 3. INVESTMENTS AND FAIR VALUE MEASUREMENTS (continued) |
Level 2 — Quoted prices in markets that are not active or financial instruments for which significant inputs are observable (including, but not limited to, quoted prices for similar investments, interest rates, foreign exchange rates, volatility and credit spreads), either directly or indirectly;
Level 3 — Prices or valuations that require significant unobservable inputs (including GSAM’s assumptions in determining fair value measurement).
Changes in valuation techniques may result in transfers into or out of an assigned level within the hierarchy. In accordance with the Funds’ policy, transfers between different levels of the fair value hierarchy resulting from such changes are deemed to have occurred as of the beginning of the reporting period.
The Board of Trustees (“Trustees”) has approved Valuation Procedures that govern the valuation of the portfolio investments held by the Funds, including investments for which market quotations are not readily available. The Trustees have delegated to GSAMday-to-day responsibility for implementing and maintaining internal controls and procedures related to the valuation of the Funds’ portfolio investments. To assess the continuing appropriateness of pricing sources and methodologies, GSAM regularly performs price verification procedures and issues challenges as necessary to third party pricing vendors or brokers, and any differences are reviewed in accordance with the Valuation Procedures.
A. Level 1 and Level 2 Fair Value Investments — The valuation techniques and significant inputs used in determining the fair values for investments classified as Level 1 and Level 2 are as follows:
Equity Securities — Equity securities traded on a United States (“U.S.”) securities exchange or the NASDAQ system, or those located on certain foreign exchanges, including but not limited to the Americas, are valued daily at their last sale price or official closing price on the principal exchange or system on which they are traded. If there is no sale or official closing price or such price is believed to not represent fair value, equity securities are valued at the last bid price for long positions and at the last ask price for short positions To the extent these investments are actively traded, they are classified as Level 1 of the fair value hierarchy, otherwise they are generally classified as Level 2.
Unlisted equity securities for which market quotations are available are valued at the last sale price on the valuation date, or if no sale occurs, at the last bid price, and are generally classified as Level 2.
Money Market Funds — Investments in the Goldman Sachs Financial Square Government Fund— Institutional Shares (“Underlying Fund”) are valued at the NAV of the Institutional Share class on the day of valuation. These investments are generally classified as Level 1 of the fair value hierarchy. For information regarding an Underlying Fund’s accounting policies and investment holdings, please see the Underlying Fund’s shareholder report.
B. Level 3 Fair Value Investments — To the extent that significant inputs to valuation models and other alternative pricing sources are unobservable, or if quotations are not readily available, or if GSAM believes that such quotations do not accurately reflect fair value, the fair value of the Funds’ investments may be determined under Valuation Procedures approved by the Trustees. GSAM, consistent with its procedures and applicable regulatory guidance, may make an adjustment to the most recent valuation prices of either domestic or foreign securities in light of significant events to reflect what it believes to be the fair value of the securities at the time of determining a Fund’s NAV. Significant events which could affect a large number of securities in a particular market may include, but are not limited to: significant fluctuations in U.S. or foreign markets; market dislocations; market disruptions; or unscheduled market closings. Significant events which could also affect a single issuer may include, but are not limited to: corporate actions such as reorganizations, mergers andbuy-outs; ratings downgrades; and bankruptcies.
31
GOLDMAN SACHS CLOSED-END FUNDS
Notes to Financial Statements(continued)
November 30, 2018
|
| 3. INVESTMENTS AND FAIR VALUE MEASUREMENTS (continued) |
C. Fair Value Hierarchy — The following is a summary of the Funds’ investments classified in the fair value hierarchy as of November 30, 2018:
| | | | | | | | | | | | |
|
| GOLDMAN SACHS MLP AND ENERGY RENAISSANCE FUND | |
| | | |
| Investment Type | | Level 1 | | | Level 2 | | | Level 3 | |
| Assets | | | | | | | | | | | | |
Common Stock(a) | | | | | | | | | | | | |
MLP’s | | | | | | | | | | | | |
Europe | | $ | 6,106,929 | | | $ | — | | | $ | — | |
North America | | | 617,828,751 | | | | — | | | | — | |
Corporations | | | | | | | | | | | | |
North America | | | 70,793,299 | | | | — | | | | — | |
Preferred Stock | | | | | | | | | | | | |
North America | | | — | | | | — | | | | 1,197,318 | |
| Total | | $ | 694,728,979 | | | $ | — | | | $ | 1,197,318 | |
| | | |
GOLDMAN SACHS MLP INCOME OPPORTUNITIES FUND
| | | | | | | | | | | | |
| | | |
| Investment Type | | Level 1 | | | Level 2 | | | Level 3 | |
| Assets | | | | | | | | | | | | |
Common Stock(a) | | | | | | | | | | | | |
MLP’s | | | | | | | | | | | | |
Europe | | $ | 17,723,782 | | | $ | — | | | $ | — | |
North America | | | 497,490,905 | | | | — | | | | — | |
Corporations | | | | | | | | | | | | |
North America | | | 33,472,500 | | | | — | | | | — | |
Preferred Stock(a) | | | | | | | | | | | | |
North America | | | — | | | | — | | | | 901,865 | |
Investment Company | | | 4,377,236 | | | | — | | | | — | |
| Total | | $ | 553,064,423 | | | $ | — | | | $ | 901,865 | |
| (a) | | Amounts are disclosed by continent to highlight the impact of time zone differences between local market close and the calculation of net asset value. Security valuations are based on the principal exchange or system on which they are traded, which may differ from country of domicile. |
For further information regarding security characteristics, see the Schedules of Investments.
The Tax Cuts and Jobs Act (“TCJA”) was signed into law on December 22, 2017. The TCJA includes changes to the corporate income tax rate and alternative minimum tax (“AMT”) and modifications to the net operating loss (“NOL”) deduction. Prior to enactment, the highest marginal federal income tax rate was 35%. The TCJA reduced the corporate rate to a flat income tax rate of 21%. The change in the rate was reflected in each Funds’ respective NAV on December 22, 2017. The Funds may also be subject to a 20% AMT to the extent that their alternative minimum tax exceeds their regular federal income tax. For tax years beginning after December 31, 2017, the TCJA repealed the corporate AMT. The TCJA eliminated the NOL carryback ability and replaced the 20 year carryforward period with an indefinite carryforward period, applicable to NOLs arising in tax years ending after December 31, 2017, but if proposed additional tax legislation is enacted, applicable instead to NOLs arising in tax years beginning after December 31, 2017. The TCJA also established a limitation for any NOLs generated in tax years beginning after December 31, 2017 to the lesser of the aggregate of available post-2017 NOLs or 80% of taxable income before any NOL utilization.
32
GOLDMAN SACHS CLOSED-END FUNDS
Total income taxes are computed by applying the federal statutory rate plus a blended state income tax rate. During the fiscal year ended November 30, 2018, the Goldman Sachs MLP and Energy Renaissance Fund reevaluated its blended state income tax rate, increasing the rate from 1.94% to 2.36% due to anticipated changes in state apportionment of income and gains and a reduction of the federal tax benefit associated with state tax expenses due to the new lower corporate tax rates. During the fiscal year ended November 30, 2018, the Goldman Sachs MLP Income Opportunities Fund reevaluated its blended state income tax rate, increasing the rate from 2.17% to 2.60% due to anticipated changes in state apportionment of income and gains and a reduction of the federal tax benefit associated with state tax expenses due to the new lower corporate tax rates. The reconciliation between the federal statutory income tax rate of 21% and the effective tax rate on net investment income/ loss and realized and unrealized gain/loss is as follows:
| | | | | | | | | | | | | | | | |
| | | Goldman Sachs
MLP and Energy Renaissance Fund | | | Goldman Sachs
MLP Income Opportunities Fund | |
Application of statutory income tax rate | | $ | 7,134,155 | | | | 21.00 | % | | $ | 3,519,124 | | | | 21.00 | % |
State income taxes, net of federal benefit | | | 801,743 | | | | 2.36 | % | | | 435,701 | | | | 2.60 | % |
Change in estimated deferred tax rate* | | | 107,508,449 | | | | 316.46 | % | | | 35,024,732 | | | | 209.01 | % |
Effect of permanent differences | | | (399,568 | ) | | | (1.18 | )% | | | (269,327 | ) | | | (1.61 | )% |
Other Adjustments | | | (2,284 | ) | | | (0.01 | )% | | | 20,196 | | | | 0.12 | % |
Change in Valuation Allowance | | | (111,964,103 | ) | | | (329.58 | )% | | | (41,159,686 | ) | | | (245.62 | )% |
Total current and deferred income tax expense/(benefit), net | | $ | 3,078,392 | | | | 9.05 | % | | $ | (2,429,260 | ) | | | (14.50 | )% |
| * | | The tax rate change listed in the table above is reflective of the change in deferred tax assets and liabilities due to the federal corporate tax rate change enacted by the TCJA as of December 22, 2017 (date of enactment). For tax years beginning after December 31, 2017, corporations will be taxed at a flat rate of 21%. The tax rate change also incorporates adjustments in state tax rates, net of federal tax benefit associated with change in tax rates. |
Deferred tax assets and liabilities are measured using effective tax rates expected to apply to taxable income in the years such temporary differences are realized or otherwise settled. At November 30, 2018, components of the Funds’ deferred tax assets and liabilities are as follows:
| | | | | | | | |
| | | Goldman Sachs
MLP and Energy Renaissance Fund | | | Goldman Sachs
MLP Income Opportunities Fund | |
| Deferred tax assets: | | | | | | | | |
Net unrealized losses on investment securities (tax basis) | | $ | 14,267,805 | | | $ | 3,095,625 | |
Net operating loss carryforward — see table below for expiration | | | 21,161,645 | | | | 6,739,118 | |
Capital loss carryforward (tax basis) — see table below for expiration | | | 166,169,872 | | | | 57,431,770 | |
Other tax assets | | | 78,100 | | | | 41,537 | |
Valuation Allowance | | | (180,465,977 | ) | | | (60,451,275 | ) |
Total Deferred Tax Assets | | $ | 21,211,445 | | | $ | 6,856,775 | |
| Deferred tax liabilities: | | | | | | | | |
Book vs. tax partnership income to be recognized | | $ | (24,289,837 | ) | | $ | (10,101,014 | ) |
Total Deferred Tax Liabilities | | $ | (24,289,837 | ) | | $ | (10,101,014 | ) |
Net Deferred Tax Asset/(Liability) | | $ | (3,078,392 | ) | | $ | (3,244,239 | ) |
33
GOLDMAN SACHS CLOSED-END FUNDS
Notes to Financial Statements(continued)
November 30, 2018
At November 30, 2018, Goldman Sachs MLP and Energy Renaissance Fund had net operating loss carryforwards, subject to expiration and limitation based on the fiscal year generated, as follows:
| | | | | | | | |
| From Fiscal Year End | | Amount | | | Expiration | |
November 30, 2015 | | $ | 1,747,993 | | | | November 30, 2035 | |
November 30, 2016 | | | 55,308,545 | | | | November 30, 2036 | |
November 30, 2017 | | | 27,311,580 | | | | November 30, 2037 | |
November 30, 2018* | | | 6,221,114 | | | | Indefinite | |
At November 30, 2018, Goldman Sachs MLP Income Opportunities Fund had net operating loss carryforwards, subject to expiration and limitation based on the fiscal year generated, as follows:
| | | | | | | | |
| From Fiscal Year End | | Amount | | | Expiration | |
November 30, 2013 | | $ | 203,208 | | | | November 30, 2033 | |
November 30, 2015 | | | 932,122 | | | | November 30, 2035 | |
November 30, 2016 | | | 5,073,916 | | | | November 30, 2036 | |
November 30, 2017 | | | 11,085,035 | | | | November 30, 2037 | |
November 30, 2018* | | | 11,261,306 | | | | Indefinite | |
At November 30, 2018, Goldman Sachs MLP and Energy Renaissance Fund had capital loss carryforwards, which may be carried back for 3 years and forward for 5 years, as follows:
| | | | | | | | |
| From Fiscal Year End | | Amount | | | Expiration | |
November 30, 2015 | | $ | 339,638,853 | | | | November 30, 2020 | |
November 30, 2016 | | | 371,704,777 | | | | November 30, 2021 | |
At November 30, 2018, Goldman Sachs MLP Income Opportunities Fund had capital loss carryforwards, which may be carried back for 3 years and forward for 5 years, as follows:
| | | | | | | | |
| From Fiscal Year End | | Amount | | | Expiration | |
November 30, 2015 | | $ | 28,756,790 | | | | November 30, 2020 | |
November 30, 2016 | | | 214,598,166 | | | | November 30, 2021 | |
The Funds review the recoverability of their deferred tax assets based upon the weight of the available evidence. When assessing, the Funds’ management considers available carrybacks, reversing temporary taxable differences, and tax planning, if any. As a result of their analysis of the recoverability of their deferred tax assets, the Funds recorded the following valuation allowances as of November 30, 2018:
| | | | |
Goldman Sachs MLP and Energy Renaissance Fund | | $ | 180,465,977 | |
Goldman Sachs MLP Income Opportunities Fund | | $ | 60,451,275 | |
| * | | Legislation has been proposed that, if enacted, would subject this year’s net operating loss carryforward to expiration in 2038. |
34
GOLDMAN SACHS CLOSED-END FUNDS
As of November 30, 2018, components of each Fund’s current and deferred tax expense/(benefit) are as follows:
| | | | | | | | | | | | | | | | | | | | | | | | |
| | | Goldman Sachs MLP and Energy Renaissance Fund | | | Goldman Sachs MLP Income Opportunities Fund | |
| | | Current | | | Deferred | | | Total | | | Current | | | Deferred | | | Total | |
Federal | | $ | — | | | $ | 117,607,175 | | | $ | 117,607,175 | | | $ | — | | | $ | 39,433,547 | | | $ | 39,433,547 | |
State | | | — | | | | (2,564,681 | ) | | | (2,564,681 | ) | | | — | | | | (703,119 | ) | | | (703,119 | ) |
Valuation Allowance | | | — | | | | (111,964,102 | ) | | | (111,964,102 | ) | | | — | | | | (41,159,688 | ) | | | (41,159,688 | ) |
Total | | $ | — | | | $ | 3,078,392 | | | $ | 3,078,392 | | | $ | — | | | $ | (2,429,260 | ) | | $ | (2,429,260 | ) |
For the fiscal year ended November 30, 2018, the Funds did not have any interest or penalties associated with the underpayment of any income taxes. At November 30, 2018, gross unrealized appreciation and depreciation of investments, based on cost for federal income tax purposes was as follows:
| | | | | | | | |
| | | Goldman Sachs
MLP and Energy Renaissance Fund | | | Goldman Sachs
MLP Income Opportunities Fund | |
Tax Cost | | $ | 653,023,759 | | | $ | 524,346,663 | |
Gross unrealized gain | | | 84,160,588 | | | | 60,387,259 | |
Gross unrealized loss | | | (41,258,050 | ) | | | (30,767,634 | ) |
Net unrealized gain (loss) | | $ | 42,902,538 | | | $ | 29,619,625 | |
Any difference between cost amounts for financial statement and federal income tax purposes is due primarily to wash sales and timing differences related to the tax treatment of partnership investments.
For the fiscal year ended November 30, 2018, the Goldman Sachs MLP and Energy Renaissance Fund’s distributions are estimated to be comprised of 67.84% from taxable income and 32.16% return of capital and for the Goldman Sachs MLP Income Opportunities Fund, the distributions are estimated to be comprised of 41.27% from taxable income and 58.73% return of capital. Shareholders will be informed of the final tax characterization of the distributions in February 2019. For the Goldman Sachs MLP and Energy Renaissance Fund and the Goldman Sachs MLP Income Opportunities Fund, tax years ended November 30, 2015 through November 30, 2017 remain open for examination by U.S. and state tax authorities. Management of the Funds is not aware of any tax positions for which it is reasonably possible that the total amounts of unrecognized tax benefits or expenses will significantly change in the next 12 months.
|
| 5. AGREEMENTS AND AFFILIATED TRANSACTIONS |
A. Management Agreement — Under each Fund’s Agreement, GSAM manages each Fund, subject to the general supervision of the Board of Trustees.
As compensation for the services rendered pursuant to the respective Agreement, the assumption of the expenses related thereto and administration of a Fund’s business affairs, including providing facilities, GSAM is entitled to a management fee, accrued daily and paid monthly, equal to an annual percentage rate of 1.00% of each Fund’s average daily managed assets for the fiscal year ended November 30, 2018. Managed assets are defined as total assets of a Fund (including any assets attributable to borrowings for investment purposes) minus the sum of all accrued liabilities (other than liabilities representing indebtedness for investment purposes).
The Funds invest in Institutional Shares of the Goldman Sachs Financial Square Government Fund, which is an affiliated Underlying Fund. GSAM has agreed to waive a portion of its management fee payable by each Fund in an amount equal to the management fee it earns as investment adviser to the affiliated Underlying Fund in which the Funds invest. For the fiscal year ended November 30, 2018, GSAM waived $2,007 and $5,066 respectively, of the MLP and Energy Renaissance Fund’s and MLP Income Opportunities Fund’s management fees.
35
GOLDMAN SACHS CLOSED-END FUNDS
Notes to Financial Statements(continued)
November 30, 2018
|
| 5. AGREEMENTS AND AFFILIATED TRANSACTIONS (continued) |
B. Other Transactions with Affiliates — For the fiscal year ended November 30, 2018, Goldman Sachs did not earn any brokerage commissions from portfolio transactions on behalf of the Funds.
Morgan Stanley & Co. LLC or certain of its affiliates may be deemed to be an affiliate of the Goldman Sachs MLP Income Opportunities Fund as a result of it or certain of its affiliates owning, controlling or holding the power to vote 5% or more of the Fund’s outstanding shares. During the fiscal year ended November 30, 2018, Morgan Stanley & Co. LLC earned $8,790 in brokerage commissions from portfolio transactions with the Goldman Sachs MLP Income Opportunities Fund.
The Funds may purchase securities from, or sell securities to, an affiliate provided the affiliation is solely due to having a common investment adviser, common officers, or common trustees. For the fiscal year ended November 30, 2018, the purchase and sale transactions for the Goldman Sachs MLP Income Opportunities Fund with an affiliated fund in compliance withRule 17a-7 under the 1940 Act were $1,351,720 and $0, respectively. For the fiscal year ended November 30, 2018, there were no purchase and sale transactions for the Goldman Sachs MLP and Energy Renaissance Fund with an affiliated fund in compliance with Rule 17a-7 under the 1940 Act.
An investment by a Fund representing greater than 5% of the voting securities of an issuer makes that issuer an affiliated person (as defined by the 1940 Act) of such Fund. The following tables provide information about the investment in shares of issuers of which the Funds are affiliates for the fiscal year ended November 30, 2018.
| | | | | | | | | | | | | | | | | | | | | | | | | | | | | | |
|
Goldman Sachs MLP Income Opportunities Fund | |
| Name of Affiliated Issuer | | Beginning
Value as of November 30,
2017 | | Purchases
at Cost | | | Proceeds
from Sales | | | Net
Realized
Gain (Loss) | | | Change in
Unrealized
Gain (Loss) | | | Ending
Value as of
November 30,
2018 | | | Shares as of
November 30,
2018 | | | Dividend
Income | |
Hoegh LNG Partners LP* | | $25,025,000 | | $ | 211,463 | | | $ | (25,627,585 | ) | | $ | (6,306,578 | ) | | $ | 6,697,700 | | | $ | — | | | | — | | | $ | 676,100 | |
| * | | Security is no longer affiliated as of November 30, 2018. |
The table below shows the transactions in and earnings from investments in all affiliated funds as of and for the fiscal year ended November 30, 2018.
| | | | | | | | | | | | | | | | | | | | | | | | | | | | |
| Fund | | | | Underlying Fund | | Beginning
Value as of
November 30,
2017 | | | Purchases
at Cost | | | Proceeds
from Sales | | | Ending
Value as of
November 30,
2018 | | | Shares as of
November 30,
2018 | | | Dividend
Income | |
MLP and Energy Renaissance Fund | | | | Goldman Sachs Financial Square
Government Fund | | $ | 3,784 | | | $ | 71,460,792 | | | $ | (71,464,576 | ) | | $ | — | | | | — | | | $ | 20,988 | |
MLP Income Opportunities Fund | | | | Goldman Sachs Financial Square
Government Fund | | | 2,734,669 | | | | 106,680,779 | | | | (105,038,212 | ) | | | 4,377,236 | | | | 4,377,236 | | | | 54,471 | |
C. Financing Agreement — The Goldman Sachs MLP and Energy Renaissance Fund and the Goldman Sachs MLP Income Opportunities Fund each have entered into an evergreen fixed/floating rate margin loan facility (the “Credit Facility”) with a major U.S. financial institution. The Credit Facility provides for borrowings in an aggregate amount up to $395,000,000 and $300,000,000, respectively for the Funds. Borrowings under the Credit Facility bear interest subject to a Fund’s election of fixed rate and/or floating rate borrowings. The interest rates for the fixed rate borrowings are based on the lender’s internal fixed rates plus a mutually agreed-upon spread. The interest rates for the floating rate borrowings are based on variable rates (i.e., LIBOR) plus market spreads. Each Fund also pays an unused commitment fee of 0.20% per annum. Interest is accrued daily and paid quarterly. Under the terms of each Credit Facility, in the event of an early termination of any fixed rate borrowing(s), the Funds will receive or pay any gain or loss associated with the lender’s interest rate hedge, which could be material in certain circumstances, as well as any related termination costs (“Breakage Fees/Expenses”). For the fiscal year ended November 30, 2018, Goldman Sachs MLP and Energy Renaissance Fund and Goldman Sachs MLP Income Opportunities Fund received Breakage Fees of $1,490,322 and $1,008,833, respectively. Such amounts were netted against “Interest on borrowings” on the Statements of Operations.
36
GOLDMAN SACHS CLOSED-END FUNDS
|
| 5. AGREEMENTS AND AFFILIATED TRANSACTIONS (continued) |
The Goldman Sachs MLP and Energy Renaissance Fund had an average outstanding balance and weighted average annual interest rate for the fiscal year ended November 30, 2018 of $230,342,466 and 3.246%, respectively. As of November 30, 2018, there was $232,500,000 of outstanding borrowings under the Credit Facility at a weighted average annual interest rate of 3.526%.
The Goldman Sachs MLP Income Opportunities Fund had an average outstanding balance and weighted average annual interest rate for the fiscal year ended November 30, 2018 of $186,356,164 and 3.244%, respectively. As of November 30, 2018, there was $188,000,000 of outstanding borrowings under the Credit Facility at a weighted average annual interest rate of 3.498%.
|
| 6. PORTFOLIO SECURITIES TRANSACTIONS |
The cost of purchases and proceeds from sales and maturities of long-term securities for the fiscal year ended November 30, 2018, were:
| | | | | | | | | | |
| Fund | | | | Purchases | | | Sales | |
Goldman Sachs MLP and Energy Renaissance | | | | $ | 450,993,103 | | | $ | 455,951,132 | |
Goldman Sachs MLP Income Opportunities | | | | | 385,297,053 | | | | 381,670,825 | |
The Funds’ risks include, but are not limited to, the following:
Investments in Other Investment Companies — As a shareholder of another investment company, a Fund will indirectly bear its proportionate share of any net management fees and other expenses paid by such other investment companies, in addition to the fees and expenses regularly borne by the Fund.
Leverage Risk — Each Fund intends to use leverage to seek to achieve its investment objective. The use of leverage creates an opportunity for increased net investment income dividends, but also creates risks for the investors. There is no assurance that each Fund’s intended leveraging strategy will be successful. Leverage involves risks and special considerations, including the likelihood of greater volatility of NAV, market price and dividend rate than a comparable portfolio without leverage; the risk that fluctuations in interest rates on borrowings and short-term debt or in the interest or dividend rates on any leverage that a Fund must pay will reduce the Fund’s return; the effect of leverage in a declining market, which is likely to cause a greater decline in the NAV than if the Fund were not leveraged, which may result in a greater decline in the market price; the investment advisory fees payable to the Investment Adviser will be higher than if the Fund did not use financial leverage; and that leverage may increase operating costs, which may reduce total return. The use of leverage may impact a Fund’s ability to declare dividends and distributions; the Funds are generally not permitted to declare cash dividends or other distributions unless, at the time of such declaration, the value of the Fund’s assets, less liabilities other than the principal amount of borrowings, is at least 300% of such principal amount (after deducting the amount of such dividend or distribution). This prohibition does not apply to privately arranged debt that is not intended to be publicly distributed (i.e., each Fund’s credit facility, as discussed above). Under the terms of each Credit Facility, in the event of an early termination of any fixed rate borrowing(s), the Funds will receive or pay any gain or loss associated with the lender’s interest rate hedge, which could be material in certain circumstances, as well as any related termination costs.
Liquidity Risk — Each Fund may make investments that are illiquid or that may become less liquid in response to market developments or adverse investor perceptions. Illiquid investments may be more difficult to value.
Market and Credit Risks — An investment in a Fund represents an indirect investment in the securities owned by the Fund, a significant portion of which are traded on a national securities exchange. The value of these securities, like other investments, may move up or down, sometimes rapidly and unpredictably. Each Fund will utilize leverage, which magnifies the market risk. Additionally, a Fund may also be exposed to credit risk in the event that an issuer fails to perform or that an institution or entity with which the Fund has unsettled or open transactions defaults.
37
GOLDMAN SACHS CLOSED-END FUNDS
Notes to Financial Statements(continued)
November 30, 2018
|
| 7. OTHER RISKS (continued) |
Market Discount Risk — Shares ofclosed-end investment companies frequently trade at a discount from their NAV. This characteristic is a risk separate and distinct from the risk that the Fund’s NAV could decrease as a result of its investment activities and may be greater for investors expecting to sell their shares in a relatively short period of time following completion of the Fund’s initial offering. Although the value of a Fund’s net assets is generally considered by market participants in determining whether to purchase or sell shares, whether investors will realize gains or losses upon the sale of their shares will depend entirely upon whether the market price of the shares at the time of sale is above or below the investor’s adjusted tax cost basis for the shares. Because the market price of the shares will be determined by factors such as (i) NAV, (ii) dividend and distribution levels and their stability (which will in turn be affected by levels of dividend and interest payments by a Fund’s portfolio holdings, the timing and success of the Fund’s investment strategies, regulations affecting the timing and character of Fund distributions, Fund expenses and other factors), (iii) supply of and demand for the shares, (iv) trading volume of the shares, (v) general market, interest rate and economic conditions and (vi) other factors that may be beyond the control of the Fund. A Fund cannot predict whether the shares will trade at, below or above NAV or at, below or above the initial public offering price.
Master Limited Partnership Risk — Investments in securities of MLPs involve risks that differ from investments in common stocks, including risks related to limited control and limited rights to vote on matters affecting the MLP, risks related to potential conflicts of interest between the MLP and the MLP’s general partner, cash flow risks, dilution risks, limited liquidity and risks related to the general partner’s right to require unit-holders to sell their common units at an undesirable time or price.
Non-Diversification Risk — The Funds arenon-diversified, meaning that they are permitted to invest a larger percentage of their assets in fewer issuers than diversified mutual funds. Thus, a Fund may be more susceptible to adverse developments affecting any single issuer held in its portfolio, and may be more susceptible to greater losses because of these developments.
Private Investment Risk — The Funds may invest in PIPE securities. PIPE transactions typically involve the purchase of securities directly from a publicly traded company or its affiliates in a private placement transaction, typically at a discount to the market price of the company’s common stock. In a PIPE transaction, the Funds may bear the price risk from the time of pricing until the time of closing. Equity issued in this manner is often subject to transfer restrictions and is therefore less liquid than equity issued through a registered public offering. The Funds may be subject tolock-up agreements that prohibit transfers for a fixed period of time. In addition, because the sale of the securities in a PIPE transaction is not registered under the 1933 Act, the securities are “restricted” and cannot be immediately resold into the public markets. The ability of the Funds to freely transfer restricted shares is conditioned upon, among other things, the SEC’s preparedness to declare the resale registration statement effective and the issuer’s right to suspend the Funds’ use of the resale registration statement if the issuer is pursuing a transaction or some other materialnon-public event is occurring. Accordingly, PIPE securities may be subject to risks associated with illiquid securities.
Sector Risk— To the extent a Fund focuses its investments in securities of issuers in one or more sectors (such as the energy sectors), the Fund will be subject, to a greater extent than if its investments were diversified across different sectors, to the risks of volatile economic cycles and/or conditions and developments that may be particular to that sector, such as: adverse economic, business, political, environmental or other developments.
Strategy Risk — Each Fund’s strategy of investing primarily in MLPs, resulting in its being taxed as a corporation, or a “C” corporation, rather than as a regulated investment company for U.S. federal income tax purposes, is a relatively new investment strategy for funds. This strategy involves complicated accounting, tax and valuation issues. Volatility in the NAV may be experienced because of the use of estimates at various times during a given year that may result in unexpected and potentially significant consequences for the Funds and their shareholders.
Tax Risks — Tax risks associated with investments in a Fund include but are not limited to the following:
Fund Structure Risk. Unlike traditional mutual funds that are structured as regulated investment companies for U.S. federal income tax purposes, each Fund will be taxable as a regular corporation, or “C” corporation, for U.S. federal income tax purposes. This means the Funds generally will be subject to U.S. federal income tax on their taxable income at the rates applicable to corporations (currently a maximum rate of 21%) and will also be subject to state and local income taxes.
38
GOLDMAN SACHS CLOSED-END FUNDS
|
| 7. OTHER RISKS (continued) |
MLP Tax Risk. MLPs are generally treated as partnerships for U.S. federal income tax purposes. Partnerships do not pay U.S. federal income tax at the partnership level. Rather, each partner is allocated a share of the partnership’s income, gains, losses, deductions and expenses. A change in current tax law or a change in the underlying business mix of a given MLP could result in an MLP being treated as a corporation for U.S. federal income tax purposes, which would result in the MLP being required to pay U.S. federal income tax (as well as state and local income taxes) on its taxable income. This would have the effect of reducing the amount of cash available for distribution by the MLP and could result in a reduction in the value of a Fund’s investment in the MLP and lower income to the Fund.
To the extent a distribution received by a Fund from an MLP is treated as a return of capital, the Fund’s adjusted tax basis in the interests of the MLP will be reduced, which may increase the Fund’s tax liability upon the sale of the interests in the MLP or upon subsequent distributions in respect of such interests.
Tax Estimation/NAV Risk. In calculating a Fund’s daily NAV, the Fund will, among other things, include its current taxes and deferred tax liability and/or asset balances and related valuation balances, if any. A Fund may accrue a deferred income tax liability balance, at the currently effective statutory U.S. federal income tax rate (currently 21%) plus an estimated state and local income tax rate, for its future tax liability associated with the capital appreciation of its investments and the distributions received by the Fund’s on interests of MLPs considered to be return of capital and for any net operating gains. Any deferred tax liability balance will reduce a Fund’s NAV which could have an effect on the market price of the shares. The Funds may also record a deferred tax asset balance, which reflects an estimate of a Fund’s future tax benefit associated with net operating losses and/or unrealized losses. Any deferred tax asset balance will increase a Fund’s NAV to the extent it exceeds any valuation allowance which could have an effect on the market price of the shares. Each Fund will rely to some extent on information provided by MLPs, which may not be provided to the Funds on a timely basis, to estimate current taxes and deferred tax liability and/or asset balances for purposes of financial statement reporting and determining its NAV. The daily estimate of a Fund’s current taxes and deferred tax liability and/or asset balances used to calculate each Fund’s NAV could vary significantly from the Fund’s actual tax liability or benefit, and, as a result, the determination of the Fund’s actual tax liability or benefit may have a material impact on the Fund’s NAV. From time to time, a Fund may modify its estimates or assumptions regarding its current taxes and deferred tax liability and/or asset balances as new information becomes available, which modifications in estimates or assumptions may have a material impact on the Fund’s NAV.
On December 22, 2017, the TCJA was signed into law. This U.S. federal tax legislation reduced the general statutory U.S. federal corporate income tax rate from 35% to 21%, made changes regarding the use of net operating losses, repealed the corporate alternative minimum tax, placed limitations on the deductibility of interest expense, reduced the dividends received deduction amount, allowed for immediate expensing of certain capital expenditures, and made other changes which may have effects on the Funds and on the MLPs in which the Funds invest. These changes may affect a Fund’s daily estimates of its current taxes and deferred tax liability and/or asset balances used in the calculation of its daily NAV. The Funds will continue to evaluate this tax legislation for its potential effects on these estimates and for its potential effects on the amounts of income taxes actually incurred. The tax legislation may also affect the information provided to the Funds by MLPs, information that may not be provided to the
Funds on a timely basis. As disclosed above, the daily estimate of current taxes and deferred tax liability and/or asset balances used to calculate each Fund’s NAV could vary significantly from the Fund’s actual tax liability or benefit, which may have a material impact on the Fund’s NAV. A Fund may modify its estimates and assumptions regarding its current taxes and deferred tax liability and/or asset balances as this evaluation of the tax legislation continues and as new information regarding the legislation or other matters becomes available, and such modifications in estimates or assumptions may have a material impact on each Fund’s NAV.
Under the Trust’s organizational documents, its Trustees, officers, employees and agents are indemnified, to the extent permitted by the 1940 Act and state law, against certain liabilities that may arise out of performance of their duties to the Funds. Additionally, in the course of business, the Funds enter into contracts that contain a variety of indemnification clauses. The Funds’ maximum exposure under these arrangements is unknown, as this would involve future claims that may be made against the Funds that have not yet occurred. However, GSAM believes the risk of loss under these arrangements to be remote.
39
GOLDMAN SACHS CLOSED-END FUNDS
Notes to Financial Statements(continued)
November 30, 2018
|
| 9. SUMMARY OF SHARE TRANSACTIONS |
Share activity is as follows:
| | | | | | | | | | | | | | | | |
| | | MLP and Energy Renaissance Fund | |
| | | | |
| | | For the Fiscal Year Ended
November 30, 2018 | | | For the Fiscal Year Ended
November 30, 2017 | |
| | | | |
| | | Shares | | | Dollars | | | Shares | | | Dollars | |
| | | | |
| Common Shares | |
Increase from reinvestment of distributions | | | 226,455 | | | $ | 1,411,129 | | | | 229,075 | | | $ | 1,614,875 | |
| | | | 226,455 | | | $ | 1,411,129 | | | | 229,075 | | | $ | 1,614,875 | |
| | | MLP Income Opportunities Fund | |
| | | | |
| | | For the Fiscal Year Ended
November 30, 2018 | | | For the Fiscal Year Ended
November 30, 2017 | |
| | | | |
| | | Shares | | | Dollars | | | Shares | | | Dollars | |
| | | | |
| Common Shares | | | | | | | | | | | | | | | | |
Increase from reinvestment of distributions | | | — | | | $ | — | | | | 84,412 | | | $ | 769,844 | |
| | | | — | | | $ | — | | | | 84,412 | | | $ | 769,844 | |
In September 2018, the Financial Accounting Standards Board issued Accounting Standards Update (ASU) 2018-13 — Fair Value Measurement (Topic 820) Disclosure Framework — Changes to the Disclosure Requirements for Fair Value Measurement. The amendments in the ASU modify fair value measurement disclosures. The amendments are effective for each Fund’s fiscal years beginning after December 15, 2019. GSAM is currently evaluating the impact, if any, of the amendments.
Subsequent events after the Statements of Assets and Liabilities date have been evaluated and GSAM has concluded that there is no impact requiring adjustment or disclosure in the financial statements.
40
Report of Independent Registered Public
Accounting Firm
To the Boards of Trustees and Shareholders of
Goldman Sachs MLP and Energy Renaissance Fund and Goldman Sachs MLP Income Opportunities Fund
Opinions on the Financial Statements
We have audited the accompanying statements of assets and liabilities, including the schedules of investments, of Goldman Sachs MLP and Energy Renaissance Fund and Goldman Sachs MLP Income Opportunities Fund (hereafter collectively referred to as the “Funds”) as of November 30, 2018, the related statements of operations and cash flows for the year ended November 30, 2018, the statement of changes in net assets for each of the two years in the period ended November 30, 2018, including the related notes, and the financial highlights for each of the periods indicated therein (collectively referred to as the “financial statements”). In our opinion, the financial statements present fairly, in all material respects, the financial position of the Funds as of November 30, 2018, the results of their operations and their cash flows for the year then ended, the changes in each of their net assets for each of the two years in the period ended November 30, 2018 and the financial highlights for each of the periods indicated therein in conformity with accounting principles generally accepted in the United States of America.
Basis for Opinions
These financial statements are the responsibility of the Funds’ management. Our responsibility is to express an opinion on the Funds’ financial statements based on our audits. We are a public accounting firm registered with the Public Company Accounting Oversight Board (United States) (“PCAOB”) and are required to be independent with respect to the Funds in accordance with the U.S. federal securities laws and the applicable rules and regulations of the Securities and Exchange Commission and the PCAOB.
We conducted our audits of these financial statements in accordance with the standards of the PCAOB. Those standards require that we plan and perform the audit to obtain reasonable assurance about whether the financial statements are free of material misstatement, whether due to error or fraud.
Our audits included performing procedures to assess the risks of material misstatement of the financial statements, whether due to error or fraud, and performing procedures that respond to those risks. Such procedures included examining, on a test basis, evidence regarding the amounts and disclosures in the financial statements. Our audits also included evaluating the accounting principles used and significant estimates made by management, as well as evaluating the overall presentation of the financial statements. Our procedures included confirmation of securities owned as of November 30, 2018 by correspondence with the custodian, transfer agent and brokers; when replies were not received from brokers, we performed other auditing procedures. We believe that our audits provide a reasonable basis for our opinions.
PricewaterhouseCoopers LLP
Boston, Massachusetts
January 25, 2019
We have served as the auditor of one or more investment companies in the Goldman Sachs fund complex since 2000.
41
GOLDMAN SACHS CLOSED-END FUNDS
Statement Regarding Basis for Approval of Management Agreements (Unaudited)
Background
The Goldman Sachs MLP Income Opportunities Fund and Goldman Sachs MLP and Energy Renaissance Fund (the “Funds”) areclosed-end management investment companies that commenced investment operations on November 26, 2013 and September 26, 2014, respectively. The Board of Trustees (the “Board” or the “Trustees”) oversees the management of the Funds and reviews the investment performance and expenses of the Funds at regularly scheduled meetings held throughout the year. In addition, the Board determines annually whether to approve the continuance of the Funds’ investment management agreements (the “Management Agreements”) with Goldman Sachs Asset Management, L.P. (the “Investment Adviser”).
The Management Agreements were approved for continuation until July 31, 2019 by the Board, including those Trustees who are not parties to the Management Agreements or “interested persons” (as defined in the Investment Company Act of 1940, as amended) of any party thereto (the “Independent Trustees”), at a meeting held on June5-6, 2018 (the “Annual Meeting”). Following the June5-6, 2018 Annual Meeting, the Trustees determined that the Funds’ Annual Meeting would be held in September. As a result, the Management Agreements were approved for continuation until September 30, 2019 by the Board at a meeting held on September20-21, 2018.
The review process undertaken by the Trustees spans the course of the year and culminates with the Annual Meeting. To assist the Trustees in their deliberations, the Trustees have established a Contract Review Committee (the “Committee”), comprised of the Independent Trustees. The Committee held one meeting over the course of the year since the Management Agreements were approved on May16-17, 2017. At the Committee meeting, regularly scheduled Board or other committee meetings, and/or the June and September Annual Meetings, matters relevant to the renewal of the Management Agreements were considered by the Board, or the Independent Trustees, as applicable. The matters considered by the Board included:
| | (a) | | the nature and quality of the advisory, administrative, and other services provided to the Funds by the Investment Adviser and its affiliates, including information about: |
| | (i) | | the structure, staff, and capabilities of the Investment Adviser and its portfolio management teams; |
| | (ii) | | the groups within the Investment Adviser and its affiliates that support the portfolio management teams or provide other types of necessary services, including fund services groups (e.g., accounting and financial reporting, tax, shareholder services, and operations); controls and risk management groups (e.g., legal, compliance, valuation oversight, credit risk management, internal audit, compliance testing, market risk analysis, and finance); and others (e.g., information technology and training); |
| | (iii) | | trends in employee headcount; |
| | (iv) | | the Investment Adviser’s financial resources and ability to hire and retain talented personnel and strengthen its operations; and |
| | (v) | | the parent company’s support of the Investment Adviser and its registered fund business, as expressed by the firm’s senior management; |
| | (b) | | information on the investment performance of each Fund in terms of both market price and net asset value (“NAV”), including comparisons to the performance of a group similarclosed-end funds prepared by a third-party data provider (the “Outside Data Provider”), a benchmark performance index, composites of accounts with comparable investment strategies managed by the Investment Adviser, and general investment outlooks in the markets in which the Funds invest; |
| | (c) | | the terms of the Management Agreements and other agreements with service providers entered into by the Trust on behalf of the Funds; |
| | (d) | | fee and expense information for the Funds, including: |
| | (i) | | the relative management fee and expense levels of each Fund as compared to those of comparable funds managed by other advisers, as provided by the Outside Data Provider; |
| | (ii) | | comparative information on the advisory fees charged and services provided by the Investment Adviser to other types of accounts (such as private wealth management accounts and institutional separate accounts) managed by the Investment Adviser having investment objectives and policies similar to those of the Funds; |
| | (e) | | information relating to the profitability of the Management Agreements of each Fund to the Investment Adviser and its affiliates; |
| | (f) | | with respect to the investment performance and expense comparison data provided by the Outside Data Provider, its processes in producing that data for each Fund; |
(g) whether each Fund’s existing management fee schedule adequately addressed any economies of scale;
| | (h) | | a summary of the“fall-out” benefits derived by the Investment Adviser and its affiliates from their relationships with the Funds, including the portfolio trading services; |
| | (i) | | a summary of potential benefits derived by the Funds as a result of their relationship with the Investment Adviser; |
42
GOLDMAN SACHS CLOSED-END FUNDS
Statement Regarding Basis for Approval of Management Agreements (Unaudited) (continued)
| | (j) | | information regarding commissions paid by the Funds and broker oversight, an update on the Investment Adviser’s soft dollars practices and other information regarding portfolio trading, and how the Investment Adviser carries out its duty to seek best execution; |
| | (k) | | portfolio manager ownership of Fund shares for each Fund; the manner in which portfolio manager compensation is determined; and the number and types of accounts managed by the portfolio managers; |
| | (k) | | the nature and quality of the services provided to the Funds by its unaffiliated service providers, and the Investment Adviser’s general oversight and evaluation (including reports on due diligence) of those service providers as part of the administrative services provided under the Management Agreements; and |
| | (l) | | the Investment Adviser’s processes and policies addressing various types of potential conflicts of interest; its approach to risk management; the annual review of the effectiveness of the Funds’ compliance program; and periodic compliance reports. |
In evaluating the Management Agreements at the Annual Meeting, the Trustees relied upon their knowledge, resulting from their meetings and other interactions throughout the year, of the Investment Adviser and its affiliates, their services, the Funds, and the other investment companies for which the Trustees have responsibility. In conjunction with these meetings, the Trustees received written materials and oral presentations on the topics covered, and were advised by their independent legal counsel regarding their responsibilities and other regulatory requirements related to the approval and continuation of investment management agreements under applicable law. In addition, the Investment Adviser and its affiliates provided the Independent Trustees with a written response to a formal request for information sent on behalf of the Independent Trustees by their independent legal counsel. During the course of their deliberations, the Independent Trustees met in executive sessions with their independent legal counsel, without representatives of the Investment Adviser or its affiliates present.
Nature, Extent, and Quality of the Services Provided Under the Management Agreements
As part of their review, the Trustees considered the nature, extent, and quality of the services provided to the Funds by the Investment Adviser. In this regard, the Trustees considered both the investment advisory services andnon-advisory services that are provided by the Investment Adviser and its affiliates. They noted the significant resources that the Investment Adviser devotes to risk management and the control environment in which the Funds operate, as well as the Investment Adviser’s commitment to maintaining high quality systems. The Trustees concluded that the Investment Adviser continued to commit substantial financial and operational resources to the Funds and expressed confidence that the Investment Adviser would continue to do so in the future. The Trustees also recognized that the Investment Adviser had made significant commitments to address regulatory compliance requirements applicable to the Funds and the Investment Adviser.
Investment Performance
The Trustees considered the investment and market performance of the Funds in light of their respective investment objectives and the market conditions for energy-related securities, including master limited partnerships (“MLPs”). In this regard, they compared the investment performance of each Fund, in terms of both market price and net asset value (“NAV”), to the performance of a group ofclosed-end funds that invest primarily in energy MLPs and are subject to taxation as “C” corporations (the “Competitor Funds”) as of December 31, 2017 prepared by the Investment Adviser using the peer group data from the Outside Data Provider for theone- and three-year periods ended December 31, 2017. The Competitor Funds’ performance was provided for theone- and three-year periods ending on December 31, 2017, to the extent that the fund had been in existence for those periods.
The Trustees noted that on a NAV total return basis, the MLP Income Opportunities Fund had placed in the third quartile of its peer group of Competitor Funds for theone- and three-year periods ended December 31, 2017, while the MLP and Energy Renaissance Fund had placed in the fourth quartile of its peer group for theone- and three-year periods ended December 31, 2017. The Trustees also reviewed supplemental information complied by the Investment Adviser using information provided by the Outside Data Provider and an additional third-party data provider comparing the Funds’ performance, in terms of both market price and NAV as of June 30, 2018, against the Competitor Funds. They noted thatyear-to-date through June 30, 2018, the MLP Income Opportunities Fund and MLP and Energy Renaissance Fund were the second and third best performing funds, respectively, in their peer category group in terms of market price total return.
Costs of Services Provided and Competitive Information
The Trustees considered the contractual terms of the Management Agreements and the fee rates payable by the Funds thereunder. In this regard, the Trustees considered information on the services rendered by the Investment Adviser to the Funds, which included both advisory and administrative services that were directed to the needs and operations of the Funds asclosed-end funds.
43
GOLDMAN SACHS CLOSED-END FUNDS
Statement Regarding Basis for Approval of Management Agreements (Unaudited) (continued)
In particular, the Trustees reviewed information on each Fund’s total operating expense ratio and management fee rate (as a percentage of both managed and net assets), and those were compared to similar information for the Competitor Funds based on analyses prepared by the Outside Data Provider as of December 31, 2017. The analyses provided a comparison of each Fund’s management fee to those of a relevant peer group and category universe; an expense analysis which compared each Fund’s overall net and gross expenses to a peer group and a category universe; and data comparing each Fund’s net expenses to the peer and category medians. The Trustees concluded that the comparisons provided by the Outside Data Provider were useful in evaluating the reasonableness of the management fees and total expenses paid by the Funds.
Profitability
The Trustees reviewed the Funds’ contribution to the Investment Adviser’s revenues andpre-tax profit margins. In this regard the Trustees noted that they had received, among other things, profitability analyses and summaries, revenue and expense schedules by Fund and by function (i.e., investment management and distribution and service), and information on the Investment Adviser’s expense allocation methodology. They observed that the profitability and expense figures are substantially similar to those used by the Investment Adviser for many internal purposes, including compensation decisions among various business groups, and are thus subject to a vigorous internal debate about how certain revenue and expenses should be allocated. The Trustees also noted that the internal audit group within the Goldman Sachs organization had audited the expense allocation methodology and was satisfied with the reasonableness, consistency, and accuracy of the Investment Adviser’s expense allocation methodology and profitability analysis calculations. Profitability data for each Fund were provided for 2017 and 2016. They also noted that in connection with the September20-21, 2018 meeting, supplemental data were provided regarding Fund assets as of June 30, 2018 and management fees paid to the Investment Adviser for the period from December 31, 2017 to June 30, 2018. The Trustees considered this information in relation to the Investment Adviser’s overall profitability.
The Trustees also took into account that the Funds use leverage, which increases total assets and thus the amount of fees received by the Investment Adviser under the Management Agreements (because the fees are calculated based on total managed assets). In this regard, the Trustees took into account that the Investment Adviser has a financial incentive for the Funds to make continuous use of leverage, which may create a conflict of interest between the Investment Adviser, on the one hand, and each Fund’s shareholders, on the other. In this regard, the Trustees considered information provided by the Investment Adviser and the presentations by portfolio managers and determined that the Funds’ use of leverage is appropriate and in the best interests of each Fund’s shareholders.
Economies of Scale
The Trustees noted that the Funds do not have management fee breakpoints. They considered each Fund’s asset levels and information comparing the contractual management fee rate charged by the Investment Adviser with fee rates charged to the Competitor Funds. The Trustees recognized that if the assets of the Funds increase over time, the Funds and their shareholders could realize economies of scale as certain Fund expenses become a smaller percentage of overall assets. They further recognized that, because the Funds areclosed-end funds with no current plans to increase their assets (other than incurring leverage for investment purposes or engaging in future efforts to raise capital), any other significant growth in its assets would generally occur through appreciation in the value of the Funds’ investment portfolios, rather than through the continuous sale of Fund shares.
Other Benefits to the Investment Adviser and Its Affiliates
The Trustees also considered the other benefits derived by the Investment Adviser and its affiliates from their relationships with the Funds, including: (a) brokerage commissions earned by Goldman Sachs & Co. LLC (“Goldman Sachs”) for executing securities transactions on behalf of the Funds; (b) research received by the Investment Adviser from broker-dealers in exchange for executing certain transactions on behalf of the Funds; (c) trading efficiencies resulting from aggregation of orders of the Funds with those for other funds or accounts managed by the Investment Adviser; (d) the Investment Adviser’s ability to leverage the infrastructure designed to service the Funds on behalf of its other clients; (e) the Investment Adviser’s ability to cross-market other products and services to Fund shareholders; (f) the Investment Adviser’s ability to negotiate better pricing with custodians on behalf of its other clients, as a result of the relationship with the Funds; and (g) the possibility that the working relationship between the Investment Adviser and the Funds’ third party service providers may cause those service providers to be more likely to do business with other areas of Goldman Sachs. In the course of considering the foregoing, the Independent Trustees requested and received further information quantifying certain of thesefall-out benefits.
Other Benefits to the Funds and Their Shareholders
The Trustees also noted that the Funds receive certain potential benefits as a result of their relationship with the Investment Adviser, including: (a) trading efficiencies resulting from aggregation of orders of the Funds with those of other funds or accounts
44
GOLDMAN SACHS CLOSED-END FUNDS
Statement Regarding Basis for Approval of Management Agreements (Unaudited) (continued)
managed by the Investment Adviser; (b) enhanced servicing from vendors because of the volume of business generated by the Investment Adviser and its affiliates; (c) enhanced servicing from broker-dealers because of the volume of business generated by the Investment Adviser and its affiliates; (d) the Investment Adviser’s ability to negotiate favorable terms with derivatives counterparties on behalf of the Funds as a result of the size and reputation of the Goldman Sachs organization; (e) the Investment Adviser’s knowledge and experience gained from managing other accounts and products; (f) the Investment Adviser’s ability to hire and retain qualified personnel to provide services to the Funds because of the reputation of the Goldman Sachs organization; and (g) the Funds’ access, through the Investment Adviser, to certain firmwide resources (e.g., proprietary risk management systems and databases), subject to certain restrictions. The Trustees noted the competitive nature of theclosed-end fund marketplace, and considered that many of the Funds’ shareholders invested in the Funds in part because of the Funds’ relationship with the Investment Adviser and that those shareholders have a general expectation that the relationship will continue. The Trustees also referred to previous presentations in considering the Investment Adviser’s brokerage policies and procedures, as well as the Investment Adviser’s use of the Funds’ brokerage commissions to obtain brokerage and research services.
Conclusion
In connection with their consideration of the Management Agreements, the Trustees gave weight to each of the factors described above, but did not identify any one particular factor as controlling their decision. After deliberation and consideration of all of the information provided, including the factors described above, the Trustees concluded, in the exercise of their business judgment, that the management fees paid by each Fund were reasonable in light of the services provided to it by the Investment Adviser, the Investment Adviser’s costs and each Fund’s current and reasonably foreseeable asset levels. At the June5-6, 2018 Annual Meeting, the Trustees unanimously concluded that the Investment Adviser’s continued management likely would benefit each Fund and its shareholders and that the Management Agreement should be approved and continued with respect to each Fund until July 31, 2019. At the September20-21, 2018 Annual Meeting, the Trustees unanimously concluded that the Investment Adviser’s continued management likely would benefit each Fund and its shareholders and that the Management Agreement should be approved and continued with respect to each Fund until September 30, 2019.
45
GOLDMAN SACHS CLOSED-END FUNDS
Trustees and Officers (Unaudited)
Independent Trustees
| | | | | | | | | | |
Name
and Age1 | | Position(s) Held with the Funds | | Term of Office and
Length of
Time Served2 | | Principal Occupation(s)
During Past 5 Years | | Number of
Portfolios in
Fund Complex
Overseen by
Trustee3 | | Other
Directorships Held by Trustee4 |
Lawrence W. Stranghoener Age: 64 | | Chairman of the Board of Trustees | | Class III; Since 2015; Chairman of the Board of Trustees; Since 2017 | | Mr. Stranghoener is retired. He is Chairman, Kennametal, Inc. (a global manufacturer and distributor of tooling and industrial materials) (2003-Present); Director, Aleris Corporation and Aleris International, Inc. (a producer of aluminum rolled products) (2011-Present); and was formerly Interim Chief Executive Officer (2014); and Executive Vice President and Chief Financial Officer (2004-2014), Mosaic Company (a fertilizer manufacturing company). Chairman of the Board of Trustees — Goldman Sachs MLP Income Opportunities Fund; Goldman Sachs MLP and Energy Renaissance Fund; Goldman Sachs ETF Trust; Goldman Sachs Private Markets Fund 2018 LLC; Goldman Sachs Private Markets Fund 2018 (A) LLC; and Goldman Sachs Private Markets Fund 2018 (B) LLC. | | 34 | | Kennametal Inc. (a global manufacturer and distributor of tooling and industrial materials) |
Caroline Dorsa Age: 59 | | Trustee | | Class III; Since 2016 | | Ms. Dorsa is retired. She is Director, Biogen Inc. (a biotechnology company) (2010-Present); Director, Intellia Therapeutics Inc. (a gene-editing company) (2015-Present); and Director, Illumina, Inc. (a life sciences company) (2017-Present). She was formerly Executive Vice President and Chief Financial Officer, Public Service Enterprise Group, Inc. (a generation and energy services company) (2009-2015); Senior Vice President, Merck & Co, Inc. (a pharmaceutical company) (2008-2009 and 1987-2007); Senior Vice President and Chief Financial Officer, Gilead Sciences, Inc. (a pharmaceutical company) (2007-2008); and Senior Vice President and Chief Financial Officer, Avaya, Inc. (a technology company) (2007). Trustee — Goldman Sachs MLP Income Opportunities Fund; Goldman Sachs MLP and Energy Renaissance Fund; and Goldman Sachs ETF Trust. | | 31 | | Biogen Inc. (a biotechnology company); Intellia Therapeutics Inc. (a gene-editing company); Illumina, Inc. (a life sciences company) |
Linda A. Lang Age: 60 | | Trustee | | Class II; Since 2016 | | Ms. Lang is retired. She is Chair of the Board of Directors, (2016-Present) and Member of the Board of Directors, WD-40 Company (2004-Present); and was formerly Chairman and Chief Executive Officer (2005-2014); and Director, President and Chief Operating Officer, Jack in the Box, Inc. (a restaurant company) (2003-2005). Previously, Ms. Lang served as an Advisory Board Member of Goldman Sachs MLP Income Opportunities Fund and Goldman Sachs MLP and Energy Renaissance Fund (February 2016-March 2016). Trustee — Goldman Sachs MLP Income Opportunities Fund; Goldman Sachs MLP and Energy Renaissance Fund; Goldman Sachs ETF Trust; Goldman Sachs Private Markets Fund 2018 LLC; Goldman Sachs Private Markets Fund 2018 (A) LLC; and Goldman Sachs Private Markets Fund 2018 (B) LLC. | | 34 | | WD-40 Company (a global consumer products company) |
Michael Latham Age: 53 | | Trustee | | Class I; Since 2015 | | Mr. Latham is retired. Formerly, he held senior management positions with the iShares exchange-traded fund business, including Chairman (2011-2014); Global Head (2010 -2011); U.S. Head (2007-2010); and Chief Operating Officer (2003-2007). Trustee — Goldman Sachs MLP Income Opportunities Fund; Goldman Sachs MLP and Energy Renaissance Fund; Goldman Sachs ETF Trust; Goldman Sachs Private Markets Fund 2018 LLC; Goldman Sachs Private Markets Fund 2018 (A) LLC; and Goldman Sachs Private Markets Fund 2018 (B) LLC. | | 34 | | None |
| | | | | | | | | | |
46
GOLDMAN SACHS CLOSED-END FUNDS
Trustees and Officers (Unaudited) (continued)
Interested Trustees
| | | | | | | | | | |
Name
and Age1 | | Position(s) Held with the Funds | | Term of Office and
Length of
Time Served2 | | Principal Occupation(s)
During Past 5 Years | | Number of
Portfolios in
Fund Complex
Overseen by
Trustee3 | | Other
Directorships Held by Trustee4 |
James A. McNamara* Age: 56 | | President and Trustee | | Class II; Since 2013 (GMZ), 2014 (GER) | | Advisory Director, Goldman Sachs (January 2018-Present); Managing Director, Goldman Sachs (January 2000-December 2017); Director of Institutional Fund Sales, GSAM (April 1998-December 2000); and Senior Vice President and Manager, Dreyfus Institutional Service Corporation (January 1993-April 1998). President and Trustee — Goldman Sachs MLP Income Opportunities Fund; Goldman Sachs Trust; Goldman Sachs Variable Insurance Trust; Goldman Sachs Trust II; Goldman Sachs MLP and Energy Renaissance Fund; Goldman Sachs ETF Trust; Goldman Sachs Private Markets Fund 2018 LLC; Goldman Sachs Private Markets Fund 2018 (A) LLC; and Goldman Sachs Private Markets Fund 2018 (B) LLC. | | 155 | | None |
| | | | | | | | | | |
| * | | Mr. McNamara is considered to be an “Interested Trustee” because he holds positions with Goldman Sachs and/or owns securities issued by The Goldman Sachs Group, Inc. He also holds comparable positions with certain other companies of which Goldman Sachs, GSAM or an affiliate thereof is the investment adviser, administrator and/or distributor. |
| 1 | | Each Trustee may be contacted by writing to the Trustee, c/o Goldman Sachs, 200 West Street, New York, New York, 10282, Attn: Caroline Kraus. |
| 2 | | After a Trustee’s initial term, each Trustee is eligible to serve for successive three-year terms concurrent with the class of Trustees in which he or she serves, subject to such policies as may be adopted by the Board from time-to-time. |
| | ∎ | | Class I Trustees currently serve a three-year term ending in 2021 for GMZ and 2019 for GER. |
| | ∎ | | Class II Trustees currently serve a three-year term ending in 2019 for GMZ and 2020 for GER. |
| | ∎ | | Class III Trustees currently serve a three-year term ending in 2020 for GMZ and 2021 for GER. |
| | | The Board has adopted polices which provide that (a) no Trustee shall hold office for more than 15 years and (b) a Trustee shall retire as of December 31st of the calendar year in which he or she reaches his or her 74th birthday, unless a waiver of such requirement shall have been adopted by a majority of the other Trustees. These policies may be changed by the Trustees without shareholder vote. |
| 3 | | The Goldman Sachs Fund Complex includes certain other companies listed above for each respective Trustee. As of November 30, 2018, Goldman Sachs MLP Income Opportunities Fund, Goldman Sachs MLP and Energy Renaissance Fund, Goldman Sachs Private Markets Fund 2018 LLC, Goldman Sachs Private Markets Fund 2018 (A) LLC and Goldman Sachs Private Markets Fund 2018 (B) LLC each consisted of one portfolio; Goldman Sachs ETF Trust consisted of 29 portfolios (14 of which offered shares to the public); Goldman Sachs Trust consisted of 89 portfolios (88 of which offered shares to the public); Goldman Sachs Variable Insurance Trust consisted of 13 portfolios; and Goldman Sachs Trust II consisted of 19 portfolios (17 of which offered shares to the public). |
| 4 | | This column includes only directorships of companies required to report to the SEC under the Securities Exchange Act of 1934 (i.e., “public companies”) or other investment companies registered under the Act. |
47
GOLDMAN SACHS CLOSED-END FUNDS
Trustees and Officers (Unaudited) (continued)
Officers of the Funds*
| | | | | | |
Name, Address and Age1 | | Position(s) Held With the Funds | | Term and
Length of
Time Served1 | | Principal Occupation(s) During Past 5 Years |
James A. McNamara Age: 56 200 West Street New York, NY 10282 | | Trustee and President | | Since 2013 (GMZ), 2014 (GER) | | Advisory Director, Goldman Sachs (January 2018-Present); Managing Director, Goldman Sachs (January 2000-December 2017); Director of Institutional Fund Sales, GSAM (April 1998-December 2000); and Senior Vice President and Manager, Dreyfus Institutional Service Corporation (January 1993-April 1998). President and Trustee — Goldman Sachs MLP and Energy Renaissance Fund; Goldman Sachs MLP Income Opportunities Fund; Goldman Sachs Trust; Goldman Sachs Variable Insurance Trust; Goldman Sachs Trust II; Goldman Sachs ETF Trust; Goldman Sachs Private Markets Fund 2018 LLC; Goldman Sachs Private Markets Fund 2018 (A) LLC; and Goldman Sachs Private Markets Fund 2018 (B) LLC. |
Caroline L. Kraus Age: 41 200 West Street New York, NY 10282 | | Secretary | | Since 2013 (GMZ), 2014 (GER) | | Managing Director, Goldman Sachs (January 2016-Present); Vice President, Goldman Sachs (August 2006-December 2015); Associate General Counsel, Goldman Sachs (2012-Present); Assistant General Counsel, Goldman Sachs (August 2006-December 2011); and Associate, Weil, Gotshal & Manges, LLP (2002-2006). Secretary — Goldman Sachs MLP and Energy Renaissance Fund; Goldman Sachs MLP Income Opportunities Fund; Goldman Sachs Trust (previously Assistant Secretary (2012)); Goldman Sachs Variable Insurance Trust (previously Assistant Secretary (2012)); Goldman Sachs Trust II; Goldman Sachs BDC, Inc.; Goldman Sachs Private Middle Market Credit LLC; Goldman Sachs Middle Market Lending Corp.; Goldman Sachs ETF Trust; Goldman Sachs Private Markets Fund 2018 LLC; Goldman Sachs Private Markets Fund 2018 (A) LLC; and Goldman Sachs Private Markets Fund 2018 (B) LLC. |
Scott M. McHugh Age: 47 200 West Street New York, NY 10282 | | Treasurer, Senior Vice President and Principal Financial Officer | | Since 2013 (Senior Vice President since 2014) (GMZ), 2014 (GER) | | Managing Director, Goldman Sachs (January 2016-Present); Vice President, Goldman Sachs (February 2007-December 2015); Assistant Treasurer of certain mutual funds administered by DWS Scudder (2005-2007); and Director (2005-2007), Vice President (2000-2005), and Assistant Vice President (1998-2000), Deutsche Asset Management or its predecessor (1998-2007). Treasurer, Senior Vice President and Principal Financial Officer — Goldman Sachs MLP and Energy Renaissance Fund; Goldman Sachs MLP Income Opportunities Fund; Goldman Sachs Trust; Goldman Sachs Variable Insurance Trust; Goldman Sachs Trust II; Goldman Sachs ETF Trust; Goldman Sachs Private Markets Fund 2018 LLC; Goldman Sachs Private Markets Fund 2018 (A) LLC; and Goldman Sachs Private Markets Fund 2018 (B) LLC. |
Joseph F. DiMaria Age: 50 30 Hudson Street Jersey City, NJ 07302 | | Assistant Treasurer and Principal Accounting Officer | | Since 2017 (GMZ and GER) | | Managing Director, Goldman Sachs (November 2015-Present) and Vice President — Mutual Fund Administration, Columbia Management Investment Advisers, LLC (May 2010-October 2015). Assistant Treasurer and Principal Accounting Officer — Goldman Sachs MLP and Energy Renaissance Fund; Goldman Sachs MLP Income Opportunities Fund; Goldman Sachs Trust; Goldman Sachs Variable Insurance Trust; Goldman Sachs Trust II; Goldman Sachs ETF Trust; Goldman Sachs Private Markets Fund 2018 LLC; Goldman Sachs Private Markets Fund 2018 (A) LLC; and Goldman Sachs Private Markets Fund 2018 (B) LLC. |
| | | | | | |
| 1 | | Officers hold office at the pleasure of the Board until the next election of officers or until his or her successor is chosen and qualified or in each case, until his or her sooner death, resignation or removal from office. |
| | | Each officer holds comparable positions with certain other companies of which Goldman Sachs, GSAM or an affiliate thereof is the investment adviser, administrator and/or distributor. |
| * | | Represents a partial list of officers of the Funds. Additional information about all the officers is available in the Funds’ Statement of Additional Information, which can be obtained from Goldman Sachs free of charge by calling this toll-free number (in the United States): 1-800-292-4726. |
48
GOLDMAN SACHS CLOSED-END FUNDS
ADDITIONAL INFORMATION (Unaudited)
A. Dividend Reinvestment Plan — Under the Dividend Reinvestment Plan (the “Plan”) for the Goldman Sachs MLP and Energy Renaissance Fund and the Goldman Sachs MLP Income Opportunities Fund (each, a “Fund” and collectively, the “Funds”), dividends and/or distributions to a holder of a Fund’s common shares of beneficial interest (each, a “Common Share” and collectively, the “Common Shares”) will automatically be reinvested in additional Common Shares of that Fund. Each registered shareholder may elect to have dividends and distributions distributed in cash (i.e., “opt-out”) rather than participate in the Plan. For any registered shareholder that does not so elect (each, a “Participant” and collectively, the “Participants”), dividends and/or distributions on such shareholder’s Common Shares will be reinvested by Computershare Trust Company, N.A. (the “Plan Agent”), as agent for shareholders in administering the Plan, in additional Common Shares, as set forth below. Participation in the Plan is completely voluntary, and may be terminated or resumed at any time without penalty by Internet, telephone or written notice if received and processed by the Plan Agent prior to the dividend record rate; otherwise such termination or resumption will be effective with respect to any subsequently declared dividend or other distribution. Participants who hold their Common Shares through a broker or other nominee and who wish to elect to receive any dividends and distributions in cash must contact their broker or nominee. The Plan Agent will open an account for each holder of Common Shares under the Plan in the same name in which such holder of Common Shares is registered. Whenever a Fund declares a dividend or other distribution (together, a “Dividend”) payable in cash, non-participants in the Plan will receive cash and Participants will receive the equivalent in Common Shares. The Common Shares will be acquired by the Plan Agent for the Participants’ accounts, depending upon the circumstances described below, either through (i) receipt of additional unissued but authorized Common Shares from the Fund (“Newly Issued Common Shares”) or (ii) by purchase of outstanding Common Shares on the open market (“Open-Market Purchases”) on the New York Stock Exchange (“NYSE”) or elsewhere. If, on the payment date for any Dividend (the “Dividend Payment Date”), the net asset value (“NAV”) per Common Share is equal to or less than the closing market price plus estimated per Common Share fees (which include any applicable brokerage commissions the Plan Agent is required to pay) (such condition often referred to as a “premium”), the Plan Agent will invest the Dividend amount in Newly Issued Common Shares on behalf of the Participants. The number of Newly Issued Common Shares to be credited to each Participant’s account will be determined by dividing the dollar amount of the Dividend by the NAV per Common Share on the Dividend Payment Date; provided that, if the NAV is less than or equal to 95% of the closing market value on the Dividend Payment Date, the dollar amount of the Dividend will be divided by 95% of the closing market price per Common Share on the Dividend Payment Date. If, on the Dividend Payment Date, the NAV per Common Share is greater than the closing market price per share plus per Common Share fees (such condition referred to as a “market discount”), the Plan Agent will invest the Dividend amount in Common Shares acquired on behalf of the Participants in Open-Market Purchases. Such Open-Market Purchases shall continue on each successive business day until the entire Dividend amount has been invested pursuant to Open-Market Purchases; provided, however, that if (a) the market discount shifts to a market premium, or (b) the Open Market Purchases have not been completed by the Last Purchase Date (as defined below), the Plan Agent shall cease making Open-Market Purchases and shall invest the entire uninvested portion of the Dividend amount in Newly Issued Common Shares in the manner contemplated above. The term “Last Purchase Date” shall mean the last business day before the next date on which the Common Shares trade on an “ex-dividend” basis or 30 days after the Dividend Payment Date, whichever is sooner. Open-market purchases may be made on any securities exchange where Common Shares are traded, in the over-the-counter market or in negotiated transactions, and may be on such terms as to price, delivery and otherwise as the Plan Agent shall determine. It is contemplated that the Funds will pay quarterly Dividends.
B. Fund Certification— The Funds are listed for trading on the NYSE. The Funds will continue to file their annual chief executive officer certifications regarding compliance with the NYSE’s listing standards no more than 30 days after the Funds’ annual shareholder meeting.
49
PRIVACY NOTICE
(Applicable only to individual, joint, and individual retirement account (IRA) investors)
The Goldman Sachs financial services companies endeavor to maintain the highest standards of confidentiality and to respect the privacy of our client relationships. In that regard, we are providing this Privacy Notice to our clients in accordance with Title V of the Gramm-Leach-Bliley Act of 1999 and its implementing regulations. This notice supplements any privacy policies or statements that we may provide in connection with specific products or services.
The Information We Collect About You. The non-public personal information we collect about you (your “Information”) comes primarily from the account applications or other forms you submit to us. We may also collect Information about your transactions and experiences with us, our affiliates, or others relating to the products or services we provide. Also, depending on the products or services you require, we may obtain additional Information from consumer reporting agencies.
Our Disclosure Policies. We do not disclose your Information to anyone, except as permitted by law. This may include sharing your Information with non-affiliated companies that perform support services for your account or process your transactions with us or our affiliates. It may also include sharing your Information with our affiliates to bring you the full range of services and products available from the Goldman Sachs family of financial services companies, including our U.S. and international brokerage, asset management, advisory, and trust services companies. Additionally, it may include disclosing your Information pursuant to your express consent, to fulfill your instructions, or to comply with applicable laws and regulations.
Our Information Security Policies. We limit access to your Information to those of our employees and service providers who are involved in offering or administering the products or services that we offer. We maintain physical, electronic, and procedural safeguards that are designed to comply with federal standards to safeguard your Information. If our relationship ends, we will continue to treat your Information as described in this Privacy Notice.
This notice is being provided on behalf of the following affiliates of The Goldman Sachs Group, Inc.:
Goldman Sachs Asset Management, L.P.
Goldman Sachs Asset Management International
GS Investment Strategies, LLC
Goldman Sachs Hedge Fund Strategies, LLC
The family of funds managed by the affiliates listed above.
50
GOLDMAN SACHS CLOSED-END FUNDS
Voting Results of Joint Annual Meeting of Shareholders (Unaudited)
The joint Annual Meeting (the “Meeting”) of the Goldman Sachs MLP and Energy Renaissance Fund (“GER”) and Goldman Sachs MLP Income Opportunities Fund (“GMZ”) was held on March 29, 2018 to consider and act upon the proposals below. At the Meeting, Caroline Dorsa and Lawrence W. Stranghoener were elected Class III Trustees to the Board of Trustees of GER. In addition, Michael Latham was elected Class I Trustee to the Board of Trustees of GMZ.
The shareholders of GER voted as follows:
| | | | | | | | | | | | | | | | |
Proposal 1 — GER Election of Trustees | | For | | | Against/Withhold | | | Abstain | | | Broker Non-Votes | |
Caroline Dorsa (Class III) | | | 62,951,324 | | | | 1,920,509 | | | | 0 | | | | 0 | |
Lawrence W. Stranghoener (Class III) | | | 62,998,770 | | | | 1,873,063 | | | | 0 | | | | 0 | |
| | | | | | | | | | | | | | | | |
In addition to the individuals named above, Michael Latham, Linda A. Lang and James A. McNamara continued to serve on the Board of Trustees of GER.
The shareholders of GMZ voted as follows:
| | | | | | | | | | | | | | | | |
Proposal 1 — GMZ Election of Trustees | | For | | | Against/Withhold | | | Abstain | | | Broker Non-Votes | |
Michael Latham (Class I) | | | 34,990,827 | | | | 577,612 | | | | 0 | | | | 0 | |
| | | | | | | | | | | | | | | | |
In addition to the individual named above, Caroline Dorsa, Linda A. Lang, James A. McNamara and Lawrence W. Stranghoener continued to serve on the Board of Trustees of GMZ.
51
FUNDS PROFILE
Goldman SachsClosed-End Funds
Goldman Sachs is a premier financial services firm, known since 1869 for creating thoughtful and customized investment solutions in complex global markets.
Today, theInvestment Management Division of Goldman Sachs serves a diverse set of clients worldwide, including private institutions, public entities and individuals. With approximately $1.34 trillion in assets under management as of September 30, 2018, Goldman Sachs Asset Management (“GSAM”) has portfolio management teams located around the world and our investment professionals bring firsthand knowledge of local markets to every investment decision. GSAM’s assets under management includes assets managed by Goldman Sachs Asset Management, L.P. and its Investment Advisory Affiliates.
|
| GOLDMAN SACHSCLOSED-END FUNDS |
|
| MLP and Energy Renaissance Fund |
|
MLP Income Opportunities Fund |
| | |
TRUSTEES Lawrence W. Stranghoener,Chairman Caroline Dorsa Linda A. Lang Michael Latham James A. McNamara | | OFFICERS James A. McNamara,President Scott M. McHugh,Treasurer, Senior Vice President and Principal Financial Officer Joseph F. DiMaria,Assistant Treasurer and Principal Accounting Officer Caroline L. Kraus,Secretary |
| |
Goldman Sachs Asset Management, L.P. Investment Adviser | | Dechert LLP Legal Counsel |
| |
Computershare Trust Company, N.A. and Computershare Inc. Transfer Agent, Registrar and Dividend Reinvestment Plan Agent | | State Street Bank and Trust Company Custodian PricewaterhouseCoopers LLP Independent Registered Public Accounting Firm |
Goldman Sachs Asset Management, L.P., 200 West Street, New York, New York 10282
The reports concerning the Funds included in this shareholder report may contain certain forward-looking statements about the factors that may affect the performance of the Funds in the future. These statements are based on Fund management’s predictions and expectations concerning certain future events and their expected impact on the Funds, such as performance of the economy as a whole and of specific industry sectors, changes in the levels of interest rates, the impact of developing world events, and other factors that may influence the future performance of the Funds. Management believes these forward-looking statements to be reasonable, although they are inherently uncertain and difficult to predict. Actual events may cause adjustments in portfolio management strategies from those currently expected to be employed.
A description of the policies and procedures that the Funds use to determine how to vote proxies relating to portfolio securities and information regarding how a Fund voted proxies relating to portfolio securities for the most recent12-month period ended June 30, are available (I) without charge, upon request by calling1-855-807-2742; and (II) on the Securities and Exchange Commission (“SEC’’) web site at http://www.sec.gov.
The Funds file their complete schedule of portfolio holdings with the SEC for the first and third quarters of each fiscal year on FormN-Qs. The Funds’ FormN-Qs are available on the SEC’s web site at http://www.sec.gov within 60 days after the Funds’ first and third fiscal quarters. FormN-Qs may be obtained upon request and without charge by calling1-855-807-2742.
Fund holdings and allocations shown are as of November 30, 2018 and may not be representative of future investments. Fund holdings should not be relied on in making investment decisions and should not be construed as research or investment advice regarding particular securities. Current and future holdings are subject to risk.
The portfolio risk management process includes an effort to monitor and manage risk, but does not imply low risk.
Views and opinions expressed are for informational purposes only and do not constitute a recommendation by GSAM to buy, sell, or hold any security. Views and opinions are current as of the date of this presentation and may be subject to change, they should not be construed as investment advice.
Economic and market forecasts presented herein reflect a series of assumptions and judgments as of the date of this presentation and are subject to change without notice. These forecasts do not take into account the specific investment objectives, restrictions, tax and financial situation or other needs of any specific client. Actual data will vary and may not be reflected here. These forecasts are subject to high levels of uncertainty that may affect actual performance.
Accordingly, these forecasts should be viewed as merely representative of a broad range of possible outcomes. These forecasts are estimated, based on assumptions, and are subject to significant revision and may change materially as economic and market conditions change. Goldman Sachs has no obligation to provide updates or changes to these forecasts. Case studies and examples are for illustrative purposes only. This communication is not an offer to sell these securities and is not a solicitation to buy these securities in any jurisdiction where the offer or sale is not permitted.
“Alerian MLP Index”, and “AMZ” are trademarks of Alerian and their use is granted under a license from Alerian.
Notice is hereby given in accordance with Section 23(c) of the Investment Company Act of 1940, as amended, that from time to time, the Fund may purchase, at market prices, shares of its common stock in the open market.
The Cushing® MLP High Income Index (the “Index”) is the exclusive property of Swank Capital, LLC, which has contracted with S&P Opco, LLC (a subsidiary of S&P Dow Jones Indices LLC) (“S&P Dow Jones Indices”) to maintain and calculate the Index. S&P® is a registered trademark of Standard & Poor’s Financial Services LLC (“SPFS”); Dow Jones® is a registered trademark of Dow Jones Trademark Holdings LLC (“Dow Jones”); and these trademarks have been licensed to S&P Dow Jones Indices. “Calculated by S&P Dow Jones Indices” and its related stylized mark(s) have been licensed for use by Swank Capital, LLC. Neither S&P Dow Jones Indices, SPFS, Dow Jones S&P nor any of their affiliates sponsor and promote the Index and none shall be liable for any errors or omissions in calculating the Index.
This report is transmitted to Funds’ shareholders only. It is not a prospectus. Investors should consider their investment goals, time horizons and risk tolerance before investing in a Fund. An investment in a Fund is not appropriate for all investors, and the Funds are not intended to be complete investment programs. Investors should carefully review and consider a Fund’s investment objective, risks, charges and expenses before investing.
© 2019 Goldman Sachs. All rights reserved. 153412-OTU-01/2019-MLPCEFAR-19/21K
| | (a) | As of the end of the period covered by this report, the Registrant has adopted a code of ethics that applies to the Registrant’s principal executive officer, principal financial officer, principal accounting officer or controller, or persons performing similar functions, regardless of whether these individuals are employed by the Registrant or a third party (the “Code of Ethics”). |
| | (b) | During the period covered by this report, no amendments were made to the provisions of the Code of Ethics. |
| | (c) | During the period covered by this report, the Registrant did not grant any waivers, including an implicit waiver, from any provision of the Code of Ethics. |
| | (d) | A copy of the Code of Ethics is available as provided in Item 13(a)(1) of this report. |
| ITEM 3. | AUDIT COMMITTEE FINANCIAL EXPERT. |
| | The Registrant’s board of trustees has determined that the Registrant has at least one “audit committee financial expert” (as defined in Item 3 of Form N-CSR) serving on its audit committee. Caroline Dorsa is the “audit committee financial expert” and is “independent” (as each term is defined in Item 3 of Form N-CSR). |
| ITEM 4. | PRINCIPAL ACCOUNTANT FEES AND SERVICES. |
Table 1 — Items 4(a) - 4(d). The accountant fees below reflect the aggregate fees billed by the Registrant during the fiscal years ended November 30, 2017 and November 30, 2018.
| | | | | | | | | | |
| | | 2018 | | | 2017 | | | Description of Services Rendered |
Audit Fees: | | | | | | | | | | |
• PricewaterhouseCoopers LLP (“PwC”) | | $ | 56,000 | | | $ | 41,000 | | | Financial Statement audits. |
Audit-Related Fees: | | | | | | | | | | |
• PwC | | $ | — | | | $ | — | | | Other attest services. |
Tax Fees: | | | | | | | | | | |
• PwC | | $ | 130,700 | | | $ | 118,900 | | | Tax compliance services provided in connection with the preparation and review of Registrant’s tax returns. |
Table 2 — Items 4(b)(c) & (d). Non-Audit Services to the Registrant’s service affiliates * that were pre-approved by the Audit Committee of the Registrant pursuant to Rule 2-01(c)(7)(ii) of Regulation S-X during the fiscal years ended November 30, 2017 and November 30, 2018.
| | | | | | | | | | |
| | | 2018 | | | 2017 | | | Description of Services Rendered |
Audit-Related Fees: | | | | | | | | | | |
• PwC | | $ | 1,356,035 | | | $ | 1,387,779 | | | Internal control review performed in accordance with Statement on Standards for Attestation Engagements No. 16 and semi annual updates related to withholding tax accrual for non-US jurisdictions. These fees are borne by the Funds’ Adviser. |
| * | These include the advisor (excluding sub-advisors) and any entity controlling, controlled by or under common control with the advisor that provides ongoing services to the registrant (hereinafter referred to as “service affiliates”). |
Item 4(e)(1) — Audit Committee Pre-Approval Policies and Procedures
Pre-Approval of Audit and Non-Audit Services Provided to Goldman Sachs MLP and Energy Renaissance Fund. The Audit and Non-Audit Services Pre-Approval Policy (the “Policy”) adopted by the Audit Committee of the Board of Trustees of Goldman Sachs MLP and Energy Renaissance Fund (the “Fund”) sets forth the procedures and the conditions pursuant to which services performed by an independent auditor for the Fund may be pre-approved. Services may be pre-approved specifically by the Audit Committee as a whole or, in certain circumstances, by the Audit Committee Chairman or the person designated as the Audit Committee Financial Expert. In addition, subject to specified cost limitations, certain services may be pre-approved under the provisions of the Policy. The Policy provides that the Audit Committee will consider whether the services provided by an independent auditor are consistent with the Securities and Exchange Commission’s rules on auditor independence. The Policy provides for periodic review and pre-approval by the Audit Committee of the services that may be provided by the independent auditor.
De Minimis Waiver. The pre-approval requirements of the Policy may be waived with respect to the provision of non-audit services that are permissible for an independent auditor to perform, provided (1) the aggregate amount of all such services provided constitutes no more than five percent of the total amount of revenues subject to pre-approval that was paid to the independent auditors during the fiscal year in which the services are provided; (2) such services were not recognized by the Fund at the time of the engagement to be non-audit services; and (3) such services are promptly brought to the attention of the Audit Committee and approved prior to the completion of the audit by the Audit Committee or by one or more members of the Audit Committee to whom authority to grant such approvals has been delegated by the Audit Committee, pursuant to the pre-approval provisions of the Policy.
Pre-Approval of Non-Audit Services Provided to the Fund’s Investment Advisers. The Policy provides that, in addition to requiring pre-approval of audit and non-audit services provided to the Fund, the Audit Committee will pre-approve those non-audit services provided to the Fund’s investment advisers (and entities controlling, controlled by or under common control with the investment advisers that provide ongoing services to the Fund) where the engagement relates directly to the operations or financial reporting of the Fund.
Item 4(e)(2) —0% of the audit-related fees, tax fees and other fees listed in Table 1 were approved by the Registrant’s Audit Committee pursuant to the “de minimis” exception of Rule 2-01(c)(7)(i)(C) of Regulation S-X. In addition, 0% of the non-audit services to the Registrant’s service affiliates listed in Table 2 were approved by the Registrant’s Audit Committee pursuant to the “de minimis” exception of Rule 2-01(c)(7)(i)(C) of Regulation S-X.
Item 4(f) —Not applicable.
Item 4(g) Aggregate Non-Audit Fees Disclosure
The aggregate non-audit fees billed to the Registrant by PwC for the twelve months ended November 30, 2018 and November 30, 2017 were $130,700 and $118,900 respectively. The aggregate non-audit fees billed to Registrant’s adviser and service affiliates by PwC for non-audit services for the twelve months ended December 31, 2017 and December 31, 2016 were approximately $9.4 million and $11.4 million respectively. With regard to the aggregate non-audit fees billed to the Registrant’s adviser and service affiliates, the 2017 and 2016 amounts include fees for non-audit services required to be pre-approved [see Table 2] and fees for non-audit services that did not require pre-approval since they did not directly relate to the Registrant’s operations or financial reporting. The figures for these entities are not yet available for the twelve months ended December 31, 2018.
Item 4(h) — The Registrant’s Audit Committee has considered whether the provision of non-audit services to the Registrant’s investment adviser and service affiliates that did not require pre-approval pursuant to paragraph (c)(7)(ii) of Rule 2-01 of Regulation S-X is compatible with maintaining the auditors’ independence.
| ITEM 5. | AUDIT COMMITTEE OF LISTED REGISTRANTS. |
| | The Registrant has a separately-designated standing Audit Committee established in accordance with Section 3(a)(58)(A) of the Securities Exchange Act of 1934, as amended. The members of the Audit Committee are Caroline Dorsa, Linda A. Lang, Michael Latham, and Lawrence W. Stranghoener, each a Trustee of the Registrant. |
| ITEM 6. | SCHEDULE OF INVESTMENTS. |
| | Schedule of Investments is included as part of the Report to Shareholders filed under Item 1. |
| ITEM 7. | DISCLOSURE OF PROXY VOTING POLICIES AND PROCEDURES FORCLOSED-END MANAGEMENT INVESTMENT COMPANIES. |
The Registrant has delegated the voting of portfolio securities to Goldman Sachs Asset Management L.P. (the “Investment Adviser”). For client accounts for which the Investment Adviser has voting discretion, the Investment Adviser has adopted policies and procedures (the “Proxy Voting Policy”) for the voting of proxies. Under the Proxy Voting Policy, the Investment Adviser’s guiding principles in performing proxy voting are to make decisions that favor proposals that tend to maximize a company’s shareholder value and are not influenced by conflicts of interest. To implement these guiding principles for investments in publicly-traded equities, the Investment Adviser has developed customized proxy voting guidelines (the “Guidelines”) that it generally applies when voting on behalf of client accounts. These Guidelines address a wide variety of individual topics, including, among other matters, shareholder voting rights, anti-takeover defenses, board structures, the election of directors, executive and director compensation, reorganizations, mergers, issues of corporate social responsibility and various shareholder proposals.
The Proxy Voting Policy, including the Guidelines, is reviewed periodically to ensure that it continues to be consistent with the Investment Adviser’s guiding principles. The Guidelines embody the positions and factors the Investment Adviser generally considers important in casting proxy votes.
The Investment Adviser has retained a third-party proxy voting service (“Proxy Service”), currently Institutional Shareholder Services, to assist in the implementation and administration of certain proxy voting-related functions including, without limitation, operational, recordkeeping and reporting services. The Proxy Service also prepares a written analysis and recommendation (a “Recommendation”) of each proxy vote that reflects the Proxy Service’s application of the Guidelines to particular proxy issues. While it is the Investment Adviser’s policy generally to follow the Guidelines and Recommendations from the Proxy Service, the Investment Adviser’s portfolio management teams (“Portfolio Management Teams”) may on certain proxy votes seek approval to diverge from the Guidelines or a Recommendation by following an “override” process. Such decisions are subject to a review and approval process, including a determination that the decision is not influenced by any conflict of interest. A Portfolio Management Team that receives approval through the override process to cast a proxy vote that diverges from the Guidelines and/or a Recommendation may vote differently than other Portfolio Management Teams that did not seek to override the vote. In forming their views on particular matters, the Portfolio Management Teams are also permitted to consider applicable regional rules and practices, including codes of conduct and other guides, regarding proxy voting, in addition to the Guidelines and Recommendations. The Investment Adviser may hire other service providers to replace or supplement the Proxy Service with respect to any of the services the Investment Adviser currently receives from the Proxy Service.
From time to time, the Investment Adviser may face regulatory, compliance, legal or logistical limits with respect to voting securities that it may purchase or hold for client accounts, which can affect the Investment Adviser’s ability to vote such proxies, as well as the desirability of voting such proxies. Among other limits, federal, state and foreign regulatory restrictions or company specific ownership limits, as well as legal matters related to consolidated groups, may restrict the total percentage of an issuer’s voting securities that the Investment Adviser can hold for clients and the nature of the Investment Adviser’s voting in such securities. The Investment Adviser’s ability to vote proxies may also be affected by, among other things: (i) late receipt of meeting notices; (ii) requirements to vote proxies in person: (iii) restrictions on a foreigner’s ability to exercise votes; (iv) potential difficulties in translating the proxy; (v) requirements to provide local agents with unrestricted powers of attorney to facilitate voting instructions; and (vi) requirements that investors who exercise their voting rights surrender the right to dispose of their holdings for some specified period in proximity to the shareholder meeting.
The Investment Adviser conducts periodic due diligence meetings with the Proxy Service which include, but are not limited to, a review of the Proxy Service’s general organizational structure, new developments with respect to research and technology, work flow improvements and internal due diligence with respect to conflicts of interest.
The Investment Adviser has adopted policies and procedures designed to prevent conflicts of interest from influencing its proxy voting decisions that the Investment Adviser makes on behalf of a client account and to help ensure that such decisions are made in accordance with the Investment Adviser’s fiduciary obligations to its clients. These policies and procedures include the Investment Adviser’s use of the Guidelines and Recommendations from the Proxy Service, the override approval process previously discussed, and the establishment of information barriers between the Investment Adviser and other businesses within The Goldman Sachs Group, Inc. Notwithstanding such proxy voting policies and procedures, actual proxy voting decisions of the Investment Adviser may have the effect of benefitting the interests of other clients or businesses of other divisions or units of Goldman Sachs and/or its affiliates, provided that the Investment Adviser believes such voting decisions to be in accordance with its fiduciary obligations.
Voting decisions with respect to fixed income securities and the securities of privately held issuers generally will be made by the Registrant’s managers based on their assessment of the particular transactions or other matters at issue.
Information regarding how the Registrant voted proxies relating to portfolio securities during the most recent 12-month period ending June 30, 2018 will be available on or through the Registrant’s website atwww.gsamfunds.com and on the SEC’s website at www.sec.gov.
| ITEM 8. | PORTFOLIO MANAGERS OFCLOSED-END MANAGEMENT INVESTMENT COMPANIES. |
Item 8(a)(1)
| | | | | | |
Name | | Title | | Length of Time Served | | Principal Occupation(s) During Past 5 Years |
| Kyri Loupis | | Lead Portfolio Manager | | Since 2014 | | Mr. Loupis joined the Investment Adviser in 2009 and is a portfolio manager and head of the Energy & Infrastructure team. Prior to joining the Investment Adviser he spent over eight years at Lehman Brothers covering the energy sector, from 2000-2006 in the Investment Banking Division, and from 2006- 2009 in the Private Equity group, where heco-founded an energy investment fund with a focus in MLPs. |
| | | |
Ganesh V. Jois, CFA | | Portfolio Manager | | Since 2014 | | Mr. Jois joined the Investment Adviser in 2009 and is a research analyst and portfolio manager for the Energy & Infrastructure Team. Prior to joining the Investment Adviser, he was at Citigroup Investment Research covering MLPs, where he helped initiate coverage on several MLPs and had coverage responsibility for nearly 20 MLPs. Between 2003 and 2005, he worked in the Financial Advisory Services practice of Deloitte & Touche. |
| | | |
| Matthew Cooper | | Portfolio Manager | | Since 2014 | | Mr. Cooper joined the Investment Adviser in 2013 and is a research analyst and portfolio manager for the Energy & Infrastructure Team. Prior to joining the Investment Adviser, he worked in the Commodities Origination and Structuring group at Merrill Lynch beginning in 2011. Between 2007 and 2009 he worked as a research analyst in the Private Equity Group at Lehman Brothers covering the energy sector. Prior to that he worked as an Investment Banker in the Energy and Power Group at Merrill Lynch & Co. |
Item 8(a)(2)
The following tables disclose other accounts within each type of category listed below for which the portfolio managers are jointly and primarily responsible for day to day portfolio management, as of November 30, 2018, unless otherwise noted.
| | | | | | | | | | | | | | | | | | | | | | | | | | | | | | | | | | | | | | | | | | | | | | | | |
| | | Number of Other Accounts Managed and Total Assets
by Account Type | | | Number of Accounts and Total Assets for
Which Advisory Fee is Performance Based | |
Name of Portfolio Manager | | Registered
Investment
Companies | | | Other Pooled
Investment
Vehicles | | | Other
Accounts | | | Registered
Investment
Companies | | | Other Pooled
Investment
Vehicles | | | Other
Accounts | |
| | Number
of
Accounts | | | Assets
Managed
(mm) | | | Number
of
Accounts | | | Assets
Managed
(mm) | | | Number
of
Accounts | | | Assets
Managed
(mm) | | | Number
of
Accounts | | | Assets
Managed
(mm) | | | Number
of
Accounts | | | Assets
Managed
(mm) | | | Number
of
Accounts | | | Assets
Managed
(mm) | |
Kyri Loupis | | | 5 | | | | 3,499 | | | | 4 | | | | 293 | | | | 2,604 | | | | 3,695 | | | | 0 | | | | 0 | | | | 0 | | | | 0 | | | | 0 | | | | 0 | |
Ganesh V. Jois | | | 4 | | | | 3,389 | | | | 3 | | | | 290 | | | | 2,603 | | | | 3,666 | | | | 0 | | | | 0 | | | | 0 | | | | 0 | | | | 0 | | | | 0 | |
Matthew Cooper | | | 5 | | | | 3,499 | | | | 4 | | | | 293 | | | | 2,604 | | | | 3,695 | | | | 0 | | | | 0 | | | | 0 | | | | 0 | | | | 0 | | | | 0 | |
Item 8(a)(3) —
Compensation for portfolio managers of the Investment Adviser is comprised of a base salary and discretionary variable compensation. The base salary is fixed from year to year.Year-end discretionary variable compensation is primarily a function of each portfolio manager’s individual performance and his or her contribution to overall team performance; the performance of the Investment Adviser and Goldman Sachs; the team’s net revenues for the past year which in part is derived from advisory fees, and performance based fees for certain accounts, if any; and anticipated compensation levels among competitor firms. Portfolio managers are rewarded, in part, for their delivery of investment performance, measured on apre-tax basis, which is reasonably expected to meet or exceed the expectations of clients and fund shareholders in terms of: excess return over an applicable benchmark, peer group ranking, risk management and factors specific to certain funds such as yield or regional focus. Performance is judged over1-,3- and5-year time horizons.
For compensation purposes, the benchmark for the Registrant is the Alerian MLP Index Total Return.
The discretionary variable compensation for portfolio managers is also significantly influenced by: (1) effective participation in team research discussions and process; and (2) management of risk in alignment with the targeted risk parameter and investment objective of the Registrant. Other factors may also be considered including: (1) general client/shareholder orientation and (2) teamwork and leadership. Portfolio managers may receive equity-based awards as part of their discretionary variable compensation.
Other Compensation — In addition to base salary and discretionary variable compensation, the Investment Adviser has a number of additional benefits in place including (1) a 401k program that enables employees to direct a percentage of their pretax salary and bonus income into atax-qualified retirement plan; and (2) investment opportunity programs in which certain professionals may participate subject to certain eligibility requirements.
Item 8(a)(4)
The following table shows the portfolio managers’ ownership of securities in the Fund as of November 30, 2018:
| | |
Name of Portfolio Manager | | Name of Portfolio Manager |
Kyri Loupis | | Over $1,000,000 |
Ganesh V. Jois, CFA | | $100,001 - $500,000 |
Matthew Cooper | | $100,001 - $500,000 |
| ITEM 9. | PURCHASES OF EQUITY SECURITIES BYCLOSED-END MANAGEMENT INVESTMENT COMPANY AND AFFILIATED PURCHASERS. |
| | There have been no purchases of equity securities by or on behalf of the Registrant of shares or other units of any registered class of the Registrant’s equity securities. |
| ITEM 10. | SUBMISSION OF MATTERS TO A VOTE OF SECURITY HOLDERS. |
| | There have been no material changes to the procedures by which shareholders may recommend nominees to the registrant’s board of trustees. |
| ITEM 11. | CONTROLS AND PROCEDURES. |
| | (a) | The registrant’s principal executive and principal financial officers, or persons performing similar functions have concluded that the registrant’s disclosure controls and procedures (as defined in Rule 30a-3(c) under the Investment Company Act of 1940, as amended (the “1940 Act”)) are effective as of a date within 90 days of the filing of this report that includes the disclosure required by this paragraph, based on the evaluation of these controls and procedures required by Rule 30a-3(b) under the 1940 Act and15d-15(b) under the Securities Exchange Act of 1934, as amended. |
| | (b) | There were no changes in the registrant’s internal control over financial reporting (as defined in Rule 30a-3(d) under the 1940 Act) that occurred during the registrant’s last fiscal quarter that have materially affected, or are reasonably likely to materially affect, the registrant’s internal control over financial reporting. |
| ITEM 12. | DISCLOSURE OF SECURITIES LENDING ACTIVITIES FOR CLOSED-END MANAGEMENT INVESTMENT COMPANIES |
| | The Registrant did not engage in securities lending activities during the fiscal period reported on this Form N-CSR. |
| | | | |
| (a)(1) | | The Registrant’s Code of Ethics for Principal Executive and Senior Financial Officers is incorporated by reference to Exhibit 12(a)(1) of the Registrant’s FormN-CSR filed on February 9, 2016. |
| | |
| (a)(2) | | Exhibit 99.CERT | | Certifications pursuant to Section 302 of the Sarbanes-Oxley Act of 2002 filed herewith. |
| |
| (a)(3) | | Not applicable. |
| |
| (a)(4) | | There was no change in the registrant’s independent public accountant for the period covered by this report. |
| | |
| (b) | | Exhibit 99.906CERT | | Certifications pursuant to Section 906 of the Sarbanes-Oxley Act of 2002 filed herewith. |
SIGNATURES
Pursuant to the requirements of the Securities Exchange Act of 1934 and the Investment Company Act of 1940, the registrant has duly caused this report to be signed on its behalf by the undersigned, thereunto duly authorized.
| | | | |
| | | | Goldman Sachs MLP and Energy Renaissance Fund |
| | |
| By: | | | | /s/ James A. McNamara |
| | |
| | | | James A. McNamara |
| | | | President/Chief Executive Officer |
| | | | Goldman Sachs MLP and Energy Renaissance Fund |
| | |
| Date: | | | | February 7, 2019 |
Pursuant to the requirements of the Securities Exchange Act of 1934 and the Investment Company Act of 1940, this report has been signed below by the following persons on behalf of the registrant and in the capacities and on the dates indicated.
| | | | |
| | |
| By: | | | | /s/ James A. McNamara |
| | |
| | | | James A. McNamara |
| | | | President/Chief Executive Officer |
| | | | Goldman Sachs MLP and Energy Renaissance Fund |
| | |
| Date: | | | | February 7, 2019 |
| | |
| By: | | | | /s/ Scott McHugh |
| | |
| | | | Scott McHugh |
| | | | Principal Financial Officer |
| | | | Goldman Sachs MLP and Energy Renaissance Fund |
| | |
| Date: | | | | February 7, 2019 |