UNITED STATES
SECURITIES AND EXCHANGE COMMISSION
Washington, D.C. 20549
FORM N-CSR
CERTIFIED SHAREHOLDER REPORT OF REGISTERED
MANAGEMENT INVESTMENT COMPANIES
Investment Company Act file number 811-22980
Angel Oak Funds Trust
(Exact name of registrant as specified in charter)
3344 Peachtree Rd. NE, Suite 1725
Atlanta, Georgia 30326
(Address of principal executive offices) (Zip code)
Dory S. Black, Esq., President
3344 Peachtree Rd. NE, Suite 1725
Atlanta, Georgia 30326
(Name and address of agent for service)
Copy to:
Douglas P. Dick
Stephen T. Cohen
Dechert LLP
1900 K Street NW
Washington, DC 20006
(404) 953-4900
Registrant’s telephone number, including area code
Date of fiscal year end: January 31
Date of reporting period: July 31, 2022
Item 1. Reports to Stockholders.
(a)

Semi-Annual Report
July 31, 2022
Angel Oak Multi-Strategy Income Fund
Angel Oak Financials Income Fund
Angel Oak High Yield Opportunities Fund
Angel Oak UltraShort Income Fund
Angel Oak Core Impact Fund
Angel Oak Capital Advisors, LLC
3344 Peachtree Road NE
Suite 1725
Atlanta, GA 30326
(404) 953-4900
Table of Contents
Investment Results – (Unaudited)
Angel Oak Multi-Strategy Income Fund
Total Return Based on a $500,000 Investment
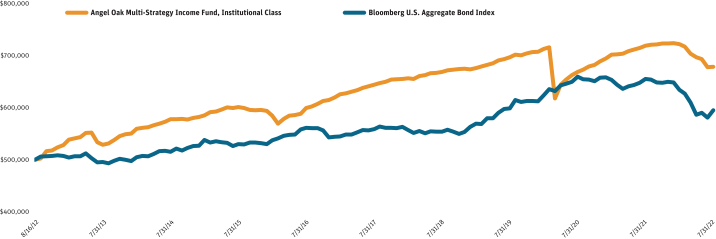
The Fund is the successor to the investment performance of the Angel Oak Multi-Strategy Income Fund (the “Predecessor Multi-Strategy Income Fund”) as a result of the reorganization of the Predecessor Multi-Strategy Income Fund into the Fund on April 10, 2015. Accordingly, the performance information shown in the chart above and table below for periods prior to April 10, 2015 is that of the Predecessor Multi-Strategy Income Fund. The Predecessor Multi-Strategy Income Fund was also advised by the Fund’s investment adviser, Angel Oak Capital Advisors, LLC (the “Adviser”), and had the same investment objective, policies, and strategies as the Fund.
The chart above assumes an initial investment of $500,000 made on August 16, 2012 (commencement of operations). Returns shown include the reinvestment of all dividends. Returns shown do not reflect the deduction of taxes that a shareholder would pay on Fund distributions or the redemption of Fund shares. In the absence of fee waivers and reimbursements, when they are necessary to keep expenses at the expense cap, total return would be reduced. Past performance is not predictive of future performance. Investment return and principal value will fluctuate so that your shares, when redeemed, may be worth more or less than the original cost. Index returns do not reflect the effects of fees or expenses. It is not possible to invest directly in an index.
Total Returns(1)
(For the period ended July 31, 2022)
| | | | | | | | | | | | | | | | | | |
| | | Average Annual Returns | |
| | | One Year | | Three Year | | | Five Year | | | Ten Year | | | Since Inception(2) | |
Angel Oak Multi-Strategy Income Fund, Institutional Class | | (5.65%) | | | (0.87 | %) | | | 1.06 | % | | | N/A | | | | 3.12 | % |
Angel Oak Multi-Strategy Income Fund, Class A without load | | (5.88%) | | | (1.12 | %) | | | 0.79 | % | | | 3.07 | % | | | 4.57 | % |
Angel Oak Multi-Strategy Income Fund, Class A with load | | (7.99%) | | | (1.88 | %) | | | 0.33 | % | | | 2.84 | % | | | 4.36 | % |
Angel Oak Multi-Strategy Income Fund, Class C without load | | (6.64%) | | | (1.87 | %) | | | 0.04 | % | | | N/A | | | | 0.73 | % |
Angel Oak Multi-Strategy Income Fund, Class C with load | | (7.53%) | | | (1.87 | %) | | | 0.04 | % | | | N/A | | | | 0.73 | % |
Bloomberg U.S. Aggregate Bond Index(3) | | (9.12%) | | | (0.21 | %) | | | 1.28 | % | | | 1.65 | % | | | 1.77 | %(4) |
(1) Return figures reflect any change in price per share and assume the reinvestment of all distributions. Total returns for Class A Shares, with load, include the maximum 2.25% sales charge. Total returns for Class C Shares, with load, include the maximum 1.00% deferred sales charge.
(2) Inception date is August 16, 2012 for Institutional Class Shares, June 28, 2011 for Class A Shares, and August 4, 2015 for Class C Shares.
(3) The Bloomberg U.S. Aggregate Bond Index measures the performance of the investment-grade, fixed-rate bond market, including government and credit securities, agency pass-through securities, asset-backed securities and commercial mortgage-backed securities. Performance figures include the change in value of the bonds in the index and the reinvestment of interest. The index return does not reflect expenses, which have been deducted from the Fund’s return. You cannot invest directly in an index; however, an individual can invest in exchange-traded funds or other investment vehicles that attempt to track the performance of a benchmark index.
1
Investment Results – (Unaudited) (continued)
(4) The return shown for the Bloomberg U.S. Aggregate Bond Index is from the inception date of the Institutional Class Shares. The Bloomberg U.S. Aggregate Bond Index return from the inception date of Class A Shares is 2.25% and for Class C Shares is 1.68%.
2
Investment Results – (Unaudited) (continued)
Angel Oak Financials Income Fund
Total Return Based on a $500,000 Investment
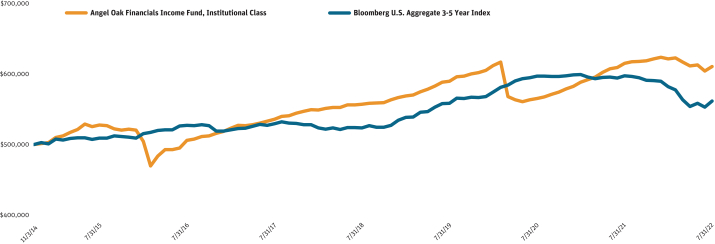
The chart above assumes an initial investment of $500,000 made on November 3, 2014 (commencement of operations). Returns shown include the reinvestment of all dividends. Returns shown do not reflect the deduction of taxes that a shareholder would pay on Fund distributions or the redemption of Fund shares. In the absence of fee waivers and reimbursements, when they are necessary to keep expenses at the expense cap, total return would be reduced. Past performance is not predictive of future performance. Investment return and principal value will fluctuate so that your shares, when redeemed, may be worth more or less than the original cost. Index returns do not reflect the effects of fees or expenses. It is not possible to invest directly in an index.
Total Returns(1)
(For the period ended July 31, 2022)
| | | | | | | | | | | | | | |
| | | Average Annual Returns | |
| | | One Year | | Three Year | | | Five Year | | | Since Inception(2) | |
Angel Oak Financials Income Fund, Institutional Class | | (0.73%) | | | 1.15 | % | | | 2.65 | % | | | 2.62 | % |
Angel Oak Financials Income Fund, Class A without load | | (0.87%) | | | 0.90 | % | | | 2.40 | % | | | 2.38 | % |
Angel Oak Financials Income Fund, Class A with load | | (3.12%) | | | 0.13 | % | | | 1.93 | % | | | 2.08 | % |
Angel Oak Financials Income Fund, Class C without load | | (2.15%) | | | 0.02 | % | | | 1.56 | % | | | 1.04 | % |
Angel Oak Financials Income Fund, Class C with load | | (3.10%) | | | 0.02 | % | | | 1.56 | % | | | 1.04 | % |
Bloomberg U.S. Aggregate 3-5 Year Index(3) | | (5.95%) | | | 0.20 | % | | | 1.19 | % | | | 1.52 | %(4) |
(1) Return figures reflect any change in price per share and assume the reinvestment of all distributions. Total returns for Class A Shares, with load, include the maximum 2.25% sales charge. Total returns for Class C Shares, with load, include the maximum 1.00% deferred sales charge.
(2) Inception date is November 3, 2014 for Institutional Class and Class A Shares and August 4, 2015 for Class C Shares.
(3) The Bloomberg U.S. Aggregate 3-5 Year Index tracks bonds with 3-5 year maturities within the Bloomberg U.S. Aggregate Bond Index. Performance figures include the change in value of the bonds in the index and the reinvestment of interest. The index return does not reflect expenses, which have been deducted from the Fund’s return. You cannot invest directly in an index; however, an individual can invest in exchange-traded funds or other investment vehicles that attempt to track the performance of a benchmark index.
(4) The return shown for the Bloomberg U.S. Aggregate 3-5 Year Index is from the inception date of the Institutional Class and Class A Shares. The Bloomberg U.S. Aggregate 3-5 Year Index return from the inception date of the Class C Shares is 1.44%.
3
Investment Results – (Unaudited) (continued)
Angel Oak High Yield Opportunities Fund
Total Return Based on a $500,000 Investment
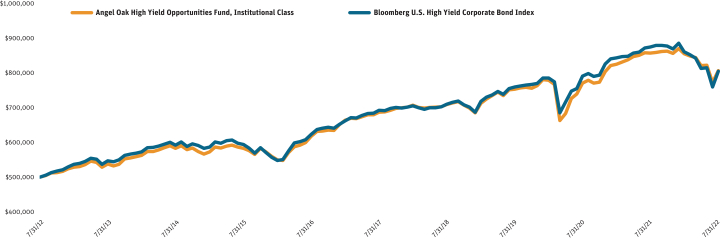
The Fund is the successor to the investment performance of the Rainier High Yield Fund (the “Predecessor High Yield Fund”) as a result of the reorganization of the Predecessor High Yield Fund into the Fund on April 15, 2016. Accordingly, the performance information shown in the chart above and table below for periods prior to April 15, 2016 is that of the Predecessor High Yield Fund’s Institutional Shares and Original Shares for the Fund’s Institutional Class and Class A shares, respectively. The Predecessor High Yield Fund was managed by the same portfolio managers as the Fund and when the Predecessor High Yield Fund was reorganized into the Fund had substantially the same investment objectives, policies, and strategies as the Fund.
The chart above assumes an initial investment of $500,000 made on July 31, 2012. Returns shown include the reinvestment of all dividends. Returns shown do not reflect the deduction of taxes that a shareholder would pay on Fund distributions or the redemption of Fund shares. In the absence of fee waivers and reimbursements, when they are necessary to keep expenses at the expense cap, total return would be reduced. Past performance is not predictive of future performance. Investment return and principal value will fluctuate so that your shares, when redeemed, may be worth more or less than the original cost. Index returns do not reflect the effects of fees or expenses. It is not possible to invest directly in an index.
Total Returns(1)
(For the period ended July 31, 2022)
| | | | | | | | | | | | | | | | | | |
| | | Average Annual Returns | |
| | | One Year | | Three Year | | | Five Year | | | Ten Year | | | Since Inception(2) | |
Angel Oak High Yield Opportunities Fund, Institutional Class | | (5.85%) | | | 2.30 | % | | | 3.26 | % | | | 4.90 | % | | | 7.50 | % |
Angel Oak High Yield Opportunities Fund, Class A without load | | (6.06%) | | | 2.03 | % | | | 3.00 | % | | | 4.65 | % | | | 4.65 | % |
Angel Oak High Yield Opportunities Fund, Class A with load | | (8.15%) | | | 1.26 | % | | | 2.52 | % | | | 4.41 | % | | | 4.41 | % |
Bloomberg U.S. High Yield Corporate Bond Index(3) | | (8.02%) | | | 1.95 | % | | | 3.06 | % | | | 4.87 | % | | | 9.05 | %(4) |
(1) Return figures reflect any change in price per share and assume the reinvestment of all distributions. Total returns for Class A Shares, with load, include the maximum 2.25% sales charge.
(2) Inception date is March 31, 2009 for Institutional Class Shares and July 31, 2012 for Class A Shares.
(3) The Bloomberg U.S. High Yield Corporate Bond Index is an unmanaged market value-weighted index that covers the universe of fixed-rate, non-investment grade debt. Performance figures include the change in value of the bonds in the index and the reinvestment of interest. The index return does not reflect expenses, which have been deducted from the Fund’s return. You cannot invest directly in an index; however, an individual can invest in exchange-traded funds or other investment vehicles that attempt to track the performance of a benchmark index.
(4) The return shown for the Bloomberg U.S. High Yield Corporate Bond Index is from the inception date of the Institutional Class Shares. The Bloomberg U.S. High Yield Corporate Bond Index return from the inception date of Class A Shares is 4.87%.
4
Investment Results – (Unaudited) (continued)
Angel Oak UltraShort Income Fund
Total Return Based on a $500,000 Investment
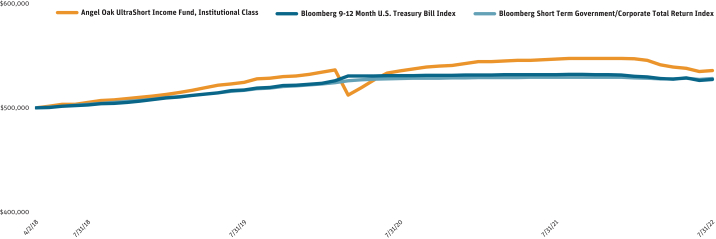
The chart above assumes an initial investment of $500,000 made on April 2, 2018 (commencement of operations). Returns shown include the reinvestment of all dividends. Returns shown do not reflect the deduction of taxes that a shareholder would pay on Fund distributions or the redemption of Fund shares. In the absence of fee waivers and reimbursements, when they are necessary to keep expenses at the expense cap, total return would be reduced. Past performance is not predictive of future performance. Investment return and principal value will fluctuate so that your shares, when redeemed, may be worth more or less than the original cost. Index returns do not reflect the effects of fees or expenses. It is not possible to invest directly in an index.
Total Returns(1)
(For the period ended July 31, 2022)
| | | | | | | | | | | | |
| | | Average Annual Returns | |
| | | One Year | | | Three Year | | | Since Inception(2) | |
Angel Oak UltraShort Income Fund, Institutional Class | | | (2.03 | %) | | | 0.72 | % | | | 1.61 | % |
Angel Oak UltraShort Income Fund, Class A | | | (2.19 | %) | | | 0.47 | % | | | 1.32 | % |
Angel Oak UltraShort Income Fund, Class A1 without load | | | N/A | | | | N/A | | | | 0.13 | %(3) |
Angel Oak UltraShort Income Fund, Class A1 with load | | | N/A | | | | N/A | | | | (1.89 | %)(3) |
Bloomberg 9-12 Month U.S. Treasury Bill Index(4) | | | (0.91 | %) | | | 0.65 | % | | | 1.23 | %(5) |
Bloomberg Short Term Government/Corporate Total Return Index(6) | | | (0.23 | %) | | | 0.73 | % | | | 1.27 | %(7) |
(1) Return figures reflect any change in price per share and assume the reinvestment of all distributions. Total returns for Class A1 Shares, with load, include the maximum 1.50% sales charge and the maximum 0.50% deferred sales charge.
(2) Inception date is April 2, 2018 for Institutional Class, April 30, 2018 for Class A Shares, and July 12, 2022 for Class A1 Shares.
(3) Less than one year of activity, figure presented is a cumulative return.
(4) The Bloomberg 9-12 Month U.S. Treasury Bill Index measures the performance of U.S. Treasury bills, notes, and bonds with a remaining maturity between 9-12 months. Performance figures include the change in value of the bonds in the index and the reinvestment of interest. The index return does not reflect expenses, which have been deducted from the Fund’s return. You cannot invest directly in an index; however, an individual can invest in exchange-traded funds or other investment vehicles that attempt to track the performance of a benchmark index.
(5) The return shown for the Bloomberg 9-12 Month U.S. Treasury Bill Index is from the inception date of the Institutional Class Shares. The Bloomberg 9-12 Month U.S. Treasury Bill Index return from the inception date of the Class A Shares is 1.23% and for Class A1 Shares is 0.18%.
5
Investment Results – (Unaudited) (continued)
(6) The Bloomberg Short Term Government/Corporate Total Return Index is an unmanaged index that represents securities that have fallen out of the U.S. Government/Corporate Index because of the standard minimum one year maturity constraint. Sectors include treasuries, agencies, industrials, utilities and financial institutions. Performance figures include the change in value of the bonds in the index and the reinvestment of interest. The index return does not reflect expenses, which have been deducted from the Fund’s return. You cannot invest directly in an index; however, an individual can invest in exchange-traded funds or other investment vehicles that attempt to track the performance of a benchmark index.
(7) The return shown for the Bloomberg Short Term Government/Corporate Total Return Index is from the inception date of the Institutional Class Shares. The Bloomberg Short Term Government/Corporate Total Return Index return from the inception date of the Class A Shares is 1.27% and for Class A1 Shares is 0.12%.
6
Investment Results – (Unaudited) (continued)
Angel Oak Core Impact Fund
Total Return Based on a $500,000 Investment
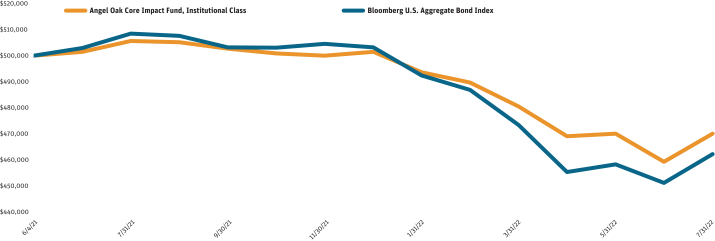
The chart above assumes an initial investment of $500,000 made on June 4, 2021 (commencement of operations). Returns shown include the reinvestment of all dividends. Returns shown do not reflect the deduction of taxes that a shareholder would pay on Fund distributions or the redemption of Fund shares. In the absence of fee waivers and reimbursements, when they are necessary to keep expenses at the expense cap, total return would be reduced. Past performance is not predictive of future performance. Investment return and principal value will fluctuate so that your shares, when redeemed, may be worth more or less than the original cost. Index returns do not reflect the effects of fees or expenses. It is not possible to invest directly in an index.
Total Returns(1)
(For the period ended July 31, 2022)
| | | | | | | | |
| | | Average Annual Returns |
| | | One Year | | | Since Inception(2) | |
Angel Oak Core Impact Fund, Institutional Class | | | (7.04 | %) | | | (5.21 | %) |
Bloomberg U.S. Aggregate Bond Index(3) | | | (9.12 | %) | | | (6.58 | %) |
(1) Return figures reflect any change in price per share and assume the reinvestment of all distributions.
(2) Inception date is June 4, 2021.
(3) The Bloomberg U.S. Aggregate Bond Index measures the performance of the investment-grade, fixed-rate bond market, including government and credit securities, agency pass-through securities, asset-backed securities and commercial mortgage-backed securities. Performance figures include the change in value of the bonds in the index and the reinvestment of interest. The index return does not reflect expenses, which have been deducted from the Fund’s return. You cannot invest directly in an index; however, an individual can invest in exchange-traded funds or other investment vehicles that attempt to track the performance of a benchmark index.
7
Summary of Funds’ Expenses – (Unaudited)
As a shareholder of the Funds, you incur two types of costs: (1) transaction costs, including sales charges (loads) on purchase payments; and (2) ongoing costs, including management fees, distribution and/or service (12b-1) fees and other expenses of the Funds. This example is intended to help you understand your ongoing costs (in dollars) of investing in the Funds and to compare these costs with the ongoing costs of investing in other mutual funds. The example is based on an investment of $1,000 invested at the beginning of the period and held for the entire period.
Actual Expenses
The first lines of the tables below provide information about actual account values and actual expenses. You may use the information in these lines, together with the amount you invested, to estimate the expenses that you paid over the period. Simply divide your account value by $1,000 (for example, an $8,600 account value divided by $1,000 = $8.60), then multiply the result by the numbers in the first lines under the heading entitled “Expenses Paid During Period” to estimate the expenses you paid on your account during this period.
Hypothetical Example for Comparison Purposes
The second lines of the tables below provide information about hypothetical account values and hypothetical expenses based on the Funds’ actual expense ratios and an assumed rate of return of 5% per year before expenses, which is not the Funds’ actual return. The hypothetical account values and expenses may not be used to estimate the actual ending account balance or expenses you paid for the period. You may use this information to compare the ongoing costs of investing in the Funds and other funds. To do so, compare this 5% hypothetical example with the 5% hypothetical examples that appear in the shareholder reports of other funds.
Please note that the expenses shown in the table are meant to highlight your ongoing costs only and do not reflect any transactional costs, such as sales charges (loads), redemption fees or exchange fees. Therefore, the second lines of the tables below are useful in comparing ongoing costs only and will not help you determine the relative costs of owning different funds. In addition, if these transactional costs were included, your costs would have been higher.
| | | | | | | | | | |
| Angel Oak Multi-Strategy Income Fund | | Beginning
Account Value | | Ending
Account Value | | Expenses Paid
During Period(1) | | Annualized
Expense Ratio |
Class A | | Actual | | $1,000.00 | | $938.30 | | $7.26 | | 1.51% |
| | | Hypothetical(2) | | $1,000.00 | | $1,017.31 | | $7.55 | | 1.51% |
Class C | | Actual | | $1,000.00 | | $935.10 | | $10.84 | | 2.26% |
| | | Hypothetical(2) | | $1,000.00 | | $1,013.59 | | $11.28 | | 2.26% |
Institutional Class | | Actual | | $1,000.00 | | $940.30 | | $6.06 | | 1.26% |
| | | Hypothetical(2) | | $1,000.00 | | $1,018.55 | | $6.31 | | 1.26% |
| | | | | | | | | | |
| Angel Oak Financials Income Fund | | Beginning
Account Value | | Ending
Account Value | | Expenses Paid
During Period(1) | | Annualized
Expense Ratio |
Class A | | Actual | | $1,000.00 | | $981.00 | | $4.67 | | 0.95% |
| | | Hypothetical(2) | | $1,000.00 | | $1,020.08 | | $4.76 | | 0.95% |
Class C | | Actual | | $1,000.00 | | $972.90 | | $8.32 | | 1.70% |
| | | Hypothetical(2) | | $1,000.00 | | $1,016.36 | | $8.50 | | 1.70% |
Institutional Class | | Actual | | $1,000.00 | | $982.10 | | $3.44 | | 0.70% |
| | | Hypothetical(2) | | $1,000.00 | | $1,021.32 | | $3.51 | | 0.70% |
| | | | | | | | | | |
| Angel Oak High Yield Opportunities Fund | | Beginning
Account Value | | Ending
Account Value | | Expenses Paid
During Period(1) | | Annualized
Expense Ratio |
Class A | | Actual | | $1,000.00 | | $942.60 | | $4.33 | | 0.90% |
| | | Hypothetical(2) | | $1,000.00 | | $1,020.33 | | $4.51 | | 0.90% |
Institutional Class | | Actual | | $1,000.00 | | $943.60 | | $3.13 | | 0.65% |
| | | Hypothetical(2) | | $1,000.00 | | $1,021.57 | | $3.26 | | 0.65% |
8
Summary of Funds’ Expenses – (Unaudited) (continued)
| | | | | | | | | | |
| Angel Oak UltraShort Income Fund | | Beginning
Account Value | | Ending
Account Value | | Expenses Paid
During Period | | Annualized
Expense Ratio |
Class A | | Actual | | $1,000.00 | | $978.80 | | $2.94(1) | | 0.60% |
| | | Hypothetical(2) | | $1,000.00 | | $1,021.82 | | $3.01(1) | | 0.60% |
Class A1 | | Actual | | $1,000.00 | | $1,001.30 | | $0.31(3) | | 0.60% |
| | | Hypothetical(2) | | $1,000.00 | | $1,021.82 | | $3.01(1) | | 0.60% |
Institutional Class | | Actual | | $1,000.00 | | $979.20 | | $1.72(1) | | 0.35% |
| | | Hypothetical(2) | | $1,000.00 | | $1,023.06 | | $1.76(1) | | 0.35% |
| | | | | | | | | | |
| Angel Oak Core Impact Fund | | Beginning
Account Value | | Ending
Account Value | | Expenses Paid
During Period(1) | | Annualized
Expense Ratio |
Institutional Class | | Actual | | $1,000.00 | | $952.20 | | $2.86 | | 0.59% |
| | | Hypothetical(2) | | $1,000.00 | | $1,021.87 | | $2.96 | | 0.59% |
(1) Expenses are equal to the Fund’s annualized expense ratio, multiplied by the average account value over the period, multiplied by the number of days (181) in the most recent six month period and divided by the number of days in the most recent twelve month period (365). The annualized expense ratios reflect fee waiver and expense limitation arrangements, including interest expense, in effect during the period. The “Financial Highlights” tables in the Funds’ financial statements, included in the report, also show the gross expense ratios, without such reimbursements.
(2) Hypothetical assumes 5% annual return before expenses.
(3) Expenses are equal to the Fund’s annualized expense ratio, multiplied by the average account value over the period, multiplied by the number of days (19) in the most recent period beginning July 12, 2022, and divided by the number of days in the most recent twelve month period (365). The annualized expense ratios reflect fee waiver and expense limitation arrangements, including interest expense, in effect during the period. The “Financial Highlights” tables in the Funds’ financial statements, included in the report, also show the gross expense ratios, without such reimbursements.
9
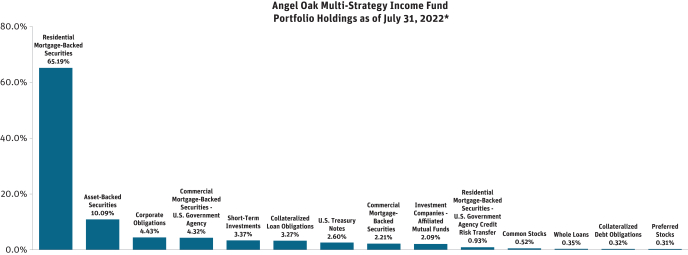
Portfolio Holdings – (Unaudited)
The investment objective of Angel Oak Multi-Strategy Income Fund is to seek current income.
The investment objective of Angel Oak Financials Income Fund is to seek current income with a secondary objective of total return.
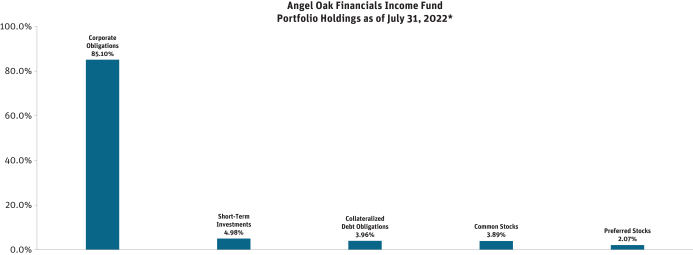
* As a percentage of total investments. The percentages presented in the table above may differ from those in the Schedule of Investments because the percentages in the Schedule of Investments are calculated based on net assets.
10
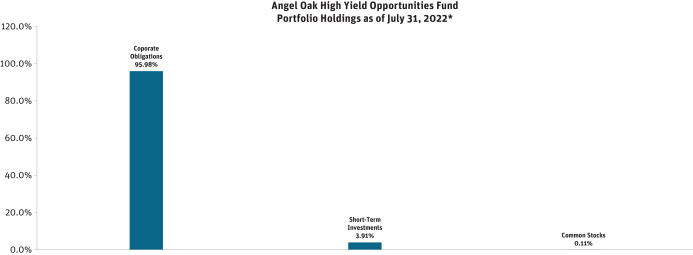
Portfolio Holdings – (Unaudited) (continued)
The investment objective of Angel Oak High Yield Opportunities Fund is to earn a high level of current income with a secondary objective of capital appreciation.
The investment objective of Angel Oak UltraShort Income Fund is to provide current income while seeking to minimize price volatility and maintain liquidity.
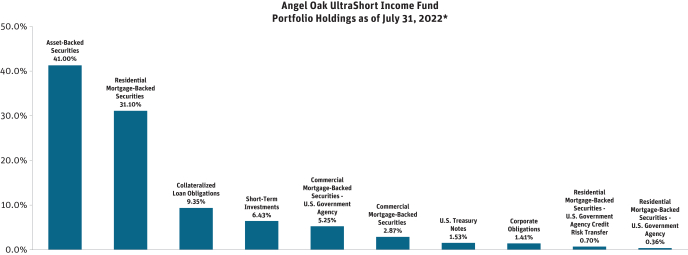
* As a percentage of total investments. The percentages presented in the table above may differ from those in the Schedule of Investments because the percentages in the Schedule of Investments are calculated based on net assets.
11
Portfolio Holdings – (Unaudited) (continued)
The investment objective of Angel Oak Core Impact Fund is seek total return while giving special consideration to positive aggregate environmental, social, and governance (“ESG”) outcomes.
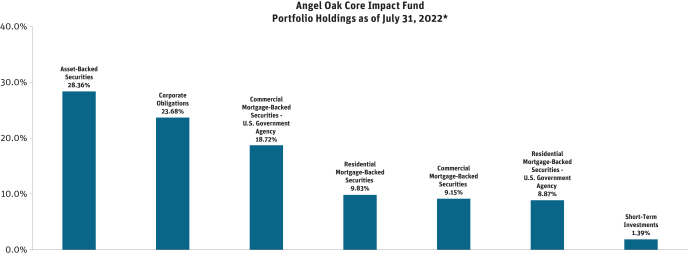
* As a percentage of total investments. The percentages presented in the table above may differ from those in the Schedule of Investments because the percentages in the Schedule of Investments are calculated based on net assets.
12
Statement of Assets and Liabilities
July 31, 2022 (Unaudited)
| | | | | | | | | | | | | | | | | | | | | | | | | |
| | | Multi-Strategy
Income Fund (a) | | Financials
Income Fund | | High Yield
Opportunities Fund | | UltraShort
Income Fund | | Core
Impact Fund |
Assets | | | | | | | | | | | | | | | | | | | | | | | | | |
Investments in unaffiliated securities at fair value* | | | | $5,448,736,357 | | | | | $155,016,625 | | | | | $66,927,481 | | | | | $1,135,403,686 | | | | | $36,025,560 | |
Investments in affiliated securities at fair value* | | | | 116,349,483 | | | | | — | | | | | — | | | | | — | | | | | — | |
Cash | | | | 598,481 | | | | | — | | | | | — | | | | | — | | | | | — | |
Deposit at broker for futures | | | | 6,763,457 | | | | | — | | | | | — | | | | | 924,244 | | | | | 436,557 | |
Receivable for fund shares sold | | | | 15,120,770 | | | | | 195,606 | | | | | 823,021 | | | | | 2,561,612 | | | | | — | |
Receivable for investments sold | | | | 1,946,245 | | | | | — | | | | | — | | | | | — | | | | | 451,750 | |
Dividends and interest receivable | | | | 23,122,919 | | | | | 1,677,986 | | | | | 1,172,362 | | | | | 1,635,745 | | | | | 148,852 | |
Prepaid expenses | | | | 139,459 | | | | | 55,727 | | | | | 23,496 | | | | | 98,025 | | | | | 36,910 | |
| | | | | | | | | | | | | | | | | | | | | | | | | |
Total Assets | | | | 5,612,777,171 | | | | | 156,945,944 | | | | | 68,946,360 | | | | | 1,140,623,312 | | | | | 37,099,629 | |
| | | | | | | | | | | | | | | | | | | | | | | | | |
Liabilities | | | | | | | | | | | | | | | | | | | | | | | | | |
Payable for reverse repurchase agreements (net of unamortized deferred issuance costs of $785,448) | | | | 249,214,601 | | | | | — | | | | | — | | | | | — | | | | | — | |
Payable for credit agreements | | | | 300,000,000 | | | | | — | | | | | — | | | | | — | | | | | — | |
Payable for investments purchased | | | | 3,460,976 | | | | | — | | | | | — | | | | | 4,328,256 | | | | | 189,076 | |
Payable for Fund shares redeemed | | | | 11,982,351 | | | | | 63,761 | | | | | 30,207 | | | | | 3,249,760 | | | | | — | |
Payable for distributions to shareholders | | | | 6,598,990 | | | | | 219,739 | | | | | 247,899 | | | | | 434,886 | | | | | 85,052 | |
Interest payable for credit and reverse repurchase agreements | | | | 2,013,845 | | | | | — | | | | | — | | | | | — | | | | | — | |
Variation margin on futures contracts | | | | — | | | | | — | | | | | — | | | | | — | | | | | — | |
Payable to Adviser | | | | 3,800,297 | | | | | 61,137 | | | | | 16,568 | | | | | 237,511 | | | | | 2,373 | |
Payable to administrator, fund accountant, and transfer agent | | | | 420,751 | | | | | 22,674 | | | | | 15,080 | | | | | 122,265 | | | | | 8,053 | |
Payable to custodian | | | | 79,323 | | | | | 1,050 | | | | | 1,697 | | | | | 12,540 | | | | | 586 | |
12b-1 fees accrued | | | | 191,639 | | | | | 23,642 | | | | | 5,748 | | | | | 50,396 | | | | | — | |
Other accrued expenses | | | | 142,453 | | | | | 21,368 | | | | | 18,546 | | | | | 57,187 | | | | | 25,908 | |
| | | | | | | | | | | | | | | | | | | | | | | | | |
Total Liabilities | | | | 577,905,226 | | | | | 413,371 | | | | | 335,745 | | | | | 8,492,801 | | | | | 311,048 | |
| | | | | | | | | | | | | | | | | | | | | | | | | |
Net Assets | | | | $5,034,871,945 | | | | | $156,532,573 | | | | | $68,610,615 | | | | | $1,132,130,511 | | | | | $36,788,581 | |
| | | | | | | | | | | | | | | | | | | | | | | | | |
Net Assets consist of: | | | | | | | | | | | | | | | | | | | | | | | | | |
Paid-in capital | | | | $6,623,621,336 | | | | | $208,635,910 | | | | | $77,500,582 | | | | | $1,183,366,946 | | | | | $40,137,017 | |
Total distributable earnings (accumulated deficit) | | | | (1,588,749,391 | ) | | | | (52,103,337 | ) | | | | (8,889,967 | ) | | | | (51,236,435 | ) | | | | (3,348,436 | ) |
| | | | | | | | | | | | | | | | | | | | | | | | | |
Net Assets | | | | $5,034,871,945 | | | | | $156,532,573 | | | | | $68,610,615 | | | | | $1,132,130,511 | | | | | $36,788,581 | |
| | | | | | | | | | | | | | | | | | | | | | | | | |
| | | | | |
Class A: | | | | | | | | | | | | | | | | | | | | | | | | | |
Net Assets | | | | $220,234,315 | | | | | $9,232,423 | | | | | $3,996,182 | | | | | $71,508,141 | | | | | $— | |
| | | | | | | | | | | | | | | | | | | | | | | | | |
Shares outstanding (unlimted number of shares authorized, no par value) | | | | 23,427,722 | | | | | 1,069,546 | | | | | 375,208 | | | | | 7,359,373 | | | | | — | |
| | | | | | | | | | | | | | | | | | | | | | | | | |
Net asset value (“NAV”) per share | | | | $9.40 | | | | | $8.63 | | | | | $10.65 | | | | | $9.72 | | | | | $— | |
| | | | | | | | | | | | | | | | | | | | | | | | | |
Offering price per share (NAV/0.9775) (b) | | | | $9.62 | | | | | $8.83 | | | | | $10.90 | | | | | $9.94 | | | | | $— | |
| | | | | | | | | | | | | | | | | | | | | | | | | |
| | | | | |
Class C: | | | | | | | | | | | | | | | | | | | | | | | | | |
Net Assets | | | | $60,982,443 | | | | | $7,763,228 | | | | | $— | | | | | $— | | | | | $— | |
| | | | | | | | | | | | | | | | | | | | | | | | | |
Shares outstanding (unlimted number of shares authorized, no par value) | | | | 6,554,289 | | | | | 913,683 | | | | | — | | | | | — | | | | | — | |
| | | | | | | | | | | | | | | | | | | | | | | | | |
Net asset value (“NAV”) and offering price per share | | | | $9.30 | | | | | $8.50 | | | | | $— | | | | | $— | | | | | $— | |
| | | | | | | | | | | | | | | | | | | | | | | | | |
Minimum redemption price per share (NAV*0.99) (c) | | | | $9.21 | | | | | $8.42 | | | | | $— | | | | | $— | | | | | $— | |
| | | | | | | | | | | | | | | | | | | | | | | | | |
| | | | | |
Institutional Class: | | | | | | | | | | | | | | | | | | | | | | | | | |
Net Assets | | | | $4,753,655,187 | | | | | $139,536,922 | | | | | $64,614,433 | | | | | $1,060,112,363 | | | | | $36,788,581 | |
| | | | | | | | | | | | | | | | | | | | | | | | | |
Shares outstanding (unlimted number of shares authorized, no par value) | | | | 506,946,789 | | | | | 16,213,098 | | | | | 6,093,302 | | | | | 109,009,308 | | | | | 3,998,122 | |
| | | | | | | | | | | | | | | | | | | | | | | | | |
Net asset value (“NAV”) and offering price per share | | | | $9.38 | | | | | $8.61 | | | | | $10.60 | | | | | $9.72 | | | | | $9.20 | |
| | | | | | | | | | | | | | | | | | | | | | | | | |
| | | | | |
Class A1: | | | | | | | | | | | | | | | | | | | | | | | | | |
Net Assets | | | | $— | | | | | $— | | | | | $— | | | | | $510,007 | | | | | $— | |
| | | | | | | | | | | | | | | | | | | | | | | | | |
Shares outstanding (unlimted number of shares authorized, no par value) | | | | — | | | | | — | | | | | — | | | | | 52,525 | | | | | — | |
| | | | | | | | | | | | | | | | | | | | | | | | | |
Net asset value (“NAV”) per share | | | | $— | | | | | $— | | | | | $— | | | | | $9.71 | | | | | $— | |
| | | | | | | | | | | | | | | | | | | | | | | | | |
Offering price per share (NAV/0.985) (d) | | | | $— | | | | | $— | | | | | $— | | | | | $9.86 | | | | | $— | |
| | | | | | | | | | | | | | | | | | | | | | | | | |
Minimum redemption price per share (NAV*0.995) (e) | | | | $— | | | | | $— | | | | | $— | | | | | $9.66 | | | | | $— | |
| | | | | | | | | | | | | | | | | | | | | | | | | |
| | | | | |
*Identified Cost: | | | | | | | | | | | | | | | | | | | | | | | | | |
Investments in unaffiliated securities | | | | $6,117,867,358 | | | | | $159,293,462 | | | | | $72,959,167 | | | | | $1,178,490,863 | | | | | $39,181,042 | |
Investments in affiliated securities | | | | 126,552,243 | | | | | — | | | | | — | | | | | — | | | | | — | |
| (a) | Statement has been consolidated. See Note 1 in the Notes to Financial Statements for basis of consolidation. |
| (b) | Class A shares impose a maximum 2.25% sales charge on purchases. This fee is not charged to shareholders of the UltraShort Income Fund. |
| (c) | A contingent deferred sales charge (“CDSC”) of 1.00% may be charged. |
| (d) | Class A1 shares impose a maximum 1.50% sales charge on purchases. |
| (e) | A contingent deferred sales charge (“CDSC”) of 0.50% may be charged. |
See accompanying notes which are an integral part of these financial statements.
13
Statement of Operations
For the Period Ended July 31, 2022 (Unaudited)
| | | | | | | | | | | | | | | | | | | | | | | | | |
| | | Multi-Strategy
Income Fund (a) | | Financials
Income Fund | | High Yield
Opportunities Fund | | UltraShort
Income Fund | | Core
Impact Fund |
Investment Income | | | | | | | | | | | | | | | | | | | | | | | | | |
Interest | | | | $180,503,975 | | | | | $3,350,198 | | | | | $2,140,668 | | | | | $12,887,793 | | | | | $511,770 | |
Dividends from unaffiliated investments | | | | 2,876,440 | | | | | 193,747 | | | | | — | | | | | — | | | | | — | |
Dividends from affiliated investments | | | | 2,241,365 | | | | | — | | | | | — | | | | | — | | | | | — | |
| | | | | | | | | | | | | | | | | | | | | | | | | |
Total Investment Income | | | | 185,621,780 | | | | | 3,543,945 | | | | | 2,140,668 | | | | | 12,887,793 | | | | | 511,770 | |
| | | | | | | | | | | | | | | | | | | | | | | | | |
| | | | | |
Expenses | | | | | | | | | | | | | | | | | | | | | | | | | |
Investment Advisory (See Note 5) | | | | 26,874,042 | | | | | 687,659 | | | | | 190,756 | | | | | 3,006,708 | | | | | 92,467 | |
Interest expense | | | | 7,671,522 | | | | | 5,702 | | | | | 25 | | | | | — | | | | | — | |
12b-1 – Class A | | | | 337,764 | | | | | 7,330 | | | | | 5,484 | | | | | 145,605 | | | | | — | |
12b-1 – Class A1 | | | | — | | | | | — | | | | | — | | | | | 14 | | | | | — | |
12b-1 – Class C | | | | 326,740 | | | | | 32,010 | | | | | — | | | | | — | | | | | — | |
Fund accounting | | | | 693,635 | | | | | 14,283 | | | | | 19,583 | | | | | 184,125 | | | | | 9,042 | |
Administration | | | | 328,345 | | | | | 14,774 | | | | | 10,699 | | | | | 83,267 | | | | | 8,417 | |
Transfer agent | | | | 287,498 | | | | | 41,114 | | | | | 14,203 | | | | | 59,025 | | | | | 6,790 | |
Legal | | | | 232,683 | | | | | 5,497 | | | | | 2,446 | | | | | 49,815 | | | | | 8,252 | |
Custodian | | | | 176,119 | | | | | 2,984 | | | | | 4,506 | | | | | 35,245 | | | | | 1,256 | |
Registration | | | | 133,028 | | | | | 31,925 | | | | | 21,595 | | | | | 144,697 | | | | | 14,080 | |
Trustee | | | | 125,972 | | | | | 19,213 | | | | | 17,870 | | | | | 40,918 | | | | | 17,291 | |
Printing | | | | 112,607 | | | | | 5,544 | | | | | 2,172 | | | | | 13,584 | | | | | 1,621 | |
Audit & tax | | | | 52,314 | | | | | 15,751 | | | | | 13,294 | | | | | 16,436 | | | | | 13,781 | |
Insurance | | | | 28,059 | | | | | 635 | | | | | 358 | | | | | 5,973 | | | | | 181 | |
Compliance | | | | 6,335 | | | | | 6,335 | | | | | 6,335 | | | | | 6,335 | | | | | 6,335 | |
Miscellaneous | | | | 1,715,517 | | | | | 6,442 | | | | | 3,450 | | | | | 13,447 | | | | | 1,267 | |
| | | | | | | | | | | | | | | | | | | | | | | | | |
Total Expenses | | | | 39,102,180 | | | | | 897,198 | | | | | 312,776 | | | | | 3,805,194 | | | | | 180,780 | |
| | | | | | | | | | | | | | | | | | | | | | | | | |
Fees contractually recouped (waived) by Adviser (See Note 5) | | | | (344,982 | ) | | | | — | | | | | (81,828 | ) | | | | (1,267,875 | ) | | | | (71,669 | ) |
Fees voluntarily waived by Adviser (See Note 5) | | | | — | | | | | (319,027 | ) | | | | — | | | | | — | | | | | — | |
| | | | | | | | | | | | | | | | | | | | | | | | | |
Net Expenses | | | | 38,757,198 | | | | | 578,171 | | | | | 230,948 | | | | | 2,537,319 | | | | | 109,111 | |
| | | | | | | | | | | | | | | | | | | | | | | | | |
Net Investment Income (Loss) | | | | $146,864,582 | | | | | $2,965,774 | | | | | $1,909,720 | | | | | $10,350,474 | | | | | $402,659 | |
| | | | | | | | | | | | | | | | | | | | | | | | | |
| | | | |
Realized and Unrealized Gain (Loss) on Investments | | | | | | | | | | | | | | | | | | | | | |
Net realized gain (loss) on investments in unaffiliated securities | | | | ($52,198,384 | ) | | | | $413,475 | | | | | ($444,006 | ) | | | | ($2,998,991 | ) | | | | ($282,587 | ) |
Net realized gain (loss) on investments on TBA sale commitments | | | | 5,722,656 | | | | | — | | | | | — | | | | | — | | | | | — | |
Net realized gain (loss) on futures | | | | 12,489,421 | | | | | — | | | | | — | | | | | (241,843 | ) | | | | — | |
Net realized gain (loss) on swaps | | | | 4,741,085 | | | | | — | | | | | — | | | | | — | | | | | — | |
Net change in unrealized appreciation (depreciation) on unaffiliated investments | | | | (498,142,399 | ) | | | | (6,414,770 | ) | | | | (5,620,028 | ) | | | | (40,081,416 | ) | | | | (2,139,742 | ) |
Net change in unrealized appreciation (depreciation) on affiliated investments | | | | (7,106,344 | ) | | | | — | | | | | — | | | | | — | | | | | — | |
Net change in unrealized appreciation (depreciation) on TBA sale commitments | | | | (4,430,900 | ) | | | | — | | | | | — | | | | | — | | | | | — | |
Net change in unrealized appreciation (depreciation) on futures contracts | | | | 8,198,874 | | | | | — | | | | | — | | | | | 2,586,626 | | | | | 150,557 | |
| | | | | | | | | | | | | | | | | | | | | | | | | |
Net Realized and Unrealized Gain (Loss) on Investments | | | | (530,725,991 | ) | | | | (6,001,295 | ) | | | | (6,064,034 | ) | | | | (40,735,624 | ) | | | | (2,271,772 | ) |
| | | | | | | | | | | | | | | | | | | | | | | | | |
Net increase (decrease) in net assets resulting from operations | | | | ($383,861,409 | ) | | | | ($3,035,521 | ) | | | | ($4,154,314 | ) | | | | ($30,385,150 | ) | | | | ($1,869,113 | ) |
| | | | | | | | | | | | | | | | | | | | | | | | | |
| (a) | Statement has been consolidated. See Notes 1 in the Notes to Financial Statements for basis of consolidation. |
See accompanying notes which are an integral part of these financial statements.
14
Angel Oak Multi-Strategy Income Fund
Consolidated Statement of Cash Flows (a)
For the Period Ended July 31, 2022 (Unaudited)
| | | | | |
CASH FLOWS FROM OPERATING ACTIVITIES: | | | | | |
Net increase (decrease) in net assets resulting from operations | | | | ($383,861,409 | ) |
Net adjustments to reconcile net increase in net assets from operations to net cash provided by (used in) operating activities: | | | | | |
Net amortization and accretion of premium and discount | | | | 7,046,685 | |
Net realized paydown gains on mortgage backed and other asset backed securities | | | | (17,612,819 | ) |
Purchases of short-term investments, net | | | | 478,850,106 | |
Purchases of investments | | | | (284,436,526 | ) |
Proceeds from TBA sale commitments | | | | (199,756,600 | ) |
Proceeds from sales of long-term investments | | | | 1,705,587,536 | |
Net change in unrealized (appreciation) depreciation on investments | | | | 505,248,743 | |
Net change in unrealized appreciation (depreciation) on futures contracts | | | | (8,198,874 | ) |
Net change in unrealized (appreciation) depreciation on TBA sale commitments | | | | 4,430,900 | |
Net realized (gain) loss on investments | | | | 52,198,384 | |
Net realized gain (loss) on futures contracts | | | | (12,489,421 | ) |
Net realized gain (loss) on swap agreements | | | | (4,741,085 | ) |
Net realized gain (loss) on investments on TBA sale commitments | | | | (5,722,656 | ) |
Change in: | | | | | |
Receivable for investments sold | | | | 217,093,396 | |
Dividends and interest receivable | | | | 2,689,512 | |
Prepaid expenses | | | | 14,202 | |
Payable for investments purchased | | | | (364,455,467 | ) |
Interest payable for credit and reverse repurchase agreements | | | | 1,118,787 | |
Payable to Adviser | | | | (1,514,338 | ) |
Payable to administrator, fund accountant and transfer agent | | | | (8,048 | ) |
Payable to custodian | | | | 24,477 | |
12b-1 fees accrued | | | | 58,296 | |
Other accrued expenses | | | | (78,860 | ) |
| | | | | |
Net cash provided by (used in) operating activities | | | | $1,691,484,921 | |
| | | | | |
CASH FLOWS FROM FINANCING ACTIVITIES: | | | | | |
Proceeds from shares sold | | | | 1,098,729,565 | |
Payment on shares redeemed | | | | (2,862,348,828 | ) |
Distributions paid to shareholders | | | | (42,277,210 | ) |
Purchases of reverse repurchase agreements | | | | 249,214,601 | |
Proceeds from reverse repurchase agreements | | | | (134,796,000 | ) |
| | | | | |
Net cash provided by (used in) financing activities | | | | (1,691,477,872 | ) |
| | | | | |
Net change in cash | | | | $7,049 | |
| | | | | |
CASH: | | | | | |
Beginning Balance | | | | 7,354,889 | |
| | | | | |
Ending Balance | | | | $7,361,938 | |
| | | | | |
SUPPLEMENTAL DISCLOSURES: | | | | | |
Cash paid for interest | | | | $6,552,735 | |
Cash held in money market investments | | | | $187,379,929 | |
Non-cash financing activities - distributions reinvested | | | | $97,842,818 | |
Non-cash financing activities - (increase) decrease in receivable for fund shares sold | | | | ($15,094,116 | ) |
Non-cash financing activities - (increase) decrease in payable for fund shares redeemed | | | | $11,737,979 | |
| |
RECONCILIATION OF RESTRICTED AND UNRESTRICTED CASH AT THE BEGINNING OF YEAR TO THE STATEMENTS OF ASSETS AND LIABILITIES: | | | | | |
Cash | | | | 1,331,676 | |
Deposit at broker for futures | | | | 3,311,696 | |
| |
RECONCILIATION OF RESTRICTED AND UNRESTRICTED CASH AT THE END OF YEAR TO THE STATEMENTS OF ASSETS AND LIABILITIES: | | | | | |
Cash | | | | 598,481 | |
Deposit at broker for futures | | | | 6,763,457 | |
| (a) | Statement has been consolidated. See Note 1 in the notes to Financial Statements for basis of consolidation. |
See accompanying notes which are an integral part of these financial statements.
15
Angel Oak Multi-Strategy Income Fund
Consolidated Statements of Changes in Net Assets
| | | | | | | | | | |
| | | For the Period
Ended July 31, 2022
(Unaudited) (a) | | For the Year Ended
January 31, 2022
(a) |
Increase (Decrease) in Net Assets due to: | | | | | | | | | | |
Operations | | | | | | | | | | |
Net investment income (loss) | | | | $146,864,582 | | | | | $323,269,065 | |
Net realized gain (loss) on investment transactions, futures contracts, TBA sale commitments, and swaps | | | | (29,245,222 | ) | | | | 10,939,721 | |
Net change in unrealized appreciation (depreciation) on investments, TBA sale commitments, and futures contracts | | | | (501,480,769 | ) | | | | (140,395,761 | ) |
| | | | | | | | | | |
Net increase (decrease) in net assets resulting from operations | | | | (383,861,409 | ) | | | | 193,813,025 | |
| | | | | | | | | | |
Distributions to Shareholders | | | | | | | | | | |
Distributions, Class A | | | | (5,898,709 | ) | | | | (17,292,024 | ) |
Distributions, Class C | | | | (1,200,943 | ) | | | | (3,008,479 | ) |
Distributions, Institutional Class | | | | (132,033,376 | ) | | | | (308,374,494 | ) |
| | | | | | | | | | |
Total distributions to shareholders | | | | (139,133,028 | ) | | | | (328,674,997 | ) |
| | | | | | | | | | |
Capital Transactions – Class A | | | | | | | | | | |
Proceeds from shares sold | | | | 25,251,152 | | | | | 113,767,630 | |
Reinvestment of distributions | | | | 4,406,219 | | | | | 13,013,210 | |
Amount paid for shares redeemed | | | | (121,337,855 | ) | | | | (181,260,631 | ) |
| | | | | | | | | | |
Total Class A | | | | (91,680,484 | ) | | | | (54,479,791 | ) |
| | | | | | | | | | |
Capital Transactions – Class C | | | | | | | | | | |
Proceeds from shares sold | | | | 995,192 | | | | | 8,258,202 | |
Reinvestment of distributions | | | | 909,800 | | | | | 2,240,601 | |
Amount paid for shares redeemed | | | | (6,714,930 | ) | | | | (25,344,980 | ) |
| | | | | | | | | | |
Total Class C | | | | (4,809,938 | ) | | | | (14,846,177 | ) |
| | | | | | | | | | |
Capital Transactions – Institutional Class | | | | | | | | | | |
Proceeds from shares sold | | | | 1,057,389,105 | | | | | 3,512,961,877 | |
Reinvestment of distributions | | | | 92,526,799 | | | | | 224,826,130 | |
Amount paid for shares redeemed | | | | (2,722,558,064 | ) | | | | (2,718,565,354 | ) |
| | | | | | | | | | |
Total Institutional Class | | | | (1,572,642,160 | ) | | | | 1,019,222,653 | |
| | | | | | | | | | |
Net increase (decrease) in net assets resulting from capital transactions | | | | (1,669,132,582 | ) | | | | 949,896,685 | |
| | | | | | | | | | |
Total Increase (Decrease) in Net Assets | | | | (2,192,127,019 | ) | | | | 815,034,713 | |
| | | | | | | | | | |
Net Assets | | | | | | | | | | |
Beginning of period | | | | 7,226,998,964 | | | | | 6,411,964,251 | |
| | | | | | | | | | |
End of period | | | | $5,034,871,945 | | | | | $7,226,998,964 | |
| | | | | | | | | | |
Share Transactions – Class A | | | | | | | | | | |
Shares sold | | | | 2,578,513 | | | | | 10,926,212 | |
Shares issued in reinvestment of distributions | | | | 451,998 | | | | | 1,252,277 | |
Shares redeemed | | | | (12,367,630 | ) | | | | (17,436,419 | ) |
| | | | | | | | | | |
Total Class A | | | | (9,337,119 | ) | | | | (5,257,930 | ) |
| | | | | | | | | | |
Share Transactions – Class C | | | | | | | | | | |
Shares sold | | | | 102,751 | | | | | 803,571 | |
Shares issued in reinvestment of distributions | | | | 94,628 | | | | | 217,730 | |
Shares redeemed | | | | (692,897 | ) | | | | (2,459,811 | ) |
| | | | | | | | | | |
Total Class C | | | | (495,518 | ) | | | | (1,438,510 | ) |
| | | | | | | | | | |
Share Transactions – Institutional Class | | | | | | | | | | |
Shares sold | | | | 108,218,451 | | | | | 338,829,057 | |
Shares issued in reinvestment of distributions | | | | 9,525,509 | | | | | 21,692,531 | |
Shares redeemed | | | | (278,708,081 | ) | | | | (262,126,642 | ) |
| | | | | | | | | | |
Total Institutional Class | | | | (160,964,121 | ) | | | | 98,394,946 | |
| | | | | | | | | | |
Net increase (decrease) in share transactions | | | | (170,796,758 | ) | | | | 91,698,506 | |
| | | | | | | | | | |
| (a) | Statement has been consolidated. See Note 1 in the Notes to Financial Statements for basis of consolidation. |
See accompanying notes which are an integral part of these financial statements.
16
Angel Oak Financials Income Fund
Statements of Changes in Net Assets
| | | | | | | | | | |
| | | For the Period Ended
July 31, 2022
(Unaudited) | | For the Year Ended
January 31, 2022 |
Increase (Decrease) in Net Assets due to: | | | | | | |
Operations | | | | | | | | | | |
Net investment income (loss) | | | | $2,965,774 | | | | | $5,942,390 | |
Net realized gain (loss) on investment transactions | | | | 413,475 | | | | | 963,613 | |
Net change in unrealized appreciation (depreciation) on investments | | | | (6,414,770 | ) | | | | 1,603,657 | |
| | | | | | | | | | |
Net increase (decrease) in net assets resulting from operations | | | | (3,035,521 | ) | | | | 8,509,660 | |
| | | | | | | | | | |
Distributions to Shareholders | | | | | | | | | | |
Distributions, Class A | | | | (109,012 | ) | | | | (111,005 | ) |
Distributions, Class C | | | | (98,882 | ) | | | | (114,065 | ) |
Distributions, Institutional Class | | | | (2,805,578 | ) | | | | (5,723,833 | ) |
| | | | | | | | | | |
Total distributions to shareholders | | | | (3,013,472 | ) | | | | (5,948,903 | ) |
| | | | | | | | | | |
Capital Transactions – Class A | | | | | | | | | | |
Proceeds from shares sold | | | | 6,086,557 | | | | | 2,220,664 | |
Reinvestment of distributions | | | | 103,210 | | | | | 102,282 | |
Amount paid for shares redeemed | | | | (981,941 | ) | | | | (913,442 | ) |
| | | | | | | | | | |
Total Class A | | | | 5,207,826 | | | | | 1,409,504 | |
| | | | | | | | | | |
Capital Transactions – Class C | | | | | | | | | | |
Proceeds from shares sold | | | | 5,249,440 | | | | | 463,088 | |
Reinvestment of distributions | | | | 76,820 | | | | | 82,346 | |
Amount paid for shares redeemed | | | | (770,971 | ) | | | | (2,734,308 | ) |
| | | | | | | | | | |
Total Class C | | | | 4,555,289 | | | | | (2,188,874 | ) |
| | | | | | | | | | |
Capital Transactions – Institutional Class | | | | | | |
Proceeds from shares sold | | | | 28,694,935 | | | | | 60,879,854 | |
Reinvestment of distributions | | | | 1,488,151 | | | | | 3,282,293 | |
Amount paid for shares redeemed | | | | (44,112,044 | ) | | | | (41,849,423 | ) |
| | | | | | | | | | |
Total Institutional Class | | | | (13,928,958 | ) | | | | 22,312,724 | |
| | | | | | | | | | |
Net increase (decrease) in net assets resulting from capital transactions | | | | (4,165,843 | ) | | | | 21,533,354 | |
| | | | | | | | | | |
Total Increase (Decrease) in Net Assets | | | | (10,214,836 | ) | | | | 24,094,111 | |
| | | | | | | | | | |
Net Assets | | | | | | | | | | |
Beginning of period | | | | 166,747,409 | | | | | 142,653,298 | |
| | | | | | | | | | |
End of period | | | | $156,532,573 | | | | | $166,747,409 | |
| | | | | | | | | | |
Share Transactions – Class A | | | | | | | | | | |
Shares sold | | | | 699,236 | | | | | 246,833 | |
Shares issued in reinvestment of distributions | | | | 11,858 | | | | | 11,405 | |
Shares redeemed | | | | (112,169 | ) | | | | (102,033 | ) |
| | | | | | | | | | |
Total Class A | | | | 598,925 | | | | | 156,205 | |
| | | | | | | | | | |
Share Transactions – Class C | | | | | | | | | | |
Shares sold | | | | 605,388 | | | | | 52,396 | |
Shares issued in reinvestment of distributions | | | | 8,965 | | | | | 9,286 | |
Shares redeemed | | | | (90,091 | ) | | | | (309,154 | ) |
| | | | | | | | | | |
Total Class C | | | | 524,262 | | | | | (247,472 | ) |
| | | | | | | | | | |
Share Transactions – Institutional Class | | | | | | |
Shares sold | | | | 3,290,288 | | | | | 6,814,124 | |
Shares issued in reinvestment of distributions | | | | 170,712 | | | | | 366,628 | |
Shares redeemed | | | | (5,037,486 | ) | | | | (4,675,741 | ) |
| | | | | | | | | | |
Total Institutional Class | | | | (1,576,486 | ) | | | | 2,505,011 | |
| | | | | | | | | | |
Net increase (decrease) in share transactions | | | | (453,299 | ) | | | | 2,413,744 | |
| | | | | | | | | | |
See accompanying notes which are an integral part of these financial statements.
17
Angel Oak High Yield Opportunities Fund
Statements of Changes in Net Assets
| | | | | | | | | | |
| | | For the Period Ended
July 31, 2022
(Unaudited) | | For the Year Ended
January 31, 2022 |
Increase (Decrease) in Net Assets due to: | | | | | | | | | | |
Operations | | | | | | | | | | |
Net investment income (loss) | | | | $1,909,720 | | | | | $3,780,159 | |
Net realized gain (loss) on investment transactions | | | | (444,006 | ) | | | | 636,570 | |
Net change in unrealized appreciation (depreciation) on investments | | | | (5,620,028 | ) | | | | (1,827,827 | ) |
| | | | | | | | | | |
Net increase (decrease) in net assets resulting from operations | | | | (4,154,314 | ) | | | | 2,588,902 | |
| | | | | | | | | | |
Distributions to Shareholders | | | | | | | | | | |
Distributions, Class A | | | | (111,598 | ) | | | | (198,482 | ) |
Distributions, Institutional Class | | | | (1,755,963 | ) | | | | (3,642,787 | ) |
| | | | | | | | | | |
Total distributions to shareholders | | | | (1,867,561 | ) | | | | (3,841,269 | ) |
| | | | | | | | | | |
Capital Transactions – Class A | | | | | | | | | | |
Proceeds from shares sold | | | | 821,659 | | | | | 2,916,252 | |
Reinvestment of distributions | | | | 111,325 | | | | | 197,215 | |
Amount paid for shares redeemed | | | | (1,381,415 | ) | | | | (2,181,125 | ) |
| | | | | | | | | | |
Total Class A | | | | (448,431 | ) | | | | 932,342 | |
| | | | | | | | | | |
Capital Transactions – Institutional Class | | | | | | | | | | |
Proceeds from shares sold | | | | 1,517,614 | | | | | 4,653,761 | |
Reinvestment of distributions | | | | 380,662 | | | | | 757,305 | |
Amount paid for shares redeemed | | | | (1,154,814 | ) | | | | (2,985,257 | ) |
| | | | | | | | | | |
Total Institutional Class | | | | 743,462 | | | | | 2,425,809 | |
| | | | | | | | | | |
Net increase (decrease) in net assets resulting from capital transactions | | | | 295,031 | | | | | 3,358,151 | |
| | | | | | | | | | |
Total Increase (Decrease) in Net Assets | | | | (5,726,844 | ) | | | | 2,105,784 | |
| | | | | | | | | | |
Net Assets | | | | | | | | | | |
Beginning of period | | | | 74,337,459 | | | | | 72,231,675 | |
| | | | | | | | | | |
End of period | | | | $68,610,615 | | | | | $74,337,459 | |
| | | | | | | | | | |
Share Transactions – Class A | | | | | | | | | | |
Shares sold | | | | 74,676 | | | | | 245,813 | |
Shares issued in reinvestment of distributions | | | | 10,181 | | | | | 16,652 | |
Shares redeemed | | | | (126,724 | ) | | | | (183,742 | ) |
| | | | | | | | | | |
Total Class A | | | | (41,867 | ) | | | | 78,723 | |
| | | | | | | | | | |
Share Transactions – Institutional Class | | | | | | | | | | |
Shares sold | | | | 141,278 | | | | | 392,064 | |
Shares issued in reinvestment of distributions | | | | 35,053 | | | | | 64,201 | |
Shares redeemed | | | | (104,263 | ) | | | | (252,371 | ) |
| | | | | | | | | | |
Total Institutional Class | | | | 72,068 | | | | | 203,894 | |
| | | | | | | | | | |
Net increase (decrease) in share transactions | | | | 30,201 | | | | | 282,617 | |
| | | | | | | | | | |
See accompanying notes which are an integral part of these financial statements.
18
Angel Oak UltraShort Income Fund
Statements of Changes in Net Assets
| | | | | | | | | | |
| | | For the Period Ended
July 31, 2022
(Unaudited) (a) | | For the Year Ended
January 31, 2022 |
Increase (Decrease) in Net Assets due to: | | | | | | | | | | |
Operations | | | | | | | | | | |
Net investment income (loss) | | | | $10,350,474 | | | | | $13,744,383 | |
Net realized gain (loss) on investment transactions and futures contracts | | | | (3,240,834 | ) | | | | (396,109 | ) |
Net change in unrealized appreciation (depreciation) on investments and futures contracts | | | | (37,494,790 | ) | | | | (7,982,855 | ) |
| | | | | | | | | | |
Net increase (decrease) in net assets resulting from operations | | | | (30,385,150 | ) | | | | 5,365,419 | |
| | | | | | | | | | |
Distributions to Shareholders | | | | | | | | | | |
Distributions, Class A | | | | (781,642 | ) | | | | (1,370,158 | ) |
Distributions, Class A1 | | | | (7 | ) | | | | — | |
Distributions, Institutional Class | | | | (10,353,675 | ) | | | | (15,915,163 | ) |
| | | | | | | | | | |
Total distributions to shareholders | | | | (11,135,324 | ) | | | | (17,285,321 | ) |
| | | | | | | | | | |
Capital Transactions – Class A | | | | | | | | | | |
Proceeds from shares sold | | | | 46,809,852 | | | | | 173,304,337 | |
Reinvestment of distributions | | | | 691,411 | | | | | 1,266,990 | |
Amount paid for shares redeemed | | | | (143,646,871 | ) | | | | (68,418,315 | ) |
| | | | | | | | | | |
Total Class A | | | | (96,145,608 | ) | | | | 106,153,012 | |
| | | | | | | | | | |
Capital Transactions – Class A1 | | | | | | | | | | |
Proceeds from shares sold | | | | 510,011 | | | | | — | |
Reinvestment of distributions | | | | 3 | | | | | — | |
| | | | | | | | | | |
Total Class A1 | | | | 510,014 | | | | | — | |
| | | | | | | | | | |
Capital Transactions – Institutional Class | | | | | | | | | | |
Proceeds from shares sold | | | | 439,939,990 | | | | | 1,725,634,613 | |
Reinvestment of distributions | | | | 8,005,896 | | | | | 12,276,225 | |
Amount paid for shares redeemed | | | | (842,529,325 | ) | | | | (1,031,046,901 | ) |
| | | | | | | | | | |
Total Institutional Class | | | | (394,583,439 | ) | | | | 706,863,937 | |
| | | | | | | | | | |
Net increase (decrease) in net assets resulting from capital transactions | | | | (490,219,033 | ) | | | | 813,016,949 | |
| | | | | | | | | | |
Total Increase (Decrease) in Net Assets | | | | (531,739,507 | ) | | | | 801,097,047 | |
| | | | | | | | | | |
Net Assets | | | | | | | | | | |
Beginning of period | | | | 1,663,870,018 | | | | | 862,772,971 | |
| | | | | | | | | | |
End of period | | | | $1,132,130,511 | | | | | $1,663,870,018 | |
| | | | | | | | | | |
Share Transactions – Class A | | | | | | | | | | |
Shares sold | | | | 4,750,898 | | | | | 17,237,092 | |
Shares issued in reinvestment of distributions | | | | 70,430 | | | | | 126,149 | |
Shares redeemed | | | | (14,599,464 | ) | | | | (6,810,400 | ) |
| | | | | | | | | | |
Total Class A | | | | (9,778,136 | ) | | | | 10,552,841 | |
| | | | | | | | | | |
Share Transactions – Class A1 | | | | | | | | | | |
Shares sold | | | | 52,525 | | | | | — | |
| | | | | | | | | | |
Total Class A1 | | | | 52,525 | | | | | — | |
| | | | | | | | | | |
Share Transactions – Institutional Class | | | | | | | | | | |
Shares sold | | | | 44,638,034 | | | | | 171,455,363 | |
Shares issued in reinvestment of distributions | | | | 815,633 | | | | | 1,220,931 | |
Shares redeemed | | | | (85,550,199 | ) | | | | (102,493,351 | ) |
| | | | | | | | | | |
Total Institutional Class | | | | (40,096,532 | ) | | | | 70,182,943 | |
| | | | | | | | | | |
Net increase (decrease) in share transactions | | | | (49,822,143 | ) | | | | 80,735,784 | |
| | | | | | | | | | |
| (a) | Class A1 commenced operations on July 12, 2022. |
See accompanying notes which are an integral part of these financial statements.
19
Angel Oak Core Impact Fund
Statements of Changes in Net Assets
| | | | | | | | | | |
| | | For the Period Ended
July 31, 2022
(Unaudited) | | For the Period Ended
January 31, 2022 (a) |
Increase (Decrease) in Net Assets due to: | | | | | | | | | | |
Operations | | | | | | | | | | |
Net investment income (loss) | | | | $402,659 | | | | | $330,201 | |
Net realized gain (loss) on investment transactions and futures contracts | | | | (282,587 | ) | | | | (11,870 | ) |
Net change in unrealized appreciation (depreciation) on investments and futures contracts | | | | (1,989,185 | ) | | | | (1,015,740 | ) |
| | | | | | | | | | |
Net increase (decrease) in net assets resulting from operations | | | | (1,869,113 | ) | | | | (697,409 | ) |
| | | | | | | | | | |
Distributions to Shareholders | | | | | | | | | | |
Distributions, Institutional Class | | | | (413,399 | ) | | | | (368,515 | ) |
| | | | | | | | | | |
Total distributions to shareholders | | | | (413,399 | ) | | | | (368,515 | ) |
| | | | | | | | | | |
Capital Transactions – Institutional Class | | | | | | | | | | |
Proceeds from shares sold | | | | 31,250 | | | | | 40,197,500 | |
Reinvestment of distributions | | | | 558 | | | | | 1,018 | |
Amount paid for shares redeemed | | | | (93,309 | ) | | | | — | |
| | | | | | | | | | |
Total Institutional Class | | | | (61,501 | ) | | | | 40,198,518 | |
| | | | | | | | | | |
Net increase (decrease) in net assets resulting from capital transactions | | | | (61,501 | ) | | | | 40,198,518 | |
| | | | | | | | | | |
Total Increase (Decrease) in Net Assets | | | | (2,344,013 | ) | | | | 39,132,594 | |
| | | | | | | | | | |
Net Assets | | | | | | | | | | |
Beginning of period | | | | 39,132,594 | | | | | — | |
| | | | | | | | | | |
End of period | | | | $36,788,581 | | | | | $39,132,594 | |
| | | | | | | | | | |
Share Transactions – Institutional Class | | | | | | | | | | |
Shares sold | | | | 3,235 | | | | | 4,004,770 | |
Shares issued in reinvestment of distributions | | | | 59 | | | | | 102 | |
Shares redeemed | | | | (10,044 | ) | | | | — | |
| | | | | | | | | | |
Total Institutional Class | | | | (6,750 | ) | | | | 4,004,872 | |
| | | | | | | | | | |
Net increase (decrease) in share transactions | | | | (6,750 | ) | | | | 4,004,872 | |
| | | | | | | | | | |
| (a) | Fund commenced operations on June 4, 2021. |
See accompanying notes which are an integral part of these financial statements.
20
Angel Oak Multi-Strategy Income Fund – Class A
Consolidated Financial Highlights (a)
(For a share outstanding during each period)
| | | | | | | | | | | | | | | | | | | | | | | | | | | | | | |
| | | For the
Period Ended
July 31, 2022
(Unaudited) | | For the
Year Ended
January 31, 2022 | | For the
Year Ended
January 31, 2021 | | For the
Year Ended
January 31, 2020 | | For the
Year Ended
January 31, 2019 | | For the
Year Ended
January 31, 2018 |
Selected Per Share Data: | | | | | | | | | | | | | | | | | | | | | | | | | | | | | | |
Net asset value, beginning of period | | | | $10.24 | | | | | $10.43 | | | | | $11.10 | | | | | $11.04 | | | | | $11.26 | | | | | $11.30 | |
| | | | | | | | | | | | | | | | | | | | | | | | | | | | | | |
| | | | | | |
Income from investment operations: | | | | | | | | | | | | | | | | | | | | | | | | | | | | | | |
Net investment income (loss) | | | | 0.23 | | | | | 0.47 | | | | | 0.46 | | | | | 0.50 | | | | | 0.52 | | | | | 0.54 | |
Net realized and unrealized gain (loss) on investments | | | | (0.86 | ) | | | | (0.19 | ) | | | | (0.68 | ) | | | | 0.06 | | | | | (0.22 | ) | | | | (0.02 | ) |
| | | | | | | | | | | | | | | | | | | | | | | | | | | | | | |
Total from investment operations | | | | (0.63 | ) | | | | 0.28 | | | | | (0.22 | ) | | | | 0.56 | | | | | 0.30 | | | | | 0.52 | |
| | | | | | | | | | | | | | | | | | | | | | | | | | | | | | |
Less distributions to shareholders: | | | | | | | | | | | | | | | | | | | | | | | | | | | | | | |
From net investment income | | | | (0.21 | ) | | | | (0.47 | ) | | | | (0.45 | ) | | | | (0.50 | ) | | | | (0.52 | ) | | | | (0.56 | ) |
| | | | | | | | | | | | | | | | | | | | | | | | | | | | | | |
Total distributions | | | | (0.21 | ) | | | | (0.47 | ) | | | | (0.45 | ) | | | | (0.50 | ) | | | | (0.52 | ) | | | | (0.56 | ) |
| | | | | | | | | | | | | | | | | | | | | | | | | | | | | | |
| | | | | | |
Net asset value, end of period | | | | $9.40 | | | | | $10.24 | | | | | $10.43 | | | | | $11.10 | | | | | $11.04 | | | | | $11.26 | |
| | | | | | | | | | | | | | | | | | | | | | | | | | | | | | |
| | | | | | |
Total return (b)(c) | | | | (6.17 | %) | | | | 2.71 | % | | | | (1.76 | %) | | | | 5.08 | % | | | | 2.72 | % | | | | 4.69 | % |
| | | | | | |
Ratios and Supplemental Data: | | | | | | | | | | | | | | | | | | | | | | | | | | | | | | |
Net assets, end of period (000’s omitted) | | | | $220,2 | 34 | | | | $335,4 | 39 | | | | $396,7 | 11 | | | | $496,1 | 14 | | | | $590,3 | 86 | | | | $538,6 | 99 |
Ratio of expenses to average net assets before waiver and reimbursement/recoupment (d) | | | | 1.52 | % | | | | 1.29 | % | | | | 1.40 | % | | | | 1.37 | % | | | | 1.35 | % | | | | 1.36 | % |
Ratio of expenses to average net assets before waiver and reimbursement/recoupment excluding interest expense (d) | | | | 1.21 | % | | | | 1.20 | % | | | | 1.21 | % | | | | 1.20 | % | | | | 1.20 | % | | | | 1.20 | % |
Ratio of expenses to average net assets after waiver and reimbursement/recoupment (d) | | | | 1.51 | % | | | | 1.28 | % | | | | 1.38 | % | | | | 1.36 | % | | | | 1.37 | % | | | | 1.40 | % |
Ratio of expenses to average net assets after waiver and reimbursement/recoupment excluding interest expense (d) | | | | 1.20 | % | | | | 1.19 | % | | | | 1.19 | % | | | | 1.19 | % | | | | 1.22 | % | | | | 1.24 | % |
Ratio of net investment income (loss) to average net assets before waiver and reimbursement/recoupment (d) | | | | 4.63 | % | | | | 4.42 | % | | | | 4.41 | % | | | | 4.46 | % | | | | 4.69 | % | | | | 4.80 | % |
Ratio of net investment income (loss) to average net assets after waiver and reimbursement/recoupment (d) | | | | 4.64 | % | | | | 4.43 | % | | | | 4.43 | % | | | | 4.47 | % | | | | 4.67 | % | | | | 4.76 | % |
Portfolio turnover rate (c) | | | | 4.71 | % | | | | 55.99 | % | | | | 67.45 | % | | | | 62.94 | % | | | | 71.49 | % | | | | 81.13 | % |
| (a) | Financial Highlights have been consolidated. See Note 1 in the Notes to Financial Statements for basis of consolidation. |
| (b) | Total return does not include the effect of sales charges. |
| (c) | Not annualized for periods less than one year. |
| (d) | Annualized for periods less than one year. |
See accompanying notes which are an integral part of these financial statements.
21
Angel Oak Multi-Strategy Income Fund – Class C
Consolidated Financial Highlights (a)
(For a share outstanding during each period)
| | | | | | | | | | | | | | | | | | | | | | | | | | | | | | |
| | | For the
Period Ended
July 31, 2022
(Unaudited) | | For the
Year Ended
January 31, 2022 | | For the
Year Ended
January 31, 2021 | | For the
Year Ended
January 31, 2020 | | For the
Year Ended
January 31, 2019 | | For the
Year Ended
January 31, 2018 |
Selected Per Share Data: | | | | | | | | | | | | | | | | | | | | | | | | | | | | | | |
Net asset value, beginning of period | | | | $10.13 | | | | | $10.34 | | | | | $11.00 | | | | | $10.95 | | | | | $11.17 | | | | | $11.23 | |
| | | | | | | | | | | | | | | | | | | | | | | | | | | | | | |
| | | | | | |
Income from investment operations: | | | | | | | | | | | | | | | | | | | | | | | | | | | | | | |
Net investment income (loss) | | | | 0.19 | | | | | 0.38 | | | | | 0.37 | | | | | 0.41 | | | | | 0.44 | | | | | 0.46 | |
Net realized and unrealized gain (loss) on investments | | | | (0.84 | ) | | | | (0.20 | ) | | | | (0.66 | ) | | | | 0.06 | | | | | (0.22 | ) | | | | (0.03 | ) |
| | | | | | | | | | | | | | | | | | | | | | | | | | | | | | |
Total from investment operations | | | | (0.65 | ) | | | | 0.18 | | | | | (0.29 | ) | | | | 0.47 | | | | | 0.22 | | | | | 0.43 | |
| | | | | | | | | | | | | | | | | | | | | | | | | | | | | | |
Less distributions to shareholders: | | | | | | | | | | | | | | | | | | | | | | | | | | | | | | |
From net investment income | | | | (0.18 | ) | | | | (0.39 | ) | | | | (0.37 | ) | | | | (0.42 | ) | | | | (0.44 | ) | | | | (0.49 | ) |
| | | | | | | | | | | | | | | | | | | | | | | | | | | | | | |
Total distributions | | | | (0.18 | ) | | | | (0.39 | ) | | | | (0.37 | ) | | | | (0.42 | ) | | | | (0.44 | ) | | | | (0.49 | ) |
| | | | | | | | | | | | | | | | | | | | | | | | | | | | | | |
| | | | | | |
Net asset value, end of period | | | | $9.30 | | | | | $10.13 | | | | | $10.34 | | | | | $11.00 | | | | | $10.95 | | | | | $11.17 | |
| | | | | | | | | | | | | | | | | | | | | | | | | | | | | | |
| | | | | | |
Total return (b)(c) | | | | (6.49 | %) | | | | 1.78 | % | | | | (2.41 | %) | | | | 4.27 | % | | | | 2.04 | % | | | | 3.90 | % |
| | | | | | |
Ratios and Supplemental Data: | | | | | | | | | | | | | | | | | | | | | | | | | | | | | | |
Net assets, end of period (000’s omitted) | | | | $60,9 | 82 | | | | $71,4 | 45 | | | | $87,7 | 43 | | | | $116,3 | 28 | | | | $102,4 | 87 | | | | $86,9 | 23 |
Ratio of expenses to average net assets before waiver and reimbursement/recoupment (d) | | | | 2.27 | % | | | | 2.04 | % | | | | 2.15 | % | | | | 2.12 | % | | | | 2.10 | % | | | | 2.11 | % |
Ratio of expenses to average net assets before waiver and reimbursement/recoupment excluding interest expense (d) | | | | 1.96 | % | | | | 1.95 | % | | | | 1.96 | % | | | | 1.95 | % | | | | 1.95 | % | | | | 1.95 | % |
Ratio of expenses to average net assets after waiver and reimbursement/recoupment (d) | | | | 2.26 | % | | | | 2.03 | % | | | | 2.13 | % | | | | 2.11 | % | | | | 2.12 | % | | | | 2.15 | % |
Ratio of expenses to average net assets after waiver and reimbursement/recoupment excluding interest expense (d) | | | | 1.95 | % | | | | 1.94 | % | | | | 1.94 | % | | | | 1.94 | % | | | | 1.97 | % | | | | 1.99 | % |
Ratio of net investment income (loss) to average net assets before waiver and reimbursement/recoupment (d) | | | | 3.92 | % | | | | 3.69 | % | | | | 3.67 | % | | | | 3.70 | % | | | | 3.94 | % | | | | 4.03 | % |
Ratio of net investment income (loss) to average net assets after waiver and reimbursement/recoupment (d) | | | | 3.93 | % | | | | 3.70 | % | | | | 3.69 | % | | | | 3.71 | % | | | | 3.92 | % | | | | 3.99 | % |
Portfolio turnover rate (c) | | | | 4.71 | % | | | | 55.99 | % | | | | 67.45 | % | | | | 62.94 | % | | | | 71.49 | % | | | | 81.13 | % |
| (a) | Financial Highlights have been consolidated. See Note 1 in the Notes to Financial Statements for basis of consolidation. |
| (b) | Total return does not include the effect of sales charges. |
| (c) | Not annualized for periods less than one year. |
| (d) | Annualized for periods less than one year. |
See accompanying notes which are an integral part of these financial statements.
22
Angel Oak Multi-Strategy Income Fund – Institutional Class
Consolidated Financial Highlights (a)
(For a share outstanding during each period)
| | | | | | | | | | | | | | | | | | | | | | | | | | | | | | |
| | | For the
Period Ended
July 31,
2022
(Unaudited) | | For the
Year Ended
January 31, 2022 | | For the
Year Ended
January 31, 2021 | | For the
Year Ended
January 31, 2020 | | For the
Year Ended
January 31, 2019 | | For the
Year Ended
January 31, 2018 |
Selected Per Share Data: | | | | | | | | | | | | | | | | | | | | | | | | | | | | | | |
Net asset value, beginning of period | | | | $10.21 | | | | | $10.41 | | | | | $11.08 | | | | | $11.02 | | | | | $11.23 | | | | | $11.28 | |
| | | | | | | | | | | | | | | | | | | | | | | | | | | | | | |
| | | | | | |
Income from investment operations: | | | | | | | | | | | | | | | | | | | | | | | | | | | | | | |
Net investment income (loss) | | | | 0.25 | | | | | 0.49 | | | | | 0.48 | | | | | 0.53 | | | | | 0.55 | | | | | 0.57 | |
Net realized and unrealized gain (loss) on investments | | | | (0.85 | ) | | | | (0.19 | ) | | | | (0.68 | ) | | | | 0.06 | | | | | (0.21 | ) | | | | (0.03 | ) |
| | | | | | | | | | | | | | | | | | | | | | | | | | | | | | |
Total from investment operations | | | | (0.60 | ) | | | | 0.30 | | | | | (0.20 | ) | | | | 0.59 | | | | | 0.34 | | | | | 0.54 | |
| | | | | | | | | | | | | | | | | | | | | | | | | | | | | | |
Less distributions to shareholders: | | | | | | | | | | | | | | | | | | | | | | | | | | | | | | |
From net investment income | | | | (0.23 | ) | | | | (0.50 | ) | | | | (0.47 | ) | | | | (0.53 | ) | | | | (0.55 | ) | | | | (0.59 | ) |
| | | | | | | | | | | | | | | | | | | | | | | | | | | | | | |
Total distributions | | | | (0.23 | ) | | | | (0.50 | ) | | | | (0.47 | ) | | | | (0.53 | ) | | | | (0.55 | ) | | | | (0.59 | ) |
| | | | | | | | | | | | | | | | | | | | | | | | | | | | | | |
| | | | | | |
Net asset value, end of period | | | | $9.38 | | | | | $10.21 | | | | | $10.41 | | | | | $11.08 | | | | | $11.02 | | | | | $11.23 | |
| | | | | | | | | | | | | | | | | | | | | | | | | | | | | | |
| | | | | | |
Total return (b) | | | | (5.97 | %) | | | | 2.87 | % | | | | (1.60 | %) | | | | 5.45 | % | | | | 3.05 | % | | | | 4.88 | % |
| | | | | | |
Ratios and Supplemental Data: | | | | | | | | | | | | | | | | | | | | | | | | | | | | | | |
Net assets, end of period (000’s omitted) | | | | $4,753, | 655 | | | | $6,820, | 115 | | | | $5,927, | 510 | | | | $7,153, | 385 | | | | $6,555, | 291 | | | | $5,826, | 546 |
Ratio of expenses to average net assets before waiver and reimbursement/recoupment (c) | | | | 1.27 | % | | | | 1.04 | % | | | | 1.15 | % | | | | 1.12 | % | | | | 1.10 | % | | | | 1.11 | % |
Ratio of expenses to average net assets before waiver and reimbursement/recoupment excluding interest expense (c) | | | | 0.96 | % | | | | 0.95 | % | | | | 0.96 | % | | | | 0.95 | % | | | | 0.95 | % | | | | 0.95 | % |
Ratio of expenses to average net assets after waiver and reimbursement/recoupment (c) | | | | 1.26 | % | | | | 1.03 | % | | | | 1.13 | % | | | | 1.11 | % | | | | 1.12 | % | | | | 1.15 | % |
Ratio of expenses to average net assets after waiver and reimbursement/recoupment excluding interest expense (c) | | | | 0.95 | % | | | | 0.94 | % | | | | 0.94 | % | | | | 0.94 | % | | | | 0.97 | % | | | | 0.99 | % |
Ratio of net investment income (loss) to average net assets before waiver and reimbursement/recoupment (c) | | | | 4.88 | % | | | | 4.69 | % | | | | 4.65 | % | | | | 4.70 | % | | | | 4.94 | % | | | | 5.06 | % |
Ratio of net investment income (loss) to average net assets after waiver and reimbursement/recoupment (c) | | | | 4.89 | % | | | | 4.70 | % | | | | 4.67 | % | | | | 4.71 | % | | | | 4.92 | % | | | | 5.02 | % |
Portfolio turnover rate (b) | | | | 4.71 | % | | | | 55.99 | % | | | | 67.45 | % | | | | 62.94 | % | | | | 71.49 | % | | | | 81.13 | % |
| (a) | Financial Highlights have been consolidated. See Note 1 in the Notes to Financial Statements for basis of consolidation. |
| (b) | Not annualized for periods less than one year. |
| (c) | Annualized for periods less than one year. |
See accompanying notes which are an integral part of these financial statements.
23
Angel Oak Financials Income Fund – Class A
Financial Highlights
(For a share outstanding during each period)
| | | | | | | | | | | | | | | | | | | | | | | | | | | | | | |
| | | For the
Period Ended
July 31, 2022
(Unaudited) | | For the
Year Ended
January 31, 2022 | | For the
Year Ended
January 31, 2021 | | For the
Year Ended
January 31, 2020 | | For the
Year Ended
January 31, 2019 | | For the
Year Ended
January 31, 2018 |
Selected Per Share Data: | | | | | | | | | | | | | | | | | | | | | | | | | | | | | | |
Net asset value, beginning of period | | | | $8.96 | | | | | $8.80 | | | | | $9.60 | | | | | $9.33 | | | | | $9.45 | | | | | $9.42 | |
| | | | | | | | | | | | | | | | | | | | | | | | | | | | | | |
| | | | | | |
Income from investment operations: | | | | | | | | | | | | | | | | | | | | | | | | | | | | | | |
Net investment income (loss) | | | | 0.16 | | | | | 0.33 | | | | | 0.34 | | | | | 0.40 | | | | | 0.44 | | | | | 0.40 | |
Net realized and unrealized gain (loss) on investments | | | | (0.33 | ) | | | | 0.15 | | | | | (0.75 | ) | | | | 0.27 | | | | | (0.13 | ) | | | | 0.03 | |
| | | | | | | | | | | | | | | | | | | | | | | | | | | | | | |
Total from investment operations | | | | (0.17 | ) | | | | 0.48 | | | | | (0.41 | ) | | | | 0.67 | | | | | 0.31 | | | | | 0.43 | |
| | | | | | | | | | | | | | | | | | | | | | | | | | | | | | |
Less distributions to shareholders: | | | | | | | | | | | | | | | | | | | | | | | | | | | | | | |
From net investment income | | | | (0.16 | ) | | | | (0.32 | ) | | | | (0.38 | ) | | | | (0.40 | ) | | | | (0.43 | ) | | | | (0.40 | ) |
Return of capital | | | | — | | | | | — | | | | | (0.01 | ) | | | | — | | | | | — | | | | | — | |
| | | | | | | | | | | | | | | | | | | | | | | | | | | | | | |
Total distributions | | | | (0.16 | ) | | | | (0.32 | ) | | | | (0.39 | ) | | | | (0.40 | ) | | | | (0.43 | ) | | | | (0.40 | ) |
| | | | | | | | | | | | | | | | | | | | | | | | | | | | | | |
| | | | | | |
Net asset value, end of period | | | | $8.63 | | | | | $8.96 | | | | | $8.80 | | | | | $9.60 | | | | | $9.33 | | | | | $9.45 | |
| | | | | | | | | | | | | | | | | | | | | | | | | | | | | | |
| | | | | | |
Total return (a)(b) | | | | (1.90 | %) | | | | 5.48 | % | | | | (4.16 | %) | | | | 7.39 | % | | | | 3.36 | % | | | | 4.69 | % |
| | | | | | |
Ratios and Supplemental Data: | | | | | | | | | | | | | | | | | | | | | | | | | | | | | | |
Net assets, end of period (000’s omitted) | | | | $9,23 | 2 | | | | $4,21 | 7 | | | | $2,76 | 5 | | | | $13,7 | 20 | | | | $7,08 | 6 | | | | $9,37 | 7 |
Ratio of expenses to average net assets before waiver and reimbursement/recoupment (c) | | | | 1.36 | % | | | | 1.35 | % | | | | 1.39 | % | | | | 1.34 | % | | | | 1.42 | % | | | | 1.36 | % |
Ratio of expenses to average net assets before waiver and reimbursement/recoupment excluding interest expense (c) | | | | 1.35 | % | | | | 1.35 | % | | | | 1.37 | % | | | | 1.34 | % | | | | 1.42 | % | | | | 1.36 | % |
Ratio of expenses to average net assets after waiver and reimbursement/recoupment (c) | | | | 0.95 | % | | | | 0.94 | % | | | | 0.96 | % | | | | 0.94 | % | | | | 0.94 | % | | | | 0.94 | % |
Ratio of expenses to average net assets after waiver and reimbursement/recoupment excluding interest expense (c) | | | | 0.94 | % | | | | 0.94 | % | | | | 0.94 | % | | | | 0.94 | % | | | | 0.94 | % | | | | 0.94 | % |
Ratio of net investment income (loss) to average net assets before waiver and reimbursement/recoupment (c) | | | | 3.23 | % | | | | 3.14 | % | | | | 3.63 | % | | | | 3.78 | % | | | | 4.22 | % | | | | 3.74 | % |
Ratio of net investment income (loss) to average net assets after waiver and reimbursement/recoupment (c) | | | | 3.64 | % | | | | 3.55 | % | | | | 4.06 | % | | | | 4.18 | % | | | | 4.70 | % | | | | 4.16 | % |
Portfolio turnover rate (b) | | | | 7.74 | % | | | | 32.33 | % | | | | 29.83 | % | | | | 35.55 | % | | | | 45.27 | % | | | | 101.75 | % |
| (a) | Total return does not include the effect of sales charges. |
| (b) | Not annualized for periods less than one year. |
| (c) | Annualized for periods less than one year. |
See accompanying notes which are an integral part of these financial statements.
24
Angel Oak Financials Income Fund – Class C
Financial Highlights
(For a share outstanding during each period)
| | | | | | | | | | | | | | | | | | | | | | | | | | | | | | |
| | | For the
Period Ended
July 31, 2022
(Unaudited) | | For the
Year Ended
January 31, 2022 | | For the
Year Ended
January 31, 2021 | | For the
Year Ended
January 31, 2020 | | For the
Year Ended
January 31, 2019 | | For the
Year Ended
January 31, 2018 |
Selected Per Share Data: | | | | | | | | | | | | | | | | | | | | | | | | | | | | | | |
Net asset value, beginning of period | | | | $8.87 | | | | | $8.72 | | | | | $9.51 | | | | | $9.25 | | | | | $9.37 | | | | | $9.37 | |
| | | | | | | | | | | | | | | | | | | | | | | | | | | | | | |
| | | | | | |
Income from investment operations: | | | | | | | | | | | | | | | | | | | | | | | | | | | | | | |
Net investment income (loss) | | | | 0.14 | | | | | 0.24 | | | | | 0.30 | | | | | 0.34 | | | | | 0.37 | | | | | 0.33 | |
Net realized and unrealized gain (loss) on investments | | | | (0.38 | ) | | | | 0.16 | | | | | (0.76 | ) | | | | 0.26 | | | | | (0.12 | ) | | | | 0.02 | |
| | | | | | | | | | | | | | | | | | | | | | | | | | | | | | |
Total from investment operations | | | | (0.24 | ) | | | | 0.40 | | | | | (0.46 | ) | | | | 0.60 | | | | | 0.25 | | | | | 0.35 | |
| | | | | | | | | | | | | | | | | | | | | | | | | | | | | | |
Less distributions to shareholders: | | | | | | | | | | | | | | | | | | | | | | | | | | | | | | |
From net investment income | | | | (0.13 | ) | | | | (0.25 | ) | | | | (0.32 | ) | | | | (0.34 | ) | | | | (0.37 | ) | | | | (0.35 | ) |
Return of capital | | | | — | | | | | — | | | | | (0.01 | ) | | | | — | | | | | — | | | | | — | |
| | | | | | | | | | | | | | | | | | | | | | | | | | | | | | |
Total distributions | | | | (0.13 | ) | | | | (0.25 | ) | | | | (0.33 | ) | | | | (0.34 | ) | | | | (0.37 | ) | | | | (0.35 | ) |
| | | | | | | | | | | | | | | | | | | | | | | | | | | | | | |
| | | | | | |
Net asset value, end of period | | | | $8.50 | | | | | $8.87 | | | | | $8.72 | | | | | $9.51 | | | | | $9.25 | | | | | $9.37 | |
| | | | | | | | | | | | | | | | | | | | | | | | | | | | | | |
| | | | | | |
Total return (a)(b) | | | | (2.71 | %) | | | | 4.63 | % | | | | (4.79 | %) | | | | 6.59 | % | | | | 2.69 | % | | | | 3.80 | % |
| | | | | | |
Ratios and Supplemental Data: | | | | | | | | | | | | | | | | | | | | | | | | | | | | | | |
Net assets, end of period (000’s omitted) | | | | $7,76 | 3 | | | | $3,45 | 2 | | | | $5,55 | 3 | | | | $6,16 | 2 | | | | $2,03 | 9 | | | | $1,46 | 5 |
Ratio of expenses to average net assets before waiver and reimbursement/recoupment (c) | | | | 2.11 | % | | | | 2.10 | % | | | | 2.15 | % | | | | 2.09 | % | | | | 2.17 | % | | | | 2.11 | % |
Ratio of expenses to average net assets before waiver and reimbursement/recoupment excluding interest expense (c) | | | | 2.10 | % | | | | 2.10 | % | | | | 2.12 | % | | | | 2.09 | % | | | | 2.17 | % | | | | 2.11 | % |
Ratio of expenses to average net assets after waiver and reimbursement/recoupment (c) | | | | 1.70 | % | | | | 1.69 | % | | | | 1.72 | % | | | | 1.69 | % | | | | 1.69 | % | | | | 1.69 | % |
Ratio of expenses to average net assets after waiver and reimbursement/recoupment excluding interest expense (c) | | | | 1.69 | % | | | | 1.69 | % | | | | 1.69 | % | | | | 1.69 | % | | | | 1.69 | % | | | | 1.69 | % |
Ratio of net investment income (loss) to average net assets before waiver and reimbursement/recoupment (c) | | | | 2.46 | % | | | | 2.38 | % | | | | 2.97 | % | | | | 3.02 | % | | | | 3.49 | % | | | | 2.99 | % |
Ratio of net investment income (loss) to average net assets after waiver and reimbursement/recoupment (c) | | | | 2.87 | % | | | | 2.79 | % | | | | 3.40 | % | | | | 3.42 | % | | | | 3.97 | % | | | | 3.41 | % |
Portfolio turnover rate (b) | | | | 7.74 | % | | | | 32.33 | % | | | | 29.83 | % | | | | 35.55 | % | | | | 45.27 | % | | | | 101.75 | % |
| (a) | Total return does not include the effect of sales charges. |
| (b) | Not annualized for periods less than one year. |
| (c) | Annualized for periods less than one year. |
See accompanying notes which are an integral part of these financial statements.
25
Angel Oak Financials Income Fund – Institutional Class
Financial Highlights
(For a share outstanding during each period)
| | | | | | | | | | | | | | | | | | | | | | | | | | | | | | |
| | | For the
Period Ended
July 31, 2022
(Unaudited) | | For the
Year Ended
January 31, 2022 | | For the
Year Ended
January 31, 2021 | | For the
Year Ended
January 31, 2020 | | For the
Year Ended
January 31, 2019 | | For the
Year Ended
January 31, 2018 |
Selected Per Share Data: | | | | | | | | | | | | | | | | | | | | | | | | | | | | | | |
Net asset value, beginning of period | | | | $8.94 | | | | | $8.79 | | | | | $9.58 | | | | | $9.32 | | | | | $9.44 | | | | | $9.41 | |
| | | | | | | | | | | | | | | | | | | | | | | | | | | | | | |
| | | | | | |
Income from investment operations: | �� | | | | | | | | | | | | | | | | | | | | | | | | | | | | | |
Net investment income (loss) | | | | 0.17 | | | | | 0.34 | | | | | 0.38 | | | | | 0.43 | | | | | 0.46 | | | | | 0.41 | |
Net realized and unrealized gain (loss) on investments | | | | (0.33 | ) | | | | 0.15 | | | | | (0.76 | ) | | | | 0.26 | | | | | (0.13 | ) | | | | 0.05 | |
| | | | | | | | | | | | | | | | | | | | | | | | | | | | | | |
Total from investment operations | | | | (0.16 | ) | | | | 0.49 | | | | | (0.38 | ) | | | | 0.69 | | | | | 0.33 | | | | | 0.46 | |
| | | | | | | | | | | | | | | | | | | | | | | | | | | | | | |
Less distributions to shareholders: | | | | | | | | | | | | | | | | | | | | | | | | | | | | | | |
From net investment income | | | | (0.17 | ) | | | | (0.34 | ) | | | | (0.40 | ) | | | | (0.43 | ) | | | | (0.45 | ) | | | | (0.43 | ) |
Return of capital | | | | — | | | | | — | | | | | (0.01 | ) | | | | — | | | | | — | | | | | — | |
| | | | | | | | | | | | | | | | | | | | | | | | | | | | | | |
Total distributions | | | | (0.17 | ) | | | | (0.34 | ) | | | | (0.41 | ) | | | | (0.43 | ) | | | | (0.45 | ) | | | | (0.43 | ) |
| | | | | | | | | | | | | | | | | | | | | | | | | | | | | | |
| | | | | | |
Net asset value, end of period | | | | $8.61 | | | | | $8.94 | | | | | $8.79 | | | | | $9.58 | | | | | $9.32 | | | | | $9.44 | |
| | | | | | | | | | | | | | | | | | | | | | | | | | | | | | |
| | | | | | |
Total return (a) | | | | (1.79 | %) | | | | 5.64 | % | | | | (3.81 | %) | | | | 7.55 | % | | | | 3.61 | % | | | | 4.97 | % |
| | | | | | |
Ratios and Supplemental Data: | | | | | | | | | | | | | | | | | | | | | | | | | | | | | | |
Net assets, end of period (000’s omitted) | | | | $139,5 | 37 | | | | $159,0 | 78 | | | | $134,3 | 35 | | | | $258,3 | 92 | | | | $122,3 | 63 | | | | $106,4 | 94 |
Ratio of expenses to average net assets before waiver and reimbursement/recoupment (b) | | | | 1.11 | % | | | | 1.10 | % | | | | 1.14 | % | | | | 1.09 | % | | | | 1.17 | % | | | | 1.10 | % |
Ratio of expenses to average net assets before waiver and reimbursement/recoupment excluding interest expense (b) | | | | 1.10 | % | | | | 1.10 | % | | | | 1.12 | % | | | | 1.09 | % | | | | 1.17 | % | | | | 1.10 | % |
Ratio of expenses to average net assets after waiver and reimbursement/recoupment (b) | | | | 0.70 | % | | | | 0.69 | % | | | | 0.71 | % | | | | 0.69 | % | | | | 0.69 | % | | | | 0.69 | % |
Ratio of expenses to average net assets after waiver and reimbursement/recoupment excluding interest expense (b) | | | | 0.69 | % | | | | 0.69 | % | | | | 0.69 | % | | | | 0.69 | % | | | | 0.69 | % | | | | 0.69 | % |
Ratio of net investment income (loss) to average net assets before waiver and reimbursement/recoupment (b) | | | | 3.48 | % | | | | 3.38 | % | | | | 3.91 | % | | | | 4.02 | % | | | | 4.48 | % | | | | 3.98 | % |
Ratio of net investment income (loss) to average net assets after waiver and reimbursement/recoupment (b) | | | | 3.89 | % | | | | 3.79 | % | | | | 4.34 | % | | | | 4.42 | % | | | | 4.96 | % | | | | 4.39 | % |
Portfolio turnover rate (a) | | | | 7.74 | % | | | | 32.33 | % | | | | 29.83 | % | | | | 35.55 | % | | | | 45.27 | % | | | | 101.75 | % |
| (a) | Not annualized for periods less than one year. |
| (b) | Annualized for periods less than one year. |
See accompanying notes which are an integral part of these financial statements.
26
Angel Oak High Yield Opportunities Fund – Class A
Financial Highlights
(For a share outstanding during each period)
| | | | | | | | | | | | | | | | | | | | | | | | | | | | | | |
| | | For the
Period Ended
July 31, 2022
(Unaudited) | | For the
Year Ended
January 31, 2022 | | For the
Year Ended
January 31, 2021 | | For the
Year Ended
January 31, 2020 | | For the
Year Ended
January 31, 2019 | | For the
Year Ended
January 31, 2018 |
Selected Per Share Data: | | | | | | | | | | | | | | | | | | | | | | | | | | | | | | |
Net asset value, beginning of period | | | | $11.59 | | | | | $11.78 | | | | | $11.76 | | | | | $11.39 | | | | | $12.00 | | | | | $11.92 | |
| | | | | | | | | | | | | | | | | | | | | | | | | | | | | | |
| | | | | | |
Income from investment operations: | | | | | | | | | | | | | | | | | | | | | | | | | | | | | | |
Net investment income (loss) | | | | 0.29 | | | | | 0.58 | | | | | 0.58 | | | | | 0.64 | | | | | 0.65 | | | | | 0.68 | |
Net realized and unrealized gain (loss) on investments | | | | (0.95 | ) | | | | (0.19 | ) | | | | 0.03 | (a) | | | | 0.37 | | | | | (0.61 | ) | | | | 0.06 | |
| | | | | | | | | | | | | | | | | | | | | | | | | | | | | | |
Total from investment operations | | | | (0.66 | ) | | | | 0.39 | | | | | 0.61 | | | | | 1.01 | | | | | 0.04 | | | | | 0.74 | |
| | | | | | | | | | | | | | | | | | | | | | | | | | | | | | |
Less distributions to shareholders: | | | | | | | | | | | | | | | | | | | | | | | | | | | | | | |
From net investment income | | | | (0.28 | ) | | | | (0.58 | ) | | | | (0.59 | ) | | | | (0.64 | ) | | | | (0.65 | ) | | | | (0.66 | ) |
| | | | | | | | | | | | | | | | | | | | | | | | | | | | | | |
Total distributions | | | | (0.28 | ) | | | | (0.58 | ) | | | | (0.59 | ) | | | | (0.64 | ) | | | | (0.65 | ) | | | | (0.66 | ) |
| | | | | | | | | | | | | | | | | | | | | | | | | | | | | | |
| | | | | | |
Net asset value, end of period | | | | $10.65 | | | | | $11.59 | | | | | $11.78 | | | | | $11.76 | | | | | $11.39 | | | | | $12.00 | |
| | | | | | | | | | | | | | | | | | | | | | | | | | | | | | |
| | | | | | |
Total return (b)(c) | | | | (5.74 | %) | | | | 3.34 | % | | | | 5.68 | % | | | | 9.08 | % | | | | 0.41 | % | | | | 6.34 | % |
| | | | | | |
Ratios and Supplemental Data: | | | | | | | | | | | | | | | | | | | | | | | | | | | | | | |
Net assets, end of period (000’s omitted) | | | | $3,99 | 6 | | | | $4,83 | 4 | | | | $3,98 | 6 | | | | $7,77 | 1 | | | | $2,75 | 4 | | | | $1,29 | 8 |
Ratio of expenses to average net assets before waiver and reimbursement/recoupment (d) | | | | 1.14 | % | | | | 1.14 | % | | | | 1.14 | % | | | | 1.14 | % | | | | 1.24 | % | | | | 1.27 | % |
Ratio of expenses to average net assets after waiver and reimbursement/recoupment (d) | | | | 0.90 | % | | | | 0.90 | % | | | | 0.90 | % | | | | 0.90 | % | | | | 0.90 | % | | | | 0.90 | % |
Ratio of net investment income (loss) to average net assets before waiver and reimbursement/recoupment (d) | | | | 5.02 | % | | | | 4.60 | % | | | | 5.18 | % | | | | 5.20 | % | | | | 5.28 | % | | | | 5.34 | % |
Ratio of net investment income (loss) to average net assets after waiver and reimbursement/recoupment (d) | | | | 5.26 | % | | | | 4.84 | % | | | | 5.42 | % | | | | 5.44 | % | | | | 5.62 | % | | | | 5.71 | % |
Portfolio turnover rate (c) | | | | 1.23 | % | | | | 38.15 | % | | | | 58.02 | % | | | | 35.80 | % | | | | 33.27 | % | | | | 45.86 | % |
| (a) | Net realized and unrealized gain (loss) per share includes balancing amounts necessary to reconcile the change in net asset value per share for the period, and may not reconcile with the aggregate gain/(loss) in the Statements of Operations due to share transactions for the period. |
| (b) | Total return does not include the effect of sales charges. |
| (c) | Not annualized for periods less than one year. |
| (d) | Annualized for periods less than one year. |
See accompanying notes which are an integral part of these financial statements.
27
Angel Oak High Yield Opportunities Fund – Institutional Class
Financial Highlights
(For a share outstanding during each period)
| | | | | | | | | | | | | | | | | | | | | | | | | | | | | | |
| | | For the
Period Ended
July 31, 2022
(Unaudited) | | For the
Year Ended
January 31, 2022 | | For the
Year Ended
January 31, 2021 | | For the
Year Ended
January 31, 2020 | | For the
Year Ended
January 31, 2019 | | For the
Year Ended
January 31, 2018 |
Selected Per Share Data: | | | | | | | | | | | | | | | | | | | | | | | | | | | | | | |
Net asset value, beginning of period | | | | $11.54 | | | | | $11.73 | | | | | $11.71 | | | | | $11.35 | | | | | $11.95 | | | | | $11.89 | |
| | | | | | | | | | | | | | | | | | | | | | �� | | | | | | | | |
| | | | | | |
Income from investment operations: | | | | | | | | | | | | | | | | | | | | | | | | | | | | | | |
Net investment income (loss) | | | | 0.30 | | | | | 0.60 | | | | | 0.63 | | | | | 0.67 | | | | | 0.69 | | | | | 0.71 | |
Net realized and unrealized gain (loss) on investments | | | | (0.95 | ) | | | | (0.18 | ) | | | | 0.01 | (a) | | | | 0.36 | | | | | (0.61 | ) | | | | 0.04 | |
| | | | | | | | | | | | | | | | | | | | | | | | | | | | | | |
Total from investment operations | | | | (0.65 | ) | | | | 0.42 | | | | | 0.64 | | | | | 1.03 | | | | | 0.08 | | | | | 0.75 | |
| | | | | | | | | | | | | | | | | | | | | | | | | | | | | | |
Less distributions to shareholders: | | | | | | | | | | | | | | | | | | | | | | | | | | | | | | |
From net investment income | | | | (0.29 | ) | | | | (0.61 | ) | | | | (0.62 | ) | | | | (0.67 | ) | | | | (0.68 | ) | | | | (0.69 | ) |
| | | | | | | | | | | | | | | | | | | | | | | | | | | | | | |
Total distributions | | | | (0.29 | ) | | | | (0.61 | ) | | | | (0.62 | ) | | | | (0.67 | ) | | | | (0.68 | ) | | | | (0.69 | ) |
| | | | | | | | | | | | | | | | | | | | | | | | | | | | | | |
| | | | | | |
Net asset value, end of period | | | | $10.60 | | | | | $11.54 | | | | | $11.73 | | | | | $11.71 | | | | | $11.35 | | | | | $11.95 | |
| | | | | | | | | | | | | | | | | | | | | | | | | | | | | | |
| | | | | | |
Total return (b) | | | | (5.64 | %) | | | | 3.62 | % | | | | 5.97 | % | | | | 9.28 | % | | | | 0.74 | % | | | | 6.53 | % |
| | | | | | |
Ratios and Supplemental Data: | | | | | | | | | | | | | | | | | | | | | | | | | | | | | | |
Net assets, end of period (000’s omitted) | | | | $64,6 | 14 | | | | $69,5 | 03 | | | | $68,2 | 45 | | | | $64,7 | 97 | | | | $48,4 | 26 | | | | $51,5 | 16 |
Ratio of expenses to average net assets before waiver and reimbursement/recoupment (c) | | | | 0.89 | % | | | | 0.89 | % | | | | 0.89 | % | | | | 0.89 | % | | | | 0.99 | % | | | | 1.02 | % |
Ratio of expenses to average net assets after waiver and reimbursement/recoupment (c) | | | | 0.65 | % | | | | 0.65 | % | | | | 0.65 | % | | | | 0.65 | % | | | | 0.65 | % | | | | 0.65 | % |
Ratio of net investment income (loss) to average net assets before waiver and reimbursement/recoupment (c) | | | | 5.28 | % | | | | 4.86 | % | | | | 5.41 | % | | | | 5.52 | % | | | | 5.59 | % | | | | 5.61 | % |
Ratio of net investment income (loss) to average net assets after waiver and reimbursement/recoupment (c) | | | | 5.52 | % | | | | 5.10 | % | | | | 5.65 | % | | | | 5.76 | % | | | | 5.93 | % | | | | 5.98 | % |
Portfolio turnover rate (b) | | | | 1.23 | % | | | | 38.15 | % | | | | 58.02 | % | | | | 35.80 | % | | | | 33.27 | % | | | | 45.86 | % |
| (a) | Net realized and unrealized gain (loss) per share includes balancing amounts necessary to reconcile the change in net asset value per share for the period, and may not reconcile with the aggregate gain/(loss) in the Statements of Operations due to share transactions for the period. |
| (b) | Not annualized for periods less than one year. |
| (c) | Annualized for periods less than one year. |
See accompanying notes which are an integral part of these financial statements.
28
Angel Oak UltraShort Income Fund – Class A
Financial Highlights
(For a share outstanding during each period)
| | | | | | | | | | | | | | | | | | | | | | | | | |
| | | For the
Period Ended
July 31, 2022
(Unaudited) | | For the
Year Ended
January 31, 2022 | | For the
Year Ended
January 31, 2021 | | For the
Year Ended
January 31, 2020 | | For the
Period Ended
January 31, 2019 (a) |
Selected Per Share Data: | | | | | | | | | | | | | | | | | | | | | | | | | |
Net asset value, beginning of period | | | | $10.00 | | | | | $10.08 | | | | | $10.12 | | | | | $10.02 | | | | | $10.01 | |
| | | | | | | | | | | | | | | | | | | | | | | | | |
| | | | | |
Income from investment operations: | | | | | | | | | | | | | | | | | | | | | | | | | |
Net investment income (loss) | | | | 0.04 | | | | | 0.08 | | | | | 0.19 | | | | | 0.29 | | | | | 0.20 | |
Net realized and unrealized gain (loss) on investments | | | | (0.25 | ) | | | | (0.05 | ) | | | | (0.04 | )(b) | | | | 0.10 | | | | | 0.01 | |
| | | | | | | | | | | | | | | | | | | | | | | | | |
Total from investment operations | | | | (0.21 | ) | | | | 0.03 | | | | | 0.15 | | | | | 0.39 | | | | | 0.21 | |
| | | | | | | | | | | | | | | | | | | | | | | | | |
Less distributions to shareholders: | | | | | | | | | | | | | | | | | | | | | | | | | |
From net investment income | | | | (0.07 | ) | | | | (0.11 | ) | | | | (0.19 | ) | | | | (0.29 | ) | | | | (0.20 | ) |
From net realized gain | | | | — | | | | | — | | | | | — | | | | | — | | | | | — | (c) |
| | | | | | | | | | | | | | | | | | | | | | | | | |
Total distributions | | | | (0.07 | ) | | | | (0.11 | ) | | | | (0.19 | ) | | | | (0.29 | ) | | | | (0.20 | ) |
| | | | | | | | | | | | | | | | | | | | | | | | | |
| | | | | |
Net asset value, end of period | | | | $9.72 | | | | | $10.00 | | | | | $10.08 | | | | | $10.12 | | | | | $10.02 | |
| | | | | | | | | | | | | | | | | | | | | | | | | |
| | | | | |
Total return (d) | | | | (2.12 | %) | | | | 0.27 | % | | | | 1.52 | % | | | | 3.92 | % | | | | 2.12 | % |
| | | | | |
Ratios and Supplemental Data: | | | | | | | | | | | | | | | | | | | | | | | | | |
Net assets, end of period (000’s omitted) | | | | $71,5 | 08 | | | | $171,3 | 28 | | | | $66,3 | 66 | | | | $51,5 | 29 | | | | $7,90 | 3 |
Ratio of expenses to average net assets before waiver and reimbursement/recoupment (e) | | | | 0.79 | % | | | | 0.78 | % | | | | 0.79 | % | | | | 0.84 | % | | | | 0.94 | % |
Ratio of expenses to average net assets after waiver and reimbursement/recoupment (e) | | | | 0.60 | % | | | | 0.56 | % | | | | 0.51 | % | | | | 0.50 | % | | | | 0.50 | % |
Ratio of net investment income (loss) to average net assets before waiver and reimbursement/recoupment (e) | | | | 1.06 | % | | | | 0.56 | % | | | | 1.45 | % | | | | 2.22 | % | | | | 2.32 | % |
Ratio of net investment income (loss) to average net assets after waiver and reimbursement/recoupment (e) | | | | 1.25 | % | | | | 0.78 | % | | | | 1.73 | % | | | | 2.56 | % | | | | 2.76 | % |
Portfolio turnover rate (d) | | | | 12.68 | % | | | | 91.83 | % | | | | 81.48 | % | | | | 156.42 | % | | | | 178.59 | % |
| (a) | Class commenced operations on April 30, 2018. |
| (b) | Net realized and unrealized gain (loss) per share includes balancing amounts necessary to reconcile the change in net asset value per share for the period, and may not reconcile with the aggregate gain/(loss) in the Statements of Operations due to share transactions for the period. |
| (d) | Not annualized for periods less than one year. |
| (e) | Annualized for periods less than one year. |
See accompanying notes which are an integral part of these financial statements.
29
Angel Oak UltraShort Income Fund – Class A1
Financial Highlights
(For a share outstanding during each period)
| | | | | |
| | | For the
Period Ended
July 31, 2022
(Unaudited) (a) |
Selected Per Share Data: | | | | | |
Net asset value, beginning of period | | | | $9.70 | |
| | | | | |
| |
Income from investment operations: | | | | | |
Net investment income (loss) | | | | — | (b) |
Net realized and unrealized gain (loss) on investments | | | | 0.01 | |
| | | | | |
Total from investment operations | | | | 0.01 | |
| | | | | |
Less distributions to shareholders: | | | | | |
From net investment income | | | | — | (b) |
| | | | | |
Total distributions | | | | — | |
| | | | | |
| |
Net asset value, end of period | | | | $9.71 | |
| | | | | |
| |
Total return (c)(d) | | | | 0.13 | % |
| |
Ratios and Supplemental Data: | | | | | |
Net assets, end of period (000’s omitted) | | | | $510 | |
Ratio of expenses to average net assets before waiver and reimbursement/recoupment (e) | | | | 0.71 | % |
Ratio of expenses to average net assets after waiver and reimbursement/recoupment (e) | | | | 0.59 | % |
Ratio of net investment income (loss) to average net assets before waiver and reimbursement/recoupment (e) | | | | (0.15 | %) |
Ratio of net investment income (loss) to average net assets after waiver and reimbursement/recoupment (e) | | | | (0.03 | %) |
Portfolio turnover rate (c) | | | | 12.68 | % |
| (a) | Class commenced operations on July 12, 2022. |
| (c) | Not annualized for periods less than one year. |
| (d) | Total return does not include the effect of sales charges. |
| (e) | Annualized for periods less than one year. |
See accompanying notes which are an integral part of these financial statements.
30
Angel Oak UltraShort Income Fund – Institutional Class
Financial Highlights
(For a share outstanding during each period)
| | | | | | | | | | | | | | | | | | | | | | | | | |
| | | For the
Period Ended
July 31, 2022
(Unaudited) | | For the
Year Ended
January 31, 2022 | | For the
Year Ended
January 31, 2021 | | For the
Year Ended
January 31, 2020 | | For the
Period Ended
January 31, 2019 (a) |
Selected Per Share Data: | | | | | | | | | | | | | | | | | | | | | | | | | |
Net asset value, beginning of period | | | | $10.01 | | | | | $10.09 | | | | | $10.12 | | | | | $10.02 | | | | | $10.00 | |
| | | | | | | | | | | | | | | | | | | | | | | | | |
| | | | | |
Income from investment operations: | | | | | | | | | | | | | | | | | | | | | | | | | |
Net investment income (loss) | | | | 0.07 | | | | | 0.11 | | | | | 0.21 | | | | | 0.31 | | | | | 0.24 | |
Net realized and unrealized gain (loss) on investments | | | | (0.28 | ) | | | | (0.06 | ) | | | | (0.03 | )(b) | | | | 0.10 | | | | | 0.02 | |
| | | | | | | | | | | | | | | | | | | | | | | | | |
Total from investment operations | | | | (0.21 | ) | | | | 0.05 | | | | | 0.18 | | | | | 0.41 | | | | | 0.26 | |
| | | | | | | | | | | | | | | | | | | | | | | | | |
Less distributions to shareholders: | | | | | | | | | | | | | | | | | | | | | | | | | |
From net investment income | | | | (0.08 | ) | | | | (0.13 | ) | | | | (0.21 | ) | | | | (0.31 | ) | | | | (0.24 | ) |
From net realized gain | | | | — | | | | | — | | | | | — | | | | | — | | | | | — | (c) |
| | | | | | | | | | | | | | | | | | | | | | | | | |
Total distributions | | | | (0.08 | ) | | | | (0.13 | ) | | | | (0.21 | ) | | | | (0.31 | ) | | | | (0.24 | ) |
| | | | | | | | | | | | | | | | | | | | | | | | | |
| | | | | |
Net asset value, end of period | | | | $9.72 | | | | | $10.01 | | | | | $10.09 | | | | | $10.12 | | | | | $10.02 | |
| | | | | | | | | | | | | | | | | | | | | | | | | |
| | | | | |
Total return (d) | | | | (2.08 | %) | | | | 0.51 | % | | | | 1.87 | % | | | | 4.16 | % | | | | 2.60 | % |
| | | | | |
Ratios and Supplemental Data: | | | | | | | | | | | | | | | | | | | | | | | | | |
Net assets, end of period (000’s omitted) | | | | $1,060, | 112 | | | | $1,492, | 542 | | | | $796,4 | 07 | | | | $357,3 | 03 | | | | $106,5 | 96 |
Ratio of expenses to average net assets before waiver and reimbursement/recoupment (e) | | | | 0.54 | % | | | | 0.53 | % | | | | 0.54 | % | | | | 0.59 | % | | | | 0.77 | % |
Ratio of expenses to average net assets after waiver and reimbursement/recoupment (e) | | | | 0.35 | % | | | | 0.31 | % | | | | 0.26 | % | | | | 0.25 | % | | | | 0.26 | % |
Ratio of net investment income (loss) to average net assets before waiver and reimbursement/recoupment (e) | | | | 1.35 | % | | | | 0.82 | % | | | | 1.67 | % | | | | 2.58 | % | | | | 2.37 | % |
Ratio of net investment income (loss) to average net assets after waiver and reimbursement/recoupment (e) | | | | 1.54 | % | | | | 1.04 | % | | | | 1.95 | % | | | | 2.92 | % | | | | 2.88 | % |
Portfolio turnover rate (d) | | | | 12.68 | % | | | | 91.83 | % | | | | 81.48 | % | | | | 156.42 | % | | | | 178.59 | % |
| (a) | Class commenced operations on April 30, 2018. |
| (b) | Net realized and unrealized gain (loss) per share includes balancing amounts necessary to reconcile the change in net asset value per share for the period, and may not reconcile with the aggregate gain/(loss) in the Statements of Operations due to share transactions for the period. |
| (d) | Not annualized for periods less than one year. |
| (e) | Annualized for periods less than one year. |
See accompanying notes which are an integral part of these financial statements.
31
Angel Oak Core Impact Fund – Institutional Class
Financial Highlights
(For a share outstanding during each period)
| | | | | | | | | | |
| | | For the
Period Ended
July 31, 2022
(Unaudited) | | For the
Period Ended
January 31, 2022 (a) |
Selected Per Share Data: | | | | | | | | | | |
Net asset value, beginning of period | | | | $9.77 | | | | | $10.00 | |
| | | | | | | | | | |
| | |
Income from investment operations: | | | | | | | | | | |
Net investment income (loss) | | | | 0.10 | | | | | 0.09 | |
Net realized and unrealized gain (loss) on investments | | | | (0.57 | ) | | | | (0.22 | ) |
| | | | | | | | | | |
Total from investment operations | | | | (0.47 | ) | | | | (0.13 | ) |
| | | | | | | | | | |
Less distributions to shareholders: | | | | | | | | | | |
From net investment income | | | | (0.10 | ) | | | | (0.10 | ) |
| | | | | | | | | | |
Total distributions | | | | (0.10 | ) | | | | (0.10 | ) |
| | | | | | | | | | |
| | |
Net asset value, end of period | | | | $9.20 | | | | | $9.77 | |
| | | | | | | | | | |
| | |
Total return (b) | | | | (4.78 | %) | | | | (1.28 | %) |
| | |
Ratios and Supplemental Data: | | | | | | | | | | |
Net assets, end of period (000’s omitted) | | | | $36,7 | 89 | | | | $39,1 | 33 |
Ratio of expenses to average net assets before waiver and reimbursement/recoupment (c) | | | | 0.98 | % | | | | 0.97 | % |
Ratio of expenses to average net assets after waiver and reimbursement/recoupment (c) | | | | 0.59 | % | | | | 0.59 | % |
Ratio of net investment income (loss) to average net assets before waiver and reimbursement/recoupment (c) | | | | 1.79 | % | | | | 1.06 | % |
Ratio of net investment income (loss) to average net assets after waiver and reimbursement/recoupment (c) | | | | 2.18 | % | | | | 1.44 | % |
Portfolio turnover rate (b) | | | | 12.19 | % | | | | 21.55 | % |
| (a) | Class commenced operations on June 4, 2021. |
| (b) | Not annualized for periods less than one year. |
| (c) | Annualized for periods less than one year. |
See accompanying notes which are an integral part of these financial statements.
32
Angel Oak Multi-Strategy Income Fund
Consolidated Schedule of Investments
July 31, 2022 (Unaudited)
| | | | | | | | |
| | | Principal
Amount | | | Value | |
Asset-Backed Securities – 11.16% | | | | | | | | |
ACC Trust, Series 2022-1, Class D, 6.650%, 10/20/2028 (a) | | | $1,500,000 | | | | $1,452,270 | |
Affirm Asset Securitization Trust, Series 2021-A, Class D, 3.490%, 8/15/2025 (a) | | | 3,000,000 | | | | 2,993,937 | |
Affirm Asset Securitization Trust, Series 2021-A, Class E, 5.650%, 8/15/2025 (a) | | | 4,000,000 | | | | 3,992,344 | |
Affirm Asset Securitization Trust, Series 2021-B, Class D, 2.540%, 8/17/2026 (a) | | | 4,500,000 | | | | 4,198,239 | |
Affirm Asset Securitization Trust, Series 2021-B, Class E, 4.610%, 8/17/2026 (a) | | | 1,900,000 | | | | 1,776,842 | |
American Credit Acceptance Receivables Trust, Series 2019-4, Class F, 5.370%, 9/12/2026 (a) | | | 800,000 | | | | 770,224 | |
American Credit Acceptance Receivables Trust, Series 2021-1, Class E, 2.290%, 3/15/2027 (a) | | | 3,500,000 | | | | 3,144,302 | |
American Credit Acceptance Receivables Trust, Series 2020-3, Class F, 5.940%, 6/14/2027 (a) | | | 5,650,000 | | | | 5,636,265 | |
American Credit Acceptance Receivables Trust, Series 2021-1, Class F, 4.010%, 11/15/2027 (a) | | | 650,000 | | | | 597,765 | |
American Credit Acceptance Receivables Trust, Series 2021-4, Class E, 3.120%, 2/14/2028 (a) | | | 1,000,000 | | | | 931,497 | |
American Credit Acceptance Receivables Trust, Series 2022-1, Class F, 4.870%, 11/13/2028 (a) | | | 1,540,000 | | | | 1,469,202 | |
Aqua Finance Trust, Series 2021-A, Class C, 3.140%, 7/17/2046 (a) | | | 1,700,000 | | | | 1,419,134 | |
Arivo Acceptance Auto Loan Receivables Trust, Series 2022-1A, Class D, 7.380%, 9/17/2029 (a) | | | 500,000 | | | | 488,183 | |
Avant Credit Card Master Trust, Series 2021-1A, Class C, 2.160%, 4/15/2027 (a) | | | 2,500,000 | | | | 2,288,075 | |
Avant Loans Funding Trust, Series 2021-REV1, Class B, 1.640%, 7/15/2030 (a) | | | 1,793,000 | | | | 1,701,503 | |
Avid Automobile Receivables Trust, Series 2021-1, Class D, 1.990%, 4/17/2028 (a) | | | 1,570,000 | | | | 1,438,279 | |
Avis Budget Rental Car Funding LLC, Series 2019-2A, Class D, 3.040%, 9/20/2025 (a) | | | 5,250,000 | | | | 4,919,386 | |
Avis Budget Rental Car Funding LLC, Series 2020-1A, Class D, 3.340%, 8/20/2026 (a) | | | 4,750,000 | | | | 4,355,869 | |
BHG Securitization Trust, Series 2021-B, Class D, 3.170%, 10/17/2034 (a) | | | 1,170,000 | | | | 1,046,473 | |
CAL Receivables LLC, Series 2022-1, Class B,
5.129% (SOFR30A + 4.350%), 10/15/2026 (a)(b) | | | 8,080,000 | | | | 7,714,841 | |
Carvana Auto Receivables Trust, Series 2021-N1, Class E, 2.880%, 1/10/2028 (a) | | | 3,300,000 | | | | 3,038,584 | |
Carvana Auto Receivables Trust, Series 2021-N1, Class F, 4.550%, 1/10/2028 (a) | | | 2,500,000 | | | | 2,347,897 | |
Carvana Auto Receivables Trust, Series 2021-N2, Class E, 2.900%, 3/10/2028 (a)(c) | | | 35,900,000 | | | | 32,213,716 | |
Carvana Auto Receivables Trust, Series 2021-P2, Class D, 2.020%, 5/10/2028 (c) | | | 5,000,000 | | | | 4,479,095 | |
Carvana Auto Receivables Trust, Series 2021-N3, Class E, 3.160%, 6/12/2028 (a) | | | 7,310,000 | | | | 6,490,344 | |
Carvana Auto Receivables Trust, Series 2021-N4, Class E, 4.530%, 9/10/2028 (a) | | | 6,870,000 | | | | 6,160,446 | |
Carvana Auto Receivables Trust, Series 2022-N1, Class E, 6.010%, 12/10/2028 (a) | | | 1,650,000 | | | | 1,564,388 | |
Carvana Auto Receivables Trust, Series 2022-P2, Class D, 6.280%, 5/10/2029 | | | 1,500,000 | | | | 1,463,130 | |
Chase Auto Credit Linked Notes, Series 2021-2, Class E, 2.280%, 12/25/2028 (a) | | | 731,296 | | | | 716,063 | |
Conn’s Receivables Funding LLC, Series A, Class A, 1.000%, 12/15/2026 (a) | | | 3,500,000 | | | | 3,518,770 | |
Conn’s Receivables Funding LLC, Series B, Class B, 2.000%, 12/15/2026 (a) | | | 500,000 | | | | 493,485 | |
Consumer Loan Underlying Bond Credit Trust, Series 2017-P2, Class CL1, 0.000%, 1/15/2024 (a) | | | 125,000 | | | | 559,104 | |
Continental Credit Card ABS LLC, Series 2019-1A, Class B, 4.950%, 8/15/2026 (a) | | | 3,700,000 | | | | 3,516,450 | |
Continental Finance Credit Card ABS Master Trust, Series 2020-1A, Class A, 2.240%, 12/15/2028 (a) | | | 1,500,000 | | | | 1,387,785 | |
Continental Finance Credit Card ABS Master Trust, Series 2020-1A, Class B, 3.660%, 12/15/2028 (a) | | | 1,500,000 | | | | 1,379,490 | |
Continental Finance Credit Card ABS Master Trust, Series 2020-1A, Class C, 5.750%, 12/15/2028 (a) | | | 1,700,000 | | | | 1,659,889 | |
CPS Auto Receivables Trust, Series 2019-C, Class F, 6.940%, 9/15/2026 (a) | | | 3,500,000 | | | | 3,476,977 | |
CPS Auto Receivables Trust, Series 2020-A, Class F, 6.930%, 3/15/2027 (a) | | | 2,500,000 | | | | 2,466,030 | |
CPS Auto Receivables Trust, Series 2021-D, Class D, 2.310%, 10/15/2027 (a)(c) | | | 7,240,000 | | | | 6,767,409 | |
CPS Auto Receivables Trust, Series 2021-A, Class E, 2.530%, 3/15/2028 (a)(c) | | | 9,320,000 | | | | 8,696,855 | |
CPS Auto Receivables Trust, Series 2021-B, Class E, 3.410%, 6/15/2028 (a) | | | 12,750,000 | | | | 11,688,868 | |
CPS Auto Receivables Trust, Series 2021-D, Class E, 4.060%, 12/15/2028 (a) | | | 3,750,000 | | | | 3,424,436 | |
CPS Auto Receivables Trust, Series 2022-A, Class E, 4.880%, 4/16/2029 (a) | | | 5,400,000 | | | | 4,975,463 | |
CPS Auto Receivables Trust, Series 2022-C, Class D, 6.450%, 4/15/2030 (a) | | | 1,500,000 | | | | 1,499,789 | |
See accompanying notes which are an integral part of these financial statements.
33
Angel Oak Multi-Strategy Income Fund
Consolidated Schedule of Investments – (continued)
July 31, 2022 (Unaudited)
| | | | | | | | |
| | | Principal
Amount | | | Value | |
Asset-Backed Securities – (continued) | | | | | | | | |
DT Auto Owner Trust, Series 2022-1A, Class C, 2.960%, 11/15/2027 (a) | | $ | 3,000,000 | | | $ | 2,887,059 | |
DT Auto Owner Trust, Series 2021-1A, Class E, 2.380%, 1/18/2028 (a) | | | 2,225,000 | | | | 2,032,270 | |
DT Auto Owner Trust, Series 2022-2, Class D, 5.460%, 3/15/2028 (a) | | | 700,000 | | | | 693,314 | |
DT Auto Owner Trust, Series 2021-4A, Class E, 3.340%, 7/17/2028 (a) | | | 3,000,000 | | | | 2,583,294 | |
DT Auto Owner Trust, Series 2021-3A, Class E, 2.650%, 9/15/2028 (a) | | | 5,250,000 | | | | 4,458,856 | |
Exeter Automobile Receivables Trust, Series 2021-4A, Class E, 4.020%, 1/17/2028 (a) | | | 7,550,000 | | | | 6,713,634 | |
Exeter Automobile Receivables Trust, Series 2021-2A, Class E, 2.900%, 7/17/2028 (a) | | | 4,000,000 | | | | 3,520,036 | |
Exeter Automobile Receivables Trust, Series 2022-1A, Class E, 5.020%, 10/15/2029 (a) | | | 2,000,000 | | | | 1,860,454 | |
Fat Brands Fazoli’s Native LLC, Series 2021-1, Class A2, 6.000%, 7/25/2051 (a) | | | 2,000,000 | | | | 1,980,458 | |
First Investors Auto Owner Trust, Series 2019-2A, Class F, 5.690%, 7/15/2026 (a) | | | 3,170,000 | | | | 3,024,925 | |
First Investors Auto Owner Trust, Series 2021-1A, Class D, 1.620%, 3/15/2027 (a) | | | 1,250,000 | | | | 1,164,090 | |
First Investors Auto Owner Trust, Series 2021-1A, Class E, 3.350%, 4/15/2027 (a) | | | 1,000,000 | | | | 914,892 | |
First Investors Auto Owner Trust, Series 2022-1A, Class E, 5.410%, 6/15/2029 (a) | | | 1,750,000 | | | | 1,632,865 | |
Flagship Credit Auto Trust, Series 2020-1, Class E, 3.520%, 6/15/2027 (a) | | | 839,000 | | | | 763,279 | |
Flagship Credit Auto Trust, Series 2020-3, Class E, 4.980%, 12/15/2027 (a) | | | 2,150,000 | | | | 2,105,860 | |
Flagship Credit Auto Trust, Series 2022-1, Class D, 3.640%, 3/15/2028 (a)(c) | | | 4,500,000 | | | | 4,241,709 | |
Flagship Credit Auto Trust, Series 2021-1, Class E, 2.720%, 4/17/2028 (a) | | | 2,600,000 | | | | 2,392,242 | |
Flagship Credit Auto Trust, Series 2020-4, Class E, 3.840%, 7/17/2028 (a) | | | 10,700,000 | | | | 10,033,936 | |
Flagship Credit Auto Trust, Series 2021-2, Class E, 3.160%, 9/15/2028 (a) | | | 4,100,000 | | | | 3,812,254 | |
Flagship Credit Auto Trust, Series 2021-4, Class E, 4.030%, 3/15/2029 (a) | | | 4,000,000 | | | | 3,620,584 | |
Flagship Credit Auto Trust, Series 2022-1, Class E, 5.370%, 6/15/2029 (a) | | | 1,500,000 | | | | 1,362,463 | |
Foundation Finance Trust, Series 2021-1A, Class A, 1.270%, 5/15/2041 (a) | | | 1,770,771 | | | | 1,639,477 | |
Foundation Finance Trust, Series 2021-1A, Class B, 1.870%, 5/15/2041 (a)(c) | | | 5,000,000 | | | | 4,504,110 | |
Foundation Finance Trust, Series 2021-2A, Class D, 5.730%, 1/15/2042 (a) | | | 1,590,000 | | | | 1,487,734 | |
Foursight Capital Automobile Receivables Trust, Series 2020-1, Class E, 3.490%, 4/15/2026 (a) | | | 1,100,000 | | | | 1,067,825 | |
Foursight Capital Automobile Receivables Trust, Series 2021-1, Class D, 1.320%, 3/15/2027 (a)(c) | | | 6,250,000 | | | | 5,932,062 | |
Foursight Capital Automobile Receivables Trust, Series 2021-1, Class E, 2.980%, 4/15/2027 (a) | | | 5,105,000 | | | | 4,784,626 | |
Foursight Capital Automobile Receivables Trust, Series 2020-1, Class F, 4.620%, 6/15/2027 (a) | | | 1,250,000 | | | | 1,253,986 | |
Foursight Capital Automobile Receivables Trust, Series 2021-2, Class E, 3.350%, 10/15/2027 (a) | | | 2,500,000 | | | | 2,326,865 | |
Foursight Capital Automobile Receivables Trust, Series 2021-2, Class F, 4.190%, 2/15/2029 (a) | | | 900,000 | | | | 848,563 | |
Foursight Capital Automobile Receivables Trust, Series 2022-1, Class E, 4.690%, 8/15/2029 (a) | | | 4,500,000 | | | | 4,183,627 | |
Foursight Capital Automobile Receivables Trust, Series 2022-2, Class D, 7.090%, 10/15/2029 (a)(d) | | | 1,300,000 | | | | 1,310,499 | |
FREED ABS Trust, Series 2021-1CP, Class C, 2.830%, 3/20/2028 (a) | | | 2,200,000 | | | | 2,158,152 | |
FREED ABS Trust, Series 2021-3FP, Class D, 2.370%, 11/20/2028 (a) | | | 2,780,000 | | | | 2,494,847 | |
FREED ABS Trust, Series 2022-3FP, Class D, 7.360%, 8/20/2029 (a) | | | 500,000 | | | | 487,944 | |
GLS Auto Receivables Issuer Trust, Series 2019-4A, Class D, 4.090%, 8/15/2026 (a) | | | 3,000,000 | | | | 2,945,340 | |
GLS Auto Receivables Issuer Trust, Series 2020-4A, Class E, 3.510%, 10/15/2027 (a) | | | 1,000,000 | | | | 957,461 | |
GLS Auto Receivables Issuer Trust, Series 2021-1A, Class E, 3.140%, 1/18/2028 (a) | | | 2,000,000 | | | | 1,884,782 | |
GLS Auto Receivables Issuer Trust, Series 2022-2, Class D, 6.150%, 4/15/2028 (a) | | | 2,800,000 | | | | 2,818,922 | |
GLS Auto Receivables Issuer Trust, Series 2021-3A, Class E, 3.200%, 10/16/2028 (a) | | | 7,500,000 | | | | 6,621,457 | |
GLS Auto Receivables Issuer Trust, Series 2021-4A, Class E, 4.430%, 10/16/2028 (a) | | | 5,000,000 | | | | 4,508,925 | |
GLS Auto Receivables Issuer Trust, Series 2021-2A, Class E, 2.870%, 5/15/2028 (a) | | | 2,000,000 | | | | 1,793,800 | |
Goldman Home Improvement Trust, Series 2021-GRN2, Class D, 4.000%, 6/25/2051 (a) | | | 2,621,000 | | | | 2,373,234 | |
Goldman Home Improvement Trust, Series 2021-GRN2, Class A, 1.150%, 6/26/2051 (a) | | | 2,593,549 | | | | 2,451,039 | |
Goldman Home Improvement Trust, Series 2021-GRN2, Class C, 2.770%, 6/26/2051 (a) | | | 9,644,000 | | | | 8,762,249 | |
Goodgreen Trust, Series 2017-2A, Class A, 3.260%, 10/15/2053 (a) | | | 4,334,257 | | | | 4,077,318 | |
See accompanying notes which are an integral part of these financial statements.
34
Angel Oak Multi-Strategy Income Fund
Consolidated Schedule of Investments – (continued)
July 31, 2022 (Unaudited)
| | | | | | | | |
| | | Principal
Amount | | | Value | |
Asset-Backed Securities – (continued) | | | | | | | | |
GoodLeap Sustainable Home Solutions Trust, Series 2021-3CS, Class A, 2.100%, 5/20/2048 (a) | | $ | 1,291,970 | | | $ | 1,134,803 | |
GoodLeap Sustainable Home Solutions Trust, Series 2021-4GS, Class A, 1.930%, 7/20/2048 (a) | | | 3,488,248 | | | | 3,028,682 | |
Helios Issuer LLC, Series 2021-B, Class A, 1.620%, 7/20/2048 (a) | | | 2,476,152 | | | | 2,154,123 | |
Hertz Vehicle Financing LLC, Series 2021-1A, Class C, 2.050%, 12/25/2025 (a) | | | 5,500,000 | | | | 5,145,013 | |
Hertz Vehicle Financing LLC, Series 2021-1A, Class D, 3.980%, 12/25/2025 (a)(c) | | | 18,000,000 | | | | 16,283,286 | |
Hertz Vehicle Financing LP, Series 2021-2A, Class D, 4.340%, 12/25/2027 (a) | | | 7,185,000 | | | | 6,399,766 | |
JP Morgan Chase Bank, Series 2020-1, Class E, 3.715%, 1/25/2028 (a) | | | 259,833 | | | | 259,273 | |
LendingClub Receivables Trust, Series 2019-7, Class R2, 0.000%, 1/15/2027 (a)(e) | | | 1,779,730 | | | | 340,507 | |
LendingClub Receivables Trust, Series 2019-7, Class R1, 0.000%, 1/15/2027 (a)(e) | | | 8,702,377 | | | | 1,664,984 | |
LendingClub Receivables Trust, Series 2019-1, Class CERT, 6.000%, 7/17/2045 (a) | | | 932,340 | | | | 5,106,012 | |
LendingClub Receivables Trust, Series 2020-6A, Class A, 2.750%, 11/15/2047 (a) | | | 872,438 | | | | 871,603 | |
Lendingpoint Asset Securitization Trust, Series 2021-B, Class B, 1.680%, 2/15/2029 (a) | | | 3,235,000 | | | | 3,091,712 | |
Lendingpoint Asset Securitization Trust, Series 2022-A, Class E, 7.020%, 6/15/2029 (a) | | | 3,320,000 | | | | 3,129,107 | |
Lendingpoint Asset Securitization Trust, Series 2022-B, Class C, 8.450%, 10/15/2029 (a) | | | 1,800,000 | | | | 1,708,760 | |
LendingPoint Asset Securitization Trust, Series 2020-REV1, Class A, 2.731%, 10/15/2028 (a) | | | 3,000,000 | | | | 2,937,222 | |
LendingPoint Asset Securitization Trust, Series 2021-B, Class C, 3.210%, 2/15/2029 (a) | | | 2,000,000 | | | | 1,902,304 | |
LendingPoint Pass-Through Trust, Series 2022-ST3, Class CERT, 0.000%, 5/15/2028 (a) | | | 1,576,000 | | | | 1,464,765 | |
LL ABS Trust, Series 2020-1A, Class C, 6.540%, 1/17/2028 (a) | | | 2,200,000 | | | | 2,188,998 | |
Marlette Funding Trust, Series 2021-1A, Class D, 2.470%, 6/16/2031 (a) | | | 3,000,000 | | | | 2,766,637 | |
Marlette Funding Trust, Series 2021-3A, Class D, 2.530%, 12/15/2031 (a) | | | 2,500,000 | | | | 2,195,270 | |
Marlette Funding Trust, Series 2022-2A, Class D, 7.500%, 8/15/2032 (a) | | | 500,000 | | | | 497,394 | |
Mercury Financial Credit Card Master Trust, Series 2021-1A, Class B, 2.330%, 3/20/2026 (a)(c) | | | 5,000,000 | | | | 4,723,925 | |
Mosaic Solar Loan Trust, Series 2019-1A, Class B, 0.000%, 12/21/2043 (a)(f) | | | 1,298,534 | | | | 1,181,374 | |
Mosaic Solar Loan Trust, Series 2021-2A, Class B, 2.090%, 4/22/2047 (a) | | | 1,127,407 | | | | 981,405 | |
Newtek Small Business Loan Trust, Series 2018-1, Class B, 5.500% (PRIME + 0.750%), 2/25/2044 (a)(b) | | | 1,292,343 | | | | 1,313,099 | |
Oportun Issuance Trust, Series 2022-A, Class C, 7.400%, 6/9/2031 (a) | | | 400,000 | | | | 394,668 | |
Pagaya AI Debt Selection Trust, Series 2021-1, Class B, 2.130%, 11/15/2027 (a)(c) | | | 9,995,879 | | | | 9,305,754 | |
Pagaya AI Debt Selection Trust, Series 2021-1, Class C, 4.090%, 11/15/2027 (a) | | | 6,197,445 | | | | 5,700,516 | |
Pagaya AI Debt Selection Trust, Series 2021-3, Class B, 1.740%, 5/15/2029 (a)(c) | | | 3,999,782 | | | | 3,756,184 | |
Pagaya AI Debt Selection Trust, Series 2021-3, Class C, 3.270%, 5/15/2029 (a) | | | 3,299,820 | | | | 2,868,643 | |
Pagaya AI Debt Selection Trust, Series 2022-1, Class B, 3.344%, 10/15/2029 (a)(c) | | | 6,000,000 | | | | 5,486,946 | |
Pagaya AI Debt Selection Trust, Series 2022-1, Class C, 4.888%, 10/15/2029 (a) | | | 7,100,000 | | | | 6,582,786 | |
Santander Bank Auto Credit-Linked Notes Series, Series 2022-A, Class B, 5.281%, 5/17/2032 (a) | | | 1,449,849 | | | | 1,432,368 | |
Santander Consumer Auto Receivables Trust, Series 2021-AA, Class E, 3.280%, 3/15/2027 (a) | | | 1,750,000 | | | | 1,548,300 | |
Santander Consumer Auto Receivables Trust, Series 2021-AA, Class F, 5.790%, 8/15/2028 (a) | | | 500,000 | | | | 461,594 | |
Santander Consumer Auto Receivables Trust, Series 2020-BA, Class F, 7.030%, 8/15/2028 (a) | | | 1,900,000 | | | | 1,901,930 | |
Santander Retail Auto Lease Trust, Series 2021-C, Class D, 1.390%, 8/20/2026 (a) | | | 4,000,000 | | | | 3,812,936 | |
Stone Street Receivables Funding LLC, Series 2015-1A, Class C, 5.600%, 12/15/2054 (a) | | | 682,096 | | | | 614,649 | |
Tesla Auto Lease Trust, Series 2021-A, Class E, 2.640%, 3/20/2025 (a) | | | 3,350,000 | | | | 3,149,037 | |
Theorem Funding Trust, Series 2020-1A, Class C, 6.250%, 10/15/2026 (a) | | | 1,000,000 | | | | 999,100 | |
Theorem Funding Trust, Series 2022-2A, Class B, 9.270%, 12/15/2028 (a) | | | 3,700,000 | | | | 3,729,230 | |
Tricolor Auto Securitization Trust, Series 2022-1A, Class F, 9.800%, 7/16/2029 (a) | | | 2,520,000 | | | | 2,513,725 | |
U.S. Auto Funding Trust, Series 2020-1A, Class D, 9.350%, 3/15/2027 (a) | | | 6,700,000 | | | | 6,742,143 | |
UNIFY Auto Receivables Trust, Series 2021-1A, Class B, 1.290%, 11/16/2026 (a) | | | 5,000,000 | | | | 4,726,355 | |
United Auto Credit Securitization Trust, Series 2022-2, Class B, 5.410%, 12/10/2025 (a) | | | 2,500,000 | | | | 2,498,918 | |
United Auto Credit Securitization Trust, Series 2021-1, Class E, 2.580%, 6/10/2026 (a) | | | 5,700,000 | | | | 5,511,991 | |
United Auto Credit Securitization Trust, Series 2021-1, Class F, 4.300%, 9/10/2027 (a) | | | 1,035,000 | | | | 965,214 | |
Upgrade Master Pass-Thru Trust, Series 2019-ST3, Class A, 3.750%, 11/15/2025 (a) | | | 923,747 | | | | 925,455 | |
See accompanying notes which are an integral part of these financial statements.
35
Angel Oak Multi-Strategy Income Fund
Consolidated Schedule of Investments – (continued)
July 31, 2022 (Unaudited)
| | | | | | | | |
| | | Principal
Amount | | | Value | |
Asset-Backed Securities – (continued) | | | | | | | | |
Upgrade Master Pass-Thru Trust, Series 2019-ST4, Class A, 3.750%, 12/15/2025 (a) | | $ | 428,087 | | | $ | 429,047 | |
Upgrade Master Pass-Thru Trust, Series 2019-ST5, Class A, 3.750%, 1/15/2026 (a) | | | 331,002 | | | | 331,621 | |
Upgrade Master Pass-Thru Trust, Series 2021-PT2, Class A, 4.971%, 5/15/2027 (a)(g) | | | 11,776,010 | | | | 11,526,912 | |
Upstart Pass-Through Trust, Series 2020-ST4, Class CERT, 0.000%, 11/20/2026 (a)(e) | | | 3,500,000 | | | | 1,463,995 | |
Upstart Pass-Through Trust, Series 2021-ST3, Class A, 2.000%, 5/20/2027 (a) | | | 1,653,728 | | | | 1,597,960 | |
Upstart Pass-Through Trust, Series 2021-ST4, Class CERT, 0.000%, 7/20/2027 (a)(e) | | | 1,475,000 | | | | 940,104 | |
Upstart Pass-Through Trust, Series 2021-ST4, Class A, 2.000%, 7/20/2027 (a) | | | 2,716,037 | | | | 2,578,951 | |
Upstart Pass-Through Trust, Series 2021-ST6, Class CERT, 9.000%, 8/20/2027 (a)(e) | | | 5,450,000 | | | | 3,453,619 | |
Upstart Pass-Through Trust, Series 2021-ST7, Class CERT, 6.500%, 9/20/2029 (a)(e) | | | 1,500,000 | | | | 1,025,862 | |
Upstart Pass-Through Trust, Series 2021-ST8, Class CERT, 6.500%, 10/20/2029 (a)(e) | | | 2,370,000 | | | | 1,466,577 | |
Upstart Pass-Through Trust, Series 2021-ST9, Class CERT, 4.500%, 11/20/2029 (a)(e) | | | 1,629,000 | | | | 930,628 | |
Upstart Pass-Through Trust, Series 2022-ST1, Class CERT, 0.000%, 3/20/2030 (a) | | | 2,400,000 | | | | 1,827,759 | |
Upstart Pass-Through Trust, Series 2022-ST2, Class CERT, 0.000%, 4/20/2030 (a) | | | 1,500,000 | | | | 1,214,367 | |
Upstart Securitization Trust, Series 2019-1, Class CERT, 0.000%, 4/20/2026 (a) | | | 20,143 | | | | 1,214,554 | |
Upstart Securitization Trust, Series 2019-3, Class CERT, 6.500%, 1/21/2030 (a)(h) | | | 17,192 | | | | 2,511,308 | |
Upstart Securitization Trust, Series 2020-3, Class C, 6.250%, 11/20/2030 (a)(c) | | | 10,427,000 | | | | 10,277,008 | |
Upstart Securitization Trust, Series 2021-1, Class C, 4.060%, 3/20/2031 (a)(c) | | | 8,600,000 | | | | 7,988,626 | |
Upstart Securitization Trust, Series 2021-2, Class C, 3.610%, 6/20/2031 (a) | | | 5,500,000 | | | | 5,159,776 | |
Upstart Securitization Trust, Series 2021-3, Class C, 3.280%, 7/20/2031 (a) | | | 7,750,000 | | | | 7,152,638 | |
Upstart Securitization Trust, Series 2021-4, Class C, 3.190%, 9/20/2031 (a) | | | 5,250,000 | | | | 4,805,126 | |
Upstart Securitization Trust, Series 2021-5, Class B, 2.490%, 11/20/2031 (a) | | | 3,000,000 | | | | 2,786,283 | |
Upstart Securitization Trust, Series 2021-5, Class C, 4.150%, 11/20/2031 (a) | | | 9,400,000 | | | | 8,599,919 | |
Upstart Securitization Trust, Series 2022-2, Class C, 8.430%, 5/20/2032 (a) | | | 1,500,000 | | | | 1,448,100 | |
US Auto Funding Trust, Series 2022-1A, Class B, 5.130%, 12/15/2025 (a) | | | 1,300,000 | | | | 1,265,510 | |
US Auto Funding Trust, Series 2022-1A, Class D, 9.140%, 7/15/2027 (a) | | | 1,000,000 | | | | 970,033 | |
Veros Auto Receivables Trust, Series 2022-1, Class D, 7.230%, 7/16/2029 (a) | | | 500,000 | | | | 497,291 | |
Veros Automobile Receivables Trust, Series 2020-1, Class C, 2.990%, 6/15/2025 (a) | | | 2,410,000 | | | | 2,381,415 | |
Veros Automobile Receivables Trust, Series 2020-1, Class D, 5.640%, 2/15/2027 (a) | | | 6,755,000 | | | | 6,478,727 | |
Westlake Automobile Receivables Trust, Series 2019-3A, Class F, 4.720%, 4/15/2026 (a) | | | 5,000,000 | | | | 4,961,710 | |
Westlake Automobile Receivables Trust, Series 2020-3A, Class F, 5.110%, 5/17/2027 (a)(c) | | | 8,750,000 | | | | 8,196,414 | |
Westlake Automobile Receivables Trust, Series 2021-1A, Class F, 3.910%, 9/15/2027 (a) | | | 4,000,000 | | | | 3,652,060 | |
Westlake Automobile Receivables Trust, Series 2021-3A, Class F, 4.250%, 6/15/2028 (a) | | | 3,000,000 | | | | 2,672,853 | |
| | | | | | | | |
| | |
TOTAL ASSET-BACKED SECURITIES
(Cost – $613,031,757) | | | | | | | $561,697,630 | |
| | | | | | | | |
Collateralized Debt Obligations – 0.36% | | | | | | | | |
Anchorage Credit Funding Ltd., Series 2020-11A, Class E, 7.050%, 4/25/2038 (a) | | | 3,500,000 | | | | 2,906,043 | |
Hildene TruPS Financials Note Securitization Ltd., Series 2018-1A, Class A1, 3.788% (3 Month LIBOR USD + 1.360%), 10/12/2038 (a)(b)(e) | | | 4,288,206 | | | | 4,266,765 | |
Hildene TruPS Financials Note Securitization Ltd., Series 2018-1A, Class B, 6.468% (3 Month LIBOR USD + 4.040%), 10/12/2038 (a)(b)(e) | | | 3,400,000 | | | | 3,298,000 | |
Hildene TruPS Financials Note Securitization Ltd., Series 2019-2A, Class A1, 3.265% (3 Month LIBOR USD + 1.760%), 5/23/2039 (a)(b)(e) | | | 3,580,373 | | | | 3,508,765 | |
Hildene TruPS Financials Note Securitization Ltd., Series 2019-2A, Class A2, 3.955% (3 Month LIBOR USD + 2.450%), 5/23/2039 (a)(b)(e) | | | 4,000,000 | | | | 3,990,000 | |
| | | | | | | | |
| | |
TOTAL COLLATERALIZED DEBT OBLIGATIONS
(Cost – $18,560,121) | | | | | | | $17,969,573 | |
| | | | | | | | |
See accompanying notes which are an integral part of these financial statements.
36
Angel Oak Multi-Strategy Income Fund
Consolidated Schedule of Investments – (continued)
July 31, 2022 (Unaudited)
| | | | | | | | |
| | | Principal
Amount | | | Value | |
Collateralized Loan Obligations – 3.61% | | | | | | | | |
ABPCI Direct Lending Fund CLO Ltd., Series 2017-1A, Class ER,
10.310% (3 Month LIBOR USD + 7.600%), 4/20/2032 (a)(b)(e) | | $ | 1,750,000 | | | $ | 1,564,435 | |
AIMCO CLO Ltd., Series 2017-AA, Class SUB, 0.000%, 7/20/2029 (a)(e)(g) | | | 4,350,000 | | | | 2,610,000 | |
Allegro CLO Ltd., Series 2014-1RX, Class SUB, 13.000%, 10/21/2028 (e)(g)(i) | | | 4,000,000 | | | | 400,000 | |
ALM CLO Ltd., Series 2020-1A, Class SUB, 0.000%, 10/15/2029 (a)(e)(g) | | | 6,000,000 | | | | 3,660,000 | |
Apidos CLO Warehouse, Series 2020-33A, Class SUB, 0.000%, 7/24/2031 (a)(e)(g) | | | 2,000,000 | | | | 1,360,000 | |
Apidos CLO Warehouse, Series 2021-38A, Class SUB, 0.000%, 1/23/2034 (a)(e)(g) | | | 3,000,000 | | | | 2,010,000 | |
Ares CLO Ltd., Series 2015-4A, Class SUB, 0.000%, 10/15/2026 (a)(e)(g) | | | 3,000,000 | | | | 750,000 | |
Babson CLO Ltd., Series 2016-1A, Class ER,
8.783% (3 Month LIBOR USD + 6.000%), 7/23/2030 (a)(b)(j) | | | 4,300,000 | | | | 3,492,043 | |
Barings CLO Ltd., Series 2018-2A, Class SUB, 0.000%, 4/15/2030 (a)(e)(g) | | | 5,000,000 | | | | 2,350,000 | |
Barings CLO Ltd., Series 2015-2A, Class DR,
5.660% (3 Month LIBOR USD + 2.950%), 10/21/2030 (a)(b) | | | 1,250,000 | | | | 1,163,025 | |
Barings CLO Ltd., Series 2019-3A, Class ER,
9.410% (3 Month LIBOR USD + 6.700%), 4/21/2031 (a)(b) | | | 3,000,000 | | | | 2,684,694 | |
Barings CLO Ltd., Series 2021-2A, Class SUB, 0.000%, 7/15/2034 (a)(e)(g) | | | 5,000,000 | | | | 3,500,000 | |
Barings Middle Market CLO Ltd., Series 2018-II, Class COM, 0.000%, 1/15/2031 (e)(g) | | | 1,500,000 | | | | 1,210,030 | |
Barings Middle Market CLO Ltd., Series 2021-IA, Class D,
11.360% (3 Month LIBOR USD + 8.650%), 7/20/2033 (a)(b)(e) | | | 1,000,000 | | | | 884,472 | |
Carlyle CLO Ltd., Series 2017-3A, Class SUB, 0.000%, 7/20/2029 (a)(e)(g) | | | 5,525,000 | | | | 1,712,750 | |
Cedar Funding CLO Ltd., Series 2016-6A, Class SUB, 0.000%, 10/20/2028 (a)(e)(g) | | | 3,000,000 | | | | 1,980,000 | |
CIFC Funding Ltd., Series 2015-2X, Class INC, 0.000%, 4/15/2030 (e)(g)(i) | | | 5,000,000 | | | | 1,850,000 | |
East West Investment Management CLO Ltd., Series 2019-FAL, Class D,
7.420% (3 Month LIBOR USD + 4.710%), 1/20/2033 (a)(b) | | | 5,000,000 | | | | 4,822,340 | |
Eaton Vance CLO Ltd., Series 2019-1A, Class SUB, 0.000%, 4/15/2031 (a)(e)(g) | | | 5,000,000 | | | | 3,400,000 | |
First Eagle Commercial Loan Funding LLC, Series 2016-1A, Class CR,
7.783% (3 Month LIBOR USD + 5.000%), 1/26/2032 (a)(b)(c) | | | 10,500,000 | | | | 10,411,905 | |
Garrison Funding Ltd., Series 2018-2RA, Class BR,
4.648% (3 Month LIBOR USD + 3.170%), 11/20/2029 (a)(b) | | | 4,500,000 | | | | 4,326,728 | |
Generate CLO Ltd, Series 2A, Class SUB, 0.000%, 10/22/2027 (a)(e)(g) | | | 4,000,000 | | | | 1,640,000 | |
Generate CLO Ltd, Series 4A, Class SUB, 0.000%, 1/22/2030 (a)(e)(g) | | | 5,500,000 | | | | 2,530,000 | |
Great Lakes CLO Ltd., Series 2021-5A, Class E,
10.012% (3 Month LIBOR USD + 7.500%), 4/15/2033 (a)(b)(c)(e) | | | 9,950,000 | | | | 8,570,751 | |
ICG US CLO Ltd., Series 2020-1A, Class SUB, 0.000%, 10/22/2031 (a)(e)(g) | | | 1,000,000 | | | | 590,000 | |
ICG US CLO Ltd., Series 2021-1A, Class E,
9.070% (3 Month LIBOR USD + 6.330%), 4/17/2034 (a)(b) | | | 2,000,000 | | | | 1,789,010 | |
Jay Park CLO Ltd., Series 2016-1X, Class SUB, 0.000%, 10/20/2027 (e)(g)(i) | | | 4,000,000 | | | | 1,280,000 | |
LCM Ltd., Series 33A, Class INC, 0.000%, 7/20/2034 (a)(e)(g) | | | 4,800,000 | | | | 3,264,000 | |
Marble Point CLO Ltd., Series 2020-1A, Class SUB, 0.000%, 4/20/2033 (a)(e)(g) | | | 2,600,000 | | | | 1,534,000 | |
Marble Point CLO Ltd., Series 2021-2A, Class INC, 0.000%, 7/25/2050 (a)(e)(g) | | | 2,500,000 | | | | 1,250,000 | |
Marble Point CLO Ltd., Series 2021-3A, Class INC, 0.000%, 10/17/2051 (a)(e)(g) | | | 3,000,000 | | | | 1,860,000 | |
MCF CLO LLC, Series 2017-3A, Class ER,
11.860% (3 Month LIBOR USD + 9.150%), 7/20/2033 (a)(b)(e) | | | 3,000,000 | | | | 2,744,118 | |
Monroe Capital MML CLO Ltd., Series 2018-2A, Class E,
8.755% (3 Month LIBOR USD + 7.250%), 11/22/2030 (a)(b)(e) | | | 5,150,000 | | | | 4,716,854 | |
Monroe Capital MML CLO Ltd., Series 2019-2A, Class D,
7.759% (3 Month LIBOR USD + 5.000%), 10/22/2031 (a)(b) | | | 700,000 | | | | 668,086 | |
Monroe Capital MML CLO Ltd., Series 2021-1A, Class E,
10.018% (3 Month LIBOR USD + 8.540%), 5/20/2033 (a)(b)(e) | | | 3,486,461 | | | | 3,136,609 | |
See accompanying notes which are an integral part of these financial statements.
37
Angel Oak Multi-Strategy Income Fund
Consolidated Schedule of Investments – (continued)
July 31, 2022 (Unaudited)
| | | | | | | | |
| | | Principal
Amount | | | Value | |
Collateralized Loan Obligations – (continued) | | | | | | | | |
Monroe Capital MML CLO Ltd., Series 2019-1A, Class ER,
9.865% (3 Month LIBOR USD + 8.360%), 11/22/2033 (a)(b)(e) | | $ | 4,440,822 | | | $ | 3,938,849 | |
Northwoods Capital Ltd., Series 2018-17A, Class SUB, 0.000%, 4/22/2031 (a)(e)(g) | | | 2,650,000 | | | | 1,404,500 | |
Oaktree CLO Ltd., Series 2019-4A, Class SUB, 0.000%, 10/20/2032 (a)(e)(g) | | | 3,500,000 | | | | 2,275,000 | |
Oaktree CLO Ltd., Series 2021-1A, Class SUB, 0.000%, 7/17/2034 (a)(e)(g) | | | 10,000,000 | | | | 6,650,000 | |
OCP CLO Ltd., Series 2021-21A, Class SUB, 0.000%, 7/20/2034 (a)(e)(g) | | | 3,000,000 | | | | 1,980,000 | |
OCP CLO Ltd., Series 2021-22A, Class SUB, 0.000%, 12/4/2034 (a)(e)(g) | | | 3,000,000 | | | | 2,175,000 | |
Octagon Investment Partners Ltd., Series 2018-18A, Class SUB, 0.000%, 12/16/2024 (a)(e)(g) | | | 4,000,000 | | | | 760,000 | |
OZLM Ltd., Series 2017-17A, Class SUB, 0.000%, 7/22/2030 (a)(e)(g) | | | 7,000,000 | | | | 1,890,000 | |
PPM CLO Ltd., Series 2020-4A, Class SUB, 0.190%, 10/20/2031 (a)(e)(g) | | | 2,500,000 | | | | 1,650,000 | |
Race Point CLO Ltd., Series 2013-8X, Class ER,
8.328% (3 Month LIBOR USD + 6.850%), 2/20/2030 (b)(i) | | | 2,500,000 | | | | 1,945,820 | |
Regatta Funding Ltd., Series 2017-3A, Class SUB, 0.000%, 1/17/2031 (a)(e)(g) | | | 2,500,000 | | | | 1,175,000 | |
Regatta Funding Ltd., Series 2021-5A, Class SUB, 0.000%, 1/22/2035 (a)(e)(g) | | | 3,000,000 | | | | 1,920,000 | |
Rockford Tower CLO Ltd., Series 2019-1A, Class SUB, 0.000%, 4/20/2032 (a)(e)(g) | | | 2,500,000 | | | | 1,725,000 | |
Rockford Tower CLO Ltd., Series 2019-1A, Class ER,
9.030% (3 Month LIBOR USD + 6.320%), 4/20/2034 (a)(b)(c) | | | 5,000,000 | | | | 4,360,400 | |
RR Ltd., Series 2018-5A, Class SUB, 0.000%, 10/15/2031 (a)(e)(g) | | | 4,000,000 | | | | 2,120,000 | |
RR Ltd., Series 2019-6A, Class DR,
8.362% (3 Month LIBOR USD + 5.850%), 4/15/2036 (a)(b)(j) | | | 2,000,000 | | | | 1,749,314 | |
Saranac CLO Ltd., Series 2020-8A, Class E,
9.598% (3 Month LIBOR USD + 8.120%), 2/22/2033 (a)(b)(c) | | | 5,250,000 | | | | 4,365,160 | |
Sound Point CLO Ltd., Series 2013-1A, Class A3R,
4.616% (3 Month LIBOR USD + 1.850%), 1/27/2031 (a)(b) | | | 400,000 | | | | 370,344 | |
Sound Point CLO Ltd., Series 2017-3A, Class D,
9.210% (3 Month LIBOR USD + 6.500%), 10/21/2030 (a)(b)(c) | | | 3,800,000 | | | | 3,210,145 | |
Sound Point CLO Ltd., Series 2014-1RA, Class E,
8.840% (3 Month LIBOR USD + 6.100%), 7/18/2031 (a)(b)(c) | | | 4,500,000 | | | | 3,661,826 | |
Steele Creek CLO Ltd., Series 2016-1A, Class CR,
3.729% (3 Month LIBOR USD + 1.900%), 6/16/2031 (a)(b)(j) | | | 17,756,577 | | | | 16,672,662 | |
Stewart Park CLO Ltd., Series 2015-1A, Class ER,
7.792% (3 Month LIBOR USD + 5.280%), 1/15/2030 (a)(b)(c) | | | 5,250,000 | | | | 4,423,592 | |
Strata CLO Ltd., Series 2021-1A, Class SUB, 0.000%, 10/20/2033 (a)(e)(g) | | | 3,000,000 | | | | 1,980,000 | |
TCP Whitney CLO Ltd., Series 2017-1A, Class ER,
9.638% (3 Month LIBOR USD + 8.160%), 8/22/2033 (a)(b)(c)(e) | | | 4,000,000 | | | | 3,525,556 | |
TCW CLO Ltd., Series 2021-1A, Class SUB, 0.000%, 3/20/2034 (a)(e)(g) | | | 5,000,000 | | | | 3,150,000 | |
THL Credit Wind River CLO Ltd., Series 2019-3A, Class E2R,
9.262% (3 Month LIBOR USD + 6.750%), 7/15/2031 (a)(b) | | | 1,500,000 | | | | 1,336,937 | |
Trinitas CLO Ltd., Series 2017-6A, Class ER,
9.599% (3 Month LIBOR USD + 6.816%), 1/25/2034 (a)(b)(j) | | | 2,850,000 | | | | 2,502,776 | |
Vibrant CLO Ltd., Series 2021-12A, Class SUB, 0.000%, 1/20/2034 (a)(e)(g) | | | 4,350,000 | | | | 2,675,250 | |
Voya CLO Ltd., Series 2019-1A, Class SUB, 0.000%, 4/16/2029 (a)(e)(g) | | | 4,900,000 | | | | 2,793,000 | |
Wellfleet CLO Ltd., Series 2015-1A, Class SUB, 0.000%, 10/20/2027 (a)(e)(g) | | | 4,900,000 | | | | 1,568,000 | |
| | | | | | | | |
| | |
TOTAL COLLATERALIZED LOAN OBLIGATIONS
(Cost – $223,978,043) | | | | | | | $181,669,981 | |
| | | | | | | | |
Commercial Mortgage-Backed Securities – 2.44% | | | | | | | | |
BBCMS Mortgage Trust, Series 2020-C7, Class A5, 2.037%, 4/17/2053 | | | 5,000,000 | | | | 4,403,215 | |
See accompanying notes which are an integral part of these financial statements.
38
Angel Oak Multi-Strategy Income Fund
Consolidated Schedule of Investments – (continued)
July 31, 2022 (Unaudited)
| | | | | | | | |
| | | Principal
Amount | | | Value | |
Commercial Mortgage-Backed Securities – (continued) | | | | | | | | |
BX Commercial Mortgage Trust, Series 2021-VOLT, Class G,
4.849% (1 Month LIBOR USD + 2.850%), 9/15/2036 (a)(b) | | $ | 3,000,000 | | | $ | 2,781,804 | |
Capital Funding Mortgage Trust, Series 2020-9, Class B,
16.613% (1 Month LIBOR USD + 14.900%), 11/28/2022 (a)(b) | | | 4,750,000 | | | | 4,683,282 | |
Capital Funding Mortgage Trust, Series 2021-19, Class B,
16.920% (1 Month LIBOR USD + 15.210%), 11/6/2023 (a)(b) | | | 4,825,000 | | | | 4,728,312 | |
Commercial Mortgage Trust, Series 2020-SBX, Class A, 1.670%, 1/10/2038 (a) | | | 500,000 | | | | 467,989 | |
Commercial Mortgage Trust, Series 2013-CR8, Class ASFL,
2.640% (1 Month LIBOR USD + 0.740%), 6/12/2046 (a)(b) | | | 664,580 | | | | 662,003 | |
Greystone CRE Notes Ltd., Series 2021-HC2, Class C,
5.323% (TSFR1M + 3.364%), 12/15/2039 (a)(b)(e) | | | 3,000,000 | | | | 2,880,555 | |
Greystone CRE Notes Ltd., Series 2021-HC2, Class D,
6.073% (TSFR1M + 4.114%), 12/15/2039 (a)(b)(e) | | | 750,000 | | | | 711,154 | |
GS Mortgage Securities Corp. Trust, Series 2018-TWR, Class G,
6.174% (1 Month LIBOR USD + 3.925%), 7/15/2031 (a)(b) | | | 500,000 | | | | 447,384 | |
Harvest SBA Loan Trust, Series 2018-1, Class A,
3.874% (1 Month LIBOR USD + 2.250%), 9/26/2044 (a)(b) | | | 1,064,277 | | | | 1,046,078 | |
JP Morgan Chase Commercial Mortgage Securities Trust, Series 2018-PTC, Class A,
3.449% (1 Month LIBOR USD + 1.450%), 4/15/2031 (a)(b)(j) | | | 3,500,000 | | | | 3,363,021 | |
JP Morgan Chase Commercial Mortgage Securities Trust, Series 2021-NYAH, Class H,
5.389% (1 Month LIBOR USD + 3.390%), 6/15/2038 (a)(b) | | | 5,000,000 | | | | 4,514,445 | |
Med Trust, Series 2021-MDLN, Class F,
6.000% (1 Month LIBOR USD + 4.000%), 11/15/2038 (a)(b) | | | 3,500,000 | | | | 3,199,091 | |
Med Trust, Series 2021-MDLN, Class G,
7.250% (1 Month LIBOR USD + 5.250%), 11/15/2038 (a)(b) | | | 2,155,000 | | | | 2,014,561 | |
Morgan Stanley Bank of America Merrill Lynch Trust, Series 2013-C7, Class G, 4.208%, 2/16/2046 (a)(e)(g) | | | 1,000,000 | | | | 87,330 | |
SLG Office Trust, Series 2021-OVA, Class A, 2.585%, 7/17/2041 (a) | | | 500,000 | | | | 441,086 | |
SMR Mortgage Trust, Series 2022-IND, Class D,
5.909% (TSFR1M + 3.950%), 2/15/2039 (a)(b) | | | 2,170,329 | | | | 2,030,520 | |
Sutherland Commercial Mortgage Loans, Series 2017-SBC6, Class A, 3.192%, 4/25/2023 (a)(g) | | | 117,329 | | | | 117,088 | |
Sutherland Commercial Mortgage Loans, Series 2017-SBC6, Class B, 5.031%, 6/25/2024 (a)(g) | | | 7,000,000 | | | | 6,855,940 | |
X-Caliber Funding LLC, Series 2021-MSN5, Class B1, 7.000%, 9/15/2022 (a) | | | 3,649,728 | | | | 3,620,428 | |
X-Caliber Funding LLC, Series 2021-MI3, Class B1,
8.713% (1 Month LIBOR USD + 7.000%), 4/17/2023 (a)(b) | | | 2,200,000 | | | | 2,122,958 | |
X-Caliber Funding LLC, Series 2021-GA5, Class B1,
8.713% (1 Month LIBOR USD + 7.000%), 6/15/2023 (a)(b) | | | 1,025,000 | | | | 998,220 | |
X-Caliber Funding LLC, 12.000%, 8/15/2023 (a)(g) | | | 5,615,000 | | | | 5,571,225 | |
X-Caliber Funding LLC, 5.000% (TSFR1M + 2.750%), 3/15/2024 (a)(b) | | | 4,532,394 | | | | 4,426,952 | |
X-Caliber Funding LLC, 10.000% (TSFR1M + 7.750%), 3/15/2024 (a)(b) | | | 849,824 | | | | 837,547 | |
X-Caliber Funding LLC, 5.000%, 10/15/2024 (a) | | | 300,000 | | | | 283,898 | |
X-Caliber Funding LLC, 8.713% (1 Month LIBOR USD + 7.000%), 10/15/2024 (a)(b) | | | 4,125,000 | | | | 4,107,774 | |
X-Caliber Funding LLC, 11.000%, 10/15/2024 (a) | | | 4,000,000 | | | | 3,844,856 | |
X-Caliber Funding LLC, 17.800%, 10/15/2024 (a)(g) | | | 900,000 | | | | 873,324 | |
X-Caliber Funding LLC, 8.213% (1 Month LIBOR USD + 6.500%), 11/6/2024 (a)(b) | | | 1,628,000 | | | | 1,627,082 | |
X-Caliber Funding LLC, Series 2021-7, Class B2, 0.000%, 1/6/2026 (a) | | | 1,788,000 | | | | 1,803,663 | |
X-Caliber Funding LLC, Series 2021-CT6, Class B2, 5.250%, 1/6/2026 (a) | | | 2,180,000 | | | | 2,137,263 | |
X-Caliber Funding LLC, Series 2021-CT6, Class B1,
7.713% (1 Month LIBOR USD + 6.000%), 1/6/2026 (a)(b) | | | 9,375,000 | | | | 8,928,506 | |
See accompanying notes which are an integral part of these financial statements.
39
Angel Oak Multi-Strategy Income Fund
Consolidated Schedule of Investments – (continued)
July 31, 2022 (Unaudited)
| | | | | | | | |
| | | Principal
Amount | | | Value | |
Commercial Mortgage-Backed Securities – (continued) | | | | | | | | |
X-Caliber Funding LLC, Series 2021-7, Class A,
4.713% (1 Month LIBOR USD + 3.000%), 1/15/2026 (a)(b) | | $ | 3,950,000 | | | $ | 3,818,406 | |
X-Caliber Funding LLC, Series 2021-7, Class B1,
7.713% (1 Month LIBOR USD + 6.000%), 1/15/2026 (a)(b) | | | 165,000 | | | | 157,147 | |
X-Caliber Mortgage Trust, Series 2019-1, Class B1,
16.290% (1 Month LIBOR USD + 14.140%), 11/6/2022 (a)(b) | | | 5,129,931 | | | | 5,056,306 | |
X-Caliber Mortgage Trust, Series 2020-1, Class B1,
9.213% (1 Month LIBOR USD + 7.500%), 2/15/2023 (a)(b) | | | 2,700,000 | | | | 2,593,617 | |
X-Caliber Mortgage Trust, Series 2020-2, Class B1,
9.550% (1 Month LIBOR USD + 7.500%), 2/15/2023 (a)(b) | | | 7,000,000 | | | | 6,719,804 | |
X-Caliber Mortgage Trust, Series 2021-CT2, Class B1,
8.463% (1 Month LIBOR USD + 6.750%), 4/6/2023 (a)(b) | | | 1,237,000 | | | | 1,200,189 | |
X-Caliber Mortgage Trust, Series 2020-5, Class A,
4.963% (1 Month LIBOR USD + 3.250%), 10/16/2023 (a)(b) | | | 5,000,000 | | | | 4,859,605 | |
X-Caliber Mortgage Trust, Series 2020-5, Class B1,
9.963% (1 Month LIBOR USD + 8.250%), 10/16/2023 (a)(b) | | | 7,000,000 | | | | 6,703,725 | |
X-Caliber Mortgage Trust, Series 2021-9, Class B1,
9.713% (1 Month LIBOR USD + 8.000%), 3/15/2024 (a)(b) | | | 1,215,000 | | | | 1,177,177 | |
X-Caliber Mortgage Trust, Series 2021-WY4, Class B1,
9.713% (1 Month LIBOR USD + 8.000%), 5/6/2024 (a)(b) | | | 2,020,000 | | | | 1,950,009 | |
X-Caliber Mortgage Trust, Series 2021-10, Class B1,
9.713% (1 Month LIBOR USD + 8.000%), 6/17/2024 (a)(b) | | | 2,000,000 | | | | 1,936,188 | |
| | | | | | | | |
| | |
TOTAL COMMERCIAL MORTGAGE-BACKED SECURITIES
(Cost – $128,461,487) | | | | | | | $122,790,727 | |
| | | | | | | | |
Commercial Mortgage-Backed Securities – U.S. Government Agency – 4.78% | | | | | | | | |
Federal Home Loan Mortgage Corp., Series 2016-KF25, Class B,
6.787% (1 Month LIBOR USD + 5.000%), 10/25/2023 (a)(b) | | | 130,091 | | | | 128,519 | |
Federal Home Loan Mortgage Corp., Series 2020-KI05, Class B,
4.087% (1 Month LIBOR USD + 2.300%), 7/25/2024 (a)(b) | | | 2,312,743 | | | | 2,263,639 | |
Federal Home Loan Mortgage Corp., Series 2017-KF34, Class B,
4.487% (1 Month LIBOR USD + 2.700%), 8/25/2024 (a)(b) | | | 739,953 | | | | 733,071 | |
Federal Home Loan Mortgage Corp., Series 2017-KF35, Class B,
4.537% (1 Month LIBOR USD + 2.750%), 8/25/2024 (a)(b) | | | 2,063,287 | | | | 1,985,426 | |
Federal Home Loan Mortgage Corp., Series 2017-KF41, Class B,
4.287% (1 Month LIBOR USD + 2.500%), 11/25/2024 (a)(b) | | | 640,882 | | | | 592,305 | |
Federal Home Loan Mortgage Corp., Series 2019-KF58, Class B,
3.937% (1 Month LIBOR USD + 2.150%), 1/25/2026 (a)(b) | | | 1,182,007 | | | | 1,121,081 | |
Federal Home Loan Mortgage Corp., Series K F16, Class A,
2.417% (1 Month LIBOR USD + 0.630%), 3/25/2026 (b) | | | 959 | | | | 955 | |
Federal Home Loan Mortgage Corp., Series 2019-KF64, Class B,
4.087% (1 Month LIBOR USD + 2.300%), 6/25/2026 (a)(b) | | | 2,487,563 | | | | 2,387,824 | |
Federal Home Loan Mortgage Corp., Series K-F74, Class AL,
2.227% (1 Month LIBOR USD + 0.440%), 1/25/2027 (b) | | | 578,789 | | | | 576,540 | |
Federal Home Loan Mortgage Corp., Series 2020-KF74, Class B,
3.937% (1 Month LIBOR USD + 2.150%), 1/25/2027 (a)(b) | | | 2,315,155 | | | | 2,162,459 | |
Federal Home Loan Mortgage Corp., Series 2017-KSW3, Class B,
4.537% (1 Month LIBOR USD + 2.750%), 5/25/2027 (a)(b) | | | 2,154,651 | | | | 2,013,161 | |
See accompanying notes which are an integral part of these financial statements.
40
Angel Oak Multi-Strategy Income Fund
Consolidated Schedule of Investments – (continued)
July 31, 2022 (Unaudited)
| | | | | | | | |
| | | Principal
Amount | | | Value | |
Commercial Mortgage-Backed Securities – U.S. Government Agency – (continued) | | | | | | | | |
Federal Home Loan Mortgage Corp., Series 2017-KF33, Class B,
4.337% (1 Month LIBOR USD + 2.550%), 6/25/2027 (a)(b) | | $ | 921,939 | | | $ | 884,756 | |
Federal Home Loan Mortgage Corp., Series K-739, Class A2, 1.336%, 9/25/2027 | | | 12,000,000 | | | | 10,986,828 | |
Federal Home Loan Mortgage Corp., Series K-740, Class A2, 1.470%, 9/25/2027 | | | 22,000,000 | | | | 20,216,966 | |
Federal Home Loan Mortgage Corp., Series 2018-KF50, Class B,
3.687% (1 Month LIBOR USD + 1.900%), 7/25/2028 (a)(b) | | | 1,860,398 | | | | 1,679,305 | |
Federal Home Loan Mortgage Corp., Series 2018-KW07, Class B, 4.083%, 9/25/2028 (a)(g) | | | 2,250,000 | | | | 2,123,523 | |
Federal Home Loan Mortgage Corp., Series K-G02, Class A1, 2.044%, 11/25/2028 | | | 1,205,384 | | | | 1,154,849 | |
Federal Home Loan Mortgage Corp., Series 2018-KF54, Class B,
3.987% (1 Month LIBOR USD + 2.200%), 11/25/2028 (b) | | | 4,420,492 | | | | 4,235,234 | |
Federal Home Loan Mortgage Corp., Series 2019-KF61, Class B,
3.987% (1 Month LIBOR USD + 2.200%), 3/25/2029 (a)(b) | | | 1,162,979 | | | | 1,112,115 | |
Federal Home Loan Mortgage Corp., Series 2019-KG02, Class B, 3.682%, 8/25/2029 (a)(g) | | | 6,000,000 | | | | 5,474,148 | |
Federal Home Loan Mortgage Corp., Series 2020-KF76, Class B,
4.537% (1 Month LIBOR USD + 2.750%), 1/25/2030 (a)(b) | | | 4,596,063 | | | | 4,344,686 | |
Federal Home Loan Mortgage Corp., Series K-108, Class A2, 1.517%, 3/25/2030 | | | 8,000,000 | | | | 7,033,312 | |
Federal Home Loan Mortgage Corp., Series K-109, Class A2, 1.558%, 4/25/2030 | | | 8,471,000 | | | | 7,458,182 | |
Federal Home Loan Mortgage Corp., Series K-116, Class A2, 1.378%, 7/25/2030 | | | 13,000,000 | | | | 11,319,152 | |
Federal Home Loan Mortgage Corp., Series K-117, Class A2, 1.406%, 8/25/2030 | | | 8,000,000 | | | | 6,882,480 | |
Federal Home Loan Mortgage Corp., Series K-118, Class A2, 1.493%, 9/25/2030 | | | 10,000,000 | | | | 8,704,090 | |
Federal Home Loan Mortgage Corp., Series K-SG1, Class A2, 1.503%, 9/25/2030 | | | 10,000,000 | | | | 8,736,230 | |
Federal Home Loan Mortgage Corp., Series K-119, Class A2, 1.566%, 9/25/2030 | | | 12,000,000 | | | | 10,444,920 | |
Federal Home Loan Mortgage Corp., Series K-120, Class A2, 1.500%, 10/25/2030 | | | 10,000,000 | | | | 8,736,720 | |
Federal Home Loan Mortgage Corp., Series K-121, Class A2, 1.547%, 10/25/2030 | | | 17,000,000 | | | | 14,852,441 | |
Federal Home Loan Mortgage Corp., Series K-G04, Class X1, 0.852%, 11/25/2030 (g)(h) | | | 36,951,121 | | | | 2,087,664 | |
Federal Home Loan Mortgage Corp., Series K-G04, Class A2, 1.487%, 11/25/2030 | | | 35,000,000 | | | | 30,110,430 | |
Federal Home Loan Mortgage Corp., Series K-122, Class A2, 1.521%, 11/25/2030 | | | 23,000,000 | | | | 20,094,502 | |
Federal Home Loan Mortgage Corp., Series K-123, Class A2, 1.621%, 12/25/2030 | | | 5,000,000 | | | | 4,376,380 | |
Federal Home Loan Mortgage Corp., Series K-124, Class A2, 1.658%, 12/25/2030 | | | 5,000,000 | | | | 4,368,165 | |
Federal Home Loan Mortgage Corp., Series 2021-MN1, Class M2,
5.264% (SOFR30A + 3.750%), 1/25/2051 (a)(b) | | | 3,700,000 | | | | 3,378,396 | |
Federal National Mortgage Association, Series 2020-M52, Class A2, 1.319%, 10/25/2030 (g) | | | 8,000,000 | | | | 7,022,368 | |
Federal National Mortgage Association, Series 2021-M1G, Class A2, 1.466%, 11/25/2030 (g) | | | 3,500,000 | | | | 3,042,823 | |
Federal National Mortgage Association, Series 2019-01, Class B10,
7.759% (1 Month LIBOR USD + 5.500%), 10/25/2049 (a)(b) | | | 1,500,000 | | | | 1,392,146 | |
Federal National Mortgage Association, Series 2019-01, Class CE,
11.009% (1 Month LIBOR USD + 8.750%), 10/25/2049 (a)(b) | | | 2,000,000 | | | | 2,086,232 | |
Federal National Mortgage Association, Series 2020-01, Class M10,
6.009% (1 Month LIBOR USD + 3.750%), 3/25/2050 (a)(b) | | | 5,000,000 | | | | 4,639,780 | |
Federal National Mortgage Association, Series 2020-01, Class CE,
9.759% (1 Month LIBOR USD + 7.500%), 3/25/2050 (a)(b) | | | 8,000,000 | | | | 7,646,168 | |
| | | | | | | | |
| | |
TOTAL COMMERCIAL MORTGAGE-BACKED SECURITIES – U.S. GOVERNMENT AGENCY
(Cost – $272,434,633) | | | | | | | $240,589,971 | |
| | | | | | | | |
| | |
| Common Stocks – 0.57% | | Shares | | | | |
Financial – 0.57% | | | | | | | | |
Annaly Capital Management, Inc. | | | 826,922 | | | | 5,689,223 | |
Ellington Financial, Inc. | | | 250,000 | | | | 4,012,500 | |
New Residential Investment Corp. | | | 625,000 | | | | 6,818,750 | |
See accompanying notes which are an integral part of these financial statements.
41
Angel Oak Multi-Strategy Income Fund
Consolidated Schedule of Investments – (continued)
July 31, 2022 (Unaudited)
| | | | | | | | |
| | | Shares | | | Value | |
Common Stocks – (continued) | | | | | | | | |
Financial – 0.64% | | | | | | | | |
PennyMac Mortgage Investment Trust | | | 200,000 | | | | $3,072,000 | |
Redwood Trust, Inc. | | | 1,056,366 | | | | 9,148,130 | |
| | | | | | | | |
| | |
TOTAL COMMON STOCKS
(Cost – $35,813,473) | | | | | | | $28,740,603 | |
| | | | | | | | |
| | |
| Corporate Obligations – 4.90% | | Principal
Amount | | | | |
Basic Materials – 0.84% | | | | | | | | |
Big River Steel LLC / BRS Finance Corp., 6.625%, 1/31/2029 (a) | | | $1,498,000 | | | | 1,529,907 | |
Clearwater Paper Corp., 4.750%, 8/15/2028 (a) | | | 4,700,000 | | | | 4,223,679 | |
Copper Mountain Mining Corp., 8.000%, 4/9/2026 (a)(i) | | | 4,224,000 | | | | 3,717,120 | |
CVR Partners LP / CVR Nitrogen Finance Corp., 6.125%, 6/15/2028 (a) | | | 3,500,000 | | | | 3,189,812 | |
Mercer International, Inc., 5.500%, 1/15/2026 | | | 2,600,000 | | | | 2,519,075 | |
Mercer International, Inc., 5.125%, 2/1/2029 | | | 1,400,000 | | | | 1,313,949 | |
Methanex Corp., 5.125%, 10/15/2027 | | | 6,900,000 | | | | 6,393,471 | |
Resolute Forest Products, Inc., 4.875%, 3/1/2026 (a) | | | 1,575,000 | | | | 1,553,005 | |
Sylvamo Corp., 7.000%, 9/1/2029 (a) | | | 17,000,000 | | | | 15,711,619 | |
Taseko Mines Ltd., 7.000%, 2/15/2026 (a) | | | 3,000,000 | | | | 2,389,382 | |
| | | | | | | | |
| | |
| | | | | | | 42,541,019 | |
| | | | | | | | |
Communications – 0.27% | | | | | | | | |
Consolidated Communications, Inc., 6.500%, 10/1/2028 (a) | | | 3,900,000 | | | | 3,363,750 | |
DIRECTV Holdings LLC / DIRECTV Financing Co. Inc., 5.875%, 8/15/2027 (a) | | | 4,900,000 | | | | 4,586,326 | |
Gray Escrow, Inc., 5.375%, 11/15/2031 (a) | | | 4,500,000 | | | | 3,982,073 | |
Townsquare Media, Inc., 6.875%, 2/1/2026 (a) | | | 1,600,000 | | | | 1,468,264 | |
| | | | | | | | |
| | |
| | | | | | | 13,400,413 | |
| | | | | | | | |
Consumer, Cyclical – 0.64% | | | | | | | | |
American Axle & Manufacturing, Inc., 5.000%, 10/1/2029 | | | 16,000,000 | | | | 14,022,640 | |
Beazer Homes USA, Inc., 5.875%, 10/15/2027 | | | 1,750,000 | | | | 1,543,535 | |
Brookfield Residential Properties, Inc. / Brookfield Residential US Corp., 6.250%, 9/15/2027 (a) | | | 1,300,000 | | | | 1,173,633 | |
Brookfield Residential Properties, Inc. / Brookfield Residential US LLC, 5.000%, 6/15/2029 (a) | | | 1,800,000 | | | | 1,387,728 | |
Century Communities, Inc., 6.750%, 6/1/2027 | | | 300,000 | | | | 305,250 | |
FirstCash, Inc., 4.625%, 9/1/2028 (a) | | | 3,900,000 | | | | 3,495,574 | |
Ford Motor Credit Co. LLC, 2.900%, 2/16/2028 | | | 2,500,000 | | | | 2,194,712 | |
Goodyear Tire & Rubber Co., 5.000%, 7/15/2029 | | | 2,200,000 | | | | 2,004,332 | |
Hawaiian Brand Intellectual Property Ltd., 5.750%, 1/20/2026 (a) | | | 1,300,000 | | | | 1,261,741 | |
United Airlines, Inc., 4.375%, 4/15/2026 (a) | | | 800,000 | | | | 765,729 | |
White Cap Buyer LLC, 6.875%, 10/15/2028 (a) | | | 4,800,000 | | | | 4,067,184 | |
| | | | | | | | |
| | |
| | | | | | | 32,222,058 | |
| | | | | | | | |
Consumer, Non-cyclical – 0.08% | | | | | | | | |
Mozart Debt Merger Sub, Inc., 5.250%, 10/1/2029 (a) | | | 900,000 | | | | 811,053 | |
NESCO Holdings, Inc., 5.500%, 4/15/2029 (a) | | | 1,700,000 | | | | 1,478,643 | |
Rent-A-Center, Inc., 6.375%, 2/15/2029 (a) | | | 2,100,000 | | | | 1,670,905 | |
| | | | | | | | |
| | |
| | | | | | | 3,960,601 | |
| | | | | | | | |
See accompanying notes which are an integral part of these financial statements.
42
Angel Oak Multi-Strategy Income Fund
Consolidated Schedule of Investments – (continued)
July 31, 2022 (Unaudited)
| | | | | | | | |
| | | Principal
Amount | | | Value | |
Corporate Obligations – (continued) | | | | | | | | |
Energy – 0.08% | | | | | | | | |
SunCoke Energy, Inc., 4.875%, 6/30/2029 (a) | | $ | 4,500,000 | | | $ | 3,824,797 | |
| | | | | | | | |
Financial – 2.92% | | | | | | | | |
Arbor Realty Trust, Inc., 5.750%, 4/1/2024 (a) | | | 3,000,000 | | | | 2,940,904 | |
Arbor Realty Trust, Inc., 4.500%, 3/15/2027 (a) | | | 11,500,000 | | | | 10,088,233 | |
B. Riley Financial, Inc., 6.375% (k) | | | 7,000,000 | | | | 6,966,400 | |
Banc of California, Inc., 5.250%, 4/15/2025 | | | 4,650,000 | | | | 4,652,231 | |
Bank of Commerce Holdings, 6.671% (3 Month LIBOR USD + 5.260%), 12/10/2025 (a)(b) | | | 2,500,000 | | | | 2,501,915 | |
Citadel LP, 5.375%, 1/17/2023 (a) | | | 2,000,000 | | | | 2,005,513 | |
Customers Bank, 6.125% (3 Month LIBOR USD + 3.443%), 6/26/2029 (a)(b) | | | 1,000,000 | | | | 1,008,645 | |
Fidelity Bank, 5.875% (3 Month LIBOR USD + 3.630%), 5/31/2030 (b) | | | 2,000,000 | | | | 2,030,215 | |
First Bancshares, Inc., 6.400% (3 Month LIBOR USD + 3.390%), 5/1/2033 (b) | | | 1,000,000 | | | | 1,061,043 | |
First Charter Capital Trust, 3.519% (3 Month LIBOR USD + 1.690%), 9/15/2035 (b)(e) | | | 1,000,000 | | | | 924,452 | |
First NBC Bank Holding Co., 5.750%, 2/18/2025 (e)(l)(m) | | | 13,500,000 | | | | 1,312,200 | |
Freedom Mortgage Corp., 7.625%, 5/1/2026 (a) | | | 5,600,000 | | | | 4,613,403 | |
Georgia Banking Co. Inc., 4.125% (TSFR3M + 3.400%), 6/15/2031 (a)(b) | | | 4,000,000 | | | | 3,772,052 | |
Hanmi Financial Corp., 3.750% (TSFR3M + 3.100%), 9/1/2031 (b) | | | 3,300,000 | | | | 3,130,106 | |
Howard Hughes Corp., 5.375%, 8/1/2028 (a) | | | 200,000 | | | | 187,576 | |
Jacksonville Bancorp, Inc., 5.579% (3 Month LIBOR USD + 3.750%), 9/15/2038 (a)(b) | | | 1,200,000 | | | | 1,199,888 | |
Kingstone Cos, Inc., 5.500%, 12/30/2022 | | | 2,000,000 | | | | 1,974,075 | |
LD Holdings Group LLC, 6.125%, 4/1/2028 (a) | | | 2,100,000 | | | | 1,280,979 | |
Luther Burbank Corp., 6.500%, 9/30/2024 (a) | | | 5,800,000 | | | | 5,747,720 | |
MGIC Investment Corp., 5.250%, 8/15/2028 | | | 500,000 | | | | 482,020 | |
Midland States Bancorp, Inc., 5.000% (TSFR3M + 3.610%), 9/30/2029 (b) | | | 750,000 | | | | 735,801 | |
Millennium Consolidated Holdings LLC, 7.500%, 6/30/2023 (a) | | | 1,000,000 | | | | 1,000,685 | |
Nationstar Mortgage Holdings, Inc., 6.000%, 1/15/2027 (a) | | | 4,400,000 | | | | 4,082,320 | |
Nationstar Mortgage Holdings, Inc., 5.500%, 8/15/2028 (a) | | | 8,700,000 | | | | 7,665,135 | |
NMI Holdings, Inc., 7.375%, 6/1/2025 (a) | | | 6,907,000 | | | | 7,011,986 | |
Northern Bancorp, Inc., 4.750% (TSFR3M + 3.275%), 12/30/2029 (a)(b) | | | 1,000,000 | | | | 984,809 | |
OneMain Finance Corp., 4.000%, 9/15/2030 | | | 800,000 | | | | 629,944 | |
PennyMac Financial Services, Inc., 5.375%, 10/15/2025 (a) | | | 4,800,000 | | | | 4,499,520 | |
PennyMac Financial Services, Inc., 4.250%, 2/15/2029 (a) | | | 900,000 | | | | 737,078 | |
PennyMac Financial Services, Inc., 5.750%, 9/15/2031 (a) | | | 900,000 | | | | 748,605 | |
PHH Mortgage Corp., 7.875%, 3/15/2026 (a) | | | 4,300,000 | | | | 4,013,974 | |
PRA Group, Inc., 5.000%, 10/1/2029 (a) | | | 3,600,000 | | | | 3,105,522 | |
Preferred Bank, 3.375% (TSFR3M + 2.780%), 6/15/2031 (b) | | | 1,500,000 | | | | 1,378,751 | |
Preferred Pass-Through Trust, 4.663% (N/A + 0.000%), 12/29/2049 (a)(n) | | | 1,000,000 | | | | 740,000 | |
Ready Capital Corp., 6.200%, 7/30/2026 (k) | | | 8,000,000 | | | | 7,728,000 | |
Ready Capital Corp., 5.750%, 2/15/2026 (k) | | | 4,500,000 | | | | 4,298,400 | |
Renasant Corp., 4.500% (TSFR3M + 4.025%), 9/15/2035 (b) | | | 4,000,000 | | | | 4,023,414 | |
Southcoast Capital, 2.496%, 9/30/2035 (e)(g) | | | 4,000,000 | | | | 3,380,000 | |
Starwood Property Trust, Inc., 4.750%, 3/15/2025 | | | 1,100,000 | | | | 1,093,950 | |
Sterling Bancorp, Inc., 8.332% (3 Month LIBOR USD + 5.820%), 4/15/2026 (a)(b) | | | 2,050,000 | | | | 2,050,636 | |
StoneX Group, Inc., 8.625%, 6/15/2025 (a) | | | 2,700,000 | | | | 2,750,409 | |
TIAA FSB Holdings, Inc., 4.381%, 1/7/2035 (e)(g) | | | 5,000,000 | | | | 4,500,000 | |
Trinitas Capital Management LLC, 6.000%, 7/30/2026 (a) | | | 2,000,000 | | | | 1,909,030 | |
Trinity Capital, Inc., 7.000% (k) | | | 2,500,000 | | | | 2,450,000 | |
United Wholesale Mortgage LLC, 5.500%, 11/15/2025 (a) | | | 2,200,000 | | | | 2,057,000 | |
United Wholesale Mortgage LLC, 5.500%, 4/15/2029 (a) | | | 9,600,000 | | | | 8,280,000 | |
See accompanying notes which are an integral part of these financial statements.
43
Angel Oak Multi-Strategy Income Fund
Consolidated Schedule of Investments – (continued)
July 31, 2022 (Unaudited)
| | | | | | | | |
| | | Principal
Amount | | | Value | |
Corporate Obligations – (continued) | | | | | | | | |
Financial – (continued) | | | | | | | | |
Velocity Commercial Capital LLC, 7.125%, 3/15/2027 (a) | | $ | 1,400,000 | | | $ | 1,328,259 | |
Western Alliance Bank, 5.250% (TSFR3M + 5.120%), 6/1/2030 (b) | | | 2,000,000 | | | | 1,998,448 | |
WSFS Cap Trust, 2.293%, 6/1/2035 (a)(e)(g) | | | 4,000,000 | | | | 3,500,000 | |
Zais Group LLC, 7.000%, 11/15/2023 (a) | | | 357,200 | | | | 350,795 | |
| | | | | | | | |
| | |
| | | | | | | 146,912,041 | |
| | | | | | | | |
Industrial – 0.06% | | | | | | | | |
Brundage-Bone Concrete Pumping Holdings, Inc., 6.000%, 2/1/2026 (a) | | | 1,700,000 | | | | 1,528,538 | |
Seaspan Corp., 5.500%, 8/1/2029 (a) | | | 1,350,000 | | | | 1,059,912 | |
Weekley Homes LLC / Weekley Finance Corp., 4.875%, 9/15/2028 (a) | | | 800,000 | | | | 658,825 | |
| | | | | | | | |
| | |
| | | | | | | 3,247,275 | |
| | | | | | | | |
Technology – 0.01% | | | | | | | | |
Seagate HDD Cayman, 3.375%, 7/15/2031 | | | 800,000 | | | | 643,815 | |
| | | | | | | | |
| | |
TOTAL CORPORATE OBLIGATIONS
(Cost – $281,268,134) | | | | | | | $246,752,019 | |
| | | | | | | | |
| | |
| Investment Companies – 2.31% | | Shares | | | | |
Affiliated Mutual Funds – 2.31% | | | | | | | | |
Angel Oak Core Impact Fund, Institutional Class | | | 3,985,110 | | | | 36,663,013 | |
Angel Oak Financials Income Fund, Institutional Class | | | 5,147,772 | | | | 44,322,316 | |
Angel Oak High Yield Opportunities Fund, Institutional Class | | | 3,336,241 | | | | 35,364,154 | |
| | | | | | | | |
| | |
TOTAL INVESTMENT COMPANIES
(Cost – $126,552,243) | | | | | | | $116,349,483 | |
| | | | | | | | |
Preferred Stocks – 0.34% | | | | | | | | |
Financial – 0.07% | | | | | | | | |
Morgan Stanley, 4.000% (3 Month LIBOR USD + 0.700%) (b) | | | 130,497 | | | | 2,675,188 | |
Raymond James Financial, Inc., 6.375% (3 Month LIBOR USD + 4.080%) (b) | | | 40,000 | | | | 1,018,056 | |
| | | | | | | | |
| | |
| | | | | | | 3,693,244 | |
| | | | | | | | |
Real Estate Investment Trust – 0.27% | | | | | | | | |
AGNC Investment Corp., 6.500% (3 Month LIBOR USD + 4.993%) (b) | | | 129,224 | | | | 2,923,047 | |
Dynex Capital, Inc., 6.900% (3 Month LIBOR USD + 5.461%) (b) | | | 320,000 | | | | 7,283,200 | |
MFA Financial, Inc., 6.500% (3 Month LIBOR USD + 5.345%) (b) | | | 168,900 | | | | 3,317,196 | |
| | | | | | | | |
| | |
| | | | | | | 13,523,443 | |
| | | | | | | | |
| | |
TOTAL PREFERRED STOCKS
(Cost – $18,688,937) | | | | | | | $17,216,687 | |
| | | | | | | | |
| | |
| |
| Principal
Amount |
| | | | |
Residential Mortgage-Backed Securities – 72.06% | | | | | | | | |
Accredited Mortgage Loan Trust, Series 2005-4, Class M1,
2.659% (1 Month LIBOR USD + 0.400%), 12/25/2035 (b) | | | $129,222 | | | | 128,954 | |
Adjustable Rate Mortgage Trust, Series 2005-3, Class 7A1, 3.105%, 7/25/2035 (g) | | | 361,816 | | | | 333,337 | |
See accompanying notes which are an integral part of these financial statements.
44
Angel Oak Multi-Strategy Income Fund
Consolidated Schedule of Investments – (continued)
July 31, 2022 (Unaudited)
| | | | | | | | |
| | | Principal
Amount | | | Value | |
Residential Mortgage-Backed Securities – (continued) | | | | | | | | |
Adjustable Rate Mortgage Trust, Series 2005-11, Class 2A3, 3.190%, 2/25/2036 (g) | | $ | 6,228,188 | | | $ | 5,347,827 | |
Adjustable Rate Mortgage Trust, Series 2005-12, Class 2A1, 3.062%, 3/25/2036 (g) | | | 1,551,004 | | | | 1,213,192 | |
Adjustable Rate Mortgage Trust, Series 2006-1, Class 2A1, 3.785%, 3/25/2036 (g) | | | 796,651 | | | | 627,873 | |
Adjustable Rate Mortgage Trust, Series 2006-3, Class 4A11,
2.619% (1 Month LIBOR USD + 0.360%), 8/25/2036 (b) | | | 1,493,349 | | | | 839,700 | |
Adjustable Rate Mortgage Trust, Series 2007-1, Class 3A22, 3.482%, 3/25/2037 (g) | | | 306,960 | | | | 281,401 | |
Adjustable Rate Mortgage Trust, Series 2007-1, Class 2A1, 3.969%, 3/25/2037 (g) | | | 2,985,182 | | | | 2,772,470 | |
Adjustable Rate Mortgage Trust, Series 2007-2, Class 1A1, 3.973%, 6/25/2037 (g) | | | 1,823,530 | | | | 1,660,669 | |
Adjustable Rate Mortgage Trust, Series 2007-2, Class 1A21, 3.973%, 6/25/2037 (g) | | | 1,921,776 | | | | 1,618,604 | |
Agate Bay Mortgage Trust, Series 2015-4, Class B4, 3.528%, 6/25/2045 (a)(g) | | | 2,018,000 | | | | 1,874,314 | |
American Home Mortgage Assets Trust, Series 2007-3, Class 22A1, 6.750%, 6/25/2037 (o) | | | 312,117 | | | | 306,005 | |
American Home Mortgage Assets Trust, Series 2006-1, Class XC, 1.561%, 5/25/2046 (e)(g)(h) | | | 16,489,986 | | | | 528,587 | |
American Home Mortgage Assets Trust, Series 2006-1, Class 2A1,
2.449% (1 Month LIBOR USD + 0.190%), 5/25/2046 (b)(j) | | | 20,589,084 | | | | 16,933,945 | |
American Home Mortgage Assets Trust, Series 2006-1, Class 1A2,
2.449% (1 Month LIBOR USD + 0.190%), 5/25/2046 (b) | | | 1,615,025 | | | | 1,424,990 | |
American Home Mortgage Assets Trust, Series 2006-2, Class 1A1,
1.603% (12 Month US Treasury Average + 0.960%), 9/25/2046 (b) | | | 1,095,732 | | | | 987,430 | |
American Home Mortgage Assets Trust, Series 2006-6, Class XP, 1.154%, 12/25/2046 (e)(g)(h) | | | 64,497,098 | | | | 1,372,692 | |
American Home Mortgage Assets Trust, Series 2007-1, Class A1,
1.343% (12 Month US Treasury Average + 0.700%), 2/25/2047 (b)(j) | | | 49,567,140 | | | | 21,636,304 | |
American Home Mortgage Assets Trust, Series 2007-5, Class XP, 1.476%, 6/25/2047 (e)(g)(h) | | | 18,369,532 | | | | 1,005,034 | |
American Home Mortgage Investment Trust, Series 2005-2, Class 5A4A, 5.883%, 9/25/2035 (o) | | | 4,200,196 | | | | 3,132,019 | |
American Home Mortgage Investment Trust, Series 2006-3, Class 22A1,
4.697% (6 Month LIBOR USD + 1.750%), 12/25/2036 (b) | | | 4,188,219 | | | | 3,703,286 | |
American Home Mortgage Investment Trust, Series 2006-3, Class 3A2, 6.750%, 12/25/2036 (o) | | | 6,308,287 | | | | 2,692,024 | |
American Home Mortgage Investment Trust, Series 2007-A, Class 13A1, 6.600%, 1/25/2037 (a)(o) | | | 2,211,292 | | | | 938,534 | |
American Home Mortgage Investment Trust, Series 2005-2, Class 1A1,
1.606% (1 Month LIBOR USD + 0.600%), 9/25/2045 (b)(j) | | | 6,180,253 | | | | 5,350,566 | |
American Home Mortgage Investment Trust, Series 2005-2, Class 2A1,
4.146% (1 Month LIBOR USD + 3.140%), 9/25/2045 (b) | | | 454,528 | | | | 395,713 | |
American Home Mortgage Investment Trust, Series 2007-2, Class 11A1,
2.719% (1 Month LIBOR USD + 0.460%), 3/25/2047 (b) | | | 3,982,285 | | | | 1,856,127 | |
American Home Mortgage Investment Trust, Series 2007-1, Class GA1A,
2.419% (1 Month LIBOR USD + 0.160%), 5/25/2047 (b)(j) | | | 18,487,420 | | | | 12,162,985 | |
American Home Mortgage Investment Trust, Series 2007-1, Class GA1C,
2.449% (1 Month LIBOR USD + 0.190%), 5/25/2047 (b)(j) | | | 11,091,865 | | | | 5,732,997 | |
Arroyo Mortgage Trust, Series 2022-1, Class M1, 3.650%, 12/25/2056 (a) | | | 2,000,000 | | | | 1,812,566 | |
Banc of America Funding Trust, Series 2009-R14, Class 2A,
11.924% (-2 x 1 Month LIBOR USD + 15.013%), 7/26/2035 (a)(b)(p) | | | 328,430 | | | | 349,990 | |
Banc of America Funding Trust, Series 2015-R8, Class 3A2, 3.304%, 8/28/2035 (a)(g) | | | 1,856,489 | | | | 1,613,265 | |
Banc of America Funding Trust, Series 2007-8, Class 2A1, 7.000%, 10/25/2037 | | | 3,855,404 | | | | 3,080,922 | |
Bank of America Alternative Loan Trust, Series 2005-10, Class 1CB4, 5.500%, 11/25/2035 | | | 354,445 | | | | 345,312 | |
Bank of America Alternative Loan Trust, Series 2006-7, Class A2, 5.707%, 10/25/2036 (g) | | | 3,578,468 | | | | 1,870,594 | |
Bank of America Alternative Loan Trust, Series 2006-7, Class A6, 6.359%, 10/25/2036 (o) | | | 3,923,316 | | | | 2,009,154 | |
Bank of America Alternative Loan Trust, Series 2006-7, Class A4, 6.498%, 10/25/2036 (o) | | | 10,529,848 | | | | 5,210,632 | |
Bank of America Alternative Loan Trust, Series 2006-9, Class 30PO, 0.000%, 1/25/2037 (f) | | | 165,728 | | | | 94,739 | |
See accompanying notes which are an integral part of these financial statements.
45
Angel Oak Multi-Strategy Income Fund
Consolidated Schedule of Investments – (continued)
July 31, 2022 (Unaudited)
| | | | | | | | |
| | | Principal
Amount | | | Value | |
Residential Mortgage-Backed Securities – (continued) | | | | | | | | |
Bank of America Alternative Loan Trust, Series 2007-1, Class 3A16,
2.859% (1 Month LIBOR USD + 0.600%), 4/25/2037 (b) | | $ | 2,514,442 | | | $ | 1,713,846 | |
Bank of America Funding Trust, Series 2005-F, Class 4A1, 2.801%, 9/20/2035 (g) | | | 1,820,384 | | | | 1,571,144 | |
Bank of America Funding Trust, Series 2007-C, Class 4A2, 2.806%, 5/20/2036 (g) | | | 742,040 | | | | 682,320 | |
Bank of America Funding Trust, Series 2006-H, Class 6A1,
2.506% (1 Month LIBOR USD + 0.380%), 10/20/2036 (b) | | | 7,069,052 | | | | 5,408,228 | |
Bank of America Funding Trust, Series 2007-2, Class 1A16,
2.859% (1 Month LIBOR USD + 0.600%), 3/25/2037 (b) | | | 2,501,029 | | | | 1,672,928 | |
Bank of America Funding Trust, Series 2014-R1, Class A2,
1.924% (1 Month LIBOR USD + 0.150%), 6/26/2037 (a)(b) | | | 4,637,132 | | | | 3,929,264 | |
Bank of America Funding Trust, Series 2007-A, Class 2A1,
2.446% (1 Month LIBOR USD + 0.320%), 2/20/2047 (b) | | | 1,878,626 | | | | 1,605,333 | |
Bank of America Funding Trust, Series 2007-A, Class 2A5,
2.586% (1 Month LIBOR USD + 0.460%), 2/20/2047 (b) | | | 1,155,733 | | | | 978,256 | |
Bank of America Funding Trust, Series 2007-B, Class A1,
2.546% (1 Month LIBOR USD + 0.420%), 4/20/2047 (b) | | | 3,032,167 | | | | 2,482,814 | |
Bank of America Funding Trust, Series 2007-C, Class 7A4,
2.566% (1 Month LIBOR USD + 0.440%), 5/20/2047 (b) | | | 2,291,782 | | | | 2,081,183 | |
Bank of America Mortgage Trust, Series 2007-1, Class 1A4, 6.000%, 3/25/2037 | | | 909,872 | | | | 839,574 | |
Bayview Financial Mortgage Pass-Through Trust, Series 2005-D, Class APO, 0.000%, 12/28/2035 (f) | | | 294,154 | | | | 241,968 | |
BCAP LLC Trust, Series 2012-RR1, Class 3A4, 5.500%, 10/26/2035 (a)(g) | | | 1,607,761 | | | | 1,381,949 | |
BCAP LLC Trust, Series 2010-RR6, Class 1410, 3.685%, 12/27/2035 (a)(g) | | | 5,095,245 | | | | 4,149,328 | |
BCAP LLC Trust, Series 2012-RR4, Class 4A7,
2.075% (1 Month LIBOR USD + 0.280%), 2/26/2036 (a)(g) | | | 2,146,122 | | | | 1,400,521 | |
BCAP LLC Trust, Series 2010-RR7, Class 9A12, 2.507%, 5/28/2036 (a)(g) | | | 1,091,541 | | | | 888,735 | |
BCAP LLC Trust, Series 2013-RR1, Class 6A2, 3.211%, 5/28/2036 (a)(g) | | | 3,181,124 | | | | 2,494,389 | |
BCAP LLC Trust, Series 2012-RR11, Class 1A2, 1.794%, 1/27/2037 (a)(g) | | | 1,020,684 | | | | 907,862 | |
BCAP LLC Trust, Series 2010-RR9, Class 7A2, 2.664%, 1/28/2037 (a)(g) | | | 6,287,689 | | | | 5,901,946 | |
BCAP LLC Trust, Series 2007-AA3, Class 1A1A,
2.679% (1 Month LIBOR USD + 0.420%), 4/25/2037 (b) | | | 1,102,535 | | | | 978,806 | |
BCAP LLC Trust, Series 2008-IND1, Class A1,
3.459% (1 Month LIBOR USD + 1.200%), 10/25/2047 (b)(j) | | | 19,847,289 | | | | 16,816,151 | |
Bear Stearns Adjustable Rate Mortgage Trust, Series 2005-6, Class 1A1, 3.592%, 8/25/2035 (g) | | | 1,869,311 | | | | 1,664,461 | |
Bear Stearns Adjustable Rate Mortgage Trust, Series 2006-2, Class 3A1, 3.441%, 7/25/2036 (g) | | | 426,355 | | | | 379,699 | |
Bear Stearns ALT-A Trust, Series 2004-5, Class 4A1, 2.962%, 6/25/2034 (g) | | | 507,632 | | | | 502,423 | |
Bear Stearns ALT-A Trust, Series 2005-5, Class 21A1, 3.208%, 7/25/2035 (g) | | | 458,435 | | | | 430,522 | |
Bear Stearns ALT-A Trust, Series 2005-7, Class 22A1, 3.280%, 9/25/2035 (g)(j) | | | 14,500,796 | | | | 9,969,558 | |
Bear Stearns ALT-A Trust, Series 2005-7, Class 21A1, 3.632%, 9/25/2035 (g) | | | 2,868,209 | | | | 2,634,040 | |
Bear Stearns Asset Backed Securities Trust, Series 2005-AC5, Class 1A2,
3.259% (1 Month LIBOR USD + 1.000%), 8/25/2035 (b) | | | 1,552,850 | | | | 1,121,474 | |
Bear Stearns Asset Backed Securities Trust, Series 2007-SD3, Class A,
2.759% (1 Month LIBOR USD + 0.500%), 5/25/2037 (b) | | | 23,649 | | | | 21,882 | |
Bear Stearns Asset Backed Securities Trust, Series 2007-AC6, Class A1, 6.500%, 10/25/2037 | | | 2,249,937 | | | | 1,580,664 | |
Bear Stearns Mortgage Funding Trust, Series 2006-AR1, Class 1A1,
2.679% (1 Month LIBOR USD + 0.420%), 7/25/2036 (b) | | | 494,669 | | | | 419,590 | |
Bellemeade Re Ltd., Series 2018-3A, Class M2,
5.009% (1 Month LIBOR USD + 2.750%), 10/25/2028 (a)(b) | | | 8,196,741 | | | | 8,048,191 | |
See accompanying notes which are an integral part of these financial statements.
46
Angel Oak Multi-Strategy Income Fund
Consolidated Schedule of Investments – (continued)
July 31, 2022 (Unaudited)
| | | | | | | | |
| | | Principal
Amount | | | Value | |
Residential Mortgage-Backed Securities – (continued) | | | | | | | | |
Bellemeade Re Ltd., Series 2019-2A, Class M2,
5.359% (1 Month LIBOR USD + 3.100%), 4/25/2029 (a)(b) | | $ | 22,150,000 | | | $ | 21,551,551 | |
Bellemeade Re Ltd., Series 2019-2A, Class B1,
6.359% (1 Month LIBOR USD + 4.100%), 4/25/2029 (a)(b) | | | 9,180,000 | | | | 8,671,621 | |
Bellemeade Re Ltd., Series 2020-4A, Class B1,
7.259% (1 Month LIBOR USD + 5.000%), 6/25/2030 (a)(b) | | | 2,500,000 | | | | 2,449,418 | |
Bellemeade Re Ltd., Series 2021-1A, Class M2,
6.364% (SOFR30A + 4.850%), 3/25/2031 (a)(b) | | | 5,750,000 | | | | 5,380,143 | |
Bellemeade Re Ltd., Series 2021-2A, Class M2,
4.414% (SOFR30A + 2.900%), 6/25/2031 (a)(b) | | | 13,250,000 | | | | 11,846,865 | |
Bellemeade Re Ltd., Series 2021-3A, Class M2,
4.664% (SOFR30A + 3.150%), 9/25/2031 (a)(b) | | | 2,900,000 | | | | 2,625,254 | |
Bellemeade Re Ltd., Series 2022-1, Class M1C,
5.214% (SOFR30A + 3.700%), 1/26/2032 (a)(b) | | | 2,500,000 | | | | 2,423,030 | |
Bellemeade Re Ltd., Series 2022-1, Class M2,
6.114% (SOFR30A + 4.600%), 1/26/2032 (a)(b) | | | 3,750,000 | | | | 3,502,163 | |
BNC Mortgage Loan Trust, Series 2006-2, Class A5,
2.879% (1 Month LIBOR USD + 0.620%), 11/25/2036 (b)(j) | | | 33,000,000 | | | | 19,952,922 | |
Boston Lending Trust, Series 2021-1, Class A, 2.000%, 7/25/2061 (a)(g) | | | 4,176,673 | | | | 3,822,595 | |
BRAVO Residential Funding Trust, Series 2021-NQM3, Class A2, 1.853%, 4/25/2060 (a)(c)(g) | | | 3,107,232 | | | | 2,965,691 | |
Cascade MH Asset Trust, Series 2021-MH1, Class B3, 7.595%, 2/25/2046 (a)(g) | | | 3,000,000 | | | | 2,669,349 | |
Chase Mortgage Finance Corp., Series 2021-CL1, Class M2,
2.864% (SOFR30A + 1.350%), 2/25/2050 (a)(b) | | | 2,144,506 | | | | 2,046,550 | |
Chase Mortgage Finance Corp., Series 2021-CL1, Class M3,
3.064% (SOFR30A + 1.550%), 2/25/2050 (a)(b) | | | 2,542,865 | | | | 2,420,520 | |
Chase Mortgage Finance Corp., Series 2021-CL1, Class M4,
4.164% (SOFR30A + 2.650%), 2/25/2050 (a)(b) | | | 2,630,594 | | | | 2,500,043 | |
Chase Mortgage Finance Corp., Series 2021-CL1, Class M5,
4.764% (SOFR30A + 3.250%), 2/25/2050 (a)(b) | | | 1,052,108 | | | | 999,240 | |
Chase Mortgage Finance Corp., Series 2021-CL1, Class B,
8.014% (SOFR30A + 6.500%), 2/25/2050 (a)(b) | | | 2,159,000 | | | | 2,060,282 | |
Chase Mortgage Finance Trust, Series 2006-A1, Class 2A2, 3.190%, 9/25/2036 (g) | | | 1,001,116 | | | | 914,191 | |
Chase Mortgage Finance Trust, Series 2006-S2, Class 2A6, 6.000%, 10/25/2036 | | | 767,656 | | | | 425,648 | |
Chase Mortgage Finance Trust, Series 2007-S2, Class 1A9, 6.000%, 3/25/2037 | | | 2,063,572 | | | | 1,347,055 | |
ChaseFlex Trust, Series 2005-2, Class 5A6, 5.000%, 6/25/2035 | | | 1,441,991 | | | | 1,179,215 | |
ChaseFlex Trust, Series 2007-1, Class 2A10,
2.759% (1 Month LIBOR USD + 0.500%), 2/25/2037 (b) | | | 2,312,639 | | | | 792,178 | |
ChaseFlex Trust, Series 2007-1, Class 2A6, 6.000%, 2/25/2037 | | | 1,605,010 | | | | 959,316 | |
ChaseFlex Trust, Series 2007-2, Class A1,
2.819% (1 Month LIBOR USD + 0.560%), 5/25/2037 (b) | | | 2,977,185 | | | | 2,617,104 | |
Chevy Chase Funding LLC Mortgage-Backed Certificates, Series 2004-3A, Class A1,
2.509% (1 Month LIBOR USD + 0.250%), 8/27/2035 (a)(b) | | | 1,541,455 | | | | 1,369,840 | |
Chevy Chase Funding LLC Mortgage-Backed Certificates, Series 2004-4A, Class A2,
2.839% (1 Month LIBOR USD + 0.580%), 10/25/2035 (a)(b) | | | 2,608,760 | | | | 2,422,239 | |
Chevy Chase Funding LLC Mortgage-Backed Certificates, Series 2005-1A, Class A1,
2.409% (1 Month LIBOR USD + 0.150%), 1/25/2036 (a)(b) | | | 2,016,730 | | | | 1,654,106 | |
Chevy Chase Funding LLC Mortgage-Backed Certificates, Series 2005-AA, Class A1,
2.459% (1 Month LIBOR USD + 0.200%), 1/25/2036 (a)(b) | | | 1,392,021 | | | | 1,155,220 | |
See accompanying notes which are an integral part of these financial statements.
47
Angel Oak Multi-Strategy Income Fund
Consolidated Schedule of Investments – (continued)
July 31, 2022 (Unaudited)
| | | | | | | | |
| | | Principal
Amount | | | Value | |
Residential Mortgage-Backed Securities – (continued) | | | | | | | | |
Chevy Chase Funding LLC Mortgage-Backed Certificates, Series 2005-1A, Class A2,
2.459% (1 Month LIBOR USD + 0.200%), 1/25/2036 (a)(b) | | $ | 2,249,097 | | | $ | 1,843,796 | |
Chevy Chase Funding LLC Mortgage-Backed Certificates, Series 2005-2A, Class A1,
2.439% (1 Month LIBOR USD + 0.180%), 5/25/2036 (a)(b) | | | 2,876,823 | | | | 2,360,954 | |
Chevy Chase Funding LLC Mortgage-Backed Certificates, Series 2005-3A, Class A2,
2.489% (1 Month LIBOR USD + 0.230%), 7/25/2036 (a)(b) | | | 3,767,469 | | | | 3,311,425 | |
Chevy Chase Funding LLC Mortgage-Backed Certificates, Series 2005-4A, Class NIO, 0.414%, 4/25/2037 (a)(e)(g)(h) | | | 20,615,105 | | | | 210,377 | |
Chevy Chase Funding LLC Mortgage-Backed Certificates, Series 2005-CA, Class A1,
2.469% (1 Month LIBOR USD + 0.210%), 10/25/2046 (a)(b) | | | 349,941 | | | | 308,049 | |
Chevy Chase Funding LLC Mortgage-Backed Certificates, Series 2006-1A, Class A1,
2.409% (1 Month LIBOR USD + 0.150%), 12/25/2046 (a)(b) | | | 3,441,661 | | | | 2,977,980 | |
Chevy Chase Funding LLC Mortgage-Backed Certificates, Series 2006-2A, Class A1,
2.389% (1 Month LIBOR USD + 0.130%), 4/25/2047 (a)(b)(j) | | | 8,927,337 | | | | 8,476,453 | |
Chevy Chase Funding LLC Mortgage-Backed Certificates, Series 2006-2A, Class A2,
2.439% (1 Month LIBOR USD + 0.180%), 4/25/2047 (a)(b) | | | 4,514,241 | | | | 3,609,213 | |
Chevy Chase Funding LLC Mortgage-Backed Certificates, Series 2006-4A, Class A1,
2.389% (1 Month LIBOR USD + 0.130%), 11/25/2047 (a)(b) | | | 940,789 | | | | 760,859 | |
Chevy Chase Funding LLC Mortgage-Backed Certificates, Series 2006-4A, Class A2,
2.439% (1 Month LIBOR USD + 0.180%), 11/25/2047 (a)(b) | | | 3,911,249 | | | | 3,117,668 | |
Chevy Chase Funding LLC Mortgage-Backed Certificates, Series 2007-1A, Class A1,
2.389% (1 Month LIBOR USD + 0.130%), 2/25/2048 (a)(b)(j) | | | 7,820,207 | | | | 6,715,791 | |
CIM Trust, Series 2019-J1, Class B5, 3.947%, 8/25/2049 (a)(g) | | | 613,000 | | | | 508,215 | |
CIM Trust, Series 2021-J1, Class B4, 2.659%, 3/25/2051 (a)(g) | | | 1,367,851 | | | | 920,315 | |
CIM Trust, Series 2021-J1, Class B6, 2.659%, 3/25/2051 (a)(g) | | | 1,416,978 | | | | 471,522 | |
CIM Trust, Series 2021-J1, Class B5, 2.659%, 3/25/2051 (a)(g) | | | 810,000 | | | | 413,332 | |
CIM Trust, Series 2021-J2, Class B5, 2.673%, 4/25/2051 (a)(g) | | | 718,000 | | | | 372,839 | |
CIM Trust, Series 2021-J2, Class B6, 2.673%, 4/25/2051 (a)(g) | | | 1,438,139 | | | | 438,430 | |
CIM Trust, Series 2021-J2, Class B4, 2.673%, 4/25/2051 (a)(g) | | | 1,623,496 | | | | 1,104,130 | |
CIM Trust, Series 2021-J3, Class B5, 2.619%, 6/25/2051 (a)(g) | | | 481,000 | | | | 215,150 | |
CIM Trust, Series 2021-J3, Class B6, 2.619%, 6/25/2051 (a)(g) | | | 800,773 | | | | 223,285 | |
CIM Trust, Series 2021-J3, Class B4, 2.619%, 6/25/2051 (a)(g) | | | 1,281,000 | | | | 742,687 | |
Citicorp. Mortgage Securities, Inc., Series 2005-2, Class 1APO, 0.000%, 3/25/2035 (f) | | | 36,137 | | | | 23,372 | |
Citigroup Mortgage Loan Trust, Series 2005-12, Class 2A1,
3.059% (1 Month LIBOR USD + 0.800%), 8/25/2035 (a)(b) | | | 1,650,680 | | | | 1,406,789 | |
Citigroup Mortgage Loan Trust, Series 2005-3, Class 2A2, 3.342%, 8/25/2035 (g) | | | 322,727 | | | | 314,910 | |
Citigroup Mortgage Loan Trust, Series 2005-7, Class 2A2A, 2.936%, 11/25/2035 (g) | | | 1,749,463 | | | | 1,346,179 | |
Citigroup Mortgage Loan Trust, Series 2006-4, Class 2A1A, 6.000%, 12/25/2035 | | | 450,159 | | | | 447,964 | |
Citigroup Mortgage Loan Trust, Series 2007-AR1, Class A2,
2.579% (1 Month LIBOR USD + 0.320%), 1/25/2037 (b) | | | 3,056,165 | | | | 2,738,333 | |
Citigroup Mortgage Loan Trust, Series 2007-6, Class 1A2A, 3.177%, 3/25/2037 (g) | | | 2,955,006 | | | | 2,479,495 | |
Citigroup Mortgage Loan Trust, Inc., Series 2005-9, Class 22A3, 6.000%, 10/25/2035 | | | 1,368,859 | | | | 1,176,561 | |
CitiMortgage Alternative Loan Trust, Series 2006-A4, Class 1A5,
2.909% (1 Month LIBOR USD + 0.650%), 9/25/2036 (b) | | | 1,714,524 | | | | 1,173,717 | |
CitiMortgage Alternative Loan Trust, Series 2006-A4, Class 1A3, 6.000%, 9/25/2036 | | | 3,203,443 | | | | 3,075,315 | |
CitiMortgage Alternative Loan Trust, Series 2006-A6, Class 1APO, 0.000%, 11/25/2036 (f) | | | 76,176 | | | | 39,473 | |
CitiMortgage Alternative Loan Trust, Series 2006-A7, Class 1A9,
2.909% (1 Month LIBOR USD + 0.650%), 12/25/2036 (b) | | | 4,403,074 | | | | 3,083,732 | |
CitiMortgage Alternative Loan Trust, Series 2006-A7, Class 1A1, 6.000%, 12/25/2036 (g) | | | 2,291,677 | | | | 2,078,711 | |
See accompanying notes which are an integral part of these financial statements.
48
Angel Oak Multi-Strategy Income Fund
Consolidated Schedule of Investments – (continued)
July 31, 2022 (Unaudited)
| | | | | | | | |
| | | Principal
Amount | | | Value | |
Residential Mortgage-Backed Securities – (continued) | | | | | | | | |
CitiMortgage Alternative Loan Trust, Series 2007-A3, Class APO, 0.000%, 3/25/2037 (f) | | $ | 124,196 | | | $ | 60,830 | |
CitiMortgage Alternative Loan Trust, Series 2007-A3, Class 1A2,
2.859% (1 Month LIBOR USD + 0.600%), 3/25/2037 (b) | | | 2,534,887 | | | | 1,846,130 | |
CitiMortgage Alternative Loan Trust, Series 2007-A4, Class APO, 0.000%, 4/25/2037 (f) | | | 120,281 | | | | 60,936 | |
CitiMortgage Alternative Loan Trust, Series 2007-A4, Class 1A9,
2.859% (1 Month LIBOR USD + 0.600%), 4/25/2037 (b) | | | 1,589,124 | | | | 1,201,567 | |
CitiMortgage Alternative Loan Trust, Series 2007-A5, Class 1A3,
2.759% (1 Month LIBOR USD + 0.500%), 5/25/2037 (b) | | | 4,200,039 | | | | 3,028,434 | |
CitiMortgage Alternative Loan Trust, Series 2007-A6, Class 1A1,
2.859% (1 Month LIBOR USD + 0.600%), 6/25/2037 (b) | | | 1,785,486 | | | | 1,352,638 | |
COLT Funding LLC, Series 2021-3R, Class M1, 2.355%, 12/26/2064 (a)(g) | | | 2,862,000 | | | | 2,338,211 | |
COLT Mortgage Loan Trust, Series 2020-2R, Class B1, 4.118%, 10/26/2065 (a)(g) | | | 3,605,000 | | | | 3,276,098 | |
CountryWide Alternative Loan Trust, Series 2004-32CB, Class 2A2,
2.659% (1 Month LIBOR USD + 0.400%), 2/25/2035 (b) | | | 621,624 | | | | 485,606 | |
CountryWide Alternative Loan Trust, Series 2005-3CB, Class 1A4, 5.250%, 3/25/2035 | | | 389,792 | | | | 372,724 | |
CountryWide Alternative Loan Trust, Series 2005-14, Class 2X, 1.500%, 5/25/2035 (e)(g)(h) | | | 19,515,828 | | | | 433,115 | |
CountryWide Alternative Loan Trust, Series 2005-16, Class X2, 1.098%, 6/25/2035 (e)(g)(h) | | | 18,714,816 | | | | 342,668 | |
CountryWide Alternative Loan Trust, Series 2005-24, Class 1AX, 1.484%, 7/20/2035 (e)(g)(h) | | | 9,376,446 | | | | 138,762 | |
CountryWide Alternative Loan Trust, Series 2005-24, Class 2A1A,
1.953% (12 Month US Treasury Average + 1.310%), 7/20/2035 (b) | | | 509,396 | | | | 421,276 | |
CountryWide Alternative Loan Trust, Series 2005-24, Class 4A1,
2.586% (1 Month LIBOR USD + 0.460%), 7/20/2035 (b) | | | 4,095,807 | | | | 3,522,931 | |
CountryWide Alternative Loan Trust, Series 2005-26CB, Class A7,
2.559% (1 Month LIBOR USD + 0.300%), 7/25/2035 (b)(j) | | | 4,622,005 | | | | 3,278,268 | |
CountryWide Alternative Loan Trust, Series 2005-27, Class 2X1, 1.241%, 8/25/2035 (e)(g)(h) | | | 23,460,542 | | | | 184,963 | |
CountryWide Alternative Loan Trust, Series 2005-27, Class 1A4, 2.175%, 8/25/2035 (g) | | | 595,129 | | | | 510,422 | |
CountryWide Alternative Loan Trust, Series 2005-27, Class 1A5, 2.265%, 8/25/2035 (g) | | | 502,895 | | | | 490,626 | |
CountryWide Alternative Loan Trust, Series 2005-J9, Class 1A6, 5.500%, 8/25/2035 | | | 658,120 | | | | 531,572 | |
CountryWide Alternative Loan Trust, Series 2005-38, Class X, 1.224%, 9/25/2035 (e)(g)(h) | | | 48,294,725 | | | | 603,539 | |
CountryWide Alternative Loan Trust, Series 2005-41, Class 2X2, 1.401%, 9/25/2035 (e)(g)(h) | | | 3,700,362 | | | | 126,578 | |
CountryWide Alternative Loan Trust, Series 2005-41, Class 1A1,
2.919% (1 Month LIBOR USD + 0.660%), 9/25/2035 (b) | | | 323,326 | | | | 221,487 | |
CountryWide Alternative Loan Trust, Series 2005-44, Class 1X, 1.088%, 10/25/2035 (e)(g)(h) | | | 19,425,351 | | | | 402,338 | |
CountryWide Alternative Loan Trust, Series 2005-42CB, Class A4,
2.939% (1 Month LIBOR USD + 0.680%), 10/25/2035 (b) | | | 1,158,713 | | | | 670,526 | |
CountryWide Alternative Loan Trust, Series 2005-51, Class 3X2, 1.042%, 11/20/2035 (e)(g)(h) | | | 13,387,537 | | | | 246,130 | |
CountryWide Alternative Loan Trust, Series 2005-51, Class 4X, 1.152%, 11/20/2035 (e)(g)(h) | | | 18,186,420 | | | | 365,347 | |
CountryWide Alternative Loan Trust, Series 2005-51, Class 1X, 1.697%, 11/20/2035 (e)(g)(h) | | | 17,842,976 | | | | 1,188,306 | |
CountryWide Alternative Loan Trust, Series 2005-56, Class 4X, 1.090%, 11/25/2035 (e)(g)(h) | | | 23,528,322 | | | | 404,452 | |
CountryWide Alternative Loan Trust, Series 2005-J11, Class 1A4,
2.659% (1 Month LIBOR USD + 0.400%), 11/25/2035 (b) | | | 2,792,340 | | | | 1,614,115 | |
CountryWide Alternative Loan Trust, Series 2005-56, Class 3A1,
2.839% (1 Month LIBOR USD + 0.580%), 11/25/2035 (b) | | | 41,355 | | | | 39,159 | |
CountryWide Alternative Loan Trust, Series 2005-61, Class 1A1,
2.779% (1 Month LIBOR USD + 0.520%), 12/25/2035 (b) | | | 1,366,723 | | | | 1,192,338 | |
CountryWide Alternative Loan Trust, Series 2005-J14, Class A8, 5.500%, 12/25/2035 | | | 1,619,400 | | | | 1,407,912 | |
CountryWide Alternative Loan Trust, Series 2005-70CB, Class A4, 5.500%, 12/25/2035 | | | 3,560,385 | | | | 3,157,474 | |
CountryWide Alternative Loan Trust, Series 2005-75CB, Class A3, 5.500%, 1/25/2036 | | | 1,337,029 | | | | 1,074,625 | |
See accompanying notes which are an integral part of these financial statements.
49
Angel Oak Multi-Strategy Income Fund
Consolidated Schedule of Investments – (continued)
July 31, 2022 (Unaudited)
| | | | | | | | |
| | | Principal
Amount | | | Value | |
Residential Mortgage-Backed Securities – (continued) | | | | | | | | |
CountryWide Alternative Loan Trust, Series 2005-85CB, Class 2A5,
3.359% (1 Month LIBOR USD + 1.100%), 2/25/2036 (b) | | $ | 1,420,233 | | | $ | 1,158,175 | |
CountryWide Alternative Loan Trust, Series 2006-HY10, Class 1X,
0.476%, 5/25/2036 (e)(g)(h) | | | 2,972,060 | | | | 36,336 | |
CountryWide Alternative Loan Trust, Series 2006-OA3, Class X, 1.293%, 5/25/2036 (e)(g)(h) | | | 17,148,927 | | | | 342,293 | |
CountryWide Alternative Loan Trust, Series 2006-24CB, Class A5,
2.859% (1 Month LIBOR USD + 0.600%), 8/25/2036 (b) | | | 3,984,745 | | | | 1,791,434 | |
CountryWide Alternative Loan Trust, Series 2006-26CB, Class A15,
6.000% (1 Month LIBOR USD + 0.550%), 9/25/2036 (b) | | | 688,126 | | | | 430,851 | |
CountryWide Alternative Loan Trust, Series 2006-29T1, Class 2A13,
2.559% (1 Month LIBOR USD + 0.300%), 10/25/2036 (b) | | | 1,619,462 | | | | 737,461 | |
CountryWide Alternative Loan Trust, Series 2006-27CB, Class A4, 6.000%, 11/25/2036 | | | 664,773 | | | | 570,666 | |
CountryWide Alternative Loan Trust, Series 2006-36T2, Class 1A4, 5.750%, 12/25/2036 | | | 6,627,069 | | | | 4,183,092 | |
CountryWide Alternative Loan Trust, Series 2006-40T1, Class 1A5, 6.000%, 1/25/2037 | | | 557,688 | | | | 468,066 | |
CountryWide Alternative Loan Trust, Series 2006-J8, Class A2, 6.000%, 2/25/2037 | | | 2,793,765 | | | | 1,737,414 | |
CountryWide Alternative Loan Trust, Series 2006-OA1, Class 1X, 1.222%, 3/20/2046 (e)(g)(h) | | | 12,152,048 | | | | 252,179 | |
CountryWide Alternative Loan Trust, Series 2006-OA10, Class XAD, 1.359%, 8/25/2046 (e)(h)(o) | | | 23,982,827 | | | | 303,479 | |
CountryWide Alternative Loan Trust, Series 2006-OA10, Class XNB,
1.814%, 8/25/2046 (e)(g)(h) | | | 22,929,922 | | | | 211,345 | |
CountryWide Alternative Loan Trust, Series 2006-OA10, Class XPP,
1.865%, 8/25/2046 (e)(g)(h) | | | 13,751,970 | | | | 95,425 | |
CountryWide Alternative Loan Trust, Series 2007-20, Class A1,
2.759% (1 Month LIBOR USD + 0.500%), 8/25/2047 (b) | | | 3,249,207 | | | | 1,410,913 | |
CountryWide Alternative Loan Trust Resecuritization, Series 2005-58R, Class A, 1.527%, 12/20/2035 (a)(g)(h) | | | 43,435,475 | | | | 2,986,536 | |
CountryWide Alternative Loan Trust Resecuritization, Series 2005-59R, Class A, 2.210%, 12/20/2035 (a)(g)(h) | | | 12,309,687 | | | | 342,825 | |
CountryWide Home Loan Mortgage Pass-Through Trust, Series 2004-20, Class X, 0.974%, 10/25/2034 (e)(g)(h) | | | 6,498,387 | | | | 264,491 | |
CountryWide Home Loan Mortgage Pass-Through Trust, Series 2004-29, Class 1X, 0.834%, 2/25/2035 (e)(g)(h) | | | 3,479,749 | | | | 39,568 | |
CountryWide Home Loan Mortgage Pass-Through Trust, Series 2004-25, Class 1X, 0.855%, 2/25/2035 (e)(g)(h) | | | 14,840,184 | | | | 170,974 | |
CountryWide Home Loan Mortgage Pass-Through Trust, Series 2004-25, Class 2A3,
2.999% (1 Month LIBOR USD + 0.740%), 2/25/2035 (b) | | | 1,435,668 | | | | 1,197,670 | |
CountryWide Home Loan Mortgage Pass-Through Trust, Series 2005-7, Class 3X, 0.859%, 3/25/2035 (e)(g)(h) | | | 1,005,467 | | | | 28,708 | |
CountryWide Home Loan Mortgage Pass-Through Trust, Series 2005-1, Class 1X, 1.059%, 3/25/2035 (e)(g)(h) | | | 3,388,055 | | | | 101,770 | |
CountryWide Home Loan Mortgage Pass-Through Trust, Series 2005-2, Class 2X, 1.122%, 3/25/2035 (e)(g)(h) | | | 8,844,707 | | | | 179,141 | |
CountryWide Home Loan Mortgage Pass-Through Trust, Series 2005-7, Clas 3A2, 2.702%, 3/25/2035 (g) | | | 3,702,128 | | | | 3,119,247 | |
CountryWide Home Loan Mortgage Pass-Through Trust, Series 2005-2, Class 1A1,
2.899% (1 Month LIBOR USD + 0.640%), 3/25/2035 (b) | | | 706,398 | | | | 587,766 | |
CountryWide Home Loan Mortgage Pass-Through Trust, Series 2005-11, Class 4X, 0.771%, 4/25/2035 (e)(g)(h) | | | 5,579,342 | | | | 98,648 | |
See accompanying notes which are an integral part of these financial statements.
50
Angel Oak Multi-Strategy Income Fund
Consolidated Schedule of Investments – (continued)
July 31, 2022 (Unaudited)
| | | | | | | | |
| | | Principal
Amount | | | Value | |
Residential Mortgage-Backed Securities – (continued) | | | | | | | | |
CountryWide Home Loan Mortgage Pass-Through Trust, Series 2006-HYB1, Class 3A1, 2.784%, 3/20/2036 (g) | | $ | 5,006,870 | | | $ | 4,753,718 | |
CountryWide Home Loan Mortgage Pass-Through Trust, Series 2006-8, Class 1A1, 6.000%, 5/25/2036 | | | 1,268,041 | | | | 1,116,017 | |
CountryWide Home Loan Mortgage Pass-Through Trust, Series 2006-12, Class X, 0.154%, 7/25/2036 (e)(g)(h) | | | 16,669,017 | | | | 87,529 | |
CountryWide Home Loan Mortgage Pass-Through Trust, Series 2007-4, Class 1A1, 6.000%, 5/25/2037 | | | 1,361,019 | | | | 1,016,694 | |
CountryWide Home Loan Mortgage Pass-Through Trust, Series 2007-7, Class A3, 5.750%, 6/25/2037 | | | 717,368 | | | | 564,106 | |
CountryWide Home Loan Mortgage Pass-Through Trust, Series 2007-J2, Class 2A1,
2.909% (1 Month LIBOR USD + 0.650%), 7/25/2037 (b) | | | 4,529,107 | | | | 1,036,726 | |
CountryWide Home Loan Mortgage Pass-Through Trust, Series 2007-18, Class 2A1, 6.500%, 11/25/2037 | | | 1,950,438 | | | | 1,196,531 | |
CountryWide Home Loan Mortgage Pass-Through Trust, Series 2007-8, Class 1A12, 5.875%, 1/25/2038 | | | 2,797,322 | | | | 2,159,152 | |
Credit Suisse First Boston Mortgage Securities Corp., Series 2005-7, Class 2A1, 5.250%, 8/25/2035 (j) | | | 8,053,562 | | | | 5,805,612 | |
Credit Suisse First Boston Mortgage Securities Corp., Series 2005-10, Class 6A12, 5.500%, 11/25/2035 | | | 2,279,036 | | | | 1,836,075 | |
Credit Suisse Mortgage Trust, Series 2015-6R, Class 1A2, 3.217%, 7/27/2035 (a)(g) | | | 6,834,800 | | | | 5,783,355 | |
Credit Suisse Mortgage Trust, Series 2014-3R, Class 1A1,
2.273% (1 Month LIBOR USD + 0.450%), 3/27/2036 (a)(b) | | | 391,142 | | | | 371,130 | |
Credit Suisse Mortgage Trust, Series 2021-AFC1, Class B1, 3.251%, 3/25/2056 (a)(g) | | | 3,031,450 | | | | 2,706,100 | |
Credit Suisse Mortgage Trust, Series 2021-AFC1, Class B2, 4.255%, 3/25/2056 (a)(g) | | | 1,539,950 | | | | 1,370,050 | |
Credit Suisse Mortgage Trust, Series 2021-INV1, Class AIOS,
0.040%, 7/25/2056 (a)(g)(h) | | | 124,142,559 | | | | 234,754 | |
Credit Suisse Mortgage Trust, Series 2021-INV1, Class AX4,
0.400%, 7/25/2056 (a)(g)(h) | | | 8,436,659 | | | | 133,746 | |
Credit Suisse Mortgage Trust, Series 2021-INV1, Class B4, 3.085%, 7/25/2056 (a)(g) | | | 2,448,838 | | | | 1,966,400 | |
Credit Suisse Mortgage Trust, Series 2021-INV1, Class B3, 3.085%, 7/25/2056 (a)(g) | | | 4,382,911 | | | | 3,765,004 | |
Credit Suisse Mortgage Trust, Series 2021-INV1, Class B6, 3.085%, 7/25/2056 (a)(g) | | | 1,323,281 | | | | 425,038 | |
Credit Suisse Mortgage Trust, Series 2021-INV1, Class B1, 3.085%, 7/25/2056 (a)(g) | | | 5,801,293 | | | | 5,406,578 | |
Credit Suisse Mortgage Trust, Series 2021-INV1, Class B5, 3.085%, 7/25/2056 (a)(g) | | | 1,675,764 | | | | 1,072,374 | |
Credit Suisse Mortgage Trust, Series 2021-INV1, Class B2, 3.085%, 7/25/2056 (a)(g) | | | 5,413,368 | | | | 4,691,094 | |
Credit Suisse Mortgage Trust, Series 2021-INV2, Class AIOS,
0.040%, 11/25/2056 (a)(e)(g)(h) | | | 360,358,473 | | | | 676,393 | |
Credit Suisse Mortgage Trust, Series 2021-INV2, Class AX1,
0.135%, 11/25/2056 (a)(g)(h) | | | 324,890,896 | | | | 1,808,343 | |
Credit Suisse Mortgage Trust, Series 2021-INV2, Class AX4,
0.150%, 11/25/2056 (a)(g)(h) | | | 20,920,231 | | | | 143,157 | |
Credit Suisse Mortgage Trust, Series 2021-INV2, Class A15X,
0.500%, 11/25/2056 (a)(g)(h) | | | 13,658,767 | | | | 311,912 | |
Credit Suisse Mortgage Trust, Series 2021-INV2, Class A3X,
0.500%, 11/25/2056 (a)(g)(h) | | | 186,982,682 | | | | 4,269,937 | |
Credit Suisse Mortgage Trust, Series 2021-INV2, Class A5A,
2.500%, 11/25/2056 (a)(c)(g) | | | 19,210,526 | | | | 17,798,975 | |
Credit Suisse Mortgage Trust, Series 2021-INV2, Class A11X,
3.224% (SOFR30A + 4.100%), 11/25/2056 (a)(b)(h) | | | 22,797,800 | | | | 1,879,473 | |
Credit Suisse Mortgage Trust, Series 2021-INV2, Class B2,
3.285%, 11/25/2056 (a)(c)(g) | | | 8,130,561 | | | | 7,008,268 | |
Credit Suisse Mortgage Trust, Series 2021-INV2, Class B5,
3.285%, 11/25/2056 (a)(g) | | | 2,903,757 | | | | 2,099,187 | |
Credit Suisse Mortgage Trust, Series 2021-INV2, Class B6,
3.285%, 11/25/2056 (a)(g) | | | 2,364,325 | | | | 823,291 | |
Credit Suisse Mortgage Trust, Series 2021-INV2, Class B4,
3.285%, 11/25/2056 (a)(g) | | | 4,452,250 | | | | 3,610,285 | |
Credit Suisse Mortgage Trust, Series 2021-INV2, Class B3,
3.285%, 11/25/2056 (a)(g) | | | 7,937,310 | | | | 6,773,073 | |
Credit Suisse Mortgage Trust, Series 2021-INV2, Class B1,
3.285%, 11/25/2056 (a)(c)(g) | | | 9,679,373 | | | | 8,960,505 | |
Credit Suisse Mortgage Trust, Series 2017-RPL3, Class B5,
4.328%, 8/25/2057 (a)(g) | | | 10,254,900 | | | | 9,531,037 | |
See accompanying notes which are an integral part of these financial statements.
51
Angel Oak Multi-Strategy Income Fund
Consolidated Schedule of Investments – (continued)
July 31, 2022 (Unaudited)
| | | | | | | | |
| | | Principal
Amount | | | Value | |
Residential Mortgage-Backed Securities – (continued) | | | | | | | | |
Credit Suisse Mortgage Trust, Series 2020-RPL4, Class XS,
1.594%, 1/25/2060 (a)(g)(h) | | $ | 210,246,520 | | | $ | 9,159,390 | |
Credit Suisse Mortgage Trust, Series 2020-RPL4, Class B3,
3.959%, 1/25/2060 (a)(g) | | | 7,204,424 | | | | 6,184,695 | |
Credit Suisse Mortgage Trust, Series 2020-RPL4, Class B4,
3.959%, 1/25/2060 (a)(g) | | | 7,205,554 | | | | 5,509,143 | |
Credit Suisse Mortgage Trust, Series 2021-NQM8, Class A2,
2.303%, 10/25/2066 (a)(g) | | | 1,916,818 | | | | 1,731,456 | |
CSMC Mortgage-Backed Trust, Series 2006-4, Class 1A1,
2.959% (1 Month LIBOR USD + 0.700%), 5/25/2036 (b) | | | 1,756,940 | | | | 927,981 | |
CSMC Mortgage-Backed Trust, Series 2006-4, Class 1A3, 6.000%, 5/25/2036 | | | 1,148,409 | | | | 871,415 | |
CSMC Trust, Series 2021-NQM7, Class A2, 1.961%, 10/25/2066 (a)(g) | | | 3,076,847 | | | | 2,865,397 | |
CSMCM Trust, Series 2018-RPL3, Class CERT, 2.741%, 7/25/2050 (a)(e)(g) | | | 10,928,934 | | | | 10,201,799 | |
CSMCM Trust, Series 2018-RPL1, Class CERT, 2.744%, 7/25/2057 (a)(e)(g) | | | 13,316,288 | | | | 13,027,977 | |
Deephaven Residential Mortgage Trust, Series 2021-4, Class A1, 1.931%, 11/25/2066 (a)(g) | | | 1,746,366 | | | | 1,589,640 | |
Deutsche Alt-A Securities, Inc. Mortgage Loan Trust, Series 2005-AR1, Class 1A1,
2.569% (1 Month LIBOR USD + 0.310%), 8/25/2035 (b) | | | 2,331,841 | | | | 1,850,313 | |
Deutsche Alt-A Securities, Inc. Mortgage Loan Trust, Series 2005-5, Class 2A4, 5.500%, 11/25/2035 | | | 3,813,105 | | | | 3,147,932 | |
Deutsche Alt-A Securities, Inc. Mortgage Loan Trust, Series 2005-5, Class 2A7, 5.500%, 11/25/2035 | | | 248,959 | | | | 198,982 | |
Deutsche Alt-A Securities, Inc. Mortgage Loan Trust, Series 2005-6, Class 1A4, 5.500%, 12/25/2035 | | | 407,358 | | | | 392,472 | |
Deutsche Alt-A Securities, Inc. Mortgage Loan Trust, Series 2006-AR1, Class 2A1, 2.876%, 2/25/2036 (g) | | | 415,125 | | | | 353,356 | |
Deutsche Alt-A Securities, Inc. Mortgage Loan Trust, Series 2006-AR3, Class A2,
2.499% (1 Month LIBOR USD + 0.240%), 8/25/2036 (b)(j) | | | 2,750,695 | | | | 2,515,874 | |
Deutsche Alt-A Securities, Inc. Mortgage Loan Trust, Series 2006-AR5, Class 1A1,
2.519% (1 Month LIBOR USD + 0.260%), 10/25/2036 (b) | | | 7,568,822 | | | | 2,861,499 | |
Deutsche Alt-A Securities, Inc. Mortgage Loan Trust, Series 2007-BAR1, Class A4,
2.739% (1 Month LIBOR USD + 0.480%), 3/25/2037 (b) | | | 76,432,950 | | | | 6,613,972 | |
Deutsche Alt-A Securities, Inc. Mortgage Loan Trust, Series 2007-AB1, Class PO, 0.000%, 4/25/2037 (f) | | | 481,691 | | | | 300,768 | |
Deutsche Alt-A Securities, Inc. Mortgage Loan Trust, Series 2007-AR3, Class 2A4,
2.959% (1 Month LIBOR USD + 0.700%), 6/25/2037 (b)(j) | | | 19,226,977 | | | | 16,207,245 | |
Deutsche Alt-A Securities, Inc. Mortgage Loan Trust, Series 2007-AR1, Class A1,
2.499% (1 Month LIBOR USD + 0.240%), 1/25/2047 (b)(j) | | | 8,336,156 | | | | 8,074,076 | |
Deutsche Alt-A Securities, Inc. Mortgage Loan Trust, Series 2007-AR1, Class A2,
2.619% (1 Month LIBOR USD + 0.360%), 1/25/2047 (b) | | | 1,089,115 | | | | 863,161 | |
Deutsche Alt-A Securities, Inc. Mortgage Loan Trust, Series 2007-OA2, Class A1,
1.413% (12 Month US Treasury Average + 0.770%), 4/25/2047 (b) | | | 692,634 | | | | 654,969 | |
Deutsche Alt-A Securities, Inc. Mortgage Loan Trust, Series 2007-OA4, Class A4,
2.044% (1 Month LIBOR USD + 0.210%), 8/25/2047 (b)(j) | | | 16,195,911 | | | | 14,841,544 | |
Deutsche Alt-A Securities, Inc. Mortgage Loan Trust, Series 2007-OA4, Class 2A1,
2.459% (1 Month LIBOR USD + 0.400%), 8/25/2047 (b)(j) | | | 6,995,366 | | | | 6,192,976 | |
Deutsche Alt-A Securities, Inc. Mortgage Loan Trust, Series 2007-OA5, Class A1A,
2.459% (1 Month LIBOR USD + 0.200%), 8/25/2047 (b) | | | 1,435,134 | | | | 1,279,963 | |
Deutsche Alt-B Securities, Inc. Mortgage Loan Trust, Series 2006-AB1, Class A2B, 5.600%, 2/25/2036 (g) | | | 3,897,194 | | | | 3,843,822 | |
Deutsche Alt-B Securities, Inc. Mortgage Loan Trust, Series 2006-AB1, Class A2D, 5.720%, 2/25/2036 (g) | | | 3,883,146 | | | | 3,766,431 | |
Deutsche Alt-B Securities, Inc. Mortgage Loan Trust, Series 2006-AB2, Class A8, 5.734%, 6/25/2036 (g) | | | 3,143,915 | | | | 2,977,121 | |
See accompanying notes which are an integral part of these financial statements.
52
Angel Oak Multi-Strategy Income Fund
Consolidated Schedule of Investments – (continued)
July 31, 2022 (Unaudited)
| | | | | | | | |
| | | Principal
Amount | | | Value | |
Residential Mortgage-Backed Securities – (continued) | | | | | | | | |
Deutsche Alt-B Securities, Inc. Mortgage Loan Trust, Series 2006-AB2, Class A1, 5.888%, 6/25/2036 (g) | | $ | 378,857 | | | $ | 361,566 | |
Deutsche Alt-B Securities, Inc. Mortgage Loan Trust, Series 2006-AB2, Class A2, 6.160%, 6/25/2036 (g) | | | 1,685,630 | | | | 1,605,738 | |
Deutsche Alt-B Securities, Inc. Mortgage Loan Trust, Series 2006-AB2, Class A3, 6.270%, 6/25/2036 (g) | | | 531,878 | | | | 522,734 | |
Deutsche Alt-B Securities, Inc. Mortgage Loan Trust, Series 2006-AB2, Class A5B, 6.593%, 6/25/2036 (o) | | | 368,844 | | | | 340,287 | |
Deutsche Alt-B Securities, Inc. Mortgage Loan Trust, Series 2006-AB3, Class A2, 6.420%, 7/25/2036 (g)(j) | | | 2,031,626 | | | | 1,785,925 | |
Deutsche Alt-B Securities, Inc. Mortgage Loan Trust, Series 2006-AB3, Class A5B, 6.800%, 7/25/2036 (o) | | | 197,058 | | | | 178,137 | |
Deutsche Alt-B Securities, Inc. Mortgage Loan Trust, Series 2006-AB4, Classs A1C, 6.000%, 10/25/2036 (g) | | | 5,003,903 | | | | 4,749,350 | |
Deutsche Alt-B Securities, Inc. Mortgage Loan Trust, Series 2006-AB4, Class A4B, 6.500%, 10/25/2036 (j)(o) | | | 6,732,439 | | | | 6,336,006 | |
Deutsche Mortgage Securities, Inc. REMIC Trust, Series 2007-WM1, Class A1, 3.478%, 6/27/2037 (a)(g)(j) | | | 12,381,105 | | | | 11,462,464 | |
Deutsche Mortgage Securities, Inc. REMIC Trust, Series 2009-RS6, Class A2B, 2.986%, 8/25/2037 (a)(g)(j) | | | 8,126,990 | | | | 7,880,596 | |
DSLA Mortgage Loan Trust, Series 2005-AR2, Class C, 0.000%, 3/19/2045 | | | 1 | | | | 502,253 | |
DSLA Mortgage Loan Trust, Series 2006-AR2, Class 2A1A,
2.320% (1 Month LIBOR USD + 0.200%), 10/19/2036 (b)(j) | | | 20,150,830 | | | | 17,124,115 | |
DSLA Mortgage Loan Trust, Series 2007-AR1, Class 1A1A,
2.260% (1 Month LIBOR USD + 0.140%), 3/19/2037 (b)(j) | | | 35,712,175 | | | | 30,785,038 | |
DSLA Mortgage Loan Trust, Series 2004-AR1, Class X2, 0.984%, 9/19/2044 (e)(g)(h) | | | 14,795,642 | | | | 184,206 | |
DSLA Mortgage Loan Trust, Series 2004-AR1, Class A2A,
2.940% (1 Month LIBOR USD + 0.820%), 9/19/2044 (b) | | | 683,447 | | | | 609,566 | |
DSLA Mortgage Loan Trust, Series 2004-AR2, Class C, 0.000%, 11/19/2044 (l) | | | 1,000 | | | | 1 | |
DSLA Mortgage Loan Trust, Series 2004-AR2, Class X2, 1.042%, 11/19/2044 (e)(g)(h) | | | 14,043,249 | | | | 170,934 | |
DSLA Mortgage Loan Trust, Series 2004-AR4, Class X2, 0.920%, 1/19/2045 (e)(g)(h) | | | 11,867,574 | | | | 79,169 | |
DSLA Mortgage Loan Trust, Series 2004-AR4, Class 1A1A,
2.840% (1 Month LIBOR USD + 0.720%), 1/19/2045 (b)(j) | | | 8,004,752 | | | | 6,783,963 | |
DSLA Mortgage Loan Trust, Series 2005-AR1, Class C, 0.000%, 2/19/2045 (l) | | | 1,000,000 | | | | 10,000 | |
DSLA Mortgage Loan Trust, Series 2005-AR1, Class X2, 1.228%, 3/19/2045 (e)(g)(h) | | | 23,046,319 | | | | 275,772 | |
DSLA Mortgage Loan Trust, Series 2005-AR1, Class 1A,
2.660% (1 Month LIBOR USD + 0.540%), 3/19/2045 (b)(j) | | | 19,450,757 | | | | 17,467,285 | |
DSLA Mortgage Loan Trust, Series 2005-AR2, Class 2A1A,
2.540% (1 Month LIBOR USD + 0.420%), 6/19/2045 (b) | | | 2,946,786 | | | | 2,582,764 | |
DSLA Mortgage Loan Trust, Series 2005-AR2, Class 2A1C,
2.560% (1 Month LIBOR USD + 0.440%), 6/19/2045 (b) | | | 1,525,351 | | | | 1,401,753 | |
DSLA Mortgage Loan Trust, Series 2005-AR4, Class 2A1A,
2.640% (1 Month LIBOR USD + 0.520%), 8/19/2045 (b) | | | 1,195,239 | | | | 1,084,051 | |
DSLA Mortgage Loan Trust, Series 2005-AR4, Class 1A,
2.640% (1 Month LIBOR USD + 0.520%), 8/19/2045 (b) | | | 156,967 | | | | 126,939 | |
DSLA Mortgage Loan Trust, Series 2006-AR1, Class 1A1A,
1.563% (12 Month US Treasury Average + 0.920%), 3/19/2046 (b)(j) | | | 9,236,389 | | | | 7,771,978 | |
Eagle RE Ltd., Series 2018-1, Class M2,
5.259% (1 Month LIBOR USD + 3.000%), 11/27/2028 (a)(b) | | | 10,717,000 | | | | 10,640,159 | |
See accompanying notes which are an integral part of these financial statements.
53
Angel Oak Multi-Strategy Income Fund
Consolidated Schedule of Investments – (continued)
July 31, 2022 (Unaudited)
| | | | | | | | |
| | | Principal
Amount | | | Value | |
Residential Mortgage-Backed Securities – (continued) | | | | | | | | |
Eagle RE Ltd., Series 2019-1, Class M2,
5.559% (1 Month LIBOR USD + 3.300%), 4/25/2029 (a)(b) | | $ | 20,903,000 | | | $ | 20,615,876 | |
Eagle RE Ltd., Series 2019-1, Class B1,
6.759% (1 Month LIBOR USD + 4.500%), 4/25/2029 (a)(b) | | | 7,909,125 | | | | 7,760,054 | |
Eagle RE Ltd., Series 2020-1, Class M1C,
4.059% (1 Month LIBOR USD + 1.800%), 1/25/2030 (a)(b) | | | 3,500,000 | | | | 3,338,573 | |
Eagle RE Ltd., Series 2020-1, Class M2,
4.259% (1 Month LIBOR USD + 2.000%), 1/25/2030 (a)(b) | | | 23,461,850 | | | | 21,968,972 | |
Eagle RE Ltd., Series 2020-1, Class B1,
5.109% (1 Month LIBOR USD + 2.850%), 1/25/2030 (a)(b) | | | 2,000,000 | | | | 1,860,926 | |
Eagle RE Ltd., Series 2021-1, Class M2, 5.964% (SOFR30A + 4.450%), 10/25/2033 (a)(b) | | | 8,000,000 | | | | 7,530,424 | |
Eagle RE Ltd., Series 2021-2, Class M2, 5.764% (SOFR30A + 4.250%), 4/25/2034 (a)(b) | | | 3,000,000 | | | | 2,841,354 | |
First Horizon Alternative Mortgage Securities Trust, Series 2005-AA9, Class 3A1, 2.817%, 11/25/2035 (g) | | | 963,223 | | | | 825,054 | |
First Horizon Alternative Mortgage Securities Trust, Series 2005-FA8, Class 1A18, 5.500%, 11/25/2035 | | | 6,323 | | | | 5,377 | |
First Horizon Alternative Mortgage Securities Trust, Series 2006-FA1, Class 1A8,
2.759% (1 Month LIBOR USD + 0.500%), 4/25/2036 (b) | | | 3,706,156 | | | | 1,721,409 | |
First Horizon Alternative Mortgage Securities Trust, Series 2006-FA1, Class 1A12, 6.000%, 4/25/2036 | | | 219,422 | | | | 148,033 | |
First Horizon Alternative Mortgage Securities Trust, Series 2006-AA2, Class 2A1, 2.699%, 5/25/2036 (g) | | | 422,972 | | | | 367,465 | |
First Horizon Mortgage Pass-Through Trust, Series 2005-AR4, Class 4A3, 2.925%, 9/25/2035 (g) | | | 41,946 | | | | 35,540 | |
Flagstar Mortgage Trust, Series 2021-9INV, Class AX1, 0.501%, 10/25/2041 (a)(g)(h) | | | 260,093,487 | | | | 3,728,180 | |
Flagstar Mortgage Trust, Series 2021-9INV, Class B6C, 2.839%, 10/25/2041 (a)(g) | | | 1,827,125 | | | | 757,084 | |
Flagstar Mortgage Trust, Series 2021-9INV, Class B4, 3.001%, 10/25/2041 (a)(g) | | | 576,959 | | | | 495,040 | |
Flagstar Mortgage Trust, Series 2021-9INV, Class B5, 3.001%, 10/25/2041 (a)(g) | | | 1,442,846 | | | | 909,915 | |
Flagstar Mortgage Trust, Series 2017-2, Class B5, 4.047%, 10/25/2047 (a)(g) | | | 1,153,000 | | | | 1,020,967 | |
Flagstar Mortgage Trust, Series 2018-2, Class B5, 4.012%, 4/25/2048 (a)(g) | | | 2,880,517 | | | | 2,634,685 | |
Flagstar Mortgage Trust, Series 2018-6RR, Class B5, 4.917%, 10/25/2048 (a)(g) | | | 2,478,000 | | | | 2,327,303 | |
Flagstar Mortgage Trust, Series 2021-1, Class B6C, 3.005%, 2/27/2051 (a)(g) | | | 2,932,342 | | | | 973,652 | |
Flagstar Mortgage Trust, Series 2021-1, Class B5, 3.130%, 2/27/2051 (a)(g) | | | 1,222,000 | | | | 789,573 | |
Flagstar Mortgage Trust, Series 2021-1, Class B4, 3.130%, 2/27/2051 (a)(g) | | | 2,825,675 | | | | 2,338,184 | |
Flagstar Mortgage Trust, Series 2021-2, Class B6C, 2.613%, 4/25/2051 (a)(g) | | | 1,792,016 | | | | 535,363 | |
Flagstar Mortgage Trust, Series 2021-2, Class B5, 2.787%, 4/25/2051 (a)(g) | | | 1,343,000 | | | | 655,799 | |
Flagstar Mortgage Trust, Series 2021-2, Class B4, 2.787%, 4/25/2051 (a)(g) | | | 1,340,188 | | | | 812,205 | |
Flagstar Mortgage Trust, Series 2021-4, Class B6C, 2.434%, 6/25/2051 (a)(g) | | | 3,378,231 | | | | 1,018,557 | |
Flagstar Mortgage Trust, Series 2021-4, Class B5, 2.711%, 6/25/2051 (a)(g) | | | 1,461,198 | | | | 990,185 | |
Flagstar Mortgage Trust, Series 2021-4, Class B4, 2.711%, 6/25/2051 (a)(g) | | | 1,704,569 | | | | 1,332,022 | |
Flagstar Mortgage Trust, Series 2021-6INV, Class B6C, 3.391%, 8/25/2051 (a)(g) | | | 10,688,517 | | | | 5,408,037 | |
Flagstar Mortgage Trust, Series 2021-6INV, Class B1, 3.500%, 8/25/2051 (a)(g) | | | 5,863,850 | | | | 5,465,413 | |
Flagstar Mortgage Trust, Series 2021-6INV, Class B2, 3.500%, 8/25/2051 (a)(c)(g) | | | 13,790,717 | | | | 12,299,140 | |
Flagstar Mortgage Trust, Series 2021-6INV, Class B4, 3.500%, 8/25/2051 (a)(g) | | | 8,618,266 | | | | 7,145,111 | |
Flagstar Mortgage Trust, Series 2021-6INV, Class B5, 3.500%, 8/25/2051 (a)(g) | | | 3,102,911 | | | | 2,351,824 | |
Flagstar Mortgage Trust, Series 2021-6INV, Class B3, 3.500%, 8/25/2051 (a)(c)(g) | | | 12,066,877 | | | | 10,449,360 | |
Flagstar Mortgage Trust, Series 2021-10IN, Class B6C, 3.375%, 10/25/2051 (a)(g) | | | 14,040,430 | | | | 7,930,934 | |
Flagstar Mortgage Trust, Series 2021-10IN, Class B5, 3.520%, 10/25/2051 (a)(g) | | | 1,248,135 | | | | 888,569 | |
Flagstar Mortgage Trust, Series 2021-10IN, Class B4, 3.520%, 10/25/2051 (a)(g) | | | 9,048,278 | | | | 7,404,595 | |
See accompanying notes which are an integral part of these financial statements.
54
Angel Oak Multi-Strategy Income Fund
Consolidated Schedule of Investments – (continued)
July 31, 2022 (Unaudited)
| | | | | | | | |
| | | Principal
Amount | | | Value | |
Residential Mortgage-Backed Securities – (continued) | | | | | | | | |
GMAC Mortgage Corp. Loan Trust, Series 2005-AR5, Class 5A1, 3.124%, 9/19/2035 (g) | | $ | 42,414 | | | $ | 37,561 | |
GMAC Mortgage Corp. Loan Trust, Series 2006-AR1, Class 1A1, 2.902%, 4/19/2036 (g) | | | 730,186 | | | | 646,226 | |
Greenpoint Mortgage Funding Trust, Series 2005-AR1, Class X1, 1.363%, 6/25/2045 (e)(g)(h) | | | 16,966,554 | | | | 357,672 | |
Greenpoint Mortgage Funding Trust, Series 2005-AR3, Class X1, 1.583%, 8/25/2045 (e)(g)(h) | | | 23,177,825 | | | | 1,364,896 | |
GreenPoint Mortgage Funding Trust, Series 2006-AR3, Class 4X, 1.000%, 4/25/2036 (e)(h) | | | 23,678,253 | | | | 533,211 | |
GreenPoint Mortgage Funding Trust, Series 2006-OH1, Class A1,
2.619% (1 Month LIBOR USD + 0.180%), 1/26/2037 (b) | | | 8,830,574 | | | | 7,735,141 | |
GreenPoint Mortgage Funding Trust, Series 2007-AR3, Class A1,
2.699% (1 Month LIBOR USD + 0.440%), 6/25/2037 (b) | | | 2,717,781 | | | | 2,370,900 | |
GreenPoint Mortgage Funding Trust, Series 2005-AR4, Class X4, 1.507%, 10/25/2045 (e)(g)(h) | | | 12,867,107 | | | | 274,648 | |
GreenPoint Mortgage Funding Trust, Series 2005-AR4, Class 4A1A,
2.879% (1 Month LIBOR USD + 0.620%), 10/25/2045 (b) | | | 1,488,577 | | | | 1,196,132 | |
GS Mortgage-Backed Securities Corp. Trust, Series 2020-PJ6, Class AX1, 0.030%, 1/25/2043 (a)(e)(g)(h) | | | 363,589,158 | | | | 475,938 | |
GS Mortgage-Backed Securities Corp. Trust, Series 2020-PJ6, Class B4, 2.780%, 3/25/2044 (a)(g) | | | 1,827,133 | | | | 1,468,418 | |
GS Mortgage-Backed Securities Corp. Trust, Series 2020-PJ6, Class B5, 2.780%, 4/25/2045 (a)(g) | | | 1,567,214 | | | | 1,096,196 | |
GS Mortgage-Backed Securities Corp. Trust, Series 2019-PJ1, Class B4, 4.081%, 8/25/2049 (a)(g) | | | 1,500,000 | | | | 1,405,880 | |
GS Mortgage-Backed Securities Corp. Trust, Series 2019-PJ1, Class B5, 4.081%, 8/25/2049 (a)(g) | | | 577,000 | | | | 536,011 | |
GS Mortgage-Backed Securities Corp. Trust, Series 2019-PJ3, Class AIOS, 0.220%, 3/25/2050 (a)(g)(h) | | | 37,294,052 | | | | 132,207 | |
GS Mortgage-Backed Securities Corp. Trust, Series 2019-PJ3, Class B6, 3.986%, 3/25/2050 (a)(g) | | | 1,834,800 | | | | 1,404,191 | |
GS Mortgage-Backed Securities Corp. Trust, Series 2020-PJ5, Class B4, 3.278%, 3/25/2051 (a)(g) | | | 2,187,086 | | | | 1,908,263 | |
GS Mortgage-Backed Securities Corp. Trust, Series 2020-PJ5, Class B5, 3.278%, 3/25/2051 (a)(g) | | | 1,788,909 | | | | 1,412,553 | |
GS Mortgage-Backed Securities Corp. Trust, Series 2020-PJ6, Class B6, 2.780%, 5/25/2051 (a)(g) | | | 1,709,317 | | | | 814,519 | |
GS Mortgage-Backed Securities Corp. Trust, Series 2021-PJ1, Class B5, 2.760%, 6/25/2051 (a)(g) | | | 1,039,000 | | | | 565,813 | |
GS Mortgage-Backed Securities Corp. Trust, Series 2021-PJ1, Class B4, 2.760%, 6/25/2051 (a)(g) | | | 2,401,301 | | | | 1,746,644 | |
GS Mortgage-Backed Securities Corp. Trust, Series 2021-PJ1, Class B6, 2.760%, 6/25/2051 (a)(g) | | | 2,079,428 | | | | 704,749 | |
GS Mortgage-Backed Securities Corp. Trust, Series 2021-PJ3, Class B5, 2.651%, 8/25/2051 (a)(g) | | | 1,281,497 | | | | 749,966 | |
GS Mortgage-Backed Securities Corp. Trust, Series 2021-PJ3, Class B4, 2.651%, 8/25/2051 (a)(g) | | | 1,281,497 | | | | 998,553 | |
GS Mortgage-Backed Securities Corp. Trust, Series 2021-PJ3, Class B6, 2.651%, 8/25/2051 (a)(g) | | | 2,208,829 | | | | 656,740 | |
GS Mortgage-Backed Securities Corp. Trust, Series 2021-PJ4, Class AX1, 0.019%, 9/25/2051 (a)(g)(h) | | | 516,809,624 | | | | 312,670 | |
GS Mortgage-Backed Securities Corp. Trust, Series 2021-PJ4, Class B6, 2.619%, 9/25/2051 (a)(g) | | | 2,482,669 | | | | 741,067 | |
See accompanying notes which are an integral part of these financial statements.
55
Angel Oak Multi-Strategy Income Fund
Consolidated Schedule of Investments – (continued)
July 31, 2022 (Unaudited)
| | | | | | | | |
| | | Principal
Amount | | | Value | |
Residential Mortgage-Backed Securities – (continued) | | | | | | | | |
GS Mortgage-Backed Securities Corp. Trust, Series 2021-PJ4, Class B4, 2.619%, 9/25/2051 (a)(g) | | $ | 2,711,658 | | | $ | 1,736,918 | |
GS Mortgage-Backed Securities Corp. Trust, Series 2021-PJ4, Class B2, 2.619%, 9/25/2051 (a)(g) | | | 8,071,035 | | | | 7,067,805 | |
GS Mortgage-Backed Securities Corp. Trust, Series 2021-PJ4, Class B1, 2.619%, 9/25/2051 (a)(g) | | | 5,122,990 | | | | 4,757,690 | |
GS Mortgage-Backed Securities Corp. Trust, Series 2021-PJ4, Class B5, 2.619%, 9/25/2051 (a)(g) | | | 1,244,000 | | | | 594,872 | |
GS Mortgage-Backed Securities Corp. Trust, Series 2021-PJ5, Class B6, 2.588%, 10/25/2051 (a)(g) | | | 2,987,778 | | | | 891,598 | |
GS Mortgage-Backed Securities Corp. Trust, Series 2021-PJ5, Class B4, 2.588%, 10/25/2051 (a)(g) | | | 3,769,496 | | | | 2,681,280 | |
GS Mortgage-Backed Securities Corp. Trust, Series 2021-PJ5, Class B5, 2.588%, 10/25/2051 (a)(g) | | | 1,194,000 | | | | 577,280 | |
GS Mortgage-Backed Securities Corp. Trust, Series 2021-PJ6, Class AX1, 0.024%, 11/25/2051 (a)(e)(g)(h) | | | 882,561,813 | | | | 1,167,629 | |
GS Mortgage-Backed Securities Corp. Trust, Series 2021-PJ6, Class B5, 2.680%, 11/25/2051 (a)(g) | | | 1,038,000 | | | | 481,668 | |
GS Mortgage-Backed Securities Corp. Trust, Series 2021-PJ6, Class B4, 2.680%, 11/25/2051 (a)(g) | | | 5,555,458 | | | | 4,371,123 | |
GS Mortgage-Backed Securities Corp. Trust, Series 2021-PJ6, Class B6, 2.680%, 11/25/2051 (a)(g) | | | 4,670,429 | | | | 1,382,900 | |
GS Mortgage-Backed Securities Corp. Trust, Series 2021-INV1, Class B3, 3.038%, 12/25/2051 (a)(g) | | | 4,234,534 | | | | 3,559,714 | |
GS Mortgage-Backed Securities Corp. Trust, Series 2021-INV1, Class B2, 3.038%, 12/25/2051 (a)(g) | | | 4,082,846 | | | | 3,469,378 | |
GS Mortgage-Backed Securities Corp. Trust, Series 2021-INV1, Class B1, 3.038%, 12/25/2051 (a)(g) | | | 4,082,846 | | | | 3,766,491 | |
GS Mortgage-Backed Securities Corp. Trust, Series 2021-INV1, Class B6, 3.046%, 12/25/2051 (a)(g) | | | 2,472,259 | | | | 794,720 | |
GS Mortgage-Backed Securities Corp. Trust, Series 2021-INV1, Class B5, 3.046%, 12/25/2051 (a)(g) | | | 1,815,359 | | | | 1,297,414 | |
GS Mortgage-Backed Securities Corp. Trust, Series 2021-INV1, Class B4, 3.046%, 12/25/2051 (a)(g) | | | 3,024,946 | | | | 2,450,255 | |
GS Mortgage-Backed Securities Corp. Trust, Series 2021-PJ7, Class B2, 2.723%, 1/25/2052 (a)(c)(g) | | | 13,160,321 | | | | 10,976,839 | |
GS Mortgage-Backed Securities Corp. Trust, Series 2021-PJ7, Class B1, 2.723%, 1/25/2052 (a)(g) | | | 8,622,145 | | | | 7,737,797 | |
GS Mortgage-Backed Securities Corp. Trust, Series 2021-PJ7, Class B5, 2.723%, 1/25/2052 (a)(g) | | | 1,814,880 | | | | 1,147,362 | |
GS Mortgage-Backed Securities Corp. Trust, Series 2021-PJ7, Class B6, 2.723%, 1/25/2052 (a)(g) | | | 3,252,733 | | | | 1,030,768 | |
GS Mortgage-Backed Securities Corp. Trust, Series 2021-PJ7, Class B4, 2.723%, 1/25/2052 (a)(g) | | | 7,714,705 | | | | 5,867,064 | |
GS Mortgage-Backed Securities Corp. Trust, Series 2021-PJ8, Class B6, 2.772%, 1/25/2052 (a)(g) | | | 3,091,101 | | | | 926,663 | |
GS Mortgage-Backed Securities Corp. Trust, Series 2021-PJ8, Class B5, 2.772%, 1/25/2052 (a)(g) | | | 1,237,000 | | | | 584,210 | |
See accompanying notes which are an integral part of these financial statements.
56
Angel Oak Multi-Strategy Income Fund
Consolidated Schedule of Investments – (continued)
July 31, 2022 (Unaudited)
| | | | | | | | |
| | | Principal
Amount | | | Value | |
Residential Mortgage-Backed Securities – (continued) | | | | | | | | |
GS Mortgage-Backed Securities Corp. Trust, Series 2021-PJ8, Class B4, 2.772%, 1/25/2052 (a)(g) | | $ | 3,928,962 | | | $ | 2,835,068 | |
GS Mortgage-Backed Securities Corp. Trust, Series 2021-HP1, Class B5, 3.220%, 1/25/2052 (a)(g) | | | 1,499,954 | | | | 1,201,716 | |
GS Mortgage-Backed Securities Corp. Trust, Series 2021-HP1, Class B2, 3.220%, 1/25/2052 (a)(c)(g) | | | 11,061,049 | | | | 9,527,446 | |
GS Mortgage-Backed Securities Corp. Trust, Series 2021-HP1, Class B4, 3.220%, 1/25/2052 (a)(g) | | | 3,749,391 | | | | 3,032,459 | |
GS Mortgage-Backed Securities Corp. Trust, Series 2021-HP1, Class B3, 3.220%, 1/25/2052 (a)(g) | | | 3,749,391 | | | | 3,190,567 | |
GS Mortgage-Backed Securities Corp. Trust, Series 2021-HP1, Class B1, 3.220%, 1/25/2052 (a)(g) | | | 4,686,001 | | | | 4,367,245 | |
GS Mortgage-Backed Securities Corp. Trust, Series 2021-HP1, Class B6, 3.220%, 1/25/2052 (a)(g) | | | 4,312,367 | | | | 1,842,368 | |
GS Mortgage-Backed Securities Corp. Trust, Series 2021-PJ9, Class B4, 2.936%, 2/25/2052 (a)(g) | | | 3,424,380 | | | | 2,722,122 | |
GS Mortgage-Backed Securities Corp. Trust, Series 2021-PJ9, Class B5, 2.936%, 2/25/2052 (a)(g) | | | 1,284,510 | | | | 889,305 | |
GS Mortgage-Backed Securities Corp. Trust, Series 2021-PJ9, Class B6, 2.936%, 2/25/2052 (a)(g) | | | 5,679,016 | | | | 1,798,368 | |
GS Mortgage-Backed Securities Corp. Trust, Series 2021-PJ10, Class A8, 2.500%, 3/25/2052 (a)(g) | | | 4,518,589 | | | | 4,227,402 | |
GS Mortgage-Backed Securities Corp. Trust, Series 2020-RPL1, Class B1, 3.822%, 7/25/2059 (a)(g) | | | 6,323,000 | | | | 5,780,227 | |
GS Mortgage-Backed Securities Trust, Series 2021-PJ2, Class B4, 2.731%, 7/25/2051 (a)(g) | | | 1,236,139 | | | | 921,438 | |
GS Mortgage-Backed Securities Trust, Series 2021-PJ2, Class B3, 2.731%, 7/25/2051 (a)(g) | | | 4,119,821 | | | | 3,527,390 | |
GS Mortgage-Backed Securities Trust, Series 2021-PJ2, Class B6, 2.731%, 7/25/2051 (a)(g) | | | 2,352,235 | | | | 786,545 | |
GS Mortgage-Backed Securities Trust, Series 2021-PJ2, Class B1, 2.731%, 7/25/2051 (a)(g) | | | 6,179,731 | | | | 5,903,719 | |
GS Mortgage-Backed Securities Trust, Series 2021-PJ2, Class B5, 2.731%, 7/25/2051 (a)(g) | | | 1,069,000 | | | | 558,868 | |
GS Mortgage-Backed Securities Trust, Series 2021-PJ2, Class B2, 2.731%, 7/25/2051 (a)(g) | | | 5,562,143 | | | | 4,975,615 | |
GS Mortgage-Backed Securities Trust, Series 2021-PJ11, Class A2, 2.500%, 4/25/2052 (a)(g) | | | 1,390,938 | | | | 1,223,054 | |
GS Mortgage-Backed Securities Trust, Series 2021-MM1, Class B3, 2.733%, 4/25/2052 (a)(g) | | | 2,664,504 | | | | 2,169,655 | |
GS Mortgage-Backed Securities Trust, Series 2021-MM1, Class B2, 2.733%, 4/25/2052 (a)(g) | | | 4,829,659 | | | | 3,985,372 | |
GS Mortgage-Backed Securities Trust, Series 2021-MM1, Class B5, 2.733%, 4/25/2052 (a)(g) | | | 849,000 | | | | 413,036 | |
GS Mortgage-Backed Securities Trust, Series 2021-MM1, Class B1, 2.733%, 4/25/2052 (a)(g) | | | 4,828,678 | | | | 4,337,838 | |
GS Mortgage-Backed Securities Trust, Series 2021-MM1, Class B4, 2.733%, 4/25/2052 (a)(g) | | | 1,523,773 | | | | 933,429 | |
GS Mortgage-Backed Securities Trust, Series 2021-MM1, Class B6, 2.733%, 4/25/2052 (a)(g) | | | 2,037,580 | | | | 594,761 | |
GS Mortgage-Backed Securities Trust, Series 2021-PJ11, Class B4, 2.865%, 4/25/2052 (a)(g) | | | 1,300,000 | | | | 881,483 | |
GS Mortgage-Backed Securities Trust, Series 2021-PJ11, Class B5, 2.865%, 4/25/2052 (a)(g) | | | 1,606,000 | | | | 857,098 | |
GS Mortgage-Backed Securities Trust, Series 2021-PJ11, Class B6, 2.865%, 4/25/2052 (a)(g) | | | 2,941,826 | | | | 954,137 | |
GS Mortgage-Backed Securities Trust, Series 2022-LTV1, Class AX4, 0.125%, 6/25/2052 (a)(g)(h) | | | 27,828,251 | | | | 157,758 | |
GS Mortgage-Backed Securities Trust, Series 2022-LTV1, Class AX1, 0.129%, 6/25/2052 (a)(g)(h) | | | 275,091,875 | | | | 1,647,800 | |
GS Mortgage-Backed Securities Trust, Series 2022-LTV1, Class AIOS, 0.220%, 6/25/2052 (a)(g)(h) | | | 212,129,537 | | | | 2,359,941 | |
GS Mortgage-Backed Securities Trust, Series 2022-LTV1, Class A14, 3.000%, 6/25/2052 (a)(c)(g) | | | 59,557,500 | | | | 53,523,730 | |
See accompanying notes which are an integral part of these financial statements.
57
Angel Oak Multi-Strategy Income Fund
Consolidated Schedule of Investments – (continued)
July 31, 2022 (Unaudited)
| | | | | | | | |
| | | Principal
Amount | | | Value | |
Residential Mortgage-Backed Securities – (continued) | | | | | | | | |
GS Mortgage-Backed Securities Trust, Series 2022-LTV1, Class A4, 3.000%, 6/25/2052 (a)(c)(g) | | $ | 27,828,251 | | | $ | 25,850,079 | |
GS Mortgage-Backed Securities Trust, Series 2022-GR1, Class B2, 3.204%, 6/25/2052 (a)(g) | | | 10,746,379 | | | | 9,413,141 | |
GS Mortgage-Backed Securities Trust, Series 2022-GR1, Class B5, 3.204%, 6/25/2052 (a)(g) | | | 1,220,774 | | | | 956,690 | |
GS Mortgage-Backed Securities Trust, Series 2022-GR1, Class B3, 3.204%, 6/25/2052 (a)(g) | | | 4,395,976 | | | | 3,865,905 | |
GS Mortgage-Backed Securities Trust, Series 2022-GR1, Class B6, 3.204%, 6/25/2052 (a)(g) | | | 5,618,777 | | | | 2,674,128 | |
GS Mortgage-Backed Securities Trust, Series 2022-GR1, Class B4, 3.204%, 6/25/2052 (a)(g) | | | 3,906,874 | | | | 3,432,982 | |
GS Mortgage-Backed Securities Trust, Series 2022-GR1, Class B1, 3.204%, 6/25/2052 (a)(g) | | | 6,592,974 | | | | 6,105,476 | |
GS Mortgage-Backed Securities Trust, Series 2022-LTV1, Class A15X, 3.224%, 6/25/2052 (a)(g)(h) | | | 15,453,977 | | | | 1,122,623 | |
GS Mortgage-Backed Securities Trust, Series 2022-LTV1, Class B2, 3.254%, 6/25/2052 (a)(g) | | | 4,883,910 | | | | 4,086,939 | |
GS Mortgage-Backed Securities Trust, Series 2022-LTV1, Class B1, 3.254%, 6/25/2052 (a)(c)(g) | | | 12,444,846 | | | | 10,987,119 | |
GS Mortgage-Backed Securities Trust, Series 2022-LTV1, Class B6, 3.254%, 6/25/2052 (a)(g) | | | 5,668,012 | | | | 2,575,312 | |
GS Mortgage-Backed Securities Trust, Series 2022-LTV1, Class B4, 3.254%, 6/25/2052 (a)(g) | | | 5,040,624 | | | | 3,956,285 | |
GS Mortgage-Backed Securities Trust, Series 2022-LTV1, Class B5, 3.254%, 6/25/2052 (a)(g) | | | 787,535 | | | | 577,014 | |
GS Mortgage-Backed Securities Trust, Series 2022-LTV1, Class B3, 3.254%, 6/25/2052 (a)(g) | | | 5,829,151 | | | | 4,652,805 | |
GSAA Home Equity Trust, Series 2005-14, Class 2A2,
2.759% (1 Month LIBOR USD + 0.500%), 12/25/2035 (b) | | | 1,486,716 | | | | 948,497 | |
GSAA Home Equity Trust, Series 2005-14, Class 2A3,
2.959% (1 Month LIBOR USD + 0.700%), 12/25/2035 (b) | | | 2,877,489 | | | | 2,532,380 | |
GSAA Home Equity Trust, Series 2005-15, Class 2A2,
2.759% (1 Month LIBOR USD + 0.500%), 1/25/2036 (b) | | | 1,887,848 | | | | 1,035,338 | |
GSAA Home Equity Trust, Series 2006-10, Class AF2, 5.825%, 6/25/2036 (g) | | | 9,347,708 | | | | 3,005,316 | |
GSAA Home Equity Trust, Series 2006-16, Class A2,
2.599% (1 Month LIBOR USD + 0.340%), 10/27/2036 (b) | | | 1,478,604 | | | | 683,147 | |
GSAA Home Equity Trust, Series 2006-18, Class AF3A, 5.772%, 11/25/2036 (g) | | | 6,476,141 | | | | 2,468,705 | |
GSAA Home Equity Trust, Series 2006-20, Class 1A2,
2.619% (1 Month LIBOR USD + 0.360%), 1/25/2037 (b) | | | 10,615,439 | | | | 4,888,070 | |
GSAA Home Equity Trust, Series 2006-20, Class A4A,
2.719% (1 Month LIBOR USD + 0.460%), 1/25/2037 (b) | | | 2,513,016 | | | | 1,531,618 | |
GSAA Home Equity Trust, Series 2007-1, Class 1A2,
2.599% (1 Month LIBOR USD + 0.340%), 2/25/2037 (b) | | | 1,850,844 | | | | 851,849 | |
GSAA Home Equity Trust, Series 2007-2, Class AV1,
2.339% (1 Month LIBOR USD + 0.080%), 3/25/2037 (b) | | | 3,440,946 | | | | 816,241 | |
GSAA Home Equity Trust, Series 2007-3, Class 1A1A,
2.399% (1 Month LIBOR USD + 0.140%), 3/25/2037 (b) | | | 5,724,589 | | | | 3,705,469 | |
GSAA Home Equity Trust, Series 2007-4, Class A2,
2.659% (1 Month LIBOR USD + 0.400%), 3/25/2037 (b) | | | 1,249,603 | | | | 443,958 | |
GSAA Home Equity Trust, Series 2007-2, Class AF4A, 6.483%, 3/25/2037 (o) | | | 2,136,319 | | | | 991,288 | |
GSAA Home Equity Trust, Series 2007-5, Class 2A1A,
2.499% (1 Month LIBOR USD + 0.240%), 5/25/2037 (b) | | | 2,380,234 | | | | 2,177,031 | |
GSAA Home Equity Trust, Series 2007-5, Class 1F4A, 6.032%, 5/25/2037 (o) | | | 4,750,495 | | | | 2,893,018 | |
GSAA Home Equity Trust, Series 2007-10, Class A2A, 6.500%, 11/25/2037 | | | 2,368,513 | | | | 1,390,381 | |
GSMSC Resecuritization Trust, Series 2014-5R, Class 3B1,
1.895% (1 Month LIBOR USD + 0.150%), 2/26/2037 (a)(b) | | | 3,743,362 | | | | 3,519,389 | |
GSMSC Resecuritization Trust, Series 2014-5R, Class 3B3,
1.895% (1 Month LIBOR USD + 0.150%), 2/26/2037 (a)(b) | | | 5,707,000 | | | | 4,821,108 | |
See accompanying notes which are an integral part of these financial statements.
58
Angel Oak Multi-Strategy Income Fund
Consolidated Schedule of Investments – (continued)
July 31, 2022 (Unaudited)
| | | | | | | | |
| | | Principal
Amount | | | Value | |
Residential Mortgage-Backed Securities – (continued) | | | | | | | | |
GSMSC Resecuritization Trust, Series 2014-5R, Class 3B4,
1.895% (1 Month LIBOR USD + 0.150%), 2/26/2037 (a)(b) | | $ | 5,709,149 | | | $ | 4,369,417 | |
GSMSC Resecuritization Trust, Series 2014-5R, Class 3B2,
1.895% (1 Month LIBOR USD + 0.150%), 2/26/2037 (a)(b) | | | 5,707,000 | | | | 5,113,449 | |
GSR Mortgage Loan Trust, Series 2005-AR3, Class 8A1, 2.423%, 5/25/2035 (g) | | | 635,925 | | | | 612,397 | |
GSR Mortgage Loan Trust, Series 2005-AR3, Class 5A1, 2.824%, 5/25/2035 (g) | | | 1,122,645 | | | | 1,054,911 | |
GSR Mortgage Loan Trust, Series 2005-6F, Class 3A6,
2.589% (1 Month LIBOR USD + 0.330%), 7/25/2035 (b) | | | 1,915,882 | | | | 1,584,167 | |
GSR Mortgage Loan Trust, Series 2005-6F, Class 3A1,
2.759% (1 Month LIBOR USD + 0.500%), 7/25/2035 (b) | | | 574,653 | | | | 499,904 | |
GSR Mortgage Loan Trust, Series 2005-AR5, Class 2A3, 3.316%, 10/25/2035 (g) | | | 888,125 | | | | 677,696 | |
GSR Mortgage Loan Trust, Series 2006-1F, Class 2A5, 6.000%, 2/25/2036 | | | 943,818 | | | | 764,630 | |
GSR Mortgage Loan Trust, Series 2006-2F, Class 3A4, 6.000%, 2/25/2036 | | | 296,835 | | | | 230,566 | |
GSR Mortgage Loan Trust, Series 2006-6F, Class 3A1, 6.500%, 7/25/2036 | | | 6,628,792 | | | | 4,814,545 | |
GSR Mortgage Loan Trust, Series 2007-AR1, Class 2A1, 2.735%, 3/25/2037 (g) | | | 5,407,279 | | | | 4,199,098 | |
GSR Mortgage Loan Trust, Series 2007-2F, Class 3A3, 6.000%, 3/25/2037 | | | 298,746 | | | | 230,371 | |
GSR Mortgage Loan Trust, Series 2007-2F, Class 3A7, 6.000%, 3/25/2037 | | | 6,492,285 | | | | 5,437,905 | |
GSR Mortgage Loan Trust, Series 2007-3F, Class 4A1,
2.559% (1 Month LIBOR USD + 0.300%), 4/25/2037 (b) | | | 4,631,142 | | | | 1,586,064 | |
HarborView Mortgage Loan Trust, Series 2004-7, Class X1, 0.500%, 11/19/2034 (e)(g)(h) | | | 1,677,100 | | | | 11,649 | |
HarborView Mortgage Loan Trust, Series 2004-9, Class 4A2,
2.900% (1 Month LIBOR USD + 0.780%), 12/19/2034 (b) | | | 2,429,549 | | | | 2,009,358 | |
HarborView Mortgage Loan Trust, Series 2004-11, Class X1, 1.070%, 1/19/2035 (e)(g)(h) | | | 7,260,822 | | | | 78,010 | |
HarborView Mortgage Loan Trust, Series 2005-1, Class X, 0.530%, 3/19/2035 (e)(g)(h) | | | 6,135,312 | | | | 232,755 | |
HarborView Mortgage Loan Trust, Series 2005-3, Class X2, 1.182%, 6/19/2035 (e)(g)(h) | | | 47,968,777 | | | | 864,973 | |
HarborView Mortgage Loan Trust, Series 2005-4, Class 3A1, 3.231%, 7/19/2035 (g) | | | 871,532 | | | | 728,355 | |
HarborView Mortgage Loan Trust, Series 2005-8, Class 2XA1, 1.100%, 9/19/2035 (e)(g)(h) | | | 23,182,781 | | | | 95,073 | |
HarborView Mortgage Loan Trust, Series 2005-8, Class 2A2A,
2.143% (12 Month US Treasury Average + 1.500%), 9/19/2035 (b) | | | 1,245,408 | | | | 1,114,531 | |
HarborView Mortgage Loan Trust, Series 2005-12, Class X2B, 0.478%, 10/19/2035 (e)(g)(h) | | | 8,769,105 | | | | 56,192 | |
HarborView Mortgage Loan Trust, Series 2005-10, Class X, 0.079%, 11/19/2035 (e)(g)(h) | | | 32,929,766 | | | | 14,687 | |
HarborView Mortgage Loan Trust, Series 2005-13, Class X, 0.776%, 2/19/2036 (e)(g)(h) | | | 15,649,121 | | | | 165,755 | |
HarborView Mortgage Loan Trust, Series 2006-10, Class 2A1A,
2.300% (1 Month LIBOR USD + 0.180%), 11/19/2036 (b)(j) | | | 17,186,832 | | | | 15,411,913 | |
HarborView Mortgage Loan Trust, Series 2006-9, Class 2A1A,
2.540% (1 Month LIBOR USD + 0.420%), 11/19/2036 (b) | | | 696,496 | | | | 596,061 | |
HarborView Mortgage Loan Trust, Series 2006-SB1, Class A1A,
1.493% (12 Month US Treasury Average + 0.850%), 12/19/2036 (b) | | | 5,198,074 | | | | 4,639,635 | |
HarborView Mortgage Loan Trust, Series 2006-14, Class 2A1A,
2.420% (1 Month LIBOR USD + 0.300%), 2/19/2037 (b)(j) | | | 16,403,847 | | | | 13,751,919 | |
HarborView Mortgage Loan Trust, Series 2007-1, Class 2A1A,
2.380% (1 Month LIBOR USD + 0.260%), 3/19/2037 (b) | | | 22,779,675 | | | | 20,069,372 | |
HarborView Mortgage Loan Trust, Series 2007-2, Class 2A1A,
2.419% (1 Month LIBOR USD + 0.320%), 4/25/2037 (b)(j) | | | 12,163,841 | | | | 10,072,244 | |
HarborView Mortgage Loan Trust, Series 2007-3, Class 2A1A,
2.520% (1 Month LIBOR USD + 0.200%), 5/19/2037 (b)(j) | | | 18,298,025 | | | | 16,438,013 | |
HarborView Mortgage Loan Trust, Series 2007-6, Class 2A1A,
2.310% (1 Month LIBOR USD + 0.190%), 8/19/2037 (b) | | | 1,691,846 | | | | 1,589,965 | |
See accompanying notes which are an integral part of these financial statements.
59
Angel Oak Multi-Strategy Income Fund
Consolidated Schedule of Investments – (continued)
July 31, 2022 (Unaudited)
| | | | | | | | |
| | | Principal
Amount | | | Value | |
Residential Mortgage-Backed Securities – (continued) | | | | | | | | |
HarborView Mortgage Loan Trust, Series 2007-6, Class 1A1A,
2.320% (1 Month LIBOR USD + 0.200%), 8/19/2037 (b)(j) | | $ | 17,344,875 | | | $ | 15,249,961 | |
HarborView Mortgage Loan Trust, Series 2007-7, Class 1A1,
3.259% (1 Month LIBOR USD + 1.000%), 10/25/2037 (b)(j) | | | 14,930,256 | | | | 13,095,044 | |
HarborView Mortgage Loan Trust, Series 2005-11, Class X, 1.249%, 8/19/2045 (e)(g)(h) | | | 9,344,844 | | | | 47,248 | |
HarborView Mortgage Loan Trust, Series 2005-15, Class 3A11,
2.643% (12 Month US Treasury Average + 2.000%), 10/20/2045 (b) | | | 3,040,492 | | | | 2,740,973 | |
HarborView Mortgage Loan Trust, Series 2005-15, Class 2A11,
2.666% (1 Month LIBOR USD + 0.540%), 10/20/2045 (b) | | | 3,329,978 | | | | 2,913,974 | |
HarborView Mortgage Loan Trust, Series 2006-4, Class 1A2A,
2.500% (1 Month LIBOR USD + 0.380%), 5/19/2046 (b) | | | 4,988,068 | | | | 2,809,340 | |
HarborView Mortgage Loan Trust, Series 2006-13, Class A,
2.300% (1 Month LIBOR USD + 0.180%), 11/19/2046 (b) | | | 5,092,119 | | | | 3,522,545 | |
Home RE Ltd., Series 2019-1, Class M2,
5.509% (1 Month LIBOR USD + 3.250%), 5/25/2029 (a)(b) | | | 20,083,000 | | | | 19,851,323 | |
Home RE Ltd., Series 2020-1, Class M2,
5.358% (1 Month LIBOR USD + 5.250%), 10/25/2030 (a)(b) | | | 1,750,000 | | | | 1,682,058 | |
Home RE Ltd., Series 2021-1, Class M1C,
4.559% (1 Month LIBOR USD + 2.300%), 7/25/2033 (a)(b) | | | 9,182,587 | | | | 8,853,905 | |
Home RE Ltd., Series 2021-1, Class M2,
5.109% (1 Month LIBOR USD + 2.850%), 7/25/2033 (a)(b) | | | 1,197,000 | | | | 1,102,292 | |
Home RE Ltd., Series 2021-1, Class B1,
5.909% (1 Month LIBOR USD + 3.650%), 7/25/2033 (a)(b) | | | 3,333,042 | | | | 3,000,184 | |
Home RE Ltd., Series 2021-2, Class M2, 4.764% (SOFR30A + 3.250%), 1/25/2034 (a)(b) | | | 11,250,000 | | | | 10,152,585 | |
Home RE Ltd., Series 2022-1, Class M1C, 7.014% (SOFR30A + 5.500%), 10/25/2034 (a)(b) | | | 3,000,000 | | | | 2,883,324 | |
Home RE Ltd., Series 2022-1, Class M2, 8.264% (SOFR30A + 6.750%), 10/25/2034 (a)(b) | | | 500,000 | | | | 486,932 | |
Home RE Ltd., Series 2022-1, Class B1, 10.514% (SOFR30A + 9.000%), 10/25/2034 (a)(b) | | | 500,000 | | | | 490,993 | |
HomeBanc Mortgage Trust, Series 2005-1, Class A1,
2.759% (1 Month LIBOR USD + 0.500%), 3/25/2035 (b) | | | 4,288,126 | | | | 3,537,841 | |
HomeBanc Mortgage Trust, Series 2005-1, Class A2,
2.879% (1 Month LIBOR USD + 0.620%), 3/25/2035 (b) | | | 681,846 | | | | 555,621 | |
HomeBanc Mortgage Trust, Series 2005-5, Class A1,
2.779% (1 Month LIBOR USD + 0.520%), 1/25/2036 (b) | | | 1,787,598 | | | | 1,642,888 | |
HomeBanc Mortgage Trust, Series 2006-1, Class 3A2, 2.672%, 4/25/2037 (g) | | | 4,259,651 | | | | 4,044,041 | |
HSI Asset Loan Obligation Trust, Series 2007-AR1, Class 2A1, 2.939%, 1/25/2037 (g) | | | 427,603 | | | | 340,342 | |
IMPAC CMB Trust, Series 2005-6, Class 1A2,
2.539% (1 Month LIBOR USD + 0.280%), 10/25/2035 (b) | | | 1,769,434 | | | | 1,607,745 | |
IMPAC CMB Trust, Series 2005-6, Class 1A1,
2.759% (1 Month LIBOR USD + 0.500%), 10/25/2035 (b)(j) | | | 17,695,188 | | | | 16,181,311 | |
IMPAC CMB Trust, Series 2005-7, Class A2,
2.539% (1 Month LIBOR USD + 0.280%), 11/25/2035 (b) | | | 1,474,558 | | | | 1,255,784 | |
IMPAC CMB Trust, Series 2005-7, Class A1,
2.779% (1 Month LIBOR USD + 0.520%), 11/25/2035 (b)(j) | | | 13,240,928 | | | | 12,039,088 | |
IMPAC CMB Trust, Series 2005-8, Class 1M1,
2.889% (1 Month LIBOR USD + 0.630%), 2/25/2036 (b) | | | 1,580,877 | | | | 1,398,674 | |
IMPAC Secured Assets Trust, Series 2005-2, Class A2D,
3.119% (1 Month LIBOR USD + 0.860%), 3/25/2036 (b) | | | 578,032 | | | | 493,612 | |
IMPAC Secured Assets Trust, Series 2006-2, Class 1A2B,
2.599% (1 Month LIBOR USD + 0.340%), 8/25/2036 (b) | | | 4,959,693 | | | | 4,320,225 | |
See accompanying notes which are an integral part of these financial statements.
60
Angel Oak Multi-Strategy Income Fund
Consolidated Schedule of Investments – (continued)
July 31, 2022 (Unaudited)
| | | | | | | | |
| | | Principal
Amount | | | Value | |
Residential Mortgage-Backed Securities – (continued) | | | | | | | | |
IMPAC Secured Assets Trust, Series 2006-2, Class 1A2C,
2.819% (1 Month LIBOR USD + 0.560%), 8/25/2036 (b)(j) | | $ | 4,296,726 | | | $ | 3,022,283 | |
IMPAC Secured Assets Trust, Series 2006-3, Class A7,
2.799% (1 Month LIBOR USD + 0.540%), 11/25/2036 (b)(j) | | | 21,362,044 | | | | 15,810,028 | |
IMPAC Secured Assets Trust, Series 2006-4, Class A1,
2.639% (1 Month LIBOR USD + 0.380%), 1/25/2037 (b) | | | 6,808,807 | | | | 5,824,437 | |
IMPAC Secured Assets Trust, Series 2006-4, Class A2C,
2.779% (1 Month LIBOR USD + 0.520%), 1/25/2037 (b)(j) | | | 20,435,222 | | | | 17,851,372 | |
IMPAC Secured Assets Trust, Series 2007-1, Class A3,
2.739% (1 Month LIBOR USD + 0.480%), 3/25/2037 (b) | | | 8,195,609 | | | | 6,387,059 | |
IMPAC Secured Assets Trust, Series 2007-2, Class 1A1C,
2.639% (1 Month LIBOR USD + 0.380%), 5/25/2037 (b)(j) | | | 12,954,144 | | | | 10,266,820 | |
IndyMac Index Mortgage Loan Trust, Series 2004-AR2, Class AX2, 2.815%, 6/25/2034 (e)(g)(h) | | | 7,385,558 | | | | 7,039,781 | |
IndyMac Index Mortgage Loan Trust, Series 2004-AR12, Class AX2, 0.543%, 12/25/2034 (e)(g)(h) | | | 2,343,216 | | | | 3,594 | |
IndyMac Index Mortgage Loan Trust, Series 2005-AR2, Class AX2, 0.904%, 2/25/2035 (e)(g)(h) | | | 11,574,725 | | | | 9,156 | |
IndyMac Index Mortgage Loan Trust, Series 2005-AR4, Class AX2, 0.733%, 3/25/2035 (e)(g)(h) | | | 13,922,760 | | | | 253,478 | |
IndyMac Index Mortgage Loan Trust, Series 2005-AR6, Class 2A1,
2.739% (1 Month LIBOR USD + 0.480%), 4/25/2035 (b) | | | 2,185,793 | | | | 1,931,664 | |
IndyMac Index Mortgage Loan Trust, Series 2005-AR8, Class AX2, 0.924%, 5/25/2035 (e)(g)(h) | | | 18,576,926 | | | | 171,112 | |
IndyMac Index Mortgage Loan Trust, Series 2005-AR5, Class 2A1, 2.599%, 5/25/2035 (g) | | | 1,015,676 | | | | 924,293 | |
IndyMac Index Mortgage Loan Trust, Series 2005-AR8, Class 2A1A,
2.719% (1 Month LIBOR USD + 0.460%), 5/25/2035 (b) | | | 2,346,733 | | | | 2,142,802 | |
IndyMac Index Mortgage Loan Trust, Series 2005-AR10, Class AX, 0.897%, 6/25/2035 (e)(g)(h) | | | 30,149,772 | | | | 234,867 | |
IndyMac Index Mortgage Loan Trust, Series 2005-AR7, Class 4A1, 3.280%, 6/25/2035 (g) | | | 890,082 | | | | 834,454 | |
IndyMac Index Mortgage Loan Trust, Series 2005-AR12, Class AX2, 1.121%, 7/25/2035 (e)(g)(h) | | | 48,204,843 | | | | 127,550 | |
IndyMac Index Mortgage Loan Trust, Series 2005-AR14, Class 2X, 0.884%, 8/25/2035 (e)(g)(h) | | | 21,964,808 | | | | 281,325 | |
IndyMac Index Mortgage Loan Trust, Series 2005-AR13, Class 1A1, 3.131%, 8/25/2035 (g) | | | 2,234,734 | | | | 1,238,322 | |
IndyMac Index Mortgage Loan Trust, Series 2005-AR19, Class A1, 2.765%, 10/25/2035 (g) | | | 4,865,640 | | | | 4,436,661 | |
IndyMac Index Mortgage Loan Trust, Series 2006-AR25, Class 5A1, 2.916%, 9/25/2036 (g) | | | 4,653,451 | | | | 4,078,597 | |
IndyMac Index Mortgage Loan Trust, Series 2007-AR1, Class 3A1, 2.827%, 3/25/2037 (g) | | | 972,020 | | | | 889,091 | |
IndyMac Index Mortgage Loan Trust, Series 2007-AR1, Class 2A1, 3.003%, 6/25/2037 (g) | | | 5,191,376 | | | | 4,222,089 | |
IndyMac Index Mortgage Loan Trust, Series 2007-AR9, Class 2A1, 3.174%, 6/25/2037 (g) | | | 3,540,389 | | | | 2,603,769 | |
IndyMac Index Mortgage Loan Trust, Series 2007-AR2, Class A1, 3.471%, 6/25/2037 (g) | | | 418,393 | | | | 351,840 | |
IndyMac Index Mortgage Loan Trust, Series 2007-FLX4, Class 2A1,
2.439% (1 Month LIBOR USD + 0.180%), 7/25/2037 (b) | | | 6,007,122 | | | | 5,390,473 | |
IndyMac Index Mortgage Loan Trust, Series 2007-AR13, Class 4A1, 3.102%, 7/25/2037 (g) | | | 3,440,515 | | | | 2,698,826 | |
IndyMac Index Mortgage Loan Trust, Series 2007-FLX5, Class 2A1,
2.439% (1 Month LIBOR USD + 0.180%), 8/25/2037 (b) | | | 2,978,125 | | | | 2,509,118 | |
IndyMac Index Mortgage Loan Trust, Series 2005-16IP, Class AX, 1.255%, 7/25/2045 (e)(g)(h) | | | 14,895,174 | | | | 34,736 | |
IndyMac Index Mortgage Loan Trust, Series 2006-AR14, Class 1A3A,
2.659% (1 Month LIBOR USD + 0.400%), 11/25/2046 (b) | | | 5,012,984 | | | | 4,647,974 | |
IndyMac Index Mortgage Loan Trust, Series 2007-AR2, Class A3,
2.619% (1 Month LIBOR USD + 0.360%), 3/25/2047 (b) | | | 8,072,891 | | | | 5,535,000 | |
JP Morgan Alternative Loan Trust, Series 2006-A7, Class 1A4,
2.719% (1 Month LIBOR USD + 0.460%), 12/25/2036 (b) | | | 1,230,346 | | | | 1,153,466 | |
JP Morgan Alternative Loan Trust, Series 2007-A2, Class 11A1,
2.619% (1 Month LIBOR USD + 0.360%), 6/25/2037 (b)(j) | | | 28,735,060 | | | | 19,778,198 | |
See accompanying notes which are an integral part of these financial statements.
61
Angel Oak Multi-Strategy Income Fund
Consolidated Schedule of Investments – (continued)
July 31, 2022 (Unaudited)
| | | | | | | | |
| | | Principal
Amount | | | Value | |
Residential Mortgage-Backed Securities – (continued) | | | | | | | | |
JP Morgan Chase Bank, Series 2019-CL1, Class M2,
3.959% (1 Month LIBOR USD + 1.700%), 4/25/2047 (a)(b)(c) | | $ | 4,377,878 | | | $ | 4,280,715 | |
JP Morgan Chase Bank, Series 2019-CL1, Class M4,
4.859% (1 Month LIBOR USD + 2.600%), 4/25/2047 (a)(b)(c) | | | 1,620,826 | | | | 1,560,724 | |
JP Morgan Chase Bank, Series 2021-CL1, Class M5,
5.164% (SOFR30A + 3.650%), 3/27/2051 (a)(b) | | | 474,155 | | | | 441,358 | |
JP Morgan Chase Bank, Series 2021-CL1, Class B,
8.414% (SOFR30A + 6.900%), 3/27/2051 (a)(b) | | | 1,151,000 | | | | 1,092,612 | |
JP Morgan Chase Bank, Series 2020-CL1, Class M2,
4.759% (1 Month LIBOR USD + 2.500%), 10/25/2057 (a)(b) | | | 3,933,171 | | | | 3,674,179 | |
JP Morgan Chase Bank, Series 2020-CL1, Class M4,
6.609% (1 Month LIBOR USD + 4.350%), 10/25/2057 (a)(b) | | | 1,257,586 | | | | 1,286,402 | |
JP Morgan Chase Bank, Series 2020-CL1, Class M5,
7.859% (1 Month LIBOR USD + 5.600%), 10/25/2057 (a)(b) | | | 2,415,391 | | | | 2,468,851 | |
JP Morgan Chase Bank, Series 2020-CL1, Class B,
12.259% (1 Month LIBOR USD + 10.000%), 10/25/2057 (a)(b)(c) | | | 6,746,057 | | | | 7,216,608 | |
JP Morgan Mortgage Trust, Series 2005-A6, Class 7A1, 3.113%, 8/25/2035 (g) | | | 5,010 | | | | 4,621 | |
JP Morgan Mortgage Trust, Series 2005-ALT1, Class 2A1, 2.982%, 10/25/2035 (g) | | | 6,428,846 | | | | 5,496,110 | |
JP Morgan Mortgage Trust, Series 2005-A8, Class 3A1, 2.704%, 11/25/2035 (g) | | | 1,599,879 | | | | 1,426,184 | |
JP Morgan Mortgage Trust, Series 2005-S3, Class 1A14, 5.500%, 1/25/2036 | | | 1,160,084 | | | | 997,068 | |
JP Morgan Mortgage Trust, Series 2006-A6, Class 2A4L, 3.128%, 10/25/2036 (g) | | | 591,908 | | | | 519,452 | |
JP Morgan Mortgage Trust, Series 2006-A6, Class 3A2, 3.148%, 10/25/2036 (g) | | | 547,346 | | | | 441,168 | |
JP Morgan Mortgage Trust, Series 2006-A6, Class 1A4L, 3.200%, 10/25/2036 (g) | | | 1,772,207 | | | | 1,577,565 | |
JP Morgan Mortgage Trust, Series 2006-A7, Class 2A3, 3.187%, 1/25/2037 (g) | | | 1,237,771 | | | | 1,162,213 | |
JP Morgan Mortgage Trust, Series 2007-A4, Class 3A3, 3.084%, 6/25/2037 (g) | | | 1,506,452 | | | | 1,312,843 | |
JP Morgan Mortgage Trust, Series 2015-1, Class B5, 2.300%, 12/25/2044 (a)(g) | | | 3,000,000 | | | | 2,523,234 | |
JP Morgan Mortgage Trust, Series 2018-1, Class B1, 3.618%, 6/25/2048 (a)(g) | | | 2,693,947 | | | | 2,673,262 | |
JP Morgan Mortgage Trust, Series 2017-4, Class B4, 3.875%, 11/25/2048 (a)(g) | | | 6,972,036 | | | | 6,368,006 | |
JP Morgan Mortgage Trust, Series 2019-1, Class B6, 3.570%, 5/25/2049 (a)(g) | | | 3,566,838 | | | | 3,247,110 | |
JP Morgan Mortgage Trust, Series 2019-1, Class B5, 4.490%, 5/25/2049 (a)(g) | | | 1,731,997 | | | | 1,601,404 | |
JP Morgan Mortgage Trust, Series 2019-LTV1, Class B6, 3.401%, 6/25/2049 (a)(g) | | | 2,801,084 | | | | 2,565,695 | |
JP Morgan Mortgage Trust, Series 2019-LTV1, Class B5, 4.571%, 6/25/2049 (a)(g) | | | 2,265,772 | | | | 2,129,984 | |
JP Morgan Mortgage Trust, Series 2019-LTV1, Class B4, 4.571%, 6/25/2049 (a)(g) | | | 6,134,378 | | | | 6,011,463 | |
JP Morgan Mortgage Trust, Series 2019-6, Class B5, 4.235%, 12/25/2049 (a)(g) | | | 1,900,425 | | | | 1,672,727 | |
JP Morgan Mortgage Trust, Series 2019-6, Class B4, 4.235%, 12/25/2049 (a)(g) | | | 4,745,815 | | | | 4,491,240 | |
JP Morgan Mortgage Trust, Series 2019-7, Class AX1, 0.029%, 2/25/2050 (a)(e)(g)(h) | | | 25,979,403 | | | | 13,250 | |
JP Morgan Mortgage Trust, Series 2019-7, Class B6, 3.356%, 2/25/2050 (a)(g) | | | 1,347,396 | | | | 933,766 | |
JP Morgan Mortgage Trust, Series 2019-7, Class B5, 4.029%, 2/25/2050 (a)(g) | | | 1,199,000 | | | | 1,015,262 | |
JP Morgan Mortgage Trust, Series 2019-7, Class B4, 4.029%, 2/25/2050 (a)(g) | | | 2,994,860 | | | | 2,725,337 | |
JP Morgan Mortgage Trust, Series 2019-8, Class AX1, 0.178%, 3/25/2050 (a)(g)(h) | | | 59,751,819 | | | | 44,575 | |
JP Morgan Mortgage Trust, Series 2019-8, Class B6, 3.992%, 3/25/2050 (a)(g) | | | 2,555,114 | | | | 1,964,873 | |
JP Morgan Mortgage Trust, Series 2019-8, Class B5, 4.178%, 3/25/2050 (a)(g) | | | 1,834,999 | | | | 1,620,917 | |
JP Morgan Mortgage Trust, Series 2019-LTV3, Class B5, 4.394%, 3/25/2050 (a)(g) | | | 1,837,025 | | | | 1,766,491 | |
JP Morgan Mortgage Trust, Series 2019-9, Class B6, 3.588%, 5/25/2050 (a)(g) | | | 5,054,889 | | | | 3,739,046 | |
JP Morgan Mortgage Trust, Series 2019-9, Class B5, 3.827%, 5/25/2050 (a)(g) | | | 2,591,229 | | | | 2,327,274 | |
JP Morgan Mortgage Trust, Series 2019-9, Class B4, 3.827%, 5/25/2050 (a)(g) | | | 2,914,657 | | | | 2,764,103 | |
JP Morgan Mortgage Trust, Series 2020-1, Class B6, 2.333%, 6/25/2050 (a)(g) | | | 3,470,917 | | | | 2,706,528 | |
JP Morgan Mortgage Trust, Series 2020-1, Class B4, 3.853%, 6/25/2050 (a)(g) | | | 3,994,213 | | | | 3,676,349 | |
JP Morgan Mortgage Trust, Series 2020-1, Class B5, 3.853%, 6/25/2050 (a)(g) | | | 2,214,200 | | | | 2,024,551 | |
See accompanying notes which are an integral part of these financial statements.
62
Angel Oak Multi-Strategy Income Fund
Consolidated Schedule of Investments – (continued)
July 31, 2022 (Unaudited)
| | | | | | | | |
| | | Principal
Amount | | | Value | |
Residential Mortgage-Backed Securities – (continued) | | | | | | | | |
JP Morgan Mortgage Trust, Series 2020-LTV1, Class B6, 4.093%, 6/25/2050 (a)(g) | | $ | 9,311,460 | | | $ | 8,633,176 | |
JP Morgan Mortgage Trust, Series 2020-LTV1, Class B5, 4.277%, 6/25/2050 (a)(g) | | | 2,889,138 | | | | 2,823,847 | |
JP Morgan Mortgage Trust, Series 2020-2, Class B3A, 3.637%, 7/25/2050 (a)(g) | | | 8,567,857 | | | | 8,253,323 | |
JP Morgan Mortgage Trust, Series 2020-3, Class B5, 3.850%, 8/25/2050 (a)(g) | | | 1,696,470 | | | | 1,554,892 | |
JP Morgan Mortgage Trust, Series 2020-LTV2, Class B6, 3.951%, 11/25/2050 (a)(g) | | | 8,646,484 | | | | 7,637,231 | |
JP Morgan Mortgage Trust, Series 2020-LTV2, Class B5, 4.055%, 11/25/2050 (a)(g) | | | 3,143,951 | | | | 3,048,114 | |
JP Morgan Mortgage Trust, Series 2020-LTV2, Class B4, 4.055%, 11/25/2050 (a)(g) | | | 7,663,502 | | | | 7,312,974 | |
JP Morgan Mortgage Trust, Series 2020-5, Class B5, 3.598%, 12/25/2050 (a)(g) | | | 1,793,423 | | | | 1,652,471 | |
JP Morgan Mortgage Trust, Series 2020-5, Class B4, 3.598%, 12/25/2050 (a)(g) | | | 3,588,760 | | | | 3,281,752 | |
JP Morgan Mortgage Trust, Series 2020-5, Class B6, 3.598%, 12/25/2050 (a)(g) | | | 4,062,829 | | | | 3,100,248 | |
JP Morgan Mortgage Trust, Series 2020-9, Class B6, 2.845%, 5/25/2051 (a)(g) | | | 1,075,745 | | | | 609,328 | |
JP Morgan Mortgage Trust, Series 2021-3, Class B6, 1.671%, 7/25/2051 (a)(g) | | | 3,146,493 | | | | 1,237,692 | |
JP Morgan Mortgage Trust, Series 2021-3, Class B4, 2.967%, 7/25/2051 (a)(g) | | | 2,127,940 | | | | 1,721,984 | |
JP Morgan Mortgage Trust, Series 2021-3, Class B5, 2.967%, 7/25/2051 (a)(g) | | | 2,562,628 | | | | 1,652,590 | |
JP Morgan Mortgage Trust, Series 2021-6, Class B6, 2.730%, 10/25/2051 (a)(g) | | | 4,692,922 | | | | 1,464,938 | |
JP Morgan Mortgage Trust, Series 2021-6, Class B2, 2.843%, 10/25/2051 (a)(c)(g) | | | 12,915,964 | | | | 11,372,339 | |
JP Morgan Mortgage Trust, Series 2021-6, Class B5, 2.863%, 10/25/2051 (a)(g) | | | 3,039,565 | | | | 2,201,019 | |
JP Morgan Mortgage Trust, Series 2021-6, Class B3, 2.863%, 10/25/2051 (a)(c)(g) | | | 12,915,964 | | | | 10,992,403 | |
JP Morgan Mortgage Trust, Series 2021-6, Class B4, 2.863%, 10/25/2051 (a)(g) | | | 3,799,213 | | | | 3,044,192 | |
JP Morgan Mortgage Trust, Series 2021-7, Class B6, 2.699%, 11/25/2051 (a)(g) | | | 2,871,998 | | | | 857,728 | |
JP Morgan Mortgage Trust, Series 2021-7, Class B5, 2.820%, 11/25/2051 (a)(g) | | | 1,862,695 | | | | 1,062,362 | |
JP Morgan Mortgage Trust, Series 2021-7, Class B4, 2.820%, 11/25/2051 (a)(g) | | | 1,862,695 | | | | 1,480,343 | |
JP Morgan Mortgage Trust, Series 2021-8, Class B6, 2.674%, 12/25/2051 (a)(g) | | | 3,256,473 | | | | 1,008,266 | |
JP Morgan Mortgage Trust, Series 2021-10, Class B6, 2.752%, 12/25/2051 (a)(g) | | | 4,027,034 | | | | 1,176,671 | |
JP Morgan Mortgage Trust, Series 2021-10, Class B5, 2.827%, 12/25/2051 (a)(g) | | | 2,481,009 | | | | 1,532,802 | |
JP Morgan Mortgage Trust, Series 2021-8, Class B4, 2.869%, 12/25/2051 (a)(g) | | | 3,175,881 | | | | 2,525,607 | |
JP Morgan Mortgage Trust, Series 2021-8, Class B5, 2.869%, 12/25/2051 (a)(g) | | | 2,268,069 | | | | 1,431,868 | |
JP Morgan Mortgage Trust, Series 2021-15, Class B4, 3.129%, 6/25/2052 (a)(g) | | | 5,274,781 | | | | 3,905,306 | |
JP Morgan Mortgage Trust, Series 2021-15, Class B6, 3.129%, 6/25/2052 (a)(g) | | | 8,439,354 | | | | 3,236,965 | |
JP Morgan Mortgage Trust, Series 2021-15, Class B3, 3.129%, 6/25/2052 (a)(g) | | | 9,066,617 | | | | 7,052,350 | |
JP Morgan Mortgage Trust, Series 2021-15, Class B5, 3.129%, 6/25/2052 (a)(g) | | | 4,218,640 | | | | 2,963,004 | |
JP Morgan Mortgage Trust, Series 2022-1, Class B6, 2.874%, 7/25/2052 (a)(g) | | | 6,039,914 | | | | 2,099,861 | |
JP Morgan Mortgage Trust, Series 2022-1, Class B4, 3.100%, 7/25/2052 (a)(c)(g) | | | 14,342,196 | | | | 11,735,990 | |
JP Morgan Mortgage Trust, Series 2022-1, Class B5, 3.100%, 7/25/2052 (a)(g) | | | 6,970,307 | | | | 5,103,450 | |
Lake Summit Mortgage Trust, 8.440%, 8/15/2049 (e)(g) | | | 4,511,726 | | | | 4,560,164 | |
Lake Summit Mortgage Trust, 6.026%, 8/28/2049 (g) | | | 281,670,492 | | | | 278,967,018 | |
Lake Summit Mortgage Trust, 7.850%, 6/25/2051 (g) | | | 3,133,606 | | | | 3,043,562 | |
Lehman Mortgage Trust, Series 2007-5, Class PO1, 0.000%, 6/25/2037 (f) | | | 18,040 | | | | 13,497 | |
Lehman Mortgage Trust, Series 2007-9, Class AP, 0.000%, 10/25/2037 (f) | | | 18,639 | | | | 14,342 | |
Lehman XS Trust, Series 2005-3, Class 3A3A, 4.930%, 9/25/2035 (o) | | | 1,173,913 | | | | 1,124,373 | |
Lehman XS Trust, Series 2007-9, Class WFIO, 0.550%, 4/25/2037 (e)(h) | | | 18,968,342 | | | | 50,778 | |
Lehman XS Trust, Series 2006-10N, Class 1A3A,
2.679% (1 Month LIBOR USD + 0.420%), 7/25/2046 (b) | | | 1,477,420 | | | | 1,444,069 | |
Lehman XS Trust, Series 2006-GP4, Class 3A4,
2.959% (1 Month LIBOR USD + 0.700%), 8/25/2046 (b) | | | 5,941,580 | | | | 4,376,900 | |
Luminent Mortgage Trust, Series 2006-1, Class X, 1.518%, 4/25/2036 (e)(g)(h) | | | 27,174,112 | | | | 345,872 | |
Luminent Mortgage Trust, Series 2006-1, Class A1,
2.979% (1 Month LIBOR USD + 0.720%), 4/25/2036 (b) | | | 3,867,878 | | | | 3,417,545 | |
Luminent Mortgage Trust, Series 2006-3, Class 12X, 1.000%, 5/25/2036 (e)(h) | | | 8,586,363 | | | | 175,033 | |
See accompanying notes which are an integral part of these financial statements.
63
Angel Oak Multi-Strategy Income Fund
Consolidated Schedule of Investments – (continued)
July 31, 2022 (Unaudited)
| | | | | | | | |
| | | Principal
Amount | | | Value | |
Residential Mortgage-Backed Securities – (continued) | | | | | | | | |
Luminent Mortgage Trust, Series 2006-3, Class 12A1,
2.679% (1 Month LIBOR USD + 0.420%), 5/27/2036 (b) | | $ | 1,717,000 | | | $ | 1,557,997 | |
Luminent Mortgage Trust, Series 2006-5, Class X, 0.773%, 7/25/2036 (e)(g)(h) | | | 28,452,736 | | | | 64,502 | |
Luminent Mortgage Trust, Series 2006-5, Class A1A,
2.639% (1 Month LIBOR USD + 0.380%), 7/25/2036 (b)(j) | | | 25,746,763 | | | | 17,689,880 | |
Luminent Mortgage Trust, Series 2006-7, Class 2A1,
2.599% (1 Month LIBOR USD + 0.340%), 12/26/2036 (b)(j) | | | 9,289,026 | | | | 8,102,278 | |
Luminent Mortgage Trust, Series 2007-2, Class 1A2,
2.819% (1 Month LIBOR USD + 0.560%), 5/26/2037 (b) | | | 3,741,435 | | | | 3,555,856 | |
Luminent Mortgage Trust, Series 2006-2, Class X, 0.853%, 2/25/2046 (e)(g)(h) | | | 33,159,930 | | | | 131,844 | |
Luminent Mortgage Trust, Series 2006-6, Class A1,
2.659% (1 Month LIBOR USD + 0.400%), 10/25/2046 (b)(j) | | | 9,897,613 | | | | 8,621,514 | |
MASTR Adjustable Rate Mortgages Trust, Series 2004-15, Class 2A2, 2.628%, 12/25/2034 (g) | | | 5,613 | | | | 5,133 | |
MASTR Adjustable Rate Mortgages Trust, Series 2005-2, Class 5A1, 2.506%, 3/25/2035 (g) | | | 15,575 | | | | 14,815 | |
MASTR Adjustable Rate Mortgages Trust, Series 2005-7, Class 2A1, 3.124%, 9/25/2035 (g) | | | 1,458,686 | | | | 1,407,448 | |
MASTR Adjustable Rate Mortgages Trust, Series 2006-2, Class 3A1, 2.724%, 1/25/2036 (g) | | | 888,786 | | | | 854,486 | |
MASTR Alternative Loan Trust, Series 2007-1, Class 15PO, 0.000%, 10/1/2033 (e)(f) | | | 2,913 | | | | 1,001 | |
MASTR Alternative Loan Trust, Series 2004-6, Class 30PO, 0.000%, 7/25/2034 (f) | | | 83,714 | | | | 76,240 | |
MASTR Alternative Loan Trust, Series 2005-5, Class 3A1, 5.750%, 8/25/2035 | | | 2,050,121 | | | | 1,594,041 | |
MASTR Alternative Loan Trust, Series 2006-1, Class A2,
2.959% (1 Month LIBOR USD + 0.700%), 2/25/2036 (b) | | | 2,079,345 | | | | 688,101 | |
MASTR Alternative Loan Trust, Series 2006-2, Class 1A2, 6.000%, 3/25/2036 | | | 357,271 | | | | 348,506 | |
MASTR Alternative Loan Trust, Series 2007-HF1, Class 4A1, 7.000%, 10/25/2047 | | | 17,028,175 | | | | 11,501,409 | |
MASTR Asset Securitization Trust, Series 2005-2, Class PO, 0.000%, 11/25/2035 (f) | | | 33,620 | | | | 24,118 | |
MASTR Asset Securitization Trust, Series 2007-1, Class AP, 0.000%, 11/25/2037 (e)(f) | | | 403 | | | | 330 | |
MASTR Resecuritization Trust, Series 2008-4, Class A1, 6.000%, 6/27/2036 (a)(g) | | | 1,549,111 | | | | 1,395,323 | |
Mello Mortgage Capital Acceptance, Series 2018-MTG1, Class B4, 3.757%, 3/25/2048 (a)(g) | | | 1,799,000 | | | | 1,736,521 | |
Mello Mortgage Capital Acceptance, Series 2018-MTG1, Class B5, 3.757%, 3/25/2048 (a)(g) | | | 1,499,000 | | | | 1,428,219 | |
Mello Mortgage Capital Acceptance, Series 2021-MTG1, Class B6, 2.652%, 4/25/2051 (a)(g) | | | 1,514,186 | | | | 460,700 | |
Mello Mortgage Capital Acceptance, Series 2021-MTG1, Class B5, 2.652%, 4/25/2051 (a)(g) | | | 555,676 | | | | 347,168 | |
Mello Mortgage Capital Acceptance, Series 2021-MTG1, Class B4, 2.652%, 4/25/2051 (a)(g) | | | 1,112,319 | | | | 841,124 | |
Mello Mortgage Capital Acceptance, Series 2021-MTG2, Class B6, 2.673%, 6/25/2051 (a)(g) | | | 1,209,493 | | | | 361,694 | |
Mello Mortgage Capital Acceptance, Series 2021-MTG2, Class B4, 2.673%, 6/25/2051 (a)(g) | | | 1,699,943 | | | | 1,299,443 | |
Mello Mortgage Capital Acceptance, Series 2021-MTG2, Class B5, 2.673%, 6/25/2051 (a)(g) | | | 349,000 | | | | 164,823 | |
Mello Mortgage Capital Acceptance, Series 2021-MTG3, Class B5, 2.899%, 7/25/2051 (a)(g) | | | 488,000 | | | | 266,272 | |
Mello Mortgage Capital Acceptance, Series 2021-MTG3, Class B6, 2.899%, 7/25/2051 (a)(g) | | | 1,137,709 | | | | 382,161 | |
Mello Mortgage Capital Acceptance, Series 2021-INV4, Class B2, 3.217%, 12/26/2051 (a)(g) | | | 9,211,499 | | | | 8,309,951 | |
Mello Mortgage Capital Acceptance, Series 2021-INV4, Class B3, 3.217%, 12/26/2051 (a)(g) | | | 2,779,825 | | | | 2,403,070 | |
Mello Mortgage Capital Acceptance, Series 2021-INV4, Class B6, 3.217%, 12/26/2051 (a)(g) | | | 3,999,295 | | | | 1,746,196 | |
Mello Mortgage Capital Acceptance, Series 2021-INV4, Class B4, 3.217%, 12/26/2051 (a)(g) | | | 3,129,029 | | | | 2,525,561 | |
Mello Mortgage Capital Acceptance, Series 2021-INV4, Class B5, 3.217%, 12/26/2051 (a)(g) | | | 1,216,297 | | | | 940,916 | |
Mello Mortgage Capital Acceptance, Series 2021-INV4, Class B1, 3.217%, 12/26/2051 (a)(g) | | | 5,735,238 | | | | 5,435,595 | |
Mello Warehouse Securitization Trust, Series 2020-2, Class F,
5.509% (1 Month LIBOR USD + 3.250%), 11/25/2053 (a)(b) | | | 3,300,000 | | | | 3,314,550 | |
Mello Warehouse Securitization Trust, Series 2020-2, Class G,
7.009% (1 Month LIBOR USD + 4.750%), 11/25/2053 (a)(b) | | | 3,600,000 | | | | 3,589,549 | |
Mello Warehouse Securitization Trust, Series 2021-2, Class E,
5.009% (1 Month LIBOR USD + 2.750%), 4/26/2055 (a)(b) | | | 4,500,000 | | | | 4,465,305 | |
See accompanying notes which are an integral part of these financial statements.
64
Angel Oak Multi-Strategy Income Fund
Consolidated Schedule of Investments – (continued)
July 31, 2022 (Unaudited)
| | | | | | | | |
| | | Principal
Amount | | | Value | |
Residential Mortgage-Backed Securities – (continued) | | | | | | | | |
Mello Warehouse Securitization Trust, Series 2021-2, Class F,
7.009% (1 Month LIBOR USD + 4.750%), 4/26/2055 (a)(b) | | $ | 5,000,000 | | | $ | 4,780,870 | |
Mello Warehouse Securitization Trust, Series 2021-3, Class B,
3.409% (1 Month LIBOR USD + 1.150%), 11/26/2055 (a)(b) | | | 5,500,000 | | | | 5,230,203 | |
Mello Warehouse Securitization Trust, Series 2021-3, Class C,
3.609% (1 Month LIBOR USD + 1.350%), 11/26/2055 (a)(b)(c) | | | 12,500,000 | | | | 11,951,375 | |
Mello Warehouse Securitization Trust, Series 2021-3, Class E,
5.509% (1 Month LIBOR USD + 3.250%), 11/26/2055 (a)(b) | | | 41,500,000 | | | | 39,788,042 | |
Mello Warehouse Securitization Trust, Series 2021-3, Class F,
7.409% (1 Month LIBOR USD + 5.150%), 11/26/2055 (a)(b) | | | 18,750,000 | | | | 17,976,525 | |
Merrill Lynch Mortgage Backed Securities Trust, Series 2007-1, Class 1A1, 2.853%, 4/25/2037 (g) | | | 1,674,903 | | | | 1,535,392 | |
Merrill Lynch Mortgage Investors Trust, Series 2003-B, Class A1,
2.939% (1 Month LIBOR USD + 0.680%), 4/25/2028 (b) | | | 1,083,913 | | | | 974,059 | |
Merrill Lynch Mortgage Investors Trust, Series 2004-A, Class A1,
2.719% (1 Month LIBOR USD + 0.460%), 4/25/2029 (b) | | | 768,276 | | | | 668,517 | |
Merrill Lynch Mortgage Investors Trust, Series 2005-A9, Class 2A1E, 2.799%, 12/25/2035 (g) | | | 923,235 | | | | 881,362 | |
Merrill Lynch Mortgage Investors Trust, Series 2006-A3, Class 3A1, 2.790%, 5/25/2036 (g) | | | 531,249 | | | | 465,875 | |
Merrill Lynch Mortgage Investors Trust, Series 2007-MLN1, Class A1,
2.509% (1 Month LIBOR USD + 0.250%), 3/25/2037 (b)(j) | | | 25,141,945 | | | | 21,862,883 | |
Merrill Lynch Mortgage Investors Trust, Series 2006-AF2, Class AV2B,
2.409% (1 Month LIBOR USD + 0.150%), 9/25/2037 (b) | | | 5,545,417 | | | | 3,788,484 | |
Merrill Lynch Mortgage Investors Trust, Series 2006-AF2, Class AV1,
2.419% (1 Month LIBOR USD + 0.160%), 9/25/2037 (b) | | | 5,450,469 | | | | 3,751,023 | |
Merrill Lynch Mortgage Investors Trust, Series 2006-AF2, Class AV2C,
2.489% (1 Month LIBOR USD + 0.230%), 9/25/2037 (b) | | | 10,182,388 | | | | 7,284,847 | |
MFA Trust, Series 2021-AEI2, Class B6, 3.236%, 10/25/2051 (a)(g) | | | 4,146,671 | | | | 1,782,807 | |
MFA Trust, Series 2021-AEI2, Class B1, 3.294%, 10/25/2051 (a)(g) | | | 3,247,155 | | | | 2,644,168 | |
MFA Trust, Series 2021-AEI2, Class B4, 3.294%, 10/25/2051 (a)(g) | | | 2,870,544 | | | | 2,124,579 | |
MFA Trust, Series 2021-AEI2, Class B2, 3.294%, 10/25/2051 (a)(g) | | | 5,956,577 | | | | 4,797,052 | |
MFA Trust, Series 2021-AEI2, Class B5, 3.294%, 10/25/2051 (a)(g) | | | 2,071,853 | | | | 1,432,852 | |
MFA Trust, Series 2021-RPL1, Class A2, 2.072%, 7/25/2060 (a)(g) | | | 4,106,000 | | | | 3,590,134 | |
MFA Trust, Series 2021-RPL1, Class M2, 2.855%, 7/25/2060 (a)(g) | | | 4,500,000 | | | | 3,867,318 | |
Morgan Stanley ABS Capital Inc. Trust, Series 2007-HE6, Class A1,
2.319% (1 Month LIBOR USD + 0.060%), 5/25/2037 (b) | | | 5,094,107 | | | | 4,698,295 | |
Morgan Stanley ABS Capital Inc. Trust, Series 2007-HE6, Class A3,
2.439% (1 Month LIBOR USD + 0.180%), 5/25/2037 (b)(j) | | | 14,795,172 | | | | 13,563,800 | |
Morgan Stanley ABS Capital Inc. Trust, Series 2007-HE6, Class A4,
2.509% (1 Month LIBOR USD + 0.250%), 5/25/2037 (b) | | | 2,130,505 | | | | 1,925,216 | |
Morgan Stanley Mortgage Loan Trust, Series 2005-1, Class 4A1,
2.559% (1 Month LIBOR USD + 0.300%), 3/25/2035 (b) | | | 1,016,925 | | | | 916,296 | |
Morgan Stanley Mortgage Loan Trust, Series 2005-3AR, Class 1A, 2.617%, 7/25/2035 (g)(j) | | | 8,061,302 | | | | 5,661,251 | |
Morgan Stanley Mortgage Loan Trust, Series 2005-3AR, Class 3A, 2.756%, 7/25/2035 (g) | | | 790,210 | | | | 723,305 | |
Morgan Stanley Mortgage Loan Trust, Series 2005-6AR, Class 5A1, 2.695%, 11/25/2035 (g) | | | 2,200,352 | | | | 1,692,460 | |
Morgan Stanley Mortgage Loan Trust, Series 2005-9AR, Class 1A,
2.549% (1 Month LIBOR USD + 0.290%), 12/25/2035 (b) | | | 1,668,495 | | | | 1,266,323 | |
Morgan Stanley Mortgage Loan Trust, Series 2006-3AR, Class 1AX, 2.505%, 3/25/2036 (e)(g)(h) | | | 15,551,606 | | | | 1,273,148 | |
See accompanying notes which are an integral part of these financial statements.
65
Angel Oak Multi-Strategy Income Fund
Consolidated Schedule of Investments – (continued)
July 31, 2022 (Unaudited)
| | | | | | | | |
| | | Principal
Amount | | | Value | |
Residential Mortgage-Backed Securities – (continued) | | | | | | | | |
Morgan Stanley Mortgage Loan Trust, Series 2006-3AR, Class 1A1,
2.509% (1 Month LIBOR USD + 0.250%), 3/25/2036 (b) | | $ | 2,069,514 | | | $ | 1,492,933 | |
Morgan Stanley Mortgage Loan Trust, Series 2006-3AR, Class 1A3,
2.519% (1 Month LIBOR USD + 0.260%), 3/25/2036 (b) | | | 1,250,472 | | | | 902,680 | |
Morgan Stanley Mortgage Loan Trust, Series 2006-3AR, Class 2A1, 3.221%, 3/25/2036 (g) | | | 6,258,071 | | | | 5,093,669 | |
Morgan Stanley Mortgage Loan Trust, Series 2006-3AR, Class 2A3, 3.221%, 3/25/2036 (g) | | | 3,180,807 | | | | 2,585,961 | |
Morgan Stanley Mortgage Loan Trust, Series 2006-5AR, Class AX, 1.572%, 4/25/2036 (e)(g)(h) | | | 17,358,277 | | | | 343,572 | |
Morgan Stanley Mortgage Loan Trust, Series 2006-7, Class 4A2,
3.009% (1 Month LIBOR USD + 0.750%), 6/25/2036 (b) | | | 3,530,449 | | | | 1,483,996 | |
Morgan Stanley Mortgage Loan Trust, Series 2006-9AR, Class A1,
2.599% (1 Month LIBOR USD + 0.340%), 8/25/2036 (b) | | | 2,005,253 | | | | 759,133 | |
Morgan Stanley Mortgage Loan Trust, Series 2006-11, Class 2A3, 6.000%, 8/25/2036 | | | 2,353,415 | | | | 1,728,042 | |
Morgan Stanley Mortgage Loan Trust, Series 2006-11, Class 1A6, 6.731%, 8/25/2036 (o) | | | 2,689,610 | | | | 980,594 | |
Morgan Stanley Mortgage Loan Trust, Series 2006-11, Class 1A3, 6.924%, 8/25/2036 (o) | | | 3,351,633 | | | | 1,220,611 | |
Morgan Stanley Mortgage Loan Trust, Series 2006-13AX, Class A2,
2.599% (1 Month LIBOR USD + 0.340%), 10/25/2036 (b) | | | 12,542,664 | | | | 4,512,161 | |
Morgan Stanley Mortgage Loan Trust, Series 2007-8XS, Class A5,
2.789% (1 Month LIBOR USD + 0.530%), 4/25/2037 (b) | | | 17,515,664 | | | | 5,935,113 | |
Morgan Stanley Mortgage Loan Trust, Series 2007-8XS, Class A9,
2.799% (1 Month LIBOR USD + 0.540%), 4/25/2037 (b) | | | 17,515,664 | | | | 5,793,096 | |
Morgan Stanley Mortgage Loan Trust, Series 2007-8XS, Class A2, 6.000%, 4/25/2037 (g) | | | 18,012,386 | | | | 9,374,384 | |
Morgan Stanley Mortgage Loan Trust, Series 2007-12, Class 3A22, 6.000%, 8/25/2037 | | | 2,657,227 | | | | 1,626,696 | |
Morgan Stanley Mortgage Loan Trust, Series 2007-15AR, Class 2A1, 2.831%, 11/25/2037 (g) | | | 5,641,790 | | | | 5,157,617 | |
Morgan Stanley Mortgage Loan Trust, Series 2007-1XS, Class 2A2, 6.326%, 9/25/2046 (o) | | | 11,898,428 | | | | 5,048,693 | |
Morgan Stanley Mortgage Loan Trust, Series 2007-1XS, Class 2A6, 6.358%, 9/25/2046 (o) | | | 4,589,087 | | | | 1,944,424 | |
Morgan Stanley Mortgage Loan Trust, Series 2007-1XS, Class 2A3, 6.419%, 9/25/2046 (o) | | | 11,414,310 | | | | 4,856,184 | |
Morgan Stanley Mortgage Loan Trust, Series 2007-1XS, Class 2A4C, 6.604%, 9/25/2046 (o) | | | 8,603,110 | | | | 3,669,820 | |
Morgan Stanley Mortgage Loan Trust, Series 2007-3XS, Class 2A3S, 5.858%, 1/25/2047 (o) | | | 1,536,475 | | | | 910,375 | |
Morgan Stanley Mortgage Loan Trust, Series 2007-3XS, Class 2A4S, 5.963%, 1/25/2047 (o) | | | 5,807,453 | | | | 3,080,314 | |
Morgan Stanley Mortgage Loan Trust, Series 2007-6XS, Class 2A5S, 6.000%, 2/25/2047 (o) | | | 2,672,570 | | | | 1,747,463 | |
Morgan Stanley Resecuritization Trust, Series 2015-R4, Class CB3, 2.449%, 8/27/2047 (a)(g) | | | 1,010,309 | | | | 718,940 | |
Morgan Stanley Residential Mortgage Loan Trust, Series 2010-R6, Class 4B,
2.011% (1 Month LIBOR USD + 0.190%), 2/26/2037 (a)(b) | | | 5,838,162 | | | | 5,070,636 | |
Morgan Stanley Residential Mortgage Loan Trust, Series 2021-1, Class B5, 2.951%, 3/25/2051 (a)(g) | | | 988,000 | | | | 543,342 | |
Morgan Stanley Residential Mortgage Loan Trust, Series 2021-1, Class B6, 2.951%, 3/25/2051 (a)(g) | | | 1,124,310 | | | | 388,706 | |
Morgan Stanley Residential Mortgage Loan Trust, Series 2021-1, Class B4, 2.951%, 3/25/2051 (a)(g) | | | 820,741 | | | | 541,776 | |
Morgan Stanley Residential Mortgage Loan Trust, Series 2021-3, Class B6, 2.800%, 6/25/2051 (a)(g) | | | 938,058 | | | | 276,791 | |
Morgan Stanley Residential Mortgage Loan Trust, Series 2021-3, Class B4, 2.823%, 6/25/2051 (a)(g) | | | 1,093,000 | | | | 658,651 | |
Morgan Stanley Residential Mortgage Loan Trust, Series 2021-3, Class B5, 2.823%, 6/25/2051 (a)(g) | | | 781,000 | | | | 380,959 | |
Morgan Stanley Residential Mortgage Loan Trust, Series 2021-4, Class B6, 2.928%, 7/25/2051 (a)(g) | | | 827,000 | | | | 247,129 | |
Morgan Stanley Residential Mortgage Loan Trust, Series 2021-4, Class B3, 2.932%, 7/25/2051 (a)(g) | | | 2,148,832 | | | | 1,701,554 | |
See accompanying notes which are an integral part of these financial statements.
66
Angel Oak Multi-Strategy Income Fund
Consolidated Schedule of Investments – (continued)
July 31, 2022 (Unaudited)
| | | | | | | | |
| | | Principal
Amount | | | Value | |
Residential Mortgage-Backed Securities – (continued) | | | | | | | | |
Morgan Stanley Residential Mortgage Loan Trust, Series 2021-4, Class B1, 2.932%, 7/25/2051 (a)(g) | | $ | 7,655,883 | | | $ | 6,942,492 | |
Morgan Stanley Residential Mortgage Loan Trust, Series 2021-4, Class B4, 2.932%, 7/25/2051 (a)(g) | | | 1,240,000 | | | | 764,590 | |
Morgan Stanley Residential Mortgage Loan Trust, Series 2021-4, Class B2, 2.932%, 7/25/2051 (a)(g) | | | 3,627,189 | | | | 3,010,447 | |
Morgan Stanley Residential Mortgage Loan Trust, Series 2021-4, Class B5, 2.932%, 7/25/2051 (a)(g) | | | 690,000 | | | | 330,858 | |
Morgan Stanley Residential Mortgage Loan Trust, Series 2021-5, Class B6, 2.988%, 8/25/2051 (a)(g) | | | 1,196,715 | | | | 365,893 | |
Morgan Stanley Residential Mortgage Loan Trust, Series 2021-5, Class B5, 2.988%, 8/25/2051 (a)(g) | | | 956,000 | | | | 467,557 | |
Morgan Stanley Residential Mortgage Loan Trust, Series 2021-5, Class B4, 2.997%, 8/25/2051 (a)(g) | | | 2,108,104 | | | | 1,433,192 | |
Morgan Stanley Residential Mortgage Loan Trust, Series 2021-5, Class B3, 2.997%, 8/25/2051 (a)(g) | | | 4,449,245 | | | | 3,692,566 | |
Morgan Stanley Residential Mortgage Loan Trust, Series 2021-5, Class B1, 2.997%, 8/25/2051 (a)(c)(g) | | | 13,113,719 | | | | 11,882,524 | |
Morgan Stanley Residential Mortgage Loan Trust, Series 2021-5, Class B2, 2.997%, 8/25/2051 (a)(g) | | | 6,323,333 | | | | 5,322,823 | |
Mortgage Insurance-Linked Notes, Series 2019-1, Class M2,
5.459% (1 Month LIBOR USD + 3.200%), 2/26/2029 (a)(b) | | | 4,464,215 | | | | 4,272,231 | |
Mortgage Insurance-Linked Notes, Series 2019-1, Class M2,
5.159% (1 Month LIBOR USD + 2.900%), 11/26/2029 (a)(b) | | | 111,093 | | | | 111,696 | |
Mortgage Insurance-Linked Notes, Series 2020-1, Class M1C,
4.009% (1 Month LIBOR USD + 1.750%), 1/25/2030 (a)(b) | | | 11,700,000 | | | | 11,010,414 | |
Mortgage Insurance-Linked Notes, Series 2020-1, Class M2A,
4.259% (1 Month LIBOR USD + 2.000%), 1/25/2030 (a)(b) | | | 21,731,174 | | | | 20,351,614 | |
Mortgage Insurance-Linked Notes, Series 2020-2, Class M2,
7.859% (1 Month LIBOR USD + 5.600%), 10/25/2030 (a)(b) | | | 1,843,167 | | | | 1,822,750 | |
Mortgage Insurance-Linked Notes, Series 2021-2, Class M1B,
5.214% (SOFR30A + 3.700%), 11/25/2031 (a)(b) | | | 3,100,541 | | | | 2,958,257 | |
Mortgage Insurance-Linked Notes, Series 2021-2, Class M2,
6.514% (SOFR30A + 5.000%), 11/25/2031 (a)(b) | | | 3,214,672 | | | | 2,915,527 | |
Mortgage Insurance-Linked Notes, Series 2021-1, Class M2,
4.664% (SOFR30A + 3.150%), 12/27/2033 (a)(b) | | | 3,250,000 | | | | 2,933,795 | |
MortgageIT Mortgage Loan Trust, Series 2006-1, Class 1X, 1.457%, 4/25/2036 (e)(g)(h) | | | 9,599,514 | | | | 82,738 | |
MortgageIT Securities Corp. Mortgage Loan Trust, Series 2007-1, Class 2A12,
2.559% (1 Month LIBOR USD + 0.300%), 6/25/2047 (b) | | | 2,559,484 | | | | 2,300,886 | |
MortgageIT Securities Corp. Mortgage Loan Trust, Series 2007-1, Class 1A1,
2.719% (1 Month LIBOR USD + 0.460%), 6/25/2047 (b) | | | 5,573,661 | | | | 4,995,644 | |
MortgageIT Securities Corp. Mortgage Loan Trust, Series 2007-1, Class 2A14,
2.819% (1 Month LIBOR USD + 0.560%), 6/25/2047 (b) | | | 2,376,760 | | | | 1,929,043 | |
New Residential Mortgage Loan Trust, Series 2019-1A, Class B6B, 3.205%, 9/25/2057 (a)(g) | | | 6,083,402 | | | | 5,436,268 | |
New Residential Mortgage Loan Trust, Series 2019-6A, Class B5IA, 1.750%, 9/25/2059 (a)(e)(g)(h) | | | 15,624,850 | | | | 1,334,925 | |
New Residential Mortgage Loan Trust, Series 2019-6A, Class B6, 4.480%, 9/25/2059 (a)(g) | | | 20,698,945 | | | | 13,871,605 | |
Nomura Asset Acceptance Corp. Alternative Loan Trust, Series 2006-AP1, Class A3, 5.654%, 1/25/2036 (g) | | | 3,491,255 | | | | 1,605,803 | |
See accompanying notes which are an integral part of these financial statements.
67
Angel Oak Multi-Strategy Income Fund
Consolidated Schedule of Investments – (continued)
July 31, 2022 (Unaudited)
| | | | | | | | |
| | | Principal
Amount | | | Value | |
Residential Mortgage-Backed Securities – (continued) | | | | | | | | |
Nomura Asset Acceptance Corp. Alternative Loan Trust, Series 2006-AR3, Class A1A,
2.579% (1 Month LIBOR USD + 0.320%), 10/27/2036 (b) | | $ | 811,162 | | | $ | 663,520 | |
Nomura Asset Acceptance Corp. Alternative Loan Trust, Series 2006-AR4, Class A3,
2.599% (1 Month LIBOR USD + 0.340%), 12/26/2036 (b) | | | 120,416 | | | | 101,154 | |
Nomura Resecuritization Trust, Series 2014-6R, Class 3A2,
2.144% (1 Month LIBOR USD + 0.260%), 1/26/2036 (a)(b) | | | 2,418,379 | | | | 1,957,523 | |
Nomura Resecuritization Trust, Series 2015-2R, Class 3A1,
2.342% (1 Month LIBOR USD + 0.150%), 11/26/2036 (a)(b) | | | 912,685 | | | | 916,168 | |
Nomura Resecuritization Trust, Series 2014-3R, Class 4A15,
1.960% (1 Month LIBOR USD + 0.160%), 3/26/2037 (a)(b) | | | 4,402,220 | | | | 3,678,640 | |
Oaktown Re Ltd., Series 2019-1A, Class B1A,
5.759% (1 Month LIBOR USD + 3.500%), 7/25/2029 (a)(b) | | | 1,200,000 | | | | 1,146,805 | |
Oaktown Re Ltd., Series 2019-1A, Class B1B,
6.609% (1 Month LIBOR USD + 4.350%), 7/25/2029 (a)(b) | | | 1,620,000 | | | | 1,563,841 | |
Oaktown Re Ltd., Series 2021-2, Class M1B,
4.414% (SOFR30A + 2.900%), 4/25/2034 (a)(b) | | | 3,000,000 | | | | 2,790,799 | |
OBX Trust, Series 2021-INV3, Class A3, 2.500%, 10/25/2051 (a)(g) | | | 1,382,952 | | | | 1,216,855 | |
Oceanview Mortgage Trust, Series 2021-5, Class B4, 2.978%, 10/25/2051 (a)(g) | | | 1,715,000 | | | | 695,347 | |
Oceanview Mortgage Trust, Series 2021-5, Class B5, 2.978%, 10/25/2051 (a)(g) | | | 734,000 | | | | 260,532 | |
Onslow Bay Mortgage Loan Trust, Series 2021-NQM4, Class A1, 1.957%, 10/25/2061 (a)(g) | | | 8,679,531 | | | | 7,939,584 | |
PFCA Home Equity Investment Trust, Series 2003-GP1, Class A, 3.502%, 10/25/2033 (a)(g) | | | 3,936,649 | | | | 3,874,670 | |
PFCA Home Equity Investment Trust, Series 2003-IFC4, Class A, 4.484%, 10/22/2034 (a)(g) | | | 2,713,067 | | | | 2,687,849 | |
PHH Alternative Mortgage Trust, Series 2007-1, Class 21PO, 0.000%, 2/25/2037 (f) | | | 13,547 | | | | 10,487 | |
PHH Alternative Mortgage Trust, Series 2007-1, Class 1A1,
2.579% (1 Month LIBOR USD + 0.320%), 2/25/2037 (b) | | | 4,365,537 | | | | 3,577,086 | |
PHH Alternative Mortgage Trust, Series 2007-2, Class 2A5,
2.809% (1 Month LIBOR USD + 0.550%), 5/25/2037 (b) | | | 1,691,535 | | | | 1,294,011 | |
PHH Alternative Mortgage Trust, Series 2007-2, Class 1A3,
2.919% (1 Month LIBOR USD + 0.660%), 5/26/2037 (b) | | | 1,002,612 | | | | 852,565 | |
PRET LLC, Series 2022-NPL3, Class A2, 7.870%, 6/25/2052 (a)(o) | | | 1,000,000 | | | | 1,020,083 | |
Prime Mortgage Trust, Series 2007-2, Class A2, 6.000%, 4/25/2037 | | | 2,820,151 | | | | 2,314,140 | |
PRPM LLC, Series 2021-RPL1, Class M1, 2.680%, 7/25/2051 (a)(g) | | | 6,167,000 | | | | 5,531,830 | |
RAMP Trust, Series 2006-RS2, Class A3A,
2.859% (1 Month LIBOR USD + 0.300%), 3/25/2036 (b) | | | 656,725 | | | | 634,055 | |
Rate Mortgage Trust, Series 2021-J1, Class B6, 2.717%, 7/25/2051 (a)(g) | | | 737,919 | | | | 213,662 | |
Rate Mortgage Trust, Series 2021-J1, Class B5, 2.717%, 7/25/2051 (a)(g) | | | 922,000 | | | | 417,306 | |
Rate Mortgage Trust, Series 2021-J1, Class B4, 2.717%, 7/25/2051 (a)(g) | | | 1,291,000 | | | | 750,474 | |
Rate Mortgage Trust, Series 2021-HB1, Class B4, 2.708%, 12/25/2051 (a)(g) | | | 2,638,026 | | | | 1,723,018 | |
Rate Mortgage Trust, Series 2021-HB1, Class B5, 2.708%, 12/25/2051 (a)(g) | | | 575,000 | | | | 254,646 | |
Rate Mortgage Trust, Series 2021-HB1, Class B6, 2.708%, 12/25/2051 (a)(g) | | | 1,340,138 | | | | 353,882 | |
Rate Mortgage Trust, Series 2022-J1, Class B4, 2.750%, 1/25/2052 (a)(g) | | | 3,746,444 | | | | 2,673,046 | |
Rate Mortgage Trust, Series 2022-J1, Class B6, 2.750%, 1/25/2052 (a)(g) | | | 1,112,723 | | | | 315,017 | |
Rate Mortgage Trust, Series 2022-J1, Class B5, 2.750%, 1/25/2052 (a)(g) | | | 632,000 | | | | 307,325 | |
RBSSP Resecuritization Trust, Series 2009-3, Class 3A3, 5.750%, 9/26/2035 (a)(g) | | | 1,722,602 | | | | 1,545,336 | |
RBSSP Resecuritization Trust, Series 2009-12, Class 19A2, 2.682%, 12/27/2035 (a)(g) | | | 7,868,231 | | | | 7,198,983 | |
RBSSP Resecuritization Trust, Series 2013-2, Class 2A2,
1.785% (1 Month LIBOR USD + 0.190%), 12/22/2036 (a)(b) | | | 5,922,265 | | | | 5,090,714 | |
Residential Accredit Loans, Inc. Trust, Series 2005-QS7, Class A1, 5.500%, 6/25/2035 | | | 1,510,100 | | | | 1,414,565 | |
See accompanying notes which are an integral part of these financial statements.
68
Angel Oak Multi-Strategy Income Fund
Consolidated Schedule of Investments – (continued)
July 31, 2022 (Unaudited)
| | | | | | | | |
| | | Principal
Amount | | | Value | |
Residential Mortgage-Backed Securities – (continued) | | | | | | | | |
Residential Accredit Loans, Inc. Trust, Series 2005-QS11, Class A2,
2.759% (1 Month LIBOR USD + 0.500%), 7/25/2035 (b) | | $ | 240,759 | | | $ | 159,987 | |
Residential Accredit Loans, Inc. Trust, Series 2005-QA8, Class CB21, 3.994%, 7/25/2035 (g) | | | 504,238 | | | | 394,651 | |
Residential Accredit Loans, Inc. Trust, Series 2005-QS12, Class A10,
3.609% (1 Month LIBOR USD + 1.350%), 8/25/2035 (b) | | | 2,717,807 | | | | 2,125,638 | |
Residential Accredit Loans, Inc. Trust, Series 2005-QS10, Class 3A3, 5.500%, 8/25/2035 | | | 862,017 | | | | 751,433 | |
Residential Accredit Loans, Inc. Trust, Series 2005-QS13, Class AP, 0.000%, 9/25/2035 (f) | | | 223,278 | | | | 124,890 | |
Residential Accredit Loans, Inc. Trust, Series 2005-QS13, Class 2A1,
2.959% (1 Month LIBOR USD + 0.700%), 9/25/2035 (b) | | | 3,527,980 | | | | 2,828,135 | |
Residential Accredit Loans, Inc. Trust, Series 2005-QS13, Class 1A6, 5.500%, 9/25/2035 | | | 477,101 | | | | 447,020 | |
Residential Accredit Loans, Inc. Trust, Series 2005-QS13, Class 2A4, 5.750%, 9/25/2035 | | | 2,033,182 | | | | 1,936,392 | |
Residential Accredit Loans, Inc. Trust, Series 2005-QS14, Class 2A1, 6.000%, 9/25/2035 | | | 6,404,873 | | | | 4,405,483 | |
Residential Accredit Loans, Inc. Trust, Series 2005-QS15, Class 3A, 6.000%, 10/25/2035 | | | 5,598,311 | | | | 5,452,027 | |
Residential Accredit Loans, Inc. Trust, Series 2005-QS16, Class A1,
2.959% (1 Month LIBOR USD + 0.700%), 11/25/2035 (b) | | | 431,896 | | | | 315,919 | |
Residential Accredit Loans, Inc. Trust, Series 2005-QS17, Class AP, 0.000%, 12/25/2035 (f) | | | 396,518 | | | | 253,958 | |
Residential Accredit Loans, Inc. Trust, Series 2005-QA13, Class 2A1, 4.088%, 12/25/2035 (g) | | | 4,121,822 | | | | 3,869,055 | |
Residential Accredit Loans, Inc. Trust, Series 2005-QS17, Class A1, 6.000%, 12/25/2035 | | | 2,182,018 | | | | 2,072,245 | |
Residential Accredit Loans, Inc. Trust, Series 2006-QS1, Class A5,
3.169% (1 Month LIBOR USD + 0.910%), 1/25/2036 (b) | | | 3,986,545 | | | | 3,034,738 | |
Residential Accredit Loans, Inc. Trust, Series 2006-QS2, Class 1A2,
2.759% (1 Month LIBOR USD + 0.500%), 2/25/2036 (b) | | | 452,311 | | | | 326,563 | |
Residential Accredit Loans, Inc. Trust, Series 2006-QS2, Class 1A5,
3.259% (1 Month LIBOR USD + 1.000%), 2/25/2036 (b) | | | 763,260 | | | | 538,736 | |
Residential Accredit Loans, Inc. Trust, Series 2006-QS2, Class 1A9, 5.500%, 2/25/2036 | | | 3,105,972 | | | | 2,729,562 | |
Residential Accredit Loans, Inc. Trust, Series 2006-QS3, Class 2AP, 0.000%, 3/25/2036 (f) | | | 539,848 | | | | 316,176 | |
Residential Accredit Loans, Inc. Trust, Series 2006-QS3, Class 1A8,
2.659% (1 Month LIBOR USD + 0.400%), 3/25/2036 (b) | | | 1,621,009 | | | | 1,133,034 | |
Residential Accredit Loans, Inc. Trust, Series 2006-QS3, Class 1A1,
2.959% (1 Month LIBOR USD + 0.700%), 3/25/2036 (b) | | | 3,004,576 | | | | 2,145,790 | |
Residential Accredit Loans, Inc. Trust, Series 2006-QA3, Class A2,
2.859% (1 Month LIBOR USD + 0.600%), 4/25/2036 (b)(j) | | | 19,753,083 | | | | 16,695,938 | |
Residential Accredit Loans, Inc. Trust, Series 2006-QS4, Class A2, 6.000%, 4/25/2036 | | | 1,262,554 | | | | 1,156,616 | |
Residential Accredit Loans, Inc. Trust, Series 2006-QS5, Class AP, 0.000%, 5/25/2036 (f) | | | 33,181 | | | | 21,155 | |
Residential Accredit Loans, Inc. Trust, Series 2006-QS5, Class A1, 6.000%, 5/25/2036 | | | 951,109 | | | | 864,260 | |
Residential Accredit Loans, Inc. Trust, Series 2006-QS5, Class A9, 6.000%, 5/25/2036 | | | 1,358,879 | | | | 1,234,033 | |
Residential Accredit Loans, Inc. Trust, Series 2006-QS9, Class 2AP, 0.000%, 7/25/2036 (f) | | | 14,951 | | | | 4,673 | |
Residential Accredit Loans, Inc. Trust, Series 2006-QS9, Class 1AP, 0.000%, 7/25/2036 (f) | | | 39,492 | | | | 24,913 | |
Residential Accredit Loans, Inc. Trust, Series 2006-QA5, Class 1A1,
2.619% (1 Month LIBOR USD + 0.360%), 7/25/2036 (b) | | | 115,913 | | | | 64,021 | |
Residential Accredit Loans, Inc. Trust, Series 2006-QA5, Class 1A2,
2.619% (1 Month LIBOR USD + 0.360%), 7/25/2036 (b) | | | 6,267,357 | | | | 3,225,094 | |
Residential Accredit Loans, Inc. Trust, Series 2006-QA6, Class A3,
2.639% (1 Month LIBOR USD + 0.380%), 7/25/2036 (b) | | | 1,560,310 | | | | 1,515,604 | |
Residential Accredit Loans, Inc. Trust, Series 2006-QA5, Class 1A3,
2.699% (1 Month LIBOR USD + 0.440%), 7/25/2036 (b) | | | 604,815 | | | | 293,084 | |
Residential Accredit Loans, Inc. Trust, Series 2006-QS9, Class 1A8,
2.909% (1 Month LIBOR USD + 0.650%), 7/25/2036 (b) | | | 1,104,944 | | | | 726,899 | |
Residential Accredit Loans, Inc. Trust, Series 2006-QS9, Class 1A10, 6.500%, 7/25/2036 | | | 1,589,121 | | | | 1,471,563 | |
See accompanying notes which are an integral part of these financial statements.
69
Angel Oak Multi-Strategy Income Fund
Consolidated Schedule of Investments – (continued)
July 31, 2022 (Unaudited)
| | | | | | | | |
| | | Principal
Amount | | | Value | |
Residential Mortgage-Backed Securities – (continued) | | | | | | | | |
Residential Accredit Loans, Inc. Trust, Series 2006-QA7, Class 2A1,
2.629% (1 Month LIBOR USD + 0.370%), 8/25/2036 (b) | | $ | 5,642,190 | | | $ | 5,011,512 | |
Residential Accredit Loans, Inc. Trust, Series 2006-QA7, Class 1A1,
2.639% (1 Month LIBOR USD + 0.380%), 8/25/2036 (b) | | | 5,981,147 | | | | 5,521,143 | |
Residential Accredit Loans, Inc. Trust, Series 2006-QS10, Class A4, 5.750%, 8/25/2036 | | | 1,445,866 | | | | 1,309,306 | |
Residential Accredit Loans, Inc. Trust, Series 2006-QS8, Class A1, 6.000%, 8/25/2036 | | | 2,090,419 | | | | 1,915,367 | |
Residential Accredit Loans, Inc. Trust, Series 2006-QS10, Class A15, 6.000%, 8/25/2036 | | | 270,558 | | | | 240,286 | |
Residential Accredit Loans, Inc. Trust, Series 2006-QS10, Class A10, 6.000%, 8/25/2036 | | | 207,275 | | | | 184,266 | |
Residential Accredit Loans, Inc. Trust, Series 2006-QS11, Class 1A2, 6.000%, 8/25/2036 | | | 2,422,869 | | | | 2,251,383 | |
Residential Accredit Loans, Inc. Trust, Series 2006-QS11, Class 1A8, 6.000%, 8/25/2036 | | | 2,413,903 | | | | 2,219,560 | |
Residential Accredit Loans, Inc. Trust, Series 2006-QS8, Class A2, 6.000%, 8/25/2036 | | | 872,191 | | | | 791,689 | |
Residential Accredit Loans, Inc. Trust, Series 2006-QS11, Class 1A1, 6.500%, 8/25/2036 | | | 3,436,787 | | | | 3,220,946 | |
Residential Accredit Loans, Inc. Trust, Series 2006-QS12, Class AP, 0.000%, 9/25/2036 (f) | | | 85,337 | | | | 55,150 | |
Residential Accredit Loans, Inc. Trust, Series 2006-QA8, Class A2,
2.619% (1 Month LIBOR USD + 0.360%), 9/25/2036 (b) | | | 419,943 | | | | 393,297 | |
Residential Accredit Loans, Inc. Trust, Series 2006-QS12, Class 2A7,
2.909% (1 Month LIBOR USD + 0.650%), 9/25/2036 (b) | | | 3,009,727 | | | | 2,271,212 | |
Residential Accredit Loans, Inc. Trust, Series 2006-QS12, Class 2A18, 5.750%, 9/25/2036 | | | 307,248 | | | | 276,208 | |
Residential Accredit Loans, Inc. Trust, Series 2006-QS12, Class 2A4, 6.000%, 9/25/2036 | | | 3,103,124 | | | | 2,825,556 | |
Residential Accredit Loans, Inc. Trust, Series 2006-QS15, Class AP, 0.000%, 10/25/2036 (f) | | | 126,832 | | | | 68,815 | |
Residential Accredit Loans, Inc. Trust, Series 2006-QS15, Class A1, 6.500%, 10/25/2036 | | | 22,023,865 | | | | 20,070,260 | |
Residential Accredit Loans, Inc. Trust, Series 2006-QS15, Class A5, 6.500%, 10/25/2036 | | | 1,182,415 | | | | 1,107,553 | |
Residential Accredit Loans, Inc. Trust, Series 2006-QS16, Class AP, 0.000%, 11/25/2036 (f) | | | 105,222 | | | | 54,441 | |
Residential Accredit Loans, Inc. Trust, Series 2006-QS14, Class A15,
2.559% (1 Month LIBOR USD + 0.300%), 11/25/2036 (b) | | | 1,753,294 | | | | 1,081,956 | |
Residential Accredit Loans, Inc. Trust, Series 2006-QS16, Class A3,
6.000% (1 Month LIBOR USD + 0.550%), 11/25/2036 (b) | | | 7,491,697 | | | | 6,409,431 | |
Residential Accredit Loans, Inc. Trust, Series 2006-QS14, Class A25, 6.500%, 11/25/2036 | | | 5,982,302 | | | | 5,560,018 | |
Residential Accredit Loans, Inc. Trust, Series 2006-QS14, Class A13, 6.500%, 11/25/2036 | | | 920,399 | | | | 826,281 | |
Residential Accredit Loans, Inc. Trust, Series 2006-QS14, Class A1, 6.500%, 11/25/2036 | | | 904,764 | | | | 812,093 | |
Residential Accredit Loans, Inc. Trust, Series 2006-QA10, Class A2,
2.619% (1 Month LIBOR USD + 0.360%), 12/25/2036 (b) | | | 460,379 | | | | 408,427 | |
Residential Accredit Loans, Inc. Trust, Series 2006-QA10, Class A1,
2.629% (1 Month LIBOR USD + 0.370%), 12/25/2036 (b) | | | 6,207,355 | | | | 5,487,767 | |
Residential Accredit Loans, Inc. Trust, Series 2006-QS18, Class 2A1,
2.709% (1 Month LIBOR USD + 0.450%), 12/25/2036 (b) | | | 5,203,571 | | | | 3,762,442 | |
Residential Accredit Loans, Inc. Trust, Series 2006-QS17, Class A6, 6.250%, 12/25/2036 | | | 4,682,544 | | | | 4,270,981 | |
Residential Accredit Loans, Inc. Trust, Series 2007-QS1, Class 2AP, 0.000%, 1/25/2037 (f) | | | 857,855 | | | | 478,628 | |
Residential Accredit Loans, Inc. Trust, Series 2007-QS1, Class 1AP, 0.000%, 1/25/2037 (f) | | | 40,305 | | | | 22,933 | |
Residential Accredit Loans, Inc. Trust, Series 2007-QS1, Class 1A5,
2.174% (1 Month LIBOR USD + 0.550%), 1/25/2037 (b) | | | 7,023,053 | | | | 5,069,149 | |
Residential Accredit Loans, Inc. Trust, Series 2007-QS1, Class 2A4,
2.809% (1 Month LIBOR USD + 0.550%), 1/25/2037 (b) | | | 9,680,151 | | | | 7,231,692 | |
Residential Accredit Loans, Inc. Trust, Series 2007-QS1, Class 2A10, 6.000%, 1/25/2037 | | | 1,700,413 | | | | 1,553,464 | |
Residential Accredit Loans, Inc. Trust, Series 2007-QS3, Class AP, 0.000%, 2/25/2037 (f) | | | 432,718 | | | | 219,188 | |
Residential Accredit Loans, Inc. Trust, Series 2007-QA2, Class A3,
2.559% (1 Month LIBOR USD + 0.300%), 2/25/2037 (b) | | | 6,009,397 | | | | 5,488,695 | |
Residential Accredit Loans, Inc. Trust, Series 2007-QH1, Class A1,
2.579% (1 Month LIBOR USD + 0.320%), 2/25/2037 (b)(j) | | | 6,286,143 | | | | 5,727,405 | |
See accompanying notes which are an integral part of these financial statements.
70
Angel Oak Multi-Strategy Income Fund
Consolidated Schedule of Investments – (continued)
July 31, 2022 (Unaudited)
| | | | | | | | |
| | | Principal
Amount | | | Value | |
Residential Mortgage-Backed Securities – (continued) | | | | | | | | |
Residential Accredit Loans, Inc. Trust, Series 2007-QS3, Class A2, 6.000%, 2/25/2037 (j) | | $ | 11,334,049 | | | $ | 10,144,008 | |
Residential Accredit Loans, Inc. Trust, Series 2007-QS5, Class AP, 0.000%, 3/25/2037 (f) | | | 198,755 | | | | 105,926 | |
Residential Accredit Loans, Inc. Trust, Series 2007-QS5, Class A7, 0.000%, 3/25/2037 (f) | | | 185,626 | | | | 97,221 | |
Residential Accredit Loans, Inc. Trust, Series 2007-QS4, Class 4A3, 0.000%, 3/25/2037 (f) | | | 556,600 | | | | 41,864 | �� |
Residential Accredit Loans, Inc. Trust, Series 2007-QS5, Class A1, 5.500%, 3/25/2037 | | | 362,664 | | | | 310,553 | |
Residential Accredit Loans, Inc. Trust, Series 2007-QS6, Class AP, 0.000%, 4/25/2037 (f) | | | 355,582 | | | | 181,887 | |
Residential Accredit Loans, Inc. Trust, Series 2007-QS6, Class A1,
2.589% (1 Month LIBOR USD + 0.330%), 4/25/2037 (b) | | | 3,298,238 | | | | 2,274,884 | |
Residential Accredit Loans, Inc. Trust, Series 2007-QA3, Class A3,
2.639% (1 Month LIBOR USD + 0.380%), 5/25/2037 (b)(j) | | | 12,023,307 | | | | 10,684,728 | |
Residential Accredit Loans, Inc. Trust, Series 2007-QS7, Class 1A7,
2.809% (1 Month LIBOR USD + 0.550%), 5/25/2037 (b) | | | 539,327 | | | | 391,096 | |
Residential Accredit Loans, Inc. Trust, Series 2007-QS8, Class A13, 6.000%, 6/25/2037 | | | 1,869,663 | | | | 1,761,163 | |
Residential Accredit Loans, Inc. Trust, Series 2007-QS9, Class AP, 0.000%, 7/25/2037 (f) | | | 998,018 | | | | 469,996 | |
Residential Accredit Loans, Inc. Trust, Series 2007-QS10, Class A1, 6.500%, 9/25/2037 | | | 7,199,802 | | | | 6,696,673 | |
Residential Accredit Loans, Inc. Trust, Series 2005-QO5, Class X, 1.681%, 1/25/2046 (e)(g)(h) | | | 24,646,063 | | | | 1,074,051 | |
Residential Accredit Loans, Inc. Trust, Series 2006-QO7, Class X3, 1.500%, 9/25/2046 (e)(h) | | | 15,131,694 | | | | 406,528 | |
Residential Accredit Loans, Inc. Trust, Series 2007-QO5, Class A,
3.763% (12 Month US Treasury Average + 3.120%), 8/25/2047 (b) | | | 23,761,688 | | | | 6,461,349 | |
Residential Asset Securitization Trust, Series 2005-A4, Class A1,
2.709% (1 Month LIBOR USD + 0.450%), 4/25/2035 (b) | | | 2,914,870 | | | | 1,810,942 | |
Residential Asset Securitization Trust, Series 2005-A10, Class A3, 5.500%, 9/25/2035 | | | 4,123,092 | | | | 3,131,039 | |
Residential Asset Securitization Trust, Series 2005-A10, Class A4, 5.500%, 9/25/2035 | | | 1,122,772 | | | | 855,777 | |
Residential Asset Securitization Trust, Series 2005-A11, Class PO, 0.000%, 10/25/2035 (f) | | | 548,657 | | | | 343,659 | |
Residential Asset Securitization Trust, Series 2005-A11, Class 1A1,
2.709% (1 Month LIBOR USD + 0.450%), 10/25/2035 (b) | | | 1,859,866 | | | | 1,212,832 | |
Residential Asset Securitization Trust, Series 2005-A11, Class 1A3, 5.500%, 10/25/2035 | | | 1,663,871 | | | | 1,486,233 | |
Residential Asset Securitization Trust, Series 2005-A12, Class A10,
2.709% (1 Month LIBOR USD + 0.450%), 11/25/2035 (b) | | | 940,563 | | | | 515,331 | |
Residential Asset Securitization Trust, Series 2005-A12, Class A6,
2.759% (1 Month LIBOR USD + 0.500%), 11/25/2035 (b) | | | 3,821,122 | | | | 2,197,397 | |
Residential Asset Securitization Trust, Series 2005-A14, Class A3, 5.500%, 12/25/2035 | | | 632,618 | | | | 487,909 | |
Residential Asset Securitization Trust, Series 2006-A2, Class A5,
2.959% (1 Month LIBOR USD + 0.700%), 5/25/2036 (b) | | | 1,845,499 | | | | 600,047 | |
Residential Asset Securitization Trust, Series 2006-A8, Class 2A3, 6.000%, 8/25/2036 | | | 6,289,025 | | | | 3,245,866 | |
Residential Asset Securitization Trust, Series 2006-A8, Class 2A4, 6.500%, 8/25/2036 | | | 10,330,364 | | | | 5,790,531 | |
Residential Asset Securitization Trust, Series 2006-A8, Class 2A1, 6.500%, 8/25/2036 | | | 1,634,214 | | | | 847,827 | |
Residential Asset Securitization Trust, Series 2006-A8, Class 2A2, 6.750%, 8/25/2036 | | | 10,400,965 | | | | 4,160,438 | |
Residential Asset Securitization Trust, Series 2006-A14C, Class 2A4, 6.000%, 12/25/2036 | | | 3,068,404 | | | | 1,595,834 | |
Residential Asset Securitization Trust, Series 2006-A16, Class 2A1, 6.000%, 2/25/2037 | | | 7,893,633 | | | | 2,856,998 | |
Residential Asset Securitization Trust, Series 2006-A16, Class 2A3, 6.609%, 2/25/2037 (g) | | | 21,194,499 | | | | 8,097,698 | |
Residential Asset Securitization Trust, Series 2007-A6, Class 1A4, 6.000%, 6/25/2037 | | | 2,196,403 | | | | 1,785,491 | |
Residential Asset Securitization Trust, Series 2007-A7, Class A6, 6.000%, 7/25/2037 | | | 3,972,856 | | | | 2,330,128 | |
Residential Funding Mortgage Securities Trust, Series 2005-S7, Class AP, 0.000%, 11/25/2035 (f) | | | 31,808 | | | | 22,885 | |
Residential Funding Mortgage Securities Trust, Series 2006-SA1, Class 1A1, 4.040%, 2/25/2036 (g) | | | 749,058 | | | | 635,465 | |
See accompanying notes which are an integral part of these financial statements.
71
Angel Oak Multi-Strategy Income Fund
Consolidated Schedule of Investments – (continued)
July 31, 2022 (Unaudited)
| | | | | | | | |
| | | Principal
Amount | | | Value | |
Residential Mortgage-Backed Securities – (continued) | | | | | | | | |
Residential Funding Mortgage Securities Trust, Series 2006-S4, Class AP, 0.000%, 4/25/2036 (f) | | $ | 116,008 | | | $ | 89,700 | |
Residential Funding Mortgage Securities Trust, Series 2006-S5, Class A4, 0.000%, 6/25/2036 (f) | | | 36,499 | | | | 22,975 | |
Residential Funding Mortgage Securities Trust, Series 2006-S5, Class A12, 6.000%, 6/25/2036 | | | 543,852 | | | | 527,008 | |
Residential Funding Mortgage Securities Trust, Series 2006-S5, Class A9, 6.000%, 6/25/2036 | | | 705,905 | | | | 668,776 | |
Residential Funding Mortgage Securities Trust, Series 2006-S7, Class A7, 6.250%, 8/25/2036 | | | 58,787 | | | | 54,782 | |
Residential Funding Mortgage Securities Trust, Series 2006-S9, Class A4, 5.750%, 9/25/2036 | | | 4,452,530 | | | | 4,137,442 | |
Residential Funding Mortgage Securities Trust, Series 2006-S10, Class 1AP, 0.000%, 10/25/2036 (f) | | | 12,276 | | | | 7,509 | |
Residential Funding Mortgage Securities Trust, Series 2006-S10, Class 1A3, 6.000%, 10/25/2036 | | | 452,500 | | | | 424,681 | |
Residential Funding Mortgage Securities Trust, Series 2006-SA4, Class 2A1, 4.825%, 11/25/2036 (g) | | | 787,478 | | | | 721,876 | |
Residential Funding Mortgage Securities Trust, Series 2007-S1, Class A7, 6.000%, 1/25/2037 | | | 1,388,987 | | | | 1,307,344 | |
Residential Funding Mortgage Securities Trust, Series 2007-S5, Class AP, 0.000%, 5/25/2037 (f) | | | 201,042 | | | | 138,088 | |
Residential Mortgage Loan Trust, Series 2020-1, Class B2, 4.665%, 1/25/2060 (a)(g) | | | 1,075,000 | | | | 983,590 | |
Rocket Mortgage Trust, Series 2021-2, Class B4, 2.565%, 6/25/2051 (a)(g) | | | 2,542,960 | | | | 1,573,868 | |
Rocket Mortgage Trust, Series 2021-2, Class B5, 2.565%, 6/25/2051 (a)(g) | | | 1,566,000 | | | | 718,399 | |
Rocket Mortgage Trust, Series 2021-2, Class B6, 2.565%, 6/25/2051 (a)(g) | | | 870,254 | | | | 255,264 | |
Rocket Mortgage Trust, Series 2021-4, Class B2A, 3.011%, 9/25/2051 (a)(c)(g) | | | 16,155,340 | | | | 15,285,585 | |
Rocket Mortgage Trust, Series 2021-4, Class B4, 3.011%, 9/25/2051 (a)(g) | | | 9,502,044 | | | | 7,490,804 | |
Rocket Mortgage Trust, Series 2021-4, Class B6, 3.011%, 9/25/2051 (a)(g) | | | 6,294,411 | | | | 2,034,719 | |
Rocket Mortgage Trust, Series 2021-4, Class B3, 3.011%, 9/25/2051 (a)(g) | | | 7,602,224 | | | | 6,595,751 | |
Rocket Mortgage Trust, Series 2021-4, Class B5, 3.011%, 9/25/2051 (a)(g) | | | 8,078,160 | | | | 5,262,849 | |
Rocket Mortgage Trust, Series 2021-6, Class B5, 2.795%, 12/25/2051 (a)(g) | | | 1,948,000 | | | | 883,023 | |
Rocket Mortgage Trust, Series 2021-6, Class B6, 2.795%, 12/25/2051 (a)(g) | | | 1,947,847 | | | | 581,565 | |
Rocket Mortgage Trust, Series 2021-6, Class B4, 2.795%, 12/25/2051 (a)(g) | | | 4,803,263 | | | | 3,175,480 | |
Rocket Mortgage Trust, Series 2022-1, Class B5, 2.756%, 1/25/2052 (a)(g) | | | 2,245,000 | | | | 1,114,613 | |
Rocket Mortgage Trust, Series 2022-1, Class B3, 2.756%, 1/25/2052 (a)(g) | | | 9,279,922 | | | | 7,067,774 | |
Rocket Mortgage Trust, Series 2022-1, Class B6, 2.756%, 1/25/2052 (a)(g) | | | 2,244,537 | | | | 664,500 | |
Rocket Mortgage Trust, Series 2022-1, Class B4, 2.756%, 1/25/2052 (a)(g) | | | 5,197,193 | | | | 3,876,264 | |
Saluda Grade Alternative Mortgage Trust, Series 2020-PAC1, Class A2, 6.899%, 8/25/2027 (a) | | | 15,000,000 | | | | 14,899,245 | |
Saluda Grade Alternative Mortgage Trust, Series 2021-MF1, Class A1, 2.805%, 11/25/2029 (a)(g) | | | 14,000,000 | | | | 13,637,764 | |
Saluda Grade Alternative Mortgage Trust, Series 2020-SEQ1, Class C, 0.000%, 5/25/2050 (a)(e)(g)(h) | | | 47,102,583 | | | | 2,625,875 | |
Saluda Grade Alternative Mortgage Trust, Series 2020-SEQ1, Class A1, 3.321%, 5/25/2050 (a)(g) | | | 6,862,380 | | | | 6,803,679 | |
Saluda Grade Alternative Mortgage Trust, Series 2020-SEQ1, Class A2, 5.000%, 5/25/2050 (a)(g) | | | 6,028,788 | | | | 5,982,511 | |
Saluda Grade Alternative Mortgage Trust, Series 2020-SEQ1, Class M1, 7.500%, 5/25/2050 (a)(g) | | | 7,318,000 | | | | 7,545,575 | |
Saluda Grade Alternative Mortgage Trust, Series 2020-FIG1, Class A1, 3.568%, 9/25/2050 (a) | | | 2,916,142 | | | | 2,900,563 | |
Saluda Grade Alternative Mortgage Trust, Series 2020-FIG1, Class M1, 7.000%, 9/25/2050 (a) | | | 15,144,128 | | | | 14,933,110 | |
Saluda Grade Alternative Mortgage Trust, Series 2021-FIG2, Class C, 0.000%, 10/25/2051 (a)(g)(h) | | | 149,483 | | | | 814,339 | |
See accompanying notes which are an integral part of these financial statements.
72
Angel Oak Multi-Strategy Income Fund
Consolidated Schedule of Investments – (continued)
July 31, 2022 (Unaudited)
| | | | | | | | |
| | | Principal
Amount | | | Value | |
Residential Mortgage-Backed Securities – (continued) | | | | | | | | |
Saluda Grade Alternative Mortgage Trust, Series 2021-FIG2, Class M1, 4.250%, 10/25/2051 (a)(g) | | $ | 1,449,524 | | | $ | 1,766,090 | |
Saluda Grade Alternative Mortgage Trust, Series 2021-FIG2, Class M2, 6.000%, 10/25/2051 (a)(g) | | | 1,159,619 | | | | 1,414,138 | |
Saluda Grade Alternative Mortgage Trust, Series 2022-SEQ2, Class XS, 2.251%, 2/25/2052 (a)(e)(g)(h) | | | 165,048,653 | | | | 6,897,548 | |
Saluda Grade Alternative Mortgage Trust, Series 2022-SEQ2, Class A1, 3.500%, 2/25/2052 (a)(g) | | | 16,876,610 | | | | 16,888,390 | |
Saluda Grade Alternative Mortgage Trust, Series 2022-SEQ2, Class M1, 5.000%, 2/25/2052 (a)(g) | | | 5,213,750 | | | | 5,157,509 | |
Saluda Grade Alternative Mortgage Trust, Series 2022-SEQ2, Class M2, 5.500%, 2/25/2052 (a)(g) | | | 3,153,250 | | | | 3,030,907 | |
Saluda Grade Alternative Mortgage Trust, Series 2022-SEQ2, Class CERT, 5.530%, 2/25/2052 (a)(g) | | | 38,061,600 | | | | 36,693,057 | |
Saluda Grade Alternative Mortgage Trust, Series 2022-SEQ2, Class B2, 6.000%, 2/25/2052 (a)(g) | | | 2,011,000 | | | | 1,910,898 | |
Saluda Grade Alternative Mortgage Trust, Series 2022-SEQ2, Class B3, 6.460%, 2/25/2052 (a)(g) | | | 2,309,200 | | | | 2,156,555 | |
Saluda Grade Fund Trust, Series 2022-SG2, Class A, 5.000%, 5/15/2052 (a) | | | 15,000,000 | | | | 14,861,085 | |
Sequoia Mortgage Trust, Series 2004-4, Class A,
2.077% (6 Month LIBOR USD + 0.520%), 5/20/2034 (b) | | | 746,005 | | | | 673,368 | |
Sequoia Mortgage Trust, Series 2004-7, Class A3B,
1.874% (6 Month LIBOR USD + 1.100%), 8/20/2034 (b) | | | 31,565 | | | | 27,537 | |
Sequoia Mortgage Trust, Series 2005-2, Class XA, 0.027%, 3/20/2035 (e)(g)(h) | | | 5,990,225 | | | | 39,559 | |
Sequoia Mortgage Trust, Series 2007-1, Class 5A1, 2.537%, 10/20/2046 (g) | | | 2,304,647 | | | | 1,931,759 | |
Sequoia Mortgage Trust, Series 2020-3, Class B4, 3.329%, 4/25/2050 (a)(g) | | | 2,415,747 | | | | 2,084,002 | |
Sequoia Mortgage Trust, Series 2021-1, Class B4, 2.673%, 3/25/2051 (a)(g) | | | 2,548,665 | | | | 1,754,371 | |
Sequoia Mortgage Trust, Series 2021-7, Class B4, 2.869%, 11/25/2051 (a)(g) | | | 1,624,858 | | | | 1,005,423 | |
SG Residential Mortgage Trust, Series 2021-2, Class A1, 1.737%, 12/25/2061 (a)(c)(g) | | | 31,808,653 | | | | 28,114,460 | |
SG Residential Mortgage Trust, Series 2021-2, Class A2, 1.942%, 12/25/2061 (a)(c)(g) | | | 9,374,464 | | | | 8,184,123 | |
Shellpoint Asset Funding Trust, Series 2013-1, Class B4, 3.876%, 7/25/2043 (a)(g) | | | 782,566 | | | | 750,810 | |
Shellpoint Asset Funding Trust, Series 2013-1, Class B5, 3.876%, 7/25/2043 (a)(g) | | | 2,735,781 | | | | 2,207,756 | |
Spruce Hill Mortgage Loan Trust, Series 2020-SH1, Class B2, 4.676%, 1/28/2050 (a)(g) | | | 6,000,000 | | | | 5,616,816 | |
Starwood Mortgage Residential Trust, Series 2021-5, Class A1, 1.920%, 9/25/2066 (a)(g) | | | 8,215,073 | | | | 7,592,551 | |
Starwood Mortgage Residential Trust, Series 2021-5, Class A3, 2.436%, 9/25/2066 (a)(g) | | | 9,427,618 | | | | 8,602,428 | |
Starwood Mortgage Residential Trust, Series 2022-1, Class A1, 2.447%, 12/25/2066 (a)(g) | | | 2,747,507 | | | | 2,543,949 | |
Structured Adjustable Rate Mortgage Loan Trust, Series 2005-18, Class 3A1, 3.038%, 9/25/2035 (g) | | | 2,154,693 | | | | 1,932,796 | |
Structured Adjustable Rate Mortgage Loan Trust, Series 2005-23, Class 4A1, 2.934%, 1/25/2036 (g) | | | 410,886 | | | | 370,519 | |
Structured Adjustable Rate Mortgage Loan Trust, Series 2007-8, Class 1A2,
3.213% (1 Month LIBOR USD + 1.500%), 9/25/2037 (b) | | | 938,662 | | | | 802,622 | |
Structured Asset Mortgage Investments Trust, Series 2004-AR1, Class X, 0.571%, 3/19/2034 (e)(g)(h) | | | 6,045,713 | | | | 18,028 | |
Structured Asset Mortgage Investments Trust, Series 2004-AR7, Class X, 0.373%, 4/19/2035 (e)(g)(h) | | | 8,465,664 | | | | 141,588 | |
Structured Asset Mortgage Investments Trust, Series 2005-AR3, Class 1X, 1.503%, 7/25/2035 (e)(g)(h) | | | 11,496,041 | | | | 171,073 | |
See accompanying notes which are an integral part of these financial statements.
73
Angel Oak Multi-Strategy Income Fund
Consolidated Schedule of Investments – (continued)
July 31, 2022 (Unaudited)
| | | | | | | | |
| | | Principal
Amount | | | Value | |
Residential Mortgage-Backed Securities – (continued) | | | | | | | | |
Structured Asset Mortgage Investments Trust, Series 2006-AR5, Class 1X, 0.449%, 5/25/2036 (e)(g)(h) | | $ | 11,770,039 | | | $ | 475,345 | |
Structured Asset Mortgage Investments Trust, Series 2006-AR5, Class 4X, 0.837%, 5/25/2036 (e)(g)(h) | | | 36,691,545 | | | | 1,384,702 | |
Structured Asset Mortgage Investments Trust, Series 2006-AR8, Class X, 0.400%, 10/25/2036 (e)(h) | | | 83,866,373 | | | | 1,587,842 | |
Structured Asset Mortgage Investments Trust, Series 2005-AR2, Class 1X, 0.909%, 5/25/2045 (e)(g)(h) | | | 8,089,195 | | | | 122,487 | |
Structured Asset Securities Corp. Mortgage Pass-Through Certificates, Series 2003-6A, Class 2A1, 2.688%, 3/25/2033 (g) | | | 15,010 | | | | 15,086 | |
TBW Mortgage-Backed Trust, Series 2006-3, Class 2A1, 6.500%, 7/25/2036 | | | 3,181,768 | | | | 1,514,830 | |
Terwin Mortgage Trust, Series 2005-18AL, Class PX, 2.672%, 1/25/2037 (a)(e)(g)(h) | | | 25,322,984 | | | | 1,258,755 | |
TH MSR Issuer Trust, Series 2019-FT1, Class A,
5.059% (1 Month LIBOR USD + 2.800%), 6/25/2024 (a)(b) | | | 2,000,000 | | | | 1,963,072 | |
Traingle Re Ltd., Series 2021-1, Class B1,
6.759% (1 Month LIBOR USD + 4.500%), 8/25/2033 (a)(b) | | | 1,500,000 | | | | 1,479,236 | |
Traingle Re Ltd., Series 2021-3, Class M1B, 4.414% (SOFR30A + 2.900%), 2/25/2034 (a)(b) | | | 8,400,000 | | | | 8,064,403 | |
Traingle Re Ltd., Series 2021-3, Class M2, 5.264% (SOFR30A + 3.750%), 2/25/2034 (a)(b) | | | 2,200,000 | | | | 2,029,181 | |
Unison Trust, Series 2021-1, Class A, 4.500%, 4/25/2050 (a)(g) | | | 9,216,152 | | | | 8,700,250 | |
Unlock Residential Trust, 6.000%, 5/1/2033 (e)(l) | | | 45,000,000 | | | | 45,000,000 | |
UWM Mortgage Trust, Series 2021-INV1, Class B5, 3.165%, 8/25/2051 (a)(g) | | | 1,649,067 | | | | 1,198,309 | |
UWM Mortgage Trust, Series 2021-INV1, Class B2, 3.165%, 8/25/2051 (a)(g) | | | 7,515,355 | | | | 6,377,606 | |
UWM Mortgage Trust, Series 2021-INV1, Class B1, 3.165%, 8/25/2051 (a)(g) | | | 6,415,978 | | | | 5,918,893 | |
UWM Mortgage Trust, Series 2021-INV1, Class B6, 3.165%, 8/25/2051 (a)(g) | | | 3,483,323 | | | | 1,319,681 | |
UWM Mortgage Trust, Series 2021-INV1, Class B3, 3.165%, 8/25/2051 (a)(g) | | | 4,398,492 | | | | 3,795,564 | |
UWM Mortgage Trust, Series 2021-INV1, Class B4, 3.165%, 8/25/2051 (a)(g) | | | 2,199,736 | | | | 1,738,370 | |
UWM Mortgage Trust, Series 2021-INV2, Class B6, 3.200%, 9/25/2051 (a)(g) | | | 4,513,305 | | | | 2,051,911 | |
UWM Mortgage Trust, Series 2021-INV2, Class B3, 3.253%, 9/25/2051 (a)(g) | | | 5,307,412 | | | | 4,482,625 | |
UWM Mortgage Trust, Series 2021-INV2, Class B5, 3.253%, 9/25/2051 (a)(g) | | | 2,162,279 | | | | 1,511,390 | |
UWM Mortgage Trust, Series 2021-INV2, Class B4, 3.253%, 9/25/2051 (a)(g) | | | 2,947,580 | | | | 2,301,936 | |
UWM Mortgage Trust, Series 2021-INV2, Class B2, 3.253%, 9/25/2051 (a)(g) | | | 9,041,275 | | | | 7,836,914 | |
UWM Mortgage Trust, Series 2021-INV2, Class B1, 3.253%, 9/25/2051 (a)(g) | | | 6,485,854 | | | | 6,056,238 | |
UWM Mortgage Trust, Series 2021-INV3, Class B6, 3.220%, 11/25/2051 (a)(g) | | | 10,197,278 | | | | 4,617,113 | |
UWM Mortgage Trust, Series 2021-INV3, Class B2, 3.243%, 11/25/2051 (a)(c)(g) | | | 17,947,681 | | | | 15,513,293 | |
UWM Mortgage Trust, Series 2021-INV3, Class B5, 3.243%, 11/25/2051 (a)(g) | | | 4,486,920 | | | | 3,223,363 | |
UWM Mortgage Trust, Series 2021-INV3, Class B4, 3.243%, 11/25/2051 (a)(g) | | | 6,118,169 | | | | 4,926,417 | |
UWM Mortgage Trust, Series 2021-INV3, Class B3, 3.243%, 11/25/2051 (a)(g) | | | 8,565,043 | | | | 7,203,030 | |
UWM Mortgage Trust, Series 2021-INV3, Class B1, 3.243%, 11/25/2051 (a)(c)(g) | | | 13,868,573 | | | | 12,716,580 | |
Verus Securitization Trust, Series 2021-7, Class A1, 1.829%, 10/25/2066 (a)(g) | | | 7,157,336 | | | | 6,562,826 | |
Verus Securitization Trust, Series 2022-3, Class M1, 4.119%, 2/25/2067 (a)(g) | | | 2,500,000 | | | | 2,273,303 | |
Verus Securitization Trust, Series 2022-7, Class M1, 5.429%, 7/25/2067 (a)(g) | | | 750,000 | | | | 676,991 | |
Wachovia Mortgage Loan Trust LLC, Series 2006-AMN1, Class A1,
1.724% (1 Month LIBOR USD + 0.100%), 8/25/2036 (b) | | | 4,804,195 | | | | 1,862,073 | |
Wachovia Mortgage Loan Trust LLC, Series 2006-AMN1, Class A2,
1.924% (1 Month LIBOR USD + 0.300%), 8/25/2036 (b) | | | 21,246,304 | | | | 9,511,142 | |
Wachovia Mortgage Loan Trust LLC, Series 2006-AMN1, Class A3,
2.104% (1 Month LIBOR USD + 0.480%), 8/25/2036 (b) | | | 2,387,488 | | | | 1,184,037 | |
Wachovia Mortgage Loan Trust LLC, Series 2006-ALT1, Class A1,
2.419% (1 Month LIBOR USD + 0.160%), 1/25/2037 (b) | | | 7,012,717 | | | | 3,297,849 | |
See accompanying notes which are an integral part of these financial statements.
74
Angel Oak Multi-Strategy Income Fund
Consolidated Schedule of Investments – (continued)
July 31, 2022 (Unaudited)
| | | | | | | | |
| | | Principal
Amount | | | Value | |
Residential Mortgage-Backed Securities – (continued) | | | | | | | | |
Wachovia Mortgage Loan Trust LLC, Series 2006-ALT1, Class A2,
2.619% (1 Month LIBOR USD + 0.360%), 1/25/2037 (b) | | $ | 2,258,532 | | | $ | 1,306,856 | |
Washington Mutual Mortgage Pass-Through Certificates Trust, Series 2004-AR3, Class B1, 3.098%, 6/25/2034 (g) | | | 596,348 | | | | 589,491 | |
Washington Mutual Mortgage Pass-Through Certificates Trust, Series 2005-AR16, Class 1A2, 2.724%, 12/25/2035 (g)(j) | | | 11,552,839 | | | | 11,034,648 | |
Washington Mutual Mortgage Pass-Through Certificates Trust, Series 2005-AR18, Class 1A2, 2.834%, 1/25/2036 (g)(j) | | | 12,264,416 | | | | 12,170,188 | |
Washington Mutual Mortgage Pass-Through Certificates Trust, Series 2006-AR14, Class 2A3, 2.605%, 11/25/2036 (g) | | | 628,946 | | | | 589,383 | |
Washington Mutual Mortgage Pass-Through Certificates Trust, Series 2006-AR18, Class 3A1, 3.026%, 1/25/2037 (g) | | | 341,435 | | | | 304,218 | |
Washington Mutual Mortgage Pass-Through Certificates Trust, Series 2007-HY6, Class 1A1, 3.188%, 6/25/2037 (g) | | | 1,994,182 | | | | 1,880,360 | |
Washington Mutual Mortgage Pass-Through Certificates Trust, Series 2004-AR10, Class X, 0.816%, 7/25/2044 (e)(g)(h) | | | 10,936,751 | | | | 120,523 | |
Washington Mutual Mortgage Pass-Through Certificates Trust, Series 2005-AR6, Class X, 0.709%, 4/25/2045 (e)(g)(h) | | | 18,226,971 | | | | 375,512 | |
Washington Mutual Mortgage Pass-Through Certificates Trust, Series 2007-OA4, Class 1XPP, 0.843%, 5/25/2047 (e)(g)(h) | | | 76,581,106 | | | | 153,392 | |
Washington Mutual Mortgage Pass-Through Certificates Trust, Series 2007-OA5, Class 1XPP, 0.696%, 6/25/2047 (e)(g)(h) | | | 64,374,167 | | | | 88,836 | |
Washington Mutual Mortgage Pass-Through Certificates WMALT Trust, Series 2003-MS7, Class P, 0.000%, 3/25/2033 (f) | | | 250 | | | | 191 | |
Washington Mutual Mortgage Pass-Through Certificates WMALT Trust, Series 2005-5, Class CB11, 3.659% (1 Month LIBOR USD + 1.400%), 7/25/2035 (b) | | | 3,649,924 | | | | 3,329,263 | |
Washington Mutual Mortgage Pass-Through Certificates WMALT Trust, Series 2005-9, Class 5A3, 3.609% (1 Month LIBOR USD + 1.350%), 11/25/2035 (b) | | | 1,813,767 | | | | 1,214,194 | |
Washington Mutual Mortgage Pass-Through Certificates WMALT Trust, Series 2005-AR1, Class A1A, 2.779% (1 Month LIBOR USD + 0.520%), 12/25/2035 (b) | | | 2,901,382 | | | | 2,407,050 | |
Washington Mutual Mortgage Pass-Through Certificates WMALT Trust, Series 2005-11, Class A7, 5.750%, 1/25/2036 | | | 6,366,805 | | | | 5,914,342 | |
Washington Mutual Mortgage Pass-Through Certificates WMALT Trust, Series 2007-HY1, Class A1, 2.439% (1 Month LIBOR USD + 0.180%), 2/25/2037 (b) | | | 7,066,618 | | | | 3,875,524 | |
Washington Mutual Mortgage Pass-Through Certificates WMALT Trust, Series 2007-3, Class A19, 6.000%, 4/25/2037 (j) | | | 4,913,947 | | | | 4,746,155 | |
Washington Mutual Mortgage Pass-Through Certificates WMALT Trust, Series 2006-AR8, Class 3X1, 1.388%, 10/25/2046 (e)(g)(h) | | | 13,438,254 | | | | 290,522 | |
Washington Mutual Mortgage Pass-Through Certificates WMALT Trust, Series 2007-OA4, Class XPPP, 1.633%, 4/25/2047 (e)(g)(h) | | | 23,576,688 | | | | 207,451 | |
Washington Mutual Mortgage Pass-Through Certificates WMALT Trust, Series 2007-OA3, Class 5A, 1.893% (12 Month US Treasury Average + 1.250%), 4/25/2047 (b) | | | 3,414,926 | | | | 2,893,832 | |
Wells Fargo Alternative Loan Trust, Series 2007-PA1, Class A1,
2.579% (1 Month LIBOR USD + 0.320%), 3/25/2037 (b) | | | 3,341,124 | | | | 2,493,568 | |
Wells Fargo Alternative Loan Trust, Series 2007-PA2, Class 1A1, 6.000%, 6/25/2037 | | | 941,336 | | | | 910,867 | |
Wells Fargo Alternative Loan Trust, Series 2007-PA3, Class 4A1, 6.500%, 7/25/2037 | | | 1,676,287 | | | | 1,482,872 | |
Wells Fargo Alternative Loan Trust, Series 2007-PA3, Class 4A3, 6.500%, 7/25/2037 | | | 1,838,883 | | | | 1,626,707 | |
Wells Fargo Mortgage Backed Securities Trust, Series 2006-AR11, Class A1, 3.914%, 8/25/2036 (g) | | | 158,289 | | | | 138,947 | |
See accompanying notes which are an integral part of these financial statements.
75
Angel Oak Multi-Strategy Income Fund
Consolidated Schedule of Investments – (continued)
July 31, 2022 (Unaudited)
| | | | | | | | |
| | | Principal
Amount | | | Value | |
Residential Mortgage-Backed Securities – (continued) | | | | | | | | |
Wells Fargo Mortgage Backed Securities Trust, Series 2006-AR12, Class 1A1, 3.403%, 9/25/2036 (g) | | $ | 280,121 | | | $ | 266,004 | |
Wells Fargo Mortgage Backed Securities Trust, Series 2006-AR14, Class 1A3, 3.043%, 10/25/2036 (g) | | | 496,895 | | | | 428,916 | |
Wells Fargo Mortgage Backed Securities Trust, Series 2007-17, Class APO, 0.000%, 1/25/2038 (f) | | | 43,366 | | | | 30,018 | |
Wells Fargo Mortgage Backed Securities Trust, Series 2019-3, Class B4, 3.736%, 7/25/2049 (a)(g) | | | 1,627,000 | | | | 1,514,421 | |
Wells Fargo Mortgage Backed Securities Trust, Series 2019-4, Class B4, 3.515%, 9/25/2049 (a)(g) | | | 2,124,000 | | | | 1,880,150 | |
Wells Fargo Mortgage Backed Securities Trust, Series 2021-1, Class B6, 2.719%, 12/25/2050 (a)(g) | | | 1,542,691 | | | | 545,246 | |
Wells Fargo Mortgage Backed Securities Trust, Series 2021-1, Class B4, 2.719%, 12/25/2050 (a)(g) | | | 1,818,000 | | | | 1,233,117 | |
Wells Fargo Mortgage Backed Securities Trust, Series 2021-1, Class B5, 2.719%, 12/25/2050 (a)(g) | | | 1,011,000 | | | | 534,394 | |
Wells Fargo Mortgage Backed Securities Trust, Series 2022-1, Class B6, 2.844%, 8/25/2051 (a)(g) | | | 1,852,327 | | | | 634,050 | |
Wells Fargo Mortgage Backed Securities Trust, Series 2022-1, Class B4, 2.980%, 8/25/2051 (a)(g) | | | 1,600,267 | | | | 1,379,554 | |
Wells Fargo Mortgage Backed Securities Trust, Series 2022-1, Class B2, 2.980%, 8/25/2051 (a)(g) | | | 4,802,777 | | | | 4,363,491 | |
Wells Fargo Mortgage Backed Securities Trust, Series 2022-1, Class B5, 2.980%, 8/25/2051 (a)(g) | | | 1,158,000 | | | | 664,016 | |
Wells Fargo Mortgage Loan Trust, Series 2010-RR2, Class 1A4, 2.772%, 9/27/2035 (a)(g) | | | 3,981,006 | | | | 3,441,185 | |
Western Mortgage Reference Notes, Series 2021-CL2, Class M4,
6.864% (SOFR30A + 5.350%), 7/25/2059 (a)(b) | | | 18,643,933 | | | | 18,236,116 | |
Western Mortgage Reference Notes, Series 2021-CL2, Class M5,
8.014% (SOFR30A + 6.500%), 7/25/2059 (a)(b) | | | 8,229,820 | | | | 8,039,448 | |
Western Mortgage Reference Notes, Series 2021-CL2, Class B,
10.014% (SOFR30A + 8.500%), 7/25/2059 (a)(b) | | | 6,600,000 | | | | 6,438,109 | |
WinWater Mortgage Loan Trust, Series 2014-1, Class B5, 3.912%, 6/20/2044 (a)(g) | | | 2,370,000 | | | | 2,151,488 | |
WinWater Mortgage Loan Trust, Series 2014-2, Class B5, 4.033%, 9/20/2044 (a)(g) | | | 1,938,000 | | | | 1,596,236 | |
WinWater Mortgage Loan Trust, Series 2015-A, Class B5, 3.826%, 6/20/2045 (a)(g) | | | 3,937,087 | | | | 2,994,832 | |
ZeroDown LLC, Series 2021-SFR1, Class A, 3.861%, 9/25/2024 (a)(g) | | | 16,659,346 | | | | 16,268,751 | |
ZeroDown LLC, Series 2021-SFR1, Class B, 7.677%, 9/25/2024 (a) | | | 4,442,444 | | | | 4,331,457 | |
| | | | | | | | |
| | |
TOTAL RESIDENTIAL MORTGAGE-BACKED SECURITIES
(Cost – $4,112,070,945) | | | | | | | $3,627,957,680 | |
| | | | | | | | |
Residential Mortgage-Backed Securities – U.S. Government Agency Credit Risk Transfer – 1.03% | | | | | | | | |
Connecticut Avenue Securities Trust, Series 2019-R07, Class 1M2,
4.359% (1 Month LIBOR USD + 2.100%), 10/25/2039 (a)(b) | | | 978,026 | | | | 974,353 | |
Connecticut Avenue Securities Trust, Series 2019-HRP1, Class B1,
11.509% (1 Month LIBOR USD + 9.250%), 11/25/2039 (a)(b) | | | 2,500,000 | | | | 2,500,000 | |
Federal Home Loan Mortgage Corp., Series 2021-DNA6, Class B2,
9.014% (SOFR30A + 7.500%), 10/25/2041 (a)(b) | | | 5,100,000 | | | | 4,457,308 | |
Federal Home Loan Mortgage Corp., Series 2021-HQA4, Class B2,
8.514% (SOFR30A + 7.000%), 12/26/2041 (a)(b) | | | 5,550,000 | | | | 4,396,482 | |
See accompanying notes which are an integral part of these financial statements.
76
Angel Oak Multi-Strategy Income Fund
Consolidated Schedule of Investments – (continued)
July 31, 2022 (Unaudited)
| | | | | | | | |
| | | Principal
Amount | | | Value | |
Residential Mortgage-Backed Securities – U.S. Government Agency Credit Risk Transfer – (continued) | | | | | | | | |
Federal Home Loan Mortgage Corp., Series 2022-DNA1, Class B1,
4.914% (SOFR30A + 3.400%), 1/27/2042 (a)(b) | | $ | 2,000,000 | | | $ | 1,745,000 | |
Federal Home Loan Mortgage Corp., Series 2022-DNA3, Class M1A,
3.514% (SOFR30A + 2.000%), 4/25/2042 (a)(b) | | | 1,624,337 | | | | 1,618,237 | |
Federal Home Loan Mortgage Corp., Series 2018-SPI2, Class B, 3.838%, 5/25/2048 (a)(c)(g) | | | 5,331,528 | | | | 4,910,342 | |
Federal Home Loan Mortgage Corp., Series 2018-SPI3, Class B, 4.155%, 8/25/2048 (a)(c)(g) | | | 10,186,271 | | | | 9,359,890 | |
Federal Home Loan Mortgage Corp., Series 2018-SPI4, Class B, 4.508%, 11/25/2048 (a)(c)(g) | | | 22,455,998 | | | | 21,865,810 | |
| | | | | | | | |
| | |
TOTAL RESIDENTIAL MORTGAGE-BACKED SECURITIES – U.S. GOVERNMENT AGENCY CREDIT RISK TRANSFER
(Cost – $54,787,498) | | | | | | | $51,827,422 | |
| | | | | | | | |
U.S. Treasury Notes – 2.87% | | | | | | | | |
0.625%, 10/15/2024 | | | 44,000,000 | | | | 41,897,969 | |
0.750%, 11/15/2024 | | | 15,000,000 | | | | 14,295,703 | |
2.125%, 11/30/2024 | | | 50,000,000 | | | | 49,152,344 | |
2.250%, 12/31/2024 | | | 40,000,000 | | | | 39,428,906 | |
| | | | | | | | |
| | |
TOTAL U.S. TREASURY NOTES
(Cost – $151,999,580) | | | | | | | $144,774,922 | |
| | | | | | | | |
Whole Loans – 0.38% | | | | | | | | |
Agency High Balance Residential Mortgages, 4.875% to 5.125%, 5/24/2048 to 6/5/2048 | | | 1,128,071 | | | | 1,105,479 | |
Agency High Balance Residential Mortgages,
2.500% to 4.500%, 4/26/2037 to 8/24/2037 (e) | | | 2,059,107 | | | | 2,024,325 | |
Gateway Mount Pleasant CRE, 5.300%, 08/01/2028 | | | 13,330,623 | | | | 11,642,517 | |
Savannah Grand, 7.020%, 02/06/2023 | | | 4,600,000 | | | | 4,596,892 | |
| | | | | | | | |
| | |
TOTAL WHOLE LOANS
(Cost – $19,392,821) | | | | | | | $19,369,213 | |
| | | | | | | | |
| | |
Short-Term Investments – 3.72% | | | Shares | | | | | |
Money Market Funds – 3.72% | | | | | | | | |
First American Government Obligations Fund, Class U, 1.459% (j)(q) | | | 187,379,929 | | | | 187,379,929 | |
| | | | | | | | |
| | |
TOTAL SHORT-TERM INVESTMENTS
(Cost – $187,379,929) | | | | | | | $187,379,929 | |
| | | | | | | | |
| | |
TOTAL INVESTMENTS – 110.53%
(Cost – $6,244,419,601) | | | | | | | $5,565,085,840 | |
| | |
Liabilities in Excess of Other Assets – (10.53%) | | | | | | | (530,213,895 | ) |
| | | | | | | | |
| | |
NET ASSETS – 100.00% | | | | | | | $5,034,871,945 | |
| | | | | | | | |
See accompanying notes which are an integral part of these financial statements.
77
Angel Oak Multi-Strategy Income Fund
Consolidated Schedule of Investments – (continued)
July 31, 2022 (Unaudited)
LIBOR: London Inter-Bank Offered Rate
SOFR30A: Secured Overnight Financing Rate 30 Day Average
TSFR1M: 1 Month Term Secured Overnight Financing Rate
TSFR3M: 3 Month Term Secured Overnight Financing Rate
| (a) | Security exempt from registration under Rule 144A or Section 4(a)(2) of the Securities Act of 1933. The security may be resold in transactions exempt from registration, normally to qualified institutional buyers. These securities are determined to be liquid by the Adviser, under the procedures established by the Fund’s Board of Trustees, unless otherwise denoted. At July 31, 2022, the value of these securities amounted to $2,993,066,738 or 59.45% of net assets. |
| (b) | Variable or floating rate security based on a reference index and spread. Certain securities are fixed to variable and currently in the fixed phase. Rate disclosed is the rate in effect as of July 31, 2022. |
| (c) | All or a portion of the security has been pledged as collateral in connection with open reverse repurchase agreements. At July 31, 2022, the value of securities pledged amounted to $532,672,347. |
| (d) | Security issued on a when-issued basis. On July 31, 2022, the total value of investments purchased on a when-issued basis was $1,310,499 or 0.03% of net assets. |
| (e) | Illiquid security. At July 31, 2022, the value of these securities amounted to $272,476,729 or 5.41% of net assets. |
| (f) | Principal only security. |
| (g) | Variable rate security. The coupon is based on an underlying pool of assets. Rate disclosed is the rate in effect as of July 31, 2022. |
| (h) | Interest only security. |
| (i) | Security exempt from registration under Regulation S of the Securities Act of 1933. Such securities are treated as liquid securities according to the Fund’s liquidity guidelines. At July 31, 2022, the value of securities pledged amounted to $9,192,940 or 0.18% of net assets. |
| (j) | All or a portion of the security has been pledged as collateral in connection with open credit agreements. At July 31, 2022, the value of securities pledged amounted to $634,859,691. |
| (k) | Security issued as a “Baby Bond”, with a par value of $25 per bond. The principal balance disclosed above represents the issuer’s outstanding principal that corresponds to the bonds held in the Fund. |
| (l) | As of July 31, 2022, the Fund has fair valued these securities under the procedures established by the Fund’s Board of Trustees. The value of these securities amounted to $46,322,201 or 0.92% of net assets. Value determined using significant unobservable inputs. |
| (m) | Non-income producing security. Item identified as in default as to the payment of interest. |
| (n) | Auction rate security. Rate disclosed is the rate in effect as of July 31, 2022. |
| (o) | Step-up bond that pays an initial coupon rate for the first period and then a higher coupon rate for the following periods. Rate disclosed is the rate in effect as of July 31, 2022. |
| (p) | Inverse floating rate security whose interest rate moves in the opposite direction of reference interest rates. Reference interest rates are typically based on a negative multiplier or slope. Interest rate may also be subject to a cap or floor. |
| (q) | Rate disclosed is the seven day yield as of July 31, 2022. |
Consolidated Schedule of Open Futures Contracts
| | | | | | | | | | | | | | |
| Short Futures Contracts | | Expiration Month | | Number of
Contracts | | | Notional Value | | | Value &
Unrealized
Appreciation
(Depreciation) | |
7 Year ERIS Aged Standard Swap Future | | March 2029 | | | (2,528 | ) | | | ($235,008,694 | ) | | | $9,947,538 | |
10 Year ERIS Aged Standard Swap Future | | December 2030 | | | (600 | ) | | | (52,996,980 | ) | | | 4,510,920 | |
10 Year ERIS Aged Standard Swap Future | | March 2032 | | | (559 | ) | | | (51,465,062 | ) | | | 2,392,632 | |
USD IRS 10 Year Prime Future | | September 2032 | | | (1,067 | ) | | | (102,549,370 | ) | | | (3,876,945 | ) |
| | | | | | | | | | | | | | |
Total | | | | | | | | | | | | | 12,974,145 | |
| | | | | | | | | | | | | | |
| Long Futures Contracts | | | | | | | | | | | |
3 Year ERIS Aged Standard Swap Future | | December 2024 | | | 674 | | | | 63,874,508 | | | | (3,127,495 | ) |
| | | | | | | | | | | | | | |
Long/Short Total | | | | | | | | | | | | | $9,846,650 | |
| | | | | | | | | | | | | | |
See accompanying notes which are an integral part of these financial statements.
78
Angel Oak Multi-Strategy Income Fund
Consolidated Schedule of Investments – (continued)
July 31, 2022 (Unaudited)
Consolidated Schedule of Open Reverse Repurchase Agreements
| | | | | | | | | | | | | | | | | | | | |
| Counterparty | | Interest
Rate | | | Trade
Date | | | Maturity Date | | | Net Closing
Amount | | | Face Value | |
Barclays Capital, Inc. | | | 3.534 | % | | | 6/21/2022 | | | | 9/21/2022 | | | | $228,645,553 | | | | $226,598,901 | |
Barclays Capital, Inc. | | | 3.534 | % | | | 7/5/2022 | | | | 9/21/2022 | | | | 11,218,824 | | | | 11,133,568 | |
Barclays Capital, Inc. | | | 3.534 | % | | | 7/8/2022 | | | | 9/21/2022 | | | | 12,357,908 | | | | 12,267,580 | |
| | | | | | | | | | | | | | | | | | | | |
| | | | | | | | | | | | | | | | | | | $250,000,049 | |
| | | | | | | | | | | | | | | | | | | | |
A reverse repurchase agreement, although structured as a sale and repurchase obligation, acts as a financing transaction under which the Fund will effectively pledge certain assets as collateral to secure a short-term loan. Generally, the other party to the agreement makes the loan in an amount less than the fair value of the pledged collateral. At the maturity of the reverse repurchase agreement, the Fund will be required to repay the loan and interest and correspondingly receive back its collateral. While used as collateral, the pledged assets continue to pay principal and interest which are for the benefit of the Fund.
See accompanying notes which are an integral part of these financial statements.
79
Angel Oak Financials Income Fund
Schedule of Investments
July 31, 2022 (Unaudited)
| | | | | | | | |
| | | Principal
Amount | | | Value | |
Collateralized Debt Obligations – 3.93% | | | | | | | | |
Hildene TruPS Financials Note Securitization Ltd., Series 2018-1A, Class A1,
3.788% (3 Month LIBOR USD + 1.360%), 10/12/2038 (a)(b)(c) | | $ | 1,429,402 | | | $ | 1,422,255 | |
Hildene TruPS Financials Note Securitization Ltd., Series 2018-1A, Class B,
6.468% (3 Month LIBOR USD + 4.040%), 10/12/2038 (a)(b)(c) | | | 1,000,000 | | | | 970,000 | |
Hildene TruPS Financials Note Securitization Ltd., Series 2019-2A, Class A1,
3.265% (3 Month LIBOR USD + 1.760%), 5/23/2039 (a)(b)(c) | | | 1,790,186 | | | | 1,754,383 | |
Hildene TruPS Financials Note Securitization Ltd., Series 2019-2A, Class A2,
3.955% (3 Month LIBOR USD + 2.450%), 5/23/2039 (a)(b)(c) | | | 2,000,000 | | | | 1,995,000 | |
| | | | | | | | |
| | |
TOTAL COLLATERALIZED DEBT OBLIGATIONS
(Cost – $6,184,718) | | | | | | $ | 6,141,638 | |
| | | | | | | | |
| | |
Common Stocks – 3.85% | | | Shares | | | | | |
Financial – 3.85% | | | | | | | | |
AmeriServ Financial, Inc. | | | 89,766 | | | | 353,678 | |
Arrow Financial Corp. | | | 17,100 | | | | 573,705 | |
Bank7 Corp. | | | 22,000 | | | | 518,540 | |
Central Valley Community Bancorp | | | 19,000 | | | | 317,870 | |
City Holding Co. | | | 4,500 | | | | 390,555 | |
Community Financial Corp. | | | 7,200 | | | | 263,520 | |
Eagle Bancorp Montana, Inc. | | | 28,506 | | | | 550,166 | |
Financial Institutions, Inc. | | | 16,594 | | | | 439,907 | |
First United Corp. | | | 36,500 | | | | 657,730 | |
Greene County Bancorp, Inc. | | | 13,500 | | | | 619,245 | |
Hingham Institution for Savings | | | 1,000 | | | | 290,010 | |
Pinnacle Financial Partners, Inc. | | | 6,000 | | | | 474,600 | |
Sterling Bancorp, Inc. (d) | | | 93,000 | | | | 582,180 | |
| | | | | | | | |
| | |
TOTAL COMMON STOCKS
(Cost – $5,654,619) | | | | | | $ | 6,031,706 | |
| | | | | | | | |
| | |
Corporate Obligations – 84.28% | |
| Principal
Amount |
| | | | |
Financial – 84.28% | | | | | | | | |
A10 Capital LLC, 5.875%, 8/17/2026 (b) | | $ | 1,000,000 | | | | 959,962 | |
Allegiance Bancshares, Inc., 4.700% (SOFR + 3.392%), 10/1/2029 (a) | | | 1,000,000 | | | | 1,004,193 | |
Amalgamated Financial Corp., 3.250% (TSFR3M + 2.300%), 11/15/2031 (a) | | | 2,000,000 | | | | 1,858,273 | |
Arbor Realty Trust, Inc., 5.750%, 4/1/2024 (b) | | | 1,500,000 | | | | 1,470,452 | |
Arbor Realty Trust, Inc., 4.500%, 3/15/2027 (b) | | | 2,500,000 | | | | 2,193,094 | |
B. Riley Financial, Inc., 5.500%, 3/31/2026 (e) | | | 1,000,000 | | | | 976,000 | |
Banc of California, Inc., 5.250%, 4/15/2025 | | | 500,000 | | | | 500,240 | |
Bancorp Bank, 4.750%, 8/15/2025 | | | 2,000,000 | | | | 1,982,169 | |
BankFinancial Corp., 3.750% (TSFR3M + 2.990%), 5/15/2031 (a)(b) | | | 2,000,000 | | | | 1,898,246 | |
BankGuam Holding Co., 4.750% (TSFR3M + 4.130%), 7/1/2031 (a)(b) | | | 2,000,000 | | | | 1,912,173 | |
Business Development Corp. of America, 4.750%, 12/30/2022 (b) | | | 2,000,000 | | | | 1,991,573 | |
Byline Bancorp, Inc., 6.000% (TSFR3M + 5.880%), 7/1/2030 (a) | | | 1,000,000 | | | | 1,029,772 | |
Cadence Bancorp, 4.750% (3 Month LIBOR USD + 3.030%), 6/30/2029 (a) | | | 2,500,000 | | | | 2,447,859 | |
CB Financial Services, Inc., 3.875% (TSFR3M + 2.800%), 12/15/2031 (a)(b) | | | 1,000,000 | | | | 936,506 | |
Central Pacific Financial Corp., 4.750% (TSFR3M + 4.560%), 11/1/2030 (a) | | | 1,000,000 | | | | 983,982 | |
Citizens Community Bancorp, Inc., 4.750% (TSFR3M + 3.290%), 4/1/2032 (a)(b) | | | 1,300,000 | | | | 1,277,863 | |
See accompanying notes which are an integral part of these financial statements.
80
Angel Oak Financials Income Fund
Schedule of Investments – (continued)
July 31, 2022 (Unaudited)
| | | | | | | | |
| | | Principal
Amount | | | Value | |
Corporate Obligations – (continued) | | | | | | | | |
Financial – (continued) | | | | | | | | |
Civista Bancshares, Inc., 3.250% (SOFR + 2.190%), 12/1/2031 (a) | | $ | 2,500,000 | | | $ | 2,341,181 | |
Clear Street Holdings LLC, 5.875%, 5/15/2026 (b) | | | 2,000,000 | | | | 1,921,900 | |
Colony Bankcorp, Inc., 5.250% (SOFRINDX + 5.250%), 5/20/2032 (a)(b) | | | 1,000,000 | | | | 988,065 | |
ConnectOne Bancorp, Inc., 5.200% (3 Month LIBOR USD + 2.840%), 2/1/2028 (a) | | | 1,950,000 | | | | 1,949,895 | |
Cowen, Inc., 7.250%, 5/6/2024 (b) | | | 1,000,000 | | | | 1,016,384 | |
CRB Group, Inc., 6.500% (TSFR3M + 6.380%), 9/1/2030 (a)(b) | | | 1,000,000 | | | | 1,015,534 | |
Dickinson Financial Corp., 4.250% (TSFR3M + 4.030%), 11/15/2030 (a)(b) | | | 1,250,000 | | | | 1,211,085 | |
Dime Community Bancshares, Inc., 5.000% (TSFR3M + 2.180%), 5/15/2032 (a) | | | 1,000,000 | | | | 992,710 | |
Equity Bancshares, Inc., 7.000% (TSFR3M + 6.880%), 6/30/2030 (a) | | | 1,000,000 | | | | 1,027,902 | |
FedNat Holding Co., 7.750%, 3/15/2029 | | | 2,500,000 | | | | 2,300,000 | |
Fidelity Bank, 5.875% (3 Month LIBOR USD + 3.630%), 5/31/2030 (a) | | | 2,000,000 | | | | 2,030,215 | |
Fidelity Financial Corp., 5.000% (TSFR3M + 2.470%), 4/30/2032 (a)(b) | | | 3,000,000 | | | | 2,978,660 | |
Financial Institutions, Inc., 6.000% (3 Month LIBOR USD + 3.944%), 4/15/2030 (a) | | | 1,500,000 | | | | 1,540,425 | |
First Bancshares, Inc., 6.400% (3 Month LIBOR USD + 3.390%), 5/1/2033 (a) | | | 2,500,000 | | | | 2,652,607 | |
First Business Financial Services, Inc., 5.500% (SOFR + 4.332%), 8/15/2029 (a)(b) | | | 3,000,000 | | | | 2,983,205 | |
First Foundation, Inc., 3.500% (SOFR + 2.040%), 2/1/2032 (a) | | | 1,000,000 | | | | 897,468 | |
First Internet Bancorp, 3.750% (SOFR + 3.110%), 9/1/2031 (a) | | | 1,000,000 | | | | 944,169 | |
First Northwest Bancorp, 3.750% (SOFR + 3.000%), 3/30/2031 (a) | | | 1,500,000 | | | | 1,424,154 | |
Firstsun Capital Bancorp, 6.000% (TSFR3M + 5.890%), 7/1/2030 (a)(b) | | | 2,000,000 | | | | 2,029,459 | |
Flushing Financial Corp., 3.125% (TSFR3M + 2.035%), 12/1/2031 (a) | | | 3,000,000 | | | | 2,763,937 | |
FS Bancorp, Inc., 3.750% (TSFR3M + 3.370%), 2/15/2031 (a) | | | 1,000,000 | | | | 951,312 | |
Happy Bancshares, Inc., 5.500% (TSFR3M + 5.345%), 7/31/2030 (a)(b)(c) | | | 3,000,000 | | | | 3,033,318 | |
Homestreet, Inc., 6.500%, 6/1/2026 | | | 3,000,000 | | | | 3,126,653 | |
Horizon Bancorp, Inc., 5.625% (TSFR3M + 5.490%), 7/1/2030 (a) | | | 1,000,000 | | | | 1,010,247 | |
Independent Bank Corp., 5.950% (TSFR3M + 5.825%), 5/31/2030 (a)(b) | | | 750,000 | | | | 762,784 | |
Independent Bank Group, Inc., 5.000% (3 Month LIBOR USD + 2.830%), 12/31/2027 (a) | | | 1,000,000 | | | | 1,002,901 | |
Jamesmark Bancshares, Inc., 3.750% (TSFR3M + 3.050%), 10/1/2031 (a)(b) | | | 850,000 | | | | 801,823 | |
Kingstone Cos, Inc., 5.500%, 12/30/2022 | | | 4,350,000 | | | | 4,293,614 | |
Level One Bancorp, Inc., 4.750% (TSFR3M + 3.110%), 12/18/2029 (a) | | | 1,000,000 | | | | 984,842 | |
Limestone Bancorp, Inc., 5.750% (3 Month LIBOR USD + 3.950%), 7/31/2029 (a)(b) | | | 1,000,000 | | | | 996,425 | |
Malvern Bancorp, Inc., 5.556% (12 Month LIBOR USD + 4.145%), 2/15/2027 (a) | | | 500,000 | | | | 499,946 | |
Marble Point Loan Financing Ltd. / MPLF Funding I LLC, 7.500%, 10/16/2025 (b) | | | 3,500,000 | | | | 3,618,040 | |
Mercantile Bank Corp., 3.250% (SOFR + 2.120%), 1/30/2032 (a) | | | 3,000,000 | | | | 2,771,987 | |
Midwest Bankcentre, Inc., 3.625% (TSFR3M + 2.950%), 6/15/2031 (a)(b) | | | 1,500,000 | | | | 1,419,775 | |
Millennium Consolidated Holdings LLC, 7.500%, 6/30/2023 (b) | | | 1,000,000 | | | | 1,000,686 | |
Narragansett Financial Corp., 3.875% (TSFR3M + 3.190%), 5/15/2031 (a)(b) | | | 2,000,000 | | | | 1,887,621 | |
National Bank of Indianapolis Corp.,
5.500% (3 Month LIBOR USD + 4.209%), 9/15/2029 (a)(b) | | | 2,000,000 | | | | 1,988,285 | |
New York Community Bancorp, Inc., 5.900% (3 Month LIBOR USD + 2.780%), 11/6/2028 (a) | | | 1,000,000 | | | | 1,010,506 | |
NexBank Capital, Inc., 4.000% (TSFR3M + 3.390%), 8/15/2031 (a)(b) | | | 3,000,000 | | | | 2,846,700 | |
NexBank Capital, Inc., 6.000%, 7/15/2032 (b) | | | 2,000,000 | | | | 2,045,916 | |
Northpointe Bancshares, Inc., 6.000% (TSFR3M + 4.905%), 9/30/2029 (a)(b) | | | 1,000,000 | | | | 999,367 | |
Oakstar Bancshares, Inc., 4.250% (TSFR3M + 3.516%), 4/15/2031 (a)(b) | | | 1,000,000 | | | | 949,541 | |
Olney Bancshares of Texas, Inc., 4.000% (TSFR3M + 3.320%), 3/15/2031 (a)(b) | | | 1,250,000 | | | | 1,177,973 | |
Pacific Western Bank, 3.250% (TSFR3M + 2.520%), 5/1/2031 (a) | | | 2,000,000 | | | | 1,865,500 | |
Peapack-Gladstone Financial Corp., 3.500% (TSFR3M + 3.260%), 12/30/2030 (a) | | | 1,500,000 | | | | 1,439,482 | |
Preferred Bank, 3.375% (TSFR3M + 2.780%), 6/15/2031 (a) | | | 4,000,000 | | | | 3,676,669 | |
Primis Financial Corp., 6.756% (3 Month LIBOR USD + 3.950%), 1/31/2027 (a)(b) | | | 1,000,000 | | | | 997,632 | |
See accompanying notes which are an integral part of these financial statements.
81
Angel Oak Financials Income Fund
Schedule of Investments – (continued)
July 31, 2022 (Unaudited)
| | | | | | | | |
| | | Principal
Amount | | | Value | |
Corporate Obligations – (continued) | | | | | | | | |
Financial – (continued) | | | | | | | | |
RBB Bancorp, 4.000% (TSFR3M + 3.290%), 4/1/2031 (a) | | $ | 3,000,000 | | | $ | 2,824,646 | |
Ready Capital Corp., 5.750%, 2/15/2026 (e) | | | 1,000,000 | | | | 955,200 | |
Renasant Corp., 3.000% (TSFR3M + 1.910%), 12/1/2031 (a) | | | 3,700,000 | | | | 3,391,124 | |
River Financial Corp., 4.000% (TSFR3M + 3.420%), 3/15/2031 (a)(b) | | | 1,000,000 | | | | 942,382 | |
SmartFinancial, Inc., 5.625% (3 Month LIBOR USD + 2.550%), 10/2/2028 (a)(b) | | | 1,250,000 | | | | 1,255,634 | |
South Street Securities Funding LLC, 6.250%, 12/30/2026 (b) | | | 1,000,000 | | | | 969,436 | |
Sterling Bancorp, Inc., 8.332% (3 Month LIBOR USD + 5.820%), 4/15/2026 (a)(b) | | | 2,000,000 | | | | 2,000,620 | |
Sterling Bancorp, Inc., 4.000% (TSFR3M + 2.530%), 12/30/2029 (a) | | | 50,000 | | | | 48,631 | |
Summit Financial Group, Inc., 3.250% (TSFR3M + 2.300%), 12/1/2031 (a) | | | 1,000,000 | | | | 926,213 | |
Texas State Bankshares, Inc., 5.750% (3 Month LIBOR USD + 3.550%), 6/15/2029 (a)(b) | | | 2,000,000 | | | | 1,993,425 | |
Trinitas Capital Management LLC, 6.000%, 7/30/2026 (b) | | | 2,000,000 | | | | 1,909,030 | |
Trinity Capital, Inc., 4.250%, 12/15/2026 | | | 2,000,000 | | | | 1,777,383 | |
Trustmark Corp., 3.625% (TSFR3M + 3.387%), 12/1/2030 (a) | | | 2,000,000 | | | | 1,899,647 | |
United Insurance Holdings Corp., 6.250%, 12/15/2027 | | | 2,000,000 | | | | 1,953,941 | |
Western Alliance Bancorp, 3.000% (TSFR3M + 2.250%), 6/15/2031 (a) | | | 2,000,000 | | | | 1,834,331 | |
WhiteHorse Finance, Inc., 4.000%, 12/15/2026 | | | 1,000,000 | | | | 903,107 | |
Zais Group LLC, 7.000%, 11/15/2023 (b) | | | 760,000 | | | | 746,373 | |
| | | | | | | | |
| | |
TOTAL CORPORATE OBLIGATIONS
(Cost – $136,600,379) | | | | | | | $131,921,980 | |
| | | | | | | | |
| | |
Preferred Stocks – 2.05% | | | Shares | | | | | |
Financial – 2.05% | | | | | | | | |
First Guaranty Bancshares, Inc., 6.750% | | | 40,000 | | | | 1,074,000 | |
PacWest Bancorp, 7.750% (H15T5Y + 4.820%) (a) | | | 40,000 | | | | 1,036,000 | |
Raymond James Financial, Inc., 6.375% (3 Month LIBOR USD + 4.088%) (a) | | | 43,321 | | | | 1,102,580 | |
| | | | | | | | |
| | |
TOTAL PREFERRED STOCKS
(Cost – $3,145,025) | | | | | | | $3,212,580 | |
| | | | | | | | |
| | |
Short-Term Investments – 4.92% | | | | | | | | |
Money Market Funds – 4.92% | | | | | | | | |
First American Government Obligations Fund, Class U, 1.459% (f) | | | 7,708,721 | | | | 7,708,721 | |
| | | | | | | | |
| | |
TOTALSHORT-TERM INVESTMENTS
(Cost – $7,708,721) | | | | | | | $7,708,721 | |
| | | | | | | | |
| | |
TOTAL INVESTMENTS – 99.03%
(Cost – $159,293,462) | | | | | | | $155,016,625 | |
| | |
Other Assets in Excess of Liabilities – 0.97% | | | | | | | 1,515,948 | |
| | | | | | | | |
| | |
NET ASSETS – 100.00% | | | | | | | $156,532,573 | |
| | | | | | | | |
LIBOR: London Inter-Bank Offered Rate
SOFR: Secured Overnight Financing Rate
SOFRINDX: Secured Overnight Financing Rate Compounded Index
TSFR3M: 3 Month Term Secured Overnight Financing Rate
H15T5Y: 5 Year Treasury Note Constant Maturity Rate
See accompanying notes which are an integral part of these financial statements.
82
Angel Oak Financials Income Fund
Schedule of Investments – (continued)
July 31, 2022 (Unaudited)
| (a) | Variable or floating rate security based on a reference index and spread. Certain securities are fixed to variable and currently in the fixed phase. Rate disclosed is the rate in effect as of July 31, 2022. |
| (b) | Security exempt from registration under Rule 144A or Section 4(a)(2) of the Securities Act of 1933. The security may be resold in transactions exempt from registration, normally to qualified institutional buyers. These securities are determined to be liquid by the Adviser, under the procedures established by the Fund’s Board of Trustees, unless otherwise denoted. At July 31, 2022, the value of these securities amounted to $67,268,585 or 42.97% of net assets. |
| (c) | Illiquid security. At July 31, 2022, the value of these securities amounted to $9,174,956 or 5.86% of net assets. |
| (d) | Non-income producing security. |
| (e) | Security issued as a “Baby Bond”, with a par value of $25 per bond. The principal balance disclosed above represents the issuer’s outstanding principal that corresponds to the bonds held in the Fund. |
| (f) | Rate disclosed is the seven day yield as of July 31, 2022. |
See accompanying notes which are an integral part of these financial statements.
83
Angel Oak High Yield Opportunities Fund
Schedule of Investments
July 31, 2022 (Unaudited)
| | | | | | | | |
| | | Shares | | | Value | |
Common Stocks – 0.11% | | | | | | | | |
Consumer, Non-cyclical – 0.11% | | | | | | | | |
Cenveo Corp. (a)(b)(c) | | | 4,630 | | | | $74,080 | |
| | | | | | | | |
| | |
TOTAL COMMON STOCKS
(Cost – $490,470) | | | | | | | $74,080 | |
| | | | | | | | |
| | |
Corporate Obligations – 93.63% | |
| Principal
Amount |
| | | | |
Basic Materials – 12.44% | | | | | | | | |
Arconic Corp., 6.125%, 2/15/2028 (b) | | | $250,000 | | | | 250,495 | |
Big River Steel LLC / BRS Finance Corp., 6.625%, 1/31/2029 (b) | | | 700,000 | | | | 714,910 | |
Cleveland-Cliffs, Inc., 5.875%, 6/1/2027 | | | 750,000 | | | | 744,937 | |
Compass Minerals International, Inc., 6.750%, 12/1/2027 (b) | | | 500,000 | | | | 481,320 | |
Consolidated Energy Finance SA, 6.500%, 5/15/2026 (b) | | | 1,250,000 | | | | 1,170,294 | |
Copper Mountain Mining Corp., 8.000%, 4/9/2026 (b)(d) | | | 960,000 | | | | 844,800 | |
CVR Partners LP / CVR Nitrogen Finance Corp., 6.125%, 6/15/2028 (b) | | | 1,000,000 | | | | 911,375 | |
Hecla Mining Co., 7.250%, 2/15/2028 | | | 500,000 | | | | 488,094 | |
Mativ, Inc., 6.875%, 10/1/2026 (b) | | | 500,000 | | | | 441,235 | |
Mercer International, Inc., 5.125%, 2/1/2029 | | | 750,000 | | | | 703,901 | |
Methanex Corp., 5.125%, 10/15/2027 | | | 500,000 | | | | 463,295 | |
Sylvamo Corp., 7.000%, 9/1/2029 (b) | | | 1,000,000 | | | | 924,213 | |
Taseko Mines Ltd., 7.000%, 2/15/2026 (b) | | | 500,000 | | | | 398,230 | |
| | | | | | | | |
| | |
| | | | | | | 8,537,099 | |
| | | | | | | | |
Communications – 9.11% | | | | | | | | |
AMC Networks, Inc., 4.750%, 8/1/2025 | | | 500,000 | | | | 480,572 | |
Cars.com, Inc., 6.375%, 11/1/2028 (b) | | | 500,000 | | | | 434,492 | |
Consolidated Communications, Inc., 6.500%, 10/1/2028 (b) | | | 500,000 | | | | 431,250 | |
CSC Holdings LLC, 5.500%, 4/15/2027 (b) | | | 500,000 | | | | 484,885 | |
Cumulus Media New Holdings, Inc., 6.750%, 7/1/2026 (b) | | | 542,000 | | | | 485,277 | |
DIRECTV Holdings LLC / DIRECTV Financing Co. Inc., 5.875%, 8/15/2027 (b) | | | 1,000,000 | | | | 935,985 | |
Entercom Media Corp., 6.500%, 5/1/2027 (b) | | | 100,000 | | | | 49,757 | |
Entercom Media Corp., 6.750%, 3/31/2029 (b) | | | 200,000 | | | | 96,970 | |
Gray Escrow, Inc., 5.375%, 11/15/2031 (b) | | | 1,000,000 | | | | 884,905 | |
Lamar Media Corp., 4.875%, 1/15/2029 | | | 250,000 | | | | 243,459 | |
Nexstar Broadcasting, Inc., 5.625%, 7/15/2027 (b) | | | 250,000 | | | | 250,404 | |
Outfront Media Capital LLC / Outfront Media Capital Corp., 5.000%, 8/15/2027 (b) | | | 250,000 | | | | 236,550 | |
Terrier Media Buyer, Inc., 8.875%, 12/15/2027 (b) | | | 250,000 | | | | 201,570 | |
Townsquare Media, Inc., 6.875%, 2/1/2026 (b) | | | 300,000 | | | | 275,300 | |
Univision Communications, Inc., 6.625%, 6/1/2027 (b) | | | 250,000 | | | | 250,969 | |
Urban One, Inc., 7.375%, 2/1/2028 (b) | | | 600,000 | | | | 508,548 | |
| | | | | | | | |
| | |
| | | | | | | 6,250,893 | |
| | | | | | | | |
Consumer, Cyclical – 15.67% | | | | | | | | |
American Airlines, Inc. / AAdvantage Loyalty IP Ltd., 5.500%, 4/20/2026 (b) | | | 500,000 | | | | 494,310 | |
American Axle & Manufacturing, Inc., 5.000%, 10/1/2029 | | | 1,000,000 | | | | 876,415 | |
Aramark Services, Inc., 6.375%, 5/1/2025 (b) | | | 500,000 | | | | 503,120 | |
Arrow Bidco LLC, 9.500%, 3/15/2024 (b) | | | 750,000 | | | | 753,662 | |
Beacon Roofing Supply, Inc., 4.500%, 11/15/2026 (b) | | | 250,000 | | | | 241,823 | |
Brookfield Residential Properties, Inc. / Brookfield Residential US LLC, 5.000%, 6/15/2029 (b) | | | 250,000 | | | | 192,740 | |
See accompanying notes which are an integral part of these financial statements.
84
Angel Oak High Yield Opportunities Fund
Schedule of Investments – (continued)
July 31, 2022 (Unaudited)
| | | | | | | | |
| | | Principal
Amount | | | Value | |
Corporate Obligations – (continued) | | | | | | | | |
Consumer, Cyclical – (continued) | | | | | | | | |
Carnival Corp., 6.000%, 5/1/2029 (b) | | $ | 350,000 | | | $ | 269,671 | |
CD&R Smokey Buyer, Inc., 6.750%, 7/15/2025 (b) | | | 250,000 | | | | 235,850 | |
Clarios Global LP, 6.750%, 5/15/2025 (b) | | | 226,000 | | | | 228,039 | |
Delta Air Lines, Inc. / SkyMiles IP Ltd., 4.750%, 10/20/2028 (b) | | | 500,000 | | | | 488,645 | |
FirstCash, Inc., 4.625%, 9/1/2028 (b) | | | 500,000 | | | | 448,151 | |
Ford Motor Co., 9.000%, 4/22/2025 | | | 1,000,000 | | | | 1,109,000 | |
Ford Motor Credit Co. LLC, 3.625%, 6/17/2031 | | | 500,000 | | | | 425,240 | |
Goodyear Tire & Rubber Co., 5.000%, 7/15/2029 | | | 500,000 | | | | 455,530 | |
Hawaiian Brand Intellectual Property Ltd., 5.750%, 1/20/2026 (b) | | | 500,000 | | | | 485,285 | |
Installed Building Products, Inc., 5.750%, 2/1/2028 (b) | | | 100,000 | | | | 91,837 | |
International Game Technology PLC, 5.250%, 1/15/2029 (b) | | | 200,000 | | | | 193,418 | |
Lithia Motors, Inc., 4.625%, 12/15/2027 (b) | | | 250,000 | | | | 236,837 | |
Marriott Ownership Resorts, Inc., 4.750%, 1/15/2028 | | | 500,000 | | | | 453,773 | |
Mileage Plus Holdings LLC / Mileage Plus Intellectual Property Assets Ltd.,
6.500%, 6/20/2027 (b) | | | 250,000 | | | | 252,886 | |
New Red Finance, Inc., 4.375%, 1/15/2028 (b) | | | 250,000 | | | | 232,101 | |
Party City Holdings, Inc., 8.750%, 2/15/2026 (b) | | | 250,000 | | | | 152,125 | |
Six Flags Theme Parks, Inc., 7.000%, 7/1/2025 (b) | | | 126,000 | | | | 129,735 | |
Spirit Loyalty Cayman Ltd. / Spirit IP Cayman Ltd., 8.000%, 9/20/2025 (b) | | | 300,000 | | | | 313,880 | |
Suburban Propane Partners LP / Suburban Energy Finance Corp., 5.000%, 6/1/2031 (b) | | | 100,000 | | | | 91,283 | |
TRI Pointe Group, Inc. / TRI Pointe Homes, Inc., 5.875%, 6/15/2024 | | | 250,000 | | | | 252,788 | |
United Airlines, Inc., 4.375%, 4/15/2026 (b) | | | 500,000 | | | | 478,580 | |
Univar Solutions USA, Inc., 5.125%, 12/1/2027 (b) | | | 250,000 | | | | 241,140 | |
White Cap Buyer LLC, 6.875%, 10/15/2028 (b) | | | 500,000 | | | | 423,665 | |
| | | | | | | | |
| | |
| | | | | | | 10,751,529 | |
| | | | | | | | |
Consumer, Non-cyclical – 10.89% | | | | | | | | |
Catalent Pharma Solutions, Inc., 5.000%, 7/15/2027 (b) | | | 250,000 | | | | 250,580 | |
CPI CG, Inc., 8.625%, 3/15/2026 (b) | | | 234,000 | | | | 226,913 | |
JBS USA LUX SA / JBS USA Finance, Inc., 6.500%, 4/15/2029 (b) | | | 120,000 | | | | 122,198 | |
Korn Ferry, 4.625%, 12/15/2027 (b) | | | 250,000 | | | | 234,750 | |
Mozart Debt Merger Sub, Inc., 5.250%, 10/1/2029 (b) | | | 500,000 | | | | 450,585 | |
NESCO Holdings, Inc., 5.500%, 4/15/2029 (b) | | | 100,000 | | | | 86,979 | |
Performance Food Group, Inc., 4.250%, 8/1/2029 (b) | | | 500,000 | | | | 443,200 | |
Prime Security Services Borrower LLC / Prime Finance, Inc., 3.375%, 8/31/2027 (b) | | | 750,000 | | | | 685,815 | |
Primo Water Holdings, Inc., 4.375%, 4/30/2029 (b) | | | 1,000,000 | | | | 865,290 | |
Rent-A-Center, Inc., 6.375%, 2/15/2029 (b) | | | 500,000 | | | | 397,834 | |
Sabre GLBL, Inc., 9.250%, 4/15/2025 (b) | | | 100,000 | | | | 101,867 | |
Sabre GLBL, Inc., 7.375%, 9/1/2025 (b) | | | 100,000 | | | | 98,848 | |
Select Medical Corp., 6.250%, 8/15/2026 (b) | | | 1,000,000 | | | | 1,002,725 | |
ServiceMaster Co. LLC, 7.450%, 8/15/2027 | | | 500,000 | | | | 582,874 | |
Simmons Foods, Inc., 4.625%, 3/1/2029 (b) | | | 250,000 | | | | 228,807 | |
Sotheby’s, 7.375%, 10/15/2027 (b) | | | 810,000 | | | | 781,450 | |
Sotheby’s/Bidfair Holdings, Inc., 5.875%, 6/1/2029 (b) | | | 500,000 | | | | 434,316 | |
TreeHouse Foods, Inc., 4.000%, 9/1/2028 | | | 250,000 | | | | 217,883 | |
US Foods, Inc., 6.250%, 4/15/2025 (b) | | | 250,000 | | | | 254,975 | |
| | | | | | | | |
| | |
| | | | | | | 7,467,889 | |
| | | | | | | | |
See accompanying notes which are an integral part of these financial statements.
85
Angel Oak High Yield Opportunities Fund
Schedule of Investments – (continued)
July 31, 2022 (Unaudited)
| | | | | | | | |
| | | Principal
Amount | | | Value | |
Corporate Obligations – (continued) | | | | | | | | |
Energy – 21.36% | | | | | | | | |
Antero Midstream Partners LP / Antero Midstream Finance Corp., 5.750%, 3/1/2027 (b) | | $ | 250,000 | | | $ | 248,109 | |
Antero Midstream Partners LP / Antero Midstream Finance Corp., 5.750%, 1/15/2028 (b) | | | 1,250,000 | | | | 1,223,744 | |
Antero Resources Corp., 8.375%, 7/15/2026 (b) | | | 162,000 | | | | 173,765 | |
Archrock Partners LP / Archrock Partners Finance Corp., 6.875%, 4/1/2027 (b) | | | 700,000 | | | | 654,720 | |
Atlantica Sustainable Infrastructure PLC, 4.125%, 6/15/2028 (b) | | | 250,000 | | | | 228,821 | |
Calumet Specialty Products Partners LP / Calumet Finance Corp., 8.125%, 1/15/2027 (b) | | | 600,000 | | | | 518,259 | |
CITGO Petroleum Corp., 7.000%, 6/15/2025 (b) | | | 500,000 | | | | 493,112 | |
CNX Resources Corp., 6.000%, 1/15/2029 (b) | | | 100,000 | | | | 97,408 | |
Comstock Resources, Inc., 6.750%, 3/1/2029 (b) | | | 100,000 | | | | 99,250 | |
Comstock Resources, Inc., 5.875%, 1/15/2030 (b) | | | 100,000 | | | | 94,004 | |
Continental Resources, Inc., 5.750%, 1/15/2031 (b) | | | 100,000 | | | | 98,735 | |
Crestwood Midstream Partners LP / Crestwood Midstream Finance Corp., 6.000%, 2/1/2029 (b) | | | 500,000 | | | | 457,710 | |
CrownRock LP / CrownRock Finance, Inc., 5.000%, 5/1/2029 (b) | | | 250,000 | | | | 232,575 | |
DCP Midstream LP, 7.375% (3 Month LIBOR USD + 5.148%), 6/15/2023 (e) | | | 500,000 | | | | 454,106 | |
Encino Acquisition Partners Holdings LLC, 8.500%, 5/1/2028 (b) | | | 250,000 | | | | 245,000 | |
EnLink Midstream LLC, 5.625%, 1/15/2028 (b) | | | 100,000 | | | | 97,237 | |
Enviva Partners LP / Enviva Partners Finance Corp., 6.500%, 1/15/2026 (b) | | | 750,000 | | | | 744,652 | |
Hilcorp Energy I LP / Hilcorp Finance Co., 5.750%, 2/1/2029 (b) | | | 900,000 | | | | 822,636 | |
Kinetik Holdings LP, 5.875%, 6/15/2030 (b) | | | 250,000 | | | | 254,336 | |
New Fortress Energy, Inc., 6.750%, 9/15/2025 (b) | | | 250,000 | | | | 244,391 | |
New Fortress Energy, Inc., 6.500%, 9/30/2026 (b) | | | 500,000 | | | | 475,725 | |
PBF Holding Co. LLC / PBF Finance Corp., 6.000%, 2/15/2028 | | | 500,000 | | | | 454,658 | |
PBF Logistics LP / PBF Logistics Finance Corp., 6.875%, 5/15/2023 | | | 250,000 | | | | 250,700 | |
Range Resources Corp., 8.250%, 1/15/2029 | | | 100,000 | | | | 107,197 | |
Shelf Drilling Holdings Ltd, 8.250%, 2/15/2025 (b) | | | 1,500,000 | | | | 1,173,825 | |
SunCoke Energy, Inc., 4.875%, 6/30/2029 (b) | | | 500,000 | | | | 424,978 | |
Tallgrass Energy Partners LP / Tallgrass Energy Finance Corp., 7.500%, 10/1/2025 (b) | | | 500,000 | | | | 501,581 | |
Tallgrass Energy Partners LP / Tallgrass Energy Finance Corp., 6.000%, 12/31/2030 (b) | | | 500,000 | | | | 449,741 | |
Transocean, Inc., 11.500%, 1/30/2027 (b) | | | 113,000 | | | | 107,384 | |
USA Compression Partners LP / USA Compression Finance Corp., 6.875%, 4/1/2026 | | | 250,000 | | | | 235,419 | |
USA Compression Partners LP / USA Compression Finance Corp., 6.875%, 9/1/2027 | | | 750,000 | | | | 689,006 | |
Venture Global Calcasieu Pass LLC, 4.125%, 8/15/2031 (b) | | | 250,000 | | | | 231,018 | |
Venture Global Calcasieu Pass LLC, 3.875%, 11/1/2033 (b) | | | 250,000 | | | | 217,574 | |
Warrior Met Coal, Inc., 7.875%, 12/1/2028 (b) | | | 2,000,000 | | | | 1,855,880 | |
| | | | | | | | |
| | |
| | | | | | | 14,657,256 | |
| | | | | | | | |
Financial – 14.57% | | | | | | | | |
Coinbase Global, Inc., 3.375%, 10/1/2028 (b) | | | 1,000,000 | | | | 645,786 | |
Credit Acceptance Corp., 6.625%, 3/15/2026 | | | 500,000 | | | | 498,045 | |
Enact Holdings, Inc., 6.500%, 8/15/2025 (b) | | | 500,000 | | | | 505,850 | |
Freedom Mortgage Corp., 7.625%, 5/1/2026 (b) | | | 500,000 | | | | 411,911 | |
Global Aircraft Leasing Co. Ltd., 6.50% Cash or 7.250% PIK, 9/15/2024 (b) | | | 418,452 | | | | 323,359 | |
goeasy Ltd., 5.375%, 12/1/2024 (b) | | | 250,000 | | | | 235,025 | |
goeasy Ltd., 4.375%, 5/1/2026 (b) | | | 500,000 | | | | 428,652 | |
HAT Holdings I LLC / HAT Holdings II LLC, 3.375%, 6/15/2026 (b) | | | 750,000 | | | | 658,350 | |
Howard Hughes Corp., 5.375%, 8/1/2028 (b) | | | 250,000 | | | | 234,470 | |
LD Holdings Group LLC, 6.125%, 4/1/2028 (b) | | | 500,000 | | | | 304,995 | |
See accompanying notes which are an integral part of these financial statements.
86
Angel Oak High Yield Opportunities Fund
Schedule of Investments – (continued)
July 31, 2022 (Unaudited)
| | | | | | | | |
| | | Principal
Amount | | | Value | |
Corporate Obligations – (continued) | | | | | | | | |
Financial – (continued) | | | | | | | | |
LPL Holdings, Inc., 4.625%, 11/15/2027 (b) | | $ | 500,000 | | | $ | 490,450 | |
MGIC Investment Corp., 5.250%, 8/15/2028 | | | 250,000 | | | | 241,010 | |
MPT Operating Partnership LP / MPT Finance Corp., 3.500%, 3/15/2031 | | | 500,000 | | | | 431,550 | |
Nationstar Mortgage Holdings, Inc., 6.000%, 1/15/2027 (b) | | | 750,000 | | | | 695,850 | |
NMI Holdings, Inc., 7.375%, 6/1/2025 (b) | | | 250,000 | | | | 253,800 | |
Park Intermediate Holdings LLC, 4.875%, 5/15/2029 (b) | | | 250,000 | | | | 230,503 | |
PennyMac Financial Services, Inc., 5.375%, 10/15/2025 (b) | | | 500,000 | | | | 468,700 | |
PennyMac Financial Services, Inc., 5.750%, 9/15/2031 (b) | | | 250,000 | | | | 207,946 | |
PRA Group, Inc., 7.375%, 9/1/2025 (b) | | | 250,000 | | | | 247,939 | |
PRA Group, Inc., 5.000%, 10/1/2029 (b) | | | 500,000 | | | | 431,322 | |
Realogy Group LLC / Realogy Co-Issuer Corp., 5.250%, 4/15/2030 (b) | | | 500,000 | | | | 399,883 | |
Starwood Property Trust, Inc., 5.500%, 11/1/2023 (b) | | | 500,000 | | | | 496,775 | |
StoneX Group, Inc., 8.625%, 6/15/2025 (b) | | | 100,000 | | | | 101,867 | |
United Wholesale Mortgage LLC, 5.500%, 11/15/2025 (b) | | | 500,000 | | | | 467,500 | |
United Wholesale Mortgage LLC, 5.500%, 4/15/2029 (b) | | | 500,000 | | | | 431,250 | |
Uniti Group LP / Uniti Group Finance, Inc. / CSL Capital LLC, 6.500%, 2/15/2029 (b) | | | 200,000 | | | | 154,436 | |
| | | | | | | | |
| | |
| | | | | | | 9,997,224 | |
| | | | | | | | |
Industrial – 8.25% | | | | | | | | |
Bombardier, Inc., 7.500%, 12/1/2024 (b) | | | 160,000 | | | | 156,960 | |
Brundage-Bone Concrete Pumping Holdings, Inc., 6.000%, 2/1/2026 (b) | | | 250,000 | | | | 224,785 | |
Builders FirstSource, Inc., 5.000%, 3/1/2030 (b) | | | 250,000 | | | | 231,900 | |
Cargo Aircraft Management, Inc., 4.750%, 2/1/2028 (b) | | | 500,000 | | | | 466,882 | |
Cloud Crane LLC, 10.125%, 8/1/2024 (b) | | | 220,000 | | | | 209,126 | |
Covanta Holding Corp., 5.000%, 9/1/2030 | | | 250,000 | | | | 218,831 | |
Dycom Industries, Inc., 4.500%, 4/15/2029 (b) | | | 100,000 | | | | 91,865 | |
Fortress Transportation and Infrastructure Investors LLC, 9.750%, 8/1/2027 (b) | | | 250,000 | | | | 253,502 | |
Great Lakes Dredge & Dock Corp., 5.250%, 6/1/2029 (b) | | | 100,000 | | | | 89,364 | |
Griffon Corp., 5.750%, 3/1/2028 | | | 350,000 | | | | 334,969 | |
II-VI, Inc., 5.000%, 12/15/2029 (b) | | | 500,000 | | | | 476,913 | |
MasTec, Inc., 4.500%, 8/15/2028 (b) | | | 500,000 | | | | 463,941 | |
Matthews International Corp., 5.250%, 12/1/2025 (b) | | | 250,000 | | | | 228,594 | |
MIWD Holdco LLC / MIWD Finance Corp., 5.500%, 2/1/2030 (b) | | | 100,000 | | | | 84,786 | |
Moog, Inc., 4.250%, 12/15/2027 (b) | | | 250,000 | | | | 233,673 | |
Mueller Water Products, Inc., 4.000%, 6/15/2029 (b) | | | 300,000 | | | | 273,834 | |
Roller Bearing Co. of America, Inc., 4.375%, 10/15/2029 (b) | | | 500,000 | | | | 453,898 | |
Seaspan Corp., 5.500%, 8/1/2029 (b) | | | 500,000 | | | | 392,560 | |
Spirit AeroSystems, Inc., 7.500%, 4/15/2025 (b) | | | 100,000 | | | | 100,049 | |
SRM Escrow Issuer LLC, 6.000%, 11/1/2028 (b) | | | 250,000 | | | | 233,073 | |
Vertiv Group Corp., 4.125%, 11/15/2028 (b) | | | 500,000 | | | | 443,610 | |
| | | | | | | | |
| | |
| | | | | | | 5,663,115 | |
| | | | | | | | |
Technology – 0.24% | | | | | | | | |
Seagate HDD Cayman, 3.375%, 7/15/2031 | | | 200,000 | | | | 160,954 | |
| | | | | | | | |
Utilities – 1.10% | | | | | | | | |
AmeriGas Partners LP / AmeriGas Finance Corp., 5.500%, 5/20/2025 | | | 250,000 | | | | 251,630 | |
See accompanying notes which are an integral part of these financial statements.
87
Angel Oak High Yield Opportunities Fund
Schedule of Investments – (continued)
July 31, 2022 (Unaudited)
| | | | | | | | |
| | | Principal
Amount | | | Value | |
Corporate Obligations – (continued) | | | | | | | | |
Utilities – (continued) | | | | | | | | |
Rockpoint Gas Storage Canada Ltd., 7.000%, 3/31/2023 (b) | | $ | 500,000 | | | $ | 499,925 | |
| | | | | | | | |
| | |
| | | | | | | 751,555 | |
| | | | | | | | |
| | |
TOTAL CORPORATE OBLIGATIONS
(Cost – $69,852,810) | | | | | | | $64,237,514 | |
| | | | | | | | |
| | |
Short-Term Investments – 3.81% | | | Shares | | | | | |
Money Market Funds – 3.81% | | | | | | | | |
First American Government Obligations Fund, Class U, 1.459% (f) | | | 2,615,887 | | | | 2,615,887 | |
| | | | | | | | |
| | |
TOTAL SHORT-TERM INVESTMENTS
(Cost – $2,615,887) | | | | | | | $2,615,887 | |
| | | | | | | | |
| | |
TOTAL INVESTMENTS – 97.55%
(Cost – $72,959,167) | | | | | | | $66,927,481 | |
| | |
Other Assets in Excess of Liabilities – 2.45% | | | | | | | 1,683,134 | |
| | | | | | | | |
| | |
NET ASSETS – 100.00% | | | | | | | $68,610,615 | |
| | | | | | | | |
LIBOR: London Inter-Bank Offered Rate
PIK: Payment-In-Kind
| (a) | As of July 31, 2022, the Fund has fair valued these securities under the procedures established by the Fund’s Board of Trustees. The value of these securities amounted to $74,080 or 0.11% of net assets. Value determined using significant unobservable inputs. |
| (b) | Security exempt from registration under Rule 144A or Section 4(a)(2) of the Securities Act of 1933. The security may be resold in transactions exempt from registration, normally to qualified institutional buyers. These securities are determined to be liquid by the Adviser, under the procedures established by the Fund’s Board of Trustees, unless otherwise denoted. At July 31, 2022, the value of these securities amounted to $52,485,758 or 76.50% of net assets. |
| (c) | Illiquid security. At July 31, 2022, the value of these securities amounted to $74,080 or 0.11% of net assets. |
| (d) | Security exempt from registration under Regulation S of the Securities Act of 1933. Such securities are treated as liquid securities according to the Fund’s liquidity guidelines. At July 31, 2022, the value of securities pledged amounted to $844,800 or 1.23% of net assets. |
| (e) | Variable or floating rate security based on a reference index and spread. Certain securities are fixed to variable and currently in the fixed phase. Rate disclosed is the rate in effect as of July 31, 2022. |
| (f) | Rate disclosed is the seven day yield as of July 31, 2022. |
See accompanying notes which are an integral part of these financial statements.
88
Angel Oak UltraShort Income Fund
Schedule of Investments
July 31, 2022 (Unaudited)
| | | | | | | | |
| | | Principal
Amount | | | Value | |
Asset-Backed Securities – 41.11% | | | | | | | | |
ACC Auto Trust, Series 2021-A, Class A, 1.080%, 4/15/2027 (a) | | | $757,373 | | | | $746,470 | |
ACC Auto Trust, Series 2021-A, Class B, 1.790%, 4/15/2027 (a) | | | 4,611,000 | | | | 4,431,448 | |
ACC Trust, Series 2019-2, Class B, 3.630%, 8/20/2023 (a) | | | 232,548 | | | | 233,133 | |
ACC Trust, Series 2021-1, Class B, 1.430%, 7/22/2024 (a) | | | 1,933,943 | | | | 1,925,478 | |
Affirm Asset Securitization Trust, Series 2021-A, Class D, 3.490%, 8/15/2025 (a) | | | 1,610,000 | | | | 1,606,746 | |
Affirm Asset Securitization Trust, Series 2021-A, Class E, 5.650%, 8/15/2025 (a) | | | 600,000 | | | | 598,852 | |
Affirm Asset Securitization Trust, Series 2021-B, Class D, 2.540%, 8/17/2026 (a) | | | 250,000 | | | | 233,235 | |
Affirm Asset Securitization Trust, Series 2021-Z2, Class A, 1.170%, 11/15/2026 (a) | | | 2,588,664 | | | | 2,513,339 | |
Affirm Asset Securitization Trust, Series 2022-Z1, Class A, 4.550%, 6/15/2027 (a) | | | 1,000,000 | | | | 993,320 | |
American Credit Acceptance Receivables Trust, Series 2021-2, Class A, 0.370%, 10/15/2024 (a) | | | 36,249 | | | | 36,236 | |
American Credit Acceptance Receivables Trust, Series 2021-2, Classs C, 0.970%, 7/13/2027 (a) | | | 1,500,000 | | | | 1,464,610 | |
Aqua Finance Trust, Series 2019-A, Class A, 3.140%, 7/16/2040 (a) | | | 623,273 | | | | 609,417 | |
Aqua Finance Trust, Series 2021-A, Class A, 1.540%, 7/17/2046 (a) | | | 3,097,532 | | | | 2,896,298 | |
Aqua Finance Trust, Series 2020-AA, Class A, 1.900%, 7/17/2046 (a) | | | 4,805,253 | | | | 4,590,809 | |
Arivo Acceptance Auto Loan Receivables Trust, Series 2021-1A, Class A, 1.190%, 1/15/2027 (a) | | | 698,978 | | | | 684,920 | |
Arivo Acceptance Auto Loan Receivables Trust, Series 2022-1A, Class A, 3.930%, 5/15/2028 (a) | | | 1,394,468 | | | | 1,376,895 | |
Avant Credit Card Master Trust, Series 2021-1A, Class A, 1.370%, 4/15/2027 (a) | | | 3,500,000 | | | | 3,234,647 | |
Avant Credit Card Master Trust, Series 2021-1A, Class B, 1.620%, 4/15/2027 (a) | | | 2,250,000 | | | | 2,060,098 | |
Avant Loans Funding Trust, Series 2021-REV1, Class A, 1.210%, 7/15/2030 (a) | | | 2,000,000 | | | | 1,889,362 | |
Avid Automobile Receivables Trust, Series 2019-1, Class D, 4.030%, 7/15/2026 (a) | | | 1,000,000 | | | | 980,570 | |
Avid Automobile Receivables Trust, Series 2021-1, Class D, 1.990%, 4/17/2028 (a) | | | 1,000,000 | | | | 916,101 | |
BHG Securitization Trust, Series 2021-B, Class A, 0.900%, 10/17/2034 (a) | | | 2,003,394 | | | | 1,924,240 | |
CarNow Auto Receivables Trust, Series 2021-1A, Class D, 3.640%, 2/17/2026 (a) | | | 1,250,000 | | | | 1,195,669 | |
CarNow Auto Receivables Trust, Series 2022-1A, Class B, 4.890%, 3/16/2026 (a) | | | 1,250,000 | | | | 1,249,407 | |
Carvana Auto Receivables Trust, Series 2019-4A, Class D, 3.070%, 7/15/2025 (a) | | | 4,858,000 | | | | 4,799,937 | |
Carvana Auto Receivables Trust, Series 2020-N1A, Class D, 3.430%, 1/15/2026 (a) | | | 2,000,000 | | | | 1,967,258 | |
Carvana Auto Receivables Trust, Series 2021-N1, Class B, 1.090%, 1/10/2028 | | | 3,170,989 | | | | 3,035,106 | |
Carvana Auto Receivables Trust, Series 2021-N1, Class C, 1.300%, 1/10/2028 | | | 3,086,813 | | | | 2,998,052 | |
Carvana Auto Receivables Trust, Series 2021-N2, Class C, 1.070%, 3/10/2028 | | | 1,362,185 | | | | 1,319,725 | |
Carvana Auto Receivables Trust, Series 2021-N3, Class C, 1.020%, 6/12/2028 | | | 4,600,000 | | | | 4,425,655 | |
Carvana Auto Receivables Trust, Series 2021-N3, Class N, 2.530%, 6/12/2028 (a) | | | 74,738 | | | | 74,828 | |
Carvana Auto Receivables Trust, Series 2021-P3, Class N, 1.990%, 9/10/2028 (a) | | | 212,456 | | | | 212,763 | |
Carvana Auto Receivables Trust, Series 2021-P4, Class N, 2.150%, 9/10/2028 (a) | | | 1,719,577 | | | | 1,713,602 | |
Carvana Auto Receivables Trust, Series 2021-N4, Class N, 2.990%, 9/10/2028 (a) | | | 1,017,331 | | | | 1,016,810 | |
Carvana Auto Receivables Trust, Series 2022-N1, Class N, 4.600%, 12/10/2028 (a) | | | 2,000,000 | | | | 1,998,644 | |
Carvana Auto Receivables Trust, Series 2022-P1, Class N, 4.350%, 1/10/2029 (a) | | | 394,982 | | | | 393,689 | |
CFMT Issuer Trust, Series 2021-GRN1, Class A, 1.100%, 3/20/2041 (a) | | | 1,932,964 | | | | 1,868,212 | |
CFMT LLC, Series 2021-AL1, Class B, 1.390%, 9/22/2031 (a) | | | 3,278,740 | | | | 3,192,673 | |
Chase Auto Credit Linked Notes, Series 2020-1, Class B, 0.991%, 1/25/2028 (a) | | | 259,833 | | | | 255,761 | |
Chase Auto Credit Linked Notes, Series 2020-1, Class C, 1.389%, 1/25/2028 (a) | | | 714,540 | | | | 705,658 | |
Chase Auto Credit Linked Notes, Series 2020-2, Class B, 0.840%, 2/25/2028 (a) | | | 356,865 | | | | 349,766 | |
Chase Auto Credit Linked Notes, Series 2020-2, Class C, 1.139%, 2/25/2028 (a) | | | 356,865 | | | | 349,286 | |
Chase Auto Credit Linked Notes, Series 2021-1, Class B, 0.875%, 9/25/2028 (a) | | | 2,603,284 | | | | 2,538,910 | |
Chase Auto Credit Linked Notes, Series 2021-1, Class C, 1.024%, 9/25/2028 (a) | | | 1,115,693 | | | | 1,086,877 | |
Chase Auto Credit Linked Notes, Series 2021-2, Class D, 1.138%, 12/25/2028 (a) | | | 936,059 | | | | 907,904 | |
Conn’s Receivables Funding LLC, Series 2021-A, Class A, 1.050%, 5/15/2026 (a) | | | 535,675 | | | | 531,992 | |
Conn’s Receivables Funding LLC, Series A, Class A, 1.000%, 12/15/2026 (a) | | | 1,000,000 | | | | 1,005,363 | |
Consumer Loan Underlying Bond CLUB Certificate Trust, Series 2019-33, Class PT, 11.439%, 10/17/2044 (a)(b) | | | 1,314,383 | | | | 1,258,982 | |
See accompanying notes which are an integral part of these financial statements.
89
Angel Oak UltraShort Income Fund
Schedule of Investments – (continued)
July 31, 2022 (Unaudited)
| | | | | | | | |
| | | Principal
Amount | | | Value | |
Asset-Backed Securities – (continued) | | | | | | | | |
Consumer Loan Underlying Bond CLUB Credit Trust, Series 2019-P2, Class C, 4.410%, 10/15/2026 (a) | | $ | 602,875 | | | $ | 596,757 | |
Consumer Loan Underlying Bond Credit Trust, Series 2018-P1, Class C, 5.210%, 7/15/2025 (a) | | | 12,024 | | | | 12,047 | |
Consumer Loan Underlying Bond Credit Trust, Series 2018-P2, Class C, 5.210%, 10/15/2025 (a) | | | 186,153 | | | | 186,464 | |
Consumer Loan Underlying Bond Credit Trust, Series 2018-P3, Class C, 5.540%, 1/15/2026 (a) | | | 680,268 | | | | 680,703 | |
Continental Finance Credit Card ABS Master Trust, Series 2020-1A, Class A, 2.240%, 12/15/2028 (a) | | | 500,000 | | | | 462,595 | |
Continental Finance Credit Card ABS Master Trust, Series 2021-A, Class A, 2.550%, 12/17/2029 (a) | | | 2,000,000 | | | | 1,999,700 | |
CPS Auto Receivables Trust, Series 2018-B, Class D, 4.260%, 3/15/2024 (a) | | | 111,411 | | | | 111,553 | |
CPS Auto Receivables Trust, Series 2019-C, Class D, 3.170%, 6/16/2025 (a) | | | 144,958 | | | | 144,641 | |
CPS Auto Receivables Trust, Series 2022-B, Class A, 2.880%, 6/15/2026 (a) | | | 1,788,971 | | | | 1,770,654 | |
CPS Auto Receivables Trust, Series 2021-A, Class C, 0.830%, 9/15/2026 (a) | | | 1,000,000 | | | | 975,862 | |
CPS Auto Receivables Trust, Series 2021-B, Class C, 1.230%, 3/15/2027 (a) | | | 1,600,000 | | | | 1,540,989 | |
CPS Auto Receivables Trust, Series 2020-C, Class E, 4.220%, 5/15/2027 (a) | | | 2,925,000 | | | | 2,836,443 | |
CPS Auto Receivables Trust, Series 2021-D, Class D, 2.310%, 10/15/2027 (a) | | | 2,000,000 | | | | 1,869,450 | |
CPS Auto Receivables Trust, Series 2021-B, Class E, 3.410%, 6/15/2028 (a) | | | 500,000 | | | | 458,387 | |
CPS Auto Receivables Trust, Series 2022-C, Class B, 4.880%, 4/15/2030 | | | 1,000,000 | | | | 999,895 | |
CPS Auto Receivables Trust, Series 2018-C, Class D, 4.400%, 6/17/2024 (a) | | | 23,021 | | | | 23,090 | |
CPS Auto Receivables Trust, Series 2021-C, Class C, 1.210%, 6/15/2027 (a) | | | 5,000,000 | | | | 4,828,070 | |
Credit Acceptance Auto Loan Trust, Series 2020-2A, Class B, 1.930%, 9/15/2029 (a) | | | 400,000 | | | | 386,636 | |
Credit Suisse ABS Trust, Series 2020-AT1, Class A, 2.625%, 10/15/2026 (a) | | | 328,707 | | | | 319,871 | |
Donlen Fleet Lease Funding LLC, Series 2021-2, Class B, 0.980%, 12/11/2034 (a) | | | 1,500,000 | | | | 1,419,525 | |
Drive Auto Receivables Trust, Series 2018-3, Class D, 4.300%, 9/16/2024 | | | 196,314 | | | | 196,934 | |
DT Auto Owner Trust, Series 2021-3A, Class C, 0.870%, 5/17/2027 (a) | | | 2,582,000 | | | | 2,430,881 | |
DT Auto Owner Trust, Series 2022-1A, Class C, 2.960%, 11/15/2027 (a) | | | 2,000,000 | | | | 1,924,706 | |
DT Auto Owner Trust, Series 2021-3A, Class E, 2.650%, 9/15/2028 (a) | | | 500,000 | | | | 424,653 | |
Evergreen Credit Card Trust, Series 2019-2, Class C, 2.620%, 9/16/2024 (a) | | | 1,900,000 | | | | 1,899,407 | |
FHF Trust, Series 2021-2A, Class A, 0.830%, 12/15/2026 (a) | | | 2,093,720 | | | | 2,028,603 | |
FHF Trust, Series 2021-1A, Class A, 1.270%, 3/15/2027 (a) | | | 2,656,579 | | | | 2,563,097 | |
First Investors Auto Owner Trust, Series 2020-1A, Class D, 3.150%, 4/15/2026 (a) | | | 1,000,000 | | | | 983,255 | |
First Investors Auto Owner Trust, Series 2019-2A, Class F, 5.690%, 7/15/2026 (a) | | | 500,000 | | | | 477,117 | |
First Investors Auto Owner Trust, Series 2019-1A, Class F, 6.150%, 7/15/2026 (a) | | | 450,000 | | | | 438,595 | |
First Investors Auto Owner Trust, Series 2021-1A, Class B, 0.890%, 3/15/2027 (a) | | | 1,450,000 | | | | 1,407,480 | |
First Investors Auto Owner Trust, Series 2021-2A, Class C, 1.470%, 11/15/2027 (a) | | | 2,402,000 | | | | 2,256,263 | |
Flagship Credit Auto Trust, Series 2021-3, Class C, 1.460%, 9/15/2027 (a) | | | 5,000,000 | | | | 4,685,580 | |
Foundation Finance Trust, Series 2020-1A, Class A, 3.540%, 7/15/2040 (a) | | | 1,245,191 | | | | 1,226,117 | |
Foundation Finance Trust, Series 2021-1A, Class A, 1.270%, 5/15/2041 (a) | | | 1,180,514 | | | | 1,092,984 | |
Foundation Finance Trust, Series 2021-2A, Class A, 2.190%, 1/15/2042 (a) | | | 1,393,812 | | | | 1,315,489 | |
Foursight Capital Automobile Receivables Trust, Series 2021-1, Class B, 0.870%, 1/15/2026 (a) | | | 10,160,000 | | | | 9,929,002 | |
Foursight Capital Automobile Receivables Trust, Series 2020-1, Class E, 3.490%, 4/15/2026 (a) | | | 5,540,000 | | | | 5,377,955 | |
Foursight Capital Automobile Receivables Trust, Series 2021-1, Class C, 1.020%, 9/15/2026 (a) | | | 4,300,000 | | | | 4,146,894 | |
Foursight Capital Automobile Receivables Trust, Series 2019-1, Class F, 5.570%, 11/16/2026 (a) | | | 2,600,000 | | | | 2,602,868 | |
Foursight Capital Automobile Receivables Trust, Series 2020-1, Class F, 4.620%, 6/15/2027 (a) | | | 1,400,000 | | | | 1,404,465 | |
Foursight Capital Automobile Receivables Trust, Series 2021-2, Class B, 1.310%, 7/15/2027 (a) | | | 3,000,000 | | | | 2,868,255 | |
Foursight Capital Automobile Receivables Trust, Series 2022-2, Class B, 5.190%, 10/15/2027 (a)(c) | | | 1,200,000 | | | | 1,207,030 | |
FREED ABS Trust, Series 2021-2, Class B, 1.030%, 6/19/2028 (a) | | | 375,377 | | | | 373,104 | |
FREED ABS Trust, Series 2021-3FP, Class C, 1.600%, 11/20/2028 (a) | | | 4,750,000 | | | | 4,533,210 | |
See accompanying notes which are an integral part of these financial statements.
90
Angel Oak UltraShort Income Fund
Schedule of Investments – (continued)
July 31, 2022 (Unaudited)
| | | | | | | | |
| | | Principal
Amount | | | Value | |
Asset-Backed Securities – (continued) | | | | | | | | |
Genesis Sales Finance Master Trust, Series 2020-AA, Class A, 1.650%, 9/22/2025 (a) | | $ | 2,000,000 | | | $ | 1,913,964 | |
Genesis Sales Finance Master Trust, Series 2021-AA, Class A, 1.200%, 12/20/2026 (a) | | | 2,000,000 | | | | 1,880,016 | |
GLS Auto Receivables Issuer Trust, Series 2019-4A, Class D, 4.090%, 8/15/2026 (a) | | | 1,750,000 | | | | 1,718,115 | |
GLS Auto Receivables Issuer Trust, Series 2020-1A, Class D, 3.680%, 11/16/2026 (a) | | | 450,000 | | | | 440,360 | |
GLS Auto Receivables Issuer Trust, Series 2021-4, Class C, 1.940%, 10/15/2027 (a) | | | 2,000,000 | | | | 1,895,362 | |
Goldman Home Improvement Trust, Series 2021-GRN2, Class A, 1.150%, 6/26/2051 (a) | | | 2,881,722 | | | | 2,723,377 | |
Hertz Vehicle Financing LLC, Series 2022-1A, Class A, 1.990%, 6/25/2026 (a) | | | 3,300,000 | | | | 3,127,634 | |
Hertz Vehicle Financing LLC, Series 2021-1A, Class A, 1.210%, 12/25/2025 (a) | | | 5,330,000 | | | | 5,011,239 | |
Hertz Vehicle Financing LLC, Series 2021-1A, Class C, 2.050%, 12/25/2025 (a) | | | 2,000,000 | | | | 1,870,914 | |
LAD Auto Receivables Trust, Series 2021-1A, Class A, 1.300%, 8/17/2026 (a) | | | 2,025,838 | | | | 1,977,481 | |
Lendbuzz Securitization Trust, Series 2021-1A, Class A, 1.460%, 6/15/2026 (a) | | | 3,032,117 | | | | 2,934,564 | |
LendingClub Receivables Trust, Series 2020-6A, Class A, 2.750%, 11/15/2047 (a) | | | 581,625 | | | | 581,069 | |
Lendingpoint Asset Securitization Trust, Series 2021-A, Class B, 1.460%, 12/15/2028 (a) | | | 6,250,000 | | | | 6,059,550 | |
Lendingpoint Asset Securitization Trust, Series 2021-B, Class A, 1.110%, 2/15/2029 (a) | | | 2,238,371 | | | | 2,199,515 | |
Lendingpoint Asset Securitization Trust, Series 2021-B, Class B, 1.680%, 2/15/2029 (a) | | | 1,000,000 | | | | 955,707 | |
Lendingpoint Asset Securitization Trust, Series 2022-A, Class B, 2.410%, 6/15/2029 (a) | | | 1,750,000 | | | | 1,691,384 | |
Lendingpoint Asset Securitization Trust, Series 2022-B, Class A, 4.770%, 10/15/2029 (a) | | | 968,129 | | | | 961,408 | |
LendingPoint Asset Securitization Trust, Series 2020-REV1, Class A, 2.731%, 10/15/2028 (a) | | | 2,000,000 | | | | 1,958,148 | |
LendingPoint Pass-Through Trust, Series 2022-ST1, Class A, 2.500%, 3/15/2028 (a) | | | 1,592,544 | | | | 1,528,061 | |
LendingPoint Pass-Through Trust, Series 2022-ST2, Class A, 3.250%, 4/15/2028 (a) | | | 1,765,199 | | | | 1,706,933 | |
LL ABS Trust, Series 2020-1A, Class C, 6.540%, 1/17/2028 (a) | | | 2,200,000 | | | | 2,188,998 | |
LL ABS Trust, Series 2021-1A, Class A, 1.070%, 5/15/2029 (a) | | | 2,875,873 | | | | 2,770,156 | |
LL ABS Trust, Series 2021-1A, Class B, 2.170%, 5/15/2029 (a) | | | 1,000,000 | | | | 919,192 | |
LP LMS Asset Securitization Trust, Series 2021-2A, Class A, 1.750%, 1/15/2029 (a) | | | 1,076,713 | | | | 1,051,461 | |
Marlette Funding Trust, Series 2018-3A, Class C, 4.630%, 9/15/2028 (a) | | | 97,678 | | | | 97,296 | |
Marlette Funding Trust, Series 2019-4A, Class C, 3.760%, 12/15/2029 (a) | | | 7,115,268 | | | | 7,011,770 | |
Marlette Funding Trust, Series 2020-1A, Class D, 3.540%, 3/15/2030 (a) | | | 13,750,000 | | | | 13,495,900 | |
Marlette Funding Trust, Series 2021-1A, Class A, 0.600%, 6/16/2031 (a) | | | 51,370 | | | | 51,292 | |
Marlette Funding Trust, Series 2021-1A, Class B, 1.000%, 6/16/2031 (a) | | | 300,000 | | | | 294,599 | |
Marlette Funding Trust, Series 2021-1A, Class C, 1.410%, 6/16/2031 (a) | | | 1,100,000 | | | | 1,038,530 | |
Marlette Funding Trust, Series 2021-1A, Class D, 2.470%, 6/16/2031 (a) | | | 1,000,000 | | | | 922,212 | |
Marlette Funding Trust, Series 2021-2A, Class B, 1.060%, 9/15/2031 (a) | | | 3,250,000 | | | | 3,123,947 | |
Marlette Funding Trust, Series 2021-3A, Class B, 1.300%, 12/15/2031 (a) | | | 3,000,000 | | | | 2,825,754 | |
Mercury Financial Credit Card Master Trust, Series 2021-1A, Class A, 1.540%, 3/20/2026 (a) | | | 14,562,000 | | | | 13,819,775 | |
Mercury Financial Credit Card Master Trust, Series 2022-1A, Class A, 2.500%, 9/21/2026 (a) | | | 5,000,000 | | | | 4,764,130 | |
Mission Lane Credit Card Master Trust, Series 2021-A, Class A, 1.590%, 9/15/2026 (a) | | | 2,000,000 | | | | 1,936,518 | |
Octane Receivables Trust, Series 2021-2A, Class A, 1.210%, 9/20/2028 (a) | | | 860,623 | | | | 830,337 | |
Oportun Funding LLC, Series 2022-1, Class A, 4.063%, 6/15/2029 (a) | | | 1,541,355 | | | | 1,521,231 | |
Oportun Issuance Trust, Series 2021-C, Class A, 2.180%, 10/8/2031 (a) | | | 2,000,000 | | | | 1,808,276 | |
Pagaya AI Debt Selection Trust, Series 2021-1, Class A, 1.180%, 11/15/2027 (a) | | | 5,031,438 | | | | 4,927,241 | |
Pagaya AI Debt Selection Trust, Series 2021-1, Class B, 2.130%, 11/15/2027 (a) | | | 10,045,859 | | | | 9,352,283 | |
Pagaya AI Debt Selection Trust, Series 2021-1, Class C, 4.090%, 11/15/2027 (a) | | | 199,918 | | | | 183,888 | |
Pagaya AI Debt Selection Trust, Series 2021-HG1, Class A, 1.220%, 1/16/2029 (a) | | | 2,042,873 | | | | 1,946,753 | |
Pagaya AI Debt Selection Trust, Series 2021-HG1, Class B, 1.820%, 1/16/2029 (a) | | | 2,145,495 | | | | 2,068,725 | |
Pagaya AI Debt Selection Trust, Series 2021-3, Class A, 1.150%, 5/15/2029 (a) | | | 20,869,983 | | | | 20,338,654 | |
Pagaya AI Debt Selection Trust, Series 2021-3, Class B, 1.740%, 5/15/2029 (a) | | | 2,999,837 | | | | 2,817,138 | |
Pagaya AI Debt Selection Trust, Series 2021-5, Class A, 1.530%, 8/15/2029 (a) | | | 4,803,263 | | | | 4,649,996 | |
Pagaya AI Debt Selection Trust, Series 2022-1, Class A, 2.030%, 10/15/2029 (a) | | | 5,078,423 | | | | 4,910,992 | |
Pagaya AI Debt Selection Trust, Series 2022-1, Class B, 3.344%, 10/15/2029 (a) | | | 1,500,000 | | | | 1,371,736 | |
See accompanying notes which are an integral part of these financial statements.
91
Angel Oak UltraShort Income Fund
Schedule of Investments – (continued)
July 31, 2022 (Unaudited)
| | | | | | | | |
| | | Principal
Amount | | | Value | |
Asset-Backed Securities – (continued) | | | | | | | | |
Prosper Marketplace Issuance Trust, Series 2019-3A, Class C, 4.940%, 9/15/2025 (a) | | $ | 50,293 | | | $ | 50,381 | |
Purchasing Power Funding LLC, Series 2021-A, Class A, 1.570%, 10/15/2025 (a) | | | 2,500,000 | | | | 2,420,237 | |
Santander Bank Auto Credit-Linked Notes Series, Series 2022-A, Class B, 5.281%, 5/17/2032 (a) | | | 362,462 | | | | 358,092 | |
Skopos Auto Receivables Trust, Series 2019-1A, Class D, 5.240%, 4/15/2025 (a) | | | 3,000,000 | | | | 2,961,435 | |
SpringCastle America Funding LLC, Series 2020-AA, Class A, 1.970%, 9/25/2037 (a) | | | 12,206,925 | | | | 11,317,101 | |
Tesla Auto Lease Trust, Series 2020-A, Class D, 2.330%, 2/20/2024 (a) | | | 4,000,000 | | | | 3,917,384 | |
Tesla Auto Lease Trust, Series 2020-A, Class E, 4.640%, 8/20/2024 (a) | | | 700,000 | | | | 695,295 | |
Tesla Auto Lease Trust, Series 2021-A, Class B, 1.020%, 3/20/2025 (a) | | | 3,000,000 | | | | 2,885,946 | |
Theorem Funding Trust, Series 2021-1A, Class A, 1.210%, 12/15/2027 (a) | | | 1,708,962 | | | | 1,672,946 | |
Theorem Funding Trust, Series 2021-1A, Class B, 1.840%, 12/15/2027 (a) | | | 2,000,000 | | | | 1,847,332 | |
Theorem Funding Trust, Series 2022-1A, Class A, 1.850%, 2/15/2028 (a) | | | 3,670,947 | | | | 3,602,682 | |
Theorem Funding Trust, Series 2022-2A, Class A, 6.060%, 12/15/2028 (a) | | | 1,000,000 | | | | 1,012,804 | |
Tidewater Auto Receivables Trust, Series 2020-AA, Class B, 1.610%, 3/15/2025 (a) | | | 517,131 | | | | 516,913 | |
Tricolor Auto Securitization Trust, Series 2021-1A, Class A, 0.740%, 4/15/2024 (a) | | | 816,313 | | | | 813,122 | |
Tricolor Auto Securitization Trust, Series 2021-1A, Class C, 1.330%, 9/16/2024 (a) | | | 7,000,000 | | | | 6,850,011 | |
Tricolor Auto Securitization Trust, Series 2022-1A, Class B, 5.010%, 5/15/2025 (a) | | | 800,000 | | | | 790,681 | |
U.S. Auto Funding Trust, Series 2020-1A, Class D, 9.350%, 3/15/2027 (a) | | | 1,300,000 | | | | 1,308,177 | |
UNIFY Auto Receivables Trust, Series 2021-1A, Class B, 1.290%, 11/16/2026 (a) | | | 1,450,000 | | | | 1,370,643 | |
United Auto Credit Securitization Trust, Series 2022-2, Class B, 5.410%, 12/10/2025 (a) | | | 1,000,000 | | | | 999,567 | |
United Auto Credit Securitization Trust, Series 2022-1, Class C, 2.610%, 6/10/2027 (a) | | | 2,000,000 | | | | 1,945,964 | |
Upgrade Master Pass-Thru Trust, Series 2019-ST1, Class A, 4.000%, 7/15/2025 (a) | | | 180,105 | | | | 180,385 | |
Upgrade Master Pass-Thru Trust, Series 2019-ST3, Class A, 3.750%, 11/15/2025 (a) | | | 812,760 | | | | 814,263 | |
Upgrade Master Pass-Thru Trust, Series 2019-ST4, Class A, 3.750%, 12/15/2025 (a) | | | 13,744 | | | | 13,775 | |
Upgrade Master Pass-Thru Trust, Series 2019-ST5, Class A, 3.750%, 1/15/2026 (a) | | | 36,778 | | | | 36,847 | |
Upstart Pass-Through Trust, Series 2020-ST6, Class A, 3.000%, 1/20/2027 (a) | | | 910,514 | | | | 892,446 | |
Upstart Pass-Through Trust, Series 2021-ST1, Class A, 2.750%, 2/20/2027 (a) | | | 3,586,862 | | | | 3,492,714 | |
Upstart Pass-Through Trust, Series 2021-ST2, Class A, 2.500%, 4/20/2027 (a) | | | 7,375,593 | | | | 7,195,113 | |
Upstart Pass-Through Trust, Series 2021-ST3, Class A, 2.000%, 5/20/2027 (a) | | | 5,347,055 | | | | 5,166,736 | |
Upstart Pass-Through Trust, Series 2021-ST4, Class A, 2.000%, 7/20/2027 (a) | | | 5,432,075 | | | | 5,157,901 | |
Upstart Pass-Through Trust, Series 2021-ST5, Class A, 2.000%, 7/20/2027 (a) | | | 3,115,515 | | | | 3,037,982 | |
Upstart Pass-Through Trust, Series 2021-ST6, Class A, 1.850%, 8/20/2027 (a) | | | 6,020,126 | | | | 5,828,301 | |
Upstart Pass-Through Trust, Series 2020-ST1, Class A, 3.750%, 2/20/2028 (a) | | | 1,436,054 | | | | 1,414,601 | |
Upstart Pass-Through Trust, Series 2020-ST3, Class A, 3.350%, 4/20/2028 (a) | | | 3,329,280 | | | | 3,257,611 | |
Upstart Pass-Through Trust, Series 2021-ST7, Class A, 1.850%, 9/20/2029 (a) | | | 1,896,521 | | | | 1,876,763 | |
Upstart Pass-Through Trust, Series 2021-ST8, Class A, 1.750%, 10/20/2029 (a) | | | 3,933,262 | | | | 3,734,322 | |
Upstart Pass-Through Trust, Series 2021-ST10, Class A, 2.250%, 1/20/2030 (a) | | | 4,029,904 | | | | 3,874,837 | |
Upstart Pass-Through Trust, Series 2022-2A, Class A, 4.250%, 6/17/2030 (a) | | | 929,971 | | | | 919,335 | |
Upstart Pass-Through Trust, Series 2022-ST1, Class A, 2.600%, 3/20/2030 (a) | | | 3,443,731 | | | | 3,380,986 | |
Upstart Securitization Trust, Series 2019-2, Class C, 4.783%, 9/20/2029 (a) | | | 3,977,082 | | | | 3,974,437 | |
Upstart Securitization Trust, Series 2019-3, Class C, 5.381%, 1/21/2030 (a) | | | 1,900,000 | | | | 1,891,418 | |
Upstart Securitization Trust, Series 2020-2, Class A, 2.309%, 11/20/2030 (a) | | | 3,846,822 | | | | 3,775,664 | |
Upstart Securitization Trust, Series 2020-3, Class B, 3.014%, 11/20/2030 (a) | | | 8,148,000 | | | | 8,000,407 | |
Upstart Securitization Trust, Series 2021-1, Class B, 1.890%, 3/20/2031 (a) | | | 3,900,000 | | | | 3,766,039 | |
Upstart Securitization Trust, Series 2021-1, Class C, 4.060%, 3/20/2031 (a) | | | 900,000 | | | | 836,019 | |
Upstart Securitization Trust, Series 2021-2, Class A, 0.910%, 6/20/2031 (a) | | | 4,138,962 | | | | 4,079,034 | |
Upstart Securitization Trust, Series 2021-2, Class C, 3.610%, 6/20/2031 (a) | | | 250,000 | | | | 234,535 | |
Upstart Securitization Trust, Series 2021-3, Class A, 0.830%, 7/20/2031 (a) | | | 3,213,668 | | | | 3,118,965 | |
Upstart Securitization Trust, Series 2021-3, Class B, 1.660%, 7/20/2031 (a) | | | 1,250,000 | | | | 1,171,872 | |
Upstart Securitization Trust, Series 2021-4, Class A, 0.840%, 9/20/2031 (a) | | | 9,639,786 | | | | 9,295,530 | |
See accompanying notes which are an integral part of these financial statements.
92
Angel Oak UltraShort Income Fund
Schedule of Investments – (continued)
July 31, 2022 (Unaudited)
| | | | | | | | |
| | | Principal
Amount | | | Value | |
Asset-Backed Securities – (continued) | | | | | | | | |
Upstart Securitization Trust, Series 2021-5, Class B, 2.490%, 11/20/2031 (a) | | $ | 1,000,000 | | | $ | 928,761 | |
US Auto Funding, Series 2021-1A, Class B, 1.490%, 3/17/2025 (a) | | | 1,676,000 | | | | 1,635,422 | |
US Auto Funding Trust, Series 2022-1A, Class B, 5.130%, 12/15/2025 (a) | | | 500,000 | | | | 486,734 | |
USASF Receivables LLC, Series 2020-1A, Class C, 5.940%, 8/15/2024 (a) | | | 2,000,000 | | | | 2,008,040 | |
Verizon Master Trust, Series 2021-2, Class B, 1.280%, 4/20/2028 | | | 4,800,000 | | | | 4,587,619 | |
Veros Automobile Receivables Trust, Series 2022-1, Class A, 3.470%, 12/15/2025 (a) | | | 1,485,458 | | | | 1,471,334 | |
Veros Automobile Receivables Trust, Series 2021-1, Class A, 0.920%, 10/15/2026 (a) | | | 622,036 | | | | 610,912 | |
Westlake Automobile Receivables Trust, Series 2021-2A, Class E, 2.380%, 3/15/2027 (a) | | | 2,250,000 | | | | 2,045,743 | |
Westlake Automobile Receivables Trust, Series 2022-1A, Class B, 2.750%, 3/15/2027 (a) | | | 2,000,000 | | | | 1,950,920 | |
| | | | | | | | |
| | |
TOTAL ASSET-BACKED SECURITIES
(Cost – $482,074,168) | | | | | | | $465,470,646 | |
| | | | | | | | |
Collateralized Loan Obligations – 9.38% | | | | | | | | |
Atrium CLO Ltd., Series 12A, Class AR,
3.589% (3 Month LIBOR USD + 0.830%), 4/22/2027 (a)(d) | | | 4,210,189 | | | | 4,128,010 | |
Barings Middle Market CLO Ltd., Series 2021-IA, Class X,
1.399% (3 Month LIBOR USD + 1.250%), 7/20/2033 (a)(d) | | | 3,428,571 | | | | 3,423,264 | |
BNPP IP CLO Ltd., Series 2014-2A, Class CR,
3.686% (3 Month LIBOR USD + 2.400%), 10/30/2025 (a)(d) | | | 1,508,070 | | | | 1,502,768 | |
Cathedral Lake CLO Ltd., Series 2021-6A, Class X,
3.783% (3 Month LIBOR USD + 1.000%), 4/25/2034 (a)(d) | | | 3,157,895 | | | | 3,156,673 | |
Cedar Funding CLO Ltd., Series 2014-4A, Class X,
3.683% (3 Month LIBOR USD + 0.900%), 7/24/2034 (a)(d) | | | 1,904,760 | | | | 1,903,981 | |
Cerberus Loan Funding LP, Series 2021-6A, Class A,
3.912% (3 Month LIBOR USD + 1.400%), 11/22/2033 (a)(d) | | | 3,208,962 | | | | 3,190,539 | |
CIFC Funding Ltd., Series 2015-3A, Class AR,
3.608% (3 Month LIBOR USD + 0.870%), 4/19/2029 (a)(d) | | | 4,843,329 | | | | 4,769,802 | |
Elevation CLO Ltd., Series 2021-13A, Class X,
3.512% (3 Month LIBOR USD + 1.000%), 7/17/2034 (a)(d) | | | 2,400,000 | | | | 2,399,234 | |
Elevation CLO Ltd., Series 2021-14A, Class X,
3.660% (3 Month LIBOR USD + 0.950%), 10/20/2034 (a)(d) | | | 3,250,000 | | | | 3,248,889 | |
First Eagle Commercial Loan Funding LLC, Series 2016-1A, Class A1AR,
4.473% (3 Month LIBOR USD + 1.690%), 1/26/2032 (a)(d) | | | 7,818,749 | | | | 7,757,341 | |
Gallatin CLO Ltd., Series 2018-1A, Class A,
3.782% (3 Month LIBOR USD + 1.050%), 1/21/2028 (a)(d) | | | 1,305,494 | | | | 1,292,829 | |
Great Lakes CLO Ltd., Series 2021-5A, Class AX,
3.462% (3 Month LIBOR USD + 0.950%), 4/15/2033 (a)(d) | | | 2,608,571 | | | | 2,577,449 | |
Halcyon Loan Advisors Funding Ltd., Series 2015-2A, Class CR,
4.933% (3 Month LIBOR USD + 2.150%), 7/26/2027 (a)(d) | | | 5,884,000 | | | | 5,782,578 | |
Hayfin Kingsland Ltd., Series 2019-2A, Class XR,
3.660% (3 Month LIBOR USD + 0.950%), 10/20/2034 (a)(d) | | | 2,700,000 | | | | 2,699,328 | |
Highbridge Loan Management Ltd., Series 2015-7A, Class BR,
2.591% (3 Month LIBOR USD + 1.180%), 3/15/2027 (a)(d) | | | 4,000,000 | | | | 3,922,648 | |
ICG US CLO Ltd., Series 2015-1X, Class A1R,
3.878% (3 Month LIBOR USD + 1.140%), 10/19/2028 (d)(e) | | | 1,934,582 | | | | 1,913,652 | |
Jamestown CLO Ltd., Series 2016-9A, Class XRR,
3.683% (3 Month LIBOR USD + 0.900%), 7/25/2034 (a)(d) | | | 3,000,001 | | | | 2,999,260 | |
Lake Shore MM CLO Ltd., Series 2021-1A, Class X,
1.180% (3 Month LIBOR USD + 1.180%), 10/17/2033 (a)(d) | | | 4,116,667 | | | | 4,109,854 | |
See accompanying notes which are an integral part of these financial statements.
93
Angel Oak UltraShort Income Fund
Schedule of Investments – (continued)
July 31, 2022 (Unaudited)
| | | | | | | | |
| | | Principal
Amount | | | Value | |
Collateralized Loan Obligations – (continued) | | | | | | | | |
LCM LP, Series 20A, Class AR, 3.750% (3 Month LIBOR USD + 1.040%), 10/20/2027 (a)(d) | | $ | 788,764 | | | $ | 781,289 | |
Marble Point CLO Ltd., Series 2020-3A, Class X,
3.588% (3 Month LIBOR USD + 0.850%), 1/19/2034 (a)(d) | | | 1,333,332 | | | | 1,332,948 | |
Medalist Partners Corporate Finance CLO Ltd., Series 2020-1A, Class X,
3.640% (3 Month LIBOR USD + 0.900%), 4/18/2033 (a)(d) | | | 600,000 | | | | 600,000 | |
Monroe Capital MML CLO Ltd., Series 2017-1A, Class AR,
4.059% (3 Month LIBOR USD + 1.300%), 4/23/2029 (a)(d) | | | 2,759,416 | | | | 2,716,907 | |
Monroe Capital MML CLO Ltd., Series 2018-1A, Class A,
3.962% (3 Month LIBOR USD + 1.450%), 4/15/2030 (a)(d) | | | 2,359,314 | | | | 2,330,113 | |
Monroe Capital MML CLO Ltd., Series 2021-2A, Class X,
2.745% (3 Month LIBOR USD + 1.000%), 9/14/2033 (a)(d) | | | 4,186,000 | | | | 4,180,202 | |
Mountain View CLO Ltd., Series 2016-1A, Class XR,
3.283% (3 Month LIBOR USD + 0.800%), 4/14/2033 (a)(d) | | | 2,105,263 | | | | 2,105,263 | |
Mountain View CLO Ltd., Series 2019-1A, Class XR,
3.262% (3 Month LIBOR USD + 0.750%), 10/16/2034 (a)(d) | | | 2,718,750 | | | | 2,718,337 | |
Neuberger Berman CLO Ltd., Series 2015-20A, Class XR,
3.462% (3 Month LIBOR USD + 0.950%), 7/17/2034 (a)(d) | | | 4,000,000 | | | | 3,998,356 | |
Northwoods Capital Ltd., Series 2019-20A, Class X,
3.583% (3 Month LIBOR USD + 0.800%), 1/26/2032 (a)(d) | | | 214,404 | | | | 214,353 | |
OZLM Ltd., Series 2015-14A, Class X,
3.512% (3 Month LIBOR USD + 1.000%), 7/17/2034 (a)(d) | | | 733,333 | | | | 733,116 | |
Saranac CLO Ltd., Series 2014-2A, Class A1AR,
2.708% (3 Month LIBOR USD + 1.230%), 11/20/2029 (a)(d) | | | 5,916,764 | | | | 5,856,324 | |
Sculptor CLO Ltd., Series 25A, Class X,
3.262% (3 Month LIBOR USD + 0.750%), 1/15/2031 (a)(d) | | | 1,500,000 | | | | 1,499,846 | |
Symphony CLO Ltd., Series 2014-14A, Class AR,
3.433% (3 Month LIBOR USD + 0.950%), 7/14/2026 (a)(d) | | | 335,123 | | | | 333,662 | |
Symphony CLO Ltd., Series 2021-25A, Class X,
3.438% (3 Month LIBOR USD + 0.700%), 4/19/2034 (a)(d) | | | 750,000 | | | | 749,868 | |
TCW CLO Ltd., Series 2019-1A, Class XR,
2.411% (3 Month LIBOR USD + 1.000%), 8/16/2034 (a)(d) | | | 3,200,000 | | | | 3,199,107 | |
TCW CLO Ltd., Series 2020-1A, Class XRR,
3.560% (3 Month LIBOR USD + 0.850%), 4/20/2034 (a)(d) | | | 2,857,143 | | | | 2,855,991 | |
TCW CLO Ltd., Series 2021-2A, Class X,
3.783% (3 Month LIBOR USD + 1.000%), 7/25/2034 (a)(d) | | | 3,200,000 | | | | 3,198,982 | |
THL Credit Lake Shore MM CLO Ltd., Series 2019-1A, Class X,
3.512% (3 Month LIBOR USD + 1.000%), 4/15/2033 (a)(d) | | | 2,333,333 | | | | 2,331,107 | |
Wellfleet CLO Ltd., Series 2019-XA, Class X,
3.710% (3 Month LIBOR USD + 1.000%), 7/20/2032 (a)(d) | | | 3,409,091 | | | | 3,408,160 | |
WhiteHorse CLO Ltd., Series 2014-9A, Class C,
5.440% (3 Month LIBOR USD + 2.700%), 7/17/2026 (a)(d) | | | 269,421 | | | | 268,263 | |
| | | | | | | | |
| | |
TOTAL COLLATERALIZED LOAN OBLIGATIONS
(Cost – $106,825,193) | | | | | | | $106,190,293 | |
| | | | | | | | |
Commercial Mortgage-Backed Securities – 2.88% | | | | | | | | |
ACRES Commercial Realty Ltd., Series 2021-FL1, Class A,
3.199% (1 Month LIBOR USD + 1.200%), 6/17/2036 (a)(d) | | | 2,000,000 | | | | 1,968,294 | |
BDS Ltd., Series 2021-FL8, Class B,
3.506% (1 Month LIBOR USD + 1.350%), 1/18/2036 (a)(d) | | | 2,000,000 | | | | 1,895,246 | |
See accompanying notes which are an integral part of these financial statements.
94
Angel Oak UltraShort Income Fund
Schedule of Investments – (continued)
July 31, 2022 (Unaudited)
| | | | | | | | |
| | | Principal
Amount | | | Value | |
Commercial Mortgage-Backed Securities – (continued) | | | | | | | | |
BX Commercial Mortgage Trust, Series 2021-VOLT, Class B,
2.949% (1 Month LIBOR USD + 0.950%), 9/15/2036 (a)(d) | | $ | 2,000,000 | | | $ | 1,895,912 | |
BXP Trust, Series 2017-CQHP, Class A,
2.849% (1 Month LIBOR USD + 0.850%), 11/15/2034 (a)(d) | | | 1,000,000 | | | | 993,097 | |
BXP Trust, Series 2017-CQHP, Class C,
3.249% (1 Month LIBOR USD + 1.250%), 11/15/2034 (a)(d) | | | 3,000,000 | | | | 2,963,784 | |
CSMC Trust, Series 2017-PFHP, Class A,
2.949% (1 Month LIBOR USD + 0.950%), 12/16/2030 (a)(d) | | | 620,000 | | | | 620,722 | |
Extended Stay America Trust, Series 2021-ESH, Class B,
3.380% (1 Month LIBOR USD + 1.380%), 7/15/2038 (a)(d) | | | 1,391,436 | | | | 1,333,412 | |
Greystone CRE Notes Ltd., Series 2021-HC2, Class A,
3.873% (TSFR1M + 1.914%), 12/15/2039 (a)(d) | | | 5,000,000 | | | | 4,832,890 | |
GS Mortgage-Backed Securities Corp Trust, Series 2022-SHIP, Class A,
2.690% (TSFR1M + 0.731%), 8/15/2036 (a)(d) | | | 2,000,000 | | | | 1,963,492 | |
GS Mortgage-Backed Securities Corp. Trust, Series 2018-TWR, Class B,
3.449% (1 Month LIBOR USD + 1.200%), 7/15/2031 (a)(d) | | | 775,000 | | | | 760,170 | |
GS Mortgage-Backed Securities Trust, Series 2018-HART, Class B,
3.300% (1 Month LIBOR USD + 1.300%), 10/15/2031 (a)(d) | | | 683,000 | | | | 658,075 | |
JP Morgan Chase Commercial Mortgage Securities Trust, Series 2018-PTC, Class A,
3.449% (1 Month LIBOR USD + 1.450%), 4/15/2031 (a)(d) | | | 1,253,000 | | | | 1,203,961 | |
JP Morgan Chase Commercial Mortgage Securities Trust, Series 2019-MFP, Class A,
2.959% (1 Month LIBOR USD + 0.960%), 7/15/2036 (a)(d) | | | 765,000 | | | | 745,119 | |
Natixis Commercial Mortgage Securities Trust, Series 2019-MILE, Class A,
3.499% (1 Month LIBOR USD + 1.500%), 7/15/2036 (a)(d) | | | 1,000,000 | | | | 974,475 | |
Ready Capital Mortgage Financing LLC, Series 2021-FL6, Class B,
3.859% (1 Month LIBOR USD + 1.600%), 7/25/2036 (a)(d) | | | 1,950,000 | | | | 1,832,772 | |
Velocity Commercial Capital Loan Trust, Series 2021-2, Class A, 1.520%, 8/25/2051 (a)(b) | | | 4,298,538 | | | | 4,056,548 | |
Velocity Commercial Capital Loan Trust, Series 2021-3, Class A, 1.960%, 10/25/2051 (a)(b) | | | 2,824,711 | | | | 2,638,458 | |
Velocity Commercial Capital Loan Trust, Series 2021-4, Class A, 2.520%, 12/25/2051 (a)(b) | | | 1,325,203 | | | | 1,261,674 | |
| | | | | | | | |
| | |
TOTAL COMMERCIAL MORTGAGE-BACKED SECURITIES
(Cost – $33,796,642) | | | | | | | $32,598,101 | |
| | | | | | | | |
Commercial Mortgage-Backed Securities – U.S. Government Agency – 5.27% | | | | | | | | |
Federal Home Loan Mortgage Corp., Series K-F29, Class A,
2.147% (1 Month LIBOR USD + 0.360%), 2/25/2024 (d) | | | 1,342,065 | | | | 1,342,232 | |
Federal Home Loan Mortgage Corp., Series 2020-KI05, Class B,
4.087% (1 Month LIBOR USD + 2.300%), 7/25/2024 (a)(d) | | | 404,730 | | | | 396,137 | |
Federal Home Loan Mortgage Corp., Series K-F51, Class A,
2.187% (1 Month LIBOR USD + 0.400%), 8/25/2025 (d) | | | 4,981,739 | | | | 4,970,849 | |
Federal Home Loan Mortgage Corp., Series K-F60, Class A,
2.277% (1 Month LIBOR USD + 0.490%), 2/25/2026 (d) | | | 1,262,376 | | | | 1,259,600 | |
Federal Home Loan Mortgage Corp., Series K-F62, Class A,
2.267% (1 Month LIBOR USD + 0.480%), 4/25/2026 (d) | | | 1,232,151 | | | | 1,228,017 | |
Federal Home Loan Mortgage Corp., Series K-F64, Class A,
2.227% (1 Month LIBOR USD + 0.440%), 6/25/2026 (d) | | | 439,288 | | | | 437,588 | |
Federal Home Loan Mortgage Corp., Series K-F68, Class A,
2.277% (1 Month LIBOR USD + 0.490%), 7/27/2026 (d) | | | 6,310,850 | | | | 6,300,702 | |
Federal Home Loan Mortgage Corp., Series K-F74, Class AS,
1.642% (MSOFR1MC + 0.530%), 1/25/2027 (d) | | | 361,743 | | | | 359,746 | |
See accompanying notes which are an integral part of these financial statements.
95
Angel Oak UltraShort Income Fund
Schedule of Investments – (continued)
July 31, 2022 (Unaudited)
| | | | | | | | |
| | | Principal
Amount | | | Value | |
Commercial Mortgage-Backed Securities – U.S. Government Agency – (continued) | | | | | | | | |
Federal Home Loan Mortgage Corp., Series K-F74, Class AL,
2.227% (1 Month LIBOR USD + 0.440%), 1/25/2027 (d) | | $ | 2,893,944 | | | $ | 2,882,701 | |
Federal Home Loan Mortgage Corp., Series K-F81, Class AS,
1.489% (SOFR30A + 0.400%), 6/25/2027 (d) | | | 1,913,255 | | | | 1,906,336 | |
Federal Home Loan Mortgage Corp., Series K-F86, Class AS,
1.409% (SOFR30A + 0.320%), 8/25/2027 (d) | | | 8,119,134 | | | | 8,065,548 | |
Federal Home Loan Mortgage Corp., Series K-F86, Class AL,
2.077% (1 Month LIBOR USD + 0.290%), 8/25/2027 (d) | | | 2,476,674 | | | | 2,461,215 | |
Federal Home Loan Mortgage Corp., Series K-F93, Class AS,
1.399% (SOFR30A + 0.310%), 10/25/2027 (d) | | | 1,497,316 | | | | 1,483,805 | |
Federal Home Loan Mortgage Corp., Series K-F93, Class AL,
2.067% (1 Month LIBOR USD + 0.280%), 10/25/2027 (d) | | | 1,751,247 | | | | 1,741,421 | |
Federal Home Loan Mortgage Corp., Series K-F100, Class AS,
1.269% (SOFR30A + 0.180%), 1/25/2028 (d) | | | 4,202,773 | | | | 4,094,517 | |
Federal Home Loan Mortgage Corp., Series K-F43, Class A,
2.027% (1 Month LIBOR USD + 0.240%), 1/25/2028 (d) | | | 2,660,940 | | | | 2,644,274 | |
Federal Home Loan Mortgage Corp., Series K-F48, Class A,
2.077% (1 Month LIBOR USD + 0.290%), 6/25/2028 (d) | | | 1,103,011 | | | | 1,091,908 | |
Federal Home Loan Mortgage Corp., Series KF57, Class A,
2.327% (1 Month LIBOR USD + 0.540%), 12/25/2028 (d) | | | 1,505,470 | | | | 1,493,634 | |
Federal Home Loan Mortgage Corp., Series K-F61, Class A,
2.317% (1 Month LIBOR USD + 0.530%), 3/25/2029 (d) | | | 2,325,959 | | | | 2,319,395 | |
Federal Home Loan Mortgage Corp., Series K-F84, Class AL,
2.087% (1 Month LIBOR USD + 0.300%), 7/25/2030 (d) | | | 3,041,274 | | | | 3,010,591 | |
Federal Home Loan Mortgage Corp., Series K-F92, Class AS,
1.449% (SOFR30A + 0.360%), 10/25/2030 (d) | | | 682,543 | | | | 678,186 | |
Federal Home Loan Mortgage Corp., Series K-F91, Class AL,
2.117% (1 Month LIBOR USD + 0.330%), 10/25/2030 (d) | | | 1,320,612 | | | | 1,304,792 | |
Federal Home Loan Mortgage Corp., Series K-F96, Class AS,
1.389% (SOFR30A + 0.300%), 11/25/2030 (d) | | | 717,446 | | | | 707,237 | |
Federal Home Loan Mortgage Corp., Series K-F94, Class AL,
2.087% (1 Month LIBOR USD + 0.300%), 11/25/2030 (d) | | | 1,504,232 | | | | 1,483,128 | |
Federal Home Loan Mortgage Corp., Series K-F99, Class AS,
1.289% (SOFR30A + 0.200%), 12/26/2030 (d) | | | 1,594,023 | | | | 1,558,720 | |
Federal National Mortgage Association, Series 2013-M2, Class AFL,
2.609% (1 Month LIBOR USD + 0.350%), 1/25/2023 (d) | | | 2,523,649 | | | | 2,525,769 | |
Federal National Mortgage Association, 2.500%, 9/1/2024 | | | 1,972,412 | | | | 1,883,677 | |
| | | | | | | | |
| | |
TOTAL COMMERCIAL MORTGAGE-BACKED SECURITIES – U.S. GOVERNMENT AGENCY
(Cost – $60,229,672) | | | | | | | $59,631,725 | |
| | | | | | | | |
Corporate Obligations – 1.41% | | | | | | | | |
Basic Materials – 0.29% | | | | | | | | |
Compass Minerals International, Inc., 4.875%, 7/15/2024 (a) | | | 3,000,000 | | | | 2,794,212 | |
FMG Resources Ltd., 5.125%, 5/15/2024 (a) | | | 500,000 | | | | 504,895 | |
| | | | | | | | |
| | |
| | | | | | | 3,299,107 | |
| | | | | | | | |
Consumer, Non-cyclical – 0.31% | | | | | | | | |
Prime Security Services Borrower LLC / Prime Finance, Inc., 5.250%, 4/15/2024 (a) | | | 3,500,000 | | | | 3,499,720 | |
| | | | | | | | |
See accompanying notes which are an integral part of these financial statements.
96
Angel Oak UltraShort Income Fund
Schedule of Investments – (continued)
July 31, 2022 (Unaudited)
| | | | | | | | |
| | | Principal
Amount | | | Value | |
Corporate Obligations – (continued) | | | | | | | | |
Energy – 0.09% | | | | | | | | |
Occidental Petroleum Corp., 6.950%, 7/1/2024 | | $ | 1,000,000 | | | $ | 1,050,645 | |
| | | | | | | | |
Financial – 0.72% | | | | | | | | |
goeasy Ltd., 5.375%, 12/1/2024 (a) | | | 1,000,000 | | | | 940,101 | |
Millennium Consolidated Holdings LLC, 7.500%, 6/30/2023 (a) | | | 2,000,000 | | | | 2,001,371 | |
OneMain Finance Corp., 6.125%, 3/15/2024 | | | 1,275,000 | | | | 1,259,279 | |
Starwood Property Trust, Inc., 5.500%, 11/1/2023 (a) | | | 4,000,000 | | | | 3,974,200 | |
| | | | | | | | |
| | |
| | | | | | | 8,174,951 | |
| | | | | | | | |
| | |
TOTAL CORPORATE OBLIGATIONS
(Cost – $16,728,245) | | | | | | | $16,024,423 | |
| | | | | | | | |
Residential Mortgage-Backed Securities – 31.19% | | | | | | | | |
Banc of America Funding Corp., Series 2015-R3, Class 7A1,
2.464% (1 Month LIBOR USD + 0.205%), 4/29/2037 (a)(d) | | | 3,108,003 | | | | 3,061,920 | |
Bellemeade Re Ltd., Series 2018-3A, Class M1B,
4.109% (1 Month LIBOR USD + 1.850%), 10/25/2028 (a)(d) | | | 784,189 | | | | 784,129 | |
Bellemeade Re Ltd., Series 2019-3A, Class M1C,
4.209% (1 Month LIBOR USD + 1.950%), 7/25/2029 (a)(d) | | | 1,397,350 | | | | 1,345,545 | |
BRAVO Residential Funding Trust, Series 2021-NQM3, Class A2, 1.853%, 4/25/2060 (a)(b) | | | 3,107,232 | | | | 2,965,691 | |
BRAVO Residential Funding Trust, Series 2020-NQM1, Class A2, 1.789%, 5/25/2060 (a)(b) | | | 1,001,124 | | | | 990,741 | |
BRAVO Residential Funding Trust, Series 2020-NQM1, Class A3, 2.406%, 5/25/2060 (a)(b) | | | 693,437 | | | | 689,176 | |
Bunker Hill Loan Depositary Trust, Series 2019-2, Class A3, 3.185%, 7/25/2049 (a)(f) | | | 4,833,375 | | | | 4,656,556 | |
Bunker Hill Loan Depositary Trust, Series 2019-3, Class A3, 3.135%, 11/25/2059 (a)(f) | | | 1,709,885 | | | | 1,673,108 | |
Cascade Funding Mortgage Trust, Series 2021-HB6, Class A, 0.898%, 6/25/2036 (a)(b) | | | 1,433,563 | | | | 1,405,050 | |
Chase Home Lending Mortgage Trust, Series 2019-ATR2, Class A11,
3.159% (1 Month LIBOR USD + 0.900%), 8/25/2049 (a)(d) | | | 1,541,244 | | | | 1,500,351 | |
CIM Trust, Series 2019-INV1, Class A2,
3.259% (1 Month LIBOR USD + 1.000%), 2/25/2049 (a)(d) | | | 62,473 | | | | 58,743 | |
CIM Trust, Series 2019-INV2, Class A11,
2.574% (1 Month LIBOR USD + 0.950%), 5/25/2049 (a)(d) | | | 224,637 | | | | 216,232 | |
CIM Trust, Series 2021-NR2, Class A1, 2.568%, 7/25/2059 (a)(f) | | | 3,360,228 | | | | 3,226,316 | |
COLT Funding LLC, Series 2021-3R, Class A3, 1.513%, 12/26/2064 (a)(b) | | | 961,849 | | | | 926,483 | |
COLT Mortgage Loan Trust, Series 2020-2, Class A1, 1.853%, 3/25/2065 (a)(b) | | | 359,077 | | | | 357,618 | |
COLT Mortgage Loan Trust, Series 2020-2, Class A3, 3.698%, 3/25/2065 (a)(b) | | | 1,710,000 | | | | 1,675,651 | |
COLT Mortgage Loan Trust, Series 2020-3, Class A1, 1.506%, 4/27/2065 (a)(b) | | | 1,168,775 | | | | 1,145,552 | |
COLT Mortgage Loan Trust, Series 2020-3, Class A3, 2.380%, 4/27/2065 (a)(b) | | | 342,353 | | | | 336,117 | |
COLT Mortgage Loan Trust, Series 2021-2, Class A2, 1.130%, 8/25/2066 (a)(b) | | | 807,606 | | | | 711,187 | |
COLT Mortgage Loan Trust, Series 2021-3, Class A1, 0.956%, 9/27/2066 (a)(b) | | | 9,697,147 | | | | 8,503,806 | |
COLT Mortgage Loan Trust, Series 2021-5, Class A1, 1.726%, 11/25/2066 (a)(b) | | | 3,624,311 | | | | 3,287,221 | |
COLT Mortgage Loan Trust, Series 2021-6, Class A1, 1.907%, 12/27/2066 (a)(b) | | | 5,758,644 | | | | 5,370,143 | |
COLT Mortgage Loan Trust, Series 2022-7, Class A3, 6.250%, 7/25/2067 (a)(b) | | | 700,000 | | | | 699,984 | |
COLT Mortgage Loan Trust, Series 2021-1R, Class A3, 1.421%, 5/25/2065 (a)(b) | | | 869,611 | | | | 840,277 | |
Credit Suisse Mortgage Capital Certificates, Series 2020-SPT1, Class A2, 2.229%, 4/25/2065 (a)(f) | | | 10,000,000 | | | | 9,833,400 | |
Credit Suisse Mortgage Capital Certificates, Series 2020-SPT1, Class A3, 2.734%, 4/25/2065 (a)(f) | | | 5,000,000 | | | | 4,865,980 | |
Credit Suisse Mortgage Trust, Series 2021-NQM8, Class A2, 2.303%, 10/25/2066 (a)(b) | | | 4,432,363 | | | | 4,003,740 | |
See accompanying notes which are an integral part of these financial statements.
97
Angel Oak UltraShort Income Fund
Schedule of Investments – (continued)
July 31, 2022 (Unaudited)
| | | | | | | | |
| | | Principal
Amount | | | Value | |
Residential Mortgage-Backed Securities – (continued) | | | | | | | | |
CSMC Trust, Series 2019-AFC1, Class A2, 2.776%, 8/25/2049 (a)(f) | | $ | 857,459 | | | $ | 845,700 | |
CSMC Trust, Series 2019-AFC1, Class A3, 2.877%, 8/25/2049 (a)(f) | | | 1,914,486 | | | | 1,870,761 | |
CSMC Trust, Series 2020-AFC1, Class A3, 2.514%, 2/25/2050 (a)(b) | | | 568,261 | | | | 547,453 | |
CSMC Trust, Series 2019-NQM1, Class A1, 2.656%, 10/25/2059 (a)(f) | | | 1,777,506 | | | | 1,741,471 | |
CSMC Trust, Series 2021-NQM1, Class A1, 0.809%, 5/25/2065 (a)(b) | | | 1,911,699 | | | | 1,829,148 | |
CSMC Trust, Series 2020-NQM1, Class A3, 1.722%, 5/25/2065 (a)(f) | | | 1,905,033 | | | | 1,836,749 | |
CSMC Trust, Series 2021-NQM3, Class A3, 1.632%, 4/25/2066 (a)(b) | | | 6,454,133 | | | | 5,962,767 | |
CSMC Trust, Series 2021-NQM5, Class A3, 1.349%, 5/25/2066 (a)(b) | | | 3,591,813 | | | | 3,282,518 | |
CSMC Trust, Series 2021-NQM8, Class A1, 1.841%, 10/25/2066 (a)(b) | | | 4,432,363 | | | | 4,070,669 | |
CSMC Trust, Series 2021-NQM7, Class A2, 1.961%, 10/25/2066 (a)(b) | | | 3,799,749 | | | | 3,538,619 | |
CSMC Trust, Series 2022-NQM1, Class A3, 2.675%, 11/25/2066 (a)(b) | | | 9,461,206 | | | | 8,628,847 | |
Deephaven Residential Mortgage Trust, Series 2021-1, Class A1, 0.715%, 5/25/2065 (a)(b) | | | 1,405,574 | | | | 1,391,294 | |
Deephaven Residential Mortgage Trust, Series 2021-2, Class A3, 1.260%, 4/25/2066 (a)(b) | | | 1,041,369 | | | | 968,273 | |
Deephaven Residential Mortgage Trust, Series 2021-4, Class A1, 1.931%, 11/25/2066 (a)(b) | | | 4,601,675 | | | | 4,188,702 | |
Ellington Financial Mortgage Trust, Series 2022-1, Class A1, 2.206%, 1/25/2067 (a)(b) | | | 2,088,325 | | | | 1,920,132 | |
Flagstar Mortgage Trust, Series 2018-6RR, Class 1A2,
2.959% (1 Month LIBOR USD + 0.700%), 10/25/2048 (a)(d) | | | 1,226,830 | | | | 1,187,836 | |
FWD Securitization Trust, Series 2019-INV1, Class A2, 3.010%, 6/25/2049 (a)(b) | | | 652,092 | | | | 646,183 | |
FWD Securitization Trust, Series 2020-INV1, Class A2, 2.340%, 1/25/2050 (a)(b) | | | 1,776,720 | | | | 1,724,569 | |
Galton Funding Mortgage Trust, Series 2017-1, Class A21, 3.500%, 7/25/2056 (a)(b) | | | 46,521 | | | | 47,094 | |
GCAT Trust, Series 2019-NQM3, Class A3, 3.043%, 11/25/2059 (a)(b) | | | 10,288,031 | | | | 9,904,689 | |
GCAT Trust, Series 2020-NQM1, Class A3, 2.554%, 1/25/2060 (a)(f) | | | 394,163 | | | | 382,417 | |
GCAT Trust, Series 2020-NQM2, Class A1, 1.555%, 4/25/2065 (a)(f) | | | 1,009,061 | | | | 981,009 | |
GCAT Trust, Series 2021-NQM7, Class A1, 1.915%, 8/25/2066 (a)(b) | | | 2,269,718 | | | | 2,174,994 | |
GS Mortgage-Backed Securities Corp. Trust, Series 2014-EB1A, Class B2, 2.705%, 7/25/2044 (a)(b) | | | 2,333,281 | | | | 2,321,911 | |
GS Mortgage-Backed Securities Corp. Trust, Series 2020-PJ2, Class A1, 3.500%, 7/25/2050 (a)(b) | | | 262,172 | | | | 253,228 | |
GS Mortgage-Backed Securities Corp. Trust, Series 2021-PJ4, Class A6, 2.500%, 9/25/2051 (a)(b) | | | 3,135,883 | | | | 2,974,799 | |
GS Mortgage-Backed Securities Corp. Trust, Series 2021-PJ9, Class A8, 2.500%, 2/25/2052 (a)(b) | | | 8,786,755 | | | | 8,220,519 | |
GS Mortgage-Backed Securities Corp. Trust, Series 2021-PJ10, Class A8, 2.500%, 3/25/2052 (a)(b) | | | 4,518,589 | | | | 4,227,402 | |
GS Mortgage-Backed Securities Corp. Trust, Series 2021-NQM1, Class A3, 1.532%, 7/25/2061 (a)(b) | | | 1,858,300 | | | | 1,805,827 | |
GS Mortgage-Backed Securities Trust, Series 2020-PJ1, Class A1, 3.500%, 5/25/2050 (a)(b) | | | 228,110 | | | | 220,338 | |
GS Mortgage-Backed Securities Trust, Series 2020-NQM1, Class A2, 1.791%, 9/25/2060 (a)(b) | | | 544,711 | | | | 527,148 | |
Home Re Ltd., Series 2018-1, Class M1,
3.859% (1 Month LIBOR USD + 1.600%), 10/25/2028 (a)(d) | | | 95,215 | | | | 95,204 | |
Home RE Ltd., Series 2021-1, Class M1A,
3.309% (1 Month LIBOR USD + 1.050%), 7/25/2033 (a)(d) | | | 359,608 | | | | 347,682 | |
Imperial Fund Mortgage Trust, Series 2021-NQM1, Class A3, 1.617%, 6/25/2056 (a)(b) | | | 1,536,720 | | | | 1,456,522 | |
JP Morgan Mortgage Trust, Series 2018-1, Class B1, 3.618%, 6/25/2048 (a)(b) | | | 897,982 | | | | 891,088 | |
JP Morgan Mortgage Trust, Series 2019-1, Class A11,
3.209% (1 Month LIBOR USD + 0.950%), 5/25/2049 (a)(d) | | | 136,268 | | | | 134,535 | |
JP Morgan Mortgage Trust, Series 2019-2, Class A11,
3.209% (1 Month LIBOR USD + 0.950%), 8/25/2049 (a)(d) | | | 453,729 | | | | 445,002 | |
See accompanying notes which are an integral part of these financial statements.
98
Angel Oak UltraShort Income Fund
Schedule of Investments – (continued)
July 31, 2022 (Unaudited)
| | | | | | | | |
| | | Principal
Amount | | | Value | |
Residential Mortgage-Backed Securities – (continued) | | | | | | | | |
JP Morgan Mortgage Trust, Series 2019-5, Class A11,
3.159% (1 Month LIBOR USD + 0.900%), 11/25/2049 (a)(d) | | $ | 1,030,925 | | | $ | 1,001,170 | |
JP Morgan Mortgage Trust, Series 2019-6, Class A3, 3.500%, 12/25/2049 (a)(b) | | | 2,104,701 | | | | 2,022,723 | |
JP Morgan Mortgage Trust, Series 2019-LTV3, Class A3, 3.500%, 3/25/2050 (a)(b) | | | 338,365 | | | | 352,355 | |
JP Morgan Mortgage Trust, Series 2019-INV3, Class A11,
2.624% (1 Month LIBOR USD + 1.000%), 5/25/2050 (a)(d) | | | 658,536 | | | | 622,161 | |
JP Morgan Mortgage Trust, Series 2020-LTV1, Class A11,
2.624% (1 Month LIBOR USD + 1.000%), 6/25/2050 (a)(d) | | | 728,325 | | | | 706,447 | |
JP Morgan Mortgage Trust, Series 2020-7, Class A11,
2.424% (1 Month LIBOR USD + 0.800%), 1/25/2051 (a)(d) | | | 979,556 | | | | 938,069 | |
JP Morgan Mortgage Trust, Series 2021-1, Class A11,
1.576% (SOFR30A + 0.650%), 6/25/2051 (a)(d) | | | 4,496,062 | | | | 4,069,956 | |
JP Morgan Mortgage Trust, Series 2021-6, Class A6, 2.500%, 10/25/2051 (a)(b) | | | 2,990,956 | | | | 2,820,086 | |
LHOME Mortgage Trust, Series 2020-RTL1, Class A1, 3.228%, 10/25/2024 (a) | | | 159,531 | | | | 158,994 | |
Mello Mortgage Capital Accepatance, Series 2021-MTG2, Class A10, 2.500%, 6/25/2051 (a)(b) | | | 3,984,057 | | | | 3,708,818 | |
METLIFE Securitization Trust, Series 2020-INV1, Class A5, 3.000%, 5/25/2050 (a)(b) | | | 2,051,762 | | | | 1,958,548 | |
MFA Trust, Series 2021-INV1, Class A2, 1.057%, 1/25/2056 (a)(b) | | | 837,224 | | | | 804,474 | |
MFA Trust, Series 2020-NQM3, Class A2, 1.324%, 1/26/2065 (a)(b) | | | 745,114 | | | | 725,724 | |
MFA Trust, Series 2020-NQM1, Class A3, 2.300%, 3/25/2065 (a)(b) | | | 1,032,010 | | | | 992,281 | |
Mill City Mortgage Loan Trust, Series 2019-GS2, Class A1, 2.750%, 8/25/2059 (a)(b) | | | 418,247 | | | | 406,277 | |
Mill City Mortgage Loan Trust, Series 2021-NMR1, Class A1, 1.125%, 11/25/2060 (a)(b) | | | 1,418,591 | | | | 1,356,893 | |
Mortgage Insurance-Linked Notes, Series 2020-2, Class B1,
9.859% (1 Month LIBOR USD + 7.600%), 10/25/2030 (a)(d) | | | 13,136,000 | | | | 13,150,121 | |
New Residential Mortgage Loan Trust, Series 2021-INV1, Class A6, 2.500%, 6/25/2051 (a)(b) | | | 2,573,905 | | | | 2,408,037 | |
New Residential Mortgage Loan Trust, Series 2019-NQM5, Class A1, 2.710%, 11/25/2059 (a)(b) | | | 540,270 | | | | 498,648 | |
New Residential Mortgage Loan Trust, Series 2019-NQM5, Class A3, 3.065%, 11/25/2059 (a)(b) | | | 406,307 | | | | 397,623 | |
New Residential Mortgage Loan Trust, Series 2020-NQM2, Class A1, 1.650%, 5/25/2060 (a)(b) | | | 712,007 | | | | 702,678 | |
NLT Trust, Series 2021-INV2, Class A3, 1.520%, 8/25/2056 (a)(b) | | | 2,167,807 | | | | 2,079,196 | |
NMLT Trust, Series 2021-INV1, Class A3, 1.797%, 5/25/2056 (a)(b) | | | 1,619,177 | | | | 1,506,842 | |
OBX Trust, Series 2018-EXP1, Class 2A2,
3.259% (1 Month LIBOR USD + 1.000%), 4/27/2048 (a)(d) | | | 173,553 | | | | 167,188 | |
OBX Trust, Series 2020-EXP1, Class 2A1,
3.009% (1 Month LIBOR USD + 0.750%), 1/26/2060 (a)(d) | | | 602,778 | | | | 579,841 | |
OBX Trust, Series 2021-NQM3, Class A2, 1.260%, 7/25/2061 (a)(b) | | | 3,111,208 | | | | 2,753,963 | |
OBX Trust, Series 2022-NQM1, Class A1, 2.305%, 11/25/2061 (a)(b) | | | 4,924,979 | | | | 4,537,792 | |
OBX Trust, Series 2021-NQM1, Class A3, 1.329%, 2/25/2066 (a)(b) | | | 5,226,692 | | | | 4,757,340 | |
Onslow Bay Mortgage Loan Trust, Series 2021-NQM4, Class A1, 1.957%, 10/25/2061 (a)(b) | | | 4,565,433 | | | | 4,176,221 | |
Onslow Bay Mortgage Loan Trust, Series 2021-NQM4, Class A2, 2.162%, 10/25/2061 (a)(b) | | | 7,753,425 | | | | 7,028,968 | |
Onslow Bay Mortgage Loan Trust, Series 2021-NQM4, Class A3, 2.367%, 10/25/2061 (a)(b) | | | 6,998,306 | | | | 6,279,447 | |
Pepper Residential Securities Trust, Series 21A, Class A1U,
3.036% (1 Month LIBOR USD + 0.880%), 1/16/2060 (a)(d) | | | 28,906 | | | | 28,853 | |
Pepper Residential Securities Trust, Series 23A, Class A1U,
3.106% (1 Month LIBOR USD + 0.950%), 8/18/2060 (a)(d) | | | 49,127 | | | | 49,070 | |
PNMAC Issuer Trust, Series 2018-FT1, Class A,
4.609% (1 Month LIBOR USD + 2.350%), 4/25/2023 (a)(d)(g) | | | 5,000,000 | | | | 5,007,745 | |
Pretium Mortgage Credit Partners LLC, Series 2021-NPL3, Class A1, 1.868%, 7/25/2051 (a)(f) | | | 5,411,850 | | | | 5,076,894 | |
PRKCM Trust, Series 2021-AFC2, Class A1, 2.071%, 11/25/2056 (a)(b) | | | 7,606,048 | | | | 6,502,487 | |
PRPM LLC, Series 2021-6, Class A1, 1.793%, 7/25/2026 (a)(f) | | | 3,538,503 | | | | 3,333,904 | |
PRPM LLC, Series 2021-9, Class A1, 2.363%, 10/25/2026 (a)(f) | | | 2,445,508 | | | | 2,331,148 | |
See accompanying notes which are an integral part of these financial statements.
99
Angel Oak UltraShort Income Fund
Schedule of Investments – (continued)
July 31, 2022 (Unaudited)
| | | | | | | | |
| | | Principal
Amount | | | Value | |
Residential Mortgage-Backed Securities – (continued) | | | | | | | | |
RCO Mortgage LLC, Series 2022-1, Class A1, 2.981%, 1/25/2027 (a)(f) | | $ | 4,232,174 | | | $ | 4,125,214 | |
Residential Mortgage Loan Trust, Series 2019-2, Class A3, 3.220%, 5/25/2059 (a)(b) | | | 486,192 | | | | 481,711 | |
Residential Mortgage Loan Trust, Series 2020-1, Class A3, 2.684%, 1/25/2060 (a)(b) | | | 785,678 | | | | 767,445 | |
RESIMAC Bastille Trust, Series 2018-1NCA, Class A1,
2.648% (1 Month LIBOR USD + 0.850%), 12/5/2059 (a)(d) | | | 65,491 | | | | 65,607 | |
Saluda Grade Alternative Mortgage Trust, Series 2021-MF1, Class A1, 2.805%, 11/25/2029 (a)(b) | | | 5,000,000 | | | | 4,870,630 | |
SG Residential Mortgage Trust, Series 2019-3, Class A1, 2.703%, 9/25/2059 (a)(b) | | | 1,580,347 | | | | 1,564,995 | |
SG Residential Mortgage Trust, Series 2019-3, Class A2, 2.877%, 9/25/2059 (a)(b) | | | 306,463 | | | | 304,750 | |
SG Residential Mortgage Trust, Series 2021-2, Class A1, 1.737%, 12/25/2061 (a)(b) | | | 13,632,280 | | | | 12,049,054 | |
SG Residential Mortgage Trust, Series 2021-2, Class A2, 1.942%, 12/25/2061 (a)(b) | | | 4,544,093 | | | | 3,967,098 | |
Spruce Hill Mortgage Loan Trust, Series 2020-SH1, Class A1, 2.521%, 1/28/2050 (a)(b) | | | 243,309 | | | | 242,896 | |
Spruce Hill Mortgage Loan Trust, Series 2020-SH1, Class A2, 2.624%, 1/28/2050 (a)(b) | | | 121,443 | | | | 120,842 | |
Starwood Mortgage Residential Trust, Series 2019-INV1, Class A3, 2.916%, 9/25/2049 (a)(b) | | | 8,859,928 | | | | 8,665,613 | |
Starwood Mortgage Residential Trust, Series 2020-1, Class A1, 2.275%, 2/25/2050 (a)(b) | | | 684,763 | | | | 667,863 | |
Starwood Mortgage Residential Trust, Series 2020-INV1, Class A3, 1.593%, 11/25/2055 (a)(b) | | | 1,773,047 | | | | 1,743,448 | |
Starwood Mortgage Residential Trust, Series 2021-3, Class A3, 1.518%, 6/25/2056 (a)(b) | | | 3,758,896 | | | | 3,535,524 | |
Starwood Mortgage Residential Trust, Series 2021-2, Class A3, 1.431%, 5/25/2065 (a)(b) | | | 677,419 | | | | 649,654 | |
Starwood Mortgage Residential Trust, Series 2021-5, Class A1, 1.920%, 9/25/2066 (a)(b) | | | 5,134,421 | | | | 4,745,345 | |
Starwood Mortgage Residential Trust, Series 2021-5, Class A2, 2.178%, 9/25/2066 (a)(b) | | | 4,653,839 | | | | 4,284,748 | |
Starwood Mortgage Residential Trust, Series 2021-5, Class A3, 2.436%, 9/25/2066 (a)(b) | | | 4,107,537 | | | | 3,748,008 | |
Starwood Mortgage Residential Trust, Series 2021-6, Class A1, 1.920%, 11/25/2066 (a)(b) | | | 5,221,716 | | | | 4,719,633 | |
Starwood Mortgage Residential Trust, Series 2022-1, Class A1, 2.447%, 12/25/2066 (a)(b) | | | 1,831,671 | | | | 1,695,966 | |
Towd Point Mortgage Trust, Series 2017-2, Class A1, 2.750%, 4/25/2057 (a)(b) | | | 963,657 | | | | 962,865 | |
Towd Point Mortgage Trust, Series 2017-6, Class A1, 2.750%, 10/25/2057 (a)(b) | | | 157,492 | | | | 153,946 | |
Towd Point Mortgage Trust, Series 2019-HY2, Class A1,
3.259% (1 Month LIBOR USD + 1.000%), 5/28/2058 (a)(d) | | | 4,649,185 | | | | 4,609,332 | |
TRK Trust, Series 2022-INV1, Class A1, 2.577%, 2/25/2057 (a)(b) | | | 3,813,468 | | | | 3,632,492 | |
Verus Securitization Trust, Series 2019-INV3, Class A2, 2.947%, 11/25/2059 (a)(b) | | | 1,611,648 | | | | 1,578,502 | |
Verus Securitization Trust, Series 2019-INV3, Class M1, 3.279%, 11/25/2059 (a)(b) | | | 2,513,000 | | | | 2,323,673 | |
Verus Securitization Trust, Series 2020-INV1, Class A1, 1.977%, 3/25/2060 (a)(b) | | | 3,034,344 | | | | 3,008,658 | |
Verus Securitization Trust, Series 2020-5, Class A2, 1.578%, 5/25/2065 (a)(f) | | | 1,164,511 | | | | 1,111,503 | |
Verus Securitization Trust, Series 2021-3, Class A2, 1.283%, 6/25/2066 (a)(b) | | | 1,010,450 | | | | 949,250 | |
Verus Securitization Trust, Series 2021-4, Class A1, 0.938%, 7/25/2066 (a)(b) | | | 11,333,265 | | | | 10,221,109 | |
Verus Securitization Trust, Series 2021-4, Class A2, 1.247%, 7/25/2066 (a)(b) | | | 1,893,510 | | | | 1,704,582 | |
Verus Securitization Trust, Series 2021-5, Class A1, 1.013%, 9/25/2066 (a)(b) | | | 2,413,755 | | | | 2,086,672 | |
Verus Securitization Trust, Series 2021-5, Class A3, 1.373%, 9/25/2066 (a)(b) | | | 2,755,530 | | | | 2,435,740 | |
Verus Securitization Trust, Series 2021-7, Class A1, 1.829%, 10/25/2066 (a)(b) | | | 1,278,096 | | | | 1,171,933 | |
Verus Securitization Trust, Series 2021-8, Class A3, 2.491%, 11/25/2066 (a)(b) | | | 1,964,132 | | | | 1,777,184 | |
Verus Securitization Trust, Series 2022-3, Class A1, 4.130%, 2/25/2067 (a)(f) | | | 2,830,491 | | | | 2,775,279 | |
Verus Securitization Trust, Series 2022-3, Class A3, 4.130%, 2/25/2067 (a)(b) | | | 2,830,491 | | | | 2,711,112 | |
Visio Trust, Series 2021-1R, Class A3, 1.688%, 5/25/2056 (a) | | | 1,942,864 | | | | 1,827,903 | |
Wells Fargo Mortgage Backed Securities Trust, Series 2020-2, Class A3, 3.000%, 2/25/2050 (a)(b) | | | 316,768 | | | | 316,783 | |
WinWater Mortgage Loan Trust, Series 2015-A, Class AX1, 0.326%, 6/20/2045 (a)(b)(h) | | | 7,099,004 | | | | 19,671 | |
| | | | | | | | |
| | |
TOTAL RESIDENTIAL MORTGAGE-BACKED SECURITIES
(Cost – $375,439,699) | | | | | | | $353,117,031 | |
| | | | | | | | |
See accompanying notes which are an integral part of these financial statements.
100
Angel Oak UltraShort Income Fund
Schedule of Investments – (continued)
July 31, 2022 (Unaudited)
| | | | | | | | |
| | | Principal
Amount | | | Value | |
Residential Mortgage-Backed Securities – U.S. Government Agency – 0.36% | | | | | | | | |
Federal Home Loan Mortgage Corp., Series 5078, Class AB, 2.000%, 9/25/2035 | | $ | 3,241,711 | | | $ | 3,188,991 | |
Federal National Mortgage Association, Series 2017-61, Class K, 3.500%, 8/25/2046 | | | 890,382 | | | | 870,045 | |
| | | | | | | | |
| | |
TOTAL RESIDENTIAL MORTGAGE-BACKED SECURITIES – U.S. GOVERNMENT AGENCY
(Cost – $4,187,136) | | | | | | | $4,059,036 | |
| | | | | | | | |
Residential Mortgage-Backed Securities – U.S. Government Agency Credit Risk Transfer – 0.70% | | | | | | | | |
Connecticut Avenue Securities Trust, Series 2019-R03, Class 1M2,
4.409% (1 Month LIBOR USD + 2.150%), 9/25/2031 (a)(d) | | | 238,210 | | | | 238,359 | |
Connecticut Avenue Securities Trust, Series 2020-R02, Class 2M2,
4.259% (1 Month LIBOR USD + 2.000%), 1/25/2040 (a)(d) | | | 683,106 | | | | 679,257 | |
Connecticut Avenue Securities Trust, Series 2022-R03, Class 1M1,
3.614% (SOFR30A + 2.100%), 3/25/2042 (a)(d) | | | 2,914,838 | | | | 2,914,838 | |
Federal Home Loan Mortgage Corp., Series 2022-DNA1, Class M1A,
2.514% (SOFR30A + 1.000%), 1/27/2042 (a)(d) | | | 975,095 | | | | 951,906 | |
Federal Home Loan Mortgage Corp., Series 2022-DNA3, Class M1A,
3.514% (SOFR30A + 2.000%), 4/25/2042 (a)(d) | | | 464,096 | | | | 462,353 | |
Federal Home Loan Mortgage Corp., Series 2018-HRP1, Class M2,
3.909% (1 Month LIBOR USD + 1.650%), 5/25/2043 (a)(d) | | | 326,238 | | | | 326,544 | |
Federal Home Loan Securities Trust, Series 2016-SC02, Class M2, 3.652%, 10/25/2046 (b) | | | 2,374,901 | | | | 2,313,980 | |
| | | | | | | | |
| | |
TOTAL RESIDENTIAL MORTGAGE-BACKED SECURITIES – U.S. GOVERNMENT AGENCY CREDIT RISK TRANSFER
(Cost – $7,970,002) | | | | | | | $7,887,237 | |
| | | | | | | | |
U.S. Treasury Notes – 1.54% | | | | | | | | |
0.125%, 12/15/2023 | | | 5,000,000 | | | | 4,811,133 | |
0.125%, 2/15/2024 | | | 5,000,000 | | | | 4,789,844 | |
0.750%, 11/15/2024 | | | 3,000,000 | | | | 2,859,140 | |
2.250%, 12/31/2024 | | | 5,000,000 | | | | 4,928,613 | |
| | | | | | | | |
| | |
TOTAL U.S. TREASURY NOTES
(Cost – $18,108,026) | | | | | | | $17,388,730 | |
| | | | | | | | |
Short-Term Investments – 6.45% | | | | | | | | |
U.S. Treasury Bills – 1.05% | | | | | | | | |
2.67%, 12/29/22 (i) | | | 10,000,000 | | | | 9,888,177 | |
2.43%, 11/03/22 (i) | | | 2,000,000 | | | | 1,987,255 | |
| | | | | | | | |
| | |
| | | | | | | 11,875,432 | |
| | | | | | | | |
| | |
| | | Shares | | | | |
Money Market Funds – 5.40% | | | | | | | | |
First American Government Obligations Fund, Class U, 1.459% (j) | | | 61,161,032 | | | | 61,161,032 | |
| | | | | | | | |
| | |
TOTAL SHORT-TERM INVESTMENTS
(Cost – $73,132,080) | | | | | | | $73,036,464 | |
| | | | | | | | |
| | |
TOTAL INVESTMENTS – 100.29%
(Cost – $1,178,490,863) | | | | | | | $1,135,403,686 | |
| | |
Liabilities in Excess of Other Assets – (0.29%) | | | | | | | (3,273,175 | ) |
| | | | | | | | |
| | |
NET ASSETS – 100.00% | | | | | | | $1,132,130,511 | |
| | | | | | | | |
See accompanying notes which are an integral part of these financial statements.
101
Angel Oak UltraShort Income Fund
Schedule of Investments – (continued)
July 31, 2022 (Unaudited)
LIBOR: London Inter-Bank Offered Rate
SOFR30A: Secured Overnight Financing Rate 30 Day Average
TSFR1M: 1 Month Term Secured Overnight Financing Rate
MSOFR1MC: 1 Month Secured Overnight Financing Rate Index
| (a) | Security exempt from registration under Rule 144A or Section 4(a)(2) of the Securities Act of 1933. The security may be resold in transactions exempt from registration, normally to qualified institutional buyers. These securities are determined to be liquid by the Adviser, under the procedures established by the Fund’s Board of Trustees, unless otherwise denoted. At July 31, 2022, the value of these securities amounted to $957,583,326 or 84.58% of net assets. |
| (b) | Variable rate security. The coupon is based on an underlying pool of assets. Rate disclosed is the rate in effect as of July 31, 2022. |
| (c) | Security issued on a when-issued basis. On July 31, 2022, the total value of investments purchased on a when-issued basis was $1,207,030 or 0.11% of net assets. |
| (d) | Variable or floating rate security based on a reference index and spread. Certain securities are fixed to variable and currently in the fixed phase. Rate disclosed is the rate in effect as of July 31, 2022. |
| (e) | Security exempt from registration under Regulation S of the Securities Act of 1933. Such securities are treated as liquid securities according to the Fund’s liquidity guidelines. At July 31, 2022, the value of securities pledged amounted to $1,913,652 or 0.17% of net assets. |
| (f) | Step-up bond that pays an initial coupon rate for the first period and then a higher coupon rate for the following periods. Rate disclosed is the rate in effect as of July 31, 2022. |
| (g) | Illiquid security. At July 31, 2022, the value of these securities amounted to $5,007,745 or 0.44% of net assets. |
| (h) | Interest only security. |
| (i) | Rate disclosed is the effective yield as of July 31, 2022. |
| (j) | Rate disclosed is the seven day yield as of July 31, 2022. |
Schedule of Open Futures Contracts
| | | | | | | | | | | | | | | | |
| Short Futures Contracts | | Expiration
Month | | | Number of
Contracts | | | Notional Value | | | Value &
Unrealized
Appreciation
(Depreciation) | |
2 Year ERIS Aged Standard Swap Future | | | September 2022 | | | | (100 | ) | | | ($9,998,740 | ) | | | $58,734 | |
3 Year ERIS Aged Standard Swap Future | | | September 2022 | | | | (40 | ) | | | (4,261,208 | ) | | | (54,068 | ) |
2 Year ERIS Aged Standard Swap Future | | | March 2023 | | | | (155 | ) | | | (15,171,834 | ) | | | 322,354 | |
3 Year ERIS Aged Standard Swap Future | | | March 2023 | | | | (50 | ) | | | (5,107,045 | ) | | | (17,120 | ) |
2 Year ERIS Aged Standard Swap Future | | | June 2023 | | | | (391 | ) | | | (37,960,391 | ) | | | 1,076,146 | |
2 Year ERIS Aged Standard Swap Future | | | September 2023 | | | | (501 | ) | | | (48,282,723 | ) | | | 1,790,474 | |
4 Year ERIS Aged Standard Swap Future | | | September 2023 | | | | (7 | ) | | | (742,320 | ) | | | 4,906 | |
2 Year ERIS Aged Standard Swap Future | | | December 2023 | | | | (125 | ) | | | (12,018,888 | ) | | | 481,925 | |
2 Year ERIS Aged Standard Swap Future | | | March 2024 | | | | (102 | ) | | | (9,733,687 | ) | | | 288,068 | |
2 Year ERIS Aged Standard Swap Future | | | September 2024 | | | | (265 | ) | | | (26,029,652 | ) | | | (121,529 | ) |
3 Year ERIS Aged Standard Swap Future | | | September 2024 | | | | (34 | ) | | | (3,191,974 | ) | | | 171,187 | |
3 Year ERIS Aged Standard Swap Future | | | September 2025 | | | | (397 | ) | | | (38,933,393 | ) | | | (366,425 | ) |
4 Year ERIS Aged Standard Swap Future | | | September 2026 | | | | (55 | ) | | | (5,334,180 | ) | | | (60,148 | ) |
| | | | | | | | | | | | | | | | |
Total | | | | | | | | | | | | | | | $3,574,504 | |
| | | | | | | | | | | | | | | | |
See accompanying notes which are an integral part of these financial statements.
102
Angel Oak Core Impact Fund
Schedule of Investments
July 31, 2022 (Unaudited)
| | | | | | | | |
| | | Principal
Amount | | | Value | |
Asset-Backed Securities – 27.77% | | | | | | | | |
Foundation Finance Trust, Series 2021-1A, Class B, 1.870%, 5/15/2041 (a) | | | $596,000 | | | | $536,890 | |
Foundation Finance Trust, Series 2021-2A, Class D, 5.730%, 1/15/2042 (a) | | | 500,000 | | | | 467,841 | |
Goldman Home Improvement Trust, Series 2021-GRN2, Class D, 4.000%, 6/25/2051 (a) | | | 500,000 | | | | 452,734 | |
Goldman Home Improvement Trust, Series 2021-GRN2, Class A, 1.150%, 6/26/2051 (a) | | | 288,172 | | | | 272,338 | |
GoodLeap Sustainable Home Solutions Trust, Series 2021-3CS, Class A, 2.100%, 5/20/2048 (a) | | | 430,657 | | | | 378,268 | |
GoodLeap Sustainable Home Solutions Trust, Series 2021-4GS, Class A, 1.930%, 7/20/2048 (a) | | | 872,062 | | | | 757,171 | |
Helios Issuer LLC, Series 2021-B, Class A, 1.620%, 7/20/2048 (a) | | | 900,419 | | | | 783,318 | |
Loanpal Solar Loan Ltd., Series 2021-1GS, Class A, 2.290%, 1/20/2048 (a) | | | 360,272 | | | | 317,844 | |
Marlette Funding Trust, Series 2019-4A, Class C, 3.760%, 12/15/2029 (a) | | | 959,222 | | | | 945,269 | |
Marlette Funding Trust, Series 2020-1A, Class D, 3.540%, 3/15/2030 (a) | | | 893,000 | | | | 876,497 | |
Marlette Funding Trust, Series 2021-1A, Class D, 2.470%, 6/16/2031 (a) | | | 242,000 | | | | 223,175 | |
Mercury Financial Credit Card Master Trust, Series 2021-1A, Class A, 1.540%, 3/20/2026 (a) | | | 400,000 | | | | 379,612 | |
Mission Lane Credit Card Master Trust, Series 2021-A, Class A, 1.590%, 9/15/2026 (a) | | | 1,500,000 | | | | 1,452,388 | |
Mosaic Solar Loan Trust, Series 2021-2A, Class B, 2.090%, 4/22/2047 (a) | | | 417,868 | | | | 363,753 | |
Mosaic Solar Loans LLC, Series 2017-2A, Class A, 3.820%, 6/22/2043 (a) | | | 67,728 | | | | 64,293 | |
Tesla Auto Lease Trust, Series 2020-A, Class E, 4.640%, 8/20/2024 (a) | | | 300,000 | | | | 297,983 | |
Tesla Auto Lease Trust, Series 2021-A, Class E, 2.640%, 3/20/2025 (a) | | | 500,000 | | | | 470,006 | |
Tricolor Auto Securitization Trust, Series 2021-1A, Class C, 1.330%, 9/16/2024 (a) | | | 1,000,000 | | | | 978,573 | |
Tricolor Auto Securitization Trust, Series 2022-1A, Class F, 9.800%, 7/16/2029 (a) | | | 200,000 | | | | 199,502 | |
| | | | | | | | |
| | |
TOTAL ASSET-BACKED SECURITIES
(Cost – $10,967,763) | | | | | | | $10,217,455 | |
| | | | | | | | |
Commercial Mortgage-Backed Securities – 8.96% | | | | | | | | |
BX Commercial Mortgage Trust, Series 2021-VOLT, Class F,
4.399% (1 Month LIBOR USD + 2.400%), 9/15/2036 (a)(b) | | | 1,000,000 | | | | 944,196 | |
Greystone CRE Notes Ltd., Series 2021-HC2, Class C,
5.323% (TSFR1M + 3.364%), 12/15/2039 (a)(b)(c) | | | 250,000 | | | | 240,046 | |
JP Morgan Chase Commercial Mortgage Securities Trust, Series 2021-NYAH, Class H,
5.389% (1 Month LIBOR USD + 3.390%), 6/15/2038 (a)(b) | | | 300,000 | | | | 270,867 | |
Med Trust, Series 2021-MDLN, Class D,
4.000% (1 Month LIBOR USD + 2.000%), 11/15/2038 (a)(b) | | | 1,000,000 | | | | 926,500 | |
SLG Office Trust, Series 2021-OVA, Class A, 2.585%, 7/17/2041 (a) | | | 500,000 | | | | 441,085 | |
X-Caliber Funding LLC, 5.000%, 10/15/2024 (a) | | | 500,000 | | | | 473,164 | |
| | | | | | | | |
| | |
TOTAL COMMERCIAL MORTGAGE-BACKED SECURITIES
(Cost – $3,502,752) | | | | | | | $3,295,858 | |
| | | | | | | | |
Commercial Mortgage-Backed Securities – U.S. Government Agency – 18.33% | | | | | | | | |
Federal Home Loan Mortgage Corp., Series 2019-KF58, Class B,
3.937% (1 Month LIBOR USD + 2.150%), 1/25/2026 (a)(b) | | | 253,287 | | | | 240,232 | |
Federal Home Loan Mortgage Corp., Series K-G02, Class A1, 2.044%, 11/25/2028 | | | 401,795 | | | | 384,950 | |
Federal Home Loan Mortgage Corp., Series 2021-P009, Class A1, 1.132%, 11/25/2029 | | | 478,461 | | | | 430,471 | |
Federal Home Loan Mortgage Corp., Series K-SG1, Class A2, 1.503%, 9/25/2030 | | | 1,010,000 | | | | 882,359 | |
Federal Home Loan Mortgage Corp., Series K-G04, Class A2, 1.487%, 11/25/2030 | | | 1,066,000 | | | | 917,078 | |
Federal Home Loan Mortgage Corp., Series 2021-P009, Class A2, 1.878%, 1/25/2031 | | | 500,000 | | | | 462,072 | |
Federal Home Loan Mortgage Corp., Series K-G05, Class A2, 2.000%, 1/25/2031 | | | 250,000 | | | | 226,487 | |
Federal Home Loan Mortgage Corp., Series K-SG3, 2.650%, 5/25/2032 (d) | | | 200,000 | | | | 189,244 | |
Federal National Mortgage Association, Series 2021-M1G, Class A2, 1.466%, 11/25/2030 (d) | | | 1,500,000 | | | | 1,304,067 | |
See accompanying notes which are an integral part of these financial statements.
103
Angel Oak Core Impact Fund
Schedule of Investments – (continued)
July 31, 2022 (Unaudited)
| | | | | | | | |
| | | Principal
Amount | | | Value | |
Commercial Mortgage-Backed Securities – U.S. Government Agency – (continued) | | | | | | | | |
Federal National Mortgage Association, Series 2021-M3G, Class A2, 1.250%, 1/25/2031 (d) | | $ | 2,000,000 | | | $ | 1,706,288 | |
| | | | | | | | |
| | |
TOTAL COMMERCIAL MORTGAGE-BACKED SECURITIES – U.S. GOVERNMENT AGENCY
(Cost – $7,597,109) | | | | | | $ | 6,743,248 | |
| | | | | | | | |
Corporate Obligations – 23.19% | | | | | | | | |
Basic Materials – 1.96% | | | | | | | | |
Compass Minerals International, Inc., 6.750%, 12/1/2027 (a) | | | 750,000 | | | | 721,980 | |
| | | | | | | | |
Consumer, Cyclical – 6.08% | | | | | | | | |
American Axle & Manufacturing, Inc., 5.000%, 10/1/2029 | | | 1,000,000 | | | | 876,415 | |
Ford Motor Co., 3.250%, 2/12/2032 | | | 300,000 | | | | 250,947 | |
Ford Motor Credit Co. LLC, 3.625%, 6/17/2031 | | | 500,000 | | | | 425,240 | |
Suburban Propane Partners LP / Suburban Energy Finance Corp., 5.000%, 6/1/2031 (a) | | | 750,000 | | | | 684,624 | |
| | | | | | | | |
| | |
| | | | | | | 2,237,226 | |
| | | | | | | | |
Energy – 2.88% | | | | | | | | |
New Fortress Energy, Inc., 6.750%, 9/15/2025 (a) | | | 625,000 | | | | 610,978 | |
Venture Global Calcasieu Pass LLC, 4.125%, 8/15/2031 (a) | | | 250,000 | | | | 231,017 | |
Venture Global Calcasieu Pass LLC, 3.875%, 11/1/2033 (a) | | | 250,000 | | | | 217,574 | |
| | | | | | | | |
| | |
| | | | | | | 1,059,569 | |
| | | | | | | | |
Financial – 10.60% | | | | | | | | |
Amalgamated Financial Corp., 3.250% (TSFR3M + 2.300%), 11/15/2031 (b) | | | 400,000 | | | | 371,654 | |
Congressional Bancshares, Inc., 4.000% (TSFR3M + 2.890%), 1/1/2032 (a)(b) | | | 500,000 | | | | 477,040 | |
Dime Community Bancshares, Inc., 5.000% (TSFR3M + 2.180%), 5/15/2032 (b) | | | 500,000 | | | | 496,355 | |
HAT Holdings I LLC / HAT Holdings II LLC, 3.375%, 6/15/2026 (a) | | | 1,000,000 | | | | 877,800 | |
Mercantile Bank Corp., 3.250% (SOFR + 2.120%), 1/30/2032 (b) | | | 500,000 | | | | 461,998 | |
OneMain Finance Corp., 3.500%, 1/15/2027 | | | 300,000 | | | | 255,725 | |
Preferred Bank, 3.375% (TSFR3M + 2.780%), 6/15/2031 (b) | | | 250,000 | | | | 229,792 | |
Renasant Corp., 3.000% (TSFR3M + 1.910%), 12/1/2031 (b) | | | 300,000 | | | | 274,956 | |
Starwood Property Trust, Inc., 3.625%, 7/15/2026 (a) | | | 500,000 | | | | 452,005 | |
| | | | | | | | |
| | |
| | | | | | | 3,897,325 | |
| | | | | | | | |
Industrial – 1.67% | | | | | | | | |
Covanta Holding Corp., 4.875%, 12/1/2029 (a) | | | 250,000 | | | | 223,216 | |
Seaspan Corp., 5.500%, 8/1/2029 (a) | | | 500,000 | | | | 392,560 | |
| | | | | | | | |
| | |
| | | | | | | 615,776 | |
| | | | | | | | |
| | |
TOTAL CORPORATE OBLIGATIONS
(Cost – $9,406,842) | | | | | | $ | 8,531,876 | |
| | | | | | | | |
Residential Mortgage-Backed Securities – 9.63% | | | | | | | | |
Deephaven Residential Mortgage Trust, Series 2021-2, Class M1, 2.217%, 4/25/2066 (a)(d) | | | 100,000 | | | | 83,661 | |
Ellington Financial Mortgage Trust, Series 2021-2, Class M1, 2.296%, 6/25/2066 (a)(d) | | | 139,000 | | | | 112,954 | |
Imperial Fund Mortgage Trust, Series 2021-NQM1, Class A3, 1.617%, 6/25/2056 (a)(d) | | | 307,344 | | | | 291,304 | |
LHOME Mortgage Trust, Series 2020-RTL1, Class A1, 3.228%, 10/25/2024 (a) | | | 95,719 | | | | 95,396 | |
MFA Trust, Series 2021-RPL1, Class A2, 2.072%, 7/25/2060 (a)(d) | | | 500,000 | | | | 437,181 | |
MFA Trust, Series 2021-RPL1, Class M2, 2.855%, 7/25/2060 (a)(d) | | | 500,000 | | | | 429,702 | |
See accompanying notes which are an integral part of these financial statements.
104
Angel Oak Core Impact Fund
Schedule of Investments – (continued)
July 31, 2022 (Unaudited)
| | | | | | | | |
| | | Principal
Amount | | | Value | |
Residential Mortgage-Backed Securities – (continued) | | | | | | | | |
Oaktown Re Ltd., Series 2018-1A, Class M1,
3.809% (1 Month LIBOR USD + 1.550%), 7/25/2028 (a)(b) | | $ | 330,485 | | | $ | 302,736 | |
PRPM LLC, Series 2021-RPL1, Class M1, 2.680%, 7/25/2051 (a)(d) | | | 1,000,000 | | | | 897,005 | |
SG Residential Mortgage Trust, Series 2019-3, Class A1, 2.703%, 9/25/2059 (a)(d) | | | 154,004 | | | | 152,508 | |
Towd Point Mortgage Trust, Series 2020-4, Class M1, 2.875%, 10/25/2060 (a) | | | 565,000 | | | | 540,130 | |
Verus Securitization Trust, Series 2021-5, Class M1, 2.331%, 9/25/2066 (a)(d) | | | 250,000 | | | | 199,815 | |
| | | | | | | | |
| | |
TOTAL RESIDENTIAL MORTGAGE-BACKED SECURITIES
(Cost – $3,875,746) | | | | | | | $3,542,392 | |
| | | | | | | | |
Residential Mortgage-Backed Securities – U.S. Government Agency – 8.69% | | | | | | | | |
Federal Home Loan Mortgage Corp., 2.000%, 6/1/2036 | | | 424,607 | | | | 404,635 | |
Federal Home Loan Mortgage Corp., 5.000%, 7/1/2052 | | | 400,000 | | | | 411,841 | |
Federal National Mortgage Association, 4.000%, 4/1/2042 | | | 569,619 | | | | 586,926 | |
Federal National Mortgage Association, 4.500%, 7/1/2052 | | | 399,247 | | | | 406,980 | |
Government National Mortgage Association, 2.500%, 4/20/2051 | | | 271,717 | | | | 258,002 | |
Government National Mortgage Association, 2.000%, 5/20/2036 | | | 248,411 | | | | 235,807 | |
Government National Mortgage Association, 2.500%, 2/20/2051 | | | 243,387 | | | | 231,711 | |
Government National Mortgage Association, 2.500%, 4/20/2051 | | | 265,622 | | | | 252,879 | |
Government National Mortgage Association, 2.500%, 4/20/2051 | | | 266,044 | | | | 253,614 | |
Government National Mortgage Association, 2.500%, 4/20/2051 | | | 161,270 | | | | 153,130 | |
| | | | | | | | |
| | |
TOTAL RESIDENTIAL MORTGAGE-BACKED SECURITIES – U.S. GOVERNMENT AGENCY
(Cost – $3,331,624) | | | | | | | $3,195,525 | |
| | | | | | | | |
| | |
Short-Term Investments – 1.36% | | | Shares | | | | | |
Money Market Funds – 1.36% | | | | | | | | |
First American Government Obligations Fund, Class U, 1.459% (e) | | | 499,206 | | | | 499,206 | |
| | | | | | | | |
| | |
TOTAL SHORT-TERM INVESTMENTS
(Cost – $499,206) | | | | | | | $499,206 | |
| | | | | | | | |
| | |
TOTAL INVESTMENTS – 97.93%
(Cost – $39,181,042) | | | | | | | $36,025,560 | |
| | |
Other Assets in Excess of Liabilities – 2.07% | | | | | | | 763,021 | |
| | | | | | | | |
| | |
NET ASSETS – 100.00% | | | | | | | $36,788,581 | |
| | | | | | | | |
LIBOR: London Inter-Bank Offered Rate
SOFR: Secured Overnight Financing Rate
TSFR1M: 1 Month Term Secured Overnight Financing Rate
TSFR3M: 3 Month Term Secured Overnight Financing Rate
| (a) | Security exempt from registration under Rule 144A or Section 4(a)(2) of the Securities Act of 1933. The security may be resold in transactions exempt from registration, normally to qualified institutional buyers. These securities are determined to be liquid by the Adviser, under the procedures established by the Fund’s Board of Trustees, unless otherwise denoted. At July 31, 2022, the value of these securities amounted to $22,184,731 or 60.30% of net assets. |
| (b) | Variable or floating rate security based on a reference index and spread. Certain securities are fixed to variable and currently in the fixed phase. Rate disclosed is the rate in effect as of July 31, 2022. |
See accompanying notes which are an integral part of these financial statements.
105
Angel Oak Core Impact Fund
Schedule of Investments – (continued)
July 31, 2022 (Unaudited)
| (c) | Illiquid security. At July 31, 2022, the value of these securities amounted to $240,046 or 0.65% of net assets. |
| (d) | Variable rate security. The coupon is based on an underlying pool of assets. Rate disclosed is the rate in effect as of July 31, 2022. |
| (e) | Rate disclosed is the seven day yield as of July 31, 2022. |
Schedule of Open Futures Contracts
| | | | | | | | | | | | | | |
| Long Futures Contracts | | Expiration Month | | Number of
Contracts | | | Notional Value | | | Value &
Unrealized
Appreciation
(Depreciation) | |
10-Year U.S. Treasury Note Future | | September 2022 | | | 82 | | | $ | 9,933,531 | | | $ | 150,557 | |
See accompanying notes which are an integral part of these financial statements.
106
Angel Oak Funds Trust
Notes to the Financial Statements
July 31, 2022 (Unaudited)
NOTE 1. ORGANIZATION
Angel Oak Funds Trust (the “Trust”) is a Delaware statutory trust organized on June 20, 2014, and registered with the U.S. Securities and Exchange Commission as an open-end management investment company, as defined in the Investment Company Act of 1940 as amended (the “1940 Act”). The Trust consists of five series, Angel Oak Multi-Strategy Income Fund (the “Multi- Strategy Income Fund”), Angel Oak Financials Income Fund (the “Financials Income Fund”), Angel Oak High Yield Opportunities Fund (the “High Yield Opportunities Fund”), Angel Oak UltraShort Income Fund (the “UltraShort Income Fund”), and Angel Oak Core Impact Fund (the “Core Impact Fund”) (together, the “Funds”). Please see the table below for a summary of class specific information:
| | | | | | | | | | | | | | | | | | | | | | |
| | | Ticker | | | Investment
Objective | | | Commencement of
Operations | | Front-End
Sales Charge | | | Back-End
Sales Charge | | | 12b-1 Fees | |
Multi-Strategy Income Fund | | | | | | | | | | | |
Class A | | | ANGIX | | | | Current Income | | | 06/28/2011 | | | 2.25 | % | | | N/A | | | | 0.25 | % |
Class C | | | ANGCX | | | 08/04/2015 | | | N/A | | | | 1.00 | % | | | 1.00 | % |
Institutional Class | | | ANGIX | | | 08/16/2012 | | | N/A | | | | N/A | | | | N/A | |
Financials Income Fund | | | | | | | | | | | |
Class A | | | ANFLX | | |
| Current Income & Capital
Appreciation |
| | 11/03/2014 | | | 2.25 | % | | | N/A | | | | 0.25 | % |
Class C | | | AFLCX | | | 08/04/2015 | | | N/A | | | | 1.00 | % | | | 1.00 | % |
Institutional Class | | | ANFIX | | | 11/03/2014 | | | N/A | | | | N/A | | | | N/A | |
High Yield Opportunities Fund | | | | | | | | | | | |
Class A | | | ANHAX | | |
| Current Income & Capital
Appreciation |
| | 07/31/2012 | | | 2.25 | % | | | N/A | | | | 0.25 | % |
Class C | | | ANHCX | | | N/A | | | N/A | | | | 1.00 | % | | | 1.00 | % |
Institutional Class | | | ANHIX | | | 03/31/2009 | | | N/A | | | | N/A | | | | N/A | |
UltraShort Income Fund | | | | | | | | | | | |
Class A | | | AOUAX | | |
| Current Income, Minimize
Price Volatility, and
Maintain Liquidity |
| | 04/30/2018 | | | N/A | | | | N/A | | | | 0.25 | % |
Class A1 | | | AOUNX | | | 07/12/2022 | | | 1.50 | % | | | 0.50 | % | | | 0.25 | % |
Institutional Class | | | AOUIX | | | 04/02/2018 | | | N/A | | | | N/A | | | | N/A | |
Core Impact Fund | | | | | | | | | | | |
Class A | | | AOIMX | | |
| Total Return While Giving
Special Consideration to
Positive Aggregate ESG
Outcomes |
| | N/A | | | 2.25 | % | | | N/A | | | | 0.25 | % |
Class C | | | AOICX | | | N/A | | | N/A | | | | 1.00 | % | | | 1.00 | % |
Institutional Class | | | AOIIX | | | 06/04/2021 | | | N/A | | | | N/A | | | | N/A | |
The Multi-Strategy Income Fund, Financials Income Fund, High Yield Opportunities Fund, and UltraShort Income Fund are diversified series of the Trust. The Core Impact Fund is a non-diversified series of the Trust, which means that it can invest a higher percentage of assets in any one issuer. Investing in a non-diversified fund may entail greater risks than is normally associated with more widely diversified funds.
The Financials Income Fund commenced operations on November 3, 2014, under the name “Angel Oak Flexible Income Fund.” On March 16, 2016, shareholders approved a change to the Fund’s fundamental investment policy on the concentration of investments. On December 16, 2018, the Fund’s name was changed to “Angel Oak Financials Income Fund,” and the Fund adopted a new investment policy pursuant to Rule 35d-1 under the 1940 Act and made certain other changes to the Fund’s investment strategies. As a result, the Fund’s performance during periods prior to these dates may have differed had the Fund’s current investment policies and strategies been in place at those times.
Wholly-Owned Subsidiaries – As part of its investment strategy, the Multi-Strategy Income Fund invests directly or, to comply with certain regulations, through its wholly owned and controlled subsidiaries, Hyperion Loan Funding Trust (“Hyperion”) and Titan Loan Funding Trust (“Titan”), each a statutory trust organized under the laws of the state of Delaware and incorporated on August 2, 2018. Hyperion and Titan act as investment vehicles in order to purchase residential and commercial real estate whole loans, participations in such loans, or instruments representing the right to receive interest payments and principal due on such loans. The allocation of the Multi-Strategy Income Fund’s investments, if any, in Hyperion or Titan will vary over time and might not include all of the types of investments described below.
107
Angel Oak Funds Trust
Notes to the Financial Statements - (continued)
July 31, 2022 (Unaudited)
NOTE 1. ORGANIZATION – (continued)
On July 31, 2022, investments in Hyperion and Titan represented 0.38% and 0.00% of the total net assets of the Multi-Strategy Income Fund, respectively.
The consolidated financial statements of the Multi-Strategy Income Fund include the investment activity and financial statements of Hyperion and Titan. All intercompany accounts and transactions have been eliminated in consolidation. Because the Multi-Strategy Income Fund may invest a substantial portion of its assets in its respective subsidiaries, the Multi-Strategy Income Fund may be considered to be investing indirectly in some of those investments through its subsidiary. For that reason, references to the Multi-Strategy Income Fund may also encompass its subsidiaries.
At July 31, 2022, investments held by Hyperion and Titan included whole loans, valued at $19,369,213 and $–, respectively. In addition, Hyperion and Titan held $597,481 and $1,000 in cash, respectively.
NOTE 2. SIGNIFICANT ACCOUNTING POLICIES
The following is a summary of significant accounting policies consistently followed by the Funds in the preparation of their financial statements in accordance with the accounting principles generally accepted in the United States of America (“GAAP”). The Funds follow the investment company accounting and reporting guidance of the Financial Accounting Standards Board (“FASB”) Accounting Codification Topic 946 “Financial Services-Investment Companies”.
Securities Valuation and Fair Value Measurements: The Funds record their investments at fair value and in accordance with fair valuation accounting standards. The Funds have adopted fair valuation accounting standards which establish an authoritative definition of fair value and set out a hierarchy for measuring fair value. These standards require additional disclosures about the various inputs and valuation techniques used to develop the measurements of fair value and a discussion of changes in valuation techniques and related inputs, if any, during the period. In addition, these standards require expanded disclosure for each major category of assets. These inputs are summarized in the three broad levels listed below:
| | • | | Level 1: quoted prices in active markets for identical securities |
| | • | | Level 2: other significant observable inputs (including, but not limited to, quoted prices for similar securities, interest rates, prepayment speeds, credit risk, etc.) |
| | • | | Level 3: significant unobservable inputs (including the Funds’ own assumptions in determining fair value of investments based on the best information available) |
The inputs or methodology used for valuing securities are not an indication of the risks associated with investing in those securities.
Investments in registered open-end management investment companies, including money market funds, will be valued based upon the net asset value (“NAV”) of such investments and are categorized as Level 1 of the fair value hierarchy.
Fair values for long-term debt securities, including asset-backed securities (“ABS”), collateralized loan obligations (“CLO”), collateralized mortgage obligations (“CMO”), corporate obligations, whole loans, and mortgage-backed securities (“MBS”) are normally determined on the basis of valuations provided by independent pricing services. Vendors typically value such securities based on one or more inputs, including but not limited to, benchmark yields, transactions, bids, offers, quotations from dealers and trading systems, new issues, spreads and other relationships observed in the markets among comparable securities; and pricing models such as yield measurers calculated using factors such as cash flows, financial or collateral performance and other reference data. In addition to these inputs, MBS and ABS may utilize cash flows, prepayment information, default rates, delinquency and loss assumptions, collateral characteristics, credit enhancements and specific deal information. Securities that use similar valuation techniques and inputs are categorized as Level 2 of the fair value hierarchy. To the extent the significant inputs are unobservable; the values generally would be categorized as Level 3.
Equity securities, including preferred stocks, that are traded on a national securities exchange, except those listed on the Nasdaq Global Market®, Nasdaq Global Select Market® and the Nasdaq Capital Market® exchanges (collectively, “Nasdaq”), are
108
Angel Oak Funds Trust
Notes to the Financial Statements - (continued)
July 31, 2022 (Unaudited)
NOTE 2. SIGNIFICANT ACCOUNTING POLICIES – (continued)
valued at the last sale price at the close of that exchange. Securities traded on Nasdaq will be valued at the Nasdaq Official Closing Price (“NOCP”). If, on a particular day, an exchange-listed or Nasdaq security does not trade, then: (i) the security shall be valued at the mean between the most recent quoted bid and asked prices at the close of the exchange; or (ii) the security shall be valued at the latest sales price on the Composite Market (defined below) for the day such security is being valued. “Composite Market” means a consolidation of the trade information provided by national securities and foreign exchanges and over-the-counter markets (“OTC”) as published by a pricing service. In the event market quotations or Composite Market pricing are not readily available, fair value will be determined in accordance with the procedures adopted by the Board of Trustees (“Board”). All equity securities that are not traded on a listed exchange are valued at the last sale price at the close of the over- the counter market. If a non-exchange listed security does not trade on a particular day, then the mean between the last quoted bid and asked price will be used as long as it continues to reflect the value of the security. If the mean is not available, then bid price can be used as long as the bid price continues to reflect the value of the security. Otherwise, fair value will be determined in accordance with the procedures adopted by the Board. These securities will generally be categorized as Level 3 securities. When using the market quotations or close prices provided by the pricing service and when the market is considered active, the security will be classified as a Level 1 security. Sometimes, an equity security owned by the Funds will be valued by the pricing service with factors other than market quotations or when the market is considered inactive. When this happens, the security will be classified as a Level 2 security.
Short term debt securities having a maturity of 60 days or less are generally valued at amortized cost, which approximates fair market value. These investments are categorized as Level 2 of the fair value hierarchy. Reverse repurchase agreements and repurchase agreements are priced at their acquisition cost, and assessed for credit adjustments, which represents fair value. These securities will generally be categorized as Level 2 securities.
Financial derivative instruments, such as futures contracts, that are traded on a national securities or commodities exchange are typically valued at the settlement price determined by the relevant exchange. Swaps, such as credit default swaps, interest-rate swaps and currency swaps, are valued by a pricing service. To the extent these securities are actively traded and valuation adjustments are not applied, they are categorized as Level 1 of the fair value hierarchy. Over-the-counter financial derivative instruments, such as certain futures contracts or swap agreements, derive their values from underlying asset prices, indices, reference rates, other inputs or a combination of these factors. These instruments are normally valued on the basis of evaluations provided by independent pricing services or broker dealer quotations. Derivatives that use similar valuation techniques as described above are typically categorized as Level 2 of the fair value hierarchy.
Securities may be fair valued in accordance with the fair valuation procedures approved by the Board. The Valuation and Risk Management Oversight Committee is generally responsible for overseeing the Funds’ valuation processes and reports quarterly to the Board. The Valuation and Risk Management Oversight Committee has delegated to the Valuation Committee of the Valuation Designee the day-to-day responsibilities for making all necessary determinations of the fair value of portfolio securities and other assets for which market quotations are not readily available or if the prices obtained from independent pricing services are deemed to be unreliable indicators of market or fair value. Representatives of the Valuation Designee’s Valuation Committee report quarterly to the Valuation and Risk Management Oversight Committee.
109
Angel Oak Funds Trust
Notes to the Financial Statements - (continued)
July 31, 2022 (Unaudited)
NOTE 2. SIGNIFICANT ACCOUNTING POLICIES – (continued)
The following is a summary of the investments by their inputs used to value each Fund’s net assets as of July 31, 2022:
| | | | | | | | | | | | | | |
| Multi-Strategy Income Fund | |
| | | Level 1 | | | Level 2 | | | Level 3 | | Total | |
Assets | | | | | | | | | | | | | | |
Asset-Backed Securities | | | $– | | | | $561,697,630 | | | $– | | | $561,697,630 | |
Collateralized Debt Obligations | | | – | | | | 17,969,573 | | | – | | | 17,969,573 | |
Collateralized Loan Obligations | | | – | | | | 181,669,981 | | | – | | | 181,669,981 | |
Commercial Mortgage-Backed Securities | | | – | | | | 122,790,727 | | | – | | | 122,790,727 | |
Commercial Mortgage-Backed Securities – U.S. Government Agency | | | – | | | | 240,589,971 | | | – | | | 240,589,971 | |
Common Stocks | | | 28,740,603 | | | | – | | | – | | | 28,740,603 | |
Corporate Obligations | | | – | | | | 245,439,819 | | | 1,312,200 | | | 246,752,019 | |
Investment Companies | | | 116,349,483 | | | | – | | | – | | | 116,349,483 | |
Preferred Stocks | | | 17,216,687 | | | | – | | | – | | | 17,216,687 | |
Residential Mortgage-Backed Securities | | | – | | | | 3,582,947,679 | | | 45,010,001 | | | 3,627,957,680 | |
Residential Mortgage-Backed Securities – U.S. Government Agency Credit Risk Transfer | | | – | | | | 51,827,422 | | | – | | | 51,827,422 | |
U.S. Treasury Notes | | | – | | | | 144,774,922 | | | – | | | 144,774,922 | |
Whole Loans | | | – | | | | 19,369,213 | | | – | | | 19,369,213 | |
Short-Term Investments | | | 187,379,929 | | | | – | | | – | | | 187,379,929 | |
Total | | | $349,686,702 | | | | $5,169,076,937 | | | $46,322,201 | | | $5,565,085,840 | |
Other Financial Instruments | | | | | | | | | | | | | | |
Assets | | | | | | | | | | | | | | |
Futures Contracts* | | | $16,851,090 | | | | $– | | | $– | | | $16,851,090 | |
Liabilities | | | | | | | | | | | | | | |
Futures Contracts* | | | 7,004,440 | | | | – | | | – | | | 7,004,440 | |
Reverse Repurchase Agreements | | | – | | | | 250,000,049 | | | – | | | 250,000,049 | |
Total | | $ | 9,846,650 | | | ($ | 250,000,049 | ) | | $– | | ($ | 240,153,399 | ) |
| * | Futures and swaps are reflected at the unrealized appreciation (depreciation) on the instrument as presented in the Consolidated Schedule of Investments. |
See the Consolidated Schedule of Investments for further disaggregation of investment categories. During the period ended July 31, 2022, the Fund recognized $1,964,873 of transfers from Level 3 to Level 2 due to an increase in relevant market activity. See the summary of quantitative information about Level 3 Fair Value Measurements for more information.
The following is a reconciliation of investments in which significant unobservable inputs (Level 3) were used in determining fair value:
| | | | | | | | | | | | | | | | | | |
Multi-Strategy
Income Fund | | Balance as of
01/31/22 | | Amortization/
Accretion/
Paydowns | | Net Realized
Gain (Loss) | | Change in Net
Unrealized
Appreciation
(Depreciation) | | Purchases | | Sales | | Transfers Into
Level 3 | | Transfers
Out of
Level 3 | | Balance as of
07/31/22 |
Corporate Obligations | | $1,312,200 | | $– | | $– | | $– | | $– | | $– | | $– | | $– | | $1,312,200 |
Residential Mortgage- Backed Securities | | $47,155,113 | | $137,928 | | $– | | ($318,167) | | $– | | $– | | $– | | ($1,964,873) | | $45,010,001 |
The total change in unrealized appreciation (depreciation) included in the Consolidated Statement of Operations attributable to Level 3 investments still held at July 31, 2022 is $110,075.
110
Angel Oak Funds Trust
Notes to the Financial Statements - (continued)
July 31, 2022 (Unaudited)
NOTE 2. SIGNIFICANT ACCOUNTING POLICIES – (continued)
The following is a summary of quantitative information about Level 3 Fair Value Measurements:
| | | | | | | | | | |
| Multi-Strategy Income Fund | | Fair Value as of
07/31/22 | | Valuation Techniques | | Unobservable Input | | Range | | Weighted Average
Unobservable Input |
| Corporate Obligations | | $1,312,200 | | Consensus
Pricing | | Third party | | $9.72* | | N/A |
| Residential Mortgage-Backed Securities | | $45,000,000 | | Model
Valuation | | Value of the
collateral of
underlying
loans | | $100.00* | | N/A |
| Residential Mortgage-Backed Securities | | $10,001 | | Model
Valuation | | Value of the
call rights and
value of the
collateral of
the deal | | $0.10-$1.00 | | $1.00 |
| * | Each input presents information for one security and reflects the value as of July 31, 2022. |
| | | | | | | | | | | | | | | | |
| Financials Income Fund | |
| | | Level 1 | | | Level 2 | | | Level 3 | | | Total | |
Assets | | | | | | | | | | | | | | | | |
Collateralized Debt Obligations | | | $– | | | | $6,141,638 | | | | $– | | | | $6,141,638 | |
Common Stocks | | | 6,031,706 | | | | – | | | | – | | | | 6,031,706 | |
Corporate Obligations | | | – | | | | 131,921,980 | | | | – | | | | 131,921,980 | |
Preferred Stocks | | | 3,212,580 | | | | – | | | | – | | | | 3,212,580 | |
Short-Term Investments | | | 7,708,721 | | | | – | | | | – | | | | 7,708,721 | |
Total | | | $16,953,007 | | | | $138,063,618 | | | | $– | | | | $155,016,625 | |
See the Schedule of Investments for further disaggregation of investment categories. During the period ended July 31, 2022, the Fund did not recognize any transfers to or from Level 3.
| | | | | | | | | | | | | | | | |
| High Yield Opportunities Fund | |
| | | Level 1 | | | Level 2 | | | Level 3 | | | Total | |
Assets | | | | | | | | | | | | | | | | |
Common Stocks | | | $– | | | | $– | | | | $74,080 | | | | $74,080 | |
Corporate Obligations | | | – | | | | 64,237,514 | | | | – | | | | 64,237,514 | |
Short-Term Investments | | | 2,615,887 | | | | – | | | | – | | | | 2,615,887 | |
Total | | | $2,615,887 | | | | $64,237,514 | | | | $74,080 | | | | $66,927,481 | |
See the Schedule of Investments for further disaggregation of investment categories. For the period ended July 31, 2022, the High Yield Opportunities Fund did not recognize any transfers to or from Level 3. See the summary of quantitative information about Level 3 Fair Value Measurements for more information.
The following is a reconciliation of investments in which significant unobservable inputs (Level 3) were used in determining fair value:
| | | | | | | | | | | | | | | | | | |
High Yield Opportunities
Fund | | Balance as of
01/31/22 | | Amortization/
Accretion | | Net Realized
Gain (Loss) | | Change in Net
Unrealized
Appreciation
(Depreciation) | | Purchases | | Sales | | Transfers
Into
Level 3 | | Transfers
Out of
Level 3 | | Balance
as of
07/31/22 |
| Common Stocks | | $27,780 | | $– | | $– | | $46,300 | | $– | | $– | | $– | | $– | | $74,080 |
The total change in unrealized appreciation (depreciation) included in the Statements of Operations attributable to Level 3 investments still held at July 31, 2022 is $46,300.
111
Angel Oak Funds Trust
Notes to the Financial Statements - (continued)
July 31, 2022 (Unaudited)
NOTE 2. SIGNIFICANT ACCOUNTING POLICIES – (continued)
The following is a summary of quantitative information about Level 3 Fair Value Measurements:
| | | | | | | | |
| High Yield Opportunities Fund | | Fair
Value as
of
07/31/22 | | Valuation
Techniques | | Unobservable
Input | | Range/
Weighted
Average
Unobservable
Input* |
| Common Stocks | | $74,080 | | Broker Quote | | Third party | | $16.00 |
| * | Table presents information for one security, which is valued at $16.00 as of July 31, 2022. |
| | | | | | | | | | | | | | | | |
| UltraShort Income Fund | |
| | | Level 1 | | | Level 2 | | | Level 3 | | | Total | |
Assets | | | | | | | | | | | | | | | | |
Asset-Backed Securities | | | $– | | | | $465,470,646 | | | | $– | | | | $465,470,646 | |
Collateralized Loan Obligations | | | – | | | | 106,190,293 | | | | – | | | | 106,190,293 | |
Commercial Mortgage-Backed Securities | | | – | | | | 32,598,101 | | | | – | | | | 32,598,101 | |
Commercial Mortgage-Backed Securities – U.S. Government Agency | | | – | | | | 59,631,725 | | | | – | | | | 59,631,725 | |
Corporate Obligations | | | – | | | | 16,024,423 | | | | – | | | | 16,024,423 | |
Residential Mortgage-Backed Securities | | | – | | | | 353,117,031 | | | | – | | | | 353,117,031 | |
Residential Mortgage-Backed Securities – U.S. Government Agency | | | – | | | | 4,059,036 | | | | – | | | | 4,059,036 | |
Residential Mortgage-Backed Securities – U.S. Government Agency Credit Risk Transfer | | | – | | | | 7,887,237 | | | | – | | | | 7,887,237 | |
U.S. Treasury Notes | | | – | | | | 17,388,730 | | | | – | | | | 17,388,730 | |
Short-Term Investments | | | 61,161,032 | | | | 11,875,432 | | | | – | | | | 73,036,464 | |
Total | | | $61,161,032 | | | | $1,074,242,654 | | | | $– | | | | $1,135,403,686 | |
Other Financial Instruments | | | | | | | | | | | | | | | | |
Assets | | | | | | | | | | | | | | | | |
Futures Contracts* | | | $4,193,794 | | | | $– | | | | $– | | | | $4,193,794 | |
Liabilities | | | | | | | | | | | | | | | | |
Futures Contracts* | | | 619,290 | | | | – | | | | – | | | | 619,290 | |
Total | | | $3,574,504 | | | | $– | | | | $– | | | | $3,574,504 | |
| * | Futures are reflected at the unrealized appreciation (depreciation) on the instrument as presented in the Schedule of Investments. |
112
Angel Oak Funds Trust
Notes to the Financial Statements - (continued)
July 31, 2022 (Unaudited)
NOTE 2. SIGNIFICANT ACCOUNTING POLICIES – (continued)
See the Schedule of Investments for further disaggregation of investment categories. During the period ended July 31, 2022, the UltraShort Income Fund did not recognize any transfers to or from Level 3.
| | | | | | | | | | | | | | | | |
| Core Impact Fund | |
| | | Level 1 | | | Level 2 | | | Level 3 | | | Total | |
Assets | | | | | | | | | | | | | | | | |
Asset-Backed Securities | | | $– | | | | $10,217,455 | | | | $– | | | | $10,217,455 | |
Commercial Mortgage-Backed Securities | | | – | | | | 3,295,858 | | | | – | | | | 3,295,858 | |
Commercial Mortgage-Backed Securities – U.S. Government Agency | | | – | | | | 6,743,248 | | | | – | | | | 6,743,248 | |
Corporate Obligations | | | – | | | | 8,531,876 | | | | – | | | | 8,531,876 | |
Residential Mortgage-Backed Securities | | | – | | | | 3,542,392 | | | | – | | | | 3,542,392 | |
Residential Mortgage-Backed Securities – U.S. Government Agency | | | – | | | | 3,195,525 | | | | – | | | | 3,195,525 | |
Short-Term Investments | | | 499,206 | | | | – | | | | – | | | | 499,206 | |
Total | | | $499,206 | | | | $35,526,354 | | | | $– | | | | $36,025,560 | |
Other Financial Instruments | | | | | | | | | | | | | | | | |
Assets | | | | | | | | | | | | | | | | |
Futures Contracts* | | | $150,557 | | | | $– | | | | $– | | | | $150,557 | |
| * | Futures are reflected at the unrealized appreciation (depreciation) on the instrument as presented in the Schedule of Investments. |
See the Schedule of Investments for further disaggregation of investment categories. During the period ended July 31, 2022, the Core Impact Fund recognized $477,040 of transfers from Level 3 to Level 2 due to an increase in relevant market activity.
The following is a reconciliation of investments in which significant unobservable inputs (Level 3) were used in determining fair value:
| | | | | | | | | | | | | | | | | | |
| Core Impact Fund | | Balance as of
01/31/22 | | Amortization/
Accretion | | Net Realized
Gain (Loss) | | Change in Net
Unrealized
Appreciation
(Depreciation) | | Purchases | | Sales | | Transfers
Into
Level 3 | | Transfers
Out of
Level 3 | | Balance
as of
01/31/22 |
| Corporate Obligations | | $500,000 | | $– | | $– | | ($22,960) | | $0 | | $– | | $– | | ($477,040) | | $– |
Federal Income Taxes: The Funds intend to elect and continue to qualify to be taxed as “regulated investment companies” under Subchapter M of the Internal Revenue Code of 1986, as amended. If so qualified, the Funds generally will not be subject to federal income tax to the extent they distribute substantially all of their net investment income and capital gains to shareholders. The Funds generally intend to operate in a manner such that they will not be liable for federal income or excise taxes.
The Funds have adopted financial reporting rules regarding recognition and measurement of tax positions taken or expected to be taken on a tax return. The Funds recognize interest and penalties, if any, related to unrecognized tax benefits as income tax expense on the Statements of Operations. During the period ended July 31, 2022, the Funds did not incur any interest or penalties. The Funds have reviewed all open tax years and major jurisdictions and concluded that no provision for income tax is required in the Funds’ financial statements. The Funds’ Federal and state income and Federal excise tax returns for which the applicable statutes of limitations have not expired are subject to examination by the Internal Revenue Service and state departments of revenue.
Security Transactions and Income Recognition: Investment security transactions are accounted for on trade date. Gains and losses realized on sales of securities are determined on a specific identification basis. Interest income and expense is recorded on an accrual basis. Discounts and premiums on securities purchased are accreted or amortized using the effective yield method, based on each security’s estimated life and recoverable principal and recorded in interest income on the Statements of
113
Angel Oak Funds Trust
Notes to the Financial Statements - (continued)
July 31, 2022 (Unaudited)
NOTE 2. SIGNIFICANT ACCOUNTING POLICIES – (continued)
Operations. Dividend income and corporate transactions, if any, are recorded on the ex-date. Paydown gains and losses on mortgage-related and other ABS are recorded as components of interest income on the Statements of Operations. Payments received from certain investments held by the Funds may be comprised of dividends, capital gains and return of capital. The Funds originally estimate the expected classification of such payments. The amounts may subsequently be reclassified upon receipt of the information from the issuer. The actual character of distributions to the Funds’ shareholders will be reflected in the Form 1099 received by shareholders after the end of the calendar year.
Expenses: Expenses incurred by the Trust that do not relate to a specific Fund are allocated to the individual Funds based on each Fund’s relative net assets or another appropriate basis. Expenses attributable to any class are borne by that class. Income, realized gains and losses, unrealized appreciation and depreciation and expenses are allocated to each class based on the net assets in relation to the relative net assets of each Fund.
Dividends and Distributions: Distributions from each Fund’s net investment income are accrued daily and typically paid monthly. The Funds intend to distribute their net realized long term capital gains and their net realized short term capital gains, if any, at least annually. Distributions to shareholders, which are determined in accordance with income tax regulations, are recorded on the ex-dividend date. The treatment for financial reporting purposes of distributions made to shareholders during the period from net investment income or net realized capital gains may differ from their ultimate treatment for federal income tax purposes. These differences are caused primarily by differences in the timing of the recognition of certain components of income, expense or realized capital gain for federal income tax purposes. Where such differences are permanent in nature, they are reclassified in the components of the net assets based on their ultimate characterization for federal income tax purposes. Any such reclassifications will have no effect on net assets, results of operations or NAV per share of the Funds. For the year or period ended January 31, 2022, certain differences were reclassified. These differences were primarily related to dividend reclassifications; the amounts did not affect net assets. The reclassifications were as follows:
| | | | | | | | |
| | | Paid-in capital | | | Distributable
earnings (accumulated
deficit) | |
Multi-Strategy Income Fund | | $ | – | | | $ | – | |
Financials Income Fund | | $ | 1 | | �� | ($ | 1 | ) |
High Yield Opportunities Fund | | $ | – | | | $ | – | |
UltraShort Income Fund | | $ | – | | | $ | – | |
Core Impact Fund | | $ | – | | | $ | – | |
Share Valuation: The NAV per share of a class of shares of each Fund is calculated by dividing the sum of the value of the securities held by the Fund, plus cash and other assets, attributable to that class, minus all liabilities (including estimated accrued expenses) attributable to that class by the total number of shares of that class outstanding, rounded to the nearest cent. The Funds’ NAV will not be calculated on the days on which the New York Stock Exchange is closed for trading.
Use of Estimates: The preparation of financial statements in conformity with GAAP requires management to make estimates and assumptions that affect the reported amounts of assets and liabilities and disclosure of contingent assets and liabilities at the date of the financial statements, as well as the reported amounts of income and expenses during the period. Actual results could differ from those estimates.
Indemnifications: Under the Trust’s organizational documents, the Trust will indemnify its officers and trustees for certain liabilities that may arise from performance of their duties to the Funds. Additionally, in the normal course of business, the Funds enter into contracts that contain a variety of representations and warranties which provide general indemnifications. The Funds’ maximum exposure under these arrangements is unknown, as this would involve future claims that may be made against the Funds that have not yet occurred.
Cash and Cash Equivalents: Cash and cash equivalents are highly liquid assets including coin, currency and short-term investments that typically mature in 30-90 days. Short-term investments can include U.S. Government and government agency securities, investment grade money market instruments, investment grade fixed-income securities, repurchase agreements,
114
Angel Oak Funds Trust
Notes to the Financial Statements - (continued)
July 31, 2022 (Unaudited)
NOTE 2. SIGNIFICANT ACCOUNTING POLICIES – (continued)
commercial paper and cash equivalents. Cash equivalents are extremely low risk assets that are liquid and easily converted into cash. These investments are only considered equivalents if they are readily available and are not restricted by some agreement. When the Adviser believes market, economic or political conditions are unfavorable for investors, the Adviser may invest up to 100% of a Fund’s net assets in cash, cash equivalents or other short-term investments. Unfavorable market or economic conditions may include excessive volatility or a prolonged general decline in the securities markets or the U.S. economy. The Adviser also may invest in these types of securities or hold cash while looking for suitable investment opportunities or to maintain liquidity. Included in Investments in unaffiliated securities at fair value on the Statements of Assets and Liabilities are investments in First American money market funds held at major financial institutions as follows:
| | |
| |
Multi-Strategy Income Fund | | $187,379,929 |
Financials Income Fund | | $7,708,721 |
High Yield Opportunities Fund | | $2,615,887 |
UltraShort Income Fund | | $61,161,032 |
Core Impact Fund | | $499,206 |
Reverse Repurchase Agreements: A reverse repurchase agreement is the sale by the Funds of a security to a party for a specified price, with the simultaneous agreement by the Funds to repurchase that security from that party on a future date at a higher price. Proceeds from securities sold under reverse repurchase agreements are reflected as a liability on the Statements of Assets and Liabilities. Interest payments made are recorded as a component of interest expense on the Statements of Operations. Reverse repurchase agreements involve the risk that the counterparty will become subject to bankruptcy or other insolvency proceedings or fail to return a security to the Funds. In such situations, the Funds may incur losses as a result of a possible decline in the value of the underlying security during the period while the Funds seek to enforce their rights, a possible lack of access to income on the underlying security during this period, or expenses of enforcing its rights. The Funds will segregate assets determined to be liquid by the Adviser or otherwise cover its obligations under reverse repurchase agreements.
The gross obligations for secured borrowing by the type of collateral pledged and remaining time to maturity on reverse repurchase contracts is as follows:
| | | | | | | | | | | | | | | | | | | | |
| Multi-Strategy Income Fund | |
| Reverse Repurchase Agreements | | Overnight and Continuous | | | Up to 30 Days | | | 30-90 Days | | | Greater than
90 Days | | | Total | |
Asset-Backed Securities | | $ | – | | | $ | – | | | $ | 64,336,176 | | | $ | – | | | $ | 64,336,176 | |
Collateralized Loan Obligations | | | – | | | | – | | | | 17,752,013 | | | | – | | | | 17,752,013 | |
Residential Mortgage-Backed Securities | | | – | | | | – | | | | 152,968,451 | | | | – | | | | 152,968,451 | |
Residential Mortgage-Backed Securities – U.S. Government Agency Credit Risk Transfer | | | – | | | | – | | | | 14,943,409 | | | | – | | | | 14,943,409 | |
Total | | | $– | | | | $– | | | | $250,000,049 | | | | $– | | | | $250,000,049 | |
Gross amount of reverse repurchase agreements in Balance Sheet Offsetting Information Table | | | | $250,000,049 | |
Amounts related to agreements not included in offsetting disclosure in Balance Sheet Offsetting Information Table | | | | $– | |
NOTE 3. RISKS ASSOCIATED WITH PORTFOLIO ASSETS
Asset-Backed and Mortgage-Backed Securities and Whole Loan Risks: Prepayment risk is associated with mortgage-backed and ABS, including CLOs, and whole loans. If interest rates fall, the underlying debt may be repaid ahead of schedule, reducing the value of the Funds’ investments. If interest rates rise, there may be fewer prepayments, which would cause the average bond maturity to rise, increasing the potential for the Funds to lose money. The value of these securities may be significantly affected by changes in interest rates, the market’s perception of issuers, and the creditworthiness of the parties involved. The ability of the Funds to successfully utilize these instruments may depend on the ability of the Funds’ Adviser to forecast interest rates and other economic factors correctly. These securities may have a structure that makes their reaction to interest rate changes and other factors difficult to predict, making their value highly volatile. Certain MBS may be secured by pools of mortgages on single-
115
Angel Oak Funds Trust
Notes to the Financial Statements - (continued)
July 31, 2022 (Unaudited)
NOTE 3. RISKS ASSOCIATED WITH PORTFOLIO ASSETS – (continued)
family, multi-family properties, as well as commercial properties. Similarly, ABS may be secured by pools of loans, such as corporate loans, student loans, automobile loans and credit card receivables. Whole loans are sold in their entirety rather than being pooled with other mortgages. Whole loans are mortgage loans sold to an investor in a secondary market. The investor purchasing the loan assumes full responsibility of the loan and all the contractual terms and rights associated with the funds. The credit risk on such loans is affected by homeowners or borrowers defaulting on their loans. The values of assets underlying mortgage-backed and ABS, including CLOs, may decline and therefore may not be adequate to cover underlying investors. To the extent the Funds focus their investments in particular types of mortgage-backed or ABS, including CLOs, and whole loans, the Funds may be more susceptible to risk factors affecting such types of investments.
Subordinated Debt of Banks and Diversified Financial Companies: The Funds may invest in subordinated debt securities, sometimes also called “junior debt”, which are debt securities for which the issuer’s obligations to make principal and interest payments are secondary to the issuer’s payment obligations to more senior debt securities. Such investments will consist primarily of debt issued by community banks or savings intuitions (or their holding companies), which are subordinated to senior debt issued by the banks and deposits held by the bank, but are senior to trust preferred obligations, preferred stock and common stock issued by the bank.
Investment Company Securities: The Funds may invest in the securities of other investment companies, including exchange-traded funds (“ETFs”), closed-end funds and open-end (mutual) funds (also called underlying funds). When a Fund invests in underlying funds it will indirectly bear its proportionate share of any fees and expenses payable directly by the underlying fund. In connection with its investments in other investment companies, a Fund will incur higher expenses, many of which may be duplicative. Furthermore, because the Funds may invest in shares of ETFs and underlying funds, their performances are directly related to the ability of the ETFs and underlying funds to meet their respective investment objectives as well as the allocation of each Fund’s assets among the ETFs and underlying funds by the Adviser. Accordingly, the Funds’ investment performance will be influenced by the investment strategies of, and risks associated with, the ETFs and underlying funds in direct proportion to the amount of assets the Funds allocate to the ETFs and underlying funds utilizing such strategies.
High Yield Securities: The Funds may invest in below investment grade securities. These “high-yield” securities, also known as “junk bonds,” will generally be rated BB or lower by S&P or will be of equivalent quality rating from another Nationally Recognized Statistical Ratings Organization, or if unrated, considered by the Adviser to be of comparable quality.
Structured Products: The Funds may invest in certain structured products. Normally, structured products are privately offered and sold (that is, they are not registered under the securities laws); however, an active dealer market may exist for structured products that qualify for Rule 144A transactions. The risks of an investment in a structured product depend largely on the type of the collateral securities and the class of the structured product in which the Funds invest. In addition to the normal interest rate, default and other risks of fixed income securities, structured products carry additional risks, including the possibility that distributions from collateral securities will not be adequate to make interest or other payments, the quality of the collateral may decline in value or default, the Funds may invest in structured products that are subordinate to other classes, values may be volatile and disputes with the issuer may produce unexpected investment results.
Common and Preferred Stocks: The Funds may invest in common stock and preferred stock. Common stock represents an equity (ownership) interest in a company, and usually possesses voting rights and earns dividends. Dividends on common stock are not fixed but are declared at the discretion of the issuer. Common stock generally represents the riskiest investment in a company. In addition, common stock generally has the greatest appreciation and depreciation potential because increases and decreases in earnings are usually reflected in a company’s stock price. The Funds may also invest in preferred stock. Preferred stock is a class of stock having a preference over common stock as to the payment of dividends and the recovery of investment should a company be liquidated, although preferred stock is usually junior to the debt securities of the issuer. Preferred stock typically does not possess voting rights and its market value may change based on changes in interest rates.
The fundamental risk of investing in stock is the risk that the value of the stock might decrease. Stock values fluctuate in response to the activities of an individual company or in response to general market and/or economic conditions. Historically, common stocks have provided greater long-term returns and have entailed greater short-term risks than preferred stocks, fixed-income and money market investments. The market values of all securities, including common and preferred stocks, is based upon the market’s
116
Angel Oak Funds Trust
Notes to the Financial Statements - (continued)
July 31, 2022 (Unaudited)
NOTE 3. RISKS ASSOCIATED WITH PORTFOLIO ASSETS – (continued)
perception of value and not necessarily the book value of an issuer or other objective measures of a company’s worth. If you invest in the Funds, you should be willing to accept the risks of the stock market (to the extent that a Fund invests in common stock) and should consider an investment in the Funds only as a part of your overall investment portfolio.
Futures Contracts: The Funds may enter into futures contracts to hedge various investments for risk management as well as speculative purposes. Initial margin deposits are made upon entering into futures contracts and can be either cash or securities. Secondary margin limits are required to be maintained while futures are held, as defined by each contract.
During the period a futures contract is open, changes in the value of the contract are recognized as unrealized gains or losses by “marking-to-market” on a daily basis to reflect the fair value of the contract at the end of each day’s trading. Variation margin receivables or payables represent the difference between the change in unrealized appreciation and depreciation on the open contracts and the cash deposits made on the margin accounts. When the contract is closed, the Funds record a realized gain or loss equal to the difference between the proceeds from the closing transaction and the Fund’s cost of entering into a contract. The use of futures contracts involves the risk of illiquid markets or imperfect correlation between the value of the instruments and the underlying securities, or that the counterparty will fail to perform its obligations.
Futures contracts are valued at the settlement price established each day by the board of trade or exchange on which they are traded. Should market conditions move unexpectedly, the Funds may not achieve the anticipated benefits of the futures contract and may realize a loss. See Note 4 for information on futures contract activity during the period ended July 31, 2022.
To-Be-Announced Securities: The Funds may invest in to-be-announced securities (“TBAs”). TBAs is a term that is generally used to describe forward-settling MBS. These TBAs are generally issued by U.S. Government Agencies or U.S. Government Sponsored Entities such as Freddie Mac, Fannie Mae and Ginnie Mae. The actual mortgage-backed security that will be delivered to the buyer at the time TBA trades are entered is not known, however, the terms of the acceptable pools of loans that will comprise the mortgage-backed security are determined at the time the trade is entered into (coupon rate, maturity, credit quality, etc.). Investment in TBAs will generally increase the Funds’ exposure to interest rate risk and could also expose the Funds to counterparty default risk. In order to mitigate counterparty default risk, the Funds only enter TBAs with counterparties for which the risk of default is determined to be remote.
NOTE 4. DERIVATIVE TRANSACTIONS
The following tables present a summary of the value of derivative instruments as of July 31, 2022, and the effect of derivative instruments on the Consolidated Statement of Assets and Liabilities as of July 31, 2022, for the Multi-Strategy Income Fund.
| | | | | | | | | |
| Multi-Strategy Income Fund |
| Derivatives | | Type of
Derivative Risk | | Consolidated Statement of Assets and
Liabilities Location | | Liabilities |
| Futures Contracts | | Interest Rate | | Deposit at broker for futures | | $1,169,826* |
| * | Deposit at brokers for futures on the Consolidated Statement of Assets and Liabilities include the daily change in variation margin as of July 31, 2022. |
The effect of derivative instruments on the Consolidated Statement of Operations for the period ended July 31, 2022, for the Multi-Strategy Income Fund:
| | | | | | |
| Derivatives | | Type of
Derivative Risk | | Location of Gain (Loss) on Derivatives in Income | | Realized Gain (Loss) on
Derivatives |
| Futures Contracts | | Interest Rate | | Net realized gain (loss) on futures contracts | | $12,489,421 |
| Swaps | | Interest Rate | | Net realized gain (loss) on swaps | | $4,741,085 |
| | | | | | |
| Derivatives | | Type of
Derivative Risk | | Location of Gain (Loss) on Derivatives in Income | | Change in Unrealized
Appreciation (Depreciation) on
Derivatives |
| Futures Contracts | | Interest Rate | | Net change in unrealized appreciation (depreciation) on futures contracts | | $8,198,874 |
117
Angel Oak Funds Trust
Notes to the Financial Statements - (continued)
July 31, 2022 (Unaudited)
NOTE 4. DERIVATIVE TRANSACTIONS – (continued)
The average monthly notional value of long and short futures contracts during the period ended July 31, 2022, was $64,404,508 and ($441,262,283), respectively. The average monthly notional value of long swap contracts during the period ended July 31, 2022, was $122,857,143. The average monthly notional value of long and short swaption contracts during the period ended July 31, 2022, was $85,714,286 and ($171,428,571), respectively.
The following tables present a summary of the value of derivative instruments as of July 31, 2022, and the effect of derivative instruments on the Statements of Assets and Liabilities as of July 31, 2022, for the UltraShort Income Fund.
| | | | | | |
| UltraShort Income Fund |
| Derivatives | | Type of Derivative Risk | | Statements of Assets and Liabilities
Location | | Assets |
| Futures Contracts | | Interest Rate | | Deposit at broker for futures | | $62,119* |
| * | Deposit at brokers for futures on the Statements of Assets and Liabilities include the daily change in variation margin as of July 31, 2022. |
The effect of derivative instruments on the Statements of Operations for the period ended July 31, 2022, for the UltraShort Income Fund:
| | | | | | |
| Derivatives | | Type of
Derivative Risk | | Location of Gain (Loss) on Derivatives in Income | | Realized Gain (Loss) on
Derivatives |
| Futures Contracts | | Interest Rate | | Net realized gain (loss) on futures contracts | | ($241,843) |
| | | | | | |
| Derivatives | | Type of
Derivative Risk | | Location of Gain (Loss) on Derivatives in Income | | Change in Unrealized
Appreciation (Depreciation) on
Derivatives |
| Futures Contracts | | Interest Rate | | Net change in unrealized appreciation (depreciation) on futures contracts | | $2,586,626 |
For the UltraShort Income Fund the average monthly notional value of short futures contracts during the period ended July 31, 2022, was ($169,260,149).
The following tables present a summary of the value of derivative instruments as of July 31, 2022, and the effect of derivative instruments on the Statements of Assets and Liabilities as of July 31, 2022, for the Core Impact Fund.
| | | | | | |
| Core Impact Fund |
| Derivatives | | Type of Derivative Risk | | Statements of Assets and
Liabilities Location | | Assets |
| Futures Contracts | | Interest Rate | | Deposit at broker for futures | | $12,813* |
| * | Deposit at brokers for futures on the Statements of Assets and Liabilities include the daily change in variation margin as of July 31, 2022. |
The effect of derivative instruments on the Statements of Operations for the period ended July 31, 2022, for the Core Impact Fund:
| | | | | | |
| Derivatives | | Type of
Derivative Risk | | Location of Gain (Loss) on Derivatives in Income | | Change in Unrealized
Appreciation (Depreciation) on
Derivatives |
| Futures Contracts | | Interest Rate | | Net change in unrealized appreciation (depreciation) on futures contracts | | $150,557 |
For the Core Impact Fund the average monthly notional value of long futures contracts during the period ended July 31, 2022, was $1,419,076.
118
Angel Oak Funds Trust
Notes to the Financial Statements - (continued)
July 31, 2022 (Unaudited)
NOTE 4. DERIVATIVE TRANSACTIONS – (continued)
Balance Sheet Offsetting Information
During the ordinary course of business, the Funds may enter into transactions subject to enforceable netting agreements or other similar arrangements (“netting agreements”). Generally, the right to offset in netting agreements allows the Funds to offset any exposure to a specific counterparty with any collateral received or delivered to that counterparty based on the terms of the agreement. Generally, the Funds manage their cash collateral and securities collateral on a counterparty basis. As of July 31, 2022, the Funds were not subject to any netting agreements.
The following table provides a summary of offsetting financial liabilities and derivatives and the effect of derivative instruments on the Statements of Assets and Liabilities as of July 31, 2022.
| | | | | | | | | | | | |
| Multi-Strategy Income Fund |
| | | | | | | | | Gross Amounts Not Offset in Consolidated Statement of Assets and Liabilities |
| | | Gross Amounts of
Recognized Liabilities | | Gross Amounts Offset in
Consolidated
Statement of Assets
and Liabilities | | Net Amounts of
Liabilities Presented in
Consolidated
Statement of
Assets and Liabilities | | Financial
Instruments | | Cash Collateral
Pledged | | Net Amount |
Futures Contracts* | | $1,169,826 | | $– | | $1,169,826 | | $– | | $1,169,826 | | $– |
Reverse Repurchase Agreements | | $250,000,049 | | $– | | $250,000,049 | | $250,000,049 | | $– | | $– |
| | | | | | | | | | | | | | | | | | | | | | | | |
| UltraShort Income Fund | |
| | | | | | | | | | | | Gross Amounts Not Offset in Statements of Assets and Liabilities | |
| | | Gross Amounts of
Recognized Assets | | | Gross Amounts Offset in
Statements of Assets
and Liabilities | | | Net Amounts of
Assets Presented in
Statements of
Assets and
Liabilities | | | Financial
Instruments | | | Cash Collateral
Pledged | | | Net Amount | |
Futures Contracts* | | $ | 62,119 | | | $ | – | | | $ | 62,119 | | | $ | – | | | $ | – | | | $ | 62,119 | |
| | | | | | | | | | | | | | | | | | | | | | | | |
| Core Impact Fund | |
| | | | | | | | | | | | Gross Amounts Not Offset in Statements of Assets and Liabilities | |
| | | Gross Amounts of
Recognized Assets | | | Gross Amounts Offset in
Statements of Assets
and Liabilities | | | Net Amounts of
Assets Presented in
Statements of
Assets and
Liabilities | | | Financial
Instruments | | | Cash Collateral
Pledged | | | Net Amount | |
Futures Contracts* | | $ | 12,813 | | | $ | – | | | $ | 12,813 | | | $ | – | | | $ | 12,813 | | | $ | – | |
| * | Deposit at brokers for futures on the Statements of Assets and Liabilities include the daily change in variation margin as of July 31, 2022. |
In some instances, the actual collateral received/pledged may be more than the amounts disclosed herein.
NOTE 5. FEES AND OTHER RELATED PARTY TRANSACTIONS
Under the terms of the investment advisory agreement, on behalf of the Funds (the “Agreement”), the Adviser manages the Funds’ investments subject to oversight of the Trustees. As compensation for its management services, Multi-Strategy Income Fund, Financials Income Fund, High Yield Opportunities Fund, UltraShort Income Fund, and Core Impact Fund are obligated to pay the Adviser a fee computed and accrued daily and paid monthly at an annual rate of 0.89%, 0.89%, 0.55%, 0.44%, and 0.50% respectively, of the average daily net assets of the Fund.
The Adviser contractually agreed through May 31, 2023, to waive or limit its fees and to assume other expenses of the Multi-Strategy Income Fund, the Financials Income Fund, the High Yield Opportunities Fund, UltraShort Income Fund, and the Core
119
Angel Oak Funds Trust
Notes to the Financial Statements - (continued)
July 31, 2022 (Unaudited)
NOTE 5. FEES AND OTHER RELATED PARTY TRANSACTIONS – (continued)
Impact Fund until May 31, 2023, so that the Total Annual Fund Operating Expenses of each Fund do not exceed 0.99%, 0.85%, 0.65%, 0.35% and 0.59%, respectively. This arrangement may only be changed or eliminated by the Board of Trustees upon 60 days’ written notice to the Adviser.
Effective December 1, 2016, the Adviser also voluntarily agreed to waive its fees and/or reimburse certain expenses to limit the total annual fund operating expenses after Fee Waiver/Expense Reimbursement to 0.69% of the Financials Income Fund’s average daily net assets. This voluntary waiver is in addition to the contractual fee waiver/expense limitation agreement discussed above and may be discontinued at any time.
During the period ended July 31, 2022, the Adviser voluntarily waived $319,027 of the Financial Income Fund’s expenses. Fees waived under these voluntary waivers are not subject to recoupment by the Adviser. These operating expense limitations do not apply to front-end sales loads, brokerage fees and commissions, borrowing costs (such as interest and dividend expenses on securities sold short), taxes, 12b-1 fees, extraordinary expenses and indirect expenses (such as “acquired funds fees and expenses”).
The contractual waiver and/or reimbursement by the Adviser with respect to the Funds is subject to repayment by the Funds within 36 months following the month in which that particular waiver and/or reimbursement occurred, provided that the Funds are able to make the repayment without exceeding the expense limitations described above or the expense limitation in effect at the time of the reimbursement (whichever is lower). During the period ended July 31, 2022, the Adviser waived $81,828 of the High Yield Opportunities Fund’s expenses, $1,267,875 of the UltraShort Income Fund’s expenses, and $71,669 of the Core Impact Fund’s expenses. During the period ended July 31, 2022, the High Yield Opportunities Fund had $90,532 of previously waived expenses expire. The expense limitation agreement specifically refers to amounts that are contractually waived, see Statements of Operations. The amounts subject to repayment by the Funds, pursuant to the aforementioned conditions at July 31, 2022, are included in the table below.
| | | | | | | | |
| | | Recoverable during
the year ended
January 31, 2023 | | Recoverable during
the year ended
January 31, 2024 | | Recoverable during
the year ended
January 31, 2025 | | Recoverable during
the year ended
January 31, 2026 |
| Multi-Strategy Income Fund | | $– | | $– | | $– | | $– |
| Financials Income Fund | | $– | | $– | | $– | | $– |
| High Yield Opportunities Fund | | $75,998 | | $170,565 | | $176,290 | | $81,828 |
| UltraShort Income Fund | | $– | | $– | | $298,340 | | $1,267,882 |
| Core Impact Fund | | $– | | $– | | $87,232 | | $71,669 |
In addition, the Adviser has contractually agreed through May 31, 2023, to waive the amount of the Multi-Strategy Income Fund’s management fee to the extent necessary to offset the proportionate share of the management fees incurred by the Fund through its investment in underlying funds for which the Adviser also serves as investment adviser (affiliated investments). This contractual waiver is not subject to recoupment by the Adviser. This arrangement may only be changed or eliminated by the Board of Trustees upon 60 days’ written notice to the Adviser. During the period ended July 31, 2022, the Adviser waived $344,982 of the Multi-Strategy Income Fund’s management fees of underlying funds.
Quasar Distributors, LLC (the “Distributor”) acts as the Funds’ principal underwriter in a continuous public offering of the Funds’ shares. The Funds have adopted a Distribution Plan in accordance with Rule 12b-1 under the 1940 Act with respect to the Class A, Class A1, and Class C shares, as applicable. The Distribution Plan provides that the Funds will pay a fee to the Distributor at an annual rate of up to 0.25% of the average daily net assets of Class A shares and Class A1 shares and at an annual rate of up to 1.00% of the average daily net assets of Class C shares. No distribution fees are paid by Institutional Class shares. These fees may be used by the Distributor to provide compensation for sales support, distribution activities or shareholder servicing activities.
U.S. Bancorp Fund Services, LLC, doing business as U.S. Bank Global Fund Services (“Fund Services”), an indirect wholly-owned subsidiary of U.S. Bancorp, serves as the Funds’ Administrator (“Administrator”) and, in that capacity, performs various administrative and accounting services for the Funds. Fund Services also serves as the Funds’ fund accountant and transfer
120
Angel Oak Funds Trust
Notes to the Financial Statements - (continued)
July 31, 2022 (Unaudited)
NOTE 5. FEES AND OTHER RELATED PARTY TRANSACTIONS – (continued)
agent. The Administrator prepares various federal and state regulatory filings, reports and returns for the Funds; prepares reports and materials to be supplied to the Trustees; monitors the activities of the Funds’ custodian; coordinates the preparation and payment of the Funds’ expenses and reviews the Funds’ expense accruals. As compensation for its services, the Administrator is entitled to a monthly fee at an annual rate based upon the average daily net assets of the Funds. U.S. Bank, N.A. (the “Custodian”) serves as custodian to the Funds.
Certain officers, Trustees and shareholders of the Funds are also owners or employees of the Adviser.
NOTE 6. SECURITIZATION TRANSACTION
On November 5, 2015, the Multi-Strategy Income Fund and the Financials Income Fund participated in the offering of the Financial Institution Note Securitization 2015-1, LTD (FINS 2015-1). As part of the offering, Multi Strategy Income Fund purchased $12,927,000 of Class A notes, $6,275,000 of Class C notes and 11,231,000 preferred shares and Financials Income Fund purchased $7,673,000 of Class A notes, $3,725,000 of Class C notes and 6,666,666 preferred shares of FINS 2015-1. The Adviser was named as the collateral surveillance and analysis provider of FINS 2015-1. The collateral manager may consult with the collateral surveillance and analysis provider prior to making certain decisions; however, the collateral manager will not be required to follow any position taken by or recommendation made by the collateral surveillance and analysis provider in any such consultation. Prior to July 31, 2022, the Multi-Strategy Income Fund and the Financials Income Fund sold all Class A notes, Class C notes and preferred shares previously held in FINS 2015-1 to a third party. The Multi-Strategy Income Fund and Financials Income Fund realized losses of $38,363 and $22,770, respectively, on the sale of the Preferred Shares.
NOTE 7. INVESTMENT TRANSACTIONS
For the period ended July 31, 2022, purchases and sales of investment securities, other than short-term investments and short-term U.S. Government securities, were as follows:
| | | | |
| | | Purchases | | Sales |
| Multi-Strategy Income Fund | | $292,891,674 | | $1,720,294,889 |
| Financials Income Fund | | $11,744,438 | | $17,239,353 |
| High Yield Opportunities Fund | | $839,803 | | $3,150,578 |
| UltraShort Income Fund | | $161,764,167 | | $586,225,125 |
| Core Impact Fund | | $5,584,495 | | $4,360,651 |
For the period ended July 31, 2022, purchases and sales of long-term U.S. Government securities, were as follows:
| | | | |
| | | Purchases | | Sales |
| Multi-Strategy Income Fund | | $26,053,277 | | $116,509,307 |
| Financials Income Fund | | $– | | $– |
| High Yield Opportunities Fund | | $– | | $– |
| UltraShort Income Fund | | $6,385,345 | | $31,178,393 |
| Core Impact Fund | | $2,127,591 | | $1,802,420 |
NOTE 8. TRANSACTIONS WITH AFFILIATES
The Funds’ ownership of shares of affiliates represents holdings for which the Funds’ and the underlying investee fund have the same investment adviser or where the investee fund’s investment adviser is under common control with the Funds’ investment adviser.
121
Angel Oak Funds Trust
Notes to the Financial Statements - (continued)
July 31, 2022 (Unaudited)
NOTE 8. TRANSACTIONS WITH AFFILIATES – (continued)
The Multi-Strategy Income Fund had the following investments in affiliates during the period ended July 31, 2022, with affiliates:
| | | | | | | | | | | | | | | | |
| Security Name | | Value as of
February 1,
2022 | | Purchases | | Sales | | Net Change in
Unrealized
Appreciation
(Depreciation) on
Investments in
Affiliates | | Value as of
July 31,
2022 | | Share
Balance | | Dividend
Income | | Net Realized
Gain (Loss) on
Investments
in Affiliates |
| Core Impact Fund | | $38,934,526 | | $– | | $– | | ($2,271,513) | | $36,663,013 | | 3,985,110 | | $406,178 | | $– |
| Financials Income Fund | | 46,021,081 | | – | | – | | (1,698,765) | | $44,322,316 | | 5,147,772 | | 870,447 | | – |
| High Yield Opportunities Fund | | 38,500,220 | | – | | – | | (3,136,066) | | $35,364,154 | | 3,336,241 | | 964,740 | | – |
Total | | $123,455,827 | | $– | | $– | | ($7,106,344) | | $116,349,483 | | 12,469,123 | | $2,241,365 | | $– |
NOTE 9. BENEFICIAL OWNERSHIP
The beneficial ownership, either directly or indirectly, of 25% or more of the voting securities of a fund creates a presumption of control of a fund, under Section 2(a)(9) of the 1940 Act. At July 31, 2022, the Multi-Strategy Income Fund owned, as beneficial shareholder, 52% of the outstanding shares of High Yield Opportunities Fund, 28% of the outstanding shares of Financials Income Fund, and over 99% of the outstanding shares of Core Impact Fund. At July 31, 2022, Charles Schwab (“Schwab”) owned, as record shareholder, 28% of the outstanding shares of UltraShort Income Fund. It is not known whether Schwab or any other underlying beneficial owners owned or controlled 25% or more of the voting securities of the Funds. At July 31, 2022, no shareholder held more than 25% of the outstanding shares of the Multi-Strategy Income Fund.
NOTE 10. FEDERAL TAX INFORMATION
The tax characterization of distributions paid for the year or period ended January 31, 2022, and January 31, 2021, were as follows:
| | | | | | | | | | | | | | |
| | | Multi-Strategy Income Fund | | | Financials Income Fund | |
| | | 2022 | | 2021 | | | 2022 | | | 2021 | |
Distributions paid from: | | | | | | | | | | | | | | |
Ordinary Income | | $328,674,997 | | | $284,445,850 | | | | $5,948,903 | | | | $7,380,213 | |
Net Long-Term Capital Gain | | – | | | – | | | | – | | | | – | |
Return of Capital | | – | | | – | | | | – | | | | 202,342 | |
Total | | $328,674,997 | | | $284,445,850 | | | | $5,948,903 | | | | $7,582,555 | |
| | | | | | | | | | | | | | |
| | | High Yield Opportunities Fund | | | UltraShort Income Fund | |
| | | 2022 | | 2021 | | | 2022 | | | 2021 | |
Distributions paid from: | | | | | | | | | | | | | | |
Ordinary Income | | $3,841,269 | | | $3,924,885 | | | | $17,285,321 | | | | $11,238,173 | |
Net Long-Term Capital Gain | | – | | | – | | | | – | | | | – | |
Total | | $3,841,269 | | | $3,924,885 | | | | $17,285,321 | | | | $11,238,173 | |
| | | | | | |
| | | Core Impact Fund | |
| | | 2022 | | 2021* | |
| Distributions paid from: | | | | | | |
| Ordinary Income | | $368,515 | | | $– | |
| Net Long-Term Capital Gain | | – | | | – | |
| Total | | $368,515 | | | $– | |
| * | Fund commenced operations on June 4, 2021. |
122
Angel Oak Funds Trust
Notes to the Financial Statements - (continued)
July 31, 2022 (Unaudited)
NOTE 10. FEDERAL TAX INFORMATION – (continued)
At January 31, 2022, the components of distributable earnings (accumulated deficit) on a tax basis were as follows:
| | | | | | | | | | |
| | | Multi-Strategy
Income Fund | | Financials
Income Fund | | High Yield
Opportunities
Fund | | UltraShort
Income Fund | | Core Impact
Fund |
Tax Cost of Investments | | $8,155,288,054 | | $160,658,135 | | $74,064,392 | | $1,675,886,235 | | $40,106,242 |
Unrealized Appreciation* | | 105,644,733 | | 3,081,758 | | 1,807,964 | | 2,884,421 | | 6,517 |
Unrealized Depreciation* | | (275,685,974) | | (1,240,993) | | (2,282,585) | | (5,910,941) | | (1,028,754) |
Net Unrealized Appreciation (Depreciation)* | | ($170,041,241) | | $1,840,765 | | ($474,621) | | ($3,026,520) | | ($1,022,237) |
Undistributed Ordinary Income | | 13,322,949 | | 190,019 | | 270,475 | | 364,054 | | 55,980 |
Undistributed Long-Term Gain (Loss) | | – | | – | | – | | – | | – |
Accumulated Gain (Loss) | | $13,322,949 | | $190,019 | | $270,475 | | $364,054 | | $55,980 |
Other Accumulated Gain (Loss) | | (909,036,662) | | (48,085,128) | | (2,663,946) | | (7,053,495) | | (99,667) |
Distributable Earnings (Accumulated Deficit) | | ($1,065,754,954) | | ($46,054,344) | | ($2,868,092) | | ($9,715,961) | | ($1,065,924) |
| * | Represents aggregated amounts of Funds’ investments, reverse repurchase agreements and futures. |
The temporary differences between book basis and tax basis in the Funds are primarily attributable to wash sales, partnership adjustments, amortization of callable bonds, and mark to market on futures contracts.
As of January 31, 2022, the Funds had available for federal tax purposes an unused capital loss carryforward, which is available for offset against future taxable net capital gains, as follows.
| | |
| |
Multi-Strategy Income Fund | | $901,449,566 |
Financials Income Fund | | $47,897,135 |
High Yield Opportunities Fund | | $2,433,728 |
UltraShort Income Fund | | $6,705,809 |
Core Impact Fund | | $44,448 |
For the year ended January 31, 2022, the Multi-Strategy Income Fund, Financials Income Fund, and High Yield Opportunities Fund utilized $12,257,470, $917,808, and $617,969 of capital loss carryforward, respectively.
To the extent these carryforwards are used to offset future gains, it is probable that the amount offset will not be distributed to shareholders. The carryforward expires as follows:
| | | | | | | | | | |
| | | Multi-Strategy
Income Fund | | Financials
Income Fund | | High Yield
Opportunities
Fund | | UltraShort
Income Fund | | Core Impact
Fund |
No expiration short-term | | $434,090,134 | | $34,335,175 | | $1,517,225 | | $6,705,809 | | $44,448 |
No expiration long-term | | $467,359,432 | | $13,561,960 | | $916,503 | | $– | | $– |
Total | | $901,449,566 | | $47,897,135 | | $2,433,728 | | $6,705,809 | | $44,448 |
Certain capital losses incurred after October 31 and within the current taxable year, are deemed to arise on the first business day of the Funds’ following taxable year. For the tax year or period ended January 31, 2022, the Multi-Strategy Income Fund, Financials Income Fund, High Yield Opportunities Fund, UltraShort Income Fund, and Core Impact Fund did not defer any post-October losses.
123
Angel Oak Funds Trust
Notes to the Financial Statements - (continued)
July 31, 2022 (Unaudited)
NOTE 11. CREDIT AGREEMENTS
In August 2015, as amended August 12, 2020, the Multi-Strategy Income Fund entered into a $400 million secured, committed, margin facility (the “Facility”) with Société Générale, which expires in October 2022. Under the Facility, interest is charged a floating rate based on the 3-month LIBOR rate plus 1.60% and is payable on the last day of each interest period, which was 4.39% as of July 31, 2022. For the period ended July 31, 2022, the average principal balance and interest rate was approximately $300,000,000 and 2.62%, respectively. The Multi-Strategy Income Fund is required to pay a commitment fee under the Facility on undrawn amounts, and an additional fee if the level of debt outstanding falls below a certain percentage. During the reporting period the Multi-Strategy Income Fund was required to pay these commitment fees on undrawn amounts, which was 0.40% as of July 31, 2022. For the period ended July 31, 2022, these expense and commitment fees, amounted to $4,157,674 and is included in the Interest and Commissions expense line item that is reflected in the Consolidated Statements of Operations. Under the terms of the Facility, the Multi-Strategy Income Fund is also required to satisfy certain collateral requirements and maintain a certain level of net assets. For additional information, see the Consolidated Schedule of Investments. As of July 31, 2022, the outstanding principal balance under the Facility was $300 million. The amount of the maximum loan outstanding during the period was $300 million from February 1, 2022 through July 31, 2022.
U.S. Bank, N.A. has made available to the Multi-Strategy Income Fund, Financials Income Fund, High Yield Opportunities Fund, UltraShort Income Fund, and Core Impact Fund a $600,000,000 secured credit facility, pursuant to a Loan Agreement (“Agreement”) effective June 8, 2016, expiring on April 28, 2023, for the purposes of having cash available to satisfy redemption requests. Advances under the Agreement would be limited to the lesser of $600,000,000 or 20% of the unencumbered assets of the Financials Income Fund, the UltraShort Income Fund, or the Core Impact Fund; or 15% of the unencumbered assets of the High Yield Opportunities Fund; or 10% of the unencumbered assets of the Multi-Strategy Income Fund. Principal is due 45 days after the initial advance and at the maturity. Interest is payable monthly in arrears. Under the credit facility, the interest rate paid by the Funds on outstanding borrowings is equal to the lender’s prime rate, minus 1.00% which was 4.50% as of July 31, 2022. Prior to April 29, 2022, the Funds paid an interest rate on outstanding borrowings equal to the one-month LIBOR, plus 1.75%. For the period ended July 31, 2022, the Funds’ activity under the credit facility was as follows:
| | | | | | | | |
| | | Average
Principal
Balance | | Average
Interest Rate | | Maximum
Loan
Outstanding | | Period Loan was Outstanding |
Financials Income Fund | | $507,293 | | 2.23% | | $6,170,000 | | March 29, 2022 |
High Yield Opportunities Fund | | $2,597 | | 1.93% | | $110,000 | | February 7, 2022, through February 8, 2022 |
As of July 31, 2022, the Funds had no outstanding borrowings under this agreement.
NOTE 12. ACCOUNTING PRONOUNCEMENTS
In March 2020, FASB issued ASU 2020-04, Reference Rate Reform. The amendments in ASU No. 2020-04 provide optional expedients and exceptions for applying U.S. GAAP to contracts, hedging relationships, and other transactions affected by reference rate reform if certain criteria are met. In January 2021, the FASB issued ASU No. 2021-01, which clarifies that certain provisions in Topic 848, if elected by an entity, apply to derivative instruments that use an interest rate for margining, discounting, or contract price alignment that is modified as a result of reference rate reform. The ASUs are effective for all entities as of March 12, 2020 through December 31, 2022. The Funds did not utilize the optional expedients and exceptions provided by ASU No. 2020-04 and ASU No. 2021-01 during the period ended July 31, 2022.
In June 2022, the FASB issued Accounting Standards Update 2022-03, which amends Fair Value Measurement (Topic 820): Fair Value Measurement of Equity Securities Subject to Contractual Sale Restrictions (“ASU 2022-03”). ASU 2022-03 clarifies guidance for fair value measurement of an equity security subject to a contractual sale restriction and establishes new disclosure requirements for such equity securities. ASU 2022-03 is effective for fiscal years beginning after December 15, 2023 and for interim periods within those fiscal years, with early adoption permitted. Management is currently evaluating the impact of these amendments on the financial statements.
124
Angel Oak Funds Trust
Notes to the Financial Statements - (continued)
July 31, 2022 (Unaudited)
NOTE 13. MACROECONOMIC RISKS
The COVID-19 pandemic, the Russian-Ukrainian war, and resulting supply chain disruptions, geopolitical risks, and economic sanctions have disrupted economic markets and the prolonged economic impact is uncertain. The operational and financial performance of the issuers of securities in which the Funds invest depends on future developments, including the duration, spread, and conclusion of these global events, and such uncertainty may in turn impact the value of the Funds’ investments.
NOTE 14. SUBSEQUENT EVENT
Management of the Funds has evaluated the need for disclosures and/or adjustments resulting from subsequent events through the date these financial statements were issued. This evaluation did not result in any subsequent events that necessitated disclosures and/or adjustments other than the following:
Effective September 22, 2022, Angel Oak Financials Income Fund changed its name to Angel Oak Financials Income Impact Fund.
125
Additional Information (Unaudited)
1. Shareholder Notification of Federal Tax Status
For the taxable year ended January 31, 2022, certain dividends paid by the Funds may be subject to a maximum tax rate of 20% as provided for by the Jobs and Growth Tax Relief Reconciliation Act of 2003. The Funds intend to designate the maximum amount allowable as taxed at a maximum rate of 20%.
For the taxable year ended January 31, 2022, the Multi-Strategy Income Fund, Financials Income Fund, High Yield Opportunities Fund, UltraShort Income Fund, and Core Impact Fund paid qualified dividend income of 0.00%, 0.00%, 0.00%, 0.00% and 0.00%, respectively.
For the taxable year ended January 31, 2022, the percentage of ordinary income dividends paid by the Multi-Strategy Income Fund, Financials Income Fund, High Yield Opportunities Fund, UltraShort Income Fund, and Core Impact Fund that qualifies for the dividends received deduction available to corporations was 0.00%, 0.00%, 0.00%, 0.00% and 0.00%, respectively.
For the taxable year ended January 31, 2022, the Multi-Strategy Income Fund, Financials Income Fund, High Yield Opportunities Fund, UltraShort Income Fund, and Core Impact Fund did not pay any ordinary income distributions that are designated as short-term capital gain distributions under Internal Revenue Section 871(k)2(c).
For the taxable year ended January 31, 2022, the percentage of taxable ordinary income distributions for the Multi-Strategy Income Fund, Financials Income Fund, High Yield Opportunities Fund, UltraShort Income Fund, and Core Impact Fund that are designated as interest related dividends under Internal Revenue 871(k)1(c) was 72.43%, 91.85%, 98.12%, 100.00% and 100.00%, respectively.
2. Disclosure of Portfolio Holdings
The Funds will file a complete schedule of portfolio holdings with the Securities and Exchange Commission (“SEC”) for the first and third quarters of each fiscal year on Part F of Form N-PORT. The Funds’ Part F of Form N-PORT is available on the SEC’s website at http://www.sec.gov and may be reviewed and copied at the SEC’s Public Reference Room in Washington, D.C. Information on the operation of the Public Reference Room may be obtained by calling (800) SEC-0230.
3. Proxy Voting Policies and Procedures
A description of the policies and procedures that the Funds use to determine how to vote proxies related to portfolio securities and information regarding how the Funds voted those proxies during the most recent twelve month period ended June 30, is available without charge upon request by (1) calling the Funds at (855) 751-4324 and (2) from Trust documents filed with the SEC on the SEC’s website at www.sec.gov.
4. Liquidity Risk Management Program
The Funds have adopted and implemented a written liquidity risk management program (the “Program”) as required by Rule 22e-4 under the 1940 Act (the “Liquidity Rule”). The board has designated the Adviser’s Risk Committee as the administrator of the Program (the “Administrator”). The Administrator conducts the day-to-day operation of the Program.
In accordance with the Program, the Funds’ liquidity risk is assessed no less frequently than annually taking into consideration certain factors, as applicable, such as (i) investment strategy and liquidity of portfolio investments both during normal and reasonably foreseeable stressed conditions, (ii) short-term and long-term cash flow projections and (iii) holdings of cash and cash equivalents and borrowing arrangements and other funding sources.
At a meeting of the Board held on June 29-30, 2022, the Administrator provided the Board with a written report addressing the Program’s operation, adequacy and effectiveness of implementation for the fiscal year ended January 31, 2022. It was noted, among other items, that the Administrator concluded that the Administrator believes (i) the Program operated effectively to assess and manage each Fund’s liquidity risk and (ii) the Program has been adequately and effectively implemented to monitor and, as applicable, respond to the Funds’ liquidity developments.
There can be no assurance that the Program will achieve its objectives in the future. Please refer to your Fund’s prospectus for more information regarding the Fund’s liquidity risk and other principal risks to which an investment in the Fund may be subject.
126
5. Compensation of Trustees
Each Trustee who is not an “interested person” (i.e., an “Independent Trustee”) of the Fund Complex (which includes affiliated registrants not disclosed in this report) receives an annual retainer of $65,000, (pro-rated for any periods less than one year), paid quarterly as well as $12,000 for attending each regularly scheduled meeting in connection with his or her service on the Board of the Fund Complex. In addition, each Committee Chair as well as the Chair of the Board receive additional annual compensation of $12,000 (pro-rated for any periods less than one year). Independent Trustees are eligible for reimbursement of out-of-pocket expenses incurred in connection with attendance at meetings. The Funds’ Statement of Additional Information includes additional information about the Trustees and is available upon request by calling toll free (855) 751-4324.
Prior to November 1, 2021, the Independent Trustees received an annual retainer of $58,000 (pro-rated for any periods less than one year), paid quarterly as well as $12,000 for attending each regularly scheduled meeting in connection with his or her service on the Board of the Fund Complex. In addition, each Committee Chair received additional annual compensation of $12,000 (pro-rated for any periods less than one year).
6. Trustees and Officers
The business of each Fund is managed under the direction of the Board. The Board formulates the general policies of each Fund and meets periodically to review each Fund’s performance, monitor investment activities and practices, and discuss other matters affecting the Funds’. The Trustees are fiduciaries for each Fund’s shareholders and are governed by the laws of the State of Delaware in this regard. The names and addresses of the Trustees and officers of the Trust are listed below along with a description of their principal occupations over at least the last five years. The address of each Trustee and Officer of the Trust is c/o Angel Oak Capital Advisors, LLC, 3344 Peachtree Road NE, Suite 1725, Atlanta, GA 30326. The Funds’ Statement of Additional Information includes additional information about the Trustees and is available upon request by calling toll free (855) 751-4324.
| | | | | | | | | | |
Name and
Year of Birth | | Position with
the Trust | | Term of Office
and Length of
Time Served | | Principal
Occupation(s) During
Past 5 Years | | Number of
Portfolios
in Fund
Complex(1)
Overseen
by Trustee | | Other Directorships Held
During the Past 5 Years |
Independent Trustees(2) |
Ira P. Cohen 1959 | | Independent Trustee, Chair | | Trustee since 2014, Chair since 2017; indefinite terms | | Executive Vice President, Recognos Financial (investment industry data analysis provider) (2015-2021); Independent financial services consultant (since 2005). | | 11 | | Trustee, Valued Advisers Trust (since 2010); Trustee, Griffin Institutional Access Credit Fund (since 2017); Trustee, Griffin Institutional Access Real Estate Fund (since 2014); Trustee, Angel Oak Strategic Credit Fund (since 2017); Trustee, Angel Oak Financial Strategies Income Term Trust (since 2018); Trustee, Angel Oak Dynamic Financial Strategies Income Term Trust (since 2019); Trustee, U.S. Fixed Income Trust (since 2019); Trustee, Angel Oak Credit Opportunities Term Trust (since 2021). |
127
| | | | | | | | | | |
Name and
Year of Birth | | Position with
the Trust | | Term of Office
and Length of
Time Served | | Principal
Occupation(s) During
Past 5 Years | | Number of
Portfolios
in Fund
Complex(1)
Overseen
by Trustee | | Other Directorships Held
During the Past 5 Years |
Alvin R. Albe, Jr. 1953 | | Independent Trustee | | Since 2014; indefinite term | | Retired. | | 11 | | Trustee, Angel Oak Strategic Credit Fund (since 2017); Trustee, Angel Oak Financial Strategies Income Term Trust (since 2018); Trustee, Angel Oak Dynamic Financial Strategies Income Term Trust (since 2019); Trustee, Angel Oak Credit Opportunities Term Trust (since 2021). |
Keith M. Schappert 1951 | | Independent Trustee | | Since 2014; indefinite term | | President, Schappert Consulting LLC (investment industry consulting) (since 2008). | | 11 | | Trustee, Mirae Asset Discovery Funds (since 2010); Director, Commonfund Capital, Inc. (since 2015); Director, The Commonfund (since 2012); Director, Calamos Asset Management, Inc. (2012-2017); Trustee, Angel Oak Strategic Credit Fund (since 2017); Trustee, Angel Oak Financial Strategies Income Term Trust (since 2018); Trustee, Angel Oak Dynamic Financial Strategies Income Term Trust (since 2019); Trustee, Angel Oak Credit Opportunities Term Trust (since 2021). |
128
| | | | | | | | | | |
Name and
Year of Birth | | Position with
the Trust | | Term of Office
and Length of
Time Served | | Principal
Occupation(s) During
Past 5 Years | | Number of
Portfolios
in Fund
Complex(1)
Overseen
by Trustee | | Other Directorships Held
During the Past 5 Years |
Andrea N. Mullins 1967 | | Independent Trustee | | Since 2019; indefinite term | | Private Investor; Independent Contractor, SWM Advisors (since 2014). | | 11 | | Trustee, Valued Advisors Trust (since 2013, Chairperson since 2017); Trustee, Angel Oak Strategic Credit Fund (since 2019); Trustee, Angel Oak Financial Strategies Income Term Trust (since 2019); Trustee, Angel Oak Dynamic Financial Strategies Income Term Trust (since 2019); Trustee, Angel Oak Credit Opportunities Term Trust (since 2021); Trustee and Audit Committee Chair, Cushing Mutual Funds Trust (since 2021); Trustee and Audit Committee Chair, Cushing MLP & Infrastructure Fund (since 2021); Trustee and Audit Committee Chair, Cushing Nextgen Infrastructure Income Fund (since 2021). |
Interested Trustees |
Samuel R. Dunlap, III 1979 | | Interested Trustee | | Since 2019; indefinite term | | Chief Investment Officer-Public Strategies, Angel Oak Capital Advisors, LLC (investment management) (since 2009). | | 11 | | Trustee, Angel Oak Strategic Credit Fund (since 2019); Trustee, Angel Oak Dynamic Financial Strategies Income Term Trust (since 2019); Trustee, Angel Oak Credit Opportunities Term Trust (since 2021): Trustee, Angel Oak Financial Strategies Income Term Trust (since 2022). |
129
| | | | | | | | | | |
Name and
Year of Birth | | Position with
the Trust | | Term of Office
and Length of
Time Served | | Principal
Occupation(s) During
Past 5 Years | | Number of
Portfolios
in Fund
Complex(1)
Overseen
by Trustee | | Other Directorships Held
During the Past 5 Years |
Cheryl M. Pate 1976 | | Interested Trustee | | Since 2022; indefinite term | | Portfolio Manager, Angel Oak Capital Advisors, LLC (investment management) (since 2017). | | 10 | | Trustee, Angel Oak Strategic Credit Fund (since 2022); Trustee, Angel Oak Dynamic Financial Strategies Income Term Trust (since 2022); Trustee, Angel Oak Credit Opportunities Term Trust (since 2022). |
| (1) | The Fund Complex includes each series of the Trust, Angel Oak Strategic Credit Fund, Angel Oak Financial Strategies Income Term Trust, Angel Oak Dynamic Financial Strategies Income Income Term Trust, and Angel Oak Credit Opportunities Term Trust. |
| (2) | The Trustees of the Trust who are not “interested persons” of the Trust as defined in the 1940 Act (“Independent Trustees”). |
| | | | | | |
Name and Year of Birth | | Position with the Trust | | Term of Office and Length of Time Served | | Principal Occupation(s) During Past 5 Years |
Officers |
Dory S. Black, Esq. 1975 | | President | | Since 2015; indefinite term | | General Counsel, Angel Oak Companies (since 2014). |
Adam Langley 1967 | | Chief Compliance Officer | | Since 2015; indefinite term | | Chief Compliance Officer, Angel Oak Capital Advisors, LLC (since 2015); Chief Compliance Officer, Buckhead One Financial Opportunities, LLC (since 2015); Chief Compliance Officer, Angel Oak Capital Partners II, LLC (since 2016); Chief Compliance Officer of Falcons I, LLC (since 2018); Chief Compliance Officer, Hawks I, LLC (since 2018); Chief Compliance Officer, Angel Oak Commercial Real Estate Solutions (2021-2022); Chief Compliance Officer, Angel Oak Strategic Credit Fund (since 2017); Chief Compliance Officer, Angel Oak Financial Strategies Income Term Trust (since 2018); Chief Compliance Officer, Angel Oak Dynamic Financial Strategies Income Term Trust (since 2019); Chief Compliance Officer, Angel Oak Credit Opportunities Fund (since 2021); Chief Operating Officer, Angel Oak Capital Advisors, LLC (since 2021). |
Kevin Sluss 1982 | | Secretary | | Since 2022; indefinite term | | Chief Risk Officer, Angel Oak Capital Advisors, LLC (since 2022), Quantitative Analytics and Model Development Manager, PNC Bank (2019-2022); Quantitative Analytics and Model Development Analyst, PNC Bank (2016-2019). |
Daniel Fazioli 1981 | | Treasurer | | Since 2015; indefinite term | | Chief Accounting Officer, Angel Oak Capital Advisors, LLC (since 2015). |
130
Each Trustee holds office for an indefinite term and until the earlier of: the Trust’s next meeting of shareholders and the election and qualification of his/her successor; or until the date a trustee dies, resigns or is removed in accordance with the Trust’s Declaration of Trust and By-laws. Each Trustee shall serve during the lifetime of the Trust until he or she: (a) dies; (b) resigns; (c) has reached the mandatory retirement age, if any, as set by the Trustees; (d) is declared incompetent by a court of appropriate jurisdiction; or (e) is removed, or, if sooner, until the next meeting of shareholders called for the purpose of electing Trustees and until the election and qualification of his or her successor. Each officer holds office at the pleasure of the Board.
131
INVESTMENT ADVISER
Angel Oak Capital Advisors, LLC
3344 Peachtree Road NE, Suite 1725
Atlanta, GA 30326
DISTRIBUTOR
Quasar Distributors, LLC
111 East Kilbourn Avenue, Suite 220
Milwaukee, WI 53202
INDEPENDENT REGISTERED PUBLIC ACCOUNTING FIRM
Cohen & Company, Ltd.
1350 Euclid Avenue, Suite 800
Cleveland, OH 44115
LEGAL COUNSEL
Dechert LLP
1900 K Street NW
Washington, DC 20006
CUSTODIAN
U.S. Bank National Association
1555 North Rivercenter Drive, Suite 302
Milwaukee, WI 53202
ADMINISTRATOR, TRANSFER AGENT, AND FUND ACCOUNTANT
U.S Bancorp Fund Services, LLC
615 East Michigan Street
Milwaukee, WI 53202
This report is intended only for the information of shareholders or those who have received the Funds’ prospectus which contains information about the Funds’ management fee and expenses. Please read the prospectus carefully before investing.
SAR-AOFT
(b) Not applicable.
Item 2. Code of Ethics.
Not applicable for semi-annual reports.
Item 3. Audit Committee Financial Expert.
Not applicable for semi-annual reports.
Item 4. Principal Accountant Fees and Services.
Not applicable for semi-annual reports.
Item 5. Audit Committee of Listed Registrants.
Not applicable to registrants who are not listed issuers (as defined in Rule 10A-3 under the Securities Exchange Act of 1934).
Item 6. Investments.
Schedule of Investments is included as part of the report to shareholders filed under Item 1 of this Form.
Item 7. Disclosure of Proxy Voting Policies and Procedures for Closed-End Management Investment Companies.
Not applicable to open-end investment companies.
Item 8. Portfolio Managers of Closed-End Management Investment Companies.
Not applicable to open-end investment companies.
Item 9. Purchases of Equity Securities by Closed-End Management Investment Company and Affiliated Purchasers.
Not applicable to open-end investment companies.
Item 10. Submission of Matters to a Vote of Security Holders.
There have been no material changes to the procedures by which shareholders may recommend nominees to the registrant’s board of trustees.
1
Item 11. Controls and Procedures.
| (a) | The Registrant’s Principal Executive Officer and Principal Financial Officer have reviewed the Registrant’s disclosure controls and procedures (as defined in Rule 30a-3(c) under the Investment Company Act of 1940 (the “Act”)) as of a date within 90 days of the filing of this report, as required by Rule 30a-3(b) under the Act and Rules 13a-15(b) or 15d-15(b) under the Securities Exchange Act of 1934. Based on their review, such officers have concluded that the disclosure controls and procedures are effective in ensuring that information required to be disclosed in this report is appropriately recorded, processed, summarized and reported and made known to them by others within the Registrant and by the Registrant’s service provider. |
| (b) | There were no changes in the Registrant’s internal control over financial reporting (as defined in Rule 30a-3(d) under the Act) that occurred during the period covered by this report that have materially affected, or are reasonably likely to materially affect, the Registrant’s internal control over financial reporting. |
Item 12. Disclosure of Securities Lending Activities for Closed-End Management Investment Companies
Not applicable to open-end investment companies.
Item 13. Exhibits.
| (a) | (1) Any code of ethics or amendment thereto, that is the subject of the disclosure required by Item 2, to the extent that the registrant intends to satisfy Item 2 requirements through filing an exhibit. Not Applicable. |
(2) A separate certification for each principal executive officer and principal financial officer pursuant to Section 302 of the Sarbanes-Oxley Act of 2002. Filed herewith.
(3) Any written solicitation to purchase securities under Rule 23c-1 under the Act sent or given during the period covered by the report by or on behalf of the registrant to 10 or more persons. Not applicable to open-end investment companies.
(4) Change in the registrant’s independent public accountant. There was no change in the registrant’s independent public accountant for the period covered by this report.
2
SIGNATURES
Pursuant to the requirements of the Securities Exchange Act of 1934 and the Investment Company Act of 1940, the registrant has duly caused this report to be signed on its behalf by the undersigned, thereunto duly authorized.
| | |
| (Registrant) Angel Oak Funds Trust |
| |
| By (Signature and Title)* | | /s/ Dory S. Black |
| | Dory S. Black, President (Principal Executive Officer) |
|
| Date September 26, 2022 |
Pursuant to the requirements of the Securities Exchange Act of 1934 and the Investment Company Act of 1940, this report has been signed below by the following persons on behalf of the registrant and in the capacities and on the dates indicated.
| | |
| By (Signature and Title)* | | /s/ Dory S. Black |
| | Dory S. Black, President (Principal Executive Officer) |
|
| Date September 26, 2022 |
| |
| By (Signature and Title)* | | /s/ Daniel Fazioli |
| | Daniel Fazioli, Treasurer (Principal Financial Officer) |
|
| Date September 26, 2022 |
| * | Print the name and title of each signing officer under his or her signature. |
3