 Earnings Release | November 20, 2014 Exhibit 99.2 |
 2 Disclosures Forward-Looking Statements: This presentation contains forward-looking statements within the meaning of the Private Securities Litigation Reform Act of 1995. Statements about our expectations, beliefs, plans, predictions, forecasts, objectives, assumptions or future events or performance are not historical facts and may be forward-looking. These statements are often, but not always, made through the use of words or phrases such as “anticipates,” “believes,” “can,” “could,” “may,” “predicts,” “potential,” “should,” “will,” “estimate,” “plans,” “projects,” “continuing,” “ongoing,” “expects,” “intends” and similar words or phrases. Accordingly, these statements are only predictions and involve estimates, known and unknown risks, assumptions and uncertainties that could cause actual results to differ materially from those expressed. All forward-looking statements are necessarily only estimates of future results, and there can be no assurance that actual results will not differ materially from expectations, and, therefore, you are cautioned not to place undue reliance on such statements. Any forward-looking statements are qualified in their entirety by reference to the factors discussed in the section titled “Risk Factors” in our Prospectus, dated October 14, 2014, included as part of the Registration Statement on Form S-1 filed in connection with our initial public offering. Further, any forward- looking statement speaks only as of the date on which it is made, and we undertake no obligation to update any forward-looking statement to reflect events or circumstances after the date on which the statement is made or to reflect the occurrence of unanticipated events. Non-GAAP Financial Measures: This presentation contains non-GAAP measures which our management relies on in making financial and operational decisions about our business and which exclude certain items that we do not consider reflective of our business performance. We believe that the presentation of these measures provides investors with greater transparency and supplemental data relating to our financial condition and results of operations. These non-GAAP measures should be considered in context with our GAAP results. A reconciliation of these non-GAAP measures appears in our earnings release dated November 20, 2014 and in the appendix to this presentation. Our earnings release and this presentation are available in the Investor Relations section of our website at www.greatwesternbank.com. Our earnings release and this presentation are also available as part of our Current Report on Form 8-K filed with the SEC on November 20, 2014. Explanatory Note: In this presentation, all financial information presented refers to the financial results of Great Western Bancorp, Inc. combined with those of its predecessor, Great Western Bancorporation, Inc. |
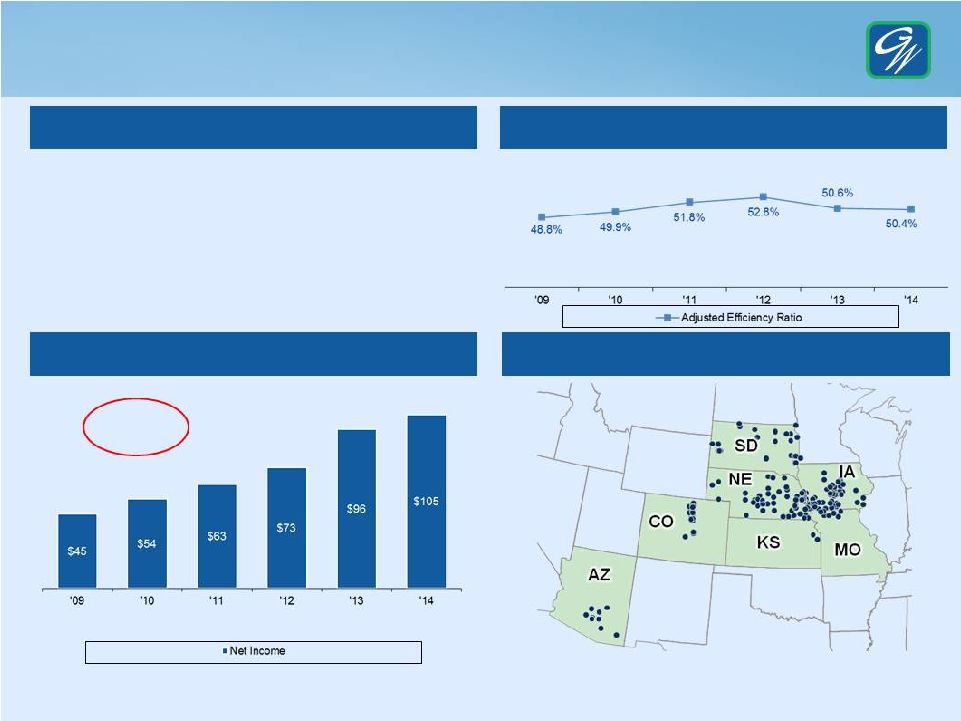 3 About GWB • Top 20 Midwest bank holding company (1) • Business bank with unique agribusiness expertise • 8 th largest farm lender bank in the U.S. as of June 30, 2014 • 162 banking branches across 7 states • Owned by National Australia Bank since 2008 • Current ownership of 68.2% Efficient Business Model Company Snapshot Demonstrated Earnings Growth Market Presence Note: Adjusted efficiency ratio is a non-GAAP measure. See appendix for reconciliation. (1)Source: SNL Financial. Based on bank holding companies with headquarters in the Midwest ranked by total assets as of June 30, 2014. Excludes specialty lenders, insurance companies, trust banks and brokerage and investment banking firms. Net Income CAGR ‘09 – ‘14: 18% For the fiscal years ended September 30. For the fiscal years ended September 30. |
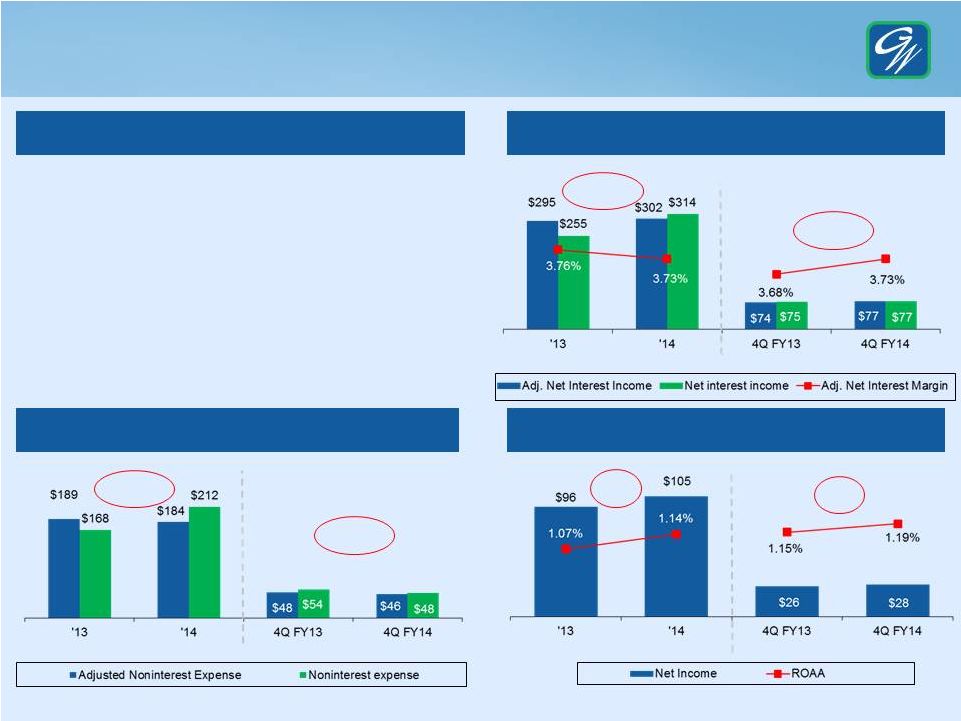 4 • 4Q FY14 net income of $27.9 million ($0.48 per share) compared to $26.3 million ($0.46 per share) for 4Q FY13 • 4Q FY14 adjusted efficiency ratio of 49.0% • FY14 net income of $105.0 million ($1.81 per share) compared to $96.2 million ($1.66 per share) for FY13 • Disciplined expense management led full-year adjusted efficiency ratio to improve to 50.4% • Improved credit quality led to a $10.9 million reduction in provision for loan losses from $11.6 million to $0.7 million • Attractive ROA and ROTCE of 1.14% and 16.6%, respectively, and ROE of 7.34% Income Statement Overview Net Interest Income ($MM) Net Income ($MM) Performance Highlights Noninterest Expense ($MM) Note: Adjusted net interest income, adjusted net interest margin, adjusted noninterest expense, adjusted efficiency ratio and return on average tangible common equity (ROTCE) are non-GAAP measures we calculate primarily to exclude the effects of offsetting fair value changes in certain loans and related interest rate swaps and the impact of amortization of intangible assets, net of tax. See appendix for reconciliations. (1) Net interest margin was 3.24% and 3.88%, respectively, for fiscal year 2013 and fiscal year 2014 and 3.75% and 3.72%, respectively, for the fourth quarters of fiscal years 2013 and 2014. +2% Adj. NII +6% For the fiscal years ended September 30 or as otherwise noted. For the fiscal years ended September 30 or as otherwise noted. For the fiscal years ended September 30 or as otherwise noted. +9% +4% Adj. NII -6% Adj. Exp. -3% Adj. Exp. (1) |
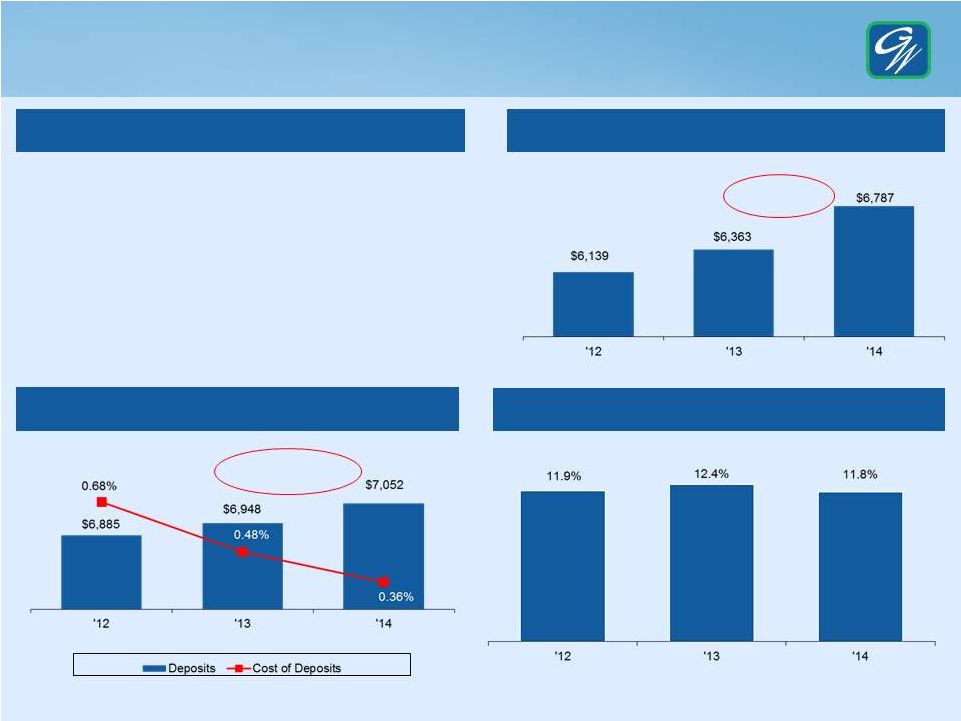 5 Balance Sheet Overview Total Loans ($MM) Balance Sheet Highlights Deposits ($MM) • Total loans up 6.7% YoY with headline growth aligned to strategy and diversification across footprint • 10% CRE growth (14% owner-occupied CRE growth) • 6% C&I and Agriculture growth, respectively • Continued transition in deposit portfolio toward more transaction accounts; lower cost of deposits • Maintained strong capital ratios despite accelerated dividend At or for the fiscal years ended September 30. At September 30. Noninterest- bearing deposits up 9% YoY +6.7% YoY Tier 1 Capital Ratio At September 30. Note: Regulatory capital ratios calculated based on currently applicable rules. |
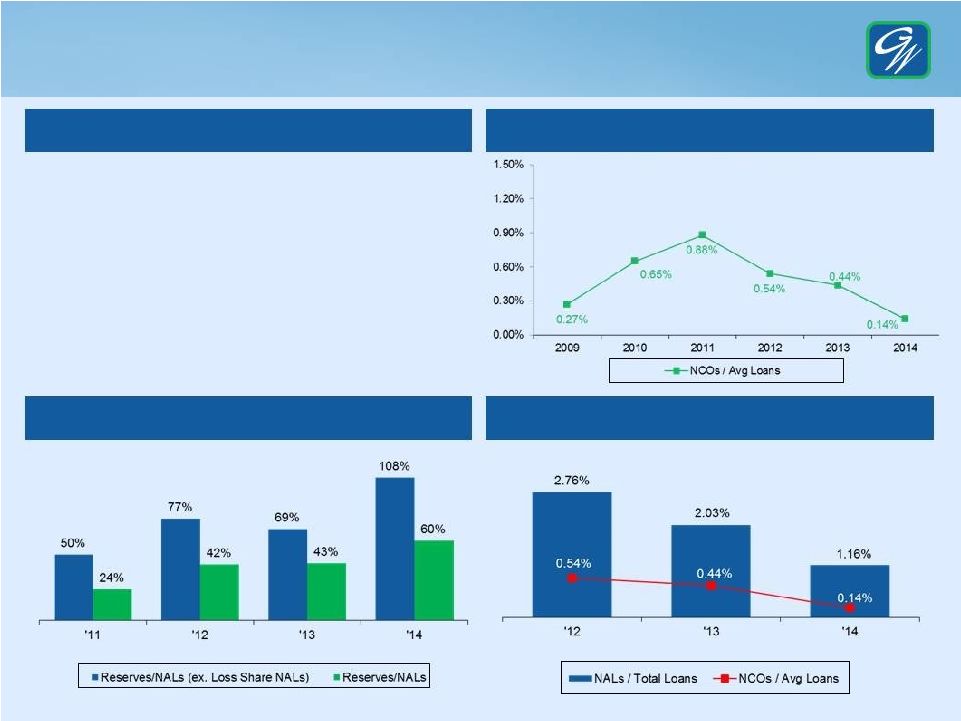 6 Continued Asset Quality Improvement • Annual net charge-offs declined to 0.14% of average loans, down from 0.44% for FY13 and from a peak of 0.88% in FY11 • Nonaccrual loans (both including and excluding loans covered by FDIC loss-sharing arrangements and total) continued to decline while Reserves / NALs increased • OREO balances declined 14% year-over-year At September 30. At or for the fiscal years ended September 30. Reserves / NALs Highlights Net Charge-Offs Improving Credit Quality For the fiscal years ended September 30. |
 7 Proven Business Strategy Focused Business Banking Franchise with Agribusiness Expertise Strong Profitability and Growth Driven by a Highly Efficient Operating Model Risk Management Driving Superior Credit Quality Relative to Peers Strong Capital Generation and Attractive Dividend Prioritize Organic Growth While Optimizing Footprint Attract and Retain High-Quality Relationship Bankers Deepen Customer Relationships |
 Appendix |
 9 Non-GAAP Reconciliations GREAT WESTERN BANCORP, INC. CONSOLIDATED FINANCIAL DATA (Unaudited) At and for the three months ended At and for the fiscal year ended Sept. 30, June 30, Sept. 30, Sept. 30, 2013 2013 2014 2014 2014 Reconciliation of Non-GAAP Measures (dollars in thousands) Cash net income and return on average tangible common equity: Net income……………………………………………… Add: Amortization of intangible assets………………. Add: Tax on amortization of intangible assets……… Cash net income……………………………………. Average common equity……………………………… Less: Average goodwill and other intangible assets…………………………………………………... Average tangible common equity………………... Return on average common equity………………….. Return on average tangible common equity *……….. * Calculated as cash net income divided by average tangible common equity. Annualized for quarterly periods. Adjusted net interest income and adjusted net interest margin: Net interest income……………………………………. Less: Loan FV adjustment related to interest rates.. Adjusted net interest income……………………… Average interest-earning assets……………………. Net interest margin……………………………………. * Adjusted net interest margin is calculated as adjusted net interest income divided by average interest earning assets. Annualized for quarterly periods. $ 27,875 $ 22,503 $ 26,323 $ 952 $ 96,243 2,768 4,069 4,690 16,216 19,290 (811) (811) (811) (3,244) (3,244) $ 29,832 $ 25,761 $ 30,202 $ 117,924 $ 112,289 $ 1,438,962 $1,445,097 $1,400,635 $ 1,430,772 $1,380,295 713,462 717,104 730,893 719,573 738,140 $ 725,500 $ 727,993 $ 669,742 $ 711,199 $ 642,155 7.69% 6.25% 7.46% 7.34% 6.97% 16.3% 14.2% 17.9% 16.6% 17.5% $ 76,646 $ 89,386 $ 74,886 $ 314,073 $ 255,096 (197) 13,197 1,330 11,922 (40,305) $ 76,843 $ 76,189 $ 73,556 $ 302,151 $ 295,401 $8,181,194 $ 8,098,052 $7,930,867 $ 8,093,861 $ 7,862,860 3.72% 4.43% 3.75% 3.88% 3.24% 3.73% 3.77% 3.68% 3.73% 3.76% Adjusted net interest margin *………………………. Sept. 30, |
 10 Non-GAAP Reconciliations Adjusted interest income and adjusted yield on Loans, other than acquired with deteriorated credit quality, net: Interest income...………………………………………. $ 76,388 $ 88,531 $ 74,453 $ 312,424 $ 249,527 Less: Loan FV adjustment related to interest rates… (197) 13,197 1,330 11,922 (40,305) Adjusted interest income..……………………….. $ 76,585 $ 75,334 $ 73,123 $ 300,502 $ 289,832 Average Loans, other than acquired with deteriorated credit quality, net………………………. $6,527,721 $6,362,850 $6,024,403 $ 6,311,857 $ 5,876,116 Yield……………………………………………………. 4.64% 5.58% 4.90% 4.95% 4.25% Adjusted yield *……………………………………….. 4.65% 4.75% 4.82% 4.76% 4.93% * Adjusted yield is calculated as adjusted interest income divided by average balance. Annualized for quarterly periods. Adjusted noninterest expense and adjusted efficiency ratio: Total revenue……………………………………….. $ 91,530 $ 103,611 $ 92,412 $ 372,127 $ 330,000 Plus: Tax equivalent adjustment………………….. 1,324 1,199 1,092 4,663 3,541 Total revenue (fully tax-equivalent basis) 92,854 104,810 93,504 376,790 333,541 Less: Loan FV adjustment related to interest rates………………………………….. (197) 13,197 1,330 11,922 (40,305) Adjusted revenue………………………. $ 93,051 $ 91,613 $ 92,174 $ 364,868 $ 373,846 Noninterest expense………………………………… $ 48,121 $ 67,476 $ 54,333 $ 212,144 $ 168,285 Less: Amortization of core deposit and other intangibles……………………………….. 2,768 4,069 4,690 16,216 19,290 Tangible noninterest expense 45,353 63,407 49,643 195,928 148,995 Less: Derivatives, net (gain) loss……………….. (197) 13,197 1,330 11,922 (40,305) Adjusted noninterest expense…………….... $ 45,550 $ 50,210 $ 48,313 $ 184,006 $ 189,300 Adjusted efficiency ratio* 49.0% 54.8% 52.4% 50.4% 50.6% Unadjusted efficiency ratio ** 48.8% 60.5% 53.1% 52.0% 44.7% * Calculated as Ratio of adjusted noninterest expense to adjusted Revenue. ** Calculated as Ratio of tangible noninterest expense to total Revenue (fully tax – equivalent basis). |
 11 Non-GAAP Reconciliations Tangible common equity and tangible common equity to tangible assets: Total stockholder’s equity .................................. $1,421,090 $1,430,964 $1,417,214 $1,421,090 $1,417,214 Less: Goodwill, core deposits and other intangibles ........................................................ 712,036 714,803 728,251 712,036 728,251 Tangible common equity .......................... $ 709,054 $ 716,161 $ 688,963 $ 709,054 $6,888,963 Total assets ..................................................... $9,371,429 $9,292,283 $9,134,258 $9,371,429 $9,134,258 Less: Goodwill, core deposits and other intangibles ........................................................ 712,036 714,803 728,251 712,036 728,251 Tangible assets ...................................... $8,659,393 $8,577,480 $8,406,007 $8,659,393 $8,406,007 Tangible common equity to tangible assets........... 8.2% 8.3$ 8.2% 8.2% 8.2% |