
Quarterly Investor Relations Presentation At and for the three and twelve months ended September 30, 2019
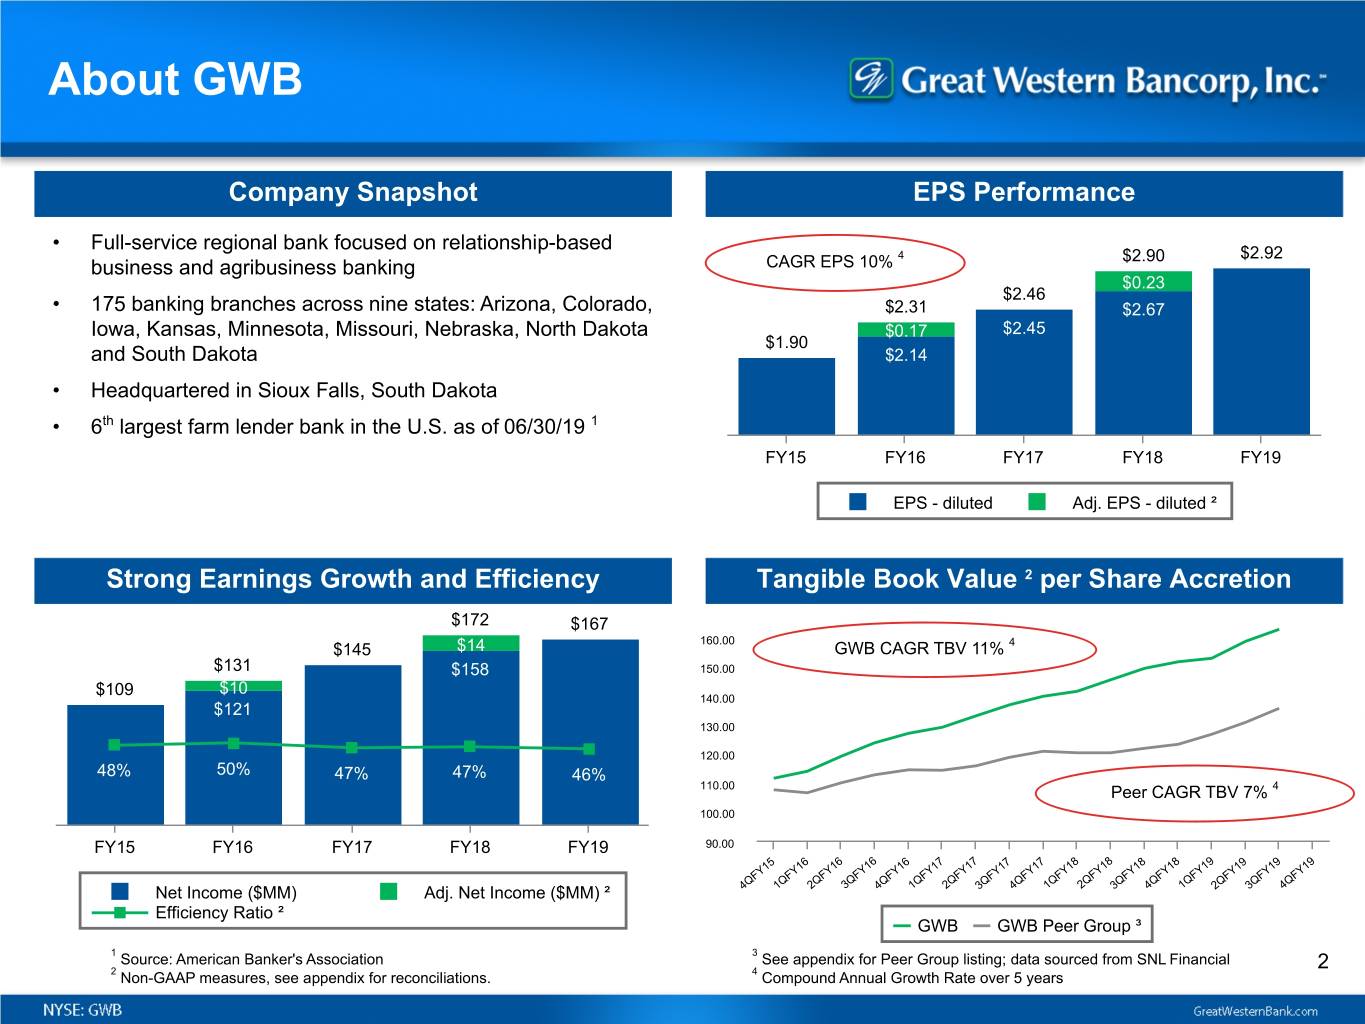
About GWB Company Snapshot EPS Performance • Full-service regional bank focused on relationship-based 4 $2.90 $2.92 business and agribusiness banking CAGR EPS 10% $0.23 $2.46 • 175 banking branches across nine states: Arizona, Colorado, $2.31 $2.67 Iowa, Kansas, Minnesota, Missouri, Nebraska, North Dakota $0.17 $2.45 $1.90 and South Dakota $2.14 • Headquartered in Sioux Falls, South Dakota • 6th largest farm lender bank in the U.S. as of 06/30/19 1 FY15 FY16 FY17 FY18 FY19 $— EPS - diluted Adj. EPS - diluted ² Strong Earnings Growth and Efficiency Tangible Book Value 2 per Share Accretion $172 $167 160.00 $145 $14 GWB CAGR TBV 11% 4 $131 $158 150.00 $109 $10 140.00 $121 130.00 120.00 48% 50% 47% 47% 46% 110.00 Peer CAGR TBV 7% 4 100.00 FY15 FY16 FY17 FY18 FY19 90.00 Net Income ($MM) Adj. Net Income ($MM) ² 4QFY15 1QFY16 2QFY16 3QFY164QFY16 1QFY17 2QFY173QFY17 4QFY17 1QFY18 2QFY183QFY18 4QFY18 1QFY192QFY19 3QFY19 4QFY19 Efficiency Ratio ² GWB GWB Peer Group ³ 1 Source: American Banker's Association 3 See appendix for Peer Group listing; data sourced from SNL Financial 2 2 Non-GAAP measures, see appendix for reconciliations. 4 Compound Annual Growth Rate over 5 years
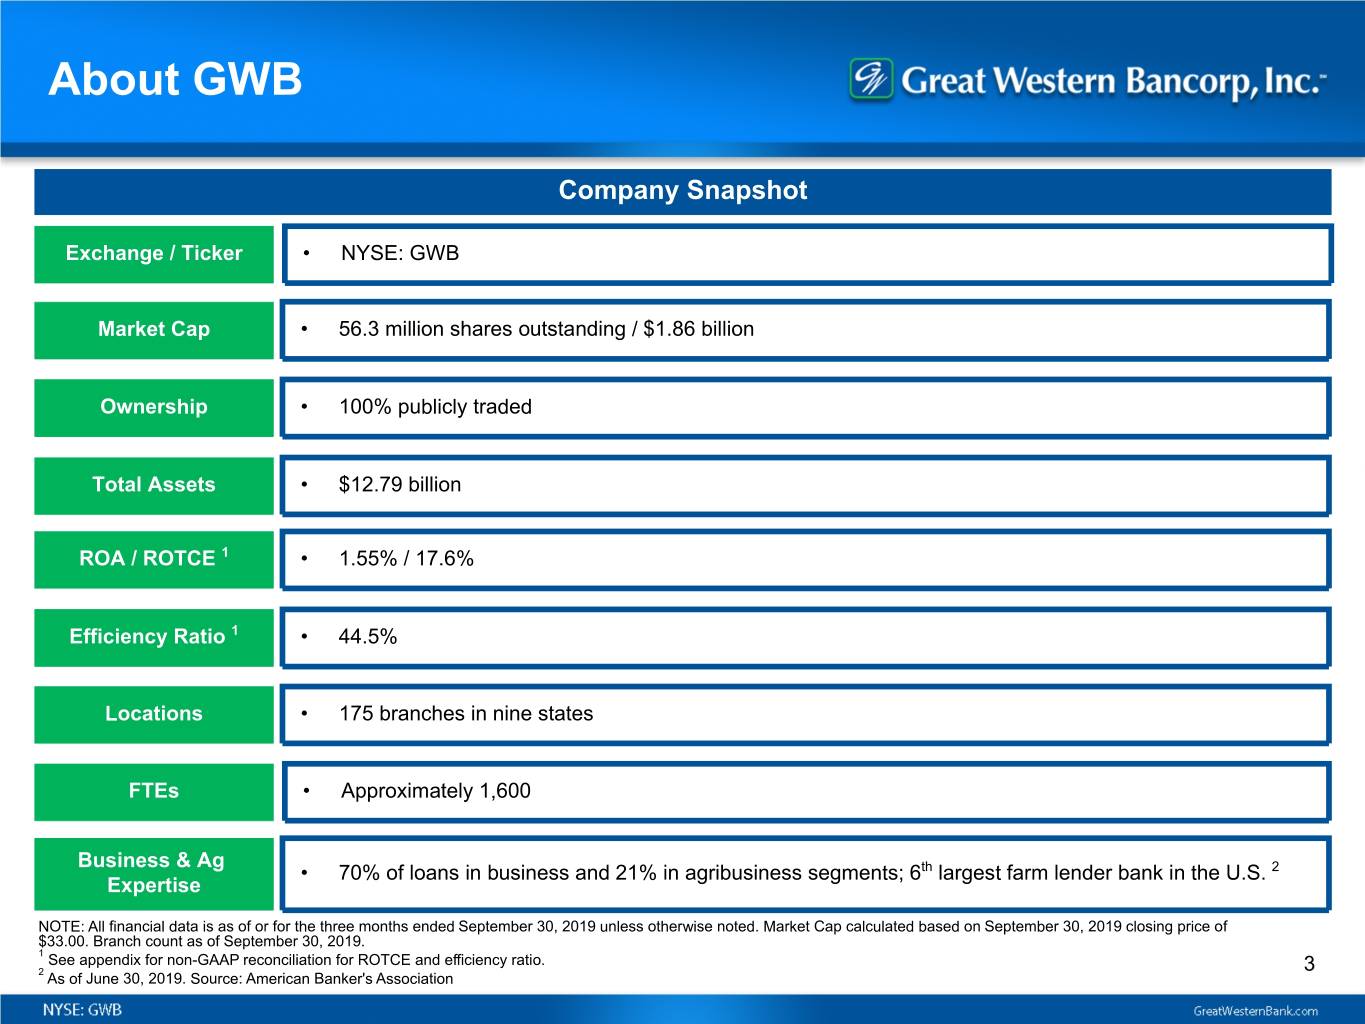
About GWB Company Snapshot Exchange / Ticker • NYSE: GWB Market Cap • 56.3 million shares outstanding / $1.86 billion Ownership • 100% publicly traded Total Assets • $12.79 billion ROA / ROTCE 1 • 1.55% / 17.6% Efficiency Ratio 1 • 44.5% Locations • 175 branches in nine states FTEs • Approximately 1,600 Business & Ag • 70% of loans in business and 21% in agribusiness segments; 6th largest farm lender bank in the U.S. 2 Expertise NOTE: All financial data is as of or for the three months ended September 30, 2019 unless otherwise noted. Market Cap calculated based on September 30, 2019 closing price of $33.00. Branch count as of September 30, 2019. 1 See appendix for non-GAAP reconciliation for ROTCE and efficiency ratio. 3 2 As of June 30, 2019. Source: American Banker's Association

Footprint Attractive Markets • 175 banking branches across nine Midwestern and Western states • Vibrant, diverse economies balanced across growing commercial hub cities and smaller rural communities • Opportunities for expansion into new markets within and adjacent to footprint 4

Executing on Strategy • Total loans declined 1.8% to $9.71 billion during the quarter bringing full fiscal year loan growth to 3.1% Focused Business • Loan growth over the fiscal year was primarily driven by non-owner occupied commercial real estate Banking Franchise with Agribusiness • Deposits increased by 0.6% to $10.30 billion during the quarter, driven by an increase in brokered deposits as Expertise a cost effective source of funding, bringing full fiscal year deposit growth to 5.8% Strong Profitability • Fully diluted EPS 1 of $0.89 for the quarter and $2.92 for the full fiscal year and Growth Driven • Profitability remains strong with ROTCE 1 of 15.3% and ROAA of 1.33% for the full fiscal year by a Highly Efficient Operating • Efficiency ratio 1 of 44.5% for the quarter and 45.8% for the full fiscal year Model • All regulatory capital ratios remain above minimums to be considered “well capitalized” Strong Capital • Quarterly dividend of $0.30 per share Generation and ◦ Dividend payable November 29, 2019 to stockholders of record as of the close of business on Attractive Dividend November 15, 2019 • Net charge-offs of $7.8 million during the quarter represent 0.31% of average total loans on an annualized basis, majority of which were in agriculture and commercial non-real estate portfolios • Loans graded "Substandard" decreased by 0.7% to $472.5 million during the quarter, loans graded "Watch" Risk Management increased by 83.6% to $405.5 million and nonaccrual loans decreased by 9.2% to $107.2 million compared to Driving Sound June 30, 2019 Credit Quality • Outside of the dairy portfolio, credit quality remained relatively stable during the quarter 1 This is a non-GAAP measure. See appendix for reconciliation. 5
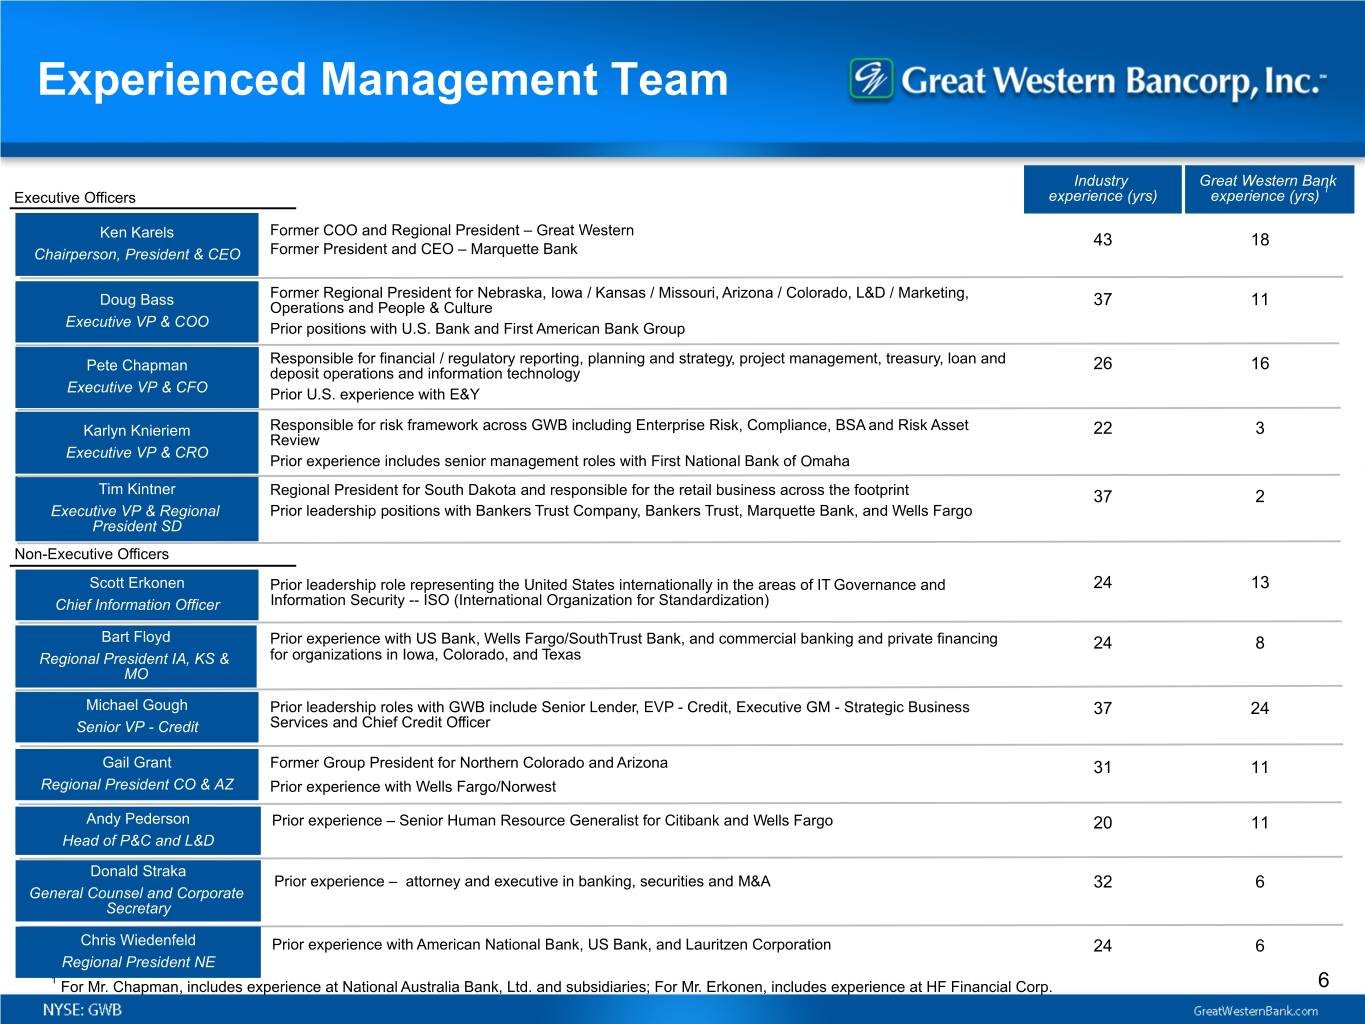
Experienced Management Team Industry Great Western Bank 1 Executive Officers experience (yrs) experience (yrs) Former COO and Regional President – Great Western Ken Karels 43 18 Chairperson, President & CEO Former President and CEO – Marquette Bank Doug Bass Former Regional President for Nebraska, Iowa / Kansas / Missouri, Arizona / Colorado, L&D / Marketing, Operations and People & Culture 37 11 Executive VP & COO Prior positions with U.S. Bank and First American Bank Group Pete Chapman Responsible for financial / regulatory reporting, planning and strategy, project management, treasury, loan and 26 16 deposit operations and information technology Executive VP & CFO Prior U.S. experience with E&Y Karlyn Knieriem Responsible for risk framework across GWB including Enterprise Risk, Compliance, BSA and Risk Asset 22 3 Review Executive VP & CRO Prior experience includes senior management roles with First National Bank of Omaha Tim Kintner Regional President for South Dakota and responsible for the retail business across the footprint 37 2 Executive VP & Regional Prior leadership positions with Bankers Trust Company, Bankers Trust, Marquette Bank, and Wells Fargo President SD Non-Executive Officers Scott Erkonen Prior leadership role representing the United States internationally in the areas of IT Governance and 24 13 Chief Information Officer Information Security -- ISO (International Organization for Standardization) Bart Floyd Prior experience with US Bank, Wells Fargo/SouthTrust Bank, and commercial banking and private financing 24 8 Regional President IA, KS & for organizations in Iowa, Colorado, and Texas MO Michael Gough Prior leadership roles with GWB include Senior Lender, EVP - Credit, Executive GM - Strategic Business 37 24 Senior VP - Credit Services and Chief Credit Officer Gail Grant Former Group President for Northern Colorado and Arizona 31 11 Regional President CO & AZ Prior experience with Wells Fargo/Norwest Andy Pederson Prior experience – Senior Human Resource Generalist for Citibank and Wells Fargo 20 11 Head of P&C and L&D Donald Straka Prior experience – attorney and executive in banking, securities and M&A 32 6 General Counsel and Corporate Secretary Chris Wiedenfeld Prior experience with American National Bank, US Bank, and Lauritzen Corporation 24 6 Regional President NE 1 For Mr. Chapman, includes experience at National Australia Bank, Ltd. and subsidiaries; For Mr. Erkonen, includes experience at HF Financial Corp. 6
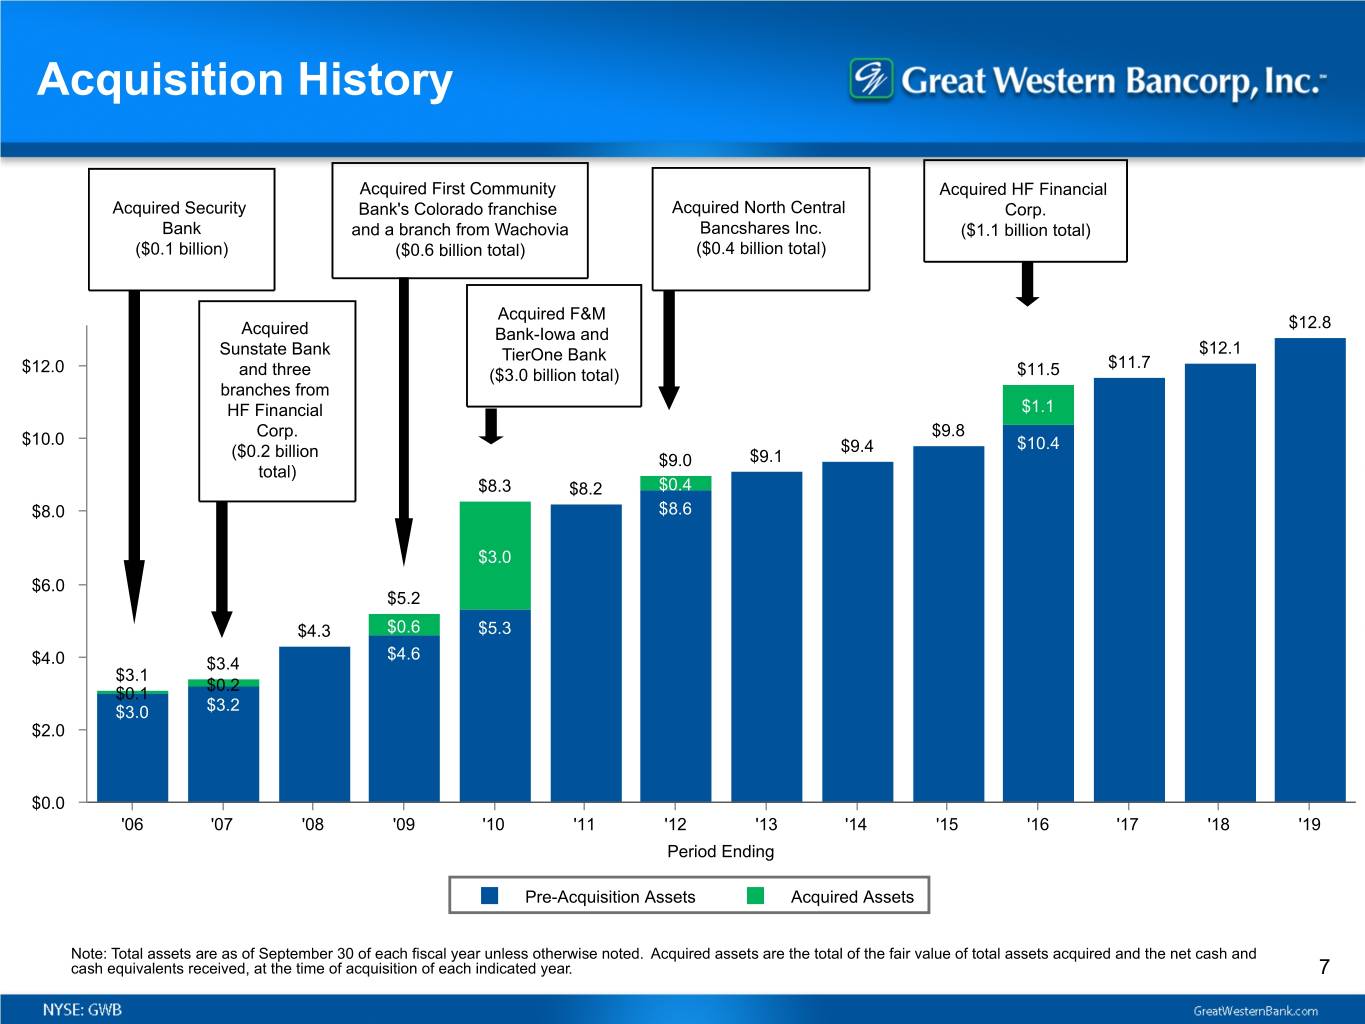
Acquisition History Acquired First Community Acquired HF Financial Acquired Security Bank's Colorado franchise Acquired North Central Corp. Bank and a branch from Wachovia Bancshares Inc. ($1.1 billion total) ($0.1 billion) ($0.6 billion total) ($0.4 billion total) Acquired F&M $12.8 Acquired Bank-Iowa and Sunstate Bank TierOne Bank $12.1 $12.0 $11.7 and three ($3.0 billion total) $11.5 branches from HF Financial $1.1 $10.0 Corp. $9.8 ($0.2 billion $9.4 $10.4 $9.0 $9.1 total) $8.3 $8.2 $0.4 $8.0 $8.6 $3.0 $6.0 $5.2 $4.3 $0.6 $5.3 $4.6 $4.0 $3.4 $3.1 $0.1 $0.2 $3.0 $3.2 $2.0 $0.0 '06 '07 '08 '09 '10 '11 '12 '13 '14 '15 '16 '17 '18 '19 Period Ending Pre-Acquisition Assets Acquired Assets Note: Total assets are as of September 30 of each fiscal year unless otherwise noted. Acquired assets are the total of the fair value of total assets acquired and the net cash and cash equivalents received, at the time of acquisition of each indicated year. 7
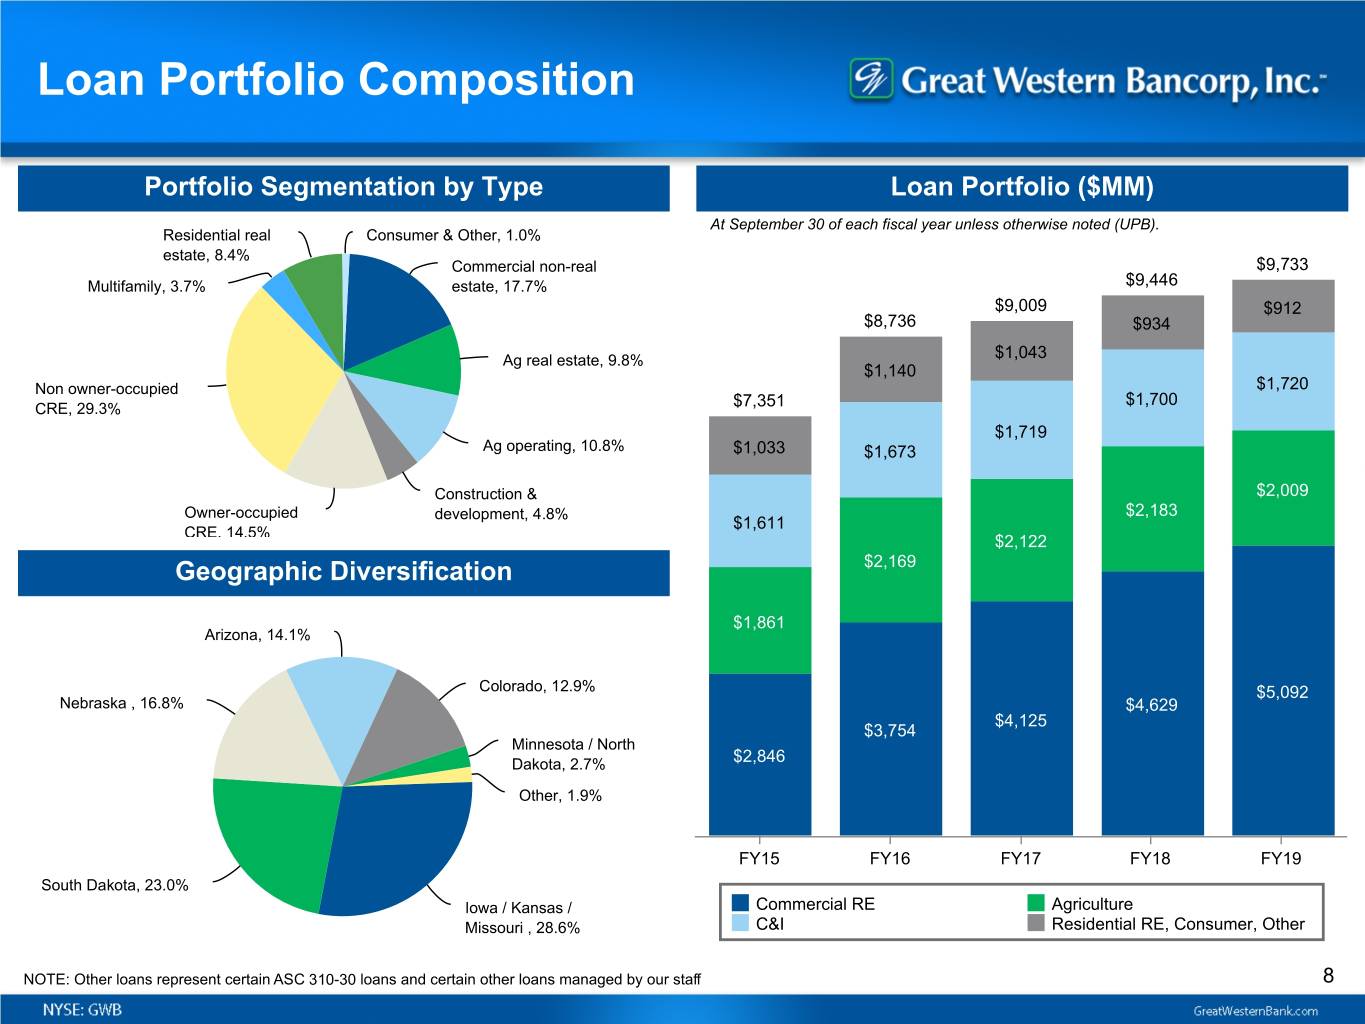
Loan Portfolio Composition Portfolio Segmentation by Type Loan Portfolio ($MM) At September 30 of each fiscal year unless otherwise noted (UPB). Residential real Consumer & Other, 1.0% estate, 8.4% Commercial non-real $9,733 Multifamily, 3.7% estate, 17.7% $9,446 $9,009 $912 $8,736 $934 Ag real estate, 9.8% $1,043 $1,140 Non owner-occupied $1,720 $1,700 CRE, 29.3% $7,351 $1,719 Ag operating, 10.8% $1,033 $1,673 Construction & $2,009 Owner-occupied development, 4.8% $2,183 $1,611 CRE, 14.5% $2,122 Geographic Diversification $2,169 $1,861 Arizona, 14.1% Colorado, 12.9% $5,092 Nebraska , 16.8% $4,629 $4,125 $3,754 Minnesota / North Dakota, 2.7% $2,846 Other, 1.9% FY15 FY16 FY17 FY18 FY19 South Dakota, 23.0% Iowa / Kansas / Commercial RE Agriculture Missouri , 28.6% C&I Residential RE, Consumer, Other NOTE: Other loans represent certain ASC 310-30 loans and certain other loans managed by our staff 8

Additional Loan Information Highlights Incremental Impact from Acquired Loans ($MM) • Loan portfolio is managed to Board-approved concentration Includes ASC 310-20 accretion, ASC limits and regulatory guidelines 310-30 accretion in excess of contractual interest and indem. asset amortization $6.1 • Income statement impact from acquired loans (including $3.9 $3.1 indemnification asset amortization) has not significantly $2.1 $2.1 $1.4 $1.5 $1.3 inflated earnings and is not expected to in the future $0.5 • Management remains comfortable with credit coverage levels $(3.3) 2015 2016 2017 2018 2019 ASC 310-30 Non ASC 310-30 Comprehensive Credit-Related Coverage ($MM) GWB Legacy - Loans GWB Legacy - Loans HF Financial Corp. at Amortized Cost at Fair Value Acquired Loans Other Acquired Loans Total ALLL $ 67,846 $ — $ 1,535 $ 1,393 $ 70,774 Remaining Loan Discount — — 9,463 4,192 13,655 Fair Value Adjustment (Credit) — 6,836 — — 6,836 Total ALLL / Discount / FV Adj. $ 67,846 $ 6,836 $ 10,998 $ 5,585 $ 91,265 Total Loans $ 8,434,221 $ 812,991 $ 386,285 $ 73,266 $ 9,706,763 ALLL / Total Loans 0.80 % — % 0.40 % 1.90 % 0.73 % Discount / Total Loans — % — % 2.45 % 5.72 % 0.14 % FV Adj. / Total Loans — % 0.84 % — % — % 0.07 % Total Coverage / Total Loans ¹ 0.80 % 0.84 % 2.85 % 7.62 % 0.94 % 1 Comprehensive Credit-Related Coverage is a non-GAAP measure that Management believes is useful to demonstarate that the FV adjustments related to credit 9 and remaining loan discounts consider credit risk and should be considered as part of total coverage.

Focused CRE Lending Highlights CRE Portfolio Composition by Type (UPB $MM) • Focus on commercial property investors, owner-occupied Multifamily, 7.2% properties, multi-family property investors and a diverse range of commercial construction with limited exposure to land Construction and development and other speculative projects development, 9.1% • Continued customer demand to finance CRE construction and development, especially in larger markets within our footprint • Regulatory CRE levels of 262% (300% test) and 44% (100% test) Non owner- occupied CRE, • 10 largest CRE exposures represent 9.6% of total CRE and 56.0% Owner-occupied average $49 million CRE, 27.7% • Approximately 3,000 customers with an average exposure of $1,700,000 CRE Portfolio Exposure Sizes (UPB) CRE Net Charge-offs / Average Loans 2 ($MM) $15M+, 29.6% 0.09% <$250K, 2.2% 0.08% $250K - $1M, 7.8% 0.04% 0.02% 0.02% $1M - $5M, 27.8% $5M- $15M, 32.6% FY15 FY16 FY17 FY18 FY19 $0.63 $2.91 $1.55 $3.39 $0.94 NOTE: All customer references are aggregated based on CIF and do not group CIFs with related ownership groups. Industry disclosures based on NAICS codes. 1 Regulatory concentration levels of CRE are 100% of the Company's total risk-based capital for loans for construction, land and land development and 300% of the Company's total risk-based capital for total nonowner-occupied CRE loans. 2 Net charge-offs / average loans represent charge-offs, net of recoveries, as a percent of average loans for each period. Average loans are calculated as the two point average of 10 each period. Ratios annualized for partial-year periods.
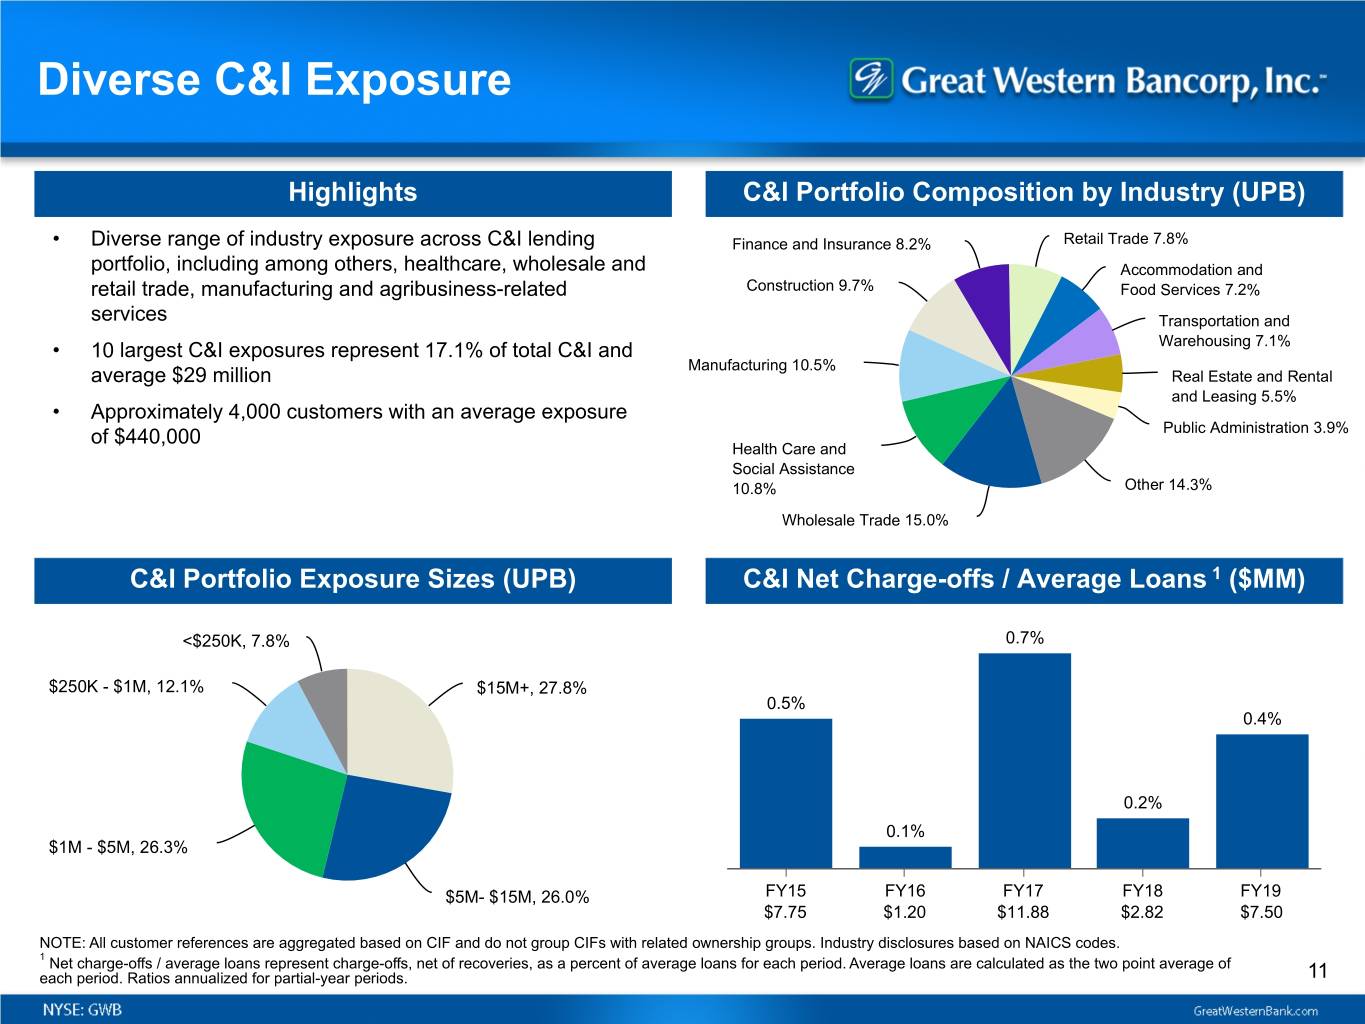
Diverse C&I Exposure Highlights C&I Portfolio Composition by Industry (UPB) • Diverse range of industry exposure across C&I lending Finance and Insurance 8.2% Retail Trade 7.8% portfolio, including among others, healthcare, wholesale and Accommodation and retail trade, manufacturing and agribusiness-related Construction 9.7% Food Services 7.2% services Transportation and • 10 largest C&I exposures represent 17.1% of total C&I and Warehousing 7.1% Manufacturing 10.5% average $29 million Real Estate and Rental and Leasing 5.5% • Approximately 4,000 customers with an average exposure of $440,000 Public Administration 3.9% Health Care and Social Assistance 10.8% Other 14.3% Wholesale Trade 15.0% C&I Portfolio Exposure Sizes (UPB) C&I Net Charge-offs / Average Loans 1 ($MM) <$250K, 7.8% 0.7% $250K - $1M, 12.1% $15M+, 27.8% 0.5% 0.4% 0.2% 0.1% $1M - $5M, 26.3% $5M- $15M, 26.0% FY15 FY16 FY17 FY18 FY19 $7.75 $1.20 $11.88 $2.82 $7.50 NOTE: All customer references are aggregated based on CIF and do not group CIFs with related ownership groups. Industry disclosures based on NAICS codes. 1 Net charge-offs / average loans represent charge-offs, net of recoveries, as a percent of average loans for each period. Average loans are calculated as the two point average of each period. Ratios annualized for partial-year periods. 11
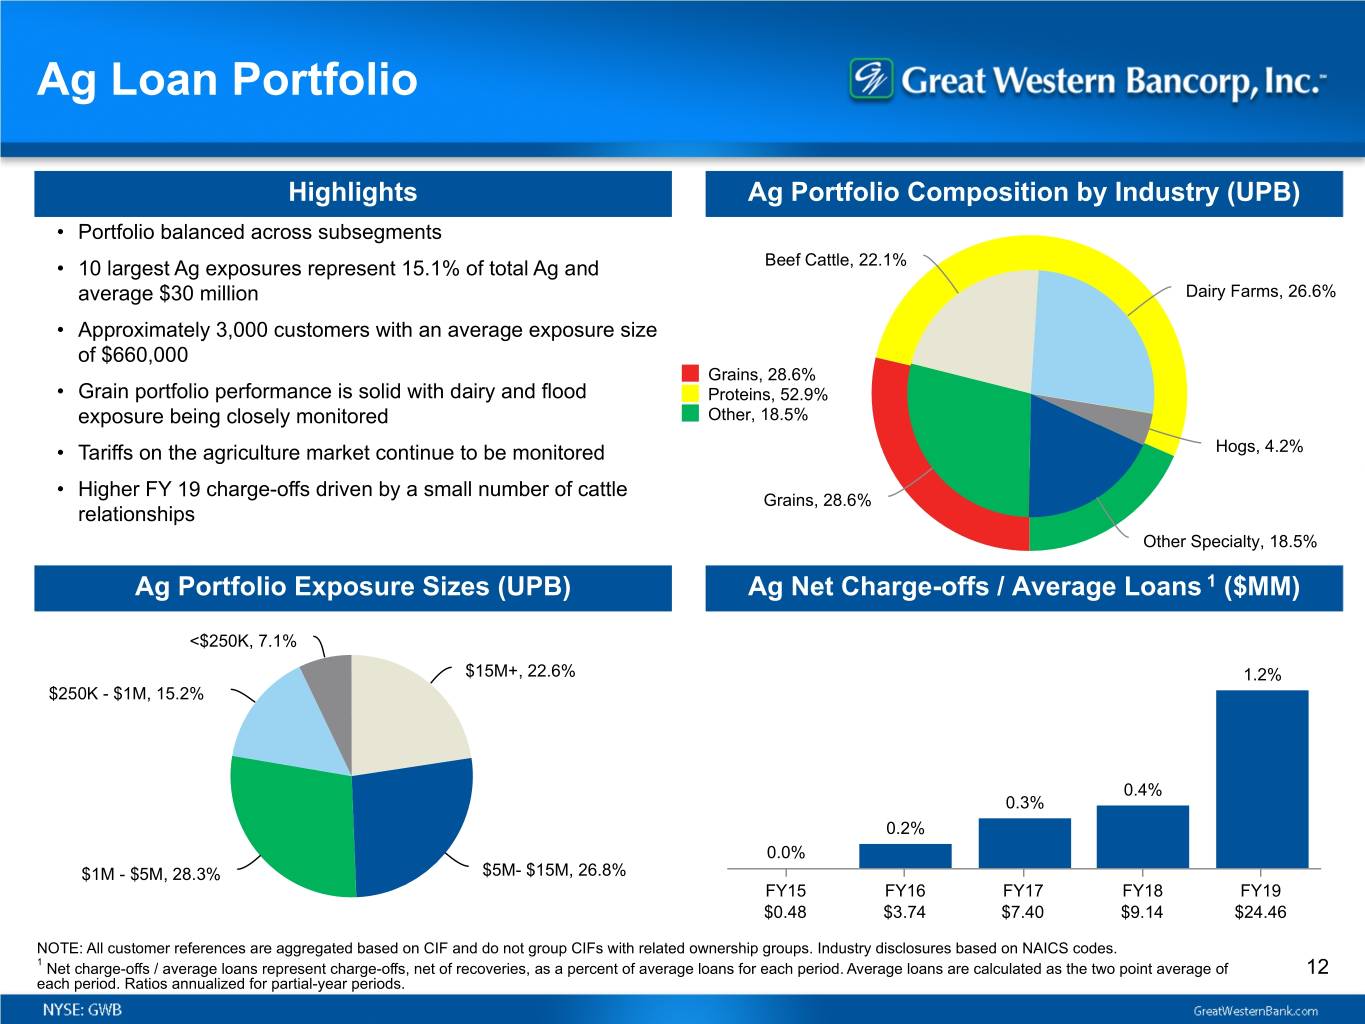
Ag Loan Portfolio Highlights Ag Portfolio Composition by Industry (UPB) • Portfolio balanced across subsegments • 10 largest Ag exposures represent 15.1% of total Ag and Beef Cattle, 22.1% average $30 million Dairy Farms, 26.6% • Approximately 3,000 customers with an average exposure size of $660,000 Grains, 28.6% • Grain portfolio performance is solid with dairy and flood Proteins, 52.9% exposure being closely monitored Other, 18.5% • Tariffs on the agriculture market continue to be monitored Hogs, 4.2% • Higher FY 19 charge-offs driven by a small number of cattle Grains, 28.6% relationships Other Specialty, 18.5% Ag Portfolio Exposure Sizes (UPB) Ag Net Charge-offs / Average Loans 1 ($MM) <$250K, 7.1% $15M+, 22.6% 1.2% $250K - $1M, 15.2% 0.4% 0.3% 0.2% 0.0% $1M - $5M, 28.3% $5M- $15M, 26.8% FY15 FY16 FY17 FY18 FY19 $0.48 $3.74 $7.40 $9.14 $24.46 NOTE: All customer references are aggregated based on CIF and do not group CIFs with related ownership groups. Industry disclosures based on NAICS codes. 1 Net charge-offs / average loans represent charge-offs, net of recoveries, as a percent of average loans for each period. Average loans are calculated as the two point average of 12 each period. Ratios annualized for partial-year periods.
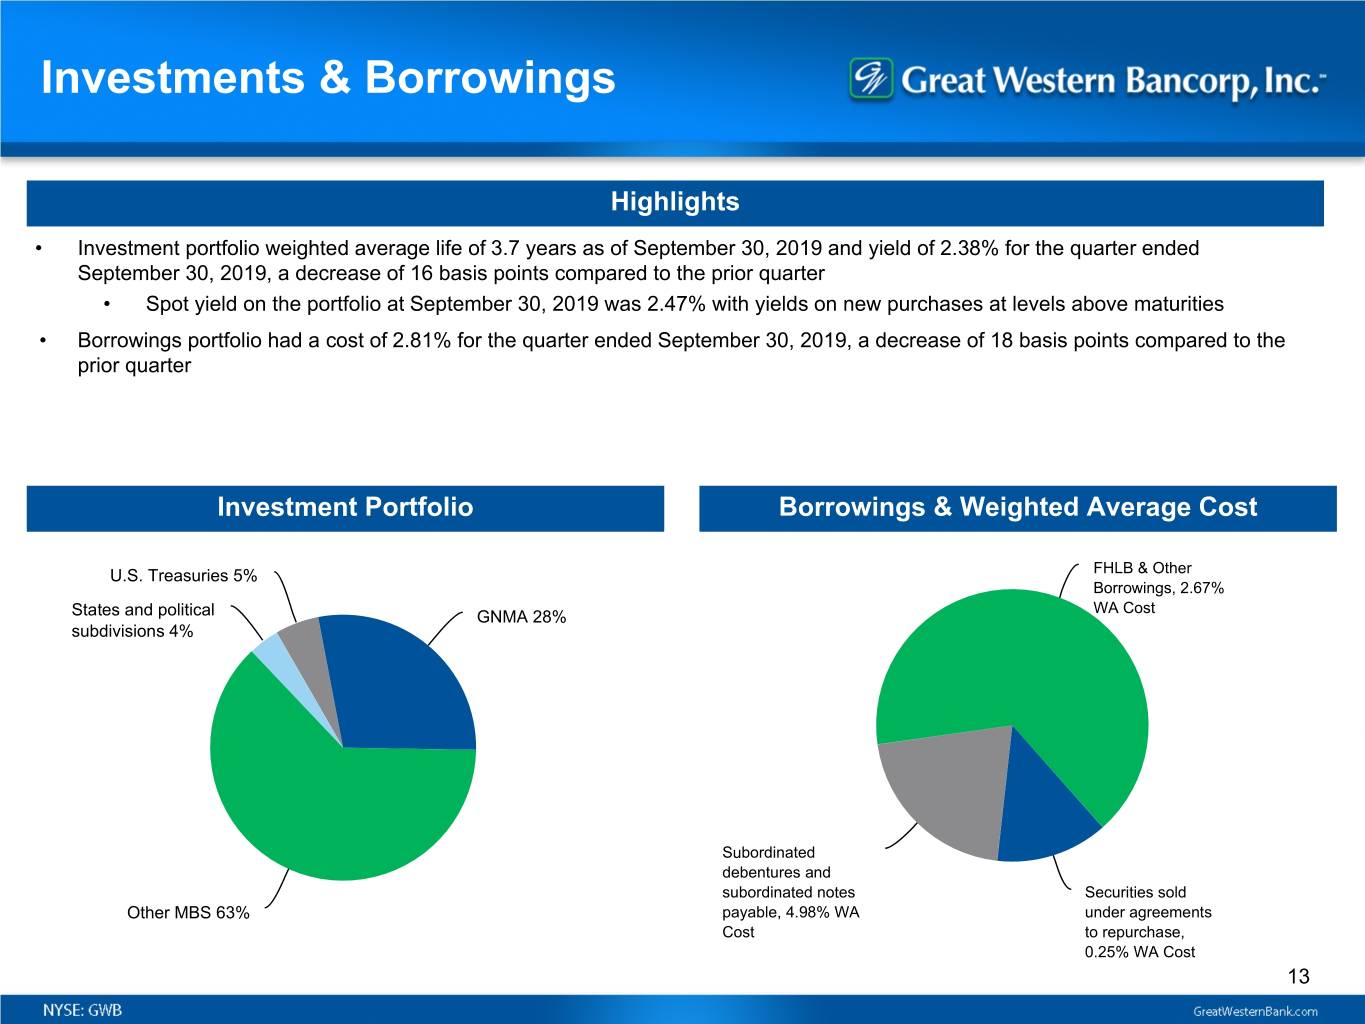
Investments & Borrowings Highlights • Investment portfolio weighted average life of 3.7 years as of September 30, 2019 and yield of 2.38% for the quarter ended September 30, 2019, a decrease of 16 basis points compared to the prior quarter • Spot yield on the portfolio at September 30, 2019 was 2.47% with yields on new purchases at levels above maturities • Borrowings portfolio had a cost of 2.81% for the quarter ended September 30, 2019, a decrease of 18 basis points compared to the prior quarter Investment Portfolio Borrowings & Weighted Average Cost U.S. Treasuries 5% FHLB & Other Borrowings, 2.67% WA Cost States and political GNMA 28% subdivisions 4% Subordinated debentures and subordinated notes Securities sold Other MBS 63% payable, 4.98% WA under agreements Cost to repurchase, 0.25% WA Cost 13

Deposits Portfolio Segmentation by Type Portfolio Over Time ($MM) Other time At September 30 of each fiscal year unless otherwise noted. $10,300 Time certificates certificates, 15.5% $9,733 $250K+, 4.8% $8,978 $2,096 $8,605 Non-Interest- $1,847 Bearing Demand, $1,275 19.0% $1,381 $7,386 1.05% $1,380 NOW, MMDA and 0.65% Savings, 60.7% 0.40% 0.32% 0.32% $6,248 $5,847 $6,043 $5,343 Geographic Diversification $4,638 Nebraska, 24.0% Arizona, 4.9% Colorado, 12.0% North Dakota / Minnesota, 0.6% $1,881 $1,856 $1,843 $1,956 $1,368 FY15 FY16 FY17 FY18 FY19 South Dakota and Iowa / Kansas / Corporate, 30.0% Missouri, 28.5% Non-Interest-Bearing Interest-Bearing Demand Time Cost of Deposits NOTE: South Dakota and Corporate deposits include deposits managed by our Corporate staff. 14
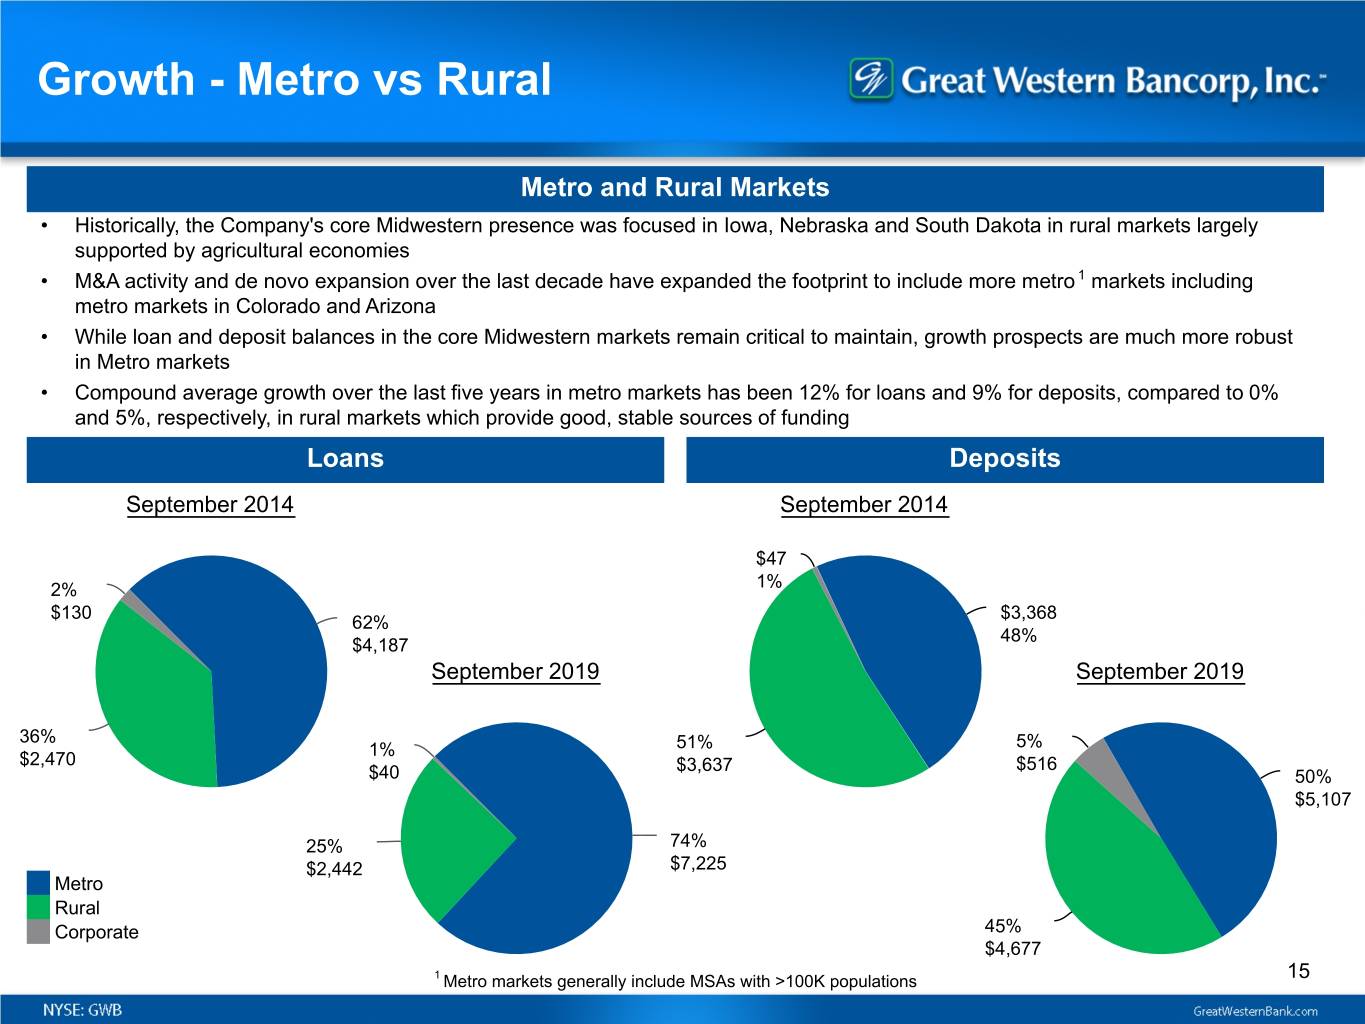
Growth - Metro vs Rural Metro and Rural Markets • Historically, the Company's core Midwestern presence was focused in Iowa, Nebraska and South Dakota in rural markets largely supported by agricultural economies • M&A activity and de novo expansion over the last decade have expanded the footprint to include more metro 1 markets including metro markets in Colorado and Arizona • While loan and deposit balances in the core Midwestern markets remain critical to maintain, growth prospects are much more robust in Metro markets • Compound average growth over the last five years in metro markets has been 12% for loans and 9% for deposits, compared to 0% and 5%, respectively, in rural markets which provide good, stable sources of funding Loans Deposits September 2014 September 2014 $47 1% 2% $130 $3,368 62% 48% $4,187 September 2019 September 2019 36% 51% 5% 1% $2,470 $3,637 $516 $40 50% $5,107 25% 74% $2,442 $7,225 Metro Rural Corporate 45% $4,677 1 Metro markets generally include MSAs with >100K populations 15
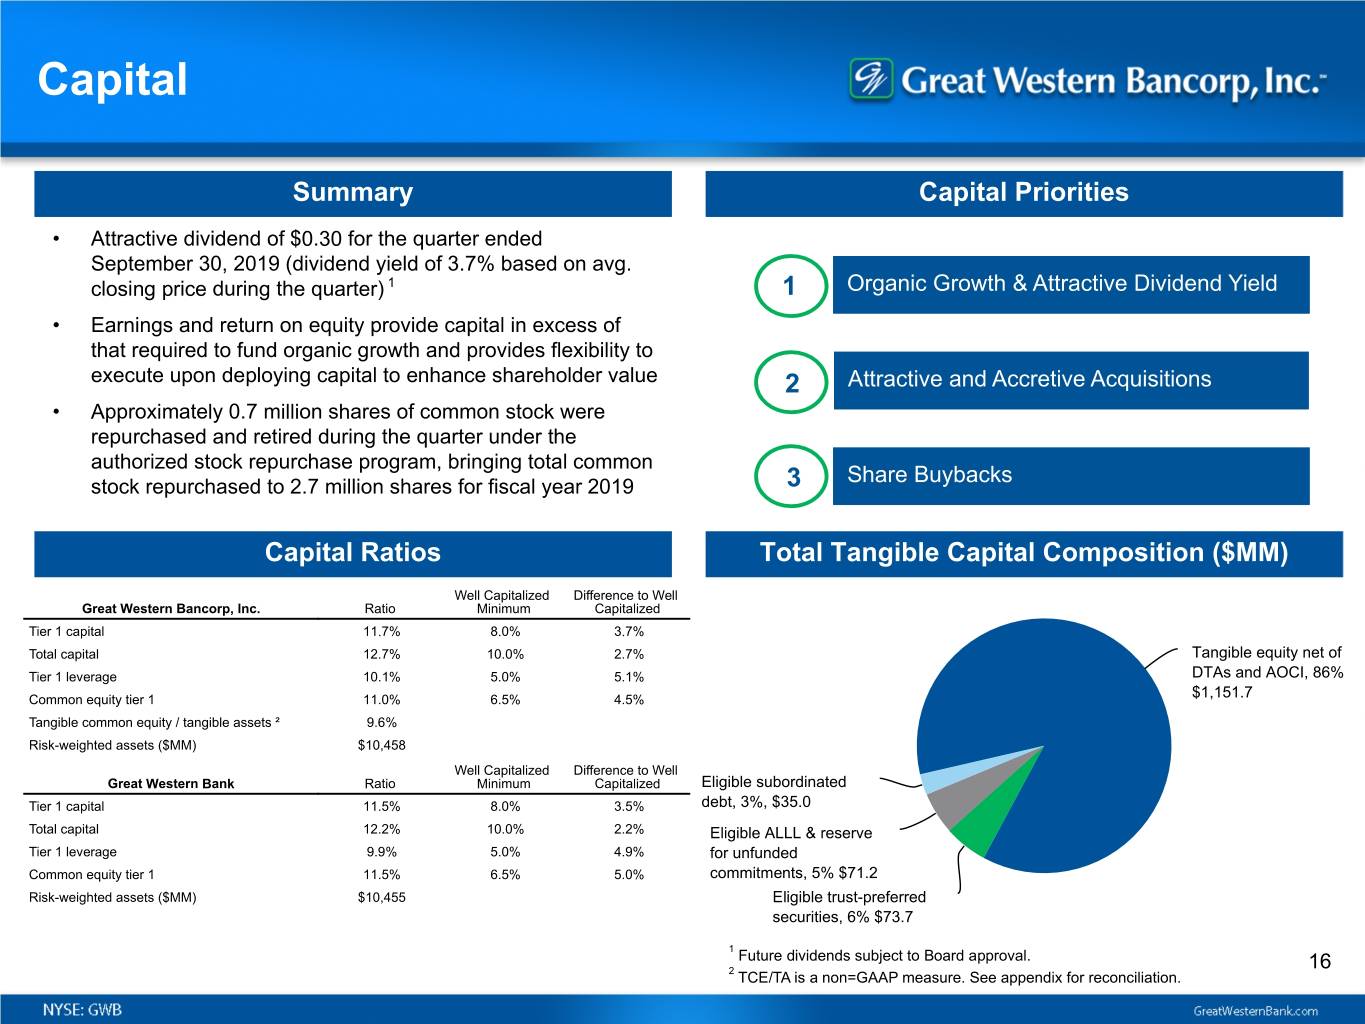
Capital Summary Capital Priorities • Attractive dividend of $0.30 for the quarter ended September 30, 2019 (dividend yield of 3.7% based on avg. closing price during the quarter) 1 1 Organic Growth & Attractive Dividend Yield • Earnings and return on equity provide capital in excess of that required to fund organic growth and provides flexibility to execute upon deploying capital to enhance shareholder value 2 Attractive and Accretive Acquisitions • Approximately 0.7 million shares of common stock were repurchased and retired during the quarter under the authorized stock repurchase program, bringing total common Share Buybacks stock repurchased to 2.7 million shares for fiscal year 2019 3 Capital Ratios Total Tangible Capital Composition ($MM) Well Capitalized Difference to Well Great Western Bancorp, Inc. Ratio Minimum Capitalized Tier 1 capital 11.7% 8.0% 3.7% Total capital 12.7% 10.0% 2.7% Tangible equity net of Tier 1 leverage 10.1% 5.0% 5.1% DTAs and AOCI, 86% Common equity tier 1 11.0% 6.5% 4.5% $1,151.7 Tangible common equity / tangible assets ² 9.6% Risk-weighted assets ($MM) $10,458 Well Capitalized Difference to Well Great Western Bank Ratio Minimum Capitalized Eligible subordinated Tier 1 capital 11.5% 8.0% 3.5% debt, 3%, $35.0 Total capital 12.2% 10.0% 2.2% Eligible ALLL & reserve Tier 1 leverage 9.9% 5.0% 4.9% for unfunded Common equity tier 1 11.5% 6.5% 5.0% commitments, 5% $71.2 Risk-weighted assets ($MM) $10,455 Eligible trust-preferred securities, 6% $73.7 1 Future dividends subject to Board approval. 16 2 TCE/TA is a non=GAAP measure. See appendix for reconciliation.

Interest Rate Sensitivity Summary Sensitivity Modeling ◦ Management believes the balance sheet is well-positioned in the current interest rate environment but funding costs are increasing 15.00% ▪ Internal expense planning is not dependent on rate hikes and NIM expansion 10.00% • Investment portfolio weighted average life of 3.7 years 5.00% • Relatively short average tenor of the loan portfolio (1.4 years at September 30, 2019) due to: 0.00% • Higher proportion of 12-month revolving lines of credit in line with business and agriculture lending focus • Certain fixed-rate loans with original terms greater than 5 -5.00% years are swapped to floating -100 bps +100 bps +200 bps +300 bps +400 bps • Within the loan portfolio, 40.6% is variable or expected to Immediate Gradual reprice in the next 12 months Rate Type Concentration Rate Term Adjustable, 21.8% Fixed Rate Term Adjustable Fixed Rate Term 3% Adjustable - 30% Variable, 29.0% Hedged, 2.0% 1% 1% 20% 1% 7% 8% 31% 27% 30% 10% 25% 14% 19% 12% Fixed - Hedged, 6.1% 9% Fixed, 41.2% 5% 5% 0% <3m 3m- 12m- 3y-5y 5y+ <3m 3m- 12m- 3y-5y 5y+ • Variable/Adjustable: 40% Prime, 30% 5yr Tsy, 30% all other 12m 3y 12m 3y • Fixed: fixed rate through maturity Fixed Adjustable • Variable: rate will reset prior to 10/31/19 Swapped to Variable 17 • Adjustable: adjustable rate that will reset after 10/31/19
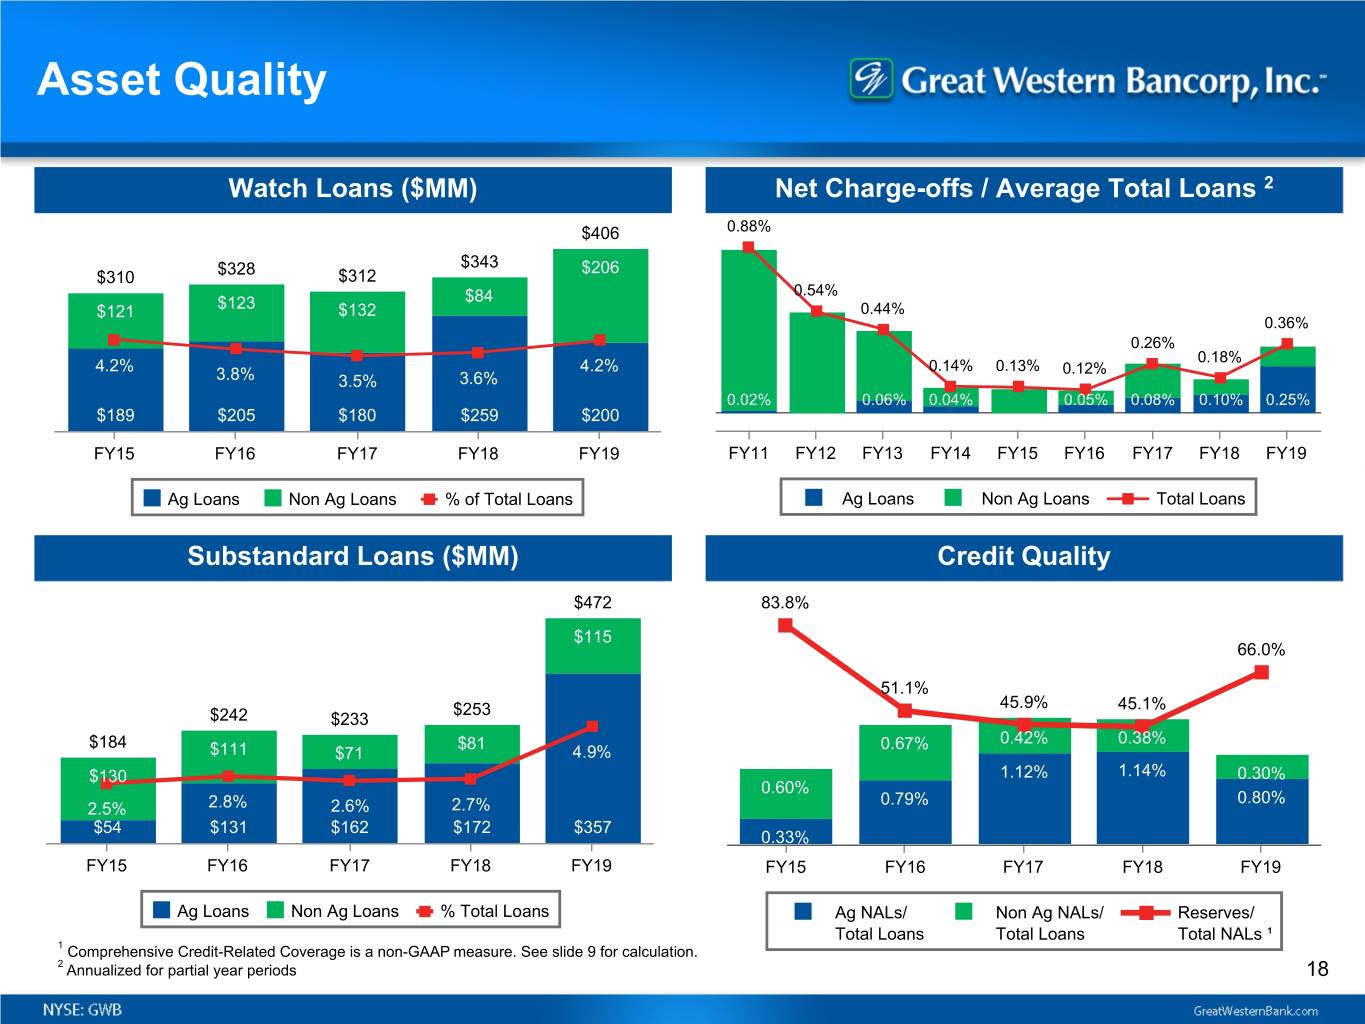
Asset Quality Watch Loans ($MM) Net Charge-offs / Average Total Loans 2 $406 0.88% $343 $206 $310 $328 $312 $84 0.54% $121 $123 $132 0.44% 0.36% 0.26% 0.18% 4.2% 4.2% 0.14% 0.13% 0.12% 3.8% 3.5% 3.6% 0.02% 0.06% 0.04% 0.05% 0.08% 0.10% 0.25% $189 $205 $180 $259 $200 FY15 FY16 FY17 FY18 FY19 FY11 FY12 FY13 FY14 FY15 FY16 FY17 FY18 FY19 Ag Loans Non Ag Loans % of Total Loans Ag Loans Non Ag Loans Total Loans Substandard Loans ($MM) Credit Quality $472 83.8% $115 66.0% 51.1% $253 45.9% 45.1% $242 $233 $184 $81 0.67% 0.42% 0.38% $111 $71 4.9% $130 1.12% 1.14% 0.30% 0.60% 0.79% 0.80% 2.5% 2.8% 2.6% 2.7% $54 $131 $162 $172 $357 0.33% FY15 FY16 FY17 FY18 FY19 FY15 FY16 FY17 FY18 FY19 Ag Loans Non Ag Loans % Total Loans Ag NALs/ Non Ag NALs/ Reserves/ Total Loans Total Loans Total NALs ¹ 1 Comprehensive Credit-Related Coverage is a non-GAAP measure. See slide 9 for calculation. 2 Annualized for partial year periods 18
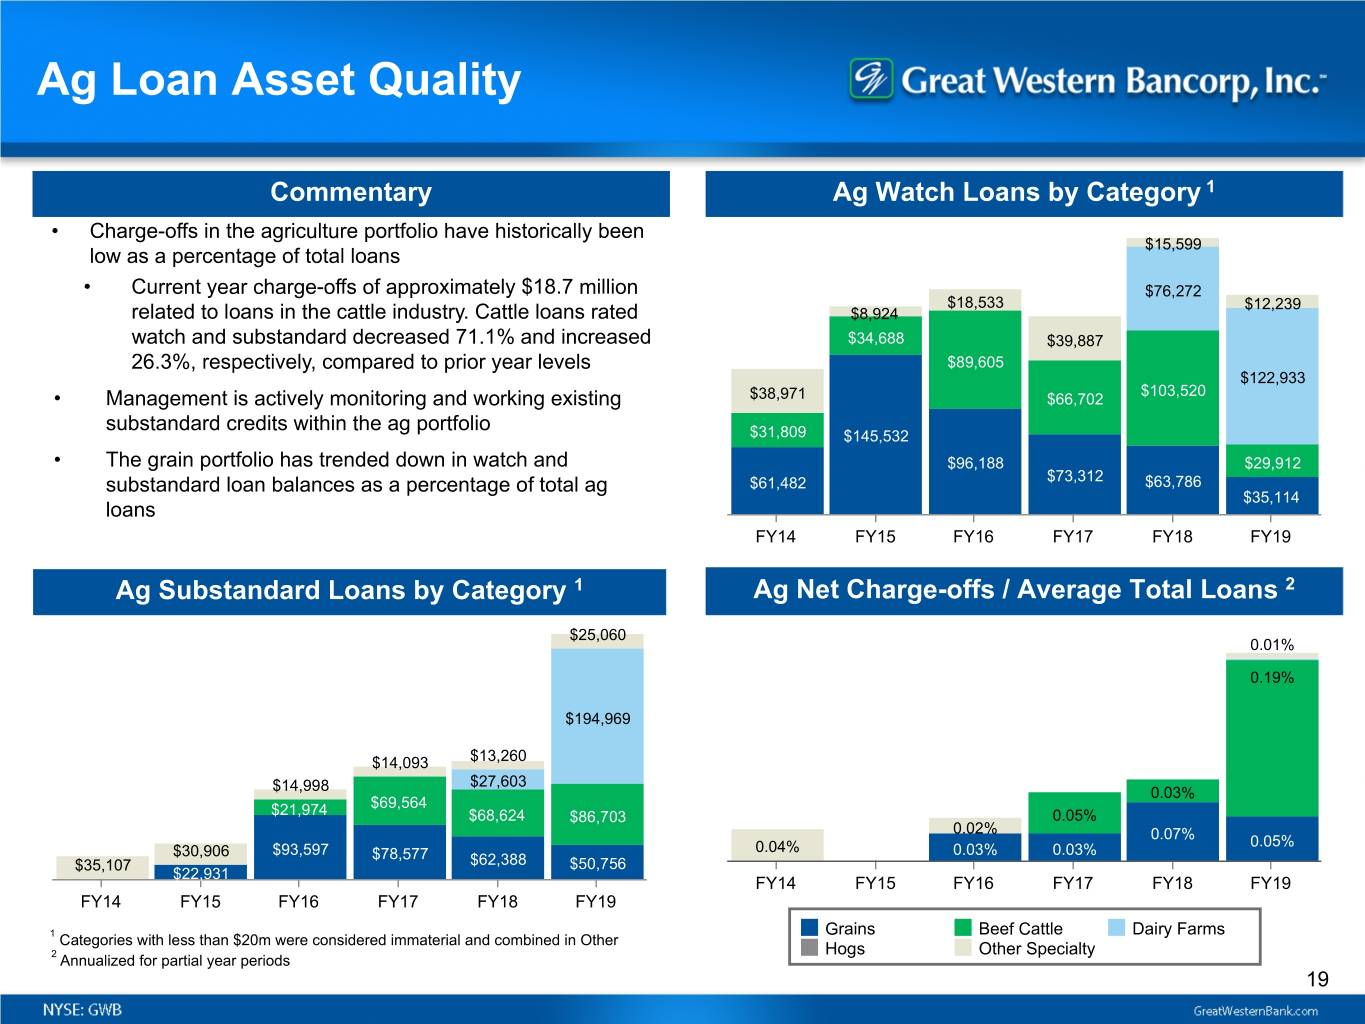
Ag Loan Asset Quality Commentary Ag Watch Loans by Category 1 • Charge-offs in the agriculture portfolio have historically been $15,599 low as a percentage of total loans • Current year charge-offs of approximately $18.7 million $76,272 $18,533 $12,239 related to loans in the cattle industry. Cattle loans rated $8,924 watch and substandard decreased 71.1% and increased $34,688 $39,887 26.3%, respectively, compared to prior year levels $89,605 $122,933 $103,520 • Management is actively monitoring and working existing $38,971 $66,702 substandard credits within the ag portfolio $31,809 $145,532 • The grain portfolio has trended down in watch and $96,188 $29,912 substandard loan balances as a percentage of total ag $61,482 $73,312 $63,786 $35,114 loans FY14 FY15 FY16 FY17 FY18 FY19 Ag Substandard Loans by Category 1 Ag Net Charge-offs / Average Total Loans 2 $25,060 0.01% 0.19% $194,969 $14,093 $13,260 $27,603 $14,998 0.03% $69,564 $21,974 $68,624 $86,703 0.05% 0.02% 0.07% 0.05% $30,906 $93,597 $78,577 0.04% 0.03% 0.03% $35,107 $62,388 $50,756 $22,931 FY14 FY15 FY16 FY17 FY18 FY19 FY14 FY15 FY16 FY17 FY18 FY19 Grains Beef Cattle Dairy Farms 1 Categories with less than $20m were considered immaterial and combined in Other Hogs Other Specialty 2 Annualized for partial year periods 19
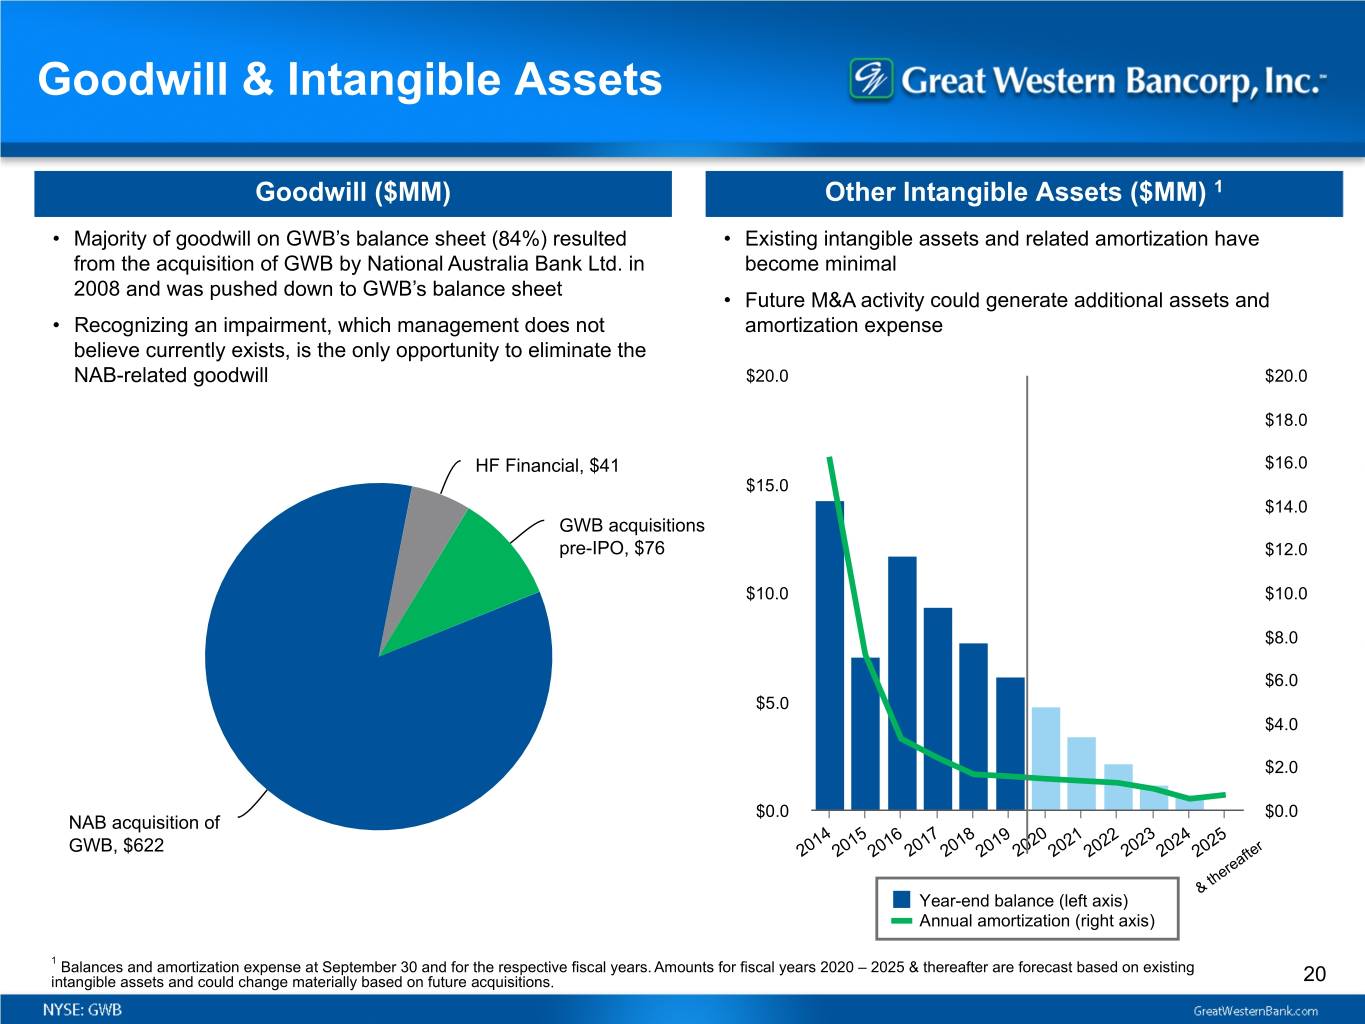
Goodwill & Intangible Assets Goodwill ($MM) Other Intangible Assets ($MM) 1 • Majority of goodwill on GWB’s balance sheet (84%) resulted • Existing intangible assets and related amortization have from the acquisition of GWB by National Australia Bank Ltd. in become minimal 2008 and was pushed down to GWB’s balance sheet • Future M&A activity could generate additional assets and • Recognizing an impairment, which management does not amortization expense believe currently exists, is the only opportunity to eliminate the NAB-related goodwill $20.0 $20.0 $18.0 HF Financial, $41 $16.0 $15.0 $14.0 GWB acquisitions pre-IPO, $76 $12.0 $10.0 $10.0 $8.0 $6.0 $5.0 $4.0 $2.0 $0.0 $0.0 NAB acquisition of GWB, $622 2014 2015 2016 2017 2018 2019 2020 2021 2022 2023 2024 2025 & thereafter Year-end balance (left axis) Annual amortization (right axis) 1 Balances and amortization expense at September 30 and for the respective fiscal years. Amounts for fiscal years 2020 – 2025 & thereafter are forecast based on existing intangible assets and could change materially based on future acquisitions. 20
Income Statement Summary
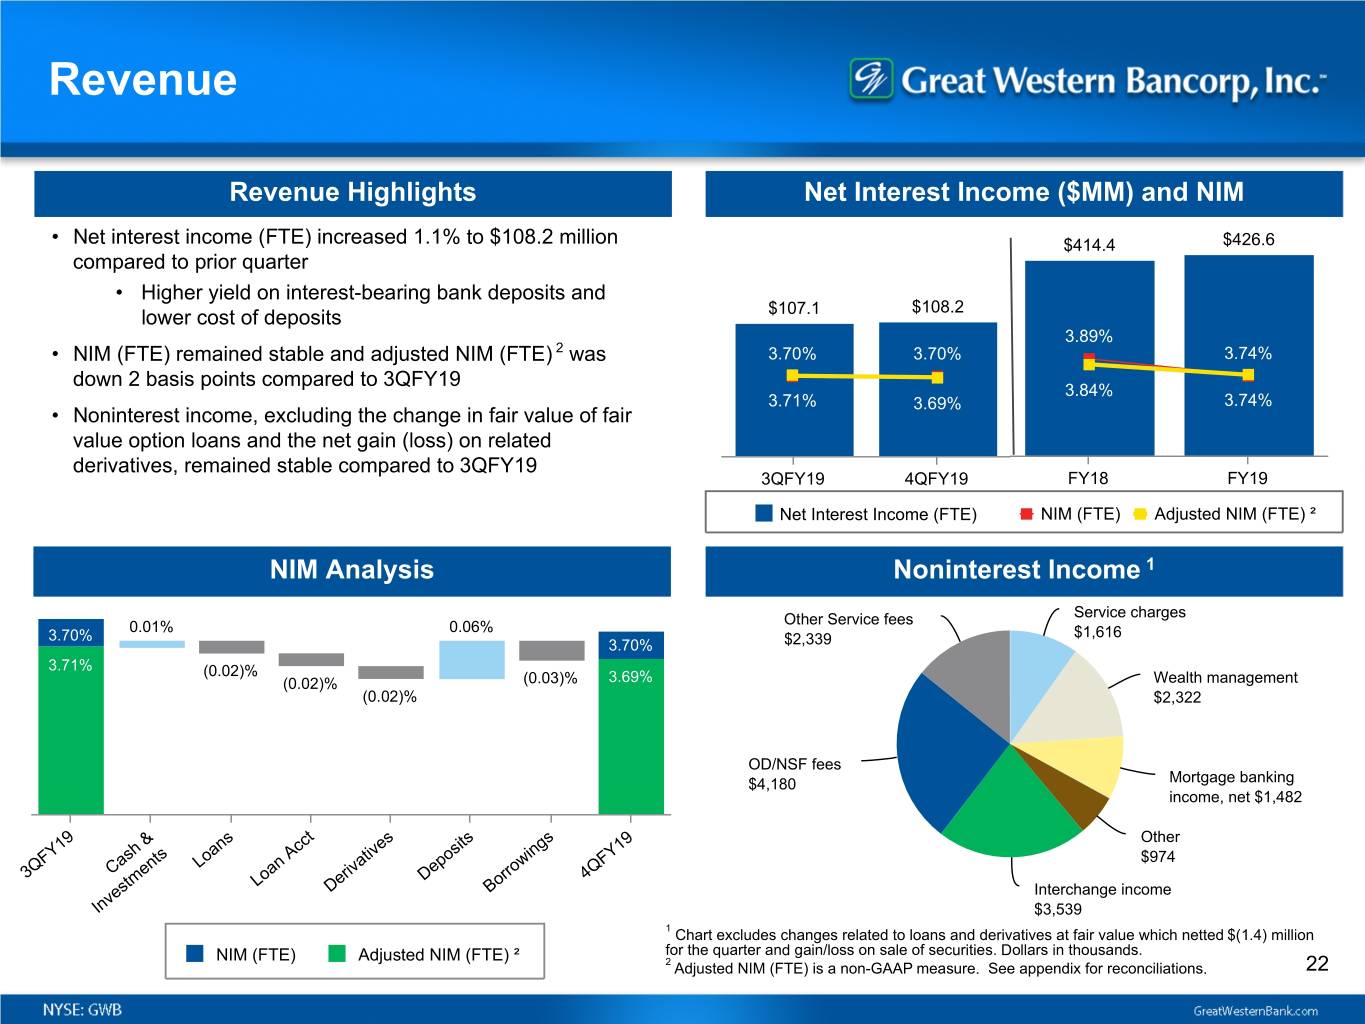
Revenue Revenue Highlights Net Interest Income ($MM) and NIM • Net interest income (FTE) increased 1.1% to $108.2 million $414.4 $426.6 compared to prior quarter • Higher yield on interest-bearing bank deposits and $108.2 lower cost of deposits $107.1 3.89% • NIM (FTE) remained stable and adjusted NIM (FTE) 2 was 3.70% 3.70% 3.74% down 2 basis points compared to 3QFY19 3.84% 3.71% 3.69% 3.74% • Noninterest income, excluding the change in fair value of fair value option loans and the net gain (loss) on related derivatives, remained stable compared to 3QFY19 3QFY19 4QFY19 FY18 FY19 Net Interest Income (FTE) NIM (FTE) Adjusted NIM (FTE) ² NIM Analysis Noninterest Income 1 Service charges 0.01% 0.06% Other Service fees 3.70% $1,616 3.70% $2,339 3.71% (0.02)% (0.02)% (0.03)% 3.69% Wealth management (0.02)% $2,322 OD/NSF fees $4,180 Mortgage banking income, net $1,482 Other Loans $974 3QFY19 Cash & Deposits 4QFY19 Loan Acct Derivatives Borrowings Interchange income Investments $3,539 1 Chart excludes changes related to loans and derivatives at fair value which netted $(1.4) million NIM (FTE) Adjusted NIM (FTE) ² for the quarter and gain/loss on sale of securities. Dollars in thousands. 2 Adjusted NIM (FTE) is a non-GAAP measure. See appendix for reconciliations. 22
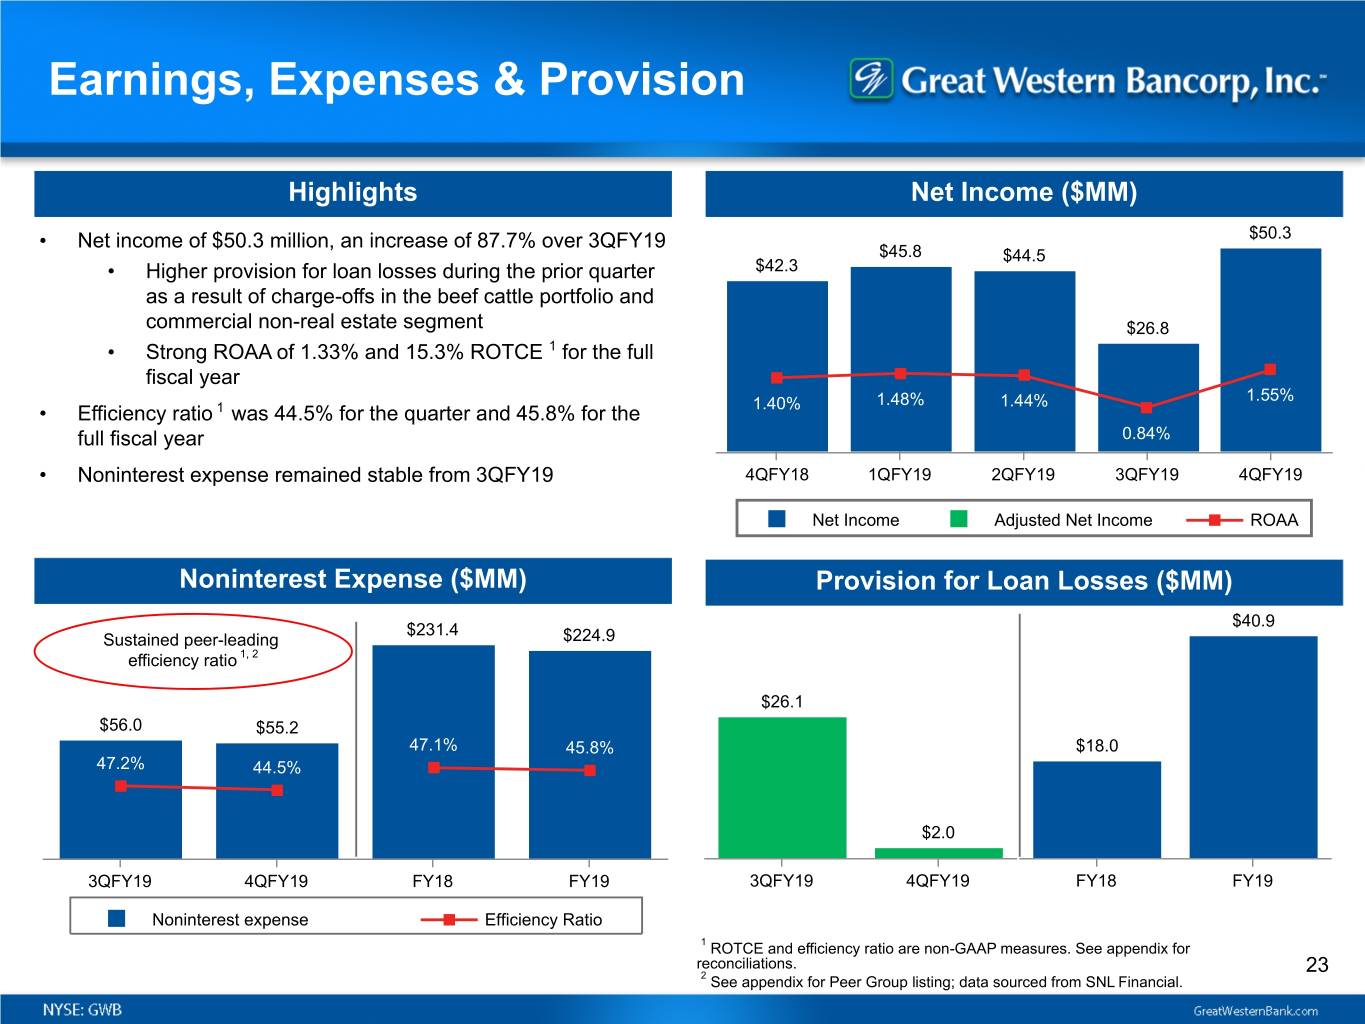
Earnings, Expenses & Provision Highlights Net Income ($MM) • Net income of $50.3 million, an increase of 87.7% over 3QFY19 $50.3 $45.8 $44.5 • Higher provision for loan losses during the prior quarter $42.3 as a result of charge-offs in the beef cattle portfolio and commercial non-real estate segment $26.8 • Strong ROAA of 1.33% and 15.3% ROTCE 1 for the full fiscal year 1.48% 1.44% 1.55% • Efficiency ratio 1 was 44.5% for the quarter and 45.8% for the 1.40% full fiscal year 0.84% • Noninterest expense remained stable from 3QFY19 4QFY18 1QFY19 2QFY19 3QFY19 4QFY19 Net Income Adjusted Net Income ROAA Noninterest Expense ($MM) Provision for Loan Losses ($MM) $40.9 $231.4 Sustained peer-leading $224.9 efficiency ratio 1, 2 $26.1 $56.0 $55.2 47.1% 45.8% $18.0 47.2% 44.5% $2.0 3QFY19 4QFY19 FY18 FY19 3QFY19 4QFY19 FY18 FY19 Noninterest expense Efficiency Ratio 1 ROTCE and efficiency ratio are non-GAAP measures. See appendix for reconciliations. 23 2 See appendix for Peer Group listing; data sourced from SNL Financial.

Proven Business Strategy Focused Business Banking Franchise with Agribusiness Expertise Attract and Retain High-Quality Relationship Bankers Invest in Organic Growth While Optimizing Footprint Deepen Customer Relationships Explore Accretive Strategic Acquisition Opportunities Strong Profitability and Growth Driven by a Highly Efficient Operating Model Strong Capital Generation and Attractive Dividend Risk Management Driving Solid Credit Quality 24
Disclosures Forward-Looking Statements: This presentation contains forward-looking statements within the meaning of the Private Securities Litigation Reform Act of 1995. Statements about Great Western Bancorp, Inc.’s expectations, beliefs, plans, strategies, predictions, forecasts, objectives, assumptions or future events or performance are not historical facts and may be forward-looking. These statements are often, but not always, made through the use of words or phrases such as “anticipates,” “believes,” “can,” “could,” “may,” “predicts,” “potential,” “should,” “will,” “estimate,” “plans,” “projects,” “continuing,” “ongoing,” “expects,” “views,” “intends” and similar words or phrases. In particular, the statements included in this Presentation concerning Great Western Bancorp, Inc.’s expected performance and strategy, the outlook for its agricultural lending segment and the interest rate environment are not historical facts and are forward-looking. Accordingly, the forward-looking statements in this Presentation are only predictions and involve estimates, known and unknown risks, assumptions and uncertainties, that could cause actual results to differ materially from those expressed. All forward-looking statements are necessarily only estimates of future results, and there can be no assurance that actual results will not differ materially from expectations, and, therefore, you are cautioned not to place undue reliance on such statements. Any forward-looking statements are qualified in their entirety by reference to the factors discussed in the sections titled “Item 1A. Risk Factors” and "Cautionary Note Regarding Forward- Looking Statements" in Great Western Bancorp, Inc.’s Annual Report on Form 10-K for the most recently ended fiscal year, and in other periodic filings with the Securities and Exchange Commission. Further, any forward-looking statement speaks only as of the date on which it is made, and Great Western Bancorp, Inc. undertakes no obligation to update any forward-looking statement to reflect events or circumstances after the date on which the statement is made or to reflect the occurrence of unanticipated events. Non-GAAP Financial Measures: This presentation contains non-GAAP measures which our management relies on in making financial and operational decisions about our business and which exclude certain items that we do not consider reflective of our business performance. We believe that the presentation of these measures provides investors with greater transparency and supplemental data relating to our financial condition and results of operations. These non-GAAP measures should be considered in context with our GAAP results. A reconciliation of these non-GAAP measures appears in our earnings release dated October 24, 2019 and in Appendix 1 to this presentation. Our earnings release and this presentation are available in the Investor Relations section of our website at www.greatwesternbank.com. Our earnings release and this presentation are also available as part of our Current Report on Form 8-K filed with the Securities and Exchange Commission on October 24, 2019. Explanatory Note: In this presentation, all financial information presented refers to the financial results of Great Western Bancorp, Inc. combined with those of its predecessor, Great Western Bancorporation, Inc. 25
Appendix 1 Non-GAAP Measures

Non-GAAP Measures At or for the twelve months ended: At or for the three months ended: September 30, September 30, September 30, June 30, March 31, December 31, September 30, 2019 2018 2019 2019 2019 2018 2018 Adjusted net income and adjusted earnings per common share: Net income - GAAP $ 167,365 $ 157,916 $ 50,285 $ 26,783 $ 44,511 $ 45,786 $ 42,281 Add: Deferred taxes revaluation due to Tax Reform Act — 13,586 — — — — — Adjusted net income $ 167,365 $ 171,502 $ 50,285 $ 26,783 $ 44,511 $ 45,786 $ 42,281 Weighted average diluted common shares outstanding 57,257,061 59,131,650 56,804,172 57,110,103 57,074,674 58,039,292 59,122,699 Earnings per common share - diluted $ 2.92 $ 2.67 $ 0.89 $ 0.47 $ 0.78 $ 0.79 $ 0.72 Adjusted earnings per common share - diluted $ 2.92 $ 2.90 $ 0.89 $ 0.47 $ 0.78 $ 0.79 $ 0.72 Tangible net income and return on average tangible common equity: Net income - GAAP $ 167,365 $ 157,916 $ 50,285 $ 26,783 $ 44,511 $ 45,786 $ 42,281 Add: Amortization of intangible assets, net of tax 1,337 1,460 315 335 343 344 343 Tangible net income $ 168,702 $ 159,376 $ 50,600 $ 27,118 $ 44,854 $ 46,130 $ 42,624 Average common equity $ 1,847,477 $ 1,788,153 $ 1,885,785 $ 1,864,132 $ 1,822,940 $ 1,817,052 $ 1,825,312 Less: Average goodwill and other intangible assets 745,920 747,513 745,349 745,718 746,107 746,503 746,900 Average tangible common equity $ 1,101,557 $ 1,040,640 $ 1,140,436 $ 1,118,414 $ 1,076,833 $ 1,070,549 $ 1,078,412 Return on average common equity * 9.1 % 8.8 % 10.6 % 5.8 % 9.9 % 10.0 % 9.2 % Return on average tangible common equity ** 15.3 % 15.3 % 17.6 % 9.7 % 16.9 % 17.1 % 15.7 % * Calculated as net income - GAAP divided by average common equity. Annualized for partial-year periods. ** Calculated as tangible net income divided by average tangible common equity. Annualized for partial-year periods. 27

Non-GAAP Measures At or for the twelve months ended: At or for the three months ended: September 30, September 30, September 30, June 30, March 31, December 31, September 30, 2019 2018 2019 2019 2019 2018 2018 Adjusted net interest income and adjusted net interest margin (fully-tax equivalent basis): Net interest income - GAAP $ 420,708 $ 407,837 $ 106,709 $ 105,629 $ 103,475 $ 104,894 $ 101,990 Add: Tax equivalent adjustment 5,843 6,597 1,487 1,424 1,442 1,490 1,687 Net interest income (FTE) 426,551 414,434 108,196 107,053 104,917 106,384 103,677 Add: Current realized derivative gain (loss) 619 (5,365) (127) 321 405 21 (419) Adjusted net interest income (FTE) $ 427,170 $ 409,069 $ 108,069 $ 107,374 $ 105,322 $ 106,405 $ 103,258 Average interest-earning assets $ 11,414,926 $ 10,647,357 $ 11,609,823 $ 11,617,521 $ 11,345,559 $ 11,086,800 $ 10,857,168 Net interest margin (FTE) * 3.74 % 3.89 % 3.70 % 3.70 % 3.75 % 3.81 % 3.79 % Adjusted net interest margin (FTE) ** 3.74 % 3.84 % 3.69 % 3.71 % 3.76 % 3.81 % 3.77 % * Calculated as net interest income (FTE) divided by average interest earning assets. Annualized for partial-year periods. ** Calculated as adjusted net interest income (FTE) divided by average interest earning assets. Annualized for partial-year periods. Adjusted interest income and adjusted yield (fully- tax equivalent basis), on non-ASC 310-30 loans: Interest income - GAAP $ 490,910 $ 439,789 $ 124,923 $ 124,098 $ 121,528 $ 120,361 $ 115,284 Add: Tax equivalent adjustment 5,843 6,597 1,487 1,424 1,442 1,490 1,687 Interest income (FTE) 496,753 446,386 126,410 125,522 122,970 121,851 116,971 Add: Current realized derivative gain (loss) 619 (5,365) (127) 321 405 21 (419) Adjusted interest income (FTE) $ 497,372 $ 441,021 $ 126,283 $ 125,843 $ 123,375 $ 121,872 $ 116,552 Average non-ASC 310-30 loans $ 9,610,956 $ 9,106,519 $ 9,693,395 $ 9,699,433 $ 9,615,096 $ 9,435,901 $ 9,299,318 Yield (FTE) * 5.17 % 4.90 % 5.17 % 5.19 % 5.19 % 5.12 % 4.99 % Adjusted yield (FTE) ** 5.18 % 4.84 % 5.17 % 5.20 % 5.20 % 5.12 % 4.97 % * Calculated as interest income (FTE) divided by average loans. Annualized for partial-year periods. ** Calculated as adjusted interest income (FTE) divided by average loans. Annualized for partial-year periods. 28
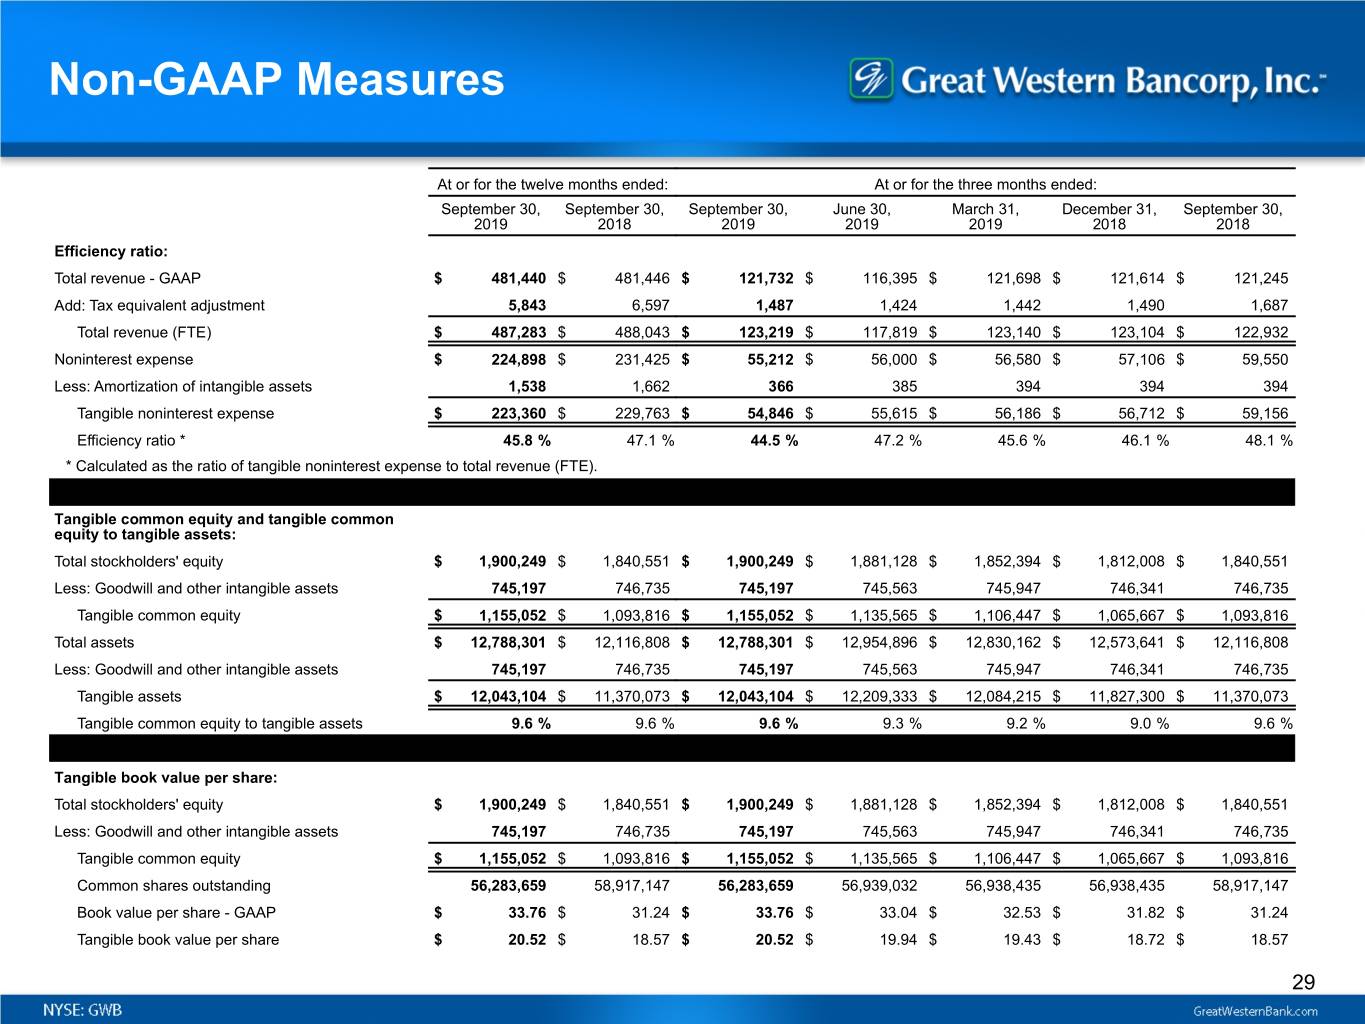
Non-GAAP Measures At or for the twelve months ended: At or for the three months ended: September 30, September 30, September 30, June 30, March 31, December 31, September 30, 2019 2018 2019 2019 2019 2018 2018 Efficiency ratio: Total revenue - GAAP $ 481,440 $ 481,446 $ 121,732 $ 116,395 $ 121,698 $ 121,614 $ 121,245 Add: Tax equivalent adjustment 5,843 6,597 1,487 1,424 1,442 1,490 1,687 Total revenue (FTE) $ 487,283 $ 488,043 $ 123,219 $ 117,819 $ 123,140 $ 123,104 $ 122,932 Noninterest expense $ 224,898 $ 231,425 $ 55,212 $ 56,000 $ 56,580 $ 57,106 $ 59,550 Less: Amortization of intangible assets 1,538 1,662 366 385 394 394 394 Tangible noninterest expense $ 223,360 $ 229,763 $ 54,846 $ 55,615 $ 56,186 $ 56,712 $ 59,156 Efficiency ratio * 45.8 % 47.1 % 44.5 % 47.2 % 45.6 % 46.1 % 48.1 % * Calculated as the ratio of tangible noninterest expense to total revenue (FTE). Tangible common equity and tangible common equity to tangible assets: Total stockholders' equity $ 1,900,249 $ 1,840,551 $ 1,900,249 $ 1,881,128 $ 1,852,394 $ 1,812,008 $ 1,840,551 Less: Goodwill and other intangible assets 745,197 746,735 745,197 745,563 745,947 746,341 746,735 Tangible common equity $ 1,155,052 $ 1,093,816 $ 1,155,052 $ 1,135,565 $ 1,106,447 $ 1,065,667 $ 1,093,816 Total assets $ 12,788,301 $ 12,116,808 $ 12,788,301 $ 12,954,896 $ 12,830,162 $ 12,573,641 $ 12,116,808 Less: Goodwill and other intangible assets 745,197 746,735 745,197 745,563 745,947 746,341 746,735 Tangible assets $ 12,043,104 $ 11,370,073 $ 12,043,104 $ 12,209,333 $ 12,084,215 $ 11,827,300 $ 11,370,073 Tangible common equity to tangible assets 9.6 % 9.6 % 9.6 % 9.3 % 9.2 % 9.0 % 9.6 % Tangible book value per share: Total stockholders' equity $ 1,900,249 $ 1,840,551 $ 1,900,249 $ 1,881,128 $ 1,852,394 $ 1,812,008 $ 1,840,551 Less: Goodwill and other intangible assets 745,197 746,735 745,197 745,563 745,947 746,341 746,735 Tangible common equity $ 1,155,052 $ 1,093,816 $ 1,155,052 $ 1,135,565 $ 1,106,447 $ 1,065,667 $ 1,093,816 Common shares outstanding 56,283,659 58,917,147 56,283,659 56,939,032 56,938,435 56,938,435 58,917,147 Book value per share - GAAP $ 33.76 $ 31.24 $ 33.76 $ 33.04 $ 32.53 $ 31.82 $ 31.24 Tangible book value per share $ 20.52 $ 18.57 $ 20.52 $ 19.94 $ 19.43 $ 18.72 $ 18.57 29
Appendix 2 Agriculture Lending & Economy
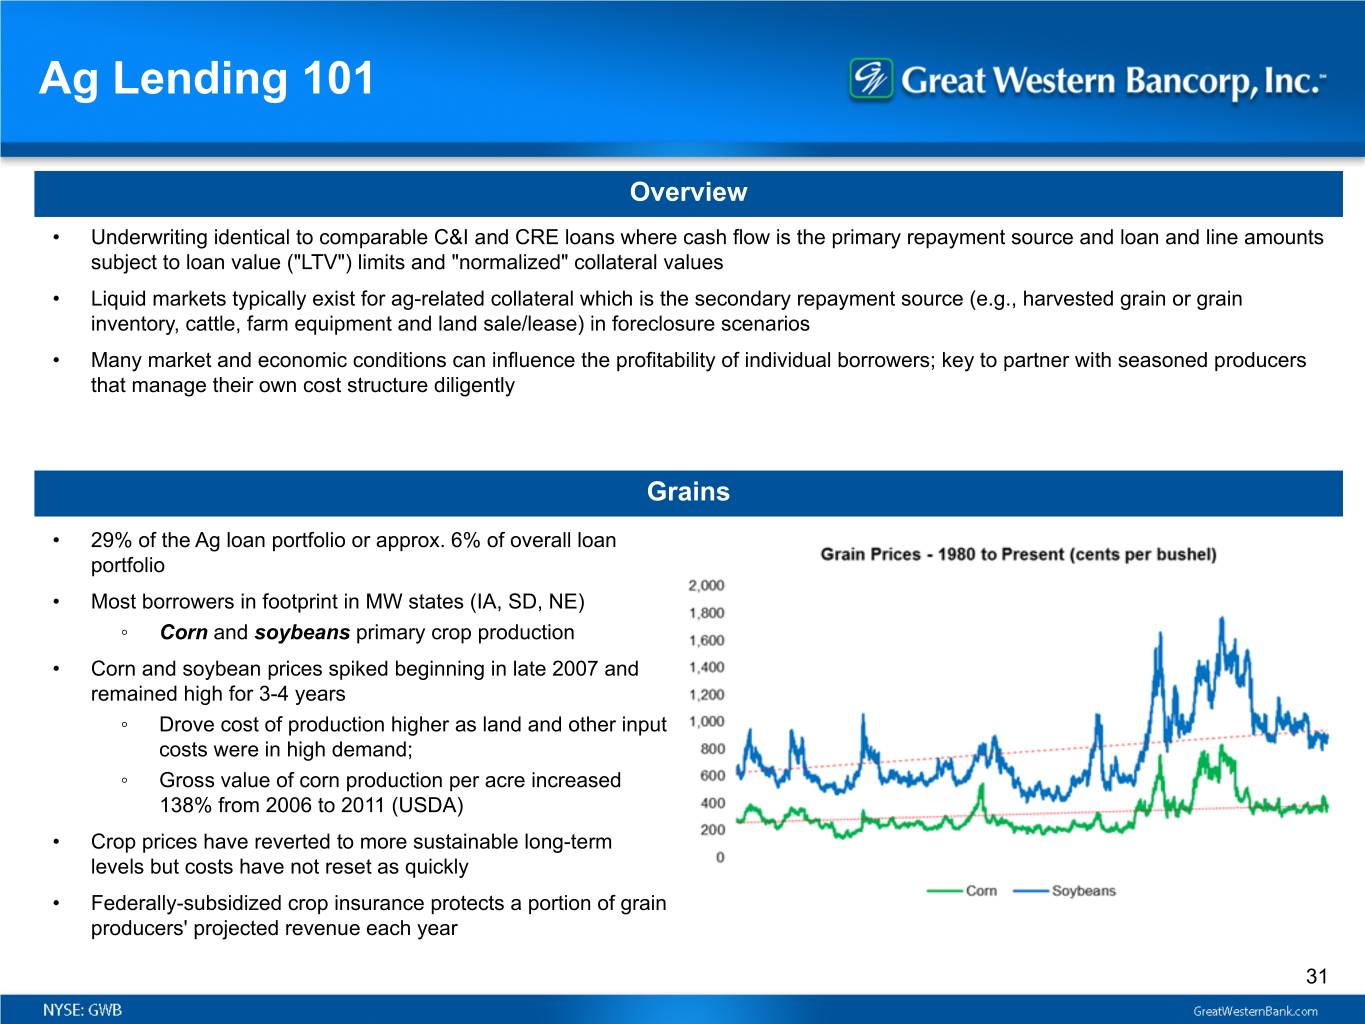
Ag Lending 101 Overview • Underwriting identical to comparable C&I and CRE loans where cash flow is the primary repayment source and loan and line amounts subject to loan value ("LTV") limits and "normalized" collateral values • Liquid markets typically exist for ag-related collateral which is the secondary repayment source (e.g., harvested grain or grain inventory, cattle, farm equipment and land sale/lease) in foreclosure scenarios • Many market and economic conditions can influence the profitability of individual borrowers; key to partner with seasoned producers that manage their own cost structure diligently Grains • 29% of the Ag loan portfolio or approx. 6% of overall loan portfolio • Most borrowers in footprint in MW states (IA, SD, NE) ◦ Corn and soybeans primary crop production • Corn and soybean prices spiked beginning in late 2007 and remained high for 3-4 years ◦ Drove cost of production higher as land and other input costs were in high demand; ◦ Gross value of corn production per acre increased 138% from 2006 to 2011 (USDA) • Crop prices have reverted to more sustainable long-term levels but costs have not reset as quickly • Federally-subsidized crop insurance protects a portion of grain producers' projected revenue each year 31

Ag Lending 101 (cont'd) Beef Cattle • 22% of the Ag loan portfolio or approx. 5% overall, primarily in SD • Beef cattle producers include: ◦ Cow-calf operators that breed cattle and raise calves to a certain weight (typically 500-600 lbs.; "Feeder Cattle") ◦ Feedlots who purchase feeder cattle and finish them for sale to processors (typically 1200+lbs.; "Live Cattle") ◦ GWB portfolio split roughly 75/25 as of September 30, 2019 • Industry is very cyclical driven by supply and demand (e.g., prices paid by feedlots dictate how many calves are bred and which stock cattle are retained for breeding vs. slaughtered) Dairy • 27% of the Ag loan portfolio or approx. 5% overall, primarily in AZ • Very cyclical pricing over time; producers that manage costs, are vertically integrated and use risk management techniques are best suited to generate profitability over time • Arizona has a milk quota system that provides some support for milk price margins for units of production providing limited stability for producers 32

Ag Economy Highlights • Industry balance sheets remain strong with debt/asset and debt/equity ratios below long-term averages and significantly below 1980s levels that precipitated, and resulted, from the period of high losses in the early 1980s • Ag sector net charge-offs, which have historically been low for the industry and for Great Western Bank, are rising Farm Balance Sheet Overview 1 1 Source: USDA Economic Research Service; 2019 is forecast data 33
Appendix 3 Peer Group

Peer Group • BancorpSouth Bank • Glacier Bancorp, Inc. • Banner Corporation • Heartland Financial USA, Inc. • Berkshire Hills Bancorp, Inc. • Old National Bancorp • Columbia Banking System, Inc. • Renasant Corporation • Community Bank System, Inc. • TCF Financial Corporation • Customers Bancorp, Inc. • Trustmark Corporation • CVB Financial Corp. • UMB Financial Corporation • First BanCorp. • United Bankshares, Inc. • First Midwest Bancorp, Inc. • United Community Banks, Inc. • Fulton Financial Corporation 35
Appendix 4 MSA Highlights
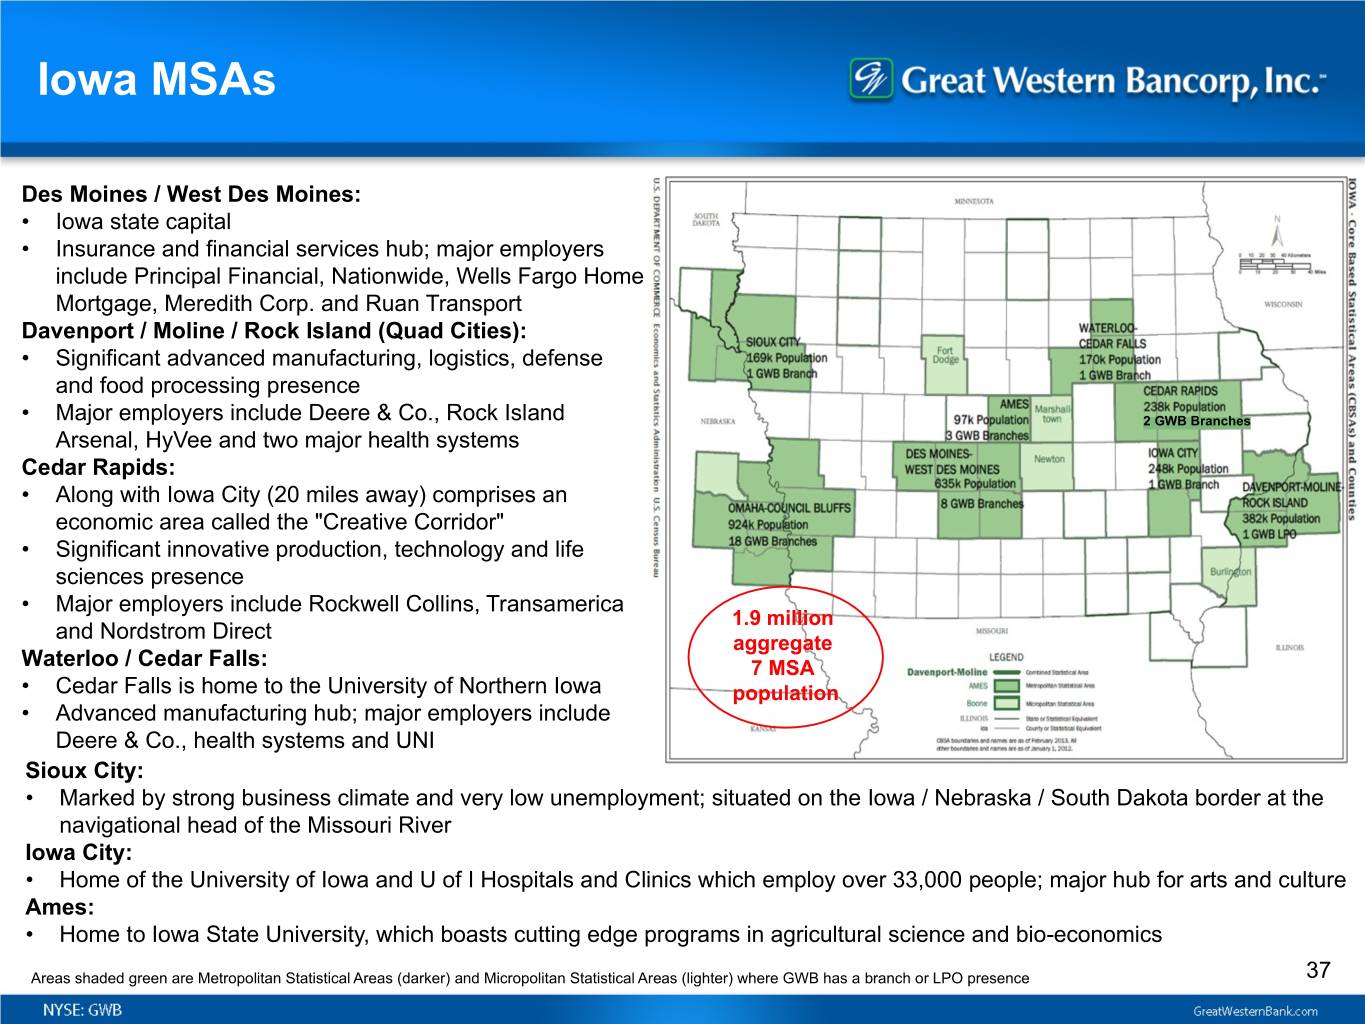
Iowa MSAs Des Moines / West Des Moines: • Iowa state capital • Insurance and financial services hub; major employers include Principal Financial, Nationwide, Wells Fargo Home Mortgage, Meredith Corp. and Ruan Transport Davenport / Moline / Rock Island (Quad Cities): • Significant advanced manufacturing, logistics, defense and food processing presence • Major employers include Deere & Co., Rock Island 2 GWB Branches Arsenal, HyVee and two major health systems Cedar Rapids: • Along with Iowa City (20 miles away) comprises an economic area called the "Creative Corridor" • Significant innovative production, technology and life sciences presence • Major employers include Rockwell Collins, Transamerica 1.9 million and Nordstrom Direct aggregate Waterloo / Cedar Falls: 7 MSA • Cedar Falls is home to the University of Northern Iowa population • Advanced manufacturing hub; major employers include Deere & Co., health systems and UNI Sioux City: • Marked by strong business climate and very low unemployment; situated on the Iowa / Nebraska / South Dakota border at the navigational head of the Missouri River Iowa City: • Home of the University of Iowa and U of I Hospitals and Clinics which employ over 33,000 people; major hub for arts and culture Ames: • Home to Iowa State University, which boasts cutting edge programs in agricultural science and bio-economics Areas shaded green are Metropolitan Statistical Areas (darker) and Micropolitan Statistical Areas (lighter) where GWB has a branch or LPO presence 37

Nebraska MSAs Omaha/ Council Bluffs: • MSA population of nearly 1 million • Headquarters to four Fortune 500 companies including Berkshire Hathaway, Union Pacific, Mutual of Omaha and Peter Kiewit & Sons • Home of Creighton University, University of Nebraska- Omaha and University of Nebraska Medical Center Lincoln: • Nebraska state capital • Home of the University of Nebraska • Insurance and financial services hub with key employers 1.3 million including Assurity Life, Ameritas and State Farm aggregate • Other robust private sector employers in transportation, 3 MSA manufacturing and start-up tech firms population Grand Island: • Part of the "Tri-Cities" of Central Nebraska along with Hastings and Kearney - bringing the total trade area population to nearly 150,000 • Strong agricultural and manufacturing presence 38 Areas shaded green are Metropolitan Statistical Areas (darker) and Micropolitan Statistical Areas (lighter) where GWB has a branch or LPO presence

South Dakota MSAs Sioux Falls: • Largest South Dakota MSA has experienced rapid growth in recent years • Hub for regional health care with two major health systems including Sanford Health, which has received considerable philanthropic support, and Avera Health • Strong banking and finance presence including the home of corporate charters for Wells Fargo and Citi Rapid City: • Gateway to prime South Dakota tourism industry including the Black Hills, Mt. Rushmore, the Badlands, Deadwood (historical and casinos) and the annual Sturgis motorcycle rally • Federal government is a major employer between six national parks in close proximity and Ellsworth Air Force 400,000 Base aggregate 2 MSA population 39 Areas shaded green are Metropolitan Statistical Areas (darker) and Micropolitan Statistical Areas (lighter) where GWB has a branch or LPO presence
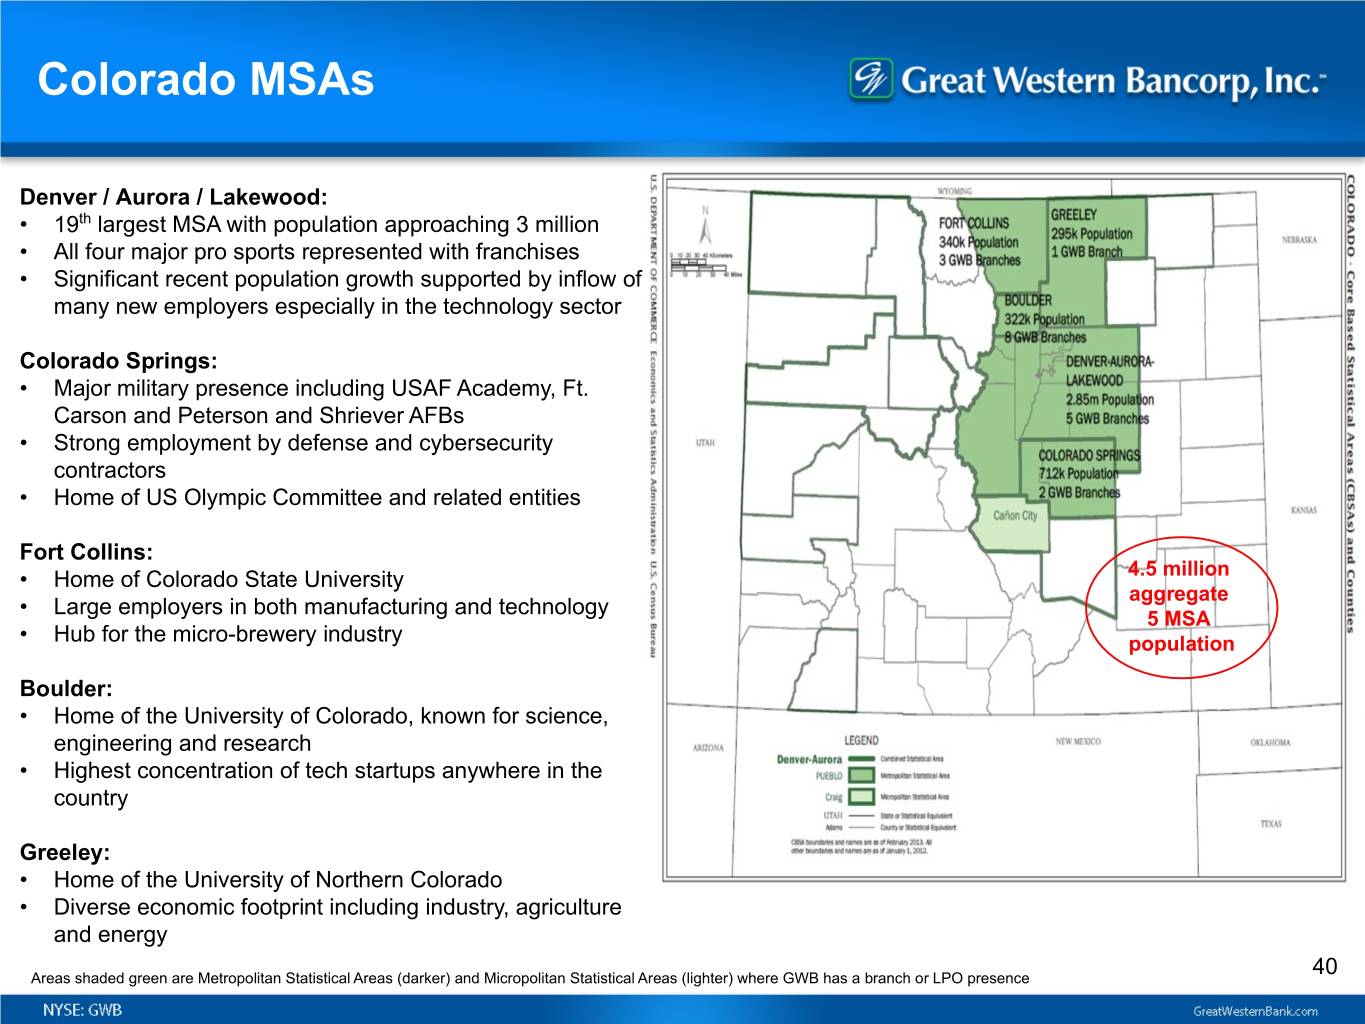
Colorado MSAs Denver / Aurora / Lakewood: • 19th largest MSA with population approaching 3 million • All four major pro sports represented with franchises • Significant recent population growth supported by inflow of many new employers especially in the technology sector Colorado Springs: • Major military presence including USAF Academy, Ft. Carson and Peterson and Shriever AFBs • Strong employment by defense and cybersecurity contractors • Home of US Olympic Committee and related entities Fort Collins: • Home of Colorado State University 4.5 million aggregate • Large employers in both manufacturing and technology 5 MSA • Hub for the micro-brewery industry population Boulder: • Home of the University of Colorado, known for science, engineering and research • Highest concentration of tech startups anywhere in the country Greeley: • Home of the University of Northern Colorado • Diverse economic footprint including industry, agriculture and energy 40 Areas shaded green are Metropolitan Statistical Areas (darker) and Micropolitan Statistical Areas (lighter) where GWB has a branch or LPO presence
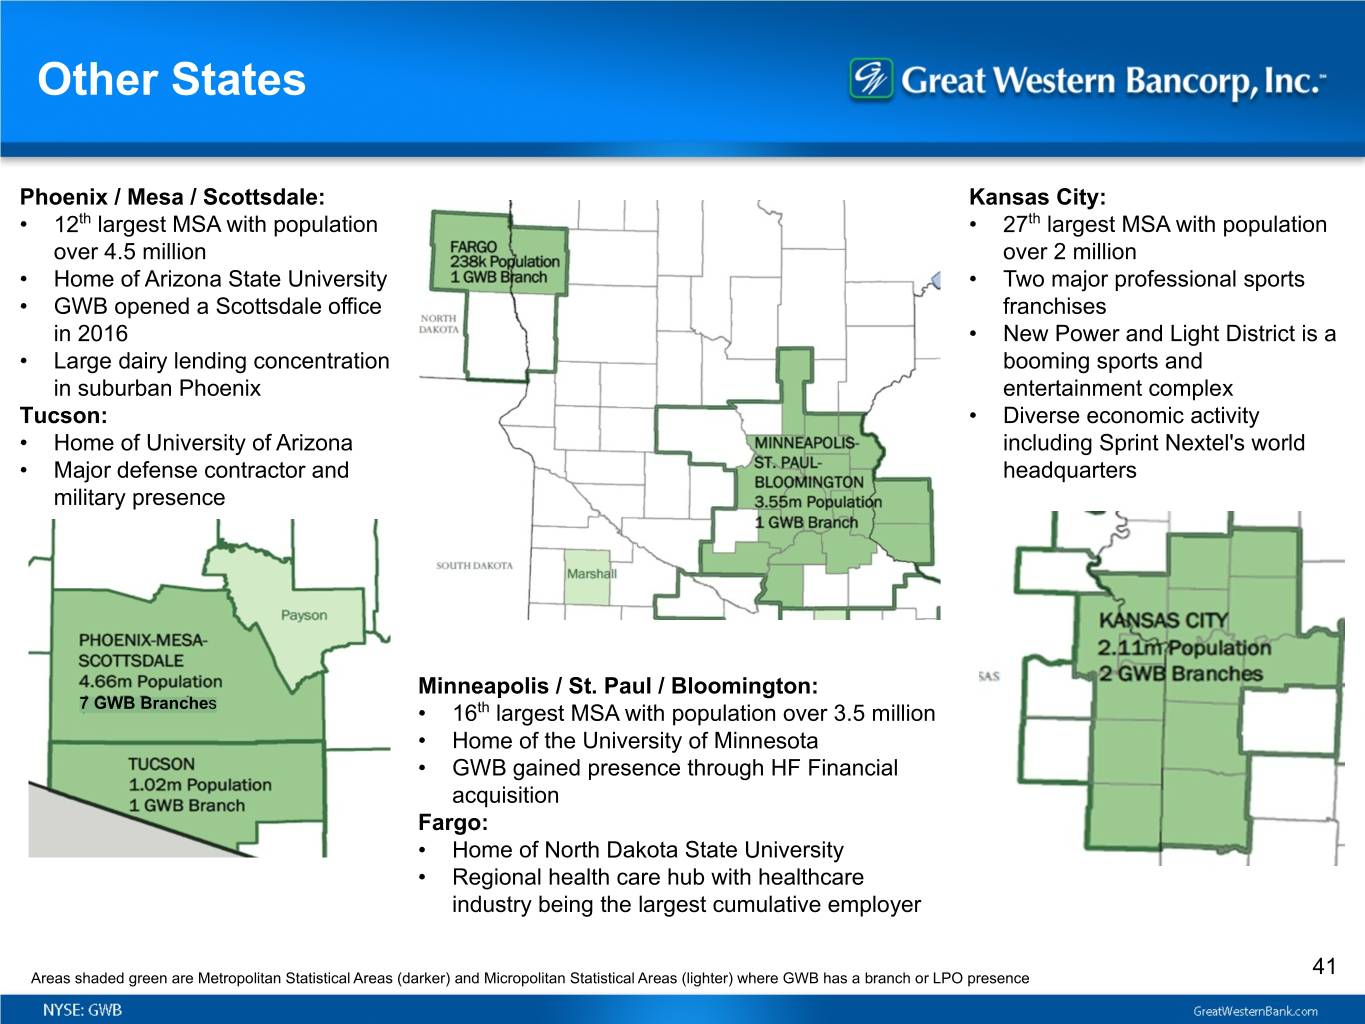
Other States Phoenix / Mesa / Scottsdale: Kansas City: • 12th largest MSA with population • 27th largest MSA with population over 4.5 million over 2 million • Home of Arizona State University • Two major professional sports • GWB opened a Scottsdale office franchises in 2016 • New Power and Light District is a • Large dairy lending concentration booming sports and in suburban Phoenix entertainment complex Tucson: • Diverse economic activity • Home of University of Arizona including Sprint Nextel's world • Major defense contractor and headquarters military presence Minneapolis / St. Paul / Bloomington: 7 GWB Branches • 16th largest MSA with population over 3.5 million • Home of the University of Minnesota • GWB gained presence through HF Financial acquisition Fargo: • Home of North Dakota State University • Regional health care hub with healthcare industry being the largest cumulative employer 41 Areas shaded green are Metropolitan Statistical Areas (darker) and Micropolitan Statistical Areas (lighter) where GWB has a branch or LPO presence
Appendix 5 Accounting for Loans at FV and Related Derivatives

Loans at FV and Related Derivatives Overview • For certain loans with an original term greater than 5 years with a fixed rate to the customer, Great Western Bank (“GWB”) has entered into equal and offsetting fixed-to-floating interest rate swaps with two US counterparties • Total size of the portfolio was $813.0 million at September 30, 2019 GWB has elected the Fair Value Option (ASC 825) on these loans and applies a similar treatment to the related derivatives: ◦ Changes in the fair value of the loans and the derivatives and the current period realized cost (benefit) of the derivatives (i.e., the net pay fixed/receive floating settlement) are recorded in earnings through noninterest income ◦ This differs significantly from most peers who have elected Hedge Accounting treatment ◦ The historical election is irrevocable so the concept will be present for the foreseeable future in GWB’s financial statements even if different accounting elections are made on future originations ◦ Management presents non-GAAP measures to provide more clarity on the underlying economics Summary Income Statement Line Item: Net increase (decrease) in fair value Net realized and unrealized (loss) gain of loans at fair value on derivatives Net Relationship Notes Increase (decrease) in FV related to interest rates $ 13,834 $ (13,834) $ — 1 Decrease in FV related to credit $ (2,085) $ (238) $ (2,323) 2 Increase in SWAP fees $ — $ 1,008 $ 1,008 3 Current period realized cost of derivatives $ — $ (127) $ (127) 4 Subtotal, loans at FV and related derivatives $ 11,749 $ (13,191) $ (1,442) 5 1 Equal and offsetting each period. Changes in the FV of each financial asset and liability driven by current compared to contractual rates. 2 Management records an adjustment for credit risk in noninterest income based on loss history for similar loans, adjusted for an assessment of existing market conditions for each loan segment. The FV adjustment related to credit is not included in the ALLL but loans are included in the ALLL coverage ratio denominator. 3 Swap fees are fees related to transacting interest rate swaps and other interest rate derivatives. 4 Current period actual cost of fixed-to-float interest rate swaps. Within non-GAAP financial measures, management reclassifies this component to interest income, resulting in adjusted interest income, adjusted net interest income and adjusted NIM, reflecting the underlying economics of the transactions. All else equal, this drag on earnings will reduce as short-term LIBOR rates increase. 5 While US GAAP mandates the presentation of these items in noninterest income, management believes the residual net amount economically represents the net credit exposure of this segment of the portfolio - presented as a "credit-related charge" in the earnings release and elsewhere (see note (2)) - and the current period derivative cost which should be analyzed relative to gross interest income received from the loan customers (see note (4)) as presented in non-GAAP measures. 43


