
Earnings Release | September 30, 2020

KEY DEVELOPMENTS • Third party loan review resulted in minimal, non-material findings Bolster Credit Risk • Loan deferrals at 1.98% of total loans excluding PPP (as Management of 10/22/2020) • Outsourcing on-going loan review function • Previous conservative decisions contributing to improving capital position Conservative and • CECL reserve build beginning October 1, 2020 Measured Actions • FTE reduction creating $4 million in annual cost savings • Prudent NIM management, including partial FHLB payoff • Hired Amy Johnson to lead enhanced Treasury Management team Organizational Alignment • Implemented centralized Facilities function: Review of all for Increased Specialization facilities underway with 12/31/2020 estimated completion • Continued Buildout of Small Business Platform (selected Fundation for LOS) 2

EARNINGS OVERVIEW FY 2020 Q4 Recap ($MM) Q4 Notable Items • Other Income and Expenses were impacted by the payoff of $205M in FHLB borrowings at 2.75% with Net Interest Income $106.0 $0.7M nonaccrual interest reversal proceeds from cash and sale of securities Provision $16.9 • Other Income includes credit charges on long term loans accounted for at fair value specific to 2 $24.7M credit costs on FV loans; substandard loans and loss impact on portfolio mark Other Income $(4.0) $7.9M security gain $7.6M FHLB prepay; $4.0M OREO writedown; • Expenses include an OREO provision and non-cash Expenses $74.9 $2.0M FDIC loss share close out adjustment related to finalization of FDIC loss share agreement on acquired loans from 2010 Tax (Benefit) $(0.9) Net Income $11.1 FY 2020 Full Year Recap ($MM) • Net revenues at $486.6 million were in line with $489.4 $483.5 $489.4 $486.6 million the prior year and slightly above $483.5 million two years prior Revenues ¹ • Credit related costs include pandemic and other charges $232.0 Expenses ¹ ² contributing to a $97 million increase in total $215.6 $36.0 comprehensive credit coverage over the prior year Credit Related Costs ³ • Expenses reflect an increase from added employees and Profit Before Credit systems along with numerous one-off items throughout the Related Costs & Tax ² $(227.1) $(220.5) $(250.2) year related to the FHLB prepayment, an FDIC loss share $(24.5) $(53.3) adjustment, COVID-19 related spend, severance costs, $(200.4) and consulting and legal costs 1 excluding credit related cost items 2 excludes $742M goodwill impairment in March 2020 2018 2019 2020 3 Credit related costs aggregate multiple income statement items such as provision, OREO, unfunded commitments, credit marks and nonaccrual interest 3
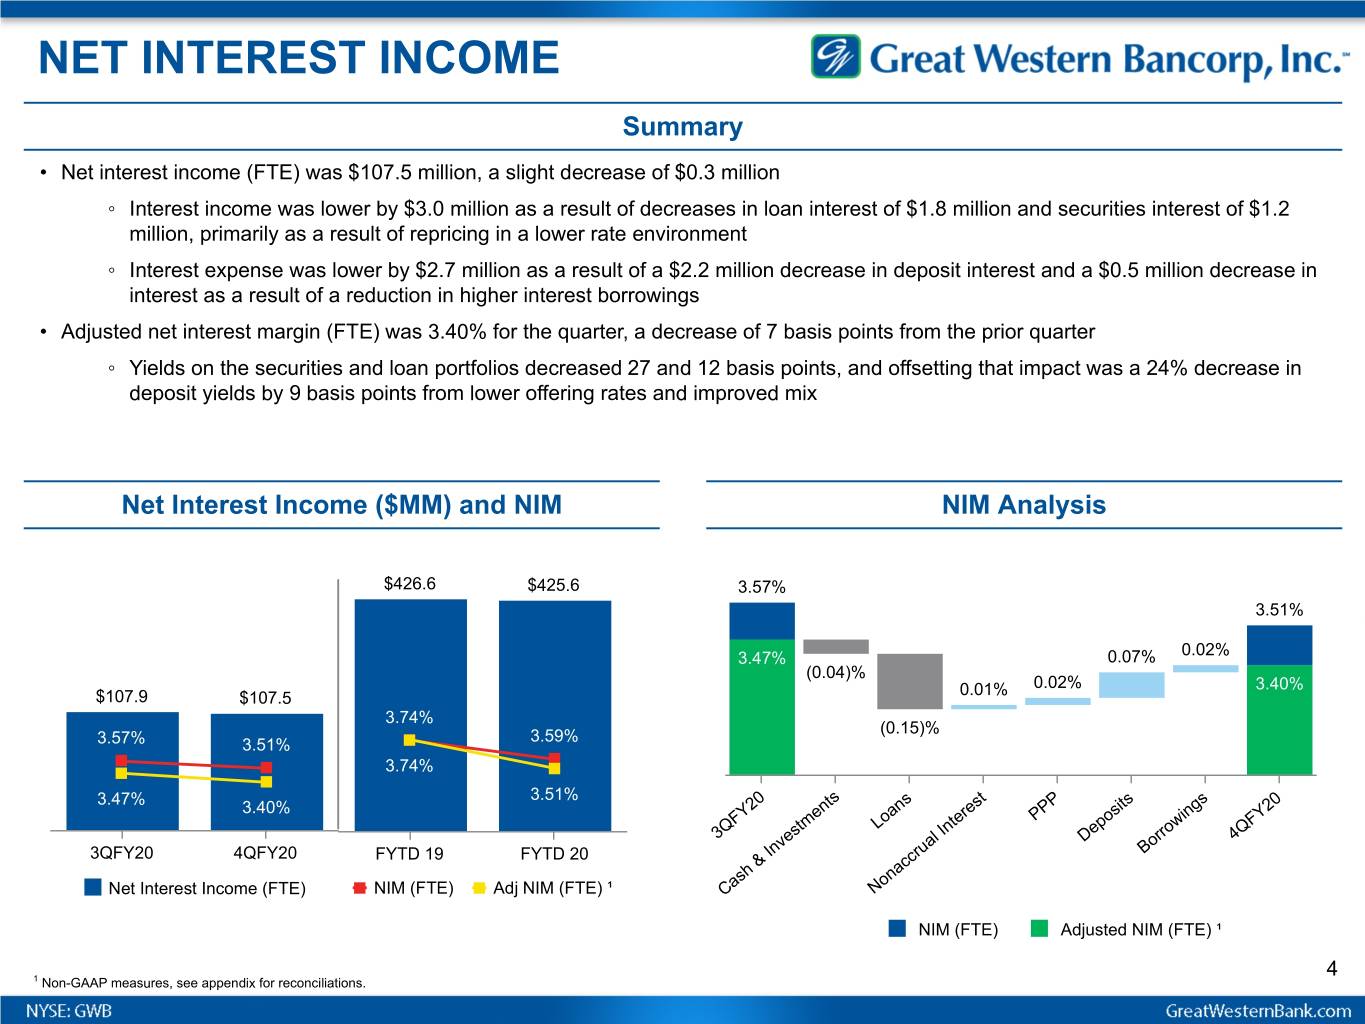
NET INTEREST INCOME Summary • Net interest income (FTE) was $107.5 million, a slight decrease of $0.3 million ◦ Interest income was lower by $3.0 million as a result of decreases in loan interest of $1.8 million and securities interest of $1.2 million, primarily as a result of repricing in a lower rate environment ◦ Interest expense was lower by $2.7 million as a result of a $2.2 million decrease in deposit interest and a $0.5 million decrease in interest as a result of a reduction in higher interest borrowings • Adjusted net interest margin (FTE) was 3.40% for the quarter, a decrease of 7 basis points from the prior quarter ◦ Yields on the securities and loan portfolios decreased 27 and 12 basis points, and offsetting that impact was a 24% decrease in deposit yields by 9 basis points from lower offering rates and improved mix Net Interest Income ($MM) and NIM NIM Analysis $426.6 $425.6 3.57% 3.51% 3.47% 0.07% 0.02% (0.04)% 0.02% 3.40% $107.9 $107.5 0.01% 3.74% 3.59% (0.15)% 3.57% 3.51% 3.74% 3.51% 3.47% 3.40% PPP Loans 3QFY20 Deposits 4QFY20 3QFY20 4QFY20 FYTD 19 FYTD 20 Borrowings Net Interest Income (FTE) NIM (FTE) Adj NIM (FTE) ¹ Cash & Investments Nonaccrual Interest NIM (FTE) Adjusted NIM (FTE) ¹ 4 1 Non-GAAP measures, see appendix for reconciliations.
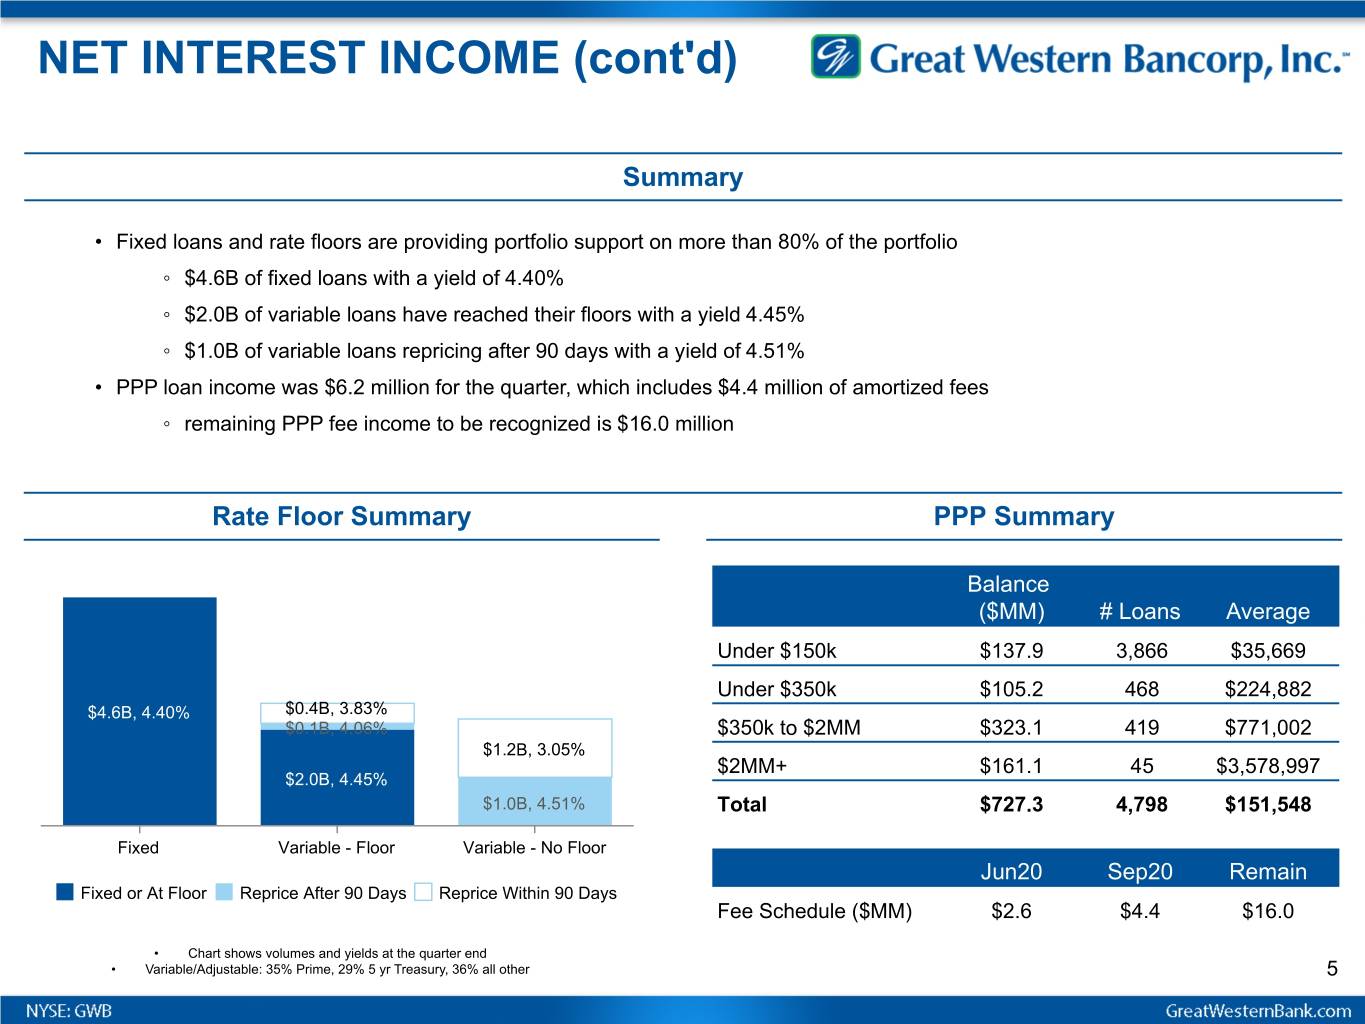
NET INTEREST INCOME (cont'd) Summary • Fixed loans and rate floors are providing portfolio support on more than 80% of the portfolio ◦ $4.6B of fixed loans with a yield of 4.40% ◦ $2.0B of variable loans have reached their floors with a yield 4.45% ◦ $1.0B of variable loans repricing after 90 days with a yield of 4.51% • PPP loan income was $6.2 million for the quarter, which includes $4.4 million of amortized fees ◦ remaining PPP fee income to be recognized is $16.0 million Rate Floor Summary PPP Summary Balance ($MM) # Loans Average Under $150k $137.9 3,866 $35,669 Under $350k $105.2 468 $224,882 $4.6B, 4.40% $0.4B, 3.83% $0.1B, 4.06% $350k to $2MM $323.1 419 $771,002 $1.2B, 3.05% $2MM+ $161.1 45 $3,578,997 $2.0B, 4.45% $1.0B, 4.51% Total $727.3 4,798 $151,548 Fixed Variable - Floor Variable - No Floor Jun20 Sep20 Remain Fixed or At Floor Reprice After 90 Days Reprice Within 90 Days Fee Schedule ($MM) $2.6 $4.4 $16.0 • Chart shows volumes and yields at the quarter end • Variable/Adjustable: 35% Prime, 29% 5 yr Treasury, 36% all other 5
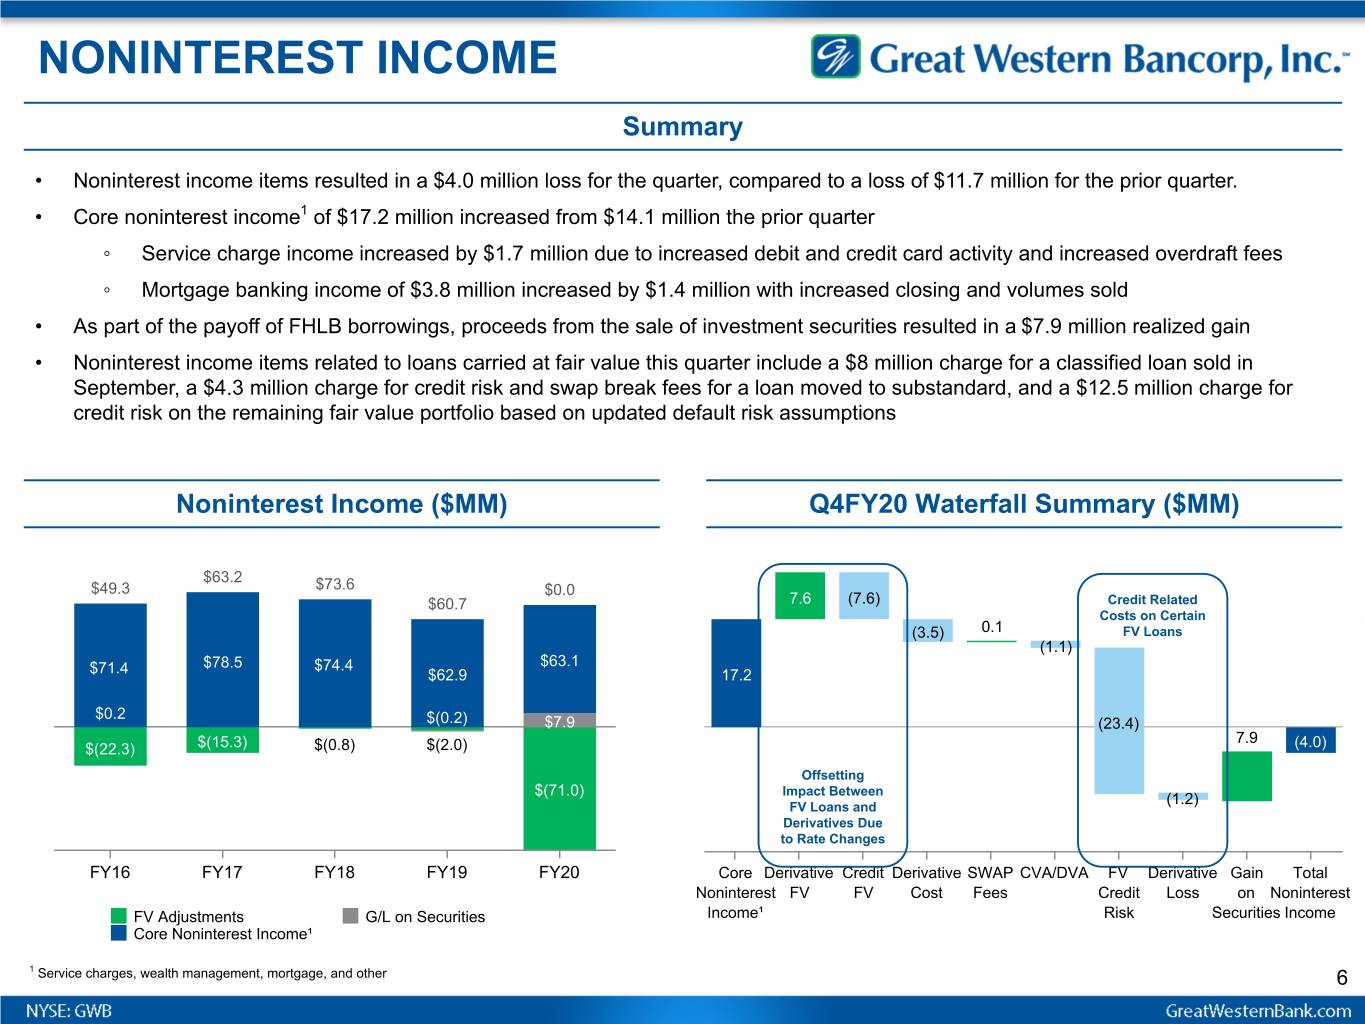
NONINTEREST INCOME Summary • Noninterest income items resulted in a $4.0 million loss for the quarter, compared to a loss of $11.7 million for the prior quarter. • Core noninterest income1 of $17.2 million increased from $14.1 million the prior quarter ◦ Service charge income increased by $1.7 million due to increased debit and credit card activity and increased overdraft fees ◦ Mortgage banking income of $3.8 million increased by $1.4 million with increased closing and volumes sold • As part of the payoff of FHLB borrowings, proceeds from the sale of investment securities resulted in a $7.9 million realized gain • Noninterest income items related to loans carried at fair value this quarter include a $8 million charge for a classified loan sold in September, a $4.3 million charge for credit risk and swap break fees for a loan moved to substandard, and a $12.5 million charge for credit risk on the remaining fair value portfolio based on updated default risk assumptions Noninterest Income ($MM) Q4FY20 Waterfall Summary ($MM) $63.2 $49.3 $73.6 $0.0 $60.7 7.6 (7.6) Credit Related Costs on Certain (3.5) 0.1 FV Loans (1.1) $78.5 $74.4 $63.1 $71.4 $62.9 17.2 $0.2 $(0.2) $7.9 (23.4) 7.9 $(22.3) $(15.3) $(0.8) $(2.0) (4.0) Offsetting $(71.0) Impact Between (1.2) FV Loans and Derivatives Due to Rate Changes FY16 FY17 FY18 FY19 FY20 Core Derivative Credit Derivative SWAP CVA/DVA FV Derivative Gain Total Noninterest FV FV Cost Fees Credit Loss on Noninterest FV Adjustments G/L on Securities Income¹ Risk Securities Income Core Noninterest Income¹ 1 Service charges, wealth management, mortgage, and other 6

EXPENSES & PROVISION Summary • Total noninterest expense was $74.9 million for the quarter, an increase of $7.9 million from the prior quarter ◦ $7.6 million cost related to the early payment of FHLB borrowings ◦ $2.0 million adjustment related to the completion of the FDIC loss share agreement, which ended June 4, 2020 ◦ Net credit related charges of $3.4 million related to OREO and unfunded commitment reserves ◦ Along with approximately $1.8 million in severances, closure costs for the Wichita Loan Production Office and consulting costs • Provision for loan and lease losses was $16.9 million, a decrease of $4.8 million, and was related to increased specific reserves on a number of loans moved to substandard in the quarter Noninterest Expense ($MM) Loan Loss Provision ($MM) $118.4 $263.6 Q2, $59.7 $231.4 $216.6 $224.9 $207.6 Q4, $74.7 Q3, $66.8 $40.9 Q4, $16.9 Q2, $65.7 $21.5 Q3, $21.6 $17.0 $18.0 Q1, $56.5 Q2, $12.1 Q1, $8.1 FY16 FY17 FY18 FY19 FY20 ¹ FY16 FY17 FY18 FY19 FY20 Provision for Loan Losses Incremental Environmental Overlay for COVID-19 1 Non-GAAP measures, see appendix for reconciliations. 7
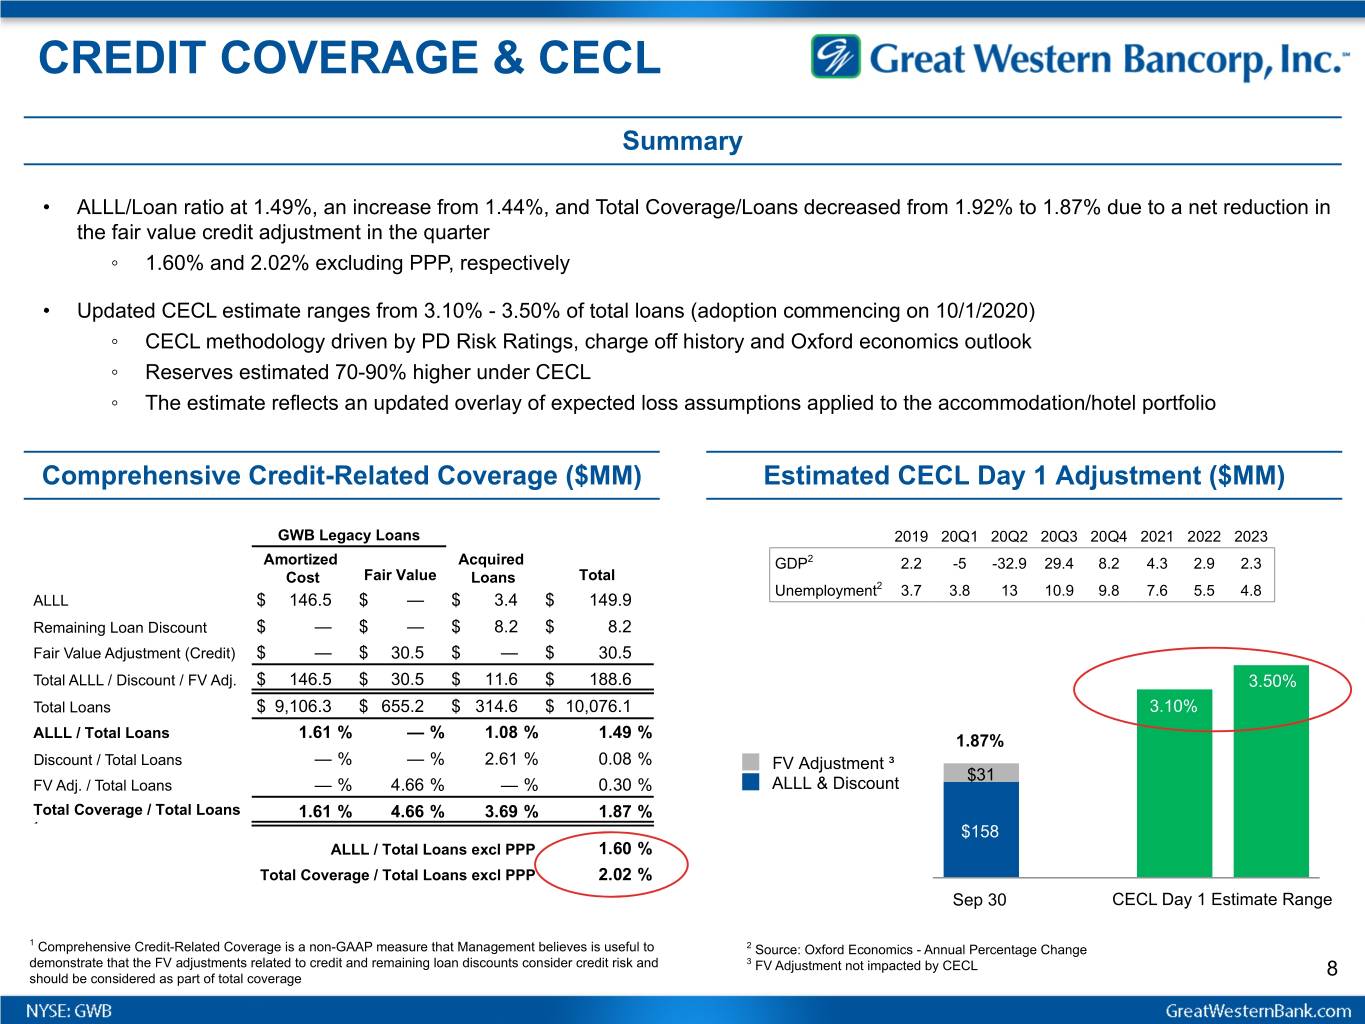
CREDIT COVERAGE & CECL Summary • ALLL/Loan ratio at 1.49%, an increase from 1.44%, and Total Coverage/Loans decreased from 1.92% to 1.87% due to a net reduction in the fair value credit adjustment in the quarter ◦ 1.60% and 2.02% excluding PPP, respectively • Updated CECL estimate ranges from 3.10% - 3.50% of total loans (adoption commencing on 10/1/2020) ◦ CECL methodology driven by PD Risk Ratings, charge off history and Oxford economics outlook ◦ Reserves estimated 70-90% higher under CECL ◦ The estimate reflects an updated overlay of expected loss assumptions applied to the accommodation/hotel portfolio Comprehensive Credit-Related Coverage ($MM) Estimated CECL Day 1 Adjustment ($MM) GWB Legacy Loans 2019 20Q1 20Q2 20Q3 20Q4 2021 2022 2023 Amortized Acquired GDP2 2.2 -5 -32.9 29.4 8.2 4.3 2.9 2.3 Cost Fair Value Loans Total Unemployment2 3.7 3.8 13 10.9 9.8 7.6 5.5 4.8 ALLL $ 146.5 $ — $ 3.4 $ 149.9 Remaining Loan Discount $ — $ — $ 8.2 $ 8.2 Fair Value Adjustment (Credit) $ — $ 30.5 $ — $ 30.5 Total ALLL / Discount / FV Adj. $ 146.5 $ 30.5 $ 11.6 $ 188.6 3.50% Total Loans $ 9,106.3 $ 655.2 $ 314.6 $ 10,076.1 3.10% ALLL / Total Loans 1.61 % — % 1.08 % 1.49 % 1.87% Discount / Total Loans — % — % 2.61 % 0.08 % FV Adjustment ³ $31 FV Adj. / Total Loans — % 4.66 % — % 0.30 % ALLL & Discount Total Coverage / Total Loans 1.61 % 4.66 % 3.69 % 1.87 % ¹ $158 ALLL / Total Loans excl PPP 1.60 % Total Coverage / Total Loans excl PPP 2.02 % Sep 30 CECL Day 1 Estimate Range 1 Comprehensive Credit-Related Coverage is a non-GAAP measure that Management believes is useful to 2 Source: Oxford Economics - Annual Percentage Change demonstrate that the FV adjustments related to credit and remaining loan discounts consider credit risk and 3 FV Adjustment not impacted by CECL should be considered as part of total coverage 8
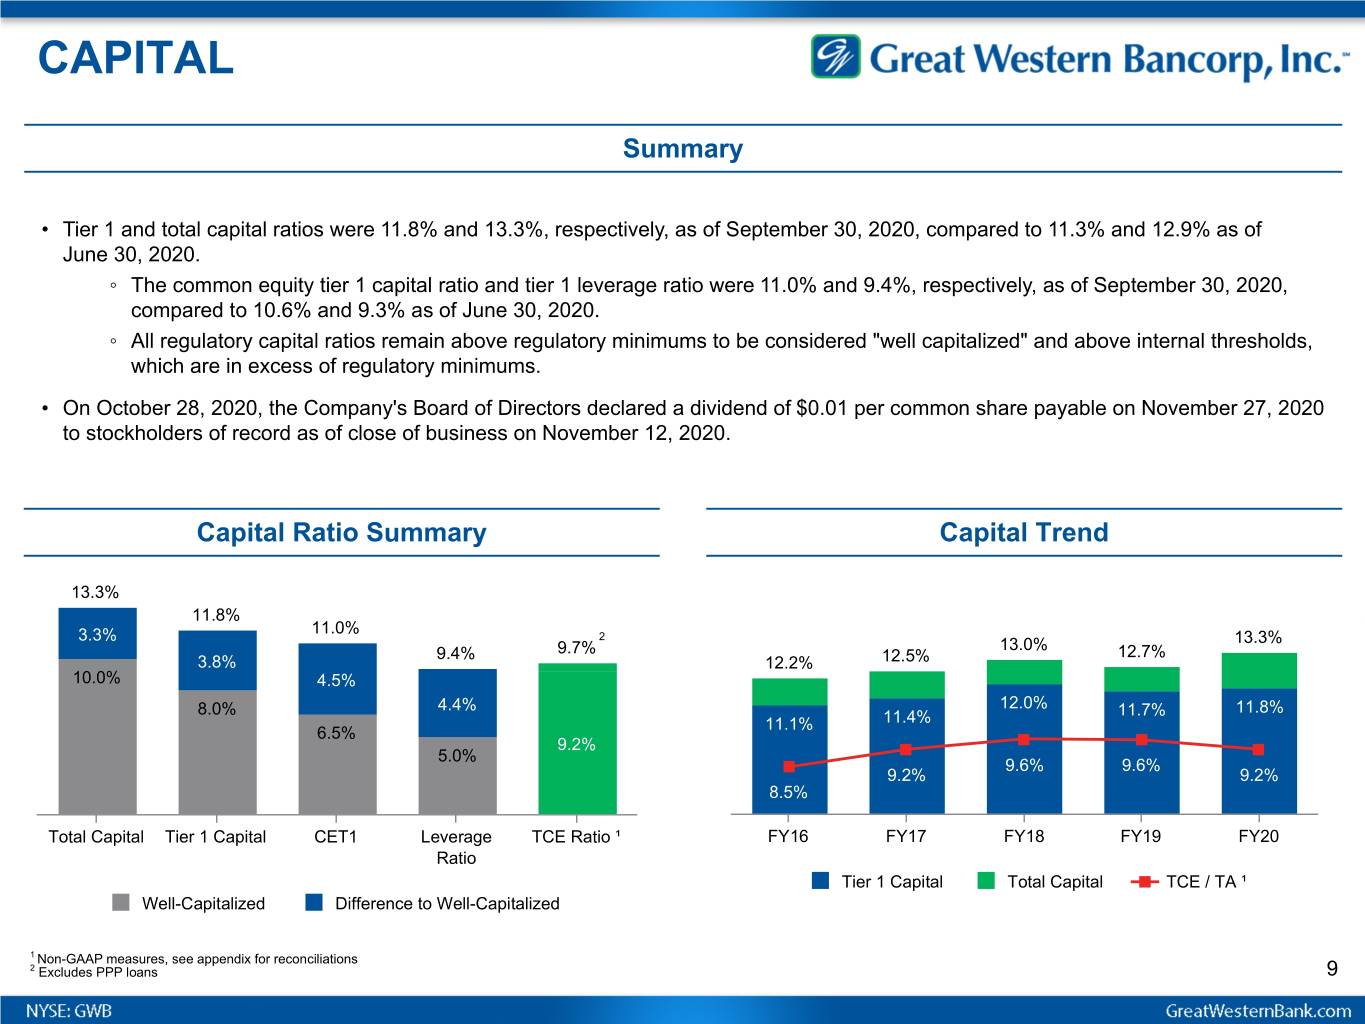
CAPITAL Summary • Tier 1 and total capital ratios were 11.8% and 13.3%, respectively, as of September 30, 2020, compared to 11.3% and 12.9% as of June 30, 2020. ◦ The common equity tier 1 capital ratio and tier 1 leverage ratio were 11.0% and 9.4%, respectively, as of September 30, 2020, compared to 10.6% and 9.3% as of June 30, 2020. ◦ All regulatory capital ratios remain above regulatory minimums to be considered "well capitalized" and above internal thresholds, which are in excess of regulatory minimums. • On October 28, 2020, the Company's Board of Directors declared a dividend of $0.01 per common share payable on November 27, 2020 to stockholders of record as of close of business on November 12, 2020. Capital Ratio Summary Capital Trend 13.3% 11.8% 11.0% 3.3% 2 13.0% 13.3% 9.4% 9.7% 12.7% 3.8% 12.2% 12.5% 10.0% 4.5% 8.0% 4.4% 12.0% 11.7% 11.8% 11.1% 11.4% 6.5% 9.2% 5.0% 9.6% 9.6% 9.2% 9.2% 8.5% Total Capital Tier 1 Capital CET1 Leverage TCE Ratio ¹ FY16 FY17 FY18 FY19 FY20 Ratio Tier 1 Capital Total Capital TCE / TA ¹ Well-Capitalized Difference to Well-Capitalized 1 Non-GAAP measures, see appendix for reconciliations 2 Excludes PPP loans 9
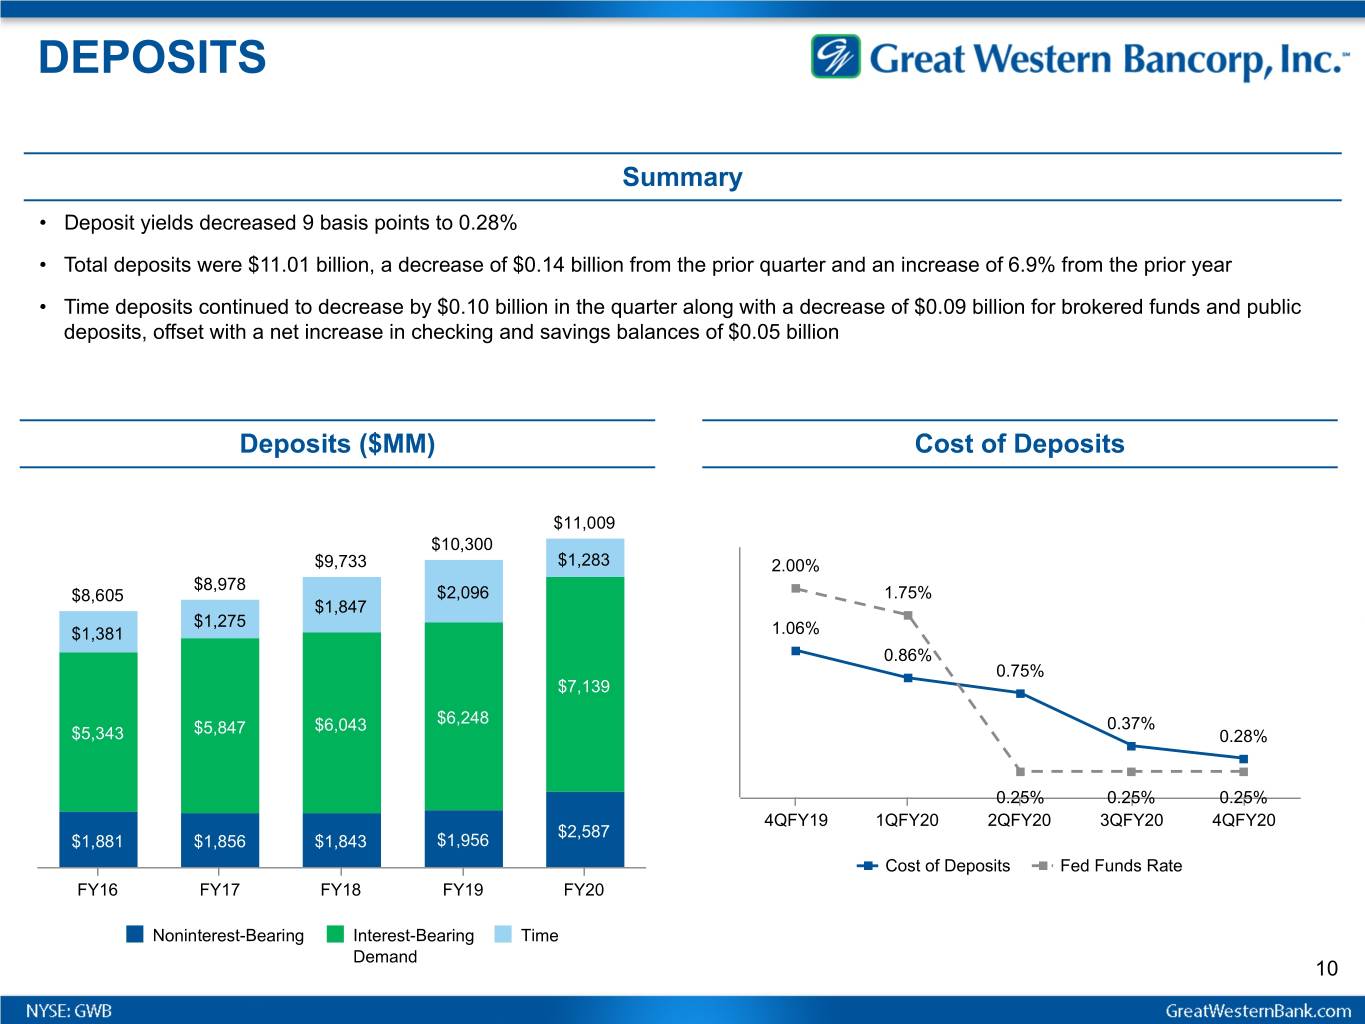
DEPOSITS Summary • Deposit yields decreased 9 basis points to 0.28% • Total deposits were $11.01 billion, a decrease of $0.14 billion from the prior quarter and an increase of 6.9% from the prior year • Time deposits continued to decrease by $0.10 billion in the quarter along with a decrease of $0.09 billion for brokered funds and public deposits, offset with a net increase in checking and savings balances of $0.05 billion Deposits ($MM) Cost of Deposits $11,009 $10,300 $9,733 $1,283 2.00% $8,978 $8,605 $2,096 1.75% $1,847 $1,275 $1,381 1.06% 0.86% 0.75% $7,139 $6,043 $6,248 0.37% $5,343 $5,847 0.28% 0.25% 0.25% 0.25% 4QFY19 1QFY20 2QFY20 3QFY20 4QFY20 $2,587 $1,881 $1,856 $1,843 $1,956 Cost of Deposits Fed Funds Rate FY16 FY17 FY18 FY19 FY20 Noninterest-Bearing Interest-Bearing Time Demand 10
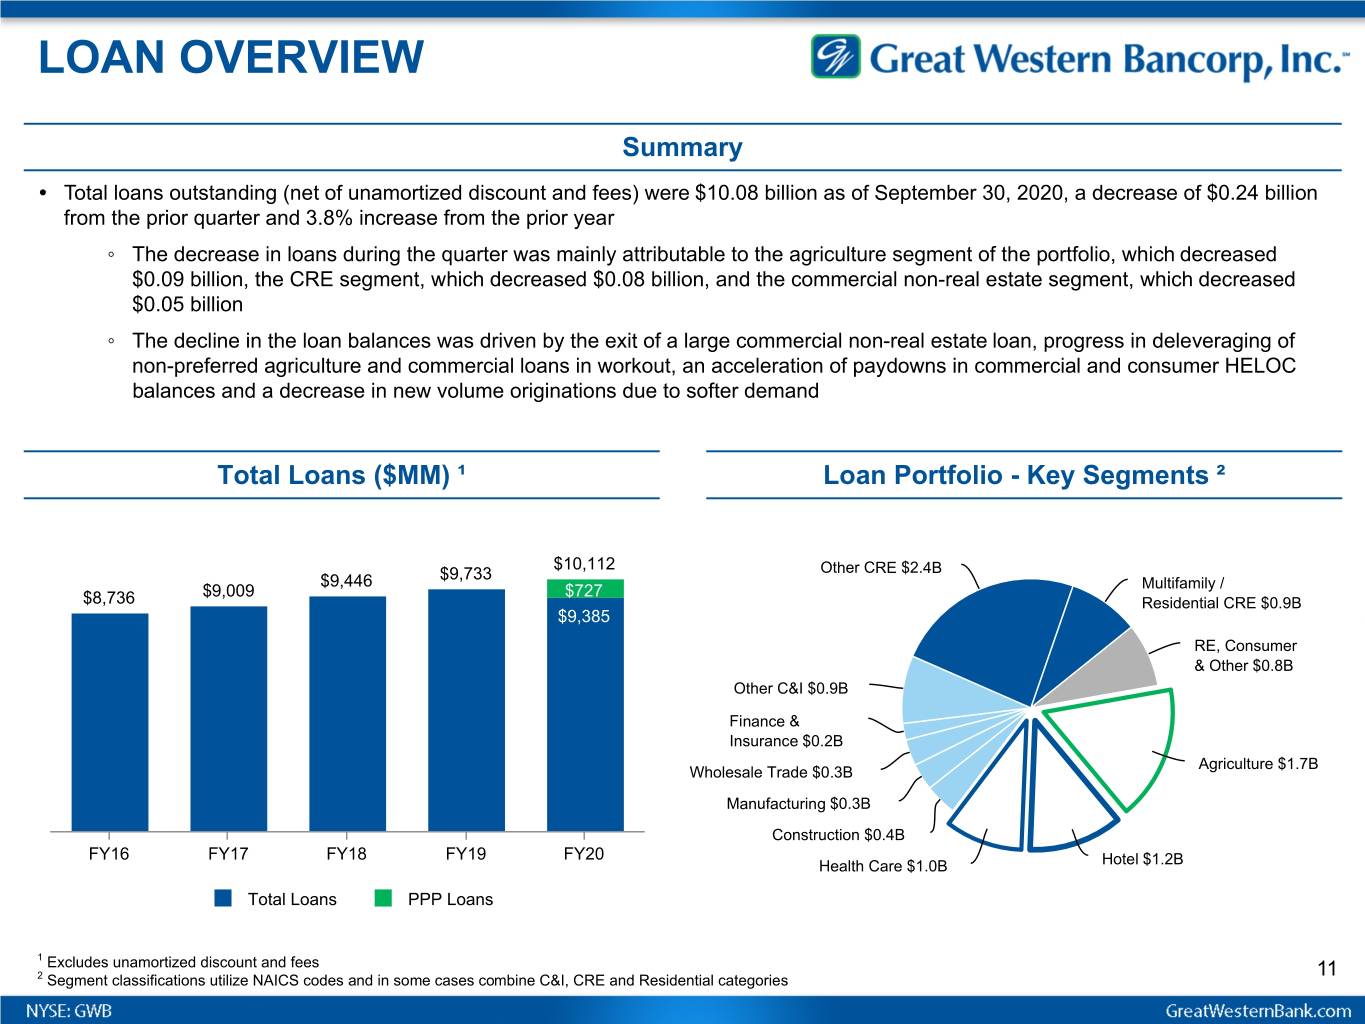
LOAN OVERVIEW Summary • Total loans outstanding (net of unamortized discount and fees) were $10.08 billion as of September 30, 2020, a decrease of $0.24 billion from the prior quarter and 3.8% increase from the prior year ◦ The decrease in loans during the quarter was mainly attributable to the agriculture segment of the portfolio, which decreased $0.09 billion, the CRE segment, which decreased $0.08 billion, and the commercial non-real estate segment, which decreased $0.05 billion ◦ The decline in the loan balances was driven by the exit of a large commercial non-real estate loan, progress in deleveraging of non-preferred agriculture and commercial loans in workout, an acceleration of paydowns in commercial and consumer HELOC balances and a decrease in new volume originations due to softer demand Total Loans ($MM) ¹ Loan Portfolio - Key Segments ² $10,112 Other CRE $2.4B $9,446 $9,733 $9,009 $727 Multifamily / $8,736 Residential CRE $0.9B $9,385 RE, Consumer & Other $0.8B Other C&I $0.9B Finance & Insurance $0.2B Agriculture $1.7B Wholesale Trade $0.3B Manufacturing $0.3B Construction $0.4B FY16 FY17 FY18 FY19 FY20 Health Care $1.0B Hotel $1.2B Total Loans PPP Loans 1 Excludes unamortized discount and fees 11 2 Segment classifications utilize NAICS codes and in some cases combine C&I, CRE and Residential categories

CREDIT INITIATIVES • Third party independent review complete with minimal findings Timely and Accurate Risk • New risk rating system fully integrated with updated Rating training sessions for 800 employees • Migration in the quarter reflects Moody's hotel scoring and successful banker engagement • New credit policy fully adopted driving decisioning tied to industries and modified hold limits More Risk Based Approval • Ag Credit Officer vacancy now filled and Senior credit team now fully in place • Specialized asset team building momentum Specialized Credit Administration • New Small Business Center of Excellence progressing with Fundation partnership 12

LOAN REVIEW & DEFERRALS External Loan Review Recap • Fourth quarter loan portfolio reviews included regular internal review and external review covering a total of $5.4 billion • 3rd party review consisted of full loan reviews combined with appraisal and quality control reviews on approximately $4 billion of commitments ◦ Segments included hotel, healthcare, nursing, real estate, wholesale trade and construction, along with grain, livestock, multifamily and manufacturing • Summary findings of reviews: ◦ 5 relationships downgraded from pass to criticized for $42.3 million (<1% of commitments reviewed) ◦ No nonaccrual or charge-off recommendations from the reviews Loan Deferral Summary ($MM) June 2020 Current 1 16.4% of Total Loans 1.84% of Total Loans % of % of 17.7% excl PPP 1.98% excl PPP Segment Segment Segments UPB Loans UPB Loans Hotel $861 72% $111 9% Arts Entertainment and Recreation $79 61% $3 3% Food & Drink $68 41% $4 3% Transportation and Warehousing $41 20% $1 1% Retail Trade $93 19% $14 3% $1,694 Real Estate and Rental and Leasing $359 14% $19 1% Other Services (except Public Administration) $22 13% $2 1% Manufacturing $25 7% $14 4% Wholesale Trade $19 6% $1 0% Health Care and Social Assistance $63 6% $1 0% Agriculture Forestry Fishing and Hunting $19 1% $2 0% $183 Other $45 2% $11 1% June 2020 Current ¹ $1,694 $183 1 Current data as of October 22, 2020 13

ASSET QUALITY METRICS Summary Net Charge-offs / Average Total Loans • Net charge-offs were $15.1 million, or 0.59% of average total 0.40% 0.36% loans (annualized) for the quarter, up $5.7 million or 22 basis 0.03% points from the prior quarter, respectively 0.02% 0.13% • Loans graded "Substandard" or worse were $769.5 million for 0.26% 0.08% 0.02% the quarter, an increase of $66.7 million from the prior quarter 0.18% 0.14% 0.01% • Nonaccrual loans were $324.9 million for the quarter, or 3.22% 0.12% 0.03% 0.25% 0.20% of total loans, an increase of $50.5 million from the prior 0.02% quarter 0.01% 0.10% 0.05% 0.08% 0.04% 0.04% 0.04% • With the new risk rating system, going into the new fiscal year 0.02% 0.01% (effective October 1st) there are $503 million in loans risk-rated FY16 FY17 FY18 FY19 FY20 special mention and $770 million risk-rated substandard/worse for a total of $1,273 million as criticized CRE AG C&I Other Total Loans Classified & Nonaccrual Loans ($MM) New Risk Rating System ($MM) Substandard or Worse Nonaccrual $770 3.22% $770 $770 1.54% 1.52% $503 1.10% $983 $380 $479 $325 $115 $107 $238 $255 $8,798 $138 $143 $8,318 $75 $83 $390 $107 $364 $38 $36 $29 $218 $172 $163 $100 $107 $78 2017 2018 2019 2020 2017 2018 2019 2020 Legacy Risk Rating New Risk Rating Ag Pass Watch - Legacy Non Ag Special Mention Substandard & Worse % of Total Loans 14
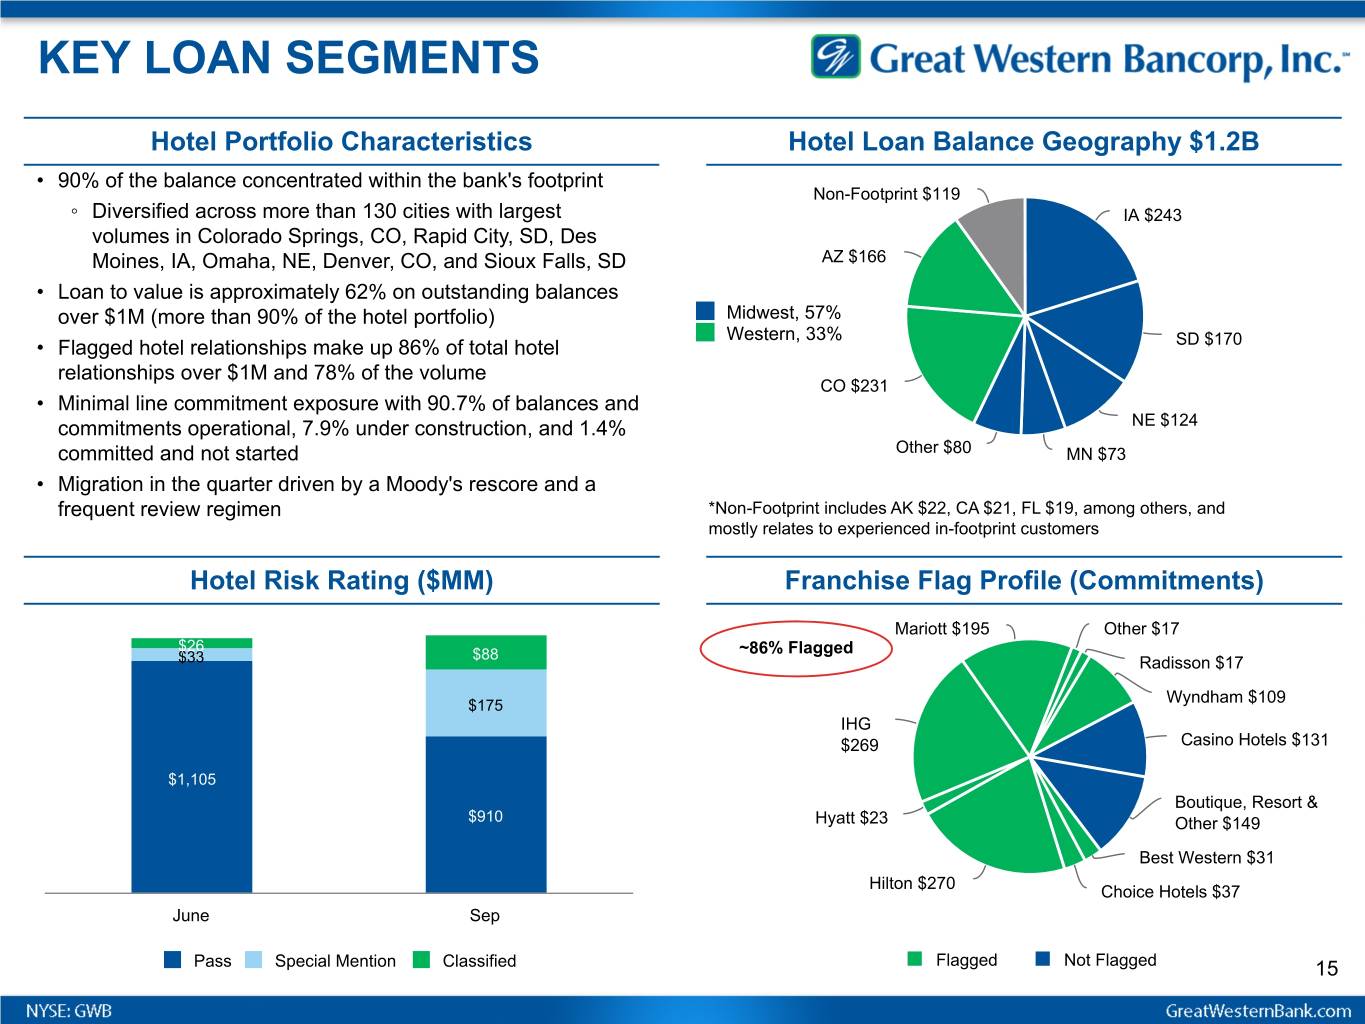
KEY LOAN SEGMENTS Hotel Portfolio Characteristics Hotel Loan Balance Geography $1.2B • 90% of the balance concentrated within the bank's footprint Non-Footprint $119 ◦ Diversified across more than 130 cities with largest IA $243 volumes in Colorado Springs, CO, Rapid City, SD, Des Moines, IA, Omaha, NE, Denver, CO, and Sioux Falls, SD AZ $166 • Loan to value is approximately 62% on outstanding balances over $1M (more than 90% of the hotel portfolio) Midwest, 57% Western, 33% • Flagged hotel relationships make up 86% of total hotel SD $170 relationships over $1M and 78% of the volume CO $231 • Minimal line commitment exposure with 90.7% of balances and commitments operational, 7.9% under construction, and 1.4% NE $124 committed and not started Other $80 MN $73 • Migration in the quarter driven by a Moody's rescore and a frequent review regimen *Non-Footprint includes AK $22, CA $21, FL $19, among others, and mostly relates to experienced in-footprint customers Hotel Risk Rating ($MM) Franchise Flag Profile (Commitments) Mariott $195 Other $17 $26 $88 ~86% Flagged $33 Radisson $17 $175 Wyndham $109 IHG $269 Casino Hotels $131 $1,105 Boutique, Resort & $910 Hyatt $23 Other $149 Best Western $31 Hilton $270 Choice Hotels $37 June Sep Pass Special Mention Classified Flagged Not Flagged 15

KEY LOAN SEGMENTS (cont'd) Ag Portfolio by Industry $1.7B Segment Update 1 • Ag portfolio remains well diversified across key sub-segments • USDA October 19, 2020, report shows great progress in corn Beef Cattle, 18.4% Dairy Farms, 25.2% harvested with SD at 64%, IA at 65% and NE at 58%, compared to the national average at 60% • Soybean harvest progress is tracking well also with SD and IA Grains, 30.4% at 90%, and NE at 92%, well ahead of the national average at Proteins, 48.9% Other, 20.7% Hogs, 5.3% 75% • Dairy market conditions remain supportive with Class III milk price at $16.43 in September, down from $19.77 in August and Grains, 30.4% $21.04 in June Other Specialty, 20.7% Health Care Portfolio $1.0B Portfolio Characteristics • Senior Care is $331 million or 3.3% of total loans, 95% CRE, and consists of approximately 45 relationships Skilled Nursing, 25.1% • Skilled nursing is $251 million or 2.5% of total loans, 93% CRE, and consists of approximately 45 relationships Hospitals, 22.4% • Hospitals are $224 million or 2.2% of total loans, more aligned to C&I at 56% and consist of approximately 32 relationships • All other health care is $194 million or 1.9% of total loans, is also higher in C&I at 52%, and is much more fragmented across 486 relationships that include physicians, dentists, optometrists, Senior Care, 33.1% therapists, and other specialty services as well as social All Other, 19.4% assistance 1 Corn and soybean harvest data found at www.nass.usda.gov 16
DISCLOSURES Forward-Looking Statements: This press release contains forward-looking statements within the meaning of the Private Securities Litigation Reform Act of 1995. Statements about Great Western Bancorp, Inc.’s expectations, beliefs, plans, strategies, predictions, forecasts, objectives, assumptions or future events or performance are not historical facts and may be forward-looking. These statements are often, but not always, made through the use of words or phrases such as “anticipates,” “believes,” “can,” “could,” “may,” “predicts,” “potential,” “should,” “will,” “estimate,” “plans,” “projects,” “continuing,” “ongoing,” “expects,” “views,” “intends” and similar words or phrases. In particular, the statements included in this press release concerning Great Western Bancorp, Inc.’s expected performance and strategy, strategies for managing troubled loans, the impact on the business arising from the COVID-19 pandemic and the interest rate environment are not historical facts and are forward-looking. Accordingly, the forward-looking statements in this press release are only predictions and involve estimates, known and unknown risks, assumptions and uncertainties that could cause actual results to differ materially from those expressed. All forward-looking statements are necessarily only estimates of future results, and there can be no assurance that actual results will not differ materially from expectations, and, therefore, you are cautioned not to place undue reliance on such statements. Any forward-looking statements are qualified in their entirety by reference to the factors discussed in the sections titled “Item 1A. Risk Factors” and "Cautionary Note Regarding Forward-Looking Statements" in Great Western Bancorp, Inc.’s Annual Report on Form 10-K for the most recently ended fiscal year, Form 10-Q for the quarters ended June 30, 2020, March 31, 2020 and December 31, 2019 and in other periodic filings with the Securities and Exchange Commission. Further, any forward-looking statement speaks only as of the date on which it is made, and Great Western Bancorp, Inc. undertakes no obligation to update any forward-looking statement to reflect events or circumstances after the date on which the statement is made or to reflect the occurrence of unanticipated events. Non-GAAP Financial Measures: This presentation contains non-GAAP measures which our management relies on in making financial and operational decisions about our business and which exclude certain items that we do not consider reflective of our business performance. We believe that the presentation of these measures provides investors with greater transparency and supplemental data relating to our financial condition and results of operations. These non-GAAP measures should be considered in context with our GAAP results. A reconciliation of these non-GAAP measures appears in our earnings release dated October 28, 2020 and in Appendix 1 to this presentation. Our earnings release and this presentation are available in the Investor Relations section of our website at www.greatwesternbank.com. Our earnings release and this presentation are also available as part of our Current Report on Form 8-K filed with the Securities and Exchange Commission on October 28, 2020. Explanatory Note: In this presentation, all financial information presented refers to the financial results of Great Western Bancorp, Inc. combined with those of its predecessor, Great Western Bancorporation, Inc. Also note loan balance information is presented using unpaid principal balances (UPB) unless otherwise noted. 17

Appendix 1 Non-GAAP Measures

SELECTED GAAP & NON-GAAP COVID-19 RESULTS Goodwill & Credit Related Non-GAAP At and for the twelve months ended: GAAP Intangible excl Goodwill COVID-19 Adjusted Net interest income $ 419,425 $ — $ 419,425 $ — $ 419,425 Provision for loan and lease losses 118,392 — 118,392 59,712 58,680 Total noninterest income (loss) 17 — 17 (10,435) 10,452 Total noninterest expense 1,007,368 742,352 265,016 3,758 261,258 (Benefit from) provision for income taxes (25,510) (29,339) 3,829 (17,220) 21,049 Adjustments to Net Income $ (680,808) $ 713,013 $ 32,205 $ 56,685 $ 88,890 • Financial results this fiscal year include several items linked to the impact of the COVID-19 pandemic. In Q2, we recognized an impairment included in noninterest expense of $742.4 million, of which $622.4 million stemmed from goodwill related to the acquisition of Great Western Bank in 2008 by National Australia Bank, $118.2 million from goodwill related to subsequent acquisitions and $1.8 million from certain intangible assets. The expense was offset in part by a related benefit from income taxes of $29.3 million. • In addition, COVID-19 impacts include $73.8 million in several credit and other related charges for loan and other real estate reserves, including a $59.7 million charge for general allowance increases in provision expense, $7.1 million and $3.3 million of charges for fair value credit risk and derivative reserves in noninterest income, respectively, a $3.3 million write down on an OREO hotel property negatively impacted by COVID-19 pandemic travel restrictions, and $0.4 million of charges for the reserve on unfunded commitments in noninterest expenses. All of these pretax expenses are offset in part by a related benefit from income taxes of $17.2 million. • See also the "Non-GAAP Financial Measures and Reconciliation" section in this document for further discussion of the above items. 19
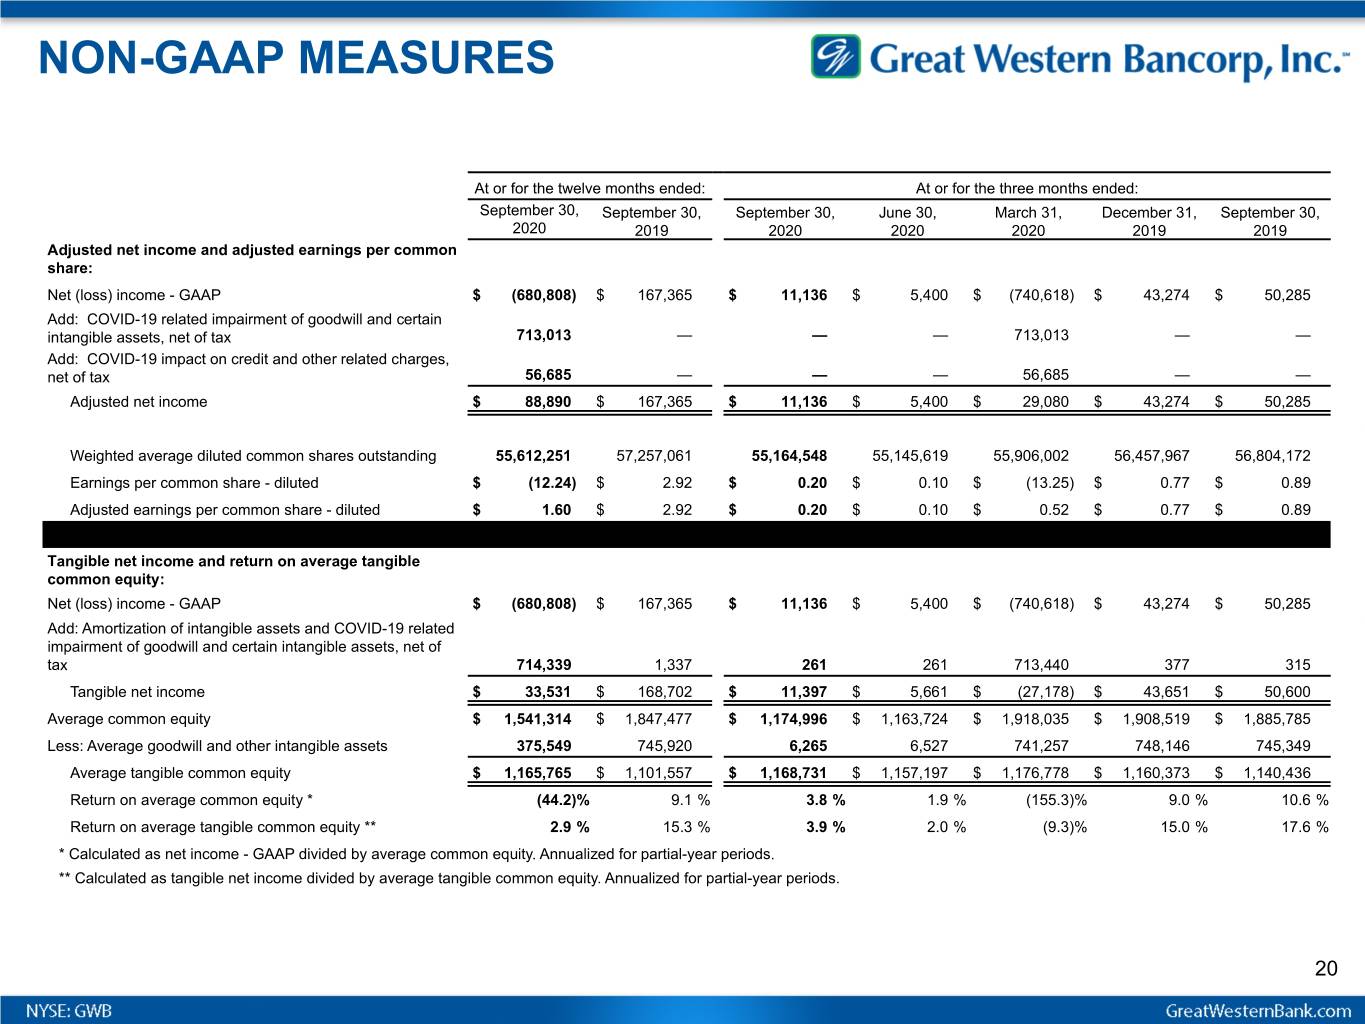
NON-GAAP MEASURES At or for the twelve months ended: At or for the three months ended: September 30, September 30, September 30, June 30, March 31, December 31, September 30, 2020 2019 2020 2020 2020 2019 2019 Adjusted net income and adjusted earnings per common share: Net (loss) income - GAAP $ (680,808) $ 167,365 $ 11,136 $ 5,400 $ (740,618) $ 43,274 $ 50,285 Add: COVID-19 related impairment of goodwill and certain intangible assets, net of tax 713,013 — — — 713,013 — — Add: COVID-19 impact on credit and other related charges, net of tax 56,685 — — — 56,685 — — Adjusted net income $ 88,890 $ 167,365 $ 11,136 $ 5,400 $ 29,080 $ 43,274 $ 50,285 Weighted average diluted common shares outstanding 55,612,251 57,257,061 55,164,548 55,145,619 55,906,002 56,457,967 56,804,172 Earnings per common share - diluted $ (12.24) $ 2.92 $ 0.20 $ 0.10 $ (13.25) $ 0.77 $ 0.89 Adjusted earnings per common share - diluted $ 1.60 $ 2.92 $ 0.20 $ 0.10 $ 0.52 $ 0.77 $ 0.89 Tangible net income and return on average tangible common equity: x x x x x Net (loss) income - GAAP $ (680,808) $ 167,365 $ 11,136 $ 5,400 $ (740,618) $ 43,274 $ 50,285 Add: Amortization of intangible assets and COVID-19 related impairment of goodwill and certain intangible assets, net of tax 714,339 1,337 261 261 713,440 377 315 Tangible net income $ 33,531 $ 168,702 $ 11,397 $ 5,661 $ (27,178) $ 43,651 $ 50,600 Average common equity $ 1,541,314 $ 1,847,477 $ 1,174,996 $ 1,163,724 $ 1,918,035 $ 1,908,519 $ 1,885,785 Less: Average goodwill and other intangible assets 375,549 745,920 6,265 6,527 741,257 748,146 745,349 Average tangible common equity $ 1,165,765 $ 1,101,557 $ 1,168,731 $ 1,157,197 $ 1,176,778 $ 1,160,373 $ 1,140,436 Return on average common equity * (44.2) % 9.1 % 3.8 % 1.9 % (155.3) % 9.0 % 10.6 % Return on average tangible common equity ** 2.9 % 15.3 % 3.9 % 2.0 % (9.3) % 15.0 % 17.6 % * Calculated as net income - GAAP divided by average common equity. Annualized for partial-year periods. ** Calculated as tangible net income divided by average tangible common equity. Annualized for partial-year periods. 20
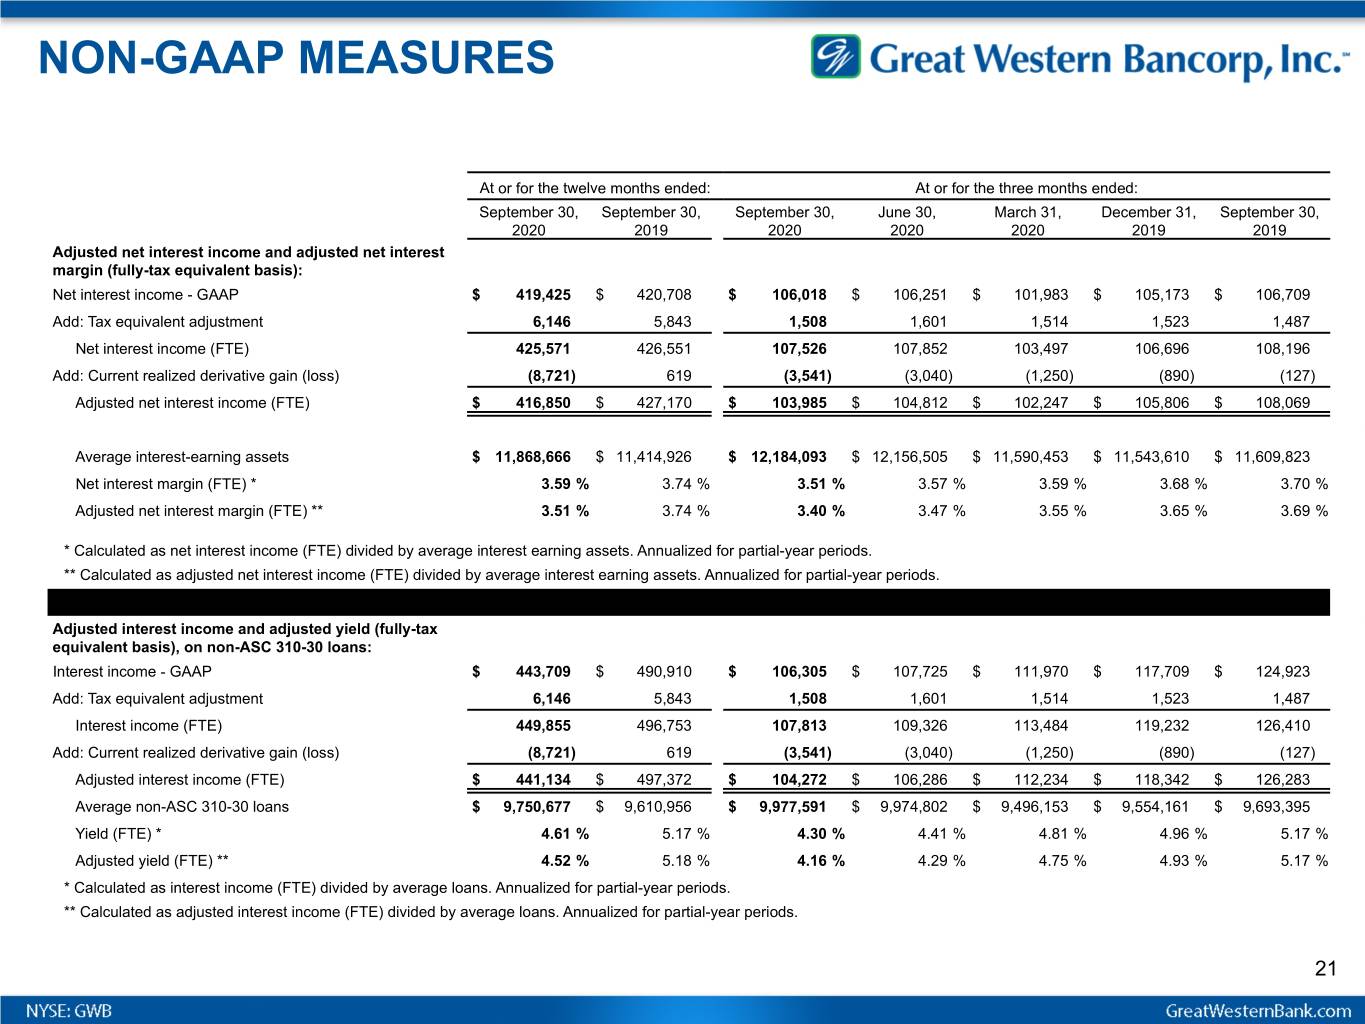
NON-GAAP MEASURES At or for the twelve months ended: At or for the three months ended: September 30, September 30, September 30, June 30, March 31, December 31, September 30, 2020 2019 2020 2020 2020 2019 2019 Adjusted net interest income and adjusted net interest margin (fully-tax equivalent basis): Net interest income - GAAP $ 419,425 $ 420,708 $ 106,018 $ 106,251 $ 101,983 $ 105,173 $ 106,709 Add: Tax equivalent adjustment 6,146 5,843 1,508 1,601 1,514 1,523 1,487 Net interest income (FTE) 425,571 426,551 107,526 107,852 103,497 106,696 108,196 Add: Current realized derivative gain (loss) (8,721) 619 (3,541) (3,040) (1,250) (890) (127) Adjusted net interest income (FTE) $ 416,850 $ 427,170 $ 103,985 $ 104,812 $ 102,247 $ 105,806 $ 108,069 Average interest-earning assets $ 11,868,666 $ 11,414,926 $ 12,184,093 $ 12,156,505 $ 11,590,453 $ 11,543,610 $ 11,609,823 Net interest margin (FTE) * 3.59 % 3.74 % 3.51 % 3.57 % 3.59 % 3.68 % 3.70 % Adjusted net interest margin (FTE) ** 3.51 % 3.74 % 3.40 % 3.47 % 3.55 % 3.65 % 3.69 % * Calculated as net interest income (FTE) divided by average interest earning assets. Annualized for partial-year periods. ** Calculated as adjusted net interest income (FTE) divided by average interest earning assets. Annualized for partial-year periods. Adjusted interest income and adjusted yield (fully-tax equivalent basis), on non-ASC 310-30 loans: x x x x x Interest income - GAAP $ 443,709 $ 490,910 $ 106,305 $ 107,725 $ 111,970 $ 117,709 $ 124,923 Add: Tax equivalent adjustment 6,146 5,843 1,508 1,601 1,514 1,523 1,487 Interest income (FTE) 449,855 496,753 107,813 109,326 113,484 119,232 126,410 Add: Current realized derivative gain (loss) (8,721) 619 (3,541) (3,040) (1,250) (890) (127) Adjusted interest income (FTE) $ 441,134 $ 497,372 $ 104,272 $ 106,286 $ 112,234 $ 118,342 $ 126,283 Average non-ASC 310-30 loans $ 9,750,677 $ 9,610,956 $ 9,977,591 $ 9,974,802 $ 9,496,153 $ 9,554,161 $ 9,693,395 Yield (FTE) * 4.61 % 5.17 % 4.30 % 4.41 % 4.81 % 4.96 % 5.17 % Adjusted yield (FTE) ** 4.52 % 5.18 % 4.16 % 4.29 % 4.75 % 4.93 % 5.17 % * Calculated as interest income (FTE) divided by average loans. Annualized for partial-year periods. ** Calculated as adjusted interest income (FTE) divided by average loans. Annualized for partial-year periods. 21
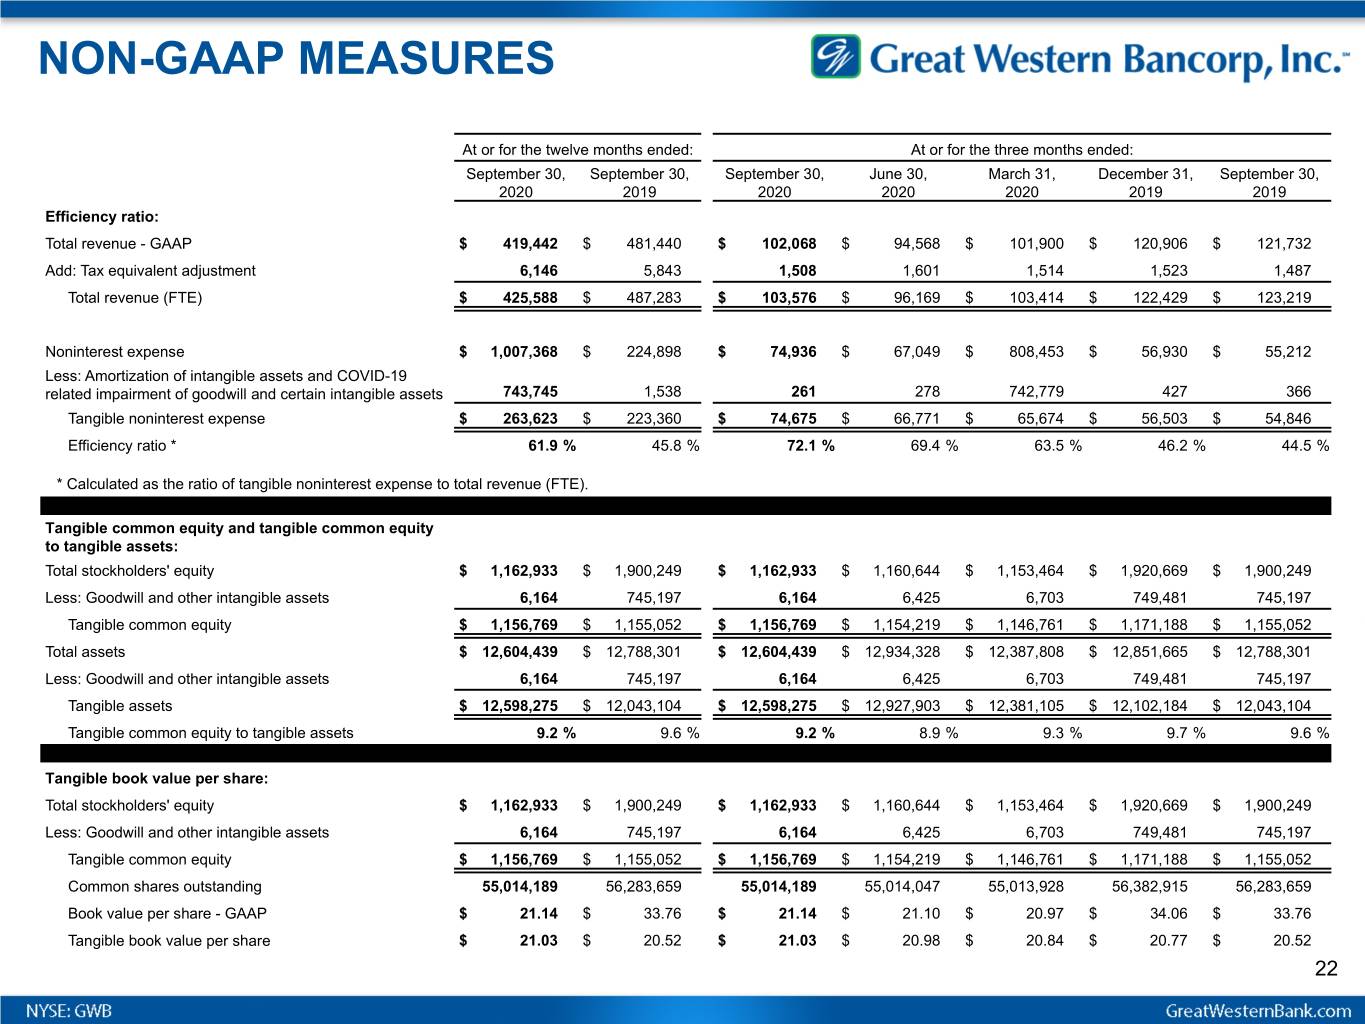
NON-GAAP MEASURES At or for the twelve months ended: At or for the three months ended: September 30, September 30, September 30, June 30, March 31, December 31, September 30, 2020 2019 2020 2020 2020 2019 2019 Efficiency ratio: Total revenue - GAAP $ 419,442 $ 481,440 $ 102,068 $ 94,568 $ 101,900 $ 120,906 $ 121,732 Add: Tax equivalent adjustment 6,146 5,843 1,508 1,601 1,514 1,523 1,487 Total revenue (FTE) $ 425,588 $ 487,283 $ 103,576 $ 96,169 $ 103,414 $ 122,429 $ 123,219 Noninterest expense $ 1,007,368 $ 224,898 $ 74,936 $ 67,049 $ 808,453 $ 56,930 $ 55,212 Less: Amortization of intangible assets and COVID-19 related impairment of goodwill and certain intangible assets 743,745 1,538 261 278 742,779 427 366 Tangible noninterest expense $ 263,623 $ 223,360 $ 74,675 $ 66,771 $ 65,674 $ 56,503 $ 54,846 Efficiency ratio * 61.9 % 45.8 % 72.1 % 69.4 % 63.5 % 46.2 % 44.5 % * Calculated as the ratio of tangible noninterest expense to total revenue (FTE). Tangible common equity and tangible common equity to tangible assets: x x x x x Total stockholders' equity $ 1,162,933 $ 1,900,249 $ 1,162,933 $ 1,160,644 $ 1,153,464 $ 1,920,669 $ 1,900,249 Less: Goodwill and other intangible assets 6,164 745,197 6,164 6,425 6,703 749,481 745,197 Tangible common equity $ 1,156,769 $ 1,155,052 $ 1,156,769 $ 1,154,219 $ 1,146,761 $ 1,171,188 $ 1,155,052 Total assets $ 12,604,439 $ 12,788,301 $ 12,604,439 $ 12,934,328 $ 12,387,808 $ 12,851,665 $ 12,788,301 Less: Goodwill and other intangible assets 6,164 745,197 6,164 6,425 6,703 749,481 745,197 Tangible assets $ 12,598,275 $ 12,043,104 $ 12,598,275 $ 12,927,903 $ 12,381,105 $ 12,102,184 $ 12,043,104 Tangible common equity to tangible assets 9.2 % 9.6 % 9.2 % 8.9 % 9.3 % 9.7 % 9.6 % x x x x x x Tangible book value per share: x x x x x Total stockholders' equity $ 1,162,933 $ 1,900,249 $ 1,162,933 $ 1,160,644 $ 1,153,464 $ 1,920,669 $ 1,900,249 Less: Goodwill and other intangible assets 6,164 745,197 6,164 6,425 6,703 749,481 745,197 Tangible common equity $ 1,156,769 $ 1,155,052 $ 1,156,769 $ 1,154,219 $ 1,146,761 $ 1,171,188 $ 1,155,052 Common shares outstanding 55,014,189 56,283,659 55,014,189 55,014,047 55,013,928 56,382,915 56,283,659 Book value per share - GAAP $ 21.14 $ 33.76 $ 21.14 $ 21.10 $ 20.97 $ 34.06 $ 33.76 Tangible book value per share $ 21.03 $ 20.52 $ 21.03 $ 20.98 $ 20.84 $ 20.77 $ 20.52 22
Appendix 2 Accounting for Loans at FV and Related Derivatives
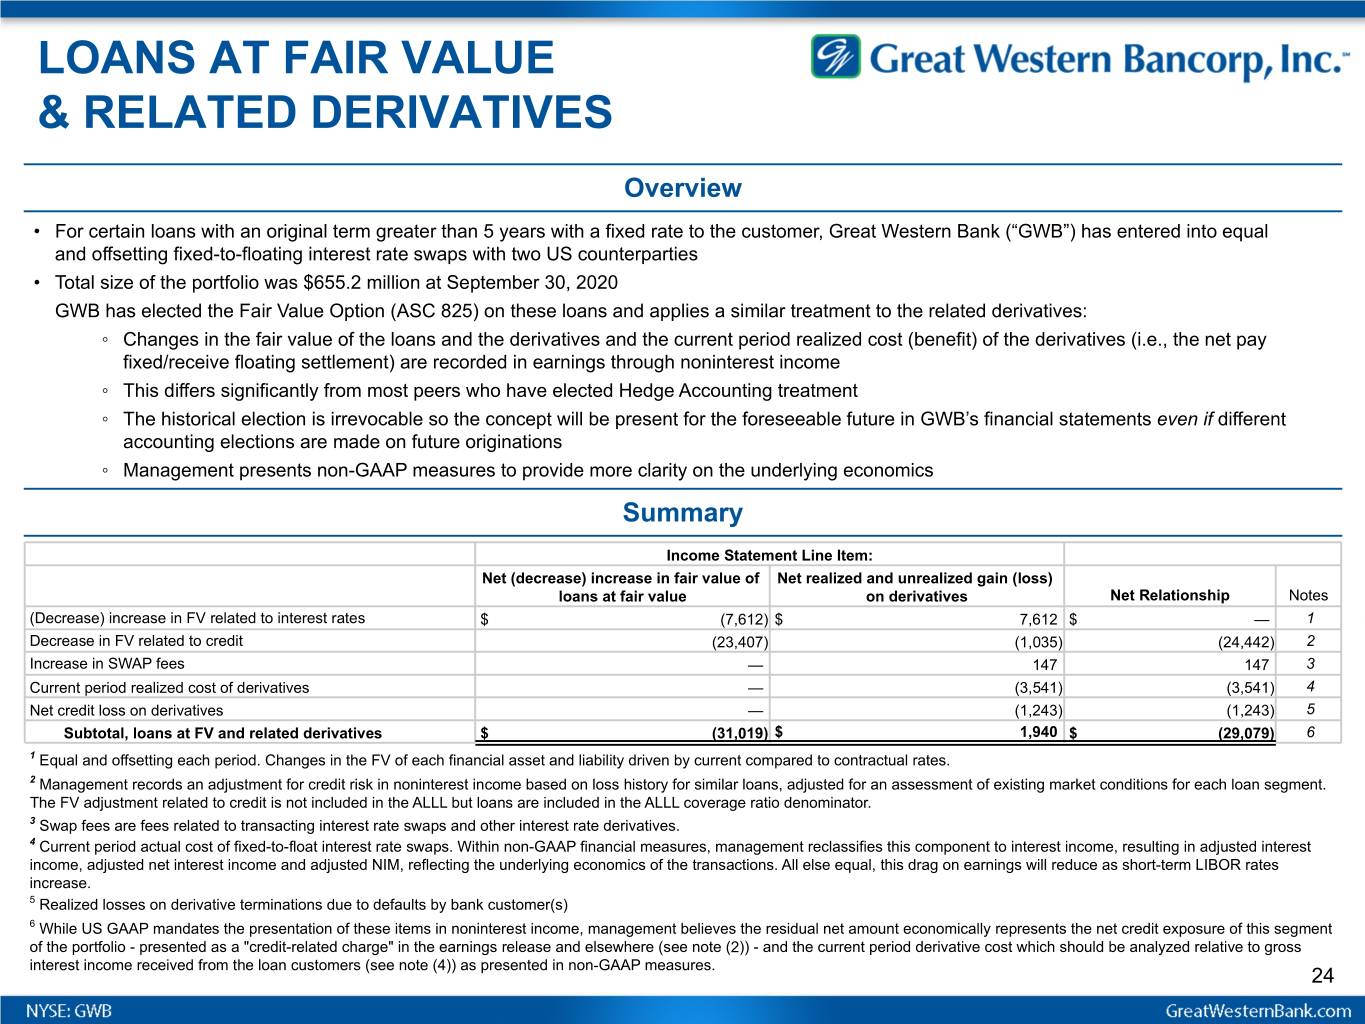
LOANS AT FAIR VALUE & RELATED DERIVATIVES Overview • For certain loans with an original term greater than 5 years with a fixed rate to the customer, Great Western Bank (“GWB”) has entered into equal and offsetting fixed-to-floating interest rate swaps with two US counterparties • Total size of the portfolio was $655.2 million at September 30, 2020 GWB has elected the Fair Value Option (ASC 825) on these loans and applies a similar treatment to the related derivatives: ◦ Changes in the fair value of the loans and the derivatives and the current period realized cost (benefit) of the derivatives (i.e., the net pay fixed/receive floating settlement) are recorded in earnings through noninterest income ◦ This differs significantly from most peers who have elected Hedge Accounting treatment ◦ The historical election is irrevocable so the concept will be present for the foreseeable future in GWB’s financial statements even if different accounting elections are made on future originations ◦ Management presents non-GAAP measures to provide more clarity on the underlying economics Summary x Income Statement Line Item: x x Net (decrease) increase in fair value of Net realized and unrealized gain (loss) x loans at fair value on derivatives Net Relationship Notes (Decrease) increase in FV related to interest rates $ (7,612) $ 7,612 $ — 1 Decrease in FV related to credit (23,407) (1,035) (24,442) 2 Increase in SWAP fees — 147 147 3 Current period realized cost of derivatives — (3,541) (3,541) 4 Net credit loss on derivatives — (1,243) (1,243) 5 Subtotal, loans at FV and related derivatives $ (31,019) $ 1,940 $ (29,079) 6 1 Equal and offsetting each period. Changes in the FV of each financial asset and liability driven by current compared to contractual rates. 2 Management records an adjustment for credit risk in noninterest income based on loss history for similar loans, adjusted for an assessment of existing market conditions for each loan segment. The FV adjustment related to credit is not included in the ALLL but loans are included in the ALLL coverage ratio denominator. 3 Swap fees are fees related to transacting interest rate swaps and other interest rate derivatives. 4 Current period actual cost of fixed-to-float interest rate swaps. Within non-GAAP financial measures, management reclassifies this component to interest income, resulting in adjusted interest income, adjusted net interest income and adjusted NIM, reflecting the underlying economics of the transactions. All else equal, this drag on earnings will reduce as short-term LIBOR rates increase. 5 Realized losses on derivative terminations due to defaults by bank customer(s) 6 While US GAAP mandates the presentation of these items in noninterest income, management believes the residual net amount economically represents the net credit exposure of this segment of the portfolio - presented as a "credit-related charge" in the earnings release and elsewhere (see note (2)) - and the current period derivative cost which should be analyzed relative to gross interest income received from the loan customers (see note (4)) as presented in non-GAAP measures. 24


