ANALYST PRESENTATION February 7, 2017 Paul B. Murphy, Jr. Chairman and CEO Second Quarter 2020 Financial Results July 22, 2020 Exhibit 99.2
Disclaimers This communication contains forward-looking statements within the meaning of the Private Securities Litigation Reform Act of 1995. These forward-looking statements reflect our current views with respect to, among other things, future events and our results of operations, financial condition and financial performance. These statements are often, but not always, made through the use of words or phrases such as “may,” “should,” “could,” “predict,” “potential,” “believe,” “will likely result,” “expect,” “continue,” “will,” “anticipate,” “seek,” “estimate,” “intend,” “plan,” “projection,” “would” and “outlook,” or the negative version of those words or other comparable words of a future or forward-looking nature. These forward-looking statements are not historical facts, and are based on current expectations, estimates and projections about our industry, management’s beliefs and certain assumptions made by management, many of which, by their nature, are inherently uncertain and beyond our control. Accordingly, we caution you that any such forward-looking statements are not guarantees of future performance and are subject to risks, assumptions and uncertainties that are difficult to predict. Although we believe that the expectations reflected in these forward-looking statements are reasonable as of the date made, actual results may prove to be materially different from the results expressed or implied by the forward-looking statements. Such factors include, without limitation, the “Risk Factors” referenced in our Registration Statement on Form S-3 filed with the Securities and Exchange Commission (the “SEC”) on May 21, 2018, and our Registration Statement on Form S-4 filed with the SEC on July 20, 2018, other risks and uncertainties listed from time to time in our reports and documents filed with the SEC, including our Annual Reports on Form 10-K and Quarterly Reports on Form 10-Q, and the following factors: business and economic conditions generally and in the financial services industry, nationally and within our current and future geographic market areas; economic, market, operational, liquidity, credit and interest rate risks associated with our business; deteriorating asset quality and higher loan charge-offs; the laws and regulations applicable to our business; our ability to achieve organic loan and deposit growth and the composition of such growth; increased competition in the financial services industry, nationally, regionally or locally; our ability to maintain our historical earnings trends; our ability to raise additional capital to implement our business plan; material weaknesses in our internal control over financial reporting; systems failures or interruptions involving our information technology and telecommunications systems or third-party servicers; the composition of our management team and our ability to attract and retain key personnel; the fiscal position of the U.S. federal government and the soundness of other financial institutions; the composition of our loan portfolio, including the identity of our borrowers and the concentration of loans in energy-related industries and in our specialized industries; the portion of our loan portfolio that is comprised of participations and shared national credits; the amount of nonperforming and classified assets we hold; the extent of the impact of the COVID-19 pandemic on us and our customers, counterparties, employees and third-party service providers, and the impacts to our business, financial position, results of operations, and prospects. Cadence can give no assurance that any goal or plan or expectation set forth in forward-looking statements can be achieved and readers are cautioned not to place undue reliance on such statements. The forward-looking statements are made as of the date of this communication, and Cadence does not intend, and assumes no obligation, to update any forward-looking statement to reflect events or circumstances after the date on which the statement is made or to reflect the occurrence of unanticipated events or circumstances, except as required by applicable law. Certain of the financial measures and ratios we present, including “efficiency ratio,” “adjusted efficiency ratio,” “adjusted noninterest expenses,” “adjusted operating revenue,” “tangible common equity ratio,” “tangible book value per share” and “return on average tangible common equity”, “adjusted return on average tangible common equity”, “adjusted return on average assets”, “adjusted diluted earnings per share”, “pre-tax, pre-provision net revenue” and "adjusted pre-tax pre-provision net revenue,“ are supplemental measures that are not required by, or are not presented in accordance with, U.S. generally accepted accounting principles (GAAP). We refer to these financial measures and ratios as “non-GAAP financial measures.” We consider the use of select non-GAAP financial measures and ratios to be useful for financial and operational decision making and useful in evaluating period-to-period comparisons. We believe that these non-GAAP financial measures provide meaningful supplemental information regarding our performance by excluding certain expenditures or assets that we believe are not indicative of our primary business operating results or by presenting certain metrics on a fully taxable equivalent basis. We believe that management and investors benefit from referring to these non-GAAP financial measures in assessing our performance and when planning, forecasting, analyzing and comparing past, present and future periods. These non-GAAP financial measures should not be considered a substitute for financial information presented in accordance with GAAP and you should not rely on non-GAAP financial measures alone as measures of our performance. The non-GAAP financial measures we present may differ from non-GAAP financial measures used by our peers or other companies. We compensate for these limitations by providing the equivalent GAAP measures whenever we present the non-GAAP financial measures and by including a reconciliation of the impact of the components adjusted for in the non-GAAP financial measure so that both measures and the individual components may be considered when analyzing our performance. A reconciliation of non-GAAP financial measures to the comparable GAAP financial measures is included in the Appendix.
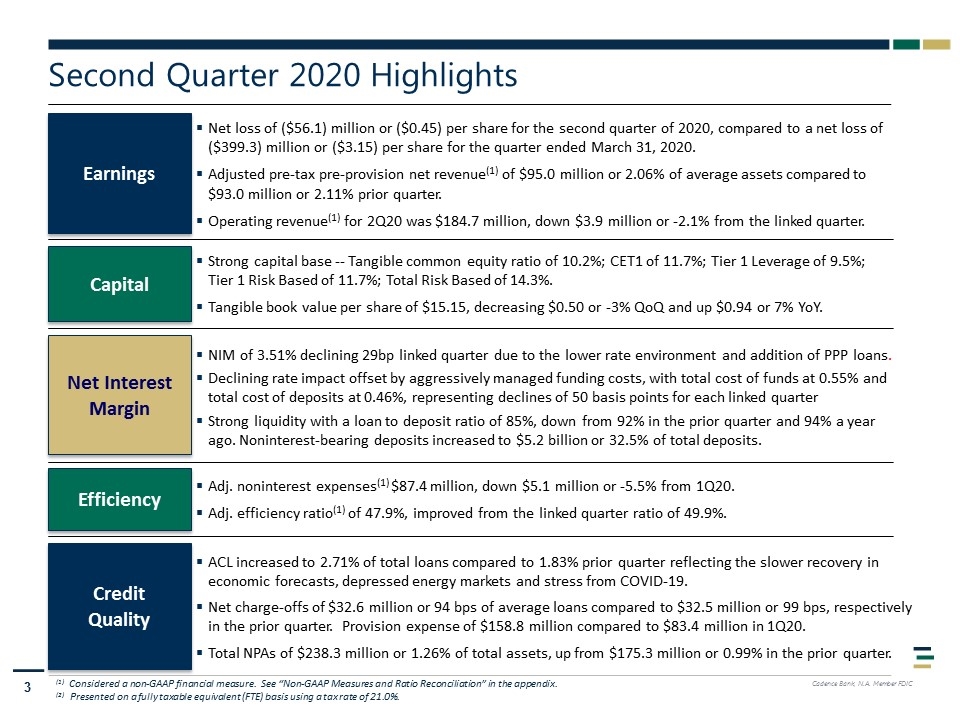
Earnings Net loss of ($56.1) million or ($0.45) per share for the second quarter of 2020, compared to a net loss of ($399.3) million or ($3.15) per share for the quarter ended March 31, 2020. Adjusted pre-tax pre-provision net revenue(1) of $95.0 million or 2.06% of average assets compared to $93.0 million or 2.11% prior quarter. Operating revenue(1) for 2Q20 was $184.7 million, down $3.9 million or -2.1% from the linked quarter. Capital Net Interest Margin Efficiency Credit Quality Strong capital base -- Tangible common equity ratio of 10.2%; CET1 of 11.7%; Tier 1 Leverage of 9.5%; Tier 1 Risk Based of 11.7%; Total Risk Based of 14.3%. Tangible book value per share of $15.15, decreasing $0.50 or -3% QoQ and up $0.94 or 7% YoY. NIM of 3.51% declining 29bp linked quarter due to the lower rate environment and addition of PPP loans. Declining rate impact offset by aggressively managed funding costs, with total cost of funds at 0.55% and total cost of deposits at 0.46%, representing declines of 50 basis points for each linked quarter Strong liquidity with a loan to deposit ratio of 85%, down from 92% in the prior quarter and 94% a year ago. Noninterest-bearing deposits increased to $5.2 billion or 32.5% of total deposits. Adj. noninterest expenses(1) $87.4 million, down $5.1 million or -5.5% from 1Q20. Adj. efficiency ratio(1) of 47.9%, improved from the linked quarter ratio of 49.9%. ACL increased to 2.71% of total loans compared to 1.83% prior quarter reflecting the slower recovery in economic forecasts, depressed energy markets and stress from COVID-19. Net charge-offs of $32.6 million or 94 bps of average loans compared to $32.5 million or 99 bps, respectively in the prior quarter. Provision expense of $158.8 million compared to $83.4 million in 1Q20. Total NPAs of $238.3 million or 1.26% of total assets, up from $175.3 million or 0.99% in the prior quarter. (1) Considered a non-GAAP financial measure. See “Non-GAAP Measures and Ratio Reconciliation” in the appendix. (2) Presented on a fully taxable equivalent (FTE) basis using a tax rate of 21.0%. Second Quarter 2020 Highlights
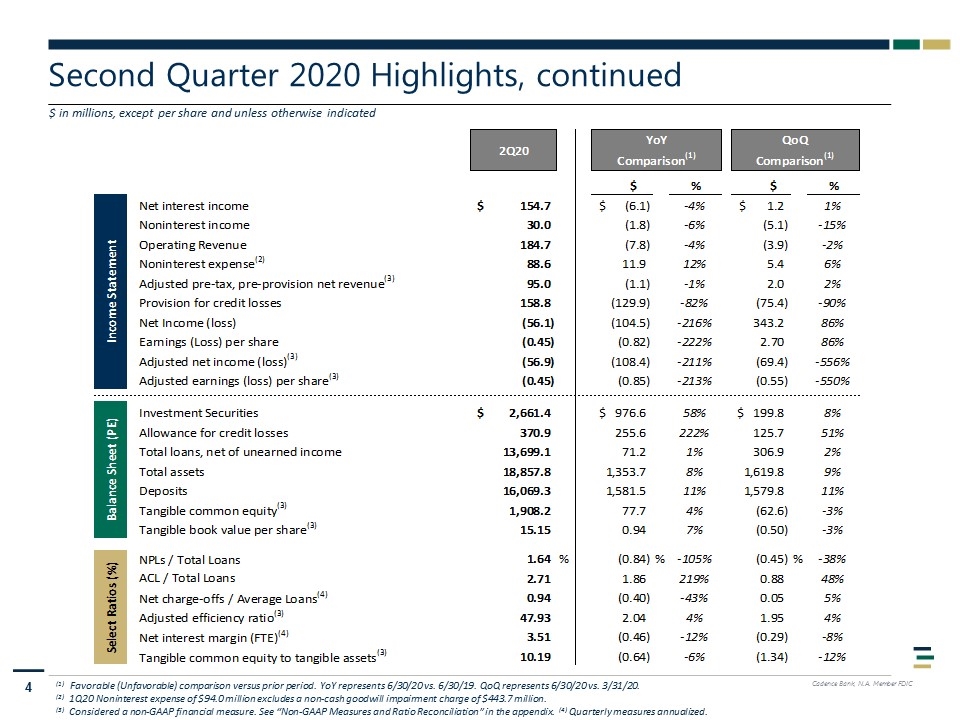
Second Quarter 2020 Highlights, continued $ in millions, except per share and unless otherwise indicated (1) Favorable (Unfavorable) comparison versus prior period. YoY represents 6/30/20 vs. 6/30/19. QoQ represents 6/30/20 vs. 3/31/20. (2) 1Q20 Noninterest expense of $94.0 million excludes a non-cash goodwill impairment charge of $443.7 million. (3) Considered a non-GAAP financial measure. See “Non-GAAP Measures and Ratio Reconciliation” in the appendix. (4) Quarterly measures annualized.
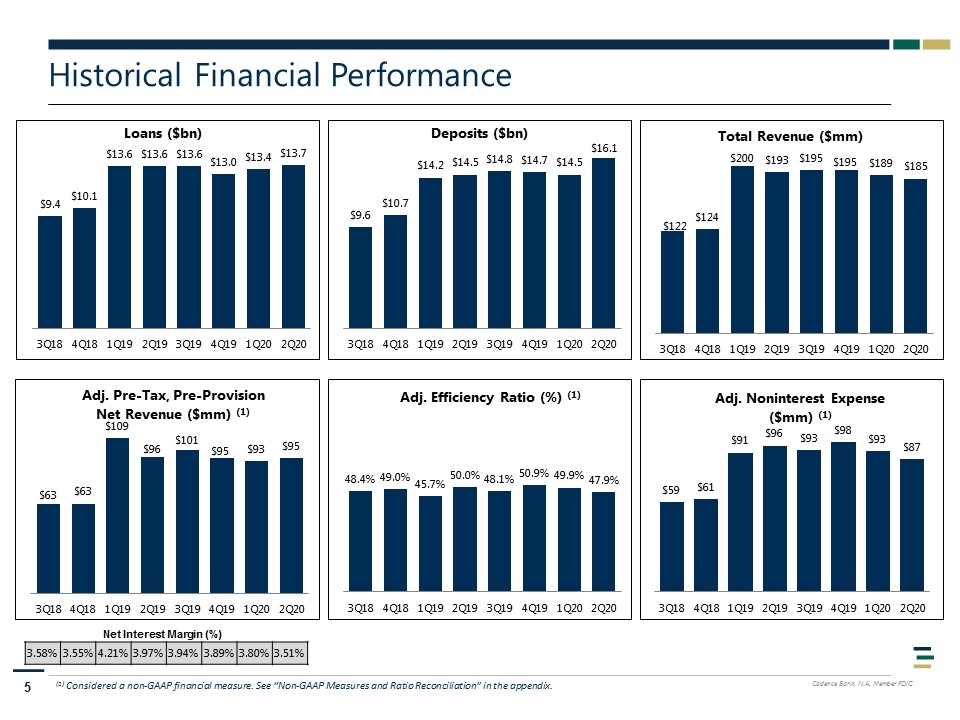
Historical Financial Performance 44% 62% 74% 17% 26% 74% 80% 84% 20% 16% 92% 8% 96% 4% (1) Considered a non-GAAP financial measure. See “Non-GAAP Measures and Ratio Reconciliation” in the appendix. 3.58% 3.55% 4.21% 3.97% 3.94% 3.89% 3.80% 3.51% Net Interest Margin (%)
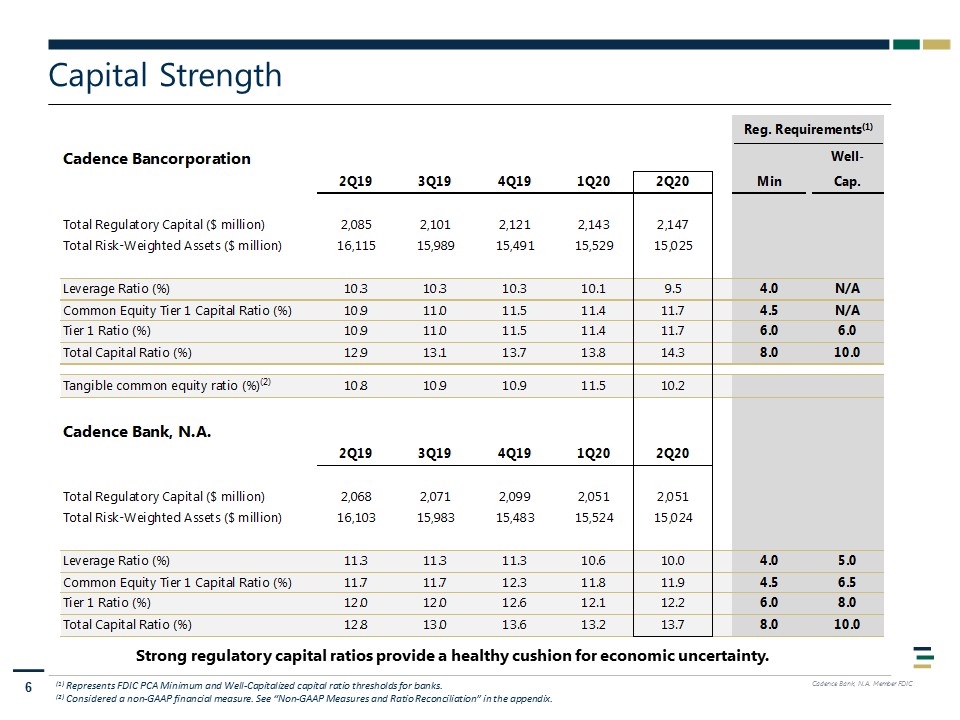
Capital Strength (1) Represents FDIC PCA Minimum and Well-Capitalized capital ratio thresholds for banks. (2) Considered a non-GAAP financial measure. See “Non-GAAP Measures and Ratio Reconciliation” in the appendix. Strong regulatory capital ratios provide a healthy cushion for economic uncertainty.
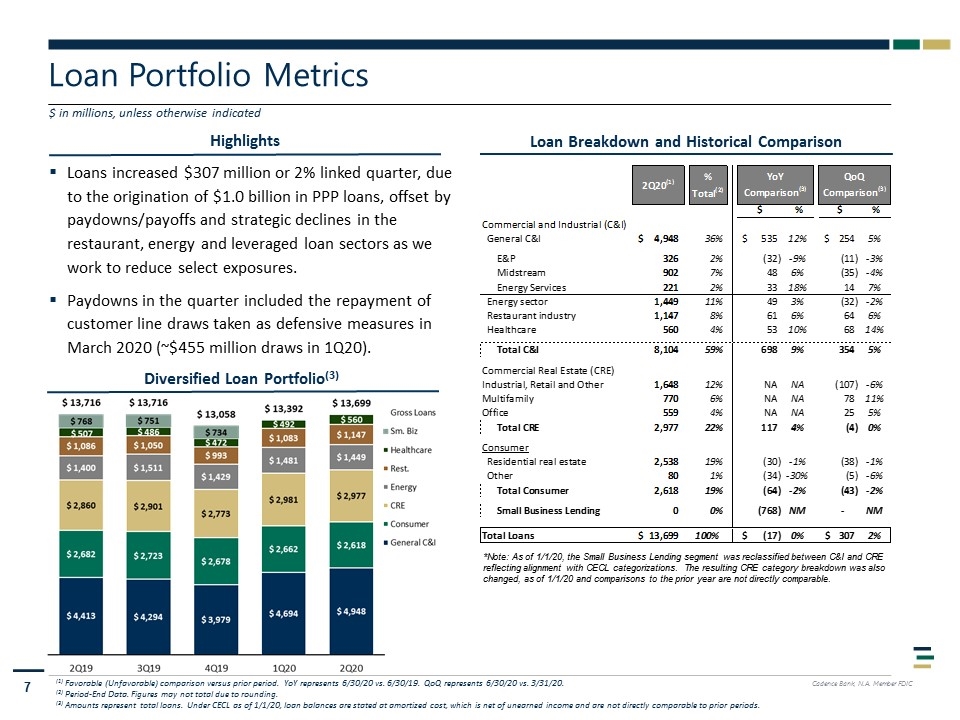
Highlights Loan Portfolio Metrics $ in millions, unless otherwise indicated Diversified Loan Portfolio(3) (1) Favorable (Unfavorable) comparison versus prior period. YoY represents 6/30/20 vs. 6/30/19. QoQ represents 6/30/20 vs. 3/31/20. (2) Period-End Data. Figures may not total due to rounding. (3) Amounts represent total loans. Under CECL as of 1/1/20, loan balances are stated at amortized cost, which is net of unearned income and are not directly comparable to prior periods. Loan Breakdown and Historical Comparison *Note: As of 1/1/20, the Small Business Lending segment was reclassified between C&I and CRE reflecting alignment with CECL categorizations. The resulting CRE category breakdown was also changed, as of 1/1/20 and comparisons to the prior year are not directly comparable. Loans increased $307 million or 2% linked quarter, due to the origination of $1.0 billion in PPP loans, offset by paydowns/payoffs and strategic declines in the restaurant, energy and leveraged loan sectors as we work to reduce select exposures. Paydowns in the quarter included the repayment of customer line draws taken as defensive measures in March 2020 (~$455 million draws in 1Q20).
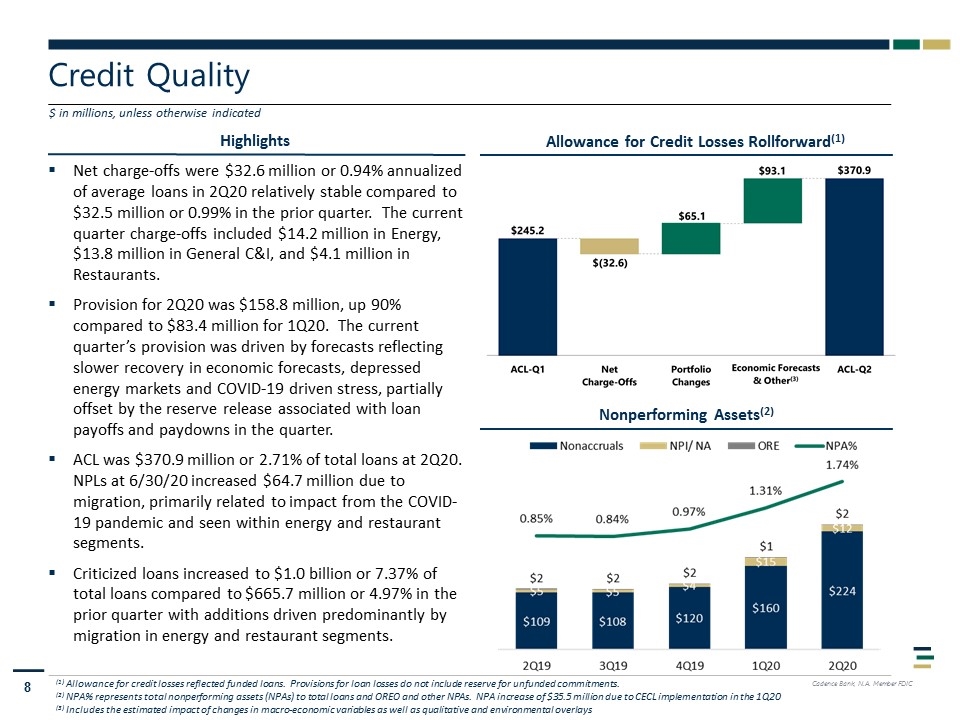
Credit Quality $ in millions, unless otherwise indicated Nonperforming Assets(2) Highlights Allowance for Credit Losses Rollforward(1) (1) Allowance for credit losses reflected funded loans. Provisions for loan losses do not include reserve for unfunded commitments. (2) NPA% represents total nonperforming assets (NPAs) to total loans and OREO and other NPAs. NPA increase of $35.5 million due to CECL implementation in the 1Q20 (3) Includes the estimated impact of changes in macro-economic variables as well as qualitative and environmental overlays Net charge-offs were $32.6 million or 0.94% annualized of average loans in 2Q20 relatively stable compared to $32.5 million or 0.99% in the prior quarter. The current quarter charge-offs included $14.2 million in Energy, $13.8 million in General C&I, and $4.1 million in Restaurants. Provision for 2Q20 was $158.8 million, up 90% compared to $83.4 million for 1Q20. The current quarter’s provision was driven by forecasts reflecting slower recovery in economic forecasts, depressed energy markets and COVID-19 driven stress, partially offset by the reserve release associated with loan payoffs and paydowns in the quarter. ACL was $370.9 million or 2.71% of total loans at 2Q20. NPLs at 6/30/20 increased $64.7 million due to migration, primarily related to impact from the COVID-19 pandemic and seen within energy and restaurant segments. Criticized loans increased to $1.0 billion or 7.37% of total loans compared to $665.7 million or 4.97% in the prior quarter with additions driven predominantly by migration in energy and restaurant segments.
Credit Quality - Commentary $ in millions, unless otherwise indicated Actionable measures to de-risk the portfolio by taking a disciplined approach to our credit analysis and reserves amid the uncertainty presented by COVID-19. Critically reviewing our portfolios to ensure we are fully reflecting the realities of a very challenging macro environment. The current quarter’s provision was significantly impacted by an economic forecast that was adversely affected by the COVID-19 pandemic and depressed oil prices, as well as associated net credit migration within certain portfolios. Our calculation for the ACL used the baseline scenario provided by a nationally recognized service, as adjusted for qualitative and environmental factors. ACL as a percent of NPLs improved on a linked quarter basis from 1.54x to 1.65x. The ACL models were conditioned by the following forecasted macroeconomic variables: GDP, Unemployment, CRE Price Index, Dow Jones Total Market, and BBB spread, among others. Increase in criticized assets largely in restaurant and energy and to a lesser extent CRE credits, partially mitigated by net reductions in general C&I credits. Approximately 2/3 of the quarterly increase driven by Restaurant (a third of this in the QSR space). Classified assets increased from quarter end $176.2 million to $570.8 million. This migration was again primarily related to the Restaurant and Energy sectors. Nonaccruals increased $64.7 million to $224.4 million primarily due to Energy, Restaurant and Healthcare. Nonaccruals are at 1.64% of total loans.
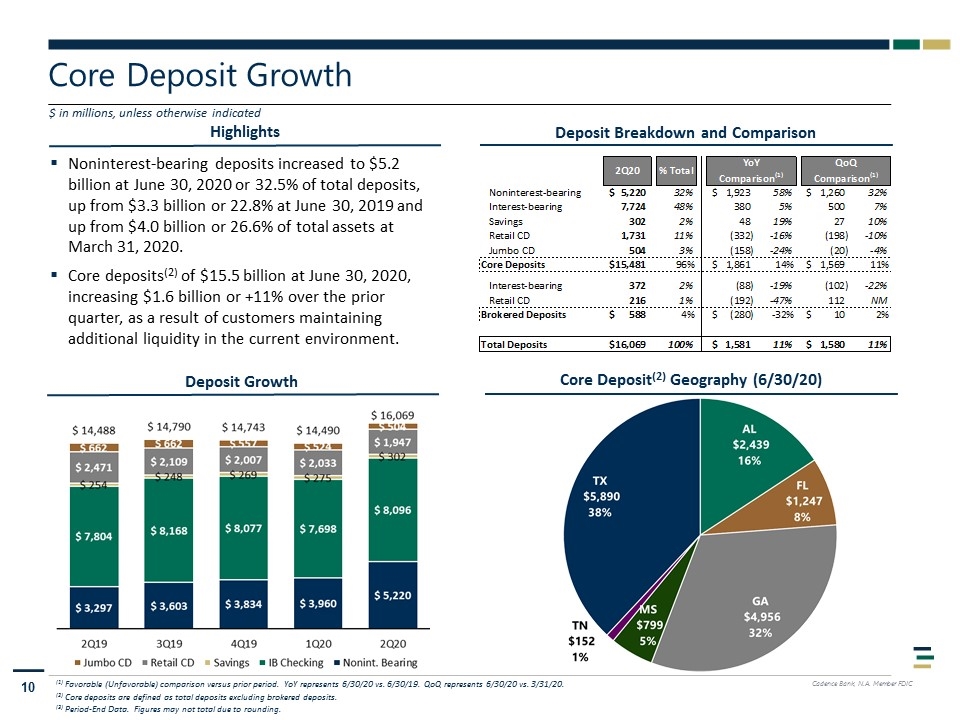
Highlights Core Deposit Growth $ in millions, unless otherwise indicated Deposit Growth Deposit Breakdown and Comparison (1) Favorable (Unfavorable) comparison versus prior period. YoY represents 6/30/20 vs. 6/30/19. QoQ represents 6/30/20 vs. 3/31/20. (2) Core deposits are defined as total deposits excluding brokered deposits. (3) Period-End Data. Figures may not total due to rounding. Core Deposit(2) Geography (6/30/20) Noninterest-bearing deposits increased to $5.2 billion at June 30, 2020 or 32.5% of total deposits, up from $3.3 billion or 22.8% at June 30, 2019 and up from $4.0 billion or 26.6% of total assets at March 31, 2020. Core deposits(2) of $15.5 billion at June 30, 2020, increasing $1.6 billion or +11% over the prior quarter, as a result of customers maintaining additional liquidity in the current environment.
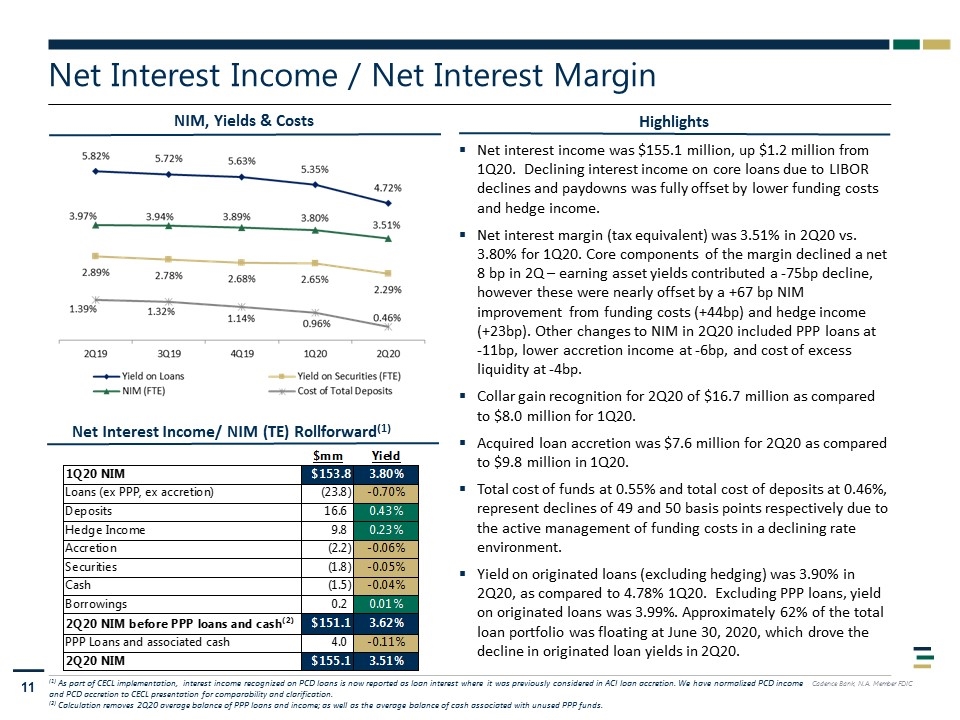
Net Interest Income / Net Interest Margin Highlights (1) As part of CECL implementation, interest income recognized on PCD loans is now reported as loan interest where it was previously considered in ACI loan accretion. We have normalized PCD income and PCD accretion to CECL presentation for comparability and clarification. (2) Calculation removes 2Q20 average balance of PPP loans and income; as well as the average balance of cash associated with unused PPP funds. NIM, Yields & Costs Net interest income was $155.1 million, up $1.2 million from 1Q20. Declining interest income on core loans due to LIBOR declines and paydowns was fully offset by lower funding costs and hedge income. Net interest margin (tax equivalent) was 3.51% in 2Q20 vs. 3.80% for 1Q20. Core components of the margin declined a net 8 bp in 2Q – earning asset yields contributed a -75bp decline, however these were nearly offset by a +67 bp NIM improvement from funding costs (+44bp) and hedge income (+23bp). Other changes to NIM in 2Q20 included PPP loans at -11bp, lower accretion income at -6bp, and cost of excess liquidity at -4bp. Collar gain recognition for 2Q20 of $16.7 million as compared to $8.0 million for 1Q20. Acquired loan accretion was $7.6 million for 2Q20 as compared to $9.8 million in 1Q20. Total cost of funds at 0.55% and total cost of deposits at 0.46%, represent declines of 49 and 50 basis points respectively due to the active management of funding costs in a declining rate environment. Yield on originated loans (excluding hedging) was 3.90% in 2Q20, as compared to 4.78% 1Q20. Excluding PPP loans, yield on originated loans was 3.99%. Approximately 62% of the total loan portfolio was floating at June 30, 2020, which drove the decline in originated loan yields in 2Q20. Net Interest Income/ NIM (TE) Rollforward(1)
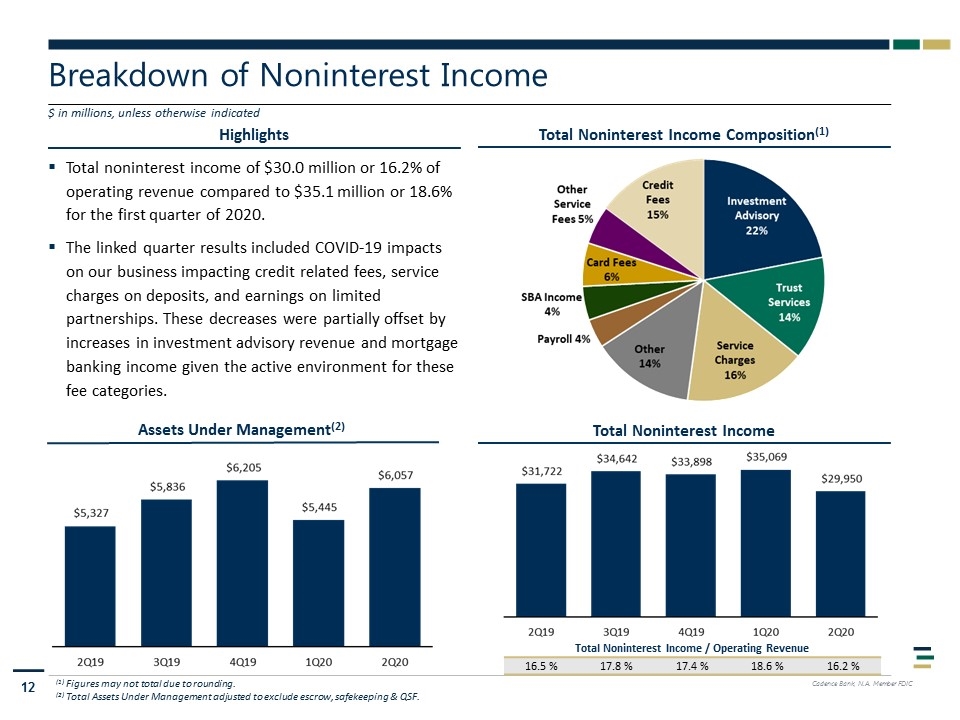
Highlights Breakdown of Noninterest Income Total Noninterest Income Composition(1) Total Noninterest Income $ in millions, unless otherwise indicated Assets Under Management(2) (1) Figures may not total due to rounding. (2) Total Assets Under Management adjusted to exclude escrow, safekeeping & QSF. Total Noninterest Income / Operating Revenue 16.5 % 17.8 % 17.4 % 18.6 % 16.2 % Total noninterest income of $30.0 million or 16.2% of operating revenue compared to $35.1 million or 18.6% for the first quarter of 2020. The linked quarter results included COVID-19 impacts on our business impacting credit related fees, service charges on deposits, and earnings on limited partnerships. These decreases were partially offset by increases in investment advisory revenue and mortgage banking income given the active environment for these fee categories.
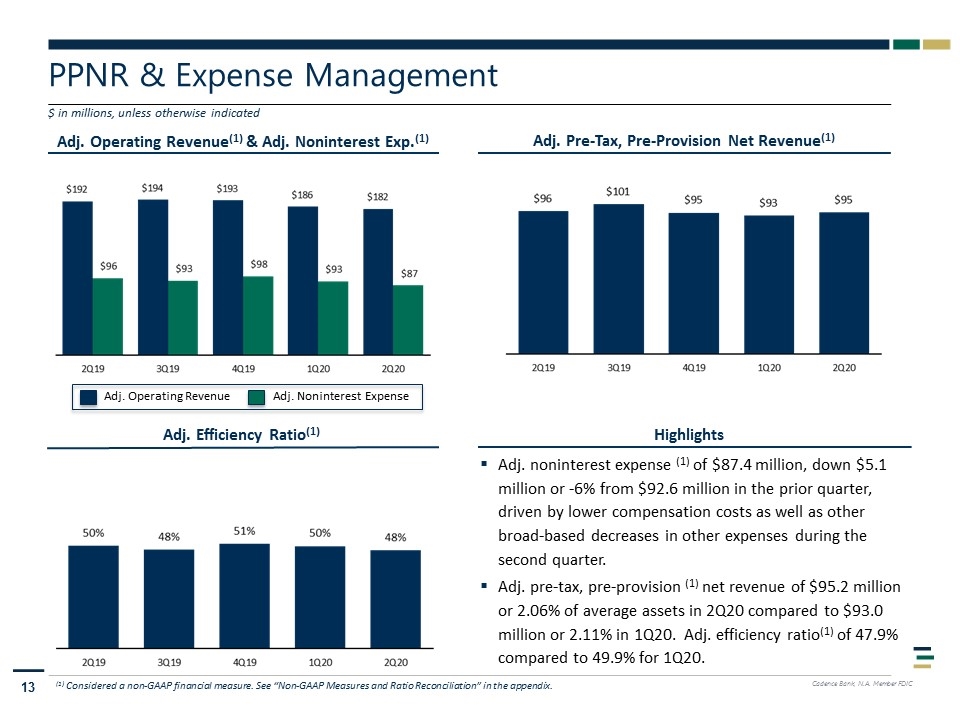
PPNR & Expense Management Adj. Pre-Tax, Pre-Provision Net Revenue(1) Highlights Adj. Efficiency Ratio(1) (1) Considered a non-GAAP financial measure. See “Non-GAAP Measures and Ratio Reconciliation” in the appendix. Adj. Operating Revenue(1) & Adj. Noninterest Exp.(1) $ in millions, unless otherwise indicated Adj. Operating Revenue Adj. Noninterest Expense Adj. noninterest expense (1) of $87.4 million, down $5.1 million or -6% from $92.6 million in the prior quarter, driven by lower compensation costs as well as other broad-based decreases in other expenses during the second quarter. Adj. pre-tax, pre-provision (1) net revenue of $95.2 million or 2.06% of average assets in 2Q20 compared to $93.0 million or 2.11% in 1Q20. Adj. efficiency ratio(1) of 47.9% compared to 49.9% for 1Q20.
Appendix
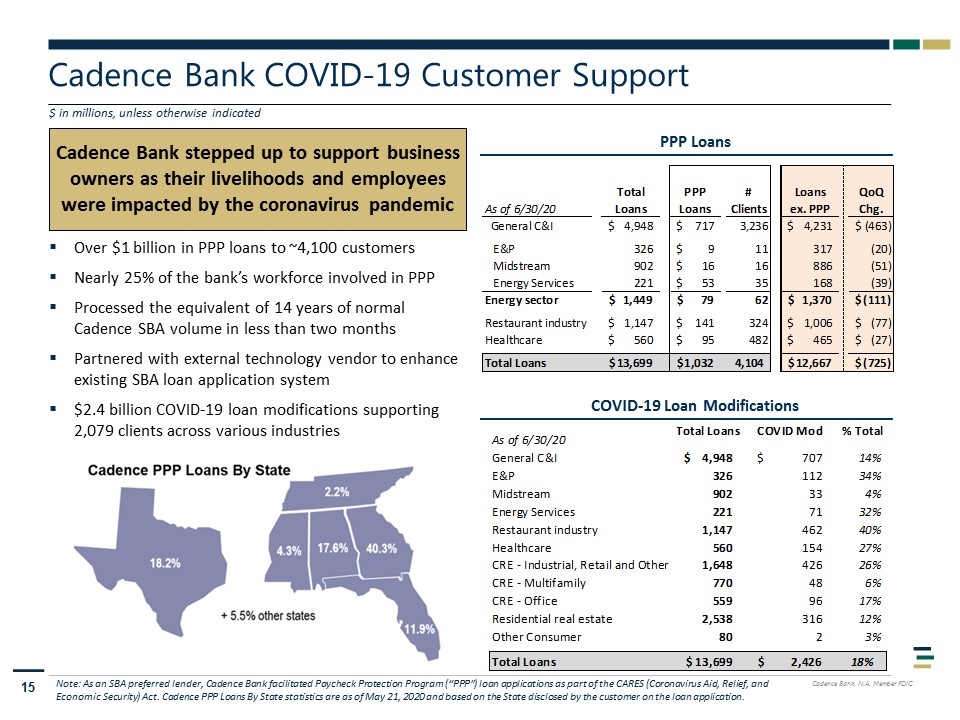
Cadence Bank COVID-19 Customer Support $ in millions, unless otherwise indicated PPP Loans Cadence Bank stepped up to support business owners as their livelihoods and employees were impacted by the coronavirus pandemic Over $1 billion in PPP loans to ~4,100 customers Nearly 25% of the bank’s workforce involved in PPP Processed the equivalent of 14 years of normal Cadence SBA volume in less than two months Partnered with external technology vendor to enhance existing SBA loan application system $2.4 billion COVID-19 loan modifications supporting 2,079 clients across various industries Note: As an SBA preferred lender, Cadence Bank facilitated Paycheck Protection Program (“PPP”) loan applications as part of the CARES (Coronavirus Aid, Relief, and Economic Security) Act. Cadence PPP Loans By State statistics are as of May 21, 2020 and based on the State disclosed by the customer on the loan application. COVID-19 Loan Modifications
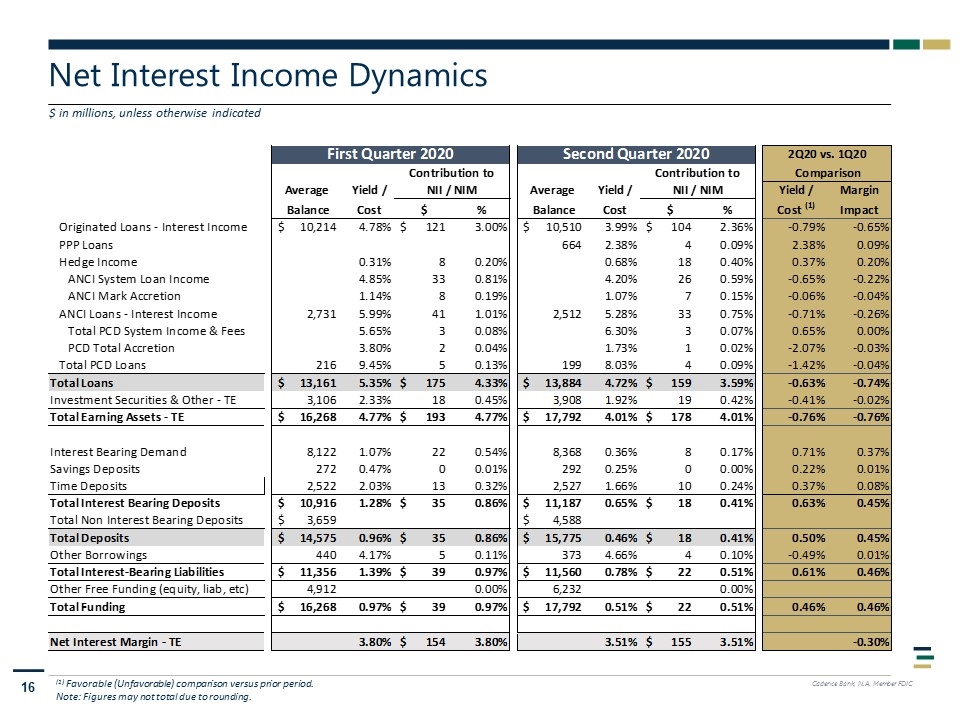
Net Interest Income Dynamics $ in millions, unless otherwise indicated (1) Favorable (Unfavorable) comparison versus prior period. Note: Figures may not total due to rounding.
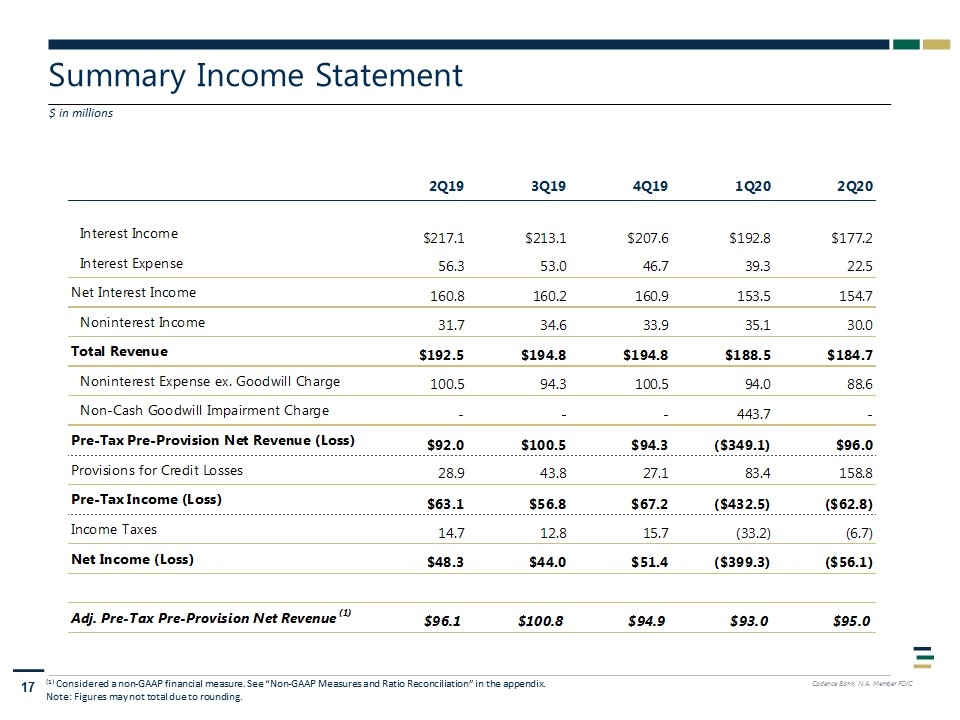
Summary Income Statement $ in millions (1) Considered a non-GAAP financial measure. See “Non-GAAP Measures and Ratio Reconciliation” in the appendix. Note: Figures may not total due to rounding.
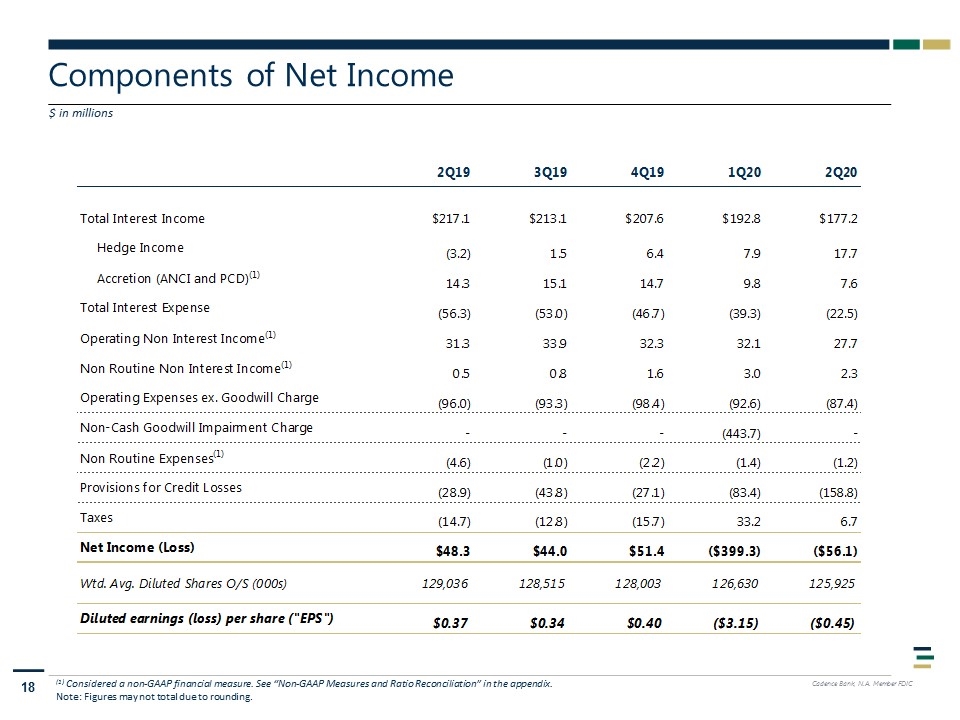
Components of Net Income $ in millions (1) Considered a non-GAAP financial measure. See “Non-GAAP Measures and Ratio Reconciliation” in the appendix. Note: Figures may not total due to rounding.
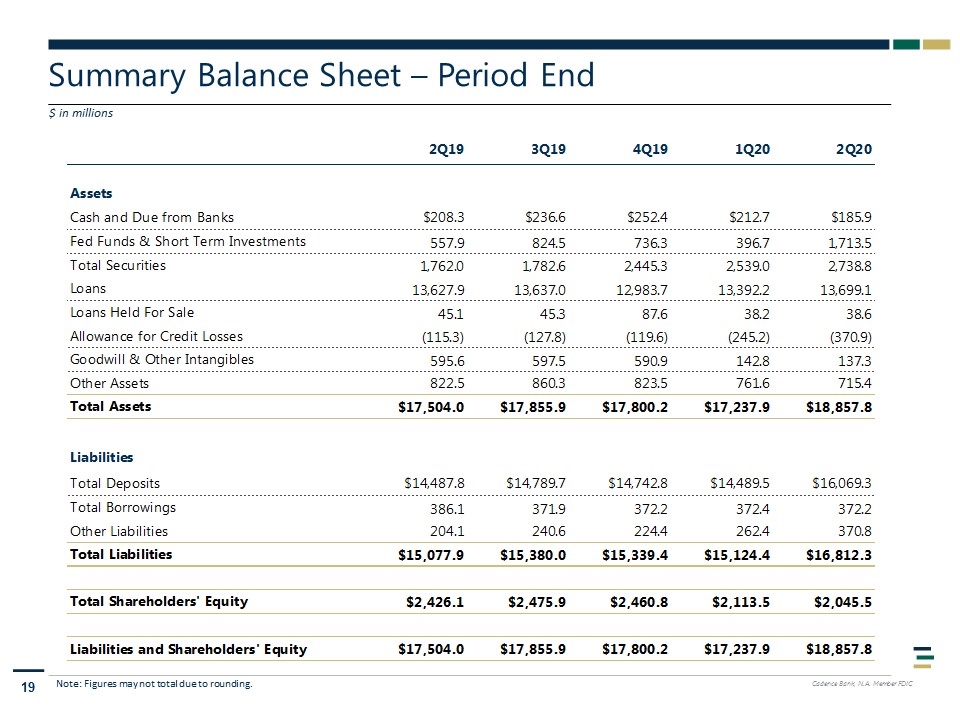
Summary Balance Sheet – Period End $ in millions Note: Figures may not total due to rounding.
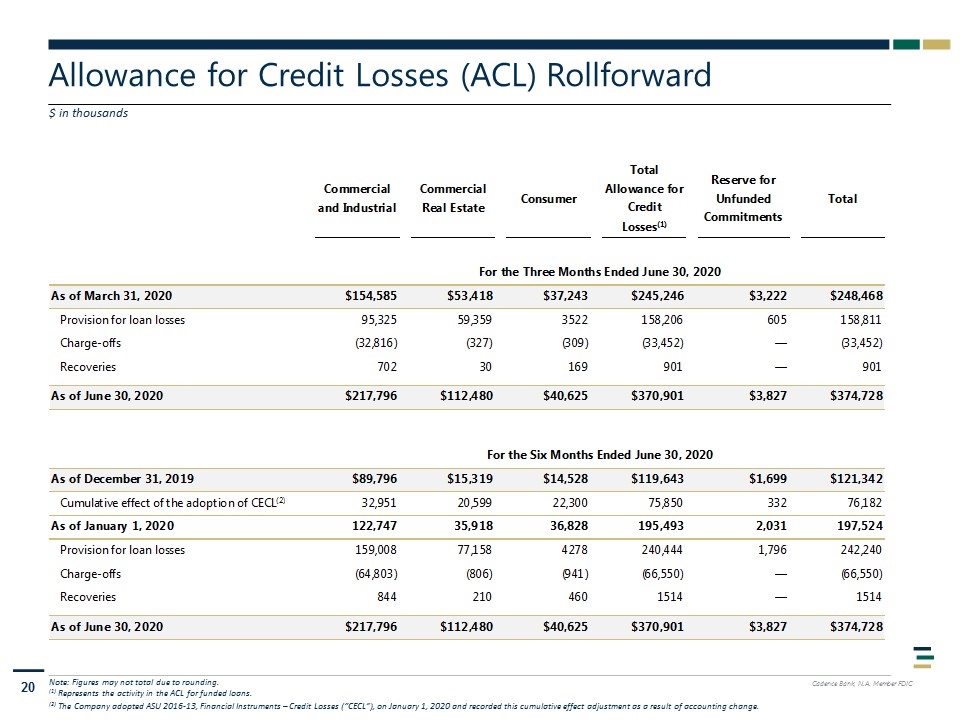
Allowance for Credit Losses (ACL) Rollforward $ in thousands Note: Figures may not total due to rounding. (1) Represents the activity in the ACL for funded loans. (2) The Company adopted ASU 2016-13, Financial Instruments – Credit Losses (“CECL”), on January 1, 2020 and recorded this cumulative effect adjustment as a result of accounting change.
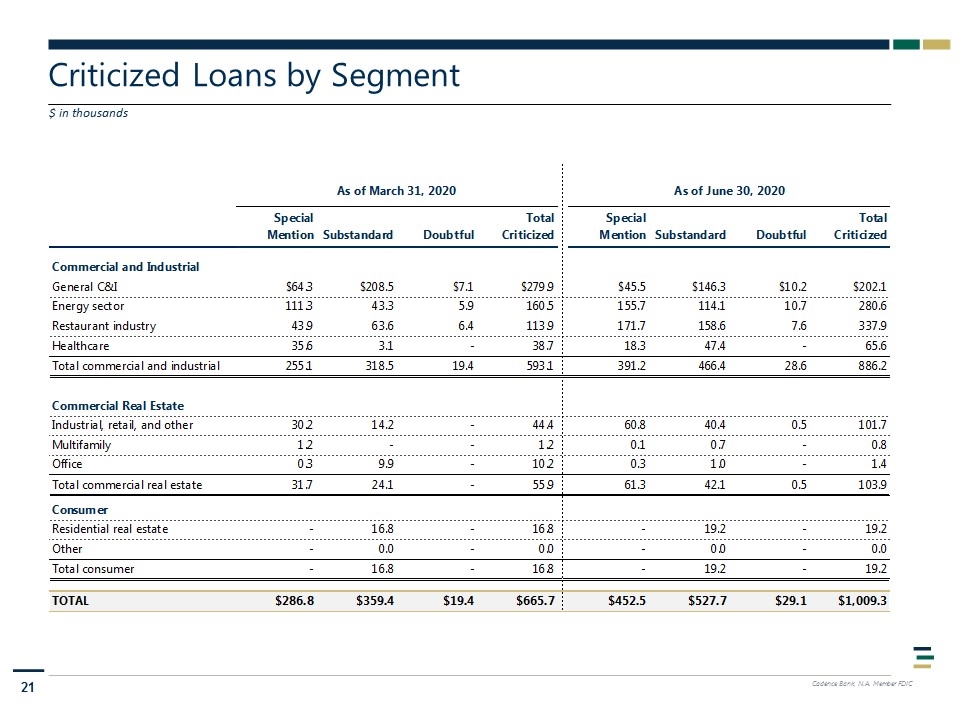
Criticized Loans by Segment $ in thousands
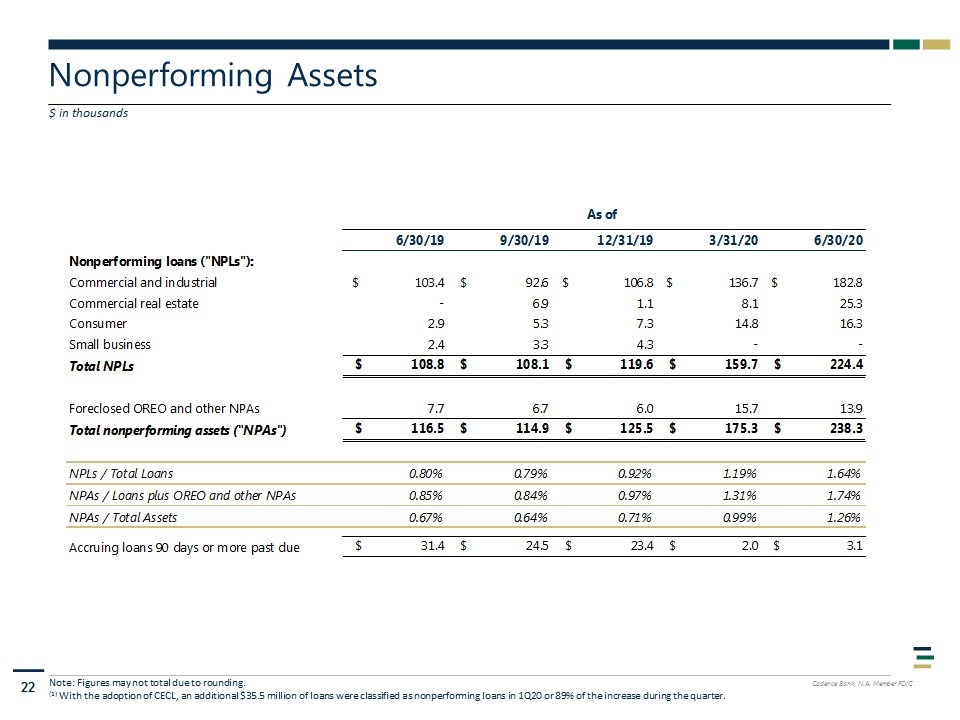
Nonperforming Assets $ in thousands Note: Figures may not total due to rounding. (1) With the adoption of CECL, an additional $35.5 million of loans were classified as nonperforming loans in 1Q20 or 89% of the increase during the quarter.
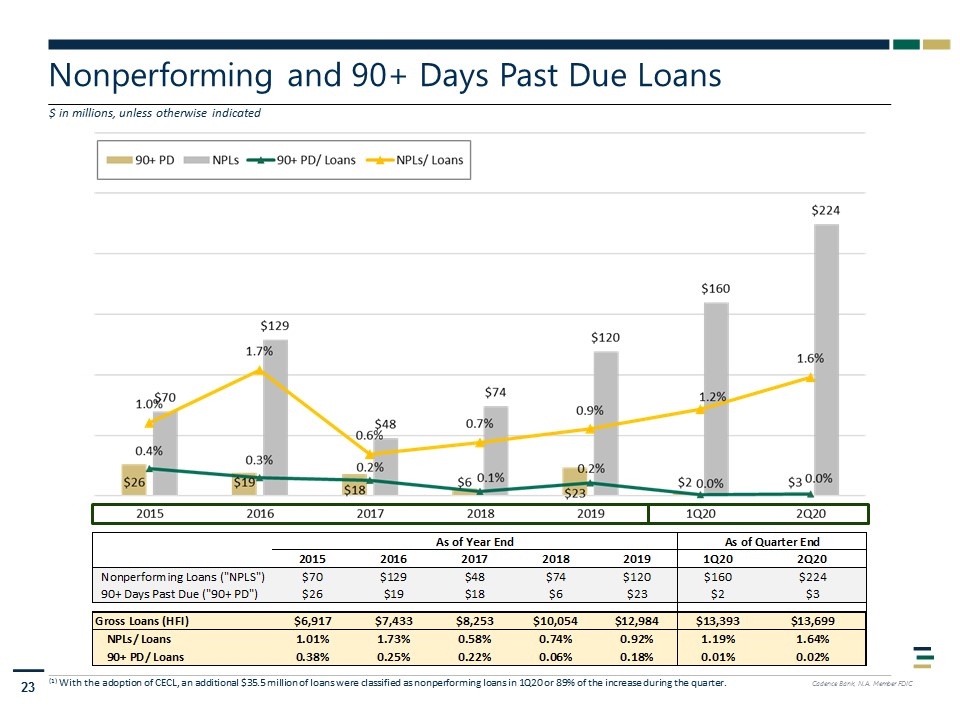
Nonperforming and 90+ Days Past Due Loans $ in millions, unless otherwise indicated (1) With the adoption of CECL, an additional $35.5 million of loans were classified as nonperforming loans in 1Q20 or 89% of the increase during the quarter. (1) (1)
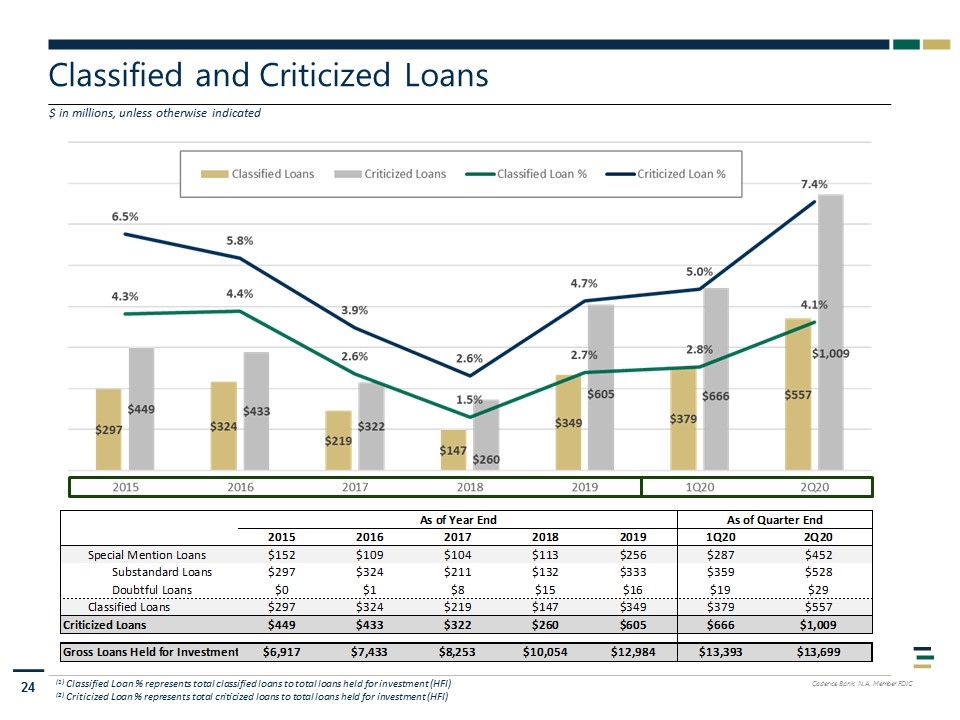
Classified and Criticized Loans $ in millions, unless otherwise indicated (1) Classified Loan % represents total classified loans to total loans held for investment (HFI) (2) Criticized Loan % represents total criticized loans to total loans held for investment (HFI)
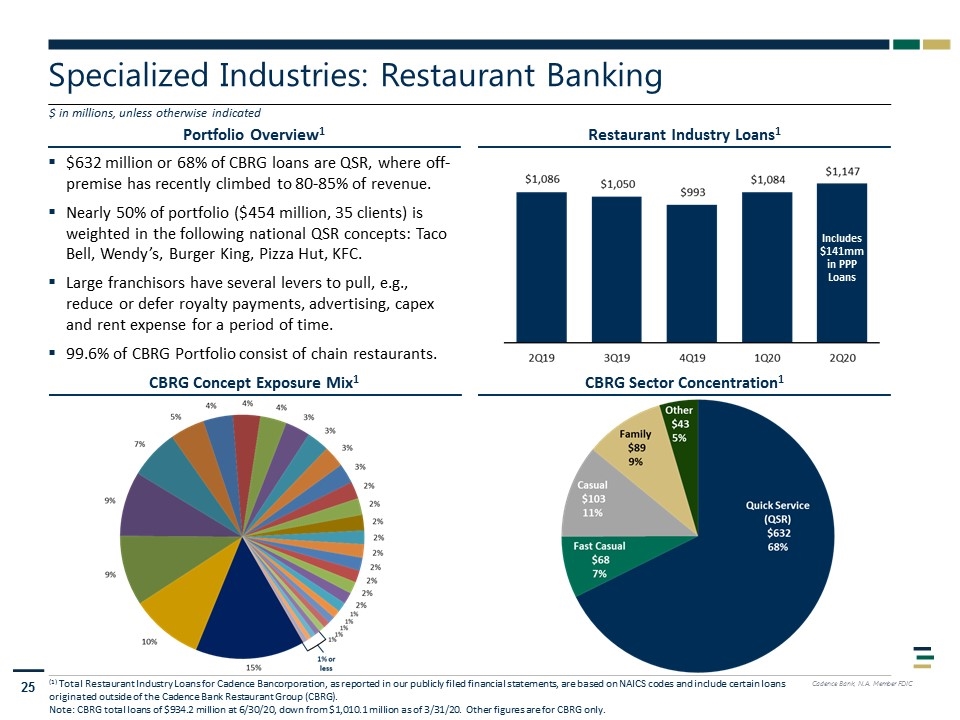
Portfolio Overview1 Specialized Industries: Restaurant Banking $ in millions, unless otherwise indicated Restaurant Industry Loans1 (1) Total Restaurant Industry Loans for Cadence Bancorporation, as reported in our publicly filed financial statements, are based on NAICS codes and include certain loans originated outside of the Cadence Bank Restaurant Group (CBRG). Note: CBRG total loans of $934.2 million at 6/30/20, down from $1,010.1 million as of 3/31/20. Other figures are for CBRG only. CBRG Sector Concentration1 CBRG Concept Exposure Mix1 $632 million or 68% of CBRG loans are QSR, where off-premise has recently climbed to 80-85% of revenue. Nearly 50% of portfolio ($454 million, 35 clients) is weighted in the following national QSR concepts: Taco Bell, Wendy’s, Burger King, Pizza Hut, KFC. Large franchisors have several levers to pull, e.g., reduce or defer royalty payments, advertising, capex and rent expense for a period of time. 99.6% of CBRG Portfolio consist of chain restaurants. Includes $141mm in PPP Loans
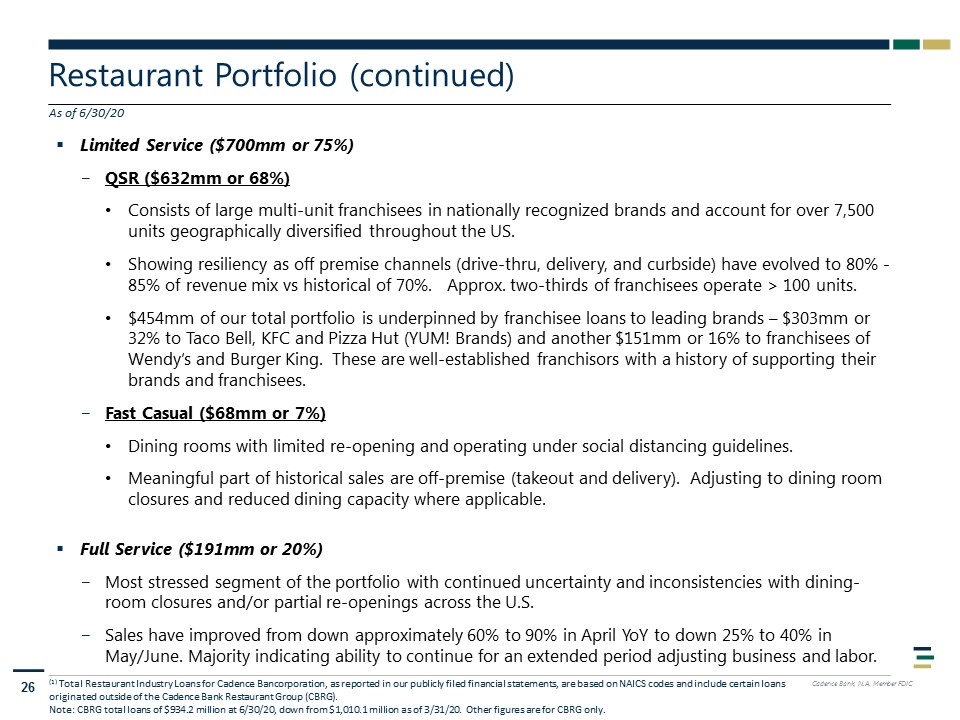
Restaurant Portfolio (continued) Limited Service ($700mm or 75%) QSR ($632mm or 68%) Consists of large multi-unit franchisees in nationally recognized brands and account for over 7,500 units geographically diversified throughout the US. Showing resiliency as off premise channels (drive-thru, delivery, and curbside) have evolved to 80% - 85% of revenue mix vs historical of 70%. Approx. two-thirds of franchisees operate > 100 units. $454mm of our total portfolio is underpinned by franchisee loans to leading brands – $303mm or 32% to Taco Bell, KFC and Pizza Hut (YUM! Brands) and another $151mm or 16% to franchisees of Wendy’s and Burger King. These are well-established franchisors with a history of supporting their brands and franchisees. Fast Casual ($68mm or 7%) Dining rooms with limited re-opening and operating under social distancing guidelines. Meaningful part of historical sales are off-premise (takeout and delivery). Adjusting to dining room closures and reduced dining capacity where applicable. Full Service ($191mm or 20%) Most stressed segment of the portfolio with continued uncertainty and inconsistencies with dining-room closures and/or partial re-openings across the U.S. Sales have improved from down approximately 60% to 90% in April YoY to down 25% to 40% in May/June. Majority indicating ability to continue for an extended period adjusting business and labor. As of 6/30/20 (1) Total Restaurant Industry Loans for Cadence Bancorporation, as reported in our publicly filed financial statements, are based on NAICS codes and include certain loans originated outside of the Cadence Bank Restaurant Group (CBRG). Note: CBRG total loans of $934.2 million at 6/30/20, down from $1,010.1 million as of 3/31/20. Other figures are for CBRG only.
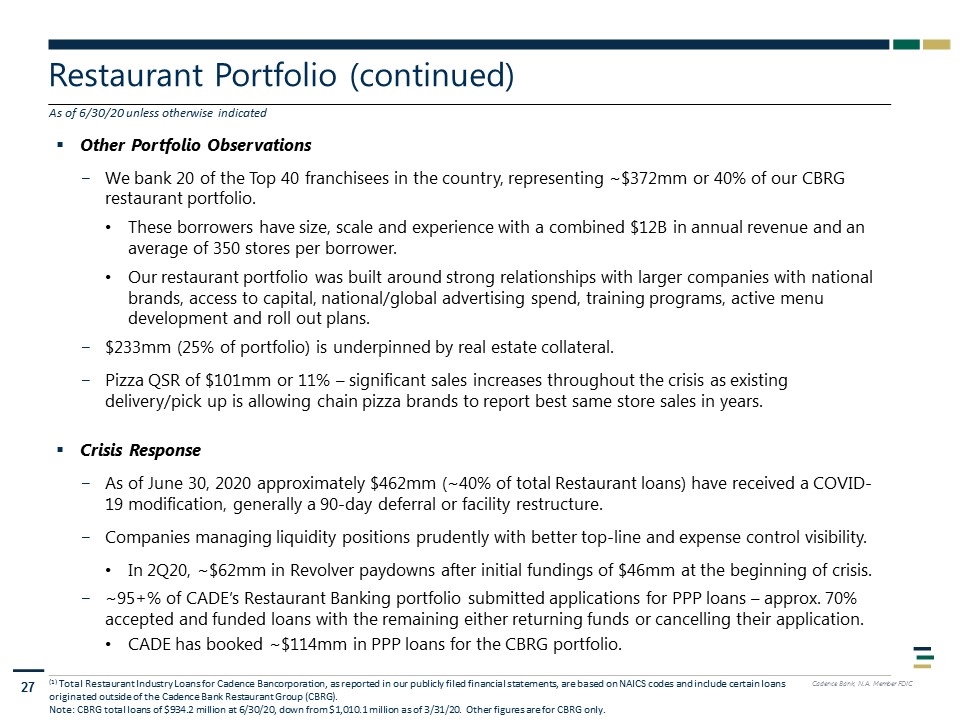
Restaurant Portfolio (continued) Other Portfolio Observations We bank 20 of the Top 40 franchisees in the country, representing ~$372mm or 40% of our CBRG restaurant portfolio. These borrowers have size, scale and experience with a combined $12B in annual revenue and an average of 350 stores per borrower. Our restaurant portfolio was built around strong relationships with larger companies with national brands, access to capital, national/global advertising spend, training programs, active menu development and roll out plans. $233mm (25% of portfolio) is underpinned by real estate collateral. Pizza QSR of $101mm or 11% – significant sales increases throughout the crisis as existing delivery/pick up is allowing chain pizza brands to report best same store sales in years. Crisis Response As of June 30, 2020 approximately $462mm (~40% of total Restaurant loans) have received a COVID-19 modification, generally a 90-day deferral or facility restructure. Companies managing liquidity positions prudently with better top-line and expense control visibility. In 2Q20, ~$62mm in Revolver paydowns after initial fundings of $46mm at the beginning of crisis. ~95+% of CADE’s Restaurant Banking portfolio submitted applications for PPP loans – approx. 70% accepted and funded loans with the remaining either returning funds or cancelling their application. CADE has booked ~$114mm in PPP loans for the CBRG portfolio. As of 6/30/20 unless otherwise indicated (1) Total Restaurant Industry Loans for Cadence Bancorporation, as reported in our publicly filed financial statements, are based on NAICS codes and include certain loans originated outside of the Cadence Bank Restaurant Group (CBRG). Note: CBRG total loans of $934.2 million at 6/30/20, down from $1,010.1 million as of 3/31/20. Other figures are for CBRG only.
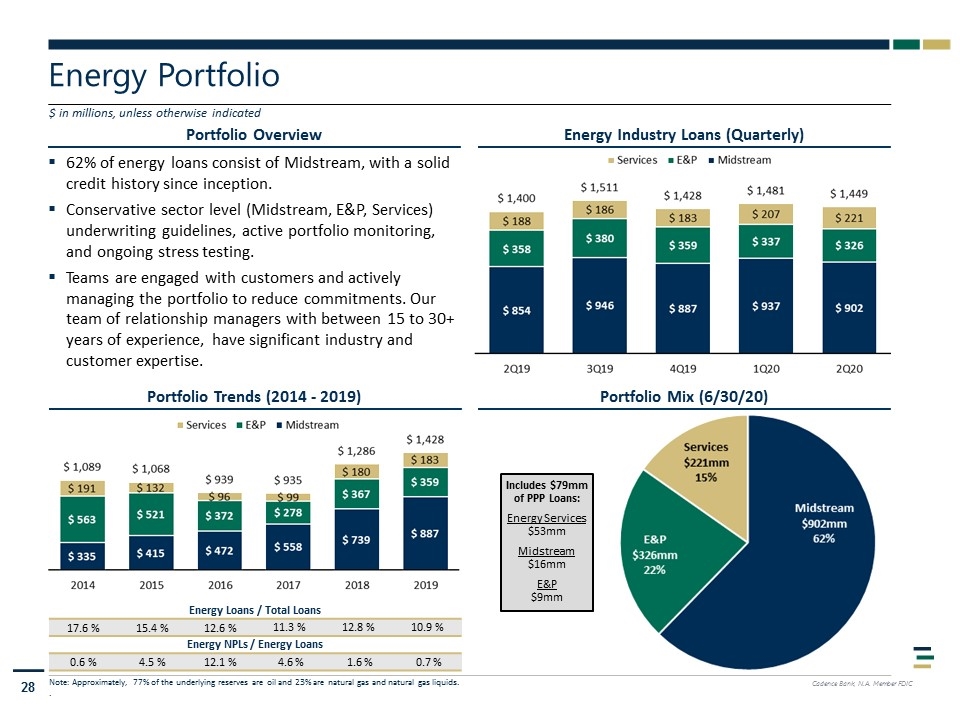
Portfolio Overview Energy Portfolio $ in millions, unless otherwise indicated Energy Industry Loans (Quarterly) Portfolio Mix (6/30/20) Portfolio Trends (2014 - 2019) Energy Loans / Total Loans 17.6 % 15.4 % 12.6 % 11.3 % 12.8 % 10.9 % Energy NPLs / Energy Loans 0.6 % 4.5 % 12.1 % 4.6 % 1.6 % 0.7 % Note: Approximately, 77% of the underlying reserves are oil and 23% are natural gas and natural gas liquids. . 62% of energy loans consist of Midstream, with a solid credit history since inception. Conservative sector level (Midstream, E&P, Services) underwriting guidelines, active portfolio monitoring, and ongoing stress testing. Teams are engaged with customers and actively managing the portfolio to reduce commitments. Our team of relationship managers with between 15 to 30+ years of experience, have significant industry and customer expertise. Includes $79mm of PPP Loans: Energy Services $53mm Midstream $16mm E&P $9mm
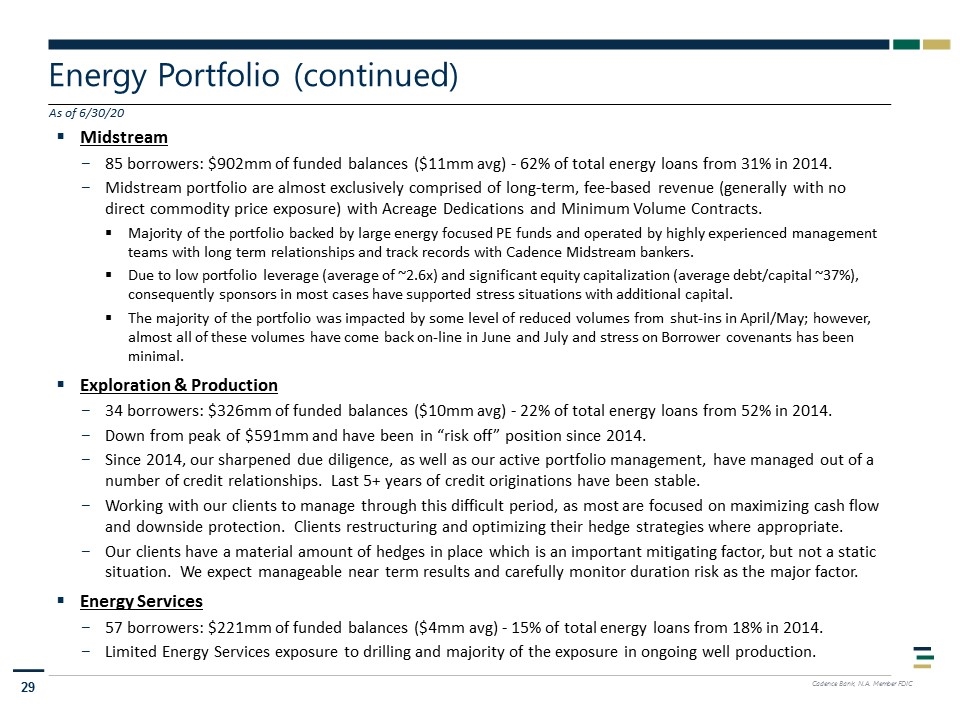
Energy Portfolio (continued) Midstream 85 borrowers: $902mm of funded balances ($11mm avg) - 62% of total energy loans from 31% in 2014. Midstream portfolio are almost exclusively comprised of long-term, fee-based revenue (generally with no direct commodity price exposure) with Acreage Dedications and Minimum Volume Contracts. Majority of the portfolio backed by large energy focused PE funds and operated by highly experienced management teams with long term relationships and track records with Cadence Midstream bankers. Due to low portfolio leverage (average of ~2.6x) and significant equity capitalization (average debt/capital ~37%), consequently sponsors in most cases have supported stress situations with additional capital. The majority of the portfolio was impacted by some level of reduced volumes from shut-ins in April/May; however, almost all of these volumes have come back on-line in June and July and stress on Borrower covenants has been minimal. Exploration & Production 34 borrowers: $326mm of funded balances ($10mm avg) - 22% of total energy loans from 52% in 2014. Down from peak of $591mm and have been in “risk off” position since 2014. Since 2014, our sharpened due diligence, as well as our active portfolio management, have managed out of a number of credit relationships. Last 5+ years of credit originations have been stable. Working with our clients to manage through this difficult period, as most are focused on maximizing cash flow and downside protection. Clients restructuring and optimizing their hedge strategies where appropriate. Our clients have a material amount of hedges in place which is an important mitigating factor, but not a static situation. We expect manageable near term results and carefully monitor duration risk as the major factor. Energy Services 57 borrowers: $221mm of funded balances ($4mm avg) - 15% of total energy loans from 18% in 2014. Limited Energy Services exposure to drilling and majority of the exposure in ongoing well production. As of 6/30/20
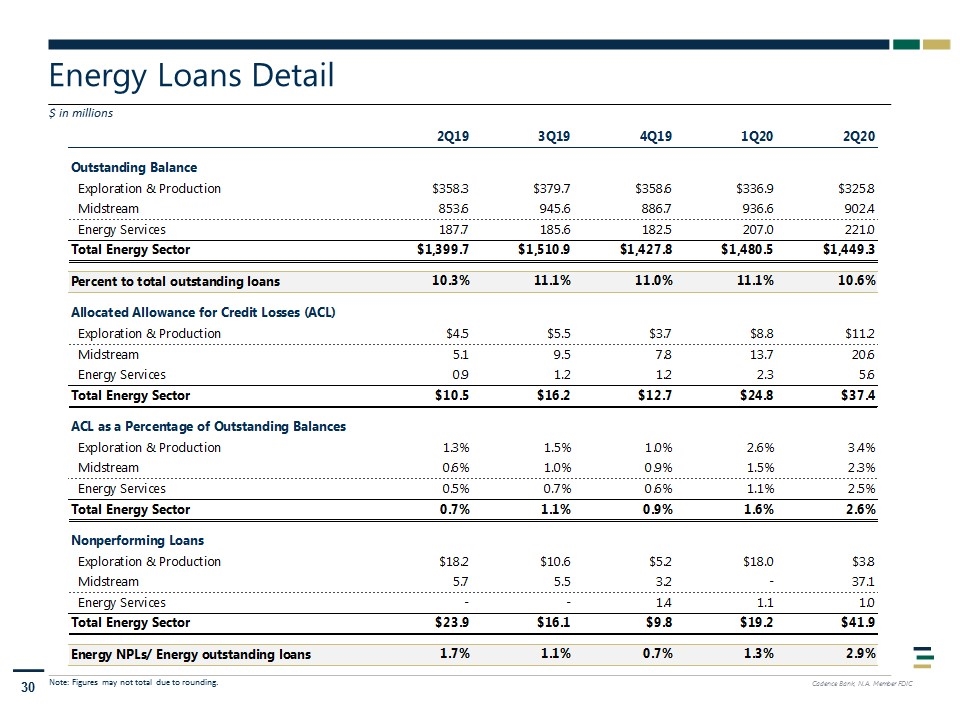
Energy Loans Detail $ in millions Note: Figures may not total due to rounding.
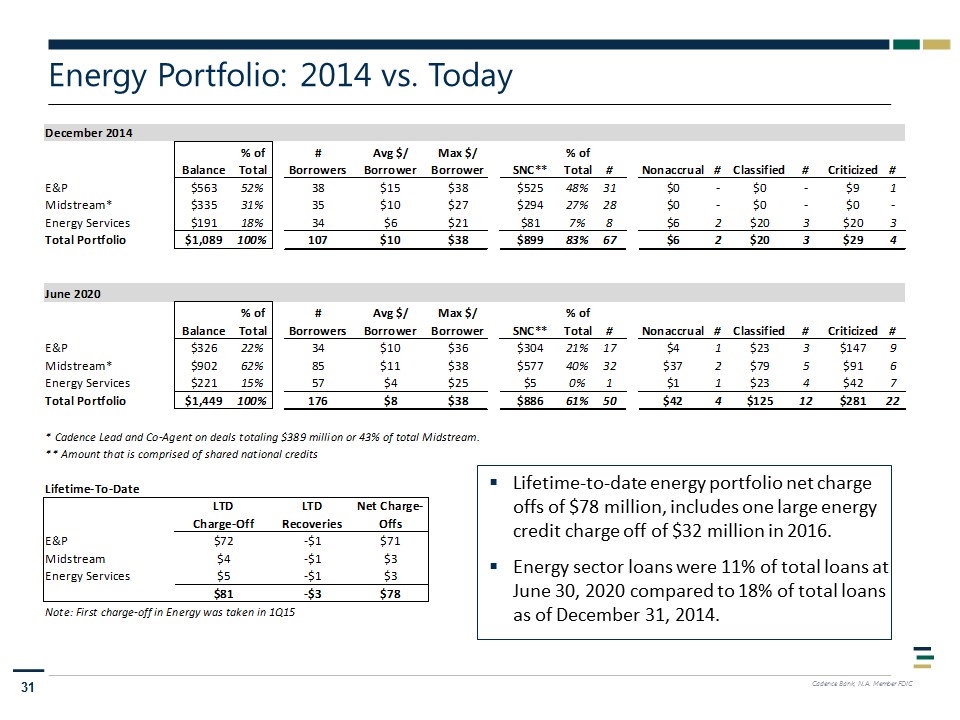
Energy Portfolio: 2014 vs. Today Lifetime-to-date energy portfolio net charge offs of $78 million, includes one large energy credit charge off of $32 million in 2016. Energy sector loans were 11% of total loans at June 30, 2020 compared to 18% of total loans as of December 31, 2014.
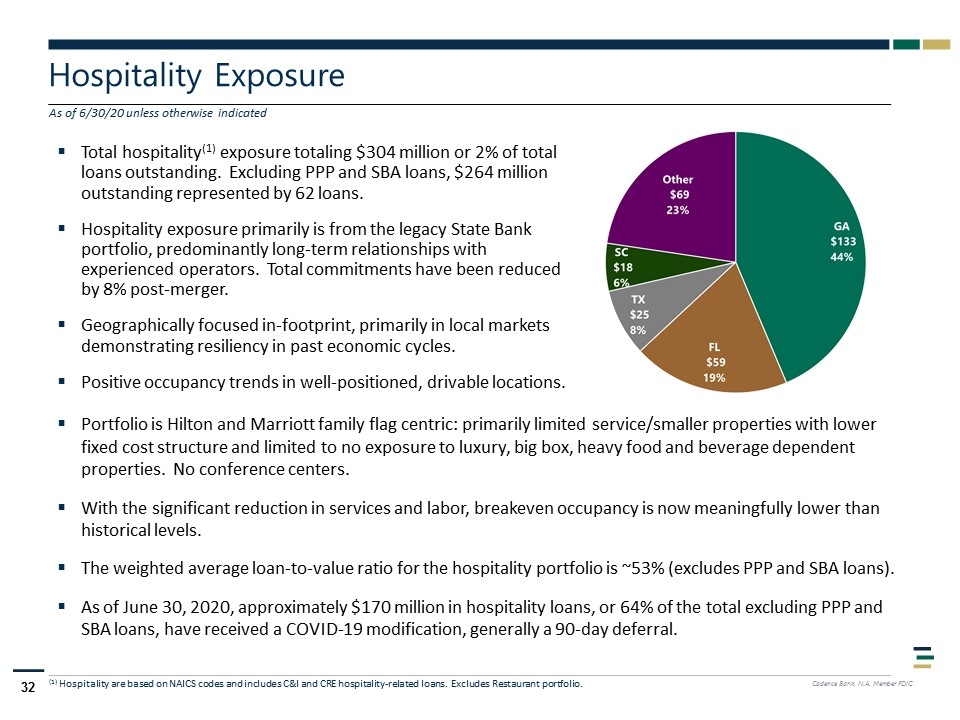
Hospitality Exposure Total hospitality(1) exposure totaling $304 million or 2% of total loans outstanding. Excluding PPP and SBA loans, $264 million outstanding represented by 62 loans. Hospitality exposure primarily is from the legacy State Bank portfolio, predominantly long-term relationships with experienced operators. Total commitments have been reduced by 8% post-merger. Geographically focused in-footprint, primarily in local markets demonstrating resiliency in past economic cycles. Positive occupancy trends in well-positioned, drivable locations. (1) Hospitality are based on NAICS codes and includes C&I and CRE hospitality-related loans. Excludes Restaurant portfolio. As of 6/30/20 unless otherwise indicated Portfolio is Hilton and Marriott family flag centric: primarily limited service/smaller properties with lower fixed cost structure and limited to no exposure to luxury, big box, heavy food and beverage dependent properties. No conference centers. With the significant reduction in services and labor, breakeven occupancy is now meaningfully lower than historical levels. The weighted average loan-to-value ratio for the hospitality portfolio is ~53% (excludes PPP and SBA loans). As of June 30, 2020, approximately $170 million in hospitality loans, or 64% of the total excluding PPP and SBA loans, have received a COVID-19 modification, generally a 90-day deferral.
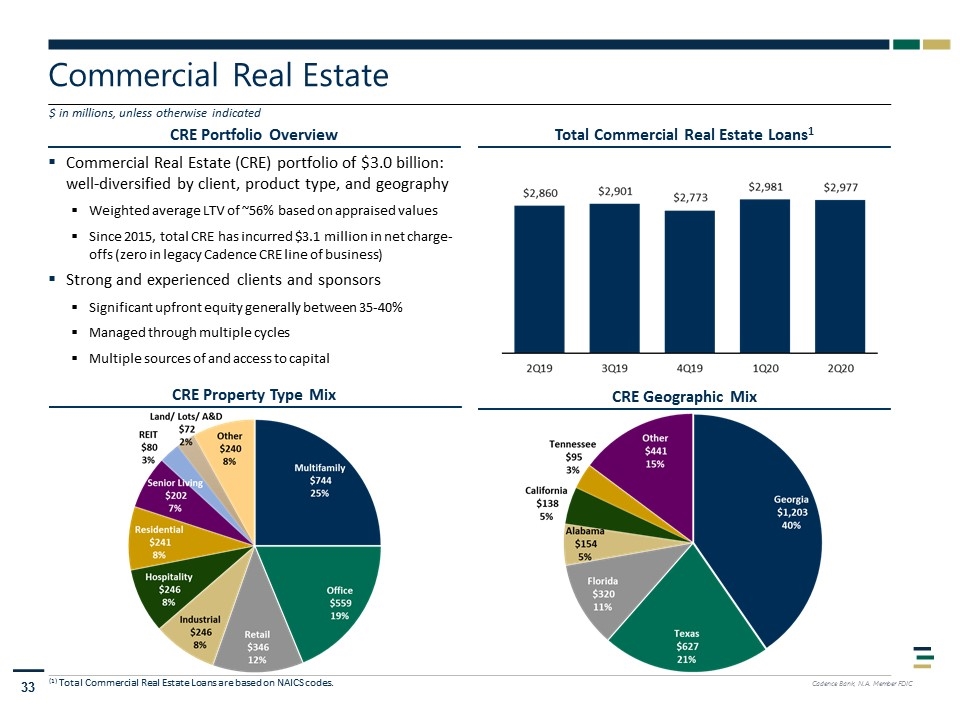
CRE Portfolio Overview Commercial Real Estate $ in millions, unless otherwise indicated Total Commercial Real Estate Loans1 Commercial Real Estate (CRE) portfolio of $3.0 billion: well-diversified by client, product type, and geography Weighted average LTV of ~56% based on appraised values Since 2015, total CRE has incurred $3.1 million in net charge-offs (zero in legacy Cadence CRE line of business) Strong and experienced clients and sponsors Significant upfront equity generally between 35-40% Managed through multiple cycles Multiple sources of and access to capital (1) Total Commercial Real Estate Loans are based on NAICS codes. CRE Geographic Mix CRE Property Type Mix
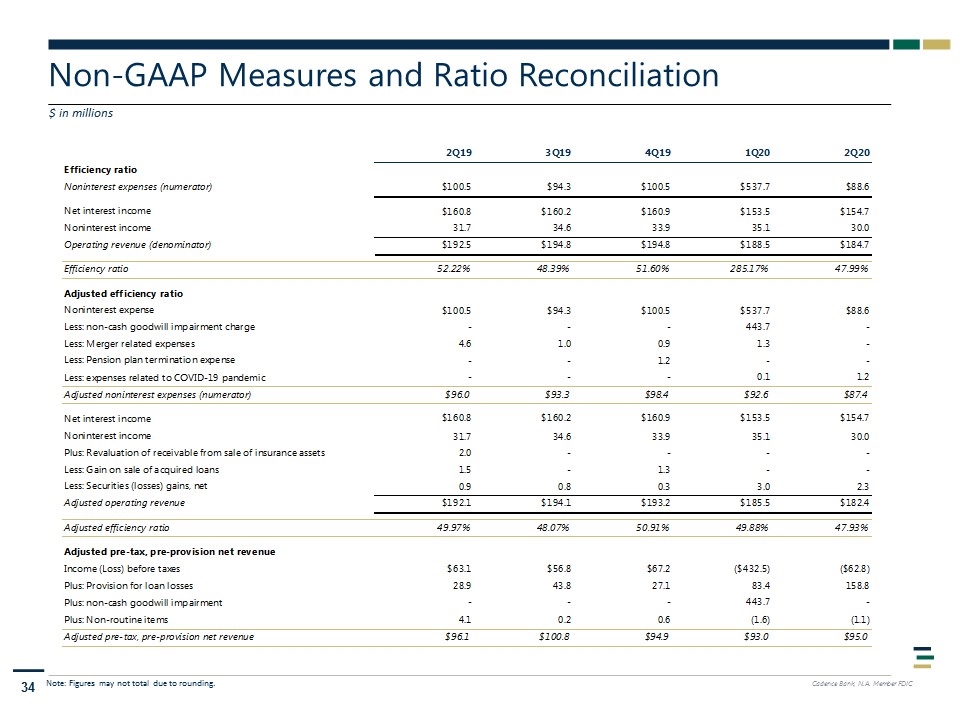
Non-GAAP Measures and Ratio Reconciliation $ in millions Note: Figures may not total due to rounding.
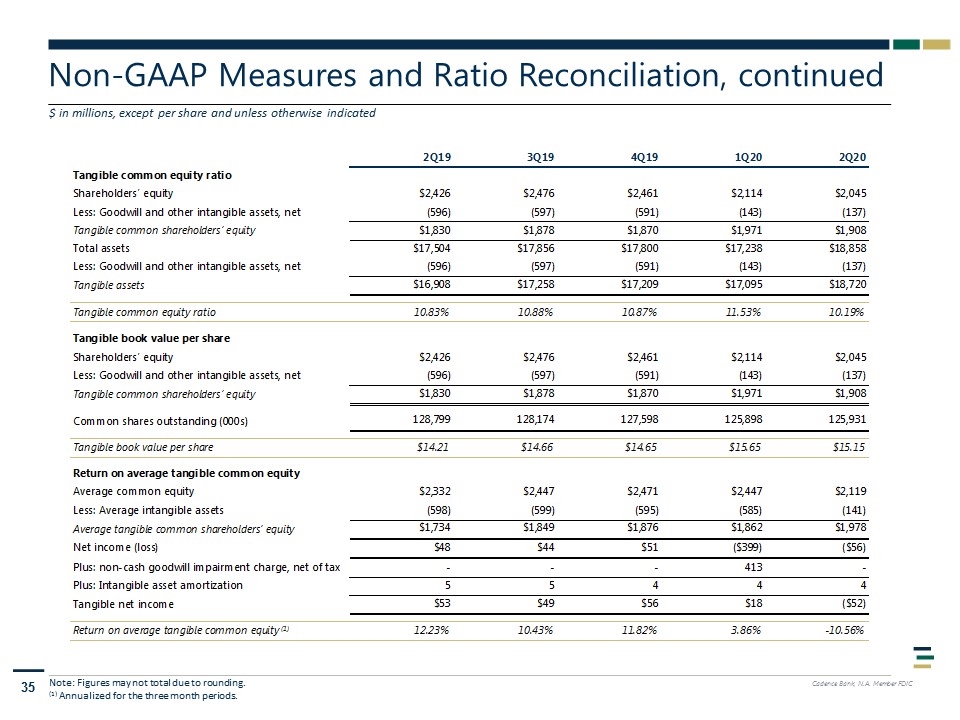
Non-GAAP Measures and Ratio Reconciliation, continued Note: Figures may not total due to rounding. (1) Annualized for the three month periods. $ in millions, except per share and unless otherwise indicated
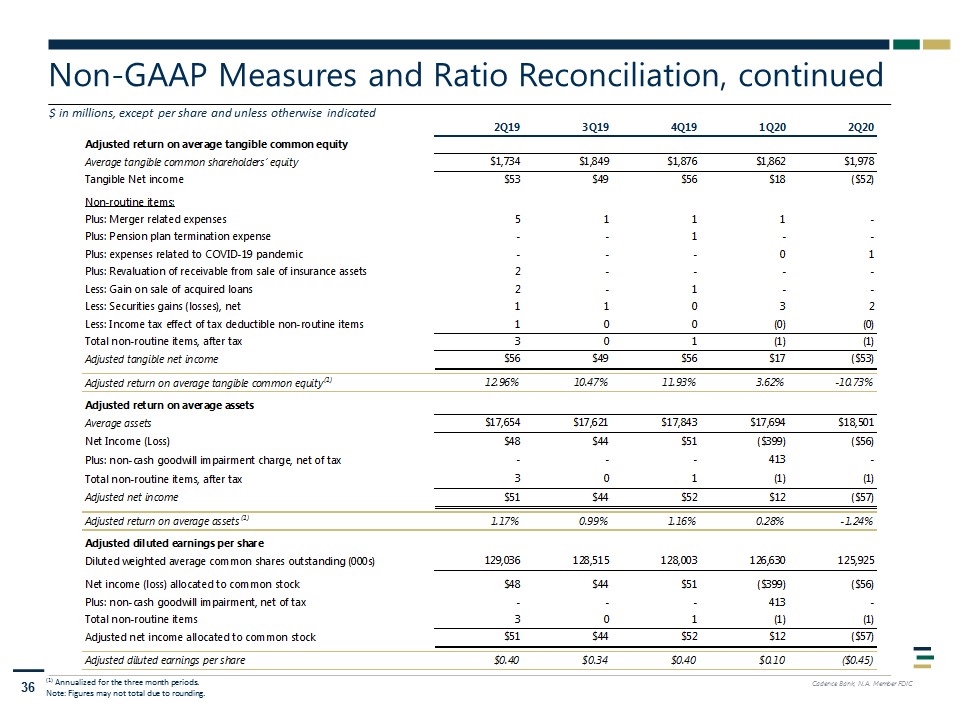
Non-GAAP Measures and Ratio Reconciliation, continued $ in millions, except per share and unless otherwise indicated (1) Annualized for the three month periods. Note: Figures may not total due to rounding.


