Table of Contents
UNITED STATES
SECURITIES AND EXCHANGE COMMISSION
Washington, D.C. 20549
FORM N-CSR
CERTIFIED SHAREHOLDER REPORT OF
REGISTERED MANAGEMENT INVESTMENT COMPANIES
Investment Company Act file number: 811-22985
SMEAD FUNDS TRUST
(Exact name of registrant as specified in charter)
2777 East Camelback Road, Suite 375
Phoenix, AZ 85016
(Address of principal executive offices) (Zip code)
Cole W. Smead
Smead Capital Management, Inc.
2777 East Camelback Road, Suite 375
Phoenix, AZ 85016
Copy to:
Pamela M. Krill, Esq
Godfrey & Kahn, S.C.
833 East Michigan Street, Suite 1800
Milwaukee, WI 53202
(Name and address of agent for service)
Registrant’s telephone number, including area code: (877) 701-2883
Date of fiscal year end: November 30
Date of reporting period: November 30, 2023
Table of Contents
Item 1. Report to Shareholders.
(a) The following is a copy of the report transmitted to shareholders pursuant to Rule 30e-1 under the Investment Company Act of 1940 (17 CFR 270.30e-1)
2
Table of Contents
Annual Report
November 30, 2023
Investment Adviser
Smead Capital Management, Inc.
2777 East Camelback Road
Suite 375
Phoenix, AZ 85016
Phone: 877-807-4122
www.smeadfunds.com
Table of Contents
| 1 | ||||
| 7 | ||||
| 9 | ||||
| 14 | ||||
| 19 | ||||
| 23 | ||||
| 25 | ||||
| 28 | ||||
| 34 | ||||
| 48 | ||||
BASIS FOR TRUSTEES’ APPROVAL OF INVESTMENT ADVISORY AGREEMENT – SMEAD INTERNATIONAL VALUE FUND | 50 | |||
| 54 | ||||
| 55 | ||||
Table of Contents
November 2023 Annual Letter: Smead Value Fund
In the fiscal year 2023, the Smead Value Fund – Investor Share Class (SMVLX; the “Fund”) showed what it could do when almost everything was going against it. The Fund had a small gain of 0.77% versus a gain in the S&P 500 Index of 13.84% and a gain in the Russell 1000 Value Index of 1.35%.
Our biggest gainers in the fiscal year were our home builders, D.R. Horton (DHI), Lennar (LEN) and NVR (NVR). The detractors were Occidental Petroleum (OXY), Target (TGT) and Ovintiv (OVV). Two were affected by the correction in oil prices, and Target shot itself in the foot by catering to a minority of customers and offending some of its best customers in the process.
Why do we say that almost everything went against us? First, the Federal Reserve Board raised interest rates from 0.25% to 5.25%. This aggressive tightening should have been a nightmare for home builders and a headwind for folks like us who are optimistic about economic growth in the next ten years in the US.
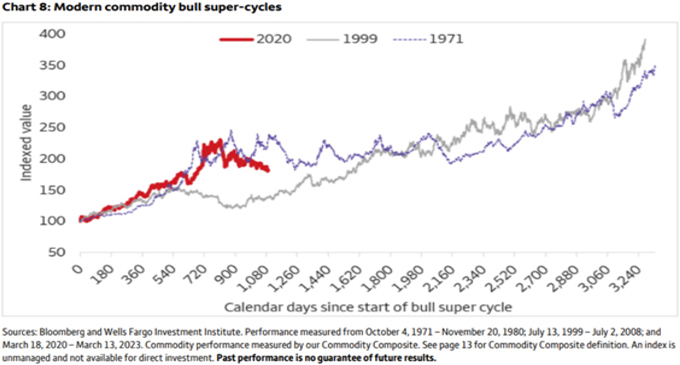
Second, oil prices corrected markedly and negatively impacted our oil and gas stocks. The chart below shows that the last two commodity super cycles were led by oil and gas and there were numerous corrections along the way.
1
Table of Contents
Third, the S&P 500 Index came off its bear market in 2022 with a strong rebound that we categorize as a bear market rally. The S&P 500 Index gain came almost exclusively from the ten largest cap stocks in the index.
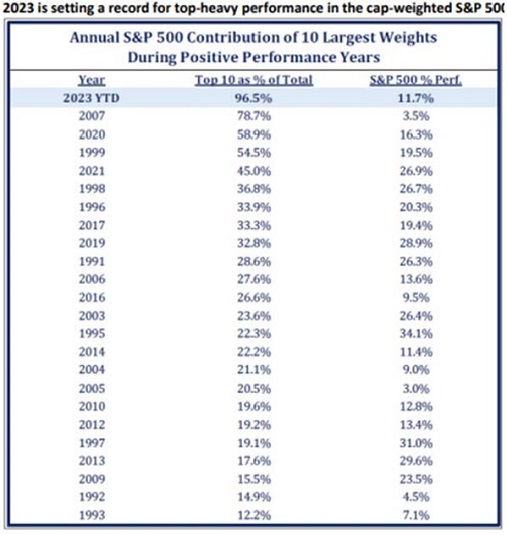
2023 is setting a record for top-heavy performance in the cap-weighted S&P 500 Annual S&P 500 Contribution of 10 Largest Weights During Positive Performance Years Year Top 10 as % of Total S&P 500 % Perf. 2023 YTD 96.5% 11.7% 2007 78.7% 3.5% 2020 58.9% 16.3% 1999 54.5% 19.5% 2021 45.0% 26.9% 1998 36.8% 26.7% 1996 33.9% 20.3% 2017 33.3% 19.4% 2019 32.8% 28.9% 1991 28.6% 26.3% 2006 27.6% 13.6% 2016 26.6% 9.5% 2003 23.6% 26.4% 1995 22.3% 34.1% 2014 22.2% 11.4% 2004 21.1% 9.0% 2005 20.5% 3.0% 2010 19.6% 12.8% 2012 19.2% 13.4% 1997 19.1% 31.0% 2013 17.6% 29.6% 2009 15.5% 23.5% 1992 14.9% 4.5% 1993 12.2% 7.1%
Source: @jessefelder, @nateGeraci, @Todd_Sahn, Strategas ETF Research
2
Table of Contents
Lastly, we had clobbered the S&P 500 Index in fiscal 2021 and 2022 and since we hold our winners to a fault, we put up with a certain amount of corrective process. As the Fund turns 16 years old on January 3, 2024, we are proud of the consistency of our returns in an era of historically high returns from owning growth stocks regardless of price.
In conclusion, we like our portfolio very much and think our portfolio of fine companies is trading at a huge discount to the S&P 500 Index and at a discount to the Russell 1000 Value Index. As always, thank you for your investment, patience and faith in what we do.
Fear stock market failure,
|
| |
William Smead | Cole Smead, CFA | |
Lead Portfolio Manager | Co-Portfolio Manager |


3
Table of Contents
November 2023 Annual Letter: Smead International Value Fund
Fiscal 2023 in the Smead International Value Fund (the “Fund”; SVXLX) showed the nonlinearity that is inherent in commodity investments but also the overall resilience of the portfolio. The Smead International Value Fund gained 6.16% versus a gain of 12.36% in the MSCI EAFE Index and a gain of 9.26% in the MSCI ACWI ex-USA NR Index. We continue to view the opportunities present in the portfolio as very favorable and laden with optionality that is underappreciated by the market.
Our best-performing stocks were Unicredit SPA (UCG IM), MEG Energy (MEG CN), and Pandora Inc (PANDORA DC). Both MEG and Unicredit consistently demonstrated strong execution across various fronts. As the market gained a clearer understanding of Unicredit’s robust balance sheet and customer base, we observed the initial stages of our investment thesis unfolding.
The three poorest-performing stocks were Occidental Petroleum (OXY US), Canada Goose Holdings (GOOS CN), and Interfor Corp (IFP CN). We are closely monitoring Canada Goose as the company navigates the optimization of its direct-to-customer strategy and expands its overall product offerings. As is typical with new strategies, there is a learning curve, and we believe that management’s incentives remain well-aligned with our own as we navigate these developments.
Non-Linear Returns
As we finish the 2023 fiscal year of the Smead International Value Fund, the last couple of years look like a fairly smooth experience for the shareholders while there has been volatility all around. In reality, there has been large volatility in the underlying portfolio. Unlike in 2022, we had numerous energy stocks that lost money this year as investors decided whether they wanted to be owners in the future. These investments in the portfolio went up in the prior year, overcoming those that struggled from the economic shocks of the Russian wars and other exogenous forces. While many investors are interested in volatility, we have no way of evaluating it. We invest despite it. We would like to discuss this with shareholders more.
“We prefer a lumpy 15% return to a smooth 12% return.” – Warren Buffett
Many investors say this in a cliché fashion, but few are willing to invest based on it. The Smead International Value Fund currently holds businesses that tend to produce lumpy returns. We’ve already talked about the lumpiness of energy stock returns in 2022-2023. The lumber companies we own in West Fraser Group (WFG CN) and Interfor (IFP CN) are further examples. Coming out of the pandemic as housing boomed tied to people wanting to have more space in the suburbs, these companies had great demand for their products in new build and remodels with interest rates that were too low. Fast forward to 2023, when everyone became familiar with the idea of higher mortgage rates. Building activity slowed markedly. The underlying questions remain: is there a demand for wood products, and who will supply that demand?
The wood products industry is the most consolidated it has ever been. That doesn’t remove the cyclicality of the industry, but a more concentrated industry causes more rational business decisions and better pricing over time. The person wanting smooth returns would have tried to sell those assets in 2022, trying to time the peak pricing of the stocks then.
4
Table of Contents
This timing doesn’t address the underlying economic problem. This is the lack of available homes for sale in the USA. There is only one way to solve this, build homes and remodel old homes. This is what these companies fill in their role as businesses. They just produced the highest return on equity in the history of their industry in 2021. Most people think they will never get back to that and have left the stocks. We believe the long-term dynamics are the same as they were. Do higher interest rates fix the supply problem in the USA? No. Therefore, it’s a question of when activity picks up to meet demand. The future is unknown, but with the industry consolidated more than ever, and keeping a lid on supply better than in the past, we believe these are one of those “lumpy” return opportunities that the Fund provides.
Most investors today want nothing to do with making money with larger volatility. They’d love a linear relationship between risk and return. In the real world, it doesn’t happen like that. In a world where we believe easily accessible equity investments like the S&P 500 may produce historically high volatility and plausibly zero for returns in the next decade, we think investors will shift their views on this and dream more about stocks that historically produced non-linear returns.
Fear stock market failure,
|
| |
Cole Smead, CFA | William Smead | |
Lead Portfolio Manager | Co-Portfolio Manager |


The information contained herein represents the opinion of Smead Capital Management, Inc. and is not intended to be a forecast of future events, a guarantee of future results, nor investment advice.
Consider the investment objectives, risks, charges and expenses of the Funds carefully before investing. The statutory and summary prospectuses contain this and other information about the Funds and are available at www.smeadcap.com or by calling 877-807-4122. Read carefully before investing.
Performance data quoted represents past performance; past performance does not guarantee future results. The investment return and principal value of an investment will fluctuate so that an investor’s shares, when redeemed, may be worth more or less than their original cost. Current performance of the Funds may be lower or higher than the performance quoted. Performance data current to the most recent month end may be obtained by calling 877-807-4122.
Mutual fund investing involves risk. Principal loss is possible.
Foreign Securities Risk. Investments in securities of foreign companies involve additional risks, including less liquidity, currency rate fluctuations, political and economic instability, differences in financial reporting standards and securities market regulation, and the imposition of foreign withholding taxes.
MSCI EAFE NR Index is a broad-based, unmanaged equity market index designed to measure the equity market performance of 21 developed markets, excluding the US and
5
Table of Contents
Canada. This benchmark calculates reinvested dividends net of withholding taxes using Luxembourg tax rates. MSCI ACWI ex-U.S. Index (Net) is a free float-adjusted market capitalization index that is designed to large and mid-cap representation across 22 of 23 Developed Markets (DM) countries (excluding the US) and 24 Emerging Markets (EM) countries. This benchmark calculates reinvested dividends net of withholding taxes using Luxembourg tax rates.
The S&P 500 Index is a broad-based unmanaged index of 500 stocks, which is widely recognized as representative of the equity market in general. The Russell 1000® Value Index measures the performance of those Russell 1000® Index companies with lower price-to-book ratios and lower forecasted growth values. Frank Russell Company is the source and owner of the trademarks, service marks and copyrights related to the Russell Indexes. Russell ® is a trademark of Russell Investment Group.
One cannot invest directly in an index.
The Smead Funds are distributed by UMB Distribution Services, LLC. UMB Distribution Services, and Smead Capital Management, Inc. are not affiliated.
6
Table of Contents
Expense Examples
(Unaudited)
As a shareholder of the Funds, you incur two types of costs: (1) transaction costs, including sales charges (loads) on purchase payments and (2) ongoing costs, including management fees, distribution (12b-1) fees, shareholder servicing fees and other Fund expenses. These Examples are intended to help you understand your ongoing costs (in dollars) of investing in the Funds, and to compare these costs with the ongoing costs of investing in other mutual funds. The Examples are based on an investment of $1,000 invested at the beginning of the period and held for the entire period as indicated below.
Actual Expenses
The second and fourth columns of the following tables provide information about actual account values and actual expenses of each Class of the Funds. If you purchase Class A shares of the Funds you will pay a maximum initial sales charge of 5.75% when you invest. Class A shares and Class C shares of Smead Value Fund and the Smead International Value Fund are subject to a contingent deferred sales charge of 1.00% for purchases of $1,000,000 or more that are redeemed within eighteen months of purchase for Class A shares and redeemed within twelve months of purchase for Class C shares. In addition, you will be assessed fees for outgoing wire transfers, returned checks and stop payment orders at prevailing rates charged by UMB Fund Services, Inc., the Funds’ transfer agent. To the extent the Funds invest in shares of exchange-traded funds (“ETFs”) or other investment companies as part of their investment strategies, you will indirectly bear your proportionate share of any fees and expenses charged by the underlying funds in which the Funds invest in addition to the expenses of the Funds. Actual expenses of the underlying funds are expected to vary among the various underlying funds. These expenses are not included in the Examples. The Examples include, but are not limited to, advisory fees, fund administration and accounting, custody and transfer agent fees. You may use the information in the second and fourth columns, together with the amount you invested, to estimate the expenses that you paid over the period. Simply divide your account value by $1,000 (for example, an $8,600 account value divided by $1,000 = 8.6), then multiply the result by the applicable number under the column entitled “Actual Expenses Paid During Period” to estimate the expenses you paid on your account during this period.
Hypothetical Example for Comparison Purposes
The third and fifth columns of the following tables provide information about hypothetical account values and hypothetical expenses based on the Funds’ actual expense ratios and an assumed rate of return of 5% per year before expenses, which are not the Funds’ actual returns. The hypothetical account values and expenses may not be used to estimate the actual ending account balance or expenses you paid for the period. You may use this information to compare the ongoing costs of investing in the Funds and other funds. To do so, compare this 5% hypothetical example with the 5% hypothetical examples that appear in the shareholder reports of other funds. Please note that the expenses shown in the table are meant to highlight your ongoing costs only and do not reflect any transactional costs, such as sales charges (loads), redemption fees or exchange fees. Therefore, the third and fifth columns of the table are useful in comparing ongoing costs only, and will not help you determine the relative total costs of owning different funds. In addition, if these transactional costs were included, your costs would have been higher.
7
Table of Contents
SMEAD FUNDS
Expense Examples (Continued)
(Unaudited)
Smead Value Fund
Class | Beginning Account Value 6/1/23 | Actual Ending Account Value 11/30/23 | Hypothetical Ending Account Value | Actual Expenses Paid During Period(1) | Hypothetical Expenses Paid During Period(1) | Net Expense Ratio During Period(2) | ||||||||||||||||||||||||
Investor Class | $ | 1,000.00 | $ | 1,108.50 | $ | 1,019.30 | $ | 6.08 | $ | 5.82 | 1.15 | % | ||||||||||||||||||
Class A | 1,000.00 | 1,108.90 | 1,019.65 | 5.71 | 5.47 | 1.08 | ||||||||||||||||||||||||
Class C | 1,000.00 | 1,104.70 | 1,015.94 | 9.60 | 9.20 | 1.82 | ||||||||||||||||||||||||
Class I1 | 1,000.00 | 1,110.30 | 1,020.86 | 4.44 | 4.26 | 0.84 | ||||||||||||||||||||||||
Class R1 | 1,000.00 | 1,109.00 | 1,019.60 | 5.76 | 5.52 | 1.09 | ||||||||||||||||||||||||
Class R2 | 1,000.00 | 1,107.00 | 1,017.90 | 7.55 | 7.23 | 1.43 | ||||||||||||||||||||||||
Class Y | 1,000.00 | 1,110.30 | 1,020.96 | 4.34 | 4.15 | 0.82 | ||||||||||||||||||||||||
| (1) | Investor Class, Class A, Class C, Class I1, Class R1, Class R2 and Class Y expenses are calculated using each Class’ annualized net expense ratio (as disclosed), multiplied by the average account value over the period, and multiplied by 183/365 (to reflect the most recent one-half year period). |
| (2) | Annualized. |
Smead International Value Fund
Class | Beginning Account Value 6/1/23 | Actual Ending Account Value 11/30/23 | Hypothetical Ending Account Value | Actual Expenses Paid During Period(1) | Hypothetical Expenses Paid During Period(1) | Net Expense Ratio During Period(2) | ||||||||||||||||||||||||
Investor Class | $ | 1,000.00 | $ | 1,116.30 | $ | 1,018.80 | $ | 6.63 | $ | 6.33 | 1.25 | % | ||||||||||||||||||
Class A | 1,000.00 | 1,115.40 | 1,017.95 | 7.53 | 7.18 | 1.42 | ||||||||||||||||||||||||
Class C | 1,000.00 | 1,112.20 | 1,015.04 | 10.59 | 10.10 | 2.00 | ||||||||||||||||||||||||
Class I1 | 1,000.00 | 1,116.80 | 1,019.30 | 6.10 | 5.82 | 1.15 | ||||||||||||||||||||||||
Class Y | 1,000.00 | 1,117.70 | 1,020.05 | 5.31 | 5.06 | 1.00 | ||||||||||||||||||||||||
| (1) | Investor Class, Class A, Class C, Class I1, and Class Y expenses are calculated using each Class’ annualized net expense ratio (as disclosed), multiplied by the average account value over the period, and multiplied by 183/365 (to reflect the most recent one-half year period). |
| (2) | Annualized. |
8
Table of Contents
Investment Highlights
(Unaudited)
The Smead Value Fund seeks long-term capital appreciation. To achieve its investment objective, the Fund maintains approximately 25-30 companies in its portfolio and will invest in the common stocks of large capitalization U.S. companies.
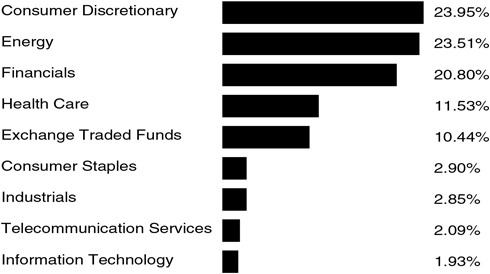
Sector Breakdown
(% of equity Investments as of November 30, 2023)
Top Ten Holdings (% of Net Assets as of November 30, 2023)*
Occidental Petroleum Corp. | 6.72 | % | ||
Lennar Corp. – Class A | 6.70 | % | ||
DR Horton, Inc. | 6.42 | % | ||
Merck & Co., Inc. | 5.78 | % | ||
American Express Co. | 5.57 | % | ||
Simon Property Group, Inc. – REIT | 5.55 | % | ||
Amgen, Inc. | 5.37 | % | ||
Ovintiv, Inc. | 4.74 | % | ||
NVR, Inc. | 4.70 | % | ||
Macerich Co. (The) – REIT | 4.54 | % |
| * | Does not Include Short-Term Investments |
Fund holdings are subject to change at any time and should not be considered recommendations to buy or sell any security. Current and future portfolio holdings are subject to risk.
Continued
9
Table of Contents
SMEAD FUNDS
Investment Highlights (Continued)
(Unaudited)
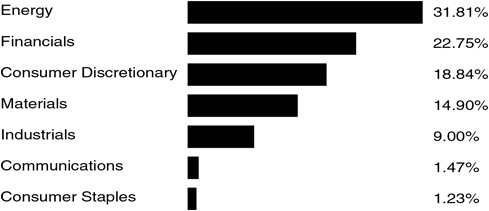
The Smead International Value Fund seeks long-term capital appreciation. To achieve its investment objective, the Fund maintains approximately 25-30 companies in its portfolio and will invest in the common stocks of large capitalization non-U.S. companies.
Sector Breakdown
(% of equity Investments as of November 30, 2023)
Top Ten Holdings (% of Net Assets as of November 30, 2023)*
MEG Energy Corp. | 9.83 | % | ||
UniCredit SpA | 8.54 | % | ||
Occidental Petroleum Corp. - Warrants | 6.97 | % | ||
Cenovus Energy, Inc. | 6.48 | % | ||
Frontline PLC | 5.96 | % | ||
BAWAG Group AG | 5.47 | % | ||
Occidental Petroleum Corp. | 4.58 | % | ||
West Fraser Timber Co. Ltd. | 4.43 | % | ||
Interfor Corp. | 4.17 | % | ||
Pandora AS | 3.98 | % |
| * | Does not Include Short-Term Investments |
Fund holdings are subject to change at any time and should not be considered recommendations to buy or sell any security. Current and future portfolio holdings are subject to risk.
Continued
10
Table of Contents
SMEAD FUNDS
Investment Highlights (Continued)
(Unaudited)
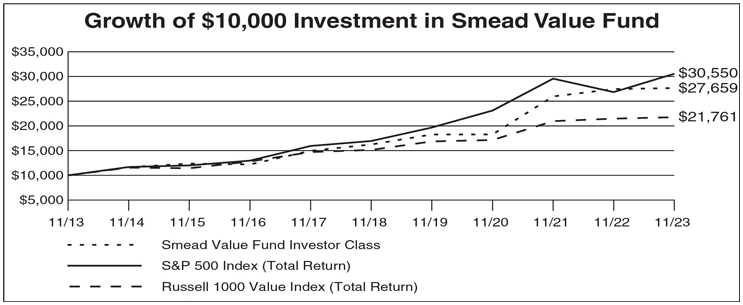
Average Annual Total Returns for the period ended November 30, 2023
| Inception Date | 1 Year | 5 Years | 10 Years | Since Inception | ||||||||||||
Smead Value Fund - Investor Class | 1/2/2008 | 0.77% | 11.23% | 10.71% | 9.42% | |||||||||||
Smead Value Fund - Class A | 1/27/2014 | 0.81% | 11.23% | N/A | 10.82% | |||||||||||
Smead Value Fund - Class C | 4/16/2020 | 0.14% | N/A | N/A | 21.05% | |||||||||||
Smead Value Fund - Class I1 | 12/18/2009 | 1.05% | 11.52% | 11.00% | 13.45% | |||||||||||
Smead Value Fund - Class R1 | 11/25/2014 | 0.65% | 10.96% | N/A | 9.89% | |||||||||||
Smead Value Fund - Class R2 | 11/25/2014 | 0.55% | 11.01% | N/A | 10.34% | |||||||||||
Smead Value Fund - Class Y | 11/25/2014 | 1.16% | 11.64% | N/A | 10.60% | |||||||||||
S&P 500® Index (Total Return) | 13.84% | 12.51% | 11.82% | 9.67% | ||||||||||||
Russell 1000® Value Index (Total Return) | 1.35% | 7.52% | 8.09% | 7.00% | ||||||||||||
Average Annual Total Returns for the period ended November 30, 2023
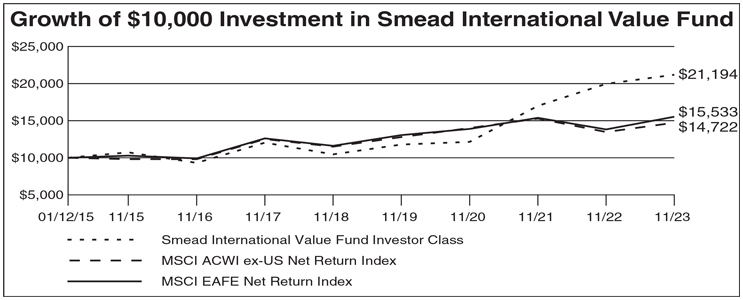
| Inception Date(1) | 1 Year | 5 Years(2) | 10 Years | Since Inception(1)(2) | ||||||||||
Smead International Value Fund - Investor Class | 1/12/2015 | 6.16% | 15.16% | N/A | 8.82% | |||||||||
Smead International Value Fund - Class A | 1/12/2015 | 5.97% | 14.98% | N/A | 8.66% | |||||||||
Smead International Value Fund - Class C | 1/12/2015 | 5.38% | 14.32% | N/A | 8.03% | |||||||||
Smead International Value Fund - Class I1 | 1/12/2015 | 6.26% | 15.30% | N/A | 8.96% | |||||||||
Smead International Value Fund - Class Y | 1/12/2015 | 6.44% | 15.45% | N/A | 9.10% | |||||||||
MSCI All Country World Index ex-USA (Net-USD) | 9.26% | 5.06% | N/A | 4.45% | ||||||||||
MSCI EAFE Index Net | 12.36% | 5.99% | N/A | 5.08% | ||||||||||
| (1) | On January 11, 2022, the Fund succeeded to substantially all of the assets and liabilities of the Smead International Value Fund LP, a Delaware Limited Partnership (the “Predecessor Fund”), in exchange solely for Class I1 shares of the Fund (the “Reorganization”). Smead Private Fund Advisers, LLC, an affiliate of Smead Capital Management, Inc., the investment adviser to the Fund (the “Adviser”), served as the General Partner for the Predecessor Fund since its inception on January 12, 2015. |
| (2) | Includes the historical performance of the Predecessor Fund prior to the date of Reorganization. |
Continued
11
Table of Contents
SMEAD FUNDS
Investment Highlights (Continued)
(Unaudited)
Performance data quoted represents past performance and does not guarantee future results. The investment return and principal value of an investment will fluctuate so that an investor’s shares, when redeemed, may be worth more or less than their original cost. Current performance of the Funds may be lower or higher than the performance quoted. Performance data current to the most recent month end may be obtained by calling 877-807-4122.
Investment performance for the Smead International Value Fund reflects fee waivers in effect. In the absence of such waivers, total returns would be reduced.
The returns shown assume reinvestment of Fund distributions and do not reflect the deduction of taxes that a shareholder would pay on Fund distributions or the redemption of Fund shares. The following graphs illustrate performance of hypothetical investments made in the Funds and broad-based securities indices on the Funds’ inception dates. The graphs do not reflect any future performance.
Continued
12
Table of Contents
SMEAD FUNDS
Investment Highlights (Continued)
(Unaudited)
The S&P 500® Index is a broad based unmanaged index of 500 stocks, which is widely recognized as representative of the equity market in general.
Standard & Poor’s®, S&P®, S&P 500® and Standard & Poor’s 500® are trade names or trademarks of Standard & Poor’s Financial Services, LLC.
The Russell 1000® Value Index measures the performance of those Russell 1000® companies with lower price-to-book ratios and lower forecasted growth values.
Frank Russell Company is the source and owner of the trademarks, service marks and copyrights related to the Russell Indexes. Russell® is a trademark of Russell Investment Group.
The MSCI ACWI ex-US Net Return Index captures large, mid, small and micro cap representation across 22 of 23 Developed Markets (DM) countries (excluding the United States). With 8,723 constituents, the index covers approximately 99% of the free float adjusted market capitalization in each country.
The MSCI EAFE Net Return Index is designed to represent the performance of large and mid-cap securities across 21 developed markets, including countries in Europe, Australasia and the Far East, excluding the U.S. and Canada. It covers approximately 85% of the free float-adjusted market capitalization in each country.
One cannot invest directly in an index.
Continued
13
Table of Contents
Shares | Value | |||||||
COMMON STOCKS 96.67% | ||||||||
Banks 11.63% | ||||||||
Bank of America Corp. | 6,167,320 | $ | 188,041,587 | |||||
Fifth Third Bancorp | 1,729,502 | 50,069,083 | ||||||
JPMorgan Chase & Co. | 1,232,267 | 192,332,233 | ||||||
M&T Bank Corp. | 383,863 | 49,199,721 | ||||||
Western Alliance Bancorp | 1,049,360 | 53,748,219 | ||||||
|
| |||||||
| 533,390,843 | ||||||||
|
| |||||||
Consumer Durables & Apparel 17.82% | ||||||||
DR Horton, Inc. | 2,305,579 | 294,353,271 | ||||||
Lennar Corp. – Class A | 2,402,370 | 307,311,170 | ||||||
NVR, Inc. (a) | 34,971 | 215,260,144 | ||||||
|
| |||||||
| 816,924,585 | ||||||||
|
| |||||||
Diversified Financials 8.47% | ||||||||
American Express Co. | 1,495,307 | 255,353,576 | ||||||
Berkshire Hathaway, Inc. – Class B (a) | 164,856 | 59,348,160 | ||||||
Credit Acceptance Corp. (a) | 161,636 | 73,867,652 | ||||||
|
| |||||||
| 388,569,388 | ||||||||
|
| |||||||
Energy 22.73% | ||||||||
APA Corp. | 4,644,794 | 167,212,584 | ||||||
ConocoPhillips | 1,707,805 | 197,371,024 | ||||||
Devon Energy Corp. | 3,383,280 | 152,146,102 | ||||||
Occidental Petroleum Corp. | 5,209,637 | 308,150,028 | ||||||
Ovintiv, Inc. | 4,900,736 | 217,298,634 | ||||||
|
| |||||||
| 1,042,178,372 | ||||||||
|
| |||||||
Media & Entertainment 2.02% | ||||||||
Warner Bros Discovery, Inc. (a) | 8,882,138 | 92,818,342 | ||||||
|
| |||||||
Pharmaceuticals, Biotechnology & Life Sciences 11.15% | ||||||||
Amgen, Inc. | 912,041 | 245,922,735 | ||||||
Merck & Co., Inc. | 2,587,643 | 265,181,655 | ||||||
|
| |||||||
| 511,104,390 | ||||||||
|
| |||||||
Real Estate 10.09% | ||||||||
Macerich Co. (The) – REIT | 18,161,584 | 208,313,369 | ||||||
Simon Property Group, Inc. – REIT | 2,037,652 | 254,482,358 | ||||||
|
| |||||||
| 462,795,727 | ||||||||
|
| |||||||
The accompanying notes are an integral part of these financial statements.
14
Table of Contents
SMEAD VALUE FUND
|
Schedule of Investments (Continued) |
November 30, 2023 |
Shares | Value | |||||||
Retailing 8.14% | ||||||||
eBay, Inc. | 2,896,462 | $ | 118,783,907 | |||||
Home Depot, Inc. | 401,446 | 125,849,306 | ||||||
Target Corp. | 961,328 | 128,635,300 | ||||||
|
| |||||||
| 373,268,513 | ||||||||
|
| |||||||
Semiconductors & Semiconductor Equipment 1.86% | ||||||||
QUALCOMM, Inc. | 662,170 | 85,453,039 | ||||||
|
| |||||||
Transportation 2.76% | ||||||||
U-Haul Holding Co. (a) | 473,200 | 26,787,852 | ||||||
U-Haul Holding Co. (Non Voting) | 1,840,476 | 99,661,775 | ||||||
|
| |||||||
| 126,449,627 | ||||||||
|
| |||||||
TOTAL COMMON STOCKS (Cost $3,899,609,563) | 4,432,952,826 | |||||||
|
| |||||||
SHORT-TERM INVESTMENTS 3.14% | ||||||||
Money Market Fund 3.14% | ||||||||
Northern Institutional Treasury Portfolio — Premier Class, 5.22% (b) | 143,975,555 | 143,975,555 | ||||||
|
| |||||||
TOTAL SHORT-TERM INVESTMENTS (Cost $143,975,555) | 143,975,555 | |||||||
|
| |||||||
TOTAL INVESTMENTS (Cost $4,043,585,118) 99.81% | 4,576,928,381 | |||||||
Other Assets in Excess of Liabilities 0.19% | 8,561,390 | |||||||
|
| |||||||
TOTAL NET ASSETS 100% | $ | 4,585,489,771 | ||||||
|
| |||||||
| (a) | Non-income producing security. |
| (b) | The rate shown is the 7-day yield as of year-end November 30, 2023. |
REIT — Real Estate Investment Trust
The Global Industry Classification Standard (GICS®) was developed by and/or is the exclusive property of MSCI, Inc. and Standard & Poor Financial Services LLC (“S&P”). GICS® is a service mark of MSCI and S&P and has been licensed for use by Smead Capital Management, Inc. for the purpose of Industry Classification in the Schedule of Investments.
The accompanying notes are an integral part of these financial statements.
15
Table of Contents
SMEAD INTERNATIONAL VALUE FUND
|
Schedule of Investments |
November 30, 2023 |
Shares | Value | |||||||
COMMON STOCKS 84.21% | ||||||||
Australia 3.30% | ||||||||
Materials 3.30% | ||||||||
Whitehaven Coal Ltd. | 739,834 | $ | 3,487,584 | |||||
|
| |||||||
Austria 5.47% | ||||||||
Financials 5.47% | ||||||||
BAWAG Group AG (a) | 110,670 | 5,779,223 | ||||||
|
| |||||||
Canada 31.37% | ||||||||
Consumer Discretionary 1.63% | ||||||||
Canada Goose Holdings, Inc. (b) | 155,369 | 1,723,205 | ||||||
|
| |||||||
Consumer Staples 1.22% | ||||||||
Alimentation Couche-Tard, Inc. | 22,600 | 1,289,097 | ||||||
|
| |||||||
Energy 19.92% | ||||||||
Cenovus Energy, Inc. | 386,120 | 6,849,116 | ||||||
MEG Energy Corp. (b) | 549,416 | 10,389,487 | ||||||
Strathcona Resources Ltd. (b) | 149,660 | 2,459,500 | ||||||
Whitecap Resources, Inc. | 195,737 | 1,353,044 | ||||||
|
| |||||||
| 21,051,147 | ||||||||
|
| |||||||
Materials 8.60% | ||||||||
Interfor Corp. (b) | 287,938 | 4,405,168 | ||||||
West Fraser Timber Co. Ltd. | 64,648 | 4,688,940 | ||||||
|
| |||||||
| 9,094,108 | ||||||||
|
| |||||||
| 33,157,557 | ||||||||
|
| |||||||
Denmark 3.98% | ||||||||
Consumer Discretionary 3.98% | ||||||||
Pandora AS | 31,170 | 4,210,049 | ||||||
|
| |||||||
Germany 1.82% | ||||||||
Consumer Discretionary 1.82% | ||||||||
Bayerische Motoren Werke AG | 18,457 | 1,920,294 | ||||||
|
| |||||||
Italy 12.51% | ||||||||
Financials 12.51% | ||||||||
Assicurazioni Generali SpA | 202,205 | 4,191,691 | ||||||
UniCredit SpA | 331,725 | 9,031,584 | ||||||
|
| |||||||
| 13,223,275 | ||||||||
|
| |||||||
The accompanying notes are an integral part of these financial statements.
16
Table of Contents
SMEAD INTERNATIONAL VALUE FUND
|
Schedule of Investments (Continued) |
November 30, 2023 |
Shares | Value | |||||||
Netherlands 1.46% | ||||||||
Communications 1.46% | ||||||||
Universal Music Group NV | 58,176 | $ | 1,539,472 | |||||
|
| |||||||
Norway 5.96% | ||||||||
Industrials 5.96% | ||||||||
Frontline PLC | 320,135 | 6,297,403 | ||||||
|
| |||||||
South Africa 2.83% | ||||||||
Materials 2.83% | ||||||||
Thungela Resources Ltd. | 390,768 | 2,988,628 | ||||||
|
| |||||||
Spain 3.44% | ||||||||
Financials 3.44% | ||||||||
Bankinter SA | 517,937 | 3,635,161 | ||||||
|
| |||||||
Switzerland 2.94% | ||||||||
Industrials 2.94% | ||||||||
IWG PLC (b) | 1,725,338 | 3,113,152 | ||||||
|
| |||||||
United Kingdom 4.55% | ||||||||
Consumer Discretionary 3.47% | ||||||||
Next PLC | 21,158 | 2,123,420 | ||||||
WH Smith PLC | 96,500 | 1,547,122 | ||||||
|
| |||||||
| 3,670,542 | ||||||||
|
| |||||||
Financials 1.08% | ||||||||
NatWest Group PLC | 432,158 | 1,137,901 | ||||||
|
| |||||||
| 4,808,443 | ||||||||
|
| |||||||
United States 4.58% | ||||||||
Energy 4.58% | ||||||||
Occidental Petroleum Corp. | 81,810 | 4,839,061 | ||||||
|
| |||||||
TOTAL COMMON STOCKS (Cost $78,778,404) | 88,999,302 | |||||||
|
| |||||||
PREFERRED STOCKS 7.73% | ||||||||
Germany 7.73% | ||||||||
Consumer Discretionary 7.73% | ||||||||
Dr Ing hc F Porsche AG, 1.20% (a),(c) | 12,906 | 1,180,593 | ||||||
Porsche Automobil Holding SE, 5.70% (c) | 72,192 | 3,524,593 | ||||||
Volkswagen AG, 8.25% (c) | 29,960 | 3,467,149 | ||||||
|
| |||||||
TOTAL PREFERRED STOCKS (Cost $11,726,283) | 8,172,335 | |||||||
|
| |||||||
The accompanying notes are an integral part of these financial statements.
17
Table of Contents
SMEAD INTERNATIONAL VALUE FUND
|
Schedule of Investments (Continued) |
November 30, 2023 |
Shares | Value | |||||||
WARRANTS 6.97% | ||||||||
United States 6.97% | ||||||||
Energy 6.97% | ||||||||
Occidental Petroleum Corp., Exp. 7/6/2027, Strike $22.00 (b) | 197,679 | 7,363,543 | ||||||
|
| |||||||
TOTAL WARRANTS (Cost $4,029,036) | 7,363,543 | |||||||
|
| |||||||
SHORT-TERM INVESTMENTS 2.08% | ||||||||
Money Market Fund 2.08% | ||||||||
Northern Institutional Treasury Portfolio — Premier Class, 5.22% (d) | 2,200,752 | 2,200,752 | ||||||
|
| |||||||
TOTAL SHORT-TERM INVESTMENTS (Cost $2,200,752) | 2,200,752 | |||||||
|
| |||||||
TOTAL INVESTMENTS (Cost $96,734,475) 100.99% | 106,735,932 | |||||||
Other Assets in Excess of Liabilities (0.99)% | (1,047,689 | ) | ||||||
|
| |||||||
TOTAL NET ASSETS 100.00% | $ | 105,688,243 | ||||||
|
| |||||||
| (a) | Security exempt from registration under Rule 144A of the Securities Act of 1933. This security may be resold in transactions exempt from registration, normally to qualified institutional buyers. At November 30, 2023, the value of this security totaled $6,959,816 or 6.59% of net assets. |
| (b) | Non-income producing security. |
| (c) | Current rate is disclosed. Dividends are calculated based on a percentage of the issuer’s net income. |
| (d) | The rate shown is the 7-day yield as of year-end November 30, 2023. |
The Global Industry Classification Standard (GICS®) was developed by and/or is the exclusive property of MSCI, Inc. and Standard & Poor Financial Services LLC (“S&P”). GICS® is a service mark of MSCI and S&P and has been licensed for use by Smead Capital Management, Inc. for the purpose of Industry Classification in the Schedule of Investments.
The accompanying notes are an integral part of these financial statements.
18
Table of Contents
Assets | ||||
Investments, at value (cost $4,043,585,118) | $ | 4,576,928,381 | ||
Receivable for Fund shares sold | 3,052,133 | |||
Dividends and interest receivable | 12,270,622 | |||
Other assets | 42,636 | |||
|
| |||
Total Assets | 4,592,293,772 | |||
|
| |||
Liabilities | ||||
Payable for Fund shares redeemed | 2,306,387 | |||
Payable to Adviser | 2,759,358 | |||
Payable to Administrator | 1,833 | |||
Payable for distribution fees | 133,381 | |||
Payable for shareholder servicing fees | 946,670 | |||
Accrued expenses and other liabilities | 656,372 | |||
|
| |||
Total Liabilities | 6,804,001 | |||
|
| |||
Net assets | $ | 4,585,489,771 | ||
|
| |||
Net Assets Consist Of: | ||||
Paid in capital | $ | 4,012,599,091 | ||
Total distributable earnings | 572,890,680 | |||
|
| |||
Net assets | $ | 4,585,489,771 | ||
|
| |||
Investor Class Shares | ||||
Net assets | $ | 97,660,054 | ||
Shares of beneficial interest outstanding (unlimited number of shares authorized, $0.001 par value) | 1,393,549 | |||
Net asset value, offering price and redemption price per share | $ | 70.08 | ||
|
| |||
Class A Shares | ||||
Net assets | $ | 420,259,193 | ||
Shares of beneficial interest outstanding (unlimited number of shares authorized, $0.001 par value) | 6,052,591 | |||
Net asset value, offering price and redemption price per share(1) | $ | 69.43 | ||
|
| |||
Maximum offering price per share ($69.43/0.9425) (2) | $ | 73.67 | ||
|
| |||
Class C Shares | ||||
Net assets | $ | 49,177,924 | ||
Shares of beneficial interest outstanding (unlimited number of shares authorized, $0.001 par value) | 728,414 | |||
Net asset value, offering price and redemption price per share(1) | $ | 67.51 | ||
|
| |||
The accompanying notes are an integral part of these financial statements.
19
Table of Contents
SMEAD VALUE FUND
|
Statement of Assets and Liabilities (Continued) |
November 30, 2023 |
Class I1 Shares | ||||
Net assets | $ | 3,624,188,571 | ||
Shares of beneficial interest outstanding (unlimited number of shares authorized, $0.001 par value) | 51,631,808 | |||
Net asset value, offering price and redemption price per share | $ | 70.19 | ||
|
| |||
Class R1 Shares | ||||
Net assets | $ | 175,021 | ||
Shares of beneficial interest outstanding (unlimited number of shares authorized, $0.001 par value) | 2,544 | |||
Net asset value, offering price and redemption price per share | $ | 68.80 | ||
|
| |||
Class R2 Shares | ||||
Net assets | $ | 291,090 | ||
Shares of beneficial interest outstanding (unlimited number of shares authorized, $0.001 par value) | 4,091 | |||
Net asset value, offering price and redemption price per share | $ | 71.15 | ||
|
| |||
Class Y Shares | ||||
Net assets | $ | 393,737,918 | ||
Shares of beneficial interest outstanding (unlimited number of shares authorized, $0.001 par value) | 5,597,973 | |||
Net asset value, offering price and redemption price per share | $ | 70.34 | ||
|
| |||
| (1) | A 1.00% deferred sales charge (CDSC) applies to Class A purchases of $1,000,000 or more that are redeemed within 18 months of purchase. A CDSC of 1.00% also applies on redemptions of Class C shares within 12 months of purchase. |
| (2) | Reflects a maximum sales charge of 5.75%. |
The accompanying notes are an integral part of these financial statements.
20
Table of Contents
SMEAD INTERNATIONAL VALUE FUND
|
Statement of Assets and Liabilities |
November 30, 2023 |
Assets | ||||
Investments, at value (cost $96,734,475) | $ | 106,735,932 | ||
Receivable for Fund shares sold | 9,650 | |||
Dividends and interest receivable | 13,436 | |||
Receivable for foreign tax reclaimable | 198,591 | |||
Other assets | 646 | |||
|
| |||
Total Assets | 106,958,255 | |||
|
| |||
Liabilities | ||||
Payable for Fund shares redeemed | 44,822 | |||
Payable to Adviser | 64,932 | |||
Payable to Administrator | 14,824 | |||
Payable for investments purchased | 1,061,143 | |||
Payable for distribution fees | 1,212 | |||
Payable for shareholder servicing fees | 13,926 | |||
Accrued reimbursement | 1,697 | |||
Accrued expenses and other liabilities | 67,456 | |||
|
| |||
Total Liabilities | 1,270,012 | |||
|
| |||
Net assets | $ | 105,688,243 | ||
|
| |||
Net Assets Consist Of: | ||||
Paid in capital | $ | 98,098,395 | ||
Total distributable earnings | 7,589,848 | |||
|
| |||
Net assets | $ | 105,688,243 | ||
|
| |||
Investor Class Shares | ||||
Net assets | $ | 65,811 | ||
Shares of beneficial interest outstanding (unlimited number of shares authorized, $0.001 par value) | 1,260 | |||
Net asset value, offering price and redemption price per share(1) | $ | 52.22 | ||
|
| |||
Class A Shares | ||||
Net assets | $ | 4,967,118 | ||
Shares of beneficial interest outstanding (unlimited number of shares authorized, $0.001 par value) | 96,254 | |||
Net asset value, offering price and redemption price per share(2) | $ | 51.60 | ||
|
| |||
Maximum offering price per share ($51.60/0.9425) (3) | $ | 54.75 | ||
|
| |||
Class C Shares | ||||
Net assets | $ | 278,978 | ||
Shares of beneficial interest outstanding (unlimited number of shares authorized, $0.001 par value) | 5,699 | |||
Net asset value, offering price and redemption price per share(2) | $ | 48.95 | ||
|
| |||
The accompanying notes are an integral part of these financial statements.
21
Table of Contents
SMEAD INTERNATIONAL VALUE FUND
|
Statement of Assets and Liabilities (Continued) |
November 30, 2023 |
Class I1 Shares | ||||
Net assets | $ | 60,967,589 | ||
Shares of beneficial interest outstanding (unlimited number of shares authorized, $0.001 par value) | 1,155,265 | |||
Net asset value, offering price and redemption price per share | $ | 52.77 | ||
|
| |||
Class Y Shares | ||||
Net assets | $ | 39,408,747 | ||
Shares of beneficial interest outstanding (unlimited number of shares authorized, $0.001 par value) | 738,701 | |||
Net asset value, offering price and redemption price per share | $ | 53.35 | ||
|
| |||
| (1) | Calculated NAV may not equal actual NAV shown due to rounding of the net assets and shares. |
| (2) | A 1.00% deferred sales charge (CDSC) applies to Class A purchases of $1,000,000 or more that are redeemed within 18 months of purchase. A CDSC of 1.00% also applies on redemptions of Class C shares within 12 months of purchase. |
| (3) | Reflects a maximum sales charge of 5.75%. |
The accompanying notes are an integral part of these financial statements.
22
Table of Contents
Investment Income | ||||
Dividend income | $ | 124,381,454 | ||
|
| |||
Total Investment Income | 124,381,454 | |||
|
| |||
Expenses | ||||
Management fees | 34,733,326 | |||
Distribution fees – Investor Class | 248,684 | |||
Distribution fees – Class A | 1,022,767 | |||
Distribution fees – Class C | 338,690 | |||
Distribution fees – Class R1 | 1,016 | |||
Distribution fees – Class R2 | 448 | |||
Shareholder servicing fees – Investor Class | 125,688 | |||
Shareholder servicing fees – Class A | 371,263 | |||
Shareholder servicing fees – Class C | 112,897 | |||
Shareholder servicing fees – Class I1 | 3,198,442 | |||
Shareholder servicing fees – Class R1 | 87 | |||
Shareholder servicing fees – Class R2 | 90 | |||
Fund accounting and Administration fees | 521,079 | |||
Transfer agent fees and expenses | 601,023 | |||
Federal and state registration fees | 57,148 | |||
Custody fees | 58,236 | |||
Reports to shareholders | 262,212 | |||
Legal fees | 227,738 | |||
Audit and tax fees | 22,687 | |||
Trustees’ fees | 230,940 | |||
Other expenses | 579,004 | |||
|
| |||
Total Expenses | 42,713,465 | |||
|
| |||
Net Investment Income | 81,667,989 | |||
|
| |||
Realized and Unrealized Gain on Investments | ||||
Net realized loss on investments | (9,394,700 | ) | ||
Net realized gain from in-kind redemptions | 151,793,602 | |||
Change in net unrealized depreciation on investments | (180,208,849 | ) | ||
|
| |||
Net Realized and Unrealized Loss on Investments | (37,809,947 | ) | ||
|
| |||
Net Increase in Net Assets from Operations | $ | 43,858,042 | ||
|
| |||
The accompanying notes are an integral part of these financial statements.
23
Table of Contents
SMEAD INTERNATIONAL VALUE FUND
|
Statement of Operations |
For the year ended November 30, 2023 |
Investment Income | ||||
Dividend income (net of taxes withheld of $364,953) | $ | 3,692,265 | ||
Interest income | 2,640 | |||
|
| |||
Total Investment Income | 3,694,905 | |||
|
| |||
Expenses | ||||
Management fees | 684,309 | |||
Distribution fees – Investor Class | 104 | |||
Distribution fees – Class A | 10,978 | |||
Distribution fees – Class C | 2,237 | |||
Shareholder servicing fees – Class A | 7,087 | |||
Shareholder servicing fees – Class C | 438 | |||
Shareholder servicing fees – Class I1 | 48,836 | |||
Fund accounting and Administration fees | 217,925 | |||
Transfer agent fees and expenses | 72,556 | |||
Federal and state registration fees | 50,678 | |||
Custody fees | 98,794 | |||
Reports to shareholders | 9,859 | |||
Audit and tax fees | 21,687 | |||
Trustees’ fees | 3,421 | |||
Other expenses | 25,273 | |||
|
| |||
Total Expenses | 1,254,182 | |||
|
| |||
Expense waiver by Adviser | (221,965 | ) | ||
Expense waiver by service provider | (25,000 | ) | ||
|
| |||
Net Expenses | 1,007,217 | |||
|
| |||
Net Investment Income | 2,687,688 | |||
|
| |||
Realized and Unrealized Gain on Investments | ||||
Net realized loss on investments | (866,678 | ) | ||
Net realized gain on foreign currency transactions | 7,612 | |||
Change in net unrealized appreciation on investments | 3,214,736 | |||
Change in net unrealized appreciation on foreign currency | 3,037 | |||
|
| |||
Net Realized and Unrealized Gain on Investments | 2,358,707 | |||
|
| |||
Net Increase in Net Assets from Operations | $ | 5,046,395 | ||
|
| |||
The accompanying notes are an integral part of these financial statements.
24
Table of Contents
For The Year Ended November 30, 2023 | For The Year Ended | |||||||
From Operations | ||||||||
Net investment income | $ | 81,667,989 | $ | 37,333,443 | ||||
Net realized gain from investments | 142,398,902 | 307,522,667 | ||||||
Change in net unrealized depreciation on investments | (180,208,849 | ) | (117,997,490 | ) | ||||
|
|
|
| |||||
Net increase in net assets from operations | 43,858,042 | 226,858,620 | ||||||
|
|
|
| |||||
From Distributions | ||||||||
Investor Class | (1,771,485 | ) | (4,255,078 | ) | ||||
Class A | (7,460,942 | ) | (11,256,332 | ) | ||||
Class C | (590,592 | ) | (682,470 | ) | ||||
Class I1 | (72,422,216 | ) | (102,566,190 | ) | ||||
Class R1 | (3,744 | ) | (6,379 | ) | ||||
Class R2 | (1,000 | ) | (3,885 | ) | ||||
Class Y | (7,794,488 | ) | (10,684,125 | ) | ||||
|
|
|
| |||||
Decrease in net assets resulting from distributions paid | (90,044,467 | ) | (129,454,459 | ) | ||||
|
|
|
| |||||
From Capital Share Transactions | ||||||||
Proceeds from shares sold | 1,892,342,324 | 2,694,052,838 | ||||||
Issued in reinvestment of dividends and distributions | 67,139,759 | 88,737,360 | ||||||
Payments for shares redeemed | (1,827,314,814 | ) | (1,441,973,313 | ) | ||||
|
|
|
| |||||
Net increase in net assets from capital share transactions | 132,167,269 | 1,340,816,885 | ||||||
|
|
|
| |||||
Total Increase in Net Assets | 85,980,844 | 1,438,221,046 | ||||||
|
|
|
| |||||
Net Assets | ||||||||
Beginning of year | 4,499,508,927 | 3,061,287,881 | ||||||
|
|
|
| |||||
End of year | $ | 4,585,489,771 | $ | 4,499,508,927 | ||||
|
|
|
| |||||
The accompanying notes are an integral part of these financial statements.
25
Table of Contents
SMEAD INTERNATIONAL VALUE FUND
|
Statements of Changes in Net Assets |
For The Year Ended November 30, 2023 | For The Period Ended November 30, 20221 | |||||||
From Operations | ||||||||
Net investment income | $ | 2,687,688 | $ | 565,985 | ||||
Net realized loss from investments | (866,678 | ) | (3,750,135 | ) | ||||
Net realized gain from foreign currency transactions | 7,612 | 9,092 | ||||||
Change in net unrealized appreciation on investments | 3,214,736 | 3,638,737 | ||||||
Change in net unrealized appreciation (depreciation) on foreign currency transactions | 3,037 | (825 | ) | |||||
|
|
|
| |||||
Net increase in net assets from operations | 5,046,395 | 462,854 | ||||||
|
|
|
| |||||
From Distributions | ||||||||
Investor Class | (255 | ) | - | |||||
Class A | (31,070 | ) | - | |||||
Class C | (2,993 | ) | - | |||||
Class I1 | (547,621 | ) | - | |||||
Class Y | (485,446 | ) | - | |||||
|
|
|
| |||||
Decrease in net assets resulting from distributions paid | (1,067,385 | ) | - | |||||
|
|
|
| |||||
From Capital Share Transactions | ||||||||
Proceeds from shares sold | 35,831,961 | 79,963,231 | ||||||
Issued in reinvestment of dividends and distributions | 1,039,547 | - | ||||||
Payments for shares redeemed | (10,696,725 | ) | (4,891,635 | ) | ||||
|
|
|
| |||||
Net increase in net assets from capital share transactions | 26,174,783 | 75,071,596 | ||||||
|
|
|
| |||||
Total Increase in Net Assets | 30,153,793 | 75,534,450 | ||||||
|
|
|
| |||||
Net Assets | ||||||||
Beginning of year | 75,534,450 | - | ||||||
|
|
|
| |||||
End of year | $ | 105,688,243 | $ | 75,534,450 | ||||
|
|
|
| |||||
| 1 | Period from January 12, 2022, date operations commenced, through November 30, 2022. |
The accompanying notes are an integral part of these financial statements.
26
Table of Contents
(This Page Intentionally Left Blank.)
Table of Contents
Financial Highlights |
November 30, 2023
| Income from investment operations | Less distributions paid | ||||||||||||||||||||||||||||||||||
| Net Asset Value, Beginning of Year | Net investment income(1) | Net realized and unrealized gain/(loss) on investments | Total from investment operations | Distributions from net investments income | Distributions from net realized gain on investments | Total distributions paid | |||||||||||||||||||||||||||||
Investor Class | |||||||||||||||||||||||||||||||||||
November 30, 2023 | $ | 70.77 | $ | 1.02 | $ | (0.53 | ) | $ | 0.49 | $ | (0.47 | ) | $ | (0.71 | ) | $ | (1.18 | ) | |||||||||||||||||
November 30, 2022 | 69.63 | 0.49 | 3.35 | 3.84 | (0.15 | ) | (2.55 | ) | (2.70 | ) | |||||||||||||||||||||||||
November 30, 2021 | 49.68 | 0.17 | 20.49 | 20.66 | (0.35 | ) | (0.36 | ) | (0.71 | ) | |||||||||||||||||||||||||
November 30, 2020 | 51.55 | 0.52 | (0.47 | ) | 0.05 | (0.35 | ) | (1.57 | ) | (1.92 | ) | ||||||||||||||||||||||||
November 30, 2019 | 49.13 | 0.33 | 5.19 | 5.52 | — | (3.10 | ) | (3.10 | ) | ||||||||||||||||||||||||||
Class A | |||||||||||||||||||||||||||||||||||
November 30, 2023 | 70.13 | 1.03 | (0.53 | ) | 0.50 | (0.49 | ) | (0.71 | ) | (1.20 | ) | ||||||||||||||||||||||||
November 30, 2022 | 69.08 | 0.50 | 3.31 | 3.81 | (0.21 | ) | (2.55 | ) | (2.76 | ) | |||||||||||||||||||||||||
November 30, 2021 | 49.32 | 0.17 | 20.32 | 20.49 | (0.37 | ) | (0.36 | ) | (0.73 | ) | |||||||||||||||||||||||||
November 30, 2020 | 51.20 | 0.50 | (0.45 | ) | 0.05 | (0.36 | ) | (1.57 | ) | (1.93 | ) | ||||||||||||||||||||||||
November 30, 2019 | 48.82 | 0.33 | 5.15 | 5.48 | — | (3.10 | ) | (3.10 | ) | ||||||||||||||||||||||||||
Class C | |||||||||||||||||||||||||||||||||||
November 30, 2023 | 68.42 | 0.58 | (0.53 | ) | 0.05 | (0.25 | ) | (0.71 | ) | (0.96 | ) | ||||||||||||||||||||||||
November 30, 2022 | 67.70 | 0.15 | 3.21 | 3.36 | (0.09 | ) | (2.55 | ) | (2.64 | ) | |||||||||||||||||||||||||
November 30, 2021 | 48.70 | (0.18 | ) | 20.00 | 19.82 | (0.46 | ) | (0.36 | ) | (0.82 | ) | ||||||||||||||||||||||||
November 30, 2020(3) | 36.22 | 0.08 | 12.40 | (4) | 12.48 | — | — | — | |||||||||||||||||||||||||||
Class I1 | |||||||||||||||||||||||||||||||||||
November 30, 2023 | 70.88 | 1.22 | (0.54 | ) | 0.68 | (0.66 | ) | (0.71 | ) | (1.37 | ) | ||||||||||||||||||||||||
November 30, 2022 | 69.74 | 0.68 | 3.35 | 4.03 | (0.34 | ) | (2.55 | ) | (2.89 | ) | |||||||||||||||||||||||||
November 30, 2021 | 49.78 | 0.34 | 20.47 | 20.81 | (0.49 | ) | (0.36 | ) | (0.85 | ) | |||||||||||||||||||||||||
November 30, 2020 | 51.65 | 0.62 | (0.43 | ) | 0.19 | (0.49 | ) | (1.57 | ) | (2.06 | ) | ||||||||||||||||||||||||
November 30, 2019 | 49.10 | 0.47 | 5.19 | 5.66 | (0.01 | ) | (3.10 | ) | (3.11 | ) | |||||||||||||||||||||||||
Class R1 | |||||||||||||||||||||||||||||||||||
November 30, 2023 | 69.48 | 0.90 | (0.50 | ) | 0.40 | (0.37 | ) | (0.71 | ) | (1.08 | ) | ||||||||||||||||||||||||
November 30, 2022 | 68.42 | 0.30 | 3.31 | 3.61 | — | (2.55 | ) | (2.55 | ) | ||||||||||||||||||||||||||
November 30, 2021 | 48.81 | (0.03 | ) | 20.21 | 20.18 | (0.21 | ) | (0.36 | ) | (0.57 | ) | ||||||||||||||||||||||||
November 30, 2020 | 50.46 | 0.38 | (0.46 | ) | (0.08 | ) | — | (1.57 | ) | (1.57 | ) | ||||||||||||||||||||||||
November 30, 2019 | 48.30 | 0.19 | 5.07 | 5.26 | — | (3.10 | ) | (3.10 | ) | ||||||||||||||||||||||||||
The accompanying notes are an integral part of these financial statements.
28
Table of Contents
| Ratio of expenses to average net assets | Ratio of net investment income (loss) to average net assets | |||||||||||||||||||||||||||||||||||||
| Net Asset Value, End of Year | Total Return(2) | Net assets at end of year (000’s) | Before waivers and recoupment of expenses | After waivers and recoupment of expenses | Before waivers and recoupment of expenses | After waivers and recoupments of expenses | Portfolio turnover rate | |||||||||||||||||||||||||||||||
| $70.08 | 0.77 | % | $ | 97,660 | 1.18 | % | 1.18 | % | 1.50 | % | 1.50 | % | 15.60 | % | ||||||||||||||||||||||||
| 70.77 | 5.70 | % | 107,324 | 1.19 | % | 1.19 | % | 0.73 | % | 0.73 | % | 11.15 | % | |||||||||||||||||||||||||
| 69.63 | 42.10 | % | 109,938 | 1.19 | % | 1.19 | % | 0.27 | % | 0.27 | % | 17.40 | % | |||||||||||||||||||||||||
| 49.68 | 0.09 | % | 79,894 | 1.22 | % | 1.22 | % | 1.16 | % | 1.16 | % | 40.26 | % | |||||||||||||||||||||||||
| 51.55 | 12.38 | % | 117,805 | 1.24 | % | 1.24 | % | 0.71 | % | 0.71 | % | 20.75 | % | |||||||||||||||||||||||||
| 69.43 | 0.81 | % | 420,259 | 1.15 | % | 1.15 | % | 1.54 | % | 1.54 | % | 15.60 | % | |||||||||||||||||||||||||
| 70.13 | 5.69 | % | 427,616 | 1.19 | % | 1.19 | % | 0.76 | % | 0.76 | % | 11.15 | % | |||||||||||||||||||||||||
| 69.08 | 42.11 | % | 274,607 | 1.20 | % | 1.20 | % | 0.27 | % | 0.27 | % | 17.40 | % | |||||||||||||||||||||||||
| 49.32 | 0.08 | % | 105,555 | 1.23 | % | 1.23 | % | 1.14 | % | 1.14 | % | 40.26 | % | |||||||||||||||||||||||||
| 51.20 | 12.35 | % | 119,181 | 1.24 | % | 1.24 | % | 0.72 | % | 0.72 | % | 20.75 | % | |||||||||||||||||||||||||
| 67.51 | 0.14 | % | 49,178 | 1.81 | % | 1.81 | % | 0.88 | % | 0.88 | % | 15.60 | % | |||||||||||||||||||||||||
| 68.42 | 5.13 | % | 41,043 | 1.75 | % | 1.75 | % | 0.23 | % | 0.23 | % | 11.15 | % | |||||||||||||||||||||||||
| 67.70 | 41.29 | % | 16,544 | 1.76 | % | 1.76 | % | (0.27 | )% | (0.27 | )% | 17.40 | % | |||||||||||||||||||||||||
| 48.70 | 34.46 | %(5) | 199 | 1.85 | %(6) | 1.84 | %(6) | 0.27 | %(6) | 0.28 | %(6) | 40.26 | %(5) | |||||||||||||||||||||||||
| 70.19 | 1.05 | % | 3,624,189 | 0.89 | % | 0.89 | % | 1.80 | % | 1.80 | % | 15.60 | % | |||||||||||||||||||||||||
| 70.88 | 5.99 | % | 3,531,198 | 0.93 | % | 0.93 | % | 1.01 | % | 1.01 | % | 11.15 | % | |||||||||||||||||||||||||
| 69.74 | 42.43 | % | 2,417,546 | 0.93 | % | 0.93 | % | 0.54 | % | 0.54 | % | 17.40 | % | |||||||||||||||||||||||||
| 49.78 | 0.36 | % | 947,872 | 0.97 | % | 0.97 | % | 1.40 | % | 1.40 | % | 40.26 | % | |||||||||||||||||||||||||
| 51.65 | 12.67 | % | 1,066,128 | 0.97 | % | 0.97 | % | 1.00 | % | 1.00 | % | 20.75 | % | |||||||||||||||||||||||||
| 68.80 | 0.65 | % | 175 | 1.35 | % | 1.35 | % | 1.35 | % | 1.35 | % | 15.60 | % | |||||||||||||||||||||||||
| 69.48 | 5.45 | % | 241 | 1.49 | % | 1.49 | % | 0.46 | % | 0.46 | % | 11.15 | % | |||||||||||||||||||||||||
| 68.42 | 41.75 | % | 171 | 1.49 | % | 1.49 | % | (0.05 | )% | (0.05 | )% | 17.40 | % | |||||||||||||||||||||||||
| 48.81 | (0.18 | )% | 291 | 1.52 | % | 1.52 | % | 0.85 | % | 0.85 | % | 40.26 | % | |||||||||||||||||||||||||
| 50.46 | 12.01 | % | 872 | 1.55 | % | 1.55 | % | 0.43 | % | 0.43 | % | 20.75 | % | |||||||||||||||||||||||||
29
Table of Contents
SMEAD VALUE FUND
Financial Highlights (Continued) |
November 30, 2023
| Income from investment operations | Less distributions paid | ||||||||||||||||||||||||||||||||||
| Net Asset Value, Beginning of Year | Net investment income(1) | Net realized and unrealized gain/(loss) on investments | Total from investment operations | Distributions from net investments income | Distributions from net realized gain on investments | Total distributions paid | |||||||||||||||||||||||||||||
Class R2 | |||||||||||||||||||||||||||||||||||
November 30, 2023 | $ | 71.80 | $ | 1.06 | $ | (0.74 | ) | $ | 0.32 | $ | (0.26 | ) | $ | (0.71 | ) | $ | (0.97 | ) | |||||||||||||||||
November 30, 2022 | 70.62 | 0.33 | 3.49 | 3.85 | (0.12 | ) | (2.55 | ) | (2.67 | ) | |||||||||||||||||||||||||
November 30, 2021 | 50.43 | 0.08 | 20.75 | 20.83 | (0.28 | ) | (0.36 | ) | (0.64 | ) | |||||||||||||||||||||||||
November 30, 2020 | 52.43 | 0.41 | (0.45 | ) | (0.04 | ) | (0.39 | ) | (1.57 | ) | (1.96 | ) | |||||||||||||||||||||||
November 30, 2019 | 50.01 | 0.32 | 5.20 | 5.52 | — | (3.10 | ) | (3.10 | ) | ||||||||||||||||||||||||||
Class Y | |||||||||||||||||||||||||||||||||||
November 30, 2023 | 71.01 | 1.26 | (0.51 | ) | 0.75 | (0.71 | ) | (0.71 | ) | (1.42 | ) | ||||||||||||||||||||||||
November 30, 2022 | 69.86 | 0.74 | 3.36 | 4.09 | (0.39 | ) | (2.55 | ) | (2.94 | ) | |||||||||||||||||||||||||
November 30, 2021 | 49.86 | 0.40 | 20.51 | 20.91 | (0.55 | ) | (0.36 | ) | (0.91 | ) | |||||||||||||||||||||||||
November 30, 2020 | 51.73 | 0.61 | (0.35 | ) | 0.26 | (0.56 | ) | (1.57 | ) | (2.13 | ) | ||||||||||||||||||||||||
November 30, 2019 | 49.19 | 0.53 | 5.19 | 5.72 | (0.08 | ) | (3.10 | ) | (3.18 | ) | |||||||||||||||||||||||||
| (1) | Based on average shares outstanding. |
| (2) | Total return in the above table represents the rate that the investor would have earned or lost on an investment in the Fund, assuming reinvestment of dividends. |
| (3) | Class C shares commenced operations on April 16, 2020. |
| (4) | The amount shown for a share outstanding throughout the year does not correspond with the change in aggregate gains and losses in the portfolio of securities during the year because of the timing of sales and purchases of Fund shares in relation to fluctuating values during the year. |
| (5) | Not annualized for periods of less than one year. |
| (6) | Annualized for periods of less than one year. |
The accompanying notes are an integral part of these financial statements.
30
Table of Contents
| Ratio of expenses to average net assets | Ratio of net investment income (loss) to average net assets | |||||||||||||||||||||||||||||||||||||
| Net Asset Value, End of Year | Total Return(2) | Net assets at end of year (000’s) | Before waivers and recoupment of expenses | After waivers and recoupment of expenses | Before waivers and recoupment of expenses | After waivers and recoupments of expenses | Portfolio turnover rate | |||||||||||||||||||||||||||||||
| $71.15 | 0.55 | % | $ | 291 | 1.41 | % | 1.41 | % | 1.54 | % | 1.54 | % | 15.60 | % | ||||||||||||||||||||||||
| 71.80 | 5.57 | % | 74 | 1.38 | % | 1.38 | % | 0.49 | % | 0.49 | % | 11.15 | % | |||||||||||||||||||||||||
| 70.62 | 41.78 | % | 95 | 1.40 | % | 1.40 | % | 0.11 | % | 0.11 | % | 17.40 | % | |||||||||||||||||||||||||
| 50.43 | (0.10 | )% | 73 | 1.43 | % | 1.43 | % | 0.91 | % | 0.91 | % | 40.26 | % | |||||||||||||||||||||||||
| 52.43 | 12.12 | % | 74 | 1.44 | % | 1.44 | % | 0.66 | % | 0.66 | % | 20.75 | % | |||||||||||||||||||||||||
| 70.34 | 1.16 | % | 393,738 | 0.81 | % | 0.81 | % | 1.86 | % | 1.86 | % | 15.60 | % | |||||||||||||||||||||||||
| 71.01 | 6.06 | % | 392,012 | 0.84 | % | 0.84 | % | 1.12 | % | 1.11 | % | 11.15 | % | |||||||||||||||||||||||||
| 69.86 | 42.62 | % | 242,387 | 0.84 | % | 0.84 | % | 0.63 | % | 0.62 | % | 17.40 | % | |||||||||||||||||||||||||
| 49.86 | 0.48 | % | 91,824 | 0.88 | % | 0.84 | % | 1.32 | % | 1.36 | % | 40.26 | % | |||||||||||||||||||||||||
| 51.73 | 12.81 | % | 15,443 | 0.86 | % | 0.84 | % | 1.12 | % | 1.14 | % | 20.75 | % | |||||||||||||||||||||||||
31
Table of Contents
SMEAD INTERNATIONAL VALUE FUND
|
Financial Highlights |
November 30, 2023 |
| Income from investment operations | Less distributions paid | ||||||||||||||||||||||||||||||||||
| Net Asset Value, Beginning of Year | Net investment income(1) | Net realized and unrealized gain (loss) on investments | Total from investment operations | Distributions from net investments income | Net Asset Value, End of Year | Total Return(2) | |||||||||||||||||||||||||||||
Investor Class | |||||||||||||||||||||||||||||||||||
November 30, 2023 | $ | 49.91 | $ | 1.23 | $ | 1.75 | $ | 2.98 | $ | (0.67 | ) | $ | 52.22 | 6.16 | % | ||||||||||||||||||||
November 30, 2022(3) | 49.33 | 0.08 | 0.50 | 0.58 | — | 49.91 | 1.18 | %(4) | |||||||||||||||||||||||||||
Class A | |||||||||||||||||||||||||||||||||||
November 30, 2023 | 49.32 | 1.34 | 1.52 | 2.86 | (0.58 | ) | 51.60 | 5.97 | % | ||||||||||||||||||||||||||
November 30, 2022(3) | 48.83 | 0.33 | 0.16 | 0.49 | — | 49.32 | 1.00 | %(4) | |||||||||||||||||||||||||||
Class C | |||||||||||||||||||||||||||||||||||
November 30, 2023 | 47.10 | 0.73 | 1.73 | 2.46 | (0.61 | ) | 48.95 | 5.38 | % | ||||||||||||||||||||||||||
November 30, 2022(3) | 46.84 | (0.14 | )(6) | 0.40 | 0.26 | — | 47.10 | 0.58 | %(4) | ||||||||||||||||||||||||||
Class I1 | |||||||||||||||||||||||||||||||||||
November 30, 2023 | 50.41 | 1.47 | 1.59 | 3.06 | (0.70 | ) | 52.77 | 6.26 | % | ||||||||||||||||||||||||||
November 30, 2022(3) | 49.78 | 0.43 | 0.20 | 0.63 | — | 50.41 | 1.27 | %(4) | |||||||||||||||||||||||||||
Class Y | |||||||||||||||||||||||||||||||||||
November 30, 2023 | 50.91 | 1.62 | 1.55 | 3.17 | (0.73 | ) | 53.35 | 6.44 | % | ||||||||||||||||||||||||||
November 30, 2022(3) | 50.18 | 0.49 | 0.24 | 0.73 | — | 50.91 | 1.45 | %(4) | |||||||||||||||||||||||||||
| (1) | Based on average shares outstanding. |
| (2) | Total return in the above table represents the rate that the investor would have earned or lost on an investment in the Fund, assuming reinvestment of dividends. |
| (3) | Period from January 12, 2022, date operations commenced, through November 30, 2022. |
| (4) | Not annualized for periods of less than one year. |
| (5) | Annualized for periods of less than one year. |
| (6) | The amount shown for a share outstanding throughout the year does not correspond with the change in aggregate gains and losses in the portfolio of securities during the year because of the timing of sales and purchases of Fund shares in relation to fluctuating values during the year. |
The accompanying notes are an integral part of these financial statements.
32
Table of Contents
| Ratio of expenses to average net assets | Ratio of net investment income (loss) to average net assets | |||||||||||||||||||||||||||
| Net assets at end of year (000’s) | Before waivers and recoupment of expenses | After waivers and recoupment of expenses | Before waivers and recoupment of expenses | After waivers and recoupment of expenses | Portfolio turnover rate | |||||||||||||||||||||||
| $ | 66 | 1.50 | % | 1.25 | % | 2.15 | % | 2.40 | % | 8.26 | % | |||||||||||||||||
| 19 | 1.42 | %(5) | 1.42 | %(5) | 0.19 | %(5) | 0.19 | %(5) | 20.30 | %(4) | ||||||||||||||||||
| 4,967 | 1.70 | % | 1.42 | % | 2.37 | % | 2.65 | % | 8.26 | % | ||||||||||||||||||
| 2,630 | 1.51 | %(5) | 1.51 | %(5) | 0.78 | %(5) | 0.78 | %(5) | 20.30 | %(4) | ||||||||||||||||||
| 279 | 2.25 | % | 2.00 | % | 1.26 | % | 1.51 | % | 8.26 | % | ||||||||||||||||||
| 106 | 2.02 | %(5) | 2.02 | %(5) | (0.34 | )%(5) | (0.34 | )%(5) | 20.30 | %(4) | ||||||||||||||||||
| 60,968 | 1.39 | % | 1.15 | % | 2.61 | % | 2.85 | % | 8.26 | % | ||||||||||||||||||
| 39,428 | 1.23 | %(5) | 1.23 | %(5) | 0.99 | %(5) | 0.99 | %(5) | 20.30 | %(4) | ||||||||||||||||||
| 39,409 | 1.31 | % | 1.00 | % | 2.81 | % | 3.12 | % | 8.26 | % | ||||||||||||||||||
| 33,351 | 1.15 | %(5) | 1.00 | %(5) | 0.97 | %(5) | 1.12 | %(5) | 20.30 | %(4) | ||||||||||||||||||
33
Table of Contents
Notes to Financial Statements
November 30, 2023
| (1) | Organization |
The Smead Value Fund and the Smead International Value Fund (each, a “Fund” and together, the “Funds”) are non-diversified series of Smead Funds Trust, a Delaware statutory trust (the “Trust”) organized on July 17, 2014. The Trust is registered under the Investment Company Act of 1940, as amended (the “1940 Act”), as an open-end management investment company. Each Fund is an investment company and accordingly follows the investment company accounting and reporting guidance of the Financial Accounting Standards Board (FASB) Accounting Standard Codification Topic 946 Financial Services-Investment Companies. Each Fund’s investment objective is long-term capital appreciation. The Trust may issue an unlimited number of interests (or shares) of beneficial interest, each with a par value of $0.001. The Smead Value Fund currently offers ten classes of shares: Investor Class, Class A, Class C, Class I1, Class I2, Class R1, Class R2, Class R3, Class R4 and Class Y shares; provided however Class I2, Class R3 and Class R4 shares are not currently available for purchase. The Smead International Value Fund currently offers six classes of shares: Investor Class, Class A, Class C, Class I1, Class I2 and Class Y shares; provided however the Class I2 shares are not currently available for purchase. Each class of shares of the Funds has identical rights and privileges except with respect to the distribution and shareholder servicing fees, and voting rights on matters affecting a single class of shares. The classes differ principally in their respective distribution and shareholder servicing expenses. Costs incurred by the Funds in connection with the organization, registration and the initial public offering of shares were paid by Smead Capital Management, Inc., the Funds’ investment adviser (the “Adviser”).
The Smead International Value Fund succeeded to substantially all of the assets and liabilities of the Smead International Value Fund LP, a Delaware Limited Partnership, in exchange solely for Class I1 shares of the Fund on January 11, 2022 (the “Reorganization”).
In January 2022, the partners of the Smead International Value Fund, L.P. (the “International Partnership”) approved the conversion of the International Partnership into the Smead International Value Fund effective January 12, 2022. The Smead International Value Fund is a successor to the International Partnership and has substantially the same investment objectives and strategies as did the International Partnership. The conversion was accomplished through a tax-free exchange of 163,932 shares of Smead International Value Fund, for the value of $8,170,405. The investment portfolio of International Partnership with a fair value of $8,056,631, identified cost of $4,908,647 and unrealized appreciation of $3,147,984 at January 11, 2022, was the principal asset acquired by Smead International Value Fund. For financial reporting purposes, assets received and shares issued by Smead International Value Fund were recorded at fair value. However, the cost basis of the investments received from International Partnership was carried forward to align ongoing reporting of Smead International Value Fund’s realized and unrealized gains and losses with amounts distributable to shareholders for tax purposes.
34
Table of Contents
SMEAD FUNDS
Notes to Financial Statements (Continued)
November 30, 2023
| (2) | Significant Accounting Policies |
The following is a summary of significant accounting policies consistently followed by the Funds in the preparation of the financial statements. These policies are in conformity with accounting principles generally accepted in the United States of America (“GAAP”).
| (a) | Investment Valuation |
The Funds value their investments at fair value. Each security owned by the Funds that is listed on a securities exchange is valued at its last sale price on that exchange on the date as of which assets are valued. When the security is listed on more than one exchange, the Funds will use the price of the exchange that the Funds generally consider to be the principal exchange on which the security is traded.
Fund securities listed on The NASDAQ Stock Market, Inc. (“NASDAQ”) will be valued at the NASDAQ Official Closing Price (“NOCP”), which may not necessarily represent the last sale price. If the NOCP is not available, such securities shall be valued at the last sale price on the day of valuation. If there has been no sale on such exchange or on NASDAQ on such day, the security is valued at the mean between the most recent bid and asked prices on such day. Over-the-counter securities that are not traded on NASDAQ shall be valued at the most recent trade price. Listed securities for which market quotations are readily available are valued at the closing prices as determined by the primary exchange where the securities are traded. Unlisted securities or listed securities for which the latest sales prices are not readily available are valued at the closing bid (long positions) or ask (short positions) price in the principal market where such securities are normally traded. Investments in other open-end investment companies are valued at their reported NAV per share. In each of these situations, valuations are typically categorized as Level 1 in the fair value hierarchy.
Debt securities, other than short-term instruments, are valued at the mean between the closing bid and asked prices provided by a pricing service (“Pricing Service”). If the closing bid and asked prices are not readily available, the Pricing Service may provide a price determined by matrix pricing or other analytical pricing models. Short-term debt securities, such as commercial paper, bankers’ acceptances and U.S. Treasury bills having a maturity of less than 60 days, are valued at amortized cost, which approximates fair value. If a short-term debt security has a maturity of greater than 60 days, it is valued at market price.
Redeemable securities issued by open-end, registered investment companies, including money market funds, are valued at the net asset value (“NAV”) of such companies for purchase and/or redemption orders placed on that day.
In the absence of prices from a Pricing Service or in the event that market quotations are not readily available, fair value will be determined under the Funds’ valuation policies and procedures adopted pursuant to Rule 2a-5 of the 1940 act. These fair value pricing procedures will also be used to price a security when corporate events, events in the securities market or world events cause the Adviser to believe that a security’s last sale price may not reflect its actual fair market value. The intended effect of using fair value pricing procedures is to ensure that a Fund’s shares are accurately priced. Pursuant to these procedures, the Board of Trustees has appointed the Adviser as the Funds’
35
Table of Contents
SMEAD FUNDS
Notes to Financial Statements (Continued)
November 30, 2023
valuation designee (the “Valuation Designee”) to perform all fair valuations of the Funds’ portfolio investments, subject to the Board of Trustees’ oversight. As the Valuation Designee, the Adviser has established a valuation committee (the “Valuation Committee”) to fulfill its responsibilities as Valuation Designee. When fair value pricing is employed, the prices of securities used by a Fund to calculate its NAV may differ from quoted or published prices for the same securities. In accordance with procedures adopted by the Trust’s Board of Trustees, fair value pricing may be used if events materially affecting the value of foreign equity securities occur between the time the exchange on which they are traded closes and the time the Funds’ NAVs are calculated. The Funds use a systematic valuation model, provided daily by an independent third party, to fair value their international equity securities. These valuations are considered as Level 2 in the fair value hierarchy. Due to the subjective and variable nature of fair value pricing, it is possible that the fair value determined for a particular security may be materially different (higher or lower) from the price of the security quoted or published by others or the value when trading resumes or is realized upon sale. Therefore, if a shareholder purchases or redeems Fund shares when the Fund holds securities priced at a fair value, the number of shares purchased or redeemed may be higher or lower than would be the case if the Fund were using market value pricing.
The Funds’ fair value procedures include fair valuation accounting standards that establish an authoritative definition of fair value and set out a hierarchy for measuring fair value. These standards require additional disclosures about the various inputs used to develop the measurements of fair value. These inputs are summarized in the three broad levels listed below:
Level 1—unadjusted quoted prices in active markets for identical securities.
Level 2—other significant observable inputs (including unadjusted quoted prices for similar securities, interest rates, prepayment speeds, credit risk, etc.).
Level 3—significant unobservable inputs (including a Fund’s own assumptions in determining the fair value of investments).
The inputs or methodology used for valuing securities are not necessarily an indication of the risk associated with investing in those securities. The following table summarizes
36
Table of Contents
SMEAD FUNDS
Notes to Financial Statements (Continued)
November 30, 2023
the valuation inputs of each Fund’s investments by each fair value hierarchy level as of November 30, 2023:
Level 1 | Level 2 | Level 3 | Total | |||||||||||||
Smead Value Fund | ||||||||||||||||
Equity(1) | ||||||||||||||||
Common Stocks | $ | 4,432,952,826 | $ | — | $— | $ | 4,432,952,826 | |||||||||
|
|
|
|
|
|
|
| |||||||||
Total Equity | 4,432,952,826 | — | — | 4,432,952,826 | ||||||||||||
Short-Term Investments | — | 143,975,555 | — | 143,975,555 | ||||||||||||
|
|
|
|
|
|
|
| |||||||||
Total Investments on Securities | $ | 4,432,952,826 | $ | 143,975,555 | $— | $ | 4,576,928,381 | |||||||||
|
|
|
|
|
|
|
| |||||||||
Level 1 | Level 2 | Level 3 | Total | |||||||||||||
Smead International Value Fund | ||||||||||||||||
Equity(1) | ||||||||||||||||
Common Stocks | $ | 37,996,618 | $ | 51,002,684 | $— | $ | 88,999,302 | |||||||||
Preferred Stocks | — | 8,172,335 | — | 8,172,335 | ||||||||||||
Warrants | 7,363,543 | — | — | 7,363,543 | ||||||||||||
|
|
|
|
|
|
|
| |||||||||
Total Equity | 45,360,161 | 59,175,019 | — | 104,535,180 | ||||||||||||
Short-Term Investments | — | 2,200,752 | — | 2,200,752 | ||||||||||||
|
|
|
|
|
|
|
| |||||||||
Total Investments on Securities | $ | 45,360,161 | $ | 61,375,771 | $— | $ | 106,735,932 | |||||||||
|
|
|
|
|
|
|
| |||||||||
| (1) | See the Schedules of Investments for industry classification. |
No Level 3 securities were held in the Funds at November 30, 2023. For the year ended November 30, 2023, there were no transfers into or out of Level 3 for the Funds. The Funds did not hold financial derivative instruments during the fiscal year.
| (b) | Share Valuation |
The NAV per share of each class is calculated by dividing the sum of the value of the securities held by the class, plus cash and other assets, minus all liabilities (including estimated accrued expenses), by the total number of shares outstanding for the class rounded to the nearest cent. The class’ shares will not be priced on the days on which the New York Stock Exchange is closed for trading.
| (c) | Use of Estimates |
The preparation of financial statements in conformity with GAAP requires management to make estimates and assumptions that affect the reported amounts of assets and liabilities and disclosure of contingent assets and liabilities at the date of the
37
Table of Contents
SMEAD FUNDS
Notes to Financial Statements (Continued)
November 30, 2023
financial statements and the reported amounts of increases and decreases in net assets from operations during the reporting period. Actual results could differ from those estimates.
| (d) | Allocation of Income, Expenses and Gains/Losses |
Income, expenses (other than those deemed attributable to a specific share class, such as distribution and shareholder servicing fees), and gains and losses of the Funds are allocated daily to each class of shares based upon the ratio of net assets represented by each class as a percentage of the net assets of the Funds. Expenses deemed directly attributable to a class of shares are recorded by the specific class. Most Fund expenses are allocated by class based on relative net assets.
| (e) | Federal Income Taxes |
The Funds comply with the requirements of Subchapter M of the Internal Revenue Code of 1986, as amended, necessary to qualify as regulated investment companies and make the requisite distributions of income and capital gains to their shareholders sufficient to relieve them from all or substantially all federal income taxes. Therefore, no federal income tax provision has been provided.
As of and during the fiscal year ended November 30, 2023, the Funds did not have a liability for any unrecognized tax benefits. The Funds recognize interest and penalties, if any, related to unrecognized tax benefits as income tax expense in the statements of operations. During the fiscal year ended November 30, 2023, the Funds did not incur any interest or penalties.
As of November 30, 2023, the components of distributable earnings on a tax basis were as follows:
| Smead Value Fund | Smead International Value Fund | |||||||
Cost basis of investments for federal income tax purposes | $ | 4,072,350,249 | $ | 97,022,068 | ||||
|
|
|
| |||||
Gross tax unrealized appreciation | 660,323,993 | 20,283,877 | ||||||
Gross tax unrealized depreciation | (155,745,861 | ) | (10,567,802 | ) | ||||
|
|
|
| |||||
Net tax unrealized appreciation | $ | 504,578,132 | $ | 9,716,075 | ||||
|
|
|
| |||||
Undistributed ordinary income | $ | 69,340,116 | $ | 2,202,948 | ||||
Undistributed long-term capital gain | — | — | ||||||
|
|
|
| |||||
Total distributable earnings | $ | 69,340,116 | $ | 2,202,948 | ||||
|
|
|
| |||||
Other accumulated losses | (1,027,568 | ) | (4,329,175 | )(1) | ||||
|
|
|
| |||||
Total accumulated gains | $ | 572,890,680 | $ | 7,589,848 | ||||
|
|
|
| |||||
38
Table of Contents
SMEAD FUNDS
Notes to Financial Statements (Continued)
November 30, 2023
| (1) | Other accumulated losses disclosed above pertains to Capital Loss Carryforwards, of which none was utilized in the current year. The character of the Capital Loss Carryforwards is $3,591,125 of short-term and $738,050 of long-term which is carried forward indefinitely. |
The tax basis of investments for tax and financial reporting purposes differs principally due to the deferral of losses on wash sales.
| (f) | Distributions to Shareholders |
The Funds will distribute any net investment income and any net realized long or short-term capital gains at least annually. Distributions from net realized gains for book purposes may include short-term capital gains. All short-term capital gains are included in ordinary income for tax purposes. Distributions to shareholders are recorded on the ex-dividend date. The Funds may also pay a special distribution at the end of the calendar year to comply with federal tax requirements. Income and capital gains distributions may differ from GAAP, primarily due to timing differences in the recognition of income, gains and losses by the Funds. GAAP requires that certain components of net assets relating to permanent differences be reclassified between the components of net assets. These reclassifications have no effect on net assets or net asset value per share. For the fiscal year ended November 30, 2023, reclassifications were made for equalization utilized and redemption in kinds.
Fund Name | Total Distributable Earnings (Loss) | Paid-in Capital | ||||||
Smead Value Fund | $(154,056,112) | $ | 154,056,112 | |||||
Smead International | $— | $— | ||||||
Value Fund | ||||||||
The tax character of distributions paid during the fiscal years ended November 30, 2023 and November 30, 2022 was as follows:
Smead Value Fund | November 30, 2023 | November 30, 2022 | ||||||
|
|
|
| |||||
Ordinary Income | $ | 47,139,436 | $ | 14,553,327 | ||||
Long-Term Capital Gain | $ | 42,905,031 | $ | 114,901,132 | ||||
Smead International Value Fund | November 30, 2023 | November 30, 2022 | ||||||
Ordinary Income | $ | 1,067,385 | $— | |||||
Long-Term Capital Gain | $ | — | $— | |||||
On December 15, 2023, the Funds declared and paid distributions from ordinary income and long-term capital gains to shareholders of record on December 13, 2023.
39
Table of Contents
SMEAD FUNDS
Notes to Financial Statements (Continued)
November 30, 2023
| (g) | Other |
Investment transactions are recorded on the trade date. The Funds determine the gain or loss from investment transactions based on specific identification using the first in, first out method. Dividend income, less foreign withholding tax, is recognized on the ex-dividend date and interest income is recognized on an accrual basis. Withholding taxes on foreign dividends have been provided for in accordance with the Funds’ understanding of the applicable country’s tax rules and rates.
There was a proxy vote for each Fund during the year ended November 30, 2023. This resulted in $529,358 in expense for the Smead Value Fund and $11,907 for the Smead International Value Fund. These expenses are recognized as Other expenses on the statements of operations.
| (h) | Foreign Currency Translation |
The books and records of the Funds are maintained in U.S. dollars. Investment securities and other assets and liabilities denominated in a foreign currency are translated into U.S. dollars on the date of valuation. The Funds do not isolate that portion of realized or unrealized gains and losses resulting from changes in the foreign exchange rate from fluctuations arising from changes in the market prices of the securities. These gains and losses are included in net realized and unrealized gains (losses) on investments on the Statements of Operations.
Net realized and unrealized gains (losses) on foreign currency transactions represent net foreign exchange gains or losses from disposition of foreign currencies, currency gains or losses realized between trade and settlement dates on securities transactions and the difference between the amount of the investment income and foreign withholding taxes recorded on the Funds’ books and the U.S. dollar equivalent amounts actually received or paid.
| (i) | Indemnifications |
Under the Trust’s organizational documents, its officers and trustees are indemnified against certain liabilities arising out of the performance of their duties to the Funds. In addition, in the normal course of business, the Funds enter into contracts that provide general indemnifications to other parties. The Funds’ maximum exposure under these arrangements is unknown as this would involve future claims that may bemade against the Funds that have not yet occurred. However, the Funds have not had prior claims or losses pursuant to these contracts and expects the risk of loss to be remote.
| (3) | Investment Adviser |
The Funds have an Investment Advisory Agreement (the “Agreement”) with the Adviser to furnish investment management services to the Funds. Under the terms of the Agreement, each Fund compensates the Adviser for its investment management services at the annual rate of 0.75% of the Fund’s average daily net assets. This fee is accrued daily and paid monthly.
The Adviser has contractually agreed to waive its management fee and/or reimburse each Fund’s other expenses (the “Expense Limitation Caps”) at least through March 31,
40
Table of Contents
SMEAD FUNDS
Notes to Financial Statements (Continued)
November 30, 2023
2024 to the extent necessary to ensure that the Fund’s operating expenses do not exceed 1.26%, 1.26%, 1.84%, 0.99%, 1.59%, 1.44% and 0.84% of the Fund’s average daily net assets for the Investor Class, Class A, Class C, Class I1, Class R1, Class R2 and Class Y shares for the Smead Value Fund and 1.25%, 1.42%, 2.00%, 1.15%, 1.10% and 1.00% of the Fund’s average daily net assets for the Investor Class, Class A, Class C, Class I1, Class I2 and Class Y shares for the Smead International Value Fund, respectively. Any such waiver or reimbursement is subject to later adjustment to allow the Adviser to recoup amounts waived or reimbursed to the extent actual fees and expenses for a fiscal period (taking into account the reimbursement) does not exceed the Expense Limitation Caps in place at the time of waiver; provided, however, that the Adviser shall only be entitled to recoup such amounts over the following three fiscal years. For the year ended November 30, 2023, the Adviser waived expenses of $221,965. The following table shows the waived or reimbursed expenses subject to potential recovery expiring on November 30:
Year incurred | Expiration Year | Smead Value Fund | Smead International Value Fund | ||||||||||||
2021 | 2024 | $ | — | $ | — | ||||||||||
2022 | 2025 | — | 33,480 | ||||||||||||
2023 | 2026 | — | 221,965 | ||||||||||||
For the year ended November 30, 2023, the Adviser did not recoup any previously waived fees and expenses from the Funds.
| (4) | Distribution Plan and Shareholder Servicing Plan |
The Funds have adopted a plan pursuant to Rule 12b-1 (the “12b-1 Plan”), which authorizes them to pay UMB Distribution Services, LLC, the Funds’ principal distributor (the “Distributor”), a fee for the Smead Value Fund at an annual rate of 0.25% of the Fund’s average daily net assets of Investor Class and Class A shares, 0.75% of the Fund’s average daily net assets of Class C shares, and 0.50% of the Fund’s average daily net assets of Class R1 and Class R2 shares for services to prospective Fund shareholders and distribution of Fund shares of the Smead Value Fund. There is no 12b-1 fee for Class I1 and Class Y shares of the Smead Value Fund. Under the 12b-1 Plan, the Smead International Value Fund pays a fee at the annual rate of 0.25% of the Fund’s average daily net assets of Investor Class and Class A shares and 0.75% of the Fund’s average daily net assets of Class C shares services to prospective Fund shareholders and distribution of Fund shares of the Smead International Value Fund. There are no 12b-1 fees for Class I1, Class I2 and Class Y shares of the Smead International Value Fund. The following table details the 12b-1 Plan fees paid for the year ended November 30, 2023:
41
Table of Contents
SMEAD FUNDS
Notes to Financial Statements (Continued)
November 30, 2023
Smead Value Fund | ||||
Investor Class | $ | 248,684 | ||
Class A | 1,022,767 | |||
Class C | 338,690 | |||
Class I1 | — | |||
Class R1 | 1,016 | |||
Class R2 | 448 | |||
Class Y | — | |||
Smead International Value Fund | ||||
Investor Class | $ 104 | |||
Class A | 10,978 | |||
Class C | 2,237 | |||
Class I1 | — | |||
Class Y | — | |||
As of November 30, 2023, the Smead Value Fund and Smead International Value Fund owed the Distributor fees pursuant to the 12b-1 Plans, in the amounts of $133,381 and $1,212, respectively.
The Funds have also adopted a separate shareholder servicing plan (the “Shareholder Servicing Plan”). The Shareholder Servicing Plan also authorizes payment of a shareholder servicing fee to financial intermediaries and other service providers up to 0.25% of the average daily net assets attributable to the Class A shares, Class C shares, Investor Class shares, Class I1 shares, Class I2 shares, Class R1 shares and Class R2 shares, respectively (this fee is referred to as the “Shareholder Servicing Fee”). However, as of November 30, 2023, these Shareholder Servicing Fees were expensed at the following rates for the Smead Value Fund: 0.13% for the Investor Class, 0.09% for the Class A shares, 0.25% for the Class C shares, 0.09% for the Class I1shares, 0.04% for the Class R1 shares, and 0.10% for the Class R2 shares. There is no Shareholder Servicing Fee for Class Y of the Smead Value Fund. The Shareholder Servicing Fees were expensed at the following rates for the Smead International Value Fund: 0.16% for the Class A shares, 0.15% for the Class C shares, 0.10% for the Class I1 shares and 0.10% for the Class I2 shares. There is no Shareholder Servicing Fee for the Investor Class and Class Y of the Smead International Value Fund. For those share classes that currently charge less than the maximum Shareholder Servicing Fee permitted under the Shareholder Servicing Plan, the Funds may increase such fee, but not beyond the maximum of 0.25%, only after providing affected shareholders with 30 days’ prior written notice. The following table details the Shareholder Servicing Fees paid for the year ended November 30, 2023:
42
Table of Contents
SMEAD FUNDS
Notes to Financial Statements (Continued)
November 30, 2023
Smead Value Fund | ||||
Investor Class | $ | 125,688 | ||
Class A | 371,263 | |||
Class C | 112,897 | |||
Class I1 | 3,198,442 | |||
Class R1 | 87 | |||
Class R2 | 90 | |||
Class Y | — | |||
Smead International Value Fund | ||||
Investor Class | $ — | |||
Class A | 7,087 | |||
Class C | 438 | |||
Class I1 | 48,836 | |||
Class Y | — | |||
| (5) | Accounting, Custody, Administration and Transfer Agent Fees |
The Northern Trust Company (the “Administrator”) acts as administrator for the Funds. The Administrator prepares various federal and state regulatory filings; prepares reports and materials to be supplied to the Trustees; monitors the activities of the Funds’ custodian and accountant; coordinates the preparation and payment of Fund expenses; and reviews the Funds’ expense accruals. For these services, each Fund pays the Administrator a fee accrued daily and paid monthly based on the Fund’s average daily net assets. The Funds may also reimburse the Administrator for out-of-pocket expenses incurred by the Administrator in the performance of its duties. The amounts paid directly to the Administrator by the Funds for administrative services are included in the administration fees in the Statements of Operations. The Administrator waived the minimum balance fee for the Smead International Value Fund the first 6 months of the fiscal year ended November 30, 2023. The waived fees for the Smead International Value Fund for the year ended November 30, 2023 were $25,000.
UMB Fund Services, Inc. (“UMB”) is the Funds’ transfer and dividend disbursing agent. UMB receives a fee that is accrued daily and paid monthly at an annual rate based on the average daily net assets of each Fund, and is reimbursed for certain out-of-pocket expenses.
43
Table of Contents
SMEAD FUNDS
Notes to Financial Statements (Continued)
November 30, 2023
| (6) | Capital Share Transactions |
Transactions in shares of the Funds were as follows:
Smead Value Fund
For The Year Ended November 30, 2023 | For The Year Ended November 30, 2022 | |||||||||||||||
|
|
|
| |||||||||||||
| Shares | Amount | Shares | Amount | |||||||||||||
|
|
|
|
|
|
|
| |||||||||
Proceeds from shares sold | ||||||||||||||||
Investor Class | 60,316 | $ | 4,090,486 | 99,745 | $ | 6,794,192 | ||||||||||
Class A | 2,396,234 | 160,819,878 | 3,992,778 | 267,269,120 | ||||||||||||
Class C | 259,405 | 16,990,282 | 411,277 | 26,868,991 | ||||||||||||
Class I1 | 18,986,199 | 1,292,260,486 | 25,895,502 | 1,749,633,388 | ||||||||||||
Class R1 | 57 | 3,745 | 1,066 | 71,379 | ||||||||||||
Class R2 | 3,056 | 209,407 | 498 | 33,958 | ||||||||||||
Class Y | 6,329,960 | 417,968,040 | 9,249,855 | 643,381,810 | ||||||||||||
Issued in reinvestment of dividends and distributions | ||||||||||||||||
Investor Class | 24,597 | 1,640,895 | 58,748 | 3,986,070 | ||||||||||||
Class A | 90,677 | 5,990,929 | 129,616 | 8,715,869 | ||||||||||||
Class C | 6,248 | 403,907 | 6,377 | 420,517 | ||||||||||||
Class I1 | 813,408 | 54,197,383 | 1,045,630 | 70,872,795 | ||||||||||||
Class R1 | — | — | — | — | ||||||||||||
Class R2 | 3 | 166 | 3 | 204 | ||||||||||||
Class Y | 73,549 | 4,906,479 | 69,867 | 4,741,905 | ||||||||||||
Payments for shares redeemed | ||||||||||||||||
Investor Class | (207,933) | (14,054,508 | ) | (220,825) | (14,844,231 | ) | ||||||||||
Class A | (2,531,635) | (170,055,102 | ) | (2,000,190) | (130,436,680 | ) | ||||||||||
Class C | (137,121) | (8,883,649 | ) | (62,159) | (3,861,718 | ) | ||||||||||
Class I1 | (17,990,640) | (1,217,450,187 | ) | (11,785,775) | (782,476,775 | ) | ||||||||||
Class R1 | (986) | (64,777 | ) | (92) | (6,272 | ) | ||||||||||
Class R2 | (1) | (37 | ) | (817) | (55,890 | ) | ||||||||||
Class Y | (6,325,698) | (416,806,554 | ) | (7,268,942) | (510,291,747 | ) | ||||||||||
|
|
|
|
|
|
|
| |||||||||
Total increase in net assets from capital share transations | 1,849,695 | $ | 132,167,269 | 19,622,162 | $ | 1,340,816,885 | ||||||||||
|
|
|
|
|
|
|
| |||||||||
44
Table of Contents
SMEAD FUNDS
Notes to Financial Statements (Continued)
November 30, 2023
Smead International Value Fund
For The Year Ended November 30, 2023 | For The Period Ended November 30, 20221 | |||||||||||||||
|
|
|
| |||||||||||||
| Shares | Amount | Shares | Amount | |||||||||||||
|
|
|
|
|
|
|
| |||||||||
Proceeds from shares sold | ||||||||||||||||
Investor Class | 877 | $ | 44,900 | 378 | $ | 16,233 | ||||||||||
Class A | 52,917 | 2,660,393 | 66,640 | 3,288,896 | ||||||||||||
Class C | 13,534 | 669,000 | 2,244 | 108,017 | ||||||||||||
Class I1 | 478,060 | 24,944,947 | 842,878 | 42,253,670 | ||||||||||||
Class Y | 146,104 | 7,512,721 | 683,082 | 34,296,415 | ||||||||||||
Issued in reinvestment of dividends and distributions | ||||||||||||||||
Investor Class | 5 | 255 | — | — | ||||||||||||
Class A | 677 | 31,070 | — | — | ||||||||||||
Class C | 68 | 2,992 | — | — | ||||||||||||
Class I1 | 11,567 | 541,661 | — | — | ||||||||||||
Class Y | 9,805 | 463,569 | — | — | ||||||||||||
Payments for shares redeemed | ||||||||||||||||
Class A | (10,676) | (534,020) | (13,304) | (641,752) | ||||||||||||
Class C | (10,147) | (475,744) | — | — | ||||||||||||
Class I1 | (116,550) | (6,016,733) | (60,690) | (2,893,374) | ||||||||||||
Class Y | (72,265) | (3,670,228) | (28,025) | (1,356,509) | ||||||||||||
|
|
|
|
|
|
|
| |||||||||
Total increase in net assets from capital share transations | 503,976 | $ | 26,174,783 | 1,493,203 | $ | 71,923,612 | ||||||||||
|
|
|
|
|
|
|
| |||||||||
| 1 | Period from January 12, 2022, date operations commenced, through November 30, 2022. |
| (7) | Investment Transactions |
The aggregate purchases and sales of securities, excluding short-term investments, for the Smead Value Fund for the year ended November 30, 2023 were $1,076,470,076 and $681,183,310, respectively. The aggregate purchases and sales of securities, excluding short-term investments, for the Smead International Value Fund for the year ended November 30, 2023 were $36,665,020 and $7,376,939, respectively. There were no purchases or sales of U.S. government securities for the Funds.
| (8) | Beneficial Ownership |
The beneficial ownership, either directly or indirectly, of more than 25% of the voting securities of a fund creates a presumption of control of the fund, under Section 2(a)(9) of the 1940 Act. As of November 30, 2023, the record holder information for Smead Value Fund and Smead International Fund was as follows:
45
Table of Contents
SMEAD FUNDS
Notes to Financial Statements (Continued)
November 30, 2023
| Percentage | ||||
Smead Value Fund | ||||
National Financial Services LLC, | ||||
Investor Class | 51.37% | |||
Class I1 | 26.14% | |||
Class Y | 35.41% | |||
Wells Fargo Clearing Services LLC, | ||||
Class C | 49.70% | |||
Merrill Lynch Pierce Fenner & Smith, | ||||
Class C | 26.55% | |||
Class R1 | 100.00% | |||
Class R2 | 94.12% | |||
Pershing LLC, | ||||
Class Y | 31.96% | |||
American Enterprise Investment Services, | ||||
Class A | 50.84% | |||
| Percentage | ||||
Smead International Value Fund | ||||
The Timothy A Gaar Living Trust, | ||||
Investor Class | 77.50% | |||
Charles Schwab & Company, Inc, | ||||
Class A | 80.90% | |||
Class C | 98.10% | |||
Class I1 | 64.66% | |||
National Financial Services LLC, | ||||
Class Y | 97.87% | |||
| (9) | Principal Risks |
General Investment Risks
An investment in the Funds represents an indirect investment in the assets owned by the Funds. As with any mutual fund, the value of the assets owned by the Funds may move up or down, and as a result, an investment in the Funds at any point in time may be worth more or less than the original amount invested.
Each Fund’s transactions in listed securities are settled/paid for upon delivery to or from their counterparties; therefore, the risk of counterparty default for listed securities is considered minimal, as delivery of securities sold is only made once the Funds have received payment. Payment is made on a purchase once the securities have been delivered by the counterparty. The trade will fail if either party fails to meet its obligations.
46
Table of Contents
SMEAD FUNDS
Notes to Financial Statements (Continued)
November 30, 2023
Market and Regulatory Risks
Events in the financial markets and economy may cause volatility and uncertainty and affect the Funds’ performance. Market events may affect a single issuer, industry, sector, or the market as a whole. In addition, because of interdependencies between markets, events in one market may adversely impact other markets or issuers in which the Funds invest in unforeseen ways. Traditionally liquid investments may experience periods of diminished liquidity. During a general downturn in the financial markets, multiple asset classes may decline in value and the Funds may lose value, regardless of the individual results of the securities and other instruments in which the Funds invest. Governmental and regulatory actions, including tax law changes and actions by the Federal Reserve, may also impair Fund management and have unexpected or adverse consequences on particular markets, strategies, or investments. Future market or regulatory events may impact the Funds in unforeseen ways, such as causing the Funds to alter their existing strategies or potentially, to liquidate and close.
Management Risk
The Adviser’s investment strategies for the Funds may not result in an increase in the value of your investment or in overall performance equal to other investments.
Non-Diversification Risk
Each Fund may invest a large percentage of its assets in securities issued by or representing a small number of issuers. As a result, the Fund’s performance may depend on the performance of a small number of issuers.
Equity Investments Risks
Stock markets are volatile. Equity investments tend to go up or down in value, sometimes rapidly and unpredictably, in response to many factors, including a company’s historical and prospective earnings, the value of its assets, general economic conditions, interest rates, investor perceptions, and market liquidity. Due to the complexities of markets, events in one market or sector may adversely impact other markets or sectors.
| (10) | Subsequent Event |
Management has evaluated the possibility of subsequent events through the date of issuance and determined that there are no material events that would require adjustment to or disclosure in the Funds’ financial statements.
47
Table of Contents

REPORT OF INDEPENDENT REGISTERED PUBLIC ACCOUNTING FIRM
To the Shareholders and Board of Trustees of
Smead Funds Trust
Opinion on the Financial Statements
We have audited the accompanying statements of assets and liabilities, including the schedules of investments, of Smead Funds Trust comprising the funds listed below (the “Funds”) as of November 30, 2023, the related statements of operations, the statements of changes in net assets, the related notes, and the financial highlights for each of the periods indicated below (collectively referred to as the “financial statements”). In our opinion, the financial statements present fairly, in all material respects, the financial position of each of the Funds as of November 30, 2023, the results of their operations, the changes in net assets, and the financial highlights for each of the periods indicated below in conformity with accounting principles generally accepted in the United States of America.
| Fund Name | Statements of Operations | Statements of Changes in Net Assets | Financial Highlights | |||
Smead Value Fund | For the year ended November 30, 2023 | For the years ended November 30, 2023 and 2022 | For the years ended November 30, 2023, 2022, 2021, 2020, and 2019 | |||
Smead International Value Fund | For the year ended November 30, 2023 | For the year ended November 30, 2023 and for the period from January 12, 2022 (commencement of operations) through November 30, 2022 | ||||
Basis for Opinion
These financial statements are the responsibility of the Funds’ management. Our responsibility is to express an opinion on the Funds’ financial statements based on our audits. We are a public accounting firm registered with the Public Company Accounting Oversight Board (United States) (“PCAOB”) and are required to be independent with respect to the Funds in accordance with the U.S. federal securities laws and the applicable rules and regulations of the Securities and Exchange Commission and the PCAOB.
We conducted our audits in accordance with the standards of the PCAOB. Those standards require that we plan and perform the audit to obtain reasonable assurance about whether the financial statements are free of material misstatement whether due to error or fraud.
C O H E N & C O M P A N Y, L T D.
800.229.1099 | 866.818.4538FAX | cohencpa.com
Registered with the Public Company Accounting Oversight Board
48
Table of Contents
Our audits included performing procedures to assess the risks of material misstatement of the financial statements, whether due to error or fraud, and performing procedures that respond to those risks. Such procedures included examining, on a test basis, evidence regarding the amounts and disclosures in the financial statements. Our procedures included confirmation of securities owned as of November 30, 2023, by correspondence with the custodians and brokers. Our audits also included evaluating the accounting principles used and significant estimates made by management, as well as evaluating the overall presentation of the financial statements. We believe that our audits provide a reasonable basis for our opinion.
We have served as the Funds’ auditor since 2007.

COHEN & COMPANY, LTD.
Cleveland, Ohio
January 29, 2024
49
Table of Contents
Basis for Trustees’ Approval of Investment Advisory Agreement
(Unaudited)
The Board of Trustees (the “Board” or the “Trustees”) of Smead Funds Trust (the “Trust”) met on August 9, 2023 to consider the renewal of the Investment Advisory Agreement (the “Agreement”) between the Trust, on behalf of the Smead Value Fund (the “Value Fund”) and the Smead International Value Fund (the “International Value Fund”), each a series of the Trust, and Smead Capital Management, Inc., the Funds’ investment adviser (the “Adviser”). Prior to this meeting, the Independent Trustees (defined below) requested and received materials to assist them in considering the renewal of the Agreement. The materials provided contained information with respect to the factors enumerated below, including a copy of the Agreement, a memorandum prepared by legal counsel to the Trust and the Independent Trustees discussing in detail the Trustees’ fiduciary obligations and the factors they should assess in considering the renewal of the Agreement, detailed comparative performance and fee information prepared by an independent consulting firm, due diligence materials relating to the Adviser (including the Adviser’s response to the Independent Trustees’ request for information, the Adviser’s Form ADV and select financial statements of the Adviser) and other pertinent information. Based on their evaluation of the information provided by the Adviser, in conjunction with the Funds’ other service providers, the Trustees, by a unanimous vote (including a separate vote of the Trustees who are not “interested persons,” as that term is defined in the Investment Company Act of 1940, as amended (the “Independent Trustees”)), approved the renewal of the Agreement for an additional one-year term.
DISCUSSION OF FACTORS CONSIDERED
In considering the renewal of the Agreement and reaching their conclusions, the Board reviewed and analyzed various factors that they determined were relevant, including the factors enumerated below.
| 1. | NATURE, EXTENT AND QUALITY OF SERVICES |
The Independent Trustees reviewed and considered the nature, extent and quality of the services provided by the Adviser and expected that they would continue to be of high quality. They noted that the Adviser’s history, experience and reputation were exceptional. The Independent Trustees considered the experience and qualifications of the personnel at the Adviser who were responsible for providing services to the Funds and the compensation structure of the Adviser. The Independent Trustees also considered the resources, policies, procedures and infrastructure of the Adviser devoted to ensuring compliance with applicable laws and regulations, as well as the Adviser’s commitment to those programs, including the Adviser’s use of third-party compliance and cybersecurity providers to support the Adviser’s own compliance efforts. The Independent Trustees noted that there were currently no known pending regulatory actions by the Securities and Exchange Commission (the “SEC”) or other regulatory agencies involving the Adviser, the Trust, the International Value Fund or the Value Fund. The Independent Trustees concluded that the Adviser’s key personnel had sufficient expertise necessary to continue to serve as investment adviser to each of the Funds and that the nature, overall quality and extent of the management services were satisfactory and reliable.
50
Table of Contents
SMEAD FUNDS
Basis for Trustees’ Approval of Investment Advisory Agreement (Continued)
(Unaudited)
| 2. | INVESTMENT PERFORMANCE |
The Independent Trustees then considered the performance of each Fund. As part of its evaluation, the Independent Trustees reviewed a report prepared by an independent consulting firm, Broadridge (the “Broadridge Report”). It was noted that, for the Value Fund, the Broadridge Report was prepared using the same methodology that the Board relied on in previous years. Although the Value Fund changed its Morningstar category from “large blend” to “large value” in January 2018, Broadridge continued to use both categories for category and peer selection with an emphasis on both institutional and no-load retail share classes that have no Rule 12b-1 fee and share a high concentration, low turnover, value-oriented strategy. It was noted that, for the International Value Fund, Broadridge used Morningstar “foreign large blend” and “foreign large value” categories with an emphasis on those funds that share a high concentration, low turnover, value-oriented strategy. The Broadridge Report included comparative information on each share class of each Fund, but designated the share class with the most assets, each Fund’s I1 Class shares, as the primary share class for each Fund’s analysis. Further, the Broadridge Report used peer groups that were smaller than in previous years’ reports to underline the high concentration and low turnover that the Funds exhibit. Using this framework, Broadridge compared each Fund’s performance to: (i) certain funds determined by Broadridge to be comparable based on investment style, expense structure and asset size (the “Morningstar Performance Peer Group”), (ii) funds included in each Fund’s respective Morningstar categories (the “Morningstar Categories”), and (iii) each Fund’s benchmark index.
The Independent Trustees examined the performance of the Value Fund, focusing on the Value Fund’s I1 Class, for the 1-year, 3-year, 5-year and 10-year periods ended June 30, 2023 and noted that the Value Fund ranked 4th out of 10 funds, 2nd out of 10 funds, 1st out of 10 funds and 1st out of 6 funds, respectively, in the Morningstar Performance Peer Group, putting the Value Fund in the second quartile for the 1-year period and the top quartile for each of the remaining periods. For the same periods, the Value Fund ranked 237th out of 551 funds, 14th out of 512 funds, 41st out of 488 funds, and 80th out of 351 funds, respectively, in the Morningstar Category, putting the Value Fund in the second quartile for the 1-year period and the top quartile for each of the remaining periods.
The Independent Trustees noted that the Value Fund outperformed its primary benchmark, the S&P 500 Index, for the 3-year and 5-year periods, but underperformed its primary benchmark for the 1-year and 10-year periods ended June 30, 2023. The Independent Trustees also examined the performance of the International Value Fund, focusing on the International Value Fund’s I1 Class, for the 1-year, 3-year and 5-year periods ended June 30, 2023 and noted that the International Value Fund ranked 8th out of 8 funds, 1st out of 8 funds and 1st out of 6 funds, respectively, in the Morningstar Performance Peer Group, putting the International Value Fund in the fourth quartile for the 1-year period and in the top quartile for each of the remaining periods. For the same periods, the International Value Fund ranked 203rd out of 265 funds, 2nd out of 239 funds, and 2nd out of 218 funds, respectively, in the Morningstar Category, putting the International Value Fund in the fourth quartile for the 1-year period and the top quartile for each of the remaining periods. The Independent Trustees noted that the International
51
Table of Contents
SMEAD FUNDS
Basis for Trustees’ Approval of Investment Advisory Agreement (Continued)
(Unaudited)
Value Fund underperformed its primary benchmark, the MSCI EAFE NR USD, for the 1-year period, but outperformed its primary benchmark for the 3- and 5-year periods ended June 30, 2023.
The Independent Trustees concluded that the performance obtained by the Adviser for each Fund was very good from a long-term perspective and that the Adviser had represented that each Fund’s short-term underperformance was in line with expectations for the market environment. Although past performance is not a guarantee or indication of future results, the Independent Trustees determined that each Fund and its respective shareholders were likely to benefit from the Adviser’s continued management.
| 3. | COST OF SERVICES PROVIDED AND PROFITS REALIZED BY THE ADVISER |
The Independent Trustees considered the advisory fee rate charged by the Adviser to each Fund and each Fund’s overall net expenses (by share class), taking into consideration the expense limitation agreement between the Trust and the Adviser. The Independent Trustees discussed Broadridge’s advisory fee analysis which showed that, at June 30, 2023 asset levels, the Value Fund’s advisory fee of 0.75% and the International Value Fund’s advisory fee of 0.75% fell within the fourth quartile and third quartile of the respective Morningstar Category as compared to each Fund’s respective Morningstar Performance Peer Group and Morningstar Category medians. They also discussed Broadridge’s net expense analysis, which showed that, as of June 30, 2023: (i) the Value Fund’s net expenses of 0.93% for the I1 Class exceeded the Morningstar Performance Peer Group and Morningstar Category medians by 24 and 23 basis points, respectively, placing the Value Fund in the fourth quartile; and (ii) the International Value Fund’s net expenses of 1.23% for the I1 Class exceeded the Morningstar Performance Peer Group and Morningstar Category medians by 33 and 38 basis points, respectively, placing the International Value Fund in the fourth quartile. As it relates to the Adviser’s advisory fee for each Fund, the Independent Trustees noted that while the fee is above the median of each Fund’s respective Morningstar Performance Peer Group and Morningstar Category, each Fund’s long-term performance has been very good. They also noted that the advisory fee charged to the Funds is lower than the advisory fee charged to the Adviser’s separately managed accounts using the same investment strategies as the Funds. As it relates to each Fund’s overall net expenses, they noted that the current expense limitation structure would remain in effect for each Fund until at least March 31, 2024. The Independent Trustees discussed at length with the Adviser whether certain share classes of each Fund could be combined, or whether a lower Rule 12b-1 fee was possible, and concluded that neither option was appropriate at this time given the Funds’ distribution channels.
The Board also reviewed the Adviser’s 2022 profitability analysis reports and the Adviser’s most recent audited financial statements, which cover the twelve months ended December 31, 2021. The Adviser explained that once the audited financial statements for fiscal 2022 are available, the Adviser will share them with the Independent Trustees, noting that the Adviser’s financial condition has remained stable from year to year.
52
Table of Contents
SMEAD FUNDS
Basis for Trustees’ Approval of Investment Advisory Agreement (Continued)
(Unaudited)
The Independent Trustees concluded that each Fund’s expenses and advisory fees paid to the Adviser were fair and reasonable in light of the comparative performance, expense and advisory fee information. The Independent Trustees further concluded that the Adviser’s profits in connection with the management of each Fund were not excessive and that the Adviser maintained adequate profit levels to support its services to each Fund.
| 4. | EXTENT OF ECONOMIES OF SCALE |
The Independent Trustees compared each Fund’s expenses relative to its respective Morningstar Performance Peer Group and its respective Morningstar Category and discussed realized and potential economies of scale. The Independent Trustees noted that, although the Funds did not have advisory fee breakpoints, the Adviser had contractually agreed to limit the expenses of each share class of each Fund so that each share class does not exceed its operating expense limitation. The Independent Trustees discussed the possibility of including breakpoints in the investment advisory fee and considered the Adviser’s thoughts on this subject. After further discussion, the Independent Trustees concluded that the current fee structure was reasonable.
| 5. | INDIRECT BENEFITS REALIZED BY THE ADVISER |
The Independent Trustees considered the direct and indirect benefits that have been and may continue to be realized by the Adviser from its association with each Fund. The Independent Trustees concluded that the benefits the Adviser received, such as greater name recognition, growth in separate account management services and increased ability to obtain research or brokerage services through the use of soft dollars, appeared to be reasonable, and in many cases benefited the Funds through growth in assets. With regard to soft dollars, it was noted that the Funds, as the Adviser’s largest clients, generate the most soft dollars for the Adviser, which are then used to service all of the Adviser’s client accounts, including those that do not pay any soft dollars.
CONCLUSIONS
On the basis of the foregoing and without assigning particular weight to any single conclusion, the Independent Trustees determined to recommend the renewal of the Agreement to the full Board.
53
Table of Contents
Notice of Privacy Policies and Practices
We collect non-public personal information about you from the following sources:
| • | information we receive about you on applications or other forms; |
| • | information you give us orally; and |
| • | information about your transactions with us or others. |
We do not disclose any non-public personal information about our shareholders or former shareholders without the shareholder’s authorization, except as permitted by law or in response to inquiries from governmental authorities. We may share information with affiliated parties and unaffiliated third parties with whom we have contracts for servicing the Funds. We will provide unaffiliated third parties with only the information necessary to carry out their assigned responsibility. All shareholder records will be disposed of in accordance with applicable law. We maintain physical, electronic and procedural safeguards to protect your non-public personal information and require third parties to treat your non-public personal information with the same high degree of confidentiality. In the event that you hold shares of the Funds through a financial intermediary, including, but not limited to, a broker-dealer, bank or trust company, the privacy policy of your financial intermediary would govern how your non-public personal information would be shared with unaffiliated third parties.
54
Table of Contents
Additional Information
(Unaudited)
Tax Information
For the year ended November 30, 2023, 100% of dividends paid from net ordinary income qualified for the dividends received deduction available to corporate shareholders of the Smead Value Fund. 6.27% of dividends paid from net ordinary income qualified for the dividends received deduction available to corporate shareholders of the Smead International Value Fund.
Statement Regarding Liquidity Risk Management Program
In accordance with Rule 22e-4 under the 1940 Act, the Trust has adopted and implemented a liquidity risk management program (the “Program”). The Program seeks to promote effective liquidity risk management for each Fund and to protect Fund shareholders from dilution of their interests. The Board of Trustees of the Trust has appointed the Adviser as the program administrator (the “Program Administrator”). The Program Administrator has further delegated administration of the Program to the Adviser’s Liquidity Risk Management Committee. The Program Administrator is required to provide an annual report to the Board regarding the adequacy and effectiveness of the Program and any material changes to the Program during the review period. The Program Administrator uses ICE Data Services (“ICE”), a third-party vendor, to provide portfolio investment classification services.
On November 7, 2023, the Board reviewed the Program Administrator’s annual written report for the period October 1, 2022 through September 30, 2023 (the “2023 Annual Report”). The 2023 Annual Report provided an assessment of each Fund’s liquidity risk, which is assessed under both normal and reasonably foreseeable stressed market conditions. For this purpose, liquidity risk is the risk that a Fund could not meet requests to redeem shares issued by the Fund without significant dilution of the remaining investors’ interests in the Fund. The 2023 Annual Report noted that following a review of liquidity reports provided by ICE, each Fund primarily held investments that were classified as “highly liquid” during the review period. As a result, and after taking into consideration each Fund’s invest strategies, cash holdings, cash flow projections, shareholder concentration and other factors deemed by the Program Administrator to be relevant to the analysis, the Program Administrator concluded that each Fund is a “primarily highly liquid fund” (as defined in the Program), which means that each Fund can continue to rely on the exclusion in Rule 22e-4 from the requirements to determine and review a highly liquid investment minimum (“HLIM”) for each Fund and to adopt policies and procedures for responding to a HLIM shortfall. The 2023 Annual Report also noted that no material changes had been made to the Program during the review period, that no changes to the Program are warranted at this time and that the Program is functioning properly.
Information about Trustees
The business and affairs of the Trust are managed under the direction of the Board of Trustees. Information pertaining to the Trustees of the Trust is set forth below. The Statement of Additional Information includes additional information about the Trustees and is available, without charge, upon request by calling 877-807-4122. This table is as of November 30, 2023.
55
Table of Contents
SMEAD FUNDS
Additional Information (Continued)
(Unaudited)
The address of each Trustee and officer is 2777 East Camelback Road, Suite 375, Phoenix, AZ 85016.
Name and Birth Year | Position(s) Held with the Trust | Term of Office and Length of Time Served | Number of Portfolios in Trust Overseen by Trustee | Principal Occupation(s) During the Past Five Years | Other Directorships Held by Trustee During the Past Five Years | |||||
Independent Trustees | ||||||||||
Gregory A. Demopulos | Trustee | Indefinite Term (since September 2014). | 2 | Chairman and CEO, Omeros Corp. (biopharmaceutical company) (since 1994). | Chairman, Omeros Corp. (since 1994). | |||||
Peter M. Musser | Trustee | Indefinite Term (since September 2014). | 2 | Principal, Angeline Properties, LLC (a private investment firm)(since 2014). | Trustee, Lawrence University (since 2012);Trustee, Berry College (since 2010). | |||||
Walter F. Walker | Trustee | Indefinite Term (since September 2014). | 2 | Principal, Hana Road Capital LLC (hedge fund) (since 2007). | Advisory Council, Stone Arch Capital (since 2005); and Independent Director, Harbor Custom Development, Inc. (real estate development company) (since 2020). | |||||
56
Table of Contents
SMEAD FUNDS
Additional Information (Continued)
(Unaudited)
Name and Birth Year | Position(s) Held with the Trust | Term of Office and Length of Time Served | Number of Portfolios in Trust Overseen by Trustee | Principal Occupation(s) During the Past Five Years | Other Directorships Held by Trustee During the Past Five Years | ||||||||
Nancy A. Zevenbergen | Trustee | Indefinite Term (since September 2014). | 2 | Principal and Chief Investment Officer, Zevenbergen Capital Investments LLC (since 1987). | Director, Seattle Pacific Foundation (since 1993); Director, Anduin Foundation (since 2010); Director, University of Washington Foster School of Business (2014-2022); and Director, evenstar3 Inc. (since 2005). | ||||||||
Interested Trustees and Officers | |||||||||||||
William W. Smead1 | Trustee and Chairman | Indefinite Term (since September 2014). | 2 | Chairman and Chief Investment Officer of the Adviser (since 2007); previously, Chief Executive Officer of the Adviser (2007-2019). | None. | ||||||||
Cole W. Smead1 | Trustee | Indefinite Term (since September 2014). | 2 | Chief Executive Officer of the Adviser (since 2022) and President of the Adviser (since 2020); previously, Managing Director of the Adviser (2007-2019). | Director and Chairman, Smead Funds S.A. (since 2015). | ||||||||
| President and Chief Executive Officer | Elected annually (since January 2016). | ||||||||||||
57
Table of Contents
SMEAD FUNDS
Additional Information (Continued)
(Unaudited)
Name and Birth Year | Position(s) Held with the Trust | Term of Office and Length of Time Served | Number of Portfolios in Trust Overseen by Trustee | Principal Occupation(s) During the Past Five Years | Other Directorships Held by Trustee During the Past Five Years | |||||
Steven J. LeMire | Chief Compliance Officer | Elected annually (since September 2014). | N/A | Chief Compliance Officer of the Adviser (since 2014). | N/A | |||||
| Treasurer, Principal Financial and Accounting Officer | Elected annually (since January 2016). | |||||||||
Heather Peterson | Secretary | Elected annually (since August 2020). | N/A | Director - Marketing & Brand Development of the Adviser (since February 2022); and Vice President - Marketing of the Adviser (January 2016 - February 2022). | N/A | |||||
| 1 | Mr. William Smead and Mr. Cole Smead are each deemed to be an “interested person” of the Funds under the 1940 Act because of their position with the Adviser. Mr. William Smead and Mr. Cole Smead are father and son, respectively. |
58
Table of Contents
SMEAD FUNDS
Additional Information (Continued)
(Unaudited)
A NOTE ON FORWARD LOOKING STATEMENTS (Unaudited)
Except for historical information contained in this report for the Funds, the matters discussed in this report may constitute forward-looking statements made pursuant to the safe-harbor provisions of the Private Securities Litigation Reform Act of 1995. These include any Adviser or portfolio manager predictions, assessments, analyses or outlooks for individual securities, industries, market sectors and/or markets. These statements involve risks and uncertainties. In addition to the general risks described for the Funds in the current Prospectus, other factors bearing on this report include the accuracy of the Adviser’s or portfolio managers’ forecasts and predictions, and the appropriateness of the investment programs designed by the Adviser or portfolio managers to implement their strategies efficiently and effectively. Any one or more of these factors, as well as other risks affecting the securities markets and investment instruments generally, could cause the actual results of the Funds to differ materially as compared to benchmarks associated with the Funds.
ADDITIONAL INFORMATION (Unaudited)
The Funds have adopted proxy voting policies and procedures that delegate to the Adviser the authority to vote proxies. A description of the Funds’ proxy voting policies and procedures is available without charge, upon request, by calling the Funds toll free at 877-807-4122. A description of these policies and procedures is also included in the Funds’ Statement of Additional Information, which is available on the SEC’s website at http://www.sec.gov.
The Funds’ proxy voting records for the most recent 12-month period ended June 30 are available without charge, upon request, by calling, toll free, 877-807-4122, or by accessing the SEC’s website at http://www.sec.gov.
The Funds file their complete schedules of portfolio holdings with the SEC for the first and third quarters of each fiscal year as an exhibit to their reports on Form N-PORT. Shareholders may view the Funds’ Form N-PORT reports on the SEC’s website at www.sec.gov.
HOUSEHOLDING (Unaudited)
In an effort to decrease costs, the Funds intend to reduce the number of duplicate prospectuses and annual and semi-annual reports you receive by sending only one copy of each to those addresses shared by two or more accounts and to shareholders the Funds reasonably believe are from the same family or household. Once implemented, if you would like to discontinue householding for your accounts, please call toll-free at 877-807-4122 to request individual copies of these documents. Once the Funds receive notice to stop householding, the Funds will begin sending individual copies 30 days after receiving your request. This policy does not apply to account statements.
59
Table of Contents
SMEAD FUNDS
Results of a Joint Special Meeting of Shareholders of SMEAD Funds Trust
(Unaudited)
At a Joint Special Meeting of Shareholders of the Funds originally scheduled for March 10, 2023 and ultimately adjourned to May 23, 2023, the Funds’ shareholders were asked to consider and act upon the following proposals (each, a “Proposal”):
| • | 1. To approve an amendment to each Fund’s fundamental investment policy regarding industry concentration; and |
| • | 2. To approve an amendment to the Trust’s Declaration of Trust to lower the quorum requirement for a shareholders’ meeting from 33-1/3% to 20%. |
At the meeting, shareholders of each Fund, voting in person or by proxy, approved Proposal 1 by the following votes:
Fund Name | For (Shares Voted / % of Voted) | Against (Shares Voted / % of Voted) | Abstain (Shares Voted / % of Voted) | Broker Non-Vote (Shares Voted / % of Voted) | ||||
Smead International Value Fund | 816,240 / 95.86% | 6,036 / 0.71% | 29,188 / 3.43% | None | ||||
Smead Value Fund | 33,571,948 / 96.76% | 509,858 / 1.47% | 614,355 / 1.77% | None | ||||
At the same meeting, the persons named as proxies on behalf of those Fund shareholders who provided voting instructions for the meeting voted to adjourn the meeting as it relates to Proposal 2 to allow time to solicit additional voting instructions from shareholders. After adjourning the meeting multiple times to permit further solicitation of proxies, at a meeting held on June 29, 2023, shareholders of each Fund, voting in person or by proxy, approved Proposal 2 by the following votes:
Fund Name | For (Shares Voted / % of Voted) | Against (Shares Voted / % of Voted) | Abstain (Shares Voted / % of Voted) | Broker Non-Vote (Shares Voted / % of Voted) | ||||
Smead International Value Fund | 856,018 / 56.58% | 24,897 / 1.65% | 16,472 / 1.09% | None | ||||
Smead Value Fund | 34,077,723 / 50.27% | 1,965,808 / 2.90% | 652,929 / 0.96% | None | ||||
60
Table of Contents
(This page intentionally left blank.)
Table of Contents
SMEAD FUNDS
Investment Adviser | Smead Capital Management, Inc. | |
2777 East Camelback Road | ||
Suite 375 | ||
Phoenix, AZ 85016 | ||
Legal Counsel | Godfrey & Kahn, S.C. | |
833 East Michigan Street | ||
Suite 1800 | ||
Milwaukee, Wisconsin 53202 | ||
Independent Registered Public Accounting Firm | Cohen & Company, Ltd. 1350 Euclid Avenue | |
Suite 800 | ||
Cleveland, Ohio 44115 | ||
Custodian, Fund Accountant and Fund Administrator | The Northern Trust Company 50 South La Salle Street | |
Chicago, IL 60603 | ||
Transfer Agent | UMB Fund Services, Inc. | |
235 W Galena Street | ||
Milwaukee, WI 53212 | ||
Distributor | UMB Distribution Services, LLC | |
235 W Galena Street | ||
Milwaukee, WI 53212 | ||
This report is intended for shareholders of the Funds and may not be used as sales literature unless preceded or accompanied by a current prospectus.
Table of Contents
| (b) | Not applicable. |
| Item 2. | Code of Ethics. |
| (a) | As of November 30, 2023, the Registrant had adopted a code of ethics, as defined in Item 2(b) of Form N-CSR, that applies to the Registrant’s principal executive officer, principal financial officer, principal accounting officer or controller, or persons performing similar functions (the “Code of Ethics”). |
| (c) | There have been no amendments to the Registrant’s Code of Ethics during the reporting period for this Form N-CSR. |
| (d) | During the period covered by the report, the Registrant did not grant any waivers to the provisions of the Code of Ethics. |
| (e) | Not applicable. |
| (f) | The Code of Ethics is included with this Form N-CSR as Exhibit 13(a)(1). |
| Item 3. | Audit Committee Financial Expert. |
| (a)(1) | The Registrant’s Board of Trustees has determined that there is at least one member who qualifies as an “Audit Committee Financial Expert” serving on its Audit Committee. |
| (a)(2) | Mr. Walter F. Walker and Mr. Peter M. Musser serve as the “Audit Committee Financial Experts” and are considered to be “Independent Trustees” as each term is defined in Item 3 of Form N-CSR. |
| Item 4. | Principal Accountant Fees and Services. |
| Fiscal Year Ended | (a) Audit Fees | (b) Audit-Related Fees | (c)1 Tax Fees | (d) All Other Fees | ||||||||||||
November 30, 2023
| ||||||||||||||||
Smead International Value Fund | $19,000 | $ | $3,000 | $ | ||||||||||||
Smead Value Fund | $19,000 | $ | $3,000 | $ | ||||||||||||
November 30, 2022 | ||||||||||||||||
Smead International Value Fund | $17,500 | $ | $3,000 | $ | ||||||||||||
Smead Value Fund | $17,500 | $ | $3,000 | $ | ||||||||||||
| 1 | The Tax Fees are the aggregate fees billed for professional services rendered by Cohen & Company, Ltd. for the review of Form 1120-RIC and Form 8613, and the review of excise tax distribution calculations. |
| (e)(1) | Audit Committee Pre-Approval Policies and Procedures. The Registrant’s Audit Committee pre-approves all audit and non-audit services to be performed by the Registrant’s accountant before the accountant is engaged by the Registrant to perform such services. |
3
Table of Contents
| (e)(2) | The percentage of services described in each of paragraphs (b) through (d) of this Item that were approved by the Audit Committee pursuant to paragraph (c)(7)(i)(C) and (c)(7)(ii) of Rule 2-01 of Regulation S-X are as follows: None. |
| (f) | Not applicable. |
| (g) | There were no non-audit fees billed by Registrant’s accountant for the Registrant’s fiscal years ended November 30, 2023 and November 30, 2022. |
| (h) | Not applicable. |
| (i) | Not applicable. |
| (j) | Not applicable. |
Item 5. Audit Committee of Listed Registrants.
Not applicable.
Item 6. Investments.
| (a) | Included as part of the Report to Shareholders under Item 1 of this Form N-CSR. |
| (b) | Not applicable. |
Item 7. Disclosure of Proxy Voting Policies and Procedures for Closed-End Management Investment Companies.
Not applicable.
Item 8. Portfolio Managers of Closed-End Management Investment Companies.
Not applicable.
Item 9. Purchases of Equity Securities by Closed-End Management Investment Company and Affiliated Purchasers.
Not applicable.
Item 10. Submission of Matters to a Vote of Security Holders.
During the period ended November 30, 2023, there were no material changes to the procedures by which shareholders may recommend nominees to the Registrant’s Board of Trustees.
Item 11. Controls and Procedures.
| (a) | The Registrant’s principal executive and principal financial officers, or persons performing similar functions, have concluded that the Registrant’s disclosure controls and procedures (as defined in Rule 30a-3(c) under the Investment Company Act of 1940 (the “Act”)) are effective, as |
4
Table of Contents
of a date within 90 days of the filing date of this Form N-CSR, based on the evaluation of these controls and procedures required by the Act and under the Securities Exchange Act of 1934. |
| (b) | There were no changes in the Registrant’s internal control over financial reporting (as defined in Rule 30a-3(d) under the Act) that occurred during the period covered by this report that have materially affected, or are reasonably likely to materially affect, the Registrant’s internal control over financial reporting. |
Item 12. Disclosure of Securities Lending Activities for Closed-End Management Investment Companies.
Not applicable.
Item 13. Exhibits.
| (a)(3) | Not applicable. |
| (a)(4) | Not applicable. |
5
Table of Contents
SIGNATURES
Pursuant to the requirements of the Securities Exchange Act of 1934 and the Investment Company Act of 1940, the Registrant has duly caused this report to be signed on its behalf by the undersigned, thereunto duly authorized.
Smead Funds Trust
By: | /s/ Cole W. Smead | |
Cole W. Smead | ||
President | ||
(Principal Executive Officer) |
Date: February 6, 2024
Pursuant to the requirements of the Securities Exchange Act of 1934 and the Investment Company Act of 1940, this report has been signed below by the following persons on behalf of the Registrant and in the capacities and on the dates indicated.
By: | /s/ Cole W. Smead | |
Cole W. Smead | ||
President | ||
(Principal Executive Officer) |
Date: February 6, 2024
By: | /s/ Steven J. LeMire | |
Steven J. LeMire | ||
Treasurer | ||
(Principal Financial Officer) |
Date: February 6, 2024