Exhibit 99.1

Investor Presentation March 2016
2 Forward Looking Statements This investor presentation contains “forward - looking statements” within the meaning of the "safe harbor" provisions of the Private S ecurities Litigation Reform Act of 1995. Forward - looking statements may be identified by the use of words such as "anticipate", "believe", "expect", "estimate", "plan", "outlook", and "project" and ot her similar expressions that predict or indicate future events or trends or that are not statements of historical matters. Such forward - looking statements include statements concerning the timing of the proposed merg er (the “Merger”) of FTS Holding Corporation (“CardConnect”) with and into a wholly - owned subsidiary of FinTech Acquisition Corp. (“FNTC”); the business plans, objectives, expectations and intentions of th e public company once the transaction is complete, and CardConnect’s estimated and future results of operations, business strategies, competitive position, industry environment and potential gro wth opportunities. These statements are based on FNTC’s or CardConnect’s management’s current expectations and beliefs, as well as a number of assumptions concerning future events. Such forward - looking statements are subject to known and unknown risks, uncertainties, assumptions and other important factors, many of which are outside FNTC’s or CardConnect’s control that could cause actual results to differ materially from the results discussed in the forward - looking statements. These risks, uncertainties, as sumptions and other important factors include, but are not limited to, (1) the occurrence of any event, change or other circumstances that could give rise to the termination of the Merger Agreement; (2) t he inability to complete the transactions contemplated by the Merger Agreement due to the failure to obtain approval of the stockholders of FNTC or other conditions to closing in the Merger Agreement; (3) th e ability of the public entity to meet NASDAQ’s listing standards following the Merger; (4) the risk that the proposed transaction disrupts current plans and operations of CardConnect as a result of the an nou ncement and consummation of the transactions described herein; (5) the ability to recognize the anticipated benefits of the proposed business combination, which may be affected by, among other things, com pet ition, the ability of the combined company to grow and manage growth profitably, maintain relationships with suppliers and retain its management and key employees; (6) costs related to the propo sed business combination; (7) changes in applicable laws or regulations; and (8) the possibility that CardConnect may be adversely affected by other economic, business, and/or competitive factors. Additional f act ors that could cause actual results to differ materially from those expressed or implied in forward - looking statements can be found in FNTC’s most recent annual report on Form 10 - K and subsequently filed quart erly reports on Form 10 - Q and current reports on Form 8 - K, which are available, free of charge, at the SEC’s website at www.sec.gov., and will also be provided in the Registration Statement and FNT C’s proxy statement/prospectus when available. You are cautioned not to place undue reliance upon any forward - looking statements, which speak only as of the date made, and FNTC and CardConnect undertake no obligation to update or revise the forward - looking statements, whether as a result of new information, future events or otherwise . Non - GAAP Financial Measures This investor presentation includes historical and projected EBITDA and Adjusted EBITDA of CardConnect, which are non - GAAP finan cial measures. EBITDA is calculated as earnings before interest and taxes plus depreciation and amortization, and Adjusted EBITDA is calculated as EBITDA plus M&A and consolidation expenses. CardCon nec t believes that these non - GAAP measures of financial results provides useful information to management and investors regarding certain financial and business trends relating to CardConnect’s fina nci al condition and results of operations. CardConnect’s management uses these non - GAAP measures to compare its performance to that of prior periods for, among other reasons, trend analyses and for budgeting and planning purposes. CardConnect believes that the use of these non - GAAP financial measures provide an additional tool for investors to use in evaluating ongoing operating results and trends an d i n comparing CardConnect’s financial measures with other peer companies, many of which present similar non - GAAP financial measures to investors. Management of CardConnect does not consider these non - GAAP me asures in isolation or as an alternative to financial measures determined in accordance with GAAP. The principal limitation of these non - GAAP financial measures is that they exclude significa nt expenses that are required by GAAP to be recorded in the Company’s financial statements. In addition, these measures are subject to inherent limitations as they reflect the exercise of judgmen t b y management about which expenses and income are excluded or included in determining these non - GAAP financial measures. You should not place undue reliance on these non - GAAP financial measures. We urge you to review CardConnect’s audited financial statements, which will be presented in FNTC’s proxy statement/prospectus to be filed with the SEC and delivered to stockholders of FNTC. Additional Information and Where to Find It In connection with the proposed Merger, FNTC intends to file with the SEC a preliminary proxy statement/prospectus (which wil l b e included in a registration statement on Form S - 4 (the “Registration Statement”)). When completed, FNTC will mail a definitive proxy statement/prospectus to its stockholders in connection with FNT C’s solicitation of proxies for the special meeting of FNTC stockholders to be held to approve the merger and related transactions. This investor presentation does not contain all the information that sho uld be considered concerning the Merger. It is not intended to provide the basis for any investment decision or any other decision in respect to the proposed merger. FNTC stockholders and other interested perso ns are advised to read, when available, FNTC’s preliminary proxy statement/prospectus, the amendments thereto, and definitive proxy statement/prospectus, as these materials will contain impo rta nt information about CardConnect, FNTC and the proposed Merger. The definitive proxy statement/prospectus will be mailed to stockholders of FNTC as of a record date to be established for voting on the Merger and related transactions. Stockholders will also be able to obtain copies of the proxy statement/prospectus and other documents filed with the SEC that will be incorporated by reference in the pr oxy statement/prospectus, without charge, once available, at the SEC's Internet site at http://www.sec.gov, or by directing a request to: FinTech Acquisition Corp., 712 Fifth Avenue, 8th Floor, New York, N ew York 10019, attention: James J. McEntee, III . Participants in the Solicitation FNTC and its directors and officers may be deemed participants in the solicitation of proxies of FNTC’s stockholders with res pec t to the approval of the Merger. Information regarding the Company’s directors and officers and a description of their interests in FNTC is contained in FNTC’s annual report on Form 10 - K for the fiscal year ended October 31, 2015, which was filed with the SEC, and will also be contained in the Registration Statement on Form S - 4 and the definitive proxy statement/prospectus for the Merger when available. Each of these documents is, or will be, available at the SEC’s website or by directing a request to the Company as described above under “Additional Information About the Transaction and Where to Find It.” Disclaimer
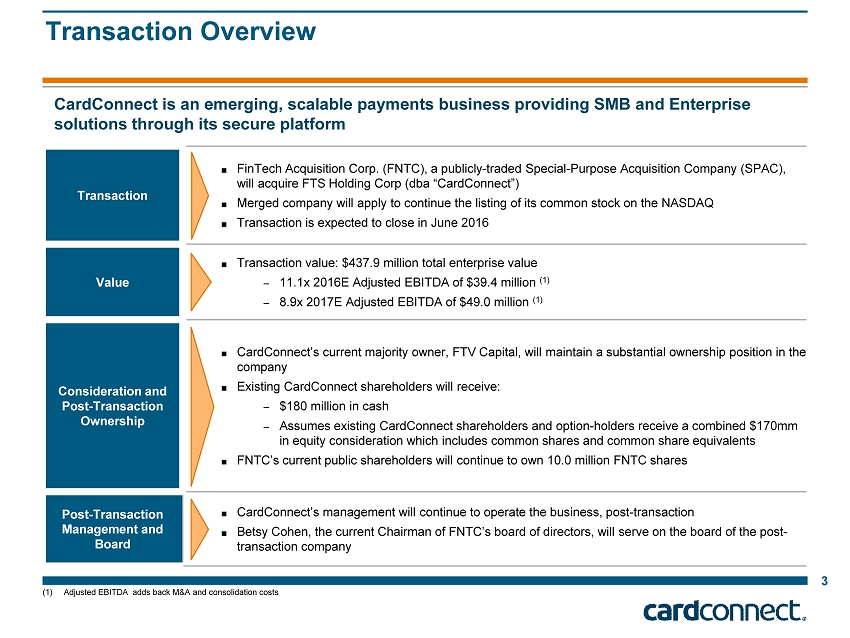
Transaction Overview Transaction ■ FinTech Acquisition Corp. (FNTC), a publicly - traded Special - Purpose Acquisition Company (SPAC), will acquire FTS Holding Corp (dba “CardConnect”) ■ Merged company will apply to continue the listing of its common stock on the NASDAQ ■ Transaction is expected to close in June 2016 Value ■ Transaction value : $437.9 million total enterprise value – 11.1x 2016E Adjusted EBITDA of $39.4 million (1) – 8.9x 2017E Adjusted EBITDA of $49.0 million (1) Consideration and Post - Transaction Ownership ■ CardConnect’s current majority owner, FTV Capital, will maintain a substantial ownership position in the company ■ Existing CardConnect shareholders will receive: – $180 million in cash – Assumes existing CardConnect shareholders and option - holders receive a combined $170mm in equity consideration which includes common shares and common share equivalents ■ FNTC’s current public shareholders will continue to own 10.0 million FNTC shares Post - Transaction Management and Board ■ CardConnect’s management will continue to operate the business, post - transaction ■ Betsy Cohen, the current Chairman of FNTC’s board of directors, will serve on the board of the post - transaction company 3 (1) Adjusted EBITDA adds back M&A and consolidation costs CardConnect is an emerging, scalable payments business providing SMB and Enterprise solutions through its secure platform
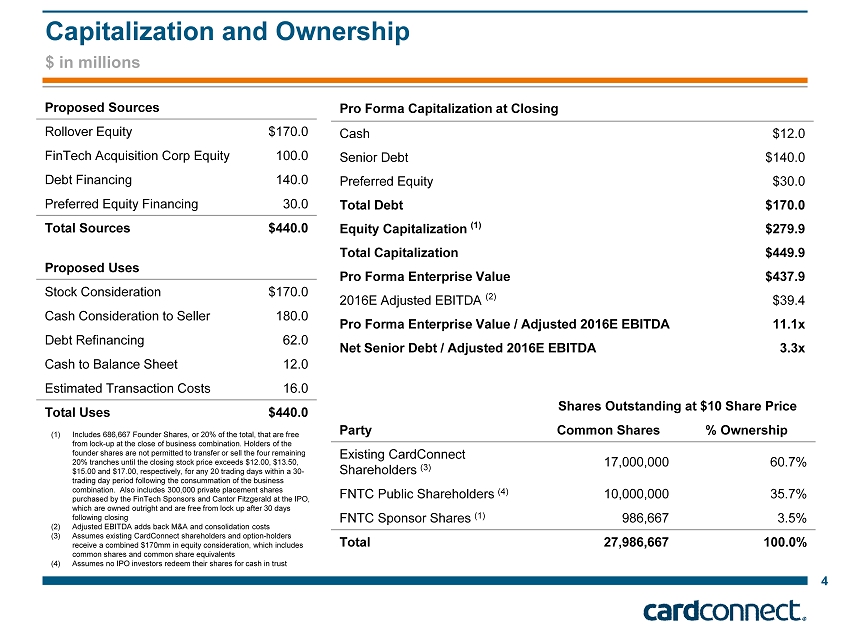
Capitalization and Ownership 4 Proposed Sources Rollover Equity $170.0 FinTech Acquisition Corp Equity 100.0 Debt Financing 140.0 Preferred Equity Financing 30.0 Total Sources $440.0 Proposed Uses Stock Consideration $170.0 Cash Consideration to Seller 180.0 Debt Refinancing 62.0 Cash to Balance Sheet 12.0 Estimated Transaction Costs 16.0 Total Uses $440.0 Shares Outstanding at $10 Share Price Party Common Shares % Ownership Existing CardConnect Shareholders (3) 17,000,000 60.7% FNTC Public Shareholders (4) 10,000,000 35.7% FNTC Sponsor Shares (1) 986,667 3.5% Total 27,986,667 100.0% Pro Forma Capitalization at Closing Cash $ 12.0 Senior Debt $140.0 Preferred Equity $30.0 Total Debt $ 170.0 Equity Capitalization (1) $279.9 Total Capitalization $ 449.9 Pro Forma Enterprise Value $ 437.9 2016E Adjusted EBITDA (2) $39.4 Pro Forma Enterprise Value / Adjusted 2016E EBITDA 11.1x Net Senior Debt / Adjusted 2016E EBITDA 3.3x (1) Includes 686,667 Founder Shares, or 20% of the total, that are free from lock - up at the close of business combination. Holders of the founder shares are not permitted to transfer or sell the four remaining 20% tranches until the closing stock price exceeds $12.00, $13.50, $15.00 and $17.00, respectively, for any 20 trading days within a 30 - trading day period following the consummation of the business combination. Also includes 300,000 private placement shares purchased by the FinTech Sponsors and Cantor Fitzgerald at the IPO, which are owned outright and are free from lock up after 30 days following closing (2) Adjusted EBITDA adds back M&A and consolidation costs (3) Assumes existing CardConnect shareholders and option - holders receive a combined $170mm in equity consideration, which includes common shares and common share equivalents (4) Assumes no IPO investors redeem their shares for cash in trust $ in millions
5 Table of Contents I. Executive Summary II. Financial Highlights A. Appendix: Products and Distribution B. Appendix: Industry Overview C. Appendix: Model Assumptions
I. Executive Summary

An emerging payments business providing SMB and Enterprise solutions through its secure platform 7 x CardConnect is a scalable, technology - focused merchant acquirer serving medium to enterprise level businesses x The CardConnect platform is differentiated by offering best - in - class web - based merchant solutions, security and ERP integration
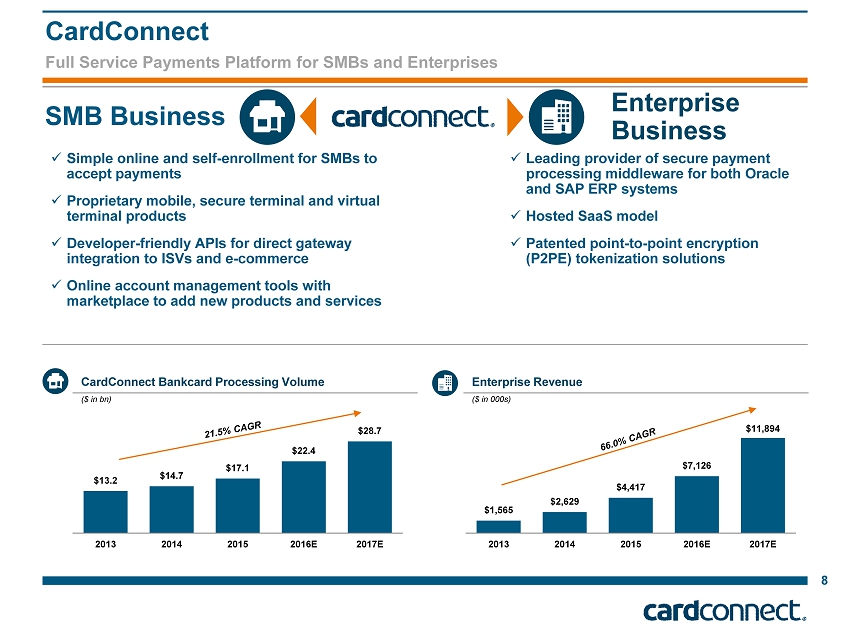
CardConnect 8 Full Service Payments Platform for SMBs and Enterprises SMB Business Enterprise Business x Simple online and self - enrollment for SMBs to accept payments x Proprietary mobile, secure terminal and virtual terminal products x Developer - friendly APIs for direct gateway integration to ISVs and e - commerce x Online account management tools with marketplace to add new products and services x Leading provider of secure payment processing middleware for both Oracle and SAP ERP systems x Hosted SaaS model x Patented point - to - point encryption (P2PE) tokenization solutions $13.2 $14.7 $17.1 $22.4 $28.7 2013 2014 2015 2016E 2017E CardConnect Bankcard Processing Volume ($ in bn) Enterprise Revenue $1,565 $2,629 $4,417 $7,126 $11,894 2013 2014 2015 2016E 2017E ($ in 000s)
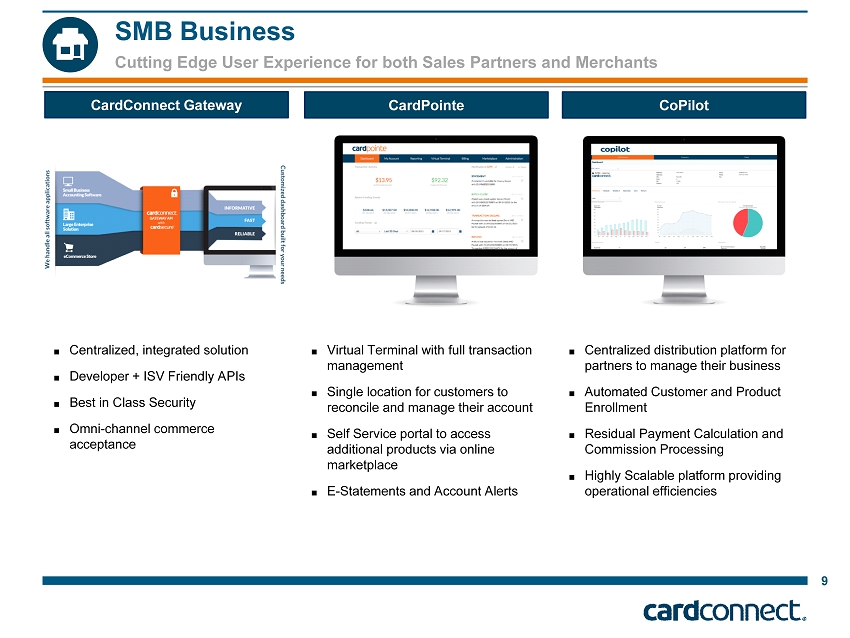
SMB Business 9 Cutting Edge User Experience for both Sales Partners and Merchants CoPilot CardPointe ■ Virtual Terminal with full transaction management ■ Single location for customers to reconcile and manage their account ■ Self Service portal to access additional products via online marketplace ■ E - Statements and Account Alerts CardConnect Gateway ■ Centralized distribution platform for partners to manage their business ■ Automated Customer and Product Enrollment ■ Residual Payment Calculation and Commission Processing ■ Highly Scalable platform providing operational efficiencies ■ Centralized, integrated solution ■ Developer + ISV Friendly APIs ■ Best in Class Security ■ Omni - channel commerce acceptance
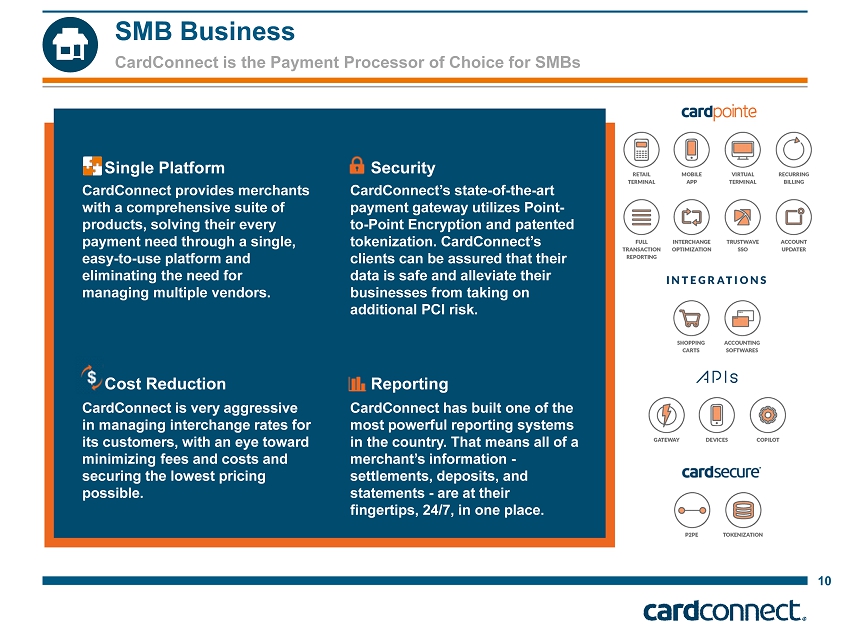
SMB Business 10 CardConnect is the Payment Processor of Choice for SMBs CardConnect provides merchants with a comprehensive suite of products, solving their every payment need through a single, easy - to - use platform and eliminating the need for managing multiple vendors. CardConnect’s state - of - the - art payment gateway utilizes Point - to - Point Encryption and patented tokenization. CardConnect’s clients can be assured that their data is safe and alleviate their businesses from taking on additional PCI risk. CardConnect is very aggressive in managing interchange rates for its customers, with an eye toward minimizing fees and costs and securing the lowest pricing possible. CardConnect has built one of the most powerful reporting systems in the country. That means all of a merchant’s information - settlements, deposits, and statements - are at their fingertips, 24/7, in one place. Single Platform Cost Reduction Security Reporting

SMB Business 11 A Platform for Continued Success High - Performing Gateway Business Continued Growth 12,164 12,384 19,292 26,441 33,427 2013 2014 2015 2016E 2017E New Merchant Production SMB Net Revenue Growth (# of annual new merchant adds) ($ in mm) $96.1 $103.2 $114.1 $145.1 $179.4 2013 2014 2015 2016E 2017E - 924 6,023 11,586 20,620 2013 2014 2015 2016E 2017E New Merchants Converted Merchants Gateway Merchant Count (# of total merchants on CardConnect Gateway) 16.9% 18.4% 17.0% 16.5% 2.8% 6.5% 8.0% 2014 2015 2016E 2017E Non-Gateway Gateway Net Volume Attrition (Net bankcard volume attrition) N/A (2) (1) 1,535 existing merchants were converted to the CardConnect Gateway in 2015 (2) Net volume attrition for Gateway is calculated based on Q4 2015 results; onboarding of merchants to the CardConnect Gateway began in Q3 2014 (1)

Enterprise Business 12 Leading Innovator In Enterprise and Security Technology Secure Enterprise Platform Enterprise Payment Gateway Oracle and SAP integrations CardSecure® Encryption and Tokenization technology Key Features
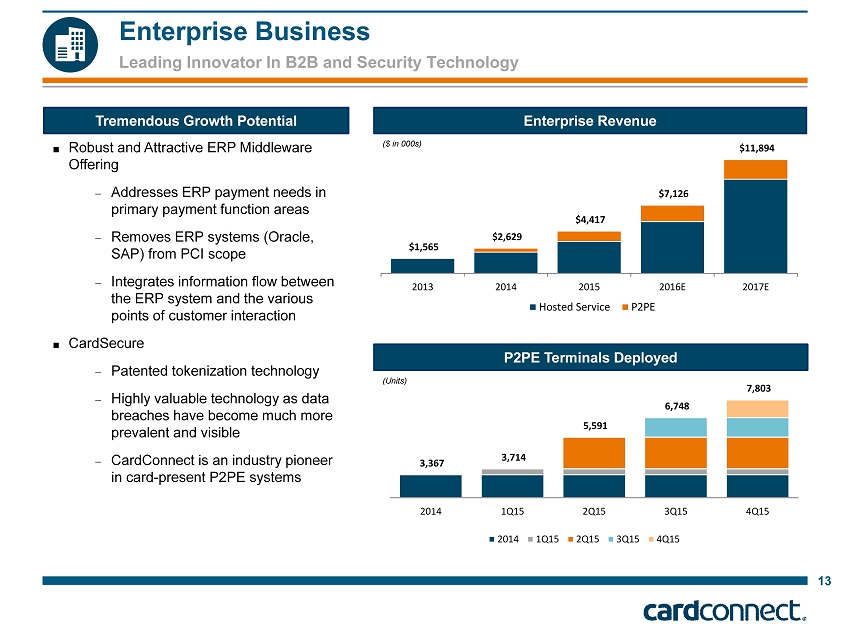
Enterprise Business 13 Leading Innovator In B2B and Security Technology Tremendous Growth Potential Enterprise Revenue ■ Robust and Attractive ERP Middleware Offering – A ddresses ERP payment needs in primary payment function areas – Removes ERP systems (Oracle, SAP) from PCI scope – Integrates information flow between the ERP system and the various points of customer interaction ■ CardSecure – Patented tokenization technology – Highly valuable technology as data breaches have become much more prevalent and visible – CardConnect is an industry pioneer in card - present P2PE systems P2PE Terminals Deployed $1,565 $2,629 $4,417 $7,126 $11,894 2013 2014 2015 2016E 2017E Hosted Service P2PE 3,367 3,714 5,591 6,748 7,803 2014 1Q15 2Q15 3Q15 4Q15 2014 1Q15 2Q15 3Q15 4Q15 ($ in 000s) (Units)
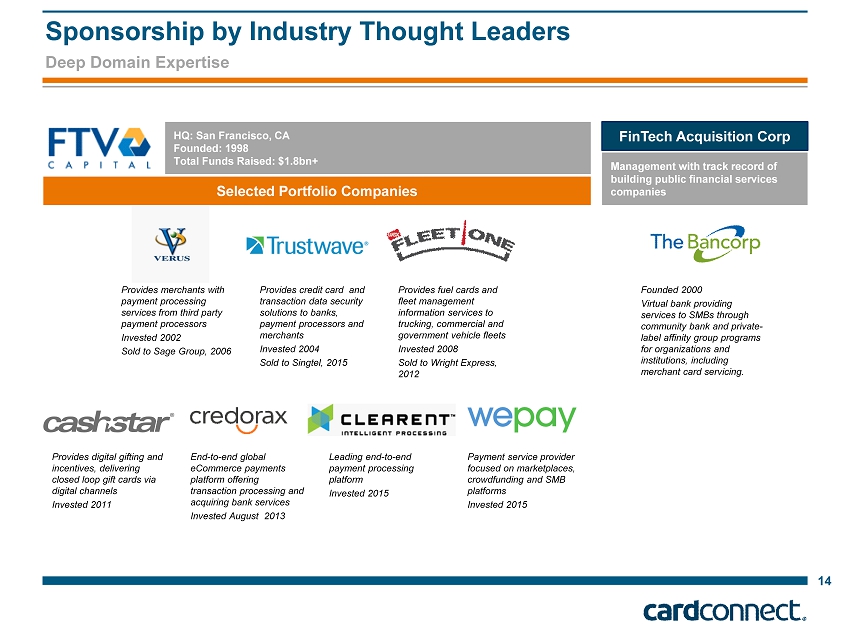
Sponsorship by Industry Thought Leaders Deep Domain Expertise FinTech Acquisition Corp Management with track record of building public financial services companies HQ: San Francisco, CA Founded: 1998 Total Funds Raised: $1.8bn+ Provides credit card and transaction data security solutions to banks, payment processors and merchants Invested 2004 Sold to Singtel, 2015 Provides fuel cards and fleet management information services to trucking, commercial and government vehicle fleets Invested 2008 Sold to Wright Express, 2012 Provides digital gifting and incentives, delivering closed loop gift cards via digital channels Invested 2011 End - to - end global eCommerce payments platform offering transaction processing and acquiring bank services Invested August 2013 Leading end - to - end payment processing platform Invested 2015 Payment service provider focused on marketplaces, crowdfunding and SMB platforms Invested 2015 Selected Portfolio Companies Founded 2000 Virtual bank providing services to SMBs through community bank and private - label affinity group programs for organizations and institutions, including merchant card servicing. 14 Provides merchants with payment processing services from third party payment processors Invested 2002 Sold to Sage Group, 2006
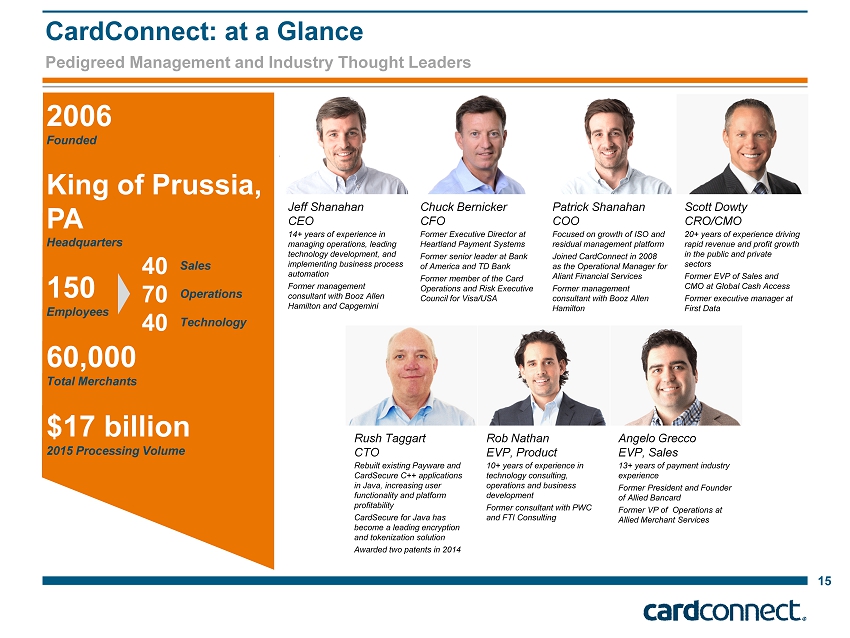
CardConnect: at a Glance 15 Pedigreed Management and Industry Thought Leaders 2006 Founded King of Prussia, PA Headquarters 150 Employees 60,000 Total Merchants $17 billion 2015 Processing Volume Jeff Shanahan CEO 14+ years of experience in managing operations, leading technology development, and implementing business process automation Former management consultant with Booz Allen Hamilton and Capgemini Chuck Bernicker CFO Former Executive Director at Heartland Payment Systems Former senior leader at Bank of America and TD Bank Former member of the Card Operations and Risk Executive Council for Visa/USA Patrick Shanahan COO Focused on growth of ISO and residual management platform Joined CardConnect in 2008 as the Operational Manager for Aliant Financial Services Former management consultant with Booz Allen Hamilton Scott Dowty CRO/CMO 20+ years of experience driving rapid revenue and profit growth in the public and private sectors Former EVP of Sales and CMO at Global Cash Access Former executive manager at First Data Rush Taggart CTO Rebuilt existing Payware and CardSecure C++ applications in Java, increasing user functionality and platform profitability CardSecure for Java has become a leading encryption and tokenization solution Awarded two patents in 2014 Rob Nathan EVP , Product 10 + years of experience in technology consulting, operations and business development Former consultant with PWC and FTI Consulting Angelo Grecco EVP , Sales 13 + years of payment industry experience Former President and Founder of Allied Bancard Former VP of Operations at Allied Merchant Services 40 70 40 Sales Operations Technology
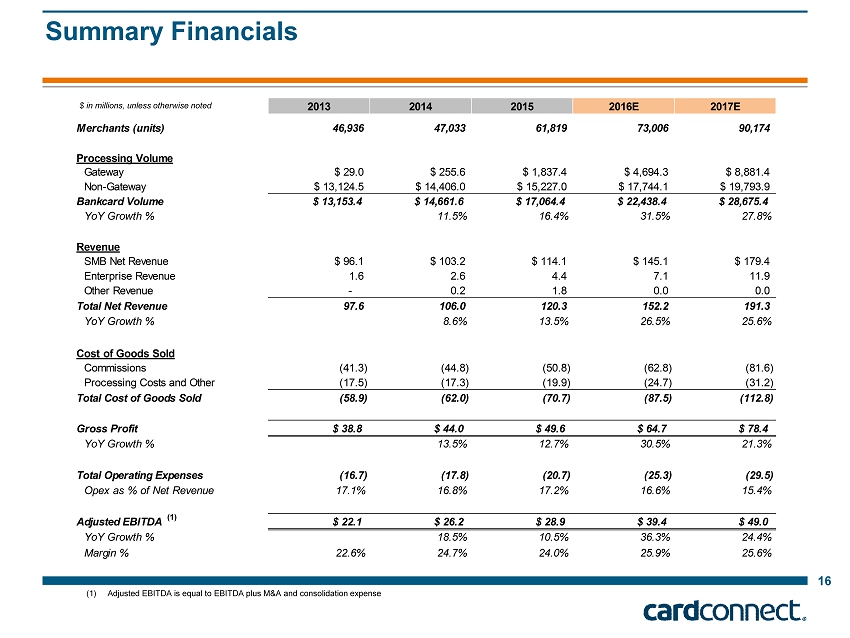
2013 2014 2015 2016E 2017E Merchants (units) 46,936 47,033 61,819 73,006 90,174 Processing Volume Gateway $ 29.0 $ 255.6 $ 1,837.4 $ 4,694.3 $ 8,881.4 Non-Gateway $ 13,124.5 $ 14,406.0 $ 15,227.0 $ 17,744.1 $ 19,793.9 Bankcard Volume $ 13,153.4 $ 14,661.6 $ 17,064.4 $ 22,438.4 $ 28,675.4 YoY Growth % 11.5% 16.4% 31.5% 27.8% Revenue SMB Net Revenue $ 96.1 $ 103.2 $ 114.1 $ 145.1 $ 179.4 Enterprise Revenue 1.6 2.6 4.4 7.1 11.9 Other Revenue - 0.2 1.8 0.0 0.0 Total Net Revenue 97.6 106.0 120.3 152.2 191.3 YoY Growth % 8.6% 13.5% 26.5% 25.6% Cost of Goods Sold Commissions (41.3) (44.8) (50.8) (62.8) (81.6) Processing Costs and Other (17.5) (17.3) (19.9) (24.7) (31.2) Total Cost of Goods Sold (58.9) (62.0) (70.7) (87.5) (112.8) Gross Profit $ 38.8 $ 44.0 $ 49.6 $ 64.7 $ 78.4 YoY Growth % 13.5% 12.7% 30.5% 21.3% Total Operating Expenses (16.7) (17.8) (20.7) (25.3) (29.5) Opex as % of Net Revenue 17.1% 16.8% 17.2% 16.6% 15.4% Adjusted EBITDA $ 22.1 $ 26.2 $ 28.9 $ 39.4 $ 49.0 YoY Growth % 18.5% 10.5% 36.3% 24.4% Margin % 22.6% 24.7% 24.0% 25.9% 25.6% 16 Summary Financials $ in millions, unless otherwise noted (1) Adjusted EBITDA is equal to EBITDA plus M&A and consolidation expense (1)
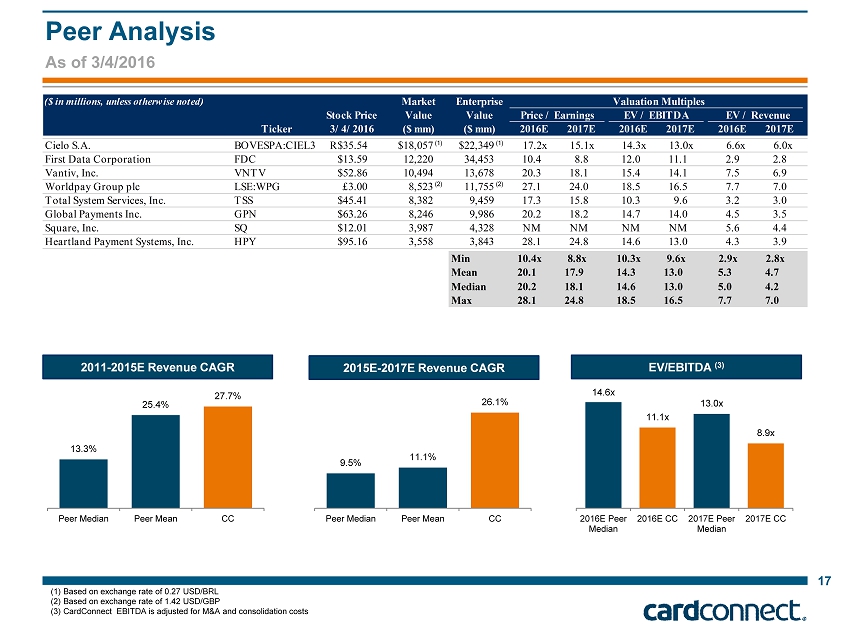
Peer Analysis 17 As of 3/4/2016 (1) Based on exchange rate of 0.27 USD/BRL (2) Based on exchange rate of 1.42 USD/GBP (3) CardConnect EBITDA is adjusted for M&A and consolidation costs (1) (1) (2) (2) 2011 - 2015E Revenue CAGR EV/EBITDA (3) 2015E - 2017E Revenue CAGR 9.5% 11.1% 26.1% Peer Median Peer Mean CC 13.3% 25.4% 27.7% Peer Median Peer Mean CC 14.6x 11.1x 13.0x 8.9x 2016E Peer Median 2016E CC 2017E Peer Median 2017E CC ($ in millions, unless otherwise noted) Market Enterprise Valuation Multiples Stock Price Value Value Price / Earnings EV / EBITDA EV / Revenue Ticker 3/4/2016 ($ mm) ($ mm) 2016E 2017E 2016E 2017E 2016E 2017E Cielo S.A. BOVESPA:CIEL3 R$35.54 $18,057 $22,349 17.2x 15.1x 14.3x 13.0x 6.6x 6.0x First Data Corporation FDC $13.59 12,220 34,453 10.4 8.8 12.0 11.1 2.9 2.8 Vantiv, Inc. VNTV $52.86 10,494 13,678 20.3 18.1 15.4 14.1 7.5 6.9 Worldpay Group plc LSE:WPG £3.00 8,523 11,755 27.1 24.0 18.5 16.5 7.7 7.0 Total System Services, Inc. TSS $45.41 8,382 9,459 17.3 15.8 10.3 9.6 3.2 3.0 Global Payments Inc. GPN $63.26 8,246 9,986 20.2 18.2 14.7 14.0 4.5 3.5 Square, Inc. SQ $12.01 3,987 4,328 NM NM NM NM 5.6 4.4 Heartland Payment Systems, Inc. HPY $95.16 3,558 3,843 28.1 24.8 14.6 13.0 4.3 3.9 Min 10.4x 8.8x 10.3x 9.6x 2.9x 2.8x Mean 20.1 17.9 14.3 13.0 5.3 4.7 Median 20.2 18.1 14.6 13.0 5.0 4.2 Max 28.1 24.8 18.5 16.5 7.7 7.0

18 Compelling Growth Opportunities Recurring / Predictable Transaction Revenue ■ Growing merchant and distribution base with accelerating net new adds ■ Consistent, highly visible path from new merchant account adds to revenue generation ■ Historically stable processing spread generates consistent gross profit Scalable Business Model Driving Favorable Margins ■ Processing platform can accommodate significant increase in merchants / transactions / volume at little to no added cost ■ COGS form the majority of expenses, with gross profit relatively stable due to fixed / pre - negotiated processing margins ■ Operating Leverage: Limited headcount / operating expense necessary to support significant increase in merchants; merchant enrollment and support teams operate very efficiently Growth in Technology Focused Businesses ■ Significant investment in enterprise solutions will continue to generate significant growth in gateway client revenue and technology revenue ■ Substantial growth forecasts derived from existing pipeline opportunities ■ Growth in technology is turbo charging the entire business, helping CardConnect add more enterprise clients and agents, etc. Proven M&A Capabilities ■ Acquirer which does not just consolidate targets, but leverages core strengths to fully integrate and expand targets’ businesses ■ Track record of effective buying and building upon target distribution networks with low merchant attrition rates ■ Ability to use publicly - traded stock as deal consideration will dramatically expand acquisition capabilities
II. Financial Highlights
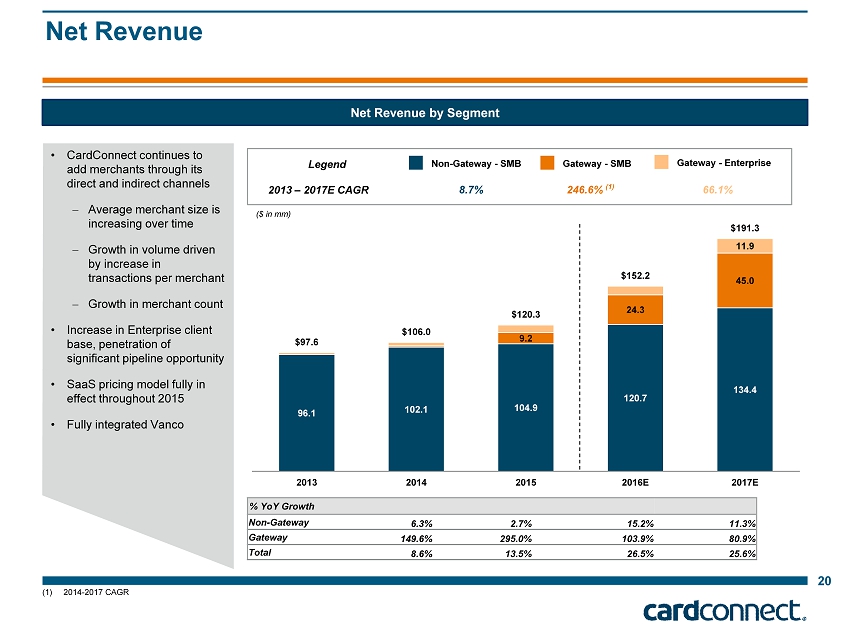
20 Net Revenue Net Revenue by Segment 96.1 102.1 104.9 120.7 134.4 9.2 24.3 45.0 11.9 $97.6 $106.0 $120.3 $152.2 $191.3 2013 2014 2015 2016E 2017E ($ in mm) % YoY Growth Non - Gateway 6.3% 2.7% 15.2 % 11.3% Gateway 149.6% 295.0% 103.9% 80.9% Total 8.6% 13.5% 26.5% 25.6% Gateway - SMB Non - Gateway - SMB Legend 2013 – 2017E CAGR 8.7% 246.6% (1) • CardConnect continues to add merchants through its direct and indirect channels – Average merchant size is increasing over time – Growth in volume driven by increase in transactions per merchant – Growth in merchant count • Increase in Enterprise client base, penetration of significant pipeline opportunity • SaaS pricing model fully in effect throughout 2015 • Fully integrated Vanco Gateway - Enterprise 66.1% (1) 2014 - 2017 CAGR
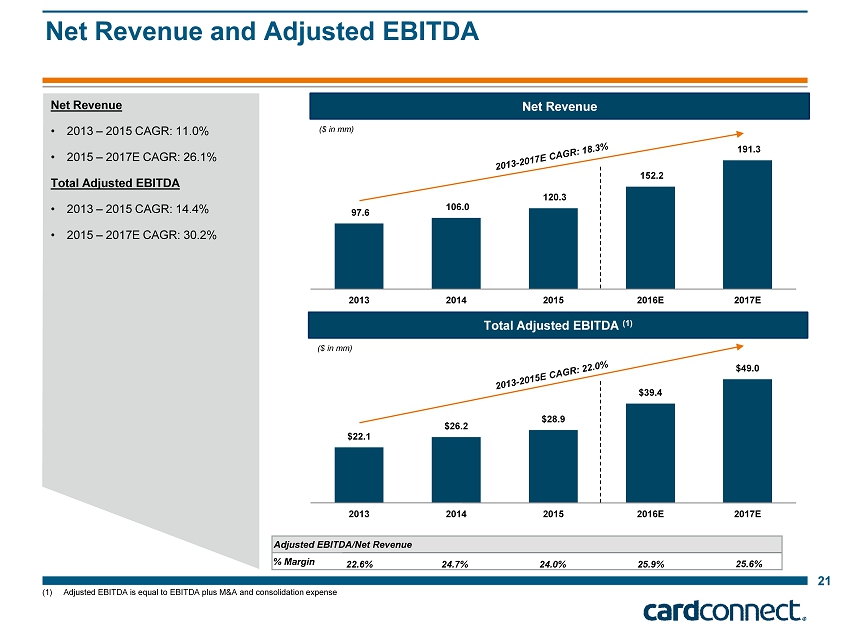
(1) Adjusted EBITDA is equal to EBITDA plus M&A and consolidation expense 21 Net Revenue and Adjusted EBITDA Total Adjusted EBITDA ( 1 ) ($ in mm) Adjusted EBITDA/Net Revenue % Margin 22.6% 24.7% 24.0% 25.9% 25.6% Net Revenue 97.6 106.0 120.3 152.2 191.3 2013 2014 2015 2016E 2017E ($ in mm) $22.1 $26.2 $28.9 $39.4 $49.0 2013 2014 2015 2016E 2017E Net Revenue • 2013 – 2015 CAGR: 11.0% • 2015 – 2017E CAGR: 26.1% Total Adjusted EBITDA • 2013 – 2015 CAGR: 14.4% • 2015 – 2017E CAGR: 30.2%
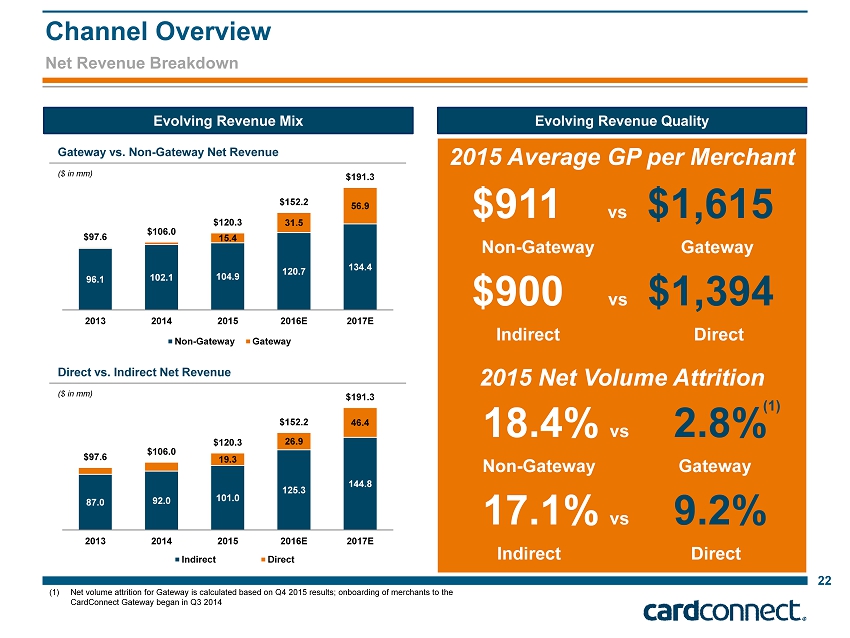
Net Revenue Breakdown Channel Overview 22 Evolving Revenue Mix Evolving Revenue Quality 96.1 102.1 104.9 120.7 134.4 15.4 31.5 56.9 $97.6 $106.0 $120.3 $152.2 $191.3 2013 2014 2015 2016E 2017E Non-Gateway Gateway Gateway vs. Non - Gateway Net Revenue ($ in mm) 87.0 92.0 101.0 125.3 144.8 19.3 26.9 46.4 $97.6 $106.0 $120.3 $152.2 $191.3 2013 2014 2015 2016E 2017E Indirect Direct Direct vs. Indirect Net Revenue ($ in mm) 2015 Average GP per Merchant 2015 Net Volume Attrition 18.4% vs 2.8% Non - Gateway Gateway 17.1% vs 9.2% Indirect Direct $911 vs $1,615 Non - Gateway Gateway $900 vs $1,394 Indirect Direct (1) (1) Net volume attrition for Gateway is calculated based on Q4 2015 results; onboarding of merchants to the CardConnect Gateway began in Q3 2014
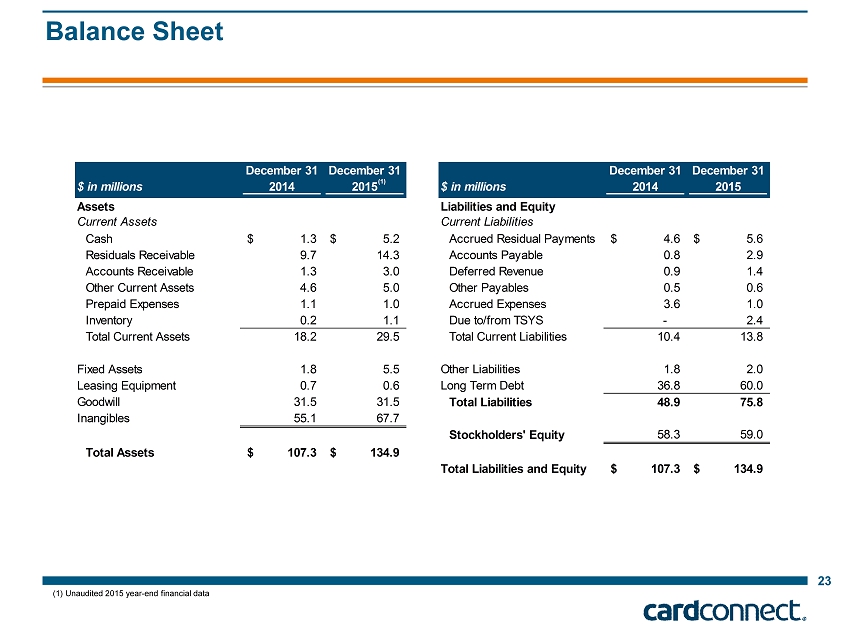
December 31 December 31 $ in millions 2014 2015 Assets Current Assets Cash 1.3$ 5.2$ Residuals Receivable 9.7 14.3 Accounts Receivable 1.3 3.0 Other Current Assets 4.6 5.0 Prepaid Expenses 1.1 1.0 Inventory 0.2 1.1 Total Current Assets 18.2 29.5 Fixed Assets 1.8 5.5 Leasing Equipment 0.7 0.6 Goodwill 31.5 31.5 Inangibles 55.1 67.7 Total Assets 107.3$ 134.9$ 23 Balance Sheet (1) Unaudited 2015 year - end financial data (1) (1) December 31 December 31 $ in millions 2014 2015 Liabilities and Equity Current Liabilities Accrued Residual Payments 4.6$ 5.6$ Accounts Payable 0.8 2.9 Deferred Revenue 0.9 1.4 Other Payables 0.5 0.6 Accrued Expenses 3.6 1.0 Due to/from TSYS - 2.4 Total Current Liabilities 10.4 13.8 Other Liabilities 1.8 2.0 Long Term Debt 36.8 60.0 Total Liabilities 48.9 75.8 Stockholders' Equity 58.3 59.0 Total Liabilities and Equity 107.3$ 134.9$
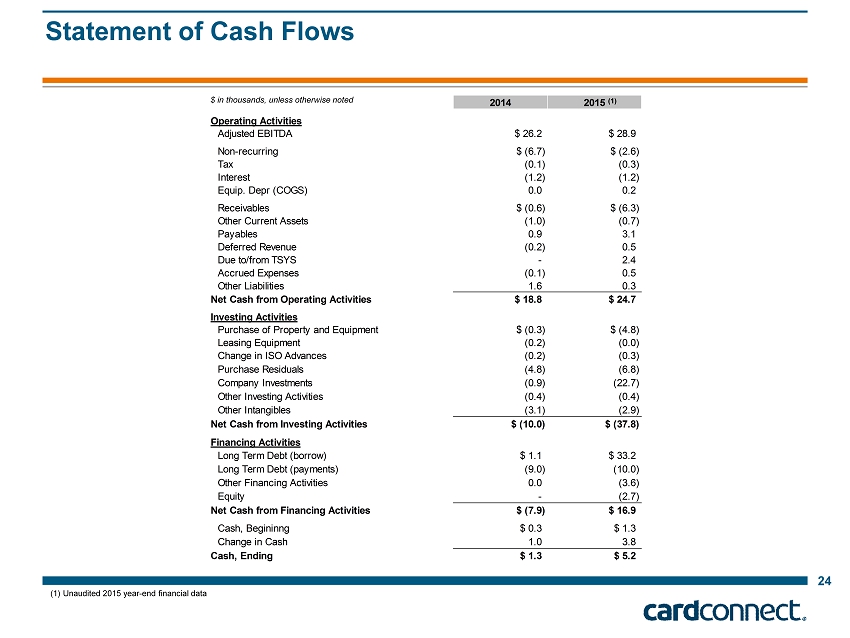
2014 2015 Operating Activities Adjusted EBITDA $ 26.2 $ 28.9 Non-recurring $ (6.7) $ (2.6) Tax (0.1) (0.3) Interest (1.2) (1.2) Equip. Depr (COGS) 0.0 0.2 Receivables $ (0.6) $ (6.3) Other Current Assets (1.0) (0.7) Payables 0.9 3.1 Deferred Revenue (0.2) 0.5 Due to/from TSYS - 2.4 Accrued Expenses (0.1) 0.5 Other Liabilities 1.6 0.3 Net Cash from Operating Activities $ 18.8 $ 24.7 Investing Activities Purchase of Property and Equipment $ (0.3) $ (4.8) Leasing Equipment (0.2) (0.0) Change in ISO Advances (0.2) (0.3) Purchase Residuals (4.8) (6.8) Company Investments (0.9) (22.7) Other Investing Activities (0.4) (0.4) Other Intangibles (3.1) (2.9) Net Cash from Investing Activities $ (10.0) $ (37.8) Financing Activities Long Term Debt (borrow) $ 1.1 $ 33.2 Long Term Debt (payments) (9.0) (10.0) Other Financing Activities 0.0 (3.6) Equity - (2.7) Net Cash from Financing Activities $ (7.9) $ 16.9 Cash, Begininng $ 0.3 $ 1.3 Change in Cash 1.0 3.8 Cash, Ending $ 1.3 $ 5.2 24 Statement of Cash Flows $ in thousands, unless otherwise noted (1) Unaudited 2015 year - end financial data (1)

A. Appendix: Products and Distribution

CardConnect Suite of Products A Full - Service Provider of Tools for Partners & Merchants 26 CoPilot ■ Digital merchant application, onboarding, risk monitoring, reporting and customer service ■ Additionally, CoPilot provides tools to agents for portfolio management, commission processing and more Portfolio Management CardPointe ■ Allows merchants to manage their account and view all payment processing data in one place with robust reporting and account alerts ■ Marketplace - self - service portal to accessing add - on features, like Virtual Terminal, ACH and Mobile Online Account Mgmt SMB Gateway & API ■ CardConnect’s Gateway API allows for seamless integration for developers ■ Virtual Terminal is an easy - to - use browser - based app for processing payments with interchange optimization, customer receipts and real - time reporting Gateway CardSecure ■ Proprietary PCI validated P2PE application ■ Offers encryption and tokenization for payments running through the Gateway ■ Merchants receive instant PCI compliance through CardConnect’s patented technology and seamless integration Security CC SAP / Oracle ■ CardConnect integrates information flow between ERP system and various points of customer interaction ■ Ensures encryption for sensitive payment data travelling externally ■ Automates the reconciliation of card - to - receipts ERP Middleware Released: June 2010 Released: July 2014 Released: July 2014 Released: February 2012 Released: Q1 1999
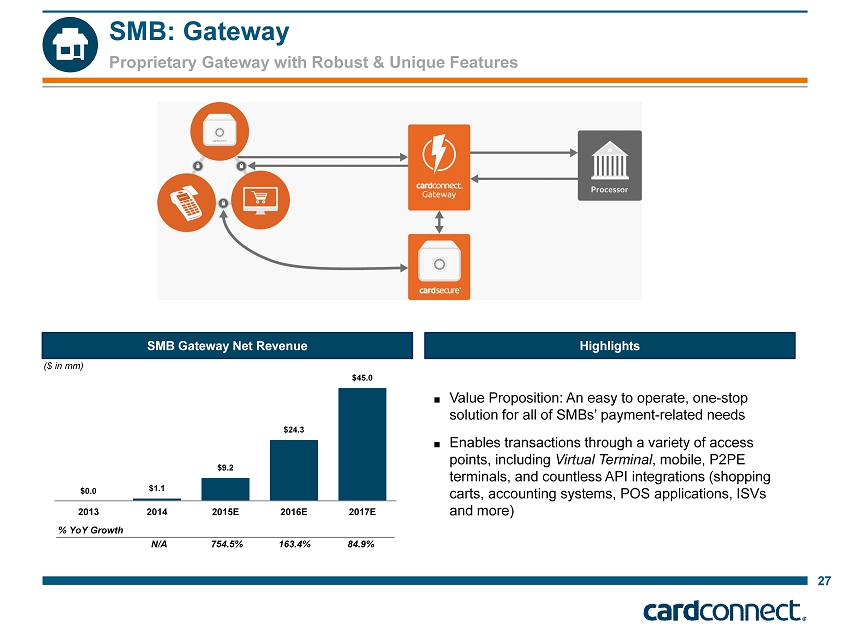
Proprietary Gateway with Robust & Unique Features SMB: Gateway 27 $0.0 $1.1 $9.2 $24.3 $45.0 2013 2014 2015E 2016E 2017E % YoY Growth N/A 754.5% 163.4% 84.9% ($ in mm) ■ Value Proposition: An easy to operate, one - stop solution for all of SMBs’ payment - related needs ■ Enables transactions through a variety of access points, including Virtual Terminal , mobile, P2PE terminals, and countless API integrations (shopping carts, accounting systems, POS applications, ISVs and more) SMB Gateway Net Revenue Highlights
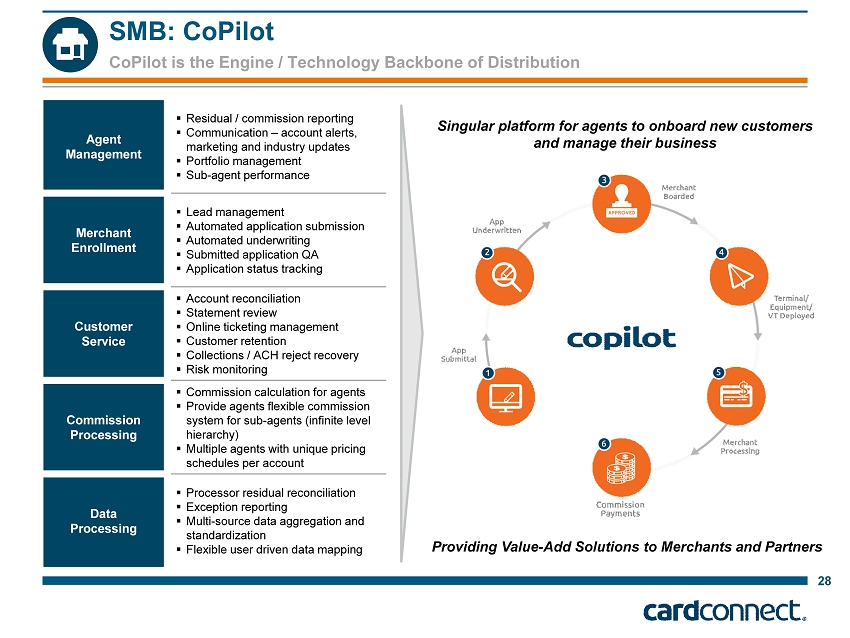
CoPilot is the Engine / Technology Backbone of Distribution 28 SMB: CoPilot Agent Management ▪ Residual / commission reporting ▪ Communication – account alerts, marketing and industry updates ▪ Portfolio management ▪ Sub - agent performance Merchant Enrollment ▪ Lead management ▪ Automated application submission ▪ Automated underwriting ▪ Submitted application QA ▪ Application status tracking Customer Service ▪ Account reconciliation ▪ Statement review ▪ Online ticketing management ▪ Customer retention ▪ Collections / ACH reject recovery ▪ Risk monitoring Commission Processing ▪ Commission calculation for agents ▪ Provide agents flexible commission system for sub - agents (infinite level hierarchy) ▪ Multiple agents with unique pricing schedules per account Data Processing ▪ Processor residual reconciliation ▪ Exception reporting ▪ Multi - source data aggregation and standardization ▪ Flexible user driven data mapping Providing Value - Add Solutions to Merchants and Partners Singular platform for agents to onboard new customers and manage their business

CardPointe Provides Additional Value - Add Functionality 29 SMB: CardPointe CardPointe Overview Today Previously ■ CardPointe is a business’s core application for managing and processing payments ■ With real - time detailed reports that track the full transaction lifecycle (from authorization to funding), along with its virtual terminal, billing plans, customer profiles and marketplace, the CardPointe is a unique tool that CardConnect clients rely on to operate their business ─ Launched : July 2014 ─ Provides single location for reporting, processing, product enrollment and account management ─ Enhanced merchant retention via product usage, product/partner marketplace and brand awareness No nexus to merchant or brand identity of CardConnect Goal is not to displace but to create additional touch points to merchant
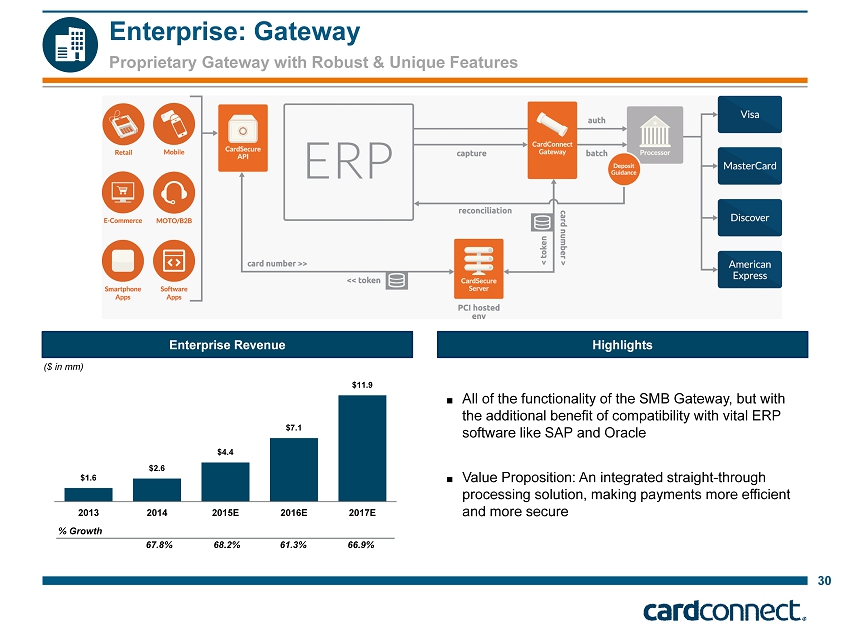
Proprietary Gateway with Robust & Unique Features Enterprise: Gateway ■ All of the functionality of the SMB Gateway, but with the additional benefit of compatibility with vital ERP software like SAP and Oracle ■ Value Proposition: An integrated straight - through processing solution, making payments more efficient and more secure $1.6 $2.6 $4.4 $7.1 $11.9 2013 2014 2015E 2016E 2017E % Growth 67.8% 68.2% 61.3% 66.9% ($ in mm) 30 Enterprise Revenue Highlights Office Visit
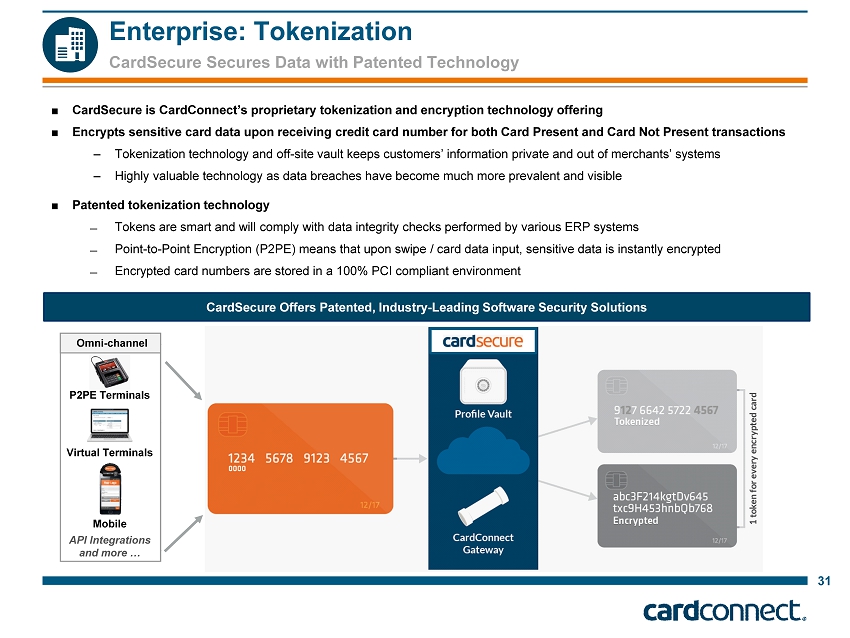
CardSecure Secures Data with Patented Technology 31 Enterprise: Tokenization ■ CardSecure is CardConnect’s proprietary tokenization and encryption technology offering ■ Encrypts sensitive card data upon receiving credit card number for both Card Present and Card Not Present transactions – Tokenization technology and off - site vault keeps customers ’ information private and out of merchants’ systems – Highly valuable technology as data breaches have become much more prevalent and visible ■ Patented tokenization technology ̶ Tokens are smart and will comply with data integrity checks performed by various ERP systems ̶ Point - to - Point Encryption (P2PE) means that upon swipe / card data input, sensitive data is instantly encrypted ̶ Encrypted card numbers are stored in a 100% PCI compliant environment CardSecure Offers Patented, Industry - Leading Software Security Solutions Omni - channel API Integrations and more … P2PE Terminals Virtual Terminals Mobile
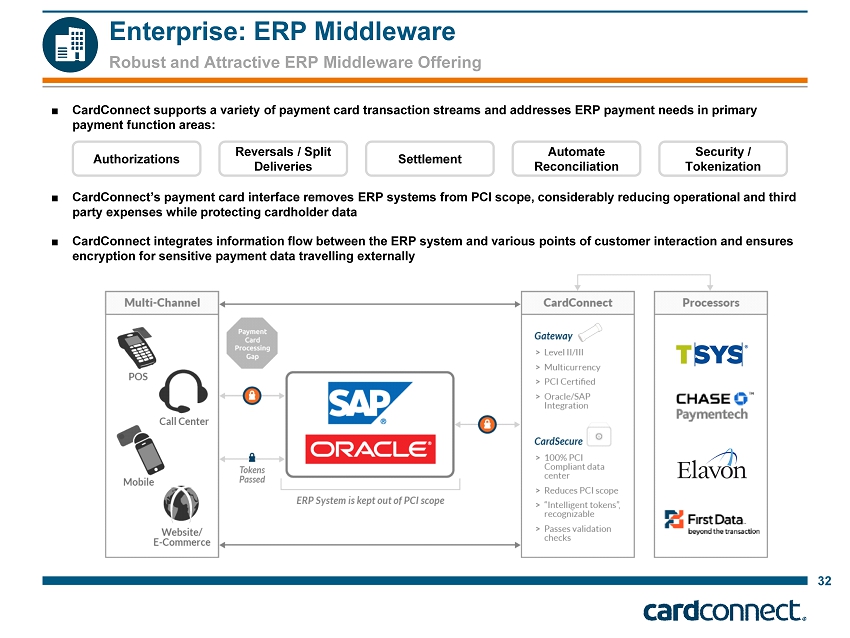
Robust and Attractive ERP Middleware Offering 32 Enterprise: ERP Middleware ■ CardConnect supports a variety of payment card transaction streams and addresses ERP payment needs in primary payment function areas: ■ CardConnect’s payment card interface removes ERP systems from PCI scope, considerably reducing operational and third party expenses while protecting cardholder data ■ CardConnect integrates information flow between the ERP system and various points of customer interaction and ensures encryption for sensitive payment data travelling externally Authorizations Reversals / Split Deliveries Settlement Automate Reconciliation Security / Tokenization

History of Rapid Evolution Key Technology Initiatives 33 2012 2013 2014 2010 Strategic technology acquisition of enterprise technology platform providing numerous benefits: ─ Patented tokenization technology ─ Point - to - Point Encryption (P2PE) ─ CardSecure ─ CardConnect Payment Gateway Gateway / Security Receives US patent for token - based payment processing Security Proprietary P2PE application is listed on the PCI Security Standards Council Security Release of CardPointe in July 2014 – one stop shop for merchants to manage accounts online Online Account Mgmt Release of Virtual Terminal in July 2014 – establishing firm as a complete Gateway provider Gateway P ayment gateway validated as PCI - DSS Compliant Gateway Release of CoPilot for Partners Portfolio Management 2015 2016 Release of P2PE Ingenico Retail Terminal for SMBs Retail Terminal Release of CardPointe Mobile App for IOS and Android users Native Mobile Application
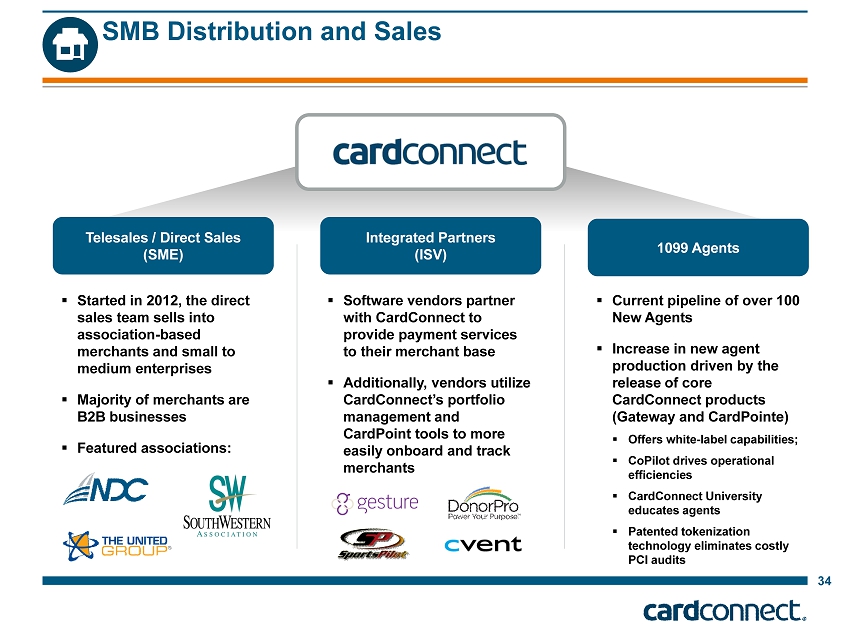
34 SMB Distribution and Sales Telesales / Direct Sales (SME) Integrated Partners (ISV ) 1099 Agents ▪ Started in 2012, the direct sales team sells into association - based merchants and small to medium enterprises ▪ Majority of merchants are B2B businesses ▪ Featured associations: ▪ Software vendors partner with CardConnect to provide payment services to their merchant base ▪ Additionally, vendors utilize CardConnect’s portfolio management and CardPoint tools to more easily onboard and track merchants ▪ Current pipeline of over 100 New Agents ▪ Increase in new agent production driven by the release of core CardConnect products (Gateway and CardPointe) ▪ Offers white - label capabilities; ▪ CoPilot drives operational efficiencies ▪ CardConnect University educates agents ▪ Patented tokenization technology eliminates costly PCI audits
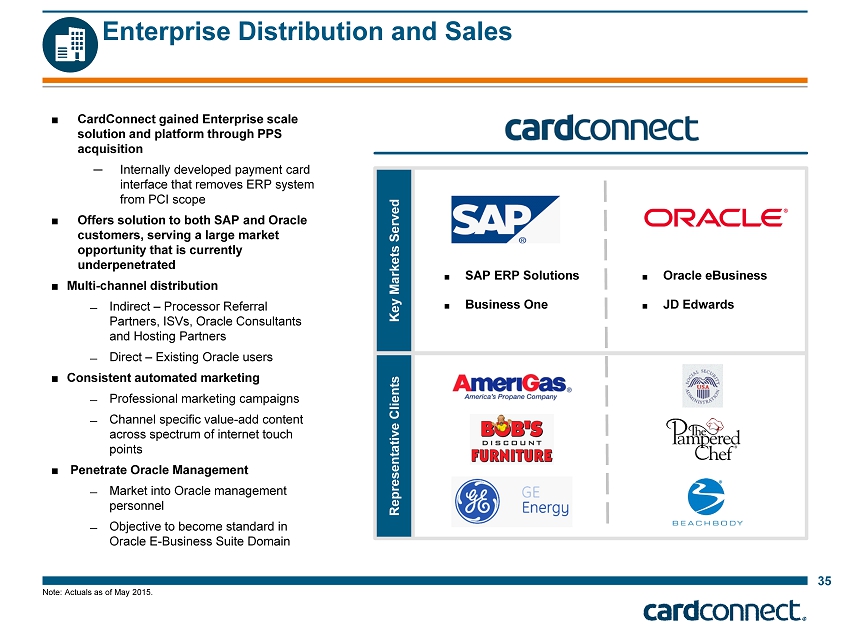
Key Markets Served Representative Clients Note: Actuals as of May 2015. 35 Enterprise Distribution and Sales ■ CardConnect gained Enterprise scale solution and platform through PPS acquisition ─ Internally developed payment card interface that removes ERP system from PCI scope ■ Offers solution to both SAP and Oracle customers, serving a large market opportunity that is currently underpenetrated ■ Multi - channel distribution ̶ Indirect – Processor Referral Partners, ISVs, Oracle Consultants and Hosting Partners ̶ Direct – Existing Oracle users ■ Consistent automated marketing ̶ Professional marketing campaigns ̶ Channel specific value - add content across spectrum of internet touch points ■ Penetrate Oracle Management ̶ Market into Oracle management personnel ̶ Objective to become standard in Oracle E - Business Suite Domain ■ SAP ERP Solutions ■ Business One ■ Oracle eBusiness ■ JD Edwards

B. Appendix: Industry Overview
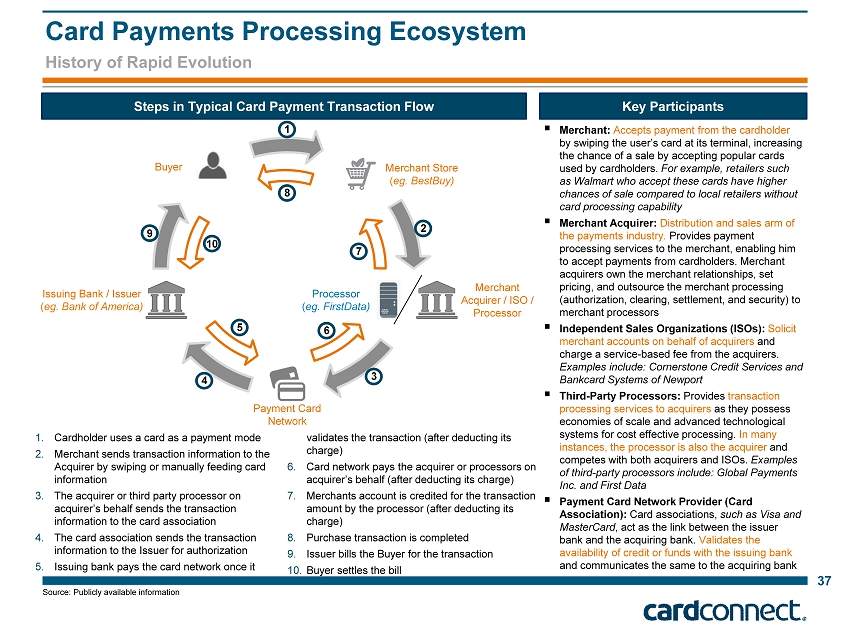
History of Rapid Evolution Card Payments Processing Ecosystem 37 1. Cardholder uses a card as a payment mode 2. Merchant sends transaction information to the Acquirer by swiping or manually feeding card information 3. The acquirer or third party processor on acquirer’s behalf sends the transaction information to the card association 4. The card association sends the transaction information to the Issuer for authorization 5. Issuing bank pays the card network once it validates the transaction (after deducting its charge) 6. Card network pays the acquirer or processors on acquirer’s behalf (after deducting its charge) 7. Merchants account is credited for the transaction amount by the processor (after deducting its charge) 8. Purchase transaction is completed 9. Issuer bills the Buyer for the transaction 10. Buyer settles the bill Steps in Typical Card Payment Transaction Flow Key Participants ▪ Merchant: Accepts payment from the cardholder by swiping the user’s card at its terminal, increasing the chance of a sale by accepting popular cards used by cardholders. For example, retailers such as Walmart who accept these cards have higher chances of sale compared to local retailers without card processing capability ▪ Merchant Acquirer: Distribution and sales arm of the payments industry. Provides payment processing services to the merchant, enabling him to accept payments from cardholders. Merchant acquirers own the merchant relationships, set pricing, and outsource the merchant processing (authorization, clearing, settlement, and security) to merchant processors ▪ Independent Sales Organizations (ISOs): Solicit merchant accounts on behalf of acquirers and charge a service - based fee from the acquirers. Examples include: Cornerstone Credit Services and Bankcard Systems of Newport ▪ Third - Party Processors: Provides transaction processing services to acquirers as they possess economies of scale and advanced technological systems for cost effective processing. In many instances, the processor is also the acquirer and competes with both acquirers and ISOs. Examples of third - party processors include: Global Payments Inc. and First Data ▪ Payment Card Network Provider (Card Association): Card associations, such as Visa and MasterCard , act as the link between the issuer bank and the acquiring bank. Validates the availability of credit or funds with the issuing bank and communicates the same to the acquiring bank 9 1 2 3 6 7 8 10 4 5 Buyer Merchant Store ( eg. BestBuy) Merchant Acquirer / ISO / Processor Processor ( eg. FirstData) Payment Card Network Issuing Bank / Issuer ( eg. Bank of America) Source: Publicly available information

Illustrative $100 transaction Payment Processing Economics 38 (1) Includes other fees such as batch header and statement fees, as well as third - party gateway and wireless fees. CardConnect earns approximately 46 or 21 bps on transactions processed by its merchants, depending on whether it is signed by the merchant directly or via an agent, respectively POINT OF SALE PROCESSING NETWORK Processing fees: ~ 54 bps Assessment fee: ~16 bps Interchange fee: ~18 0 bps Merchants Network Assoc. ~ 1 6 bps Issuing bank ~ 18 0 bps Agents /ISO Authorization $97. 50 $98.0 4 Authorization Settlement Fee ISSUING BANK ILLUSTRATIVE EXAMPLE Intervals of transaction Economic Breakdown Point of sale $100.00 Merchant acquirer / Agent (0.46) Sponsor Bank (0.01) Agents - Processor (1) (0.07) Network Association (0.16) Issuing Bank (1.80) Net proceeds to merchant $97.50 Merchant Acquirer ~ 46 bps Proces s or ~ 7 bps Sponsor Bank ~ 1 bps Commission Fees ~23 - 30 bps
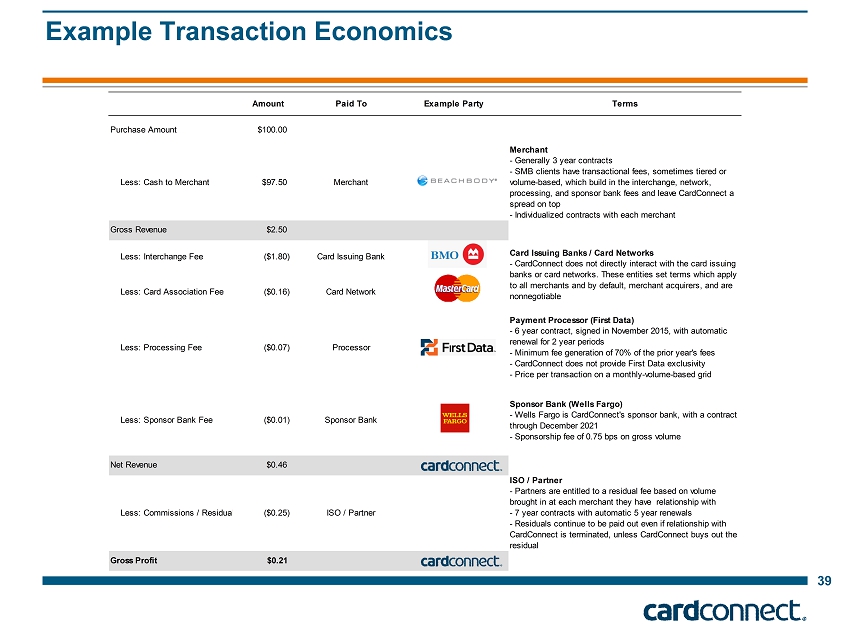
Example Transaction Economics 39 Amount Paid To Example Party Terms Purchase Amount $100.00 Less: Cash to Merchant $97.50 Merchant Merchant - Generally 3 year contracts - SMB clients have transactional fees, sometimes tiered or volume-based, which build in the interchange, network, processing, and sponsor bank fees and leave CardConnect a spread on top - Individualized contracts with each merchant Gross Revenue $2.50 Less: Interchange Fee ($1.80) Card Issuing Bank Less: Card Association Fee ($0.16) Card Network Less: Processing Fee ($0.07) Processor Payment Processor (First Data) - 6 year contract, signed in November 2015, with automatic renewal for 2 year periods - Minimum fee generation of 70% of the prior year's fees - CardConnect does not provide First Data exclusivity - Price per transaction on a monthly-volume-based grid Less: Sponsor Bank Fee ($0.01) Sponsor Bank Sponsor Bank (Wells Fargo) - Wells Fargo is CardConnect's sponsor bank, with a contract through December 2021 - Sponsorship fee of 0.75 bps on gross volume Net Revenue $0.46 Less: Commissions / Residuals ($0.25) ISO / Partner ISO / Partner - Partners are entitled to a residual fee based on volume brought in at each merchant they have relationship with - 7 year contracts with automatic 5 year renewals - Residuals continue to be paid out even if relationship with CardConnect is terminated, unless CardConnect buys out the residual Gross Profit $0.21 Card Issuing Banks / Card Networks - CardConnect does not directly interact with the card issuing banks or card networks. These entities set terms which apply to all merchants and by default, merchant acquirers, and are nonnegotiable
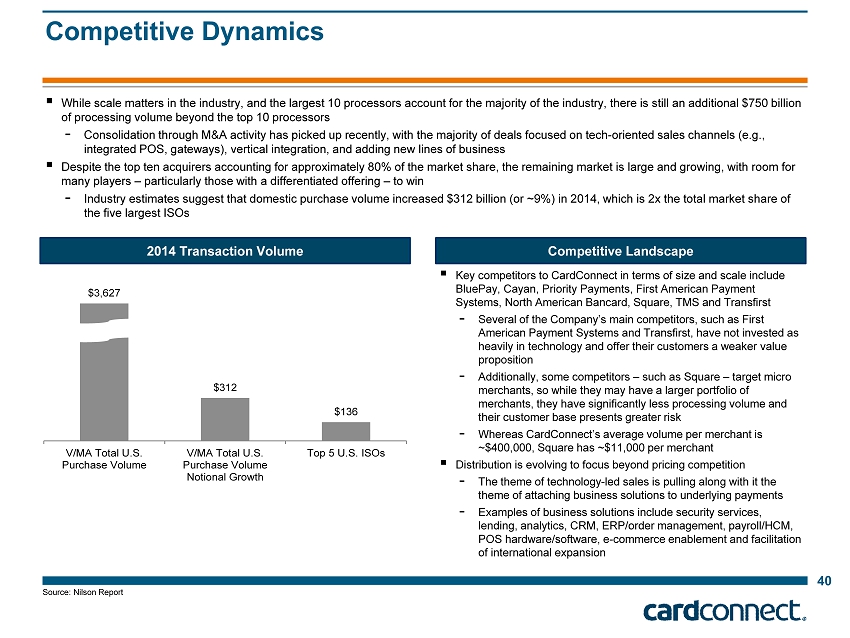
Competitive Dynamics 40 ▪ While scale matters in the industry, and the largest 10 processors account for the majority of the industry, there is still a n a dditional $750 billion of processing volume beyond the top 10 processors - Consolidation through M&A activity has picked up recently, with the majority of deals focused on tech - oriented sales channels (e .g ., integrated POS, gateways), vertical integration, and adding new lines of business ▪ Despite the top ten acquirers accounting for approximately 80 % of the market share, the remaining market is large and growing, with room for many players – particularly those with a differentiated offering – to win - Industry estimates suggest that domestic purchase volume increased $312 billion (or ~9%) in 2014, which is 2x the total marke t s hare of the five largest ISOs 2014 Transaction Volume $3,627 $312 $136 V/MA Total U.S. Purchase Volume V/MA Total U.S. Purchase Volume Notional Growth Top 5 U.S. ISOs Competitive Landscape ▪ Key competitors to CardConnect in terms of size and scale include BluePay, Cayan, Priority Payments, First American Payment Systems, North American Bancard, Square, TMS and Transfirst - Several of the Company’s main competitors, such as First American Payment Systems and Transfirst, have not invested as heavily in technology and offer their customers a weaker value proposition - Additionally, some competitors – such as Square – target micro merchants, so while they may have a larger portfolio of merchants, they have significantly less processing volume and their customer base presents greater risk - Whereas CardConnect’s average volume per merchant is ~$400,000 , Square has ~$11,000 per merchant ▪ Distribution is evolving to focus beyond pricing competition - The theme of technology - led sales is pulling along with it the theme of attaching business solutions to underlying payments - Examples of business solutions include security services, lending, analytics, CRM, ERP/order management, payroll/HCM, POS hardware/software, e - commerce enablement and facilitation of international expansion Source: Nilson R eport
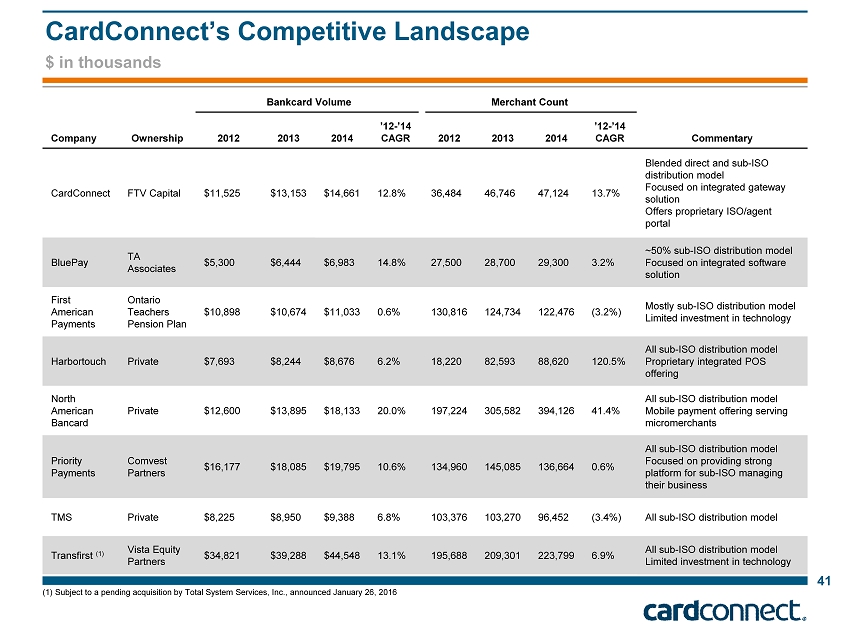
CardConnect’s Competitive Landscape 41 Bankcard Volume Merchant Count Company Ownership 2012 2013 2014 ’12 - ’14 CAGR 2012 2013 2014 ’12 - ’14 CAGR Commentary CardConnect FTV Capital $11,525 $13,153 $14,661 12.8% 36,484 46,746 47,124 13.7% Blended direct and sub - ISO distribution model Focused on integrated gateway solution Offers proprietary ISO/agent portal BluePay TA Associates $5,300 $6,444 $6,983 14.8% 27,500 28,700 29,300 3.2% ~50% sub - ISO distribution model Focused on integrated software solution First American Payments Ontario Teachers Pension Plan $10,898 $10,674 $11,033 0.6% 130,816 124,734 122,476 (3.2%) Mostly sub - ISO distribution model Limited investment in technology Harbortouch Private $7,693 $8,244 $8,676 6.2% 18,220 82,593 88,620 120.5% All sub - ISO distribution model Proprietary integrated POS offering North American Bancard Private $12,600 $13,895 $18,133 20.0% 197,224 305,582 394,126 41.4% All sub - ISO distribution model Mobile payment offering serving micromerchants Priority Payments Comvest Partners $16,177 $18,085 $19,795 10.6% 134,960 145,085 136,664 0.6% All sub - ISO distribution model Focused on providing strong platform for sub - ISO managing their business TMS Private $8,225 $8,950 $9,388 6.8% 103,376 103,270 96,452 (3.4%) All sub - ISO distribution model Transfirst (1) Vista Equity Partners $34,821 $39,288 $44,548 13.1% 195,688 209,301 223,799 6.9% All sub - ISO distribution model Limited investment in technology $ in thousands (1) Subject to a pending acquisition by Total System Services, Inc., announced January 26, 2016
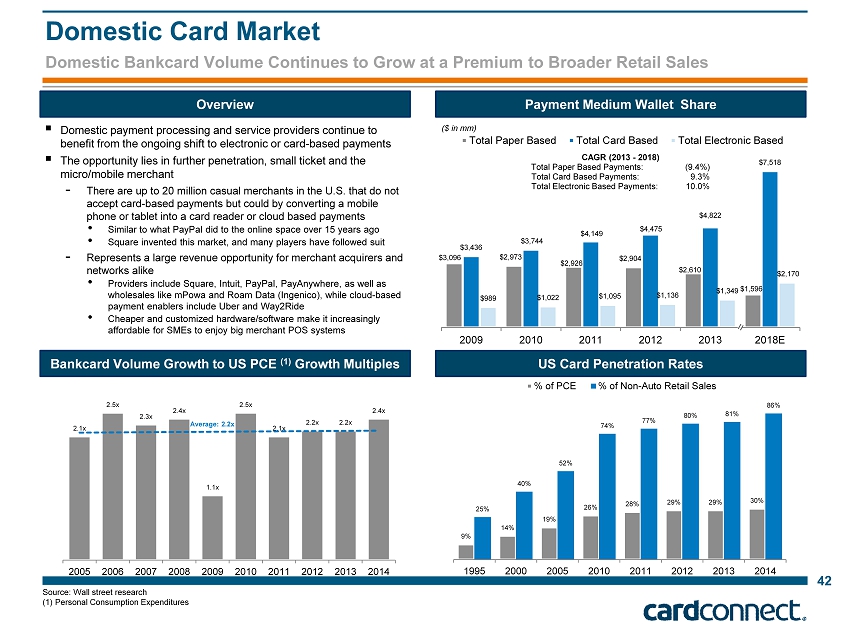
Domestic Bankcard Volume Continues to Grow at a Premium to Broader Retail Sales Domestic Card Market 42 Overview Payment Medium Wallet Share Bankcard Volume Growth to US PCE (1) Growth Multiples US Card Penetration Rates ▪ Domestic payment processing and service providers continue to benefit from the ongoing shift to electronic or card - based payments ▪ The opportunity lies in further penetration, small ticket and the micro/mobile merchant - There are up to 20 million casual merchants in the U.S. that do not accept card - based payments but could by converting a mobile phone or tablet into a card reader or cloud based payments • Similar to what PayPal did to the online space over 15 years ago • Square invented this market, and many players have followed suit - Represents a large revenue opportunity for merchant acquirers and networks alike • Providers include Square, Intuit, PayPal , PayAnywhere , as well as wholesales like mPowa and Roam Data (Ingenico ), while cloud - based payment enablers include Uber and Way2Ride • Cheaper and customized hardware/software make it increasingly affordable for SMEs to enjoy big merchant POS systems $3,096 $2,973 $2,926 $2,904 $2,610 $1,596 $3,436 $3,744 $4,149 $4,475 $4,822 $7,518 $989 $1,022 $1,095 $1,136 $1,349 $2,170 2009 2010 2011 2012 2013 2018E Total Paper Based Total Card Based Total Electronic Based CAGR (2013 - 2018) Total Paper Based Payments: (9.4%) Total Card Based Payments : 9.3% Total Electronic Based Payments: 10.0% Source: Wall street research (1) Personal Consumption Expenditures 9% 14% 19% 26% 28% 29% 29% 30% 25% 40% 52% 74% 77% 80% 81% 86% 1995 2000 2005 2010 2011 2012 2013 2014 % of PCE % of Non-Auto Retail Sales 2.1x 2.5x 2.3x 2.4x 1.1x 2.5x 2.1x 2.2x 2.2x 2.4x 2005 2006 2007 2008 2009 2010 2011 2012 2013 2014 Average: 2.2x ($ in mm)

Key Trends & Market Dynamics Customer Simplicity ■ As technology improves, the demand for simplicity substantially increases ■ Frictionless and simplified user experiences drive adoption and conversion rates with both customers and merchants ■ Success by keeping the onboarding process quick, painless, and cost effective Steady Migration Towards Electronic & Card - based Payments ■ Continued move towards non - cash payments across all industries, transaction sizes and types ■ B2B electronic payments are more recent and more significant driver of this phenomenon over the next few years ■ Most important factor driving B2B usage to electronic payments is the implied cost savings Increasing Legislation & Regulations for Protection of Person Identity Information ■ Increased industry rules and regulations and data breach notification laws in order to protect stored cardholder data and reduce exposure to security breaches ■ Currently there are over 45 existing states with information security and breach notification laws with Texas, Massachusetts and Minnesota having the most stringent laws ■ Need to comply with PCI DSS standards Movement to Tightly Integrated, Real - time & Straight - through Processing ■ Payments have to flow securely to a variety of different credit card processors from any system where payment originates within an enterprise ■ Companies drive to automate manual error prone internal processes that connect manual, error - to credit card processors; this creates a need to streamline the ERP transaction flow and allow for auditing and reporting 43
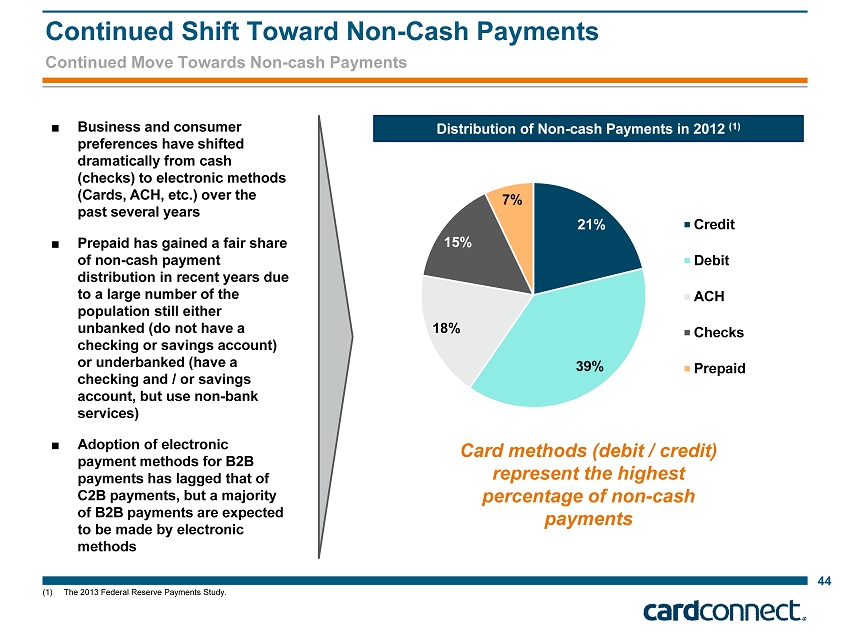
(1) The 2013 Federal Reserve Payments Study. Continued Move Towards Non - cash Payments Continued Shift Toward Non - Cash Payments 21% 39% 18% 15% 7% Credit Debit ACH Checks Prepaid Distribution of Non - cash Payments in 2012 (1) 44 ■ Business and consumer preferences have shifted dramatically from cash (checks) to electronic methods (Cards, ACH, etc.) over the past several years ■ Prepaid has gained a fair share of non - cash payment distribution in recent years due to a large number of the population still either unbanked (do not have a checking or savings account) or underbanked (have a checking and / or savings account, but use non - bank services) ■ Adoption of electronic payment methods for B2B payments has lagged that of C2B payments, but a majority of B2B payments are expected to be made by electronic methods Card methods (debit / credit) represent the highest percentage of non - cash payments

45 Steady Migration in B2B Toward Electronic Payments Increasing Usage of Electronic Payments in B2B Payments ■ Electronic payments are increasingly used for B2B payments ■ Secular tailwind behind steady B2B migration to electronic payments ■ Most important factor driving B2B usage to electronic payments is the implied cost savings 65% 20% 8% 7% 0% % of All B2B Transactions By Payment Type (1) Check ACH Wire Cards Other 78% 48% 6% 21% 51% 26% 1% 1% 68% ACH Purchase Cards Checks B2B - Change in Usage By Payment Type During Year (1) Increased No Change Decreased 28% 42% 48% 48% 50% 42% 30% 26% 22% 10% 8% 8% 0% 6% 14% 18% 2004 2007 2010 2013 Likelihood of Converting Major Suppliers to B2B e - Payments, 2004 to 2013 (1) Very Likely Somewhat Likely Not at All Likely Already Electronic ■ Nearly half of the respondents to Electronics Payments Survey for B2B Suppliers felt a switch from checks to electronic payments was very likely in 2013 ̶ Additionally approximately a quarter of 2013 respondents believed a switch from checks to electronic payments was somewhat likely ■ B2B Suppliers responding that they already were employing an electronic payments has steadily risen over the last decade to nearly a fifth of respondents in 2013 Current State Direction Going Forward (1) Federal Reserve Bank of Minneapolis. Chicago Payments Symposium. 9/25/2014.
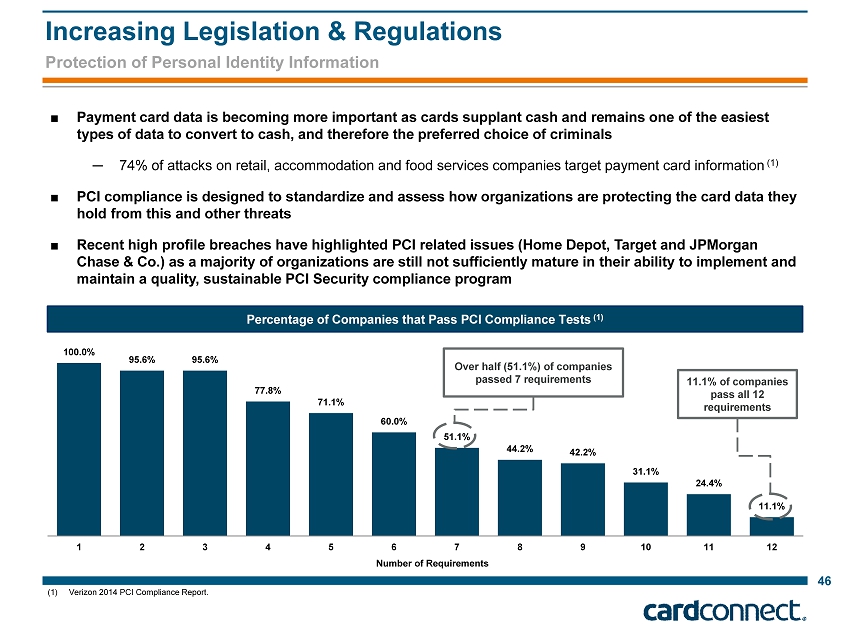
(1) Verizon 2014 PCI Compliance Report. 46 Increasing Legislation & Regulations ■ Payment card data is becoming more important as cards supplant cash and remains one of the easiest types of data to convert to cash, and therefore the preferred choice of criminals ─ 74% of attacks on retail, accommodation and food services companies target payment card information (1 ) ■ PCI compliance is designed to standardize and assess how organizations are protecting the card data they hold from this and other threats ■ Recent high profile breaches have highlighted PCI related issues (Home Depot, Target and JPMorgan Chase & Co.) as a majority of organizations are still not sufficiently mature in their ability to implement and maintain a quality, sustainable PCI Security compliance program 100.0% 95.6% 95.6% 77.8% 71.1% 60.0% 51.1% 44.2% 42.2% 31.1% 24.4% 11.1% 1 2 3 4 5 6 7 8 9 10 11 12 Number of Requirements Percentage of Companies that Pass PCI Compliance Tests (1) Over half (51.1%) of companies passed 7 requirements 11.1% of companies pass all 12 requirements Protection of Personal Identity Information
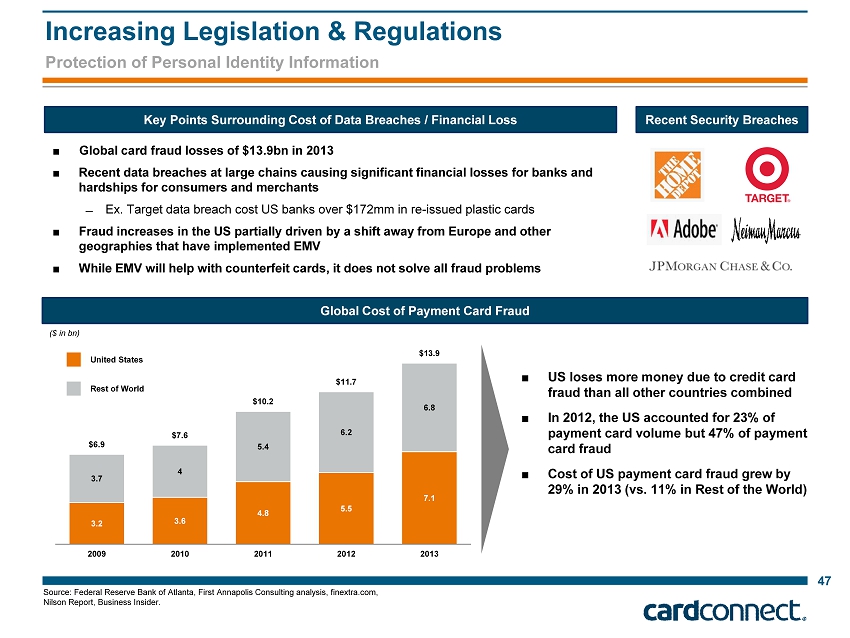
Source: Federal Reserve Bank of Atlanta, First Annapolis Consulting analysis, finextra.com, Nilson Report, Business Insider. 47 ■ Global card fraud losses of $13.9bn in 2013 ■ Recent data breaches at large chains causing significant financial losses for banks and hardships for consumers and merchants ̶ Ex. Target data breach cost US banks over $172mm in re - issued plastic cards ■ Fraud increases in the US partially driven by a shift away from Europe and other geographies that have implemented EMV ■ While EMV will help with counterfeit cards, it does not solve all fraud problems 3.2 3.6 4.8 5.5 7.1 3.7 4 5.4 6.2 6.8 $6.9 $7.6 $10.2 $11.7 $13.9 2009 2010 2011 2012 2013 Global Cost of Payment Card Fraud ($ in bn ) ■ US loses more money due to credit card fraud than all other countries combined ■ In 2012, the US accounted for 23% of payment card volume but 47% of payment card fraud ■ Cost of US payment card fraud grew by 29% in 2013 (vs. 11% in R est of the W orld ) Recent Security Breaches Key Points Surrounding Cost of Data Breaches / Financial Loss United States Rest of World Increasing Legislation & Regulations Protection of Personal Identity Information

■ The percent of revenue lost to fraud is up in 2014 due to an increase in fraudulent transactions ■ There was a 45% increase in the number of successful fraudulent transactions in 2014, more than triple the rate in 2013 48 0.80% 0.69% 0.53% 0.51% 1.36% 1.21% 0.85% 0.68% m-Commerce Merchants International Merchants Large e-Commerce Merchants All Merchants Merchant Segment – Fraud As a Percentage of Revenue (1) 2013 2014 (1) 2014 Lexis Nexis True Cost of Fraud Study, Lexis Nexis. Increasing Legislation & Regulations Protection of Personal Identity Information
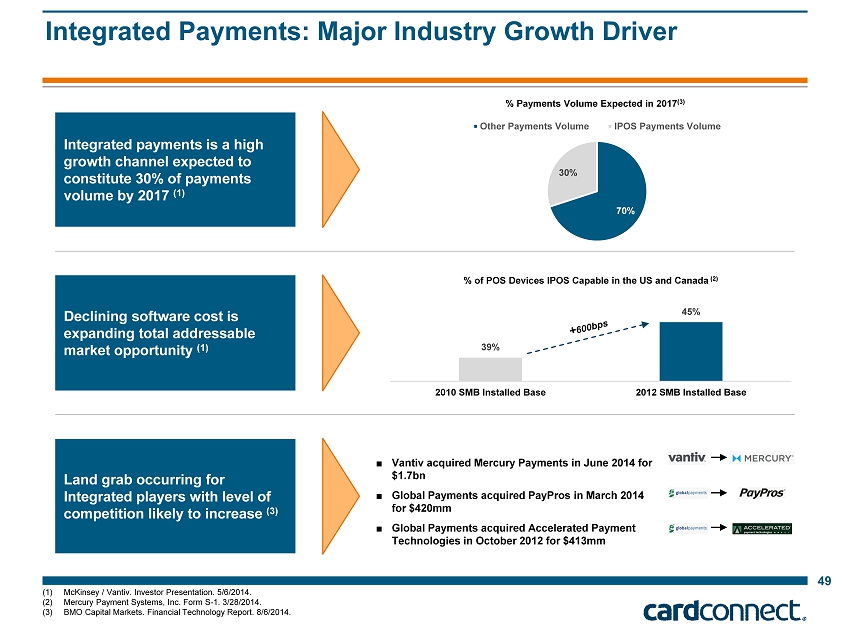
49 Integrated Payments: Major Industry Growth Driver (1) McKinsey / Vantiv. Investor Presentation. 5/6/2014. (2) Mercury Payment Systems, Inc. Form S - 1. 3/28/2014. (3) BMO Capital Markets. Financial Technology Report. 8/6/2014. 39% 45% 2010 SMB Installed Base 2012 SMB Installed Base % of POS Devices IPOS Capable in the US and Canada (2) Declining software cost is expanding total addressable market opportunity (1) Integrated payments is a high growth channel expected to constitute 30% of payments volume by 2017 (1) Land grab occurring for Integrated players with level of competition likely to increase (3) 70% 30% % Payments Volume Expected in 2017 (3) Other Payments Volume IPOS Payments Volume ■ Vantiv acquired Mercury Payments in June 2014 for $1.7bn ■ Global Payments acquired PayPros in March 2014 for $420mm ■ Global Payments acquired Accelerated Payment Technologies in October 2012 for $413mm
C. Appendix: Model Assumptions
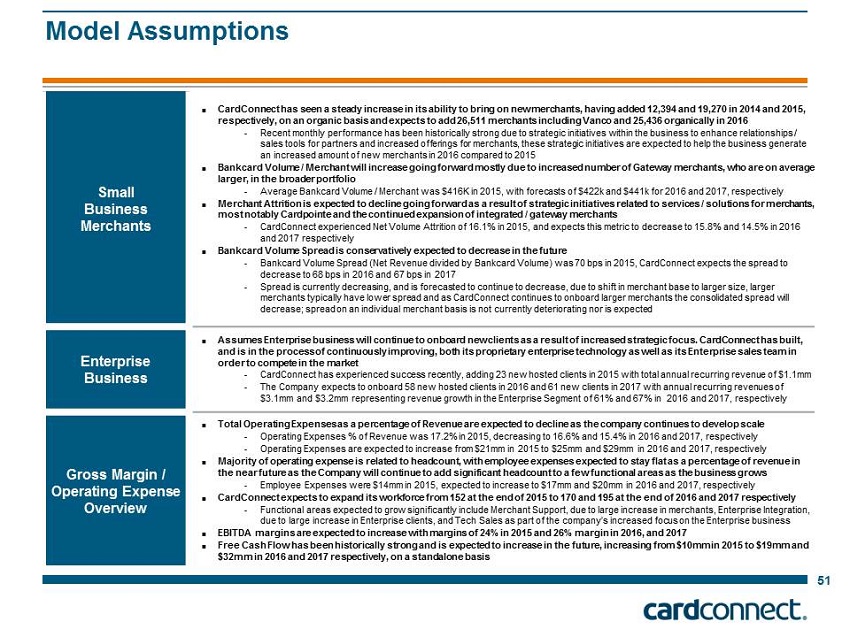
Payment Technologies in October 2012 for $413mm