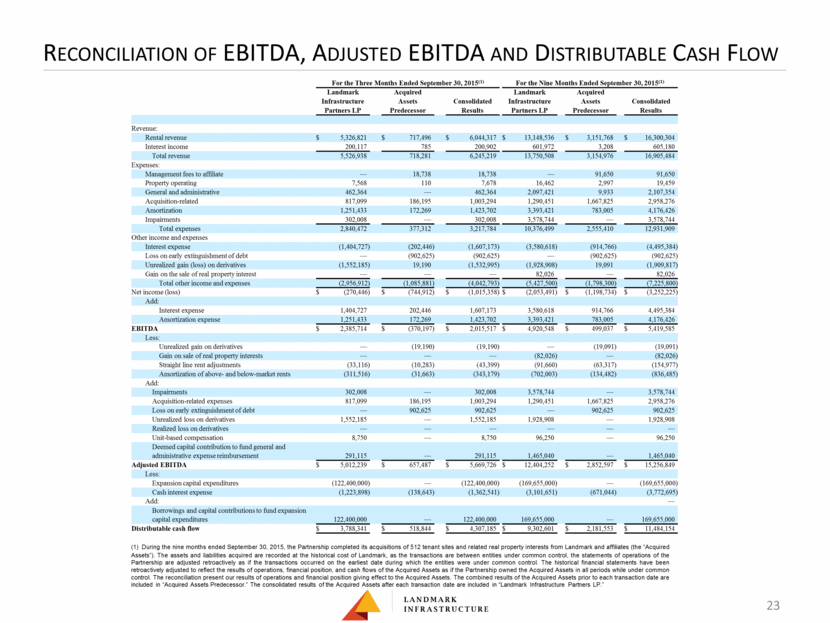
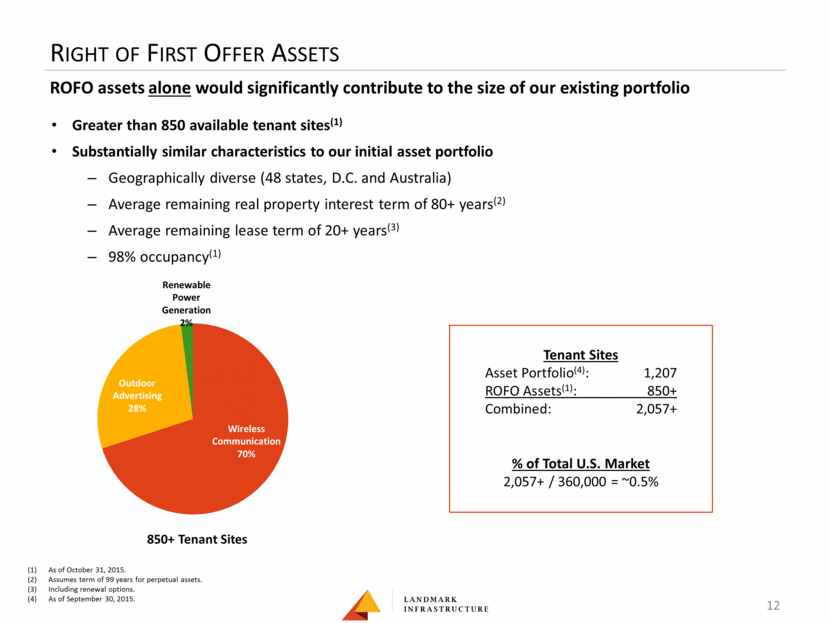
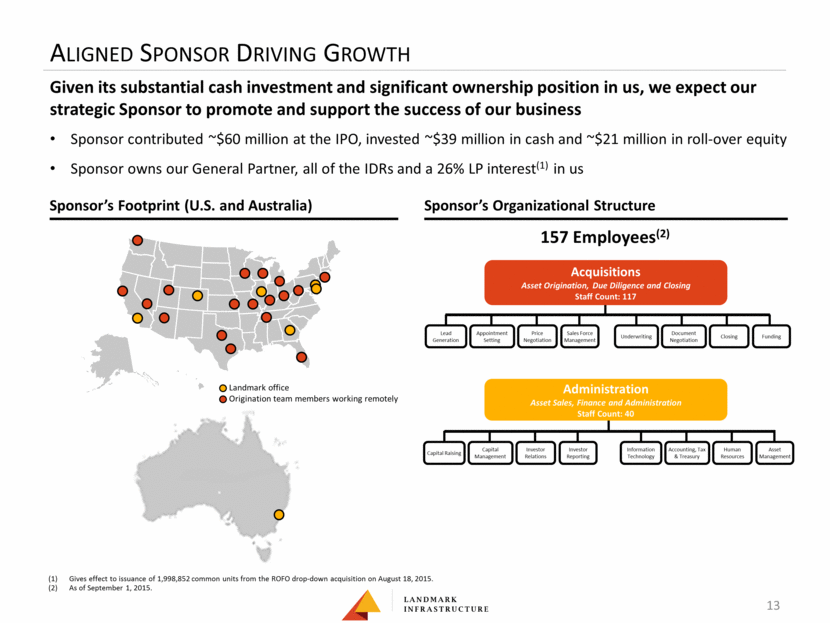
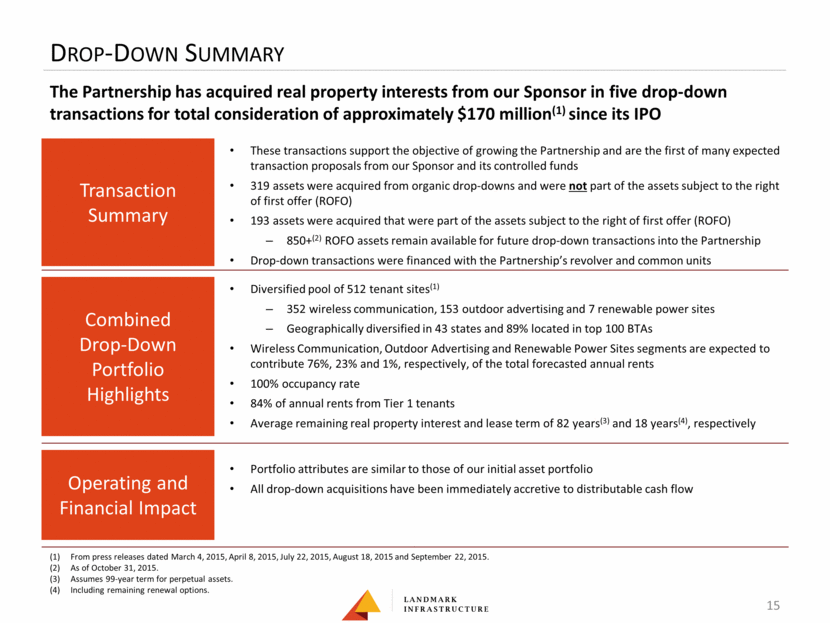
Reconciliation of EBITDA, Adjusted EBITDA and Distributable Cash Flow 23 (1) During the nine months ended September 30, 2015, the Partnership completed its acquisitions of 512 tenant sites and related real property interests from Landmark and affiliates (the “Acquired Assets”). The assets and liabilities acquired are recorded at the historical cost of Landmark, as the transactions are between entities under common control, the statements of operations of the Partnership are adjusted retroactively as if the transactions occurred on the earliest date during which the entities were under common control. The historical financial statements have been retroactively adjusted to reflect the results of operations, financial position, and cash flows of the Acquired Assets as if the Partnership owned the Acquired Assets in all periods while under common control. The reconciliation present our results of operations and financial position giving effect to the Acquired Assets. The combined results of the Acquired Assets prior to each transaction date are included in “Acquired Assets Predecessor.” The consolidated results of the Acquired Assets after each transaction date are included in “Landmark Infrastructure Partners LP.” For the Three Months Ended September 30, 2015(1) For the Nine Months Ended September 30, 2015(1) Landmark Acquired Landmark Acquired Infrastructure Assets Consolidated Infrastructure Assets Consolidated Partners LP Predecessor Results Partners LP Predecessor Results Revenue: Rental revenue $ 5,326,821 $ 717,496 $ 6,044,317 $ 13,148,536 $ 3,151,768 $ 16,300,304 Interest income 200,117 785 200,902 601,972 3,208 605,180 Total revenue 5,526,938 718,281 6,245,219 13,750,508 3,154,976 16,905,484 Expenses: Management fees to affiliate — 18,738 18,738 — 91,650 91,650 Property operating 7,568 110 7,678 16,462 2,997 19,459 General and administrative 462,364 — 462,364 2,097,421 9,933 2,107,354 Acquisition-related 817,099 186,195 1,003,294 1,290,451 1,667,825 2,958,276 Amortization 1,251,433 172,269 1,423,702 3,393,421 783,005 4,176,426 Impairments 302,008 — 302,008 3,578,744 — 3,578,744 Total expenses 2,840,472 377,312 3,217,784 10,376,499 2,555,410 12,931,909 Other income and expenses Interest expense (1,404,727) (202,446) (1,607,173) (3,580,618) (914,766) (4,495,384) Loss on early extinguishment of debt — (902,625) (902,625) — (902,625) (902,625) Unrealized gain (loss) on derivatives (1,552,185) 19,190 (1,532,995) (1,928,908) 19,091 (1,909,817) Gain on the sale of real property interest — — — 82,026 — 82,026 Total other income and expenses (2,956,912) (1,085,881) (4,042,793) (5,427,500) (1,798,300) (7,225,800) Net income (loss) $ (270,446) $ (744,912) $ (1,015,358) $ (2,053,491) $ (1,198,734) $ (3,252,225) Add: Interest expense 1,404,727 202,446 1,607,173 3,580,618 914,766 4,495,384 Amortization expense 1,251,433 172,269 1,423,702 3,393,421 783,005 4,176,426 EBITDA $ 2,385,714 $ (370,197) $ 2,015,517 $ 4,920,548 $ 499,037 $ 5,419,585 Less: Unrealized gain on derivatives — (19,190) (19,190) — (19,091) (19,091) Gain on sale of real property interests — — — (82,026) — (82,026) Straight line rent adjustments (33,116) (10,283) (43,399) (91,660) (63,317) (154,977) Amortization of above- and below-market rents (311,516) (31,663) (343,179) (702,003) (134,482) (836,485) Add: Impairments 302,008 — 302,008 3,578,744 — 3,578,744 Acquisition-related expenses 817,099 186,195 1,003,294 1,290,451 1,667,825 2,958,276 Loss on early extinguishment of debt — 902,625 902,625 — 902,625 902,625 Unrealized loss on derivatives 1,552,185 — 1,552,185 1,928,908 — 1,928,908 Realized loss on derivatives — — — — — — Unit-based compensation 8,750 — 8,750 96,250 — 96,250 Deemed capital contribution to fund general and administrative expense reimbursement 291,115 — 291,115 1,465,040 — 1,465,040 Adjusted EBITDA $ 5,012,239 $ 657,487 $ 5,669,726 $ 12,404,252 $ 2,852,597 $ 15,256,849 Less: Expansion capital expenditures (122,400,000) — (122,400,000) (169,655,000) — (169,655,000) Cash interest expense (1,223,898) (138,643) (1,362,541) (3,101,651) (671,044) (3,772,695) Add: — Borrowings and capital contributions to fund expansion capital expenditures 122,400,000 — 122,400,000 169,655,000 — 169,655,000 Distributable cash flow $ 3,788,341 $ 518,844 $ 4,307,185 $ 9,302,601 $ 2,181,553 $ 11,484,154
