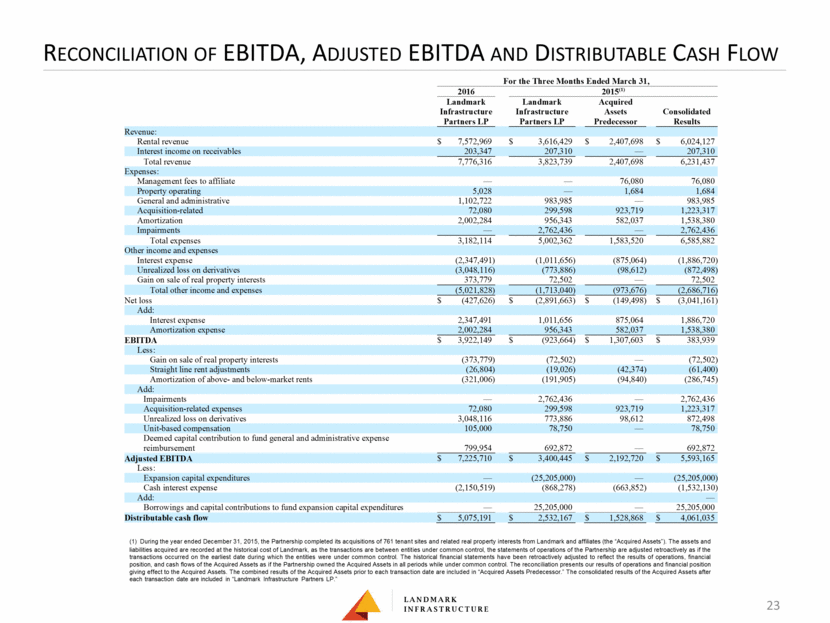
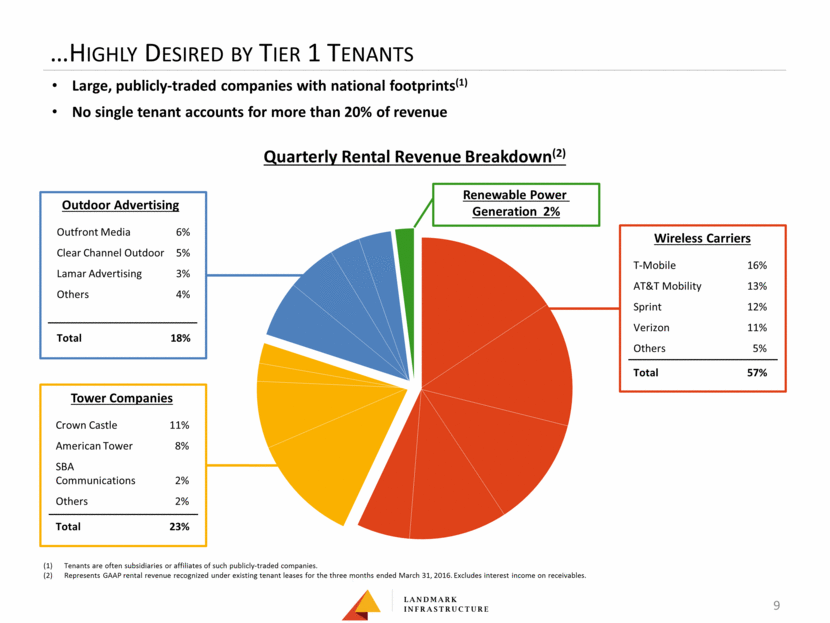
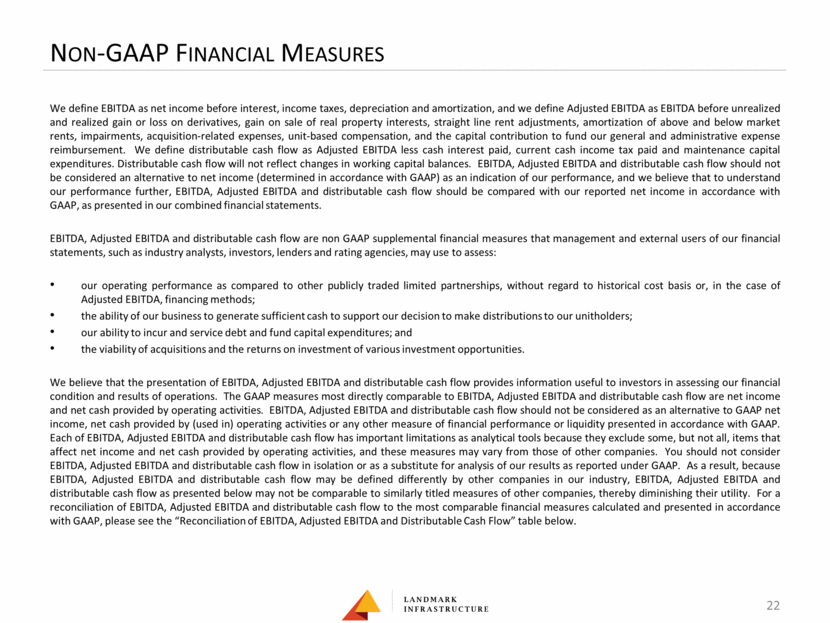
Reconciliation of EBITDA, Adjusted EBITDA and Distributable Cash Flow 23 (1) During the year ended December 31, 2015, the Partnership completed its acquisitions of 761 tenant sites and related real property interests from Landmark and affiliates (the “Acquired Assets”). The assets and liabilities acquired are recorded at the historical cost of Landmark, as the transactions are between entities under common control, the statements of operations of the Partnership are adjusted retroactively as if the transactions occurred on the earliest date during which the entities were under common control. The historical financial statements have been retroactively adjusted to reflect the results of operations, financial position, and cash flows of the Acquired Assets as if the Partnership owned the Acquired Assets in all periods while under common control. The reconciliation presents our results of operations and financial position giving effect to the Acquired Assets. The combined results of the Acquired Assets prior to each transaction date are included in “Acquired Assets Predecessor.” The consolidated results of the Acquired Assets after each transaction date are included in “Landmark Infrastructure Partners LP.” For the Three Months Ended March 31, 2016 2015(1) Landmark Landmark Acquired Infrastructure Infrastructure Assets Consolidated Partners LP Partners LP Predecessor Results Revenue: Rental revenue $ 7,572,969 $ 3,616,429 $ 2,407,698 $ 6,024,127 Interest income on receivables 203,347 207,310 — 207,310 Total revenue 7,776,316 3,823,739 2,407,698 6,231,437 Expenses: Management fees to affiliate — — 76,080 76,080 Property operating 5,028 — 1,684 1,684 General and administrative 1,102,722 983,985 — 983,985 Acquisition-related 72,080 299,598 923,719 1,223,317 Amortization 2,002,284 956,343 582,037 1,538,380 Impairments — 2,762,436 — 2,762,436 Total expenses 3,182,114 5,002,362 1,583,520 6,585,882 Other income and expenses Interest expense (2,347,491) (1,011,656) (875,064) (1,886,720) Unrealized loss on derivatives (3,048,116) (773,886) (98,612) (872,498) Gain on sale of real property interests 373,779 72,502 — 72,502 Total other income and expenses (5,021,828) (1,713,040) (973,676) (2,686,716) Net loss $ (427,626) $ (2,891,663) $ (149,498) $ (3,041,161) Add: Interest expense 2,347,491 1,011,656 875,064 1,886,720 Amortization expense 2,002,284 956,343 582,037 1,538,380 EBITDA $ 3,922,149 $ (923,664) $ 1,307,603 $ 383,939 Less: Gain on sale of real property interests (373,779) (72,502) — (72,502) Straight line rent adjustments (26,804) (19,026) (42,374) (61,400) Amortization of above- and below-market rents (321,006) (191,905) (94,840) (286,745) Add: Impairments — 2,762,436 — 2,762,436 Acquisition-related expenses 72,080 299,598 923,719 1,223,317 Unrealized loss on derivatives 3,048,116 773,886 98,612 872,498 Unit-based compensation 105,000 78,750 — 78,750 Deemed capital contribution to fund general and administrative expense reimbursement 799,954 692,872 — 692,872 Adjusted EBITDA $ 7,225,710 $ 3,400,445 $ 2,192,720 $ 5,593,165 Less: Expansion capital expenditures — (25,205,000) — (25,205,000) Cash interest expense (2,150,519) (868,278) (663,852) (1,532,130) Add: — Borrowings and capital contributions to fund expansion capital expenditures — 25,205,000 — 25,205,000 Distributable cash flow $ 5,075,191 $ 2,532,167 $ 1,528,868 $ 4,061,035