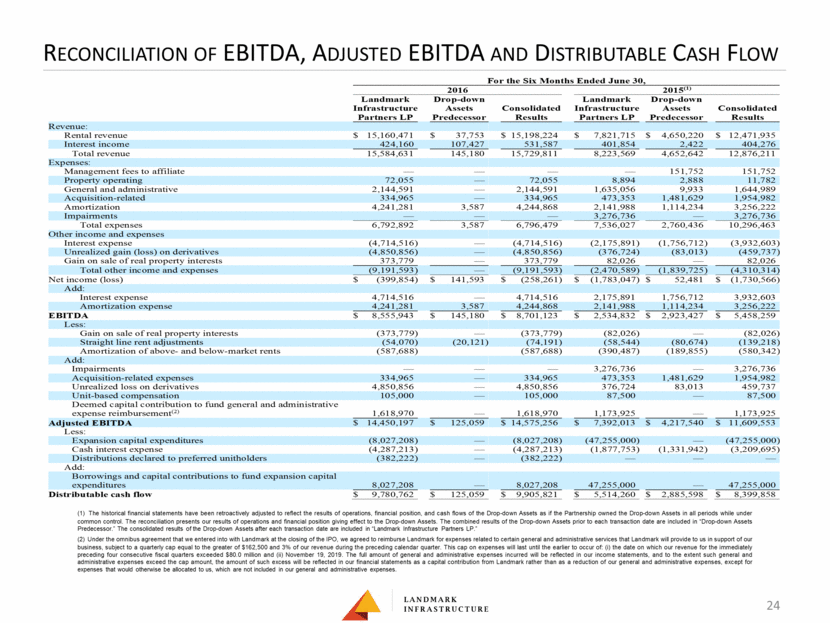
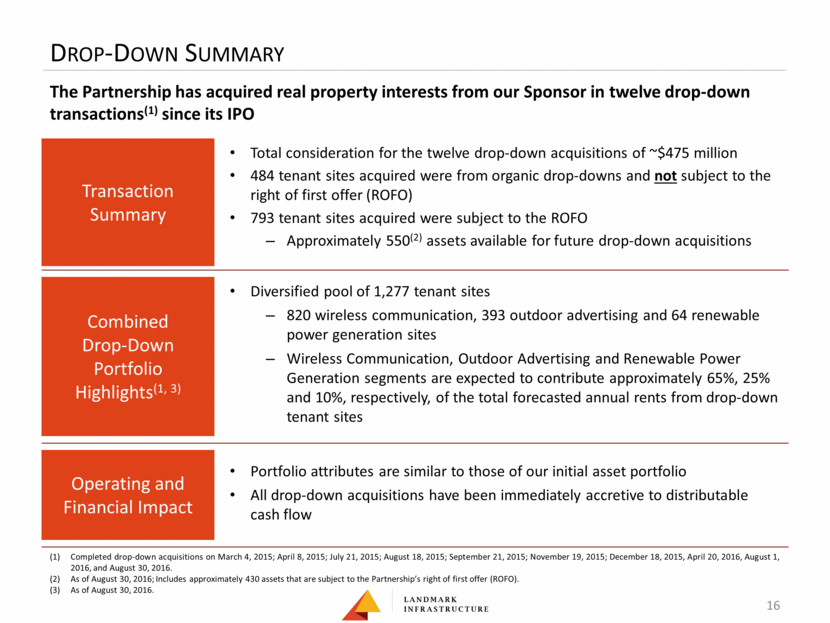
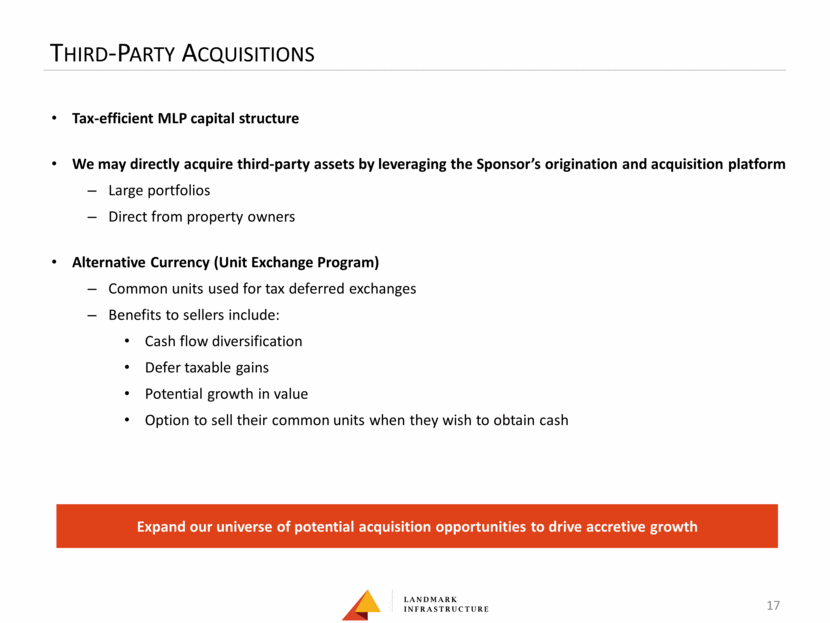
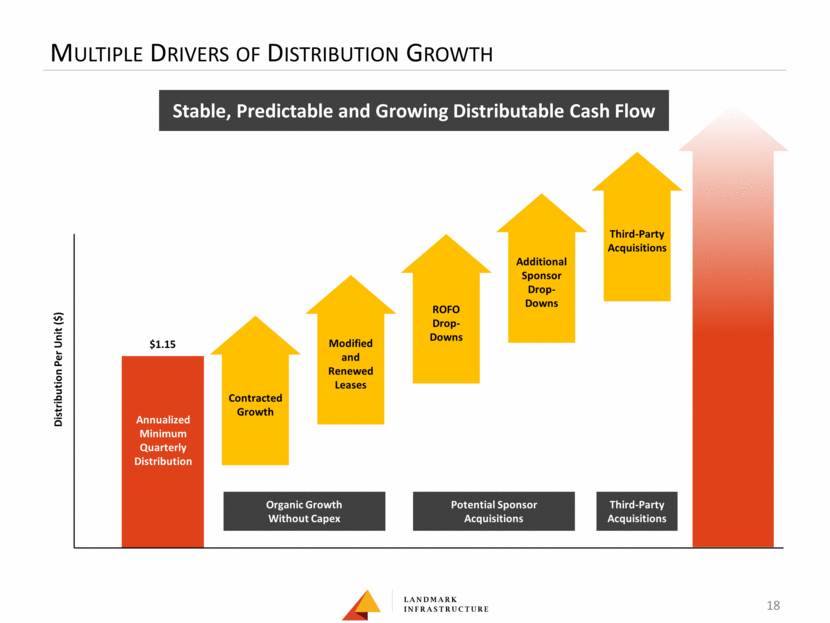
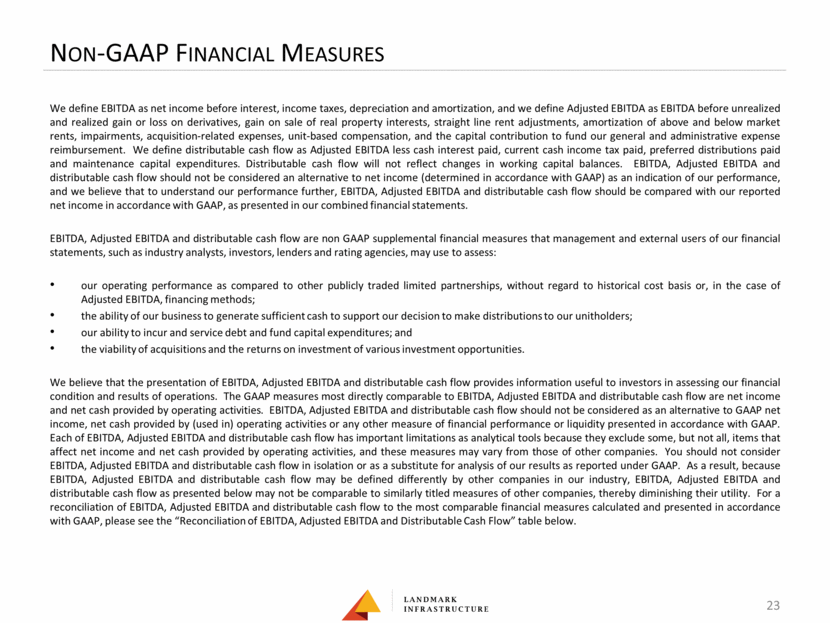
Reconciliation of EBITDA, Adjusted EBITDA and Distributable Cash Flow 24 (1) The historical financial statements have been retroactively adjusted to reflect the results of operations, financial position, and cash flows of the Drop-down Assets as if the Partnership owned the Drop-down Assets in all periods while under common control. The reconciliation presents our results of operations and financial position giving effect to the Drop-down Assets. The combined results of the Drop-down Assets prior to each transaction date are included in “Drop-down Assets Predecessor.” The consolidated results of the Drop-down Assets after each transaction date are included in “Landmark Infrastructure Partners LP.” (2) Under the omnibus agreement that we entered into with Landmark at the closing of the IPO, we agreed to reimburse Landmark for expenses related to certain general and administrative services that Landmark will provide to us in support of our business, subject to a quarterly cap equal to the greater of $162,500 and 3% of our revenue during the preceding calendar quarter. This cap on expenses will last until the earlier to occur of: (i) the date on which our revenue for the immediately preceding four consecutive fiscal quarters exceeded $80.0 million and (ii) November 19, 2019. The full amount of general and administrative expenses incurred will be reflected in our income statements, and to the extent such general and administrative expenses exceed the cap amount, the amount of such excess will be reflected in our financial statements as a capital contribution from Landmark rather than as a reduction of our general and administrative expenses, except for expenses that would otherwise be allocated to us, which are not included in our general and administrative expenses. For the Six Months Ended June 30, 2016 2015(1) Landmark Drop-down Landmark Drop-down Infrastructure Assets Consolidated Infrastructure Assets Consolidated Partners LP Predecessor Results Partners LP Predecessor Results Revenue: Rental revenue $ 15,160,471 $ 37,753 $ 15,198,224 $ 7,821,715 $ 4,650,220 $ 12,471,935 Interest income 424,160 107,427 531,587 401,854 2,422 404,276 Total revenue 15,584,631 145,180 15,729,811 8,223,569 4,652,642 12,876,211 Expenses: Management fees to affiliate — — — — 151,752 151,752 Property operating 72,055 — 72,055 8,894 2,888 11,782 General and administrative 2,144,591 — 2,144,591 1,635,056 9,933 1,644,989 Acquisition-related 334,965 — 334,965 473,353 1,481,629 1,954,982 Amortization 4,241,281 3,587 4,244,868 2,141,988 1,114,234 3,256,222 Impairments — — — 3,276,736 — 3,276,736 Total expenses 6,792,892 3,587 6,796,479 7,536,027 2,760,436 10,296,463 Other income and expenses Interest expense (4,714,516) — (4,714,516) (2,175,891) (1,756,712) (3,932,603) Unrealized gain (loss) on derivatives (4,850,856) — (4,850,856) (376,724) (83,013) (459,737) Gain on sale of real property interests 373,779 — 373,779 82,026 — 82,026 Total other income and expenses (9,191,593) — (9,191,593) (2,470,589) (1,839,725) (4,310,314) Net income (loss) $ (399,854) $ 141,593 $ (258,261) $ (1,783,047) $ 52,481 $ (1,730,566) Add: Interest expense 4,714,516 — 4,714,516 2,175,891 1,756,712 3,932,603 Amortization expense 4,241,281 3,587 4,244,868 2,141,988 1,114,234 3,256,222 EBITDA $ 8,555,943 $ 145,180 $ 8,701,123 $ 2,534,832 $ 2,923,427 $ 5,458,259 Less: Gain on sale of real property interests (373,779) — (373,779) (82,026) — (82,026) Straight line rent adjustments (54,070) (20,121) (74,191) (58,544) (80,674) (139,218) Amortization of above- and below-market rents (587,688) (587,688) (390,487) (189,855) (580,342) Add: Impairments — — — 3,276,736 — 3,276,736 Acquisition-related expenses 334,965 — 334,965 473,353 1,481,629 1,954,982 Unrealized loss on derivatives 4,850,856 — 4,850,856 376,724 83,013 459,737 Unit-based compensation 105,000 — 105,000 87,500 — 87,500 Deemed capital contribution to fund general and administrative expense reimbursement(2) 1,618,970 — 1,618,970 1,173,925 — 1,173,925 Adjusted EBITDA $ 14,450,197 $ 125,059 $ 14,575,256 $ 7,392,013 $ 4,217,540 $ 11,609,553 Less: Expansion capital expenditures (8,027,208) — (8,027,208) (47,255,000) — (47,255,000) Cash interest expense (4,287,213) — (4,287,213) (1,877,753) (1,331,942) (3,209,695) Distributions declared to preferred unitholders (382,222) — (382,222) — — — Add: Borrowings and capital contributions to fund expansion capital expenditures 8,027,208 — 8,027,208 47,255,000 — 47,255,000 Distributable cash flow $ 9,780,762 $ 125,059 $ 9,905,821 $ 5,514,260 $ 2,885,598 $ 8,399,858
