Table of Contents
As confidentially submitted to the Securities and Exchange Commission on August 8, 2014. This draft registration statement has not been publicly filed with the Securities and Exchange Commission and all information contained herein remains strictly confidential.
RegistrationNo. -
UNITED STATES
SECURITIES AND EXCHANGE COMMISSION
Washington, D.C. 20549
Form F 1
REGISTRATION STATEMENT
UNDER
THE SECURITIES ACT OF 1933
Intercorp Financial Services Inc.
(Exact name of Registrant as specified in its charter)
| Republic of Panama | 6029 | Not applicable | ||
(State or other jurisdiction of incorporation or organization) | (Primary Standard Industrial Classification Code Number) | (I.R.S. Employer Identification No.) |
Intercorp Financial Services Inc.
Torre Interbank, Av. Carlos Villarán 140
La Victoria
Lima 13, Peru
(51) (1) 615-9011
(Address, including zip code, and telephone number, including area code, of Registrant’s principal executive offices)
Corporation Service Company
1180 Avenue of the Americas, Suite 210
New York, NY 10036
(212)299-5600
(Name, address, including zip code, and telephone number, including area code, of agent for service)
Copies of all communications, including communications sent to agent for service, should be sent to:
Antonia E. Stolper, Esq. Shearman & Sterling LLP 599 Lexington Avenue New York, New York 10022 (212)848-5009 | Juan Francisco Méndez, Esq. Simpson Thacher & Bartlett LLP 425 Lexington Avenue New York, New York 10017 (212)455-2579 |
Approximate date of commencement of proposed sale of the securities to the public: As soon as practicable after this registration statement becomes effective.
If any of the securities being registered on this Form are to be offered on a delayed or continuous basis pursuant to Rule 415 under the Securities Act of 1933, check the following box: ¨
If this Form is filed to register additional securities for an offering pursuant to Rule 462(b) under the Securities Act, check the following box and list the Securities Act registration statement number of the earlier effective registration statement for the same offering. ¨
If this Form is apost-effective amendment filed pursuant to Rule 462(c) under the Securities Act, check the following box and list the Securities Act registration statement number of the earlier effective registration statement for the same offering. ¨
If this Form is apost-effective amendment filed pursuant to Rule 462(d) under the Securities Act, check the following box and list the Securities Act registration statement number of the earlier effective registration statement for the same offering. ¨
If delivery of this prospectus is expected to be made pursuant to Rule 434, check the following box. ¨
CALCULATION OF REGISTRATION FEE
| ||||
Title of each class of securities to be registered | Proposed maximum aggregate | Amount of registration fee | ||
Common shares(1) | US$ | US$ | ||
| ||||
| ||||
| (1) | Includes common shares that the underwriters have the option to purchase, if any, and common shares that are to be offered outside the United States but that may be resold from time to time in the United States in transactions requiring registration under the Securities Act. Offers and sales of common shares outside the United States are being made pursuant to Regulation S and are not covered by the Registration Statement. |
| (2) | Estimated solely for the purpose of computing the amount of the registration fee pursuant to Rule 457(o) under the Securities Act. |
The Registrant hereby amends this registration statement on such date or dates as may be necessary to delay its effective date until the Registrant shall file a further amendment which specifically states that this registration statement shall thereafter become effective in accordance with Section 8(a) of the Securities Act of 1933, as amended, or until this registration statement shall become effective on such date as the Commission, acting pursuant to said Section 8(a), may determine.
Table of Contents
The information in this preliminary prospectus is not complete and may be changed. These securities may not be sold until the registration statement filed with the U.S. Securities and Exchange Commission is effective. This prospectus is not an offer to sell nor does it seek an offer to buy these securities in any jurisdiction where the offer or sale is not permitted
SUBJECT TO COMPLETION, DATED , 2014
Preliminary Prospectus
Shares

Common Stock
This is a public offering of shares of Intercorp Financial Services, Inc. (“IFS”) by the selling shareholders identified in this prospectus. We will not receive any of the proceeds from the sale of the common shares by the selling shareholders.
Our common shares are listed on the Lima Stock Exchange (Bolsa de Valores de Lima) under the symbol “IFS”. On August 7, 2014, the last reported sales price of IFS common shares on the Lima Stock Exchange was US$ 32.31 per share. We will apply to have the common shares listed on the New York Stock Exchange under the symbol “IFSP”.
The selling shareholders have granted the underwriters an option for a period of 30 days to purchase from them up to an aggregate of additional common shares.
Investing in the common shares involves risks. See “Risks Factors” beginning on page 22.
| Price to Public | Underwriting Discount and Commissions | Proceeds to the Selling Shareholders | ||||||||||
Per Share | US$ | US$ | US$ | |||||||||
Total | US$ | US$ | US$ | |||||||||
Delivery of the common shares will be made on or about , 2014.
Neither the U.S. Securities and Exchange Commission nor any state securities commission has approved or disapproved of these securities or determined if this prospectus is truthful or complete. Any representation to the contrary is a criminal offense.
This offering has not and will not be registered in the Republic of Peru (“Peru”) and therefore is not and will not be subject to Peruvian laws applicable to public offerings in Peru. Neither this offering nor the common shares have been or will be registered in the Republic of Panama and therefore are not and will not be subject to the Panamanian laws applicable to public offerings in Panama. The information contained in this prospectus has not been and will not be approved or disapproved by the Peruvian Securities Commission (Superintendencia del Mercado de Valores, or “SMV”), the Lima Stock Exchange, or the Panamanian Superintendency of the Securities Market (Superintendencia del Mercado de Valores, or “Panamanian SMV”). The common shares may not be sold in Peru or Panama except in compliance with the securities laws of Peru and Panama, respectively.
Global Coordinators and Bookrunners
| BofA Merrill Lynch | Credit Suisse | |
The date of this prospectus is , 2014.
Table of Contents
We are responsible for the information contained in this prospectus. We have not authorized anyone to give you any other information and we take no responsibility for any other information that others may give you.
| Page | ||||
| ii | ||||
| 1 | ||||
| 16 | ||||
| 20 | ||||
| 22 | ||||
| 42 | ||||
| 43 | ||||
| 44 | ||||
| 45 | ||||
| 46 | ||||
Unaudited Pro Forma Condensed Combined Financial Information | 49 | |||
Management’s Discussion and Analysis of Results of Operations and Financial Condition | 53 | |||
| 88 | ||||
| Page | ||||
| 101 | ||||
| 120 | ||||
| 150 | ||||
| 165 | ||||
| 182 | ||||
| 194 | ||||
| 195 | ||||
| 201 | ||||
| 204 | ||||
| 207 | ||||
| 209 | ||||
| 217 | ||||
| 226 | ||||
| 227 | ||||
| 228 | ||||
| 229 | ||||
| 230 | ||||
| F-1 | ||||
Through and including , 2014 (the 25th day after the date of this prospectus), U.S. federal securities law requires all dealers that effect transactions in our common shares, whether or not participating in this offering, to deliver a prospectus. This requirement is in addition to the dealers’ obligation to deliver a prospectus when acting as underwriters and with respect to their unsold allotments or subscription.
This prospectus has been prepared on the basis that all offers of common shares in any Member State of the European Economic Area which has implemented the Prospectus Directive (each, a “Relevant Member State”) will be made pursuant to an exemption under the Prospectus Directive from the requirement to produce a prospectus for offers of common shares. Accordingly, any person making or intending to make any offer of common shares within the European Economic Area that are the subject of the offering contemplated in this prospectus should only do so in circumstances in which no obligation arises for us or the underwriters to produce a prospectus for such offer. Neither we nor the underwriters have authorized, or hereby authorize, the making of any offer of common shares in circumstances in which an obligation arises for us or the underwriters to publish a prospectus for such offer. “Prospectus Directive” means Directive 2003/71/EC (and amendments thereto, including the 2010 PD Amending Directive, to the extent implemented in the Relevant Member State), and includes any relevant implementing measure in the Relevant Member State; and the expression “2010 PD Amending Directive” means Directive 2010/73/EU.
The distribution of this prospectus and the offering and sale of common shares in certain jurisdictions may be restricted by law. Persons who receive this prospectus must inform themselves about and observe any such restrictions. This prospectus does not constitute an offer of, or an invitation to purchase, any of the common shares in any jurisdiction in which such offer or invitation would be unlawful.
i
Table of Contents
PRESENTATION OF FINANCIAL AND OTHER INFORMATION
Certain Definitions
All references to “we”, “us”, “our company” and “IFS” in this prospectus are to Intercorp Financial Services Inc., a corporation (sociedad anónima) organized under the laws of the Republic of Panama (“Panama”).
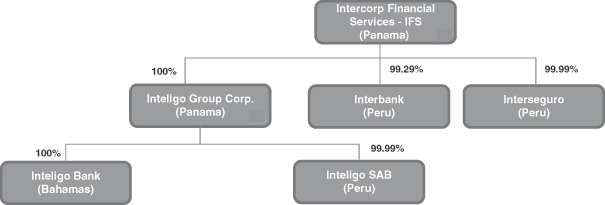
In this prospectus, we refer to our principal subsidiaries as follows: (i) in our banking segment: Banco Internacional del Perú, S.A.A. – Interbank, an open-stock corporation (sociedad anónima abierta) organized under the laws of Peru, as “Interbank”; (ii) in our insurance segment: Interseguro Compañía de Seguros, S.A., a corporation (sociedad anónima) organized under the laws of Peru, as “Interseguro”; and (iii) in our wealth management segment: Inteligo Group Corp., a corporation (sociedad anónima) organized under the laws of Panama, as “Inteligo”, Inteligo Bank Ltd., a corporation organized under the laws of The Bahamas, as “Inteligo Bank” and Inteligo SAB S.A., a corporation (sociedad anónima) organized under the laws of Peru, as “Inteligo SAB”.
In this prospectus, we also refer to our parent company, Intercorp Perú Ltd (“Intercorp Peru”), a holding company for a group of companies operating mainly in Peru under the name “Intercorp”. Intercorp Peru’s main subsidiaries include our company and Intercorp Retail Inc. (“Intercorp Retail”). Intercorp Retail acts as a holding company for the retail and real estate operations of Intercorp Peru in Peru. Through its subsidiary InRetail Peru Corp., whose shares are listed on the Lima Stock Exchange under the symbol “INRETAILC1”, Intercorp Retail has a controlling stake in (i) Supermercados Peruanos S.A. (“Supermercados Peruanos”), a supermarket chain, primarily operating under the Plaza Vea brand (“Plaza Vea”), (ii) Eckerd Peru S.A., a pharmacy chain operating under the Inkafarma brand (“Inkafarma”) controlled by Intercorp Peru since 2011, and (iii) InRetail Real Estate Corp., an owner, developer and operator of shopping malls. Intercorp Retail also controls directly (i) Tiendas Peruanas S.A. (“Tiendas Peruanas”), a department store chain operating under the Oechsle brand (“Oechsle”) that started operations in 2009, (ii) Financiera Uno S.A. (“Financiera Uno”), a consumer finance company that started operations in 2010, and (iii) Homecenters Peruanos S.A., a home improvement company operating under the Promart brand that started operations in 2010.
Financial Statements
Our audited combined financial statements as of and for the years ended December 31, 2013 and 2012 and as of January 1, 2012 included in this prospectus have been prepared innuevos soles and in accordance with International Financial Reporting Standards (“IFRS”) issued by the International Accounting Standards Board (“IASB”) and audited by Medina, Zaldívar, Paredes & Asociados, a member firm of Ernst & Young Global, in accordance with the standards of the Public Company Accounting Oversight Board (“PCAOB”). The opening statement of financial position was prepared as of January 1, 2012, the date of transition to IFRS for the IFS financial statements, as required by IFRS 1—“First Time Adoption of International Financial Reporting Standards”.
We have historically prepared our financial statements in accordance with accounting principles prescribed by the Peruvian Superintendency of Banks, Insurance and Private Pension Fund Administrators (Superintendencia de Banca, Seguros y AFPs, or “SBS”), hereinafter “Peruvian SBS GAAP”. This is the first time we prepare our financial statements in accordance with IFRS as issued by the IASB. For more information about our transition to IFRS, see notes 3.1, 3.5 and 13.4 to our audited combined financial statements included in this prospectus.
For regulatory purposes, includingBanco Central de Reserva del Perú (the “Central Reserve Bank of Peru”) regulations and the reporting requirements of the SMV, we and our Peruvian subsidiaries prepare and will continue to prepare and make available to shareholders statutory financial statements as prescribed by the SBS and the SMV, which currently is and in the near future is expected to be prepared in accordance with Peruvian SBS GAAP.
ii
Table of Contents
Intercorp Peru approved a shareholders structure reorganization on July 18, 2014, with effective date August 1, 2014, through which we became the direct owner of 100% of the capital stock of Inteligo. As a result, Inteligo became our subsidiary. Given that the reorganization will not lead to a change in Intercorp Peru’s control of the subsidiaries under IFS, the reorganization is considered a transaction among entities under common control. As a result, the reorganization is accounted for using the pooling-of-interest method. Through the effective date of the reorganization, the financial statements are presented as audited combined financial statements.
Inteligo Bank, which contributes over 99% of Inteligo’s net profit for the year ended December 31, 2013, had previously adopted IFRS as issued by the IASB, and therefore Inteligo prepared its financial statements for all years presented in this prospectus in accordance with IFRS as issued by the IASB. Inteligo SAB, however, has more recently adopted IFRS, and has prepared its individual financial statements in accordance with IFRS since January 1, 2012.
We have included in this prospectus certain information reported by the SBS and the SMV for the Peruvian banking and insurance sector as a whole as well as for individual financial institutions in Peru, including Interbank and Interseguro, which report to the SBS and the SMV in Peruvian SBS GAAP. All statements in this prospectus regarding our relative market position and financial performancevis-a-vis the financial services and insurance sectors in Peru, are based, out of necessity, on information obtained from SBS and SMV statistics. Statements in this prospectus regarding our relative market position and financial performance however, do not include information relating to Inteligo as Inteligo is not regulated by and does not report to the SBS or the SMV. In addition, for certain financial information related to our compound annual growth rate (“CAGR”) we have included such information pursuant to Peruvian SBS GAAP in order to be able to show prospective investors our growth over a longer period than two years. IFRS differs in certain respects from Peruvian SBS GAAP. Consequently, information presented in this prospectus in accordance with Peruvian SBS GAAP or based on information from the SBS or SMV may not be comparable with our financial information prepared in accordance with IFRS. Unless otherwise indicated, all financial information provided in this prospectus has been prepared in accordance with IFRS.
We manage our business in three segments: Banking, Insurance and Wealth Management. For information on our results of operations per our business segments, see note 27 to our audited combined financial statements included in this prospectus.
Currency Translation
We have translated some of thenuevos soles amounts contained in this prospectus into U.S. dollars for convenience purposes only. Unless otherwise indicated or the context otherwise requires, the rate used to translatenuevos soles amounts to U.S. dollars was S/. 2.795 to US$1.00, which was the exchange rate reported for December 31, 2013 by the SBS. The Federal Reserve Bank of New York does not report a noon buying rate fornuevos soles. The U.S. dollar equivalent information presented in this prospectus is provided solely for convenience of investors and should not be construed as implying that thenuevos soles or other currency amounts represent, or could have been or could be converted into, U.S. dollars at such rates or at any other rate. See “Exchange Rates” for information regarding historical exchange rates ofnuevos soles to U.S. dollars.
Effect of Rounding
Certain figures included in this prospectus and in our audited combined financial statements have been rounded for ease of presentation. Percentage figures included in this prospectus have not in all cases been calculated on the basis of such rounded figures but on the basis of such amounts prior to rounding. For this reason, percentage amounts in this prospectus may vary from those obtained by performing the same calculations using the figures in our audited combined financial statements. Certain other amounts that appear in this prospectus may not sum due to rounding.
iii
Table of Contents
Market and Industry Data
Unless otherwise indicated, statistical information relating to our Peruvian subsidiaries, Interbank and Interseguro, regarding market share, ranking, and other measures, as well as information on other Peruvian financial institutions and the Peruvian financial system generally, has been derived from reports and information published by the SBS, the SMV, the Central Reserve Bank of Peru, theFederación Latinoamericana de Bancos(Federation of Latin American Banks, or “FELABAN”), theAsociación de Bancos del Perú(Association of Peruvian Banks, or “ASBANC”), Swiss Re Sigma’s report, “World Insurance in 2013: Steering Towards Recovery” (“Swiss Re Sigma 2013 Report”), or from other publicly available sources and industry publications. Industry publications generally state that the information they contain has been obtained from sources believed to be reliable, but that the accuracy and completeness of such information is not guaranteed. Similarly, any internal surveys, estimates and market research used in this prospectus, while believed to be reliable, have not been independently verified, and we do not make any representation as to the accuracy of such information.
In this prospectus, unless otherwise indicated, all macroeconomic data relating to Peru is based on information published by the SBS, the Central Reserve Bank of Peru, the PeruvianMinisterio de Economía y Finanzas (Ministry of the Economy and Finance), and the PeruvianInstituto Nacional de Estadística e Informática(National Institute of Statistics and Information Processing, or “INEI”).
References in this prospectus to GDP refer to real gross domestic product, except for GDP per capita and penetration ratios of loan products.
References in this prospectus to the group of peer countries in Latin America refer to Brazil, Chile, Colombia and Mexico.
References in this prospectus to the four largest banks in Peru or the four largest Peruvian banks refer to Banco de Crédito del Peru, BBVA, Interbank and Scotiabank.
Socioeconomic levels are determined based on the data collected by INEI in their national annual surveyEncuesta Nacional de Hogares(ENAHO). INEI assigns a score to each household based on their ranking on the following four factors: (i) characteristics of the household living space, (ii) level of living space overcrowding, (iii) level of education of household head and (iv) ownership of durable goods/properties; and then groups them in five socioeconomic classes (A, B, C, D, E).
Loan Portfolio Data
Unless otherwise indicated, references in this prospectus to performing loans refer to loans in compliance with their original contractual obligations. References to past-due loans refer to overdue loans defined as follows. Commercial loans are considered past-due once amortization payments are 15 days overdue. Loans tomicro-businesses are considered past-due once amortization payments are 30 days overdue. In the case of consumer, mortgage and leasing loans, the amortization portion of a coupon is considered past-due once 30 days overdue and the total amount of the loan is considered past-due once an amortization payment is 90 days overdue. Past-due loans do not include refinanced and restructured loans. References to total gross loans include total loans outstanding, including past-due loans and refinanced loans, and references to total loans, net are to gross loansplus accrued interestless allowances for loan losses and deferred interest.
Certain Financial Definitions and Conventions
We present return on assets, or ROA, and return on equity, or ROE, in this prospectus. We define our ROA as net profit for the year divided by average total assets and our ROE as net profit for the year divided by average shareholders’ equity. We present average balances and nominal average interest rates in this prospectus. Except as otherwise indicated, average balances are based on quarterly balances. Nominal average interest rates have been calculated by dividing interest earned on assets or paid on liabilities by the corresponding average balances on such assets or liabilities.
iv
Table of Contents
This summary highlights selected information described in greater detail elsewhere in this prospectus. You should carefully read this prospectus in its entirety before investing in our common shares, including “Risk Factors”, “Management’s Discussion and Analysis of Financial Condition and Results of Operations” and our audited combined financial statements and related notes. Unless otherwise indicated, all financial information provided in this section has been prepared in accordance with IFRS.
Overview
IFS is a leading provider of financial services in the fast-growing, underpenetrated and profitable Peruvian financial system. Through one of the largest distribution networks in Peru (as measured by the number of financial stores, ATMs, correspondent agents and sales force), IFS provides a wide range of products spanning banking, insurance and wealth management services to individual and commercial clients.
Our main subsidiaries are Interbank, a universal bank, Interseguro, an insurance company, and Inteligo, a wealth management services provider. We operate our subsidiaries through a coordinated strategy, focusing on specific businesses which we believe offer high growth opportunities. We are the second largest provider of consumer loans (retail loans other than mortgages) in Peru in terms of total loans outstanding, the leading provider of annuities in terms of premiums, and operate a fast-growing wealth management business.
Inteligo was acquired by IFS effective on August 1, 2014. We believe that Inteligo strengthens our position as a leading provider of diversified financial services in Peru, since it complements our banking and insurance segments with a rapidly growing and highly profitable wealth management business. Inteligo benefits from a recurring source of fee income from financial advisory services catering to the increasing number of high net worth individuals in Peru.
Since our initial public offering in Peru in 2007, we have generated high levels of growth and profitability. Through December 31, 2011, under Peruvian SBS GAAP and prior to the acquisition of Inteligo, our net profit grew at a three-year CAGR of 40.8% for the period ended December 31, 2011, with an average ROA and average ROE of 2.6% and 27.3%, respectively. For the two years ended December 31, 2013, our average ROA and average ROE was 2.8% and 25.5%, respectively, and for 2013 our net profit grew 27.5%, in each case under IFRS and including the effect of the recent acquisition of Inteligo for these periods.
1
Table of Contents
The following charts show the evolution of our net profit and ROE from 2008 through 2011 in accordance with Peruvian SBS GAAP, and for 2012 and 2013 in accordance with IFRS.
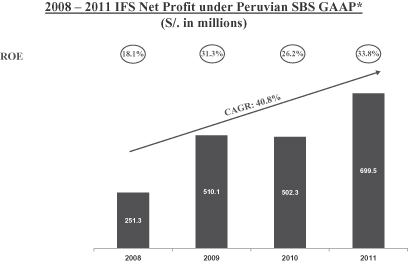
| * | Excludes Inteligo. |
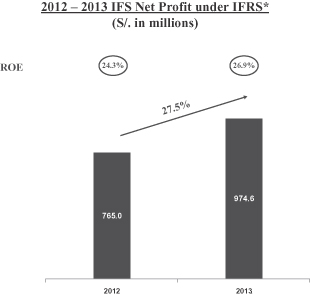
| * | Includes Inteligo. |
As of December 31, 2013, we had total assets of S/. 36.2 billion (approximately US$12.9 billion), total gross loans of S/. 20.9 billion (approximately US$7.5 billion), total deposits of S/. 22.1 billion (approximately US$7.9 billion) and shareholders’ equity of S/. 3.7 billion (approximately US$1.3 billion). For the year ended December 31, 2013, our net profit was S/. 974.6 million (approximately US$348.7 million).
2
Table of Contents
We operate the following three business segments:
| • | Banking: Interbank is the second largest provider of consumer loans (retail loans other than mortgages) in Peru in terms of total loans outstanding as of December 31, 2013, according to the SBS. Within the consumer loan segment in Peru, Interbank is the second largest provider of credit card financing and the largest private bank provider of payroll loans to public sector employees. Additionally, it is the fourth largest bank in Peru in terms of retail mortgages and commercial lending, as well as overall deposits and total assets. Interbank has built one of the most convenient and extensive retail banking distribution networks in Peru with a total of 268 financial stores, more than 2,400 ATMs and more than 3,200 correspondent agents. |
Interbank’s five-year CAGR in loans, deposits and net profit was 16.1%, 15.9%, and 19.1%, respectively, under Peruvian SBS GAAP, for the period ended December 31, 2013. For the year ended December 31, 2013, Interbank’s year-over-year growth in loans, deposits and net profit was 26.6%, 38.7%, and 8.2%, respectively, and its ROE was 23.7%, under IFRS.
| • | Insurance: Interseguro is the leading provider of annuities in Peru, the fastest-growing insurance product in the Peruvian insurance industry over the last five years, with a 25.0% market share as measured by premiums for the year ended December 31, 2013, according to the SBS. In addition to its leading position in annuities, Interseguro also offers individual life and retail insurance products. |
Interseguro’s five-year CAGR in premiums and net profit was 21.7% and 87.6%, respectively, under Peruvian SBS GAAP, for the period ended December 31, 2013. For the year ended December 31, 2013, Interseguro’s year-over-year growth in premiums and net profit was 26.3% and 87.7%, respectively, and its ROE was 48.2%, under IFRS.
| • | Wealth management: Inteligo is a fast-growing provider of wealth management services through Inteligo Bank and brokerage services through Inteligo SAB. Inteligo caters mainly to Peruvian high net worth individuals, particularly clients with investable assets between US$0.5 million and US$10 million who benefit from Peru’s rapid wealth creation. |
Inteligo Bank’s five-year CAGR in assets under management plus deposits was 24.5%, under IFRS, for the period ended December 31, 2013. For the year ended December 31, 2013, Inteligo Bank’s year-over-year growth in assets under management plus deposits was 25.6%, and Inteligo’s ROE was 26.5%, under IFRS.
The following table provides certain financial information about our three business segments.
| As of and for the year ended December 31, 2013 | ||||||||||||||||||||||||
| Total Assets | Total Equity | Net Profit | ||||||||||||||||||||||
| S/. in millions | % | S/. in millions | % | S/. in millions | % | |||||||||||||||||||
Banking | 29,873.0 | 82.6 | 2,804.9 | 75.6 | 615.0 | 63.1 | ||||||||||||||||||
Insurance | 3,870.1 | 10.7 | 541.1 | 14.6 | 281.6 | 28.9 | ||||||||||||||||||
Wealth management | 2,718.7 | 7.5 | 453.7 | 12.2 | 109.3 | 11.2 | ||||||||||||||||||
Corporate and eliminations(1) | (282.6 | ) | (0.8 | ) | (87.3 | ) | (2.4 | ) | (31.3 | ) | (3.2 | ) | ||||||||||||
|
|
|
|
|
|
|
|
|
|
|
| |||||||||||||
Total | 36,179.2 | 100.0 | 3,712.4 | 100.0 | 974.6 | 100.0 | ||||||||||||||||||
|
|
|
|
|
|
|
|
|
|
|
| |||||||||||||
| (1) | Corporate and eliminations corresponds to expenses of IFS and elimination of intercompany transactions. See note 27 to our audited combined financial statements. |
3
Table of Contents
The following table provides certain financial information about our combined business.
| As of and for the years ended December 31, | ||||||||||||
| 2013 | 2013 | 2012 | ||||||||||
| (US$ in millions)(1)(2) | (S/. in millions)(1) | |||||||||||
Total assets | 12,944.2 | 36,179.2 | 29,473.5 | |||||||||
Total gross loans | 7,494.5 | 20,947.2 | 16,535.9 | |||||||||
Total deposits | 7,895.3 | 22,067.5 | 16,138.6 | |||||||||
Total equity | 1,328.2 | 3,712.4 | 3,619.3 | |||||||||
Net profit | 348.7 | 974.6 | 765.0 | |||||||||
Dividends declared(3) | — | 432.8 | 452.2 | |||||||||
Assets under management plus deposits(4) | 3,313.4 | 9,260.9 | 7,370.7 | |||||||||
Net interest margin | — | 5.9 | % | 6.3 | % | |||||||
ROA | — | 2.9 | % | 2.8 | % | |||||||
ROE | — | 26.9 | % | 24.3 | % | |||||||
Past-due-loan ratio | — | 1.7 | % | 1.8 | % | |||||||
Efficiency ratio(5) | — | 41.5 | % | 43.5 | % | |||||||
Financial stores | — | 268 | 261 | |||||||||
ATMs | — | 2,433 | 2,403 | |||||||||
Correspondent agents | — | 3,214 | 2,535 | |||||||||
| (1) | Except for percentages and ratios and number of financial stores, ATMs and correspondent agents. |
| (2) | Amounts stated in U.S. dollars as of and for the year ended December 31, 2013 have been translated fromnuevos soles at the exchange rate of S/. 2.795 = US $1.00. See “Exchange Rates”. |
| (3) | Dividends are declared and paid in U.S. dollars and were US$165.8 million and US$168.4 million for 2013 and 2012, respectively. |
| (4) | Refers to assets under management plus deposits of Inteligo Bank. |
| (5) | Efficiency ratio is calculated by dividing (x) salaries and employee benefits plus administrative expenses plus depreciation and amortization by (y) net interest and similar income plus other income plus net premiums earned. |
Market Opportunity
We believe that the current ongoing growth of the Peruvian economy, the increasing size of the middle class, the low penetration rates of financial services, the rapid growth of private wealth creation and the healthy, well-capitalized and profitable financial system offer significant opportunities for our continued profitable growth. These market opportunities are further described below.
High growth economy with strong macroeconomic fundamentals
Peru’s average GDP growth rate was 6.1% between 2008 and 2013, while its average inflation rate was 3.2% during the same period. The Peruvian government’s conservative fiscal policy, coupled with the Central Reserve Bank of Peru’s responsible management of inflation and international reserves, has helped Peru to improve and maintain investment grade ratings of A3 by Moody’s Investor Service (“Moody’s”), BBB+ by Standard & Poor’s Rating Services (“S&P”) and BBB+ by Fitch Ratings Ltd. (“Fitch”). In its most recent forecast as of July 2014, the Central Reserve Bank of Peru has estimated real GDP growth for Peru of 4.4%, 6.0% and 6.3% in 2014, 2015 and 2016, respectively.
Expansion of purchasing power of middle and upper socioeconomic classes
According to INEI, the poverty rate in Peru has declined to 23.9% in 2013, from 37.3% in 2008, and GDP per capita in U.S. dollars has grown 1.6x during the same period. According to INEI, Peru’s middle and upper
4
Table of Contents
socio-economic segments (segments A, B and C) have significantly expanded and, as of 2012, represented 45% of the population compared to 28% in 2004. The increase in the number of people belonging to the middle and upper classes creates the need for financial services, particularly for increasingly sophisticated banking, insurance and wealth management products.
Low financial services penetration
Despite the recent growth, we believe that growth potential in Peru’s financial services sector continues to be significant. Banking penetration in Peru as of December 31, 2013, measured as the ratio of loans-to-GDP was 30.4%, below the average ratio of 49.9% for the group of peer countries in Latin America and less than half than the ratio of 84.1% for Chile, according to the IMF and local regulators. We believe that penetration potential is even more significant in retail banking. In terms of retail loan penetration, including credit cards and branches per inhabitant, Peru is well below its peer countries in Latin America. As of December 31, 2013, the estimated total number of credit cards per inhabitant in Peru was only 0.26 as compared to 1.25 cards per inhabitant for Chile. The ratio of consumer loans-to-GDP and the ratio of mortgage loans-to-GDP in Peru were only 5.4% and 5.3%, respectively, while the averages for the group of peer countries in Latin America were 8.6% and 8.8%, respectively, as of December 31, 2013. Furthermore, as of December 31, 2013, there were only approximately 186,400 mortgages outstanding in Peru for a population of 30.5 million, compared to approximately 1.3 million mortgages outstanding in Chile for a population of 17.2 million. Similarly, insurance penetration in Peru, measured as the ratio of premiums-to-GDP as of December 31, 2013, is estimated to be 1.6%, which is lower than the average ratio of 3.3% for the group of peer countries in Latin America, and less than half the ratio of 4.2% for Chile, according to the Swiss Re Sigma 2013 Report.
Growth of private wealth in Peru
We believe the continuing growth in private wealth in Peru will further increase the market for wealth management services for Peruvian clients. According to INEI, the number of households in Peru with annual disposable income in excess of US$75,000, increased from 1.2% of the total population in 2008 to 2.1% in 2013. We expect the number of high net worth individuals in Peru and the size of their investible assets to continue to grow.
Healthy, well-capitalized and profitable financial system
As a result of sound regulation, the Peruvian financial system is healthy, well-capitalized and profitable. Gross loans have grown at a five-year CAGR of 13.0% for the period ended December 31, 2013, while the banking system’s asset quality has remained strong with a ratio of past-due loans as a percentage of total gross loans of 2.1% and a ratio of allowance for loan losses as a percentage of past-due loans of 188.1% as of December 31, 2013, according to the SBS. Capitalization has consistently been well above regulatory requirements with a total capital ratio of the banking system of 13.7% as of December 31, 2013, according to the SBS. Insurance companies in Peru are also well-capitalized with an industry regulatory solvency ratio of 28.4% as of December 31, 2013. Furthermore, profitability remains high, with a 21.2% ROE for the banking system, and a 12.8% ROE for the insurance industry for the year ended December 31, 2013, according to the SBS.
Strengths
Leading financial services provider focused on highly attractive businesses
We are focused on some of the fastest growing and most profitable businesses in the Peruvian financial system. Within our banking segment, Interbank focuses on retail banking, with 49.1% of its loan portfolio constituting retail loans, compared to 34.3% for the Peruvian banking system, as of December 31, 2013,
5
Table of Contents
according to the SBS. Interbank is the second largest provider of consumer loans (other than mortgage loans) among banks in Peru, with a 20.1% market share as measured by gross consumer loans as of December 31, 2013. Interbank is also the second largest provider of credit card financing among banks in Peru, with a 22.6% market share by gross credit card loans, and the largest private bank provider of payroll loans to public sector employees, with a 24.6% market share by gross payroll loans, in each case as of December 31, 2013. Interbank has one of the highest net interest margins of the Peruvian banking system, due to its stronger focus on retail banking when compared to its peers. During 2013, Interbank’s net interest margin was 174 basis points higher than the average for the four largest Peruvian banks, according to the SBS. Under IFRS, Interbank’s net interest margin for the year ended December 31, 2013 was 6.2%.
In our insurance segment, Interseguro is the leading provider of annuities in Peru, with a market share of 25.0% as measured by premiums for the year ended December 31, 2013, according to the SBS. Furthermore, Interseguro has maintained the leading position in the Peruvian annuities market since 2010. Annuities represented the fastest-growing insurance product in the Peruvian insurance industry with a five-year CAGR in premiums of 21.6% for the period ended December 31, 2013, driven by the growing number of Peruvians retiring under the Peruvian private pension system. Growth of annuities is expected to further accelerate as the number of Peruvian private pension system’s retirees and their respective average pension balances increase. Over the ten years ended December 31, 2013, 67 thousand people have retired under the Peruvian private pension system compared to a total of 375 thousand and nearly three million expected retirees over the next ten and 30 years, respectively, according to the SBS, to whom Interseguro will offer annuities.
Within our wealth management segment, Inteligo is well-positioned to capture an increasing share of the growing number of wealthy individuals, resulting from strong economic growth and wealth creation in Peru. Inteligo’s five-year CAGR for assets under management plus deposits for the period ended December 31, 2013 was 24.5% under IFRS. We believe Inteligo’s position as a provider of wealth management services to this group of customers will help increase its share of wallet among high net worth individuals, while delivering high levels of growth and profitability.
Outstanding track record of profitable growth, resulting in consistent market share gains
Our strong track record of profitable growth is supported by our increased market share and high profitability across our business segments. In retail banking, Interbank’s total retail loans, including consumer and mortgage loans, achieved a five-year CAGR of 16.6%, compared to 15.7% for the Peruvian banking system, for the period ended December 31, 2013, according to the SBS. In addition, Interbank has increased its market share across retail products over the five-year period ended December 31, 2013. With respect to credit card loans, Interbank’s market share increased from 20.5% to 22.6%, and in mortgage loans, Interbank’s market share increased from 10.1% to 13.1%, in each case from 2008 to 2013.
Interbank has also increased its commercial lending and outpaced the Peruvian banking system, achieving a five-year CAGR of 15.6% in commercial loans outstanding compared to the system’s 11.8%, for the period ended December 31, 2013. Interbank’s market share in commercial loans has increased from 7.7% to 9.0% from 2008 to 2013.
Interbank’s increasing market shares have been accompanied by high profitability, with net profit growing at a five-year CAGR of 19.1% compared to 8.4% for the Peruvian banking system for the period ended December 31, 2013.
Interseguro is one of the fastest growing insurance companies in Peru, achieving a five-year CAGR of 21.7% in premiums, compared to the industry’s 15.9%, for the period ended December 31, 2013, according to the SBS. In addition, Interseguro’s market share by annuities premiums has increased from 22.7% to 25.0% from 2008 to 2013. During this period, Interseguro’s net profit grew at a five-year CAGR of 87.6% compared to 50.2% for the Peruvian insurance industry.
6
Table of Contents
Inteligo Bank’s assets under management plus deposits grew at a five-year CAGR of 24.5% for the period ended December 31, 2013. Similarly, net profit grew at a five-year CAGR of 44.0% for the period ended December 31, 2013, supported by strong fees on assets under management, which stood at 1.08% in 2013 (calculated by dividing (x) fee income from financial services, net by (y) average assets under management).
Convenient, extensive and innovative distribution network with a customer-oriented approach
We believe that our convenient, extensive and innovative retail distribution network, together with our product-specific sales force, has made our products more accessible to our customers and has differentiated us from our competitors.
Interbank has built an omni-channel distribution network in Peru, serving over 1.9 million customers. As of December 31, 2013, Interbank had 268 financial stores and operated the second-largest ATM network in Peru with more than 2,400 ATMs, which includes the largest out-of-branch ATM network (under ourGlobal Net brand). Interbank has the largest number of financial stores inside supermarkets in Peru, which are open on weekends and Monday through Sunday from 9:00 a.m. to 9:00 p.m. Moreover, with the intention of providing underserved customers with more convenient services, Interbank operates a network of correspondent agents, called Interbank Agentes. The correspondent agents’ concept consists of providing commercial establishments with low-cost electronic terminals which allow customers to perform basic transactions. As of December 31, 2013, Interbank had over 3,200 correspondent agents.
Interseguro markets its annuities and individual life insurance products through its own dedicated sales force to ensure the delivery of high quality service and advice to clients. Interseguro’s specialized sales force is trained to provide a differentiated service for various customer types. As of December 31, 2013, Interseguro employed 128 agents exclusively dedicated to sell annuities and 240 agents to sell other insurance products. In addition to its own sales force, Interseguro leverages the retail distribution capacity of other IFS and Intercorp Peru subsidiaries, including Interbank’s distribution network and our affiliate Intercorp Retail’s sales points (Plaza Vea and Oechsle) to offer simple low-cost premium insurance products.
Inteligo has developed a proprietary financial advisory model that has been a key pillar in sustaining its growth. The model takes into account the financial objectives of its clients and emphasizes risk analysis and constant monitoring with portfolio rebalancing. Along with this, Inteligo has been able to successfully segment its target client base in order to deliver tailored products and advice.
Our commitment to innovation as part of our customer-oriented approach is demonstrated by continuous improvement of our banking products and distribution channels. For example, in May 2013, Interbank introduced “Imagine” financial stores, a concept jointly developed with IDEO, a design and innovation consulting firm. “Imagine” fosters a more pleasant and inviting environment to Interbank’s customers, and is designed to educate customers on the use of electronic and Internet banking tools in order to migrate low value transactions to electronic channels, while continuing to capture new customers and exploitcross-selling opportunities. Furthermore, Interbank has a full-time financial store functioning as an innovation lab (Explora), allowing it to constantly test new ideas and concepts. These types of initiatives, among others, have allowed Interbank to receive eight awards for creativity and innovation since 1998 fromCreatividad Empresarial, a consortium comprising local journalists and scholars, which is more than any other bank in Peru.
Sound risk management resulting in strong asset quality and high investment returns
Our experienced risk management teams focus on monitoring and managing risks across all business areas, including credit, market, liquidity, operational risks, among others. We believe our risk management expertise has allowed us to achieve strong asset quality and high investment returns.
7
Table of Contents
Interbank’s underwriting procedures are based on strong analytics and proprietary models, developed in partnership with internationally recognized risk management experts. These models, along with the risk management skills of its experienced risk management team, provide Interbank with competitive advantages. Despite its fast growth and high concentration in retail loans, which tend to have higher levels of delinquency, Interbank’s past-due loans as a percentage of total gross loans ratio as of December 2013 was 1.8%, the second lowest among the four largest banks in Peru and lower than the industry average of 2.1%.
Interseguro’s investment team and its investment management approach have resulted in high investment returns. We believe that Interseguro was the first insurance company in Peru to invest in real estate as part of its investment strategy, taking advantage of high returns in the real estate sector in Peru, to diversify its investment portfolio and to extend its investment portfolio’s duration to better match its liabilities. Interseguro’s returns on its investment portfolio has outperformed the Peruvian insurance industry, achieving an average return of 9.7% from 2008 to 2013, compared to the Peruvian insurance industry’s average of 7.7%, according to data published by the SMV.
Affiliation with the Intercorp Peru group
Our ultimate parent company, Intercorp Peru, is one of Peru’s largest business groups, with activities spanning financial services, retail and real estate, among others. We believe that being part of this group gives us a competitive edge, because of the group’s deep knowledge of the Peruvian consumer, extensive focus and know-how in the Peruvian retail market, highly visible in-country presence and rapid decision-making capabilities.
Experienced management team with proven ability to foster a merit-based culture and a highly-motivated work force
We benefit from an experienced, diverse and talented management team. Most of the members of our senior management have held management positions with other major financial institutions in the United States, Latin America and Europe.
We are focused on attracting, developing and maintaining highly qualified personnel and believe that a merit-based culture that emphasizes teamwork enables them to maintain a motivated workforce that delivers high quality service. Interbank is the only Peruvian company that has been chosen by the Peruvian Great Place to Work Institute as one of the 20 best places to work in Peru for the past 12 consecutive years and one of the top 20 places to work in Latin America for the past two years. Similarly, Interseguro is the only Peruvian insurance company that has been chosen as one of the top five best places to work in Peru (medium-size category) by the Peruvian Great Place to Work Institute for the past four consecutive years, including first place in 2012 and second place in 2013 for Peru and fifth place for Latin America. Additionally, Inteligo SAB has been ranked among the top ten companies in its category (companies with 30 to 250 employees) since it started participating in the Great Place to Work institution survey in 2011, and currently it is the only Peruvian brokerage house included in the ranking.
Strategy
We aim to maintain our leadership position as one of the fastest growing and most profitable providers of financial services in Peru. We aim to provide the best customer experience to our customers based on convenient, agile and friendly service, which we believe leads to new customers and to increased satisfaction, cross-selling and retention of our existing customers.
Leverage our leading market positions in our key businesses to benefit from the significant growth potential of the financial sector
Interbank is a leader in retail banking, particularly in the issuance of credit cards, mortgage origination and payroll lending to public employees, which we believe continue to have significant growth potential in Peru. We believe that Peru’s low credit penetration combined with its strong economic growth will lead to robust growth in consumer and mortgage lending, that Interbank is well positioned to capture.
8
Table of Contents
As of December 31, 2013, the estimated total number of credit cards per inhabitant in Peru was only 0.26 as compared to 1.25 cards per inhabitant for Chile. The ratio of consumer loans-to-GDP and the ratio of mortgage loans-to-GDP in Peru were only 5.4% and 5.3%, respectively, while the averages for the group of peer countries in Latin America were 8.6% and 8.8%, respectively, as of December 31, 2013.
Interbank plans to continue to balance its growth between retail and commercial banking, as it believes that commercial lending will continue to exhibit strong growth in the coming years. We believe there are significant opportunities for Interbank in commercial banking, primarily focusing on Peruvian corporates and medium-size companies, where Interbank has a lower market share (9.0% in terms of gross loans as of December 31, 2013 according to the SBS) when compared to its retail business. Interbank focuses on high margin and fee generating products such as leasing, structured finance, cash management, trade finance and factoring in its commercial lending business.
Interseguro will continue to focus on its annuities business, which we expect to continue to benefit from the growth stemming from the increased number of retirees from the Peruvian private pension system, as well as an increase in total funds managed. Additionally, Interseguro plans to further develop its life and other insurance products targeted to individuals. We intend to capitalize on Interbank’s growing distribution network by continuing sales of insurance products in combination with banking products, and on Intercorp Peru’s extensive distribution network to continue our cross-selling efforts of low-cost premium policies.
We believe that Inteligo’s portfolio of clients and the size of its assets under management plus deposits will continue to grow along with increased wealth generation in Peru. We expect that growth of assets under management plus deposits will outpace Peru’s real economic growth driven by the accelerating demand for sophisticated wealth management services. From 2008 to 2013, Peru’s GDP grew at an average annual real rate of 6.1%, while Inteligo Bank’s assets under management plus deposits grew at a five-year CAGR of 24.5%.
Provide the most convenient, agile and friendly customer service experience through continuous innovation
We are committed to continuing to focus on innovation and providing the best possible and differentiated customer experience for our banking, insurance and wealth management clients. We intend to continue to improve the productivity of our banking distribution model, as well as our systems. We are focused on continuously improving user experience and are increasingly using our alternative channels to sell banking products, such as pre-approved loans.
Interbank aims to provide the most convenient, friendly and agile experience for its customers through a wide variety of distribution channels. To strengthen Interbank’s omni-channel offering, it will continue to invest in its digital channels. Interbank plans to continue to develop a best-in-class experience across multiple devices, including ATMs, desktop PCs, tablets and mobile phones. Interbank will continue to integrate our customer relationship management (“CRM”) and digital marketing capabilities to foster online sales of traditional and innovative products.
Even with Interbank’s extensive distribution network, we believe there is an opportunity to continue to grow physical channels in Peru because the country has one of the lowest branch and ATM penetrations as compared to the peer countries in Latin America. Interbank plans to pursue selective growth of its financial stores and use its ATM and correspondent agent networks to provide additional and more accessible points of contact to customers. In addition, Interbank will continue to improve its in-store customer experience by constantly testing new ideas and concepts through “Explora”, a full-time innovation financial store.
Interseguro markets its annuities and individual life insurance products through its own highly productive sales force to ensure its customers receive high quality financial advice and the best customer service. Interseguro’s sales agents are trained as financial advisors and are segmented according to customer needs.
9
Table of Contents
Interseguro’s CRM platform further facilitates agents maintaining a close relationship with their customers. Additionally, Interseguro offers retirees additional benefits, such as complimentary health screenings and discounts on a range of products and services.
Further develop our customer-centric vision with advanced CRM and analytics
In 2012, Interbank implemented a change from its product-based strategy in order to shift to a customer-centric vision. Having reached a substantial scale in terms of number of clients, loans and deposits, Interbank decided to increase its focus on specific profitable client segments with a customer-centric approach to improve cross-selling and retention without impacting its success in acquiring new clients. We believe that Interbank has a significant opportunity to increase its cross-selling as its number of products per customer remained low at 1.7 in 2013. As a consequence of this strategic shift, Interbank enhanced its CRM and analytics capabilities and is transforming these capabilities into a competitive advantage in the Peruvian market.
Interseguro expects to continue offering personalized and sophisticated assistance to its annuities and individual life insurance customers. The success of its customer-centric strategy is demonstrated by the fact that Interseguro is the largest annuities provider in Peru even though it does not have an affiliated pension fund administrator (“AFP”), unlike some of its competitors. Interseguro also aims to continue to develop simple and convenient retail insurance products that better serve the needs of the growing Peruvian middle class.
Inteligo will continue to focus on its target customers, providing them with advisory services, supported by a local investment team that possesses extensive knowledge of its Peruvian clients’ preferences for financial products. Inteligo’s position will further benefit from having a leading brokerage operation in Peru, Inteligo SAB, and being part of one of Peru’s leading financial groups.
Leverage existing operating capacity to generate additional revenue with low additional marginal cost
We aim to achieve high levels of profitability by leveraging our existing operating capacity. Despite the growth of our platform and portfolios, our efficiency ratio, as measured under IFRS, improved from 43.5% in the year ended December 31, 2012 to 41.5% in the year ended December 31, 2013. Interbank’s focus on cost-control strategies has led to a five-year CAGR of 9.0% in its total expenses, compared to the banking system’s 11.1%, for the period ended December 31, 2013 according to the SBS. We believe that cost control will be increasingly important in our efforts to maintain high profitability in an increasingly competitive environment. To accomplish these goals, we have invested in information technology and the development of simpler, more manageable, secure and modern business processes and platforms.
We have made substantial investments in recent years in expanding the number of our financial stores and developing our mobile platforms. Consequently, we believe we are well-positioned to significantly expand our client base without a substantial increase in expenses. Our budget for capital expenditures for the next three years is approximately S/. 460 million, primarily at Interbank, 70% of which is related to information technology expenditures and 30% is associated with expanding the number of financial stores. Among the budgeted expenditures for information technology, a substantial portion corresponds to new and ongoing IT projects intended to improve the quality and responsiveness of internal operating processes and to continue to improve our digital capabilities, CRM, cash management platform, information systems, among others, as well as product improvements.
Actively pursue cross-selling opportunities to leverage our customer base across IFS and Intercorp Peru
We are currently pursuing cross-selling opportunities, including, primarily, the sale of insurance products to our banking clients. We intend to leverage more of our and Intercorp Peru’s retail presence to cross-sell products
10
Table of Contents
across Interbank, Interseguro and Inteligo. We believe that Interbank’s current 1.9 million retail customers represent a significant opportunity to sell additional banking products and services, as well as Interseguro’s insurance products and Inteligo’s brokerage services. Additionally, we plan to capitalize on the future growth of Intercorp Peru’s retail business through its shopping malls, supermarkets, pharmacies and home improvement stores, to capture the cross-selling opportunities that those channels represent for IFS.
Continue focusing on maintaining a highly motivated team with a strong culture aligned to our strategy
We believe that a motivated workforce leads to high quality customer service, which in turn leads to satisfied customers and better results. Our commitment to fostering a motivated workforce and merit-based culture is demonstrated by being ranked among the top Peruvian and Latin American companies in all of our segments by the Great Place to Work Institute.
Interbank, Interseguro and Inteligo will continue their efforts to attract, develop and retain highly qualified personnel and to maintain a merit-based culture that emphasizes teamwork to keep a motivated workforce that delivers high quality service.
Corporate Structure
The following chart presents our corporate structure, indicating our principal subsidiaries and respective ownership interests.
History
IFS is a corporation (sociedad anónima) organized under the laws of Panama in 2006. We are the majority owner and controlling shareholder of our subsidiaries, Interbank, Interseguro and Inteligo, which comprise our banking, insurance and wealth management segments, respectively. We are responsible for coordinating, supervising and establishing their strategy and management policies. In 2007, we conducted an initial public offering of our common shares publicly in Peru and privately outside of Peru.
Interbank is an open-stock corporation (sociedad anónima abierta). Interbank was incorporated in Lima, Peru in 1897 and formerly conducted business under the names “Banco Internacional del Perú S.A.” and “Interbanc”. In August 1994, as part of the government’s privatization efforts, 91% of Interbank’s share capital
11
Table of Contents
was acquired by Corporación Interbank, which subsequently transferred its holdings in Interbank to the Rodríguez-Pastor family through Intercorp Peru, a limited liability company organized under the laws of the Commonwealth of The Bahamas that is listed on the Lima Stock Exchange. After Interbank’s acquisition by Intercorp Peru in 1994, Interbank began conducting business under the name “Interbank” as part of a rebranding and modernization effort, and has become a leading universal bank in Peru.
Interseguro is a corporation (sociedad anónima) that was incorporated in 1998 by Intercorp Peru, pursuant to an agreement between Intercorp Peru and The Bankers Trust Company (“Bankers Trust”) (at the time the controlling shareholder of Consorcio Nacional de Seguros S.A.A., the largest insurer in Chile) to benefit from the expansion of the insurance business in Peru. In connection with the sale of Bankers Trust to Deutsche Bank AG in 1999, Bankers Trust’s interest in Interseguro was sold to a group of Chilean investors, and in 2000 Intercorp Peru acquired the portion of Interseguro that it did not own.
Inteligo was incorporated under the laws of the Republic of Panama in 2006. Inteligo Bank is a corporation that was incorporated in 1995 in The Bahamas and formerly conducted business under the names of Interbank Overseas Ltd. and Blubank Ltd. It is licensed by the Central Bank of The Bahamas to conduct various types of banking, trust, financing, investment and financial advisory services activities. Inteligo SAB is a corporation (sociedad anónima)that started operations in 1993. It is organized under the laws of Peru, and is licensed by the SMV to operate in Peru and conduct brokerage, custody, portfolio management and advisory services.
On July 18, 2014, the board of directors of IFS approved the acquisition of Inteligo, effective on August 1, 2014. This reorganization entailed the acquisition of 100% of Intercorp Peru’s shares in Inteligo by IFS in exchange for 19.5 million IFS common shares.
Banking Segment
Interbank provides retail and commercial banking services to over 1.9 million total customers as of December 31, 2013. It is the fourth largest bank in Peru in terms of total assets, total loans and total deposits, with market shares of 11.4%, 11.7% and 11.7%, respectively, as of December 31, 2013 and in accordance with SBS. Interbank is focused on fast-growing and highly profitable retail banking businesses, such as credit card financing, payroll loans to public employees and mortgages, as well as Peruvian corporates and medium-size companies within commercial banking.
Given this focus, 49.1% of Interbank’s gross loans as of December 31, 2013 correspond to retail banking, compared to 34.3% for the Peruvian banking system, in accordance with the SBS. Interbank is the second largest provider of consumer financing (retail loans other than mortgages), the leading player among private banks in payroll loans to public sector employees, the second largest provider of credit card financing and the third largest bank in retail deposits in Peru. As part of its strategy to serve retail banking customers, Interbank has one of the most convenient and extensive retail banking distribution networks in Peru and is currently present in 23 of Peru’s 25 regions. Interbank serves its customers through 268 financial stores, more than 2,400 ATMs throughout Peru, which is the second largest ATM network nationwide and the largest out of branch ATM network, and more than 3,200 correspondent agents.
In the commercial banking line of business, which represents 50.9% of Interbank’s gross loans as of December 31, 2013 according to Peruvian GAAP, Interbank focuses on high margin and fee generating products such as leasing, structured finance, cash management, trade finance and factoring in its commercial lending business. These products and services are attractive not only for the financial margins they offer, but also for the fee income they generate. In addition, these products and services enhance customer loyalty and provide significant cross-selling opportunities.
For the years ended December 31, 2013 and 2012, Interbank’s net profit was S/. 615.0 million (US$220.0 million) and S/. 568.4 million, respectively. As of December 31, 2013 and 2012, Interbank had
12
Table of Contents
shareholders’ equity of S/. 2.8 billion (US$1.0 billion) and S/. 2.5 billion, respectively. Interbank’s ROE for the year ended December 31, 2013 and 2012 was 23.7% and 25.1%, respectively, and its ROA for the years ended December 31, 2013 and 2012 was 2.3% and 2.5%, respectively.
Insurance Segment
Interseguro is an insurance company that caters to Peru’s growing middle class. Interseguro is focused on annuities, the fastest growing insurance market segment in Peru, which is driven by the sale of annuities to individuals reaching retirement age in the Peruvian private pension system. Interseguro was the leader in the Peruvian annuities segment for the last four years, with a 25.0% market share by premiums for the year ended December 31, 2013.
The growth of annuities is expected to further accelerate as the number of Peruvian private pension system retirees and their respective average pension balances increase. Over the ten years ended December 31, 2013, 67 thousand people have retired under the Peruvian private pension system compared to a total of 375 thousand and nearly three million expected retirees over the next ten and 30 years, respectively, according to the SBS. In Peru, employees may choose to accumulate their retirement contribution in the public or the private pension system. Under the private pension system, a retiree has the option of converting the capital accumulated in a personal account maintained with an AFP into an annuity offered by a life insurance company, such as Interseguro. In addition to retirement annuities, Interseguro also offers disability annuities to members of the Peruvian private pension system who have been declared permanently or partially disabled, and survivorship annuities for beneficiaries of deceased members of the system. Once an annuity client chooses an insurance company, the decision is irrevocable.
Interseguro also offers traditional life insurance products, as well as low-cost premium retail insurance products, including credit life, mandatory traffic accident insurance (“SOAT”), card protection insurance, among others, mainly sold through IFS and Intercorp Peru’s complementary channels, such as Interbank financial stores and Intercorp Retail’s points of sale (Plaza Vea and Oechsle), and Interseguro’s own network of 368 specialized agents located throughout Peru. Interseguro’s life and retail insurance business lines have grown significantly over the last five years. Interseguro was the fifth largest insurance company and the fifth largest life insurance company in Peru in terms of premiums for the year ended December 31, 2013. In addition, in terms of assets Interseguro was the fourth largest insurance company and the fourth largest life insurance company in Peru as of December 31, 2013.
For the years ended December 31, 2013 and 2012, Interseguro’s net profit was S/. 281.6 million (US$100.7 million) and S/. 150.0 million, respectively. As of December 31, 2013 and 2012, Interseguro had shareholders’ equity of S/. 541.1 million (US$193.6 million) and S/. 704.9 million, respectively. Interseguro’s ROE for the years ended December 31, 2013 and 2012 was 48.2% and 27.1%, respectively. According to the SMV, for the years ended in December 31, 2013, Interseguro was the most profitable insurance company by net profit and achieved the second highest ROE, when compared to the six largest insurance companies in Peru.
Wealth Management
Inteligo is a fast-growing provider of wealth management services through Inteligo Bank and brokerage services through Inteligo SAB. Inteligo caters mainly to Peruvian high net worth individuals, particularly clients with investable assets between US$0.5 million and US$10 million who are benefitting from Peru’s rapid wealth creation. As of December 31, 2013, Inteligo Bank had assets under management plus deposits of S/. 9,260.9 million (US$3,313.4 million), having grown at a five-year CAGR of 24.5% for the period ended December 31, 2013. Increased wealth generation in Peru is expected to continue to create a market for wealth management
13
Table of Contents
services for Peruvian clients. Inteligo conducts various types of banking, trust, financing, brokerage and investing activities for high net worth individuals.
Inteligo SAB provides sales and trading operations for individual and institutional customers primarily in the Peruvian capital markets. As of December 31, 2013, Inteligo SAB was the fourth largest broker by market share in equities trading, according to the SMV.
Inteligo’s net profit for the years ended December 31, 2013 and 2012, was S/. 109.3 million (US$39.1 million) and S/. 99.3 million, respectively. As of December 31, 2013 and 2012, Inteligo had shareholders’ equity of S/. 453.7 million (US$162.3 million) and S/. 370.7 million, respectively. ROE for the years ended December 31, 2013 and 2012 was 26.5% and 28.3%, respectively, and its ROA for the years ended December 31, 2013 and 2012 was 4.2% and 4.7%, respectively. Inteligo Bank represents the principal source of net profit for Inteligo, contributing over 99% of its net profit for the year ended December 31, 2013.
Risks and Challenges
Our ability to leverage our strengths and successfully pursue the strategies described above is subject to a high degree of risk. See “Risk Factors” and the other information included in this prospectus for a discussion of factors you should consider before deciding to invest in our common shares. Such risks include, but are not limited to, the following:
| • | We are a holding company, and all of our operations are conducted by our subsidiaries. Our ability to pay dividends to you will depend on the ability of our subsidiaries to pay dividends to us. |
| • | Economic, social and political developments in Peru, including political instability, inflation and unemployment, could have a material adverse effect on our results of operations and financial condition. |
| • | A devaluation of the nuevo sol could have a material adverse effect on our financial condition and results of operations. |
| • | Interest rate changes could have a material adverse effect on our financial condition and results of operations. |
| • | The investment activities of our subsidiaries are subject to factors beyond their control and losses from their exposures could result in a material adverse effect on our financial condition and results of operations. |
| • | We could sustain losses if our asset quality declines. |
| • | Actual mortality and morbidity rates and other factors may differ from those assumed in the calculation of technical reserves and may have a material adverse effect on Interseguro’s financial condition and results of operations. |
| • | Our subsidiaries are subject to extensive supervision and regulation. Changes in existing regulations or the implementation of future regulations may adversely affect our business and results of operations. |
| • | The operations of our subsidiaries require the maintenance of banking, insurance and other licenses and any noncompliance with applicable license and operating obligations could have an adverse effect on our financial condition and results of operation. |
| • | Our subsidiaries face intense competition from other banking, insurance and financial institutions, and, if they are unable to compete successfully, our business and results of operations could be materially and adversely affected. |
14
Table of Contents
Corporate Information
Our principal executive offices are located at Av. Carlos Villarán 140, Urbanización Santa Catalina, La Victoria, Lima 13, Peru. Our telephone number is +(511) 615-9011. Our website address (the contents of which are not part of, and are not incorporated into, this prospectus) iswww.ifs.com.pe.
15
Table of Contents
SUMMARY COMBINED FINANCIAL AND OPERATING INFORMATION
The following table sets forth our summary combined financial information. The combined income statements data for the years ended December 31, 2013 and 2012 and the combined statements of financial position data as of December 31, 2013 and 2012 and January 1, 2012 (our IFRS transition date) are derived from our audited combined financial statements and related notes included elsewhere in this prospectus, which have been prepared in accordance with IFRS as issued by the IASB.
The results included below and elsewhere in this prospectus are not necessarily indicative of our future performance. The summary combined financial information presented below should be read in conjunction with “Presentation of Financial and Other Information,” “Management’s Discussion and Analysis of Results of Operations and Financial Condition” and our audited combined financial statements and related notes included elsewhere in this prospectus.
| For the years ended December 31, | ||||||||||||
| 2013 | 2013 | 2012 | ||||||||||
| (US$ in millions)(1)(2) | (S/. in millions)(1) | |||||||||||
COMBINED INCOME STATEMENTS | ||||||||||||
Net interest and similar income | 625.3 | 1,747.7 | 1,562.0 | |||||||||
Provision for loan losses, net of recoveries | (135.0 | ) | (377.2 | ) | (400.8 | ) | ||||||
|
|
|
|
|
| |||||||
Net interest and similar income after provision for loan losses | 490.3 | 1,370.5 | 1,161.3 | |||||||||
Fee income from financial services, net | 222.5 | 622.0 | 671.5 | |||||||||
Net gain on foreign exchange transactions | 65.6 | 183.4 | 193.9 | |||||||||
Net gain on sale of securities | 86.6 | 241.9 | 138.6 | |||||||||
Other revenues(3) | 77.3 | 216.1 | 185.5 | |||||||||
Total other income | 452.1 | 1,263.5 | 1,189.4 | |||||||||
Total premiums earned less claims and benefits | 32.2 | 89.9 | (60.5 | ) | ||||||||
Total other expenses | (526.3 | ) | (1,471.1 | ) | (1,318.3 | ) | ||||||
|
|
|
|
|
| |||||||
Income before translation result and income tax | 448.2 | 1,252.8 | 971.8 | |||||||||
Translation result | (4.5 | ) | (12.5 | ) | 6.5 | |||||||
Income tax | (95.1 | ) | (265.8 | ) | (213.4 | ) | ||||||
|
|
|
|
|
| |||||||
Profit for the year | 348.7 | 974.6 | 765.0 | |||||||||
|
|
|
|
|
| |||||||
Attributable to: | ||||||||||||
Equity holders of IFS | 347.1 | 970.2 | 760.9 | |||||||||
Non-controlling interest | 1.6 | 4.4 | 4.1 | |||||||||
Pro forma earnings per share(4) | 3.09 | 8.65 | 6.83 | |||||||||
Weighted average pro forma number of shares outstanding (4) | — | 109,895,694 | 110,006,980 | |||||||||
16
Table of Contents
| As of December 31, | As of January 1, | |||||||||||||||
| 2013 | 2013 | 2012 | 2012 | |||||||||||||
| (US$ in millions)(1)(2) | (S/. in millions)(1) | |||||||||||||||
COMBINED STATEMENTS OF FINANCIAL POSITION | ||||||||||||||||
Assets | ||||||||||||||||
Cash, due from banks and inter-bank funds | 2,721.3 | 7,606.0 | 5,781.3 | 2,545.0 | ||||||||||||
Trading securities and investments available-for-sale | 2,031.3 | 5,677.7 | 5,372.2 | 5,898.2 | ||||||||||||
Loans, net of unearned income | 7,571.2 | 21,161.5 | 16,711.0 | 15,002.2 | ||||||||||||
Allowance for loan losses | (248.4 | ) | (694.4 | ) | (588.6 | ) | (500.4 | ) | ||||||||
Investment property | 283.5 | 792.4 | 680.0 | 721.4 | ||||||||||||
Property, furniture and equipment, net | 205.4 | 574.2 | 562.8 | 545.8 | ||||||||||||
Other assets(5) | 379.9 | 1,061.7 | 954.9 | 795.1 | ||||||||||||
|
|
|
|
|
|
|
| |||||||||
Total assets | 12,944.2 | 36,179.2 | 29,473.5 | 25,007.4 | ||||||||||||
|
|
|
|
|
|
|
| |||||||||
Liabilities and equity | ||||||||||||||||
Deposits and obligations | 7,895.3 | 22,067.5 | 16,138.6 | 14,599.3 | ||||||||||||
Due to banks and correspondents and inter-bank funds | 1,024.0 | 2,862.1 | 2,888.7 | 1,711.9 | ||||||||||||
Bonds, notes and other obligations | 1,225.4 | 3,425.0 | 3,177.1 | 2,639.6 | ||||||||||||
Insurance contract liabilities | 1,122.4 | 3,137.2 | 2,694.5 | 2,426.8 | ||||||||||||
Other liabilities(6) | 348.8 | 975.0 | 955.3 | 695.3 | ||||||||||||
|
|
|
|
|
|
|
| |||||||||
Total liabilities | 11,616.0 | 32,466.7 | 25,854.2 | 22,072.9 | ||||||||||||
|
|
|
|
|
|
|
| |||||||||
Equity | ||||||||||||||||
Equity holders of IFS | 1,321.0 | 3,692.2 | 3,601.0 | 2,919.4 | ||||||||||||
Non-controlling interest | 7.2 | 20.2 | 18.3 | 15.1 | ||||||||||||
Total equity | 1,328.2 | 3,712.4 | 3,619.3 | 2,934.5 | ||||||||||||
|
|
|
|
|
|
|
| |||||||||
Total liabilities and equity | 12,944.2 | 36,179.2 | 29,473.5 | 25,007.4 | ||||||||||||
|
|
|
|
|
|
|
| |||||||||
17
Table of Contents
| As of and for the years ended December 31, | ||||||||||||
| 2013 | 2013 | 2012 | ||||||||||
| (US$ in millions)(1)(2) | (S/. in millions)(1) | |||||||||||
SELECTED FINANCIAL RATIOS | ||||||||||||
Performance Ratios | ||||||||||||
Net interest margin(7) | — | 5.9 | % | 6.3 | % | |||||||
Efficiency ratio(8) | — | 41.5 | % | 43.5 | % | |||||||
ROA | — | 2.9 | % | 2.8 | % | |||||||
ROE | — | 26.9 | % | 24.3 | % | |||||||
Capital and Balance Sheet Structure | ||||||||||||
Average total equity as a percentage of average total assets | — | 10.9 | % | 11.4 | % | |||||||
Total loans, net as a percentage of total deposits | — | 92.7 | % | 99.9 | % | |||||||
Capitalization ratio of Interbank(9) | — | 13.4 | % | 13.3 | % | |||||||
Solvency ratio of Interseguro(10) | 14.4 | % | 40.0 | % | ||||||||
Capitalization ratio of Inteligo Bank(11) | — | 18.6 | % | 15.9 | % | |||||||
Credit Quality | ||||||||||||
Past-due-loans as a percentage of total gross loans (at end of period) | — | 1.7 | % | 1.8 | % | |||||||
Provision expense as a percentage of total gross loans | — | 1.8 | % | 2.4 | % | |||||||
Allowance for loan losses as a percentage of past-due loans (coverage ratio) (at end of period) | — | 200.3 | % | 202.2 | % | |||||||
OTHER DATA | ||||||||||||
Assets under management plus deposits of Inteligo | 3,313.4 | 9,260.9 | 7,370.7 | |||||||||
Dividends declared(12) | — | 434.6 | 453.8 | |||||||||
Pro forma dividends per share | — | 3.95 | 4.13 | |||||||||
Exchange rate (S/. per US $1.00 at end of period) | — | 2.795 | 2.550 | |||||||||
Employees | — | 7,650 | 7,414 | |||||||||
Financial stores | — | 268 | 261 | |||||||||
ATMs | — | 2,433 | 2,403 | |||||||||
Correspondent agents | — | 3,214 | 2,535 | |||||||||
| (1) | Except for percentages and ratios, number of employees, financial stores, ATMs and correspondent agents. |
| (2) | Amounts stated in U.S. dollars as of and for the year ended December 31, 2013 have been translated fromnuevos soles at the exchange rate of S/. 2.795 = US $1.00. See “Exchange Rates”. |
| (3) | Other revenues is defined as net trading (loss) income, rental income, profit from sale of investment property, valuation gain from investment property and other. |
| (4) | See “Unaudited Pro Forma Condensed Combined Financial Information”. |
| (5) | Other assets is defined as due from customers on acceptances, accounts receivable and other assets, net and deferred income tax assets, net. |
| (6) | Other liabilities is defined as due from customers on acceptances, accounts payable, provisions and other liabilities and deferred income tax liabilities, net |
| (7) | Net interest margin is defined as (x) net interest and similar income divided by (y) average interest-earning assets. See “Selected Statistical Information”. |
| (8) | Efficiency ratio is calculated by dividing (x) salaries and employee benefits plus administrative expenses plus depreciation and amortization by (y) net interest and similar income plus other income, plus net premiums earned. |
18
Table of Contents
| (9) | Regulatory capital for Interbank is calculated in accordance with the guidelines of the Basel II Accord, as adopted by the SBS. See “Regulation and Supervision—Insurance Regulation and Supervision—Solvency Requirements and Regulatory Capital”. |
| (10) | Solvency ratio for Interseguro is calculated in accordance with SBS guidelines. See “Regulation and Supervision—Insurance Regulation and Supervision—Solvency Requirements and Regulatory Capital”. |
| (11) | Regulatory capital for Inteligo Bank is calculated in accordance with the guidelines promulgated by The Central Bank of The Bahamas. |
| (12) | Dividends include dividends declared and paid by Inteligo Bank for each year presented. See note 15(a) to our audited combined financial statements.Dividends are declared and paid in U.S. dollars. Dividends declared and paid were US$165.8 million in 2013 and US$168.4 million in 2012. |
19
Table of Contents
The following is a brief summary of the terms of this offering and should be read together with the more detailed information and financial data and statements contained elsewhere in this prospectus. For a more complete description of our common shares, see “Description of our Share Capital” in this prospectus.
Issuer | Intercorp Financial Services Inc. |
Selling Shareholders | IFH Capital Corp. |
.
| Intercorp Capital Investments Inc. |
Securities Offered by the Selling Shareholders | common shares |
Offering Price | US$ |
Option to Purchase Additional Common Shares | The selling shareholders are granting the underwriters an option, exercisable within 30 days from the date of this prospectus, to purchase up to an aggregate of additional common shares at the public offering price listed on the cover page of this prospectus, less underwriting discounts and commissions. |
Use of Proceeds | We and the selling shareholders estimate that the net proceeds from this offering will be approximately US$ , or approximately US$ if the underwriters exercise their option to purchase additional common shares in full. These amounts assume a public offering price of US$ per common share (the last reported sales price of our shares reported on the Lima Stock Exchange on , 2014), after deducting the estimated underwriting discounts and commissions and offering expenses. |
| The selling shareholders will receive all net proceeds from the sale of our common shares in this offering. We will not receive any proceeds from the sale of common shares by the selling shareholders. |
Lock-up | We and the selling shareholders, our directors and officers and our controlling shareholders, collectively owning 74.4% of our common shares as of August 1, 2014, have agreed, subject to limited exceptions, not to sell any of our common shares for a period of 180 days after the date of this prospectus without the prior approval of the representatives of the underwriters.See “Underwriting”. |
Shares Outstanding Immediately Prior to and Following the Offering | Immediately prior to and following the offering, we will have 113,110,864 common shares issued and outstanding. |
Dividends and dividend policy | We are a holding company and, as such, our ability to pay dividends is subject to the ability of our subsidiaries to pay dividends to us. See “Dividends and Dividend Policy” for further information on our dividend policy. |
20
Table of Contents
Listing | IFS’s common shares are listed on the Lima Stock Exchange under the symbol “IFS”. We will apply to list our common shares on the New York Stock Exchange under the symbol “IFSP”. |
Taxation | For a discussion of the material Peruvian, U.S. federal and Panamanian income tax consequences relating to an investment in our common shares, see “Taxation”. |
Risk Factors | Investing in our common shares involves risks. See “Risk Factors” beginning on page 22 and the other information included in this prospectus for a discussion of factors you should consider before deciding to invest in our common shares. |
21
Table of Contents
An investment in our common shares involves a high degree of risk. You should carefully consider the following risk factors, as well as the other information presented in this prospectus, before buying our common shares. The risks and uncertainties described below are not the only ones that we face. Additional risks and uncertainties that we do not know about or that we currently think are immaterial may also impair our business operations. Any of the following risks, if they actually occur, could have a material adverse effect on our financial condition and results of operations. In that event, the market price of our common shares could decline, and you may lose all or part of your investment.
Risks Relating to Our Business
We are a holding company and, as a result, our ability to pay dividends to you will depend on the ability of our subsidiaries to pay dividends to us.
As a holding company, all of our operations are conducted through our subsidiaries. Accordingly, our ability to pay dividends to you will depend upon our receipt of dividends and other distributions from our subsidiaries. There are various regulatory restrictions in the jurisdictions where our subsidiaries operate that may limit our subsidiaries’ ability to pay dividends or make other payments to us, such as the obligation to maintain minimum regulatory capital and minimum liquidity. In addition, our subsidiaries may incur indebtedness or enter into other arrangements containing terms that may restrict or prohibit the payment of dividends, the making of other distributions, or the making of loans to us. To the extent our subsidiaries do not have funds available or are otherwise restricted from paying dividends to us, our ability to pay dividends to our shareholders will be adversely affected.
As a holding company, our right to receive any distribution of assets of our subsidiaries may be effectively subordinated to the rights of our subsidiaries’ creditors, and you may have limited recourse against our subsidiaries’ assets in case of liquidation.
As a holding company, our right to receive any distribution of assets of our subsidiaries upon any subsidiary’s liquidation or reorganization or otherwise (and thus the ability of the holders of our common shares to benefit from such distribution) will be subject to the prior claims of creditors of that subsidiary. Accordingly, holders of our common shares will have rights that will effectively be subordinated to all existing and future liabilities of our subsidiaries, and, in the event of any claim against us, our shareholders may have recourse only against our assets, and not those of our subsidiaries, for payments.
Our subsidiaries are subject to extensive regulation and supervision and changes in existing regulations or the implementation of future regulations may have a material adverse effect on our financial condition and results of operations.
Interbank and Interseguro are subject to extensive regulation and supervision by the SBS. The SBS also oversees all of Interbank’s and Interseguro’s subsidiaries and their operations as well as Interbank’s branch in Panama. Interbank is also subject to regulation and oversight by the Central Reserve Bank of Peru, which, together with the SBS, has general administrative responsibilities over banks and other financial institutions, including authority to set loan loss provisions, limits on fees, regulatory capital requirements and other minimum capital adequacy and reserve requirements. In addition, banks are required to provide the SBS, on a periodic basis, with all information that is necessary to allow for its evaluation of the bank’s financial performance.
Similarly, Inteligo’s subsidiaries are regulated by governmental entities in several jurisdictions, such as The Bahamas, Panama and Peru. Inteligo Bank is subject to the regulation and supervision of the Central Bank of The Bahamas and its branch is subject to regulation by the Superintendency of Banks in Panama (Superintendencia de Bancos de Panamá), while Inteligo SAB is subject to the regulation and supervision of the SMV in Peru.
22
Table of Contents
Changes in the regulation and supervision of Interbank, Interseguro and Inteligo could have a material adverse effect on our financial condition and results of operations. For example, the SBS and the Central Reserve Bank of Peru regulate, and have in the past changed, capital structure and deposit reserve requirements, interest paid on deposit reserves, the amount of deposit reserves for which no interest is payable, rules regarding provisions for loan losses and legal lending limits applicable to Peruvian commercial banks. Furthermore, Interbank could be required to increase its level of provisions in response topro-cyclical provisioning requirements that could be activated by regulators under certain favorable macroeconomic conditions.
Since annuities began to be offered by insurance companies in 1993, the SBS has implemented major changes affecting reserve requirements for insurance companies, such as Interseguro. For example, future changes by the SBS on mortality tables used for calculating reserves for new annuities could result in a higher reserve requirement, which in turn could adversely affect Interseguro’s financial condition, or could result in lowered implied interest rates on Interseguro’s annuities. New legislation or regulations applicable to the insurance industry may adversely affect Interseguro’s ability to underwrite and price risks accurately. In addition, the SBS may change the types of and limits on eligible investments, which could force Interseguro to liquidate current investments on less favorable terms than if they were held to maturity and restrict Interseguro from making investments that its management deems to be beneficial.
We cannot predict whether and to what extent new laws and regulations, or changes to existing laws and regulations, affecting our subsidiaries’ business will be adopted in the future, the timing of any such adoption and what effect such events would have on our financial condition and results of operations.
The operations of our subsidiaries require the maintenance of banking, insurance and other licenses and any non-compliance with applicable license and operating obligations could have a material adverse effect on our financial condition and results of operations.
All banks and insurance companies established in Peru require certain authorizations issued by the SBS in order to operate in Peru. In addition, all brokerage firms operating in Peru require certain authorizations issued by the SMV in order to operate in Peru. In The Bahamas and Panama, all banks require a license to operate.
Our subsidiaries currently have the required licenses in order to conduct their operations in their corresponding jurisdictions for all of their operations. Although we believe our subsidiaries are currently in compliance with their respective existing material license and reporting obligations, there is no assurance that our subsidiaries will be able to maintain the necessary licenses in the future. The loss of a license, a breach of the terms of a license by any of our subsidiaries or the failure to obtain any further required licenses in the future could have a material adverse effect on our financial condition and results of operations. If any of our subsidiaries loses its licenses or is required to seek additional licenses, then such subsidiary will be unable to perform its operations as it is currently authorized.
Under certain circumstances, the SBS, the SMV, the Superintendency of Banks in Panama or the Central Bank of The Bahamas, as applicable, may intervene in our subsidiaries’ operations in order to prevent, control and reduce the effects of a failure of our operations.
Under the Peruvian Banking and Insurance Law and the regulations thereunder, the SBS may intervene in Interbank’s and Interseguro’s operations upon the occurrence of any of the following events:
| • | Interbank or Interseguro suspends payment of its obligations or is unable to pay its obligations as they come due; |
| • | Interbank or Interseguro breaches any of its commitments to the SBS under a surveillance regime imposed by the SBS; |
| • | Interbank’s regulatory capital is less than 50% of the minimum regulatory capital required under the Peruvian Banking and Insurance Law; |
23
Table of Contents
| • | Interbank or Interseguro experiences a deficit or reduction of more than 50% of its regulatory capital during the preceding12-month period; or |
| • | Interseguro experiences a deficit or reduction of the regulatory capital of more than 50% of its solvency equity. |
In the event of an intervention, the SBS has the power to institute measures, such as limiting the decisions that could be taken at a shareholders’ meeting, suspending our normal activities and segregating certain of Interbank’s or Interseguro’s assets and liabilities for transfer to third parties, among others. Furthermore, the SBS has the power under the Peruvian Banking and Insurance Law to declare thewind-up or liquidation of any bank or insurance company if an intervention extends for longer than 45 days, which period may be extended for another 45 days at the sole discretion of the SBS, and/or upon the occurrence of awind-up or liquidation pursuant to theLey General de Sociedades, or Peruvian General Corporations Law.
Under Peruvian capital markets law and the regulations thereunder, the SMV may intervene in Inteligo SAB’s operations upon its committing (i) significant irregularities that put the company at risk to carry out its operations as permitted by law or (ii) significant transgressions of the law, statutes and regulations promulgated by the SMV.
Under Bahamian banking regulation, the Central Bank of The Bahamas may intervene in Inteligo Bank’s operations under the occurrence of any of the following events:
| • | Inteligo Bank carries on its business in a manner detrimental to the public interest or the interests of its depositors or other creditors; or |
| • | it contravenes the provisions of Bahamian banking law or any other law, order or regulation made thereunder, or any term or condition subject to which the license was issued, either in The Bahamas or elsewhere. |
Under Panamanian Banking Law, the Superintendency of Banks in Panama (Superintendencia de Bancos de Panamá) may seize administrative and operating control of the Panama Branch of Inteligo Bank, based on any of the following grounds:
| • | upon a reasoned request of Inteligo Bank itself; |
| • | if Inteligo Bank cannot continue operations without endangering the interests of the depositors; |
| • | as a consequence of the evaluation of the report submitted by the appointed advisor; |
| • | non-compliance with the measures ordered by the Superintendency of Banks in Panama; |
| • | if Inteligo Bank carries out its operations in an illegal, negligent or fraudulent manner; |
| • | if Inteligo Bank has suspended payment on its obligations; or |
| • | if the Superintendency of Banks in Panama confirms that the capital adequacy, solvency or liquidity of Inteligo Bank has deteriorated so as to require action by the Superintendency of Banks in Panama. |
The adoption of new international banking and insurance guidelines may cause our subsidiaries to require additional capital and could cause their cost of funds to increase, which could have a material adverse effect on our financial condition and results of operations.
In December 2009, the Basel Committee announced its intention to issue a new framework (“Basel III”), related to the regulation, supervision and risk management of the banking industry. Among the changes adopted
24
Table of Contents
by Basel III were raising the quality, consistency and transparency of the capital base; enhancing risk coverage; reducing procyclicality and promoting countercyclical buffers; and addressing systemic risk and interconnectedness.
In July 2011, the SBS issued SBS Resolution8425-2011, establishing the final methodologies in the calculation and the implementation schedule of the additional capital requirements to be implemented in Peru, which, although not completely consistent with Basel III, includes requirements to cover concentration, interest rate and systemic risk, as well as certainpro-cyclical capital requirements. These new requirements are to be implemented over a period of five years which began in July 2012, at which date Interbank was in compliance with the first phase, which required a financial institution to increase its regulatory capital by 40%. Interbank was in compliance with the July 2013 requirement of 55% in additional regulatory capital and the July 2014 requirement of 70% in additional regulatory capital. For the remaining phases of the implementation period, Interbank will have to comply with an increase to its capital adequacy requirements of: (i) 85% in additional regulatory capital by July 2015; and (ii) 100% in additional regulatory capital by July 2016. Interbank expects to be in compliance with these additional capital requirements. We cannot assure you that Interbank’s assumptions with respect to compliance will turn out to be correct, nor can we assure you that the complete adoption of the new Basel III framework will not have a material adverse effect on Interbank’s financial condition and results of operations.
With respect to Interseguro, Solvency II is under consideration by international regulatory bodies, which could result in the SBS raising solvency ratio requirements for insurance companies in Peru in the future.
With respect to Inteligo Bank, The Bahamas currently adheres to Basel I, and is currently in the process of implementing certain Basel II and Basel III requirements. including more stringent capital requirements.
We cannot assess the impact of any such requirements in the future on our financial condition or results of operations.
Our controlling shareholder, Intercorp Peru, is subject to capital requirements imposed by the SBS, and Intercorp Peru’s failure to comply with these requirements could have a material adverse effect on our financial condition and results of operations.
The SBS has established minimum capital requirements for financial services holding companies on a fully consolidated basis, which the SBS evaluates on an annual basis. As a result of its direct and indirect equity interest in Interbank and Interseguro, our controlling shareholder, Intercorp Peru, is subject to these minimum capital requirements. Intercorp Peru owns businesses in addition to ours, and financial information relating to both our business and to those other businesses is used to determine compliance with the minimum capital requirements. If Intercorp Peru fails to comply with these requirements, the SBS may request Intercorp Peru to take certain actions to achieve compliance. If Intercorp Peru fails to take these actions, the SBS could suspend or revoke Interbank’s and Interseguro’s licenses to operate in Peru, which would have a material adverse effect on our financial condition and results of operations.
Our subsidiaries face intense competition from other banking, insurance and financial institutions, and failure to compete successfully, could have a material adverse effect on our financial condition and results of operations.
The banking market in Peru is highly competitive. Interbank has experienced strong competition, from local and foreign banks, including new entrants attracted by Peru’s low banking penetration, as well as from department stores that offer credit cards and the local and international capital markets that lend to commercial customers. Competition may reduce the average interest rates that Interbank can charge its customers, increase the average rates Interbank must pay on its deposits and may negatively affect its loan growth and place pressure on margins. Some of Interbank’s competitors may have access to greater resources and be more successful in the
25
Table of Contents
development of products and services that compete directly with Interbank’s products and services. If Interbank’s competitors are successful in developing products and services that are more effective or less expensive than the products and services offered by it, Interbank may be unable to compete successfully. Even if Interbank’s products and services prove to be more effective than those developed by other competitors, such other competitors may be more successful in marketing their products and services because of their greater financial resources or marketing strategies, among other factors. Interbank may not be able to grow or maintain its market share if it is not able to match its competitors’ pricing or keep pace with their development of new products and services. Adverse impact on Interbank resulting from increased competition could have a material adverse effect on our financial condition and results of operations.
The Peruvian insurance market, particularly the annuity and life insurance sectors, is also highly competitive. Interseguro’s principal competitors are large insurance companies that may have greater resources and offer a wider range of products. These insurance companies may have better access to independent brokers who sell insurance to customers. In addition, Interseguro may also face competition from private pension funds (AFPs), which could in the future be allowed to offer annuities in the future. Moreover, under the private pension system, upon retirement, a retiree has the option of choosing to remain with their pension fund or choose an annuity. Any adverse impact on Interseguro resulting from increased competition could have a material adverse effect on our financial condition and results of operations.
Similarly, if Inteligo Bank’s competitors are successful in developing products and services that are more effective or less expensive than the products and services offered by Inteligo Bank, it may be unable to compete successfully. Even if Inteligo Bank’s products and services prove to be more effective than those developed by other competitors, such other competitors may be more successful in marketing their products and services because of their greater financial resources or marketing strategies, and other factors. Competitors may also dedicate greater resources to, and be more successful in, the development of products and services that may compete directly with Inteligo Bank’s products and services. Inteligo Bank competes in a global market for wealth management services, including wealth management divisions of global banks. Such competition would adversely affect the acceptance of Inteligo Bank’s products and/or lead to adverse changes in the investing habits of Inteligo Bank’s customer base. Inteligo Bank may not be able to grow or maintain its market share if it is not able to keep pace with its competitors’ development of new products and services. Any adverse impact on Inteligo Bank resulting from increased competition could have a material adverse effect on our financial condition and results of operations.
The banking and insurance markets are exposed to macroeconomic shocks that may negatively impact household income, and consequently, could have a material adverse effect on our financial condition and results of operations.
Interbank’s strategy is to focus on the retail and commercial banking sectors and to grow and gain market share profitably. As a result, Interbank’s loan portfolio will become increasingly vulnerable to macroeconomic shocks that could negatively impact the household income of Interbank’s customers and result in increased loan losses. Furthermore, because the penetration of bank lending products in the Peruvian retail sector has been historically low, there is no basis on which to evaluate how the retail sector will perform in the event of an economic crisis, such as a recession or a significant devaluation of thenuevo sol, and Interbank’s historical loan loss experience may not be indicative of the performance of its loan portfolio in the future. In addition, our commercial clients could be negatively affected by global and local macroeconomic trends.
In the event of a macroeconomic shock, the value of Interseguro’s investments may also suffer losses, including its investment property. In addition, the amount of savings available to potential annuity holders may be negatively impacted by unemployment or a decline in wages. A macroeconomic shock may also negatively impact wealth generation in Peru, and in turn, impact the demand for our wealth management services.
26
Table of Contents
Our loans, our deposits and our profits have all experienced substantial growth, benefitting from growth in the Peruvian economy. We may not be able to continue our historically strong growth.
We have experienced significant growth over the last ten years and our loans, our deposits and our profits have all experienced substantial growth. We may not be able to continue to grow strongly or at all in the future due to factors beyond our control, which could have a material adverse effect on our financial condition and result of operations.
We could sustain losses if our asset quality declines.
Our earnings are significantly affected by Interbank’s ability to properly originate, underwrite and service loans. We could sustain losses if Interbank incorrectly assesses the creditworthiness of its borrowers or fails to detect or respond to deterioration in asset quality in a timely manner. Problems with asset quality could cause our net interest and similar income to decrease and our provisions for loan losses to increase, which could adversely affect our financial condition and results of operations.
Reduced diversification in Interbank’s loan portfolio could have a material adverse effect on our financial condition and results of operations.
While loan portfolio risk associated with lending to certain economic sectors or clients in certain market segments can be mitigated through adequate diversification policies, Interbank’s pursuit of opportunities in which it can charge higher interest rates may reduce diversification of the loan portfolio and expose Interbank to greater credit risk. Reduced diversification could expose Interbank to greater risks in the event of a decline in asset quality. Moreover, certain concentrations of borrowers’ commercial sectors may be unavoidable in Peru—principally the natural resources, fishing, agriculture and mining sectors—and deteriorations in such sectors could have a material adverse effect on Interbank’s deposits, loan performance and other businesses.
In addition, as of December 31, 2013, retail banking loans accounted for 48.9% of Interbank’s loan portfolio. Higher than average exposure to retail banking could be accompanied by greater credit risk due to higher risk profiles compared, particularly, to loans to large corporate customers. Given the significant recent growth of Interbank’s loan portfolio, historical loss experience may not be indicative of future doubtful loan experience.
The allowances of Interbank for impairment losses may not be adequate to cover the future losses to its loan portfolio or other assets, which could have a material adverse effect on our financial condition and results of operations.
Interbank records allowances for impairment losses on loans and other assets. The amount of allowances recorded is based on Interbank’s current assessment of and expectations concerning various factors affecting the quality of its loan portfolio. These factors include, among other things, Interbank’s borrowers’ financial condition, repayment abilities and repayment intentions, the realizable value of any collateral, the prospects for support from any guarantor, Peru’s economy, government macroeconomic policies, interest rates and the legal and regulatory environment. Many of these factors are beyond Interbank’s control. In addition, as these factors evolve, the models Interbank uses to determine the appropriate level of allowance for impairment losses on loans and other assets require recalibration, which can lead to increased allowances. If Interbank’s assessment of and expectations concerning theabove-mentioned factors differ from actual developments, or if the quality of its loan portfolio deteriorates or the future actual losses exceed its estimates, Interbank’s allowance for impairment losses may not be adequate to cover actual losses and it may need to make additional allowances for impairment losses, which could have a material adverse effect on our financial condition and results of operations.
27
Table of Contents
The investment activities of our subsidiaries are subject to factors beyond their control and losses from their exposures could result in a material adverse effect on our financial condition and results of operations.
As part of its treasury operations, Interbank trades various financial instruments and other assets, including debt, equity, fixed income, currency and related derivatives, as both agent and principal, and derives a proportion of itsnon-financial income from trading profits. Interbank has established position limits fornuevo sol and foreigncurrency-denominated securities in accordance with its overall risk management policy and with the SBS requirements. However, Interbank is exposed to numerous factors that are beyond its control, including overall market trading activity, interest rate levels, the credit risk of its counterparties and general market volatility. In addition, a significant part of Interbank’s trading is related to customer transactions and Interbank could be exposed to a number of risks related to the movement of market prices in the underlying instruments, including the risk of unfavorable market price movements relative to its long or short positions, a decline in the market liquidity of the related instruments, volatility in market prices, interest rates or foreign currency exchange rates relating to these positions, and the risk that the instruments with which Interbank chooses to hedge certain positions do not track the fair value of those positions. If Interbank incurs any losses from these exposures, it could reduce Interbank’s trading profits or cause it to suffer losses from trading activities, either of which could have a material adverse effect on our financial condition and results of operations.
Inteligo Bank is exposed to similar investment and trading risks as Interbank.
Interseguro is exposed to the risk of a decrease in the value of its investments due to volatility in market conditions, real estate prices, equity values and interest rates, among other factors, many of which are beyond Interseguro’s control. In addition, as a holder of a large portfolio of debt investments and fixed income securities, Interseguro is exposed to the risk that the issuer of its fixed income securities may default.
Furthermore, in all of our segments, our investments may be subject to impairment, which could adversely affect our financial condition and results of operations.
Interest rate changes could have a material adverse effect on our financial condition and results of operations.
Interbank’s and Inteligo’s financial condition and results of operations depend to a large extent on their financial margin, which in turn depends on their ability to charge interest oninterest-earning assets, such as loans to customers, that is higher than the interest they pay oninterest-bearing liabilities, such as deposits. Market interest rates are sensitive to many factors beyond their control, including the interest rate policies of the Central Reserve Bank of Peru and the U.S. Federal Reserve. Interest rates on U.S. dollars are expected to rise in the future, as the U.S. Federal Reserve begins to gradually reduce the size of its financial asset purchases under its monetary policy of “quantitative easing” implemented in response to the global economic and financial crisis. Increases in market interest rates in Peru could require Interbank to increase the interest rates it pays on deposits. If Interbank or Inteligo were unable to implement commensurate and timely increases in interest rates on loans they originate, their margins would decline. In addition, Interbank’s primary sources of funds are retail deposits with no specific or contractual maturity, and a substantial portion of the loans it originates have a longer term. The difference in maturities between deposits and loans could magnify the effect of any interest rate mismatch, as well as pose a liquidity risk if Interbank were not able to obtain funding as its liabilities mature.
Interseguro faces interest rate risk as a result of the potential variation in interest rates when it reinvests debt instruments to cover its obligations. Interseguro may reinvest when the term of its investments differs from that of its obligations. Interseguro tries to match the cash flows of its obligations with the maturities of its portfolio, but the shortage of instruments with the appropriate maturity profile may result in mismatches with its obligations, and, as a result, expose it to interest rate risk.
28
Table of Contents
Interseguro is significantly exposed to the impact of changes in interest rates on the technical reserves it estimates on new premiums for insurance products, resulting in substantial volatility in its results of operations.
Interseguro estimates its technical reserves for purposes of the combined statement of financial position under IFRS by using a discount rate that reflects the interest rate performance of the debt instruments in its portfolio, adjusted for credit risk. A decrease in prevailing interest rates will result in higher technical reserve requirements while an increase in prevailing interest rates will result in lower technical reserve requirements. As a result, the results of operations of Interseguro will reflect volatility in the interest rate environment.
Interbank may not be able to obtain the funding required to support further growth and implement its strategy.
Interbank’s strategy to continue to expand its distribution network and grow its loan portfolio will require it to continue to have an active funding strategy. Demand for loans has grown rapidly and Interbank has had to diversify its sources of funding beyond traditional deposits. Interbank’s access to funding will depend on many factors, including factors beyond our control, such as any credit crunch or other conditions in global capital markets and investors’ perceptions of the risks of investing in Peru and emerging markets generally. The recent crisis in Europe and general market volatility, for example, had a negative impact on the liquidity of global financial markets in recent months, as was the case in the 2008 and 2009 global financial and economic crisis. Any equity or debt financing, if available at all, may be on terms that are not favorable to Interbank. If access to funding is limited, Interbank may not be able to implement its strategy, which could have a material adverse effect on our financial condition and results of operations.
A reduction in our subsidiaries’ credit rating could increase their cost of borrowing funds and make their ability to raise new funds, attract deposits and renew maturing debt more difficult.
Our subsidiaries’ credit ratings are an important component of their respective liquidity profile. Among other factors, Interbank’s credit ratings are based on its financial strength, the credit quality and concentrations in its loan portfolio, the level and volatility of its earnings, its capital adequacy, the quality of management, the liquidity of its balance sheet, the availability of a significant base of core retail and commercial deposits and its ability to access a broad array of funding sources. In addition, our subsidiaries’ lenders may be sensitive to the risk of a ratings downgrade, which could increase the cost of refinancing their existing obligations, raising funds in the capital markets and borrowing funds from private lenders.
The significant share ownership of our controlling shareholder may conflict with your interests and may have an adverse effect on the future market price of our shares.
Prior to this global offering, our controlling shareholder, Intercorp Peru, owned, directly and indirectly, approximately 74.3% of our outstanding common shares. Following this global offering, we expect that Intercorp Peru owns approximately % of our outstanding common shares. Actions by Intercorp Peru with respect to the disposition of our common shares that it beneficially owns or the perception that such actions will occur, may negatively affect the trading prices of our common shares.
In addition, Intercorp Peru will be able to elect a majority of the members of our board of directors and thus determine our business strategies, as well as determine the outcome of actions that require shareholder approval, including the approval of mergers and other extraordinary transactions and the payment of dividends. The controlling shareholder of Intercorp Peru may have interests that differ from yours and may take actions that may be adverse to your interests. The concentration of ownership may also delay, prevent or deter a change in control of our company, could deprive our shareholders of an opportunity to receive a premium for their common shares as part of a sale of our company and might ultimately affect the market price of our common shares.
29
Table of Contents
In addition, we and our subsidiaries engage in numerous related party transactions with companies controlled by Intercorp Peru as well as other affiliated companies. Although Peruvian, Panamanian and Bahamian law regulate the amount of credit exposure our subsidiaries are permitted to have with our related parties, we cannot assure you that conflicts of interest will not arise.
Actual mortality and morbidity rates and other factors may differ from those assumed in the calculation of technical reserves and may have a material adverse effect on Interseguro’s financial condition and results of operations.
Interseguro calculates technical reserves on a monthly basis. Interseguro is using the mortality tables approved by the Chilean Superintendency of Securities and Insurance (Superintendencia de Valores y Seguros) and the Chilean Superintendency of Pensions (Superintendencia de Pensiones) which incorporate moreup-to-date mortality information than the ones prescribed by the SBS, resulting in longer estimated lives and higher technical reserves. Changes in the tables and assumptions we use may lead to increases in technical reserves and may have an adverse effect on Interseguro’s financial condition and results of operations.
In addition, actual mortality and morbidity rates may differ from those assumed in the initial calculation of annuity reserves at the time of the issuance of the policy and their periodic adjustments. If Interseguro’s assumptions differ materially from actual mortality rates, Interseguro could be required to make payments under its annuities for a longer period of time than originally estimated, and existing reserves could fall short of actual payments. Significant shortfalls could have a material adverse effect on our financial condition and results of operations.
A substantial portion of Interseguro’s annuity sales are attributable to a retirement program that has been recently changed and may expire in the future.
Approximately 27% of Interseguro’s total annuity premiums sold for 2013 resulted from the Peruvian government’s special early retirement program (Régimen Especial de Jubilación Anticipada), which will expire in 2016. The Peruvian government created this retirement program in 2010, which includes additional requirements with respect to qualification for early retirement, as well as conditions that may lower pension amounts. If the government fails to renew this retirement program upon its expiration, or if a renewed program provides less favorable conditions, our sales of annuities could decrease.
Interseguro’s failure to underwrite and price insurance premiums accurately for the products it offers would have a material adverse effect on its financial condition and results of operations.
Interseguro’s financial condition and results of operations depend on its ability to underwrite insurance policies and set premium rates accurately. Interseguro must generate sufficient premiums to offset claim losses and cover operating and underwriting expenses to make a profit. In order to price insurance policies accurately, Interseguro must collect and analyze a substantial volume of data, develop, test and apply appropriate rating formulae, closely monitor changes in trends in a timely fashion and project both severity and frequency of loss with reasonable accuracy. If Interseguro fails to assess accurately the risks that it assumes or does not reinsure an appropriate level of risk, it may fail to establish adequate premium rates, which could reduce income and have a material adverse effect on its financial condition and results of operations.
Interbank’s and Interseguro’s reliance on Peruvian sovereign and global bonds in their respective investment portfolios leaves us vulnerable to a default on such debt.
A substantial portion of our investment portfolio consists of Peruvian sovereign and global bonds and Central Reserve Bank of Peru certificates of deposit, which represented 28.4% and 19.5% of our investment
30
Table of Contents
portfolio as of December 31, 2013 and 2012, respectively. A default on Peruvian sovereign debt could have a material adverse effect on our financial condition and results of operations.
Interseguro may suffer losses in its investment portfolio because of risks associated with its real estate investments.
Interseguro’s investment portfolio includes real estate investments located solely in Peru. As of December 31, 2013, Interseguro’s investments in real estate projects totaled S/. 711.5 million, which represented 19.0% of Interseguro’s total investment portfolio. Real estate investments are relatively illiquid, and Interseguro’s ability to vary its portfolio of properties in response to changes in economic and other conditions is limited. If Interseguro wants or needs to sell a property, it may not be able to do so in the desired time period or on favorable terms, which could have a material adverse effect on our financial condition and results of operations.
Furthermore, Interseguro is exposed to risk in respect of its real estate investments that are under development, including delays in receiving zoning permits, construction delays, changes in regulation or lack of demand.
Interseguro also faces credit risks with respect to its real estate investments. Interseguro generally invests in land in order to develop commercial real estate projects. For these projects, Interseguro enters intolong-term leases with anchor stores (typically 10 to 20 years) andmedium-term leases with smaller stores in shopping malls (typically 2 to 5 years). In the case oflong- andmedium-term leases, Interseguro’s tenants may experience a downturn in their businesses, which could weaken their financial condition and result in the tenants’ inability to make lease payments to Interseguro in a timely manner or at all.
Interseguro’s investment properties are carried at fair value, which could result in the value of such investment properties declining if market conditions deteriorate. As a result, we could suffer an adverse impact on our financial conditions and results of operations.
Tax exemptions applicable to a substantial portion of Interseguro’s investment earnings could be changed in the future.
Interseguro pays no income tax, primarily because its earnings in respect of its technical reserves are entirely exempt from income tax. We cannot assure you that the current tax exemption will remain in place, which could have a material adverse effect on our financial condition and results of operations.
We and our subsidiaries are dependent on key personnel.
Our development, operation and growth have depended significantly upon the efforts and experience of our and our subsidiaries’ board of directors, senior management and key personnel. Although we currently expect that our and our subsidiaries’ board of directors and other senior managers will continue in their positions, we cannot assure you that they will do so. The loss of their services, or our inability to attract and retain qualified personnel to replace them, could have a material adverse effect on our financial condition and results of operations.
Interruption or failure in our subsidiaries’ information technology systems may adversely affect their operations.
As financial and insurance institutions, our success depend on the efficient and uninterrupted operation of our subsidiaries’ computer and communications hardware systems, including systems relating to the operation of Interbank’s financial stores, ATMs,Interbank-Agente correspondent agents, mobile applications and website.
31
Table of Contents
Our subsidiaries’ computer and communications systems and operations could be damaged or interrupted by fire, flood, power loss, telecommunications failure, computer viruses, physical or electronicbreak-ins and similar events or disruptions. Any of these events could cause system interruptions, delays and losses of critical data and could prevent our subsidiaries from operating at optimal levels or at all.
Any failure, interruption or breach in security of our subsidiaries’ information systems could result in failures or interruptions in their risk management, general ledger, deposit servicing, loan organization and/or other important operations, as applicable. Although our subsidiaries have developedback-up systems and a fully equipped disaster recovery center, and may continue some of their operations in case of emergency, if their information systems failed, even for a short period of time, then they may be unable to serve some or all of their customers’ needs on a timely basis. Likewise, a temporary shutdown of our subsidiaries’ information systems could result in additional costs for information retrieval and verification. In addition, failure to update and develop our subsidiaries’ existing information systems as effectively as their competitors may result in a loss of the competitive advantages that each subsidiary believes its information systems provide. Furthermore, our subsidiaries may not have adequate insurance coverage or insurance limits to be compensated for losses from a major interruption.
If our subsidiaries experience a data security breach and confidential customer information is disclosed to or accessed by third parties, their customers could be adversely affected. The collection of data and processing of transactions require our subsidiaries to receive and store a large amount of personally identifiable data. This type of data is subject to legislation and regulation in various jurisdictions. Recently, data security breaches suffered bywell-known companies and institutions have attracted a substantial amount of media attention, prompting U.S. state and federal legislative proposals addressing data privacy and security. If similar proposals are adopted in Peru, our subsidiaries may be subject to more extensive requirements to protect the personally identifiable information that they processes in connection with their services. Our subsidiaries may become exposed to potential liabilities with respect to the data that they collect, manage and process, and may incur legal costs if their information security policies and procedures are not effective or if they are required to defend their methods of collection, processing and storage of personal data. Security breaches, lawsuits or adverse publicity relating to our subsidiaries’ methods of handling personal data could have a material adverse effect on their business, financial condition and results of operations due to the costs and negative market reaction relating to such developments.
No assurance can be given that such failures, interruptions or breaches will not occur or our subsidiaries will adequately address them if they do occur. Accordingly, the occurrence of any failures, interruptions or breaches could have a material adverse effect on our subsidiaries, financial condition and results of operations, including as a result of facing significant fines, customer notice obligations or costly litigation, maintaining or upgrading their information technology systems, or performing other information technology services on a timely basis.
Our subsidiaries are susceptible to fraud, unauthorized transactions and operational errors.
Our subsidiaries are susceptible to, among other things, fraud by employees or outsiders, unauthorized transactions by employees and other operational errors (including clerical or record keeping errors and errors resulting from faulty computer or telecommunications systems). Given a high volume of transactions that may occur at a financial institution, errors could be repeated or compounded before they are discovered and remedied. In addition, a number of transactions are not fully automated, which may further increase the risk that human error or employee tampering will result in losses that may be difficult to detect quickly or at all.
While our subsidiaries maintain a system of internal controls designed to monitor and control operational risk, there can be no assurance that their system of internal controls will be effective. Losses from the failure of their system of internal controls to discover and rectify such matters could have a material adverse effect on our financial condition and results of operations.
32
Table of Contents
Any failure to comply withanti-money laundering andanti-terrorist financing laws and regulations could damage our reputation or expose us to penalties.
We believe that our subsidiaries are in compliance with applicableanti-money laundering andanti-terrorist financing laws and regulations and have adopted policies and procedures, including internal controls and“know-your-customer” procedures, aimed at preventing money laundering and terrorist financing. We believe thatanti-money laundering policies and procedures are based upon, and are in compliance in all material respects with, the applicable provisions of Peruvian, Panamanian and Bahamian law. In addition, as we also rely on our correspondent banks and reinsurance institutions having their own appropriateanti-money laundering andanti-terrorist financing procedures, we employ what we believe are commercially reasonable procedures for monitoring our correspondent banks and reinsurance institutions. However, such measures, procedures and compliance may not be completely effective in preventing third parties from using any of our subsidiaries (and our correspondent banks) as a conduit for money laundering (including illegal cash operations) or terrorist financing without our (and our correspondent banks’ and reinsurance institutions’) knowledge. If any of them were to be associated with money laundering (including illegal cash operations) or terrorist financing, our subsidiaries’ reputation could suffer and/or they could become subject to fines, sanctions or legal enforcement, including being added to any “blacklists” that would prohibit certain parties from engaging in transactions with us, which could have a material adverse effect on our financial condition and results of operations.
Risks Relating to Peru
Economic, social and political developments in Peru, including political instability, inflation and unemployment, could have a material adverse effect on our financial condition and results of operations.
Substantially all of the operations and customers of our subsidiaries are located in Peru. Accordingly, our financial condition and results of operations will be dependent on the level of economic activity in Peru. Our financial condition and results of operations could be affected by changes in economic and other policies of the Peruvian government (which has exercised and continues to exercise a substantial influence over many aspects of the private sector) and by other economic and political developments in Peru, including, devaluation, currency exchange controls, inflation and economic downturns.
In the past, Peru has experienced political instability that has included a succession of regimes with differing economic policies and programs. Previous governments have imposed controls on prices, exchange rates, local and foreign investment and international trade, restricted the ability of companies to dismiss employees, expropriated private sector assets and prohibited the remittance of profits to foreign investors. We cannot be certain whether the Peruvian government, including the administration of President Ollanta Humala who was inaugurated in July 2011, will continue to pursuebusiness-friendly andopen-market economic policies that stimulate economic growth and social stability.
During the 1980s and the early 1990s, Peru experienced severe terrorist activity targeted against, among others, the government and the private sector. Despite the suppression of terrorist activity, we cannot assure you that a resurgence of terrorism in Peru will not occur, or that if there is such a resurgence, it will not disrupt the economy of Peru and our business. In addition, Peru has, from time to time, experienced social and political turmoil, including riots, nationwide protests, strikes and street demonstrations. Despite Peru’s ongoing economic growth and stabilization, the social and political tensions and high levels of poverty and unemployment continue. Future government policies to preempt or respond to social unrest could include, among other things, expropriation, nationalization, suspension of the enforcement of creditors’ rights and new taxation policies. These policies could adversely and materially affect the Peruvian economy and our financial condition and results of operations.
33
Table of Contents
A devaluation of the nuevo sol could have a material adverse effect on our financial condition and results of operations.
As the Peruvian banking system is highly dollarized, with 46.4% of outstanding loans and 47.6% of deposits denominated in U.S. dollars as of December 31, 2013, devaluation of thenuevo sol against the U.S. dollar could have a negative impact on the ability of Interbank’s clients to repay loans and make premium payments. Within our insurance segment, a similar adverse effect could occur on Interseguro’s local debt holdings denominated in foreign currency. Despite any devaluation, and absent any change in foreign exchange regulations, Interbank and Interseguro would be required to continue to repaydollar-denominated deposits in U.S. dollars. In addition, while we seek to manage the gap between Interbank’s and Interseguro’s foreign currency-denominated assets and liabilities, by matching, for example, the volumes and maturities of Interbank’snuevo sol-denominated loans against Interbank’snuevosol-denominated deposits, we may not be successful in doing so. Therefore, any significant devaluation of thenuevo sol against the U.S. dollar could have a material adverse effect on our financial condition and results of operations.
Potential exchange controls implemented by the Peruvian government could adversely affect our ability to pay dividends and have a material adverse effect on our financial condition and results of operations.
Since 1991, the Peruvian economy has undergone a major transformation from a highly protected and regulated system to afree-market economy. During this period, protectionist and interventionist laws and policies have been dismantled gradually to create a liberal economy dominated by the private sector. Exchange controls and restrictions on remittances of profits, dividends, and royalties have ceased. Prior to 1991, Peru exercised control over the foreign exchange markets by imposing multiple exchange rates and placing restrictions on the possession and use of foreign currencies. The Peruvian economy has responded to this transformation by growing at a compound average annual rate of 4.8% during the period from 1994 to 2013. Currently, foreign exchange rates are determined by market conditions, with regularopen-market operations by the Central Reserve Bank of Peru in the foreign exchange market to reduce volatility in the value of Peru’s currency against the U.S. dollar.
Any dividends paid to us by Interbank, Interseguro and Inteligo SAB will be paid innuevos soles. While the Peruvian government currently imposes no restrictions on a company’s ability to transfer U.S. dollars from Peru to other countries, to convert Peruvian currency into U.S. dollars or to remit dividends abroad, Peru has implemented restrictive exchange controls in the past. There can be no assurance that the Peruvian government will continue to permit such transfers, conversions or remittances without any restriction. In addition, a devaluation of thenuevo sol against the U.S. dollar would decrease the dollar value of any dividends paid to us by our subsidiaries, and, as a result, that we can pay to our shareholders.
Increased inflation in Peru could have an adverse effect on the Peruvianlong-term credit market as well as the Peruvian economy generally and, therefore, on our financial condition and results of operations.
In the past, Peru has suffered through periods of high andhyper-inflation, which has materially undermined the Peruvian economy and the government’s ability to create conditions that support economic growth. In response to increased inflation, the Central Reserve Bank of Peru, which sets the Peruvian basic interest rate, may increase or decrease the basic interest rate in an attempt to control inflation or foster economic growth. Increases in the base interest rate could adversely affect our results of operations, increasing the cost of certain funding. Additionally, a return to a high inflation environment would also undermine Peru’s foreign competitiveness, with negative effects on the level of economic activity and employment, while increasing our operating costs and adversely impacting our operating margins.
34
Table of Contents
The stability of the Peruvian financial system depends on public confidence in Peruvian banking and financial institutions.
Financial institutions, including Interbank and Interseguro, depend on public confidence in the Peruvian financial system. In the event of adverse developments affecting Peru’s economic, political or social conditions or if a bank faces liquidity problems, the general public may withdraw deposits and savings from the troubled bank or from banks generally, thereby precipitating a liquidity crisis, as occurred in Peru in the late 1990s.
If depositors withdraw significant holdings from banks generally, including Interbank, there will be a substantial adverse impact on the manner in which financial institutions, including Interbank and Interseguro, conduct their business, on their ability to operate as financial intermediaries and on their financial condition, which could have a material adverse effect on our financial condition and results of operations.
The Peruvian economy could be adversely affected by economic developments in regional or global markets.
Financial and securities markets in Peru are influenced by economic and market conditions in regional or global markets. Although economic conditions vary from country to country, investors’ perceptions of the events occurring in one country may adversely affect cash flows and securities from issuers in other countries, including Peru. For example, the Peruvian economy was adversely affected by the political and economic events that occurred in several emerging economies in the 1990s, including in Mexico in 1994, which impacted the fair value of securities issued by companies from markets throughout Latin America. The crisis in the Asian markets beginning in 1997 also negatively affected markets throughout Latin America. Similar adverse consequences resulted from the economic crisis in Russia in 1998, the Brazilian devaluation in 1999 and the Argentine crisis in 2001. In addition, Peru’s economy continues to be affected by events in the economies of its major regional partners and in developed economies that are trading partners or that affect the global economy.
The 2008 and 2009 global financial and economic crisis, principally driven by the subprime mortgage market in the United States, substantially affected the international financial system, including Peru’s securities market and economy. Additionally, the more recent crisis in Europe, which began with the financial crises in Greece, Spain, Italy and Portugal, reduced the confidence of foreign investors, which caused volatility in the securities markets and affected the ability of companies to obtain financing globally. Meanwhile, renewed doubts about the pace of global growth, particularly in the United States, contributed to already weak international growth in 2011, 2012 and 2013. Any interruption to the recovery of the developed economies, the continued effects of the global crisis in 2008 and 2009, a worsening of the more recent crisis in Europe or a new economic and/or financial crisis, could affect Peru’s economy. Our business is particularly sensitive to economic and market conditions which affect products of various export industries, including textile, fishing, and agriculture. In addition, we are active in the real estate sector, which can also be highly sensitive to macroeconomic developments. Although we have relatively little exposure to the mining sector, a decline in commodity prices could negatively affect the Peruvian economy as a whole. Any increase in the number of delinquencies or defaults would result in higher levels ofnon-performing assets and provisions for loan losses, which could have a material adverse effect on our financial condition and results of operations.
A decline in the prices of certain commodities in the international markets could have a material adverse effect on our financial condition and results of operations.
In 2013, natural resource exports, in particular metals, fishmeal, agricultural products and oil and its derivatives, represented 73.4% of Peru’s total exports, according to the Central Reserve Bank of Peru figures. A decline in commodity prices in the international markets, especially metals, may have an adverse impact on government finances, which could affect both investor confidence and the sustainability of government expenditure and social programs. Thus, a decline in commodity prices could, ultimately, affect the political environment in Peru, especially as regional and local governments are particularly reliant on tax revenue from
35
Table of Contents
mining concerns. By potentially affecting private sector demand and investor confidence, lower commodity prices could also affect the banking and insurance sector, leading to, for example, lower credit demand, deteriorating asset quality and currency devaluation. A decline in commodity prices could also materially affect the finances of some of our clients that rely on revenue from natural resources.
The market volatility generated by distortions in the international financial markets may affect the Peruvian capital markets and the Peruvian banking system.
The global financial and economic crisis of 2008 and 2009 adversely affected and increased the volatility of the performance of the Lima Stock Exchange. In recent years, the Lima Stock Exchange has experienced increased participation from local and international retail investors that react rapidly to the effects from international markets. The general index of the Lima Stock Exchange increased by 65.0% in 2010, decreased by 16.7% in 2011, increased by 5.9% in 2012 and decreased by 23.6% in 2013. The volatility in the international markets may adversely affect the Peruvian capital markets and could therefore impact our ability to raise funds from local capital markets at a level necessary to fund our operations.
The Peruvian banking system has not experienced any significant liquidity problems as a result of the recent international liquidity environment, primarily because the major source of funds for local banks, including Interbank, is represented by the deposit base. However, we cannot assure you that future market volatility will not affect the Peruvian banking system, including Interbank, or that such volatility will not have a material adverse effect on our financial condition and results of operations.
The operations of Interbank, Interseguro and Inteligo SAB could be adversely affected by an earthquake or other natural disasters.
Peru is affected byEl Niño, an oceanic and atmospheric phenomenon that causes a warming of temperatures in the Pacific Ocean, resulting in heavy rains off the coast of Peru and various other effects in other parts of the world. The effects ofEl Niño, which typically occurs every two to seven years, include flooding and the destruction of fish populations and agriculture, and it accordingly can have a negative impact on Peru’s economy.El Niño could, in particular, negatively impact our agricultural and fishing loan portfolio.
Peru is also located in an area that experiences seismic activity and occasionally is affected by earthquakes. For example, in 2007, an earthquake with a magnitude of 7.9 on the Richter scale struck the central coast of Peru, severally damaging the region south of Lima. Although Interbank’s and Interseguro’s headquarters and financial stores in Peru have not been materially affected by an earthquake, a major earthquake could damage infrastructure necessary to their operations.
Although we have insured against damage caused by an earthquake and other natural disasters, accidents or other similar events (including coverage for losses due to resulting business interruption), the occurrence of an earthquake in particular and any other natural disasters in general could adversely affect our results of operations and financial condition. Further, any natural disaster will increase the probability of Interseguro having to pay the corresponding indemnification to customers under insurance policies that Interseguro sold, which would negatively affect its operating margins.
Risks Relating to the Common Shares and the Offering
There may be a lack of liquidity and market for our common shares.
Prior to this offering, there has not been a public market for our common shares in the United States. We will apply to list our common shares on the New York Stock Exchange. We cannot predict whether an active liquid public trading market for our common shares in the United States will develop or be sustained. Active, liquid trading markets generally result in lower price volatility and respond more efficiently to orders from
36
Table of Contents
investors to purchase or sell securities. Liquidity of a securities’ market is often a function of the volume of the underlying shares that arepublicly-held by unrelated parties. Our common shares are listed on the Lima Stock Exchange, which is generally a less liquid trading market than the New York Stock Exchange.
The price of our common shares may be volatile.
The trading price of our common shares following this offering may fluctuate substantially and may be higher or lower than the price you pay, depending on many factors, some of which are beyond our control and may not be related to our operating performance. These fluctuations could cause you to lose part or all of your investment in our common shares. The factors that could cause fluctuations include, but are not limited to, the following:
| • | overall price and volume fluctuations affecting the stock exchanges on which our common shares are listed; |
| • | significant volatility in the market price and trading volume of banking or insurance company securities generally; |
| • | actual or anticipated changes in our earnings, fluctuations in our operating results or the failure to meet the expectations of financial market analysts and investors; |
| • | investor perceptions of the banking and insurance industries in general and our company in particular; |
| • | the operating and stock performance of comparable companies; |
| • | general economic conditions and trends; |
| • | catastrophic events; |
| • | changes in accounting standards, policies, guidance, interpretation or principles; |
| • | regulatory changes; |
| • | loss of external funding sources; or |
| • | sales of large blocks of our stock or sales by insiders. |
We may raise additional capital in the future through the issuance of equity securities, which may result in dilution of the interests of our shareholders.
We may need to raise additional capital and may opt for obtaining such capital through the public or private placement of debt securities or securities convertible into our common shares. Our articles of incorporation do not provide for preemptive rights for our shareholders in the event of a public or private debt financing, or financing through the issuance of securities convertible into our common shares, such additional funds may dilute the percentage interests of investors in our common shares.
You may have fewer and less well defined rights than shareholders of a company organized in other jurisdictions, such as the United States.
We are asociedad anónima (corporation) organized under the laws of Panama. Our corporate affairs are governed by our organizational documents and the laws of Panama. Under such documents and laws, our shareholders, and therefore holders of our common shares, may have fewer or less well defined rights than they might have as shareholders of a corporation incorporated in other jurisdictions, such as in the United States.
You may have difficulty enforcing judgments against us, our officers and directors and our controlling shareholder.
Substantially all of our directors, officers, our controlling shareholder and certain of the experts named herein reside outside the United States, and all or substantial portions of our assets are located outside the United
37
Table of Contents
States. As a result, it may not be possible for you to effect service of process within the United States upon such persons or upon us, including with respect to matters arising under the federal securities laws of the United States, or to enforce against such persons or against us judgments of courts of the United States predicated upon the civil liability provisions of the federal securities laws of the United States.
We have been advised by our Peruvian counsel that any final and conclusive judgment for a fixed and definitive sum obtained against us in any foreign court having jurisdiction in respect of any suit, action or proceeding against us for the enforcement of any of the obligations assumed under this prospectus would, upon request, will be deemed valid and enforceable in Peru without the local court reopening the case, provided that (a) there is in effect a treaty between the country where said foreign court sits and Peru regarding the recognition and enforcement of foreign judgments or, (b) in the absence of such a treaty, the following conditions and requirements are met: (i) the judgment does not resolve matters under the exclusive jurisdiction of Peruvian courts, (ii) such court had jurisdiction under its own private international law rules and under international rules on jurisdiction, (iii) the defendant was served in accordance with the laws of the place where such proceeding took place, was granted a reasonable opportunity to appear before such foreign court and was guaranteed due process rights, (iv) the judgment has the status ofres judicata in the jurisdiction of the court rendering such judgment, (v) there is no pending litigation in Peru between the same parties for the same dispute, which shall have been initiated before the commencement of the proceeding that concluded with the foreign judgment, (vi) the judgment is not incompatible with another judgment that fulfills the requirements of recognition and enforceability established by Peruvian law unless such foreign judgment was rendered first, (vii) the judgment is not contrary to public order or good morals and (viii) it is not proven that such foreign court denies enforcement of Peruvian judgment or engages in a review of the merits thereof.
We have been advised by our Panamanian counsel that there is uncertainty as to the enforceability in original actions in Panamanian courts of liabilities predicated solely on the U.S. federal securities laws and as to the enforceability in Panamanian courts of judgments of U.S. courts obtained in actions predicated upon the civil liability provisions of the federal securities laws of the United States. There is no existing treaty between the United States and Panama for the reciprocal enforcement of foreign judgments of courts outside Panama, including without limitation, judgments of U.S. courts. Panamanian courts, however, have enforced judgments rendered in the United States based on legal principles of reciprocity and comity. We have been advised by our Panamanian counsel that judgments rendered by foreign courts may only be recognized and enforced by the courts of Panama in the event that the Supreme Court of Panama validates such judgment by the issuance of a writ of exequatur. Subject to a writ of exequatur, any final judgment rendered by any U.S. court will be recognized, conclusive and enforceable in the courts of Panama without reconsideration of the merits, provided that: (i) such foreign court grants reciprocity to the enforcement of judgments of the courts of Panama; (ii) the party against which the judgment was rendered was personally served (service by mail not being sufficient) in such action within such foreign jurisdiction; (iii) the judgment arises out of a personal action against the defendant; (iv) the obligation in respect of which the judgment was rendered is lawful in Panama and does not contradict the public policy of Panama; (v) the judgment is properly authenticated by diplomatic or consular officers of Panama or pursuant to the 1961 Hague Convention on the Legalization of Documents; and (vi) a copy of the final judgment is translated into Spanish by a licensed translator in Panama. We have no reason to believe that any of our obligations relating to the shares would be contrary to Panamanian law.
In addition, our articles of incorporation contain a general indemnification provision for our officers and directors for any loss, change or payment arising out of any claim or right of action, both individually and on our behalf, against any of them. Directors and officers and their successors and their property will be compensated for and kept safe, during the time devoted to the company in relation to any of the affairs thereof, from any action, costs, charges, losses, damages and expenses which any of them may incur or sustain by reason of any act or omission done in the performance of their duties, and none of them will be liable for the acts, neglect or omissions of others, even if his signature or action has been provided as internal or external requirement. The indemnity provision does not cover any damage or loss resulting from malice or inexcusable negligence on the part of any of our officers or directors.
38
Table of Contents
Judgments of Peruvian courts with respect to our common shares will be payable only in nuevos soles.
If proceedings are brought in the courts of Peru seeking to enforce our obligations in respect of our common shares, we will not be required to discharge our obligations in a currency other thannuevos soles. Under Peruvian exchange control limitations, an obligation in Peru to pay amounts denominated in a currency other thannuevos soles may be satisfied in Peruvian currency only at the exchange rate, as determined by the Central Reserve Bank of Peru, in effect on the date the judgment is obtained, and such amounts are then adjusted to reflect exchange rate variations through the effective payment date. The then prevailing exchange rate may not affordnon-Peruvian investors with full compensation for any claim arising out of or related to our obligations under our common shares.
Peru has different corporate disclosure and accounting standards than those you may be familiar with in the United States.
Financial reporting and securities disclosure requirements in Peru differ in certain significant respects from those required in the United States. There are also material differences among IFRS, Peruvian SBS GAAP and U.S. GAAP. Accordingly, the information about us available to you will not be the same as the information available to holders of shares issued by a U.S. company. Furthermore, we recently began preparing our financial statements in accordance with IFRS and, as a result, some of our financial data may not be easily comparable from period to period.
In addition, the Peruvian Securities Market Law, which governs open or publicly listed companies, such as us, imposes disclosure requirements that are more limited than those in the U.S. in certain important respects. Although Peruvian law imposes restrictions on insider trading and price manipulation, applicable Peruvian laws are different from those in the United States, and the Peruvian securities markets are not as highly regulated and supervised as the U.S. securities markets.
We could be considered a passive foreign investment company for U.S. federal income tax purposes, which could result in adverse U.S. tax consequences for U.S. investors.
Based on our current expectations regarding the value and nature of our assets, the sources and nature of our income, relevant market and shareholder data and our current business plans, we believe that we will not be treated as a passive foreign investment company, or PFIC, for U.S. federal income tax purposes with respect to our 2013 and current taxable year and we do not anticipate becoming a PFIC in the future. Such characterization could result in adverse U.S. tax consequences to you if you are a U.S. investor. For example, our U.S. investors may become subject to increased tax liabilities under U.S. tax laws and regulations and will become subject to burdensome reporting requirements. If you are a U.S. investor and we are treated as a PFIC for U.S. federal income tax purposes, you could be subject to an interest charge when you receive certain distributions from us or when you sell your shares. In addition, the gain from the sale of your shares generally will be treated as ordinary income, although a loss, if any, generally will be treated as capital loss. The deductibility of certain capital losses is subject to limitations. Certain elections may be available to mitigate the consequences if we are treated as a PFIC for U.S. federal income tax purposes. See “Taxation—United States Federal Income Tax Considerations—Passive Foreign Investment Companies” included elsewhere in this prospectus.
One or more of our subsidiaries could be classified as a PFIC for U.S. federal income tax purposes.
As discussed in more detail in “Taxation—United States Federal Income Tax Considerations,” U.S. investors face unique U.S. tax issues from indirectly owning interests in a PFIC that may result in adverse U.S. tax consequences to them. See “Taxation—United States Federal Income Tax Considerations—Passive Foreign Investment Companies” included elsewhere in this prospectus.
39
Table of Contents
If we are unable to implement and maintain effective internal control over financial reporting in the future, our results of operations and the price of our common shares could be adversely affected.
We are not currently required to comply with Section 404 of the U.S.Sarbanes-Oxley Act of 2002 and, therefore, we have not made a formal assessment of the effectiveness of our internal control over financial reporting for that purpose. Section 404 of the U.S.Sarbanes-Oxley Act of 2002 will require us, for our fiscal year ending December 31, 2015 and subsequent years, to document and test the effectiveness of our internal control over financial reporting in accordance with an established internal control framework and to report on our conclusion as to the effectiveness of our internal controls. It will also require an independent registered public accounting firm to test our internal control over financial reporting and to report on and attest to the effectiveness of our internal control over financial reporting. Any delays or difficulty in satisfying our requirements could adversely affect our future results of operations and the price of our common shares. Moreover, it may cost us more than we expect to comply with thesecontrol-andprocedure-related requirements. Failure to comply with Section 404 could potentially subject us to sanctions or investigations by the SEC, the New York Stock Exchange or other regulatory authorities.
Any failure to implement required new or improved controls, or difficulties encountered in their implementation, could harm our operating results or cause us to fail to meet our reporting obligations. If we are unable to conclude that we have effective internal control over financial reporting, or if our independent registered public accounting firm is unable to provide us with an unqualified opinion regarding the effectiveness of our internal control over financial reporting as of December 31, 2015 and in subsequent years as required by Section 404, investors could lose confidence in the reliability of our financial statements, which could result in a decrease in the value of our common shares.
Our status as a foreign private issuer allows us to follow alternate standards to the corporate governance standards of the NYSE, which may limit the protections afforded to investors.
We are a “foreign private issuer” within the meaning of the New York Stock Exchange (“NYSE”) corporate governance standards. Under NYSE rules, a foreign private issuer may elect to comply with the practices of its home country and not comply with certain corporate governance requirements applicable to U.S. companies with securities listed on the exchange. We currently follow certain Panamanian and Peruvian practices concerning corporate governance and intend to continue to do so. Accordingly, holders of our common shares will not have the same protections afforded to shareholders of companies that are subject to all of the NYSE corporate governance requirements.
For example, the New York Stock Exchange listing standards provide that the board of directors of a U.S. listed company must have a majority of independent directors at the time the company ceases to be a “controlled company”. The listing standards for the NYSE also require that U.S. listed companies, at the time they cease to be “controlled companies,” have a nominating/corporate governance committee and a compensation committee (in addition to an audit committee). Each of these committees must consist solely of independent directors and must have a written charter that addresses certain matters specified in the listing standards. Under both Panamanian and Peruvian law, companies may, but are not required to, form special governance committees, which may be composed partially or entirely ofnon-independent directors. In addition, NYSE rules require the independentnon-executive directors of U.S. listed companies to meet on a regular basis without management being present. There is no similar requirement under Peruvian and Panamanian law.
The NYSE’s listing standards also require U.S. listed companies to adopt and disclose corporate governance guidelines. In December 2013, the SMV published the new Code of Good Governance for Peruvian Companies. Although we have implemented these measures, those principles are not mandatory and therefore we are not legally required to comply with the corporate governance guidelines, but are required to disclose whether or not we are in compliance. We are fully compliant with Panamanian corporate law.
40
Table of Contents
If securities or industry analysts do not actively follow our business, or if they publish unfavorable research about our business, the price and trading volume of our common shares could decline.
The trading market for our common shares will depend, in part, on the research and reports that securities or industry analysts publish about us or our business. If analysts do not cover our company, the trading price for our common shares may be negatively impacted. If one or more of the analysts who covers us downgrades our common shares or publishes unfavorable research about our business, the price of our common shares would likely decline. If one or more of these analysts ceases coverage of our company or fails to publish reports on us regularly, demand for our common shares could decrease, which could cause the price and trading volume of our common shares to decline.
41
Table of Contents
SPECIAL NOTE REGARDINGFORWARD-LOOKING STATEMENTS
This prospectus contains statements that constituteforward-looking statements. These statements appear throughout this prospectus, including, without limitation, under “Summary,” “Risk Factors,” “Management’s Discussion and Analysis of Results of Operations and Financial Condition” and “Business,” and include statements regarding our current intent, belief or expectations of our officers or management with respect to (1) our strategic plans, (2) trends affecting our financial condition or results of operations, (3) the impact of competition and regulations, (4) projected capital expenditures and (5) liquidity. Suchforward-looking statements are not guarantees of future performance and involve risks and uncertainties. Actual results may differ materially from those described in suchforward-looking statements included in this prospectus as a result of various factors, many of which are beyond our control.
Factors that could cause actual results to differ materially and adversely include, but are not limited to:
| • | economic, business and political developments in Peru and globally; |
| • | exchange rate fluctuations and government measures to control foreign exchange rates; |
| • | increased inflation; |
| • | increases in interest rates; |
| • | changes in Peruvian and foreign laws and regulations, including the adoption of new capital requirements for banks or insurance companies; |
| • | increased competition in the Peruvian financial services and insurance markets; |
| • | increased costs of funding or our inability to obtain additional debt or equity financing on attractive terms; |
| • | a deterioration in our asset quality; |
| • | allowances for impairment losses may be inadequate; |
| • | changes in actuarial assumptions upon which our annuity business is based; |
| • | failure to adequately price insurance premiums; |
| • | dependence on sovereign debt in our investment portfolios; |
| • | changes in the Peruvian real estate market; |
| • | dependence on information technology systems; and |
| • | the other factors discussed under “Risk Factors” in this prospectus. |
The words “believe,” “understand,” “may,” “will,” “aim,” “estimate,” “continue,” “anticipate,” “seek,” “intend,” “expect,” “should,” “could,” “forecast” and similar words are intended to identifyforward-looking statements. You should not place undue reliance on such statements, which speak only as of the date they were made. These cautionary statements should be considered in connection with any written or oralforward-looking statements that we may issue in the future. Neither we nor the selling shareholders undertake any obligation to update publicly or to revise anyforward-looking statements after we distribute this prospectus because of new information, future events or other factors. Our independent public auditors have neither examined nor compiled theforward-looking statements and, accordingly, do not provide any assurance with respect to such statements. In light of the risks and uncertainties described above, the future events and circumstances discussed in this prospectus might not occur and are not guarantees of future performance. Because of these uncertainties, you should not make any investment decision based upon these estimates andforward-looking statements.
42
Table of Contents
The Peruviannuevo sol is freely traded in the exchange market. Current Peruvian regulations on foreign investment allow foreign equity holders of Peruvian companies to receive and repatriate 100% of the cash dividends distributed by these companies.Non-Peruvian equity holders are allowed to purchase foreign currency at free market currency rates through any member of the Peruvian banking system and transfer such foreign currency outside Peru without restriction. Peruvian law in the past, however, has imposed restrictions on the conversion of Peruvian currency and the transfer of funds abroad, and we cannot assure you that Peruvian law will continue to permit such payments, transfers, conversions or remittances without restrictions. In addition, under Panamanian law, there are currently no exchange control restrictions imposed on payments made in U.S. dollars. There can be no assurance, however, that Peruvian and Panamanian laws will continue to permit such payments, transfers, conversions or remittances without restrictions.
The following tables set forth the high, low, average andperiod-end exchange rates for the periods indicated, expressed innuevo sol per U.S. dollar. Exchange rates are derived from the selling rate exchange rates reported by the SBS fornuevo sol per U.S. dollar. The Federal Reserve Bank of New York does not report a noon buying rate fornuevo sol.
| nuevo sol per US$ | ||||||||||||||||
Year ended December 31, | High | Low | Average(1) | Period-End | ||||||||||||
2007 | 3.201 | 2.968 | 3.129 | 2.996 | ||||||||||||
2008 | 3.157 | 2.693 | 2.924 | 3.140 | ||||||||||||
2009 | 3.259 | 2.852 | 3.012 | 2.890 | ||||||||||||
2010 | 2.883 | 2.787 | 2.825 | 2.809 | ||||||||||||
2011 | 2.833 | 2.694 | 2.755 | 2.696 | ||||||||||||
2012 | 2.709 | 2.550 | 2.639 | 2.550 | ||||||||||||
2013 | 2.820 | 2.540 | 2.702 | 2.795 | ||||||||||||
| (1) | Represents the average of exchange rates on each day of each month during the periods indicated. |
| nuevo sol per US$ | ||||||||||||||||
Month Ended | High | Low | Average(2) | Period-End | ||||||||||||
January 2014 | 2.824 | 2.798 | 2.809 | 2.821 | ||||||||||||
February 2014 | 2.825 | 2.800 | 2.813 | 2.800 | ||||||||||||
March 2014 | 2.803 | 2.798 | 2.801 | 2.803 | ||||||||||||
April 2014 | 2.811 | 2.774 | 2.795 | 2.808 | ||||||||||||
May 2014 | 2.806 | 2.761 | 2.788 | 2.761 | ||||||||||||
June 2014 | 2.807 | 2.774 | 2.795 | 2.796 | ||||||||||||
July 2014 | 2.796 | 2.773 | 2.786 | 2.796 | ||||||||||||
August 2014 (through August 5, 2014) | 2.813 | 2.796 | 2.804 | 2.813 | ||||||||||||
| (1) | Represents the average of the daily exchange rates during each day of the respective month indicated. |
43
Table of Contents
The selling shareholders will receive all of the net proceeds from the sale of our common shares. We will not receive any of the net proceeds from the sale of our common shares offered by the selling shareholders.
44
Table of Contents
The following table sets forth our total combined capitalization as of December 31, 2013, derived from our audited combined financial statements prepared in accordance with IFRS.
This table should be read in conjunction with, and is qualified in its entirety by reference to, “Presentation of Financial and Other Information,” “Management’s Discussion and Analysis of Financial Condition and Results of Operations,” “Selected Statistical Information” and our audited combined financial statements and the related notes included elsewhere in this prospectus.
| As of December 31, 2013 | ||||||||
| (US$ in millions)(1) | (S/. in millions) | |||||||
Indebtedness: | ||||||||
Long-term indebtedness(2) | 1,889.5 | 5,309.1 | ||||||
Shareholders’ equity: | ||||||||
Capital stock | 374.2 | 1,046.0 | ||||||
Treasury stock | (81.5 | ) | (227.7 | ) | ||||
Capital surplus | 95.9 | 268.1 | ||||||
Retained earnings | 922.6 | 2,578.8 | ||||||
Unrealized results, net | 9.7 | 27.1 | ||||||
Equity attributable to Group’s shareholders | 1,321.0 | 3,692.2 | ||||||
Non-controlling interest | 7.2 | 20.2 | ||||||
|
|
|
| |||||
Total equity | 1,328.2 | 3,712.4 | ||||||
|
|
|
| |||||
Total capitalization | 3,227.7 | 9,021.5 | ||||||
| (1) | Calculated based on an exchange rate of S/. 2.795 to US$1.00 as of December 31, 2013. |
| (2) | Excludes current portion of long-term debt. |
45
Table of Contents
SELECTED COMBINED FINANCIAL INFORMATION
The following tables summarize our financial data for each of the periods indicated. The combined income statements data for the years ended December 31, 2013 and 2012 and the combined statements of financial position data as of December 31, 2013 and 2012 and January 1, 2012 (our IFRS transition date) are derived from our audited combined financial statements prepared in accordance with IFRS as issued by the IASB and related notes included elsewhere in this prospectus.
The results included below and elsewhere in this prospectus are not necessarily indicative of our future performance. The selected combined financial information presented below should be read in conjunction with “Presentation of Financial and Other Information,” “Management’s Discussion and Analysis of Results of Operations and Financial Condition” and our audited combined financial statements and notes to those statements included elsewhere in this prospectus.
| For the years ended December 31, | ||||||||||||
| 2013 | 2013 | 2012 | ||||||||||
| (US$ in millions)(1)(2) | (S/. in millions)(1) | |||||||||||
COMBINED INCOME STATEMENTS | ||||||||||||
Interest and similar income | 860.7 | 2,405.5 | 2,128.8 | |||||||||
Interest and similar expense | (235.4 | ) | (657.8 | ) | (566.8 | ) | ||||||
|
|
|
|
|
| |||||||
Net interest and similar income | 625.3 | 1,747.7 | 1,562.0 | |||||||||
Provision for loan losses, net of recoveries | (135.0 | ) | (377.2 | ) | (400.8 | ) | ||||||
|
|
|
|
|
| |||||||
Net interest and similar income after provision for loan losses | 490.3 | 1,370.5 | 1,161.3 | |||||||||
Other income | ||||||||||||
Fee income from financial services, net | 222.5 | 622.0 | 671.5 | |||||||||
Net gain on foreign exchange transactions | 65.6 | 183.4 | 193.9 | |||||||||
Net gain on sale of securities | 86.6 | 241.9 | 138.6 | |||||||||
Net trading (loss) income | (2.7 | ) | (7.5 | ) | 14.7 | |||||||
Rental income | 12.0 | 33.6 | 41.3 | |||||||||
Profit from sale of investment property | 1.4 | 4.0 | 17.7 | |||||||||
Valuation gain from investment property | 34.6 | 96.6 | 39.1 | |||||||||
Other | 32.0 | 89.4 | 72.7 | |||||||||
|
|
|
|
|
| |||||||
Total other income | 452.1 | 1,263.5 | 1,189.4 | |||||||||
Insurance premiums and claims | ||||||||||||
Net premiums earned | 94.4 | 263.7 | 86.9 | |||||||||
Net claims and benefits incurred for life Insurance contracts and others | (62.2 | ) | (173.8 | ) | (147.5 | ) | ||||||
|
|
|
|
|
| |||||||
Total premiums earned less claims and benefits | 32.2 | 89.9 | (60.5 | ) | ||||||||
Other expenses | ||||||||||||
Salaries and employee benefits | (224.2 | ) | (626.5 | ) | (552.6 | ) | ||||||
Administrative expenses | (228.2 | ) | (637.8 | ) | (596.1 | ) | ||||||
Depreciation and amortization | (34.5 | ) | (96.4 | ) | (86.3 | ) | ||||||
Impairment loss on available-for-sale investment | (5.0 | ) | (14.1 | ) | (7.1 | ) | ||||||
Expenses related to rental income | (2.2 | ) | (6.1 | ) | (4.0 | ) | ||||||
Other | (32.3 | ) | (90.2 | ) | (72.3 | ) | ||||||
|
|
|
|
|
| |||||||
Total other expenses | (526.3 | ) | (1,471.1 | ) | (1,318.3 | ) | ||||||
|
|
|
|
|
| |||||||
Income before translation result and income tax | 448.2 | 1,252.8 | 971.8 | |||||||||
Translation result | (4.5 | ) | (12.5 | ) | 6.5 | |||||||
Income tax | (95.1 | ) | (265.8 | ) | (213.4 | ) | ||||||
|
|
|
|
|
| |||||||
Profit for the year | 348.7 | 974.6 | 765.0 | |||||||||
|
|
|
|
|
| |||||||
46
Table of Contents
| For the years ended December 31, | ||||||||||||
| 2013 | 2013 | 2012 | ||||||||||
| (US$ in millions)(1)(2) | (S/. in millions)(1) | |||||||||||
Attributable to: | ||||||||||||
Equity holders of IFS | 347.1 | 970.2 | 760.9 | |||||||||
Non-controlling interest | (1.6 | ) | 4.4 | 4.1 | ||||||||
Pro forma earnings per share(3) | 3.09 | 8.65 | 6.83 | |||||||||
Weighted average pro forma number of shares outstanding(3) | — | 109,895,694 | 110,006,980 | |||||||||
| As of the years ended December 31, | As of January 1, | |||||||||||||||
| 2013 | 2013 | 2012 | 2012 | |||||||||||||
| (US$ in millions)(1)(2) | (S/. in millions)(1) | (S/. in millions)(1) | ||||||||||||||
COMBINED STATEMENTS OF FINANCIAL POSITION | ||||||||||||||||
Assets | ||||||||||||||||
Cash and due from banks | 2,648.0 | 7,401.1 | 5,589.3 | 2,510.6 | ||||||||||||
Inter-bank funds | 73.3 | 204.9 | 192.0 | 34.4 | ||||||||||||
Trading securities | 45.3 | 126.7 | 144.7 | 221.3 | ||||||||||||
Investments available-for-sale, net | 1,986.0 | 5,551.0 | 5,227.5 | 5,676.9 | ||||||||||||
Loans, net of unearned income | 7,571.2 | 21,161.5 | 16,711.0 | 15,002.2 | ||||||||||||
Allowance for loan losses | (248.4 | ) | (694.4 | ) | (588.6 | ) | (500.4 | ) | ||||||||
Investment property | 283.5 | 792.4 | 680.0 | 721.4 | ||||||||||||
Property, furniture and equipment, net | 205.4 | 574.2 | 562.8 | 545.8 | ||||||||||||
Other assets(4) | 379.9 | 1,061.7 | 954.9 | 795.1 | ||||||||||||
|
|
|
|
|
|
|
| |||||||||
Total assets | 12,944.2 | 36,179.2 | 29,473.5 | 25,007.4 | ||||||||||||
|
|
|
|
|
|
|
| |||||||||
Liabilities | ||||||||||||||||
Deposits and obligations | 7,895.3 | 22,067.5 | 16,138.6 | 14,599.3 | ||||||||||||
Inter-bank funds | 35.8 | 100.0 | 9.3 | 7.0 | ||||||||||||
Due to banks and correspondents | 988.2 | 2,762.1 | 2,879.4 | 1,704.9 | ||||||||||||
Bonds, notes and other obligations | 1,225.4 | 3,425.0 | 3,177.1 | 2,639.6 | ||||||||||||
Insurance contract liabilities | 1,122.4 | 3,137.2 | 2,694.5 | 2,426.8 | ||||||||||||
Other liabilities(5) | 348.8 | 975.0 | 955.3 | 695.3 | ||||||||||||
|
|
|
|
|
|
|
| |||||||||
Total liabilities | 11,616.0 | 32,466.7 | 25,854.2 | 22,072.9 | ||||||||||||
|
|
|
|
|
|
|
| |||||||||
Equity | ||||||||||||||||
Equity holders of IFS | 1,321.0 | 3,692.2 | 3,601.0 | 2,919.4 | ||||||||||||
Non-controlling interest | 7.2 | 20.2 | 18.3 | 15.1 | ||||||||||||
Total equity | 1,328.2 | 3,712.4 | 3,619.3 | 2,934.5 | ||||||||||||
|
|
|
|
|
|
|
| |||||||||
Total liabilities and equity | 12,944.2 | 36,179.2 | 29,473.5 | 25,007.4 | ||||||||||||
|
|
|
|
|
|
|
| |||||||||
47
Table of Contents
| As of and for the years ended December 31, | ||||||||||||
| 2013 | 2013 | 2012 | ||||||||||
| (US$ in millions)(1)(2) | (S/. in millions)(1) | |||||||||||
SELECTED FINANCIAL RATIOS | ||||||||||||
Performance Ratios | ||||||||||||
Net interest margin(6) | — | 5.9 | % | 6.3 | % | |||||||
Efficiency ratio(7) | — | 41.5 | % | 43.5 | % | |||||||
ROA | — | 2.9 | % | 2.8 | % | |||||||
ROE | — | 26.9 | % | 24.3 | % | |||||||
Capital and Balance Sheet Structure | ||||||||||||
Average total equity as a percentage of average total assets | — | 10.9 | % | 11.4 | % | |||||||
Total loans, net as a percentage of total deposits | — | 92.7 | % | 99.9 | % | |||||||
Capitalization ratio of Interbank(8) | — | 13.4 | % | 13.3 | % | |||||||
Solvency ratio of Interseguro(9) | 14.4 | % | 40.0 | % | ||||||||
Capitalization ratio of Inteligo Bank(10) | — | 18.6 | % | 15.9 | % | |||||||
Credit Quality | ||||||||||||
Past-due loans as a percentage of total gross loans (at end of period) | — | 1.7 | % | 1.8 | % | |||||||
Provision expense as a percentage of total gross loans | — | 1.8 | % | 2.4 | % | |||||||
Allowance for loan losses as a percentage of past-due loans (coverage ratio) (at end of period) | — | 200.3 | % | 202.2 | % | |||||||
OTHER DATA | ||||||||||||
Assets under management plus deposits of Inteligo | 3,313.4 | 9,260.9 | 7,370.7 | |||||||||
Combined dividends declared(11) | — | 434.6 | 453.8 | |||||||||
Pro forma dividends per share | — | 3.95 | 4.13 | |||||||||
Exchange rate (S/. per US $1.00 at end of period) | — | 2.795 | 2.550 | |||||||||
Employees | — | 7,650 | 7,414 | |||||||||
Financial stores | — | 268 | 261 | |||||||||
ATMs | — | 2,433 | 2,403 | |||||||||
Correspondent agents | — | 3,214 | 2,535 | |||||||||
| (1) | Except for percentages and ratios, number of employees, financial stores, ATMs and correspondent agents. |
| (2) | Amounts stated in U.S. dollars as of and for the year ended December 31, 2013 have been translated fromnuevos soles at the exchange rate of S/. 2.795 = US $1.00. See “Exchange Rates”. |
| (3) | See “Unaudited Pro Forma Condensed Combined Financial Information”. |
| (4) | Other assets is defined as due from customers on acceptance, accounts receivable and other assets, net and deferred income tax, net. |
| (5) | Other liabilities is defined as due from customers on acceptances, accounts payable, provisions and other liabilities and deferred income tax liabilities, net. |
| (6) | Net interest margin is defined as (x) net interest and similar income divided by (y) average interest-earning assets. |
| (7) | Efficiency ratio is calculated by dividing (x) salaries and employee benefits plus administrative expenses plus depreciation and amortization by (y) net interest and similar income plus other income, plus net premiums earned. |
| (8) | Regulatory capital for Interbank is calculated in accordance with the guidelines of the Basel II Accord, as adopted by the SBS. See “Regulation and Supervision—Insurance Regulation and Supervision—Solvency Requirements and Regulatory Capital”. |
| (9) | Solvency ratio for Interseguro is calculated in accordance with SBS guidelines. See “Regulation and Supervision—Insurance Regulation and Supervision—Solvency Requirements and Regulatory Capital”. |
| (10) | Regulatory capital for Inteligo Bank is calculated in accordance with the guidelines promulgated by the Central Bank of The Bahamas. |
| (11) | Dividends include dividends declared and paid by Inteligo Bank for each year presented. Dividends are declared and paid in U.S. dollars. Dividends declared and paid were US$165.8 million in 2013 and US$168.4 million in 2012. |
48
Table of Contents
UNAUDITED PRO FORMA CONDENSED COMBINED FINANCIAL INFORMATION
The following unaudited condensed combined pro forma financial information gives pro forma effect to: (i) the spin-off of Inteligo’s real estate subsidiaries, Inteligo Real Estate Corp. and Inteligo Real Estate Perú, and (ii) the transfer of all of the issued and outstanding common shares of Inteligo to us in exchange for the issuance of 19,495,413 of our common shares. Our common shares were issued to two subsidiaries of Intercorp Peru for the common shares of Inteligo at an exchange ratio of 23.28:1, at a price per share of US$32.7. The 30 calendar day-weighted average price per share on the Lima Stock Exchange of IFS’ common shares, prior to July 18, 2014, the date on which IFS’ board of directors approved the acquisition of Inteligo, was US$32.7.
Under IFRS, reorganizations under common control, such as the reorganization described in the preceding paragraph, are accounted for at carry-over book value, and therefore no fair value adjustments or goodwill have been recognized and all amounts have been accounted for at their original book values. The pro forma financial information set forth in this section includes condensed combined statements of financial position and condensed combined income statements for the same dates and periods presented in our audited combined financial statements included in this prospectus. The pro forma adjustments reflect the spin-off of Inteligo Real Estate Corp. and Inteligo Real Estate Perú and the issuance of IFS’ shares, as if they had occurred on the date of each respective condensed combined statement of financial position for the purposes of the pro forma condensed combined statements of financial position and as of the beginning of each period presented for purposes of the pro forma condensed combined income statements.
The historical combined financial information included in this unaudited pro forma condensed combined financial information was derived from our audited combined statements of financial position included in this prospectus.
The unaudited pro forma combined financial information is not intended to represent or be indicative of our financial position or results of operations in future periods or the results that actually would have been realized had the transactions occurred as at the dates presented herein. The unaudited condensed combined pro forma financial information, including notes thereto, is qualified in its entirety by reference to, and should be read in conjunction with, our audited combined financial statements and notes thereto included with this prospectus.
49
Table of Contents
The following tables present the impact of the transactions on our combined statements of financial positions as of December 31, 2013 and 2012, and as of January 1, 2012 (IFRS transition date). For presentation purposes, assets and liabilities accounts are not presented as there is no impact to their corresponding historical amounts included in our audited combined statements of financial position as a result of the pro forma adjustments.
| As of December 31, 2013 | ||||||||||||
| As shown in our Historical Combined Statement of Financial Position | Pro forma adjustments | Pro forma balance | ||||||||||
| (S/. in millions) | ||||||||||||
Equity | ||||||||||||
Attributable to IFS’s equity holders | ||||||||||||
Capital stock(1) | 1,046.0 | 1,528.4 | 2,574.4 | |||||||||
Reserve—capital contribution adjustment(1) | — | (1,528.4 | ) | (1,528.4 | ) | |||||||
Treasury stock | (227.7 | ) | (227.7 | ) | ||||||||
Capital surplus | 268.1 | 268.1 | ||||||||||
Unrealized results, net | 27.1 | 27.1 | ||||||||||
Retained earnings(1) | 2,578.8 | (82.6 | ) | 2,496.2 | ||||||||
Non-controlling interest(1.iii)(2) | 20.2 | 82.6 | 102.8 | |||||||||
|
|
|
| |||||||||
Total equity | 3,712.4 | 3,712.4 | ||||||||||
| As of December 31, 2012 | ||||||||||||
| As shown in our Historical Combined Statement of Financial Position | Pro forma adjustments | Pro forma balance | ||||||||||
| (S/. in millions) | ||||||||||||
Equity | ||||||||||||
Attributable to IFS’s equity holders | ||||||||||||
Capital stock(1) | 1,046.0 | 1,528.4 | 2,574.4 | |||||||||
Reserve—capital contribution adjustment(1) | (1,528.4 | ) | (1,528.4 | ) | ||||||||
Treasury stock | (191.4 | ) | (191.4 | ) | ||||||||
Capital surplus | 268.1 | 268.1 | ||||||||||
Unrealized results, net | 451.2 | 451.2 | ||||||||||
Retained earnings(1) | 2,027.1 | (57.2 | ) | 1,969.9 | ||||||||
Non-controlling interest(1.iii)(2) | 18.3 | 57.2 | 75.5 | |||||||||
|
|
|
| |||||||||
Total equity | 3,619.3 | 3,619.3 | ||||||||||
| As of January 1, 2012 | ||||||||||||
| As shown in our Historical Combined Statement of Financial Position | Pro forma adjustments | Pro forma balance | ||||||||||
| (S/. in millions) | ||||||||||||
Equity | ||||||||||||
Attributable to IFS’s equity holders | ||||||||||||
Capital stock(1) | 1,046.0 | 1,528.4 | 2,574.4 | |||||||||
Reserve—capital contribution adjustment(1) | — | (1,528.4 | ) | (1,528.4 | ) | |||||||
Treasury stock | (201.2 | ) | (201.2 | ) | ||||||||
Capital surplus | 268.1 | 268.1 | ||||||||||
Unrealized results, net | 101.0 | 101.0 | ||||||||||
Retained earnings(1) | 1,705.5 | (47.3 | ) | 1,658.2 | ||||||||
Non-controlling interest(1.iii)(2) | 15.1 | 47.3 | 62.4 | |||||||||
|
|
|
| |||||||||
Total equity | 2,934.5 | 2,934.5 | ||||||||||
50
Table of Contents
The following tables present the impact of the transactions on our combined income statements for the years ended December 31, 2013 and 2012. For presentation purposes, income and expense items are not presented as there is no impact to their corresponding amounts included in our audited combined income statements as a result of the pro forma adjustments.
| For the year ended December 31, 2013 | ||||||||||||
| As shown in our Historical Combined Income Statement | Pro forma adjustments | Pro forma balance | ||||||||||
| (S/. in millions, except per share data) | ||||||||||||
Profit for the year | 974.6 | 974.6 | ||||||||||
Attributable to: | ||||||||||||
Equity holders of IFS(2) | 970.2 | (19.8 | ) | 950.4 | ||||||||
Non-controlling interest(2) | 4.4 | 19.8 | 24.2 | |||||||||
Basic and diluted pro-forma earnings per share to IFS(3)(4) | 8.65 | |||||||||||
Weighted average number of pro-forma outstanding shares(3) | 90,400,281 | 19,495,413 | 109,895,694 | |||||||||
| For the year ended December 31, 2012 | ||||||||||||
| As shown in our Historical Combined Income Statement | Pro forma adjustments | Pro forma balance | ||||||||||
| (S/. in millions, except per share data) | ||||||||||||
Profit for the year | 765.0 | 765.0 | ||||||||||
Attributable to: | ||||||||||||
Equity holders of IFS(2) | 760.9 | (9.8 | ) | 751.1 | ||||||||
Non-controlling interest(2) | 4.1 | 9.8 | 13.9 | |||||||||
Basic and diluted pro-forma earnings per share to IFS(3)(4) | 6.83 | |||||||||||
Weighted average number of pro-forma outstanding shares(3) | 90,511,567 | 19,495.413 | 110,006,980 | |||||||||
| (1) | Adjustments related to the impact on the equity accounts as a result of the capitalization of the net assets of Inteligo and the spin-off of Inteligo’s real estate subsidiaries, as follows: |
| i. | The capital increase represents the difference between: (a) the fair value of the shares of IFS issued to acquire Inteligo in the total amount of S/. 1,774,800, based on a price per share of US$ 32.70 and the exchange rate fromnuevos soles to U.S. dollars of 2.784, and, (b) the capital stock of Inteligo that was included as part of the combined capital stock of S/. 246,400, for December 31, 2013 and 2012 and January 1, 2012. |
| ii. | The capital contribution reserve represents the difference between the fair value of the shares of IFS issued and the book value of the capital stock of Inteligo that was acquired, as the share exchange ratio was performed at fair value while the pooling of interests method was used to account for the acquisition of Inteligo, which requires all amounts to be accounted for at book value. In addition, for statutory purposes the capital stock of IFS post reorganization will remain at book value. |
| iii. | The decrease in retained earnings and corresponding increase in equity attributable to non-controlling interests represent the spin-off of Inteligo Real Estate Corp. and Inteligo Real Estate Perú whose only significant holding at the time of the reorganization was 39.33% of an investment property valued at S/.209.9 million, S/. 145.4 million and S/. 120.4 million at December 31, 2013, 2012 and January 1, 2012, respectively (see (2) below). |
| (2) | Adjustment related to investment property of Inteligo Real Estate Corp. and Inteligo Real Estate Perú. Interseguro sold a 39.33% participation of such investment property to Inteligo on December 17, 2013, however, since such investment property belonged to Interseguro throughout all periods presented within the audited combined financial statements of IFS to date and will continue to be consolidated by IFS after the reorganization, the impact of the corresponding adjustments is limited to equity and profit for the year |
51
Table of Contents
| attributable to the equity holders of IFS and non-controlling interest for all periods presented in the pro forma financial information. The pro forma adjustment in the income statements is equivalent to 39.33% of the unrealized profit recognized in IFS’ audited combined financial statements for each period of S/. 50.4 million and S/. 25.0 million for the years ended December 31, 2013 and 2012, respectively. There is no income tax impact as a result of this pro forma adjustment as Interseguro is not affected by income tax and the property did not generate any unrealized gain for Inteligo after it was transferred on December 17, 2013. |
| (3) | The table below presents the impact of the reorganization on the number of shares of IFS as of December 31, 2013, 2012 and January 1, 2012 considering the shares issued to acquire Inteligo. |
| Outstanding shares of IFS | Shares issued to acquire Inteligo | Pro forma number of shares | ||||||||||
As of January 1, 2012 | 90,522,711 | 19,495,413 | 110,018,124 | |||||||||
As of December 31, 2012 | 90,500,423 | 19,495,413 | 109,995,836 | |||||||||
As of December 31, 2013 | 90,300,140 | 19,495,413 | 109,795,553 | |||||||||
Weighted average number of shares for the year ended December 31, 2012 | 90,511,567 | 19,495,413 | 110,006,980 | |||||||||
Weighted average number of shares for the year ended December 31, 2013 | 90,400,281 | 19,495,413 | 109,895,694 | |||||||||
| (4) | The table below presents the impact on earnings per share for the years ended December 31, 2013 and 2012 considering the pro forma number of shares of the corresponding periods: |
| Year ended December 31, | ||||||||
| 2013 | 2012 | |||||||
| (S/. in millions, except per share data) | ||||||||
Pro forma combined profit for the year attributable to equity holders | 950.4 | 751.1 | ||||||
Pro forma basic and diluted earnings per share attributable to equity holders of IFS | 8.65 | 6.83 | ||||||
Dividends per share
The table below presents the impact on dividends per share for the years ended December 31, 2013 and 2012 considering the pro forma number of shares of the corresponding periods:
| Year ended December 31, | ||||||||
| 2013 | 2012 | |||||||
| (S/. in millions, except per share data) | ||||||||
Dividends distributed in the year(i) | 434.6 | 453.8 | ||||||
Pro forma dividends per share | 3.95 | 4.13 | ||||||
| (i) | Includes dividends paid to minority shareholders in subsidiaries of IFS (see Statement of Changes in Shareholders’ Equity in the audited combined financial statements). |
52
Table of Contents
MANAGEMENT’S DISCUSSION AND ANALYSIS OF RESULTS OF OPERATIONS AND FINANCIAL CONDITION
The following discussion should be read in conjunction with our audited combined financial statements, together with the notes thereto, included elsewhere in this prospectus. Unless otherwise indicated, all financial information provided in this section has been prepared in accordance with IFRS.
Overview
IFS is a leading provider of financial services in the fast-growing, underpenetrated and profitable Peruvian financial system. Through one of the largest distribution networks in Peru (as measured by the number of financial stores, ATMs, correspondent agents and sales force), IFS provides a wide range of products spanning banking, insurance and wealth management services to individual and commercial clients.
Our main subsidiaries are Interbank, a universal bank, Interseguro, an insurance company, and Inteligo, a wealth management services provider. We operate our subsidiaries through a coordinated strategy, focusing on specific businesses which we believe offer high growth opportunities. We are the second largest provider of consumer loans (retail loans other than mortgages) in Peru in terms of total loans outstanding, the leading provider of annuities in terms of premiums, and operate a fast-growing wealth management business.
Inteligo was acquired by IFS effective on August 1, 2014. We believe that Inteligo strengthens our position as a leading provider of diversified financial services in Peru, since it complements our banking and insurance segments with a rapidly growing and highly profitable wealth management business. Inteligo benefits from a recurring source of fee income from financial advisory services catering to the increasing number of high net worth individuals in Peru.
Factors Affecting Our Results of Operations
Substantially all of our subsidiaries’ operations are conducted in Peru. Accordingly, our results of operations and financial condition are dependent on economic conditions, consumer spending and investment levels in Peru. During the 1980s, Peru experienced a severe economic crisis and high levels of inflation. Beginning in the 1990s, however, the Peruvian government implemented a series of structural reforms, which helped stabilize the Peruvian economy and foster continued GDP growth, lower inflation and interest rates, more stable currency and significantly improved public finances. As a result, according to the IMF, the Peruvian economy was the second fastest growing economy in Latin America in terms of GDP growth rate between 2008 and 2013.
The table below sets forth additional details regarding Peru’s recent economic performance.
| 2013 | 2012 | 2011 | 2010 | 2009 | 2008 | |||||||||||||||||||
Peruvian real GDP growth rate | 5.8 | % | 6.0 | % | 6.5 | % | 8.5 | % | 1.0 | % | 9.1 | % | ||||||||||||
Internal demand growth | 7.0 | % | 8.0 | % | 7.7 | % | 14.9 | % | (3.3 | )% | 13.6 | % | ||||||||||||
Fixed private investment (real growth) | 6.4 | % | 15.6 | % | 11.0 | % | 25.9 | % | (9.1 | )% | 23.9 | % | ||||||||||||
Reference interest rate | 4.0 | % | 4.3 | % | 4.3 | % | 3.0 | % | 1.3 | % | 6.5 | % | ||||||||||||
Fiscal surplus (deficit) (% of GDP) | 0.9 | % | 2.3 | % | 2.0 | % | (0.2 | )% | (1.4 | )% | 2.5 | % | ||||||||||||
Variation in Consumer Price Index (“CPI”) | 2.9 | % | 2.6 | % | 4.7 | % | 2.1 | % | 0.2 | % | 6.7 | % | ||||||||||||
Unemployment rate (quarterly moving average) | 5.7 | % | 5.6 | % | 7.0 | % | 7.2 | % | 7.9 | % | 7.8 | % | ||||||||||||
Disposable income growth | 5.9 | % | 6.9 | % | 7.4 | % | 11.4 | % | 1.1 | % | 7.5 | % | ||||||||||||
Public external debt as a percentage of Peruvian GDP | 8.8 | % | 9.8 | % | 11.4 | % | 13.2 | % | 16.4 | % | 16.8 | % | ||||||||||||
Net international reserves (US$ in millions) | 65,663 | 63,991 | 48,816 | 44,105 | 33,135 | 31,196 | ||||||||||||||||||
Sources: Central Reserve Bank of Peru, INEI and the Peruvian Ministry of Economy and Finance.
The global economy experienced a period of significant financial instability in 2008 and 2009, accompanied by the worst global economic downturn in many decades. The Peruvian economy, while affected, was one of the
53
Table of Contents
few economies in Latin America to experience growth in 2009. Peru’s real GDP grew at a rate of 1.0% in 2009, supported by the Peruvian government’s fiscal stimulus programs. Furthermore, Peru continues to be one of six countries in Latin America, along with Brazil, Chile, Colombia, Mexico and Panama, to have its sovereign debt rated investment grade by S&P, Fitch and Moody’s. The Peruvian government’s conservative fiscal policy, coupled with the Central Reserve Bank of Peru’s responsible management of inflation and international reserves has helped Peru to improve and maintain investment grade ratings by Moody’s (A3), S&P (BBB+) and Fitch (BBB+). In July 2014, Moody’s upgraded Peru’s credit rating from Baa2 to A3, turning Peru into one of three countries in Latin America to benefit from such ratings. Peru’s credit ratings are subject to periodic review, and may be revised or lowered in the future.
The Peruvian economy experienced a strong recovery during 2010, 2011, 2012 and 2013, with real GDP growing 8.5%, 6.5%, 6.0% and 5.8%, respectively. This increase was primarily driven by higher internal demand and stronger private investment, both of which grew at a five-year CAGR of 6.7% and 9.3%, respectively, during the same period.
Primarily as a result of increasing economic output, growing investments and higher consumer confidence, the financial industry in Peru has experienced significant growth in recent years. Gross loans outstanding in the Peruvian banking system have grown at a five-year CAGR of 13.0%, from S/. 91.9 billion to S/. 169.6 billion, for the period ended 2013. Gross premiums in the Peruvian insurance industry have grown at a five-year CAGR of 15.9% from S/. 4.3 billion to S/. 9.1 billion for the period ended December 31, 2013.
Interest Rates
In general, increases in prevailing interest rates result in more interest revenue from loans. An increase of prevailing interest rates may, however, adversely affect Interbank as a result of reduced overall demand for loans and greater risk of default by its clients. In addition, relatively high interest rates affect Interbank’s funding costs, and can adversely affect spreads on its loan portfolio if Interbank is unable to pass on the increased funding costs to its clients. On the other hand, a decrease in interest rates can reduce Interbank’s revenue from its loan portfolio. This revenue decrease could be offset by an increase in the volume of loans resulting from higher demand and/or a decrease in Interbank’s funding costs.
Increased competition in Peru has created downward pressure on interest rates for retail loans, particularly consumer loans and mortgages. Local interest rates on commercial loans and deposits decreased in 2011 following the trend in international interest rates and increased competition. Interest rates in the commercial banking sector have become more competitive as larger borrowers have been increasingly accessing the international capital markets. We have mitigated the impact of such increased competition by focusing on medium-size companies and individuals. Over the last two years interest rates have remained relatively low. Interest rates on U.S. dollars are expected to rise in the future, as the U.S. Federal Reserve begins to gradually reduce the size of its financial asset purchases under its monetary policy of “quantitative easing” implemented in response to the global economic and financial crisis of 2008 and 2009.
Increases in interest rates negatively affect the value of Interseguros’ fixed income portfolio. However, higher rates allow Interseguro to reinvest new annuities at a higher yield. At the same time, increases in interest rates result in an increase in the discount rate Interseguro uses to calculate its reserve requirements, which has the effect of reducing Interseguro’s required technical reserves. Conversely, if interest rates fall, Interseguro’s portfolio will have a lower average interest rate, resulting in Interseguro having to record higher technical reserves. See note 3.3(b) to our audited combined financial statements.
Similar to Interbank, an increase in prevailing interest rates may adversely affect Inteligo as a result of reduced overall demand for loans, as well as lower interest margins if Inteligo is unable to pass on higher funding costs to its clients. On the other hand, a decrease in interest rates may reduce Inteligo’s revenue from its loan portfolio. Furthermore, a portion of Inteligo’s revenues corresponds to earnings from its investment portfolio and
54
Table of Contents
is therefore exposed to interest rates fluctuations that may affect revenue from fixed-income instruments. Increases in interest rates result in additional interest income from Inteligo’s variable-rate investments, but may also result in capital losses on its fixed-rate investments.
Inflation
Our performance may be impacted by inflation, because substantially all of our assets are not adjusted for the effects of inflation. During the 1980s, Peru experienced hyperinflation, negative economic growth and substantial currency devaluation. Inflation rates in Peru began to decrease in the 1990s and in the last 12 years Peru had one of the lowest average inflation rates in the region, partly due to the monetary policy implemented by the Central Reserve Bank of Peru and partly due to the conservative fiscal policy of the Peruvian government. In 2002, in order to maintain low inflation rates, the Central Reserve Bank of Peru established an annual inflation target of 2.5% within a range of one percentage point. In 2007, the target was lowered to 2.0%, within a range of one percentage point. The Central Reserve Bank of Peru has maintained its target inflation range ever since. The inflation rate in Peru, as measured by changes in the consumer price index by the INEI, was 6.7% in 2008, 0.2% in 2009, 2.1% in 2010, 4.7% in 2011, 2.6% in 2012 and 2.9% in 2013.
Depreciation and Appreciation of the Nuevo Sol
Thenuevo sol floats freely against other currencies. Nevertheless, the Central Reserve Bank of Peru participates in the market (buying or sellingnuevos soles) in order to avoid any large fluctuations in the exchange rate because of the effects that it could cause to the Peruvian economy, which remains partly dollarized. As a significant portion of our subsidiaries’ assets and liabilities are denominated in U.S. dollars and our financial statements are prepared innuevos soles, the results reflected in our audited combined financial statements are affected by fluctuations in the exchange rates between thenuevo sol and the U.S. dollar.
Thenuevo sol has been subject to significant devaluation against the U.S. dollar and other foreign currencies in the past. However, from early 2009 to early 2013, thenuevo sol appreciated against the U.S. dollar and other foreign currencies. During the second quarter of 2013, the U.S. Federal Reserve’s decision to gradually reduce the size of its monetary stimulus resulted in thenuevo sol depreciating against the U.S. dollar. Notwithstanding this depreciation, since June 2013, thenuevo sol has remained relatively stable, and as of June 2014, its value against the U.S. dollar was in line with its early 2011 value. Any future changes in the value of thenuevo sol against the U.S. dollar and other foreign currencies could adversely affect our financial condition and results of operations to the extent that our subsidiaries maintain a gap between foreign denominated assets and liabilities. See “Exchange Rates”.
The Peruvian government has adopted a policy to encourage the de-dollarization of the Peruvian economy. This policy includes promoting the development of anuevo sol capital market and local currency yield curves. In addition, the government is promoting thenuevo sol-denominated components of government sponsored mortgage subsidy programs (mainlyNuevo Crédito Mivivienda andCrédito Complementario Techo Propio) to fosterlong-term financing in local currency. The proportion of outstanding loans in the banking system denominated in U.S. dollars has fallen from 55.9% as of December 31, 2008 to 46.2% as of December 31, 2013, according to figures published by SBS. In addition, the percentage of deposits in the banking system denominated in U.S. dollars was approximately 55.6% as of December 31, 2008 compared to 47.4% as of December 31, 2013. Interbank’s proportion of loans innuevos solesgrew from 54.9% as of December 31, 2012 to 57.4% as of December 31, 2013, while deposits innuevos soles grew from 58.0% as of December 31, 2012 to 61.4% as of December 31, 2013.
As of December 31, 2013, 53.1% of Interseguro’s investment portfolio was invested innuevos soles and 46.9% was invested in U.S. dollars. According to Interseguro’s investment policy, it allocates the currency of its investment portfolio to mitigate potential currency volatility between its investment assets and its insurance liabilities.
Substantially all of Inteligo’s financial assets and liabilities are denominated in U.S. dollars.
55
Table of Contents
Monetary Policy
Since April 2010, as a result of significant economic growth, the Central Reserve Bank of Peru began tightening its monetary policy, raising the reference rate and increasing reserve requirements. This tightening policy had the goal of mitigating speculative capital inflows and cooling the expansion of credit. For example, as of June 2014, the minimum legal reserve requirement for local and foreign currency deposits was 9.0%, compared to 6.0% as of May 2010. Since June 2014, foreign currency deposits collected from the general public are subject to a 50.0% required reserve rate compared to 30.0% at May 2010. Local currency deposits collected from the general public are subject to an 11.5% required reserve rate since June 2014, compared to having no reserve requirements as of May 2010. The reference rate increased from 1.25% in April 1, 2010 to 4.25% in October 2013, as a result of the Central Reserve Bank of Peru’s effort to maintain the inflation rate close to its target inflation rate in the context of the rapid GDP growth. However, in November 2013, there was a decrease of 25 basis points, and an additional 25 basis points decrease to 3.75% in July 2014, in light of stable levels of inflation and in order to stimulate faster GDP growth.
Competition
We face intense competition in all of our segments, which can affect our margins, growth and profitability. See “Industry and Competition”.
Demographic and Socioeconomic Trends
Peru’s strong economic growth has been supported by favorable demographic trends. According to INEI, the poverty rate in Peru has declined to 23.9% in 2013, from approximately 37.3% in 2008, and the unemployment rate has decreased to 5.7% from 7.8% over the same period. As a result, GDP per capita in U.S. dollars has increased from US$4,353 in 2008 to US$6,630 in 2013, reflecting a robust increase in purchasing power. In addition, the increase in the number of people retiring from the Peruvian private pension fund system will benefit our annuities business.
We expect to benefit from these trends in all of our segments.
Critical Accounting Policies
The preparation of financial statements in conformity with IFRS requires management to make estimates and assumptions that affect the reported amounts of assets, liabilities, revenues and expenses. Critical accounting policies used in the preparation of our combined financial statements are described below. For additional information on our significant accounting policies and new accounting pronouncements not yet effective, see note 3 to the audited combined financial statements included in this prospectus.
Insurance activities
For the adoption of IFRS 4 “Insurance contracts”, our management concluded that the relevant framework to be used was Peruvian SBS GAAP with certain modifications, as permitted by IFRS 4 in force as of December 31, 2013. See note 3.5(k) of our audited combined financial statements.
Insurance liabilities are recognized when contracts are entered into. The technical reserves for annuities and disability and survivor benefits insurance are determined as the sum of the discounted value of expected future benefits to be paid during a defined or non-defined period, computed upon the basis of current mortality and morbidity tables and current discount interest rates (see note 13(e) to our audited combined financial statements). Individual life technical reserves are determined as the sum of the discounted value of expected future benefits, administration expenses, policyholder options and guarantees and investment income, less the discounted value of the expected premiums that would be required to meet the future cash outflows. Furthermore, the technical reserves for other insurance contracts comprise the provision for unearned premiums and unexpired risks.
56
Table of Contents
Insurance claims reserves include reserves for reported claims and an estimate of the incurred but Non-Reported Claims to Interseguro (hereinafter “IBNR”). IBNR reserves as of December 31, 2013 and 2012 and as of January 1, 2012, were determined on the basis of the Chain Ladder methodology (a generally accepted actuarial method), whereby the weighted average of past claim development is projected into the future, with the projection based on the ratios of cumulative past claims. Adjustments to the liabilities at each reporting date are recorded in the combined statements of income. The liability is derecognized when the obligation expires, is discharged or is cancelled.
At each reporting date, an assessment is made of whether the recognized life insurance liabilities are adequate, by using an existing liability adequacy test as laid out under IFRS 4. In the case of annuities and retirement, disability and survival insurances this was done by using current assumptions for mortality and morbidity tables and interest rates.
Financial Instruments: Initial recognition and subsequent measurement
A financial instrument is any contract that creates a financial asset of one entity and a financial liability or equity instrument of another entity.
In accordance with IAS 39, all financial assets and liabilities, including derivative financial instruments, must be recognized in the statement of financial position and measured based on the category in which the instrument is classified.
Financial assets and liabilities can be classified into following categories: financial assets and liabilities at fair value through profit or loss, available-for-sale financial assets, held-to-maturity financial assets, loans and receivables and financial liabilities at amortized cost.
The classification of financial instruments at initial recognition depends on what management’s purpose and intention were for acquiring the financial instruments and the characteristics of such financial instruments. All financial instruments are measured initially at their fair value plus any directly attributable incremental cost of acquisition or issue, except in the case of financial assets and financial liabilities recorded at fair value through profit or loss.
Purchases or sales of financial assets that require delivery of assets within a time frame established by regulation or convention in the marketplace (regular-way trades) are recognized on the trade date, which is the date that we commit to purchase or sell the asset. Derivatives are recognized on a trade date basis.
| (i) | Financial assets and liabilities at fair value through profit or loss |
Financial assets and liabilities at fair value through profit or loss include financial assets held for trading and financial assets designated at fair value through profit or loss, which designation is made upon initial recognition and on aninstrument-by-instrument basis. Derivative financial instruments are also categorized as held for trading unless they are designated as hedging instruments.
Financial assets are classified as held for trading if they are acquired for the purpose of selling or repurchasing in the near term and are presented in the line item captioned “Trading securities” in our combined statement of financial position. Changes in fair value are recognized in “Net trading income (loss)” in our combined income statement. Interest and dividends earned on these investments are accrued in our combined income statement in the line item captioned “Net trading income (loss)”, according to the terms of the contract, or when the right to the payment has been established.
As of December 31, 2013 and 2012 and as of January 1, 2012, we held financial assets classified as held for trading in the amount of S/.126.7 million, S/.144.7 million and S/.221.3 million, respectively, which appear as “Trading securities” in our combined statement of financial position.
57
Table of Contents
| (ii) | Available-for-sale financial investments |
Available-for-sale financial investments include equity investments and debt securities. Equity investments classified asavailable-for-sale are those that are neither classified as held for trading nor designated at fair value through profit or loss. Debt securities in this category are those that are intended to be held for an indefinite period of time and that may be sold in response to needs for liquidity or in response to changes in market conditions.
After initial recognition,available-for-sale financial investments are measured at fair value with unrealized gains or losses recognized as other comprehensive income in theavailable-for-sale reserve, net of its corresponding deferred tax andnon-controlling interest, until the investment is derecognized, at which time the cumulative gain or loss is recognized in our combined income in the caption “Net gain on sale of securities”, or determined to be impaired, at which time the impaired amount is recognized in our combined income statement in the caption “Impairment loss on available-for-sale investments” and removed from theavailable-for-sale reserve.
Interest and dividends earned are recognized in the combined income statement in the caption “Interest and similar income”. Interest earned is reported as interest income using the effective interest rate method and dividends earned are recognized when collection rights are established.
Estimated fair values are based primarily on quoted prices or, if quoted market prices are not available, discounted expected cash flows using market rates commensurate with the credit quality and maturity of the investment.
During the years ended December 31, 2013 and 2012, we did not reclassify any of ouravailable-for-sale financial investments.
Impairment of financial assets
At each date of our combined statement of financial position, we assess whether there is any objective evidence that a financial asset or a group of financial assets is impaired. An impairment exists if one or more events that has occurred since the initial recognition of the asset (an incurred “loss event”) that has an impact that may be reliably estimated on the previously estimated future cash flows of the financial asset or the group of financial assets. Evidence of impairment may include indications that the borrower or a group of borrowers is experiencing significant financial difficulty, default or delinquency in interest or principal payments, the probability that such borrower or borrowers will go bankrupt or initiate any legal financial reorganization proceedings and where observable data indicate that there is a measurable decrease in the estimated future cash flows, such as changes in arrears or economic conditions that correlate with defaults. Criteria used for each category of financial assets are as follows:
| (i) | Available-for-sale financial investments |
Foravailable-for-sale financial investments, we assess whether there is objective evidence that an investment or a group of investments is impaired at each date of our combined statement of financial position.
In the case of equity investments, objective evidence would include a significant or prolonged decline in its fair value to below cost. “Significant” is evaluated against the original cost of the investment and “prolonged” against the period in which the fair value has been below its original cost. Where there is evidence of impairment, the cumulative loss (measured as the difference between the acquisition cost and the current fair value, less any previously recognized impairment loss) is removed from the investmentsavailable-for-sale reserve of our combined statement of changes in equity and recognized in our combined income statement. Impairment losses on equity investments are not reversed through our combined income statement; instead, increases in their fair value after impairment are recognized directly in our combined statement of comprehensive income.
58
Table of Contents
In the case of debt instruments, impairment is assessed based on the same criteria as financial assets carried at amortized cost. The amount recorded for impairment is the cumulative loss measured as the difference between the amortized cost and the debt instrument’s current fair value, less any impairment loss on that investment previously recognized in our combined income statement. Future interest income is based on the reduced carrying amount and is accrued using the interest rate used to discount the future cash flows for the purpose of measuring the impairment loss. Interest income is recorded as part of the line item captioned “Interest and similar income” in our combined income statement. If, in a subsequent year, the fair value of a debt instrument increases and the increase can be objectively related to an event occurring after the impairment loss was recognized in our combined income statement, the impairment loss is reversed through our combined income statement.
| (ii) | Renegotiated loans |
Where possible, we seek to modify loans rather than take possession of collateral. The modified loans are direct loans in which modifications are made to the time and/or amounts specified in the original contract due to difficulties in the payment capacity of the client. When a loan is modified, it is no longer considered as past-due, but maintains its previous classification as impaired or not impaired. If the debtor complies with the modified agreement during the following six months and an analysis of such debtor’s payment capacity supports an improved risk classification, it is classified as not impaired. If, subsequent to the loan modification, the debtor fails to comply with the modified agreement, the loan is considered impaired and past-due.
Investment properties
We determine whether a property is classified as investment property or inventory property according to the following criteria:
| (i) | Investment property consists of land and buildings (principally shopping malls) that are not occupied substantially for our use or operations, nor held for sale in the ordinary course of business, but are held primarily to earn rental income and capital appreciation. These buildings are substantially rented to tenants and not intended to be sold in the ordinary course of business. Investment property includes both completed property and property under construction orre-development. |
| (ii) | Inventory property consists of property that is held for sale in the ordinary course of business. |
We have not classified any property as inventory property.
We measure our investment property at fair value according to the requirements of IAS 40 “Investment Property”, as we have elected to use the fair value model as our accounting policy.
Investment property is measured initially at cost, including transaction costs. Transaction costs include transfer taxes, professional fees for legal services and initial leasing commissions to bring the property to the condition necessary for it to be capable of operating. The carrying amount also includes the cost of replacing part of an existing investment property at the time that cost is incurred if the recognition criteria are met.
Properties under construction are recorded at their initial acquisition cost or construction cost. The initial cost consists of its purchase price, plus the directly related costs that include professional fees for legal services and any cost directly attributable to locate and put the asset in useable condition. Investment property under construction includes the value of land, which is determined by appraisals performed by an accredited appraiser andwork-in-progress, which is recorded at cost.
Subsequent to initial recognition, investment property is stated at fair value. Gains or losses arising from changes in fair value are included in the “Valuation gain from investment property” caption of our combined income statement in the year in which such gains or losses arise. Transfers are made to or from investment property only when there is a change in use.
59
Table of Contents
Fair values are evaluated periodically by our management, based on the discounted cash flows that are expected to be obtained from these investments. Fair values of investments properties under construction or investment properties held to operate in the future are assessed by an external appraiser, through the application of a recognized valuation model. See note 7 to our audited combined financial statements for details of fair value and related assumptions.
Investment property is derecognized when it has been disposed of or permanently withdrawn from use and no future economic benefit is expected from its disposal. The difference between the net disposal proceeds and the carrying amount of the asset would result in either gains or losses at the retirement or disposal of investment property. Any gains or losses are recognized in our combined income statement in the year of retirement or disposal.
Gains or losses on the disposal of investment property are determined as the difference between net disposal proceeds and the carrying value of the assets in the previous period’s financial statements.
Fair value measurement
The fair value measurement is based on the presumption that the transaction to sell the asset or transfer the liability takes place either (i) in the principal market for the asset or liability, or (ii) in the absence of a principal market, in the most advantageous market for the asset or liability. The principal or the most advantageous market must be accessible to us. In addition, the fair value of a liability will reflect itsnon-performance risk.
The fair value of an asset or a liability is measured using the assumptions that market participants would use when pricing such asset or liability, assuming that market participants act in their best economic interest.
When they are available, we measure the fair value of a financial instrument using its quoted price on an active market for that instrument. A market is regarded as active if transactions for such asset or liability take place with sufficient frequency and volume to provide pricing information on an ongoing basis.
If there is no quoted price in an active market, then valuation techniques are used. We use valuation techniques that are appropriate in the circumstances and for which sufficient data are available to measure fair value, maximizing the use of relevant observable inputs and minimizing the use of unobservable inputs.
The chosen valuation technique must incorporate all of the factors that market participants would take into account in pricing a transaction.
In the case of investment property, we have considered the specific requirements relating to highest and best use, valuation premise and principal (or most advantageous) market. The determination of investment property fair value requires the use of estimates such as the future cash flows of the assets (for example: leases, sales, fixed rents for the different types of tenants, variable rental in function to a percentage of the sales, operating costs, building costs, maintenance capital expenditures and the use of discount rates). Additionally, development risks (such as construction and abandonment) are also taken into account when determining the fair value of investment property under construction.
The fair value of investment property in our combined statement of financial position must reflect the volatile nature of the real estate markets; therefore, our management and independent appraisers use their market knowledge and other professional criteria for determining fair value, and do not depend solely on historical comparable transactions. In this sense, there is a greater degree of uncertainty than when a more active market exists for the estimation of fair value. Significant methods and assumptions used in the estimation of fair value of investment property are detailed in note 7 to our audited combined financial statements.
60
Table of Contents
All assets and liabilities for which fair value is measured or disclosed in our combined financial statements are categorized within the fair value hierarchy, described as follows, based on the lowest level input that is significant to the fair value measurement as a whole:
| • | Level 1—Quoted (unadjusted) market prices in active markets for identical assets or liabilities. |
| • | Level 2—Valuation techniques for which the lowest level input that is significant to the fair value measurement is directly or indirectly observable. |
| • | Level 3—Valuation techniques for which the lowest level input that is significant to the fair value measurement is unobservable. |
For assets and liabilities that are recognized at fair value in our combined financial statements on a recurring basis, we determine whether transfers have occurred between different levels in the hierarchy byre-assessing each categorization at the end of each reporting period.
For the purpose of fair value disclosures, we have classified assets and liabilities on the basis of the nature, characteristics and risks of the specific asset or liability and their level within the fair value hierarchy explained above.
Income tax
Income tax is computed based on the individual financial statements of IFS, Inteligo and each one of their subsidiaries.
Deferred income tax is accounted for in accordance with IAS 12 “Income Tax” and reflects the effects of temporary differences between the carrying amounts of assets and liabilities for accounting purposes and the amounts determined for tax purposes. Deferred assets and liabilities are measured using the tax rates that are expected to be in force in the years in which such temporary differences are expected to be recovered or settled. The measurement of deferred tax assets and deferred tax liabilities reflects the tax consequences that arise from the manner in which each individual entity expects, at the date of our combined statement of financial position, to recover or settle the carrying amount of its assets and liabilities.
Deferred tax assets and liabilities are recognized regardless of when the temporary differences are likely to reverse. Deferred tax assets are recognized when it is probable that sufficient taxable income will be generated against which the deferred tax assets can be offset. At each date of our combined statements of financial position, unrecognized deferred assets and the carrying amount of deferred tax assets registered are assessed. A previously unrecognized deferred tax asset is recognized to the extent that it has become probable that future taxable income will allow the deferred tax asset to be recovered. Likewise, the carrying amount of a deferred tax asset is reduced when such deferred tax asset may no longer be used, either in full or in part.
According to IAS 12, deferred income tax is determined according to the tax rate applicable to the undistributed earnings; any additional tax on distribution of dividends is recorded at the date on which the liability is recognized.
Principal Line Items in Combined Income Statements
Below is a description of certain significant line items from our combined income statements:
| • | Interest and similar income includes interest from our loan portfolio plus interest and dividends from our investment portfolio and is composed of the following line items: (i) interest on loans, (ii) interest on investments available-for-sale, (iii) interest on due from banks and inter-bank funds, and (iv) other interest and similar income. See note 18 to our audited combined financial statements; |
61
Table of Contents
| • | Interest and similar expenses includes all financial expenses incurred to fund our operations and is composed of the following line items: (i) interest on deposits and obligations, (ii) interest on bonds, notes and other obligations and (iii) interest and fees due to banks and correspondents. See note 18 to our audited combined financial statements; |
| • | Provision for loan losses, net of recoveries include provisions recognized as expense, net of recoveries for the period. See note 6(c) to our audited combined financial statements; |
| • | Fee income from financial services, net includes primarily commissions and other fees we charge to our customers, net from related expenses, and is composed of the following line items: (i) maintenance and mailing of accounts, interchange fees, transfers and credit and debit card services, (ii) funds management, (iii) commissions from banking services, (iv) fees for indirect loans, (v) collection services and, (vi) brokerage and custody services. See note 19 to our audited combined financial statements; |
| • | Other income includes: (i) net gain on foreign exchange transactions, (ii) net gain on sale of securities, (iii) net trading income (loss), (iv) rental income, (v) profit from sale of investment property, (vi) valuation gain from investment property; as presented in our combined income statements. |
| • | Total premiums earned less claims and benefits include: (i) net premiums, (ii) adjustment of technical reserves, and (iii) net claims and benefits incurred. See notes 21(a) and 22 to our audited combined financial statements; and |
| • | Other expenses include: (i) salaries and employee benefits, (ii) administrative expenses, (iii) depreciation and amortization, (iv) impairment loss on available-for-sale investment, and (v) expenses related to rental income. See notes 5, 23 and 24 to our audited combined financial statements. |
62
Table of Contents
Results of Operations for the Year Ended December 31, 2013 Compared to the Year Ended December 31, 2012
The following table sets forth the principal components of our combined profit for 2013 and 2012.
| For the years ended December 31, | ||||||||||||||||
| 2013 | 2012 | Change | ||||||||||||||
|
|
|
| |||||||||||||
| (S/. in millions) | (S/. in millions) | % | ||||||||||||||
Interest and similar income | 2,405.5 | 2,128.8 | 276.8 | 13.0 | % | |||||||||||
Interest and similar expenses | (657.8 | ) | (566.8 | ) | (91.0 | ) | 16.1 | % | ||||||||
|
|
|
|
|
| |||||||||||
Net interest and similar income | 1,747.7 | 1,562.0 | 185.7 | 11.9 | % | |||||||||||
Provision for loan losses, net of recoveries | (377.2 | ) | (400.8 | ) | 23.5 | (5.9 | )% | |||||||||
|
|
|
|
|
| |||||||||||
Net interest and similar income after provision for loan losses | 1,370.5 | 1,161.3 | 209.2 | 18.0 | % | |||||||||||
Fee income from financial services, net | 622.0 | 671.5 | (49.5 | ) | (7.4 | )% | ||||||||||
Other income | 641.5 | 517.9 | 123.6 | 23.9 | % | |||||||||||
Total other income | 1,263.5 | 1,189.4 | 74.1 | 5.9 | % | |||||||||||
Total premiums earned less claims and benefits | 89.9 | (60.5 | ) | 150.5 | N/M | |||||||||||
Other expenses | (1,471.1 | ) | (1,318.3 | ) | (152.8 | ) | 11.6 | % | ||||||||
|
|
|
|
|
| |||||||||||
Income before translation result and income tax | 1,252.8 | 971.8 | 281.0 | 28.9 | % | |||||||||||
Translation result | (12.5 | ) | 6.5 | (19.0 | ) | N/M | ||||||||||
Income tax | (265.8 | ) | (213.4 | ) | (52.4 | ) | 24.6 | % | ||||||||
|
|
|
|
|
| |||||||||||
Profit for the year | 974.6 | 765.0 | 209.6 | 27.4 | % | |||||||||||
|
|
|
|
|
| |||||||||||
Attributable to: | ||||||||||||||||
Equity holders of IFS | 970.2 | 760.9 | 209.3 | 27.5 | % | |||||||||||
Non-controlling interest | 4.4 | 4.1 | 0.3 | 8.3 | % | |||||||||||
Our combined profit for the year increased by 27.4% in 2013 compared to 2012. This increase was primarily due to a S/. 46.6 million or 8.2% increase in our banking segment profit, a S/. 131.6 million or 87.7% increase in our insurance segment profit, and a S/. 10.1 million or 10.1% increase in our wealth management segment profit. The increase in profit for the year was mainly due to a S/. 185.7 million, or 11.9%, increase in our net interest and similar income, a decline of S/. 23.5 million, or 5.9%, in provision for loan losses, net of recoveries, an increase of S/. 123.6 million, or 23.9%, in our other income and an increase of S/. 150.5 million in total premiums earned less claims and benefits. These factors were partially offset by a 7.4% decrease in our fee income from financial services, net and an 11.6% increase in other expenses, which accounted for a negative impact of S/. 49.5 million and S/. 152.8 million, respectively.
63
Table of Contents
Interest and Similar Income
The following table presents the components of our interest and similar income for 2013 and 2012.
| For the years ended December 31, | ||||||||||||||||
| 2013 | 2012 | Change | ||||||||||||||
(S/. in millions)
| (S/. in millions) | % | ||||||||||||||
Interest and similar income | ||||||||||||||||
Interest on loans | 2,082.9 | 1,825.5 | 257.4 | 14.1 | % | |||||||||||
Interest on investments available-for-sale and trading securities | 276.3 | 272.7 | 3.6 | 1.3 | % | |||||||||||
Interest on cash and due from banks and inter-bank funds | 46.3 | 30.5 | 15.8 | 51.6 | % | |||||||||||
|
|
|
|
|
| |||||||||||
Total interest and similar income | 2,405.5 | 2,128.8 | 276.8 | 13.0 | % | |||||||||||
|
|
|
| |||||||||||||
Nominal average rate | 8.1 | % | 8.6 | % | ||||||||||||
Total interest and similar income increased by S/. 276.8 million, or 13.0%, in 2013 compared to 2012, primarily due to growth in the average volume of our interest-earning assets, mainly from our banking segment, which increased by 21.4%, boosted by the growth in our loan portfolio. A 20.6% increase in the average volume of our interest-earning assets in 2013 accounted for S/. 381.5 million of the increase in total interest earned, partially offset by a decline in our nominal average rate, from 8.6% in 2012 to 8.1% in 2013, which accounted for a S/. 104.7 million decrease. The decrease in the nominal average rate over our interest-earning assets was mainly attributable to changes in the mix of products within the loan portfolio of our banking segment.
Interest on loans increased by S/. 257.4 million, or 14.1%, in 2013 compared to 2012, with increases in contributions from our banking and wealth management segments of S/. 241.7 million and S/. 15.7 million, respectively. Within the banking segment, the increase in interest on loans was due to growth in the average volume, especially as a result of higher disbursements in mortgages, consumer loans (both payroll loans to public employees and credit cards) and commercial loans (short and medium-term loans as well as trade finance loans).
An 18.6% increase in Interbank’s average balance of loans in 2013 accounted for a S/. 347.0 million increase in interest income. The decline in Interbank’s nominal average rate, from 11.9% in 2012 to 11.4% in 2013, accounted for a S/. 105.4 million decrease in interest income and was explained by changes in the mix of products in its loan portfolio.
Within the wealth management segment, growth in interest income on loans was also due to higher average volume in interest-earning assets, which grew by 48.8% in 2013 compared to 2012, as a result of an increase in disbursements of collateralized loans.
Interest on investments available-for-sale and trading securities increased by S/. 3.6 million, or 1.3%, in 2013 compared to 2012 due to a higher nominal average rate, which increased from 4.7% in 2012 to 4.9% in 2013, while the average volume remained relatively stable. Our insurance segment was the largest contributor to growth in investment income in 2013, with a S/. 35.3 million increase from 2012, but was offset by a S/. 40.8 million, or 51.6%, decrease in our banking segment. Such decrease in Interbank’s interest on investments available-for-sale was a result of a lower volume invested in Central Reserve Bank of Peru certificates of deposit.
Interest on due from banks and inter-bank funds increased by S/. 15.8 million, or 51.6%, in 2013 compared to 2012, primarily explained by our banking segment, which accounted for S/. 14.5 million of such increase. The higher average volume of due from banks and inter-bank funds during 2013 accounted for S/. 17.0 million of the total increase, partially offset by a lower return that accounted for a S/. 1.2 million decrease. Particularly in the banking segment, the rise in volume of due from banks and interbank funds was a result of higher average reserve requirements from the Central Reserve Bank of Peru in effect throughout 2013 when compared to 2012.
64
Table of Contents
Interest and Similar Expenses
The following table presents the components of our interest and similar expenses for 2013 and 2012.
| For the years ended December 31, | ||||||||||||||||
| 2013 | 2012 | Change | ||||||||||||||
(S/. in millions)
| (S/. in millions) | % | ||||||||||||||
Interest and similar expenses | ||||||||||||||||
Interest on deposits and obligations | (315.6 | ) | (275.2 | ) | 40.4 | 14.7 | % | |||||||||
Interest on bonds, notes and other obligations | (192.6 | ) | (157.1 | ) | 35.5 | 22.6 | % | |||||||||
Interest and fees due to banks and correspondents | (149.6 | ) | (134.4 | ) | 15.2 | 11.3 | % | |||||||||
|
|
|
|
|
|
|
| |||||||||
Total interest and similar expenses | (657.8 | ) | (566.8 | ) | 91.0 | 16.1 | % | |||||||||
|
|
|
| |||||||||||||
Nominal average rate | 3.0 | % | 3.1 | % | ||||||||||||
Interest on deposits and obligations increased by S/. 40.4 million, or 14.7%, in 2013 compared to 2012, primarily due to higher average volume of deposits in our banking segment. Our higher average volume of deposits of 19.0% represented S/. 55.1 million of the increase in expenses related to deposits and obligations, while a decline in the nominal average rate, from 2.1% in 2012 to 2.0% in 2013, accounted for a S/. 14.7 million decrease in such expenses.
Interest on bonds, notes and other obligations increased by S/. 35.5 million, or 22.6%, in 2013 compared to 2012, due to higher volume and higher nominal average rate. The higher average volume of bonds, notes and obligations of 15.1% accounted for S/. 25.2 million of the total increase, while the higher nominal average rate increased from 5.4% in 2012 to 5.8% in 2013 accounted for the remaining S/. 10.2 million. The largest contributor to the increase in interest expenses related to bonds, notes and other obligations was our banking segment, with S/. 35.4 million. The increase in our nominal average interest rates is mostly related to our mix, reflecting a decrease in the balances of our diversified payment rights (DPRs) and an increase in long-term bonds at higher interest rates.
Our banking segment was active in 2013 in diversifying its funding, as Interbank issued two subordinated bonds in the local capital markets for S/. 150.0 million and US$ 50.0 million each, in addition to an international syndicated loan for US$ 200.0 million.
Interest and fees due to banks and correspondents increased by S/. 15.2 million, or 11.3%, in 2013 compared to 2012, primarily due to a S/. 13.9 million increase in our banking segment. The average volume grew by 30.4%, which contributed to a S/. 35.9 million increase in expenses, and partially offset by a decline in the nominal average rate from 5.7% in 2012 to 4.8% in 2013, which contributed to a decrease of S/. 20.8 million in expenses.
Provision for Loan Losses, Net of Recoveries
The following table presents the components of our provision for loan losses, net of recoveries for 2013 and 2012.
| For the years ended December 31, | ||||||||||||||||
| 2013 | 2012 | Change | ||||||||||||||
| (S/. in millions) | (S/. in millions) | % | ||||||||||||||
Provision for loan losses, net of recoveries | (377.2 | ) | (400.8 | ) | 23.5 | 5.9 | % | |||||||||
|
|
|
| |||||||||||||
65
Table of Contents
Provision for loan losses, net of recoveries decreased by S/. 23.5 million, or 5.9%, in 2013 compared to 2012. The decline in provisions was mainly a result of our banking segment, which had lower provisioning requirements mainly on credit cards, due to an improved average asset quality during 2013. During this period, Interbank’s loans increased 26.5%, while its past-due loans increased only 19.1% from S/. 291.2 million in 2012 to S/. 346.6 million in 2013. As a result, Interbank’s past-due loans ratio improved from 1.9% in 2012 to 1.7% in 2013. The improvement in Interbank’s asset quality was mainly due to its credit card loan portfolio, as a result of improvements in its credit scoring origination models and to a revised strategy to target existing customers with good credit risk scores and offer them differentiated pricing in relation to their risk profiles.
In our banking segment, allowances for loan losses increased in 2013 when compared to 2012 as a result of growth in its loan portfolio. While past-due loans grew 19.1% from 2012 to 2013, allowances for loan losses increased only 17.6%, as higher asset quality resulted in lower requirements for additional provisions. As a result, Interbank’s coverage ratio decreased to 199.9% in 2013 from 201.7% in 2012.
Fee Income from Financial Services, Net
The following table presents the components of our fee income from financial services, net for 2013 and 2012.
| For the years ended December 31, | ||||||||||||||||
| 2013 | 2012 | Change | ||||||||||||||
(S/. in millions)
| (S/. in millions) | % | ||||||||||||||
Income | ||||||||||||||||
Maintenance and mailing of accounts, interchange fees, transfers and credit and debit card services | 396.2 | 445.4 | (49.3 | ) | (11.1 | )% | ||||||||||
Funds management | 105.2 | 82.1 | 23.2 | 28.2 | % | |||||||||||
Commissions from banking services | 87.8 | 116.1 | (28.2 | ) | (24.3 | )% | ||||||||||
Fees for indirect loans | 49.0 | 40.7 | 8.4 | 20.6 | % | |||||||||||
Collection services | 19.5 | 20.9 | (1.5 | ) | (6.9 | )% | ||||||||||
Brokerage and custody services | 8.8 | 10.4 | (1.6 | ) | (15.5 | )% | ||||||||||
Other | 25.5 | 32.4 | (6.9 | ) | (21.4 | )% | ||||||||||
|
|
|
|
|
| |||||||||||
Total | 692.0 | 748.0 | (56.0 | ) | (7.5 | )% | ||||||||||
Expenses | ||||||||||||||||
Insurance | (24.5 | ) | (37.6 | ) | 13.1 | (34.9 | )% | |||||||||
Fees paid to foreign banks | (18.0 | ) | (14.0 | ) | (4.0 | ) | 28.3 | % | ||||||||
Brokerage and custody services | (0.2 | ) | (0.3 | ) | 0.1 | (38.3 | )% | |||||||||
Other | (27.4 | ) | (24.7 | ) | (2.7 | ) | 11.1 | % | ||||||||
|
|
|
|
|
| |||||||||||
Total | (70.0 | ) | (76.5 | ) | 6.5 | (8.5 | )% | |||||||||
|
|
|
|
|
| |||||||||||
Fee income from financial services, net | 622.0 | 671.5 | (49.5 | ) | (7.4 | )% | ||||||||||
|
|
|
| |||||||||||||
Fee income from financial services, net decreased by S/. 49.5 million, or 7.4%, in 2013 compared to 2012, mainly as a result of a decrease in maintenance and mailing of accounts, interchange fees, transfers and credit and debit card services, and lower commissions from banking services, which were partially offset by an increase in our funds management fees and a decrease in insurance expenses paid to third parties.
Maintenance and mailing of accounts, interchange fees, transfers and credit and debit card services decreased by S/. 49.3 million, or 11.1%, from S/. 445.4 million in 2012 to S/. 396.2 million in 2013, mainly explained by lower fee income of our banking segment due to the elimination of certain credit card-related fees charged to customers pursuant to regulatory changes in effect from January 2013 onwards. The most significant
66
Table of Contents
credit card fees eliminated were (i) over-limit fees, (ii) cash advance fees and (iii) administrative fees. Moreover, commissions on credit cards were also affected by a greater number of customers migrating to free online credit card account statements.
Commissions from banking services decreased by S/. 28.2 million, or 24.3%, in 2013 compared to 2012, reflecting a change in regulation which led Interseguro to raise the price of insurance premiums, and hence record additional income in net premiums earned and less income attributable to commissions from banking services.
Funds management fees increased by S/. 23.2 million, or 28.2%, in 2013 compared to 2012, which was due to higher transaction fees in our wealth management segment, a 26.4% increase in assets under management plus deposits during the year, and better pricing for the management of client assets.
Other Income
The following table sets forth our other income for 2013 and 2012.
| For the years ended December 31, | ||||||||||||||||
| 2013 | 2012 | Change | ||||||||||||||
| (S/. in millions) | (S/. in millions) | % | ||||||||||||||
Net gain on foreign exchange transactions | 183.4 | 193.9 | (10.4 | ) | (5.4 | )% | ||||||||||
Net gain on sale of securities | 241.9 | 138.6 | 103.4 | 74.6 | % | |||||||||||
Net trading (loss) income | (7.5 | ) | 14.7 | (22.1 | ) | N/M | ||||||||||
Rental income | 33.6 | 41.3 | (7.7 | ) | (18.6 | )% | ||||||||||
Profit from sale of investment property | 4.0 | 17.7 | (13.6 | ) | (77.1 | )% | ||||||||||
Valuation gain from investment property | 96.6 | 39.1 | 57.5 | 146.9 | % | |||||||||||
Other | 89.4 | 72.7 | 16.7 | 22.9 | % | |||||||||||
|
|
|
|
|
| |||||||||||
Other income | 641.5 | 517.9 | 123.6 | 23.9 | % | |||||||||||
|
|
|
| |||||||||||||
Other income increased by S/. 123.6 million, or 23.9%, in 2013 compared to 2012, mainly as a result of an increase in net gain on sale of securities, which accounted for S/. 103.4 million of the total increase. See note 5(f) to our audited combined financial statements. This was related to the sale of equity investments, which generated S/. 149.4 million in pre-tax income. In addition, we had a S/. 57.5 million increase in valuation gains from investment property in 2013 primarily from our insurance segment. See note 7 to our audited combined financial statements.
We also experienced a decrease in net gain on foreign exchange transactions and net trading income. Net gain on foreign exchange transactions decreased by S/. 10.4 million in 2013 compared to 2012, due to a decrease in income from forwards transactions at our banking segment. Our net trading income reverted from a S/. 14.7 million gain in 2012 to a S/. 7.5 million loss in 2013, mainly due to losses on a currency forward position that resulted from the depreciation of thenuevo solagainst the U.S. dollar at our insurance segment.
67
Table of Contents
Total Premiums Earned Less Claims and Benefits
The following table presents the components of our total premiums earned less claims and benefits for 2013 and 2012.
| For the years ended December 31, | ||||||||||||||||
| 2013 | 2012 | Change | ||||||||||||||
| (S/. in millions) | (S/. in millions) | % | ||||||||||||||
Premiums assumed | 564.3 | 446.6 | 117.7 | 26.3 | % | |||||||||||
Premiums ceded to reinsurers | (5.7 | ) | (4.7 | ) | (1.1 | ) | 22.9 | % | ||||||||
Adjustment of technical reserves | (294.8 | ) | (355.0 | ) | 60.2 | (17.0 | )% | |||||||||
Net claims and benefits incurred | (173.8 | ) | (147.5 | ) | (26.3) | 17.9 | % | |||||||||
|
|
|
|
|
| |||||||||||
Total premiums earned less benefits and claims | 89.9 | (60.5 | ) | 150.5 | N/M | |||||||||||
|
|
|
| |||||||||||||
Interseguro’s premiums assumed increased S/. 117.7 million, or 26.3%, in 2013 compared to 2012 as a result of the growth in annuities, credit life insurance and card protection during the period. Premiums ceded to reinsurers increased from S/. 4.7 million in 2012 to S/. 5.7 million in 2013.
Adjustment of technical reserves decreased S/. 60.2 million, or 17.0%, in 2013 compared to 2012, mainly as a result of lower technical reserves in annuities driven by the use of a higher rate to discount estimated future payments. The discount rate mainly depends on the interest rate performance of Interseguro’s debt instruments in its portfolio, adjusted for credit risk that increased from 3.4% in 2012 to 4.0% in 2013.
Net claims and benefits incurred increased by S/. 26.3 million, or 17.9%, in 2013 compared to 2012, reflecting the growth of our annuities portfolio and a higher observed mortality rate for credit life insurance.
Other Expenses
The following table presents the components of our other expenses for the years ended December 31, 2013 and 2012.
| For the years ended December 31, | ||||||||||||||||
| 2013 | 2012 | Change | ||||||||||||||
| (S/. in millions) | (S/. in millions) | % | ||||||||||||||
Other expenses | ||||||||||||||||
Salaries and employee benefits | (626.5 | ) | (552.6 | ) | (73.9 | ) | 13.4 | % | ||||||||
Administrative expenses | (637.8 | ) | (596.1 | ) | (41.7 | ) | 7.0 | % | ||||||||
Depreciation and amortization | (96.4 | ) | (86.3 | ) | (10.2 | ) | 11.8 | % | ||||||||
Impairment loss on available for sale investments | (14.1 | ) | (7.1 | ) | (7.0 | ) | 97.8 | % | ||||||||
Expenses related to rental income | (6.1 | ) | (4.0 | ) | (2.1 | ) | 53.6 | % | ||||||||
Other | (90.2 | ) | (72.3 | ) | (18.0 | ) | 24.9 | % | ||||||||
|
|
|
|
|
| |||||||||||
Total other expenses | (1,471.1 | ) | (1,318.3 | ) | (152.8 | ) | 11.6 | % | ||||||||
|
|
|
| |||||||||||||
Our total other expenses increased 11.6% in 2013 compared to 2012 mainly due to higher expenses in our banking and insurance segments, which represented S/. 99.4 million and S/. 62.2 million of the total increase, respectively. Salaries and employee benefits expenses increased from S/. 552.6 million in 2012 to S/. 626.5 million in 2013, primarily explained by a higher average headcount in our banking segment during 2013 as compared to 2012, and a higher average cost per employee in all of our segments. Administrative expenses increased by S/. 41.7 million or 7.0%, from S/. 596.1 million in 2012 to S/. 637.8 million in 2013, mainly due to higher expenses for third-party services provided to Interbank.
68
Table of Contents
Our other expenses increased by S/. 18.0 million or 24.9%, mainly as a result of higher commissions in Interseguro related to sales of retail insurance products and due to higher insurance premiums. Likewise, our impairment loss on available for sale investments increased by S/. 7.0 million, or 97.8%, compared to 2012, primarily from our insurance segment.
Our efficiency ratio is calculated by dividing salaries and employee benefits plus administrative expenses plus depreciation and amortization by net interest and similar income plus other income, plus net premiums earned. Our efficiency ratio improved to 41.5% in 2013, from 43.5% in 2012.
Income before Translation Result and Income Tax
The following table sets forth our profit before translation result and tax for 2013 and 2012.
| For the years ended December 31, | ||||||||||||||||
| 2013 | 2012 | Change | ||||||||||||||
| (S/. in millions) | (S/. in millions) | % | ||||||||||||||
Income before translation result and income tax | 1,252.8 | 971.8 | 281.0 | 28.9 | % | |||||||||||
Translation result | (12.5 | ) | 6.5 | (19.0 | ) | N/M | ||||||||||
Income tax | (265.8 | ) | (213.4 | ) | (52.4 | ) | 24.6 | % | ||||||||
|
|
|
|
|
| |||||||||||
Profit for the year | 974.6 | 765.0 | 209.6 | 27.4 | % | |||||||||||
|
|
|
| |||||||||||||
Income before translation result and income tax increased by S/. 281.0 million or 28.9%, in 2013 compared to 2012. The decrease in our translation result is primarily explained by the impact of the devaluation of thenuevo solon our banking segment. Income tax increased from S/. 213.4 million in 2012 to S/. 265.8 million in 2013.
In our banking and insurance segments, we are subject to Peruvian income tax and are required to calculate our income tax expense on a non-consolidated basis. As of December 31, 2013 and 2012, the applicable corporate income tax rate in Peru was 30.0% of taxable income. A substantial portion of Interseguro’s earnings are exempt from income tax because Peruvian tax law provides that gains from investments that cover technical reserves for annuities and individual life insurance are tax exempted.
In our wealth management business, Inteligo Bank is not subject to income tax. However, our Peruvian brokerage operation is subject to Peruvian income tax and Inteligo SAB must calculate income tax expense on a non-consolidated basis. As of December 31, 2013 and 2012, the applicable corporate income tax rate for Inteligo SAB was 30% of taxable income, which represented a total tax expense of S/. 0.7 million. This amount represents the entirety of the income tax expense incurred by Inteligo during 2013.
The effective tax rate including current and deferred income tax for IFS was 21.4% in 2013 and 21.8% in 2012.
Profit for the Year
As a result of the foregoing, our profit for the year increased by S/. 209.6 million, or 27.4%, from S/. 765.0 million in 2012 to S/. 974.6 million in 2013. All of our segments showed an increase in their profit for the year. Our insurance segment increased by S/. 131.6 million, while our banking and wealth management segments increased by S/. 46.6 million and S/. 10.1 million, respectively. The increase in profit of the year resulted in an increase in our ROE, which was 26.9% for 2013, compared to 24.3% for 2012.
69
Table of Contents
Results of Operations by Segment
The following table presents an overview of certain combined income statement data for each of our segments for the years ended December 31, 2013 and 2012.
| Banking | Insurance | Wealth Management | Corporate and Eliminations | Combined | ||||||||||||||||||||||||||||||||||||
| 2013 | 2012 | 2013 | 2012 | 2013 | 2012 | 2013 | 2012 | 2013 | 2012 | |||||||||||||||||||||||||||||||
| (S/. in millions) | ||||||||||||||||||||||||||||||||||||||||
Interest and similar income | 2,146.4 | 1,931.0 | 169.7 | 134.4 | 99.8 | 81.3 | (10.4 | ) | (18.0 | ) | 2,405.5 | 2,128.8 | ||||||||||||||||||||||||||||
Interest and similar expenses | (614.0 | ) | (532.9 | ) | (1.4 | ) | (1.2 | ) | (43.2 | ) | (34.5 | ) | 0.8 | 1.9 | (657.8 | ) | (566.8 | ) | ||||||||||||||||||||||
|
|
|
|
|
|
|
|
|
|
|
|
|
|
|
|
|
|
|
| |||||||||||||||||||||
Net interest and similar income | 1,532.4 | 1,398.1 | 168.4 | 133.2 | 56.6 | 46.8 | (9.6 | ) | (16.1 | ) | 1,747.7 | 1,562.0 | ||||||||||||||||||||||||||||
Provision for loan losses, net of recoveries | (377.2 | ) | (400.8 | ) | 0.0 | 0.0 | 0.0 | 0.0 | 0.0 | 0.0 | (377.2 | ) | (400.8 | ) | ||||||||||||||||||||||||||
|
|
|
|
|
|
|
|
|
|
|
|
|
|
|
|
|
|
|
| |||||||||||||||||||||
Net interest and similar income after provision for loan losses | 1,155.1 | 997.3 | 168.4 | 133.2 | 56.6 | 46.8 | (9.6 | ) | (16.1 | ) | 1,370.5 | 1,161.3 | ||||||||||||||||||||||||||||
Fee income from financial services, net | 574.7 | 625.8 | (1.7 | ) | (1.0 | ) | 78.5 | 61.4 | (29.5 | ) | (14.8 | ) | 622.0 | 671.5 | ||||||||||||||||||||||||||
Other income | 379.2 | 260.0 | 196.7 | 184.2 | 33.9 | 51.8 | 31.7 | 21.9 | 641.5 | 517.9 | ||||||||||||||||||||||||||||||
Other income | 953.8 | 885.9 | 195.1 | 183.2 | 112.4 | 113.3 | 2.2 | 7.1 | 1,263.5 | 1,189.4 | ||||||||||||||||||||||||||||||
Total premiums earned less claims and benefits | 0.0 | 0.0 | 89.9 | (60.5 | ) | 0.0 | 0.0 | 0.0 | 0.0 | 89.9 | (60.5 | ) | ||||||||||||||||||||||||||||
Other expenses | (1,225.9 | ) | (1,126.4 | ) | (166.4 | ) | (104.3 | ) | (62.4 | ) | (59.9 | ) | (16.4 | ) | (27.8 | ) | (1,471.1 | ) | (1,318.3 | ) | ||||||||||||||||||||
|
|
|
|
|
|
|
|
|
|
|
|
|
|
|
|
|
|
|
| |||||||||||||||||||||
Income before translation result and income tax | 883.1 | 756.8 | 287.0 | 151.6 | 106.7 | 100.2 | (23.9 | ) | (36.7 | ) | 1,252.8 | 971.8 | ||||||||||||||||||||||||||||
|
|
|
|
|
|
|
|
|
|
|
|
|
|
|
|
|
|
|
| |||||||||||||||||||||
Translation result | (21.1 | ) | 9.6 | (5.3 | ) | (1.3 | ) | 3.4 | (0.3 | ) | 10.6 | (1.5 | ) | (12.5 | ) | 6.5 | ||||||||||||||||||||||||
Income tax | (247.0 | ) | (197.9 | ) | (0.1 | ) | (0.3 | ) | (0.7 | ) | (0.7 | ) | (17.9 | ) | (14.5 | ) | (265.8 | ) | (213.4 | ) | ||||||||||||||||||||
|
|
|
|
|
|
|
|
|
|
|
|
|
|
|
|
|
|
|
| |||||||||||||||||||||
Profit for the year | 615.0 | 568.4 | 281.6 | 150.0 | 109.3 | 99.3 | (31.3 | ) | (52.7 | ) | 974.6 | 765.0 | ||||||||||||||||||||||||||||
|
|
|
|
|
|
|
|
|
|
|
|
|
|
|
|
|
|
|
| |||||||||||||||||||||
Attributable to: | ||||||||||||||||||||||||||||||||||||||||
Equity holders of IFS | 615.0 | 568.4 | 281.5 | 149.9 | 109.3 | 99.3 | (35.7 | ) | (56.7 | ) | 970.2 | 760.9 | ||||||||||||||||||||||||||||
Non-controlling interest | 0.0 | 0.0 | 0.1 | 0.1 | 0.0 | 0.0 | 4.4 | 4.0 | 4.4 | 4.1 | ||||||||||||||||||||||||||||||
Banking
Our banking segment activities include a wide range of products and services for individuals and commercial clients.
Interest and Similar Income
The following table presents the components of interest and similar income for our banking segment for 2013 and 2012.
| For the years ended December 31, | ||||||||||||||||
| 2013 | 2012 | Change | ||||||||||||||
(S/. in millions)
| (S/. in millions) | % | ||||||||||||||
Interest and similar income | ||||||||||||||||
Interest on loans | 2,025.3 | 1,783.7 | 241.7 | 13.5 | % | |||||||||||
Interest on investments available-for-sale | 74.8 | 115.6 | (40.8 | ) | (35.3 | )% | ||||||||||
Interest on due from banks and inter-bank funds | 46.2 | 31.7 | 14.5 | 45.6 | % | |||||||||||
|
|
|
|
|
| |||||||||||
Total interest and similar income | 2,146.4 | 1,931.0 | 215.4 | 11.2 | % | |||||||||||
|
|
|
|
|
| |||||||||||
Nominal average rate | 11.4 | % | 11.9 | % | ||||||||||||
70
Table of Contents
Total interest and similar income increased by S/. 215.4 million, or 11.2%, in 2013 compared to 2012, mainly due to a 13.5% increase in interest on loans. Additionally, there was a 45.6% increase in interest on due from banks and inter-bank funds, all of which was partially offset by a 35.3% decrease in interest on investments available-for-sale.
Interest on loans increased by S/. 241.7 million, or 13.5%, in 2013 compared to 2012, primarily due to growth in average loan volume, which was partially offset by a decline in the nominal average rate. An 18.6% increase in Interbank’s average balance of loans in 2013 accounted for a S/. 347.0 million increase in the interest on loans. The nominal average rates charged on Interbank’s loans decreased from 11.9% in 2012 to 11.4% in 2013. Such decline in nominal average rate accounted for a S/. 105.4 million decrease in interest on loans from 2012 to 2013.
The decline in the average interest rate responds to changes in the mix of products in Interbank’s loan portfolio, as commercial loans, which have a lower interest rate than retail loans, grew faster during 2013. In addition, the variation in currency mix of Interbank’s loan portfolio also affected its nominal average rate. During 2013, loans innuevos soles, which had a greater decline in nominal average rate compared to loans in U.S. dollars, represented a larger portion of Interbank’s gross loans. The average loan balance innuevo soles grew from 52.9% in 2012 to 56.7% of Interbank’s gross loans in 2013.
Interbank’s interest on investments available-for-sale decreased by S/. 40.8 million in 2013 compared to 2012 as a result of a lower average volume and lower nominal average rate on its investment portfolio. Volume decrease accounted for a S/. 18.6 million reduction in interest income and was largely attributable to lower investments in Central Reserve Bank of Peru certificates of deposit, while a decrease in Interbank’s investments nominal average rate, from 5.1% in 2012 to 4.0% in 2013, accounted for a S/. 22.2 million decrease in interest income.
Interest on due from banks and inter-bank funds increased by S/. 14.5 million in 2013 compared to 2012, mainly due to a 63.9% growth in average volume. The increase in the average volume due from banks and inter-bank funds was a result of a higher average reserve requirement from the Central Reserve Bank of Peru in effect throughout 2013 when compared to 2012. The nominal average rate slightly decreased, from 1.0% in 2012 to 0.9% in 2013, representing a S/. 3.3 million reduction in interest income.
Interest and Similar Expenses
The following table presents the components of interest and similar expenses for our banking segment for 2013 and 2012.
| For the years ended December 31, | ||||||||||||||||
| 2013 | 2012 | Change | ||||||||||||||
(S/. in millions)
| (S/. in millions) | % | ||||||||||||||
Interest and similar expenses | ||||||||||||||||
Interest on deposits and obligations | (275.1 | ) | (243.3 | ) | (31.8 | ) | 13.1 | % | ||||||||
Interest on bonds, notes and other obligations | (191.0 | ) | (155.6 | ) | (35.4 | ) | 22.8 | % | ||||||||
Interest and fees due to banks and correspondents | (148.0 | ) | (134.1 | ) | (13.9 | ) | 10.4 | % | ||||||||
|
|
|
| |||||||||||||
Total interest and similar expenses | (614.0 | ) | (532.9 | ) | (81.1 | ) | 15.2 | % | ||||||||
|
|
|
| |||||||||||||
Nominal average rate | 3.0 | % | 3.1 | % | ||||||||||||
Total interest and similar expenses increased by S/. 81.1 million, or 15.2%, in 2013 compared to 2012 as a result of a S/. 31.8 million increase in interest on deposits and obligations, an S/. 13.9 million increase in interest and fees due to banks and correspondents, and a S/. 35.4 million increase in interest on bonds, notes and other obligations.
71
Table of Contents
Interest on deposits and obligations increased by S/. 31.8 million, from S/. 243.3 million in 2012 to S/. 275.1 million in 2013, due to a 19.2% increase in the average volume, which was partially offset by a lower nominal average rate. Higher average volume accounted for a S/. 50.8 million increase in interest expense. Cost of deposits decreased from 2.0% in 2012 to 1.9% in 2013, accounting for a S/. 19.0 million decrease in interest on deposits.
Interest on bonds, notes and other obligations increased by S/. 35.4 million, or 22.8%, in 2013 compared to 2012, mainly as a result of a 24.2% increase in average volume. In September 2012, Interbank issued US$250.0 million of senior notes in the international capital markets, and during 2013, Interbank issued two subordinated bonds in the local capital markets for S/. 150.0 million and US$50.0 million. At the same time, in 2013, certain bonds amounting to S/. 153.1 million matured. The increase in average volume was partially offset by a decline in nominal average rate, from 6.6% in 2012 to 6.5% in 2013.
Interest and fees due to banks and correspondents increased by S/. 13.9 million, or 10.4%, in 2013 compared to 2012, due to a 16.9% increase in average volumes, which was partly offset by a decline in average cost from 4.8% in 2012 to 4.5% in 2013. Growth in the average volume of interest and fees due to banks and correspondents was driven by increases in local funding, which is mostly used to fund mortgage loans granted under government-sponsored housing programs, such asMivivienda, and in foreign funding. The increase in foreign funding average volume was mainly due to the disbursement of a US$200.0 million syndicated loan in 2013, partially offset by the maturity of various loans. The decline in the nominal average rate related to banks and correspondents was mainly due to a decrease in Interbank’s nominal average rate in U.S. dollars, which decreased from 4.2% in 2012 to 3.6% in 2013. The increase in funding volume accounted for S/. 25.5 million of the increase in interest expense, while the decline in the average cost offset such increase by S/. 11.6 million.
Interbank’s nominal average rate decreased 3.1% in 2012 to 3.0% in 2013, mainly as a result of lower nominal average rate on deposits and a higher proportion of deposits within its total funding base.
Net Interest Margin
As a result of the above, Interbank’s net interest margin declined from 6.9% in 2012 to 6.2% in 2013, due to a 21.4% increase in average volume of interest-earning assets, which exceeded the increase of 9.6% in net interest income.
Provision for Loan Losses, Net of Recoveries
The following table presents the components of provision for loan losses, net of recoveries for our banking segment for 2013 and 2012.
| For the years ended December 31, | ||||||||||||||||
| 2013 | 2012 | Change | ||||||||||||||
| (S/. in millions) | (S/. in millions) | % | ||||||||||||||
Provision for loan losses, net of recoveries | (377.2 | ) | (400.8 | ) | 23.5 | 5.9 | % | |||||||||
Past-due-loan ratio (at period end) | 1.7 | % | 1.9 | % | ||||||||||||
Provision for loan losses as a percentage of average total loans | 2.3 | % | 3.0 | % | ||||||||||||
Coverage ratio (at period end) | 199.9 | % | 201.7 | % | ||||||||||||
Allowance for loan losses (at period end) | 693.0 | 587.4 | ||||||||||||||
Provision for loan losses, net of recoveries decreased by S/. 23.5 million, or 5.9%, in 2013 compared to 2012 mainly due to lower provisioning requirements on credit cards, as a result of an improvement in asset
72
Table of Contents
quality. Interbank’s provisions for loan losses, net of recoveries to average loans (without recoveries) decreased from 3.0% in 2012 to 2.3% in 2013, the same ratio for consumer loans decreased from 7.2% in 2012 to 5.7% in 2013 while the ratio for commercial loans slightly decreased from 1.1% to 1.0%. During this period, Interbank’s current loans increased 26.5%, while its past-due loans increased 19.1% from S/. 291.2 million in 2012 to S/. 346.6 million in 2013. As a result, Interbank’s past-due loans ratio improved from 1.9% in 2012 to 1.7% in 2013. Interbank’s lower past-due loan ratio was mainly due to improvements in Interbank’s credit scoring origination models on credit cards, and to a revised strategy to target customers with good credit risk scores and offer differentiated pricing in relation to a customer’s risk profile. The past-due loan ratio for credit cards decreased from 4.6% in 2012 to 3.8% in 2013.
Allowances for loan losses increased in 2013 when compared to 2012 as a result of growth in Interbank’s loan portfolio. While past-due loans grew 19.1% from 2012 to 2013, allowances for loan losses increased only 18.0%, as higher asset quality resulted in lower requirements for additional provisions. As a result, Interbank’s coverage ratio decreased to 199.9% in 2013 from 201.7% in 2012.
Fee Income from Financial Services, Net
The following table presents the components of fee income from financial services, net for our banking segment for 2013 and 2012.
| For the years ended December 31, | ||||||||||||||||
| 2013 | 2012 | Change | ||||||||||||||
| (S/. in millions) | (S/. in millions) | % | ||||||||||||||
Income | ||||||||||||||||
Maintenance and mailing of accounts, interchange fees, transfers and credit and debit card services | 396.2 | 445.4 | (49.3 | ) | (11.1 | )% | ||||||||||
Commissions from banking services | 222.7 | 186.9 | 35.7 | 19.1 | % | |||||||||||
Fees for indirect loans | 49.0 | 40.8 | 8.2 | 20.2 | % | |||||||||||
Collection services | 19.5 | 20.9 | (1.5 | ) | (6.9 | )% | ||||||||||
Funds management | 33.0 | 29.8 | 3.2 | 10.9 | % | |||||||||||
Others | 25.5 | 33.2 | (7.7 | ) | (23.3 | )% | ||||||||||
|
|
|
|
|
| |||||||||||
Total income | 745.8 | 757.0 | (11.2 | ) | (1.5 | )% | ||||||||||
Expenses | ||||||||||||||||
Insurance | (129.1 | ) | (94.5 | ) | (34.6 | ) | 36.6 | % | ||||||||
Fees paid to foreign banks | (18.0 | ) | (14.0 | ) | (4.0 | ) | 28.3 | % | ||||||||
Other | (24.1 | ) | (22.6 | ) | (1.4 | ) | 6.3 | % | ||||||||
Total expenses | (171.1 | ) | (131.2 | ) | (40.0 | ) | 30.5 | % | ||||||||
|
|
|
|
|
| |||||||||||
Fee income from financial services, net | 574.7 | 625.8 | (51.2 | ) | (8.2 | )% | ||||||||||
|
|
|
| |||||||||||||
Interbank’s fee income from financial services, net decreased S/. 51.2 million, or 8.2%, in 2013 compared to 2012, mainly explained by a S/. 49.3 million decrease in maintenance and mailing of accounts, interchange fees, transfers and credit and debit card services. Credit card commissions were affected by a decrease in credit card-related fees due to regulatory changes in effect from January 2013 which prohibit banks to charge certain specific fees and (ii) lower credit card account statement fees attributable to a decrease in the number of credit card accounts and to an increase in the number of customers migrating to online credit card account statements, which are delivered for free.
Commissions from banking services increased by S/. 35.7 million, or 19.1%, in 2013 compared to 2012, as a result of higher insurance premiums related to insurance sold for Interseguro by Interbank. These amounts are eliminated upon combination. Such increase in fee income was offset by a S/. 34.6 million increase in insurance related expenses.
73
Table of Contents
Other Income
The following table presents the components of other income for our banking segment for 2013 and 2012.
| For the years ended December 31, | ||||||||||||||||
| 2013 | 2012 | Change | ||||||||||||||
| (S/. in millions) | (S/. in millions) | % | ||||||||||||||
Net gain on foreign exchange transactions | 183.4 | 193.9 | (10.4 | ) | (5.4 | )% | ||||||||||
Net gain on sale of securities | 85.9 | 14.8 | 71.1 | 480.6 | % | |||||||||||
Net trading (loss) income | 34.2 | 2.1 | 32.1 | 1515.7 | % | |||||||||||
Other | 75.6 | 49.3 | 26.4 | 53.5 | % | |||||||||||
|
|
|
|
|
| |||||||||||
Other income | 379.2 | 260.0 | 119.1 | 45.8 | % | |||||||||||
|
|
|
| |||||||||||||
Other income increased by S/. 119.1 million, or 45.8%, in 2013 compared to 2012 mainly due to an increase in net gain on sale of securities and higher net trading income. The increase in net gain on sale of securities was related to the sale of equity investments, which generated S/. 82.3 million in pre-tax income in 2013. Interbank’s net trading income increased by S/. 32.1 million in 2013 compared to 2012, mainly as a result of derivative instruments that were positively affected by the appreciation of the U.S. dollar against thenuevo sol during 2013. However, such increases were partially offset by a S/. 10.4 million decrease in net gain on foreign exchange transactions, which was due to a decrease in income from forward foreign exchange agreements with clients.
Other Expenses
The following table presents the components of other expenses for our banking segment for 2013 and 2012.
| For the years ended December 31, | ||||||||||||||||
| 2013 | 2012 | Change | ||||||||||||||
| (S/. in millions) | (S/. in millions) | % | ||||||||||||||
Other expenses | ||||||||||||||||
Salaries and employee benefits | (510.3 | ) | (457.8 | ) | (52.5 | ) | 11.5 | % | ||||||||
Administrative expenses | (587.2 | ) | (547.2 | ) | (40.0 | ) | 7.3 | % | ||||||||
Depreciation and amortization | (90.9 | ) | (81.3 | ) | (9.6 | ) | 11.9 | % | ||||||||
Other | (37.4 | ) | (40.2 | ) | 2.7 | (6.8 | )% | |||||||||
|
|
|
|
|
| |||||||||||
Total other expenses | (1,225.9 | ) | (1,126.4 | ) | (99.4 | ) | 8.8 | % | ||||||||
|
|
|
| |||||||||||||
Other expenses increased S/. 99.4 million, or 8.8%, in 2013 compared to 2012, as a result of a S/. 52.2 million increase in salaries and employee benefits and a S/. 40.0 million increase in administrative expenses. Personnel expenses increased mainly due to an increase in Interbank’s average headcount, from 6,528 in 2012 to 6,697 in 2013, and an increase in the average cost per employee. The increase in administrative expenses was due to higher expenses for third-party services provided to Interbank, with the largest cost increases related to (i) property leases, mainly from Interbank’s financial stores, (ii) miscellaneous services and (iii) maintenance. On the other hand, the increase of S/. 9.6 million in depreciation and amortization expenses was mainly attributable to investments in systems and information technology intangible assets.
Interbank’s efficiency ratio is calculated by dividing salaries and employee benefits plus administrative expenses plus depreciation and amortization by net interest and similar income plus other income. Interbank’s efficiency ratio remained almost flat at 47.8% in 2013 compared to 47.6% in 2012.
Profit for the Year
As a result of the foregoing, our banking segment’s profit for the year increased by S/. 46.6 million, or 8.2%, from S/. 568.4 million in 2012 to S/. 615.0 million in 2013. Interbank’s ROE which was 23.7% for 2013 and 25.1% for 2012.
74
Table of Contents
Insurance
Interseguro is an insurance company that caters to Peru’s middle class. Interseguro is focused on annuities, the fastest growing insurance product in Peru. Interseguro also offers a variety of individual life insurance products providing a wide range of coverage for the length of a policyholder’s life. In addition, Interseguro offers retail insurance products that are low-cost premium insurance products mostly sold through Intercorp Peru’s complementary channels, including credit life insurance, debit and credit card protection insurance and SOAT.
Net Interest and Similar Income
The following table presents the components of our insurance segment’s net interest and similar income for 2013 and 2012.
| For the years ended December 31, | ||||||||||||||||
| 2013 | 2012 | Change | ||||||||||||||
| (S/. in millions) | (S/. in millions) | % | ||||||||||||||
Net interest and similar income | ||||||||||||||||
Interest and similar income | 169.7 | 134.4 | 35.3 | 26.3 | % | |||||||||||
Interest and similar expenses | (1.4 | ) | (1.2 | ) | (0.1 | ) | 8.6 | % | ||||||||
|
|
|
|
|
| |||||||||||
Net interest and similar income | 168.4 | 133.2 | 35.2 | 26.4 | % | |||||||||||
|
|
|
| |||||||||||||
Interseguro’s net interest and similar income increased S/. 35.2 million, or 26.4%, in 2013 compared to 2012.
The increase in interest and similar income was driven by an increase in interests on investments available-for-sale as part of a 15.1% increase in the average volume of Interseguro’s investment portfolio and a 53 basis points increase in its nominal average rate during 2013. The investment portfolio increased primarily as a result of growth in premiums. The nominal average rate received for our insurance segment’s investments increased from 5.4% in 2012 to 6.0% in 2013.
Other Income
| For the years ended December 31, | ||||||||||||||||
| 2013 | 2012 | Change | ||||||||||||||
| (S/. in millions) | (S/. in millions) | % | ||||||||||||||
Net gain on sale of securities | 62.3 | 65.4 | (3.1 | ) | (4.7 | )% | ||||||||||
Net trading (loss) income | (18.6 | ) | (1.9 | ) | (16.7 | ) | NM | |||||||||
Rental income | 36.1 | 42.0 | (5.9 | ) | (14.0 | )% | ||||||||||
Profit from sale of investment property | 25.2 | 17.7 | 7.5 | 42.7 | % | |||||||||||
Valuation gain from investment property | 77.3 | 39.1 | 38.2 | 97.6 | % | |||||||||||
Other | 14.5 | 21.9 | (7.5 | ) | (34.0 | )% | ||||||||||
|
|
|
|
|
| |||||||||||
Other income | 196.7 | 184.2 | 12.6 | 6.8 | % | |||||||||||
|
|
|
| |||||||||||||
Other income increased by S/. 12.6 million, or 6.8%, in 2013 compared to 2012, mainly as a result of an increase in valuation gain from Interseguro’s real estate investment property and profit from sale of investment property during the same period.
Net gain on sale of securities decreased due primarily due to lower gains in bonds, which were partially offset by higher gains in equity and funds. Net trading income decreased mainly due to a S/. 18.6 million loss on a currency forward position that resulted from the depreciation of thenuevo sol against the U.S. dollar.
Rental income decreased as a result of the sale of certain real estate investments.
75
Table of Contents
Total Premiums Earned Less Claims and Benefits
The following table presents the components of total premiums earned less claims and benefits for 2013 and 2012 for our insurance segment.
| For the years ended December 31, | ||||||||||||||||
| 2013 | 2012 | Change | ||||||||||||||
| (S/. in millions) | (S/. in millions) | % | ||||||||||||||
Premiums assumed | 564.3 | 446.6 | 117.7 | 26.3 | % | |||||||||||
Premiums ceded to reinsurers | (5.7 | ) | (4.7 | ) | (1.1 | ) | 22.9 | % | ||||||||
Adjustment of technical reserves | (294.8 | ) | (355.0 | ) | 60.2 | (17.0 | )% | |||||||||
Net claims and benefits incurred | (173.8 | ) | (147.5 | ) | (26.3) | 17.9 | % | |||||||||
|
|
|
|
|
| |||||||||||
Total premiums earned less claims and benefits | 89.9 | (60.5 | ) | 150.5 | N/M | |||||||||||
|
|
|
| |||||||||||||
Interseguro’s net premiums (premiums assumed minus premiums ceded to reinsurers) increased S/. 116.6 million, or 26.4%, in 2013 compared to 2012. Adjustment of technical reserves decreased 17.0%, from S/. 355 million in 2012 to S/. 294.8 million in 2013. Claims incurred increased 17.9%, from S/. 147.5 million in 2012 to S/. 173.8 million in 2013, mainly due to an increase in annuity claims. As a result, total premiums earned less claims and benefits increased from a S/. 60.5 million loss in 2012 to a S/. 89.9 million gain in 2013.
Net Premiums
Net premiums represent the difference between premiums assumed and premiums ceded to reinsurers. The following table presents net premiums by business line for 2013 and 2012 for our insurance segment.
| For the years ended December 31, | ||||||||||||||||
| 2013 | 2012 | Change | ||||||||||||||
| (S/. in millions) | (S/. in millions) | % | ||||||||||||||
Annuities(1) | 395.9 | 326.8 | 69.1 | 21.1 | % | |||||||||||
Individual Life | 28.8 | 23.0 | 5.8 | 25.2 | % | |||||||||||
Retail Insurance | 133.9 | 92.2 | 41.7 | 45.2 | % | |||||||||||
Credit Life Insurance | 68.0 | 47.6 | 20.4 | 42.9 | % | |||||||||||
Mandatory Traffic Accident (SOAT) | 24.7 | 23.2 | 1.5 | 6.3 | % | |||||||||||
Card Protection | 22.6 | 11.8 | 10.8 | 92.4 | % | |||||||||||
Others | 18.6 | 9.6 | 9.0 | 108.0 | % | |||||||||||
|
|
|
|
|
| |||||||||||
Net premiums | 558.6 | 442.0 | 116.6 | 26.4 | % | |||||||||||
| (1) | Annuities include premiums from pension-related insurance (disability and survivorship) which Interseguro ceased to offer in 2007 and are currently in run off. |
Net premiums increased by S/. 116.6 million, or 26.4%, in 2013 compared to 2012, mainly as a result of the growth in annuities, credit life insurance and card protection during the period. Premiums earned from annuities increased by S/. 69.1 million, from S/. 326.8 million in 2012 to S/. 395.9 million in 2013, reflecting a market expansion and a market share growth in 2013. In addition, there was a S/. 20.4 million, or 42.9%, increase in premiums earned from credit life insurance policies during the same period due primarily to the overall growth of insured credits and a new commercial agreement between Interbank and Interseguro that led to higher premiums paid to Interseguro and higher commissions. These amounts are eliminated upon combination. A new insurance contract law requiring annual premiums issuance for certain products and the growth in insured credit/debit cards resulted in higher card protection premiums of S/. 10.8 million, or 92.4% growth, in 2013 compared to 2012.
76
Table of Contents
Adjustment of Technical Reserves
The following table presents adjustment of technical reserves by business line for 2013 and 2012 for our insurance segment.
| For the years ended December 31, | ||||||||||||||||
| 2013 | 2012 | Change | ||||||||||||||
| (S/. in millions) | (S/. in millions) | % | ||||||||||||||
Annuities(1) | (273.1 | ) | (344.3 | ) | 71.2 | (20.7 | )% | |||||||||
Individual Life | (10.2 | ) | (9.1 | ) | (1.1 | ) | 11.6 | % | ||||||||
Retail Insurance | (11.5 | ) | (1.6 | ) | (9.9 | ) | 632.1 | % | ||||||||
|
|
|
|
|
| |||||||||||
Adjustment of technical reserves | (294.8 | ) | (355.0 | ) | 60.2 | (17.0 | )% | |||||||||
| (1) | Annuities include premiums from pension-related insurance (disability and survivorship) which Interseguro ceased to offer in 2007 and are currently in run off. |
Adjustment of technical reserves decreased S/. 60.2 million, or 17.0%, in 2013 compared to 2012, mainly as a result of lower technical reserves in annuities partially offset by higher technical reserves in individual life and retail insurance products during the period. Technical reserves in annuities decreased by S/. 71.2 million, from S/. 344.3 million in 2012 to S/. 273.1 million in 2013, driven by the use of a higher rate to discount estimated future payments. The discount rate depends mainly on the interest rate performance on Interseguro’s debt instruments on its portfolio, adjusted for credit risk that increased from 3.4% in 2012 to 4.0% in 2013, mainly driven by the 10-year U.S. Treasury Bond rate increasing from 1.76% in 2012 to 3.03% in 2013.
Net Claims and Benefits Incurred
The following table presents net claims and benefits incurred by business line for 2013 and 2012 for our insurance segment.
| For the years ended December 31, | ||||||||||||||||
| 2013 | 2012 | Change | ||||||||||||||
| (S/. in millions) | (S/. in millions) | % | ||||||||||||||
Annuities(1) | (135.1 | ) | (115.7 | ) | (19.3 | ) | 16.7 | % | ||||||||
Individual Life | (1.8 | ) | (2.2 | ) | 0.4 | (19.0 | )% | |||||||||
Retail Insurance | (37.0 | ) | (29.5 | ) | (7.4 | ) | 25.1 | % | ||||||||
Credit Life Insurance | (25.2 | ) | (19.5 | ) | (5.6 | ) | 28.7 | % | ||||||||
Mandatory Traffic Accident (SOAT) | (10.2 | ) | (9.1 | ) | (1.1 | ) | 12.0 | % | ||||||||
Card Protection | (0.4 | ) | (0.4 | ) | 0.0 | (10.2 | )% | |||||||||
Others | (1.2 | ) | (0.4 | ) | (0.8 | ) | 175.6 | % | ||||||||
|
|
|
|
|
| |||||||||||
Net claims and benefits incurred | (173.8 | ) | (147.5 | ) | (26.3 | ) | 17.9 | % | ||||||||
| (1) | Annuities include premiums from pension-related insurance (disability and survivorship) which Interseguro ceased to offer in 2007 and are currently in run off. |
Net claims and benefits incurred increased by S/. 26.3 million, or 17.9%, in 2013 compared to 2012, mainly as a result of higher annuity claims related to annuities during the period. Annuity claims increased by S/. 19.3 million, from S/. 115.7 million in 2012 to S/. 135.1 million in 2013, reflecting the growth of Interseguro’s annuities portfolio. In addition, there was a S/. 5.6 million, or 28.7%, increase in credit life insurance claims during the same period. This increase was due to a higher observed mortality rate compared to the previous year, but still below Interseguro’s assumed mortality rate.
77
Table of Contents
Other Expenses
The following table presents the components of our insurance segment’s other expenses for 2013 and 2012.
| For the years ended December 31, | ||||||||||||||||
| 2013 | 2012 | Change | ||||||||||||||
| (S/. in millions) | (S/. in millions) | % | ||||||||||||||
Other expenses | ||||||||||||||||
Salaries and employee benefits | (56.2 | ) | (41.2 | ) | (15.0 | ) | 36.4 | % | ||||||||
Administrative expenses | (26.5 | ) | (22.3 | ) | (4.2 | ) | 18.7 | % | ||||||||
Depreciation and amortization | (2.5 | ) | (1.9 | ) | (0.6 | ) | 31.0 | % | ||||||||
Third-party commissions | (40.6 | ) | (15.4 | ) | (25.2 | ) | 164.1 | % | ||||||||
Expenses related to rental income | (6.1 | ) | (4.0 | ) | (2.1 | ) | 53.6 | % | ||||||||
Other | (34.6 | ) | (19.5 | ) | (15.1 | ) | 77.2 | % | ||||||||
|
|
|
|
|
| |||||||||||
Total other expenses | (166.4 | ) | (104.3 | ) | (62.2 | ) | 59.6 | % | ||||||||
|
|
|
| |||||||||||||
Total other expenses were S/. 166.4 million in 2013, 59.6% higher than in 2012, mainly as a result of higher salaries and employee benefits, third-party commissions and other expenses. Salaries and employee benefits increased from S/. 41.2 million in 2012 to S/. 56.2 million in 2013 as a result of a S/. 9.5 million increase in sales force commissions and a S/. 5.5 million increase in back-office personnel expenses in line with the growth of the business. Administrative expenses increased by S/. 4.2 million from S/. 22.3 million in 2012 to S/. 26.5 million in 2013, mainly driven by expenses related to outsourcing of information technology development and marketing expenses. Third-party commissions increased by S/. 25.2 million due to higher insurance premiums that led to higher commissions paid by Interseguro to Interbank and to third parties. These amounts are eliminated upon combination at the IFS level. Expenses related to rental income increased from S/. 4.0 million in 2012 to S/. 6.1 million in 2013. Other expenses increased from S/. 20.0 million in 2012 to S/. 34.6 million in 2013, mainly as a result of a S/. 14.1 million impairment loss on investments available-for-sale.
Profit for the Year
As a result of the foregoing, our insurance segment’s profit for the year increased by S/. 131.6 million, or 87.7%, from S/. 150.0 million in 2012 to S/. 281.6 million in 2013. The increase in profit of the year resulted in an increase in Interseguro’s ROE which was 48.2% for 2013 and 27.1% for 2012.
Wealth Management
Inteligo is a premier wealth management business serving retail and institutional clients. Inteligo is a fast-growing provider of wealth management services through Inteligo Bank and brokerage services through Inteligo SAB. Inteligo caters mainly to Peruvian high net worth individuals, particularly clients with investable assets between US$0.5 million and US$10 million who are benefitting from Peru’s rapid wealth creation. Inteligo Bank represents the principal source of profit for Inteligo, contributing over 99% of its profit for the year ended December 31, 2013.
78
Table of Contents
Interest and Similar Income
The following table presents the components of our wealth management segment’s interest and similar income for 2013 and 2012.
| For the years ended December 31, | ||||||||||||||||
| 2013 | 2012 | Change | ||||||||||||||
| (S/. in millions) | (S/. in millions) | % | ||||||||||||||
Interest and similar income | ||||||||||||||||
Interest on loans | 57.6 | 41.9 | 15.7 | 37.5 | % | |||||||||||
Interest on investments available-for-sale | 42.0 | 39.4 | 2.6 | 6.7 | % | |||||||||||
Interest on due from banks and inter-bank funds | 0.2 | 0.1 | 0.1 | 164.4 | % | |||||||||||
|
|
|
|
|
| |||||||||||
Total interest and similar income | 99.8 | 81.3 | 18.5 | 22.7 | % | |||||||||||
|
|
|
| |||||||||||||
Nominal Average Rate | 4.4 | % | 4.2 | % | ||||||||||||
Total interest and similar income increased S/. 18.5 million, or 22.7%, in 2013 compared to 2012, mainly due to higher interest on loans. The increase was the result of a 48.8% increase in the average balance of Inteligo’s loan portfolio, which was partially offset by a decrease in the nominal average rate charged during the same period.
Interest on investments available-for-sale increased by S/. 2.6 million, or 6.7% in 2013 compared to 2012, mainly due to higher dividends received and higher income from fixed income securities. The nominal average rate for Inteligo’s portfolio improved from 3.4% in 2012 to 3.9% in 2013. The increase in interest income was partially offset by a 6.1% decrease in the average balance in Inteligo’s investment portfolio.
Interest and Similar Expenses
The following table presents the components of our wealth management segment’s interest and similar expenses for 2013 and 2012.
| For the years ended December 31, | ||||||||||||||||
| 2013 | 2012 | Change | ||||||||||||||
| (S/. in millions) | (S/. in millions) | % | ||||||||||||||
Interest and similar expenses | ||||||||||||||||
Interest on deposits and obligations | (41.3 | ) | (33.4 | ) | (7.9 | ) | 23.6 | % | ||||||||
Interest and fees due to banks and correspondents | (1.5 | ) | (0.3 | ) | (1.2 | ) | N/M | |||||||||
Interest on bonds, notes and other obligations | (0.4 | ) | (0.8 | ) | 0.4 | (52.2 | )% | |||||||||
|
|
|
|
|
| |||||||||||
Total interest and similar expenses | (43.2 | ) | (34.5 | ) | (8.7 | ) | 25.1 | % | ||||||||
|
|
|
| |||||||||||||
Nominal Average Rate | 2.9 | % | 3.1 | % | ||||||||||||
Total interest and similar expenses increased S/. 8.7 million, or 25.1%, in 2013 compared to 2012, mainly as a result of a S/. 7.9 million increase in expenses related to interest on deposits and obligations, and a S/. 1.2 million increase in expenses related to interest and fees due to banks and correspondents.
Interest on deposits and obligations increased by S/. 7.9 million, from S/. 33.4 million in 2012 to S/. 41.3 million in 2013, as a result of a 23.0% increase in the average volume of interest-bearing deposits, which contributed S/. 7.7 million of the increase in interest expenses.
Interest and fees due to banks and correspondents increased S/. 1.2 million in 2013 compared to 2012 due to a 152.6% increase in average volume of loans with banks. The growth in volume was driven by increases in funding which was mostly used to grant new loans and fund portfolio investments.
79
Table of Contents
Inteligo’s nominal average rate for interest bearing liabilities decreased 17 basis points, from 3.1% in 2012 to 2.9% in 2013, mainly as a result of lower rates paid on time deposits. Inteligo’s total cost of funding increased five basis points to 2.1% in 2013, which was attributable to a greater proportion of clients’ funds being in time deposits as compared to non-interest paying cash accounts.
Provision for Loan Losses, Net of Recoveries
Inteligo’s loan portfolio had no delinquencies in either 2012 or 2013. As a result, Inteligo’s provision for loan losses was zero in both periods.
Fee Income from Financial Services, Net
The following table presents the components of our wealth management segment’s fee income from financial services, net for 2013 and 2012.
| For the years ended December 31, | ||||||||||||||||
| 2013 | 2012 | Change | ||||||||||||||
| (S/. in millions) | (S/. in millions) | % | ||||||||||||||
Income | ||||||||||||||||
Funds management | 72.2 | 52.3 | 19.9 | 38.1 | % | |||||||||||
Brokerage | 8.8 | 10.4 | (1.6 | ) | (15.5 | )% | ||||||||||
|
|
|
|
|
|
|
| |||||||||
Total income | 81.0 | 62.7 | 18.3 | 29.2 | % | |||||||||||
|
|
|
|
|
|
|
| |||||||||
Expenses | ||||||||||||||||
Brokerage | (0.2 | ) | (0.3 | ) | 0.1 | (38.3 | )% | |||||||||
Others | (2.3 | ) | (1.0 | ) | (1.3 | ) | NM | |||||||||
|
|
|
|
|
|
|
| |||||||||
Total expenses | (2.5 | ) | (1.3 | ) | (1.2 | ) | 91.7 | % | ||||||||
|
|
|
|
|
| |||||||||||
Fee income from financial services, net | 78.5 | 61.4 | 17.1 | 27.8 | % | |||||||||||
|
|
|
| |||||||||||||
Fee income from financial services, net, increased S/. 17.1 million, or 27.8%, in 2013 compared to 2012, primarily due to a S/. 19.9 million, or 38.1%, increase in fee income from funds management, which was partially offset by a S/. 1.2 million increase in total expenses. The increase of S/. 19.9 million in fee income from funds management was mainly attributable to a 25.6% year-over-year increase in assets under management plus deposits, and improved pricing for managing client assets through Inteligo Bank. This increase was partially offset by a decrease of S/. 1.6 million in brokerage income from Inteligo SAB. The decrease in brokerage income was mainly due to a decrease in overall volumes traded on the Lima Stock Exchange.
Other Income
The following table shows other income of our wealth management segment in 2013 and 2012.
| For the years ended December 31, | ||||||||||||||||
| 2013 | 2012 | Change | ||||||||||||||
| (S/. in millions) | (S/. in millions) | % | ||||||||||||||
Net gain on sale of securities | 28.6 | 45.0 | (16.3 | ) | (36.3 | )% | ||||||||||
Net trading income | 5.2 | 6.9 | (1.7 | ) | (24.1 | )% | ||||||||||
Others | 0.1 | (0.0 | ) | 0.1 | NM | |||||||||||
|
|
|
| |||||||||||||
Other income | 33.9 | 51.8 | (17.9 | ) | (34.6 | )% | ||||||||||
|
|
|
| |||||||||||||
Other income decreased S/. 17.9 million, or 34.6%, in 2013 compared to 2012, mainly due to a S/. 16.3 million, or 36.3%, decrease in net gain on sale of securities. Net gain on sale of securities corresponded to the sale of shares in mutual funds and common stock. These gains were partially offset by losses in the sale of
80
Table of Contents
fixed income securities, resulting from a sharp increase in the benchmark 10 year US Treasury yield during 2013. During the second half of 2013, Inteligo’s investment portfolio was rebalanced and a portion of fixed income securities was sold. Similarly, the decrease in net trading income of S/. 1.7 million from 2012 to 2013 was due to a lower fair value of fixed income securities, driven by the increase in interest rates experienced during 2013.
Other Expenses
The following table presents the components of our wealth management segment’s other expenses for 2013 and 2012.
| For the years ended December 31, | ||||||||||||||||
| 2013 | 2012 | Change | ||||||||||||||
| (S/. in millions) | (S/. in millions) | % | ||||||||||||||
Other expenses | ||||||||||||||||
Salaries and employee benefits | (35.5 | ) | (33.7 | ) | (1.8 | ) | 5.3 | % | ||||||||
Administrative expenses | (24.1 | ) | (22.6 | ) | (1.5 | ) | 6.4 | % | ||||||||
Depreciation and amortization | (2.9 | ) | (2.5 | ) | (0.4 | ) | 14.2 | % | ||||||||
Other | (0.0 | ) | (1.0 | ) | 1.1 | NM | ||||||||||
|
|
|
|
|
| |||||||||||
Total other expenses | (62.4 | ) | (59.9 | ) | (2.5 | ) | 4.3 | % | ||||||||
|
|
|
| |||||||||||||
Total other expenses increased by S/. 2.5 million, or 4.3%, in 2013 compared to 2012. Salaries and employee benefits increased by S/. 1.8 million, as a result of an increase in our wealth management segment’s average payroll. Additionally, administrative expenses increased by S/. 1.5 million mainly due to increases in services provided by third parties.
Depreciation of property, plant and equipment increased by S/. 0.4 million in 2013 compared to 2012 as a result of a larger balance of equipment assets due to the installation of new offices for Inteligo in Panama City.
Inteligo’s efficiency ratio is calculated by dividing salaries and employee benefits plus administrative expenses plus depreciation and amortization by net interest and similar income plus other income. Our wealth management segment’s efficiency ratio improved to 36.9% in 2013 from 36.7% in 2012.
Profit for the Year
As a result of the foregoing, our wealth management segment’s profit for the year increased by S/. 10.1 million, or 10.1%, from S/. 99.3 million in 2012 to S/. 109.3 million in 2013. Inteligo’s ROE was 26.5% for 2013 and 28.3% for 2012.
Liquidity and Capital Resources
Our primary source of liquidity is dividends received from our subsidiaries and our primary use of funds is the payment of dividends to our shareholders. The following discussion of liquidity and capital resources is on a segment basis. See “Dividends and Dividend Policy”.
Interbank
The following table presents Interbank’s primary sources of funds as of December 31, 2013 and 2012
| At December 31, | ||||||||||||||||
| 2013 | 2012 | Change | ||||||||||||||
| (S/. in millions) | (S/. in millions) | % | ||||||||||||||
Deposits and obligations | 20,239.4 | 14,594.1 | 5,645.3 | 38.7 | % | |||||||||||
Due to banks and correspondents | 2,981.3 | 3,179.9 | (198.6 | ) | (6.2 | )% | ||||||||||
Bonds, notes and other obligations | 3,068.7 | 2,707.3 | 361.4 | 13.4 | % | |||||||||||
|
|
|
|
|
| |||||||||||
Total | 26,289.4 | 20,481.3 | 5,808.1 | 28.4 | % | |||||||||||
|
|
|
| |||||||||||||
81
Table of Contents
In our banking segment, our primary sources of funds have traditionally consisted of deposits and obligations, which amounted to S/. 20,239.4 million at December 31, 2013. Interbank’s deposits include retail and commercial deposits, generated mainly through its financial stores distribution network, and its relationships with commercial clients.
Interbank is required to maintain deposits with the Central Reserve Bank of Peru, as legal reserves, in an amount determined by the percentage of the deposits and other liabilities owed to its clients. For a description of theencaje legales (minimum reserves) regulations, see “Regulation and Supervision”.
At times, Interbank has utilized Peru’sshort-term interbank loans market to satisfy liquidity needs. The Central Reserve Bank of Peru’s discount window, which makesshort-term loans to banks at premium rates, is another potential,short-term funding source, although Interbank has used it infrequently. As part of Interbank’s liquidity management, it sometimes enter into repos on Central Reserve Bank certificates of deposit, which are a cost and tax efficient source of funds in Peruvian currency.
Amounts due to banks and correspondents of Interbank (including both short andlong-term amounts) decreased by S/. 198.6 million, or 6.2%, to S/. 2,981.3 million as of December 31, 2013 from S/. 3,179.9 million as of December 31, 2012 as a result of a decrease in loans received from foreign entities, partially offset by an increase in promotional credit lines received fromCorporación Financiera de Desarrollo S.A. (a Peruvian state-owned development bank, or “COFIDE”).
Interbank has issued senior, senior subordinated, junior subordinated, mortgage and leasing bonds in the Peruvian and international capital markets. Interest payable accounted for an additional S/. 41.3 million of Interbank’s bonds and other obligations. See note 12 to our audited combined financial statements.
Interseguro
Interseguro’s primary source of funds is premiums collected.
Interseguro issued subordinated bonds in the Peruvian market. As of December 31, 2013, Interseguro had S/. 14.0 million in bonds outstanding.
Inteligo
The following table presents Inteligo’s primary sources of funds as of December 31, 2013 and 2012.
| At December 31, | ||||||||||||||||
| 2013 | 2012 | Change | ||||||||||||||
| (S/. in millions) | (S/. in millions) | % | ||||||||||||||
Deposits and obligations | 2,017.3 | 1,638.3 | 378.9 | 23.1 | % | |||||||||||
Due to banks and correspondents | 224.7 | 165.9 | 58.8 | 35.5 | % | |||||||||||
|
|
|
|
|
| |||||||||||
Total | 2,242.0 | 1,804.2 | 437.7 | 24.3 | % | |||||||||||
In our wealth management segment, the primary source of funds has consisted of deposits and obligations, which amounted to S/. 2,017.3 million at December 31, 2013. Inteligo Bank’s deposits are retail deposits, from its private wealth clients. Retail deposits provide Inteligo with a low-cost, diverse and stable source of funding. Due to banks and correspondents consists of the credit facilities provided to Inteligo Bank.
Total deposits and obligations increased by S/. 378.9 million, or 23.1%, as of December 31, 2013 from December 31, 2012 as a result of an increase in time deposits.
Amounts due to banks and correspondents increased by S/. 58.8 million from S/. 165.9 million as of December 31, 2012 to S/. 224.7 million as of December 31, 2013 as a result of an increase in credit facilities for Inteligo Bank.
82
Table of Contents
Regulatory Capital
We do not present regulatory capital on a consolidated basis. However, Interbank and Interseguro are required to maintain minimum regulatory capital pursuant to guidelines issued by the SBS, and Inteligo Bank is required to maintain minimum regulatory capital pursuant to guidelines issued by the Central Bank of The Bahamas.
Interbank
As of December 31, 2013, the minimum regulatory capital as a percentage of risk-weighted assets for Interbank was 11.5%. As of December 31, 2013, Interbank’s ratio of regulatory capital to total risk weighted assets was 13.4%, the second highest among the largest four banks in Peru. See note 15(f) to our audited combined financial statements for a discussion of regulatory capital requirements applicable to Interbank.
The following table presents Interbank’s regulatory capital for the years ended December 31, 2013 and 2012 in accordance with Peruvian SBS GAAP, as required by the Peruvian Banking and Insurance Law.
| At December 31, | ||||||||||||||||
| 2013 | 2012 | Change | ||||||||||||||
| (S/. in millions) | (S/. in millions) | % | ||||||||||||||
Paid-in-capital | 1,680.2 | 1,423.5 | 256.7 | 18.0 | % | |||||||||||
Legal and special reserves | 397.1 | 340.1 | 57.0 | 16.8 | % | |||||||||||
Treasury stock | (33.9 | ) | (33.9 | ) | — | 0.0 | % | |||||||||
Earnings with capitalization agreement(1) | 292.1 | 245.2 | 46.9 | 19.1 | % | |||||||||||
Unrealized gains in investments available-for-sale | (0.7 | ) | 3.9 | (4.6 | ) | (117.9 | %) | |||||||||
Subordinated bonds | 412.1 | 349.3 | 62.8 | 18.0 | % | |||||||||||
Investment in parent company (IFS)(2) | (110.9 | ) | (101.1 | ) | (9.8 | ) | 9.7 | % | ||||||||
Others | (45.1 | ) | (58.3 | ) | 13.2 | (22.6 | %) | |||||||||
|
|
|
|
|
| |||||||||||
Total Tier I | 2,590.9 | 2,168.7 | 422.2 | 19.5 | % | |||||||||||
|
|
|
|
|
| |||||||||||
Subordinated bonds | 831.0 | 540.4 | 290.6 | 53.8 | % | |||||||||||
Generic allowances for loan losses | 306.2 | 249.9 | 56.3 | 22.5 | % | |||||||||||
Investment in parent company (IFS) | (111.0 | ) | (101.2 | ) | (9.8 | ) | 9.6 | % | ||||||||
Others | (45.1 | ) | (58.3 | ) | 13.2 | (22.6 | %) | |||||||||
|
|
|
|
|
| |||||||||||
Total Tier 2 | 981.2 | 630.8 | 350.4 | 55.5 | % | |||||||||||
|
|
|
|
|
| |||||||||||
Total Regulatory Capital | 3,572.1 | 2,799.5 | 772.6 | 27.6 | % | |||||||||||
|
|
|
|
|
| |||||||||||
Risk-weighted assets | 26,684.0 | 21,086.1 | 5,597.9 | 26.5 | % | |||||||||||
Regulatory capital as a percentage ofrisk-weighted assets | 13.4 | % | 13.3 | % | ||||||||||||
| (1) | Corresponds to retained earnings to be capitalized as directed by the board of directors. |
| (2) | Corresponds to 3,077,240 IFS shares held by Interbank as of December 31, 2013 and 2012. |
Interseguro
Interseguro is required to maintain a minimum regulatory capital, also known as solvency equity, pursuant to guidelines issued by the SBS. The capital requirement is the sum of solvency and the guarantee fund. Solvency equity is determined by the level of risk and the risk profile assumed by an insurance company in Peru in accordance with SBS regulations. The guarantee fund is equivalent to 35% of solvency equity. See note 15(f) to our audited combined financial statements for a discussion of regulatory capital requirements applicable to Interseguro.
83
Table of Contents
The following table presents Interseguro’s solvency ratio for the years ended December 31, 2013 and 2012 in accordance with Peruvian SBS GAAP as required by the Peruvian Banking and Insurance Law.
| At December 31, | ||||||||||||||||
| 2013 | 2012 | Change | ||||||||||||||
| (S/. in millions) | (S/. in millions) | % | ||||||||||||||
Solvency equity (solvency margin)(1) | 177.6 | 140.3 | 37.3 | 26.5 | % | |||||||||||
Guarantee fund(2) | 62.1 | 49.1 | 13.0 | 26.5 | % | |||||||||||
|
|
|
|
|
| |||||||||||
Surplus | 34.5 | 75.7 | 40.3 | |||||||||||||
Solvency Ratio(3) | 14.4 | % | 40.0 | % | ||||||||||||
| (1) | Corresponds to an amount determined by the level of risk and the risk profile assumed by an insurance company in Peru in accordance with SBS regulations. |
| (2) | Equal to 35% of solvency equity. |
| (3) | Solvency ratio for Interseguro is calculated in accordance with SBS guidelines. See “Regulation and Supervision—Insurance Regulation and Supervision—Solvency Requirements and Regulatory Capital”. |
Inteligo Bank
The following table presents Inteligo Bank’s risk-weighted assets and regulatory capital as a percentage of risk-weighted assets as of December 31, 2013 and 2012.
| At December 31, | ||||||||||||||||
| 2013 | 2012 | Change | ||||||||||||||
| (US$ in millions) | (US$ in millions) | % | ||||||||||||||
Total eligible capital | 94.5 | 91.4 | 3.1 | 3.4 | % | |||||||||||
Total risk-weighted assets | 509.2 | 575.0 | (65.8 | ) | (11.4 | )% | ||||||||||
|
|
|
| |||||||||||||
Capital ratio | 18.6 | % | 15.9 | % | ||||||||||||
Banking regulations on capital adequacy in The Bahamas take into account the recommendations of the Basel I Committee. Although its guidelines for the management of capital provide that Inteligo’s regulatory capital must be equal to or greater than 8.0% of the total risk-weighted assets, the Central Bank of The Bahamas is working on implementing Basel III requirements by 2016. Risk-weighted assets are the sum of (i) the total amount of creditrisk-weighted assets and indirect loans; and (ii) 10 times the regulatory capital allocated to cover market risk only if the bank’s market risk position is higher than (a) 5% of the total on- and off-balance sheet assets and (b) US$ 100 million. Currently the regulatory capital allocated to cover operational risk is not considered inrisk-weighted assets. As of December 31, 2013, Inteligo Bank’s ratio of regulatory capital to total risk weighted assets was 18.6%.
In Peru, Inteligo SAB is regulated by the SMV, which is responsible for determining the minimum capital requirement for the companies under its supervision. For 2013, the capital requirement for brokerage houses was S/. 1.8 million; Inteligo SAB had capital exceeding S/. 30.0 million.
84
Table of Contents
Commitments and Contractual Obligations
We enter into various commitments and contractual obligations that may require future cash payments. The following table summarizes our commitments and contractual obligations as of December 31, 2013.
| Less than 1 year | 1-3 years | 3-5 years | More than 5 years | Total | ||||||||||||||||
| (S/. in millions) | ||||||||||||||||||||
Deposits and obligations | 20,943.6 | 716.1 | 382.4 | 25.4 | 22,067.5 | |||||||||||||||
Inter-bank funds | 100.0 | 100.0 | ||||||||||||||||||
Due to banks and correspondents | 678.6 | 1,043.7 | 226.7 | 813.0 | 2,762.1 | |||||||||||||||
Bonds, notes and other obligations | 198.7 | 191.0 | 0.0 | 3,035.3 | 3,425.0 | |||||||||||||||
Due from customers on acceptances | 22.3 | — | — | — | 22.3 | |||||||||||||||
Accounts payable, provisions and other liabilities | 938.0 | — | — | — | 938.0 | |||||||||||||||
|
|
|
|
|
|
|
|
|
| |||||||||||
Total | 22,881.3 | 1,950.8 | 609.1 | 3,873.7 | 29,314.9 | |||||||||||||||
% of Total | 78.0 | % | 6.7 | % | 2.1 | % | 13.2 | % | 100.0 | % | ||||||||||
Capital Expenditures Program
In our banking segment, Interbank has made substantial investments in the past few years in expanding its financial stores, investing in technology and in its mobile platform.
Interbank believes that it has built the foundations to continue to grow and capture the market opportunities. It has a capital expenditure plan to assure the accomplishment of its medium term strategic plan, as it believes that operating efficiency and the proximity to its customers are key competitive advantages. Interbank believes that cost control will be increasingly important in its efforts to maintain high profitability ratios in a changing business environment. To accomplish these goals, Inteligo has invested in information technology and the development of simpler, more manageable, secure and modern business processes and platforms to attain higher productivity.
Interbank also continue to enhance its strategic development capabilities, increase its business scale, develop economies of scale by incorporating new financially related businesses, reinforce the productivity of its financial store network, enhance its remote transactional channels, improve its credit processes, develop a higher level of automation in its internal processes and consolidate its cost control policy and monitoring procedures. Interbank seeks to improve security in transactional services to reduce operational risks, using anti-fraud security software for electronic transfers and other security measures to avoid attacks on Interbank’s network of ATMs.
Interbank’s budget for capital expenditures for the next three years is approximately S/. 450 million, 70% of which is related to information technology expenditures and 30% is associated with expanding the number of financial stores. Among the budgeted expenditures for information technology, a substantial portion corresponds to new and ongoing IT projects intended to improve the quality and responsiveness of internal operating processes and to provide us with business solutions for financial planning and commercial tasks to improve its CRM, cash management platform, information systems, among others, as well as product improvements. Interbank also plans to invest in critical projects involved in our midterm IT plan, information technology, mainly software and hardware, as Interbank believes this is one of the best ways to improve its service quality and operating efficiency, as well as investments in technological equipment, (improvements or renewal) of its ATMs nationwide network and increase of its functionalities to its mobile and web banking applications.
In 2012, Interseguro began to make additional investments in technology to support its rapidly expanding operations. In 2013 it decided to invest in the implementation of an operations system in order to support Interseguro’s planned growth in individual life and retail insurance products, a CRM platform, and business intelligence capabilities, among others. As of December 2013, Interseguro’s has invested approximately S/. 10 million in technology.
85
Table of Contents
Interseguro plans to continue to invest approximately S/. 12.0 million in these medium term projects for the next three years. Aside from its technology investments program and upgrades, Interseguro is also considering minor investments to improve office infrastructure.
In our wealth management segment, Inteligo Bank is in the final stages of implementing a new core system to support its rapidly expanding operations. As of December 31, 2013, Inteligo Bank has invested S/. 15.9 million in the development of the system. This will allow Inteligo Bank to leverage its existing CRM platform and develop even stronger business intelligence capabilities.
Inteligo Bank and Inteligo SAB have no material capital expenditure budget.
Off-Balance Sheet Arrangements
Interbank, Interseguro and Inteligo have various contractual arrangements, such as contingent operations, that are not recognized as liabilities in our audited combined financial statements but are required to be recorded as off-balance sheet items. See note 17 to our audited combined financial statements.
We enter into contingent operations to generate fees from guarantees, stand-by letters of credit, import and export and letters of credit, due from bank acceptances and foreign currency forward obligations.
The following table presents our combined off-balance sheet arrangements as of December 31, 2013 and 2012.
| As of December 31, | ||||||||
| 2013 | 2012 | |||||||
| (S/. in millions) | ||||||||
Contingent credits—Indirect loans | ||||||||
Guarantees and standby letters | 3,789.9 | 3,376.1 | ||||||
Import and export letters of credit | 317.3 | 394.9 | ||||||
|
|
|
| |||||
| 4,107.2 | 3,771.0 | |||||||
|
|
|
| |||||
Derivatives | ||||||||
Held for trading | ||||||||
Forward currency contracts—buy | 2,780.8 | 2,406.8 | ||||||
Forward currency contracts—sell | 3,145.3 | 2,228.9 | ||||||
Foreign currency forward contracts on currencies other thannuevo sol | 532.0 | 262.9 | ||||||
Interest rate swaps | 382.6 | 123.4 | ||||||
Currency swaps | 970.2 | 387.6 | ||||||
Cross currency swap | 164.5 | 127.5 | ||||||
Held as hedges | ||||||||
Cash flow hedges: | ||||||||
Interest rate swaps | 348.0 | 463.1 | ||||||
|
|
|
| |||||
| 8,323.4 | 6,000.2 | |||||||
|
|
|
| |||||
Responsibilities under credit lines agreements | 6,223.0 | 5,655.7 | ||||||
|
|
|
| |||||
Total | 18,653.6 | 15,426.8 | ||||||
|
|
|
| |||||
Guarantees and standby letters, mainly granted to construction, services and energy clients, increased by S/. 413.8 million, or 12.3%, from S/. 3,376.1 million as of December 31, 2012 to S/. 3,789.9 million as of December 31, 2013. However, import and export letters of credit decreased by S/. 77.6 million in the same period as a result of lower international trade activity.
86
Table of Contents
As of December 31, 2013, foreign currency forwards, including purchase and sale agreements, increased by S/. 1,559.4 million from S/. 4,898.6 million as of December 31, 2012 to S/. 6,458.0 million as of December 31, 2013. These agreements were entered into, primarily to satisfy client requirements, mainly banks. We also use derivative financial instruments as hedges. See note 9 (e) to our audited combined financial statements for derivative financial instruments valuation.
Responsibilities under credit line agreements increased by S/. 567.4 million in the year ended December 31, 2013, as a result of higher utilization of credit lines available.
Quantitative and Qualitative Disclosures about Market Risk
For a discussion of quantitative and qualitative market risk, see note 29 to our audited combined financial statements.
87
Table of Contents
SELECTED STATISTICAL INFORMATION
The following tables present certain selected statistical information and ratios for IFS for the periods indicated. The following information is included for analytical purposes and should be read in conjunction with the information included in “Management’s Discussion and Analysis of Results of Operations and Financial Conditions” and our audited combined financial statements and notes thereto included elsewhere in this prospectus. The statistical information and discussion and analysis presented below for the fiscal years ended December 31, 2013 and December 31, 2012 reflect our combined financial position with our subsidiaries, Inteligo, Interbank and Interseguro, as of December 31, 2013 and 2012 and their results of operations for 2013 and 2012.
Average Balance Sheets, Income Earned from Interest-Earning Assets, Interest Paid on Interest-Bearing Liabilities
The tables below set forth, by currency of denomination, average balances for IFS prepared on a combined basis, and, where applicable, interest earned on interest-earning assets and interest paid on interest-bearing liabilities for the years ended December 31, 2013 and 2012. Except as otherwise indicated, average balances, when used, have been classified by currency (nuevos soles or foreign currency (primarily U.S. dollars)), regardless of the domestic or international origin of the relevant balances. In addition, unless otherwise set forth in this prospectus, such average balances are based on quarterly balances. Nominal average interest rates have been calculated by dividing interest earned on assets or paid on liabilities by the corresponding average balances on such assets or liabilities.
| For the year ended December 31, | ||||||||||||||||||||||||
| 2013 | 2012 | |||||||||||||||||||||||
| (S/. in millions, except for percentages) | ||||||||||||||||||||||||
| Average Balance | Interest Earned | Nominal Average Rate | Average Balance | Interest Earned | Nominal Average Rate | |||||||||||||||||||
Interest-earning assets: | ||||||||||||||||||||||||
Cash and due from banks | ||||||||||||||||||||||||
Nuevos soles | 1,794.1 | 43.7 | 2.4 | % | 1,138.1 | 27.3 | 2.4 | % | ||||||||||||||||
Foreign currency | 3,599.5 | 2.6 | 0.1 | % | 2,190.4 | 3.2 | 0.1 | % | ||||||||||||||||
|
|
|
|
|
|
|
| |||||||||||||||||
Total | 5,393.6 | 46.3 | 0.9 | % | 3,328.4 | 30.5 | 0.9 | % | ||||||||||||||||
|
|
|
|
|
|
|
| |||||||||||||||||
Investments available-for-sale and trading securities | ||||||||||||||||||||||||
Nuevos soles | 2,082.7 | 101.7 | 4.9 | % | 2,227.1 | 99.3 | 4.5 | % | ||||||||||||||||
Foreign currency | 3,569.3 | 174.6 | 4.9 | % | 3,537.2 | 173.5 | 4.9 | % | ||||||||||||||||
|
|
|
|
|
|
|
| |||||||||||||||||
Total | 5,652.0 | 276.3 | 4.9 | % | 5,764.2 | 272.7 | 4.7 | % | ||||||||||||||||
|
|
|
|
|
|
|
| |||||||||||||||||
Loans(2) | ||||||||||||||||||||||||
Nuevos soles | 10,178.5 | 1,505.6 | 14.8 | % | 8,206.2 | 1,313.0 | 16.0 | % | ||||||||||||||||
Foreign currency | 8,564.3 | 577.3 | 6.7 | % | 7,403.4 | 512.5 | 6.9 | % | ||||||||||||||||
|
|
|
|
|
|
|
| |||||||||||||||||
Total | 18,742.8 | 2,082.9 | 11.1 | % | 15,609.6 | 1,825.5 | 11.7 | % | ||||||||||||||||
|
|
|
|
|
|
|
| |||||||||||||||||
Total Interest-earning assets: | ||||||||||||||||||||||||
Nuevos soles | 14,055.3 | 1,651.1 | 11.7 | % | 11,571.4 | 1,439.6 | 12.4 | % | ||||||||||||||||
Foreign currency | 15,733.2 | 754.5 | 4.8 | % | 13,130.9 | 689.2 | 5.2 | % | ||||||||||||||||
|
|
|
|
|
|
|
| |||||||||||||||||
Total | 29,788.4 | 2,405.5 | 8.1 | % | 24,702.3 | 2,128.8 | 8.6 | % | ||||||||||||||||
|
|
|
|
|
|
|
| |||||||||||||||||
Taxable interest income | — | 2,062.4 | — | — | 1,823.9 | — | ||||||||||||||||||
Non-taxable interest income | — | 343.1 | — | — | 304.9 | — | ||||||||||||||||||
Interest-bearing liabilities: | ||||||||||||||||||||||||
Deposits and obligations | ||||||||||||||||||||||||
Nuevos soles | 8,788.9 | (223.4 | ) | (2.5 | )% | 6,976.1 | (184.5 | ) | (2.6 | )% | ||||||||||||||
Foreign currency | 6,739.5 | (92.2 | ) | (1.4 | )% | 6,078.1 | (90.7 | ) | (1.5 | )% | ||||||||||||||
|
|
|
|
|
|
|
| |||||||||||||||||
Total | 15,528.4 | (315.6 | ) | (2.0 | )% | 13,054.2 | (275.2 | ) | (2.1 | )% | ||||||||||||||
|
|
|
|
|
|
|
| |||||||||||||||||
88
Table of Contents
| For the year ended December 31, | ||||||||||||||||||||||||
| 2013 | 2012 | |||||||||||||||||||||||
| (S/. in millions, except for percentages) | ||||||||||||||||||||||||
| Average Balance | Interest Earned | Nominal Average Rate | Average Balance | Interest Earned | Nominal Average Rate | |||||||||||||||||||
Due to banks and correspondents(1) | ||||||||||||||||||||||||
Nuevos soles | 1,016.9 | (65.9 | ) | (6.5 | )% | 737.5 | (46.5 | ) | (6.3 | )% | ||||||||||||||
Foreign currency | 2,068.4 | (83.7 | ) | (4.0 | )% | 1,627.7 | (87.9 | ) | (5.4 | )% | ||||||||||||||
|
|
|
|
|
|
|
| |||||||||||||||||
Total | 3,085.2 | (149.6 | ) | (4.8 | )% | 2,365.1 | (134.4 | ) | (5.7 | )% | ||||||||||||||
|
|
|
|
|
|
|
| |||||||||||||||||
Bonds, notes and other obligations | ||||||||||||||||||||||||
Nuevos soles | 418.4 | (23.7 | ) | (5.7 | )% | 347.3 | (17.3 | ) | (5.0 | )% | ||||||||||||||
Foreign currency | 2,910.2 | (168.9 | ) | (5.8 | )% | 2,545.2 | (139.9 | ) | (5.5 | )% | ||||||||||||||
|
|
|
|
|
|
|
| |||||||||||||||||
Total | 3,328.7 | (192.6 | ) | (5.8 | )% | 2,892.5 | (157.1 | ) | (5.4 | )% | ||||||||||||||
|
|
|
|
|
|
|
| |||||||||||||||||
Total Interest-bearing liabilities: | ||||||||||||||||||||||||
Nuevos soles | 10,224.2 | (313.1 | ) | (3.1 | )% | 8,060.9 | (248.3 | ) | (3.1 | )% | ||||||||||||||
Foreign currency | 11,718.1 | (344.7 | ) | (2.9 | )% | 10,250.9 | (318.4 | ) | (3.1 | )% | ||||||||||||||
|
|
|
|
|
|
|
| |||||||||||||||||
Total | 21,942.3 | (657.8 | ) | (3.0 | )% | 18,311.8 | (566.8 | ) | (3.1 | )% | ||||||||||||||
|
|
|
|
|
|
|
| |||||||||||||||||
| (1) | Includes inter-bank funds. |
| (2) | Interest income on loans is suspended when collection of loans becomes doubtful. When loans are overdue more than 90 days, such income is excluded from interest income until collected. Accrued interest income on such loans is provisioned. |
The following tables set forth, by currency of denomination, average balances for our non-interest earning assets and non-interest bearing liabilities and shareholders’ equity for the years ended December 31, 2013 and 2012.
| For the year ended December 31, | ||||||||||||||||||||||||
| 2013 | 2012 | |||||||||||||||||||||||
| (S/. in millions, except for percentages) | ||||||||||||||||||||||||
| Average Balance | Interest Earned | Nominal Average Rate | Average Balance | Interest Earned | Nominal Average Rate | |||||||||||||||||||
Non Interest-earning assets: | ||||||||||||||||||||||||
Cash due from banks | ||||||||||||||||||||||||
Nuevos soles | 769.7 | — | — | 621.8 | — | — | ||||||||||||||||||
Foreign currency | 909.1 | — | — | 673.3 | — | — | ||||||||||||||||||
|
|
|
|
|
|
|
| |||||||||||||||||
Total | 1,678.8 | — | — | 1,295.1 | — | — | ||||||||||||||||||
|
|
|
|
|
|
|
| |||||||||||||||||
Allowance for loan losses | ||||||||||||||||||||||||
Nuevos soles | (521.0 | ) | — | — | (461.4 | ) | — | — | ||||||||||||||||
Foreign currency | (118.1 | ) | — | — | (98.7 | ) | — | — | ||||||||||||||||
|
|
|
|
|
|
|
| |||||||||||||||||
Total | (639.1 | ) | — | — | (560.1 | ) | — | — | ||||||||||||||||
|
|
|
|
|
|
|
| |||||||||||||||||
Investment property | ||||||||||||||||||||||||
Nuevos soles | 662.3 | — | — | 676.4 | — | — | ||||||||||||||||||
Foreign currency | — | — | — | — | — | — | ||||||||||||||||||
|
|
|
|
|
|
|
| |||||||||||||||||
Total | 662.3 | — | — | 676.4 | — | — | ||||||||||||||||||
|
|
|
|
|
|
|
| |||||||||||||||||
Property, furniture and equipment, net | ||||||||||||||||||||||||
Nuevos soles | 564.6 | — | — | 551.3 | — | — | ||||||||||||||||||
Foreign currency | — | — | — | — | — | — | ||||||||||||||||||
|
|
|
|
|
|
|
| |||||||||||||||||
Total | 564.6 | — | — | 551.3 | — | — | ||||||||||||||||||
|
|
|
|
|
|
|
| |||||||||||||||||
89
Table of Contents
| For the year ended December 31, | ||||||||||||||||||||||||
| 2013 | 2012 | |||||||||||||||||||||||
| (S/. in millions, except for percentages) | ||||||||||||||||||||||||
| Average Balance | Interest Earned | Nominal Average Rate | Average Balance | Interest Earned | Nominal Average Rate | |||||||||||||||||||
Accounts receivable and other assets | ||||||||||||||||||||||||
Nuevos soles | 845.9 | — | — | 685.6 | — | — | ||||||||||||||||||
Foreign currency | 261.6 | — | — | 209.6 | — | — | ||||||||||||||||||
|
|
|
|
|
|
|
| |||||||||||||||||
Total | 1,107.5 | — | — | 895.2 | — | — | ||||||||||||||||||
|
|
|
|
|
|
|
| |||||||||||||||||
Due from customers on acceptances | ||||||||||||||||||||||||
Nuevos soles | — | — | — | — | — | — | ||||||||||||||||||
Foreign currency | 70.6 | — | — | 67.1 | — | — | ||||||||||||||||||
|
|
|
|
|
|
|
| |||||||||||||||||
Total | 70.6 | — | — | 67.1 | — | — | ||||||||||||||||||
|
|
|
|
|
|
|
| |||||||||||||||||
Deferred income tax | ||||||||||||||||||||||||
Nuevos soles | 5.2 | — | — | 2.8 | — | — | ||||||||||||||||||
Foreign currency | — | — | — | — | — | — | ||||||||||||||||||
|
|
|
|
|
|
|
| |||||||||||||||||
Total | 5.2 | — | — | 2.8 | — | — | ||||||||||||||||||
|
|
|
|
|
|
|
| |||||||||||||||||
Total Non Interest-earning assets | ||||||||||||||||||||||||
Nuevos soles | 2,326.8 | — | — | 2,076.5 | — | — | ||||||||||||||||||
Foreign currency | 1,123.1 | — | — | 851.3 | — | — | ||||||||||||||||||
|
|
|
|
|
|
|
| |||||||||||||||||
Total | 3,449.9 | — | — | 2,927.8 | — | — | ||||||||||||||||||
|
|
|
|
|
|
|
| |||||||||||||||||
Non Interest-bearing Liabilities: | ||||||||||||||||||||||||
Deposits and obligations | ||||||||||||||||||||||||
Nuevos soles | 1,414.1 | — | — | 1,144.1 | — | — | ||||||||||||||||||
Foreign currency | 2,250.9 | — | — | 1,538.0 | — | — | ||||||||||||||||||
|
|
|
|
|
|
|
| |||||||||||||||||
Total | 3,664.9 | — | — | 2,682.1 | — | — | ||||||||||||||||||
|
|
|
|
|
|
|
| |||||||||||||||||
Due from customers on acceptances | ||||||||||||||||||||||||
Nuevos soles | — | — | — | — | — | — | ||||||||||||||||||
Foreign currency | 70.6 | — | — | 67.1 | — | — | ||||||||||||||||||
|
|
|
|
|
|
|
| |||||||||||||||||
Total | 70.6 | — | — | 67.1 | — | — | ||||||||||||||||||
|
|
|
|
|
|
|
| |||||||||||||||||
Insurance contract liabilities | ||||||||||||||||||||||||
Nuevos soles | 1,235.6 | — | — | 891.6 | — | — | ||||||||||||||||||
Foreign currency | 1,670.7 | — | — | 1,667.6 | — | — | ||||||||||||||||||
|
|
|
|
|
|
|
| |||||||||||||||||
Total | 2,906.2 | — | — | 2,559.2 | — | — | ||||||||||||||||||
|
|
|
|
|
|
|
| |||||||||||||||||
Accounts payable, provisions and other liabilities | ||||||||||||||||||||||||
Nuevos soles | 696.0 | — | — | 591.1 | — | — | ||||||||||||||||||
Foreign currency | 299.1 | — | — | 250.6 | — | — | ||||||||||||||||||
|
|
|
|
|
|
|
| |||||||||||||||||
Total | 995.1 | — | — | 841.7 | — | — | ||||||||||||||||||
|
|
|
|
|
|
|
| |||||||||||||||||
Deferred income tax liability, net | ||||||||||||||||||||||||
Nuevos soles | 29.8 | — | — | 21.5 | — | — | ||||||||||||||||||
Foreign currency | — | — | — | — | — | — | ||||||||||||||||||
|
|
|
|
|
|
|
| |||||||||||||||||
Total | 29.8 | — | — | 21.5 | — | — | ||||||||||||||||||
|
|
|
|
|
|
|
| |||||||||||||||||
Total Non Interest-Bearing Liabilities | ||||||||||||||||||||||||
Nuevos soles | 3,375.4 | — | — | 2,648.3 | — | — | ||||||||||||||||||
Foreign currency | 4,291.2 | — | — | 3,523.3 | — | — | ||||||||||||||||||
|
|
|
|
|
|
|
| |||||||||||||||||
Total | 7,666.7 | ��� | — | 6,171.6 | — | — | ||||||||||||||||||
|
|
|
|
|
|
|
| |||||||||||||||||
90
Table of Contents
Return on Equity and Assets
The following table sets forth our return on average total assets and average shareholders’ equity and related information for the periods indicated.
| For the Year Ended December 31, | ||||||||
| 2013 | 2012 | |||||||
Return on average total assets | 2.9 | % | 2.8 | % | ||||
Return on average shareholders’ equity | 26.9 | % | 24.3 | % | ||||
Equity to assets ratio(1) | 10.9 | % | 11.4 | % | ||||
Dividend payout ratio(2) | 44.6 | % | 59.3 | % | ||||
| (1) | Average shareholders’ equity as a percentage of annual average assets. |
| (2) | Dividends divided by net profit. |
Changes in Net Interest and Similar Income and Net Interest and Similar Expense: Volume and Rate Analysis
The following tables set forth, by currency of denomination, changes in our interest revenue and expenses between changes in the average volume of interest-earning assets and interest-bearing liabilities and changes in their respective nominal interest rates from 2012 to 2013. Volume and rate variances have been calculated based on movements in average quarterly balances and changes in nominal interest rates, average interest-earning assets and average interest-bearing liabilities. The net change attributable to changes in both volume and rate has been allocated proportionately to the change due to volume and the change due to rate.
| 2013 / 2012 | ||||||||||||
| Increase (Decrease) Due to Changes in | ||||||||||||
| Rate | Volume | Net Change | ||||||||||
| (S/. in millions) | ||||||||||||
Interest-earning assets | ||||||||||||
Cash and due from banks(1) | ||||||||||||
Nuevos soles | 0.4 | 16.0 | 16.4 | |||||||||
Foreign currency | (1.7 | ) | 1.0 | (0.7 | ) | |||||||
Total | (1.2 | ) | 17.0 | 15.8 | ||||||||
Investment available-for-sale and trading securities | ||||||||||||
Nuevos soles | 9.5 | (7.1 | ) | 2.5 | ||||||||
Foreign currency | (0.4 | ) | 1.6 | 1.1 | ||||||||
Total | 9.1 | (5.5 | ) | 3.6 | ||||||||
Loans | ||||||||||||
Nuevos soles | (99.2 | ) | 291.7 | 192.6 | ||||||||
Foreign currency | (13.5 | ) | 78.3 | 64.8 | ||||||||
Total | (112.6 | ) | 370.0 | 257.4 | ||||||||
Total interest-earning assets: | ||||||||||||
Nuevos soles | (89.2 | ) | 300.7 | 211.5 | ||||||||
Foreign currency | (15.5 | ) | 80.8 | 65.3 | ||||||||
Total | (104.7 | ) | 381.5 | 276.8 | ||||||||
91
Table of Contents
| 2013 / 2012 | ||||||||||||
| Increase (Decrease) Due to Changes in | ||||||||||||
| Rate | Volume | Net Change | ||||||||||
| (S/. in millions) | ||||||||||||
Interest-bearing liabilities | ||||||||||||
Deposits and obligations | ||||||||||||
Nuevos soles | 7.2 | (46.1 | ) | (38.9 | ) | |||||||
Foreign currency | 7.5 | (9.0 | ) | (1.5 | ) | |||||||
Total | 14.7 | (55.1 | ) | (40.4 | ) | |||||||
Due to banks and correspondents(1) | ||||||||||||
Nuevos soles | (1.3 | ) | (18.1 | ) | (19.4 | ) | ||||||
Foreign currency | 22.0 | (17.8 | ) | 4.2 | ||||||||
Total | 20.8 | (35.9 | ) | (15.2 | ) | |||||||
Bonds, notes and other obligations | ||||||||||||
Nuevos soles | (2.4 | ) | (4.0 | ) | (6.5 | ) | ||||||
Foreign currency | (7.8 | ) | (21.2 | ) | (29.0 | ) | ||||||
Total | (10.2 | ) | (25.2 | ) | (35.5 | ) | ||||||
Total interest-bearing liabilities: | ||||||||||||
Nuevos soles | 3.5 | (68.2 | ) | (64.7 | ) | |||||||
Foreign currency | 21.8 | (48.1 | ) | (26.3 | ) | |||||||
Total | 25.2 | (116.3 | ) | (91.0 | ) | |||||||
| (1) | Includes inter-bank funds. |
Interest-Earning Assets: Net Interest Margin and Yield Spread
The following table sets forth for each of the periods indicated, by currency of denomination, our levels of average interest-earning assets, net interest income, gross yield, net interest margin and yield spread, all on a nominal basis.
| For the Year Ended December 31, | ||||||||
| 2013 | 2012 | |||||||
| (S/. in millions, except for percentages) | ||||||||
Average interest-earning assets | ||||||||
Nuevos soles | 14,055.3 | 11,571.4 | ||||||
Foreign currency | 15,733.2 | 13,130.9 | ||||||
|
|
|
| |||||
Total | 29,788.4 | 24,702.3 | ||||||
|
|
|
| |||||
Net interest income(1) | ||||||||
Nuevos soles | 1,338.0 | 1,191.3 | ||||||
Foreign currency | 409.7 | 370.7 | ||||||
|
|
|
| |||||
Total | 1,747.7 | 1,562.0 | ||||||
|
|
|
| |||||
Gross yield(2) | ||||||||
Nuevos soles | 11.7 | % | 12.4 | % | ||||
Foreign currency | 4.8 | % | 5.2 | % | ||||
|
|
|
| |||||
Total | 8.1 | % | 8.6 | % | ||||
|
|
|
| |||||
Net interest margin(3) | ||||||||
Nuevos soles | 9.5 | % | 10.3 | % | ||||
Foreign currency | 2.6 | % | 2.8 | % | ||||
|
|
|
| |||||
Total | 5.9 | % | 6.3 | % | ||||
|
|
|
| |||||
Yield spread(4) | ||||||||
Nuevos soles | 8.7 | % | 9.4 | % | ||||
Foreign currency | 1.9 | % | 2.1 | % | ||||
92
Table of Contents
| (1) | Net interest and similar income is defined as interest and similar income less interest and similar expense. |
| (2) | Gross Yield is defined as interest and similar income divided by average interest-earning assets. |
| (3) | Net interest margin is defined as net interest and similar income divided by average interest-earning assets. |
| (4) | Yield spread, on a nominal basis, represents the difference between gross yield on average interest-earning assets and average cost of interest-bearing liabilities. |
Investment Portfolio
The following table sets forth our trading securities and investments available-for-sale by type on the dates indicated. For more information on our trading and investments available-for-sale, see note 5 to our audited combined financial statements appearing elsewhere in this prospectus.
| As of December 31, | As of January 1, | |||||||||||||||||||||||
| 2013 | 2012 | 2012 | ||||||||||||||||||||||
| S/. in millions | % | S/. in millions | % | S/. in millions | % | |||||||||||||||||||
Equity securities | 550.0 | 9.9 | % | 916.3 | 17.2 | % | 659.2 | 12.3 | % | |||||||||||||||
Bonds | 3,074.3 | 54.7 | % | 3,026.1 | 56.7 | % | 2,905.5 | 54.4 | % | |||||||||||||||
Investment in Peruvian sovereign and global bonds | 829.1 | 14.7 | % | 410.9 | 7.7 | % | 419.3 | 7.9 | % | |||||||||||||||
Negotiable bank certificates issued by the Central Reserve Bank of Peru | 772.0 | 13.7 | % | 629.0 | 11.8 | % | 1,499.2 | 28.1 | % | |||||||||||||||
Mutual funds and investment participations | 393.9 | 7.0 | % | 356.3 | 6.7 | % | 377.8 | 7.1 | % | |||||||||||||||
|
|
|
|
|
|
|
|
|
|
|
| |||||||||||||
Total | 5,624.3 | 100.0 | % | 5,338.6 | 100.0 | % | 5,861.1 | 100 | % | |||||||||||||||
|
|
|
|
|
| |||||||||||||||||||
Less: Provision for impairment | — | — | ||||||||||||||||||||||
Plus: Accrued interest | 53.3 | 33.6 | 37.1 | |||||||||||||||||||||
|
|
|
|
|
| |||||||||||||||||||
Total investments, net | 5,677.7 | 5,372.2 | 5,898.2 | |||||||||||||||||||||
|
|
|
|
|
| |||||||||||||||||||
93
Table of Contents
The following table sets forth the maturities of our trading securities and investments available-for-sale by type as of December 31, 2013, before accrued interest.
| As of December 31, 2013 | ||||||||||||||||||||||||||||||||||||||||||||||||||||||||||||
| 1 month | Average Yield | 1-3 months | Average Yield | 3 months- 1 year | Average Yield | 1-5 years | Average Yield | 5-10 years | Average Yield | Over 10 years | Average Yield | No maturity | Average Yield | Total | ||||||||||||||||||||||||||||||||||||||||||||||
| (S/. In millions except for percentages) | ||||||||||||||||||||||||||||||||||||||||||||||||||||||||||||
Trading Securities | ||||||||||||||||||||||||||||||||||||||||||||||||||||||||||||
Equity securities | — | — | — | — | — | — | — | — | — | — | — | — | 44.4 | — | 44.4 | |||||||||||||||||||||||||||||||||||||||||||||
Bonds | — | — | — | — | — | — | — | — | — | — | — | — | 65.7 | 6.3 | % | 65.7 | ||||||||||||||||||||||||||||||||||||||||||||
Peruvian sovereign and global Bonds | — | — | — | — | — | — | — | — | — | — | — | — | 14.9 | 6.4 | % | 14.9 | ||||||||||||||||||||||||||||||||||||||||||||
|
|
|
|
|
|
|
|
|
|
|
|
|
|
|
|
|
|
|
|
|
|
|
|
|
|
|
|
|
| |||||||||||||||||||||||||||||||
Total Trading Securities | — | — | — | — | — | — | 125.0 | 125.0 | ||||||||||||||||||||||||||||||||||||||||||||||||||||
|
|
|
|
|
|
|
|
|
|
|
|
|
|
|
|
|
|
|
|
|
|
|
|
|
|
|
|
|
| |||||||||||||||||||||||||||||||
Available for sale investments: | ||||||||||||||||||||||||||||||||||||||||||||||||||||||||||||
Equity securities | — | — | — | — | — | — | — | — | — | — | — | — | 510.6 | — | 510.6 | |||||||||||||||||||||||||||||||||||||||||||||
Bonds | 25.4 | 5.10 | % | 21.7 | 3.80 | % | 124.2 | 5.10 | % | 156.2 | 4.70 | % | 784.3 | 5.60 | % | 1,896.9 | 6.80 | % | — | 3,008.6 | ||||||||||||||||||||||||||||||||||||||||
Peruvian sovereign and global Bonds | — | — | 0.1 | 0.00 | % | 1.0 | 0.00 | % | 1.0 | 2.10 | % | 311.7 | 5.30 | % | 500.3 | 6.10 | % | — | — | 814.1 | ||||||||||||||||||||||||||||||||||||||||
Negotiable bank certificates issued by the Central Reserve Bank of Peru | 67.0 | 2.10 | % | 108.0 | 0.70 | % | 597.1 | 3.60 | % | — | — | — | — | — | — | 772.0 | ||||||||||||||||||||||||||||||||||||||||||||
Mutual funds and investments participations | — | — | — | — | — | — | — | — | — | — | — | 393.9 | 393.9 | |||||||||||||||||||||||||||||||||||||||||||||||
|
|
|
|
|
|
|
|
|
|
|
|
|
|
|
| |||||||||||||||||||||||||||||||||||||||||||||
Total available for sale investments | 92.4 | 129.8 | 722.3 | 157.2 | 1,096.0 | 2,397.2 | 904.5 | 5,499.3 | ||||||||||||||||||||||||||||||||||||||||||||||||||||
|
|
|
|
|
|
|
|
|
|
|
|
|
|
|
| |||||||||||||||||||||||||||||||||||||||||||||
Total trading securities and available for sale investments | 92.4 | 129.8 | 722.3 | 157.2 | 1,096.0 | 2,397.2 | 1,029.5 | 5,624.3 | ||||||||||||||||||||||||||||||||||||||||||||||||||||
% | 1.6 | % | 2.3 | % | 12.8 | % | 2.8 | % | 19.5 | % | 42.6 | % | 18.3 | % | 100.0 | % | ||||||||||||||||||||||||||||||||||||||||||||
94
Table of Contents
Loan Portfolio
The following table sets forth our loans by type of loan, at the dates indicated.
| As of December 31, | As of January 1, | |||||||||||||||||||||||
| 2013 | 2012 | 2012 | ||||||||||||||||||||||
S/. in millions | % | S/. in millions | % | S/. in millions | % | |||||||||||||||||||
Loan Portfolio | ||||||||||||||||||||||||
Loans | 14,869.5 | 71.0 | % | 11,377.8 | 68.8 | % | 9,897.7 | 66.7 | % | |||||||||||||||
Credit cards receivables | 2,547.6 | 12.2 | % | 2,117.2 | 12.8 | % | 2,179.6 | 14.7 | % | |||||||||||||||
Leasing receivables | 2,217.7 | 10.6 | % | 2,018.4 | 12.2 | % | 1,783.3 | 12.0 | % | |||||||||||||||
Discounted notes | 457.1 | 2.2 | % | 433.4 | 2.6 | % | 318.5 | 2.1 | % | |||||||||||||||
Factoring receivables | 256.6 | 1.2 | % | 175.2 | 1.1 | % | 249.8 | 1.7 | % | |||||||||||||||
Advances and overdrafts | 128.1 | 0.6 | % | 14.4 | 0.1 | % | 109.5 | 0.7 | % | |||||||||||||||
Refinanced loans | 123.9 | 0.6 | % | 108.3 | 0.7 | % | 87.1 | 0.6 | % | |||||||||||||||
Past-due and under legal collection | 346.6 | 1.7 | % | 291.2 | 1.8 | % | 216.4 | 1.5 | % | |||||||||||||||
|
|
|
|
|
|
|
|
|
| |||||||||||||||
Total gross loans | 20,947.2 | 100.0 | % | 16,535.9 | 100.0 | % | 14,842.0 | 100 | % | |||||||||||||||
|
|
|
|
|
| |||||||||||||||||||
Add: | ||||||||||||||||||||||||
Accrued interest | 228.5 | 186.6 | 171.7 | |||||||||||||||||||||
Less: | ||||||||||||||||||||||||
Allowance for loan losses | (694.4 | ) | (588.6 | ) | (500.4 | ) | ||||||||||||||||||
Deferred interest | (14.1 | ) | (11.5 | ) | (11.5 | ) | ||||||||||||||||||
Total loans, net | 20,467.2 | 16,122.4 | 14,501.8 | |||||||||||||||||||||
|
|
|
|
|
| |||||||||||||||||||
Loans by Economic Activity
The following table sets forth the composition of our loan portfolio at the dates indicated based on the borrower’s principal economic activity.
| As of December 31, | As of January 1, | |||||||||||||||||||||||
| 2013 | 2012 | 2012 | ||||||||||||||||||||||
S/. in millions | % | S/. in millions | % | S/. in millions | % | |||||||||||||||||||
Loan by economic activity | ||||||||||||||||||||||||
Retail loans | 10,053.1 | 48.0 | % | 8,407.0 | 50.8 | % | 7,335.8 | 49.4 | % | |||||||||||||||
Manufacturing | 2,494.1 | 11.9 | % | 1,934.5 | 11.7 | % | 1,964.8 | 13.2 | % | |||||||||||||||
Commerce | 2,162.6 | 10.3 | % | 1,829.7 | 11.1 | % | 1,476.2 | 9.9 | % | |||||||||||||||
Lease and real estate activities | 1,564.2 | 7.5 | % | 956.7 | 5.8 | % | 866.6 | 5.8 | % | |||||||||||||||
Agriculture | 931.6 | 4.4 | % | 606.2 | 3.7 | % | 614.3 | 4.1 | % | |||||||||||||||
Financial services | 907.7 | 4.3 | % | 670.8 | 4.1 | % | 725.7 | 4.9 | % | |||||||||||||||
Communication, storage and transportation | 812.0 | 3.9 | % | 524.1 | 3.2 | % | 413.8 | 2.8 | % | |||||||||||||||
Construction | 636.1 | 3.0 | % | 470.9 | 2.8 | % | 333.4 | 2.2 | % | |||||||||||||||
Electricity, gas and water | 431.4 | 2.1 | % | 290.4 | 1.8 | % | 221.8 | 1.5 | % | |||||||||||||||
Mining | 382.7 | 1.8 | % | 372.7 | 2.3 | % | 355.7 | 2.4 | % | |||||||||||||||
Fishing | 114.3 | 0.5 | % | 105.8 | 0.6 | % | 167.8 | 1.1 | % | |||||||||||||||
Education, health and other | 98.2 | 0.5 | % | 59.7 | 0.4 | % | — | — | ||||||||||||||||
Others | 359.2 | 1.7 | % | 307.4 | 1.9 | % | 366.0 | 2.5 | % | |||||||||||||||
|
|
|
|
|
|
|
|
|
|
|
| |||||||||||||
Total gross loans | 20,947.2 | 100.0 | % | 16,535.9 | 100.0 | % | 14,842.0 | 100.0 | % | |||||||||||||||
|
|
|
|
|
| |||||||||||||||||||
95
Table of Contents
Loans by Business Lines
The following table shows the composition of our loan portfolio divided by our lines of business.
| As of December 31, | As of January 1, | |||||||||||||||||||||||
| 2013 | 2012 | 2012 | ||||||||||||||||||||||
S/. in millions | % | S/. in millions | % | S/. in millions | % | |||||||||||||||||||
Commercial loans | 10,688.5 | 51.0 | % | 7,804.1 | 47.2 | % | 7,074.5 | 47.7 | % | |||||||||||||||
Consumer loans | 5,960.1 | 28.5 | % | 5,212.5 | 31.5 | % | 4,928.3 | 33.2 | % | |||||||||||||||
Mortgage loans | 3,745.4 | 17.9 | % | 2,988.3 | 18.1 | % | 2,333.1 | 15.7 | % | |||||||||||||||
Micro-business loans | 553.2 | 2.6 | % | 531.0 | 3.2 | % | 506.1 | 3.4 | % | |||||||||||||||
|
|
|
|
|
|
|
|
|
|
|
| |||||||||||||
Total gross loans(1) | 20,947.2 | 100.0 | % | 16,535.9 | 100.0 | % | 14,842.0 | 100.0 | % | |||||||||||||||
|
|
|
|
|
| |||||||||||||||||||
| (1) | Total gross loans consists of total loans outstanding, including past-due loans and refinanced loans, for S/. 470.5, S/. 399.4 and S/. 303.5 as of December 31, 2013 and 2012 and as of January 1, 2012, respectively. |
Commercial loans: Generally, short-term and long-term loans granted innuevos soles and U.S. dollars to companies on an adjustable or fixed rate basis in order to finance the production and sale of goods and services / working capital or investments.
Consumer loans: Generally, short-term and long-term loans granted innuevos soles and U.S. dollars to individuals in order to finance the purchase of goods or services not related to commercial activities.
Mortgage loans: Mortgage loans are adjustable or fixed rate, long-term loans granted innuevos soles and U.S. dollars to individuals in order to finance (1) the purchase, development and construction of an individual’s home or the (2) remodeling, improvement or sub-division of an individual’s existing home, in each case secured by a real property mortgage.
Micro-business loans: Micro-business loans are those loans extended to finance the production and sale of goods and services of companies or individuals which, during the last six months, had outstanding loans due to local financial institutions (other than residential mortgage loans) of less than S/. 20,000.
Refinanced loans: Refinanced loans are loans with amendments to their respective payment schedules as a result of payment delays by the relevant borrowers as defined by SBS regulations.
Past-due loans: Past-due loans correspond to overdue loans, defined as commercial loans for which amortization payments are 15 days overdue and loans to microbusinesses for which amortization payments are 30 days overdue. In the case of consumer, mortgage and leasing loans, the amortization portion of a coupon is considered past-due once 30 days overdue and the total amount of the loan is considered past-due once an amortization payment is 90 days overdue.
Loans by Currency
The following table presents our loan portfolio divided by currency at the dates indicated.
| As of December 31, | As of January 1, | |||||||||||||||||||||||
| 2013 | 2012 | 2012 | ||||||||||||||||||||||
S/. in millions | % | S/. in millions | % | S/. in millions | % | |||||||||||||||||||
Foreign currency denominated | 9,070.8 | 43.3 | % | 7,784.4 | 47.1 | % | 7,216.3 | 48.6 | % | |||||||||||||||
Nuevo sol denominated | 11,876.4 | 56.7 | % | 8,751.5 | 52.9 | % | 7,625.7 | 51.4 | % | |||||||||||||||
|
|
|
|
|
|
|
|
|
|
|
| |||||||||||||
Total gross loans | 20,947.2 | 100.0 | % | 16,535.9 | 100.0 | % | 14,842.0 | 100.0 | % | |||||||||||||||
|
|
|
|
|
| |||||||||||||||||||
96
Table of Contents
Maturity Composition of our Portfolio of Loans
The following table sets forth an analysis of our portfolio of loans as of December 31, 2013, by type and by the time remaining to maturity. Loan amounts are presented before deduction of allowances for loan losses.
| As of December 31, 2013 | ||||||||||||||||||||||||||||
| 1 month | 1-3 months | 3 months – 1 year | 1 – 5 years | More than 5 years. | Past-due loans | Total | ||||||||||||||||||||||
Loans | 959.0 | 1,784.0 | 3,514.8 | 5,181.8 | 3,429.9 | 346.6 | 15,216.1 | |||||||||||||||||||||
Credit cards receivables | 308.4 | 356.2 | 957.6 | 925.3 | — | 2,547.6 | ||||||||||||||||||||||
Leasing receivables | 129.0 | 135.0 | 707.1 | 1,167.6 | 79.0 | 2,217.7 | ||||||||||||||||||||||
Discounted notes | 209.5 | 205.7 | 40.2 | 1.7 | — | 457.1 | ||||||||||||||||||||||
Factoring receivables | 111.1 | 100.5 | 45.1 | — | — | 256.6 | ||||||||||||||||||||||
Advances and overdrafts | 128.1 | — | — | — | 128.1 | |||||||||||||||||||||||
Refinanced loans | 3.0 | 5.4 | 30.4 | 68.5 | 16.6 | 123.9 | ||||||||||||||||||||||
|
|
|
|
|
|
|
|
|
|
|
|
|
| |||||||||||||||
Total gross loans | 1,848.1 | 2,586.8 | 5,295.2 | 7,345.0 | 3,525.4 | 346.6 | 20,947.2 | |||||||||||||||||||||
|
|
|
|
|
|
|
|
|
|
|
|
|
| |||||||||||||||
| (1) | Includes past-due loans over 90 days and less than 90 days in the amount S/. 313.5 and S/. 33.1, respectively. |
Classification of our Loan Portfolio
We classify our loan portfolio into one of five risk categories. See “Management’s Discussion and Analysis of Results of Operations and Financial Condition—Risk Management” and note 29.1(d) to our audited combined financial statements for a discussion of our loan portfolio classification policies. The following table provides statistical data regarding the classification of our loans as of the end of the periods indicated.
| As of December 31, | As of January 1, | |||||||||||||||||||||||
| 2013 | 2012 | 2012 | ||||||||||||||||||||||
S/. in millions | % | S/. in millions | % | S/. in millions | % | |||||||||||||||||||
A: Normal | 23,670.1 | 94.5 | % | 19,021.5 | 93.7 | % | 17,352.6 | 93.6 | % | |||||||||||||||
B: With potential problems | 539.4 | 2.2 | % | 526.5 | 2.6 | % | 530.1 | 2.9 | % | |||||||||||||||
C: Substandard | 220.0 | 0.9 | % | 200.0 | 1.0 | % | 192.3 | 1.0 | % | |||||||||||||||
D: Doubtful | 342.4 | 1.4 | % | 321.8 | 1.6 | % | 274.1 | 1.5 | % | |||||||||||||||
E: Loss | 282.5 | 1.1 | % | 237.1 | 1.2 | % | 192.2 | 1.0 | % | |||||||||||||||
Total | 25,054.4 | 100.0 | % | 20,306.9 | 100.0 | % | 18,541.3 | 100.0 | % | |||||||||||||||
Direct loan portfolio before allowance for loan losses | 20,947.2 | 83.6 | % | 16,535.9 | 81.4 | % | 14,842.0 | 80.0 | % | |||||||||||||||
Indirect loan portfolio before allowance for loan losses | 4,107.2 | 16.4 | % | 3,771.0 | 18.6 | % | 3,699.3 | 20.0 | % | |||||||||||||||
Total | 25,054.4 | 100.0 | % | 20,306.9 | 100.0 | % | 18,541.3 | 100.0 | % | |||||||||||||||
|
|
|
|
|
| |||||||||||||||||||
Allowance for Loan Losses
Our allowance for loan losses is recorded in accordance with IAS 39. See “Management’s Discussion and Analysis of Results of Operations and Financial Condition—Critical Accounting Policies—Provision for Loan Losses” for a description of the guidelines and procedures used in the review of our loan portfolio and the calculation of our allowances for loan losses. See note 29.1(d) to our audited combined financial statements.
97
Table of Contents
The following table shows the allocation of our allowance for loan losses for each type of loan at the dates indicated.
| As of December 31, | As of January 1, | |||||||||||||||||||||||
| 2013 | 2012 | 2012 | ||||||||||||||||||||||
| S/. in millions | % | S/. in millions | % | S/. in millions | % | |||||||||||||||||||
Commercial loans | 112.8 | 15.9 | % | 90.5 | 15.0 | % | 89.6 | 17.5 | % | |||||||||||||||
Consumer loans | 510.9 | 72.2 | % | 449.2 | 74.7 | % | 369.3 | 72.1 | % | |||||||||||||||
Mortgage loans | 24.1 | 3.4 | % | 14.8 | 2.5 | % | 9.6 | 1.9 | % | |||||||||||||||
Micro-business loans | 59.7 | 8.4 | % | 47.2 | 7.8 | % | 43.8 | 8.6 | % | |||||||||||||||
|
|
|
|
|
|
|
|
|
|
|
| |||||||||||||
Total allowance for loan losses(1) | 707.5 | 100.0 | % | 601.7 | 100.0 | % | 512.2 | 100.0 | % | |||||||||||||||
|
|
|
|
|
| |||||||||||||||||||
| (1) | Includes allowance for indirect loans amounting to S/. 13.1 million, S/. 13.1 million and S/. 11.9 million as of December 31, 2013, 2012 and as of January 1, 2012. See note 9(a) to our audited combined financial statements. |
The following table shows the changes in our allowance for loan losses as of December 31, 2013 and 2012.
| As of December 31 | ||||||||
| 2013 | 2012 | |||||||
S/. in millions | S/. in millions | |||||||
Beginning balances | 601.7 | 512.2 | ||||||
Provision | 377.2 | 401.0 | ||||||
Recoveries of write-offs | 96.2 | 80.3 | ||||||
Loan portfolio written off | (382.9 | ) | (382.7 | ) | ||||
Translation result | 15.3 | (9.0 | ) | |||||
|
|
|
| |||||
Ending balances | 707.5 | 601.7 | ||||||
|
|
|
| |||||
Allowances for contingent loans | 13.1 | 13.1 | ||||||
Allowances for direct loans | 694.4 | 588.6 | ||||||
|
|
|
| |||||
Total allowances for loan losses | 707.5 | 601.7 | ||||||
|
|
|
| |||||
The following table shows the changes in our allowance for loan losses (direct and indirect) by line of business for the years ended December 31, 2013 and 2012.
| For the Year Ended December 31, 2013 | ||||||||||||||||||||
| Commercial loans | Mortgage loans | Consumer loans | Micro- business loans | Total | ||||||||||||||||
| (S/. in millions) | ||||||||||||||||||||
Beginning balances | 90.5 | 14.8 | 449.2 | 47.2 | 601.7 | |||||||||||||||
Provision | 20.6 | 6.3 | 325.3 | 25.0 | 377.2 | |||||||||||||||
Recovery of written-off loans | 0.4 | 0.2 | 92.1 | 3.5 | 96.2 | |||||||||||||||
Loan portfolio written-off | (7.1 | ) | (0.1 | ) | (357.8 | ) | (17.9 | ) | (382.9 | ) | ||||||||||
Translation result | 8.5 | 2.9 | 2.0 | 1.9 | 15.3 | |||||||||||||||
|
|
|
|
|
|
|
|
|
| |||||||||||
Ending balances(1) | 112.8 | 24.1 | 510.9 | 59.7 | 707.5 | |||||||||||||||
|
|
|
|
|
| |||||||||||||||
| (1) | The allowance for loan losses includes the allowance for indirect loans totaling S/. 13.1 million, which is presented in “Accounts payable, provisions and other liabilities” in our combined statement of financial position. See note 9(a) to our audited combined financial statements. |
98
Table of Contents
| For the Year Ended December 31, 2012 | ||||||||||||||||||||
| Commercial loans | Mortgage loans | Consumer loans | Micro- business loans | Total | ||||||||||||||||
| (S/. in millions) | ||||||||||||||||||||
Beginning balances | 89.6 | 9.6 | 369.2 | 43.8 | 512.2 | |||||||||||||||
Provision | 7.2 | 7.1 | 368.8 | 17.7 | 400.8 | |||||||||||||||
Recovery of written-off loans | 1.2 | 0.1 | 76.0 | 3.0 | 80.3 | |||||||||||||||
Loan portfolio written-off | (1.3 | ) | (0.4 | ) | (363.8 | ) | (17.2 | ) | (382.7 | ) | ||||||||||
Translation result | (6.1 | ) | (1.6 | ) | (1.0 | ) | (0.2 | ) | (8.9 | ) | ||||||||||
|
|
|
|
|
|
|
|
|
| |||||||||||
Ending balances | 90.5 | 14.8 | 449.2 | 47.2 | 601.7 | |||||||||||||||
|
|
|
|
|
| |||||||||||||||
| (1) | The allowance for loan losses includes the allowance for indirect loans totaling S/. 13.1 , which is presented in “Accounts payable, provisions and other liabilities” in our combined statement of financial position. See note 9(a) to our audited combined financial statements. |
Composition of Deposits and Other Commitments
The following table sets forth the composition of our deposits and similar commitments at the dates indicated:
| As of December 31, | As of January 1, | |||||||||||||||||||||||
| 2013 | 2012 | 2012 | ||||||||||||||||||||||
| S/. in millions | % | S/. in millions | % | S/. in millions | % | |||||||||||||||||||
Demand deposits | ||||||||||||||||||||||||
Nuevos soles | 2,264.4 | 10.3 | % | 2,244.5 | 13.6 | % | 1,603.2 | 11.0 | % | |||||||||||||||
Foreign currency | 4,652.7 | 21.1 | % | 2,223.5 | 13.4 | % | 2,350.4 | 16.1 | % | |||||||||||||||
|
|
|
|
|
|
|
|
|
|
|
| |||||||||||||
Total | 6,917.0 | 31.3 | % | 4,468.1 | 27.0 | % | 3,953.6 | 27.1 | % | |||||||||||||||
|
|
|
|
|
| |||||||||||||||||||
Savings deposits | ||||||||||||||||||||||||
Nuevos soles | 3,055.7 | 13.8 | % | 2,453.4 | 14.8 | % | 2,153.0 | 14.7 | % | |||||||||||||||
Foreign currency | 2,315.2 | 10.5 | % | 1,918.0 | 14.0 | % | 1,991.8 | 13.6 | % | |||||||||||||||
|
|
|
|
|
|
|
|
|
|
|
| |||||||||||||
Total | 5,370.9 | 24.3 | % | 4,371.4 | 28.8 | % | 4,144.8 | 28.4 | % | |||||||||||||||
|
|
|
|
|
| |||||||||||||||||||
Time deposits | ||||||||||||||||||||||||
Nuevos soles | 5,571.2 | 25.2 | % | 4,079.9 | 24.7 | % | 3,609.0 | 24.7 | % | |||||||||||||||
Foreign currency | 4,202.3 | 19.0 | % | 3,213.2 | 19.4 | % | 2,883.5 | 19.8 | % | |||||||||||||||
|
|
|
|
|
|
|
|
|
|
|
| |||||||||||||
Total | 9,773.5 | 44.3 | % | 7,293.1 | 44.1 | % | 6,492.5 | 44.5 | % | |||||||||||||||
|
|
|
|
|
| |||||||||||||||||||
Others | ||||||||||||||||||||||||
Nuevos soles | 6.0 | 0.0 | % | 6.0 | 0.0 | % | 8.4 | 0.1 | % | |||||||||||||||
Foreign currency | 0.1 | 0.0 | % | 0.0 | 0.0 | % | 0.0 | 0.0 | % | |||||||||||||||
|
|
|
|
|
|
|
|
|
|
|
| |||||||||||||
Total | 6.0 | 0.0 | % | 6.1 | 0.0 | % | 8.5 | 0.1 | % | |||||||||||||||
|
|
|
|
|
| |||||||||||||||||||
Total deposits | ||||||||||||||||||||||||
Nuevos soles | 10,897.2 | 49.4 | % | 8,783.8 | 53.1 | % | 7,373.5 |
|
50.5 |
% | ||||||||||||||
Foreign currency | 11,170.3 | 50.6 | % | 7,354.8 | 46.9 | % | 7,225.8 | 49.5 | % | |||||||||||||||
|
|
|
|
|
|
|
|
|
|
|
| |||||||||||||
Total | 22,067.5 | 100.0 | % | 16,138.6 | 100.0 | % | 14,599.3 | 100.0 | % | |||||||||||||||
|
|
|
|
|
| |||||||||||||||||||
99
Table of Contents
Maturity of Deposits
The following table sets forth information regarding the maturity of our deposits as of December 31, 2013.
| For the year ended December 31, 2013 | ||||||||||||||||||||||||
| 1 month | 1-3 months | 3 months-1 year | 1-5 years | More than 5 years | Total | |||||||||||||||||||
| Maturity Deposits | (S/. in millions) | |||||||||||||||||||||||
Demand deposits | 6,348.8 | — | — | — | 568.2 | 6,917.0 | ||||||||||||||||||
Saving deposits | 5,370.9 | — | — | — | — | 5,370.9 | ||||||||||||||||||
Time deposits | 3,420.7 | 2,683.5 | 2,545.4 | 1,098.4 | 25.4 | 9,773.5 | ||||||||||||||||||
|
|
|
|
|
|
|
|
|
|
|
| |||||||||||||
Total(1) | 15,140.4 | 2,683.5 | 2,545.4 | 1,098.4 | 593.6 | 22,061.4 | ||||||||||||||||||
|
|
|
|
|
|
|
|
|
|
|
| |||||||||||||
Percentage of Total | 68.6 | % | 12.2 | % | 11.5 | % | 5.0 | % | 2.7 | % | 100.0 | % | ||||||||||||
| (1) | Does not include other deposits totaling S/. 6.0 million. |
Short-Term Borrowings
Our short-term borrowings, other than deposits, are composed of due to banks and correspondents, bonds, notes and other obligations and amounted to S/. 977.9 million as of December 31, 2013, S/. 1,919.9 million as of December 31, 2012 and S/. 470.6 million as of January 1, 2012, with nominal average rates of 2.9%, 2.4% and 3.8%, respectively.
100
Table of Contents
Strong Macroeconomic Fundamentals
The Peruvian economy has been one of the best performing in Latin America as a result of prudent macroeconomic policy and strong fundamentals. From 2008 to 2013, according to the International Monetary Fund, the Peruvian economy was the fastest growing as compared to the peer countries in Latin America in terms of average real GDP growth rates. Economic growth has been mostly driven by higher internal demand and stronger fixed private investment, which grew at 5-year CAGRs of 8.0% and 12.3%, respectively, for the period ended December 31, 2013. In its most recent forecast as of July 2014, the Central Reserve Bank of Peru has estimated real GDP growth for Peru of 4.4%, 6.0% and 6.3% in 2014, 2015 and 2016, respectively.
The following chart sets forth Peru’s average real GDP growth rate from 2008 to 2013, as compared to selected peer countries in Latin America.
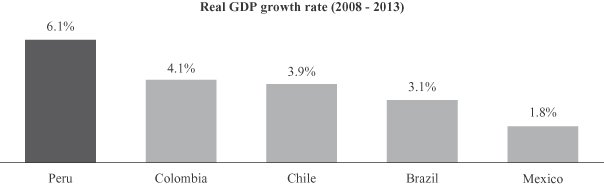
Source: Data published by the central banks of Chile and Peru and the national institutes of statistics of Brazil, Colombia and Mexico.
From 2008 to 2013, Peru maintained one of the lowest inflation rates in Latin America, due to the monetary policy implemented by the Central Reserve Bank of Peru and the conservative fiscal policy of the Peruvian government. In 2002, in order to maintain low inflation rates, the Central Reserve Bank of Peru established an annual inflation target of 2.5% within a range of one percentage point, which was lowered to 2.0% in 2007. The Central Reserve Bank of Peru has maintained this target inflation range since then. From 2008 to 2013, according to INEI, Peru’s inflation, as measured by changes of the consumer price index, averaged 3.2%, below the average consumer price inflation rate of 4.2% for the group of peer countries in Latin America during the same period.
101
Table of Contents
The following chart sets forth Peru’s average consumer price inflation rate from 2008 to 2013, as compared to the group of peer countries in Latin America.
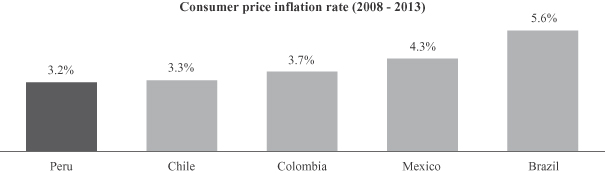
Source: Data published by the central banks of Mexico and Peru and the national institutes of statistics of Brazil, Chile and Colombia.
The Peruvian government’s conservative fiscal policy, coupled with the Central Reserve Bank of Peru’s management of inflation and international reserves, has helped Peru improve and maintain investment grade ratings by Moody’s (A3), S&P (BBB+) and Fitch (BBB+). In July 2014, Moody’s upgraded Peru’s credit rating from Baa2 to A3, making Peru one of three countries in Latin America to benefit from such ratings.
The following chart displays Peru’s net international reserves and public external debt-to-GDP ratio from 2008 to 2013.
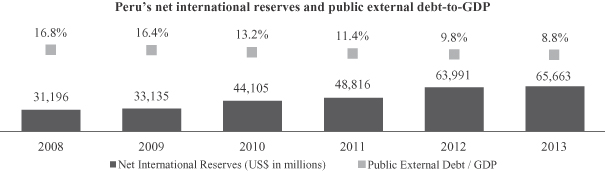
Source: Central Reserve Bank of Peru.
Peru’s unemployment rate has decreased significantly over the past five years, mainly supported by both monetary and fiscal stimulus, which have fueled economic growth and demand for labor. According to INEI, the unemployment rate has decreased over 200 basis points from 7.8% in 2008 to 5.7% in 2013.
102
Table of Contents
The following chart displays Peru’s unemployment rate from 2008 to 2013.
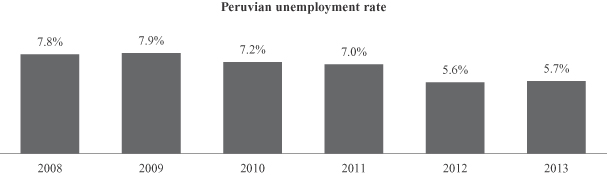
Source: INEI.
Since 2008, thenuevo sol has remained one of the most stable currencies in Latin America, maintaining its value against the U.S. dollar and other foreign currencies, mainly supported by Peru’s strong monetary policy. The Central Reserve Bank of Peru participates in the market (buying or sellingnuevos soles) in order to avoid large exchange rate fluctuations and their adverse effects on the Peruvian economy, which remains partially dollarized.
The following chart displays the local currency exchange rate versus the U.S. dollar indexed to January 2008, for Peru and the group of peer countries in Latin America.
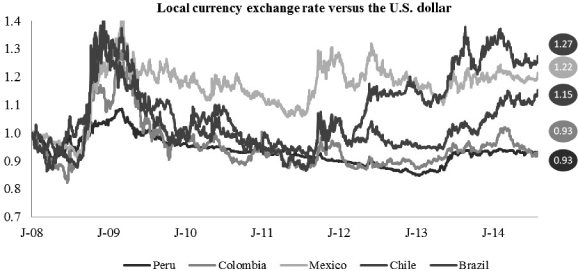
Source: Data published by the central banks of Brazil, Chile, Colombia, Mexico and Peru.
103
Table of Contents
Demographic Trends
Peru’s strong economic growth has been supported by favorable demographic trends. According to INEI, the poverty rate in Peru declined to 23.9% in 2013, from approximately 37.3% in 2008. Moreover, GDP per capita in U.S. Dollars increased from US$4,353 in 2008 to US$6,630 in 2013, reflecting a robust increase in consumer purchasing power according to the Central Reserve Bank of Peru.
The following chart displays Peru’s GDP per capita in U.S. dollars and the poverty rate from 2008 to 2013.
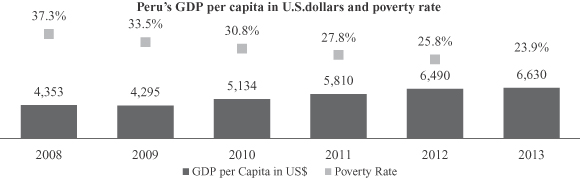
Source: Central Reserve Bank of Peru and INEI.
Peruvian Banking System and Competition
During the 1990s, the Peruvian economy underwent a major transformation, from being a highly protected and regulated system prevailing in the 1980s to afree-market economy. During this period, protectionist and interventionist laws and policies were gradually dismantled to create a liberal economy dominated by the private sector. Similarly, the Peruvian financial industry underwent deep structural changes that resulted in a significant expansion of credit. From 1993 to 1998, performing loans in the Peruvian financial system grew at a five-year CAGR of 45.9%, and banking penetration in Peru, measured as the ratio ofloans-to-GDP, rose from 10.2% to 26.4% according to the SBS.
In 1998, the rise in international interest rates that followed the Russian default led to large outflows of capital from Peru, resulting in a 15.8% depreciation of thenuevo sol. The strong depreciation of thenuevo sol, coupled with the strong dollarization of the Peruvian Banking system prevalent at that time (81% of the loans were denominated in U.S. dollars) led to a sharp deterioration of the Peruvian banking system’s loan portfolio quality and to a contraction in total loans. Past-due loans in the system peaked at 9.4% of total gross loans as of January 31, 2000, resulting in increased provisions and large capital losses for financial institutions.
However, from 2001 onwards, as macroeconomic conditions improved, the general banking industry indicators in Peru began also to improve. Past-due loans dropped from 9.0% of total gross loans as of December 31, 2001 to 3.7% as of December 31, 2004, and loan reserves over past-due loans increased from 118.9% as of December 31, 2001 to 176.5% as of December 31, 2004 according to the SBS.
From 2005 to 2008, fostered by a steady and sustained improvement in Peru’s macroeconomic indicators, credit expanded again, with performing loans growing 25.2% in 2005, 18.0% in 2006, 34.7% in 2007 and 38.2% in 2008. The global financial crisis that started in late 2008 temporarily reduced credit growth as performing loans remained flat in 2009.
104
Table of Contents
From December 31, 2008 to December 31, 2013, the banking system in Peru experienced a significant expansion of credit. During this period, gross loans in the Peruvian banking system grew at a five-year CAGR of 13.0% and banking penetration in Peru, measured as the ratio ofloans-to-GDP, rose from 16.5% to 30.4%, according to the SBS and the Central Reserve Bank of Peru. A significant part of the growth experienced by the Peruvian financial system since 2008 has been generated by the retail banking sector. Retail loans (including consumer loans and mortgages) grew at a five-year CAGR of 15.7% for the period ended December 31, 2013.
As of December 31, 2013, approximately 34.3% of the Peruvian banking sector’s total loans were retail loans, up from 30.5% as of December 31, 2008. In particular, consumer loans, in which Interbank has a leading position, grew at a five-year CAGR of 12.5% for the period ended December 31, 2013.
According to the SBS, the total number of credit cards issued in Peru as of December 31, 2013 was approximately 8.0 million, of which approximately 19.7% were issued by non-banking entities, including store-branded cards. For the period ended December 31, 2013, the Peruvian banking system’s credit card loans grew at a five-year CAGR of 13.3% as a result of high economic growth and increased consumer spending. During the same period, Interbank’s credit card loans grew at a five-year CAGR of 12.5%.
Although mortgage loans also grew significantly, at a five-year CAGR of 19.8% for the period ended December 31, 2013, they still represent a small portion of retail banking loans, with only approximately 186,400 mortgages outstanding in Peru among a population of approximately 30.5 million, compared to approximately 1.3 million mortgages outstanding in Chile for a population of 17.2 million each as of December 31, 2013. A stable macroeconomic environment and the promotion of housing programs over the past five years have been the main drivers of mortgage loan growth in Peru and are expected to continue fueling mortgage lending.
Despite this growth, the Peruvian banking system remains underpenetrated in comparison to the banking systems from the group of peer countries in Latin America. As of December 31, 2013, Peru’s loans-to-GDP ratio was 30.4%, below the average ratio of 49.9% for the group of peer countries in Latin America and less than half the ratio of 84.1% for Chile, according to the IMF and local regulators.
The following chart shows banking penetration as of December 31, 2013 as measured by deposits-to-GDP and loans-to-GDP.
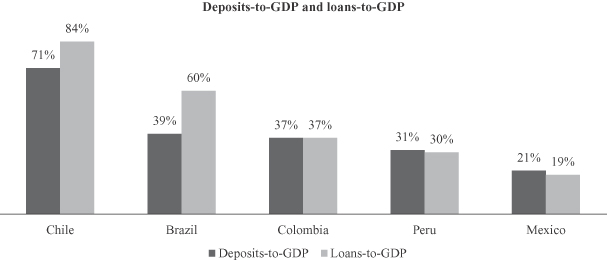
Source: IMF, the local bank regulators, local national institutes of statistics, and local central banks.
105
Table of Contents
The Peruvian banking system is highly concentrated in a small number of relatively large participants. The four largest banks accounted for 83.8% of total gross loans and 83.4% of total deposits in the system as of December 31, 2013. Furthermore, foreign banks play a significant role in the Peruvian financial system. As of December 31, 2013, BBVA and Scotiabank, two of the four largest banks in the system, which accounted for a combined 38.6% of total gross loans and 37.2% of total deposits, according to the SBS, were under foreign control. Although other major global banks such as BNP Paribas, Standard Chartered, Intesa (Sudameris) and BankBoston have ceased operations in Peru over the past nine years, other foreign banks have entered or have shown interest in entering or increasing their exposure in the Peruvian market.
Interbank is currently the fourth largest bank in Peru as measured by total gross loans and deposits, as of December 31, 2013, and has faced strong competition, including increased pressure on margins, primarily as a result of the presence of commercial banks in the Peruvian market with substantial capital, technology and marketing resources, as well as from Peruvian pension funds that lend to Interbank’s current and potential commercial customers. This increased competition has affected the average interest rates that Interbank has been able to charge its customers.
The following tables show Interbank’s main competitors and their respective market shares as of December 31, 2013.
| As of December 31, 2013 | ||||||||||||||||||||||||||||||||||||
| Assets | Total Gross Loans | Deposits | ||||||||||||||||||||||||||||||||||
| Balance | Market Share (%) | Rank | Balance | Market Share (%) | Rank | Balance | Market Share (%) | Rank | ||||||||||||||||||||||||||||
(S/. in millions) | (S/. in millions) | (S/. in millions) | ||||||||||||||||||||||||||||||||||
BCP | 91,342.9 | 35.0 | % | 1 | 56,794.3 | 33.5 | % | 1 | 59,358.9 | 34.5 | % | 1 | ||||||||||||||||||||||||
BBVA | 56,550.0 | 21.6 | % | 2 | 39,794.3 | 23.5 | % | 2 | 36,385.5 | 21.2 | % | 2 | ||||||||||||||||||||||||
Scotiabank | 40,951.5 | 15.7 | % | 3 | 25,720.8 | 15.2 | % | 3 | 27,597.3 | 16.1 | % | 3 | ||||||||||||||||||||||||
Interbank | 29,871.6 | 11.4 | % | 4 | 19,778.4 | 11.7 | % | 4 | 20,043.4 | 11.7 | % | 4 | ||||||||||||||||||||||||
BanBif | 7,680.7 | 2.9 | % | 5 | 5,642.6 | 3.3 | % | 5 | 5,169.8 | 3.0 | % | 6 | ||||||||||||||||||||||||
Mibanco | 5,975.6 | 2.3 | % | 6 | 4,473.9 | 2.6 | % | 7 | 3,901.9 | 2.3 | % | 8 | ||||||||||||||||||||||||
Citibank | 6,804.4 | 2.6 | % | 7 | 2,695.3 | 1.6 | % | 8 | 5,217.9 | 3.0 | % | 5 | ||||||||||||||||||||||||
Financiero | 6,568.6 | 2.5 | % | 8 | 4,694.7 | 2.8 | % | 6 | 3,944.7 | 2.3 | % | 7 | ||||||||||||||||||||||||
GNB | 3,631.6 | 1.4 | % | 9 | 2,636.9 | 1.6 | % | 9 | 2,874.9 | 1.7 | % | 9 | ||||||||||||||||||||||||
Falabella | 3,257.3 | 1.2 | % | 10 | 2,499.2 | 1.5 | % | 10 | 1,777.7 | 1.0 | % | 11 | ||||||||||||||||||||||||
Santander | 3,225.4 | 1.2 | % | 11 | 1,739.1 | 1.0 | % | 11 | 2,020.1 | 1.2 | % | 10 | ||||||||||||||||||||||||
Comercio | 1,648.4 | 0.6 | % | 12 | 1,156.2 | 0.7 | % | 12 | 1,299.6 | 0.8 | % | 12 | ||||||||||||||||||||||||
Ripley | 1,486.0 | 0.6 | % | 13 | 1,011.8 | 0.6 | % | 13 | 805.0 | 0.5 | % | 14 | ||||||||||||||||||||||||
Azteca | 1,140.9 | 0.4 | % | 14 | 630.9 | 0.4 | % | 14 | 960.3 | 0.5 | % | 13 | ||||||||||||||||||||||||
Deutsche | 767.5 | 0.3 | % | 15 | 0.0 | 0.0 | % | 16 | 543.8 | 0.3 | % | 15 | ||||||||||||||||||||||||
Cencosud | 414.7 | 0.2 | % | 16 | 287.0 | 0.2 | % | 15 | 39.7 | 0.0 | % | 16 | ||||||||||||||||||||||||
|
|
|
|
|
|
|
|
|
|
|
|
|
|
|
|
|
| |||||||||||||||||||
Total | 261,316.8 | 100.0 | % | 169,555.5 | 100.0 | % | 171,940.5 | 100.0 | % | |||||||||||||||||||||||||||
|
|
|
|
|
|
|
|
|
|
|
| |||||||||||||||||||||||||
Source: SBS.
106
Table of Contents
As of December 31, 2013 | ||||||||||||||||||||||||||
Gross Consumer Loans(1) | Gross Consumer Credit Cards | |||||||||||||||||||||||||
Bank | Balance | Market Share (%) | Rank | Bank | Balance | Market Share (%) | Rank | |||||||||||||||||||
(S/. in millions) | (S/. in millions) | |||||||||||||||||||||||||
BCP | 7,985.15 | 27.0 | % | 1 | BCP | 2,871.39 | 23.9 | % | 1 | |||||||||||||||||
Interbank | 5,960.16 | 20.1 | % | 2 | Interbank | 2,715.00 | 22.6 | % | 2 | |||||||||||||||||
BBVA | 3,457.61 | 11.7 | % | 3 | BBVA | 1,202.53 | 10.0 | % | 4 | |||||||||||||||||
Scotiabank | 3,418.18 | 11.6 | % | 4 | Scotiabank | 886.84 | 7.4 | % | 5 | |||||||||||||||||
Falabella | 2,487.88 | 8.4 | % | 5 | Falabella | 2,348.89 | 19.6 | % | 3 | |||||||||||||||||
Ripley | 1,011.57 | 3.4 | % | 6 | Ripley | 772.98 | 6.4 | % | 6 | |||||||||||||||||
Financiero | 1,001.71 | 3.4 | % | 7 | Financiero | 74.29 | 0.6 | % | 11 | |||||||||||||||||
Citibank | 975.72 | 3.3 | % | 8 | Citibank | 568.42 | 4.7 | % | 7 | |||||||||||||||||
GNB | 917.91 | 3.1 | % | 9 | GNB | 95.98 | 0.8 | % | 10 | |||||||||||||||||
Comercio | 806.21 | 2.7 | % | 10 | Comercio | 3.02 | 0.0 | % | 14 | |||||||||||||||||
Azteca | 630.90 | 2.1 | % | 11 | Azteca | 23.43 | 0.2 | % | 12 | |||||||||||||||||
BanBif | 473.45 | 1.6 | % | 12 | BanBif | 136.35 | 1.1 | % | 9 | |||||||||||||||||
Cencosud | 287.04 | 1.0 | % | 13 | Cencosud | 287.04 | 2.4 | % | 8 | |||||||||||||||||
Mibanco | 169.40 | 0.6 | % | 14 | Mibanco | 5.86 | 0.0 | % | 13 | |||||||||||||||||
Santander | 0.61 | 0.0 | % | 15 | Santander | 0.00 | 0.0 | % | 15 | |||||||||||||||||
Deutsche | 0.00 | 0.0 | % | 16 | Deutsche | 0.00 | 0.0 | % | 16 | |||||||||||||||||
|
|
|
|
|
|
|
| |||||||||||||||||||
Total | 29,583.49 | 100.0 | % | Total | 11,992.02 | 100.0 | % | |||||||||||||||||||
|
|
|
|
|
|
|
| |||||||||||||||||||
| (1) | Gross consumer loans does not include mortgage loans. |
Source: SBS.
As of December 31, 2013 | ||||||||||||||||||||||||||
Gross Commercial Loans | Gross Mortgage Loans | |||||||||||||||||||||||||
Bank | Balance | Market Share (%) | Rank | Bank | Balance | Market Share (%) | Rank | |||||||||||||||||||
(S/. in millions) | (S/. in millions) | |||||||||||||||||||||||||
BCP | 39,238.99 | 35.2 | % | 1 | BCP | 9,570.21 | 33.5 | % | 1 | |||||||||||||||||
BBVA | 27,784.86 | 24.9 | % | 2 | BBVA | 8,551.80 | 29.9 | % | 2 | |||||||||||||||||
Scotiabank | 18,256.44 | 16.4 | % | 3 | Scotiabank | 4,046.15 | 14.2 | % | 3 | |||||||||||||||||
Interbank | 10,075.36 | 9.0 | % | 4 | Interbank | 3,742.85 | 13.1 | % | 4 | |||||||||||||||||
BanBif | 4,113.74 | 3.7 | % | 5 | BanBif | 1,055.38 | 3.7 | % | 5 | |||||||||||||||||
Mibanco | 4,025.09 | 3.6 | % | 6 | GNB | 750.31 | 2.6 | % | 6 | |||||||||||||||||
Financiero | 3,132.48 | 2.8 | % | 7 | Financiero | 560.50 | 2.0 | % | 7 | |||||||||||||||||
Santander | 1,738.52 | 1.6 | % | 8 | Mibanco | 279.46 | 1.0 | % | 8 | |||||||||||||||||
Citibank | 1,714.37 | 1.5 | % | 9 | Comercio | 15.77 | 0.1 | % | 9 | |||||||||||||||||
GNB | 968.72 | 0.9 | % | 10 | Falabella | 11.30 | 0.0 | % | 10 | |||||||||||||||||
Comercio | 334.23 | 0.3 | % | 11 | Citibank | 5.26 | 0.0 | % | 11 | |||||||||||||||||
Ripley | 0.19 | 0.0 | % | 12 | Santander | 0.00 | 0.0 | % | 12 | |||||||||||||||||
Falabella | 0.00 | 0.0 | % | 13 | Ripley | 0.00 | 0.0 | % | 13 | |||||||||||||||||
Azteca | 0.00 | 0.0 | % | 14 | Azteca | 0.00 | 0.0 | % | 14 | |||||||||||||||||
Cencosud | 0.00 | 0.0 | % | 15 | Cencosud | 0.00 | 0.0 | % | 15 | |||||||||||||||||
Deutsche | 0.00 | 0.0 | % | 16 | Deutsche | 0.00 | 0.0 | % | 16 | |||||||||||||||||
|
|
|
|
|
|
|
| |||||||||||||||||||
Total | 111,382.98 | 100.0 | % | Total | 28,588.98 | 100.0 | % | |||||||||||||||||||
|
|
|
|
|
|
|
| |||||||||||||||||||
Source: SBS.
107
Table of Contents
The following table shows key industry metrics for the four largest banks by assets and the Peruvian banking system.
| As of December 31, | ||||||||||||||||||||||||
| 2013 | 2012 | 2011 | 2010 | 2009 | 2008 | |||||||||||||||||||
ROE(1) | ||||||||||||||||||||||||
Interbank | 26.5 | % | 26.8 | % | 31.4 | % | 33.7 | % | 36.7 | % | 31.1 | % | ||||||||||||
BCP | 21.8 | % | 22.4 | % | 24.9 | % | 24.1 | % | 21.0 | % | 37.6 | % | ||||||||||||
BBVA | 29.8 | % | 33.1 | % | 34.3 | % | 33.7 | % | 36.5 | % | 36.2 | % | ||||||||||||
Scotiabank | 18.0 | % | 19.2 | % | 21.5 | % | 21.5 | % | 23.8 | % | 28.7 | % | ||||||||||||
Peruvian banking system | 21.2 | % | 22.4 | % | 24.5 | % | 24.2 | % | 24.5 | % | 31.1 | % | ||||||||||||
ROA(2) | ||||||||||||||||||||||||
Interbank | 2.4 | % | 2.6 | % | 2.8 | % | 2.8 | % | 2.8 | % | 2.1 | % | ||||||||||||
BCP | 1.9 | % | 2.0 | % | 2.1 | % | 2.0 | % | 1.8 | % | 2.7 | % | ||||||||||||
BBVA | 2.4 | % | 2.6 | % | 2.8 | % | 2.9 | % | 2.9 | % | 2.5 | % | ||||||||||||
Scotiabank | 2.3 | % | 2.7 | % | 2.8 | % | 2.8 | % | 2.8 | % | 2.9 | % | ||||||||||||
Peruvian banking system | 2.0 | % | 2.2 | % | 2.3 | % | 2.4 | % | 2.3 | % | 2.6 | % | ||||||||||||
Efficiency Ratio(3) | ||||||||||||||||||||||||
Interbank | 48.8 | % | 46.3 | % | 45.7 | % | 46.4 | % | 46.9 | % | 56.4 | % | ||||||||||||
BCP | 46.0 | % | 47.3 | % | 47.9 | % | 42.6 | % | 46.9 | % | 43.0 | % | ||||||||||||
BBVA | 36.6 | % | 35.4 | % | 36.9 | % | 33.3 | % | 31.4 | % | 34.8 | % | ||||||||||||
Scotiabank | 40.1 | % | 39.4 | % | 40.0 | % | 39.7 | % | 37.3 | % | 43.6 | % | ||||||||||||
Peruvian banking system | 47.1 | % | 46.7 | % | 47.1 | % | 44.2 | % | 44.3 | % | 46.7 | % | ||||||||||||
Past-Due-Loan Ratio(4) | ||||||||||||||||||||||||
Interbank | 1.8 | % | 1.8 | % | 1.5 | % | 1.5 | % | 1.5 | % | 1.2 | % | ||||||||||||
BCP | 2.3 | % | 1.7 | % | 1.4 | % | 1.4 | % | 1.4 | % | 0.7 | % | ||||||||||||
BBVA | 1.7 | % | 1.2 | % | 0.9 | % | 1.0 | % | 1.0 | % | 1.2 | % | ||||||||||||
Scotiabank | 2.1 | % | 1.8 | % | 1.5 | % | 1.5 | % | 1.7 | % | 1.8 | % | ||||||||||||
Peruvian banking system | 2.1 | % | 1.8 | % | 1.5 | % | 1.5 | % | 1.6 | % | 1.3 | % | ||||||||||||
Coverage Ratio | ||||||||||||||||||||||||
Interbank | 226.6 | % | 234.5 | % | 274.1 | % | 269.1 | % | 266.6 | % | 283.1 | % | ||||||||||||
BCP | 151.9 | % | 185.9 | % | 199.0 | % | 196.2 | % | 195.2 | % | 303.1 | % | ||||||||||||
BBVA | 258.9 | % | 366.8 | % | 446.9 | % | 396.5 | % | 401.2 | % | 304.2 | % | ||||||||||||
Scotiabank | 170.5 | % | 203.6 | % | 234.5 | % | 241.4 | % | 259.9 | % | 231.4 | % | ||||||||||||
Peruvian banking system | 188.1 | % | 223.6 | % | 251.1 | % | 245.6 | % | 242.2 | % | 258.7 | % | ||||||||||||
Total Capital Ratio | ||||||||||||||||||||||||
Interbank | 13.4 | % | 13.3 | % | 13.7 | % | 14.4 | % | 11.5 | % | 10.8 | % | ||||||||||||
BCP | 14.5 | % | 14.7 | % | 14.5 | % | 12.8 | % | 14.5 | % | 11.5 | % | ||||||||||||
BBVA | 12.4 | % | 12.4 | % | 12.5 | % | 14.7 | % | 13.3 | % | 11.9 | % | ||||||||||||
Scotiabank | 13.2 | % | 15.7 | % | 10.9 | % | 11.5 | % | 11.9 | % | 11.9 | % | ||||||||||||
Peruvian banking system | 13.7 | % | 14.1 | % | 13.4 | % | 13.6 | % | 13.5 | % | 11.9 | % | ||||||||||||
| (1) | ROE is calculated as net profit for the last twelve months as a percentage of average shareholders’ equity, computed as the simple average of the last twelve months. |
| (2) | ROA is calculated as net profit for the last twelve months as a percentage of average total assets, computed as the simple average of the last twelve months. |
| (3) | Efficiency ratio is calculated as operating expenses divided by total financial income, which consists of gross financial income, income from financial services, net, and other income, net for the last twelve months. |
| (4) | Past-due-loan ratio is calculated as past-due loans and loans in legal collection as a percentage of total gross loan portfolio, computed using the ending balance of the year. |
Source: SBS.
108
Table of Contents
Among the four largest banks, Interbank is also the fastest growing bank in terms of net profit with a five-year CAGR of 19.1% for the period ended December 31, 2013, under Peruvian SBS GAAP. Interbank’s five-year CAGR was higher than Banco de Crédito del Perú (4.3%), BBVA (12.5%) and Scotiabank (7.4%). For the year ended December 31, 2013, Interbank continued to outperform its closest competitors and grew 13.4% year-over-year in terms of net profit, faster than Banco de Crédito del Perú (10.0%), BBVA (4.7%) and Scotiabank (3.9%).
The following chart sets forth the five-year CAGR in net profit for the period ended December 31, 2013 for the four largest banks in Peru. Under IFRS, Interbank’s net profit for the year ended December 31, 2013 grew 8.2% year-over-year.
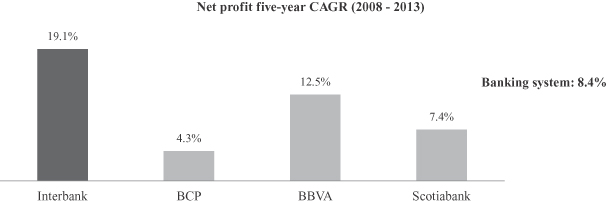
Interbank’s share of the Peruvian banking system’s net profit increased from 8.1% for the year ended December 31, 2008 to 13.0% for the year ended December 31, 2013.
Interbank was also the fastest growing bank by total loans and total deposits, among the four largest banks in Peru as of the year ended December 31, 2013. The following chart sets forth the five-year CAGR of total loans under Peruvian SBS GAAP for the four largest banks in Peru, for the period ended December 31, 2013. Under IFRS, Interbank’s total loans for the year ended December 31, 2013 grew 26.6% year-over-year.
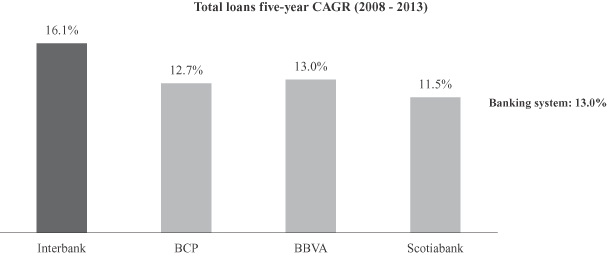
Source: SBS
109
Table of Contents
The following chart sets forth the five-year CAGR of total deposits for the four largest banks in Peru for the period ended December 31, 2013. Under IFRS, Interbank’s total deposits for the year ended December 31, 2013 grew 38.7% year-over-year.
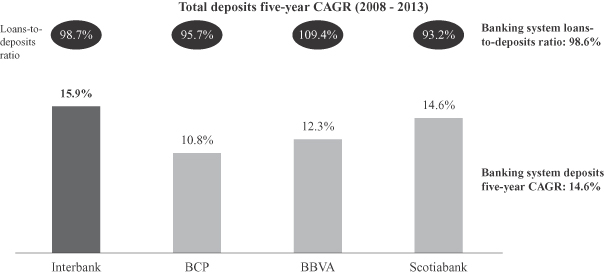
Source: SBS
Interbank’s asset quality is among the best when compared to the four largest banks in Peru on the basis of past-due-loan and coverage ratios. Interbank’s past-due-loan ratio was the second lowest among the four largest Peruvian banks, and lower than the banking system’s average of 2.1%. The following chart sets forth the past-due-loan and coverage ratios under Peruvian SBS GAAP for the four largest banks in Peru as of December 31, 2013. Under IFRS, as of December 31, 2013, Interbank’s past-due-loan and coverage ratios were 1.7% and 199.9%, respectively.
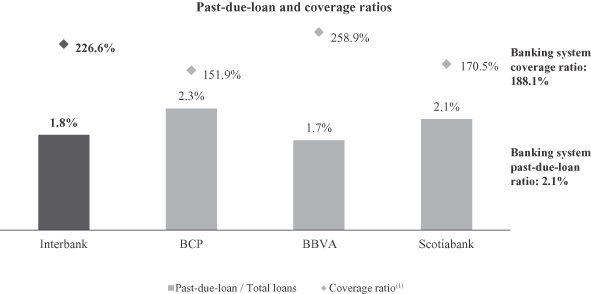
Source: SBS
110
Table of Contents
As of December 31, 2013, Interbank’s past-due-loan ratios in credit cards and consumer loans were the lowest and second lowest, respectively, among the four largest Peruvian banks. The following chart sets forth the past-due-loan ratios in credit cards and consumer loans for the four largest banks in Peru as of December 31, 2013.
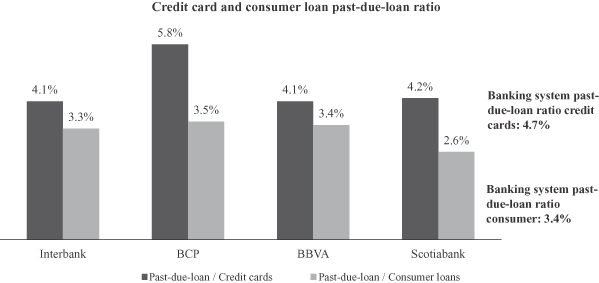
Source: SBS
For the year ended December 31, 2013, Interbank had the lowest commercial past-due-loan ratio among the four largest Peruvian banks. The following chart sets forth the commercial past-due-loan ratio for the four largest banks as of December 31, 2013.
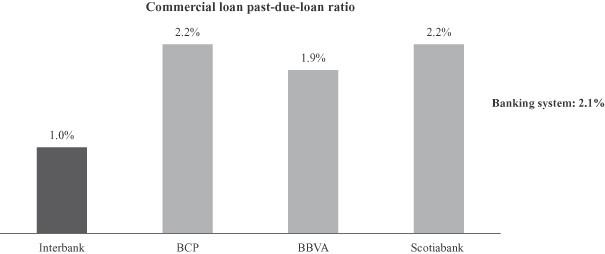
Source: SBS
111
Table of Contents
From 2008 to 2013, Interbank had the highest net interest margin, gross and net of loan loss provisions expenses, among the four largest Peruvian banks. The following chart sets forth the net interest margin before loan loss provision expenses from 2008 to 2013, for the four largest banks in Peru under Peruvian SBS GAAP. Under IFRS, in 2013 Interbank’s net interest margin was 6.2%.
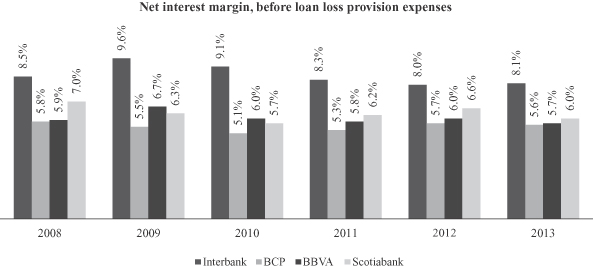
Source: SBS.
The following chart sets forth the net interest margin, net of loan loss provision expenses, from 2008 to 2013, for the four largest banks under Peruvian SBS GAAP.
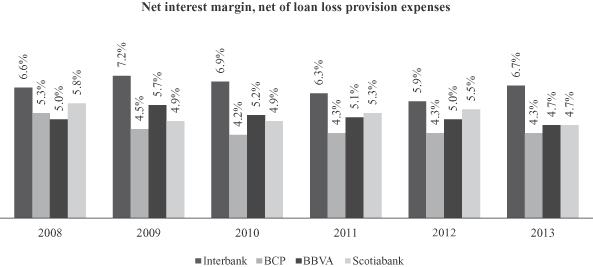
Source: SBS.
112
Table of Contents
For the year ended December 31, 2013, Interbank had the second highest ROE and ROA among the four largest banks. The following chart sets forth the ROE and ROA for the four largest banks in Peru for the year ended December 31, 2013 under Peruvian SBS GAAP. Under IFRS, in 2013 Interbank’s ROE was 23.7%.
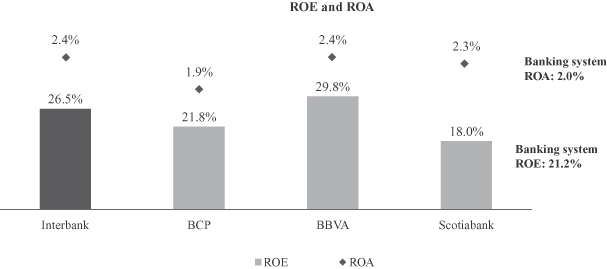
Source: SBS.
ROE is calculated as net profit for the last twelve months as a percentage of average shareholders’ equity, computed as the simple average of the last twelve months. ROA is calculated as net profit for the last twelve months as a percentage of average total assets, computed as the simple average of the last twelve months.
The following chart sets forth Interbank’s BIS ratio compared to the Peruvian banking system’s total capital ratio from 2008 to 2013.
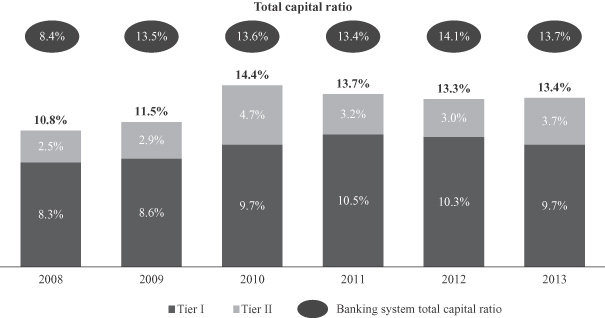
Source: SBS.
113
Table of Contents
Peruvian Insurance Industry and Competition
The Peruvian insurance industry is well-capitalized, with a solvency ratio of 28.4% under Peruvian SBS GAAP as of December 31, 2013 and operates under a well-established regulatory framework. Over the past years, the industry has experienced strong growth. Insurance premiums grew at a five-year CAGR of 15.9% for the period ended December 31, 2013, equivalent to approximately 2.9x of Peru’s real GDP CAGR over the same period. Insurance premiums in Peru reached S/. 9.1 billion for the year ended December 31, 2013, representing a 14.7% year-over-year increase. Despite such growth, insurance penetration in Peru, measured as the ratio of premiums-to-GDP as of December 31, 2013, is estimated to be 1.6%, which is lower than the average ratio of 3.3% for selected peer countries in Latin America, and less than half the ratio of 4.2% for Chile, according to the Swiss Re Sigma Report.
We believe that Peru’s growing middle class will increase penetration in the Peruvian insurance industry. The following chart shows insurance penetration for the year ended December 31, 2013 as measured by premiums-to-GDP.
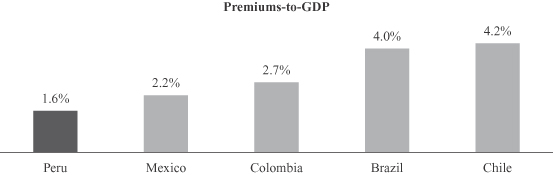
Source: Swiss Re Sigma 2013 Report.
Life insurance premiums represented approximately 46% of total insurance premiums for the year ended December 31, 2013. In particular, annuities represented the fastest growing insurance product, with premiums growing at a five-year CAGR of 21.6% compared to the insurance industry’s 15.9% for the period ended December 31, 2013. Growth of the annuities’ segment is expected to further accelerate as the number of Peruvian private pension system’s retirees and their respective average pension balances increase. Over the ten years ended December 31, 2013, 67 thousand people have retired under the Peruvian private pension system compared to a total of 375 thousand and nearly three million expected retirees over the next ten and 30 years, respectively, according to the SBS.
114
Table of Contents
The table below sets forth the number of members in the Peruvian private pension system as of December 31, 2013.
As of December 31, 2013 | ||||
Age (years) | Number of Members (in thousands) | |||
Less than 25 | 699 | |||
26-35 | 1,756 | |||
36-45 | 1,632 | |||
46-55 | 942 | |||
56-65 | 375 | |||
More than 65 | 77 | |||
|
| |||
Total | 5,482 | |||
|
| |||
Source: SBS
The chart below sets forth Peruvian insurance premiums from 2008 to 2013.
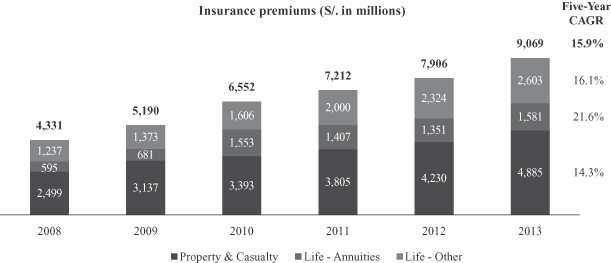
Source: SBS.
115
Table of Contents
For the year ended December 31, 2013, Interseguro was the leading provider of annuities in Peru, with a market share of 25.0% as measured by premiums among Peruvian insurance companies. The chart below shows market share by annuities premiums from 2008 to 2013.
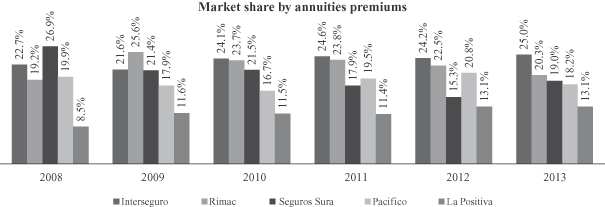
Source: SBS.
As of December 31, 2013, a total of fifteen (15) companies comprised the Peruvian insurance industry. For the year ended December 31, 2013, the four largest insurance companies by total premiums had a 79.1% market share, and the leading two insurance companies had a combined market share of 59.4%. In terms of assets, the four largest insurance companies had a 79.8% market share, and the leading two insurance companies had a combined market share of 54.0% over the same period. The Peruvian insurance industry is largely represented by Peruvian companies with four of the seven largest companies controlled by Peruvian economic groups.
The following table presents market shares by assets and premiums of the seven largest insurance companies in Peru as of and for the year ended December 31, 2013.
Company | Life | Non-Life | Total Assets as of December 31, 2013 | Total Premiums for the year ended December 31, 2013 | ||||||||||||||||
| (S/. in million) | % | (S/. in million) | % | |||||||||||||||||
Rimac | ü | ü | 7,902.0 | 28.1 | % | 2,990.1 | 33.0 | % | ||||||||||||
Pacifico(1) | ü | ü | 7,300.9 | 25.9 | % | 2,401.1 | 26.5 | % | ||||||||||||
Seguros Sura | ü | — | 3,628.4 | 12.9 | % | 540.3 | 6.0 | % | ||||||||||||
Interseguro | ü | ü | 3,627.5 | 12.9 | % | 564.3 | 6.2 | % | ||||||||||||
La Positiva | ü | ü | 2,915.0 | 10.4 | % | 1,027.9 | 11.3 | % | ||||||||||||
Mapfre Peru(1) | — | ü | 1,200.2 | 4.3 | % | 751.5 | 8.3 | % | ||||||||||||
Mapfre Peru Vida(1) | ü | — | 807.7 | 2.9 | % | 291.1 | 3.2 | % | ||||||||||||
Source: SMV, SBS.
| (1) | Mapfre Peru and Mapfre Peru Vida are shown individually as Mapfre does not report on a consolidated basis to the SBS. |
116
Table of Contents
Interseguro’s average ROE, under Peruvian SBS GAAP was 30.3% from 2008 to 2013, higher than the industry’s average of 15.4% for the same period. The following chart sets forth the ROEs for Interseguro, its main competitors and the Peruvian insurance industry, from 2008 to 2013. For the year ended December 31, 2013, Interseguro’s ROE was 48.2% under IFRS.
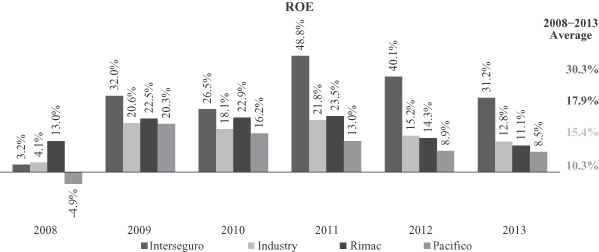
Source: SMV.
The following chart sets forth five-year CAGRs of premiums for the year ended December 31, 2013 for Interseguro, its main competitors and the Peruvian insurance industry.
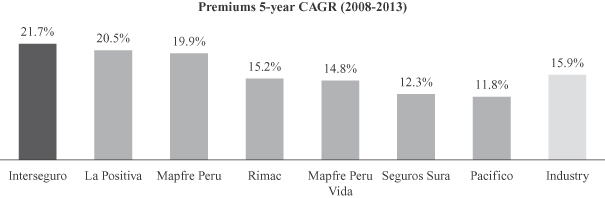
Source: SBS.
Mapfre Peru and Mapfre Peru Vida are shown individually as Mapfre does not report on a consolidated basis to the SBS.
117
Table of Contents
The following chart shows investment portfolio returns for Interseguro and the Peruvian insurance industry from 2008 to 2013.
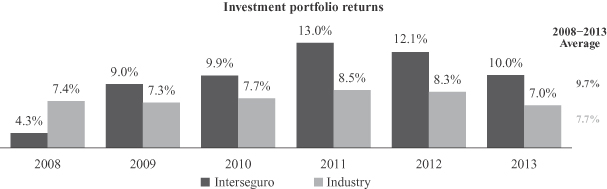
Source: SMV.
Wealth Management Industry and Competition
Inteligo Bank operates in the highly competitive and regulated wealth management industry, competing with independent advisors, global banks and Peruvian firms, such as its main competitor Credicorp Ltd., through its subsidiary Atlantic Security Bank (“ASB”). The Peruvian wealth management industry has also recently attracted several new participants, including representative offices of global banks such as JP Morgan, UBS, RBC, Credit Suisse, Julius Baer among others.
Integlio Bank had a five-year CAGR of assets under management plus deposits of 24.5%, higher than ASB’s CAGR of 9.8%, for the period ended December 31, 2013.
The chart below shows assets under management plus deposits in U.S. dollars for Inteligo Bank and ASB, from 2008 to 2013.
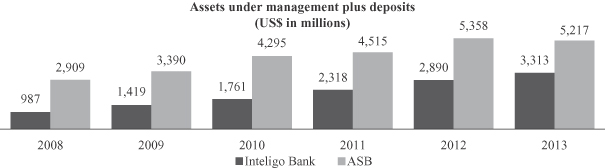
Source: Credicorp Ltd.’s annual reports.
118
Table of Contents
Inteligo Bank’s average ROE from 2008 to 2013 was 23.2% which was higher than ASB’s average ROE of 18.6% during the same period. The following chart compares ROE for Inteligo Bank and ASB from 2008 to 2013.
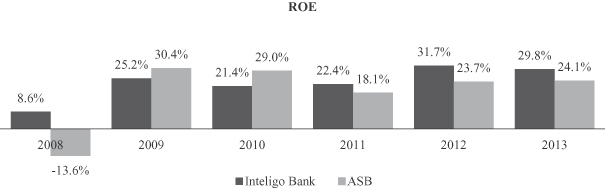
Source: Credicorp Ltd.’s annual reports.
Additionally, Inteligo Bank has generated higher returns on assets under management than ASB from 2008 to 2013. The following chart sets forth fee income as a percentage of average assets under management for Inteligo Bank and ASB from 2008 to 2013.
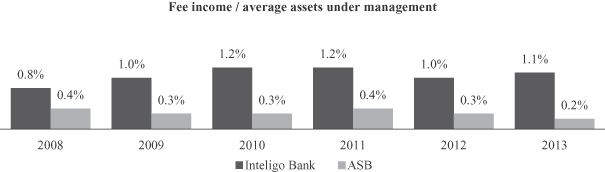
Source: Credicorp Ltd.’s annual reports.
Inteligo SAB provides brokerage services, including sales and trading, in Peru’s domestic capital markets. As of December 31, 2013, the Peruvian brokerage industry consisted of 27 brokerage firms. Inteligo SAB has ranked among the four largest equity trading platforms in each of the last seven years in terms of trading volumes on the Lima Stock Exchange.
119
Table of Contents
Overview
IFS is a leading provider of financial services in the fast-growing, underpenetrated and profitable Peruvian financial system. Through one of the largest distribution networks in Peru (as measured by the number of financial stores, ATMs, correspondent agents and sales force), IFS provides a wide range of products spanning banking, insurance and wealth management services to individual and commercial clients.
Our main subsidiaries are Interbank, a universal bank, Interseguro, an insurance company, and Inteligo, a wealth management services provider. We operate our subsidiaries through a coordinated strategy, focusing on specific businesses which we believe offer high growth opportunities. We are the second largest provider of consumer loans (retail loans other than mortgages) in Peru in terms of total loans outstanding, the leading provider of annuities in terms of premiums, and have a leading and fast-growing wealth management business.
Inteligo was acquired by IFS effective on August 1, 2014. We believe that Inteligo strengthens our position as a leading provider of diversified financial services in Peru, since it complements our banking and insurance segments with a rapidly growing and highly profitable wealth management business. Inteligo benefits from a recurring source of fee income from financial advisory services.
Strengths
Leading financial services provider focused on highly attractive businesses
We are focused on some of the fastest growing and most profitable businesses in the Peruvian financial system. Within our banking segment, Interbank focuses on retail banking, with 49.1% of its loan portfolio constituting retail loans, compared to 34.3% for the Peruvian banking system, as of December 31, 2013, according to the SBS. Interbank is the second largest provider of consumer loans (including mortgage loans) among banks in Peru, with a 16.7% market share as measured by gross consumer loans outstanding as of December 31, 2013. Interbank is also the second largest provider of credit card financing among banks in Peru, with a 22.6% market share by gross credit card loans outstanding and the largest private bank provider of payroll loans to public sector employees, with a 24.6% market share by gross payroll loans, in each case as of December 31, 2013. Interbank has one of the highest net interest margins of the Peruvian banking system, due to its stronger focus on retail banking when compared to its peers. During 2013, Interbank’s net interest margin was 8.1% compared to 6.4% for the four largest Peruvian banks, according to the SBS. Under IFRS, Interbank’s net interest margin for the year ended December 31, 2013 was 6.2%.
In our insurance segment, Interseguro is the leading provider of annuities in Peru, with a market share of 25.0% as measured by premiums for the year ended December 31, 2013, according to the SBS. Furthermore, Interseguro has maintained the leading position in the Peruvian annuities market since 2010. Annuities represented the fastest-growing insurance product in the Peruvian insurance industry with a five-year CAGR in premiums of 21.6% for the period from 2008 to 2013, driven by the growing number of Peruvians retiring under the peruvian private pension system. Growth of the annuities segment is expected to further accelerate as the number of peruvian private pension system’s retirees and their respective average pension balances increase. Over the ten years ended December 31, 2013, 67 thousand people have retired under the Peruvian private pension system compared to a total of 375 thousand and nearly three million expected retirees over the next ten and 30 years, respectively, according to the SBS.
Within our wealth management segment, Inteligo is well-positioned to capture an increasing share of the growing number of wealthy individuals, resulting from strong economic growth and wealth creation in Peru. Inteligo’s five-year CAGR for assets under management plus deposits for the period from 2008 to 2013 was 24.5% under IFRS. We believe Inteligo’s position as a provider of wealth management services to this group of customers will help increase its share of wallet among high net worth individuals, while delivering high levels of growth and profitability.
120
Table of Contents
Outstanding track record of profitable growth, resulting in consistent market share gains
Our strong track record of profitable growth is supported by our increased market share and high profitability across our business segments. In retail banking, Interbank’s total retail loans, including consumer and mortgage loans, achieved a five-year CAGR of 16.6%, compared to 15.7% for the Peruvian banking system, for the period ended December 31, 2013, according to the SBS. In addition, Interbank has increased its market share across retail products over the five-year period ended December 31, 2013. With respect to credit card loans, Interbank’s market share increased from 20.5% to 22.6%, and in mortgage loans, Interbank’s market share increased from 10.1% to 13.1%, in each case from 2008 to 2013.
Interbank has also increased its commercial lending and outpaced the Peruvian banking system, achieving a five-year CAGR of 15.6% in commercial loans outstanding compared to the system’s 11.8%, for the period ended December 31, 2013. Interbank’s market share in commercial loans has increased from 7.7% to 9.0% from 2008 to 2013.
Interbank’s increasing market shares have been accompanied by high profitability, with net profit growing at a five-year CAGR of 19.1% compared to 8.4% for the Peruvian banking system for the period ended December 31, 2013.
Interseguro is one of the fastest growing insurance companies in Peru, achieving a five-year CAGR of 21.7% in direct premiums, compared to the industry’s 15.9%, for the period ended December 31, 2013, according to the SBS. In addition, Interseguro’s market share by annuities premiums has increased from 22.7% to 25.0% from 2008 to 2013. During this period, Interseguro’s net profit grew at a five-year CAGR of 87.6% compared to 50.2% for the Peruvian insurance industry.
Inteligo Bank’s assets under management plus deposits grew at a five-year CAGR of 24.5% for the period ended December 31, 2013. Similarly, net profit grew at a five-year CAGR of 44.0% for the period ended December 31, 2013, supported by strong fees on assets under management, which stood at 1.08% in 2013 (calculated by dividing (x) fee income from financial services, net by (y) average assets under management).
Convenient, extensive and innovative distribution network with a customer-oriented approach
We believe that our convenient, extensive and innovative retail distribution network, together with our product-specific sales force, has made our products more accessible to our customers and has differentiated us from our competitors.
Interbank has built an omni-channel distribution network in Peru, serving over 1.9 million customers. As of December 31, 2013, Interbank had 268 financial stores and operated the second-largest ATM network in Peru with more than 2,400 ATMs, which includes the largest out-of-branch ATM network (under ourGlobal Net brand). Interbank has the largest number of financial stores inside supermarkets in Peru, which are open on weekends and Monday through Sunday from 9:00 a.m. to 9:00 p.m. Moreover with the intention of providing underserved customers with more convenient services, Interbank operates a network of correspondent agents, called Interbank Agentes. The correspondent agents’ concept consists of providing commercial establishments with low-cost electronic terminals which allow customers to perform basic transactions. As of December 31, 2013, Interbank had over 3,200 correspondent agents.
Interseguro markets its annuities and individual life insurance products through its own dedicated sales force to ensure the delivery of high quality service and advice to clients. Interseguro’s specialized sales force is trained to provide a differentiated service for various customer types. As of December 31, 2013, Interseguro employed 128 agents exclusively dedicated to sell annuities and 240 agents to sell other insurance products. In addition to its own sales force, Interseguro leverages the retail distribution capacity of other IFS and Intercorp Peru subsidiaries, including Interbank’s distribution network and our affiliate Intercorp Retail’s sales points (Plaza Vea and Oechsle) to offer simple low-cost premium insurance products.
121
Table of Contents
Our commitment to innovation as part of our customer-oriented approach is demonstrated by continuous improvement of our banking products and distribution channels. For example, in May 2013, Interbank introduced “Imagine” financial stores, a concept jointly developed with IDEO, a design and innovation consulting firm. “Imagine” fosters a more pleasant and inviting environment to Interbank’s customers, and is designed to educate customers on the use of electronic and Internet banking tools in order to migrate low value transactions to electronic channels, while continuing to capture new customers and exploitcross-selling opportunities. Furthermore, Interbank has a full-time financial store functioning as an innovation lab (Explora), allowing it to constantly test new ideas and concepts. These types of initiatives, among others, have allowed Interbank to receive eight awards for creativity and innovation since 1998 fromCreatividad Empresarial, a consortium comprising local journalists and scholars, which is more than any other bank in Peru.
Sound risk management resulting in strong asset quality and investment returns
Our experienced risk management teams focus on monitoring and managing risks across all business areas, including credit, market, liquidity, operational risks, among others. We believe our risk management expertise has allowed us to achieve strong asset quality and high investment returns.
Interbank’s underwriting procedures are based on strong analytics and proprietary models, developed in partnership with internationally recognized risk management experts. These models, along with the risk management skills of its experienced risk management team, provide Interbank with competitive advantages. Despite its fast growth and high concentration in retail loans, which tend to have higher levels of delinquency, Interbank’s past-due loans as a percentage of total gross loans ratio as of December 2013 was 1.8%, the second lowest among the four largest banks in Peru and lower than the industry average of 2.1%.
Interseguro’s investment team and its investment management approach have resulted in high investment returns. We believe that Interseguro was the first insurance company in Peru to invest in real estate as part of its investment strategy, taking advantage of high returns in the real estate sector in Peru, to diversify its investment portfolio and to extend its investment portfolio’s duration to better match its liabilities. Interseguro’s returns on its investment portfolio has outperformed the Peruvian insurance industry, achieving an average return of 9.7% from 2008 to 2013, compared to the Peruvian insurance industry’s average of 7.7%, according to data published by the SMV.
Affiliation with the Intercorp Peru group
Our ultimate parent company, Intercorp Peru, is one of Peru’s largest business groups, with activities spanning financial services, retail and real estate, among others. We believe that being part of this group gives us a competitive edge, because of the group’s deep knowledge of the Peruvian consumer, extensive focus and know-how in the Peruvian retail market, highly visible in-country presence and rapid decision-making capabilities.
Experienced management team with proven ability to foster a merit-based culture and a highly motivated work force
We benefit from an experienced, diverse and talented management team. Most of the members of our senior management have held management positions with other major financial institutions in the United States, Latin America and Europe.
We are focused on attracting, developing and maintaining highly qualified personnel and believe that a merit-based culture that emphasizes teamwork enables them to maintain a motivated workforce that delivers high quality service. Interbank is the only Peruvian company that has been chosen by the Peruvian Great Place to Work Institute as one of the 20 best places to work in Peru for the past 12 consecutive years and one of the top 20
122
Table of Contents
places to work in Latin America for the past two years. Similarly, Interseguro is the only Peruvian insurance company that has been chosen as one of the top five best places to work in Peru (medium-size category) by the Peruvian Great Place to Work Institute for the past four consecutive years, including first place in 2012 and second place in 2013 for Peru and fifth place for Latin America. Additionally, Inteligo SAB has been ranked among the top ten companies in its category (companies with 30 to 250 employees) since it started participating in the Great Place to Work institution survey in 2011, and currently it is the only Peruvian brokerage house included in the ranking.
Strategy
We aim to maintain our leadership position as one of the fastest growing and most profitable providers of financial services in Peru. We aim to provide the best customer experience to our customers based on convenient, agile and friendly service, which we believe leads to new customers and to increased satisfaction, cross-selling and retention of our existing customers.
Leverage our leading market positions in our key businesses to benefit from the significant growth potential of the financial sector
Interbank is a leader in retail banking, particularly in the issuance of credit cards, mortgage origination and payroll lending to public employees, which we believe continue to have significant growth potential in Peru. We believe that Peru’s low credit penetration combined with its strong economic growth will lead to robust growth in consumer and mortgage lending, that Interbank is well positioned to capture.
As of December 31, 2013, the estimated total number of credit cards per inhabitant in Peru was only 0.26 as compared to 1.25 cards per inhabitant for Chile. The ratio of consumer loans-to-GDP and the ratio of mortgage loans-to-GDP in Peru were only 5.4% and 5.3%, respectively, while the averages for the group of peer countries in Latin America were 8.6% and 8.8%, respectively, as of December 31, 2013.
Interbank plans to continue to balance its growth between retail and commercial banking, as it believes that commercial lending will continue to exhibit strong growth in the coming years. We believe there are significant opportunities for Interbank in commercial banking, primarily focusing on Peruvian corporates and medium-size companies, where Interbank has a lower market share (9.0% in terms of gross loans as of December 31, 2013 according to the SBS) when compared to its retail business. Interbank focuses on high margin and fee generating products such as leasing, structured finance, cash management, trade finance and factoring in its commercial lending business.
Interseguro will continue to focus on its annuities business, which we expect to continue to benefit from the growth stemming from the increased number of retirees from the Peruvian private pension system, as well as an increase in total funds managed. Additionally, Interseguro plans to further develop its life and other insurance products targeted to individuals. We intend to capitalize on Interbank’s growing distribution network by continuing sales of insurance products in combination with banking products, and on Intercorp Peru’s extensive distribution network to continue our cross-selling efforts of low-cost premium policies.
We believe that Inteligo’s portfolio of clients and the size of its assets under management plus deposits will continue to grow along with increased wealth generation in Peru. We expect that growth of assets under management plus deposits will outpace Peru’s real economic growth driven by the accelerating demand for sophisticated wealth management services. From 2008 to 2013, Peru’s GDP grew at an average annual real rate of 6.1%, while Inteligo Bank’s assets under management plus deposits grew at a five-year CAGR of 24.5%.
Provide the most convenient, agile and friendly customer service experience through continuous innovation
We are committed to continuing to focus on innovation and providing the best possible and differentiated customer experience for our banking, insurance and wealth management clients. We intend to continue to
123
Table of Contents
improve the productivity of our banking distribution model, as well as our systems. We are focused on continuously improving user experience and are increasingly using our alternative channels to sell banking products, such as pre-approved loans.
Interbank aims to provide the most convenient, friendly and agile experience for its customers through a wide variety of distribution channels. To strengthen Interbank’s omni-channel offering, it will continue to invest in its digital channels. Interbank plans to continue to develop a best-in-class experience across multiple devices, including ATMs, desktop PCs, tablets and mobile phones. Interbank will continue to integrate our customer relationship management (“CRM”) and digital marketing capabilities to foster online sales of traditional and innovative products.
Even with Interbank’s extensive distribution network, we believe there is an opportunity to continue to grow physical channels in Peru because the country has one of the lowest branch and ATM penetrations as compared to the peer countries in Latin America. Interbank plans to pursue selective growth of its financial stores and use its ATM and correspondent agent networks to provide additional and more accessible points of contact to customers. In addition, Interbank will continue to improve its in-store customer experience by constantly testing new ideas and concepts through “Explora”, a full-time innovation financial store.
Interseguro markets its annuities and individual life insurance products through its own highly productive sales force to ensure its customers receive high quality financial advice and the best customer service. Interseguro’s sales agents are trained as financial advisors and are segmented according to customer needs.
Interseguro’s CRM platform further facilitates agents maintaining a close relationship with their customers. Additionally, Interseguro offers retirees additional benefits, such as complimentary health screenings and discounts on a range of products and services.
Further develop our customer-centric vision with advanced CRM and analytics
In 2012, Interbank implemented a change from its product-based strategy in order to shift to a customer-centric vision. Having reached a substantial scale in terms of number of clients, loans and deposits, Interbank decided to increase its focus on specific profitable client segments with a customer-centric approach to improve cross-selling and retention without impacting its success in acquiring new clients. We believe that Interbank has a significant opportunity to increase its cross-selling as its number of products per customer remained low at 1.7 in 2013. As a consequence of this strategic shift, Interbank enhanced its CRM and analytics capabilities and is transforming these capabilities into a competitive advantage in the Peruvian market.
Interseguro expects to continue offering personalized and sophisticated assistance to its annuities and individual life insurance customers. The success of its customer-centric strategy is demonstrated by the fact that Interseguro is the largest annuities provider in Peru even though it does not have an affiliated pension fund administrator (“AFP”), unlike some of its competitors. Interseguro also aims to continue to develop simple and convenient retail insurance products that better serve the needs of the growing Peruvian middle class.
Inteligo will continue to focus on its target customers, providing them with advisory services, supported by a local investment team that possesses extensive knowledge of its Peruvian clients’ preferences for financial products. Inteligo’s position will further benefit from having a leading brokerage operation in Peru, Inteligo SAB, and being part of one of Peru’s leading financial groups.
Leverage existing operating capacity to generate additional revenue with low additional marginal cost
We aim to achieve high levels of profitability by leveraging our existing operating capacity. Despite the growth of our platform and portfolios, our efficiency ratio, as measured under IFRS, improved from 43.5% in the year ended December 31, 2012 to 41.5% in the year ended December 31, 2013. Interbank’s focus on cost-control strategies has led to a five-year CAGR of 9.0% in its total expenses, compared to the banking system’s 11.1%,
124
Table of Contents
for the period ended December 31, 2013 according to the SBS. We believe that cost control will be increasingly important in our efforts to maintain high profitability in an increasingly competitive environment. To accomplish these goals, we have invested in information technology and the development of simpler, more manageable, secure and modern business processes and platforms.
We have made substantial investments in recent years in expanding the number of our financial stores and developing our mobile platforms. Consequently, we believe we are well-positioned to significantly expand our client base without a substantial increase in expenses. Our budget for capital expenditures for the next three years is approximately S/. 460 million, primarily at Interbank, 70% of which is related to information technology expenditures and 30% is associated with expanding the number of financial stores. Among the budgeted expenditures for information technology, a substantial portion corresponds to new and ongoing IT projects intended to improve the quality and responsiveness of internal operating processes and to continue to improve our digital capabilities, CRM, cash management platform, information systems, among others, as well as product improvements.
Actively pursue cross-selling opportunities to leverage our customer base across IFS and Intercorp Peru
We are currently pursuing cross-selling opportunities, including, primarily, the sale of insurance products to our banking clients. We intend to leverage more of our and Intercorp Peru’s retail presence to cross-sell products
across Interbank, Interseguro and Inteligo. We believe that Interbank’s current 1.9 million retail customers represent a significant opportunity to sell additional banking products and services, as well as Interseguro’s insurance products and Inteligo’s brokerage services. Additionally, we plan to capitalize on the future growth of Intercorp Peru’s retail business through its shopping malls, supermarkets, pharmacies and home improvement stores, to capture the cross-selling opportunities that those channels represent for IFS.
Continue focusing on maintaining a highly motivated team with a strong culture aligned to our strategy
We believe that a motivated workforce leads to high quality customer service, which in turn leads to satisfied customers and better results. Our commitment to fostering a motivated workforce and merit-based culture is demonstrated by being ranked among the top Peruvian and Latin American companies in all of our segments by the Great Place to Work Institute.
Interbank, Interseguro and Inteligo will continue their efforts to attract, develop and retain highly qualified personnel and to maintain a merit-based culture that emphasizes teamwork to keep a motivated workforce that delivers high quality service.
Banking Segment
Overview
Interbank provides retail and commercial banking services to over 1.9 million total customers as of December 31, 2013. It is the fourth largest bank in Peru in terms of total assets, total loans and total deposits, with market shares of 11.4%, 11.7% and 11.7%, respectively, as of December 31, 2013 and in accordance with SBS. Interbank is focused on fast-growing and highly profitable retail banking businesses, such as credit card financing, payroll loans to public employees and mortgages, as well as Peruvian corporates and medium-size companies within commercial banking.
Given this focus, 49.1% of Interbank’s gross loans as of December 31, 2013 correspond to retail banking, compared to 34.3% for the Peruvian banking system, in accordance with the SBS. Interbank is the second largest provider of consumer financing (retail loans other than mortgages), the leading player among private banks in payroll loans to public sector employees, the second largest provider of credit card financing and the third largest bank in retail deposits in Peru. As part of its strategy to serve retail banking customers, Interbank has one of the most convenient and extensive retail banking distribution networks in Peru and is currently present in 23 of Peru’s 25 regions. Interbank serves its customers through 268 financial stores, more than 2,400 ATMs throughout Peru, which is the second largest ATM network nationwide and the largest out of branch ATM network, and more than 3,200 correspondent agents.
125
Table of Contents
In the commercial banking line of business, which represents 50.9% of Interbank’s gross loans as of December 31, 2013 according to Peruvian SBS GAAP, Interbank focuses on high margin and fee generating products such as leasing, structured finance, cash management, trade finance and factoring in its commercial lending business. These products and services are attractive not only for the financial margins, but also for the fee income they generate. In addition, these products and services enhance customer loyalty and provide significant cross-selling opportunities.
The table below provides a breakdown of Interbank’s loan portfolio under IFRS.
| As of December 31, | ||||||||||||||||
| 2013 | 2012 | |||||||||||||||
| S/. in millions | % | S/. in millions | % | |||||||||||||
Retail loans | ||||||||||||||||
Credit Cards | 2,708.5 | 27.9 | % | 2,285.2 | 27.9 | % | ||||||||||
Payroll deduction loans | 2,489.0 | 25.7 | % | 2,252.8 | 27.5 | % | ||||||||||
Other consumer loans | 762.6 | 7.9 | % | 675.9 | 8.2 | % | ||||||||||
Mortgages loans | 3,742.8 | 38.6 | % | 2,985.5 | 36.4 | % | ||||||||||
Total retail gross loans | 9,703.0 | 100 | % | 8,199.4 | 100 | % | ||||||||||
Total commercial gross loans | 10,137.8 | 100 | % | 7,512.9 | 100 | % | ||||||||||
Total gross loans | 19,840.8 | 15,712.3 | ||||||||||||||
Percentage retail loans | 48.9 | % | 52.2 | % | ||||||||||||
Percentage commercial loans | 51.1 | % | 47.8 | % | ||||||||||||
For the years ended December 31, 2013 and 2012, Interbank’s net profit was S/. 615.0 million (US$220.0 million) and S/. 568.4 million, respectively. As of December 31, 2013 and 2012, Interbank had shareholders’ equity of S/. 2.8 billion (US$1.0 billion) and S/. 2.5 billion, respectively. Interbank’s ROE for the year ended December 31, 2013 and 2012 was 23.7% and 25.1%, respectively, and its ROA for the years ended December 31, 2013 and 2012 was 2.3% and 2.5%, respectively.
History
Interbank is an open-stock corporation (sociedad anónima abierta). Interbank was incorporated in Lima, Peru in 1897 and formerly conducted business under the names “Banco Internacional del Perú S.A.” and “Interbanc”. In August 1994, as part of the government’s privatization efforts, 91% of Interbank’s share capital was acquired by Corporación Interbank, which subsequently transferred its holdings in Interbank to the Rodríguez-Pastor family through Intercorp Peru, a limited liability company organized under the laws of the Commonwealth of The Bahamas that is listed on the Lima Stock Exchange. After Interbank’s acquisition by Intercorp Peru in 1994, it began conducting business under the name “Interbank” as part of a rebranding and modernization effort, and has become a leading universal bank in Peru.
Business Lines
Interbank has three business lines: (1) retail banking; (2) commercial banking and (3) treasury and institutional.

126
Table of Contents
Retail Banking
Interbank’s retail banking business line provides a variety of financial products and services to individuals including retail loans and retail deposits. Interbank’s retail banking strategy consists in providing the best customer experience through convenient, agile and friendly service. Interbank’s key objectives include increasing its market share in its core products through increasing its share of wallet and cross-selling products to its existing customers. Interbank seeks to meet the financial service needs of Peru’s growing middle class who only recently have had sufficient disposable income to become integrated into the financial system. Interbank believes the retail banking sector presents significant opportunities to continue to grow and sustain high margins, while assuming reasonable risk.
As of December 31, 2013, retail loans represented 49.1% of Interbank’s total loan portfolio outstanding as compared to 34.3% for the Peruvian banking system under Peruvian SBS GAAP. Furthermore, Interbank’s strategy also seeks to continue capturing low-cost funding through a stable and diversified deposit base.
Retail Loans
Retail loans consist of consumer and mortgage loans. Interbank classifies its consumer loans into two categories: (i) credit cards; and (ii) payroll deduction and other consumer loans.
Consumer Loans
Credit cards. Credit cards represent the largest portion of Interbank’s consumer loan portfolio in terms of outstanding loans. Interbank offers its retail customers all three major credit cards: VISA, Master Card and American Express. Interbank has an exclusivity agreement with American Express for its Centurion line of credit cards. Additionally in August 2010, Interbank entered into a co-branded agreement with América Móvil Perú S.A.C. (“CLARO”), under which Visa Interbank Claro cardholders earn CLARO points for all card purchases, including cash withdrawals and service payments, redeemable for purchasing additional mobile minutes or mobile devices. Interbank also offers other credit cards with different value propositions catering to each customer segment.
Interbank’s credit card loans had a five-year CAGR of 13.6% for the period ended December 31, 2013 and as of December 31, 2013 represented a market share of 22.6%. As of December 31, 2013, credit cards represented approximately 28.0% of Interbank’s retail loan portfolio as compared to approximately 20.6% for the Peruvian banking system, and its past-due-loan ratio in credit cards stood at 4.1%, the lowest among the largest four banks in Peru. Interbank’s lower past-due-loan ratio results from its strategy of targeting customers through enhanced and proprietary credit scores and offering differentiated pricing based on each customer’s risk profile through improved credit scoring and origination models.
Payroll deduction and other consumer loans. Payroll deduction loans to public sector employees represent the second largest portion of Interbank’s consumer loans, after credit cards. Interbank ranks first among private banks in Peru in terms of payroll deduction loans to public sector employees, with a market share of 24.6% as of December 31, 2013. In addition to payroll deduction loans, Interbank offers other loans to individuals, including auto loans and unsecured personal loans.
Interbank also offers payroll deduction loans for public sector employees who maintainCuenta Sueldo, or payroll accounts, at Interbank. The risk of default under payroll deduction loans is lower, particularly because the employer deducts the loan payments from the employee’s salary and makes payments to Interbank directly. Additionally, by law, these loans are insured by an insurance company against the death and disability of the borrower. Interseguro provides substantially all of the insurance policies for these loans although customers are free to purchase insurance from other providers.
Mortgage Loans
Interbank offers fixed rate mortgage loans with an average term of 20 years, denominated in either U.S. dollars ornuevos soles.
127
Table of Contents
Interbank’s mortgage loans outstanding grew at a five-year CAGR of 25.8% for the period ended December 31, 2013 compared to 19.8% CAGR for the Peruvian banking system over the same period. As of December 31, 2013, 65.9% of Interbank’s mortgage loans outstanding were denominated innuevos soles and the remaining 34.1% in U.S. dollars. For the year ended December 31, 2013, Interbank’s mortgage loan disbursements amounted to approximately S/. 1,032.9 million, of which 88.6% were denominated innuevos soles and the remaining 11.4% in U.S. dollars.
To promote mortgages origination, Interbank has developed a web portal,www.micasapropia.pe, which allows customers to search for properties, obtain tips and advice on buying a home, as well as simulate mortgage payments and loans and contact a mortgage specialist. For the year ended December 31, 2013, Interbank had approximately 2.8 million visitors to the website, and almost 10% of its total mortgage disbursements were originated through this website.
Interbank also provides residential construction loans to real estate developers. Although these loans are reported within the commercial banking portfolio, they are managed together with retail banking mortgages because of the synergies between the businesses. Financing real estate projects provides Interbank with an opportunity to market mortgage loans to home buyers. As of December 31, 2013, approximately 58.0% of Interbank’s new mortgages were originated from real estate developments financed by Interbank. This business unit within retail banking continues to grow at significant levels due to strong demand in the Peruvian construction sector. As of December 31, 2013, Interbank had S/. 534.6 million in loans to real estate developers outstanding, representing approximately 2.7% of its total loans.
In 2001, the Peruvian government launched theMivivienda program, a social initiative to promote the construction of low income housing, of which Interbank is an active participant. As of December 2013, theMivivienda program had successfully disbursed approximately 13,200 loans, mainly to develop multi-family buildings. TheMivivienda program provides direct funding to match each loan underwritten by banks, as well as credit risk coverage for 1/3 of any realized loss. Furthermore, the program subsidizes interest rates by rewarding the end customer with direct financial incentives if payments are kept current.
Retail Deposits
Interbank offers a wide range ofnuevo sol and U.S. dollar denominated transactional, savings and investment accounts through one of the largest distribution networks (as measured by total financial stores, ATMs and correspondent agents). These products satisfy key consumer needs and position Interbank as an attractive financial institution for retail customers. The following tables present the composition of Interbank’s retail deposits as of December 31, 2013.
| As of December 31, 2013 | ||||||||
| Number of Accounts | % | |||||||
Transactional | 1,218,773 | 68.2 | % | |||||
Savings | 240,345 | 13.4 | % | |||||
Investment | 329,183 | 18.4 | % | |||||
|
|
|
| |||||
Total | 1,788,301 | 100.0 | % | |||||
| Amount (S/. in millions) | % | |||||||
Transactional | 2,168.7 | 27.6 | % | |||||
Savings | 2,841.7 | 36.2 | % | |||||
Investment | 2,850.1 | 36.3 | % | |||||
|
|
|
| |||||
Total | 7,860.6 | 100.0 | % | |||||
128
Table of Contents
Transactional Accounts
Within retail deposits, Interbank offers transactional accounts with different interest rates, maintenance fees and options for accessing funds, such as checkbooks, debit cards and Internet access. The following table presents Interbank’s transactional accounts by amounts outstanding as of December 31, 2013.
| Amount | % | |||||||
| (S/. in millions) | ||||||||
Cuenta Ágil | 948.4 | 43.7 | % | |||||
Cuenta Sueldo | 721.0 | 33.2 | % | |||||
Cuenta Simple | 348.3 | 16.1 | % | |||||
Cuenta Corriente | 102.3 | 4.7 | % | |||||
Cuenta Móvil | 40.1 | 1.9 | % | |||||
Cuenta Auto | 8.6 | 0.4 | % | |||||
Total | 2,168.7 | 100.0 | % | |||||
Cuenta Ágil is a transactional account that permits unlimited transactions in financial stores and electronic channels and carries no monthly maintenance fee as long as the account carries a minimum average balance of either US$200 or S/. 500 is maintained on a monthly basis.
Cuenta Sueldo is a payroll account into which an employer may deposit an accountholder’s salary on a regular basis. These payroll accounts provide debit cards for employees as well as monthly interest on account balances and discounts at restaurants and retailers, among other benefits. Interbank offers these payroll account services to employers in conjunction with other commercial banking products, and also markets directly to employees.
Cuenta Simple is used by customers for their everyday banking needs and does not have a maintenance fee. Transactions are free of charge for up to a certain number of monthly transactions through physical channels. In addition, all transactions performed through online banking and other electronic devices are free of charge. This transactional account is of low cost for Interbank as most of the transactions are conducted through electronic channels. Customers are also able to receive incoming wire transfers in this account.
Cuenta Max is a transactional account used by customers who need to make frequent money wire transfers within Peru. No fees are charged in connection with these transfers. This account is no longer available to new customers but has been grandfathered for existing accountholders.
Cuenta Corriente is a checking account used primarily by small business owners and independent professionals to pay for expenses.
Savings Accounts
Interbank offers savings accounts with a variety of interest rates, maintenance charges and options for alternative access channels, such as ATM cards, Internet access and mobile access. The following table presents savings accounts by amounts outstanding as of December 31, 2013.
| Amount | % | |||||||
| (S/. in millions) | ||||||||
Cuenta Millonaria | 2,172.2 | 76.4 | % | |||||
Cuenta Ahorros | 569.3 | 20.0 | % | |||||
Ahorro Casa | 98.0 | 3.4 | % | |||||
Ahorro Techo | 2.2 | 0.1 | % | |||||
Total | 2,841.7 | 100.0 | % | |||||
129
Table of Contents
Cuenta Millonariais one of Interbank’s fastest growing savings accounts, which may be denominated innuevos soles or U.S. dollars. The Cuenta Millonaria account allows accountholders to participate in sweepstakes to win apartments and cars.
Cuentas Ahorro are savings accounts that permit unlimited transactions in electronic channels, carry no monthly maintenance fee and provide additional benefits tailored to the needs of different customer types.
Ahorro Casa allows customers to make monthly deposits to finance home purchases. Once an accountholder reaches a pre-established balance in the account and demonstrates savings and payment capacity, the accountholder is may apply for a mortgage loan with Interbank mortgage division.
Investment Accounts
Interbank offers time deposits, deposits certificates (CDs) and CTS accounts denominated innuevos soles and U.S. dollars, to customers who may or may not have a checking or savings account with Interbank. The following tables presents Interbank’s investment accounts by amounts outstanding as of December 31, 2013.
| Amount | % | |||||||
| (S/. in millions) | ||||||||
Time deposits | 1,759.5 | 61.7 | % | |||||
CTS Accounts | 1,051.3 | 36.9 | % | |||||
CDs | 39.3 | 1.4 | % | |||||
|
|
|
| |||||
Total | 2,850.1 | 100.0 | % | |||||
Interbank offers time deposits and CDs, with maturities ranging from 31 days to five years. Time deposits with maturities ranging from 31 days to 365 days may be opened with a minimum initial balance of S/. 2,000 or US$1,000, and from 365 days to 990 days, with a minimum initial balance of S/. 10,000 or US$5,000. Time deposits with maturities ranging from 4 years to 5 years, are only offered in U.S. dollars and can be opened with a minimum initial balance of US$5,000.
CTS accounts are severance accounts that employers must open for the benefit of their employees pursuant to Peruvian law. Employers must deposit into these accounts twice a year (in May and November) an amount equal to one half of an employee’s month’s salary. Employees may withdraw from their CTS account any amount exceeding the sum of such employee’s four months’ salary calculated based on the most recent monthly salary.
Commercial Banking
Interbank’s commercial banking business line primarily targets Peruvian corporates and medium-size companies. The commercial banking unit has three business units: corporate, medium-size business and small business.
Other traditional products offered to Interbank’s commercial clients include working capital loans and letters of credit. Interbank has also developed an expertise in certain industries, such as agribusiness and fishing. Interbank markets its cash management services, including payroll services, collection and account payments, to commercial clients that provide it with opportunities to cross sell retail products. As of December 31, 2013, Interbank was the fourth largest bank in terms of commercial loans outstanding, with a total commercial loan portfolio amounting to S/. 10.1 billion, representing a 9.0% market share, while its past-due-loan ratio stood at 1.0%, the lowest among the largest four banks in Peru.
Corporate Banking
Interbank’s corporate banking unit is primarily responsible for providing services to companies with annual sales exceeding S/. 100.0 million or are part of a large economic group. Interbank’s corporate banking unit provides investment banking, structured finance and other sophisticated banking products to meet the needs of its
130
Table of Contents
target clients. Furthermore, Interbank focuses on developing a relationship with each client and promoting fee-related and low-risk products, such as letters of credit, collections, transfers and foreign exchange services, tailored to meet the particular requirements of each client.
Medium-size Business Banking
Interbank’s medium-size business banking unit offers many of the same products as those of the corporate banking unit mainly to medium-size enterprises with annual sales between S/. 5.0 million and S/. 100.0 million. The unit primarily provides Interbank’s clients with working capital loans secured by accounts receivable and other products, including financing for medium and long-term investment programs. Medium-size businesses also constitute an important source of deposits.
Medium-size enterprises in Peru generally do not have access to financing through local or international capital markets or to term loans from foreign banks. Interbank expects to capitalize on the significant growth opportunities in this sector and to profit from the margins that it offers when taking into account the reasonable degree of risk involved. We believe that this sector will continue to grow along with the Peruvian economy.
Small Business Banking
Interbank’s small business banking unit serves companies with annual sales between S/. 300,000 and S/. 5.0 million. Interbank offers working capital loans, fixed asset financing, revolving lines of credit and transactional accounts to small businesses.
Interbank has invested in building an experienced team and developing a strong information technology platform, with online and automated processes to better serve these customers. The small business team works from 20 small business banking centers located in Lima and other major cities throughout Peru.
Main commercial banking products
Leasing. Interbank provides financial leasing including commercial real estate, vehicles, machinery and other goods. At the end of the term of a leasing agreement, the customer has the option to purchase the leased assets. As of December 31, 2013, Interbank’s market share was 9.7% by gross loans. Leasing products generate high margins and present lower credit risk compared to other financial products.
In recent years, the growth in Interbank’ leasing business has been driven by economic growth and related private sector investments. We expect this trend to continue in the future. Furthermore, Interbank is actively pursuing leasing and financing opportunities for machinery and equipment to grow its leasing business.
Cash management. Interbank offers products and services that strengthen its relationship with clients, build loyalty and reduce costs by using electronic channels and by increasing fee income. Services managed by this unit include collection services (automated trade bill collection), automated payments (payroll and payments to suppliers) and digital banking and cash management. Interbank earns fees from cash management services by charging its clients a fixed fee and a variable fee based on the volume and frequency of the transactions.
Trade finance. Interbank provides short-term loans for trade, funded with internal resources or with credit lines from foreign banks. In addition, the trade finance unit offers medium-term credit lines using funds granted by international commercial banks and foreign governmental institutions. The trade finance unit also earns fees by providing customers with letters of credit, international collection and foreign exchange services.
131
Table of Contents
As of December 31, 2013, Interbank had a market share of 11.1% in the trade finance business.
Interbank intends to capitalize on the growing importance of China and Brazil to Peru’s foreign trade by facilitating trade and investment with both countries. In 2007, Interbank established a Commercial Representative Office in China in order to meet the needs of Peruvian and Chinese firms wishing to access these markets. In 2012, Interbank opened a Commercial Representative Office in Brazil.
Factoring. Through its electronic factoring product, customers are able to send their invoices to Interbank on a continuous basis up to a certain credit limit and borrow against these invoices. Once the customer reaches this limit and no additional receivables are generated, the customer stops receiving advances from Interbank.
Treasury and Institutional
The main activities of Interbank’s treasury and institutional business line include treasury and institutional banking, as well as mutual funds through Interfondos S.A. and securitization services through Internacional de Titulos Sociedad Titulizadora S.A. (“Intertítulos”).
Treasury
Interbank is an active participant in the money and foreign exchange trading markets in Peru. Its money market desk plays an active role in thenuevo sol and foreign currency short-term money markets. In addition, the money market desk participates in the auction of certificates of deposit issued by the Central Reserve Bank of Peru. Interbank’s proprietary trading activities focus on foreign exchange trading and short-term investments in securities, which primarily include certificates of deposit of the Central Reserve Bank of Peru, Peruvian global bonds and sovereign debt instruments.
Institutional Banking
Interbank’s institutional banking unit serves primarily non-profit public and private organizations, international entities, educational institutions and nongovernmental organizations. As of December 31, 2013, the institutional banking unit had more than 540 clients and S/. 7.0 billion in deposits, accounting for 24.6% of Interbank’s total deposits.
The institutional banking unit is strategically important to Interbank as it provides with a stable and low-cost deposit base, as well as opportunities for fee income generation. The clients for the institutional banking unit require mainly transactional products, such as remote office banking, collection services, automated payroll payment services and investment management. Interbank’s strategy is focused on building customer loyalty with these clients by offering customized services at competitive rates and by providing high-quality customer service.
Mutual funds
Interbank provides asset management services through its wholly-owned subsidiary, Interfondos. As of December 31, 2013, Interfondos had assets under management of approximately S/. 2,445 million and was the fourth largest mutual fund manager in Peru with a 14.8% market share based on assets under management. Through Interfondos, Interbank expects to continue to benefit from the growth in the mutual fund industry. Mutual fund penetration in Peru is relatively low compared to other countries in the region. Mutual fund assets under management in Peru represented only 2.9% of GDP as of December 31, 2013 as compared to approximately 14.8% in Chile, according the SMV and the Association of Mutual Funds of Chile (Asociación de Administradoras de Fondos Mutuos de Chile).
132
Table of Contents
Securitization services
In addition, Interbank provides securitization services through its wholly-owned subsidiary, Intertitulos.
Distribution Channels
Interbank has built an omni-channel distribution network in Peru, serving over 1.9 million customers. As of December 31, 2013, Interbank had 268 financial stores and operated the second-largest ATM network in Peru with more than 2,400 ATMs, which includes the largest out-of-branch ATM network (under ourGlobal Net brand). Interbank has the largest number of financial stores inside supermarkets in Peru. Moreover, with the intention of providing underserved customers with more convenient services, Interbank operates a network of correspondent agents, called Interbank Agentes. The correspondent agents’ concept consists of providing commercial establishments with low-cost electronic terminals which allow customers to perform basic transactions. As of December 31, 2013, we had over 3,200 correspondent agents.
Financial Stores
As of December 31, 2013, Interbank had 268 financial stores, of which 175 were located throughout Lima and 93 in the rest of Peru. Interbank has the second highest number of financial stores outside of Lima among Peruvian banks covering 23 of Peru’s 25 regions. A large number of the financial stores are located in convenient, high traffic areas, such as supermarkets and shopping malls to maximize client coverage. Interbank has 71 financial stores that are open Monday through Sunday from 9:00 am to 9:00 pm.
In May 2013, Interbank introduced “Imagine” financial stores, a concept jointly developed with IDEO, a design and innovation consulting firm. “Imagine” fosters a more pleasant and inviting environment to Interbank’s customers, and is designed to educate customers on the use of electronic and Internet banking tools in order to migrate low value transactions to electronic channels, while continuing to capture new customers and exploitcross-selling opportunities. Furthermore, Interbank has a full-time financial store functioning as an innovation lab (Explora), allowing it to constantly test new ideas and concepts. These types of initiatives, among others, have allowed Interbank to receive eight awards for creativity and innovation since 1998 fromCreatividad Empresarial, a consortium comprising local journalists and scholars, which is more than any other bank in Peru.
ATMs
Interbank’s strategy is to offer its customers increased convenience by locating approximately 70% of its ATMs away from its financial stores. As of December 31, 2013, Interbank had the second largest ATM network in Peru, with more than 2,400 ATMs distributed across Peru marketed under theGlobal Net brand. Some of Interbank’s ATMs have advanced features, including the ability to receive cash and check deposits, as well as pre-approved cash loans. Interbank has 1,300 ATMs at out-of-branch locations, the largest number in Peru, while its closest competitor only has 600.
Correspondent Agents
Interbank Agenteconsists of providing commercial establishments with low-cost electronic terminals which allow customers to perform basic transactions, such as withdrawals, deposits and paying utility bills, with the intention of providing underserved customers with more convenient services. As of December 31, 2013, we had over 3,200 correspondent agents.
133
Table of Contents
Electronic Banking
Interbank offers online banking to its clients through its website,www.interbank.com.pe. As of December 31, 2013, Interbank had approximately 188,100 online banking users. During the year ended December 31, 2013, more than 2.6 million transactions were conducted online using its website.
Interbank also offers mobile banking services, which include, account balance and transaction inquiries, transfers between accounts, credit card, cell phone and loan payment options.
Security is an important factor in electronic and online banking and Interbank continues to enhance its fraud prevention and security features.
Other Channels
In-bound Call Center
Interbank offers its customers telephone banking services 24 hours a day, seven days a week. Through telephone banking, Interbank’s customers can obtain balance information, make credit card payments, transfer money between accounts and pay their utilities, insurance, tuition and cellular phone bills.
Interbank has a state-of-the-art call center, which manages an average of 640,000 calls per month, answering inquiries from clients, offering assistance and information, and selling new products to customers.
Out-bound Call Center
Interbank has a dedicated telephone sales force of 729 employees, which primarily sells credit cards and some other retail products. The dedicated sales force is a key resource for customers’ acquisition and for our cross-selling campaigns.
Information Technology Unit
Interbank continuously invests in new technology and the maintenance of its existing equipment and infrastructure in order to improve its value proposition to its customers, increase its efficiency and support business growth. The IT unit focuses on assuring 24x7 channel availability, enhancing the timeliness of data processing, guaranteeing data protection and anti-fraud security, updating and maintaining hardware platforms and software versions, developing contingency plans and implementing technology projects. Interbank’s information technology network also processes credit card, personal and commercial loans, and electronic transactions.
In order to comply with business and regulatory requirements, Interbank has strengthened its IT governance model incorporating best practices for IT quality assurance, risk evaluation, projects management and focused responsibilities for teams operating the technology and teams developing new solutions. It has also fortified its business continuity program through increased redundancy programs and upgraded hardware and software components. This model includes establishing operating partnerships with various leading word-class IT vendors.
Interbank has also made significant investments to upgrade its data centers and central technology platforms. These platforms provide a stable and secure environment for Interbank’s operations, a better understanding of cost drivers, and improve its processes. They also manage Interbank’s current commercial portfolio, allow product and services innovation and the adequate assessment of Interbank’s business lines profitability. See “Management’s Discussion and Analysis of Results of Operations and Financial Condition—Liquidity and Capital Resources—Capital Expenditures Program”.
134
Table of Contents
Interbank continues to invest in new and ongoing IT projects in order to improve the quality and responsiveness of internal operating processes and provide business solutions to improve Interbank’s CRM, cash management platform, among others.
Employees
As of December 31, 2013, Interbank had 6,886 employees, of whom 3,138 work in financial stores, 2,678 at the headquarters and in operational centers of Interbank, and 1,070 in the sales force. Interbank’s employees are not unionized, are not a party to any collective bargaining agreement and, since Interbank’s privatization in 1994, have never been involved in a strike or work stoppage.
Interbank and its subsidiaries are focused on attracting, developing and maintaining highly qualified personnel and believe that a merit-based culture that emphasizes teamwork enables them to maintain a motivated workforce that delivers high quality service. Interbank is the only Peruvian company that has been chosen by the Peruvian Great Place to Work Institute as one of the 20 best places to work in Peru for the past 12 consecutive years and one of the top 20 places to work in Latin America in the past two years. Additionally, Interbank was named one of the top 10 best places to work in Latin America among Latin American companies with greater than 1,000 employees by Latin American Great Place to Work Institute in 2013.
Facilities
Interbank owns its headquarters, the Interbank Tower, located at Av. Carlos Villarán 140, Urbanización, Santa Catalina, La Victoria, Lima 13, Peru. Although most of its financial store facilities are leased, Interbank owned 51 financial store facilities as of December 31, 2013.
Insurance Segment
Overview
Interseguro is an insurance company that caters to Peru’s growing middle class. Interseguro is focused on annuities, the fastest growing insurance market segment in Peru, which is driven by the sale of annuities to individuals reaching retirement age in the Peruvian private pension system. Interseguro was the leader in the Peruvian annuities segment for the last four years, with a 25.0% market share by premiums for the year ended December 31, 2013.
According to the SMV, for the years ended in December 31, 2013, Interseguro was the most profitable insurance company by net profit and achieved the second highest ROE, when compared to the six largest insurance companies in Peru, including Interseguro. Interseguro has also been the fastest growing insurance company in terms of premiums in the Peruvian insurance market with a five-year CAGR of 21.7% compared to the insurance industry’s 15.9% for the period ended December 31, 2013. Interseguro intends to leverage its leading position in annuities, as well as Intercorp Peru’s retail distribution capacity, to continue capturing growth opportunities in the insurance industry. In addition, Interseguro expects to continue developing new products to satisfy increasing demand for insurance products of middle class families in Peru.
History
Interseguro, a corporation(sociedad anónima), was incorporated in 1998 pursuant to an agreement between Intercorp Peru and Bankers Trust (at the time the controlling shareholder of Consorcio Nacional de Seguros S.A.A., the largest insurer in Chile). In connection with the sale of Bankers Trust to Deutsche Bank AG in 1999, Bankers Trust’s interest in Interseguro was sold to a group of Chilean investors. In 2000, Intercorp Peru acquired the portion of Interseguro it did not own from these investors. In 2001, IFC acquired a 15% equity interest in Interseguro. Prior to our corporate reorganization in 2007, IFC held 14.3% of Interseguro’s total capital. Currently, we own all of Interseguro’s outstanding equity interests, other than one share held by Intercorp Peru pursuant to Peruvian regulations.
135
Table of Contents
Interseguro’s Business Lines
Interseguro has three business lines: (1) annuities; (2) retail insurance; and (3) individual life.
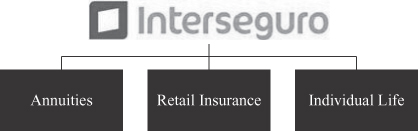
The following table presents the premiums assumed derived from each of Interseguro’s three business lines.
| For the year ended December 31, | ||||||||||||||||
| 2013 | % | 2012 | % | |||||||||||||
| (S/. in millions) | (S/. in millions) | |||||||||||||||
Product | ||||||||||||||||
Annuities(1) | 395.9 | 70.2 | % | 326.8 | 73.2 | % | ||||||||||
Retail Insurance | 139.9 | 24.8 | % | 96.1 | 21.5 | % | ||||||||||
Individual Life | 28.5 | 5.1 | % | 23.8 | 5.3 | % | ||||||||||
|
|
|
|
|
|
|
| |||||||||
Total | 564.3 | 100.0 | % | 446.6 | 100.0 | % | ||||||||||
| (1) | Includes premiums from a pension-related insurance, which Interseguro ceased to offer in 2007 and is currently in run-off. |
Annuities
An annuity is a type of insurance policy that, in exchange for an initial lump sum payment, provides regular monthly payments over the life of a policyholder. Interseguro sells all of its annuities under the Peruvian private pension system. In Peru, employees may choose to deposit their cumulative contributions in the public or the private pension system. Under the private pension system, upon retirement, a retiree has the option of converting the capital accumulated into a personal account maintained with an AFP,or into an annuity offered by an insurance company, such as Interseguro. Interseguro offers annuities in three currencies: U.S. dollars,nuevos soles indexed to CPI andnuevos soles adjusted by 2% per annum. A retiree’s joint choice of an insurance company and a currency denomination is irrevocable. In addition to retirement annuities, Interseguro also offers disability annuities to members of the Peruvian private pension system who have been declared permanently or partially disabled, and survivorship annuities for beneficiaries of deceased members of the system.
Interseguro’s annuities products include:
Retirement.The retirement annuity product is directed to members of the Peruvian private pension system who are 65 years of age or older and retiring. Retirement represented 37.6% of annuities sold by Interseguro for the year ended December 31, 2013.
Early Retirement. The early retirement product is offered to members of the Peruvian private pension system who are not yet 65 years of age, but who are permitted to have access to their Peruvian private pension system accounts if the savings in such accounts allow for a pension of at least 50% of the average last 120 months compensation. Early Retirement annuity products represented 2.5% of annuities sold by Interseguro for the year ended December 31, 2013.
Special Early Retirement. The special early retirement product is offered to members of the Peruvian private pension system who are 55 years of age or older and male, or 50 years of age or older and female, and are
136
Table of Contents
retiring and have not been contributing to Peruvian private pension system for at least 12 months. This product is more flexible than the standard early retirement annuity product. This regime governing the special retirement product will expire in 2016. Special Early Retirement accounted for 26.6% of annuities sold by Interseguro for the year ended December 31, 2013.
Disability and Survivorship. The disability and survivorship product is offered to members of the Peruvian private pension system who have been declared permanently or partially disabled and beneficiaries of deceased members of the Peruvian private pension system. Disability and Survivorship annuity products accounted for 33.4% of annuities sold by Interseguro for the year ended December 31, 2013.
Product differentiation is limited in the Peruvian annuities sector, as product features are regulated by the SBS. The market position of each insurance company is driven instead, by its sales strategy and quality of service. Interseguro’s sales strategy, consisting of providing on-going sales force training, and implementing innovative control and management mechanisms, has permitted Interseguro to be the market leader in the annuities sector over the past four years, with an increasing advantage over the second largest market participant. For the year ended December 31, 2013, Interseguro’s market share by annuity premiums was 25.0%, more than 450 basis points higher than its next competitor’s market share.
The growth of annuities is expected to further accelerate as the number of Peruvian private pension system retirees and their respective average pension balances increase. Over the ten years ended December 31, 2013, 67 thousand people have retired under the Peruvian private pension system compared to a total of 375 thousand and nearly three million expected retirees over the next ten and 30 years, respectively, according to the SBS.
Retail Insurance
Interseguro offers simple,low-cost premium products targeted to middle class families and sold mainly through Interbank financial stores, as well as channels owned by Intercorp Peru, including Intercorp Retail points of sales (Plaza Vea and Oechsle).
Interseguro offers the following retail insurance products:
Credit Life Insurance. The credit life insurance product protects against death or disability of the insured and is designed to pay the debt owed by a customer to the financial institution. This product is available for mortgages, credit cards and personal loans. Credit life insurance represented 50.4% of total retail insurance premiums sold by Interseguro for the year ended December 31, 2013.
Debit and Credit Card Protection Insurance. The debit and credit card protection insurance product protects the insured against financial loss, medical expenses for hospitalization or accidental death as a result of theft, assault and abduction. Debit and credit card protection insurance represented 16.2% of total retail insurance premiums sold by Interseguro for the year ended December 31, 2013.
SOAT (Seguro Obligatorio de Accidentes de Tránsito). The SOAT product protects against the risk of death or injury to occupants and third parties involved in an automobile accident. The SOAT product is mandatory and coverage is limited to cover personal injury, excluding any physical damage to the vehicle. The SOAT product accounted for 17.7% of total retail insurance premiums sold by Interseguro for the year ended December 31, 2013.
Others. The other products category protects against personal accidents and provides extended warranty for electronics and home appliances. Other products accounted for 15.8% of total retail insurance premiums sold by Interseguro for the year ended December 31, 2013.
Individual Life
Although the individual life insurance market remains relatively small in Peru, the market has grown at a five-year CAGR of 7.6% for the period ended December 31, 2013. Peru’s economic expansion of the middle class is expected to continue driving growth of individual life products.
137
Table of Contents
Interseguro offers a variety of individual life insurance products, providing a wide range of coverage for the length of a policyholder’s life. Most of Interseguro’s products also provide savings features.
Interseguro’s individual life insurance product portfolio is comprised of:
Universal Life Insurance. The universal life insurance product provides life insurance coverage with aflexible-premium and an adjustable benefit policy that builds cash value. The cash value can be invested in a wide range of separate accounts, similar to mutual funds. Upon death, benefits are paid to beneficiaries if the insured dies before the endowment age. Universal life insurance represented 66.5% of total individual life insurance premiums sold by Interseguro for the year ended December 31, 2013.
Whole Life Insurance. The whole life insurance product provides life insurance coverage for the life-span of an individual. Upon the death of the policyholder, or at the policy’s maturity, the policy pays a death benefit to the beneficiaries. Whole life insurance policies also have a savings component, as they build cash value over time, and thus can be used for capital accumulation. Whole life insurance represented 16.0% of total individual life insurance premiums sold by Interseguro for the year ended December 31, 2013.
Guaranteed Education. The guaranteed education product allows parents to save for their child’s education expenses. Customers’ premium payments build up a protected fund designed to cover their children’s college education. Upon disability or death of a policyholder, Interseguro assumes the policyholder’s child’s tuition payments, Guaranteed Education represented 6.9% of total individual life insurance premiums sold by Interseguro for the year ended December 31, 2013.
Others. The others product category, which includes term life and accident insurance, among others, accounted for 10.6% of total individual life insurance premiums sold by Interseguro for the year ended December 31, 2013.
Interseguro’s strategy in individual life insurance consists in adapting its products to the emerging Peruvian middle class, developing a highly-trained sales force and achieving high standards of sales efficiency. For the year ended December 31, 2013, Interseguro positioned itself as the fifth largest participant in the individual life insurance market, with a 5.3% market share by premiums.
Sales Force
Interseguro markets its annuities and individual life insurance products through its own dedicated sales force both in Lima and across Peru’s provinces.
In annuities, Interseguro employed 128 agents, 76 in Lima and 52 outside of Lima as of December 31, 2013. Each salesperson receives continuous training over amultiple-level program, which includes training in macroeconomic background, financial statement analysis, investment policy, marketing techniques and time management. In addition, Interseguro’s annuity sales agents specialize in the sale of different types of annuity products. As a result, Interseguro’s sales force is trained to satisfy each customer’s needs.
In life insurance, Interseguro employed 203 agents, 100 in Lima and 103 outside of Lima, as of December 31, 2013. In addition, Interseguro employs servicing agents with the aim of servicing existing life insurance policies. We believe that constant training develops effective sales techniques and the skills to assess customer needs, which we believe is one of Interseguro’s critical competitive advantages. Interseguro has a specialized team focused on setting a training curriculum for each sales person in the first three years with the company as well as in assigning a mentor to each new recruit.
As of December 31, 2013, Interseguro employed 37 SOAT sales agents, 27 in Lima and 10 outside of Lima. Interseguro also works with 47 brokers nationwide for the SOAT. Interseguro also works with insurance brokers to sell SOAT to increase coverage in Peru with limited capital investment. The brokerage channel accounts for approximately 45% of Interseguro’s total SOAT sales.
138
Table of Contents
Strategic Partners
Interseguro offers its retail insurance products throughnon-traditional channels, including partnerships with Interbank and Intercorp Retail.
Through its partner companies, Interseguro reaches a large number of customers, offering a convenient and reliable payment mechanism. This distribution network represents one of Interseguro’s strongest competitive advantages, as it allows for a broad insurance product offering through several points of sales.
Interseguro’s retail insurance division used the following distribution channels to sell its products as of December 31, 2013:
Strategic Partners | Point of Sales | |
Interbank | Financial Stores: 268 | |
Intercorp Retail | Plaza Vea: 63 stores Oechsle: 16 stores |
Investments and Investment Management
Investment Portfolio
Interseguro invests the insurance premiums yet to be paid out in claims, in its investment portfolio, based on a policy of capital conservation and adequate diversification.
The main objective of Interseguro’s investment portfolio is to cover its future payment obligations, associated mainly with its annuities business. Interseguro maintains a conservative asset liability management approach, matching its obligations by currency and maturity. Interseguro’s portfolio focuses on high-qualityfixed-income instruments, which provide stable and predictable cash flows, covering liabilities and mitigating interest rate risk, currency risk, inflation risk and cash flow mismatches. As of December 31, 2013, no bond acquired by Interseguro has ever defaulted or entered into an insolvency proceeding.
Given that the Peruvian market offers a limited range oflong-term investment instruments, Interseguro has sought to increase its investments outside of Peru and explore alternative investments in the local market, such as sovereign bonds and real estate projects.
As of December 31, 2013, Interseguro’s investments amounted to S/. 3,755.3 million, of which S/. 2,613.1 million, S/. 304.3 million and S/. 124.9 million were fixed income securities, equity securities and fund investments, respectively. In addition, as of that date, investments in real estate projects were S/. 713.0 million (approximately US$255.1 million).
Interseguro was the first insurance company in Peru to invest in real estate as part of its investment strategy, taking advantage of high returns in the real estate sector in Peru, to diversify its investment portfolio and to extend its investment portfolio duration to better match its liabilities. Interseguro’s returns on its investment portfolio has outperformed the Peruvian insurance industry, achieving an average return of 9.7% from 2008 to 2013, compared to the Peruvian insurance industry’s average of 7.7%, according to data published by the SMV.
139
Table of Contents
The following table presents a breakdown of Interseguro’s investment portfolio by type of investment as of December 31, 2013 and 2012.
Investments by Type
| Book Value | Book Value | |||||||||||||||
| As of December 31, 2013 | As of December 31, 2012 | |||||||||||||||
| S/. in millions | % | S/. in millions | % | |||||||||||||
Fixed Income | 2,613.1 | 69.6 | % | 2,367.5 | 68.8 | % | ||||||||||
Deposits | 73.7 | 2.0 | % | 46.2 | 1.3 | % | ||||||||||
Corporate Bonds | 1,256.4 | 33.5 | % | 1,205.0 | 35.0 | % | ||||||||||
Peruvian Sovereign Bonds | 698.6 | 18.6 | % | 556.0 | 16.2 | % | ||||||||||
Foreign Bonds | 584.4 | 15.6 | % | 560.3 | 16.3 | % | ||||||||||
Equity and Funds | 429.2 | 11.4 | % | 391.0 | 11.4 | % | ||||||||||
Equity | 304.3 | 8.1 | % | 289.5 | 8.4 | % | ||||||||||
Funds | 124.9 | 3.3 | % | 101.5 | 3.0 | % | ||||||||||
Real Estate | 713.0 | 19.0 | % | 681.2 | 19.8 | % | ||||||||||
|
|
|
|
|
|
|
| |||||||||
Total | 3,755.3 | 100.0 | % | 3,439.7 | 100.0 | % | ||||||||||
|
|
|
|
|
|
|
| |||||||||
The following chart presents a breakdown of Interseguro’s investment portfolio by currency as of December 31, 2013 and 2012.
Investments by Currency
Portfolio | As of December 31, 2013 | As of December 31, 2012 | ||||||||||||||
| (in millions) | % | (in millions) | % | |||||||||||||
Nuevo sol | 1,995.0 | 53.1 | % | 1,735.9 | 50.5 | % | ||||||||||
U.S. dollars | 1,760.3 | 46.9 | % | 1,703.8 | 49.5 | % | ||||||||||
|
|
|
|
|
|
|
| |||||||||
Total | 3,755.3 | 100.00 | % | 3,439.7 | 100.00 | % | ||||||||||
|
|
|
|
|
|
|
| |||||||||
140
Table of Contents
The following table presents a breakdown of Interseguro’s investment portfolio by rating as of December 31, 2013 and 2012.
Investments by Rating(1)
| As of December 31, | ||||||||||||||||
| 2013 | 2012 | 2013 | 2012 | |||||||||||||
| (S/. in millions) | % | |||||||||||||||
AAA | 689.6 | 618.8 | 72.8% | 72.4% | ||||||||||||
AA+ to AA- | 248.3 | 226.0 | 26.2% | 26.4% | ||||||||||||
A+ to A- | 8.9 | 10.1 | 0.9% | 1.2% | ||||||||||||
|
|
|
|
|
|
|
| |||||||||
Total Local Rating | 946.8 | 854.9 | 100.0% | 100.0% | ||||||||||||
|
|
|
|
|
|
|
| |||||||||
AAA | 0.0 | 39.3 | 0.0% | 2.7% | ||||||||||||
AA+ to AA- | 17.4 | 0.0 | 1.1% | 0.0% | ||||||||||||
A+ to A- | 62.3 | 30.0 | 3.9% | 2.0% | ||||||||||||
BBB+ | 34.1 | 54.0 | 2.1% | 3.7% | ||||||||||||
BBB | 952.7 | 791.0 | 59.8% | 53.9% | ||||||||||||
BBB- | 280.7 | 267.4 | 17.6% | 18.2% | ||||||||||||
BB+ | 11.4 | 0.0 | 0.7% | 0.0% | ||||||||||||
BB | 98.1 | 130.8 | 6.2% | 8.9% | ||||||||||||
BB- | 135.9 | 153.9 | 8.5% | 10.5% | ||||||||||||
|
|
|
|
|
|
|
| |||||||||
Total Foreign Rating | 1,592.7 | 1,466.4 | 100.0% | 100.0% | ||||||||||||
|
|
|
|
|
|
|
| |||||||||
Total | 2,539.4 | 2,321.3 | — | — | ||||||||||||
|
|
|
|
|
|
|
| |||||||||
| (1) | Includes only credit-rated fixed-income investments. |
The following table presents a breakdown of Interseguro’s investment portfolio by maturity as of December 31, 2013 and 2012.
Investments by Maturity
| As of December 31, | ||||||||
| 2013 | 2012 | |||||||
| (S/. in millions) | (S/. millions) | |||||||
Maturity | ||||||||
0-5 years | 87.4 | 120.3 | ||||||
6-10 years | 300.2 | 206.1 | ||||||
11-20 years | 986.4 | 976.4 | ||||||
21+ years | 1,239.1 | 1,024.7 | ||||||
No maturity* | 1,142.1 | 1,072.4 | ||||||
|
|
|
| |||||
Total | 3,755.3 | 3,439.7 | ||||||
| * | Real-estate and equity investments. |
Fixed-Income
Thefixed-income securities portfolio is mainly composed oflong-term fixed rate debt that are eligible instruments to cover reserves, in compliance with the requirements established by the SBS.
As of December 31, 2013, Interseguro’sfixed-income securities portfolio represented 69.6% of its total portfolio, of which 48.1% were corporate bonds, 18.6% Peruvian sovereign bonds, 22.4% foreign bonds and 2.8% deposits.
141
Table of Contents
As of December 31, 2013, 100% of bonds with local ratings and 84.6% of bonds with international ratings had investment grade status.
Equity and Funds
Substantially all of Interseguro’s equity and funds portfolio is invested in companies with low beta and relatively stable and predictable cash flows. Interseguro’s equity and funds portfolio is invested across Latin America and the United States. As of December 31, 2013, Interseguro’s equity and funds portfolio represented 11.4% of its total portfolio, of which 60.1% was invested in foreign securities and 39.9% in local securities.
Real Estate
Interseguro’s investments in real estate are made mainly in land and shopping malls. Interseguro receives advice from InRetail Properties Management and Real Plaza related to its real estate portfolio. InRetail Properties Management is specialized in securing new locations and developing shopping malls based on its proprietary consumer demand analytics and projected yield targets. Real Plaza is focused on operating shopping malls. Anchor tenants include Plaza Vea, Ripley, Oechsle and Saga Falabella, brand-name retailers such as Forever 21, Brooks Brothers, Zara, and Banana Republic, leading local fashion boutiques, restaurant chains and other entertainment and service offering chains.
Real estate income derives from the appreciation of real estate property and from rental income from its tenants. Interseguro’s rental income comes primarily from Real Plaza Centro Civico and Real Plaza Sullana shopping malls. As of December 31, 2013, Interseguro’s investments in real estate projects represented 19.0% of its total portfolio.
Investment Policy and Regulatory Framework
Regulations applicable to insurance companies established by the SBS define which types of investments are considered to be appropriate for the coverage of reserves and set minimum diversification requirements for their investment portfolios. In addition, regulations require, among others, a minimum rating for investment instruments that may be acquired by insurance companies.
Interseguro invests the amount of money collected in insurance premiums not yet paid out in claims (float), based on a policy of capital conservation and adequate diversification by continuously seeking new investment opportunities. In order to meet these objectives, Interseguro implements an annual investment plan, which sets specific targets for each type of investment. This annual plan is approved by the board of directors and presented to the local regulator at the beginning of each year. Quarterly reviews are also submitted to the regulator.
In addition, Interseguro has an investment committee that reviews its current portfolio and approves new issuers and projects. The investment committee meets monthly and is composed of four members of Interseguro’s board of directors, Interseguro’s chief executive officer and chief investment officer, and one external member. The risk management unit ensures that the investment plan is being followed.
Reinsurance
Interseguro transfers risks to reinsurers in order to limit its maximum aggregate potential loss and minimize exposures on large particular individual risks. Reinsurance is placed with reinsurance companies based on its reinsurance policy, which is annually approved by Interseguro’s board of directors and its risk committee. Interseguro’s main reinsurers for 2014 are four international reinsurance companies: Scor Global Life, Munich Re, Gen Re and Lloyd’s.
Premiums ceded to reinsurers represented 1.0% of Interseguro’s premiums assumed for the year ended December 31, 2013. The maximum amount retained by Interseguro for individual life and for credit life insurance is US$50 thousand and US$30 thousand, respectively.
142
Table of Contents
Interseguro also has catastrophe reinsurance that covers individual and group life insurance products, except annuities. These contracts are intended to limit Interseguro’s risk exposure in the event of low-probability but high-cost events, such as natural or man-made disasters.
Information Technology Unit
Interseguro’s information technology unit is responsible for managing its technology infrastructure, telecommunications network and computer systems. The unit is also responsible for designing and implementing in-house solutions or third-party technological developments to support Interseguro’s operation.
Interseguro has undertaken investments in technology with the aim of providing a stable and secure platform to support its rapidly expanding business. In 2012, Interseguro’s insurance company decided to invest in the implementation of an operations system in order to support Interseguro’s planned growth in life and retail insurance, a CRM platform, and business intelligence capabilities, among others. Interseguro has invested approximately S/. 10 million in technology for the year ended December 31, 2013. Interseguro plans to invest approximately S/. 12 million in these projects over the next three years.
Employees
As of December 31, 2013, Interseguro had a total of 558 employees, which included officers and administrative staff, as well as sales agents and representatives. Interseguro’s employees are not unionized, are not a party to any collective bargaining agreement and have never been involved in a strike or work stoppage.
Interseguro’s employees are one of its most important assets. Interseguro aims to attract the best talent and actively encourages employees to develop their careers within the company. It provides employees with better benefits than those required by labor laws, including school allowance, specialized training programs, paid leave due to death of a family member and life insurance coverage after the third month of employment. Interseguro also provideswell-being and care programs for its employees, as well as a full portfolio of development, family inclusion, and social programs.
Interseguro is the only Peruvian insurance company that has been chosen as one of the top five best places to work in Peru (medium-size category) by the Great Place to Work Institute for the past four consecutive years, including first place in 2012 and second place in 2013. Additionally, Interseguro was named one of the top five best places to work in Latin America by the Latin American Great Place to Work Institute in 2013.
Facilities
Interseguro owns its administrative office, located at Av. Pardo y Aliaga 634, San Isidro, Lima 27, Peru as well as its main commercial office, located at Av. Paseo de la República 3071, San Isidro, Lima 27, Peru. Additionally, Interseguro leases one facility in the district of Los Olivos, Lima andtwenty-five facilities in different provinces of Peru. Most of Interseguro’s facilities outside of Lima are subleased to Interbank.
Wealth Management Segment
Overview
Inteligo is a premier provider of wealth management services for Peruvian customers, serving mainly high net worth individuals. Inteligo’s understanding of its customer needs, local market knowledge, as well as its highly professional advisory process, have positioned it as a leading wealth management services firm for Peruvian clients.
143
Table of Contents
Inteligo conducts various types of banking, trust, financing, brokerage and investing activities for high net worth individuals through two operating subsidiaries, Inteligo Bank and Inteligo SAB. Inteligo Bank contributed over 99% of Inteligo’s net profit for the year ended December 31, 2013. Inteligo SAB provides sales and trading for individual and institutional clients primarily in the Peruvian capital markets.
History
Inteligo was incorporated under the laws of the Republic of Panama in 2006. Inteligo Bank is a corporation that was incorporated in 1995 in The Bahamas and formerly conducted business under the names of Interbank Overseas Ltd. and Blubank Ltd. It is licensed by the Central Bank of The Bahamas to conduct various types of banking, trust, financing, investment and financial advisory services activities. Inteligo SAB is a corporation (sociedad anónima)that started operations in 1993. It is organized under the laws of Peru, and is licensed by the SMV to operate in Peru and conduct brokerage, custody, portfolio management and advisory services.
Business Lines
Inteligo has three business lines: (1) financial advisory; (2) lending and (3) portfolio investments.

Financial Advisory
Inteligo provides financial advisory services to high net worth individuals regarding investments, including equities, fixed income, structured products, alternative investments and managed accounts. Through its team of investment analysts, Inteligo designs financial strategies to satisfy the investment objectives of each client in the Peruvian and international financial markets. Furthermore, Inteligo provides regular updates to its clients on market conditions through reports from its in-house research team.
The strength of Inteligo’s financial advisory services has contributed to the growth of its fee income as a percentage of its revenues. Inteligo’s fee income from financial services, net has grown from S/. 61.4 million in 2012 to S/. 78.5 million in 2013, representing a year over year growth of 27.8% for the year ended December 31, 2013 and 46.4% of Inteligo’s total sources of revenue.
Lending
Inteligo offers lending services to complement its wealth management business to existing clients.
Inteligo Bank’s loan portfolio had no delinquencies and was fully collateralized by its clients’ assets as of December 31, 2013. Inteligo’s loan portfolio totaled S/. 1,125.9 million as of December 31, 2013, increasing 34.5%, from S/. 837.4 million, as of December 31, 2012. Inteligo’s loan portfolio represented 41.4% of its total assets as of December 31, 2013.
144
Table of Contents
Portfolio Investments
Inteligo manages a proprietary portfolio primarily composed ofmedium-term investments infixed-income securities. Inteligo’s investment team uses third-party funds as well as individual fixed income and equity securities. For the year ended December 31, 2012, revenues from Inteligo’s proprietary portfolio represented 26.7% of total revenue compared to 17.0% for the year ended December 31, 2013.
Inteligo’s investment portfolio as of December 31, 2013 totaled S/. 901.0 million, a decrease of 16.9%, from S/. 1,084.0 million as of December 31, 2012. In addition, Inteligo’s investment portfolio represented 33.1% and 48.3% of its assets as of December 31, 2013 and 2012, respectively.
The following table shows the composition of Inteligo’s portfolio by investment type as of December 31, 2013 and 2012.
Investments by Type
| As of December 31, | ||||||||
| 2013 | 2012 | |||||||
| (S/. in millions) | (S/. in millions) | |||||||
Investment | ||||||||
Fixed-income | 380.1 | 707.7 | ||||||
Equity | 103.0 | 104.5 | ||||||
Alternative investments | 217.9 | 272.2 | ||||||
Total | 901.0 | 1,084.4 | ||||||
The following table presents a breakdown of Inteligo’s investment portfolio by maturity as of December 31, 2013 and 2012.
Investments by Maturity
| As of December 31, | ||||||||
| 2013 | 2012 | |||||||
| (S/. in millions) | (S/. in millions) | |||||||
Maturity | ||||||||
0-5 years | 175.4 | 246.5 | ||||||
6-10 years | 249.0 | 262.2 | ||||||
11-20 years | 11.6 | 70.3 | ||||||
21+ years | 59.3 | 97.2 | ||||||
No maturity* | 405.8 | 408.2 | ||||||
Total | 901.0 | 1,084.4 | ||||||
| * | Mutual Funds, equity and private equity investments. |
Inteligo’s successful strategy is reflected by the strong growth of Inteligo Bank’s assets under management plus deposits which had a five-year CAGR of 24.5% for the period ended December 31, 2013 surpassing Peru’s GDP growth. Inteligo’s assets under management plus deposits grew at approximately 2.9x Peru’s GDP growth rate from December 31, 2008 to December 31, 2013.
145
Table of Contents
The following chart shows Inteligo Bank’s assets under management plus deposits and the GDP growth multiplier for the periods indicated.
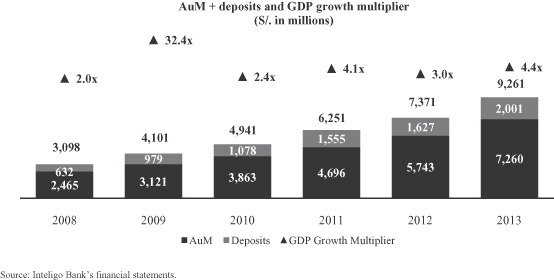
Inteligo Bank’s net profit grew at a five-year CAGR of 44.0% for the period ended December 31, 2013, supported by strong fees on assets under management, which stood at 1.08% in 2013.
From the year ended December 31, 2008, Inteligo Bank has consistently grown its assets under management plus deposits at rates surpassing Peru’s GDP growth. Inteligo’s assets under management plus deposits grew at approximately 2.9x Peru’s GDP growth rate from December 31, 2008 to December 31, 2013.
The following table shows Inteligo Bank’s net profit for the period ended December 31, 2013.
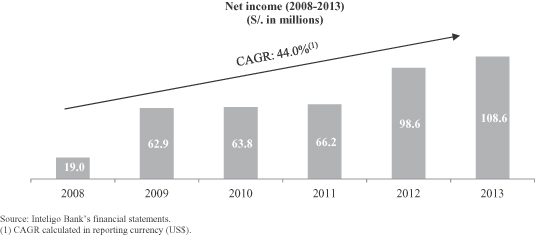
146
Table of Contents
The following table shows Inteligo Bank’s five-year CAGR in revenues contribution from net interest margin and fee income for the period ended December 31, 2013.
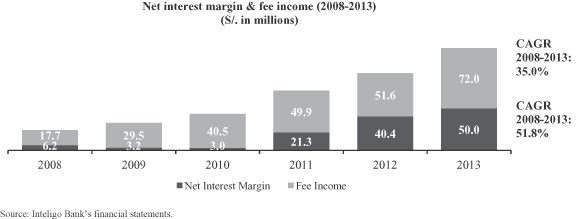
Market Segmentation
Inteligo Bank primarily focuses on individuals with investable assets in the range of between US$0.5 million and US$10 million, where Inteligo believes there is higher growth potential. As of December 31, 2013, Inteligo Bank had approximately 3,000 clients.
Inteligo’s strategy consists in establishinglong-term relationships with its broad and profitable client base, segmenting its customers effectively and proactively providing financial advisory services. Inteligo’s committed advisory service, supported by a local investment team that possesses extensive knowledge of its Peruvian clients’ preferences for financial products, and delivered through an experienced group of relationship managers is a key pillar of Inteligo’s success. Inteligo’s position further benefits from its leading brokerage operation in Peru through Inteligo SAB, and from being part of one of Peru’s leading economic groups.
Financial Advisory Team
Inteligo serves its customers through its own team of financial advisors of approximately 40 members. Through its relationship managers, Inteligo establishes strong client relationships which result in a loyal and growing customer base. Inteligo’s experienced relationship managers team has acquired specialized product knowledge and deep understanding of its customers’ needs.
Information Technology Unit
Inteligo’s information technology unit is responsible for managing its network infrastructure, telecommunications and computer systems. The unit is also responsible for developing and evaluatingin-house technologies andthird-party software solutions.
Inteligo Bank is in the final stages of implementing a new core system to support its rapidly expanding operations. As of December 31, 2013, Inteligo Bank has invested S/. 15.9 million in the development of this technology platform, which will allow it to leverage its existing CRM platform and develop stronger business intelligence capabilities.
Employees
As of December 31, 2013, Inteligo and its subsidiaries had a total of 196 employees, which included officers and administrative staff, as well as commercial representatives. Inteligo’s senior management is located in Peru. Inteligo’s and its subsidiaries’ employees are not unionized, are not a party to any collective bargaining agreement and have never been involved in a strike or work stoppage.
147
Table of Contents
Inteligo is committed to maintaining low employee rotation and a high level of employee satisfaction. Inteligo SAB first participated in the Great Place to Work Institute survey in 2011, and has since then been ranked among the top ten companies in its category (companies with 30 to 250 employees) in Peru.
Facilities
Inteligo leases all the facilities where it operates and had four offices as of December 31, 2013. Inteligo Bank’s registered headquarters are located at Inteligo Bank—Seventeen Shop Building, First Floor, Collins Avenue & Fourth Terrace, Centreville, Nassau, The Bahamas.
Legal Proceedings
We are not involved in any legal or arbitration proceedings, which could have a material adverse effect on our financial position.
Interbank is involved in a number of legal proceedings in the ordinary course of its banking segment. Interbank is also a party to a number of legal proceedings related to labor disputes with former employees.
Interseguro is routinely involved in legal or arbitration proceedings with respect to liabilities that are the subject of policy claims. These liabilities are taken into account in setting Interseguro’s technical reserves.
Inteligo is involved in legal proceedings in the ordinary course of its banking operations. Inteligo has been named as a defendant in the following litigation matters involving the Bernie Madoff cases, with each of the claims below involving approximately US$11 million:
| • | Fairfield Case (Madoff Liquidator) filed September 2, 2010; and |
| • | Irving Picard (Madoff Trustee) filed October 6, 2011. |
This litigation involves the request for return of certain redemption payments received by Inteligo as a result of an agreement with Madoff liquidator and trustee by which all funds collected are to be distributed in a proportion of 40% to the liquidator and 60% to the trustee. Inteligo’s redemption payments were less than its subscription payments.
Anti-Money Laundering Policies
Anti-Money Laundering
Peru has long-standing laws criminalizing money laundering activities, and such laws were further strengthened in 1996 with the adoption of the Peruvian Banking and Insurance Law, which incorporated the guidelines of the Organization of American States directly into Peruvian law, and Law No. 28306, which revised functions assigned to the Financial Intelligence Unit (Unidad de Inteligencia Financiera, or “UIF”), a public entity responsible for directing anti-money laundering actions and monitoring information that public and private companies are required to provide, which is part of the SBS. The UIF has the authority to request detailed reports with respect to the movement of funds and the identity of depositors. In accordance with certain regulations, mainly Law No. 28306 and SBS Resolution No. 838-2008, companies must have a system aimed to ensure and prevent products and/or services offered to public from being used for illegal purposes related to money laundering and/or terrorist financing, subject to warnings, fines, withdrawal of operating license and even imprisonment.
We have developed anAnti-Money Laundering program complying with the applicable rules and regulations, the Financial Action Task Force (FATF) recommendations and resolutions issued by the UN.
148
Table of Contents
This program is focused mainly on the following:
| • | Allowing the detection of unusual transactions and prevention or timely detection of suspicious transactions or any such attempted transactions, in order to inform the Financial Intelligence Unit within relevant legal deadlines. |
| • | Developing training programs in order to educate employees about the standards in effect for the prevention of money laundering and terrorist financing. |
| • | The commitment of all directors, executives, employees and any authorized representatives to the implementation of a code of conduct approved by the board of directors. |
| • | Requiring relevant information from individuals and/or companies and verifying any information obtained by visits to the homes or offices of such individuals and/or companies, by conducting personal interviews. |
| • | Identifying and registering clients that in the course of the business relationship that show a transactional pattern that does not match such client’s business profile. |
| • | Reporting to the UIF any operations that have occurred or that have been attempted to occur, and which in our judgment are suspicious, regardless of the amounts involved, within a period not exceeding thirty calendar days after any such operation has been identified. |
Corporate Compliance System
The Corporate Compliance System consists of policies and procedures to properly manage compliance with applicable local and international laws. In order to ensure proper compliance with any new and changing laws and regulations, our efforts focus on the identification of any new or changed requirements and the establishment of internal deadlines for the implementation of any compliance measure in a timely manner.
In addition, the Corporate Compliance System has arisk-based approach, which focuses on reducing the level of exposure to fines or other penalties that could negatively impact our reputation.
The Corporate Compliance System includes the Anti-Money Laundering program and other compliance programs, such as:
| • | Protection of Personal Information |
| • | Safety and Security at Work |
| • | Regulatory Compliance |
| • | Foreign Corrupt Practices Act (FCPA) |
| • | Foreign Account Tax Compliance Act (FATCA) |
| • | Dodd Frank Act |
The Corporate Compliance System provides specialized courses and virtual training for employees and is permanently monitored by regulators and internal and external auditors.
149
Table of Contents
Our goal is to attain sustainable long term growth, through a balance between risk policies and profitability. As a result, our senior management places great emphasis on risk management.
In order to manage the risks described below, IFS has a specialized risk management structure, measurement systems and mitigation and remediation processes in place for each of its business segments. We incorporate analytics into our decision-making process and make use of tools and methodologies that allow us to identify and manage risk efficiently.
Organizational Management Structure
Board of Directors
The board of directors at each of our subsidiaries (Interbank, Interseguro and Inteligo) is responsible for establishing an appropriate and integrated risk management system and for promoting an internal environment that facilitates the board of directors’ supervision and risk management control. The board of directors is continuously informed about the degree of exposure of the diverse risks managed by each subsidiary and inherent to their businesses.
The boards of directors of Interbank, Interseguro and Inteligo have created several specialized committees to which they have delegated specific tasks in order to enhance risk management and internal control. We list below the main committees established by the boards of directors of our subsidiaries.
Integral Risk Management Committee and Risk Committee
The Integral Risk Management Committee is a corporate body created by resolution of the board of directors. It is responsible for approving the policies and organization of the comprehensive risk management system, as well as any amendments to said policies. The Integral Risk Management Committee defines the risk appetite and level of tolerance that each subsidiary is willing to take in its business and the actions needed to implement the required corrective measures necessary to maintain adequate levels of risk tolerance.
At Interbank, the Integral Risk Management Committee is comprised of two members of the board of directors, the Chief Executive Officer, all Vice-Presidents and the General Counsel. The Committee reports monthly to the board of directors the main issues it has discussed and the agreements adopted in the previous meeting.
In the case of Inteligo, the Integral Risk Management Committee is comprised of five members of the board of directors, the Chief Executive Officer and the Risk Officer. The Committee reports quarterly to the board of directors the main issues it has discussed and the agreements adopted in the previous meeting.
Instead of an Integral Risk Management Committee, Interseguro has a Risk Committee, which is a corporate body created by board of directors resolution responsible for defining risk limits for Interseguro’s business, approving risk policies and approving required corrective measures necessary to maintain adequate levels of risk tolerance. The Risk Committee is comprised of three board members and the Chief Executive Officer.
Audit Committee
The Audit Committee is a corporate body created by the board of directors. Its main purpose is to verify the adequacy of the processes of accounting and financial reporting in place at each subsidiary, as well as to evaluate the activities performed by internal and external auditors. The Audit Committee is comprised of three board members in each subsidiary and allows for participation by the Chief Executive Officer, the Internal Auditor, the General Counsel and other executives, when required. The Audit Committee reports monthly to the board of directors the main issues it has discussed and the agreements adopted in the previous meeting.
150
Table of Contents
Assets and Liabilities Committee
The Assets and Liabilities Committee (“ALCO”) is a corporate body created by resolution of the board of directors of Interbank and Inteligo.
At Interbank, ALCO’s main purpose is to manage the structure of Interbank’s financial position considering its profitability and risk targets. ALCO is also responsible for the proposition of new products or operations that contain components of market risk. Additionally, it is the communication channel with the units that generate market risks. ALCO meets monthly and is comprised of the Chief Executive Officer, the Vice Presidents of Risks, Commercial, Finance and Capital Markets, the Manager of Market Risks and the Deputy Manager of Treasury/Position Desk.
Inteligo holds positions that are not actively traded, but are part of its assets and liabilities. These positions include a loan portfolio, customer deposits and bank loans. These positions are also exposed to interest rate risk, exchange rate risk and liquidity risk. The main purpose of ALCO at Inteligo is to manage its financial position, considering its profitability and risk targets. ALCO is also responsible for the approval of new investment products. ALCO meets quarterly and is comprised of five board members, the Chief Executive Officer and the Risk Officer.
Investment Committee
Instead of an ALCO, Interseguro has an Investment Committee. The Investment Committee is responsible for approving the limits of each security or real estate which could be included in Interseguro’s investment portfolio. This Committee is comprised of several members of the board, the Chief Executive Officer and the Vice President of Investments. The RMU Manager also participates as an advisor.
Internal Audit
The Internal Audit Division reports to the board of directors at each subsidiary. It supports the company in meeting its objectives through the application of a systemic and disciplined approach to assess and enhance the efficiency of its governance processes, risk management and control processes.
Banking Segment
Main Types of Risks
The main types of risk inherent in Interbank’s businesses are credit, market, foreign exchange, liquidity and operational risk.
| • | Credit risk: probability of loss due to inability or lack of willingness to pay by debtors, counterparts or third parties bound by contractual obligations. |
| • | Market risk: probability of loss in positions on and off-balance sheets derived from variations in market conditions. It generally includes the following risk types: exchange rate, fair value by interest rate type and price, among others. |
| • | Foreign exchange risk: probability of loss due to exchange rate movements. |
| • | Liquidity risk: potential inability to meet contractual and contingent obligations, both on- or off-balance sheet, as they come due. |
| • | Operational risk: probability of loss due to inadequate processes, personnel and information technology failures, or external events. |
In order to manage the above risks, Interbank has a specialized risk management structure, measurement systems and mitigation and remediation processes. It uses different models and rating tools at the client or product level to manage risks. These tools measure and value the risk with a prospective vision, thus allowing for making better risk decisions in the different stages or life cycle of each loan.
151
Table of Contents
These tools are continuously monitored and periodically validated to ensure that appropriate levels of prediction and performance are being maintained and to take corrective action or make adjustments to the models when needed.
The risk management indicators are continuously reviewed and assessed to identify possible deviations in risk profile with respect to the stipulated risk appetite and apply timely corrective actions as needed. This information is submitted to the Integral Risk Management Committee monthly and to the board of directors periodically.
Credit Risk
The main risk Interbank must manage is credit risk. In order to mitigate exposure to credit risk and provide adequate risk coverage, Interbank has established the following measures, among others:
| • | policies, procedures, methodologies, models and parameters to identify, measure, control and report credit risk. |
| • | review and assessment of credit risk through specialized units of risk screening, which are independent from Interbank’s Commercial Division, and which assess credit risk prior to loan approvals or prior to the acquisition of specific investments. |
| • | timely monitoring and tracking of credit risk and maintenance of pre-defined tolerance levels. |
| • | compliance with regulatory limits and establishment of internal limits to minimize exposure to debtors and counterparties, such as those related to sector concentration (for loans), by issuer, credit rating and liquidity. |
| • | procedures for the management of loan guarantees. |
Additionally, as part of the integral risk management system, in certain circumstances Interbank uses derivative financial instruments to mitigate the risk exposure which arises from the variations in interest rates and exchange rates.
Interbank also uses different models and rating tools for each type of client and/or product. Interbank constantly monitors and reviews these tools to ensure that adequate levels of prediction and performance are maintained and if necessary, to make adjustments or take corrective measures.
Through its policies and procedures, Interbank establishes the patterns and mechanisms needed to prevent excessive risk concentration and maintain a diversified portfolio.
Interbank manages its credit risk by means of three main processes: underwriting, monitoring and recovery. These processes are applied accordingly in different business lines.
152
Table of Contents
Commercial Banking
The following table presents the approval levels required for commercial loan applications by principal amount in U.S. dollars.
Approval requirement | Amount | Executive required to be | Minimum | |||
| Interbank Related companies credit committee | Any transaction with related companies | Director | 3 | |||
| Director credit committee | More than US$30,000,000 | Director and CEO | 3 | |||
| Central credit committee | Up to US$30,000,000 | CEO and VP for Risk Management | 3 | |||
| Executive credit committee | Up to US$15,000,000 | VP for Risk Management | 3 | |||
| Central services credit committee | Up to US$7,000,000 | Risk Admissions Manager | 2 | |||
| Risk credit committee I | Up to US$4,000,000 | Risk Admissions Executive | 2 | |||
| Risk credit committee II | Up to US$1,000,000 | Risk Admissions Executive | 2 | |||
| Commercial credit committee I | Up to US$150,000 | Commercial Manager | 2 | |||
| Commercial credit committee II | Up to US$100,000 | Commercial Executive | 2 | |||
| Commercial credit committee III | Transaction or credit line with 100% in cash collaterals/standby letters of credit; up to US$1,500,000 (up to $5,000,000 Risk representative); | Commercial Executive | 2 | |||
| Leasing committee I | Up to US$1,500,000 | Risk Admission Executive | 2 | |||
| Leasing committee II | Up to US$350,000 Up to US$60,000 | Leasing Manager Leasing Executive | 2 |
Credit approval is determined by the applicant’s repayment ability, which is defined primarily by its cash flow and credit history. The decision whether or not to approve an extension of credit takes into account the applicant’s economic environment, its ability to meet its obligations, collateral, management and the credit ratings assigned to the applicant by other companies of the financial system.
In order to rate credit risk within the commercial portfolio, Interbank uses a credit risk management system, the Statistical Rating System. This system measures credit risk by classifying companies based on their expected default probability, without taking into account the facility’s amount, loan conditions or collateral. The Statistical Rating System is supported by a statistical model that predicts default probability from historical default data, based on the company’s qualitative information, financial performance and internal and external credit behavior. Currently, the system is designed to rate companies from our commercial banking business line with at least S/. 5.0 million in annual sales.
For listed companies, real estate developers, financial institutions, insurance companies or government entities, Interbank uses the Weighted Rating System. This methodology considers six different areas: (1) product, demand and industry; (2) shareholders and management; (3) access to credit; (4) profitability; (5) generation of resources, and (6) solvency. The final rating will be the weighted sum of these areas.
The Watchlist System monitors clients that have risk potential that needs to be addressed. Based on internal and external alerts, historical financial data and client behavior and market conditions, clients are classified into one of four categories: (1) surveillance, (2) guarantee (increase collateral), (3) reduce exposure and (4) exit or collect.
The Non-Performing Assets Monitoring System monitors the status of non-performing loans and defines categories and related strategies. This system allows Interbank to focus recovery efforts on those loans which
153
Table of Contents
do not have a well-defined recovery strategy and also permits periodic evaluations of outstanding loans that already have a recovery plan in order to take timely corrective action. The recovery portfolio is divided into refinanced credit, judicial recoveries and restructured credit.
Credit risk management includes strategies related to proper recovery of defaulted loans. Depending on whether the recovery strategy is based upon the client’s cash flow or collateral foreclosure, loans are assigned to the recovery division. This division has two units, special credit and judicial recovery. Judicial recovery may include the sale of recovered or foreclosed assets, which are managed by the asset sales unit that is in charge of selling these assets.
Small Business Banking
The following table presents the approval levels required for small business banking loan applications by principal amount in U.S. dollars.
Approval levels | Amount | |
| Vice President of Risk Management | Over US$380,000 | |
| Risk Manager | Up to US$380,000 | |
| Risk Assistant manager | Up to US$225,000 | |
| Credit Chief Zone | Up to US$130,000 | |
| Master Credit Analyst | Up to US$75,000 | |
| Senior Credit Analyst | Up to US$45,000 | |
| Credit Analyst | Up to US$18,000 |
In small business banking, credit approval is determined by the applicant’s repayment ability, which is in turn determined primarily by the applicant’s cash flow and credit history. Approvals of loans depend on the applicant’s economic conditions, its ability to meet its obligations, collateral, management and the credit ratings assigned by a scoring system applied to new and current clients.
An independent unit is responsible for ensuring proper compliance with risk policies, the methodologies applied in the evaluation of creditors and the performance of scoring models and ensuring that the quality of the portfolio does not exceed risk limits. These functions are based on the analysis of development trends and evolutions in the portfolio through monitoring and controlling risk and early detection of any situation that may increase the risk of the customer base of small size-companies.
Interbank has developed specific risk management tools to respond efficiently to new schemes and constraints that arise in the market for small business banking. Interbank refers to these tools as the Small Business Banking Management and Monitoring Process, which consist of:
| • | Scoring Small Banking Enterprises: is an analysis tool in the credit evaluation process aimed at reducing risk rates and process times and assigning a score to the credit proposal evaluated. |
| • | Indebted Customers Methodology Small Business Banking: identifies customers who have high leverage exposure. |
| • | Special Surveillance Portfolio: monitors the customer’s credit historical behavior using a series of variables that identify, measure and separate the portfolio, determining the customer’s level of risk, while suggesting actions to take, preventive measures and/or commercial incentives. |
| • | Field Audit and Monitoring: is used to assess quality by selecting samples of credit loans granted and poor performing portfolios and reviewing supporting documentation, with a final risk report presentation. |
During collection of early stage (1-90 days) due loans in small banking, Interbank uses collection scores that allow Interbank to define the collection strategy: phone collection, text message collection, mail or personal collection.
154
Table of Contents
Recovery in small business banking occurs in two phases. Early collection is based on and supported by commercial executives for the first 90 days. During this time, a customer in default is contacted and recovery efforts are made in the form of letters, telephone calls and direct negotiations. The recovery process is also supported by admission risk officers. After the first 90 days, the defaulted loan is transferred to the Recovery Unit.
Retail Banking
The following table presents the approval levels required for retail loan applications by principal amount in U.S. dollars. Approval levels also vary according to product.
Approval levels | Amount | |
| Executive Committee | Over US$1,000,000 | |
| Vice President of Risk Management | Up to US$1,000,000 | |
| Risk Manager | Up to US$500,000 | |
| Assistant Risk Manager | Up to US$350,000 | |
| Head Credit Officer | Up to US$200,000 | |
| Senior Credit Analyst | Up to US$100,000 | |
| Credit Analyst | Up to US$70,000 | |
| Junior Credit Analyst | Up to US$50,000 |
The approval process in retail banking is supported by world class tools, a workflow that includes a parameterized decision making system, including risk policies and limits, as well as statistical models for all main retail banking products: credit cards, payroll loans, mortgages and consumer loans.
In retail banking, credit approval is determined by the applicant’s repayment ability and credit history based on the applicant’s monthly net profit and risk profile. An independent unit is responsible for monitoring the performance of the customer’s portfolio, identifying and controlling risk across the customer’s life cycle, keeping track of the performance of credit policies at originations and behavior in customer management and collections. For this purpose, Interbank uses data mining and cluster analysis, stress testing for likelihood of defaults, vintage and roll rate analysis and credit risk scoring.
During collection of early stage (1-90 days) due loans in retail banking, Interbank uses collection scores that allow it to choose the appropriate collection strategy: phone collection, text message collection, mail or personal collection.
Unpaid debts with a 90 day stay are deemed defaulted loans. Depending on whether the recovery strategy is based on the client’s cash flow or collateral foreclosure, loans are assigned to Interbank’s recovery division. The recovery division has two units, pre-judicial and judicial stage of recovery. During the judicial stage of recovery, accounts are assigned to recovery attorneys. Recovery may include the sale of foreclosed assets.
Defaulted loans that are 100% accounted for under loan loss reserves are written-off and managed through external judicial recovery.
Collections and recoveries are undertaken through advanced collection systems from world class suppliers and predictive dialers. The recovery portfolio is segmented into various groups that are divided according to the specific phase of the recovery process. Collections and recovery efforts are made by letters, SMS text messages, IVR (Interactive Voice Response), telephone and personal contact with the customer.
Market Risk
Market risk is the probability of loss due to variations in financial market conditions. The main variations to which Interbank is exposed are: exchange rates, interest rates and prices. Said variations can affect the value of financial assets and liabilities.
155
Table of Contents
Interbank separates exposures to market risk into two blocks: (i) trading book, which comprises positions in liquid investments, and (ii) banking book, which comprises banking assets and liabilities inherent to the intermediation business whose market risk exposure stems from the changes in the portfolio’s structural positions.
Trading Book
In order to control and monitor the risks arising from the volatility of risk factors, Interbank has established maximum exposure limits by currency, investment type, Value-at-Risk (VaR) and tolerance to expected maximum loss (Stop Loss), which are monitored on a daily basis. Likewise, reports from the Integral Risk Management Committee and ALCO are submitted regularly to Interbank’s board of directors.
The validity of VaR calculation is proven through a back-testing proof, which uses historical data to ensure that the model adequately estimates potential losses. Additionally, it calculates risk factor sensitivity, which shows potential portfolio losses resulting from interest rate shocks, exchange rate shocks and price shocks, among others.
Banking Book
Interbank also holds positions that are not actively traded. These positions include all loan placements and funds raised through Interbank’s intermediation business, as well as certain investments that are not deemed trading.
Interest Rate Risk
Interest rates continuously fluctuate on the market. These fluctuations affect Interbank in two ways: first, through the change in the valuation of assets and liabilities; and second, though cash flows at repricing. The variation in the valuation of assets and liabilities is increasingly sensitive as the term at which the asset or liability repricing increases. This process consists of the assessment of the repricing periods. On the other side, cash flows are affected when the instruments reach maturity, given that they are invested or placed at the new market interest rates.
The interest rate risk tracking is reported to the Integral Risk Management Committee, as well as the ALCO. The Integral Risk Management Committee approves the various limits applicable to the management of financial instruments. The tracking process is performed by the Division of Market Risk.
Repricing gap
An analysis of repricing gaps is performed in order to determine the impact of interest rate movements on the valuation of assets and liabilities into different time gaps.
156
Table of Contents
The following table summarizes Interbank’s exposure to interest rate risks. Financial instruments are presented at book value, classified by the period of the contract’s interest rate repricing or maturity date, whichever occurs first:
| Repricing Gap at December 31, 2013 | ||||||||||||||||||||||||||||||||
| 1 - Month | 1-3 Months | 3 Months – 1 Years | 1 Year - 3 Years | 3 Year - 5 Years | Over 5 years | Past-due loans / Equities | Banking | |||||||||||||||||||||||||
| (S/. in millions) | ||||||||||||||||||||||||||||||||
Assets | ||||||||||||||||||||||||||||||||
Cash due from banks(1) | 5,357 | — | — | — | — | — | — | 5,357 | ||||||||||||||||||||||||
Trading securities | 53 | — | — | — | — | — | 2 | 54 | ||||||||||||||||||||||||
Investments available-for-sale, net | 79 | 119 | 649 | 6 | 7 | 760 | 292 | 1,911 | ||||||||||||||||||||||||
Loans, net of unearned income | 2,475 | 2,376 | 4,184 | 4,580 | 2,572 | 3,503 | 344 | 20,034 | ||||||||||||||||||||||||
|
|
|
|
|
|
|
|
|
|
|
|
|
|
|
| |||||||||||||||||
Total | 7,985 | 2,495 | 4,833 | 4,586 | 2,578 | 4,241 | 638 | 27,357 | ||||||||||||||||||||||||
|
|
|
|
|
|
|
|
|
|
|
|
|
|
|
| |||||||||||||||||
Liabilities(1) | ||||||||||||||||||||||||||||||||
Bonds, notes and other obligations | 136 | — | 38 | 0 | — | 2,895 | — | 3,069 | ||||||||||||||||||||||||
|
|
|
|
|
|
|
|
|
|
|
|
|
|
|
| |||||||||||||||||
Total | 8,675 | 1,845 | 2,649 | 5,173 | 174 | 3,734 | — | 22,249 | ||||||||||||||||||||||||
|
|
|
|
|
|
|
|
|
|
|
|
|
|
|
| |||||||||||||||||
| (1) | Includes inter-bank funds. |
Foreign Exchange Risk
Foreign exchange rate risk is the risk due to exchange rates movements. Management sets limits on exposure levels by currency, and monitors them on a daily basis. Transactions in foreign currency are accounted for by using exchange rates prevailing on the market.
Interbank manages exchange rate risk by matching its assets and liabilities, overseeing the global exchange position on a daily basis. Interbank’s global foreign exchange position is equivalent to the result of long positions minus short positions in currencies different from thenuevo sol. The global foreign exchange position includes spot positions and derivative positions.
Liquidity Risk
Interbank’s liquidity risk arises from the potential inability to comply with financial obligations. This risk may arise as a result of diverse events such as the unexpected loss of funding sources or the inability to rapidly settle assets, among others.
Interbank takes short-term deposits and transforms them into longer-term loans, which also increases its exposure to liquidity risk. Interbank keeps a set of deposits that historically represent a stable funding source.
Interbank’s liquidity is managed by the Vice President of Capital Markets, which leads ALCO. Liquidity risk is overseen by the Integral Risk Management Committee, which defines the risk level that Interbank is willing to take and reviews the corresponding indicators, limits and controls.
Interbank has a set of indicators that establish minimum short-term liquidity and reflect several risk aspects, such as concentration, stability, position by currency, main depositors, etc. The Market Risk Division is responsible for tracking such indicators.
157
Table of Contents
Interbank also assesses medium-term and long-term liquidity through a structural analysis of its funds inflows and outflows on diverse maturity terms. This process allows it to identify, for each currency, the funding sources, how liquidity needs increase and which terms are mismatched. For both assets and liabilities, Interbank makes assumptions for operations without specific maturity dates, including revolving loans and savings. These assumptions also include the estimated obligations arising from contingent liabilities such as guarantee letters or non-used credit lines. On the basis of this information, necessary actions are taken to maintain the target liquidity levels.
Operational Risk
Interbank has launched several initiatives to strengthen its risk culture, adopt international best practices in risk management and lay the groundwork for adapting the New Capital Accord (Basel II) standard.
Interbank manages operational risk through a specialized unit that is guided by banking best-practices, including Basel II policies. The objectives of the operational risk unit are to:
| • | reduce operational losses by identifying potential process risks; |
| • | identify operational risk in the development of new products; and |
| • | manage control risk andself-assess critical processes; |
| • | monitor and measure operational risk. |
Interbank’s methodology is based on three tools for identifying and measuring risks that calculate the exposure level t risk and facilitate the decision-making process to mitigate exposures within certain limits of risk tolerance: (i) risks and controls self-assessment, (ii) collection of loss event and (iii) risk indicators.
Insurance Segment
Interseguro has the following risk management objectives:
| • | protect shareholder value by monitoring that exposure to probable losses does not exceed approved limits. |
| • | support the decision making processes in Interseguro, by providing consistent, reliable and timely risk information. |
| • | promote a successful company culture of risk awareness and informed risk-taking. |
To this end, Interseguro uses tools and methodologies to identify and manage risk efficiently, incorporating analytics into its decision-making process.
Main Types of Risks
The main risks faced by Interseguro are actuarial risk, credit risk, market risk, interest rate risk, foreign exchange risk, liquidity risk, inflation risk and operational risk.
Actuarial Risk
As an insurance company, Interseguro is exposed to the risk that the assumptions it employs to price a particular insurance policy, such as the frequency of losses or the severity of losses may be incorrect. Flaws in these assumptions may lead to premium mispricing and the miscalculation of the amount of funds necessary to cover such insurance policy. Particularly, upon the sale of an annuity, Interseguro records a reserve that is calculated on the basis of a discount rate based on the performance of the portfolio of investments related to the annuities and mortality data.
158
Table of Contents
Credit Risk
Interseguro holds a large portfolio of debt investments and fixed income securities and is therefore exposed to the risk that the issuer may default on its interest or principal payments. This risk is mitigated through a three step process. Initially, regulations established by the SBS (1) limit the types of investments Interseguro can make, (2) set minimum credit ratings that securities must have, and (3) limit Interseguro’s investments with respect to a single issuer. Secondly, Interseguro performs a careful analysis on the securities it purchases. Finally, Interseguro’s investment committee, which is comprised of both internal and independent members of its board of directors, is responsible for approving any new investment and periodically reviews Interseguro’s investment portfolio. As of December 31, 2013, among Interseguro’s fixed income securities with a local rating, 72.8% were considered AAA, 26.2% AA+/AA- and 0.9% A+A-; among its fixed income securities with an international rating, 59.8% were considered BBB, 17.6% BBB-, 6.2% BB and 8.5% BB-.
| As of December 31, | ||||||||||||||||
| 2013 | 2012 | 2013 | 2012 | |||||||||||||
| (S/. in millions) | % | |||||||||||||||
AAA | 689.6 | 618.8 | 72.8 | % | 72.4 | % | ||||||||||
AA+ to AA- | 248.3 | 226.0 | 26.2 | % | 26.4 | % | ||||||||||
A+ to A- | 8.9 | 10.1 | 0.9 | % | 1.2 | % | ||||||||||
|
|
|
|
|
|
|
| |||||||||
Total Local Ratings | 946.8 | 854.9 | 100.0 | % | 100.0 | % | ||||||||||
|
|
|
|
|
|
|
| |||||||||
AAA | 0.0 | 39.3 | 0.0 | % | 2.7 | % | ||||||||||
AA+ to AA- | 17.4 | 0.0 | 1.1 | % | 0.0 | % | ||||||||||
A+ to A- | 62.3 | 30.0 | 3.9 | % | 2.0 | % | ||||||||||
BBB+ | 34.1 | 54.0 | 2.1 | % | 3.7 | % | ||||||||||
BBB | 952.7 | 791.0 | 59.8 | % | 53.9 | % | ||||||||||
BBB- | 280.7 | 267.4 | 17.6 | % | 18.2 | % | ||||||||||
BB+ | 11.4 | 0.0 | 0.7 | % | 0.0 | |||||||||||
BB | 98.1 | 130.8 | 6.2 | % | 8.9 | % | ||||||||||
BB- | 135.9 | 153.9 | 8.5 | % | 10.5 | % | ||||||||||
|
|
|
|
|
|
|
| |||||||||
Total International Rating | 1,592.7 | 1,466.4 | 100.0 | % | 100.0 | % | ||||||||||
|
|
|
|
|
|
|
| |||||||||
Total | 2,539.4 | 2,321.3 | — | — | ||||||||||||
|
|
|
|
|
|
|
| |||||||||
Market Risk
Interseguro is exposed to the risk that the value of its investments decreases due to changing market conditions. Market risk drivers include equity prices, interest rates and real estate prices. Interseguro manages this risk by setting limits on individual issuer concentration, on type and liquidity of assets and on deviations from the terms of the technical liabilities they should cover. The RMU regularly assesses market risk to verify its alignment to the IFS’s risk appetite. This assessment includes VaR analysis, contribution and sensitivity analysis of each risk driver and stress tests in different extreme scenarios.
The VaR analysis is a statistical measurement that quantifies the maximum loss expected for the investment portfolio for a period of time and a determined significance level under normal market conditions. For VaR calculation Interseguro uses a historical simulation model, with a 10 day period of time and a 99% significance level. The VaR is calculated for the entire market portfolio, and for each market risk factor: interest rate, equity price and foreign exchange.
The validity of the VaR calculation is proven through a back-testing proof, which uses historical data to ensure that the model adequately estimates the potential losses. Additionally, Interseguro has also developed a sensibility analysis to show potential portfolio losses derived from price variations or interest rates fluctuations.
159
Table of Contents
Interest Rate Risk
The following table sets forth all the assets and liabilities that are sensitive to interest rate movements. In addition to fixed income investments, Interseguro has almost no interest-bearing assets or liabilities. Consequently, the interest rate risk of Interseguro is already incorporated into the market risk of the portfolio.
| Repricing Gap at December 31, 2013 | ||||||||||||||||||||||||||||||||
| S/. in millions | ||||||||||||||||||||||||||||||||
| 1 - Month | 1-3 Months | 3 Months - 1 Years | 1 Year - 3 Years | 3 Year - 5 Years | Over 5 years | Past-due loans / Equities | Total | |||||||||||||||||||||||||
Interest earning assets | ||||||||||||||||||||||||||||||||
Cash and due from banks | 21.9 | — | 8.1 | 18.4 | — | 25.3 | — | 73.7 | ||||||||||||||||||||||||
Inter-bank funds | — | — | — | — | — | — | — | — | ||||||||||||||||||||||||
Trading securities | — | — | — | — | — | — | 13.5 | 13.5 | ||||||||||||||||||||||||
Investments available-for-sale, net | 15.0 | 16.1 | 148.0 | 360.4 | 395.4 | 1,618.0 | 402.2 | 2,955.1 | ||||||||||||||||||||||||
Loans, net of unearned income | — | — | — | — | — | — | — | — | ||||||||||||||||||||||||
|
|
|
|
|
|
|
|
|
|
|
|
|
|
|
| |||||||||||||||||
Total interest earning assets | 36.9 | 16.1 | 156.1 | 378.8 | 395.4 | 1,643.3 | 415.7 | 3,042.3 | ||||||||||||||||||||||||
|
|
|
|
|
|
|
|
|
|
|
|
|
|
|
| |||||||||||||||||
Interest bearing liabilities | ||||||||||||||||||||||||||||||||
Bonds, notes and other obligations | — | — | — | 13.9 | — | — | — | 13.9 | ||||||||||||||||||||||||
|
|
|
|
|
|
|
|
|
|
|
|
|
|
|
| |||||||||||||||||
Total interest bearing liabilities | — | — | — | 13.9 | — | — | — | 13.9 | ||||||||||||||||||||||||
|
|
|
|
|
|
|
|
|
|
|
|
|
|
|
| |||||||||||||||||
Foreign Exchange Risk
Interseguro manages its foreign exchange rate exposure by matching assets and liabilities denominated in foreign currencies. Residual mismatches are reduced by acquiring foreign exchange forwards, which makes this risk almost immaterial.
Liquidity Risk
Interseguro can project with certain accuracy the expected timing of a significant portion of payouts (annuities cannot be accelerated by policyholders) and therefore maintains assets with maturities equal or similar to those of its projected payouts. As of December 31, 2013, the first ten years of obligations were matched with the corresponding investments. The coverage ratio for obligations beyond the first ten years was 0.9.
A risk may arise if Interseguro investments cannot be liquidated in time to cover or pay for its obligations when they become due. As of December 31, 2013, 69.1% of its short-term liabilities were matched by fixed-income assets maturing in the same period. The remaining 30.9% could be covered by liquid investment in equity.
Inflation Risk
Payments related to certain of Interseguro’s liabilities are adjusted for Peruvian inflation. Interseguro holds inflation-adjusted securities in its portfolio to offset this risk. As of December 31, 2013, Interseguro had S/. 549.6 million in inflation-adjustable securities, while reserves related to long-term inflation-adjusted payments (generally over two years) amounted to S/. 750.8 million. Additionally, Interseguro holds a real estate investment portfolio that is naturally adjusted for inflation.
160
Table of Contents
Operational Risk
Operational risk is defined as the possibility of losses due to inadequate processes, faulty personnel, information technology, or external events. To manage these risks, Interseguro uses tools for identification, evaluation and treatment of risks similar to the tools used by banks to comply with Basel II. The goals of these risk management tools may be summarized as follows:
| • | reduce operational losses by identifying potential process risks; |
| • | identify operational risk in the development of new products; |
| • | manage control risk andself-assessment of critical processes; and |
| • | monitor and measure operational risk. |
Wealth Management Segment
Inteligo’s risk management policies are guided by an emphasis on maintaining growth that is both sustainable, profitable and aligned to adequate levels of risk. In order to accomplish this, Inteligo has developed analytic tools and methodologies aiming to identify and manage risk efficiently. Inteligo monitors and reviews these tools to ensure that adequate levels of prediction and performance are maintained and, if necessary, to make adjustments or take corrective measures.
In order to manage the above risks, Inteligo has a specialized risk management structure, measurement systems and mitigation and coverage processes.
Inteligo uses different key risk indicators (“KRI”) to measure its exposure to risk factors. These KRI are continuously monitored and reviewed monthly by senior management and quarterly by the Integral Risk Management Committee and the board of directors to identify possible deviations from the stipulated risk appetite and apply timely corrective actions if needed.
Both credit and market risk are the main risks to be managed by Inteligo and, in order to mitigate its exposure and provide adequate risk coverage, it has established the following measures, among others:
| • | policies, procedures, methodologies, and parameters aimed to identify, measure, control and report market and credit risk; |
| • | review and assessment of credit risk through a specialized risk department which is independent from the commercial unit and which assesses all credit risks prior to loan approvals; |
| • | compliance with regulatory limits and establishment of internal limits for concentration exposure to counterparties and financial instruments, such as concentration to industry, issuer, credit rating and type of investment; and |
| • | procedures for the management of loan guarantees. |
Through these measures, Inteligo establishes the patterns and mechanisms needed to maintain a diversified portfolio and prevent excessive risk concentration.
Main Types of Risks
The main risks faced by Inteligo are credit risk, market risk, interest rate risk, foreign exchange risk, liquidity risk and operational risk.
Credit Risk
In our wealth management segment, only Inteligo Bank is exposed to credit risk. The substantial majority of loans we make are fully collateralized by time deposits or investment securities. Nevertheless, we have implemented strict credit risk management policies, which have contributed to the fact that in our entire history there has not been a non performing loan.
161
Table of Contents
The following table presents the approval levels required for loan applications by total exposure amount in U.S. dollars.
Approval levels | Amount | |
| Board of Directors | Over US$20,000,000 | |
| Executive Committee | Up to US$20,000,000 | |
| Credit Committee | Up to US$10,000,000 | |
| Risk Officer | Up to US$3,000,000 | |
| Senior Credit Risk Supervisor | Up to US$1,000,000 |
Credit approval is determined by the applicant’s repayment ability, which is determined primarily by the applicant’s credit history and cash flow generation for commercial loans or monthly net profit for retail loans. The decision whether or not to approve an extension of credit takes into account the applicant’s economic environment, its ability to meet its obligations, collateral, management and character. We developed a credit risk scorecard system in 2013, which classifies applicants based on several variables such as leverage ratio, debt service as a percentage of monthly income and collateral quality, among others.
The Risk Unit is responsible for periodical monitoring of our credit portfolio and early detection of possible deviations in the credit performance and financial condition of clients in order to maintain a healthy loan portfolio and take timely and necessary actions to reduce or avoid losses. To this end, the Risk Unit reviews Inteligo’s loan portfolio on a monthly basis and calculates an expected credit loss according to internal models. Additionally, it is responsible for the regulatory classification of all bank customers and appropriate allocation of reserves.
Although Inteligo Bank has a recovery process for the collection of unpaid loans, there has not been a non-performing or defaulted loan.
Market Risk
Market risk is the probability of loss due to variations in financial market conditions. The main variations to which Inteligo is exposed to are: interest rates and prices. Said variations can affect the value of Inteligo’s financial assets and liabilities. Exchange rate risk is minimal because of the small exposure to other currencies.
Inteligo Investment Portfolio
In order to monitor the risks within each instrument of its investment portfolio, Inteligo has established maximum exposure limits by individual issuer, investment type and currency that are calculated on a monthly basis.
The main technique used to measure and control market risk is VaR, which is a statistical measurement that quantifies the maximum loss expected for the investment portfolio for a period of time and a determined significance level under normal market conditions. Inteligo uses the delta normal VaR model for a period of one month with a 99% confidence level. The VaR is calculated for each risk factor (price, interest rate and exchange rate) and investment type (fixed income, equity and alternative investments).
Additionally, Inteligo calculates the marginal contribution to VaR of each instrument in the portfolio. The validity of the VaR calculation is verified through a back-testing methodology, which uses historical data to ensure that the model adequately estimates potential losses. Inteligo has also developed a sensitivity analysis to show potential portfolio losses from price variations in its investment portfolio or interest rates fluctuations.
Assets and Liabilities Management
Inteligo holds positions that are not actively traded, including its loan portfolio, customer deposits, and bank loans. These positions are also exposed to interest rate risk, exchange rate risk and liquidity risk.
162
Table of Contents
Interest Rate Risk
Interest rates continuously fluctuate on the market. These fluctuations affect Inteligo in two ways: firstly, through the change in the valuation of assets and liabilities; and secondly, affecting the cash flows at repricing dates. The variation in the valuation of assets and liabilities is increasingly sensitive as the term at which the asset or liability repricing increases.
An analysis of the repricing gaps is performed in order to determine the impact of interest rates movements. Said analysis consists of classifying all the interest earning assets and interest bearing liabilities in several time ranges according of their repricing date. The impact of the variation in the valuation of assets and liabilities on each range (the repricing gap) is calculated in function of this analysis.
The following table summarizes Inteligo’s exposure to interest rate risks. Inteligo’s financial instruments are presented at book value, classified by the period of the contract’s interest rate repricing or maturity date, whichever occurs first:
| 2013 | ||||||||||||||||||||||||||||||||
| Up to 1 month | From 1 to 3 months | From 3 to 12 months | From 1 to 3 years | From 3 to 5 years | More than 5 years | Non-interest bearing | Total | |||||||||||||||||||||||||
| S/. in millions | ||||||||||||||||||||||||||||||||
Interest earning assets | ||||||||||||||||||||||||||||||||
Cash and due from banks | 202 | — | — | — | — | — | — | 202 | ||||||||||||||||||||||||
Inter-bank funds | — | — | — | — | — | — | — | — | ||||||||||||||||||||||||
Trading securities | 23 | — | — | — | — | — | 36 | 59 | ||||||||||||||||||||||||
Investments available for sale, net | 40 | 7 | 105 | 68 | 80 | 172 | 369 | 841 | ||||||||||||||||||||||||
Other assets | 82 | 114 | 747 | 150 | 11 | 23 | — | 1,127 | ||||||||||||||||||||||||
|
|
|
|
|
|
|
|
|
|
|
|
|
|
|
| |||||||||||||||||
Total interest earning assets | 348 | 121 | 853 | 219 | 91 | 194 | 406 | 2,229 | ||||||||||||||||||||||||
|
|
|
|
|
|
|
|
|
|
|
|
|
|
|
| |||||||||||||||||
Interest bearing liabilities | ||||||||||||||||||||||||||||||||
Deposits and obligations and deposits from financial entities | 182 | 153 | 880 | 210 | 2 | 22 | — | 1,449 | ||||||||||||||||||||||||
Due to banks and correspondents | — | — | 225 | — | — | — | — | 225 | ||||||||||||||||||||||||
Inter-bank funds | — | — | — | — | — | — | — | — | ||||||||||||||||||||||||
Bonds and other obligations | — | — | — | — | — | — | — | — | ||||||||||||||||||||||||
|
|
|
|
|
|
|
|
|
|
|
|
|
|
|
| |||||||||||||||||
Total interest bearing liabilities | 182 | 153 | 1,105 | 210 | 2 | 22 | — | 1,674 | ||||||||||||||||||||||||
|
|
|
|
|
|
|
|
|
|
|
|
|
|
|
| |||||||||||||||||
Marginal gap | 165 | (32 | ) | (252 | ) | 9 | 89 | 172 | 405 | |||||||||||||||||||||||
Accumulated gap | 165 | 133 | (119 | ) | (110 | ) | (22 | ) | 151 | 557 | ||||||||||||||||||||||
|
|
|
|
|
|
|
|
|
|
|
|
|
| |||||||||||||||||||
Foreign exchange risk
Exchange rate risk is related to the variation of the positions both on- and off-balance sheet that may be negatively affected by exchange rates movements. Inteligo Bank’s main business is performed in U.S. dollars, its functional currency. Management sets a limit to exposure levels in other currencies and monitors it monthly. Inteligo SAB uses bothnuevos solesand U.S. dollars in its trading operations and maintains positions in both currencies.
Liquidity risk
Liquidity risk consists of Inteligo’s inability to comply with the maturity of its obligations, thus incurring losses that affect its equity position. This risk may arise as result of diverse events such as the unexpected decrease of funding sources or the inability to rapidly settle assets, among others.
163
Table of Contents
Although Inteligo takes short-term deposits, most of the deposits have historically been renewed or maintained, and consequently they represent a stable funding source. Additionally, the average loan term is less than a year and more than a half of the investment portfolio can be easily liquidated, so liquidity risk is low.
Nevertheless, Inteligo assesses medium-term and long-term liquidity through a structural analysis of its funds inflows and outflows on diverse maturity terms. This process allows it to know the diverse funding sources, how liquidity needs to be increased, and which terms are mismatched. On the basis of this information, the necessary decisions to maintain adequate liquidity levels are taken.
Operational Risk
Inteligo manages operational risk through its risk unit, guided by banking best-practices, including Basel II policies. The objectives of the operational risk management are to:
| • | reduce operational losses by identifying potential process risks; |
| • | identify operational risk in the development of new products; and |
| • | manage control risk andself-assess critical processes; |
| • | monitor and measure operational risk. |
Inteligo’s methodology is based on two tools for identifying and measuring risks that calculate the exposure level and facilitates decision-making to mitigate exposures within certain limits of risk tolerance. These tools are risks and controls self-assessment, and collection of loss event.
Although Inteligo Bank currently uses the Basic Indicator Approach for operational risk management under Basel II, it is working very closely with the Central Bank of The Bahamas to implement more advanced approaches. In recent years, Inteligo launched several initiatives to strengthen the risk culture among the employees.
164
Table of Contents
The Peruvian Financial and Insurance Systems
Our activities are conducted through Interbank and Interseguro, our banking and insurance subsidiaries, respectively, operating in Peru. A summary of the Peruvian financial and insurance regulatory framework is set forth below.
General Overview of the Peruvian Financial Regulatory Framework
Peruvian banking regulation follows the standards set by the Basel Committee on Banking Supervision. Peruvian banks and other Peruvian financial institutions are primarily governed by two banking regulatory authorities: the SBS and the Central Reserve Bank of Peru. The Peruvian Constitution establishes that the SBS’s main function and responsibility is to protect depositors of the Peruvian financial system, while the main function of the Central Reserve Bank of Peru is to preserve monetary stability.
The regulatory framework for the operation of the Peruvian financial and insurance sector is set in the Peruvian Banking and Insurance Law (Ley General del Sistema Financiera y del Sistema de Seguros y Orgánica de la Superintendencia de Banca y Seguros), which was enacted in December 1996. The Peruvian Banking and Insurance Law regulates Peruvian financial and insurance companies and private pension funds administrators. In accordance with the Peruvian Banking and Insurance Law, the SBS is responsible for issuing banking regulations and for monitoring the Peruvian banking and financial sector. The SBS supervises and regulates financial institutions such as commercial banks, financial companies, financial leasing companies, small business financial companies, savings and loan corporations, financial services companies such as trust companies and investment banks, insurance companies, and private pension fund managers (other financial institutions such as stock brokerage houses and mutual fund managers are subject to different legal frameworks and to the supervision of the SMV). The SBS became operational in 1931.
Financial and insurance institutions must seek the authorization of the SBS before initiating operations. The SBS has administrative and financial autonomy, and its head office is located in Lima. The current chairman of the SBS was appointed by President Humala in August 2011.
In June 2008, as a way to facilitate the adoption process to the Basel II standards, the Peruvian Banking and Insurance Law was amended by Legislative Decree No. 1028 and Legislative Decree No. 1052, to comply with the international standards. The changes introduced have been designed to be implemented progressively. The SBS, by use of its regulatory attributes, has issued several regulations that seek to adapt the Peruvian Financial System to the new Basel Capital Accord.
As noted, Peruvian banks, financial institutions and insurance companies are mainly regulated and supervised by the following administrative institutions:
The SBS
The SBS is the regulatory authority charged with the implementation and enforcement of the requirements contained in the Peruvian Banking and Insurance Law approved by Law No. 26702, and, more generally, with the regulation and supervision of all financial and insurance companies in Peru and, since July 2005, the private pension funds administrators.
Its objectives include: (i) protecting the public interest; (ii) safeguarding the financial stability of the institutions over which it has authority; and (iii) punishing violators of its regulations.
Its main responsibilities include: (i) reviewing and approving, with assistance of the Central Reserve Bank of Peru, the establishment, organization and operations of the institutions it regulates and their subsidiaries;
165
Table of Contents
(ii) overseeing mergers, dissolutions and reorganization of banks, financial institutions and insurance companies; (iii) supervising financial, insurance and related companies from which information on an individual or consolidated basis is required, through changes in ownership and management control (this supervision also applies to non-bank holding companies, such as us and Intercorp Peru); (iv) reviewing theby-laws and amendments thereto of these companies; (v) setting forth criteria governing the transfer of bank shares, when permitted by law, for valuation of assets and liabilities and for minimum capital requirements; (vi) controlling theCentral de Riesgos (Bank Risk Assessment Center), to which all banks are legally required to provide information regarding all business and individuals with whom they deal without regard to the amount of credit risk (the information provided is made available to all banks to allow them to monitor individual borrowers’ overall exposure to Peru’s financial system); and (vii) supervising theanti-money laundering system through the financial intelligence unit.
The SBS enforces the Peruvian Banking and Insurance Law on an ongoing basis through periodic resolutions. The Peruvian Banking and Insurance Law provides for stringent loan loss reserve standards, brings asset risk weighing in line with the Basel Committee on Banking Supervision guidelines and includes the supervision of holding companies of financial institutions by the SBS.
For the foregoing purpose, the SBS requires banks, financial and insurance companies to report, on a periodic basis, all relevant information necessary foroff-site evaluation of its financial performance. The relevant information foroff-site evaluation includes audited financial statements on a combined basis, board of directors’ reports, auditor’s reports and any other reports which reflect the operation of a bank’s business. Under current practice, such reporting is required on a daily, weekly, monthly, quarterly andsemi-annual basis, depending on the nature of the reported information.
The SBS is also responsible for conductingon-site examinations of banks on an annual basis, implementing the provisions of the Peruvian Banking and Insurance Law and other related legislation, examining all banking operations, and analyzing the relationship between assets, liabilities, net worth, profit and loss accounts and all other factors affecting a bank’s financial structure.
The SBS has the power to impose administrative sanctions on financial institutions and their directors and employees as a result of any violation of the Peruvian financial and insurance system rules. Sanctions vary from monetary fines to license cancellation. The SBS may also sanction directors and other officers of financial institutions for breach of regulations under the supervision of the SBS.
The Central Reserve Bank of Peru
The Central Reserve Bank of Peru was incorporated in 1922 and performs the functions common to a central or reserve bank, such as issuing bank notes, implementing governmental monetary policies, regulating the money supply, managing official gold and foreign exchange reserves and managing the interbank cash clearance system. The Central Reserve Bank of Peru exercises its power and authority independently and is responsible for its affairs in accordance with the government’s policies. The Central Reserve Bank of Peru is empowered to determine the inflation target and to adopt a monetary policy in accordance thereof and is also responsible for establishing mandatory minimum liquidity reserves. The Central Reserve Bank of Peru manages Peruvian international reserves and gathers and publishes data on its finances and is also the sole issuer of Peruvian currency.
The SMV
The SMV (formerly theComisión Nacional Supervisora de Empresas y Valores or “CONASEV”) is the Peruvian securities market regulatory authority, attached to the Ministry of Economy and Finance, with functional, administrative, economic, technical and budgetary autonomy. The main purpose of the SMV is promoting, overseeing and regulating the securities market, supervising and controlling all individuals and entities that intervene in such market, controlling compliance with the provisions of the Peruvian Securities Market Law and its regulations and sanctioning the breach thereof.
166
Table of Contents
The SMV has broad regulatory and supervisory powers in order to achieve theabove-mentioned purposes, which include (i) issuing general mandatory rules applicable to the Peruvian Securities Market; (ii) supervising the Peruvian Securities Market (including the power to order inspections and require the submission of information and documentation by entities that are under its jurisdiction and summon and interrogate any person that may contribute to its investigations); (iii) imposing sanctions; (iv) managing the Public Registry of Securities; (v) authorizing public offerings of securities and recording details of such public offerings and their respective programs with the Public Registry of Securities; (vi) authorizing the incorporation and functioning of entities under its scope of supervision; and (vii) monitoring the content and accuracy of the financial and other information that is filed with the SMV.
Banking Regulation and Supervision
Banking regulations and capital adequacy in Peru take into account the recommendations of the Basel Committee. The SBS has adopted the principles and guidelines of Basel II and Basel III. So far, in adopting Basel III recommendations approved in September 2010, the SBS has increased the minimum regulatory capital required for Peruvian banks. However, Basel III has not yet been totally implemented and we cannot provide any assurances whether or as to the extent to which the SBS may adopt it.
Implementation of Basel II Principles
To carry out the implementation of Basel II, the SBS has approved a schedule of two (2) phases: a first mandatory phase and a second voluntary phase. During the first phase, which started in 2008 and ended in June 2009, the SBS performed quantitative impact studies and drafted the most important regulations. On June 22, 2008, Legislative Decree No. 1028 was issued, which contains certain amendments to the current Peruvian Banking and Insurance Law, most of which were aimed to adapt it to Basel II standards.
In order to conform to Basel II standards, the methodology for measuring credit, market and operational risks has been amended to allow both standardized and internalmodel-based methods for measuring market and credit risks. All Peruvian financial institutions and insurance companies were to have implemented the standardized approach methodology by June 2009. Financial institutions and insurance companies will have the opportunity to request the validation and approval to implement the internalrating-based (“IRB”) methodology. Only those financial institutions and insurance companies that apply to use the IRB methodology will follow the second phase of implementation of Basel II standards.
The second phase consists of a validation process of the IRB methodology by the SBS and its subsequent approval. Once the IRB methodology has been validated and approved by the SBS, the pertinent financial institution will use regulatory capital floors to calculate their capital requirements. The amount of required capital may not be less than the percentage of capital requirements obtained under the previous methodology.
| First Year | Second Year | Third Year | ||||||||||
Basic IRB and Internal Models of Credit Risk | 95 | % | 90 | % | 80 | % | ||||||
Advanced Models of Credit Risk and/or Operational Risk | 90 | % | 90 | % | — | |||||||
Capital Adequacy Requirements—Basel II
Under the amended provisions of Article 199 of the Peruvian Banking and Insurance Law, and on an unconsolidated basis, the regulatory capital (patrimonio efectivo) may not be lower than 10% of its total weighted assets, the latter being defined as the sum of: (i) ten times the regulatory capital allocated to cover market risks; (ii) ten times the regulatory capital allocated to cover operational risks; and, (iii) the total amount of creditrisk-weighted assets.
According to the amended provisions of Articles 184 and 185 of the Peruvian Banking and Insurance Law, regulatory capital is defined as the sum of: (i) Tier I Regulatory Capital or Basic Capital; and (ii) Supplementary Capital.
167
Table of Contents
Basic Capital or Tier I Regulatory Capital is comprised ofpaid-in capital (which includes common stock and non-cumulative perpetual preferred shares), legal reserves, supplementary capital premiums, voluntary reserves distributable only with prior SBS approval and retained earnings of past years and of the current year, which are committed for capitalization. It also includes instruments having the characteristics of permanence and loss absorption issued in compliance with regulations recently enacted by the SBS. Basic Capital is subject to the following deductions: losses of prior years and of the current year, any deficit due to allowances, and goodwill resulting from corporate reorganizations and acquisitions. Basic Capital is also subject to certain additional deductions (e.g. 50% of the investments in shares and subordinated debt issued by other local or foreign financial institutions or financial insurance companies, etc.).
Supplementary Capital is constituted by the sum of Tier II and Tier III Regulatory Capital. Tier II Regulatory Capital consists of voluntary reserves (which may be reduced without prior consent from the SBS), the eligible portion of redeemable subordinated debt instruments that have mixed debt and equity features, and the generic loan loss provision (up to certain limits). Tier II Regulatory Capital is subject to certain deductions under the law (e.g. 50% of the investments in shares and subordinated debt issued by other local or foreign financial institutions or financial insurance companies, etc.). Tier III Regulatory Capital consists of redeemable subordinated debt that is incurred for the exclusive purpose of covering market risk.
Banks are required to prepare and submit to the SBS, within the first 15 days of each month, a report analyzing the bank’s assets for the previous month and the total amount of the bank’s regulatory capital. Foreign currency denominated assets are valued innuevos soles at an average exchange rate published by the SBS in effect as of the date of such report.
Implementation of Basel III Principles
In order to implement the Basel III principles, in July 2011 the SBS approved ResolutionNo. 8425-2011 which requires additional regulatory capital based on the risk profile of each financial institution in accordance with the guidelines approved by the SBS, to cover risks not contemplated in Pillar I of Basel II. The new resolution also includes capital requirements based on the Basel III principles related to capital conservation in order to mitigate the following risks: (a) economic cycle risk, (b) business concentration risk (by individual Section and/or region), (c) market concentration risk, (d) interest risk on the banking book and (e) other risks. The regime is being gradually implemented in phases over a period of five years, starting in July 2012. Nevertheless, the SBS has not fully adopted Basel III.
In July 2012, Interbank was in compliance with the first phase, which required that a financial institution increase its regulatory capital by 40%. In addition, Interbank was in compliance with the July 2013 requirement of the 55% increase in additional regulatory capital. The remaining phases of the regime will be implemented in the following phases:
Implementation Date | Percentage Required of Additional Capital Requirement | |||
July 2014 | 70 | % | ||
July 2015 | 85 | % | ||
July 2016 | 100 | % | ||
As of the date of this prospectus, Interbank is in compliance with the additional requirement applicable to the period from July 2014 through July 2015.
Liquidity Requirement of Basel III Principles
In December 2012, the SBS approved Resolution No. 9075-2012 requiring a new calculation of the liquidity ratio coverage. The liquidity ratio coverage is a ratio for financial institutions to ensure the maintenance of adequate levels of high quality liquidity assets that could easily be converted into cash to meet liquidity needs, for a 30 calendar day period, under a stress liquidity scenario. High quality liquidity assets are defined as assets that are easily and immediately converted into cash.
168
Table of Contents
To date, Interbank is in full compliance with all regulatory limits. In addition, Interbank’s alert system monitors any deviations so Interbank may take any preventive measures.
For the implementation of this ratio, the SBS has defined an adequation plan, as detailed below:
| 2014 | 2015 | 2016 | ||||||||||
Liquidity Ratio Coverage Ratio | 80 | % | 90 | % | 100 | % | ||||||
Classification of the Loan Portfolio
According to SBS regulations, the provision for loan losses is calculated and recorded following SBS Resolution N° 11356-2008, which sets parameters to determine the calculation of provisions which is based on formulas and the use of specific percentages over the balances of loans and collateral received. Also, it requires constitution of generic provisions based on total loan portfolio, including generic provisions on not-impaired loans. The loan portfolio provisions which result from such classification differ materially from the loan portfolio provisions which result from our application of IFRS. For a discussion of our loan portfolio classification policies and the resulting allowances, see “Selected Statistical Information—Classification of our Loan Portfolio and—Allowance for Loan Losses” and note 29.1(d) to our audited combined financial statements.
Risk ofOver-Indebtedness by Consumer Banking Customers
According to SBS Resolution No. 6941 2008, as amended, banks and other financial entities must adopt a system to manage the risk of over indebtedness that (a) allows the mitigation of such risk before and after making the loan, (b) permits the performance of a permanent monitoring of the portfolio to identify over indebted borrowers and (c) includes the periodic evaluation of the control mechanisms being used and of the corrective actions or required improvements, as the case may be. The board of directors of such banks and other financial entities are responsible for (i) establishing and reviewing the policies and proceedings for the identification, measuring, treatment, control, reporting and monitoring of the risk from the level of indebtedness of its consumer banking customers and (ii) causing the management to adopt the necessary measures to monitor and control such risks. In addition, the board of directors must cause the bank and/or financial entity to have an organizational structure that guarantees total independence between the risk and the commercial divisions and that the incentive schemes for employees’ performance does not cause a conflict of interest with risk management policies.
Banks and financial entities that are not able to monitor, control and identify the risk of over indebtedness are obliged to maintain a special loan loss reserve. Banks and financial entities that comply with the requirements described above are not required to maintain any such specific allowance.
Legal Reserve Requirements
Pursuant to Article 67 of the Peruvian Banking and Insurance Law, all banks must create a legal reserve. Each year a bank must allocate 10% of its net profit to its legal reserve until its legal reserve is equal to 35% of itspaid-in capital. Any subsequent increases inpaid-in capital will imply a corresponding increase in the required level of the legal reserves to be funded as described above.
Lending Limits
Under Article 206 of the Peruvian Banking and Insurance Law, the total amount of direct and indirect credits and financings granted in favor of a person shall not exceed 10% of the bank’s regulatory capital. A person is defined for the purposes therein as a person or group of persons or entities representing a common or single risk.
169
Table of Contents
The SBS has issued special regulations establishing the guidelines that must be followed by banks when determining legal reserves for legal proceedings for past-due loans and foreclosures.
For purposes of Peruvian Banking and Insurance Law, a single borrower includes an individual or an economic group. An economic group constituting a single or common risk, according to Peruvian Banking and Insurance Law, includes a person, such person’s close relatives and companies in which such person or close relatives have significant share ownership ordecision-making capability. According to current regulations, shareholders who own or control directly or indirectly at leastone-tenth of a company’s shares are considered significant shareholders. Significantdecision-making capability is deemed to be present when, among other, a person or group can exercise material and continuous influence upon the decisions of a company, when a person or company holds seats on the board of directors or has principal officers in another company, or when it can be assumed that one company or person is the beneficial recipient of credit facilities granted to another company.
The 10% limit indicated above may be raised to 15%, 20% and 30%, depending on the type of collateral securing the excess over each limit. For instance, the limit can be extended to 15% when the excess is secured by a mortgage; it may be raised to 20% when the excess is collateralized with securities listed in the Selective Index of the Lima Stock Exchange (ISBVL); it may be raised to 30% when the excess is secured with deposits that are maintained and pledged with the bank.
Other special lending limits must also be taken into account, such as lending to related parties or affiliates (30% of regulatory capital), to local banks (30%), and to foreign banks (from 5% for non-regulated banks to 30% for first category international banks, which may also be raised to 50% when backed by letters of credit). There are other limits that require banks to diversify their portfolio through different types of assets, benefiting liquid and low risk assets.
Lending to Related Parties
The Peruvian Banking and Insurance Law regulates and limits transactions with related parties and affiliates of financial institutions, on an unconsolidated basis. In 1997, the SBS and the SMV enacted regulations containing definitions of indirect ownership, related parties and economic groups, which serve as the basis for determining limits on transactions with related parties and affiliates. These regulations also provide the basis for the subsequent development of specific supervision standards of financial institutions and conglomerates formed by financial institutions.
Additionally, pursuant to Article 202 of the Peruvian Banking and Insurance Law, the aggregate amount of loans to related party borrowers may not exceed 30% of a bank’s regulatory capital (exceptionally, according to CircularB-2148-2005, as amended, the amount of loans to related parties may not exceed 50% of a bank’s regulatory capital if the excess of 30% is secured by credit letters from foreign financial institutions). For purposes of this test, related party borrower includes any person or an affiliate of that person, holding, directly or indirectly, 4% or more of a bank’s capital stock, directors, certain of the bank’s principal executive officers or other persons in more junior positions affiliated with the bank’s management.
All loans to related parties must be made on anarm’s-length basis with terms no more favorable than the best terms that Interbank would offer to the public.
In addition, under Article 201 of the Peruvian Banking and Insurance Law the total amount of loans extended to directors, officers, employees or close relatives of any such persons may not exceed 7% of a bank’s regulatory capital. All loans made to any single such related party borrower may not exceed 0.35% of a bank’s regulatory capital (i.e., 5% of the overall 7% limit) per each person, including such person’s spouse and relatives. In addition, the Peruvian Banking and Insurance Law generally provides that banks may not extend credit to or guarantee the obligations of employees or members of the board of directors, except for home mortgage loans to employees and directors.
170
Table of Contents
Country Risk Reserve Requirements
SBS ResolutionNo. 505-2002, enacted in June 2002, requires the funding of reserves to cover exposure to country risk, which is defined to include sovereign risk, transfer risk and expropriation or nationalization risk, all of which may affect operations with companies or individuals in foreign countries. The SBS has also established guidelines indicating the procedures and responsibilities necessary for coping with country risk.
Integral Risk Management
SBS ResolutionNo. 37-2008, enacted in January 2008, contains guidelines for integral risk management of financial institutions. Integral risk management is a process intended to identify potential events that can affect banks and to manage those events according to its nature and risk level. This new regulation covers all kinds of risks that could affect a banking operation, such as operational, market, credit, strategic, liquidity, legal and reputational risks.
Credit Risk
According to the Peruvian Banking and Insurance Law, as of July 1, 2009, financial institutions would have been allowed to use the IRB methodology instead of the standardized methodology for calculating their regulatory capital requirement for credit risk, after receiving prior approval from the SBS. However, regulations required for the full implementation of both standardized and IRB methodologies by Peruvian financial institutions were not enacted until November 4, 2009, with SBS ResolutionNo. 14354-2009.
Under SBS ResolutionNo. 14354-2009, enacted in November 2009, financial institutions are allowed to use the standardized methodology and, with the prior approval of the SBS, IRB methodologies for calculating their regulatory capital requirement for credit risk. Interbank has not decided if it will request approval from the SBS to adopt the IRB methodology.
In addition, according to SBS ResolutionNo. 3780-2011, financial institutions are required to implement an organizational structure and certain procedures in connection with control on interests management and strategic needs procedures in order to adequately manage credit risk.
Market Risk
Regulations for the supervision of market risks, enacted in May 1998, require banks to establish internal policies and procedures to monitor these risks, as well as market risk exposure limits. Regulations define market risk as the probability of loss derived from exposure to various classes of commodities, securities, foreign exchange, derivative operations or commercial assets that banks may hold in their portfolio, which may, or may not, be accounted for in their statements of financial position. On June 2009, the SBS enacted SBS Resolution No. 6328 2009, which defines the methodology to be applied, and the requirements to be satisfied, to calculate the regulatory capital requirement for market risks under the standard methodology and the IRB methodology.
Since July 1, 2009, financial institutions have been allowed to use IRB methodology (subject to prior approval by the SBS) in substitution of the standardized methodology.
Operational Risk
SBS ResolutionNo. 2115-2009, enacted in April 2009, defines the methodology to be applied, and the requirements to be satisfied, by financial institutions in calculating their regulatory capital requirement for operational risk under the IRB methodology, the alternative standardized methodology and the advanced methodologies. The IRB methodology uses a bank’s gross operational margin as an “exposure indicator” and its application does not require the prior approval by the SBS. Application of the alternative standardized methodology or the advanced methodologies requires compliance with certain provisions included in SBS Resolution No. 2115- 2009 and prior approval from the SBS.
171
Table of Contents
SBS ResolutionNo. 2116-2009, enacted in April 2009, which approves the guidelines for managing operational risk, defines “operational risk” as the possibility of suffering losses due to inadequate procedures, failures of personnel, information technology or external events, including, without limitation, legal risks (but excluding strategic and reputational risk). It also establishes that a bank’s board of directors is responsible for designing the general policies to manage operational risk and that a bank’s management is in charge of implementing such policies. Finally, it provides that each bank is obligated to create a database of all of such bank’s losses due to operational risk, classifying such losses by event.
Investments in Financial Instruments
Investment in financial instruments by Peruvian banks is restricted to those financial instruments listed in the Peruvian Banking and Insurance Law, such as equity instruments traded on a stock exchange, debt instruments (to the extent that certain requirements are satisfied), sovereign debt instruments and quotas in mutual and investment funds, among others.
Reserve Requirements from the Central Reserve Bank of Peru
Under the Peruvian Banking and Insurance Law, all financial institutions regulated by the SBS (except forsmall-business developmentnon-bank institutions) are required to maintain a legal reserve (encaje) for certain obligations. The Central Reserve Bank of Peru may require additional marginal reserves. The exact level and method of calculation of these reserve requirements is set by the Central Reserve Bank of Peru, which has issued different sets of regulations for foreign and localcurrency-denominated obligations of banks. The following liabilities are subject to the reserve requirement: demand and time deposits, savings accounts, certain obligations, securities, certain bonds, and funds administered by the bank. Subject to certain requirements, the regulation excludesmid-term andlong-term funding (i.e. more than three years) from foreign financial institutions, other central banks, governments or multilateral lending agencies.
In April 2004, the Central Reserve Bank of Peru began requiring reserves on amounts due to foreign banks and other foreign financial institutions, which were not previously considered obligations.
As of June 2014, the minimum legal reserve requirement for local and foreign currency deposits is 9%. Foreign currency and local currency deposits collected from the general public are subject to a marginal rate of 50% and 12.5%, respectively. Deposits in local currencies collected from a foreign financial institution and borrowings from foreign sources, with an original maturity of two or less than two years, are subject to a 12.5% special rate up to an amount equivalent to the greater of average of all such obligations until June 2013 plus S/. 100 million or 1% of the minimum capital requirement applicable as of December 2012. Any excess is subject to a 120% rate. In addition, deposits in foreign currencies collected from a foreign financial institution and borrowings from foreign sources with amortized maturity of two or less than two years are subject to a 50% special rate from August 1, 2013 and a 60% special rate applicable to those incurred until July 31, 2013.
Local and foreign currency borrowings from certain foreign sources with an original maturity of more than two years are subject to a 20% special rate only for the portion in excess of an amount equivalent to the greater of 2.5x the minimum capital requirement on December 31, 2013 and S/. 400.0 million, provided that (i) the amount of such obligations does not exceed the equivalent to 2.0x the minimum capital requirement applicable on December 31, 2012; and, (ii) the amount of its total liabilities does not exceed the equivalent to 4.0x the minimum capital requirement applicable on December 31, 2012. In case the foregoing requirements are not met, a 20% special rate will apply only for the portion in excess of an amount equivalent to the greater of 3.5x the minimum capital requirement on December 31, 2012 and S/. 400.0 million. Financial institutions may satisfy the minimum reserve requirements with funds that they hold in vaults or that they have deposited in their accounts at the Central Reserve Bank of Peru.
172
Table of Contents
According to Peruvian banking regulation, financial institutions are also obliged to maintain a minimum 3% of all their obligations subject to the reserve requirement in both domestic and foreign currencies deposited as a legal reserve at the Central Reserve Bank of Peru. The Central Reserve Bank of Peru oversees compliance with the reserve requirements.
The Central Reserve Bank of Peru also establishes the interest rate payable on reserves that exceed the minimum legal reserve requirement applicable to both local and foreign currency deposits. The current applicable interest rate for (a) local currency reserves, other than those described below, is the overnight deposits interest rate minus 195 basis points; and (b) foreign currency deposits, is 25% of theone-month LIBOR interest rate. Currently, no interest rate is payable in respect of local currency deposits to certain foreign sources, such as financial institutions, hedge funds, brokerage firms, pension funds and others with a foreign parent company, except for those authorized by the SBS to collect deposits from the general public in Peru. The applicable interest rate is expected to be periodically revised by the Central Reserve Bank of Peru in accordance with monetary policy objectives.
In the past, the Central Reserve Bank of Peru has on numerous occasions changed the deposit reserve requirements applicable to Peruvian commercial banks and both the rate of interest paid on deposit reserves and the amount of deposit reserves on which no interest is payable by the Central Reserve Bank of Peru.
Deposit Insurance Fund
Bank deposits are protected by theFondo de Seguros de Depósito (Deposit Insurance Fund), against bank failure. Specifically, savings deposit by natural persons, savings deposit accounts maintained bynon-profit entities and checking accounts are covered in full up to an amount that is revised quarterly by the SBS. For the period between June and August 2014, the maximum coverage amount is S/. 93,316.00 per person per bank.
The Deposit Insurance Fund was established in 1991 and was organized as a private corporation in 1996. The Deposit Insurance Fund’s governing body is led by a representative of the SBS. The additional members are appointed by the Central Reserve Bank of Peru (one member), the Ministry of Economy and Finance (one member) and by the banks (three members). SBS provides the necessary administrative members and operational resources for the Deposit Insurance Fund.
The financial resources available to the Deposit Insurance Fund pursuant to the Peruvian Banking and Insurance Law include, among others, the original contribution from the Central Reserve Bank of Peru, insurance premiums paid by banks, unclaimed bank deposits (after ten years) and fines imposed by the SBS for violations of the Peruvian Banking and Insurance Law.
In addition, the Deposit Insurance Fund may, in extraordinary situations, borrow funds with authorization from the Peruvian treasury, or it may borrowlong-term government securities from the Peruvian treasury.
Anti-Money Laundering Rules
Money laundering is considered a criminal act in Peru. A special legal framework was established in April 2002, which follows the 40 recommendations of the Financial Action Task Force on Money Laundering, or “FATF”, established by theG-7. Since then, this legal framework has been amended in order to improve and increase the efficiency of the Peruviananti-money laundering system.
Money laundering includes a wide range of serious offenses such as tax evasion, terrorism, drug trafficking, corruption and other criminal activities. A special set ofanti-money laundering rules applies specifically to banks, which include specific rules for customer and employeedue-diligence andrecord-keeping. In March 2008, the SBS enacted additionalanti-money laundering provisions, pursuant to which, among other things, banks must establish a set of policies and procedures specifically aimed to prevent asset laundering and the financing of terrorist activities. In November 2008, the SBS modified theanti-money laundering provisions
173
Table of Contents
to include, among other changes, the obligations of Peruvian banks to verify that their branches and foreign subsidiaries comply with theanti-money laundering and terrorism financing provisions enacted by the SBS and with the recommendations of the FATF.
The government agency responsible for supervising theanti-money laundering system is the UIF, which was made part of the SBS in July 2007. The chairman of this agency is appointed by the chairman of the SBS.
On February 17, 2011, the SBS modified currentanti-money laundering provisions through SBS ResolutionNo. 2108-2011 as amended, in order to adapt these provisions to international standards established by the Financial Action Task Force of South America (Grupo de Acción Financiera de Sudamerica, or “GAFISUD”), in relation to due diligence in the identification of clients according to their risk and profile level, among other considerations.
Disclosure of Material Information
All banks that are organized as corporations (the only exception being the Peruvian branches of foreign banks) are listed on the Lima Stock Exchange. As a result, they are subject to the disclosure and reporting rules contained in the Peruvian Securities Market Law and the internal regulations of the SMV and the Lima Stock Exchange.
Under these rules, listed companies such as banks are required to disclose to the market in a timely manner (on the same day when the event occurs) all information that investors are reasonably likely to consider material. Specific regulations provide for specific parameters to determine what is considered material information. Banks are also subject to full disclosure and reporting obligations under the banking regulatory framework.
In March 2014, regulations related to disclosure of material information were amended. By virtue of such regulations, issuers under supervision of the SMV are required to disclose all material information in connection with the issuer of registered securities (such as our common shares), its activities or securities issued or secured by such issuer which may influence the liquidity or price of such securities.
Also, issuers whose securities are also traded in foreign markets, must file before with the SMV all information that is required to be disclosed to investors on such foreign market at least as soon as such information is delivered pursuant to the applicable foreign regulations.
Intervention by the SBS and Liquidation
Pursuant to the Peruvian Banking and Insurance Law, the SBS has the power to interrupt the operations of a bank in order to prevent, or to control and reduce the effects of, a bank failure. Accordingly, the SBS may intervene in a bank’s business by adopting either a temporary surveillance regime or a definitive intervention regime (“Intervention”) depending on how critical the situation is deemed to be by the SBS. Intervention will be taken upon the occurrence of certain events, including (a) suspension of payments, (b) failure to comply with the restructuring plan during the surveillance regime, (c) regulatory capital is less than 50% of the minimum regulatory capital required (d) deficit or reduction of more than 50% of its regulatory capital in a twelve month period. Less drastic measures, such as (1) placing additional requirements, (2) ordering a capital increase or an asset divesture, or (3) imposing a financial restructuring plan, may be also adopted by the SBS when the situation allows for them.
An Intervention may halt a bank’s operations up to 45 days, and may be extended for a second period of up to 45 additional days, during which time the SBS may institute measures such as (a) canceling losses by reducing reserves, capital and subordinated debt, (b) segregating certain assets and liabilities for transfer to another financial institution, and (c) merging the intervened bank with another acquiring institution. After an Intervention, the SBS will proceed to dissolve and liquidate the bank unless the preceding option (c) was applied.
174
Table of Contents
Beginning on the date on which a resolution of the SBS subjecting a bank to an Intervention regime is issued, and continuing until such Intervention is concluded (which period ends when the liquidation process begins), the Peruvian Banking and Insurance Law prevents any creditor of the bank from (a) initiating any judicial or administrative procedure for the collection of any amount owed by the bank, (b) enforcing any judicial decision rendered against the bank to secure payment of any of its obligations, (c) constituting a lien or attachment over any of the assets of the bank to secure payment of any of its obligations, or (d) making any payment, advance or compensation or assuming any obligation on behalf of the bank, with the funds or assets that may belong to it and are held by third parties, except for(i) set-off compensation payments that are made between regulated entities of the Peruvian banking and financial sector and insurance industry, and(ii) set-off of reciprocal obligations arising from repurchase agreements and operations with financial derivates entered into with local or foreign financial and insurance institutions.
During liquidation, claims of bank creditors rank as follows:
First order—Labor claims:
| • | 1stEmployee remunerations. |
| • | 2ndSocial benefits, contributions to the private and public pension system and other labor claims against the bank accrued until the date when the dissolution is declared, retirement pensions or the capital required to redeem those pensions or to secure them by purchasing annuities. |
Second order—Claims for bank deposits and other types of saving instruments provided under the Peruvian Banking and Insurance Law, in the portion not covered by the Deposit Insurance Fund.
Third order—Taxes:
| • | 1st Claims by the Peruvian social security administration (Seguro Social de Salud del Perú EsSalud) related to health care benefits for which the bank is responsible as employer. |
| • | 2nd Taxes. |
Fourth order—Unsecured andnon-privileged credits:
| • | 1st All unsecured andnon-privileged credits against the bank, ranked on the basis of (i) the date they were assumed or incurred by the bank whereby obligations assumed or incurred on an earlier date shall rank senior in right of payment to obligations assumed or incurred by the bank at a later date, and (ii) obligations assumed or incurred by the bank on a date that cannot be determined shall rank junior in right of payment to all the obligations comprised in (i) above andpari passu among themselves. |
| • | 2nd The legal interest on the bank’s obligations that may accrue during the liquidation. |
| • | 3rd Subordinated debt. |
Except for the first and second categories under unsecured andnon-privileged credits, all claims within an order will be rankedpari passu among themselves. Each category of creditors will collect in the order indicated above, whereby distributions in one order will be subject to completing full distribution in the prior order. Any security interest created before the issuance of the resolution declaring the bank’s dissolution and the initiation of the liquidation process shall survive in order to guarantee the obligation it secures. The secured creditors shall retain the right to collect from the proceeds of the sale of the collateral, on a preferred basis (except with respect to labor claims, savings and deposits, which are privileged claims), subject to certain rules established under Article 119 of the Peruvian Banking and Insurance Law.
Peruvian banks are not subject to the regime of insolvency and bankruptcy otherwise applicable to corporations in general.
175
Table of Contents
Insurance Regulation and Supervision
Solvency Requirements and Regulatory Capital
Pursuant to the Peruvian Banking and Insurance Law, the SBS regulates the solvency margin of Peruvian insurance companies. The solvency margin is based upon calculations that take into account the amount of premiums and the medium burden of claims during a specified period prior to date on which calculation is made.
Insurance companies must also maintain a “solvency equity”, which must be equal to the highest of (a) the solvency margin, or (b) the minimum capital requirements, as established by law, or (c) the company’s overall indebtedness, calculated in accordance with provisions of the Peruvian Banking and Insurance Law. The required amount of solvency equity is recalculated at least monthly and is adjusted for inflation. If the insurance company has operations subject to credit risk, part of the solvency equity should be segregated for their coverage.
The Peruvian Banking and Insurance Law provides that insurance companies should have at all times a regulatory capital that should not be lower than the solvency equity, which must be the higher than (a) the solvency margin, or (b) the minimum capital required by law, or S/. 16,186,466.
The regulatory capital of Peruvian insurance companies used to cover its operations may be conformed by: (a) the insurance company’spaid-in-capital, voluntary and legal reserves and premium for the issue of shares; and (b) the computable portion of the subordinate debt meeting SBS requirements that such entity establishes for such purpose. The Peruvian Banking and Insurance Law provides the following procedure for the determination of the regulatory capital eligible to cover insurance risks: (a) sum of thepaid-in-capital, supplementary capital premium, and the legal and voluntary reserves, as applicable; (b) sum of the profit of previous fiscal years and of the fiscal year in course; (c) subtraction of the amount of all the investment in subordinate bonds and shares of diverse nature made by insurance companies in other insurance companies engaged in different lines of business; and (d) subtraction of the losses of the previous fiscal years and the fiscal year in course.
Furthermore, insurance companies shall maintain a guarantee reserve equivalent tothirty-five percent (35%) of its solvency equity as a guarantee fund. According to the Peruvian Banking and Insurance Law, such guarantee fund is different and complementary to the portions of capital respectively directed to (a) constitute the solvency margin of the insurance risks; and, (b) as applicable, to cover credit risks.
Reserves
The Peruvian Banking and Insurance Law provides that insurance companies shall constitute, on a monthly basis, the following technical reserves: (a) for claims, including those that took place and were not reported, past-due capital and income or benefits of the insured parties, with pending liquidation or payment; (b) mathematical, over life or income insurance; (c) for risks in course ornon-accrued premiums; and (d) for catastrophes and uncertain casualty risks.
Article 67 of the Peruvian Banking and Insurance Law also requires that all insurance companies establish a legal reserve by setting aside 10% of adjusted income before taxes, until the reserve reaches at least 35% of their capital stock.
Limit of Indebtedness
Insurance companies may only take credits, in the country or abroad for a sum not exceeding an amount equivalent to its regulatory capital. In case such limit of indebtedness is surpassed, the insurance company shall submit to the SBS a program approved by its board of director establishing the measures adopted to eliminate the excess within a term not exceeding three (3) months.
176
Table of Contents
Investment Requirements
Pursuant to the Peruvian Banking and Insurance Law, the total amount of investments of a Peruvian insurance company shall cover the total amount of technical obligations at all times. For such purposes, technical obligations are defined as the sum of all obligations that an insurance company hasvis-à-vis its insured clients plus the solvency equity, the guarantee fund and the regulatory capital for the economic cycle. The assets covering the technical obligations cannot be subject to any pledge, encumbrance or precautionary measure, which limits its free availability.
Peruvian insurance companies are allowed to invest in certain eligible assets such as instruments issued by the Peruvian Central Government, classified corporate bonds, shares, among others. However, in order to balance levels of risk, applicable regulations have imposed a number of limitations to insurance companies with respect to their investments (by issuer, economic group, type of instrument, nationality, among others. In general terms, no more than 20% of the total amount of an insurance company’s technical obligations may be invested in certain instruments (including, among others, stocks and bonds) issued by the same economic group. The investment regulations further specify that investment policies of Peruvian insurance companies shall consider maximum limits by issuer (calculated over the regulatory capital of each company) depending on the type of investment and the insurance industry in which the company operates. Insurance companies that operate within the life insurance industry cannot invest more than 55% of its regulatory capital innon-liquid shares of the same issuer, or more than 20% of its regulatory capital in debt instruments of the same issuer, among other limitations.
Disclosure of Relevant Information
All insurance companies that are organized as corporations (the only exception being the Peruvian branches of foreign insurance companies) have their shares listed on the Lima Stock Exchange. As a result, they are subject to the disclosure and reporting rules contained in the Peruvian Securities Market Law and the internal regulations of the Lima Stock Exchange.
Under these rules, listed companies such as insurance companies are required to disclose to the market on a timely manner (on the same day when the fact occurs) all information that investors are reasonably likely to consider material. Special regulation provides for specific parameters to determine what is considered relevant information. Insurance companies are also subject to full disclosure and reporting obligations under the insurance regulatory framework.
On March 2014, regulations related to disclosure of material information have been amended. By virtue of such regulations, issuers under supervision of the SMV are required to disclose all material information in connection with the issuer of registered securities (such as our common shares), its activities or securities issued or secured by such issuer which may influence the liquidity or price of such securities must be disclosed.
Also, issuers whose securities are also traded in foreign markets, must file before the SMV all information that is required to be disclosed to investors on such foreign market at least in the same opportunity as such information is delivered pursuant to the applicable foreign regulations.
As explained above, insurance companies are also subject to full disclosure and reporting obligations under the insurance regulatory framework.
177
Table of Contents
Ownership Restrictions
The Peruvian Banking and Insurance Law establishes certain restrictions on the ownership of a bank and insurance company’s capital stock. Banks must have at least two unrelated shareholders at all times. Restrictions are placed on the ownership of shares of any bank or insurance company by persons that have committed certain crimes, as well as by public officials who have supervisory powers over banks or who are majority shareholders of an enterprise of a similar nature. All transfers of shares in a bank or insurance company must be reported to the SBS by the bank or insurance company.
Transfers involving the acquisition by any individual or corporation, whether directly or indirectly, of more than 10% of a bank or insurance company’s capital stock must receive prior authorization from the SBS. The SBS may deny authorization to such transfer of shares if the purchasers (or their shareholders in the case of legal persons) are legally disabled, have engaged in illegal activity in the areas of banking, finance, insurance or reinsurance, or if objections are raised on the basis of the purchaser’s moral fitness or financial solvency. The decision of the SBS on this matter is final, and cannot be overturned in the courts. If a transfer is made without obtaining the prior approval of the SBS, the purchaser may be fined an amount equivalent to the value of the securities transferred. In addition, the purchaser will be required to sell the securities within 30 days, or the fine will double, and the purchaser is disqualified from exercising its voting rights at any shareholders’ meetings and to participate in the distribution of dividends. Foreign investors receive the same treatment as Peruvian nationals and are subject to the same limitations described above.
Risk Rating
The Peruvian Banking and Insurance Law and SBS ResolutionNo. 18400-2010, enacted in December 2010, require that all financial and insurance institutions be rated by at least two rating agencies (registered with the SBS) on a semiannual basis (updated in March and September), in addition to the SBS’s own assessment. Criteria to be considered in the rating include risk management and control procedures, loan quality, financial strength, profitability, liquidity and financial efficiency. Five risk categories are assigned, from “A,” lowest risk, to “E,” highest risk, allowing for subcategories within each letter.
Intervention by the SBS
Pursuant to the Peruvian Banking and Insurance Law, the SBS has the power to interrupt the operations of an insurance company to prevent, or to control and reduce, the effects of its failure. Accordingly, SBS intervention may be of two levels, depending on how critical the situation is: a temporary supervision regime or a definitive intervention regime prior to liquidating the bank or insurance company. Intervention will be taken upon the occurrence of certain events including: (1) payment interruption; (2) failure to comply with the restructuring plan during the surveillance regime; (3) deficit or reduction of more than 50% of its regulatory capital in a twelve month period; or (4) deficit or reduction of its regulatory capital in excess of 50% of its solvency capital.
The intervention regime and the liquidation is the same as the one described above for banking entities. See Regulation and Supervision Section— “The Peruvian Financial System—Intervention by the SBS and Liquidation”.
General Overview of the Bahamian Financial Regulatory Framework
The regulatory framework for the operation of the Bahamian financial sector is set forth in the Central Bank of The Bahamas Act, 2000, as amended, and the Banks and Trust Companies Regulation Act, 2000, as amended. The Central Bank of The Bahamas licenses and supervises all of the banks and trust companies in The Bahamas. Its objectives include promoting and maintaining monetary stability and ensuring a sound financial system through the effective application of international regulatory and supervisory standards. All banks must adhere to the Central Bank of The Bahamas’ licensing and prudential requirements, ongoing supervisory programs and regulatory reporting requirements, and are subject to periodic onsite inspections.
178
Table of Contents
Licensing
Inteligo Bank has been granted a banking license by the Central Bank of The Bahamas and an International Banking License by the Superintendency of Banks of Panama. Under the BTCRA, the Central Bank of The Bahamas may revoke the license of a licensee if:
| • | in the opinion of the Central Bank of The Bahamas, the licensee (i) is carrying on its business in a manner detrimental to the public interest or the interests of its depositors or other creditors or (ii) contravening the provisions of Bahamian banking law or any other law, order or regulations made thereunder, or any term or condition subject to which the license was issued, either in The Bahamas or elsewhere; (iii) if Inteligo Bank has ceased to carry on its banking business; or (iv) if Inteligo Bank becomes bankrupt or goes into liquidation or is wound up or otherwise dissolved. |
| • | if the licensee has ceased to carry on banking business or trust business; or |
| • | if the licensee becomes bankrupt or goes into liquidation or is wound up or otherwise dissolved. |
Banking Regulation and Supervision
Banking regulations on capital adequacy and regulatory framework in The Bahamas take into account the recommendations of the Basel Committee. The Central Bank of The Bahamas has adopted a Basel Implementation Program (the “Program”) comprising elements of both the Basel II and Basel III frameworks that will be appropriate to the types of banks and the scale of their operations in The Bahamas. The Central Bank of The Bahamas proposes to stage the implementation of the Program in three phases within a thirty (30) month timeline, which commenced during the fourth quarter of 2013 and is expected to conclude with live implementation during the first quarter of 2016.
Corporate Governance
TheGuidelines for the Corporate Governance of Banks and Trust Companies Licensed to Do Business Within and From Within The Bahamas, issued by the Central Bank of The Bahamas, list the minimum standards that banks must adopt in respect of their corporate governance framework. Generally, the guidelines require the board of directors to develop and implement policies and procedures to ensure (i) the competence and independence of board members, (ii) proper management of strategic, business andprocess-level risks, (iii) compliance with applicable laws, regulations and guidelines, and (iv) ongoing reporting to the Central Bank of The Bahamas.
Limits on Large Exposures
Pursuant to the Banks and Trust Companies (Large Exposures) (Amendment) Regulations, 2012, no bank shall (i) incur exposures to any individual counterparty or group of connected parties which in the aggregate exceedtwenty-five percent of the bank’s capital base, (ii) holdnon-capital investments in securities of a single issuer which exceed ten percent of the bank’s capital base, (iii) incur exposures to its related parties which in the aggregate exceed fifteen percent of the bank’s capital base, (iv) incur exposures to related parties unless approved by the bank’s board of directors and negotiated on an arm’s length basis, or (v) incurnon-exempt large exposures which in the aggregate exceed eight hundred percent of its capital base. There are certain exemptions listed in the regulations and the Central Bank of The Bahamas may also exempt a bank from the exposure limits outlined in the regulations in certain circumstances.
Classification of Impaired Assets
TheGuidelines for the Measurement, Monitoring and Control of Impaired Assets, issued by the Central Bank of The Bahamas, provide the Central Bank of The Bahamas’ minimum requirements for the recognition, measurement and classification of impaired assets. An impaired asset is defined as an asset where there is no
179
Table of Contents
longer a reasonable assurance of timely collection of the full amount of principal and interest due to a deterioration of credit quality of the counterparty. Banks are required to follow the requirements of the International Financial Reporting Standards relating to impaired assets, in particular International Accounting Standards 18, 36 and 39.
Credit Risk
TheGuidelines for the Management of Credit Risk, issued by the Central Bank of The Bahamas, require banks to have a written statement of their credit risk strategy and policies and procedures to implement the strategy. The strategy and policies should be approved by the board of directors and should be consistent with the bank’s degree of risk tolerance, the level of capital available for credit activities and credit management expertise. The Central Bank of The Bahamas endorses the Basel Committee’sPrinciples for the Management of Credit Risk (September 2000).
Market Risk
TheGuidelines on the Management of Market Risk, issued by the Central Bank of The Bahamas, require banks that meet the stated threshold tests to establish sound policies and procedures for the management of market risk, to be supervised and controlled by the board of directors and senior management. Market risk is defined as the risk of losses in on and off-balance sheet positions arising from movements in market prices.
Operational Risk
TheGuidelines for the Management of Operational Risk, issued by the Central Bank of The Bahamas, require senior management of a bank, under the approval of the board of directors, to develop and implement an operational risk management framework that explicitly recognizes operational risk as a distinct risk to the institution and aims to effectively manage it. Operational risk is defined as the risk of loss resulting from inadequate or failed internal processes, people and systems from external events. The guidelines are based upon thePrinciples for the Sound Management of Operational Risk, issued by the Basel Committee on Banking Supervision in 2011.
Country Risk
TheGuidelines for the Management of Country Risk, issued by the Central Bank of The Bahamas, require banks to have a risk management process that focuses on the broadly defined concept of country risk and addresses certain minimum requirements listed therein. The guidelines reference the Basel Committee’sCore Principles for Effective Banking Supervision.
Anti-Money Laundering Laws and Regulations
Money laundering is a criminal act in The Bahamas. The laws of The Bahamas concerning money laundering and combatting the financing of terrorism are contained in the following legislation, as amended: (i) the Proceeds of Crime Act, 2000; (ii) theAnti-Terrorism Act, 2004; (iii) the Financial Transactions Reporting Act, 2000; (iv) the Financial Transaction Reporting Regulations, 2000; (v) the Financial Transactions Reporting (Wire Transfers) Regulations, 2009; (vi) the Financial Intelligence Unit Act, 2000; and (vii) the Financial Intelligence (Transactions Reporting) Regulations, 2001. TheGuidelines for Licensees on the Prevention of Money Laundering & Countering the Financing of Terrorism, issued by the Central Bank of The Bahamas, apply specifically to banks and other licensees of the Central Bank of The Bahamas. The guidelines require banks to establish clear responsibilities and accountabilities toensure that policies, procedures and controls which deter criminals from using their facilities for money laundering or the financing of terrorism, are implemented andmaintained, thus ensuring that theycomply with their obligations under the law. Banks must have in place sufficient controls and monitoring systems for timely detection and reporting of suspicious activities, proper verification of their customers’ identities, record keeping in accordance with applicable laws, and ongoing education and training for its employees.
180
Table of Contents
External Auditors
The Guidelines on the Relationship between External Auditors of Licensees and the Central Bank of The Bahamas, issued by the Central Bank of The Bahamas, require banks to inform the Central Bank of The Bahamas of the appointment of their external auditors. In addition to listing certain criteria to be used when appointing external auditors, the guidelines also provide examples of facts and matters of material significance that must be reported by an external auditor to the Central Bank of The Bahamas, such as material misstatements in financial statements or evidence of fraudulent activities. The guidelines take into account the aspects of the Basel Committee’s paper, The Relationship Between Banking Supervisors and Banks’ External Auditors (2002).
181
Table of Contents
General
Our business and affairs are managed by our board of directors in accordance with our articles of incorporation and Panamanian Corporate Law. Our articles of incorporation provide for a board of directors of no less than three members.
Our current board of directors is comprised of five directors and no alternates. We may increase the size of our board of directors prior to the effective date of our registration statement. If a director resigns or otherwise becomes unable to continue with its duties, a majority of our directors may appoint any other person to serve as director for the remaining term of the board.
The board of directors may establish one or more committees, to which it may delegate any or all of its responsibilities. Each committee shall be composed by two or more directors.
The board of directors typically meets in regularly scheduled quarterly meetings and when called by any director or our Chief Executive Officer. Resolutions must be adopted by a majority of the directors present at the meeting.
Board of Directors
Upon consummation of this offering, our board of directors will consist of five members, three of whom will be independent. The business address of our board of directors is Av. Carlos Villarán 140, Urbanización Santa Catalina, La Victoria, Lima 13, Peru. The following table sets forth certain information about our current directors.
Name | Position | Year of Birth | Year Appointed | |||||||
Carlos Rodríguez Pastor Persivale | Chairman | 1959 | 2007 | |||||||
Felipe Morris Guerinoni(1) | Secretary | 1953 | 2007 | |||||||
Ramón Barúa Alzamora | Treasurer | 1946 | 2006 | |||||||
Alfonso de los Heros Pérez Albela(1) | Director | 1939 | 2009 | |||||||
Alfonso Bustamante y Bustamante(1) | Director | 1941 | 2007 | |||||||
| (1) | Independent director. |
Carlos Rodríguez Pastor Persivale has served as IFS’s chairman since 2007. He also serves as Interbank’s chairman since 1995 and was Interbank’s interim Chief Executive Officer during 2010. In addition, Mr. Rodríguez Pastor serves as director of Intercorp Peru, Interbank, Inteligo Bank, Interseguro, Supermercados Peruanos, InRetail Peru Corp. Royalty Pharma and Financiera Uno S.A. Mr. Rodríguez Pastor received a bachelor’s degree in social science from the University of California at Berkeley and a master’s degree in business administration from the Amos Tuck School of Business at Dartmouth College.
Felipe Morris Guerinoni has served as one of IFS’s directors since 2007. Mr. Morris also serves as Interseguro’s Chairman and serves as a director of Interbank, Intercorp Peru, Inteligo Bank, Interseguro, and Financiera Uno S.A. Mr. Morris received a degree in economics from the Universidad del Pacífico in Lima, a masters in economics from the University of Pittsburgh and a master’s degree in finance from American University.
Ramon Barúa Alzamora has served as one of IFS’s directors since 2006. In addition, Mr. Barúa is the Chief Executive Officer of Intercorp Peru and serves as a director of Interbank, Intercorp Peru, Inteligo Bank, Interseguro, Intertítulos, Interfondos, Urbi Propiedades S.A., InRetail Peru Corp. and Financiera Uno S.A. Mr. Barúa received a degree in industrial engineering from the Universidad Nacional de Ingeniería in Lima and a degree in economics from the Université Catholique de Louvain in Belgium.
182
Table of Contents
Alfonso de los HerosPérez-Albela has served as one of IFS’s directors since 2009. Mr. de los Heros also serves as director of Interbank. Mr. de los Heros has been Prime Minister of Peru(1991-1992) and currently is a partner at Estudio Echecopar and also serves as a director of various Peruvian companies. Mr. de los Heros received a degree in law from the Pontificia Universidad Católica del Perú.
Alfonso Bustamante y Bustamante has served as one of IFS’s directors since March 2007. Mr. Bustamante is the President of the Board of Corporación Financiera de Inversiones S.A.A., Indeco S.A., Agrícola Mochica S.A.C., Peruplast S.A. and also serves as a director of several other Peruvian companies, including La Positiva Seguros y Reaseguros S.A., Interbank and Empresa Eléctrica de Piura S.A. Mr. Bustamante has been Prime Minister of Peru(1993-1994) and Minister of Industry and Tourism(2003-2004), President of Prom Perú, President of ASBANC, and President of the Board of Directors of Telefónica del Perú and Bancosur, formerly Banco del Sur del Perú, S.A. Mr. Bustamante received a degree in agricultural engineering from the Universidad Nacional Agraria La Molina in Lima and pursued his graduate studies at the University of Michigan, Ann Arbor.
Executive Officers
The business address of our executive officers is Av. Carlos Villarán 140, Urbanización Santa Catalina, La Victoria, Lima 13, Peru. The following table sets forth certain information about our executive officers.
Name | Position | Year of Birth | Year Appointed | |||||||
Luis Felipe Castellanos López Torres | Chief Executive Officer | 1970 | 2013 | |||||||
Gonzalo Basadre Brazzini | Deputy Chief Executive Officer | 1970 | 2013 | |||||||
Michela Casassa Ramat | Chief Financial Officer | 1973 | 2012 | |||||||
Liliana Elcira Vera Villacorta | Chief Accounting Officer | 1974 | 2007 | |||||||
Juan Antonio Castro Molina | General Counsel | 1971 | 2007 | |||||||
Ernesto Giancarlo Ferrero Merino | Investor Relations Officer | 1973 | 2014 | |||||||
Luis Felipe Castellanos López Torres has served as IFS’s Chief Executive Officer since April 2013 and as Interbank’s Chief Executive Officer since January 2011. Mr. Castellanos joined Interbank in 2006 as the Chief Executive Officer of Interfondos. He has served as Interbank’s Vice President for Retail Banking and Manager of the Mortgage and Real Estate Division. Previously, he was a Director in the investment banking division at Citigroup Global Markets in New York. Before joining Citigroup, Mr. Castellanos was responsible for the treasury department at Minera Yanacocha S.A. Mr. Castellanos received a bachelor’s degree in business administration from the Universidad del Pacífico and a master’s degree in business administration from the Amos Tuck School of Business at Dartmouth College.
Gonzalo Basadre Brazzini has served as IFS’s Deputy Chief Executive Officer since April 2013. Mr. Basadre is also Interseguro’s General Manager (Chief Executive Officer) of Interseguro since 2012 and served as Vice President of Investments (Chief Investment Officer) of Interseguro. He received a degree in business administration from the Universidad del Pacífico in Lima and a master’s degree of business administration from Harvard University.
Michela Casassa Ramat has served as IFS’s Chief Financial Officer since September 2012 and as Interbank’s Chief Financial Officer since September 2012. Mrs. Casassa joined Interbank in September 2011 as Head of Strategic Planning. Prior to joining Interbank, she served as Head of Strategy for Corporate and Investment Banking at Banco de Crédito del Perú in Lima and Unicredit in Munich, and Head of Strategy for the International Division of Unicredit in Milan and Istanbul. She has also worked at The Boston Consulting Group in Milan and Citibank in Lima. Mrs. Casassa holds a bachelor’s degree in business administration from the Universidad de Lima and an MBA with a specialization in finance from the SDA Bocconi in Milan.
Liliana Elcira Vera Villacorta has served as IFS’s Chief Accounting Officer since our formation. Ms. Vera has served as Accounting Manager of Interbank since 2003. From 1998 to 2002, Ms. Vera worked for Medina,
183
Table of Contents
Zaldivar, Paredes & Asociados, a member firm of Ernst & Young Global, as a senior analyst. Ms. Vera received a degree in accounting from the Pontificia Universidad Católica del Perú and a master’s degree in Business Administration from INCAE Business School.
Juan Antonio Castro Molina has served as IFS’s General Counsel since our formation and currently serves as IFS’s principal stock market representative. Mr. Castro previously worked for Wilmer, Cutler, Pickering, Hale and Dorr in Washington D.C. and was chief of staff to the Prime Minister of Peru(2001-2002). Mr Castro received a degree in law from the Pontificia Universidad Católica del Perú, a master of laws from the University of Virginia,where he attended as a Fulbright scholar, and has attended senior management programs at Harvard Business School and The Wharton School of Business at the University of Pennsylvania. Mr. Castro is a professor in the Master of Laws Program at the Universidad de Lima.
Ernesto Giancarlo Ferrero Merino. Mr. Ferrero was appointed IFS’s Investor Relations Officer in July 2014. He also serves as Interbank’s Head of Financial Management since February 2012. Mr. Ferrero joined Interbank in November 2010 as Deputy Head of Corporate Finance. Prior to joining Interbank, he worked as Corporate and Investment Banking Vice President at BBVA Banco Continental and General Manager at BBVA Continental Bolsa. Mr. Ferrero holds a bachelor’s degree in economics from the Universidad del Pacifico, as well as a master’s degree in business administration from the Rotterdam School of Management at Erasmus University, The Netherlands.
Interbank
Board of Directors
Interbank’s board of directors consists of eleven members, seven of whom are independent. The business address of Interbank’s board of directors is Av. Carlos Villarán, Urbanización Santa Catalina, La Victoria, Lima 13, Peru. The following table sets forth certain information about our directors as of the date of this prospectus.
Name | Position | Year of Birth | Year Appointed | |||||||
CarlosRodríguez-Pastor Persivale | Chairman | 1959 | 1995 | |||||||
Augusto Baertl Montori(1) | Director | 1943 | 2002 | |||||||
Ramón Barúa Alzamora | Director | 1946 | 1994 | |||||||
Alfonso de los HerosPérez-Albela | Director | 1939 | 1994 | |||||||
David Fischman Kalincausky(1) | Director | 1958 | 2003 | |||||||
Felipe Morris Guerinoni(1) | Director | 1953 | 2000 | |||||||
Ricardo Briceño Villena(1) | Director | 1947 | 2010 | |||||||
Alfredo Gastañeta Alayza(1) | Director | 1950 | 2004 | |||||||
Alfonso Bustamante y Bustamante | Director | 1941 | 2007 | |||||||
Carmen Rosa Graham Ayllón(1) | Director | 1958 | 2007 | |||||||
Fernando Zavala Lombardi(1) | Director | 1971 | 2011 | |||||||
| (1) | Independent director. |
The following sets forth selected biographical information for each of the members of Interbank’s board of directors.
CarlosRodríguez-Pastor Persivale. See “—General—Board of Directors”.
Augusto Baertl Montori has served as one of Interbank’s directors since 2002. Mr. Baertl also serves as a director of several other Peruvian companies, including Gestora de Negocios e Inversiones S.A., Fima S.A., and Graña y Montero S.A. Mr. Baertl received an engineering degree from the Universidad Nacional de Ingeniería in Lima and has attended senior management programs at Harvard University and Northwestern University.
184
Table of Contents
Ramon Barúa Alzamora. See “—General—Board of Directors”.
Alfonso de los HerosPérez-Albela. See “—General—Board of Directors”.
David Fischman Kalincausky has served as one of Interbank’s directors since 2003. Mr. Fischman also serves as a director of Supermercados Peruanos. Mr. Fischman received a degree in civil engineering from Georgia Tech University and a master’s degree in business administration from Boston University.
Felipe Morris Guerinoni. See “—General—Board of Directors”.
Ricardo Briceño Villena was elected Interbank’s director in March 2010. Mr. Briceño presided at the National Mining, Petroleum and Energy Association(2001-2002) and was President of the National Confederation of Private Companies for the period2009-2011. Mr. Briceño holds a degree as an industrial engineer from the Universidad Nacional de Ingeniería, in Lima; a Diploma on Economic Development from the Université Catholique de Louvain in Belgium and a master’s degree in Development Planning and Public Finance from the Universiteit Antwerpen.
Alfredo Gastañeta Alayza has served as one of Interbank’s directors since 2004. Mr. Gastañeta is a partner at Estudio Aurelio García Sayán Abogados and also serves as a director of various Peruvian companies, including Cementos Lima S.A., Sindicato de Inversiones y Administración S.A., Central Hidroeléctrica El Platanal S.A., Nuevas Inversiones S.A. and Union de Concreteras S.A. Mr. Gastañeta received a law degree from the Pontificia Universidad Católica del Perú.
Alfonso Bustamante y Bustamante. See “—General—Board of Directors”.
Carmen Rosa Graham Ayllón has served as one of Interbank’s directors since March 2007. Ms. Graham is a business consultant and a member of the board of directors of Ferreycorp S.A., Nextel S.A., Patronato Pro Universidad del Pacífico and Fundación Empresarios por la Educación. Ms. Graham also serves as President of Fundación Backus. Ms. Graham was President of Universidad del Pacífico(2007-2009). From 1981 to 2005, Ms. Graham worked for IBM, where she was CEO of IBM Colombia (from1999-2001), CEO of IBM Perú and Bolivia (from2001-2003) and Regional Director of Strategy(2004-2005). Ms. Graham received a bachelor’s degree in business administration from the Universidad del Pacífico in Lima and a master’s degree in business administration from Adolfo Ibañez School of Business in Miami. Ms. Graham has completed several management trainings at IBM Corporation and advanced programs at Georgetown University, Harvard University, Universidad Monterrey and Universidad de Piura.
Fernando Zavala Lombardi has served as one of Interbank’s directors since 2011. Mr. Zavala also serves as a director of Enersur S.A. From 2005 to 2006, Mr. Zavala served as Finance Minister for the Republic of Peru. Mr. Zavala has worked for different companies of SABMiller plc. He joined Unión de Cervecerías Peruanas Backus y Johnston S.A.A as Vice President of Corporate Affairs in 2006, and was appointed President of Cervecería Nacional (Panamá) in 2009. In 2013, Mr. Zavala returned to Peru to serve as President of Unión de Cervecerías Peruanas Backus y Johnston S.A. Mr. Zavala holds a degree in economics from the Universidad del Pacífico and a master’s degree in business administration from Birmingham University in the United Kingdom.
185
Table of Contents
Executive Officers
The business address of Interbank’s executive officers is Av. Carlos Villarán 140, Urbanización Santa Catalina, La Victoria, Lima 13, Peru. The following table sets forth certain information about Interbank’s executive officers as of the date of this prospectus.
Name | Position | Year of Birth | Year Appointed | |||||||
Luis Felipe Castellanos López Torres | Chief Executive Officer | 1970 | 2011 | |||||||
Michela Casassa Ramat | Chief Financial Officer | 1973 | 2013 | |||||||
Fernando Ríos Sarmiento | Vice President of Retail Business | 1970 | 2014 | |||||||
Gabriela Prado Bustamante | Vice President of Risk Management | 1970 | 2008 | |||||||
Carlos Cano Núñez | Vice President of Commercial Banking | 1954 | 2011 | |||||||
Alfonso Grados Carraro | Vice President of Operations | 1955 | 2007 | |||||||
Giorgio Bernasconi Carozzi | Vice President of Capital Markets | 1961 | 2009 | |||||||
Carlos Tori Grande | Vice President of Distribution Channels | 1976 | 2014 | |||||||
ZelmaAcosta-Rubio Rodríguez | General Counsel | 1965 | 2007 | |||||||
Susana Llosa de Cárdenas | Manager of Human Resources | 1955 | 2000 | |||||||
Luis Felipe Castellanos López Torres. See “—General—Executive Officers”.
Michela Casassa Ramat. See “—General—Executive Officers”.
Fernando Ríos Sarmiento has served as Interbank’s Vice President of Retail Business since January 2014. Mr. Ríos joined Interbank in 2012 as Head of Credit Card and Personal Loans Business. Prior to 2012, he served as Private Banking Manager at Inteligo. Mr. Ríos currently serves as a director in several companies related to Interbank, including Visanet S.A.C., Procesos MC Perú S.A.C. and Expressnet S.A.C. Before joining Interbank, Mr. Ríos also worked for Banco de Crédito del Perú. Mr. Ríos received a bachelor’s degree in civil engineering from the Universidad de Piura and a master’s degree in business administration from the Universidad dePiura-IESE.
Gabriela Prado Bustamante has served as Interbank’s Vice President of Risk Management since July 2008. Previously, Ms. Prado was responsible for Interbank’s Special Asset Management Division. From 2000 to 2004, Ms. Prado served as Manager of Interbank’s Risk Management Division, which is responsible for monitoring customer performance. Ms. Prado received a bachelor’s degree in business administration from the Universidad de Lima, and a graduate degree in business administration from the INCAE Business School.
Carlos Cano Nuñez has served as Interbank’s Vice President for Commercial Banking since January 2011. Mr. Cano joined Interbank in 2002, as Vice President for Retail Banking and Marketing. Mr. Cano also serves as a director of Interfondos. Before joining Interbank, Mr. Cano was the Chief Executive Officer of Santander Leasing. Mr. Cano received a degree in commercial engineering from the Universidad Nacional de Ingeniería in Lima, and a master’s degree in business administration from Adolfo Ibañez School of Business in Miami.
Alfonso Grados Carraro has served as Interbank’s Vice President for Operations since May 2007. From 1981 to 2004, Mr. Grados worked for different companies of the Backus Brewery Corporation (“Backus”) in Peru. At Backus, Mr. Grados served as Chief Executive Officer of Cervecera del Sur S.A., Corporate Controller of Corporación Backus S.A., Corporate Director for Human Resources of Backus & Johnston S.A.A. and Administrative and Financial Director of Compañía Nacional de Cerveza S.A. More recently, Mr. Grados was the Chief Executive Officer of the Institute for Liberty and Democracy. Mr. Grados received a degree in business administration from the Universidad del Pacífico, and a master’s degree in business administration from Adolfo Ibañez School of Business in Miami.
Giorgio Bernasconi Carozzi has served as Interbank’s Vice President for Capital Markets since March 2009. Prior to joining Interbank, Mr. Bernasconi served as Director in Strategy and Marketing, Global Markets and
186
Table of Contents
Distribution for Latin America and was responsible for Latin American capital markets at BBVA Bancomer in México. From 1997 to 2006, he was Deputy General Manager for BBVA Banco Continental. He previously served as Treasury Vice President for Citibank Lima. Mr. Bernasconi has a bachelor’s degree in administration from the Pontificia Universidad Católica del Perú.
Carlos Tori Grande has served as Interbank’s Vice President for Distribution Channels since February 2014. Mr. Tori joined Interbank in 2009 as Head of the Corporate Finance team. Prior to 2009, he served as Investment Banking Associate at Merrill Lynch’s Financial Institutions Group. Mr. Tori currently serves as a director in several companies related to Interbank, including Interfondos, Transferencia Electrónica de Beneficios S.A.C., Servicio de Transferencia Electrónica de Beneficios y Pagos S.A.C. and local credit card acquirers, such as Procesos MC Perú S.A.C. and Expressnet S.A.C. Prior to joining Interbank, Mr. Tori also worked for Citigroup and BankBoston. Mr. Tori received a bachelor’s degree in business administration from Texas A&M University and a master’s degree in business administration from the Amos Tuck School of Business at Dartmouth College.
Zelma Acosta-Rubio Rodríguez has served as Interbank’s General Counsel and Secretary of the Board of Directors since April 2007. Mrs. Acosta—Rubio also serves as a director of several related companies of Interbank, including, La Fiduciaria S.A. and Intertitulos S.A. Before joining Interbank, Mrs. Acosta Rubio worked at Clifford Chance in London and Milbank, Tweed, Hadley & McCloy in New York. Mrs. Acosta Rubio received a law degree from the Universidad Catolica Andres Bello in Caracas, a master’s degree in comparative jurisprudence from New York University; a master’s degree in international banking law from Morin Center for Banking and Financial Law at Boston University and a master’s degree in business administration from the Management School at Universidad de Piura. Mrs. Acosta Rubio is admitted to the New York State Bar.
Susana Llosa de Cárdenas has served as Interbank’s Human Resources Manager since 2000. Previously, Ms. Llosa served as a Customer Service Quality Manager. Before joining Interbank, Ms. Llosa was a small business entrepreneur. Ms. Llosa has a degree in small business administration from the Universidad del Pacífico in Lima and a master’s degree in business administration from the INCAE Business School.
Interseguro
Board of Directors
Interseguro’s board of directors for 2014 consists of six principal members and one alternate member, three of whom will be independent. The business address of Interseguro’s board of directors is Avenida Pardo y Aliaga No. 634, San Isidro, Lima 27, Peru. The following table sets forth certain information about Interseguro’s directors as of the date of this prospectus.
Name | Position | Year of Birth | Year Appointed | |||||||
Felipe Morris Guerinoni(1) | Chairman | 1953 | 1998 | |||||||
Carlos Rodríguez Pastor Persivale | Director | 1959 | 1998 | |||||||
Ramón Barúa Alzamora | Director | 1946 | 2000 | |||||||
Juan Carlos Vallejo Blanco | Director | 1964 | 2012 | |||||||
Raúl Musso Vento(1) | Director | 1954 | 2000 | |||||||
Guillermo Martínez Barros(1) | Director | 1958 | 2008 | |||||||
Carlos Saco-Vertiz Tudela(1) | Alternate Director for Mr. Guillermo Martínez Barros | 1961 | 2013 | |||||||
| (1) | Independent director. |
187
Table of Contents
The following sets forth selected biographical information for each of the members of Interseguro’s board of directors.
Felipe Morris Guerinoni. See “—General—Board of Directors”.
Carlos Rodríguez Pastor Persivale. See “—General—Board of Directors”.
Ramon Barúa Alzamora. See “—General—Board of Directors”.
Juan Carlos Vallejohas served as one of Interseguro’s directors since 2012. In addition, Mr. Vallejo is the General Manager of Supermercados Peruanos, and serves as a director of Urbi Propiedades S.A., Financiera Uno S.A. and Inmobiliaria Milenia S.A. Mr. Vallejo received a degree in industrial engineering from the Universidad de Chile and a master’s degree in business administration from INCAE Business School in Costa Rica.
Raúl Musso Ventohas served as one of Interseguro’s directors since 2000 and currently is the Chief Executive Officer of Industrias Electro Químicas S.A. Mr. Musso served as a director of Urbi Mercados S.A. (from 1999 to 2000), as the General Manager of LP Holding S.A. (from1998-1999), and as theVice-President of Bankers Trust Company. Mr. Musso received a degree in economics from the Universidad del Pacífico and a master’s degree in economics from the University of Pittsburgh.
Guillermo Martínez Barros has served as one of Interseguro’s directors since 2008. In addition, Mr. Martínez serves as director of Financiera Uno S.A., Isapre Consalud in Chile, PrimAmérica Consultores S.A. in Chile and PrimAmérica Capacitación S.A. in Chile. Mr. Martínez is also the chairman and owner of Inmobiliaria e Inversiones Siete Mares S.A., the chairman of Scan S.A., Ebench S.A. and Redlegal S.A. in Chille. In addition he is a Professor of Finance at the MBA Programme of Universidad Gabriela Mistral in Chile. Mr. Martínez received a degree in economics from the Universidad Católica de Chile, a master’ degree in business administration from the University of Chicago and a master’s degree in economics from the London School of Economics.
Carlos Saco-Vertiz Tudela has served as an alternate director of Interseguro’s since 2013. In addition, Mr. Saco-Vertiz has served as a director of Financiera Uno S.A., Tiendas Peruanas S.A., Supermercados Peruanos S.A. and Homecenters Peruanos S.A. Mr. Saco-Vertiz received a law degree from the Pontificia Universidad Católica del Perú and graduated from the Senior Management Program (PAD) of the Universidad de Piura.
Executive Officers
The business address of Interseguro’s executive officers is Avenida Pardo y Aliaga No. 634, San Isidro, Lima 27, Peru. The following table sets forth certain information about Interseguro’s executive officers.
Name | Position | Year of Birth | Year Appointed | |||||||
Gonzalo Basadre Brazzini | Chief Executive Officer | 1970 | 2012 | |||||||
Juan Carlos Motta Flores | Vice President of Operations and Actuarial Studies | 1963 | 2011 | |||||||
María del Carmen Rocha Bedoya | Chief Financial Officer | 1971 | 2013 | |||||||
Enrique Espinoza Aguayo | Vice President of Investments | 1977 | 2010 | |||||||
Carlos Chamochumbi Macchiavello | Commercial Vice President | 1967 | 2010 | |||||||
Walter Montero Marcos | Vice President of Information Technology | 1963 | 2011 | |||||||
Gonzalo Basadre Brazzini. See “—General—Executive Officers”.
Juan Carlos Motta Flores is Interseguro’s Vice President of Operations and Actuarial Studies since 2011 and former Manager of Operations and Tecnique. Mr. Motta received a degree and a master’s degree in economics, both from the Universidad Católica de Chile.
188
Table of Contents
María del Carmen Rocha Bedoya is Interseguro’s Chief Financial Officer since 2013. Miss Rocha received a degree in industrial engineering from the Pontificia Universidad Católica del Perú and a master’s degree of business administration from INSEAD Business School in France.
Enrique Espinoza Aguayo is Interseguro’s Vice President of Investments (Chief Investment Officer) since 2012 and former Division Manager of Investments Table. Mr. Espinoza received a degree in economics from the Universidad del Pacífico in Lima and a master’s degree of business administration from Wharton School, University of Pennsylvania in the United States of America.
Carlos Chamochumbi Macchiavello is Interseguro’s Commercial Vice President since 2011 and former Commercial Manager. Mr. Chamochumbi received a degree in industrial engineering from the Universidad de Lima and a master’s degree of business administration from the Universidad de Piura in Lima.
Walter Montero Marcos is Interseguro’s Vice President of Information Technology since 2011. Mr. Montero received a degree in mathematics and statistics and a master’s degree in computer sciences, both from the Pontificia Universidad Católica del Perú, a master’s degree in computer science from the Universidad de Cantabria in Spain, and a master’s degree in business administration from INCAE Business School in Costa Rica.
Inteligo
Board of Directors
Inteligo’s board of directors consists of three members, none of whom are independent. The business address of Inteligo’s board of directors is Calle 50 y Calle 74, PH 909, Piso 16, Panama City, Panama. The following table sets forth certain information about Inteligo’s directors as of the date of this prospectus.
Name | Position | Year of Birth | Year Appointed | |||||||
Roberto Hoyle Mc Callum | Chairman | 1949 | 2014 | |||||||
Carlos Rodriguez Pastor Persivale | Vice President | 1959 | 2007 | |||||||
Ramón Barúa Alzamora | Director—Secretary—Treasurer | 1946 | 2006 | |||||||
The following sets forth selected biographical information for each of the members of Inteligo’s board of directors.
Roberto Hoyle Mc Callumhas served as Chairman of Inteligo since February 2014. He also serves as Director of Inteligo SAB and Inteligo Bank. With over 40 years experience in international banking, he is DirectorTreasurer of the Peruvian North American Binational Center, Director of Vida Peru, and Executive Director of Lima Chambers of Commerce. He served as President of the Lima Stock Exchange between 2008 and 2013, Director of the Lima Stock Exchange between 2006 and 2008, Director of CAVALI between 2004 and 2006, Chairman of in Peru Board of Director, Executive Committee Member of the Iberian American Federation of Stock Exchanges (FIAB) between 2011 and 2013, Chairman of the Board of Datatec between 2008 and 2013. Mr. Hoyle received a degree in business administration from Northwood Institute of Lima, Peru and a degree in electronic engineering from the Universidad Ricardo Palma. Mr. Hoyle completed advance degree programs on banking and finance at IRI (Rome, Italy) and graduated from the Senior Management Program (PAD) of the Universidad de Piura.
Carlos Rodríguez Pastor Persivale. See “—General—Board of Directors”.
Ramón Barúa Alzamora. See “—General—Board of Directors”.
189
Table of Contents
Executive Officers
The business address of Inteligo’s executive officers is Calle 50 y Calle 74, PH 909, Piso 16, Panama City, Panama. The following table sets forth certain information about Inteligo’s executive officers.
Name | Position | Date of Birth | Year Appointed | |||||||
Reynaldo Roisenvit Grancelli | Chief Executive Officer | 1969 | 2014 | |||||||
Bruno Ferreccio del Río | Chief Financial Officer | 1976 | 2014 | |||||||
Jorge Velarde Benavides | Chief Investment Officer | 1977 | 2014 | |||||||
Enrique Spihlmann Denegri | Chief Commercial Officer | 1967 | 2014 | |||||||
Raúl Iñigo Tizón | Chief Operations Officer | 1950 | 2014 | |||||||
Ximena Benavides Reverditto | General Counsel | 1978 | 2014 | |||||||
Reynaldo Roisenvit Grancelli has served as Inteligo’s Chief Executive Officer since February 2014. He also serves as Inteligo SAB’s Chief Executive Officer since January 2011. He is also a Director of Inteligo Bank since 2003, member of the Investment Committee of Interseguro, member of Corporate Governance Committees of Inteligo Bank and Director of CAVALI. He has previously served as Deputy CEO of Inteligo SAB, Chief of Research of Interfip Bolsa, CEO of Interfip Bolsa, Products Manager of Private Banking at Interbank, and Portfolio Manager of Global Investment Advisory Group at the Compass Group, in New York. Mr. Roisenvit received a degree in economics from the Universidad de Lima and a master’s degree in business administration from Columbia Business School.
Bruno Ferreccio del Ríohas served as Inteligo’s Chief Financial Officer since March 2014. He also serves as Inteligo SAB’s Financial Vice President since April 2014 and CEO of Inteligo Real Estate Peru. Before joining Inteligo in June 2010 as Inteligo SAB’s Financial Manager and Chief of Products, Mr. Ferreccio worked asVice-president of Futures and Derivates in Commodities at AAKOP LLC, Associate of Futures and Derivates in Basic Metals at AAKOP LLC in New York, and Resident Engineer of HV S.A. CONTRATISTAS in Peru. He received a bachelor’s degree in civil engineering from the University of Texas, Austin and a master’s degree in business administration from the University of Michigan.
Jorge Velarde Benavideshas served as Inteligo’s Chief Investment Officer since March 2014. He also serves as Inteligo SAB’s Investments Vice President since April 2014. Before joining Inteligo in 2008 as Inteligo SAB’s Products and Investment Manager, he worked as Investments Manager of Rimac International, Investments Manager of Larrain Vial, Portfolio Administrator of Profuturo AFP, Investment Analyst and Credit Analyst of Banco Sudamericano and Investment Analyst at Intercapital SAB. He received a degree in economics from the Universidad del Pacifico and a master’s degree in finance from the London Business School.
Enrique Spihlmann Denegrihas served as Inteligo’s Chief Commercial Officer since March 2014. He also serves as Inteligo SAB’s Commercial Vice President since April 2014. Before joining Inteligo in 2013 as Inteligo SAB’s Commercial Manager, he worked as Head Corporate Redesign and Strategic Planning of Scotiabank Costa Rica, Vice President and Head of Wealth Management of Scotiabank Costa Rica for Costa Rica and El Salvador, CEO of Scotia Bolsa S.A. Peru, CEO of Scotia Fondos S.A.A. Peru, CIO of TBK Investments Inc., Treasury Head of Tribank International (Cayman) Limited, Treasury Head of NBK Bank, Treasury Head of Bank Boston – Peru’s Branch, and Treasury and FX Trading Deputy Manager of Banco de Lima Sudameris. He served as a Board member of Lima’s Stock Exchange, CAVALI, Cambolsa (Costa Rica) and Scotiabank Costa Rica. He received abachelor’s degree in international business management with a minor in finance from St. Mary’s University, San Antonio, Texas.
Raúl Iñigo Tizónhas served as Inteligo’s Chief Operations Officer since March 2014. Mr. Iñigo has more than 40 years of banking experience. Before joining Inteligo, Mr. Iñigo worked as Chief Operations Officer at Banco de Crédito del Perú and Vice President of Operations at Atlantic Security Bank in Panama. Mr. Iñigo received a degree in business administration from the Universidad Nacional Mayor de San Marcos and has completed several management and banking trainings and advanced programs at the Kellogg School of Management.
190
Table of Contents
Ximena Benavides Reverditto has served as Inteligo’s General Counsel since March 2014 and as Inteligo SAB’s Legal Counsel since December 2011. Before joining Inteligo, Mrs. Benavides worked at Curtis,Mallet-Prevost, Colt & Mosle LLP, International Corporate Practice, in New York, Estudio Grau Abogados in Lima, and was a Fellow of the Olin Center for Law, Economics and Public Policy at Yale Law School. Mrs. Benavides is member of the Legal Affairs Committee of Procapitales. Mrs. Benavides received a master’s degree in laws from Yale Law School, a law degree from the Pontificia Universidad Católica del Perú, and a post graduate diploma in finance from the Universidad de Piura.
Compensation
IFS
Our articles of incorporation provide that our shareholders are responsible for determining the compensation to be paid to members of our board. In 2013, annual compensation to board members of IFS totaled S/. 25,874,000. In 2013, our executive officers as a group received compensation from us or our subsidiaries of S/. 3,555,000.
Share Ownership by Directors and Senior Management
None of our directors or senior management beneficially owns our common shares other than three directors and three senior executives of IFS, who own a 0.0728% interest in IFS.
ExecutiveLong-Term Incentive Plan
We have not adopted a definitive executivelong-term incentive plan. Following the consummation of the offering, however, we anticipate that our board of directors will consider alternatives for the implementation of an executivelong-term incentive plan with a view toward adopting a plan or plans suitable for IFS, subject to necessary approvals.
Corporate Governance
As a foreign private issuer, we are subject to different corporate governance requirements than those followed by a U.S. company with shares listed on the NYSE that follow NYSE listing standards. With certain exceptions, foreign private issuers are permitted to follow their home country corporate governance standards.
We are registered with the SMV and although there is no legal obligation to comply with Peruvian corporate governance practices, we are required to report our degree of compliance with Peruvian corporate governance practices for Peruvian publicly-held companies to the SMV. Because we are not subject to Panamanian securities laws as we have not offered any securities in Panama and because general corporate law in Panama does not impose any meaningful restrictions on our corporate governance, a comparison to Panamanian corporate governance practices is not applicable. Additionally, we have adopted a set of additional corporate governance guidelines as contemplated by the Sarbanes-Oxley Act of 2002 and our articles of incorporation, which include the establishment of:
| • | principles and duties relating to the conduct of our management, including as with respect to confidentiality and conflicts of interest; |
| • | internal accounting controls systems; |
| • | an audit committee; and |
| • | a code of business conduct and ethics. |
191
Table of Contents
The following is a comparison between our corporate governance policies under Peruvian law and those of the NYSE listing standards.
| NYSE Standards | Our Corporate Governance Practices | |
| Director Independence. A majority of the board of directors must be independent, except in the case of a “controlled” foreign private issuer. §303A.01 of the NYSE Listed Company Manual | Our articles of incorporation provide for a minimum of three members for our board of directors. Currently, our board of directors is composed of five members. | |
| The criteria for determining independence under our corporate governance standards has been defined in accordance with Rule 10A-3 under the Exchange Act. | ||
| Executive Sessions. Non-management directors must meet regularly in executive sessions without management. Independent directors should meet alone in an executive session at least once a year. §303A.03 of the NYSE Listed Company Manual | Under our articles of incorporation and applicable laws non-management directors are not required to meet in executive sessions without management. | |
| Audit committee. An audit committee satisfying the requirements of Rule 10A-3 under the Exchange Act. §303A.06 of the NYSE Listed Company Manual | We believe we are in compliance with Rule 10A-3 under the Exchange Act. | |
| Audit committee additional requirements. §303A.07 of the NYSE Listed Company Manual requires that an audit committee must consist of at least three members, each of whom are financially literate and at least one of whom is a financial expert, and that the audit committee have a written charter outlining the committee’s responsibilities. | Our audit committee consists of three members, all of whom are financially literate, two of them whom are independent, and one of whom is a financial expert. Our audit committee has a written charter. | |
| Nominating/corporate governance committee. A nominating/corporate governance committee of independent directors is required. The committee must have a charter specifying the purpose, duties and evaluation procedures of the committee. §303A.04 of the NYSE Listed Company Manual | We do not have a nominating/corporate governance committee. Our board of directors has the power to establish such a committee in the future on the terms that it deems fit. | |
| Compensation committee. A compensation committee of independent directors is required. The committee must approve executive officer compensation and must have a charter specifying the purpose, duties and evaluation procedures of the committee. §303A.05 of the NYSE Listed Company Manual | We do not have a compensation committee. Our Board of Directors may establish a compensation committee in the future on the terms it deems appropriate. | |
| Code of Ethics. A code of business conduct and ethics are required, as is disclosure of any waiver for directors or executive officers. §303A.10 of the NYSE Listed Company Manual | We have adopted a code of business conduct and ethics, as contemplated by the NYSE. Our board of directors has the obligation to verify compliance with the provisions of such code. | |
192
Table of Contents
Board Committees
Audit Committee
Our audit committee is comprised of three directors, two of which are independent in accordance with the criteria set forth under our “Audit Committee Charter”, the rules of the NYSE and Rule 10A-3(b)(1) of the Exchange Act, each as applicable to foreign private issuers. The current members of our audit committee are Ramón Barúa Alzamora, Felipe Morris Guerinoni and Alfonso De los Heros Pérez-Albela, and Felipe Morris Guerinoni and Alfonso De los Heros Pérez-Albela are independent under Rule 10A-3 under the Exchange Act and Felipe Morris Guerinoni is our financial expert. Our audit committee oversees our corporate accounting and financial reporting process. Immediately prior to the closing of this offering, the audit committee will be responsible for:
| • | reviewing our financial statements; |
| • | evaluating our internal controls and procedures, and identifying deficiencies; |
| • | recommending to our annual shareholders’ meeting the appointment of our external auditors, determining their compensation, retention and oversight, and resolving any disagreement that may arise between management and our external auditors; |
| • | evaluating the company’s compliance with the Board of Director’s internal regulation, as well as with general principles of corporate governance; |
| • | informing our board of directors regarding any issues that arise with respect to the quality or integrity of our financial statements, our compliance with legal or regulatory requirements, the performance and independence of the external auditors, or the performance of the internal audit function; |
| • | establishing procedures for the reception, retention and treatment of complaints regarding accounting, internal controls or other auditing matters, including the confidential, anonymous submission by our employees of concerns regarding questionable accounting or auditing matters; |
| • | independently engaging its own counsel and any other advisers it deems necessary to fulfill its functions; and |
| • | establishing policies and procedures topre-approve audit and permissiblenon-audit services. |
193
Table of Contents
Our only outstanding equity securities are our common shares. As of August 1, 2014, IFS had issued 113,110,864 common shares, of which 64,532,623 were held indirectly by Intercorp Peru.
The following table sets forth the record and beneficial ownership of our common shares before the offering and after the offering, with respect to each shareholder known to us to own 5% or more of our outstanding common shares, as of August 1, assuming no exercise of the underwriters’ option to purchase additional common shares.
| Common Shares Owned Before the Offering | Common Shares Owned After the Offering | |||||||||||
Shareholders | Number of Shares | Percentage owned | Number of Shares | Percentage owned | ||||||||
Intercorp Perú Ltd. | 64,532,623 | 57.1% | ||||||||||
IFH Capital Corp.(1) | 9,747,706 | 8.6% | ||||||||||
Intercorp Capital Investments Inc.(1) | 9,747,707 | 8.6% | ||||||||||
Other Directors and Officers | 82,249 | 0.1% | ||||||||||
Shares owned by Interbank | 3,728,393 | 3.3 | ||||||||||
Float | 25,272,186 | 22.3 | ||||||||||
Total | 113,110,864 | 100.0 | ||||||||||
|
|
|
|
|
| |||||||
| (1) | Wholly-owned subsidiary of Intercorp Peru, which is indirectly owned and controlled by the Rodriguez Pastor family. Carlos Rodriguez Pastor Persivale is chairman of our board of directors. |
| (2) | Excluding any member of the Rodriguez Pastor family. |
Selling Shareholders
IFH Capital Corp. and Intercorp Capital Investments Inc. are the only selling shareholders in the offering.
194
Table of Contents
In the ordinary course of business, we and our subsidiaries, Interbank, Interseguro and Inteligo, engage in a variety of transactions among themselves and with certain of their affiliates and related parties. All material transactions between us or our subsidiaries and our other affiliates or related parties are evaluated by our senior management and our related party transactions committee in accordance with specific regulations and internal rules applicable to all third party transactions. These transactions are subject to prevailing market conditions and transfer pricing regulations.
Interbank extends loans to related parties, including its executive officers and directors and executive officers and directors of our affiliates, in accordance with Peruvian law and regulations established by the SBS. According to Peruvian law, loans to related parties cannot be made on more favorable terms than those offered to the public. As a result, all related party loans have been made in the ordinary course of business, on anarm’s-length basis and on substantially the same terms, including with respect to interest rates and collateral, as those prevailing at the time for comparable transactions offered to the public. In addition, related party loans do not involve greater collection risk nor present other features unfavorable to Interbank as compared to loans offered to the public. Peruvian law and SBS regulations also set forth limitations on the amount of credit loans that may be extended to related parties based on Article 20 of the Peruvian Banking and Insurance Law. The law establishes that the total amount of loans to be extended to directors, employees and close relatives of any such persons may not exceed 7.0% of the bank’s regulatory capital. All loans extended to any director or employee of the company (including close relatives of such person) may not exceed 0.35% of the regulatory capital (i.e., 5.0% of the overall 7.0% limit discussed above). Such loans must not be granted in more advantageous conditions than those offered to the public, with the exception of mortgage loans granted to workers for housing purposes.
In addition, under Article 202 of the Peruvian Banking and Insurance Law no loans extended to related parties or affiliates may exceed 30% of a bank’s regulatory capital. Under these laws, related party borrowers include any corporation holding, directly or indirectly, 4.0% or more of a bank’s shares, such bank’s directors, certain of its principal executive officers or other persons affiliated with such bank’s management.
Peruvian regulations also set forth limits on the investments of insurance companies. Pursuant to SBS regulations, the aggregate amount of investments that Interseguro may have with any member of its economic group cannot exceed 10.0% of its technical obligations.
Furthermore, under Peruvian law, board members and executive officers of apublicly-held company, such as us, Interbank and Interseguro, may not (i) engage in transactions with the company or any related party of the company, except for transactions entered into in the ordinary course of business and on anarm’s-length basis or approved at least bytwo-thirds of the members of the board of directors, (ii) appropriate for their own benefit a business opportunity that belongs to the company, or (iii) participate in any corporate decision that presents a conflict of interest with the company. In all cases, the execution of agreements that involve at least 5.0% of the assets of the company with persons or entities related to directors, managers or shareholders that own, directly or indirectly, more than 10.0% of the share capital requires the prior authorization of the board of directors (with no participation of the director(s) involved in the transaction, if any). In addition, the execution of agreements with a party controlled by the company’s controlling shareholder requires the prior authorization of the board of directors and an evaluation of the terms of the transaction by an external independent company (audit companies or other evaluator to be determined by the SMV).
According to the regulations of the Central Bank of The Bahamas, Inteligo Bank related party transactions are subject to a prudential norm of eight times its capital.
For additional information about loans to, and certain other transactions with, related parties and affiliates, see note 26 to our audited combined financial statements included elsewhere in this prospectus.
195
Table of Contents
In the normal course of our operations, related party transactions are evaluated in accordance with Peruvian Banking Law and the rules and limits described in this section are based solely on those rules. Notwithstanding, for the purposes of describing our related party transactions below, we have applied IFRS rules (IAS 24) and are therefore including information regarding an investment in Royalty Pharma International Holdings, LP for which Carlos Rodriguez Pastor is a director, which we believe is not a related party under Peruvian Banking and Insurance Law.
Interbank
Lease Agreements between Interbank and Supermercados Peruanos S.A.
In December 2003, Interbank and Supermercados Peruanos entered into a master lease agreement, as amended, pursuant to which Supermercados Peruanos agreed to lease 1,000 square meters of floor space, at US$113.3 per square meter per month, for the last five years of the term of the agreement in its supermarkets for the operation of Interbank’s financial stores for a term of 15 years. Interbank made an advanced payment of US$10 million to be applied to the monthly rental payments for the first ten years and delivered US$2 million as security deposit.
In September 2009, Interbank and Supermercados Peruanos entered into an amendment agreement pursuant to which Supermercados Peruanos agreed to lease 1,038 square meters of additional floor space at US$80 per square meter per month, plus taxes. Interbank made an advanced payment of US$6.0 million, to be applied to the first 80 monthly rental payments.
Interseguro
Lease Agreements with Supermercados Peruanos S.A.
On October 15, 2009, Interseguro and Supermercados Peruanos entered into aten-year lease agreement according to which Interseguro leased a commercial space to Supermercados Peruanos in Centro Comercial Real Plaza Centro Civico in the city of Lima. Under this agreement, Supermercados Peruanos is entitled to operate a hypermarket. The monthly rental payment for the agreement is the greater of the amount equal to 2.0% of Supermercados Peruanos hypermarket monthly net sales and S/.18 per square meter plus taxes, adjusted annually for inflation.
On August 15, 2013, Interseguro and Supermercados Peruanos entered into a30-year usufruct agreement according to which Supermercados Peruanos was granted in usufruct a commercial space in the Centro Comercial Real Plaza Sullana in the city of Sullana. Under this usufruct agreement, Supermercados Peruanos is entitled to operate a hypermarket. The monthly rental fee under the agreement is the amount that is the greater of 2.0% of the hypermarket’s monthly net sales plus taxes, and S/.20 per square meter plus taxes, adjusted annually for inflation.
Supermercados Peruanos entered into a30-year agreement pursuant to which Interproperties transferred the surface use of the lot located in Lurin, Lima to Supermercados Peruanos. Under the agreement, Supermercados Peruanos is entitled to operate a hypermarket and to lease orsub-lease areas therein to tenants whose economic activities belong to certainpre-defined categories. The monthly rental payment for the agreement is the greater of the amount equal to 0.5% of Supermercados Peruanos monthly hypermarket net sales and a fixed payment. This payment is structured as follows: from October 15, 2013 to October 14, 2014, S/.12,000 monthly plus S/.5,000 monthly, both adjusted for inflation on an annual basis since October 15, 2011, plus taxes. From October 15, 2014 to October 14, 2015, the rental payment is equal to the rent of the previous year adjusted for inflation, plus taxes. From October 15, 2015 to October 14, 2016, the fixed rental payment is equal to the rent of the previous year adjusted for inflation, plus S/.5,000 monthly and taxes.
196
Table of Contents
Lease Agreements with Real Plaza
On December 28, 2009, Interseguro and Real Plaza entered into afive-year lease agreement ending on December 31, 2014, pursuant to which Interseguro leased administrative offices on the eighth floor of the building located at Pardo y Aliaga N°640, in the city of Lima. Under the lease agreement, Real Plaza is entitled to operate administrative offices. The monthly rental payment for the agreement is the sum of (i) US$280 plus taxes and (ii) S/.34 per square meter plus taxes.
On January 01, 2011, Interseguro and Real Plaza entered into a lease agreement ending on December 31, 2014, pursuant to which Interseguro leased administrative offices in the ninth floor of the building located in Pardo y Aliaga N°640, in the city of Lima. Under the lease agreement, Real Plaza is entitled to operate administrative offices. The monthly rental payment for the agreement is S/.34 per square meter plus taxes.
On November 1, 2013, Interseguro and Real Plaza entered into an agreement ending on December 31, 2014, pursuant to which Real Plaza provides integral administrative services and represents Interseguro in the administration of Centro Comercial Real Plaza Sullana, in the city of Sullana. The monthly payment by Interseguro to Real Plaza under the agreement is S/.10,500 plus taxes.
Agreements with Colegios Peruanos S.A. (CPSA)
On October 22, 2012, CPSA entered into a30-year surface use and easement right agreement according to which Interseguro leased the property located in Ate, Lima to CPSA. Under the agreement, CPSA is entitled to operate a school under the “Innova Schools” commercial brand. The annual rental payment under the agreement is US$130,318 plus taxes. The agreement may be renewed under the same conditions for an additional30-year term.
On January 22, 2014, Interseguro and CPSA entered into a5-year surface use agreement according to which Interseguro leased the property located in Huaral, Lima. On January 22, 2014, Interseguro and CPSA entered into afive-year surface use agreement according to which Interseguro leased two properties located in Pachacamac, Lima. Under both agreements, CPSA is entitled to operate a school under the “Innova Schools” commercial brand. The annual rental payment under the agreements before the school commences operations is equal to 14.0% of the investment made in the property. Should the school’s operations begin a year later; the annual payment for the second year will be equal to 7.0% of the investment made in the property. Interseguro will concede a grace period to a maximum six months from the beginning of construction. Once the school is operative, the annual rental payment for the agreement is the greater of a variable and fixed amount. The fixed rental payment is S/.15 per square meter the first year, S/.18 per square meter the second year and S/.20.7 per square meter the third year (all plus taxes). The variable rental payment is 6.0% of net revenue, paid annually. During the term of both agreements and in the three-month period following the termination of said agreements, CPSA has a right to match or improve upon the offer of any third party to acquire, constitute an “usufructo”usufruct, lease, constitute a right of use of surface or assignment in use of these properties, at fair value; however, if CPSA does not exercise this right, Interseguro may dispose of both properties.
Lease Agreements with Cineplex
On December 15, 2009, Interseguro and Cineplex S.A., or Cineplex, entered into asix-year lease agreement pursuant to which Interseguro granted an usufruct to Cineplex over certain offices in the fourth floor of the Edificios Longitudinales de Comercio building. Under the lease agreement, Cineplex is entitled to operate administrative offices only. The monthly rental payment for the agreement is S/.21 per square meter plus taxes, adjusted annually for inflation since November 15, 2011.
On February 09, 2010, Interseguro and Cineplex entered into a10-year lease agreement pursuant to which Interseguro leased cinema complex area on the first and third floor of Centro Comercial Real Plaza Centro Civico in the city of Lima. The monthly rental payment for the agreement is the greater of the amount equal to 11.0% of the monthly net revenue plus taxes and S/.24.43 per square meter, plus taxes.
197
Table of Contents
Lease Agreements with Tiendas Peruanas (Oechsle)
On November 2, 2009, Interseguro and Tiendas Peruanas entered into a20-yearsub-usufruct agreement according to which Interseguro leased a commercial area to Tiendas Peruanas in the Centro Comercial Real Plaza Centro Civico, located in Lima. The monthly rental payment for the agreement is the greater of the amount equal to 2.5% of Tiendas Peruanas’ Centro Civico Store’s monthly net sales plus taxes and S/.16 per square meter plus taxes, annually adjusted for inflation since 2009.
Lease Agreements with Homecenter Peruanos (Promart)
On July 1, 2013, Interseguro and Homecenters Peruanos entered into a30-year usufruct agreement according to which Interseguro leased a commercial area to Homecenters Peruanos in Centro Comercial Real Plaza Sullana. The monthly rental payment under the agreement is the greater of the amount equal to 2.25% of such store’s monthly net sales plus taxes and S/.20 per square meter plus taxes, adjusted annually for inflation.
Lease Agreements with Alert del Peru S.A., Bembos S.A., Corporación Peruana de Restaurantes S.A. and EP de Franquicias S.A.
On April 16, 2012, Interseguro and Alert del Peru S.A. entered into afive-year lease agreement pursuant to which Interseguro leased EP de Franquicias S.A. commercial space in Centro Comercial Real Plaza Centro Civico in the city of Lima. The monthly rental payment for the agreement is the greater of the amount equal to 9.5% of the restaurant’s monthly net revenue plus taxes and S/.165 per square meter plus taxes, adjusted annually for inflation beginning June 1, 2014. In addition, the fixed rental payment that corresponds to the month of December is 100% higher.
On November 1, 2013, Interseguro and Bembos S.A. entered into atwo-year lease agreement according to which Interseguro leased commercial space in Centro Comercial Real Plaza Centro Civico in the city of Lima. The monthly rental payment for the agreement is the greater of the amount equal to 8.5% of the restaurant’s monthly net revenue plus taxes and S/.2,800 plus taxes, adjusted annually for inflation beginning November 1, 2014.
On December 1, 2013, Interseguro and Corporacion Peruana de Restaurantes S.A. entered into a lease agreement ending December 31, 2019, pursuant to which Interseguro leased commercial space in Centro Comercial Real Plaza Centro Civico in the city of Lima. Under the lease agreement, Corporacion Peruana de Restaurantes S.A. is entitled to operate a restaurant under the “Papa John’s” commercial brand. The monthly rental payment for the agreement is the greater of the amount equal to 8.5% of the monthly net revenue of this restaurant plus taxes and S/.170 per square meter plus taxes, adjusted annually for inflation beginning February 1, 2015.
On April 16, 2012, Interseguro and EP de Franquicias entered into a lease agreement ending on June 30, 2017, pursuant to which Interseguro leased commercial space in Centro Comercial Real Plaza Centro Civico in the city of Lima. Under the lease agreement, EP de Franquicias is entitled to operate a restaurant under the “Popeyes” commercial brand. The monthly rental payment for the agreement is the greater of the amount equal to 8.5% of the monthly net revenue of this restaurant plus taxes and S/.65 per square meter plus taxes, adjusted annually for inflation beginning July 1, 2013. In addition, the fixed rental payment increases by 10.0% every 30 months.
Lease Agreements with Eckerd Peru S.A.
On April 12, 2013, Interseguro and Eckerd Peru S.A. entered into a lease agreement ending on May 31, 2018, pursuant to which Interseguro leased commercial space in Centro Comercial Real Plaza Centro Civico in the city of Lima. Under the lease agreement, Eckerd Peru S.A. is entitled to sell pharmaceutical products, perfumes, surgical equipment and health related services under the “Inkafarma” commercial brand. The monthly rental payment for the agreement is the greater of the amount equal to 8.5% of the monthly net revenue of this store plus taxes and S/.170 per square meter plus taxes, adjusted annually for inflation beginning June 1, 2014.
198
Table of Contents
Lease Agreements with URBI S.A.
On October 20, 2008, Interseguro and Urbi S.A. entered into a30-year agreement according to which Urbi S.A. provides administrative services in Centro Comercial Real Plaza Civico in the city of Lima. The monthly payment for the agreement is S/.10,500 per month, plus taxes.
Agreements with Inretail Properties Management
On April 2, 2012, Interseguro and InRetail Properties Management entered into an agreement ending on December 31, 2013, pursuant to which InRetail Properties Management provides advisory services related to the identification and structuring of real estate projects. The term of the agreement may be automatically renewed until termination by either party. The payment for such services under the agreement is 1.5% of the total value of the operation price, per project (plus taxes).
Investment Property Sold to Inteligo Real Estate Perú S.A.C.
Pursuant to a purchase agreement for sale of investment properties dated December 17, 2013, Interseguro sold to Inteligo Real Estate Peru S.A.C. for US$27,816,000 and S/.5,367,870.75, 39.33% of the real estate property located at Av. Paseo de la República, Calle San Miguel Gerónimo Seminario, Calle San Cristóbal y Av. República de Panamá, San Isidro, Lima, and known as “Lillingstone”. As a result of our reorganization in July 2014, the 39.33% of the Lillinsgstone project was spun off to Intercorp Peru (See “Unaudited Pro Forma Condensed Combined Financial Information”).
Puruchuco Sale Agreement
On June 27, 2014, Interseguro sold to an InRetail Real Estate subsidiary 138,562.44 square meters of land located in Avenida Nicolás Ayllon N°4770, Ate, Lima, Peru (lot known as Puruchuco). The transaction amount was S/. 99,857,790 from which S/. 42,158,000 was paid on June 30,2014, S/. 2,984,220 will be paid on July 1, 2014 and the remainder S/. 54,805,570 will be paid on or before September 30, 2014.
Investment in Royalty Pharma
As of December 31, 2013, Interseguro held 251,286 participations of RPI (Royalty Pharma Investments) valued at US$ 83.75 per participation and 54,978 participations of RPS (Royalty Pharma Select) valued at US$ 69.10 per Participation, both investments aggregated value was US$ 24,844,182.
Inteligo
Investment Property Sold to Inteligo Real Estate Perú S.A.C.
Pursuant to a purchase agreement dated December 17, 2013, Inteligo Real Estate Perú S.A.C. acquired from Interseguro, for US$27,816,000 and S/.5,367,870.75, 39.33% of the real estate property located at Av. Paseo de la República, Calle San Miguel Gerónimo Seminario, Calle San Cristóbal y Av. República de Panamá, San Isidro, Lima, and known as “Lillingstone”. As a result of our reorganization in July 2014, the 39.33% of the Lillinsgstone project was spun off to Intercorp Pen (See “Unaudited Consolidated Pro Forma Financial Information”).
Lease Agreement with Real Plaza
On October 4, 2010, Inteligo SAB and Real Plaza entered into an agreement with an initial maturity date on March 30, 2014, which has been extended for an additional 3 year term terminating on March 31, 2017. Pursuant to which Real Plaza leased a commercial space in Centro Comercial Real Plaza Arequipa in the city of Arequipa. Under the lease agreement, Inteligo SAB is entitled to operate under its line of business, offering and commercializing products and/or services in the stock exchange market. The monthly rental payment of the agreement is of S/. 130 per square meter plus taxes, annually adjusted for inflation since 2014.
199
Table of Contents
Investment in Royalty Pharma International Holdings, LP (RPI)
As of December 31, 2013, Inteligo Bank held 250,000 participations of RPI valued at US$ 83.75 per participation, amounting to a total value of US$ 20,937,500.
200
Table of Contents
The following summary provides information concerning our common shares and briefly describes certain significant provisions of ourpacto social (articles of incorporation) and Panama corporate law. This summary does not purport to be complete and is qualified in its entirety by reference to our articles of incorporation and Panama corporate law.
General
As of the date of this prospectus, our authorized capital consists of 150,000,000 common shares, and our issued capital consists of 113,110,864 outstanding common shares, with no par value, issued at US$9.72 per common share. All of our common shares are fully paid andnon-assessable.Non-residents of Panama may hold and vote shares.
Dividend and Liquidation Rights
Payment of dividends is proposed by our board of directors and must be authorized by our shareholders at a general meeting of the shareholders. According to Panama’s Corporation Law (Law 32 of 1927), dividends may be paid to our shareholders from the net earnings or profits of the company or from the surplus of its assets over its liabilities, but not otherwise. In accordance with Article 37 of Panama’s Corporation Law, we may declare and may pay out dividends on the basis of the amount actually paid on partially paid shares of stock. Since we are not subject to payment of Panamanian income tax, dividends payable by us are not subject to a Panamanian income or dividend tax nor to any Panamanian withholding tax. See “Taxation—Panamanian Taxation”.
Upon our liquidation, our shareholders would be entitled to receive proportionately any assets remaining after payment of our debt, taxes and liquidation expenses.
Shareholders’ Meetings and Voting Rights
Pursuant to Panamanian corporate law, general meetings of shareholders, whether ordinary or extraordinary, shall be held in the Republic of Panama, unless the articles of incorporation or bylaws of the corporation shall provide for such meetings to be held elsewhere.
Our articles of incorporation provide that general meetings of shareholders, whether ordinary or extraordinary, may be held in any place or country. Meetings of shareholders shall be held at such dates and in such places as our board of directors shall determine, while extraordinary meetings may be called by the board of directors or by the President, whenever they deem convenient. Furthermore, an extraordinary general meeting of shareholders must be called by the board of directors or the President whenever so requested in writing by one or more shareholders representing at least 20% of all our shares issued and outstanding.
Only such matters that have been included in the notice of meeting may be dealt with at the extraordinary general meeting of shareholders.
Notice of any general meeting of shareholders, whether ordinary or extraordinary, shall be given at least five days and not more than 60 days prior to the date of the meeting by publishing the same once in a newspaper of general circulation in the city of Panama, Republic of Panama.
Action is taken at ordinary meetings on the following matters: the approval of the management carried out by our directors, the approval of the annual accounts from the previous fiscal year, the application of the previous fiscal year’s income or loss, the election of the members of our board of directors and the determination of their remuneration, the election of the president of the Company, the designation of our external auditors or their appointment by our board of directors, when necessary, and any other matter within the powers of the shareholders as set forth in our articles of incorporation or included in the notice thereof.
201
Table of Contents
Our articles of incorporation further provide that shares shall have the same rights and privileges and, except for the provisions regarding the election of directors, each shall have one vote at all general meetings of shareholders. Only holders of common shares are entitled to attend general meetings of shareholders.
The shareholders may be counted as present and may vote at any meeting either by way of their legal representatives or by way of proxies appointed by public or private document, with or without the power of substitution.
Our articles of incorporation provide that, on the first call of any ordinary or extraordinary general shareholders’ meeting, the presence in person or by proxy of shareholders representing at leastone-half plus one of the shares issued and outstanding will constitute a quorum. If on the first call a quorum is not present, the meeting can be reconvened through a second call, at which meeting a quorum shall be obtained with the number of shareholders present or represented therein.
All resolutions of a general meeting of shareholders shall be adopted by the affirmative vote of a shareholder or shareholders representingone-half plus one of the shares present, except those enumerated hereunder, for which the affirmative vote ofone-half plus one of the shares issued and outstanding shall be necessary: (a) to amend the articles of incorporation; (b) to issue obligations for more than 50% of the registered capital of the Company; (c) to encumber or pledge the property of the Company to secure obligations of others for an amount exceeding 50% of the registered capital of the Company as the same has been determined by the external auditors of the company; (d) to approve mergers with other corporations; (e) to dissolve or liquidate the company orspin-off assets; and (f) to remove the directors of the Company from office.
In the election of members of the board of directors, each shareholder shall be entitled to cast a number of votes equal to the number of shares held by or for him, multiplied by the number of directors to be elected, it being understood that such shareholder may cast all his/her votes for a single candidate, or distribute them among the total number of directors to be elected or among two or more thereof, as he/she may deem appropriate.
According to provisions of Panama corporate law, a resolution passed in a shareholders’ meeting is binding on all shareholders, but in no case can a vote of the majority deprive the shareholders of vested rights or impose upon them a resolution of any kind inconsistent with the corporation’s constitutive documents, except as provided by law. Any shareholder shall be entitled to protest against resolutions passed in a general meeting of shareholders in violation of the law, the articles of incorporation or the bylaws, and may sue in a competent court to have the same annulled. Within a peremptory 30 days, if requested by the plaintiff, and should the court deem the matter urgent, the Judge may stay the execution of the resolution until the petition has been adjudged. Such a stay of execution shall not be ordered if the shareholder upon suing does so by ordinary proceedings.
Shareholder Suits
Under Panama corporate law, directors shall not be personally liable for the obligations of the company, but they shall be individually or severally liable, as the case may be, to the company and to third parties for the effectiveness of payments, which appear as having been made by the shareholders, the existence of the dividends declared, the sound management of the accounts and, in general, for the wrongful exercise of their mandate or the violation of laws, the articles of incorporation, theby-laws or resolutions of the general shareholders’ meeting. Such directors as may have protested within proper time against the resolutions of the majority, or those who have not been present at the meeting with justifiable cause, shall be exempt from liability.
Our articles of incorporation state that we shall indemnify and hold our directors and officers harmless with respect to any action, judicial expense, loss, damage or cost which they may incur or suffer as a consequence of acts or omissions in the performance of their duties, and neither of them will be liable for any acts, omissions, or negligence of the other directors and/or officers, except in the case of the gross negligence or inexcusable wrongdoing by the director or officer.
202
Table of Contents
Registration and Transfers
Our shares are indivisible. Joint holders of one share must designate a single person to exercise their shareholders’ rights, but they are jointly and severally liable to us for all the obligations flowing from their status as shareholders, such as the payment of any pending capital calls.
Shares represented shall be transferable on the books of the corporation but in no case shall the transfer of stock be binding on the corporation unless it shall have been registered in the corporation’s books.
If a shareholder shall be indebted to the company may refuse to permit the transfer of his/her shares until such indebtedness is paid. But in all cases the transferor and the transferee shall be jointly liable for the payment of the amounts owed to the company by virtue of the shares so transferred.
Restrictions on Foreign Investment
Panama does not restrict foreign currency movements and foreign investments. Foreign investors may freely invest in shares of Panamanian companies as well as transfer invested capital, capital gains and dividends out of Panama without limitation (subject to applicable taxes).
Preemptive Rights and Increase of Share Capital
Our articles of incorporation state that our shareholders do not have a preferential right to subscribe shares issued pursuant to a capital increase, nor do they have a first option or preferential right to purchase or acquire shares that any of our other shareholders may wish to sell or otherwise dispose of.
Reporting Requirements
Since our shares are not registered with the Panamanian SMV or listed on the Panamanian stock exchange, agreements adopted with respect to the acquisition or disposition of our shares do not need to be reported to any Panamanian regulatory agency, provided that such transfers are not made in violation of Panama’s securities laws and regulations.
203
Table of Contents
Market Price of Our Common Shares
Our Shares
Our common shares are registered in the Public Registry of Securities held with the SMV and are listed on the Lima Stock Exchange under the symbol “IFS”. On August 7, 2014, the closing price on the Lima Stock Exchange was US$32.31 per common share. As of July 1, 2014 our shares represented 4.6% of the General Index of the Lima Stock Exchange (IGBVL) 2014 portfolio. As of December 31, 2013, Intercorp Peru held 68.9% of our shares and was the only record holder holding more than 5% of our shares.
The following table sets forth for the five most recent full years and for the current year the high and low closing prices of our common shares on the Lima Stock Exchange as reported by the Lima Stock Exchange.
| High | Low | |||||||
| (in US$) | ||||||||
2009 | 23.05 | 8.02 | ||||||
2010 | 33.75 | 20.20 | ||||||
2011 | 35.55 | 22.44 | ||||||
2012 | 34.60 | 26.00 | ||||||
2013 | 40.40 | 28.50 | ||||||
2014: | ||||||||
January | 33.14 | 30.00 | ||||||
February | 31.75 | 31.00 | ||||||
March | 31.60 | 30.51 | ||||||
April | 33.10 | 31.50 | ||||||
May | 33.11 | 32.30 | ||||||
June | 32.98 | 32.00 | ||||||
July | 32.75 | 32.00 | ||||||
The following table sets forth for each quarter of the two most recent years the high and low closing prices of our common shares on the Lima Stock Exchange as reported by the Lima Stock Exchange.
| High | Low | |||||||
| (in US$) | ||||||||
2012: | ||||||||
First quarter | 33.00 | 26.00 | ||||||
Second quarter | 34.50 | 29.50 | ||||||
Third quarter | 33.00 | 30.20 | ||||||
Fourth quarter | 34.60 | 32.00 | ||||||
2013: | ||||||||
First quarter | 40.00 | 36.30 | ||||||
Second quarter | 40.40 | 33.00 | ||||||
Third quarter | 32.50 | 28.50 | ||||||
Fourth quarter | 33.60 | 29.50 | ||||||
204
Table of Contents
The following table sets forth for each of the most recent six months the high and low closing prices innuevos soles of our common shares on the Lima Stock Exchange as reported by the Lima Stock Exchange.
| High | Low | |||||||
| (in US$) | ||||||||
2014: | ||||||||
January | 33.14 | 30.00 | ||||||
February | 31.75 | 31.00 | ||||||
March | 31.60 | 30.51 | ||||||
April | 33.10 | 31.50 | ||||||
May | 33.11 | 32.30 | ||||||
June | 32.98 | 32.00 | ||||||
July | 32.75 | 32.00 | ||||||
Trading in the Peruvian Securities Market
Lima Stock Exchange
As of December 31, 2013, there were 282 companies listed on the Lima Stock Exchange. Established in 1970, the Lima Stock Exchange is Peru’s only securities exchange. On November 19, 2003, the members of the Lima Stock Exchange approved to the conversion of its corporate status to a publicly held corporation. As of December 31, 2013, the Lima Stock Exchange had a share capital of S/.59,715,840, divided into 56,405,407 class “A” shares and 3,310,433 class “B” shares of par value S/.1.00 each. Class “A” shares are entitled to one vote per share while class “B” shares do not have voting rights.
Trading on the Lima Stock Exchange is primarily done on an electronic trading system that became operational in August 1995. From the first Monday of November through the second Sunday of March of each year, trading hours are Monday through Friday (except holidays) as follows: 8:20 a.m.–8:30 a.m.(pre-market ordering); 8:30 a.m.–2:55 p.m. (trading); 2:55 p.m.–3:00 p.m.(after-market sales); and 3:00 p.m.–3:10 p.m.(after-market trading). At all other times, trading hours are from Monday to Friday (except holidays) as follows:9:00��a.m.-9:30 a.m.(pre-market ordering); 9:30 a.m.–3:55 p.m. (trading); 3:55 p.m.–4:00 p.m.(after-market sales); and 4:00 p.m.–4:10 p.m.(after-market trading).
Substantially all of the transactions on the Lima Stock Exchange are traded on the electronic system. Transactions during the electronic sessions are executed through brokerage firms and stock brokers on behalf of their clients. Brokers submit orders in the order in which they are received. The orders must specify the type of security as well as the amount and price of the proposed sale or purchase. In order to control price volatility, the Lima Stock Exchange imposes a 15 minute suspension on trading when the price of a security varies on a single day by more than 15% for Peruvian companies and 30% fornon-Peruvian companies.
Certain information regarding trading on the Lima Stock Exchange is set forth in the table below:
| 2009 | 2010 | 2011 | 2012 | 2013 | ||||||||||||||||
Market capitalization (in millions ofnuevos soles)(1) | 310,116 | 451,796 | 327,823 | 391,180 | 337,226 | |||||||||||||||
Volume (in millions of nuevos soles) | 16,840 | 18,685 | 21,524 | 19,871 | 15,861 | |||||||||||||||
Average daily trading volume (in millions ofnuevos soles) | 67 | 74 | 86 | 79 | 63 | |||||||||||||||
| (1) | End-of-period figures for trading on the Lima Stock Exchange. |
The stock market capitalization of companies listed on the Lima Stock Exchange was US$120.7 billion at the end of 2013, compared to US$107.3 billion, US$161.1 billion, US$121.6 billion and US$153.4 billion at the end of 2009, 2010, 2011 and 2012, respectively.
Total market volume in 2013 was US$5.9 billion, reflecting a 20.2% decrease compared to 2012. Equity market volume, which represented 69.3% of total market volume, ended the year at US$4.1 billion, 31.7% less
205
Table of Contents
than the previous year. The fixed income market, which represented 14.6% of total market volume, reported volume of US$853 million, reflecting an increase of 76.5%. The repo market, which represented 16.1% of total market volume, reported volume of US$944 million in 2013, reflecting an increase of 3.3%.
The total number of operations in the market in 2013 decreased by 22.8%, closing the year at 192,159 operations. The number of operations in the equity market in 2013 declined by 24.4% amounting to 179,459 operations.
The General Index of the Lima Stock Exchange (Índice General de la Bolsa de Valores de Lima), increased, by 101.0% in 2009 and 65.0% in 2010, reaching 23,374 points as of December 31, 2010, the highest value over the past five years. In 2011, the index reported losses amounting to 16.7%, while in 2012 it registered an increase of 5.9% and in 2013 it registered a decrease of 23.6%.
Regulation of the Peruvian Securities Market
The regulatory framework for the Peruvian securities market is provided by the Securities Market Law (Ley del Mercado de Valores) approved by Legislative Decree No. 861, as amended, and by regulations enacted, from time to time, by the SMV. The purpose of the Securities Market Law is to promote the ordered development and transparency of the Peruvian securities market and the adequate protection of investors. The Securities Market Law contains, among other things, general rules in connection with: (i) primary and secondary public offerings of securities, including concurrent international offerings; (ii) tender offers; (iii) the registration of securities with the Public Registry of Securities (Registro Público del Mercado de Valores); (iv) reporting obligations, including disclosure material information (hechos de importancia) and financial information; (v) the prohibition of insider trading, fraud and price manipulation,(vi) broker-dealers; (vii) stock exchanges; (viii) clearing and settlement, including clearing agencies; (ix) financial instruments and transactions, including securitizations; and (x) mutual funds and investments funds publicly placed and their respective management companies.
The Peruvian securities market is regulated and overseen by the SMV, a governmental entity with functional, administrative, economic, technical and budgetary autonomy that is part of the Peruvian Ministry of Economy and Finance. Its chief executive is the Superintendent of Securities Market, or the Superintendent, and its ruling body is a board of directors comprised of five members composed of the Superintendent (who acts as chairman) and four additional members appointed by the executive branch of the government. The SMV is responsible, among other things, for enacting regulations in connection with the securities market, licensing and overseeingbroker-dealers, clearing agencies,stock-exchanges and mutual fund managers, enforcing the Securities Market Law and securities regulations, including initiating investigations and enforcement actions for securities law violations and imposing sanctions for such violations, registering public offerings, and reviewing documents required to be filed with the SMV.
Disclosure Obligations
The Securities Market Law and its implementing regulations provide that issuers of securities registered with the SMV must disclose all material information (hechos de importancia) in connection with the issuer, its activities or securities issued by such issuer, which may influence the liquidity or price of their registered securities. Disclosure obligations include: (a) periodic reporting of financial information, including interim unaudited financial statements on a quarterly basis (which are not required to be subject to limited review by external auditors), and annual audited consolidated financial statements on an annual basis, (b) material information relating to the issuer and its activities that may significantly affect the price, offering or trading of the registered securities, and in general, all the information that may be relevant for investors to be able to make investment decisions, (c) information about the issuer’s economic group, and (d) information about transfers of shares above certain thresholds.
In order to comply with the foregoing disclosure obligations, issuers must disclose information to the SMV and, if the securities are listed, with the Lima Stock Exchange as soon as practicable but not later than the same day on which the issuer becomes aware of such information.
206
Table of Contents
We are a holding company and, as such, our ability to pay dividends is subject to the ability of our subsidiaries to pay dividends to us.
Our annual dividend is proposed by our board of directors and approved at our annual ordinary meeting of shareholders. Dividends are paid to shareholders who held common shares as of the record date preceding the date set for payment of the dividend. The shares go ex-dividend three business days prior to the record date.
The amount to be distributed is proposed annually by our board of directors and subject to the approval of the general shareholders’ meeting.
The following table shows IFS’ distribution of net profit for the two years ended December 31, 2013.
| For the years ended December 31, | ||||||||
| 2013 | 2012 | |||||||
| (S/. in millions) | ||||||||
Net profit | 744.6 | 705.7 | ||||||
Reserves | — | — | ||||||
Capitalized earnings | — | — | ||||||
Dividends declared | 424.1 | 391.9 | ||||||
Interbank
Interbank’s dividends are proposed annually by its board of directors and are subject to approval by the general shareholders’ meeting of Interbank. Current dividend policy establishes that Interbank will pay as dividends a maximum of 50% of its net profits in 2013, 2014 and 2015. Dividend distributions depend on several factors, including (1) approval by Interbank’s shareholders of the proposal to distribute dividends, (2) Interbank’s earnings, (3) Interbank’s capital expenditure program, (4) capital and legal reserve requirements, and (5) prevailing market conditions. For the years ended 2013 and 2012, Interbank declared and distributed as dividends approximately 50% of its distributable income (net profit minus the required legal reserves, which are equivalent to 10% of net profit).
Dividends are declared based on Interbank’s financial statements prepared under Peruvian SBS GAAP. The following table shows Interbank’s distribution of net profit for the two years ended December 31, 2013 under Peruvian SBS GAAP.
| For the years ended December 31, | ||||||||
| 2013 | 2012 | |||||||
| (S/. in millions) | ||||||||
Net profit | 647.1 | 570.5 | ||||||
Reserves | 64.7 | 57.0 | ||||||
Capitalized earnings | 292.1 | 256.7 | ||||||
Dividends declared | 290.3 | 256.7 | ||||||
Interseguro
Interseguro’s dividends are proposed annually by its board of directors and are subject to approval by the general shareholders’ meeting. Current dividend policy establishes that Interseguro will pay as dividends a maximum of 50% of its net profits attained in any given year. Dividend distributions depend on several factors, including (1) approval by Interseguro’s shareholders of the proposal to distribute dividends, (2) Interseguro’s earnings, (3) Interseguro��s capital expenditure program, (4) capital and legal reserve requirements, and (5) prevailing market conditions. For the year ended 2012, Interseguro reinvested approximately 17% of its distributable income to strengthen its capital base and to finance its growth.
207
Table of Contents
The following tables shows Interseguro’s distribution of net profit for the two years ended December 31, 2013.
| For the years ended December 31, | ||||||||
| 2013 | 2012 | |||||||
| (S/. in millions) | ||||||||
Net profit | 152.4 | 189.2 | ||||||
Reserves | — | 11.1 | ||||||
Capitalized earnings(1) | 4.5 | 31.7 | ||||||
Dividends declared | 147.9 | 140.3 | ||||||
| (1) | Includes capitalization of earnings net of accumulated losses. |
Inteligo
Inteligo’s dividends are proposed annually by its board of directors and are subject to approval by the general shareholders’ meeting. Dividend distributions depend on several factors, including (1) approval by Inteligo’s shareholders of the proposal to distribute dividends, (2) Inteligo’s earnings, (3) Inteligo’s capital expenditure program, and (4) prevailing market conditions. For the year ended 2013, Inteligo declared and distributed approximately S/. 40.8 million in dividends.
The following table shows Inteligo’s distribution of net profit for the two years ended December 31, 2013.
| For the years ended December 31, | ||||||||
| 2013 | 2012 | |||||||
| (S/. in millions) | ||||||||
Net profit | 109.3 | 99.3 | ||||||
Reserves | — | — | ||||||
Capitalized earnings | — | — | ||||||
Dividends declared | 40.8 | 78.5 | ||||||
For additional information regarding risks that could materially adversely affect our ability to pay dividends, see “Risk Factors—Risks Relating to Our Business—We are a holding company, and all of our operations are conducted by our subsidiaries. Our ability to pay dividends to you will depend on the ability of our subsidiaries to pay dividends to us”.
For additional information regarding taxation of dividends, see “Taxation—Peruvian Tax Considerations” and “Taxation—United States Federal Income Tax Considerations—Distributions”.
208
Table of Contents
The following discussion summarizes the material Peruvian, U.S. federal and Panamanian income tax consequences of acquiring, holding and disposing of our shares.
This discussion is not a comprehensive discussion of all the tax considerations that may be relevant to a decision to purchase our shares and is not applicable to all categories of investors, some of which may be subject to special rules, and does not specifically address all of the Peruvian, U.S. federal and Panamanian income tax considerations applicable to any particular holder. It is based upon the tax laws of Peru, the United States and Panama as in effect on the date of this prospectus, which are subject to change, possibly with retroactive effect, and to differing interpretations. Each prospective purchaser is urged to consult its independent tax advisor about the particular Peruvian, U.S. federal and Panamanian income tax consequences to it of an investment in our shares.
Peruvian Tax Considerations
The following is a general summary of material Peruvian tax matters under Peruvian law, as in effect on the date of this prospectus, and describes the principal tax consequences of an investment in the offered shares by a person or entity who is not a resident of Peru and does not hold the offered shares or a beneficial interest therein in connection with the conduct of a trade or business through a permanent establishment in Peru. This summary is not intended to be a comprehensive description of all of the tax considerations that may be relevant to a decision to make an investment in the offered shares. In addition, it does not describe any tax consequences: (a) arising under the laws of any taxing jurisdiction other than Peru or (b) applicable to a resident of Peru or to a person with a permanent establishment in Peru.
For Peruvian tax purposes, a legal entity is deemed to be domiciled in Peru if it has been incorporated in Peru, it is an agent in Peru of a foreign entity or it is a permanent establishment in Peru of a foreign entity. All entities incorporated in Peru are subject to Peruvian income tax on their worldwide income, whereas agencies and permanent establishments of non-domiciled legal entities and all non-domiciled legal entities are only liable for the Peruvian income tax in relation to their Peruvian source income. On the other hand, as a general rule, a non-Peruvian individual is deemed domiciled in Peru for tax purposes if such individual has resided or has stayed in Peru for more than 183 calendar days during any 12-month period. In such circumstances, such individual will be deemed domiciled in Peru as of the first day in the year the above condition is met. An individual domiciled in Peru is liable for Peruvian income tax on worldwide income, while a non-domiciled individual is only liable for Peruvian income tax in relation to their Peruvian source income.
As a general rule, under the current Peruvian income tax laws and regulations, no tax consequences in Peru will apply to a corporation or individual due to the acquisition, holding and disposal of the offered shares since the shares are issued by an entity not incorporated in Peru.
Notwithstanding the above, a capital gain derived from the indirect transfer of shares issued by a Peruvian entity (Peruvian shares) will be deemed Peruvian-source income and levied at a 30 % tax rate. An indirect transfer of Peruvian shares takes place in the transfer of the shares of a non-resident entity that owns, directly or indirectly, shares of a Peruvian company provided that the following conditions are met:
| (i) | the fair market value of the Peruvian shares, whether owned directly or indirectly by the foreign parent company, is equal to 50% or more of the fair market value of the stock issued by the foreign parent entity at any time during the 12-month period prior to the transfer; and, |
| (ii) | in any 12-month period, 10% or more of the shares issued by the foreign parent company are transferred. |
There is a rebuttable presumption that both conditions are met if the foreign parent company whose shares are transferred resides in a tax haven pursuant to Peruvian legislation.
209
Table of Contents
Applicable regulations provide specific rules to determine the fair market value and cost of the stock issued by the foreign parent entity.
The sale of the offered shares is not subject to the Peruvian Value Added Tax (VAT).
Even though this discussion mainly describes tax consequences in Peru for non-resident persons that invest in the offered shares, it should be noted that, as an entity non-domiciled in Peru, we will be liable for the Peruvian income tax only for our Peruvian source income, if any. Therefore, since we are an entity incorporated in Panama, the disposal of our shares will not generate Peruvian source income for us or any other shareholder not domiciled in Peru, unless an indirect transfer of Peruvian shares, as described above, occurs.
Dividends distributed by us are not subject to any withholding tax in Peru.
In case of indirect or direct transfer of shares, the Peruvian company transferred will be jointly and severally liable for any unpaid capital gains income tax due by the transferor, provided that the Peruvian company is deemed a related party to such transferor within the previous 12 months prior to the transfer.
United States Federal Income Tax Considerations
The following discussion is a summary of material U.S. federal income tax considerations that may be relevant to the acquisition, ownership and disposition of common shares by a beneficial owner that is: (i) an individual who is a citizen or resident of the United States; (ii) a corporation (or other entity treated as a corporation for U.S. federal income tax purposes) created or organized under the laws of the United States, any state thereof or the District of Columbia; (iii) an estate the income of which is subject to U.S. federal income tax regardless of its source; or (iv) a trust if a court within the United States is able to exercise primary supervision over its administration and one or more U.S. persons have the authority to control all substantial decisions of the trust (or otherwise if the trust has a valid election in effect under current U.S. Treasury regulations to be treated as a U.S. person). For purposes of this discussion, we refer to these owners of common shares as “U.S. Holders”. If a partnership (or other entity or arrangement that is treated as a partnership for U.S. federal income tax purposes) holds common shares, the tax treatment of a partner generally will depend upon the status of the partner and upon the activities of the partnership. A prospective investor that is a partnership (or other entity or arrangement that is treated as a partnership for U.S. federal income tax purposes) or a partner in a partnership holding our common shares should consult its own tax advisors.
This summary is not a comprehensive discussion of all of the tax considerations that may be relevant to a U.S. Holder’s decision to acquire our common shares. In particular, this discussion is directed only to U.S. Holders that will hold our common shares as capital assets (generally, property held for investment) and it does not address the Medicare tax on net investment income or any special U.S. federal income tax consequences that may be applicable to U.S. Holders that are subject to special treatment under the Internal Revenue Code of 1986, as amended (“U.S. Code”), such as banks, brokers or dealers in securities or currencies, traders in securities electing themark-to-market method of accounting, financial institutions, insurance companies,tax-exempt entities, regulated investment companies, real estate investment trusts, holders that own or are treated as owning 10% or more of our voting or common shares, persons holding our common shares as part of a hedging, conversion or other integrated transaction or a straddle, persons subject to the alternative minimum tax or U.S. Holders whose functional currency is not the U.S. dollar. In addition, this summary does not address the effects of any state, local or non-U.S. tax laws. Prospective investors are advised to satisfy themselves as to the overall U.S. federal, state and local tax consequences of their ownership of our common shares by consulting their own tax advisors.
Except where specifically described below, this discussion assumes that we are not a passive foreign investment company (“PFIC”), for U.S. federal income tax purposes. Please see the discussion under “—Passive Foreign Investment Companies” below.
210
Table of Contents
The statements of U.S. federal income tax laws set out below are based on the laws in force as of the date hereof and may be subject to changes in U.S. federal income tax law occurring after that date, including changes that may have retroactive effect.
Distributions
Subject to the discussion below under “—Passive Foreign Investment Companies,” distributions of cash or property (other than our common shares, if any, distributed pro rata to all of our shareholders) paid out of our current or accumulated earnings and profits (as determined for U.S. federal income tax purposes) with respect to our common shares, including the net amount of Peruvian, Panamanian, or other tax, if any, withheld on the distribution, will be includible in gross income as ordinary income on the date on which the U.S. Holder receives the dividends. To the extent that the amount of any distribution exceeds our current and accumulated earnings and profits as determined for U.S. federal income tax purposes, such excess amounts will be treated first as a nontaxable return of capital to the extent of such U.S. Holder’s tax basis in our common shares and, thereafter, as capital gain. We do not intend to maintain calculations of our earnings and profits under U.S. federal income tax principles. Unless and until these calculations are made, distributions should be presumed to be taxable dividends for U.S. federal income tax purposes. As used below, the term “dividend” means a distribution that constitutes a dividend for U.S. federal income tax purposes.
A dividend paid in anon-U.S. currency will be includible in the gross income of a U.S. Holder in a U.S. dollar amount calculated by reference to the exchange rate in effect on the day the dividend is received by the U.S. Holder, regardless of whether the payment is in fact converted to U.S. dollars. If a dividend paid in anon-U.S. currency is converted into U.S. dollars on the day the dividend is received by the U.S. Holder, the U.S. Holder should not be required to recognize foreign currency gain or loss in respect of the dividend income. Any gain or loss resulting from currency exchange fluctuations during the period from the date the dividend payment is included in the gross income of a U.S. Holder through the date suchnon-U.S. currency is converted into U.S. dollars (or otherwise disposed of) generally will be treated as U.S. source ordinary income or loss. U.S. Holders should consult their own tax advisors regarding the treatment of foreign currency gain or loss, if any, with respect tonon-U.S. currency received by the U.S. Holder which is not converted into U.S. dollars on the date of receipt.
Dividends paid to corporate U.S. Holders with respect to our common shares will not be eligible for the dividends received deduction allowed to corporations under the U.S. Code. Under current law, dividends received by certainnon-corporate U.S. Holders with respect to the common shares will be subject to U.S. federal income tax at preferential rates if the dividends constitute “qualified dividend income” for U.S. federal income tax purposes. Dividends paid on the common shares will be treated as qualified dividend income if:
| • | the common shares are readily tradable on an established securities market in the United States; and |
| • | we were not, in the year prior to the year in which the dividend was paid, and are not, in the year in which the dividend is paid, a PFIC. |
We will apply to have the common shares listed on the NYSE, and we expect that the common shares will qualify as readily tradable on an established securities market in the United States if they are so listed. Moreover, as discussed below under “—Passive Foreign Investment Companies,” we believe that we will not be treated as a PFIC for U.S. federal income tax purposes with respect to our 2013 and current taxable year, and based on our current expectations regarding the value and nature of our assets, the sources and nature of our income, relevant market and shareholder data and our current business plans, we do not anticipate becoming a PFIC in the future. However, there can be no assurance in this regard because the PFIC determination is made annually and is based on the portion of our assets (including goodwill) and income that is characterized as passive under the PFIC rules and our continued qualification for an exception to the PFIC rules for certain foreign banks and insurance companies.
Subject to generally applicable limitations and conditions under the U.S. Code (including a minimum holding period requirement), Peruvian, Panamanian, or othernon-U.S. income tax, if any, withheld from
211
Table of Contents
dividends may be treated as a foreign income tax eligible for credit against a U.S. Holder’s U.S. federal income tax liability. Dividends paid on our common shares generally will constitute foreign source income, and for purposes of calculating the foreign tax credit, as “passive category income,” for most U.S. Holders. Alternatively, a U.S. Holder may be able to deduct foreign income taxes paid with respect to dividends on our common shares against its taxable income, assuming such U.S. Holder does not take a credit for any foreign income taxes paid or accrued during the taxable year and certain other conditions are met. U.S. Holders should consult their own advisors concerning the implications of these rules in light of their particular circumstances.
Sale, Exchange or Other Taxable Disposition of our Common Shares
Subject to the discussion below under “—Passive Foreign Investment Companies,” gain or loss realized by a U.S. Holder on the sale, exchange or other taxable disposition of our common shares generally will be capital gain or loss and generally will belong-term capital gain or loss if our common shares have been held for more than one year. The amount of gain or loss realized will be the difference between (i) the amount realized on the sale, exchange or other taxable disposition of our common shares over (ii) the U.S. Holder’s adjusted tax basis in such common shares, in each case determined in U.S. dollars.Long-term capital gain realized by certain U.S. Holders (including individuals) generally is eligible for favorable rates of U.S. federal income tax. The deductibility of capital losses is subject to significant limitations under the U.S. Code.
Any gain or loss realized by a U.S. Holder on such a sale, exchange or other taxable disposition of our common shares generally will be treated as U.S. source income or loss for U.S. foreign tax credit purposes. If anynon-U.S. withholding tax is withheld on such sale, exchange or other taxable disposition, a U.S. Holder generally would not be able to utilize foreign tax credits in respect of suchnon-U.S. withholding tax unless the U.S. Holder has other income from foreign sources, for purposes of the foreign tax credit limitation rules. Alternatively, a U.S. Holder may be able to deductnon-U.S. withholding taxes paid with respect to a disposition of our common shares against its taxable income, assuming such U.S. Holder does not take a credit for any foreign income taxes paid or accrued during the taxable year and certain other conditions are met. U.S. Holders should consult their own tax advisors regarding the application of the foreign tax credit limitation rules to their investment in, and disposition of, our common shares.
Passive Foreign Investment Companies
U.S. Holders should carefully consider the discussion below regarding our potential treatment as a PFIC for U.S. federal income tax purposes.
In general, if, during any taxable year of a non U.S. corporation, 75% or more of the corporation’s gross income consists of certain types of “passive income,” or the average value during a taxable year of the “passive assets” of the corporation (generally, assets that generate passive income) is 50% or more of the average value of all of its assets, the corporation will be classified as a PFIC under U.S. federal income tax law. Passive income for this purpose generally, among other things, includes interest, dividends, royalties, rents and gains from commodities and securities transactions. Certain exceptions are provided, however, for passive income derived in the conduct of an active business.
The PFIC provisions also contain alook-through rule under which anon-U.S. corporation shall be treated as if it received directly its proportionate share of the income and as if it held its proportionate share of the assets of any other corporation in which it owns at least 25% of the value of the stock. Under thelook-through rule, we should be deemed to own a proportionate share of the assets and to have received a proportionate share of the income of our principal subsidiaries, including Interbank, Interseguro and Inteligo Bank for purposes of the PFIC determination. As noted below, the assets and income of Interbank, Interseguro and Inteligo Bank are subject to special rules under the PFIC regime.
Assets and Income of Interbank and Inteligo Bank under the PFIC Rules
The application of the PFIC rules to banks is unclear under present U.S. federal income tax law. Banks generally derive a substantial part of their income from assets that areinterest-bearing or that otherwise could be
212
Table of Contents
considered passive assets under the PFIC rules. The U.S. Internal Revenue Service (the “U.S. IRS”) has issued a notice and has proposed U.S. Treasury regulations that exclude from passive income any income derived in the active conduct of a banking business by a qualifying foreign bank (the “active bank exception”). The U.S. IRS notice and proposed U.S. Treasury regulations have different requirements for qualifying as a foreign bank, and for determining the banking income that may be excluded from passive income under the active bank exception. Moreover, the proposed U.S. Treasury regulations have been outstanding since 1994 and will not be effective unless finalized.
Because final U.S. Treasury regulations have not been issued and because the notice and the proposed U.S. Treasury regulations are inconsistent in certain respects, Interbank’s, Inteligo Bank’s and (as a result) our status under the PFIC rules is subject to uncertainty. While we conduct, and intend to continue to conduct, a significant banking business, there can be no assurance that we will satisfy the specific requirements for the active bank exception under either the U.S. IRS notice or the proposed U.S. Treasury regulations. It is therefore possible that a significant portion of the assets and income of Interbank or Inteligo Bank may be treated as passive.
Assets and Income of Interseguro under the PFIC Rules
While passive income generally includes interest, dividends, annuities and other investment income, the PFIC rules provide that income “derived in the active conduct of an insurance business by a corporation which is predominantly engaged in an insurance business” is not treated as passive income. The insurance income exception is intended to ensure that income derived by a bona fide insurance company is not treated as passive income, except to the extent such income is attributable to financial reserves in excess of the reasonable needs of the insurance business. We expect, for purposes of the PFIC rules, that Interseguro will be predominantly engaged in the active conduct of an insurance business and is unlikely to have financial reserves in excess of the reasonable needs of its insurance business in each year of operations. No assurance can be provided, however, that changes in our business operations or in the application of U.S. federal income tax law will not affect the ability of Interseguro to qualify for the active insurance income exception. In this regard, there currently are no U.S. Treasury regulations regarding the application of the PFIC provisions to an insurance company.
Consequences of PFIC Status
Although the matter is not free from doubt, based on our current expectations regarding the value and nature of our assets, the sources and nature of our income, relevant market and shareholder data and our current business plans, we believe that we will not be treated as a PFIC for U.S. federal income tax purposes with respect to our 2013 and current taxable year and we do not anticipate becoming a PFIC in the future. If we are classified as a PFIC for any taxable year, a U.S. Holder would be subject to special rules (and may be subject to increased tax liability) with respect to (a) any gain realized on the sale or other disposition of shares, and (b) any “excess distribution” made by us to the U.S. Holder (generally, any distribution during a taxable year in which distributions to the U.S. Holder on the shares exceed 125% of the average annual distributions the U.S. Holder received on the shares during the preceding three taxable years or, if shorter, the U.S. Holder’s holding period for the shares). Under those rules, (a) the gain or excess distribution would be allocated ratably over the U.S. Holder’s holding period for the shares, (b) the amount allocated to the taxable year in which the gain or excess distribution is realized and to taxable years before the first year in which we became a PFIC would be taxable as ordinary income, (c) the amount allocated to each prior year in which we were a PFIC would be subject to U.S. federal income tax at the highest tax rate in effect for that year and (d) the interest charge generally applicable to underpayments of U.S. federal income tax would be imposed in respect of the tax attributable to each prior year in which we were a PFIC. In addition, in the event we are classified as a PFIC, similar rules would apply to “excess distributions” or gains with respect to subsidiary PFICs held directly or indirectly by us(“Lower-tier PFICs”), even if the proceeds are not distributed to our shareholders. A U.S. Holder generally will be required to file U.S. IRS Form 8621 if it holds our common shares in any year in which we are classified as a PFIC.
A U.S. Holder may be able to mitigate these tax consequences by electing mark to market treatment for its shares, provided the relevant shares constitute “marketable stock” as defined in U.S. Treasury regulations. Our
213
Table of Contents
shares will be “marketable stock” if they are “regularly traded” on a “qualified exchange or other market” within the meaning of the U.S. Treasury regulations. We will apply to have our common shares listed on the NYSE, and we expect that our common shares will qualify as regularly traded on a qualified exchange or other market if they are so listed. No assurance can be given, however, that our common shares will be considered regularly traded on a qualified exchange or other market. A U.S. Holder electing the mark to market regime generally would, during any year in which we are treated as a PFIC, compute gain or loss at the end of such year as if the shares had been sold at fair value. Any gain recognized by the U.S. Holder under the mark to market election, including on an actual sale, would be treated as ordinary income, and the U.S. Holder would be allowed an ordinary deduction for any decrease in the value of shares as of the end of any taxable year and for any loss recognized on an actual sale, but only to the extent, in each case, of previously included mark to market income not offset by previously deducted decreases in value. Any loss on an actual sale of shares would be a capital loss to the extent in excess of previously included mark to market income not offset by previously deducted decreases in value. A U.S. Holder’s tax basis in shares would increase or decrease by gain or loss taken into account under the mark to market regime.
A mark to market election under the PFIC rules applies to all future years of an electing U.S. Holder during which the shares are regularly traded on a qualifying exchange or other market, unless revoked with the U.S. IRS’s consent. A mark to market election under the PFIC rules with respect to shares would not apply to aLower-tier PFIC, and a U.S. Holder would not be able to make such a mark to market election in respect of its indirect ownership interest in thatLower-tier PFIC. Consequently, U.S. Holders of shares could be subject to the PFIC rules with respect to income of theLower-Tier PFIC the value of which already had been taken into account indirectly via mark to market adjustments.
Backup Withholding and Information Reporting
Dividends paid on, and proceeds from the sale or other disposition of, our common shares to a U.S. Holder generally will be subject to the information reporting requirements of the U.S. Code and may be subject to backup withholding unless the U.S. Holder provides an accurate taxpayer identification number and makes any other required certification or otherwise establishes an exemption. Backup withholding is not an additional tax. The amount of any backup withholding from a payment to a U.S. Holder will be allowed as a credit against the U.S. Holder’s U.S. federal income tax liability and may entitle the U.S. Holder to a refund, provided that certain required information is timely furnished to the U.S. IRS.
In addition, U.S. Holders may be required to comply with certain reporting requirements, including filing a U.S. IRS Form 8938, Statement of Foreign Financial Assets, with respect to the holding of certain foreign financial assets, including stock of foreign issuers, either directly or through certain foreign financial institutions, if the aggregate value of all such assets exceeds US$50,000. U.S. Holders should consult their own tax advisors regarding the application of the information reporting rules to our common shares and the application of these reporting requirements to their particular situations.
Possible FATCA Withholding After 2016
Pursuant to U.S. tax legislation commonly referred to as “FATCA,” we may be subject to withholding tax at the rate of 30% on certain payments of U.S. source income and proceeds from the disposition of U.S. stocks and securities, unless we enter into an agreement with the U.S. IRS (or be subject to an intergovernmental agreement) pursuant to which we would be required to satisfy certain due diligence and reporting requirements with respect to our U.S. account holders. In that case, investors may be required to provide additional certifications and information to allow us to determine their FATCA status (such as a U.S. IRSForm W-9 or applicable U.S. IRSForm W-8), and, starting in 2017, investors that fail to provide such certifications and information (ornon-U.S. financial institutions that are not in compliance with FATCA) may be subject to a 30% withholding tax on certain amounts received that are considered “foreign passthru payments,” subject to exclusions for stock that is publicly traded and that meets certain volume requirements. Under current guidance, the term “foreign passthru
214
Table of Contents
payment” is not defined and it is unclear whether or to what extent payments on securities such as our common shares would be considered foreign passthru payments that are subject to withholding under FATCA. In addition, intergovernmental agreements with Panama, Peru, The Bahamas or other applicable jurisdictions may eliminate the requirement to withhold tax on foreign passthru payments. If applicable, withholding on foreign passthru payments would not be required with respect to payments made before January 1, 2017. You should consult your tax advisors regarding the consequences of FATCA, or any intergovernmental agreement ornon-U.S. legislation implementing FATCA, to your investment in our common shares.
HOLDERS OF OUR COMMON SHARES SHOULD CONSULT THEIR OWN TAX ADVISORS AS TO THE U.S. FEDERAL INCOME AND OTHER TAX CONSEQUENCES OF THE ACQUISITION, OWNERSHIP AND DISPOSITION OF OUR COMMON SHARES, INCLUDING, IN PARTICULAR, THE EFFECT OF ANYNON-U.S., STATE OR LOCAL TAX LAWS.
Panamanian Taxation
The following is a summary of the principal Panamanian income tax consequences resulting from the beneficial ownership and disposition of our common shares by certain persons. This summary is based on the Panamanian Tax Code of 1956, as amended, other applicable tax laws, decrees and regulations issued thereunder, and judicial and administrative interpretations thereof, all as in effect on the date hereof, and is subject to any changes in these or other laws, decrees, regulations and interpretations occurring after such date, possibly with retroactive effect. This summary is intended as a descriptive summary only and is not a complete analysis or listing of all potential Panamanian income tax consequences to purchasers of our common shares. The summary does not address the tax treatment of potential purchasers that may be subject to special income tax and withholding rules. The summary is not intended as tax advice to any particular person, nor does it purport to furnish information on the level of detail or with attention to a purchaser’s specific tax circumstances that would be provided by a purchaser’s own tax advisor. Prospective purchasers are urged to consult their own tax advisors as to the precise Panamanian and other tax consequences of acquiring, owning and disposing of our common shares.
Panamanian Income Tax Structure
Panama’s income tax law is essentially territorial. Consequently, income tax is levied only upon income or gains derived from income deemed to arise from Panamanian sources, while income not deemed to be Panamanian source income is not subject to Panamanian income taxes.
Taxation of Dividends
In light of the above, dividend income is not subject to income tax in Panama if the profits to which the dividends relate are not Panamanian source income. Moreover, dividends on dividend income are not subject to income tax in Panama. Accordingly, because we are a holding company that does not perform income generating activities in Panama and our income is generated exclusively from activities outside of Panama, dividend payments made with respect to our common shares would not be subject to income tax or withholding requirements in Panama.
The offering and sale of the shares and the use of proceeds therefrom herein described will all take place outside of Panama, and we do not intend to place, invest or economically utilize in Panama the proceeds that we will receive upon the issuance and sale of the shares, or to conduct business activities in Panama.
Taxation of Capital Gains
Under the tax principles set forth above, because we generate income only from foreign ornon-Panamanian sources, any capital gains realized by a holder of common shares on the sale or other disposition thereof will be exempt from income or capital gains tax in Panama.
215
Table of Contents
Stamp and Other Taxes
Because we are a holding company that does not perform income generating activities in Panama and our income is generated exclusively from activities outside of Panama, the common shares, and any document containing an agreement providing for the sale or disposition thereof, are not subject to stamp, registration or similar taxes, unless the respective documents shall be used before the courts or administrative authorities of Panama, in which case the stamp tax shall be paid at that time at a rate of US$0.10 for each US$100.00 or fraction of US$100.00 of the face value of the obligations stated therein.
In light of the above, there are no sales, transfer or inheritance taxes applicable to the sale or disposition of common shares.
Foreign Investors
Because the gains realized on the sale and disposition of common shares are not subject to income tax as indicated above, a person domiciled outside of Panama is not required to file an income tax return in Panama solely by reason of his or her purchase or ownership of common shares.
216
Table of Contents
Credit Suisse Securities (USA) LLC and Merrill Lynch, Pierce, Fenner & Smith Incorporated are acting as joint global coordinators and joint bookrunners for this offering and representatives of each of the underwriters named below. Subject to the terms and conditions set forth in an underwriting agreement among us, the selling shareholders and the underwriters, the selling shareholders have agreed to sell to the underwriters, and each of the underwriters has agreed, severally and not jointly, to purchase from the selling shareholders, the number of common shares set forth opposite its name below.
| Underwriter | Number of Shares | |
Credit Suisse Securities (USA) LLC | ||
Merrill Lynch, Pierce, Fenner & Smith Incorporated | ||
| ||
Total | ||
|
Subject to the terms and conditions set forth in the underwriting agreement, the underwriters have agreed, severally and not jointly, to purchase all of the shares sold under the underwriting agreement if any of these shares are purchased. If an underwriter defaults, the underwriting agreement provides that the purchase commitments of thenon-defaulting underwriters may be increased or the underwriting agreement may be terminated.
We and the selling shareholders have agreed to indemnify the underwriters against certain liabilities, including liabilities under the Securities Act, or to contribute to payments the underwriters may be required to make in respect of those liabilities.
The underwriters are offering the shares, subject to prior sale, when, as and if issued to and accepted by them, subject to approval of legal matters by their counsel, including the validity of the shares, and other conditions contained in the underwriting agreement, such as the receipt by the underwriters of officers’ certificates and legal opinions. The underwriters reserve the right to withdraw, cancel or modify offers to the public and to reject orders in whole or in part.
Underwriting Discounts and Commissions
The representatives have advised us and the selling shareholders that the underwriters propose initially to offer the shares to the public at the public offering price set forth on the cover page of this prospectus and to dealers at that price less a concession not in excess of US$ per share. After the initial offering, the public offering price, concession or any other term of the offering may be changed.
The following table shows the public offering price, underwriting discount and proceeds before expenses to the selling shareholders. The information assumes either no exercise or full exercise by the underwriters of their option to purchase additional shares.
| Per Share | Without Option | With Option | ||||||||||
Public offering price | US$ | US$ | US$ | |||||||||
Underwriting discount | US$ | US$ | US$ | |||||||||
Proceeds, before expenses, to the selling shareholders | US$ | US$ | US$ | |||||||||
The expenses of the offering, not including the underwriting discounts and commissions, are estimated at US$ and are payable by us.
217
Table of Contents
Option to Purchase Additional Shares
The selling shareholders have granted an option to the underwriters, exercisable for 30 days after the date of this prospectus, to purchase up to an aggregate of additional common shares at the public offering price listed on the cover page of this prospectus, less underwriting discounts and commissions. If the underwriters exercise this option, each will be obligated, subject to conditions contained in the underwriting agreement, to purchase a number of additional shares proportionate to that underwriter’s initial amount reflected in the above table.
No Sales of Similar Securities
We, the selling shareholders, our executive officers and directors and our controlling shareholder have agreed not to sell or transfer any common shares or securities convertible into, exchangeable for, exercisable for, or repayable with common shares, for 180 days after the date of this prospectus without first obtaining the written consent of the representatives of the underwriters. Specifically, we and these other persons have agreed, with certain limited exceptions, not to directly or indirectly:
| • | offer, pledge, sell or contract to sell any common shares; |
| • | sell any option or contract to purchase any common shares; |
| • | purchase any option or contract to sell any common shares; |
| • | grant any option, right or warrant for the sale of any common shares; |
| • | lend or otherwise dispose of or transfer any common shares; |
| • | request or demand that we file a registration statement related to the common shares; or |
| • | enter into any swap or other agreement that transfers, in whole or in part, the economic consequence of ownership of any common shares whether any such swap or transaction is to be settled by delivery of shares or other securities, in cash or otherwise. |
Thislock-up provision applies to common shares and to securities convertible into or exchangeable or exercisable for or repayable with common shares. It also applies to common shares owned now or acquired later by the person executing the agreement or for which the person executing the agreement later acquires the power of disposition. In the event that either (i) during the last 17 days of thelock-up period referred to above, we issue an earnings release or material news or a material event relating to us occurs or (ii) prior to the expiration of thelock-up period, we announce that we will release earnings results or become aware that material news or a material event will occur during the16-day period beginning on the last day of thelock-up period, the restrictions described above shall continue to apply until the expiration of the18-day period beginning on the issuance of the earnings release or the occurrence of the material news or material event, as applicable, unless the representatives on behalf of the underwriters waive, in writing, such an extension. The restrictions described above are subject to certain exceptions.
New York Stock Exchange Listing
We expect the shares to be approved for listing on the New York Stock Exchange under the symbol “IFSP”. In order to meet the requirements for listing on that exchange, the underwriters have undertaken to sell a minimum number of shares to a minimum number of beneficial owners as required by that exchange. Our common shares are also listed on the Lima Stock Exchange under the symbol “IFS”.
Before this offering, there has been no public market for our common shares in the United States. An active trading market for the shares may not develop in the United States. It is also possible that after the offering the common shares will not trade in the public market in the United States at or above the public offering price.
The underwriters do not expect to sell more than 5% of the shares in the aggregate to accounts over which they exercise discretionary authority.
218
Table of Contents
Price Stabilization, Short Positions and Penalty Bids
Until the distribution of the shares is completed, SEC rules may limit underwriters and selling group members from bidding for and purchasing our common shares. However, the representatives may engage in transactions that stabilize the price of the common shares, such as bids or purchases to peg, fix or maintain that price.
In connection with the offering, the underwriters may purchase and sell our common shares in the open market. These transactions may include short sales, purchases on the open market to cover positions created by short sales and stabilizing transactions. Short sales involve the sale by the underwriters of a greater number of shares than they are required to purchase in the offering. “Covered” short sales are sales made in an amount not greater than the underwriters’ option to purchase additional shares described above. The underwriters may close out any covered short position by either exercising their option to purchase additional shares or purchasing shares in the open market. In determining the source of shares to close out the covered short position, the underwriters will consider, among other things, the price of shares available for purchase in the open market as compared to the price at which they may purchase shares through the option granted to them. “Naked” short sales are sales in excess of such option. The underwriters must close out any naked short position by purchasing shares in the open market. A naked short position is more likely to be created if the underwriters are concerned that there may be downward pressure on the price of our common shares in the open market after pricing that could adversely affect investors who purchase in the offering. Stabilizing transactions consist of various bids for or purchases of common shares made by the underwriters in the open market prior to the completion of the offering.
The underwriters may also impose a penalty bid. This occurs when a particular underwriter repays to the other underwriters a portion of the underwriting discount received by it because the representatives have repurchased shares sold by or for the account of such underwriter in stabilizing or short covering transactions.
Similar to other purchase transactions, the underwriters’ purchases to cover the syndicate short sales may have the effect of raising or maintaining the market price of our common shares or preventing or retarding a decline in the market price of our common shares. As a result, the price of our common shares may be higher than the price that might otherwise exist in the open market. The underwriters may conduct these transactions on the New York Stock Exchange, in theover-the-counter market or otherwise.
Neither we nor any of the underwriters make any representation or prediction as to the direction or magnitude of any effect that the transactions described above may have on the price of our common shares. In addition, neither we nor any of the underwriters make any representation that the representatives will engage in these transactions or that these transactions, once commenced, will not be discontinued without notice.
Electronic Distribution
In connection with the offering, certain of the underwriters or securities dealers may distribute prospectuses by electronic means, such ase-mail.
Other Relationships
Some of the underwriters and their affiliates have engaged in, and may in the future engage in, investment banking and other commercial dealings in the ordinary course of business with us or our affiliates. They have received, or may in the future receive, customary fees and commissions for these transactions.
In addition, in the ordinary course of their business activities, the underwriters and their affiliates may make or hold a broad array of investments and actively trade debt and equity securities (or related derivative securities) and financial instruments (including bank loans) for their own account and for the accounts of their customers. Such investments and securities activities may involve securities and/or instruments of ours or our affiliates. The underwriters and their affiliates may also make investment recommendations and/or publish or express independent research views in respect of such securities or financial instruments and may hold, or recommend to clients that they acquire, long and/or short positions in such securities and instruments.
219
Table of Contents
Selling restrictions
The common shares offered by this prospectus may not be offered or sold, directly or indirectly, nor may this prospectus or any other offering material or advertisements in connection with the offer and sale of any such securities be distributed or published in any jurisdiction, except under circumstances that will result in compliance with the applicable rules and regulations of that jurisdiction. Persons into whose possession this prospectus comes are advised to inform themselves about and to observe any restrictions relating to the offering and the distribution of this prospectus. This prospectus does not constitute an offer to sell or a solicitation of an offer to buy any common shares offered by this prospectus in any jurisdiction in which such an offer or a solicitation is unlawful.
Notice to Prospective Investors in Panama
The shares have not been, and will not be, registered for public offering in Panama with the Panamanian Superintendency of the Securities Market (Superintendencia del Mercado de Valores, previously the National Securities Commission of Panama) underDecree-Law 1 of July 8, 1999, as reformed by Law 67 of 2011 (the “Panamanian Securities Act”). Accordingly, the shares may not be offered or sold in Panama nor to persons domiciled in Panama, except in certain limited transactions exempted from the registration requirements of the Panamanian Securities Act. The shares do not benefit from tax incentives accorded by the Panamanian Securities Act, and are not subject to regulation or supervision by the Panamanian Superintendency of the Securities Market as long as the shares are privately offered to no more than 25 persons domiciled in Panama and result in the sale to no more than 10 of such persons.
Notice to Prospective Investors in Peru
The information contained in this prospectus have not been and will not be registered with or approved by the SMV or the Lima Stock Exchange. Accordingly, the shares cannot be offered or sold in Peru, except if such offering is considered a private offering under the securities laws and regulations of Peru.
Notice to Prospective Investors in the European Economic Area
In relation to each Member State of the European Economic Area (each, a “Relevant Member State”), no offer of shares may be made to the public in that Relevant Member State other than:
| A. | to any legal entity which is a qualified investor as defined in the Prospectus Directive; |
| B. | to fewer than 100 or, if the Relevant Member State has implemented the relevant provision of the 2010 PD Amending Directive, 150, natural or legal persons (other than qualified investors as defined in the Prospectus Directive), as permitted under the Prospectus Directive, subject to obtaining the prior consent of the representatives; or |
| C. | in any other circumstances falling within Article 3(2) of the Prospectus Directive; |
provided that no such offer of shares shall require the Company or the representatives to publish a prospectus pursuant to Article 3 of the Prospectus Directive or supplement a prospectus pursuant to Article 16 of the Prospectus Directive.
Each person in a Relevant Member State who initially acquires any shares or to whom any offer is made will be deemed to have represented, acknowledged and agreed that it is a “qualified investor” within the meaning of the law in that Relevant Member State implementing Article 2(1)(e) of the Prospectus Directive. In the case of any shares being offered to a financial intermediary as that term is used in Article 3(2) of the Prospectus Directive, each such financial intermediary will be deemed to have represented, acknowledged and agreed that the shares acquired by it in the offer have not been acquired on anon-discretionary basis on behalf of, nor have they been acquired with a view to their offer or resale to, persons in circumstances which may give rise to an offer of any shares to the public other than their offer or resale in a Relevant Member State to qualified investors as so defined or in circumstances in which the prior consent of the representatives has been obtained to each such proposed offer or resale.
220
Table of Contents
The Company, the representatives and their affiliates will rely upon the truth and accuracy of the foregoing representations, acknowledgements and agreements.
This prospectus has been prepared on the basis that any offer of shares in any Relevant Member State will be made pursuant to an exemption under the Prospectus Directive from the requirement to publish a prospectus for offers of shares. Accordingly any person making or intending to make an offer in that Relevant Member State of shares which are the subject of the offering contemplated in this prospectus may only do so in circumstances in which no obligation arises for the Company or any of the underwriters to publish a prospectus pursuant to Article 3 of the Prospectus Directive in relation to such offer. Neither the Company nor the underwriters have authorized, nor do they authorize, the making of any offer of shares in circumstances in which an obligation arises for the Company or the underwriters to publish a prospectus for such offer.
For the purpose of the above provisions, the expression “an offer to the public” in relation to any shares in any Relevant Member State means the communication in any form and by any means of sufficient information on the terms of the offer and the shares to be offered so as to enable an investor to decide to purchase or subscribe the shares, as the same may be varied in the Relevant Member State by any measure implementing the Prospectus Directive in the Relevant Member State and the expression “Prospectus Directive” means Directive 2003/71/EC (including the 2010 PD Amending Directive, to the extent implemented in the Relevant Member States) and includes any relevant implementing measure in the Relevant Member State and the expression “2010 PD Amending Directive” means Directive 2010/73/EU.
Notice to Prospective Investors in the United Kingdom
In addition, in the United Kingdom, this document is being distributed only to, and is directed only at, and any offer subsequently made may only be directed at persons who are “qualified investors” (as defined in the Prospectus Directive) (i) who have professional experience in matters relating to investments falling within Article 19 (5) of the Financial Services and Markets Act 2000 (Financial Promotion) Order 2005, as amended (the “Order”) and/or (ii) who are high net worth companies (or persons to whom it may otherwise be lawfully communicated) falling within Article 49(2)(a) to (d) of the Order (all such persons together being referred to as “relevant persons”). This document must not be acted on or relied on in the United Kingdom by persons who are not relevant persons. In the United Kingdom, any investment or investment activity to which this document relates is only available to, and will be engaged in with, relevant persons.
Notice to Prospective Investors in Switzerland
The shares may not be publicly offered in Switzerland and will not be listed on the SIX Swiss Exchange (“SIX”) or on any other stock exchange or regulated trading facility in Switzerland. This document has been prepared without regard to the disclosure standards for issuance prospectuses under art. 652a or art. 1156 of the Swiss Code of Obligations or the disclosure standards for listing prospectuses under art. 27ff. of the SIX Listing Rules or the listing rules of any other stock exchange or regulated trading facility in Switzerland. Neither this document nor any other offering or marketing material relating to the shares or the offering may be publicly distributed or otherwise made publicly available in Switzerland.
Neither this document nor any other offering or marketing material relating to the offering, the Company, the shares have been or will be filed with or approved by any Swiss regulatory authority. In particular, this document will not be filed with, and the offer of shares will not be supervised by, the Swiss Financial Market Supervisory Authority FINMA (FINMA), and the offer of shares has not been and will not be authorized under the Swiss Federal Act on Collective Investment Schemes (“CISA”). The investor protection afforded to acquirers of interests in collective investment schemes under the CISA does not extend to acquirers of shares.
Notice to Prospective Investors in the Dubai International Financial Centre
This prospectus relates to an Exempt Offer in accordance with the Offered Securities Rules of the Dubai Financial Services Authority (“DFSA”). This prospectus is intended for distribution only to persons of a type
221
Table of Contents
specified in the Offered Securities Rules of the DFSA. It must not be delivered to, or relied on by, any other person. The DFSA has no responsibility for reviewing or verifying any documents in connection with Exempt Offers. The DFSA has not approved this prospectus nor taken steps to verify the information set forth herein and has no responsibility for the prospectus. The shares to which this prospectus relates may be illiquid and/or subject to restrictions on their resale. Prospective purchasers of the shares offered should conduct their own due diligence on the shares. If you do not understand the contents of this prospectus you should consult an authorized financial advisor.
Notice to Prospective Investors in the United Arab Emirates
The shares will be sold outside the United Arab Emirates and are not part of a public offering and are being offered to a limited number of institutional and private investors in the United Arab Emirates. We have not been reviewed, approved or licensed by the United Arab Emirates Central Bank or any other relevant licensing authorities or governmental agencies in the United Arab Emirates. This document is strictly private and confidential and has not been reviewed, deposited or registered with any licensing authority or governmental agency in the United Arab Emirates, and is being issued to a limited number of institutional and private investors and must not be provided to any person other than the original recipient and may not be reproduced or used for any other purpose. Our shares may not be offered or sold directly or indirectly to the public in the United Arab Emirates.
Notice to Prospective Investors in Australia
No placement document, prospectus, product disclosure statement or other disclosure document has been lodged with the Australian Securities and Investments Commission (“ASIC”), in relation to the offering. This prospectus does not constitute a prospectus, product disclosure statement or other disclosure document under the Corporations Act 2001 (the “Corporations Act”), and does not purport to include the information required for a prospectus, product disclosure statement or other disclosure document under the Corporations Act.
Any offer in Australia of the shares may only be made to persons (the “Exempt Investors”) who are “sophisticated investors” (within the meaning of section 708(8) of the Corporations Act), “professional investors” (within the meaning of section 708(11) of the Corporations Act) or otherwise pursuant to one or more exemptions contained in section 708 of the Corporations Act so that it is lawful to offer the shares without disclosure to investors under Chapter 6D of the Corporations Act.
The shares applied for by Exempt Investors in Australia must not be offered for sale in Australia in the period of 12 months after the date of allotment under the offering, except in circumstances where disclosure to investors under Chapter 6D of the Corporations Act would not be required pursuant to an exemption under section 708 of the Corporations Act or otherwise or where the offer is pursuant to a disclosure document which complies with Chapter 6D of the Corporations Act. Any person acquiring shares must observe such Australianon-sale restrictions.
This prospectus contains general information only and does not take account of the investment objectives, financial situation or particular needs of any particular person. It does not contain any securities recommendations or financial product advice. Before making an investment decision, investors need to consider whether the information in this prospectus is appropriate to their needs, objectives and circumstances, and, if necessary, seek expert advice on those matters.
Notice to Prospective Investors in Hong Kong
The shares have not been offered or sold and will not be offered or sold in Hong Kong, by means of any document, other than (a) to “professional investors” as defined in the Securities and Futures Ordinance (Cap. 571) of Hong Kong and any rules made under that Ordinance; or (b) in other circumstances which do not result
222
Table of Contents
in the document being a “prospectus” as defined in the Companies Ordinance (Cap. 32) of Hong Kong or which do not constitute an offer to the public within the meaning of that Ordinance. No advertisement, invitation or document relating to the shares has been or may be issued or has been or may be in the possession of any person for the purposes of issue, whether in Hong Kong or elsewhere, which is directed at, or the contents of which are likely to be accessed or read by, the public of Hong Kong (except if permitted to do so under the securities laws of Hong Kong) other than with respect to shares which are or are intended to be disposed of only to persons outside Hong Kong or only to “professional investors” as defined in the Securities and Futures Ordinance and any rules made under that Ordinance.
Notice to Prospective Investors in Japan
The shares have not been and will not be registered under the Financial Instruments and Exchange Law of Japan (Law No. 25 of 1948, as amended) and, accordingly, will not be offered or sold, directly or indirectly, in Japan, or for the benefit of any Japanese Person or to others forre-offering or resale, directly or indirectly, in Japan or to any Japanese Person, except in compliance with all applicable laws, regulations and ministerial guidelines promulgated by relevant Japanese governmental or regulatory authorities in effect at the relevant time. For the purposes of this paragraph, “Japanese Person” shall mean any person resident in Japan, including any corporation or other entity organized under the laws of Japan.
Notice to Prospective Investors in Singapore
This prospectus has not been registered as a prospectus with the Monetary Authority of Singapore. Accordingly, this prospectus and any other document or material in connection with the offer or sale, or invitation for subscription or purchase, ofNon-CIS Securities may not be circulated or distributed, nor may theNon-CIS Securities be offered or sold, or be made the subject of an invitation for subscription or purchase, whether directly or indirectly, to persons in Singapore other than (i) to an institutional investor under Section 274 of the Securities and Futures Act, Chapter 289 of Singapore (the “SFA”), (ii) to a relevant person pursuant to Section 275(1), or any person pursuant to Section 275(1A), and in accordance with the conditions specified in Section 275, of the SFA, or (iii) otherwise pursuant to, and in accordance with the conditions of, any other applicable provision of the SFA.
Where theNon-CIS Securities are subscribed or purchased under Section 275 of the SFA by a relevant person which is:
| (a) | a corporation (which is not an accredited investor (as defined in Section 4A of the SFA)) the sole business of which is to hold investments and the entire share capital of which is owned by one or more individuals, each of whom is an accredited investor; or |
| (b) | a trust (where the trustee is not an accredited investor) whose sole purpose is to hold investments and each beneficiary of the trust is an individual who is an accredited investor, |
securities (as defined in Section 239(1) of the SFA) of that corporation or the beneficiaries’ rights and interest (howsoever described) in that trust shall not be transferred within six months after that corporation or that trust has acquired theNon-CIS Securities pursuant to an offer made under Section 275 of the SFA except:
| (a) | to an institutional investor or to a relevant person defined in Section 275(2) of the SFA, or to any person arising from an offer referred to in Section 275(1A) or Section 276(4)(i)(B) of the SFA; |
| (b) | where no consideration is or will be given for the transfer; |
| (c) | where the transfer is by operation of law; |
| (d) | as specified in Section 276(7) of the SFA; or |
| (e) | as specified in Regulation 32 of the Securities and Futures (Offers of Investments) (Shares and Debentures) Regulations 2005 of Singapore. |
223
Table of Contents
Notice to Prospective Investors in Brazil
The offer of shares described in this prospectus will not be carried out by any means that would constitute a public offering in Brazil under Law No. 6,385, of December 7, 1976, as amended, and under CVM Rule (Instrução) No. 400, of December 29, 2003, as amended. The offer and sale of the shares have not been and will not be registered with theComissão de Valores Móbilearios in Brazil. The shares have not been offered or sold, and will not be offered or sold in Brazil, except in circumstances that do not constitute a public offering or distribution under Brazilian laws and regulations.
Notice to Prospective Investors in Chile
The offer of shares described herein is governed by the General Rule (Norma de Carácter General) 336 of June 27, 2012, issued by the Chilean Superintendency of Securities and Insurance (“SVS”). The offer relates to shares not registered with the Securities Registry or the Registry of Foreign Securities of the SVS, so the shares are not subject to the oversight of the SVS. Since the shares are unregistered securities in Chile, we have no obligation to deliver in Chile public information regarding the shares. The shares may not be sold in a public offering in Chile unless they are registered in the Securities Registry or the Registry of Foreign Securities of the SVS.
La oferta de los valores está acogida a la Norma de Carácter General 336 de fecha 27 de junio de 2012 de la Superintendencia de Valores y Seguros de Chile. La oferta versa sobre valores no inscritos en el Registro de Valores o en el Registro de Valores Extranjeros que lleva la SVS, por lo que los valores no están sujetos a la fiscalización de dicho organismo. Por tratarse de valores no inscritos, no existe obligación por parte del emisor de entregar en Chile información pública respecto de los valores. Estos valores no pueden ser objeto de oferta pública a menos que sean inscritos en el Registro de Valores correspondiente.
Notice to Prospective Investors in Colombia
The shares have not been and will not be offered in Colombia through a public offering of securities pursuant to Colombian laws and regulations, nor will they be registered in the Colombian National Registry of Securities and Issuers or listed on a regulated securities trading system such as the Colombian Stock Exchange.
Notice to Prospective Investors in Mexico
The shares described in this prospectus are not being offered, sold or traded in Mexico pursuant to, and do not constitute, anoferta pública (public offering) in accordance with theLey del Mercado de Valores, as amended (Mexican Securities Market Law, or “LMV”), orDisposiciones de carácter general aplicables a las emisoras de valores y a otros participantes del mercado de valores (the general rules, regulations and other general provisions issued by theComisión Nacional Bancaria y de Valores (Mexican Banking and Securities Commission, or “CNBV”), or “General Issuer’s Rules”), nor is the offering contemplated hereby being authorized by the CNBV; therefore, any such shares may not be offered or sold publicly, or otherwise be the subject of brokerage activities, in Mexico, except pursuant to a private placement exemption or other exemptions set forth in the Mexican Securities Market Law. As such, this offering can be made to any person in Mexico so long as the offering is conducted on a direct and personal basis and it complies, among other requirements as set forth under the LMV and the General Issuer’s Rules, with the following:
| (i) | it is made to persons who areinversionistas institucionales (institutional investors) within the meaning of Article 2, Roman numeral XVII, of the LMV and regarded as such pursuant to the laws of Mexico, orinversionistas calificados (qualified investors) within the meaning of Article 2, Roman numeral XVI, of the LMV, and have the income, assets or qualitative characteristics provided for under Article 1, Roman numeral XIII of the General Issuer’s Rules, which require maintenance, in average over the past year, of investments in securities (within the meaning of the LMV) for an amount equal or greater than 1,500,000 Unidades de Inversión (Investment Units or “UDIs”), or in each of the last two years had a gross annual income equal to or greater than 500,000 UDIs; or |
224
Table of Contents
| (ii) | it is made to persons who are shareholders of companies which fulfill their corporate purpose exclusively or substantially with such securities (e.g., investment companies authorized to invest in such securities); or |
| (iii) | it is made pursuant to a plan or applicable program for our or our affiliates’ employees or groups of employees; or |
| (iv) | it is made to less than 100 persons, to the extent such persons do not qualify under (i), (ii) or (iii) above. |
In identifying proposed purchasers for the shares in Mexico, the underwriters will only contact persons or entities whom they reasonably believe are within one of the four categories described in the immediately preceding paragraph in items (i) through (iv). The underwriters may further require you to expressly reiterate that you fall into one of the above mentioned categories, that you further understand that the private offering of shares has less documentary and information requirements than public offerings do, and to waive the right to claim on any lacking thereof.
This prospectus may not be publicly distributed in Mexico, whether through mass media to indeterminate subjects or otherwise, and they are not intended to serve as an application for the registration of the shares before the CNBV or listing of the shares before theBolsa Mexicana de Valores, S.A.B. de C.V. (Mexican Stock Exchange, or “BMV”), nor as a prospectus in connection with a public offering in Mexico. This prospectus is solely our responsibility and has not been reviewed or authorized by the CNBV. The CNBV has not assessed or passed on the investment quality of the shares, our solvency, liquidity or credit quality or the accuracy or completeness of the information provided in this prospectus. In making an investment decision, all investors, including any Mexican investors who may acquire the shares from time to time, must rely on their own review and examination of our company. The acquisition of the shares by an investor who is a resident of Mexico will be made under its own responsibility.
225
Table of Contents
EXPENSES OF THE GLOBAL OFFERING
We estimate that our expenses in connection with the offering, other than underwriting discounts and commissions, will be as follows:
Expenses | Amount (in U.S. dollars) | Percentage of Net Proceeds of the Offering(%) | ||||
Securities and Exchange Commission registration fee | US$ | |||||
New York Stock Exchange listing fee | US$ | |||||
Financial Industry Regulatory Authority filing fee | US$ | |||||
Printing expenses | US$ | |||||
Legal fees and expenses | US$ | |||||
Accountant fees and expenses | US$ | |||||
Miscellaneous costs | US$ | |||||
|
|
| ||||
Total | US$ | |||||
The total underwriting discounts and commissions that the selling shareholders are required to pay will be US$ , or [5]% of the gross proceeds of the offering. All amounts in the table are estimated except the Securities and Exchange Commission registration fee, The New York Stock Exchange listing fee and the Financial Industry Regulatory Authority (FINRA) filing fee.
226
Table of Contents
The validity of the common shares and other matters governed by Panamanian law will be passed upon for us by Arias, Aleman & Mora, our Panamanian counsel, and for the underwriters by Arias, Fabrega & Fabrega. Certain matters governed by U.S. law will be passed upon for us by Shearman & Sterling LLP, New York, New York, and for the underwriters by Simpson Thacher & Bartlett LLP, New York, New York. Certain matters governed by Peruvian law will be passed upon for us by Rubio Leguía Normand and for the underwriters by Miranda & Amado Abogados.
227
Table of Contents
Our combined financial statements at December 31, 2013 and 2012 and for each of the two years ended December 31, 2013, appearing in this prospectus have been audited by Medina, Zaldívar, Paredes & Asociados, a member firm of Ernst & Young Global, independent registered public accounting firm, as set forth in their report thereon appearing elsewhere herein, and are included in reliance upon such report given on the authority of such firm as experts in auditing and accounting.
228
Table of Contents
WHERE YOU CAN FIND MORE INFORMATION
We have filed with the SEC a registration statement (including amendments and exhibits to the registration statement) onForm F-1 under the Securities Act. This prospectus, which is part of the registration statement, does not contain all of the information set forth in the registration statement and the exhibits and schedules to the registration statement. For further information, we refer you to the registration statement and the exhibits and schedules filed as part of the registration statement. If a document has been filed as an exhibit to the registration statement, we refer you to the copy of the document that has been filed. Each statement in this prospectus relating to a document filed as an exhibit is qualified in all respects by the filed exhibit. Each statement regarding a contract, agreement or other document is qualified in its entirety by reference to the actual document.
Upon completion of this offering we will be subject to the informational requirements of the Exchange Act, that are applicable to foreign private issuers. Accordingly, we will be required to file reports and other information with the SEC, including annual reports onForm 20-F and reports onForm 6-K. You may inspect and copy the reports and other information to be filed with the SEC at the public reference facilities maintained by the SEC at 100 F Street, N.E., Washington D.C. 20549. Copies of the materials may be obtained from the Public Reference Room of the SEC at 100 F Street, N.E., Washington, D.C. 20549 at prescribed rates. The public may obtain information on the operation of the SEC’s Public Reference Room by calling the SEC in the United States at1-800-SEC-0330. In addition, the SEC maintains an Internet website at http://www.sec.gov, from which you can electronically access the registration statement and its materials.
As a foreign private issuer, we are not subject to the same disclosure requirements as a domestic U.S. registrant under the Exchange Act. For example, we are not required to prepare and issue quarterly reports. However, we will be required to file annual reports onForm 20-F within the time period required by the SEC, which is currently four months from December 31, the end of our fiscal year. In addition, as a foreign private issuer, we are not subject to the proxy rules under Section 14 of the Exchange Act and our officers and directors will not be subject to Section 16 of the Exchange Act relating to insidershort-swing profit disclosure and recovery regime.
We will file financial statements and other periodic reports with the SMV in Peru. Issuers of securities registered with the SMV are required to disclose material information relating to the issuer. Pursuant to the Securities Market Law and relevant regulations enacted thereunder, all material information in connection with the issuer of registered securities, its activities or securities issued or secured by such issuer which may influence the liquidity or price of such securities must be disclosed. Accordingly, issuers must file with the SMV mainly two types of information: (a) financial information, including unaudited interim financial statements on a quarterly basis (which are not required to be subject to limited review), and audited annual consolidated financial statements on an annual basis, and (b) material information relating to the issuer and its activities that may significantly affect the price, offering or negotiation of the issued securities, and in general, all the information that may be relevant for investors to be able to make investment decisions.
229
Table of Contents
ENFORCEABILITY OF CIVIL LIABILITIES
We are asociedad anónima (corporation) organized and existing under the laws of Panama. Substantially all of our directors, officers, controlling persons and certain of the experts named herein reside outside the United States, and all or a substantial portion of our and their assets are located outside the United States. As a result, it may not be possible for investors to effect service of process within the United States upon such persons, including with respect to matters arising under the federal securities laws of the United States, or to enforce against such persons or against us judgments of courts of the United States predicated upon the civil liability provisions of the federal securities laws of the United States.
Peru
We have been advised by our Peruvian counsel, Rubio Leguía Nomrand, that there is uncertainty as to the enforceability, in original actions in Peruvian courts, of liabilities predicated upon U.S. federal securities laws. In addition, we have been advised by our Peruvian counsel that any final and conclusive judgment for a fixed and definitive sum obtained against us in any foreign court having jurisdiction in respect of any suit, action or proceeding against us for the enforcement of any of the obligations assumed under this prospectus would, upon request, be deemed valid and enforceable in Peru through an exequatur judiciary proceeding (which does not involve the reopening of the case),provided that: (a) there is in effect a treaty between the country where said foreign court sits and Peru regarding the recognition and enforcement of foreign judgments; or (b) in the absence of such a treaty, the original judgment is ratified by the Peruvian courts (Cortes de la República del Perú),provided that the following conditions and requirements are met: (i) the judgment does not resolve matters under the exclusive jurisdiction of Peruvian courts (and the matters contemplated by this prospectus are not matters under the exclusive jurisdiction of Peruvian courts); (ii) the relevant foreign court had jurisdiction under its own private international conflict of law rules and under international rules on jurisdiction; (iii) the defendant was served in accordance with the laws of the place where such proceeding took place, was granted a reasonable opportunity to appear before such foreign court and was guaranteed due process rights; (iv) the judgment has the status ofres judicata in the jurisdiction of the court rendering such judgment; (v) there is no pending litigation in Peru between the same parties for the same dispute, which shall have been initiated before the commencement of the proceeding that concluded with the foreign judgment; (vi) the foreign judgment is not incompatible with another judgment that fulfills the requirements of recognition and enforceability established by Peruvian law unless such foreign judgment was rendered first; (vii) the foreign judgment is not contrary toorden público (public policy) or good morals; (viii) it is not proven that such foreign court denies enforcement of Peruvian judgments or engages in a review of the merits thereof; (ix) a copy of the judgment has been (a) duly apostilled by the competent authority of the jurisdiction of the issuing court, in case of jurisdictions that are parties to the Hague Apostille Convention, or (b) certified by Peruvian consular authorities, in case of jurisdictions that are not parties to the Hague Apostille Convention, and is accompanied by a copy of a certified translation into Spanish; and (x) the applicable court taxes or fees have been paid.
We have no reason to believe that any of our obligations relating to the common shares would be contrary to Peruvian public policy, good morals and international treaties binding upon Peru or generally accepted principles of international law. Our properties and subsidiaries have no immunity from a court’s jurisdiction.
The United States does not currently have a treaty with Peru providing for reciprocal recognition and enforcement of judgments in civil and commercial matters. Therefore, unless theabove-mentioned requirements are satisfied, a final judgment for payment of money rendered by a federal or state court in the United States based on civil liability, whether or not predicated solely upon U.S. federal securities laws, may not be enforceable, either in whole or in part, in Peru. However, if the party in whose favor such unenforced final judgment was rendered brings a new suit in a competent court in Peru, such party may submit to the Peruvian court the final judgment rendered in the United States. Under such circumstances, a judgment by a federal or state court of the United States against our company may be regarded by a Peruvian court only as evidence of the outcome of the dispute to which such judgment relates, and a Peruvian court may choose tore-hear the dispute.
230
Table of Contents
In addition, awards of punitive damages in actions brought in the United States or elsewhere are unenforceable in Peru. In the past, however, Peruvian courts have enforced judgments rendered in the United States based on legal principles of reciprocity and comity.
Panama
There is no existing treaty between the United States and Panama for the reciprocal enforcement of judgments of courts outside Panama, including without limitation, judgments of U.S. courts. Panamanian courts, however, have enforced judgments rendered in the United States based on legal principles of reciprocity and comity. We have been advised by our Panamanian counsel, that judgments rendered by foreign courts may only be recognized and enforced by the courts of Panama in the event that the Supreme Court of Panama validates such judgment by the issuance of a writ of exequatur. Subject to a writ of exequatur, any final judgment rendered by any U.S. court will be recognized, conclusive and enforceable in the courts of Panama without reconsideration of the merits, provided that: (i) such foreign court grants reciprocity to the enforcement of judgments of courts of Panama; (ii) the party against which the judgment was rendered was personally served (service by mail not being sufficient) in such action within such foreign jurisdiction; (iii) the judgment arises out of a personal action against the defendant; (iv) the obligation in respect of which the judgment was rendered is lawful in Panama and does not contradict the public policy of Panama; (v) the judgment is properly authenticated by diplomatic or consular officers of Panama or pursuant to the 1961 Hague Convention on the Legalization of Documents; and (vi) a copy of the final judgment is translated into Spanish by a licensed translator in Panama. We have no reason to believe that any of our obligations relating to the shares would be contrary to Panamanian law.
231
Table of Contents
Combined financial statements as of December 31, 2013, December 31, 2012 and January 1, 2012 and for the years ended December 31, 2013 and 2012
| F-3 | ||||
| F-4 | ||||
| F-4 | ||||
| F-5 | ||||
| F-6 | ||||
| F-7 | ||||
| F-8 | ||||
| F-9 | ||||
Table of Contents
Intercorp Financial Services Inc. and Subsidiaries and Inteligo Group Corp. and Subsidiaries
Combined financial statements as of December 31, 2013, December 31, 2012 and January 1, 2012 and for the years ended December 31, 2013 and 2012
F-1
Table of Contents
Intercorp Financial Services Inc. and Subsidiaries and Inteligo Group Corp. and Subsidiaries
Combined financial statements as of December 31, 2013, December 31, 2012 and January 1, 2012 and for the years ended December 31, 2013 and 2012
| F-3 | ||||
| F-4 | ||||
| F-4 | ||||
| F-5 | ||||
| F-6 | ||||
| F-7 | ||||
| F-8 | ||||
| F-9 | ||||
F-2
Table of Contents
Report of Independent Registered Public Accounting Firm
To the Board of Directors and Shareholders of Intercorp Financial Services Inc. and Inteligo Group Corp.
We have audited the accompanying combined financial statements of Intercorp Financial Services Inc. and its Subsidiaries and Inteligo Group Corp. and its Subsidiaries (both holding companies incorporated in the Republic of Panama, hereinafter “the Group” and both subsidiaries of Intercorp Perú Ltd.) which comprise the combined statements of financial position as of December 31, 2013 and December 31, 2012, the opening combined statement of financial position as of January 1, 2012 and the related combined statements of income, comprehensive income, changes in equity and cash flows for each of the two years ended December 31, 2013. These combined financial statements are the responsibility of the Group’s Management. Our responsibility is to express an opinion on these combined financial statements based on our audits.
We conducted our audits in accordance with the standards of the Public Company Accounting Oversight Board (United States of America). Those standards require that we plan and perform the audit to obtain reasonable assurance about whether the combined financial statements are free of material misstatement. We were not engaged to perform an audit of the Group’s internal control over financial reporting. Our audits included consideration of internal control over financial reporting as a basis for designing audit procedures that are appropriate in the circumstances, but not for the purpose of expressing an opinion on the effectiveness of the Group’s internal control over financial reporting. Accordingly, we express no such opinion. An audit also includes examining, on a test basis, evidence supporting the amounts and disclosures in the financial statements, assessing the accounting principles used and significant estimates made by Management and evaluating the overall financial statement presentation. We believe that our audits provide a reasonable basis for our opinion.
In our opinion, the combined financial statements referred to above present fairly, in all material respects, the combined financial position of Intercorp Financial Services Inc. and Subsidiaries and Inteligo Group Corp. and Subsidiaries as of December 31, 2013, December 31, 2012 and January 1, 2012 and the combined results of their operations and their cash flows for each of the two years in the period ended December 31, 2013, in accordance with International Financial Reporting Standards as issued by the International Accounting Standards Board (IASB).
Lima, Peru,
August 7, 2014
Countersigned by: |
/S/ CRISTIAN EMMERICH |
Cristian Emmerich Medina, Zaldívar, Paredes & Asociados |
C.P.C.C. Register No.19-289 |
F-3
Table of Contents
Intercorp Financial Services Inc. and Subsidiaries and Inteligo Group Corp. and Subsidiaries
Combined statements of financial position
As of December 31, 2013, December 31, 2012 and January 1, 2012
| Note | 2013 | 2012 | 01.01.2012 | |||||||||||
| S/.(000) | S/.(000) | S/.(000) | ||||||||||||
Assets | ||||||||||||||
Cash and due from banks: | 4 | |||||||||||||
Non-interest bearing | 2,046,602 | 1,662,107 | 1,213,323 | |||||||||||
Interest bearing | 5,160,599 | 3,847,061 | 1,212,650 | |||||||||||
Restricted funds | 193,895 | 80,131 | 84,619 | |||||||||||
|
|
|
|
|
| |||||||||
| 7,401,096 | 5,589,299 | 2,510,592 | ||||||||||||
Inter-bank funds | 204,905 | 192,026 | 34,421 | |||||||||||
Trading securities | 126,692 | 144,744 | 221,305 | |||||||||||
Investments available-for-sale | 5 | 5,550,994 | 5,227,467 | 5,676,853 | ||||||||||
Loans, net: | 6 | |||||||||||||
Loans, net of unearned income | 21,161,536 | 16,710,992 | 15,002,203 | |||||||||||
Allowance for loan losses | (694,375 | ) | (588,632 | ) | (500,373 | ) | ||||||||
|
|
|
|
|
| |||||||||
| 20,467,161 | 16,122,360 | 14,501,830 | ||||||||||||
Investment property | 7 | 792,423 | 679,984 | 721,423 | ||||||||||
Property, furniture and equipment, net | 8 | 574,186 | 562,783 | 545,835 | ||||||||||
Due from customers on acceptances | 22,310 | 88,070 | 19,853 | |||||||||||
Accounts receivable and other assets, net | 9 | 1,023,360 | 863,806 | 772,523 | ||||||||||
Deferred income tax asset, net | 14 | 16,029 | 3,010 | 2,734 | ||||||||||
|
|
|
|
|
| |||||||||
Total assets | 36,179,156 | 29,473,549 | 25,007,369 | |||||||||||
|
|
|
|
|
| |||||||||
| Note | 2013 | 2012 | 01.01.2012 | |||||||||||
| S/.(000) | S/.(000) | S/.(000) | ||||||||||||
Liabilities and equity | ||||||||||||||
Deposits and obligations: | 10 | |||||||||||||
Non-interest bearing | 4,563,685 | 2,994,842 | 2,572,881 | |||||||||||
Interest bearing | 17,503,774 | 13,143,767 | 12,026,445 | |||||||||||
|
|
|
|
|
| |||||||||
| 22,067,459 | 16,138,609 | 14,599,326 | ||||||||||||
Inter-bank funds | 100,022 | 9,310 | 7,002 | |||||||||||
Due to banks and correspondents | 11 | 2,762,116 | 2,879,430 | 1,704,864 | ||||||||||
Bonds, notes and other obligations | 12 | 3,424,955 | 3,177,073 | 2,639,603 | ||||||||||
Due from customers on acceptances | 22,310 | 88,070 | 19,853 | |||||||||||
Insurance contract liabilities | 13 | 3,137,183 | 2,694,508 | 2,426,838 | ||||||||||
Accounts payable, provisions and other liabilities | 9 | 938,019 | 825,940 | 656,788 | ||||||||||
Deferred income tax liability, net | 14 | 14,646 | 41,308 | 18,621 | ||||||||||
|
|
|
|
|
| |||||||||
Total liabilities | 32,466,710 | 25,854,248 | 22,072,895 | |||||||||||
|
|
|
|
|
| |||||||||
Equity | 15 | |||||||||||||
Equity attributable to Group’s shareholders: | ||||||||||||||
Capital stock | 1,045,981 | 1,045,981 | 1,045,981 | |||||||||||
Treasury stock | (227,707 | ) | (191,401 | ) | (201,172 | ) | ||||||||
Capital surplus | 268,077 | 268,077 | 268,077 | |||||||||||
Unrealized results, net | 27,092 | 451,252 | 101,029 | |||||||||||
Retained earnings | 2,578,774 | 2,027,107 | 1,705,492 | |||||||||||
|
|
|
|
|
| |||||||||
| 3,692,217 | 3,601,016 | 2,919,407 | ||||||||||||
Non-controlling interest | 20,229 | 18,285 | 15,067 | |||||||||||
|
|
|
|
|
| |||||||||
Total equity | 3,712,446 | 3,619,301 | 2,934,474 | |||||||||||
|
|
|
|
|
| |||||||||
Total liabilities and equity | 36,179,156 | 29,473,549 | 25,007,369 | |||||||||||
|
|
|
|
|
| |||||||||
The accompanying notes are an integral part of these combined financial statements.
F-4
Table of Contents
Intercorp Financial Services Inc. and Subsidiaries and Inteligo Group Corp. and Subsidiaries
Combined income statements
For the years ended December 31, 2013 and 2012
| Note | 2013 | 2012 | ||||||||
| S/.(000) | S/.(000) | |||||||||
Interest and similar income | 18 | 2,405,543 | 2,128,774 | |||||||
Interest and similar expenses | 18 | (657,809 | ) | (566,763 | ) | |||||
|
|
|
| |||||||
Net interest and similar income | 1,747,734 | 1,562,011 | ||||||||
Provision for loan losses, net of recoveries | 6(c) | (377,242 | ) | (400,753 | ) | |||||
|
|
|
| |||||||
Net interest and similar income after provision for loan losses | 1,370,492 | 1,161,258 | ||||||||
Other income | ||||||||||
Fee income from financial services, net | 19 | 622,023 | 671,513 | |||||||
Net gain on foreign exchange transactions | 183,444 | 193,883 | ||||||||
Net gain on sale of securities | 241,932 | 138,581 | ||||||||
Net trading (loss) income | (7,478 | ) | 14,658 | |||||||
Rental income | 33,637 | 41,334 | ||||||||
Profit from sale of investment property | 4,034 | 17,654 | ||||||||
Valuation gain from investment property | 7 | 96,575 | 39,115 | |||||||
Other | 20 | 89,374 | 72,704 | |||||||
|
|
|
| |||||||
Total other income | 1,263,541 | 1,189,442 | ||||||||
|
|
|
| |||||||
Insurance premiums and claims | ||||||||||
Net premiums earned | 21(a) | 263,746 | 86,934 | |||||||
Net claims and benefits incurred for life insurance contracts and others | 22 | (173,808 | ) | (147,478 | ) | |||||
|
|
|
| |||||||
Total premiums earned less claims and benefits | 89,938 | (60,544 | ) | |||||||
|
|
|
| |||||||
Other expenses | ||||||||||
Salaries and employee benefits | 23 | (626,534 | ) | (552,599 | ) | |||||
Administrative expenses | 24 | (637,773 | ) | (596,118 | ) | |||||
Depreciation and amortization | 8(a) and 9(d) | (96,423 | ) | (86,257 | ) | |||||
Impairment loss on available-for-sale investments | 5(c) | (14,080 | ) | (7,119 | ) | |||||
Expenses related to rental income | (6,108 | ) | (3,977 | ) | ||||||
Other | 20 | (90,211 | ) | (72,251 | ) | |||||
|
|
|
| |||||||
Total other expenses | (1,471,129 | ) | (1,318,321 | ) | ||||||
|
|
|
| |||||||
Income before translation result and income tax | 1,252,842 | 971,835 | ||||||||
Translation result | (12,477 | ) | 6,518 | |||||||
Income tax | 14(c) | (265,756 | ) | (213,372 | ) | |||||
|
|
|
| |||||||
Profit for the year | 974,609 | 764,981 | ||||||||
|
|
|
| |||||||
Attributable to: | ||||||||||
Equity holders of the Group | 970,175 | 760,886 | ||||||||
Non-controlling interest | 4,434 | 4,095 | ||||||||
|
|
|
| |||||||
| 974,609 | 764,981 | |||||||||
|
|
|
| |||||||
Basic and diluted pro-forma earnings per share attributable to the Group (stated in Nuevos Soles) | 25 | 8.647 | 6.834 | |||||||
|
|
|
| |||||||
Weighted average number of pro-forma outstanding shares (in thousands) | 25 | 109,892 | 109,904 | |||||||
|
|
|
| |||||||
The accompanying notes are an integral part of these combined financial statements.
F-5
Table of Contents
Intercorp Financial Services Inc. and Subsidiaries and Inteligo Group Corp. and Subsidiaries
Combined statements of comprehensive income
For the years ended December 31, 2013 and 2012
| Note | 2013 | 2012 | ||||||||||
| S/.(000) | S/.(000) | |||||||||||
Profit for the year | 974,609 | 764,981 | ||||||||||
Other comprehensive income | ||||||||||||
Other comprehensive income to be reclassified to profit or loss in subsequent periods: | ||||||||||||
Net (loss) gain on investments available-for-sale | 15(e) | (487,925 | ) | 383,548 | ||||||||
Income tax | 22,582 | (27,983 | ) | |||||||||
|
|
|
| |||||||||
| (465,343 | ) | 355,565 | ||||||||||
Net movement on cash flow hedges | 15(e) | 11,632 | 14,325 | |||||||||
Income tax | (3,460 | ) | (4,296 | ) | ||||||||
|
|
|
| |||||||||
| 8,172 | 10,029 | |||||||||||
Exchange differences on translation of foreign operation | 32,301 | (14,741 | ) | |||||||||
|
|
|
| |||||||||
Net other comprehensive income to be reclassified to profit or loss in subsequent periods, net of income tax | (424,870 | ) | 350,853 | |||||||||
|
|
|
| |||||||||
Total comprehensive income for the year, net of income tax | 549,739 | 1,115,834 | ||||||||||
|
|
|
| |||||||||
Attributable to: | ||||||||||||
Equity holders of the Group | 546,015 | 1,111,109 | ||||||||||
Non-controlling interest | 3,724 | 4,725 | ||||||||||
|
|
|
| |||||||||
| 549,739 | 1,115,834 | |||||||||||
|
|
|
| |||||||||
The accompanying notes are an integral part of these combined financial statements.
F-6
Table of Contents
Intercorp Financial Services Inc. and Subsidiaries and Inteligo Group Corp. and Subsidiaries
Combined statements of changes in equity
For the years ended December 31, 2013 and 2012
| Number of shares | Attributable to IFS Group shareholders | |||||||||||||||||||||||||||||||||||||||||||||||||||
| IFS | Inteligo Group | Unrealized results, net | ||||||||||||||||||||||||||||||||||||||||||||||||||
| Issued | In treasury | Issued | Capital stock | Treasury stock | Capital surplus | Available- for-sale | Derivatives Instruments designated as cash flow hedges | Foreign currency translation reserve | Retained earnings | Total | Non-controlling interest | Total equity | ||||||||||||||||||||||||||||||||||||||||
| (in thousands) | (in thousands) | (in thousands) | S/.(000) | S/.(000) | S/.(000) | S/.(000) | S/.(000) | S/.(000) | S/.(000) | S/.(000) | S/.(000) | S/.(000) | ||||||||||||||||||||||||||||||||||||||||
Balances as of January 1, 2012 | 93,615 | (3,092 | ) | 837 | 1,045,981 | (201,172 | ) | 268,077 | 129,709 | (28,680 | ) | — | 1,705,492 | 2,919,407 | 15,067 | 2,934,474 | ||||||||||||||||||||||||||||||||||||
Net income | — | — | — | — | — | — | — | — | — | 760,886 | 760,886 | 4,095 | 764,981 | |||||||||||||||||||||||||||||||||||||||
Other comprehensive income | — | — | — | — | — | — | 355,006 | 9,958 | (14,741 | ) | — | 350,223 | 630 | 350,853 | ||||||||||||||||||||||||||||||||||||||
|
|
|
|
|
|
|
|
|
|
|
|
|
|
|
|
|
|
|
|
|
|
|
|
|
| |||||||||||||||||||||||||||
Total comprehensive income | — | — | — | — | — | — | 355,006 | 9,958 | (14,741 | ) | 760,886 | 1,111,109 | 4,725 | 1,115,834 | ||||||||||||||||||||||||||||||||||||||
Declared and paid dividends, Note 15(a) | — | — | — | — | — | — | — | — | — | (452,159 | ) | (452,159 | ) | — | (452,159 | ) | ||||||||||||||||||||||||||||||||||||
Dividends paid to minority shareholders in Subsidiaries | — | — | — | — | — | — | — | — | — | — | — | (1,644 | ) | (1,644 | ) | |||||||||||||||||||||||||||||||||||||
Net variation of treasury stock held by Subsidiaries, Note 15(d) | — | (23 | ) | — | — | 9,771 | — | — | — | — | — | 9,771 | — | 9,771 | ||||||||||||||||||||||||||||||||||||||
Dividends received by Subsidiaries on treasury stock | — | — | — | — | — | — | — | — | — | 12,899 | 12,899 | — | 12,899 | |||||||||||||||||||||||||||||||||||||||
Other | — | — | — | — | — | — | — | — | (11 | ) | (11 | ) | 137 | 126 | ||||||||||||||||||||||||||||||||||||||
|
|
|
|
|
|
|
|
|
|
|
|
|
|
|
|
|
|
|
|
|
|
|
|
|
| |||||||||||||||||||||||||||
Balances as of December 31, 2012 | 93,615 | (3,115 | ) | 837 | 1,045,981 | (191,401 | ) | 268,077 | 484,715 | (18,722 | ) | (14,741 | ) | 2,027,107 | 3,601,016 | 18,285 | 3,619,301 | |||||||||||||||||||||||||||||||||||
Net income | — | — | — | — | — | — | — | — | — | 970,175 | 970,175 | 4,434 | 974,609 | |||||||||||||||||||||||||||||||||||||||
Other comprehensive income | — | — | — | — | — | — | (464,576 | ) | 8,115 | 32,301 | — | (424,160 | ) | (710 | ) | (424,870 | ) | |||||||||||||||||||||||||||||||||||
|
|
|
|
|
|
|
|
|
|
|
|
|
|
|
|
|
|
|
|
|
|
|
|
|
| |||||||||||||||||||||||||||
Total comprehensive income | — | — | — | — | — | — | (464,576 | ) | 8,115 | 32,301 | 970,175 | 546,015 | 3,724 | 549,739 | ||||||||||||||||||||||||||||||||||||||
Declared and paid dividends, Note 15(a) | — | — | — | — | — | — | — | — | — | (432,759 | ) | (432,759 | ) | — | (432,759 | ) | ||||||||||||||||||||||||||||||||||||
Dividends paid to minority shareholders in Subsidiaries | — | — | — | — | — | — | — | — | — | — | — | (1,819 | ) | (1,819 | ) | |||||||||||||||||||||||||||||||||||||
Net variation of treasury stock held by Subsidiaries, Note 15(b) | — | (200 | ) | — | — | (36,306 | ) | — | — | — | — | — | (36,306 | ) | — | (36,306 | ) | |||||||||||||||||||||||||||||||||||
Dividends received by Subsidiaries on treasury stock | — | — | — | — | — | — | — | — | — | 12,954 | 12,954 | — | 12,954 | |||||||||||||||||||||||||||||||||||||||
Other | — | — | — | — | — | — | — | — | — | 1,297 | 1,297 | 39 | 1,336 | |||||||||||||||||||||||||||||||||||||||
|
|
|
|
|
|
|
|
|
|
|
|
|
|
|
|
|
|
|
|
|
|
|
|
|
| |||||||||||||||||||||||||||
Balances as of December 31, 2013 | 93,615 | (3,315 | ) | 837 | 1,045,981 | (227,707 | ) | 268,077 | 20,139 | (10,607 | ) | 17,560 | 2,578,774 | 3,692,217 | 20,229 | 3,712,446 | ||||||||||||||||||||||||||||||||||||
|
|
|
|
|
|
|
|
|
|
|
|
|
|
|
|
|
|
|
|
|
|
|
|
|
| |||||||||||||||||||||||||||
The accompanying notes are an integral part of these combined financial statements.
F-7
Table of Contents
Intercorp Financial Services Inc. and Subsidiaries and Inteligo Group Corp. and Subsidiaries
Combined statements of cash flows
For the years ended December 31, 2013 and 2012
| 2013 | 2012 | |||||||
| S/.(000) | S/.(000) | |||||||
Cash flows from operating activities | ||||||||
Profit for the year | 974,609 | 764,981 | ||||||
Add (deduct) | ||||||||
Provision for loan losses, net of recoveries | 377,242 | 400,753 | ||||||
Depreciation and amortization | 96,423 | 86,257 | ||||||
Provision contingencies and others | 3,898 | 6,481 | ||||||
Deferred income tax | (20,559 | ) | (9,868 | ) | ||||
Net gain on sales of securities | (241,932 | ) | (138,581 | ) | ||||
Impairment loss on available-for-sale investments | 14,080 | 7,119 | ||||||
Net trading loss (income) | 7,478 | (14,658 | ) | |||||
Valuation gain from investment property | (96,575 | ) | (39,115 | ) | ||||
Translation result | 12,477 | (6,518 | ) | |||||
Profit from sale of investments property | (4,034 | ) | (17,654 | ) | ||||
Purchase (sale) of trading securities, net | (25,779 | ) | 95,305 | |||||
Increase in accrued interest | (59,146 | ) | (12,281 | ) | ||||
Increase in accrued interest payable | (9,297 | ) | 14,652 | |||||
Net changes in assets and liabilities | ||||||||
Increase in loans | (4,598,837 | ) | (2,087,203 | ) | ||||
Increase in other assets | (96,657 | ) | (102,852 | ) | ||||
Increase in deposits and obligations | 6,420,783 | 1,399,970 | ||||||
(Decrease) increase in due to banks and correspondents | (141,722 | ) | 1,048,494 | |||||
Increase in other liabilities | 843,558 | 816,967 | ||||||
Income tax paid | (253,904 | ) | (229,526 | ) | ||||
|
|
|
| |||||
Net cash provided by operating activities | 3,202,106 | 1,982,723 | ||||||
|
|
|
| |||||
Cash flows from investing activities | ||||||||
(Purchase) sale of available-for-sale investments | (675,425 | ) | 916,494 | |||||
Purchase of property, furniture and equipment | (77,437 | ) | (81,237 | ) | ||||
Purchase of intangible assets | (39,732 | ) | (48,430 | ) | ||||
Purchase of investment property | (147,063 | ) | (105,748 | ) | ||||
Proceeds from the sale of investment property | 135,233 | 203,956 | ||||||
|
|
|
| |||||
Net cash (used in) provided by investing activities | (804,424 | ) | 885,035 | |||||
|
|
|
| |||||
Cash flows from financing activities | ||||||||
Issuance of bonds and notes | 288,868 | 809,629 | ||||||
Redemption and payments of bonds and notes | (264,665 | ) | (205,844 | ) | ||||
Net increase in payable Inter-bank funds | 90,712 | 2,308 | ||||||
Net increase in receivable Inter-bank funds | (12,879 | ) | (157,605 | ) | ||||
Cash dividends | (432,759 | ) | (452,159 | ) | ||||
Payments of dividends to minority shareholders | (1,819 | ) | (1,644 | ) | ||||
|
|
|
| |||||
Net cash used in financing activities | (332,542 | ) | (5,315 | ) | ||||
|
|
|
| |||||
Net increase in cash and cash equivalents | 2,065,140 | 2,862,443 | ||||||
Translation (loss) gain on cash and cash equivalents | (366,196 | ) | 219,995 | |||||
Cash and cash equivalents at the beginning of the year | 5,507,432 | 2,424,994 | ||||||
|
|
|
| |||||
Cash and cash equivalents at the end of the year | 7,206,376 | 5,507,432 | ||||||
|
|
|
| |||||
Supplementary cash flows information: | ||||||||
Cash paid during the year for - | ||||||||
Interest | 639,610 | 522,586 | ||||||
Cash received during the year for - | ||||||||
Interest | 2,263,209 | 2,041,515 | ||||||
The accompanying notes are an integral part of these combined financial statements.
F-8
Table of Contents
Intercorp Financial Services Inc. and Subsidiaries and Inteligo Group Corp. and Subsidiaries
Notes to the combined financial statements
As of December 31, 2013, December 31, 2012 and January 1, 2012
| 1. | Group reorganization and business activity |
The combined financial statements of Intercorp Financial Services Inc. and Subsidiaries (hereinafter “IFS and Subsidiaries”) and Inteligo Group Corp. and Subsidiaries (hereinafter “Inteligo Group and Subsidiaries”) are not of a legal entity existing for the periods presented: rather, it is a combination of said entities, which were under common control of Intercorp Perú Ltd. since their incorporation and during the periods presented. Intercorp Perú Ltd. is a holding company incorporated in 1997 in the Commonwealth of the Bahamas; as of January 1, 2012, December 31, 2012 and December 31, 2013, it held 71.29%, 71.31% and 72.48%, respectively of IFS and 100% of Inteligo Group.
Intercorp Perú Ltd. approved a shareholders structure reorganization on July 18, 2014, with effective date August 1, 2014, through which IFS became the direct owner of 100% of the capital stock of Inteligo Group and Subsidiaries. As a result, Inteligo Group and Subsidiaries became a subsidiary of IFS, see Note 33.
Management has prepared these combined financial statements of IFS and Subsidiaries and Inteligo Group and Subsidiaries (hereinafter “IFS Group and Subsidiaries” or the “Group”) for the purpose of including them as historical financial information in a public prospectus for registration with the United States Securities and Exchange Commission (SEC).
IFS is a holding corporation incorporated in the Republic of Panama in 2006. Its legal domicile is located at Av. Carlos Villarán 140, Urb. Santa Catalina, La Victoria, Lima, Peru.
As of December 31, 2013 and 2012 and as of January 1, 2012, IFS holds 99.29% and 100% of the capital stock of Banco Internacional del Perú S.A.A. – Interbank (hereafter “Interbank”) and of Interseguro Compañía de Seguros S.A. (hereinafter “Interseguro”), respectively. The operations of IFS and its Subsidiaries are concentrated in Peru. The main activities of its Subsidiaries and their assets, liabilities, equity, operating income and net income balances are presented in Note 2.
Inteligo Group Corp. is a holding corporation incorporated in the Republic of Panama in 2006. Its legal domicile is Calle 50 and Elvira Méndez, P.H Torre Financial Center, Floor 48, Panama City, Panama.
As of December 31, 2013 and 2012 and as of January 1, 2012, Inteligo Group holds 100% of the capital stock of Inteligo Bank Ltd. (hereafter “Inteligo Bank”), Inteligo Sociedad Agente de Bolsa S.A. and Inteligo Real Estate Corp. The operations of Inteligo Group and its Subsidiaries are concentrated in Panama and Peru. The main activities of its Subsidiaries and their assets, liabilities, equity, operating income and net income balances are presented in Note 2.
Given that the reorganization will not lead to a change in Intercorp Perú’s control of the Subsidiaries now grouped under IFS, in accordance with International Financial Reporting Standards (see Note 3.2) the reorganization is considered a transaction among entities under common control. As a result, the reorganization will be accounted for using the pooling-of-interest method. Through the effective date of the reorganization, the financial statements are presented as Combined Financial Statements.
The combined financial statements of IFS Group and Subsidiaries as of December 31, 2013, December 31, 2012 and January 1, 2012 and for the years ended December 31, 2013 and 2012, were approved by the Board of Directors on August 7, 2014.
F-9
Table of Contents
Notes to the combined financial statements (continued)
| 2. | Subsidiaries |
IFS’s and Inteligo Group’s Subsidiaries are the following:
IFS’ Subsidiaries -
| (a) | Banco Internacional del Perú S.A.A. - Interbank and Subsidiaries - |
Interbank is incorporated in Peru and is authorized by the Superintendence of Banking, Insurance and Private Pension Funds Administrators (hereafter “the SBS”, for its Spanish acronym) to operate as a universal bank in accordance with Peruvian legislation. The Bank’s operations are governed by the General Act of the Financial and Insurance System and the Organic Act of the Superintendence of Banks and Insurance SBS - Act 26702 (hereafter the “Banking and Insurance Act”), that establishes the requirements, rights, obligations, restrictions and other operating conditions that Peruvian financial and insurance entities must comply with.
As of December 31, 2013 and 2012 and January 1, 2012, Interbank had 269, 262 and 241 offices, respectively, and a branch established in the Republic of Panama. Additionally, it holds 100% of the shares of the following Subsidiaries:
| Entity | Activity | |
Interfondos S.A. Sociedad Administradora de Fondos | Manages mutual funds and investment funds. | |
Internacional de Títulos Sociedad Titulizadora S.A. - Intertítulos S.T. | Manages securitization funds. | |
Inversiones Huancavelica S.A. | Real estate activities. | |
Contacto Servicios Integrales de Crédito y Cobranzas S.A. | Collection services. | |
Corporación Inmobiliaria de La Unión 600 S.A. | Real estate activities. | |
Corporación de Servicios Conexos S.A. - Expressnet | Services related to credit card transactions or products related to the brand “American Express”. | |
IBK Securitizadora | A consolidated special purpose entity (SPE), by which Interbank issued negotiable long - term notes, see Note 12 (d) and (e). |
| (b) | Interseguro Compañía de Seguros S.A. and Subsidiaries - |
Interseguro is incorporated in Peru and its operations are governed by the Banking and Insurance Act. It is authorized by the SBS to issue life and general risk insurance contracts and it holds 75% of the shares of the following Subsidiary:
| Entity | Activity | |
| Centro Comercial Estación Central S.A. | Administration of “Centro Comercial Estación Central”, located in downtown Lima; as of December 31, 2013 and 2012 and January 1, 2012, Interseguro holds 75% of its shares. |
Until July 2012, Interseguro held 100% of the capital stock of Real Plaza S.A. (an entity dedicated to the management of shopping centers) and of InRetail Properties Management S.R.L. (an entity dedicated to activities related to the real estate business). At said date, Interseguro exchanged the aforementioned shares into shares equivalent to 0.09% of the capital stock of InRetail Perú Corp., a related entity. The fair value of shares received amounted to approximately S/.2,775,000. As of the date
F-10
Table of Contents
Notes to the combined financial statements (continued)
of the exchange, Real Plaza S.A. and InRetail Properties Management S.R.L. aggregated assets, liabilities and net income amounted to S/.9,200,000, S/.6,500,000 and S/.11,000, respectively. During 2013, the shares of InRetail Perú Corp. were sold to third parties; see Note 5(e).
Patrimonio Fideicometido D.S.093-2002-EF, Interproperties Perú (herein after “the Patrimonio Fideicometido – Interproperties Perú”) is a structured entity, incorporated in April 2008, in which several investors contributed investment properties; each investor or investors has ownership of and controls the specific contributed investment property. The fair values of the properties owned and controlled by Interseguro which were included in this structured entity as of January 1, 2012, December 31, 2012 and December 31, 2013 amounted to S/.415,261,000, S/.287,309,000 and S/.393,791,000, respectively. See Note 7 for further details. For accounting purposes these assets included in this structure are considered “silos” under IFRS 10 because they are ring-fenced parts of the wider structured entity (the Patrimonio Fideicometido – Interproperties Perú). The Group has ownership of and decision making power over these properties, and the Group has the exposure or rights to their returns; therefore, the Group has consolidated the silos containing the investment properties that it controls.
| (c) | AFP Interactiva S.A. was incorporated in Peru in November 2012. As of December 31, 2013 and 2012, it did not have operations and had a paid in capital of S/.2,600,000. However, in December 2013, AFP Interactiva’s Shareholders’ meeting agreed to reduce the entity’s capital stock by S/.2,599,000, which was undertaken in February 2014. |
Inteligo Group‘s Subsidiaries –
| (a) | Inteligo Bank Ltd. |
It is incorporated in The Commonwealth of the Bahamas and has a branch established in the Republic of Panama that operates under an international license issued by the Superintendence of Banks of the Republic of Panama. Its main activities are private and institutional banking services mainly with Peruvian citizens.
| (b) | Inteligo Sociedad Agente de Bolsa S.A. - |
It is incorporated in Peru and provides brokerage services.
| (c) | Inteligo Real Estate Corp. - |
It is a holding company incorporated in the Republic of Panama. Inteligo Real Estate Corp. controls 100% of the shares of Inteligo Real Estate Perú S.A.C., a company that as of December 31, 2013 holds one investment property contributed to the Patrimonio Fideicometido – Interproperties Perú (see Note 7), for an amount of S/.82,857,000.
F-11
Table of Contents
Notes to the combined financial statements (continued)
The table below presents a summary of the financial statements of the main Subsidiaries, before adjustments and eliminations for the combination, as of December 31, 2013 and 2012 and for the years then ended and as of January 1, 2012 in accordance with International Financial Reporting Standards (IFRS):
| Banco Internacional del Perú S.A.A. – Interbank and Subsidiaries | Interseguro Compañía de Seguros S.A. and Subsidiaries | Inteligo Group Corp. and Subsidiaries | ||||||||||||||||||||||||||||||||||
| 2013 | 2012 | 01.01.2012 | 2013 | 2012 | 01.01.2012 | 2013 | 2012 | 01.01.2012 | ||||||||||||||||||||||||||||
| S/.(000) | S/.(000) | S/.(000) | S/.(000) | S/.(000) | S/.(000) | S/.(000) | S/.(000) | S/.(000) | ||||||||||||||||||||||||||||
Investments | 1,965,625 | 1,584,143 | 2,531,161 | 2,968,640 | 2,712,291 | 2,222,340 | 901,002 | 1,084,368 | 1,180,190 | |||||||||||||||||||||||||||
Loans, net | 19,341,267 | 15,284,963 | 13,955,754 | — | — | — | 1,125,926 | 837,419 | 546,125 | |||||||||||||||||||||||||||
Investment property | — | — | — | 711,466 | 679,984 | 721,423 | 82,857 | — | — | |||||||||||||||||||||||||||
Total assets | 29,872,998 | 23,805,931 | 20,122,755 | 3,870,084 | 3,512,289 | 3,052,096 | 2,718,713 | 2,244,236 | 1,900,448 | |||||||||||||||||||||||||||
Deposits and obligations | 20,239,433 | 14,594,125 | 13,120,684 | — | — | — | 2,017,263 | 1,638,348 | 1,565,643 | |||||||||||||||||||||||||||
Bonds, notes and other obligations | 3,068,715 | 2,707,276 | 2,037,654 | 13,975 | 12,750 | 13,480 | — | — | — | |||||||||||||||||||||||||||
Insurance contracts liabilities | — | — | — | 3,137,183 | 2,694,508 | 2,426,840 | — | — | — | |||||||||||||||||||||||||||
Due to banks and correspondents | 2,881,272 | 3,170,594 | 2,266,132 | — | 191 | 31,047 | 224,711 | 165,883 | — | |||||||||||||||||||||||||||
Total liabilities | 27,068,117 | 21,258,961 | 17,996,023 | 3,328,947 | 2,807,425 | 2,564,841 | 2,265,009 | 1,873,582 | 1,594,122 | |||||||||||||||||||||||||||
Equity, net | 2,804,881 | 2,546,970 | 2,126,732 | 541,137 | 704,864 | 487,255 | 453,704 | 370,654 | 306,326 | |||||||||||||||||||||||||||
Net interest and similar income | 1,532,352 | 1,398,096 | — | 168,397 | 133,206 | — | 56,633 | 46,815 | — | |||||||||||||||||||||||||||
Provision for loan losses, net of recoveries | (377,242 | ) | (400,753 | ) | — | — | — | — | — | — | — | |||||||||||||||||||||||||
Valuation gain and sale gain from investment properties | — | — | — | 100,609 | 56,769 | — | — | — | — | |||||||||||||||||||||||||||
Total premiums earned less claims and benefits | — | — | — | 89,938 | (60,544 | ) | — | — | — | — | ||||||||||||||||||||||||||
Profit for the year | 615,011 | 568,438 | — | 281,556 | 149,972 | — | 109,337 | 99,280 | — | |||||||||||||||||||||||||||
| 3. | Accounting principles and practices |
| 3.1 | Basis of presentation and use of estimates - |
The combined financial statements have been prepared in accordance with International Financial Reporting Standards (“IFRS”) as issued by the International Accounting Standards Board (“IASB”).
IFS had previously prepared consolidated financial statements in accordance with accounting principles prescribed by the SBS for financial and insurance entities established in Peru (Peruvian SBS GAAP). As result, this is the first time IFS has prepared its financial statements in accordance with IFRS as issued by the IASB. Refer to Note 3.4 for information on how IFS adopted IFRS. Inteligo Group and Subsidiaries had previously adopted IFRS as issued by the IASB and therefore prepared its consolidated financial statements for all years presented in according with IFRS as issued by the IASB.
The combined financial statements have been prepared on a historical cost basis, except for investment property, derivative financial instruments, investments at fair value through profit or loss (trading securities) and available-for-sale investments that have been measured at fair value. The combined financial statements are presented in Nuevos Soles and all values are rounded to the nearest thousand (S/.(000)), except when otherwise indicated.
The preparation of the combined financial statements in conformity with IFRS requires Management to make estimates and assumptions that affect the reported amounts of assets, liabilities, revenues and expenses and the disclosure of significant events in the notes to the combined financial statements.
Estimates and judgments are continually evaluated and are based on historical experience and other factors, including expectations of future events that are believed to be reasonable under the current circumstances. Existing circumstances and assumptions about future developments, however, may change due to markets or circumstances arising beyond the control of the Group. Such changes are
F-12
Table of Contents
Notes to the combined financial statements (continued)
reflected in the assumptions when they occur. Actual results could differ from those estimates. The most significant estimates comprised in the accompanying combined financial statements are related to the computation of the allowance for loan losses, the fair value measurement of investments and investment property, the technical reserves for claims and premiums, the estimated useful life of intangible assets, property, furniture and equipment, the fair value measurement of derivative financial instruments and the estimation of deferred tax assets and liabilities. The accounting criteria used for each of these items are described in this Note.
| 3.2 | Basis of combination and consolidation - |
The combined financial statements comprise the consolidated financial statements of IFS Group and Subsidiaries and the consolidated financial statements of Inteligo Group and Subsidiaries (see Note 2), for all periods presented.
For consolidation purposes, control is achieved when the Group is exposed, or has rights, to variable returns from its involvement with the investee and has the ability to affect those returns through its power over the investee. Specifically, the Group controls an investee if and only if the Group has:
| • | power over the investee (i.e., existing rights that give it the current ability to direct the relevant activities of the investee); |
| • | exposure, or rights, to variable returns from its involvement with the investee; and |
| • | the ability to use its power over the investee to affect its returns. |
When the Group has less than a majority of the voting or similar rights of an investee, the Group considers all relevant facts and circumstances in assessing whether it has power over an investee, including:
| • | the contractual arrangement with the other vote holders of the investee; |
| • | rights arising from other contractual arrangements; and |
| • | the Group’s voting rights and potential voting rights. |
The Group re-assesses whether or not it controls an investee if facts and circumstances indicate that there are changes to one or more of the three elements of control. Consolidation of a Subsidiary begins when the Group obtains control over the Subsidiary and ceases when the Group loses control of the subsidiary.
For combination and consolidation purposes, profit or loss and each component of other comprehensive income (“OCI”) are attributed to the equity holders of the parent of the Group and to the non-controlling interests, even if this results in the non-controlling interests having a deficit balance. When necessary, adjustments are made to the financial statements of Subsidiaries to bring their accounting policies into line with the Group’s accounting policies. All intra-group assets and liabilities, income, expenses and cash flows relating to transactions between members of the Group are fully eliminated.
A change in the ownership interest of a Subsidiary, without a loss of control, is accounted for as an equity transaction.
Assets in custody or managed by the Group, such as investments funds and other, are not part of the Group’s combined financial statements, see Note 3.3(y).
F-13
Table of Contents
Notes to the combined financial statements (continued)
| 3.3 | Summary of significant accounting policies - |
| (a) | Foreign currency translation - |
Functional and presentation currency:
The Group has determined that its functional and presentation currency is the Nuevo Sol, because it reflects the economic substance of the underlying events and circumstances relevant to most of the Group entities, insofar as its main operations and/or transactions, such as loans granted, financing obtained, sale of insurance premiums, interest and similar income, interest and similar expenses and an important percentage of purchases are established and settled in Nuevos Soles.
Because Inteligo Bank has a functional currency different from the Nuevo Sol, it was translated for combining purposes using the methodology established by IAS 21, “The Effects of Changes in Foreign Exchanges Rates”, as follows:
| • | Assets and liabilities at the closing rate at the date of each combined statement of financial position. |
| • | Income and expense at the average exchange rate for each month of the year. |
All resulting translation differences were recognized in the caption “Exchange differences on translation of foreign operation” of the combined statements of other comprehensive income.
Foreign currency balances and transactions:
Foreign currency transactions and balances are those realized in currencies different from functional currency. Transactions in foreign currencies are initially recorded in the functional currency exchange rate at the date of the transaction. Monetary assets and liabilities denominated in foreign currencies are adjusted at the functional currency exchange rate in effect on the reporting date. Differences between the closing rate at the date of each combined statement of financial position presented and the exchange rate initially used to record the transactions are recognized in the combined income statements in the period in which they arise, in the caption “Translation result”. Non-monetary assets and liabilities acquired in a foreign currency are recorded at the exchange rate as at the dates of the initial transaction.
| (b) | Income and expense recognition from banking activities - |
Interest income and expense for all interest-bearing financial instruments, including those related to financial instruments classified as held for trading or designated at fair value through profit or loss, are recognized within “Interest and similar income” and “Interest and similar expenses” in the combined statements of income using the effective interest rate method (“EIR”), which is the rate that discounts estimated future cash payments or receipts through the expected life of the financial instrument or a shorter period, where appropriate, to the net carrying amount of the financial asset or financial liability. The calculation takes into account all contractual terms of the financial instrument and includes any fees or incremental costs that are directly attributable to the instrument and are an integral part of the EIR, but not future credit losses.
Interest income is suspended when collection of loans become doubtful, when loans are overdue more than 90 days or when the borrower or securities issuer defaults, if earlier than 90 days; such income is excluded from interest income until collected. Uncollected income on such loans is provisioned. When Management determines that the debtor’s financial condition has improved, the recording of interest thereon is reestablished on an accrual basis.
Interest income includes coupons earned on fixed income investment and trading securities and the accrued discount and premium on financial instruments. Dividends are recognized as income when they are declared.
F-14
Table of Contents
Notes to the combined financial statements (continued)
Fees and commission income are recognized on an accrual basis. Contingent credit fees for loans that are likely to be drawn down and other credit related fees are deferred (together with any direct incremental costs) and recognized as an adjustment to the effective interest rate on the loan.
All other revenues and expenses are recognized on an accrual basis.
| (c) | Insurance contracts - |
Accounting policies for insurance activities:
For the adoption of IFRS 4 “Insurance contracts”, the Group decided to continue applying to insurance contracts the existing accounting policies that were applicable prior to the adoption of IFRS (i.e., Peruvian SBS GAAP) with certain modifications described below:
| • | Incurred but not reported claims reserve (IBNR): IBNR reserves were calculated and applied retrospectively at each recording period using the Chain Ladder methodology (an actuarial method generally accepted) which considers past experience based on cumulative claims losses to estimate future claims developments. |
| • | Technical reserves for annuities and retirement, disability and survival insurances: the Group considered current mortality and morbidity tables which differ from those established by the SBS and set the interest rate to discount the future cash flows of these liabilities as the current interest rate that reflects the interest rate performance of the debt instruments in the portfolio, adjusted for credit risk (see detail of tables and interest rates used in Note 13 (e)). |
Product classification:
Insurance contracts are those contracts where the Group (the insurer) has accepted significant insurance risk from another party (the policyholder) by agreeing to compensate the policyholder if a specified uncertain future event (the insured event) adversely affects the policyholder. As a general guideline, the Group determines whether it has significant insurance risk by comparing benefits paid with benefits payable if the insured event did not occur.
Once a contract has been classified as an insurance contract, it remains an insurance contract for the remainder of its life, even if the insurance risk reduces significantly during this period, unless all rights and obligations are extinguished or expire.
Life insurance contracts offered by the Group include retirement, disability and survival insurance, annuities and group and individual life. The non-life insurance contracts mainly include SOAT (mandatory personal car accident) and debit and credit card insurance.
Insurance receivables:
Insurance receivables are recognized when due and are measured on initial recognition at the fair value of the consideration received or receivable. Subsequent to initial recognition, insurance receivables are measured at amortized cost. As of December 31, 2013 and 2012 and as of January 1, 2012, the carrying value of the insurance receivables is similar to its fair value due to its short term maturity. The carrying value of insurance receivables is reviewed for impairment whenever events or circumstances indicate that the carrying amount may not be recoverable, with the impairment loss recorded in the combined income statements.
Reinsurance commissions:
Commissions on reinsurance contracts for ceded premiums are deferred and amortized on a straight line basis over the term of the coverage of the reinsurance contracts.
F-15
Table of Contents
Notes to the combined financial statements (continued)
Insurance contracts liabilities:
Life insurance liabilities are recognized when contracts are entered into.
The technical reserves for retirement, disability and survival insurance and annuities are determined as the sum of the discounted value of expected future benefits to be paid during a defined or non-defined period, computed upon the basis of current mortality and morbidity tables and current discount interest rates described in Note 13(e). Individual life technical reserves are determined as the sum of the discounted value of expected future benefits, administration expenses, policyholder options and guarantees and investment income, less the discounted value of the expected premiums that would be required to meet the future cash outflows. Furthermore, the technical reserves for group life insurance contracts comprise the provision for unearned premiums and unexpired risks.
Insurance claims reserves include reserves for reported claims and an estimate of the incurred but non-reported claims to the Group (hereinafter “IBNR”). IBNR reserves as of December 31, 2013 and 2012 and as of January 1, 2012, were determined on the basis of the Chain Ladder methodology (a generally accepted actuarial method), whereby the weighted average of past claim development is projected into the future, with the projection based on the ratios of cumulative past claims. Adjustments to the liabilities at each reporting date are recorded in the combined statements of income. The liability is derecognized when the obligation expires, is discharged or is cancelled.
At each reporting date, an assessment is made of whether the recognized life insurance liabilities are adequate, by using an existing liability adequacy test as laid out under IFRS 4. In the case of annuities and retirement, disability and survival insurances this was done by using current assumptions for mortality and morbidity tables and interest rates. As of December 31, 2013, 2012 and January 1, 2012, Management determined that the liabilities were adequate and therefore, it has not recorded any additional insurance liability.
Income recognition:
Life insurance contracts:
Gross recurring premiums on life insurance contracts are recognized as revenue when due from policyholder. For single premium business, revenue is recognized on the date on which the policy is effective. The net premiums earned includes the annual variation of technical reserves.
Property, casualty and group life insurance contracts:
Unearned premiums are those proportions of premiums written in a year that relate to periods of risk after the reporting date. Unearned premiums are calculated on a daily pro rata basis. The proportion attributable to subsequent periods is deferred as a provision for unearned premiums.
Benefits, claims and expenses recognition:
| (i) | Gross benefits and claims |
Gross benefits and claims for life insurance contracts include the cost of all claims arising during the year, including internal and external claims handling costs that are directly related to the processing and settlement of claims. Death, survival and disability claims are recorded on the basis of notifications received. Annuities payments are recorded, monthly, when due.
F-16
Table of Contents
Notes to the combined financial statements (continued)
| (ii) | Reinsurance premiums |
Reinsurance premiums comprise the total premiums payable for the whole coverage provided by contracts entered in the period and are recognized on the date on which the policy incepts. Unearned reinsurance premiums are deferred over the coverage period of the reinsurance contract.
| (iii) | Reinsurance claims |
Reinsurance claims are recognized when the related gross insurance claim is recognized according to the terms of the relevant contract.
| (iv) | Acquisition costs |
The acquisition costs related to the sale of new policies are expensed as incurred.
| (d) | Financial Instruments: Initial recognition and subsequent measurement – |
A financial instrument is any contract that gives rise to a financial asset of one entity and a financial liability or equity instrument of another entity.
In accordance with IAS 39 “Financial Instruments: Recognition and measurement”, all financial assets and liabilities, including derivative financial instruments, are recognized in the statement of financial position and measured based on the category in which the instrument is classified.
Financial assets and liabilities can be classified into the following categories:
| • | financial assets and liabilities at fair value through profit or loss; |
| • | available-for-sale financial assets; |
| • | held-to-maturity financial assets; |
| • | loans and receivables; or |
| • | financial liabilities at amortized cost. |
The classification of financial instruments at initial recognition depends on the purpose and Management’s intention when the financial instruments were acquired and their characteristics. All financial instruments are measured initially at their fair value plus any directly attributable incremental cost of acquisition or issue, except in the case of financial assets and financial liabilities recorded at fair value through profit or loss.
As of December 31, 2013 and 2012 and as of January 1, 2012, the Group has not designated any financial asset into the category of held-to-maturity.
Purchases or sales of financial assets that require delivery of assets within a time frame established by regulation or convention in the marketplace (i.e., regular way trades) are recognized on the trade date, which is the date that the Group commits to purchase or sell the asset. Derivatives are recognized on a trade date basis.
| (i) | Financial assets and liabilities at fair value through profit or loss |
Financial assets and liabilities at fair value through profit or loss include financial assets held for trading and financial assets designated at fair value through profit or loss, which designation is made upon initial recognition and on an instrument-by- instrument basis. Derivative financial instruments are also categorized as held for trading unless they are designated as hedging instruments.
F-17
Table of Contents
Notes to the combined financial statements (continued)
Financial assets are classified as held for trading if they are acquired for the purpose of selling or repurchasing in the near term and are presented in the caption “Trading securities” of the combined statements of financial position. Changes in fair value are recognized in “Net trading income (loss)” of the combined statements of income. Interest and dividend earned is accrued in the combined statements of income in the caption “Net trading income (loss)”, according to the terms of the contract, or when the right to the payment has been established.
Management may only designate an instrument at fair value through profit or loss upon initial recognition when the following criteria are met:
| • | the designation eliminates or significantly reduces the inconsistent treatment that would otherwise arise from measuring assets or liabilities or recognizing gains or losses on them on a different basis; or |
| • | the assets and liabilities are part of a group of financial assets, financial liabilities or both which are managed and their performance evaluated on a fair value basis, in accordance with a documented risk management or investment strategy; or |
| • | the financial instrument contains one or more embedded derivatives, which significantly modify the cash flows that otherwise would be required by the contract. |
Changes in fair value of designated financial assets through profit or loss upon initial recognition are recorded in the “Net trading income (loss)” caption of the combined income statements.
As of December 31, 2013 and 2012 and as of January 1, 2012, the Group has not designated any financial asset as at fair value through profit or loss.
| (ii) | Available-for-sale financial investments |
Available-for-sale financial investments include equity investments and debt securities. Equity investments classified as available-for-sale are those that are neither classified as held for trading nor designated at a fair value through profit or loss. Debt securities in this category are those that are intended to be held for an indefinite period of time and that may be sold in response to needs for liquidity or in response to changes in the market conditions.
After initial recognition, available-for-sale financial investments are measured at fair value with unrealized gains or losses recognized as other comprehensive income in the available-for-sale reserve, net of its corresponding deferred tax and non-controlling interest, until the investment is derecognized, at which time the cumulative gain or loss is recognized in the combined income statements in the caption “Net gain on sale of securities”, or determined to be impaired, at which time the impaired amount is recognized in the combined income statements in the caption “Impairment loss on available–for–sale investments” and removed from the available-for-sale reserve.
Interest and dividends earned are recognized in the combined income statements in the caption “Interest and similar income”. Interest earned is reported as interest income using the effective interest rate method and dividends earned are recognized when collection rights are established.
Estimated fair values are based primarily on quoted prices or, if quoted market prices are not available, discounted expected cash flows using market rates commensurate with the credit quality and maturity of the investment, see paragraph (v).
During years 2013 and 2012, the Group did not reclassify any of its available-for-sale financial investments.
F-18
Table of Contents
Notes to the combined financial statements (continued)
| (iii) | Loans and receivables |
Loans and receivables are non-derivative financial assets with fixed or determinable payments that are not quoted in an active market.
After initial measurement, loans and receivables are subsequently measured at amortized cost using the effective interest rate method, less any allowance for impairment. Amortized cost is calculated by taking into account any discount or premium on acquisition and fees and costs that are an integral part of the effective interest rate. The effective interest rate amortization is recognized in the combined statements of income in the caption “Interest and similar income”. Losses from impairment are recognized in the combined statements of income in the caption “Provision for loan losses, net of recoveries”.
Direct loans are recorded when disbursement of funds to the clients are made. Indirect (off-balance sheet) loans are recorded when documents supporting such facilities are issued. The Group considers as refinanced or restructured those loans that change their payment schedules due to difficulties in the debtor’s ability to repay the loan.
| (iv) | Financial liabilities at amortized cost |
After initial measurement they are subsequently measured at amortized cost using the effective interest rate method. Amortized cost includes any issuance discount or premium and directly attributable transaction costs that are an integral part of the effective interest rate.
Repurchase agreements
Securities sold under agreement to repurchase at a specified future date are not derecognized from the combined statements of financial position as the Group retains substantially all of the risks and rewards of ownerships. The cash received is recognized as an asset with a corresponding obligation to return it, including accrued interest, as a liability, reflecting the transaction’s economic substance as a loan to the Group. The difference between the sale and repurchase price is treated as interest expense and is accrued over the life of the agreement using the effective interest rate and is recognized in the caption “Interest and similar expenses” of the combined income statements.
As of December 31, 2013 and 2012 and as of January 1, 2012, the Group does not have any repurchase agreements.
| (e) | Derecognition of financial assets and liabilities – |
Financial assets
A financial asset (or, where applicable a part of a financial asset or a part of a group of similar financial assets) is derecognized when: (i) the rights to receive cash flows from the asset have expired; or (ii) the Group has transferred its rights to receive cash flows from the asset or has assumed an obligation to pay the received cash flows in full without material delay to a third party under a “pass-through” arrangement; and either the Group has transferred substantially all the risks and rewards of the asset, or the Group has neither transferred nor retained substantially all the risks and rewards of the asset, but has transferred control of the asset.
Financial liabilities
A financial liability is derecognized when the obligation under the liability is discharged, cancelled or expires. When an existing financial liability is replaced by another from the
F-19
Table of Contents
Notes to the combined financial statements (continued)
same lender on substantially different terms, or the terms of an existing liability are substantially modified, such exchange or modification is treated as a derecognition of the original liability and the recognition of a new liability, with the difference between the carrying amount of the original financial liability and the consideration paid recognized in the combined statements of income.
| (f) | Offsetting financial instruments – |
Financial assets and liabilities are offset and the net amount is reported in the combined statements of financial position when there is a legally enforceable right to offset the recognized amounts and Management has the intention to settle on a net basis, or realize the assets and settle the liability simultaneously.
| (g) | Impairment of financial assets – |
The Group assesses at each date of the combined statements of financial position whether there is any objective evidence that a financial asset or a group of financial assets is impaired. An impairment exists if one or more events that has occurred since the initial recognition of the asset (an incurred “loss event”) has an impact on the estimated future cash flows of the financial asset or the group of financial assets that can be reliably estimated. Evidence of impairment may include indications that the borrower or a group of borrowers is experiencing significant financial difficulty, default or delinquency in interest or principal payments, the probability that they will go bankrupt or initiate any legal financial reorganization process and where observable data indicate that there is a measurable decrease in the estimated future cash flows, such as changes in arrears or economic conditions that correlate with defaults. Criteria used for each category of financial assets are as follows:
| (i) | Financial assets carried at amortized cost |
For loans, receivables and held-to-maturity investments that are carried at amortized cost, the Group first assesses whether impairment exists individually for financial assets that are individually significant, or collectively for financial assets that are not individually significant. If the Group determines that no objective evidence of impairment exists for an individually assessed financial asset, whether significant or not, it includes the asset in a group of financial assets with similar credit risk characteristics and collectively assesses them for impairment. Assets that are individually assessed for impairment and for which an impairment loss is, or continues to be, recognized are not included in a collective assessment of impairment.
The amount of any impairment loss identified is measured as the difference between the asset’s carrying amount and the present value of estimated future cash flows (excluding future expected credit losses that have not yet been incurred).
The carrying amount of the asset is reduced through the use of an allowance account and the amount of the loss is recognized in the combined statements of income. A loan, together with the associated allowance, is written off when classified as loss, is fully provisioned and there is real and verifiable evidence that the loan is unrecoverable and collection efforts concluded without success, impossibility of foreclosure or all collateral has been realized or has been transferred to the Group. If in any subsequent year, the amount of the estimated impairment loss increases or decreases because of an event occurring after the impairment was recognized, the previously recognized impairment loss is increased or reduced by adjusting the allowance account.
F-20
Table of Contents
Notes to the combined financial statements (continued)
If in the future a written-off loan is later recovered, the recovery is recognized in the combined income statements as a credit to the caption “Provision for loan losses, net of recoveries”.
The present value of the estimated future cash flows is discounted at the financial asset’s original effective interest rate. If a loan has a variable interest rate, the discount rate for measuring any impairment loss is the current effective interest rate. The calculation of the present value of the estimated future cash flows of a collateralized financial asset reflects the cash flows that may result from foreclosure less costs for obtaining and selling the collateral, whether or not foreclosure is probable.
For collective assessment of impairment, financial assets are grouped considering the Group’s internal credit grading system, which considers credit risk characteristics; for example: asset type, industry, geographical location, collateral type and past-due status and other relevant factors.
Future cash flows from a group of financial assets that are collectively evaluated for impairment are estimated on the basis of historical loss experience for assets with similar credit risk characteristics to those in the group. Historical loss experience is adjusted on the basis of current observable data to reflect the effects of current conditions that did not affect the years on which the historical loss experience is based and to remove the effects of conditions in the historical period that do not currently exists. The methodology and assumptions used are reviewed regularly to reduce any differences between loss estimates and actual loss experience.
| (ii) | Available-for-sale financial investments |
For available-for-sale financial investments, the Group assesses at each date of the combined statements of financial position whether there is objective evidence that an investment or a group of investments is impaired.
In the case of equity investments, objective evidence would include a significant or prolonged decline in its fair value below cost. “Significant” is to be evaluated against the original cost of the investment and “prolonged” against the period in which the fair value has been below its original cost. Where there is evidence of impairment, the cumulative loss (measured as the difference between the acquisition cost and the current fair value, less any previously recognized impairment loss) is removed from investments available-for-sale reserve of the combined statements of changes in equity and recognized in the combined income statements. Impairment losses on equity investments are not reversed through the combined income statements; rather increases in their fair value after impairment are recognized directly in the combined statements comprehensive income.
In the case of debt instruments impairment is assessed based on the same criteria as financial assets carried at amortized cost. The amount recorded for impairment is the cumulative loss measured as the difference between the amortized cost and the current fair value, less any impairment loss on that investment previously recognized in the combined statements of income. Future interest income is based on the reduced carrying amount and is accrued using the interest rate used to discount the future cash flows for the purpose of measuring the impairment loss. Interest income is recorded as part of “Interest and similar income” of the combined statements of income. If in a subsequent year, the fair value of a debt instrument increases and the increase can be objectively related to an event occurring after the impairment loss was recognized in the combined income statements, the impairment loss is reversed through the combined income statements.
F-21
Table of Contents
Notes to the combined financial statements (continued)
| (iii) | Renegotiated loans |
Where possible, the Group seeks to modify loans rather than to take possession of collateral. The modified loans are direct loans in which modifications are made in the time and/or amounts of the original contract due to difficulties in the payment capacity of the client. When a loan is modified, it is no longer considered as past-due but it maintains its previous classification as impaired or not impaired. If the debtor complies with the new agreement during the following six months and an analysis of its payment capacity supports a new improved risk classification, it is classified as not impaired. If subsequent to the loan modification the debtor fails to comply with the new agreement, it is considered as impaired and past-due.
| (h) | Derivatives – |
Derivatives are initially recognized at fair value on the date a derivative contract is entered into and are subsequently remeasured at their fair value. All derivatives are recognized as assets when the fair value is positive and as liabilities when negative.
Derivatives can be designated as hedging instruments under hedge accounting and in the event they qualify, depending upon the nature of the hedged item, the method for recognizing gains or losses from changes in fair value will be different. These derivatives, which are used to hedge exposures to risk or modify the characteristics of financial assets and liabilities and that meet IAS 39 criteria, are recognized as hedge accounting.
Derivatives not designated as hedging instruments or that do not qualify for hedge accounting are initially recognized at fair value and are subsequently remeasured at their fair value; which is estimated based on the market exchange rate and interest rate. They are carried as assets when fair value is positive and as liabilities when fair value is negative. Gains and losses for changes in their fair value are recorded in the combined income statements.
In accordance with IAS 39, to qualify for hedge accounting, all of the following conditions are met:
| (i) | at the inception of the hedge there is formal designation and documentation of the hedging relationship and the entity’s risk management objective and strategy for undertaking the hedge; |
| (ii) | the hedge is expected to be highly effective in offsetting changes in fair value or cash flows attributable to the hedged risk, consistent with the originally documented risk management strategy for that particular hedging relationship; |
| (iii) | for a cash flow hedge, a forecast transaction that is the subject of the hedge must be highly probable and must present an exposure to variations in cash flows that could ultimately affect profit or loss; |
| (iv) | the effectiveness of the hedge can be reliably measured, i.e the fair value or cash flows of the hedge item that are attributable to the hedged risk and the fair value of the hedging instrument can be reliably measured; and |
| (v) | the hedge is assessed on an ongoing basis and it is determined that the hedge has in fact been highly effective throughout the periods for which the hedge was designated. |
IAS 39 presents three hedge accounting categories: fair value hedge; cash flow hedge; and hedge of net investments in a foreign operation. The Group uses derivatives as hedging instruments under cash flow hedge, as detailed in Note 9(e).
F-22
Table of Contents
Notes to the combined financial statements (continued)
Fair value hedge
For derivatives that are designated and qualify as fair value hedges, the following practices are adopted:
| (i) | the gain or loss arising from the new measurement of the hedge instrument at fair value is recognized in income; and |
| (ii) | the gain or loss arising from the hedged item, attributable to the effective portion of the hedge risk, adjusts the book value of the hedged item and is also recognized in income. |
When the derivative expires or is sold or the hedge no longer meets the accounting hedge criteria or the entity revokes the designation, the Group prospectively discontinues the accounting hedge. In addition, any adjustment in the book value of the hedged item is amortized in income.
Cash flow hedge
For derivatives that are designated and qualify as a cash flow hedge, the effective portion of derivative gains or losses are recognized in Other comprehensive income – Gains and losses – cash flow hedge, and reclassified to income in the same period or periods in which the hedge transaction affects income. The portion of gain or loss on derivatives that represents the ineffective portion or the hedge components excluded from the assessment of effectiveness is recognized immediately in income. Amounts originally recorded in Other comprehensive income and subsequently reclassified to income are recorded in the corresponding income or expense lines in which the related hedged item is reported.
When a hedging instrument expires or is sold, or when a hedge no longer meets the criteria for hedge accounting and also when the Group redesignates a hedge, any cumulative gain or loss existing in Other comprehensive income is frozen and is recognized in income when the hedge item is ultimately recognized in the income statement. When a forecast transaction is no longer expected to occur, the cumulative gain or loss recognized in Other comprehensive income is immediately transferred to the combined income statement.
| (i) | Investments in associates – |
An associate is an entity over which the Group has significant influence. Significant influence is the power to participate in the financial and operating policy decisions of the entity, but is not control over those policies. The considerations made to determining significant influence are similar to those necessary to determine control over Subsidiaries.
The Group’s investments in its associates are recognized initially at cost and then are accounted for using the equity method. The Group ‘s investments in associates are included in the caption “Other assets” in the combined statements of financial position. Gains resulting from the use of the equity method of accounting are included in the caption “Other income” of the combined income statements.
| (j) | Leases – |
The determination of whether an arrangement is, or contains, a lease is based in the substance of the arrangement at inception date: i.e., whether fulfillment of the arrangement is dependent on the use of a specific asset or assets on the arrangement conveys a right to use the asset even if that right is not explicitly specified in an arrangement.
F-23
Table of Contents
Notes to the combined financial statements (continued)
Operating leases:
Leases in which a significant portion of the risks and benefits of the asset are hold by the lessor are classified as operating leases. Under this concept, the Group has mainly leases used as banking branches.
When an operating lease is terminated before the lease period has expired, any penalty payment to the lessor is recognized as an expense in the period in which termination takes place.
Finance leases:
Finance leases are recognized as granted loans at the present value of the future lease collections. The difference between the gross receivable amount and the present value of the loan is recognized as unearned interest. Lease income is recognized over the term of the lease agreement using the effective interest rate method, which reflects a constant periodic rate of return.
| (k) | Rental income – |
The Group is the lessor in operating leases of its investment property. Rental income arising from operating leases on investment property is accounted for on a straight-line basis over the lease terms and is included in revenue in the combined income statements due to its operating nature, except for contingent rental income which is recognized when it arises.
The lease term is the non-cancellable period of the lease together with any further term for which the tenant has the option to continue the lease, where, at the inception of the lease, Management is reasonably certain that the tenant will exercise that option.
Amounts received from tenants to terminate leases or to compensate for dilapidations are recognized in the combined income statements when the right to receive them arises.
Service charges, management charges and other expenses recoverable from tenants and income arising from expenses recharged to tenants is recognized in the period in which the compensation becomes receivable. Service and management charges and other such receipts are included in Rental income gross of the related costs, as Management considers that the Group acts as principal in this respect.
| (l) | Investment property – |
Classification of property –
The Group determines whether a property is classified as investment property or inventory property:
| (i) | Investment property comprises land and buildings (principally shopping malls) that are not occupied substantially for use by, or in the operations of, the Group, nor for sale in the ordinary course of business, but are held primarily to earn rental income and capital appreciation. These buildings are substantially rented to tenants and not intended to be sold in the ordinary course of business. Investment property comprises completed property and property under construction or re-development. |
| (ii) | Inventory property comprises property that is held for sale in the ordinary course of business. |
The Group has not classified any property as inventory property.
The Group measures its investment property at fair value according to the requirements of IAS 40 – “Investment Property”, as it has elected to use the fair value model as its accounting policy.
F-24
Table of Contents
Notes to the combined financial statements (continued)
Investment property is measured initially at cost including transaction costs. Transaction costs include transfer taxes, professional fees for legal services and initial leasing commissions to bring the property to the condition necessary for it to be capable of operating. The carrying amount also includes the cost of replacing part of an existing investment property at the time that cost is incurred if the recognition criteria are met.
Properties under construction are measured based on estimates prepared by independent real estate valuation experts, except where such values (e.g. work-in progress incurred on properties under construction) cannot be readily determined. Accordingly, the work-in-progress incurred on these properties under construction is measured at cost until either its fair value becomes reliably measurable or construction is completed (whichever is earlier). Investment property under construction includes the value of land, which is determined by appraisals performed by an accredited appraiser using price per square meter as market comparable method.
Subsequent to initial recognition, investment property is stated at fair value. Gains or losses arising from changes in the fair values are included in the “Valuation gain from investment property” caption of the combined income statement in the year in which they arise, including the corresponding tax effect. Transfers are made to or from investment property only when there is a change in use. No such transfers have occurred for the years ended December 31, 2013 and 2012.
Fair values are evaluated periodically by Management, based on the discounted cash flows that are expected to be obtained from these investments. Fair values of investments properties under construction or investment properties held to operate in the future are assessed by an independent external appraiser, through the application of a recognized valuation model. See note 7 for details of fair value and related assumptions.
Investment property is derecognized when it has been disposed of or permanently withdrawn from use and no future economic benefit is expected from its disposal. The difference between the net disposal proceeds and the carrying amount of the asset would result in either gains or losses at the retirement or disposal of investment property. Any gains or losses are recognized in the income statement in the year of retirement or disposal.
Gains or losses on the disposal of investment property are determined as the difference between net disposal proceeds and the carrying value of the assets in the previous full period’s financial statements.
| (m) | Foreclosed assets – |
Foreclosed assets are recorded at the lower of cost or estimated market value (less cost to sell), which is obtained from valuations made by independent appraisers. Reductions in book values are recorded in the combined income statements.
| (n) | Property, furniture and equipment – |
Property, furniture and equipment are stated at cost less accumulated depreciation and impairment losses, if applicable. Such costs include expenditures that are directly attributable to the acquired property, furniture or equipment. Maintenance and repair costs are charged to the combined income statements; significant renewals and improvements are capitalized when it is probable that future economic benefits, in excess of the originally assessed standard of performance, will flow from the use of the acquired property, furniture or equipment.
F-25
Table of Contents
Notes to the combined financial statements (continued)
Land is not depreciated. Depreciation is calculated using the straight-line method over the estimated useful lives, which are as follows:
| Average years | ||
Buildings and facilities | 40 - 75 | |
Leasehold improvements | 5 | |
Furniture and equipment | 10 | |
Vehicles | 5 |
An item of property, furniture and equipment and any significant part initially recognized is derecognized upon disposal or when no future economic benefits are expected from its use or disposal. Any gain or loss arising on derecognition of the asset (calculated as the difference between the net disposal proceeds and the carrying amount of the asset) is included in the combined income statements.
Asset’s residual value, useful life and the selected depreciation method are periodically reviewed to ensure that they are consistent with current economic benefits and life expectations.
| (o) | Intangible assets with finite useful lives – |
The intangible assets with finite useful lives that are included in the “Accounts receivable and other assets, net” caption of the combined statements of financial position are mainly costs incurred in connection with the acquisition of computer software used in operations and other minor intangible assets. The amortization expense is calculated following the straight-line method in a period between 4 and 5 years, see Note 9(d).
| (p) | Impairment of non-financial assets – |
The Group assesses at each reporting date whether there is an indication that a non-financial asset may be impaired. If any indication exists, or when annual impairment testing for an asset is required, the Group estimates the asset’s recoverable amount. An asset’s recoverable amount is the higher of an asset’s or cash generating unit (CGU) fair value less costs to sell and its value in use and is determined for an individual asset, unless the asset does not generate cash inflows that are largely independent of those from other assets or groups of assets.
When the carrying amount of an asset or CGU exceeds its recoverable amount, the asset is considered impaired and is written down to its recoverable amount. In assessing value in use, the estimated future cash flows are discounted to their present value using a pre-tax discount rate that reflects current market assessments of the time value of money and the risks specific to the asset. In determining fair value less costs to sell, an appropriate valuation model is used.
| (q) | Due from customers on acceptances – |
Due from customers on acceptances corresponds to accounts receivables from customers for import and export transactions, whose obligations have been accepted by the Group. The obligations that must be assumed by the Group for such transactions are recorded as liabilities.
| (r) | Financial guarantees – |
In the ordinary course of business, the Group issues financial guarantees, such as letters of credit, guarantees and acceptances. Financial guarantees are initially recognized at fair value (which is equivalent at that moment to the fee received) in the caption “Other liabilities” of the combined statements of financial position. Subsequent to initial recognition, the Group’s liability under each
F-26
Table of Contents
Notes to the combined financial statements (continued)
guarantee is measured at the higher of the amount initially recognized less, when appropriate, cumulative amortization recognized in the combined statements of income and the best estimate of expenditure required to settle any financial obligation arising as a result of the financial guarantee.
Any increase in the liability relating to a financial guarantee is included in the combined income statements. The fee received is recognized in the caption “Fee income from financial services, net” of the combined income statements on a straight line basis over the life of the granted financial guarantee.
| (s) | Defined contribution pension plan – |
The Group only operates a defined contribution pension plan. The contribution payable to a defined contribution pension plan is in proportion to the services rendered to the Group by the employees and is recorded as an expense in the caption “Salaries and employee benefits” of the combined income statements. Unpaid contributions are recorded as a liability.
| (t) | Provisions – |
Provisions are recognized when the Group has a present obligation (legal or constructive) as a result of a past event, it is probable that an outflow or resources embodying economic benefits will be required to settle the obligation and a reliable estimate can be made of the amount of the obligation. The expense relating to any provision is presented in the combined income statements net of any reimbursement. If the effect of the time value of money is material, provisions are discounted using a current pre-tax rate that reflects, where appropriate, the specific risks of the liability. Where discounting is used, the increase in the provision due to the passage of time is recognized as a finance cost.
| (u) | Contingencies – |
Contingent liabilities are not recognized in the combined financial statements. They are disclosed in notes, unless the probability of an outflow of resources is remote. Contingent assets are not recorded in the combined financial statements; they are disclosed if it is probable that an inflow of economic benefits will be realized.
| (v) | Fair value measurement – |
Fair value is the price that would be received to sell an asset or paid to transfer a liability in an orderly transaction between market participants at the measurement date. The fair value measurement is based on the presumption that the transaction to sell the asset or transfer the liability takes place either:
| • | in the principal market for the asset or liability; or |
| • | in the absence of a principal market, in the most advantageous market for the asset or liability. |
The principal or the most advantageous market must be accessible to by the Group. Also, the fair value of a liability reflects its non-performance risk.
The fair value of an asset or a liability is measured using the assumptions that market participants would use when pricing the asset or liability, assuming that market participants act in their economic best interest.
F-27
Table of Contents
Notes to the combined financial statements (continued)
When available, the Group measures the fair value of a financial instrument using the quoted price in an active market for that instrument. A market is regarded as active if transactions for the asset or liability take place with sufficient frequency and volume to provide pricing information on an ongoing basis.
If there is no quoted price in an active market, then the Group uses valuation techniques. The Group uses valuation techniques that are appropriate in the circumstances and for which sufficient data are available to measure fair value, maximizing the use of relevant observable inputs and minimizing the use of unobservable inputs.
The chosen valuation technique incorporates all of the factors that market participants would take into account in pricing a transaction.
In the case of investment property, the Group has considered the specific requirements relating to highest and best use, valuation premise and principal (or most advantageous) market. The determination of investment property fair value requires the use of estimations such as the future cash flows of the assets (for example: leases, sales, fixed rents for the different types of tenants, variable rental in function to a percentage of the sales, operating costs, building costs (hereinafter “CAPEX”), maintenance CAPEX and the use of discount rates). Additionally, the development risks (such as construction and abandonment) are also taken into account when determining the fair value of the land related to the investment property under construction.
The fair value of investment property in the combined statements of financial position must reflect the volatile nature of the real estate markets; therefore, Management and its appraisers use their market knowledge and professional criteria and do not depend solely on historical comparable transactions. In this sense, there is a greater degree of uncertainty than when more active market exists for the estimation of fair value. Significant methods and assumptions used in the estimation of fair value of investment property are detailed in Note 7.
All assets and liabilities for which fair value is measured or disclosed in the combined financial statements are categorized within the fair value hierarchy, described as follows, based on the lowest level input that is significant to the fair value measurement as a whole:
| • | Level 1 – Quoted (unadjusted) market prices in active markets for identical assets or liabilities. |
| • | Level 2 – Valuation techniques for which the lowest level input that is significant to the fair value measurement is directly or indirectly observable. |
| • | Level 3 – Valuation techniques for which the lowest level input that is significant to the fair value measurement is unobservable. |
For assets and liabilities that are recognized at fair value in the combined financial statements on a recurring basis, the Group determines whether transfers have occurred between Levels in the hierarchy by re-assessing categorization at the end of each reporting period.
For the purpose of fair value disclosures, the Group has determined classes of assets and liabilities on the basis of the nature, characteristics and risks of the asset or liability and the level of the fair value hierarchy as explained above.
Fair values of financial instruments measured at amortized cost are disclosed in Note 30(b).
| (w) | Income tax – |
Income tax is computed based on individual financial statements of IFS, Inteligo Group and each one of their Subsidiaries.
F-28
Table of Contents
Notes to the combined financial statements (continued)
Deferred income tax is accounted for in accordance with IAS 12 “Income Tax”. In this sense, deferred income tax reflects the effects of temporary differences between the carrying amounts of assets and liabilities for accounting purposes and the amounts determined for tax purposes. Deferred assets and liabilities are measured using the tax rates that are expected to be in force in the years in which such temporary differences are expected to be recovered or settled. The measurement of deferred tax assets and deferred tax liabilities reflects the tax consequences that arise from the manner in which each individual entity of the Group expects, at the combined statements of financial position dates, to recover or settle the carrying amount of its assets and liabilities.
Deferred tax assets and liabilities are recognized regardless of when the temporary differences are likely to reverse. Deferred tax assets are recognized when it is probable that sufficient taxable income will be generated against which the deferred tax assets can be offset. At each combined statements of financial position date, unrecognized deferred assets and the carrying amount of deferred tax assets registered are assessed. A previously unrecognized deferred tax asset is recognized to the extent that it has now become probable that future taxable income will allow the deferred tax asset to be recovered. Likewise, the carrying amount of a deferred tax asset is reduced when it is no longer probable that sufficient taxable income will be available to allow all or part of the deferred tax asset to be utilized.
According to IAS 12, deferred income tax is determined considering the tax rate applicable to the non-distributed earnings; any additional tax on distribution of dividends is recorded at the date at which the liability is recognized.
| (x) | Segment information |
IFRS 8 – “Operating segments” requires that operating segments be disclosed consistently with information provided to the chief operating decision maker, who is the person or group of persons that allocates resources to the segments and assesses their performance. Segment information is presented in Note 27.
| (y) | Fiduciary activities and management of funds – |
The Group provides trustee, investment management, advisory and custody services to third parties that result in the holding of assets on their behalf. These assets and income arising thereon are excluded from these combined financial statements, as they are not assets of the Group, see Note 31.
Commissions generated for these activities are included in the caption “Fee income from financial services, net” of the combined income statements.
| (z) | Earnings per share – |
Basic and diluted earnings per share amounts are calculated by dividing the net profit for the year attributable to ordinary equity holders by the weighted average number of ordinary shares outstanding during the year. As of December 31, 2013 and 2012 and as of January 1, 2012, IFS and Inteligo Group do not have financial instruments with dilutive effect, therefore basic and diluted earnings per share are identical for the years reported.
Nevertheless, because of the reorganization described in Note 1, presentation of combined earnings per share is not meaningful. Therefore, the Group is not presenting historical combined earnings per share; instead, the Group is presenting pro-forma earnings per share to reflect the structure of the Group for all periods presented as if the new structure had been in place on January 1, 2012, see Note 25.
F-29
Table of Contents
Notes to the combined financial statements (continued)
| (aa) | Capital surplus – |
Corresponds to the difference between the nominal value of shares issued and their offering price. Capital surplus is presented net of expenses incurred in the issuance of shares.
| (ab) | Treasury stock – |
Shares repurchased are recorded in shareholders’ equity under Treasury shares at their average purchase price. Shares that are subsequently sold are recorded as a reduction in Treasury shares, measured at the average price of treasury stock held at such date.
| (ac) | Cash and cash equivalents – |
Cash presented in the combined statements of cash flows includes cash and due from banks balances with original maturities lower than three months, excluding the respective interest accrued, as well as restricted funds.
| 3.4 | First-time adoption of IFRS – |
These combined financial statements for the year ended December 31, 2013 are the first that the Group has prepared in accordance with IFRS. For periods up to and including the year ended as of December 31, 2013, IFS prepared its financial statements in accordance with Peruvian SBS GAAP, while Inteligo Group prepared its financial statements in accordance with IFRS.
Accordingly, the Group has prepared combined financial statements which comply with IFRS applicable for periods ending on or after December 31, 2013 together with the comparative period date as of and for the year ended December 31, 2012, as described in the summary significant accounting policies. In preparing these combined financial statements, the Group’s opening combined statement of financial position was prepared as of January 1, 2012, the Group’s date of transition to IFRS. This note explains the principal adjustments made by the Group in restating its Peruvian SBS GAAP combined financial statements, including the statement of financial position as of January 1, 2012 and its previously financial statements as of and for the year ended December 31, 2013.
| 3.4.1 | Summary of IFRS 1 – “First-time Adoption of International Financial Reporting Standards” exceptions and exemptions applied in the preparation of these combined financial statements – |
The Group prepared its opening statement of financial position as of January 1, 2012 applying the accounting policies, standards and measurement basis described in Note 3.3 and applying the following exemptions and using all applicable mandatory exceptions set forth in IFRS 1, which are relevant for the Group’s operations:
| (a) | Insurance contracts |
As permitted by IFRS 4, the Group decided to continue applying for insurance contracts the existing accounting policies that were applicable prior to the adoption of IFRS (i.e., Peruvian SBS GAAP) with certain modifications, as described in more detail in Note 3.5.K., to make the financial statements information more reliable and no less relevant.
| (b) | Leases |
An entity that applies IFRS for the first time may opt to apply the specific transition rules of IFRIC 4 – “Determining Whether an Arrangement Contains a Lease” and it may determine if
F-30
Table of Contents
Notes to the combined financial statements (continued)
there is a lease agreement on the transition date to IFRS based on the facts and circumstances existing on the transition date. The application of IFRIC 4 did not have any impact on the Group in the transition date to IFRS.
| (c) | A first-time adopter need not comply with the requirements in IAS 21 to recognize cumulative translation differences on foreign operations. |
Under IFRS 1 exemptions, the cumulative currency translations differences for Inteligo Group are deemed to be zero as of January 1, 2012. Consequently, there was no resulting adjustment against retained earnings.
Translation differences recognized in results of 2012 and 2013 have been presented in a separate equity caption “Unrealized results, net” as “Foreign Currency Translation Reserve”.
| (d) | Estimates |
IFRS 1 requires that estimates used by Management for IFRS purposes at the transition date to IFRSs are to be consistent with estimates made as of the same date under previous GAAP, unless there is evidence of errors in the preparation of the estimates in previous GAAP as compared to IFRS.
Estimates as of January 1, 2012, December 31, 2012 and December 31, 2013 are consistent with those made for the same dates in accordance with Peruvian SBS GAAP, except for new estimations related to adjustments for conversion to IFRS; such as the allowance for loan losses, the fair value of investment property, the residual values and useful lives of the items of property, plant and equipment and the technical reserves and claim reserves; that have been developed with the Group information available at such dates and, as a result, reflect conditions at January 1, 2012, December 31, 2012 and 2013, respectively.
IFS and Subsidiaries reconciliation of equity, income statement and comprehensive income is included in the following tables. As discussed in Note 1, the Group executed a transaction under common control whereby Inteligo Group became a wholly-owned subsidiary of IFS. IFS is a first-time adopter of IFRS while Inteligo Group adopted IFRS in 2005. Therefore, the reconciliation tables required by IFRS 1 are being presented from the perspective of IFS, as the first time adopter and the Inteligo Group balances, which are already stated under IFRS; and excluding elimination entries.
F-31
Table of Contents
Notes to the combined financial statements (continued)
Group reconciliation of equity as of January 1, 2012 (date of transition to IFRS):
| Peruvian SBS GAAP line items | Peruvian SBS GAAP | Note | Reclassifications | Note | Remeasurements | IFRS as of January 1, | Inteligo Group IFRS, net of combination eliminations | IFRS of combined structure | IFRS line items | |||||||||||||||||||||
| S/.(000) | 3.5 | S/.(000) | 3.5 | S/.(000) | S/.(000) | S/.(000) | S/.(000) | |||||||||||||||||||||||
Assets | Assets | |||||||||||||||||||||||||||||
Cash and due from banks | 2,483,364 | — | — | 2,483,364 | 27,228 | 2,510,592 | Cash and due from banks | |||||||||||||||||||||||
Inter-bank funds | 34,421 | — | — | 34,421 | — | 34,421 | Inter-bank funds | |||||||||||||||||||||||
Investments: | Investments: | |||||||||||||||||||||||||||||
Trading securities | 27,946 | — | — | 27,946 | 193,359 | 221,305 | Trading securities | |||||||||||||||||||||||
Investments available-for-sale, net | 3,571,332 | I | 1,083,677 | I | 38,325 | 4,693,334 | 983,519 | 5,676,853 | Investments available-for-sale, net | |||||||||||||||||||||
Held-to-maturity investments | 1,106,402 | I | (1,106,402 | ) | — | — | — | — | ||||||||||||||||||||||
Loans, net: | Loans, net: | |||||||||||||||||||||||||||||
Loans, net of unearned income | 14,324,473 | A, F | 121,669 | 8,641 | 14,454,783 | 547,420 | 15,002,203 | Loans, net of unearned income | ||||||||||||||||||||||
Allowance for loan losses | (593,204 | ) | A, F | (1,124 | ) | B | 95,249 | (499,079 | ) | (1,294 | ) | (500,373 | ) | Allowance for loan losses | ||||||||||||||||
Investment property | 424,255 | 2,682 | J | 294,486 | 721,423 | — | 721,423 | Investment property | ||||||||||||||||||||||
Property, furniture and equipment, net | 444,248 | 3,711 | C | 91,007 | 538,966 | 6,869 | 545,835 | Property, furniture and equipment, net | ||||||||||||||||||||||
Due from customers on acceptances | — | N | 19,853 | — | 19,853 | — | 19,853 | Due from customers on acceptances | ||||||||||||||||||||||
Accounts receivable and other assets, net | 832,562 | A | (129,052 | ) | D, K, L | 4,467 | 707,977 | 64,546 | 772,523 | Accounts receivable and other assets, net | ||||||||||||||||||||
Deferred income tax asset, net | 56,449 | — | M | (54,237 | ) | 2,212 | 522 | 2,734 | Deferred Income tax asset, net | |||||||||||||||||||||
|
|
|
|
|
|
|
|
|
|
|
| |||||||||||||||||||
Total assets | 22,712,248 | (4,986 | ) | 477,938 | 23,185,200 | 1,822,169 | 25,007,369 | Total assets | ||||||||||||||||||||||
|
|
|
|
|
|
|
|
|
|
|
| |||||||||||||||||||
Liabilities and equity | Liabilities and equity | |||||||||||||||||||||||||||||
Deposits and obligations | 13,155,117 | A | (47,647 | ) | — | 13,107,470 | 1,491,856 | 14,599,326 | Deposits and obligations | |||||||||||||||||||||
Inter-bank funds | 7,002 | — | — | 7,002 | — | 7,002 | Inter-bank funds | |||||||||||||||||||||||
Due to banks and correspondents | 1,704,664 | 200 | — | 1,704,864 | — | 1,704,864 | Due to banks and correspondents | |||||||||||||||||||||||
Bonds, notes and other obligations | 2,643,449 | — | — | 2,643,449 | (3,846 | ) | 2,639,603 | Bonds, notes and other obligations | ||||||||||||||||||||||
Due from customers on acceptances | — | N | 19,853 | — | 19,853 | — | 19,853 | Due from customers on acceptances | ||||||||||||||||||||||
Insurance contract liabilities | 2,178,079 | 3,531 | K | 245,228 | 2,426,838 | — | 2,426,838 | Insurance contract liabilities | ||||||||||||||||||||||
Accounts payable, provisions and other liabilities | 648,515 | A | 19,041 | B, E | (38,330 | ) | 629,226 | 27,562 | 656,788 | Accounts payable, provisions and other liabilities | ||||||||||||||||||||
Deferred income tax liability, net | 2,227 | — | M | 16,123 | 18,350 | 271 | 18,621 | Deferred income tax liability, net | ||||||||||||||||||||||
|
|
|
|
|
|
|
|
|
|
|
| |||||||||||||||||||
Total liabilities | 20,339,053 | (5,022 | ) | 223,021 | 20,557,052 | 1,515,843 | 22,072,895 | Total liabilities | ||||||||||||||||||||||
|
|
|
|
|
|
|
|
|
|
|
| |||||||||||||||||||
Equity | Equity | |||||||||||||||||||||||||||||
Equity attributable to Group’s shareholders: | Equity attributable to Group’s shareholders: | |||||||||||||||||||||||||||||
Capital stock | 799,581 | — | — | 799,581 | 246,400 | 1,045,981 | Capital stock | |||||||||||||||||||||||
Treasury stock | (214,996 | ) | — | — | (214,996 | ) | 13,824 | (201,172 | ) | Treasury stock | ||||||||||||||||||||
Capital surplus | 268,077 | — | — | 268,077 | — | 268,077 | Capital surplus | |||||||||||||||||||||||
Unrealized results, net | 22,833 | — | G, I | 30,706 | 53,539 | 47,490 | 101,029 | Unrealized results, net | ||||||||||||||||||||||
Retained earnings | 1,483,832 | — | (*) | 223,048 | 1,706,880 | (1,388 | ) | 1,705,492 | Retained earnings | |||||||||||||||||||||
|
|
|
|
|
|
|
|
|
|
|
| |||||||||||||||||||
| 2,359,327 | — | 253,754 | 2,613,081 | 306,326 | 2,919,407 | |||||||||||||||||||||||||
Non-controlling interest | 13,868 | 36 | 1,163 | 15,067 | — | 15,067 | Non-controlling interest | |||||||||||||||||||||||
|
|
|
|
|
|
|
|
|
|
|
| |||||||||||||||||||
Total equity | 2,373,195 | 36 | 254,917 | 2,628,148 | 306,326 | 2,934,474 | Total equity | |||||||||||||||||||||||
|
|
|
|
|
|
|
|
|
|
|
| |||||||||||||||||||
Total liabilities and equity | 22,712,248 | (4,986 | ) | 477,938 | 23,185,200 | 1,822,169 | 25,007,369 | Total liabilities and equity | ||||||||||||||||||||||
|
|
|
|
|
|
|
|
|
|
|
| |||||||||||||||||||
| (*) | C, B, D, E, L, G, I, J, K. |
F-32
Table of Contents
Notes to the combined financial statements (continued)
Group reconciliation of equity as of December 31, 2013:
| Peruvian SBS GAAP line items | Peruvian SBS GAAP | Note | Reclassifications | Note | Remeasurements | IFRS as of December 31, 2013 | Inteligo Group IFRS, net of combination eliminations | IFRS of combined structure | IFRS line items | |||||||||||||||||||||
| S/.(000) | 3.5 | S/.(000) | 3.5 | S/.(000) | S/.(000) | S/.(000) | S/.(000) | |||||||||||||||||||||||
Assets | Assets | |||||||||||||||||||||||||||||
Cash and due from banks | 6,962,751 | — | — | 6,962,751 | 438,345 | 7,401,096 | Cash and due from banks: | |||||||||||||||||||||||
Inter-bank funds | 204,905 | — | — | 204,905 | — | 204,905 | Inter-bank funds | |||||||||||||||||||||||
Investments: | Investments: | |||||||||||||||||||||||||||||
Trading securities | 67,724 | — | — | 67,724 | 58,968 | 126,692 | Trading securities | |||||||||||||||||||||||
Investments available-for-sale, net | 2,592,462 | I | 2,219,153 | I | (72,672 | ) | 4,738,943 | 812,051 | 5,550,994 | Investments available-for-sale, net | ||||||||||||||||||||
Held-to-maturity investments | 2,221,686 | I | (2,221,686 | ) | — | — | — | — | ||||||||||||||||||||||
Loans, net: | Loans, net: | |||||||||||||||||||||||||||||
Loans, net of unearned income | 19,936,670 | A, F | 88,743 | 8,854 | 20,034,267 | 1,127,269 | 21,161,536 | Loans, net of unearned income | ||||||||||||||||||||||
Allowance for loan losses | (785,272 | ) | A, F | (904 | ) | B | 93,144 | (693,032 | ) | (1,343 | ) | (694,375 | ) | Allowance for loan losses | ||||||||||||||||
Investment property | 446,550 | 545 | J | 262,471 | 709,566 | 82,857 | 792,423 | Investment property | ||||||||||||||||||||||
Property, furniture and equipment, net | 446,106 | 2,917 | C | 116,730 | 565,753 | 8,433 | 574,186 | Property, furniture and equipment, net | ||||||||||||||||||||||
Due from customers on acceptances | — | N | 22,310 | — | 22,310 | — | 22,310 | Due from customers on acceptances | ||||||||||||||||||||||
Accounts receivable and other assets, net | 1,041,036 | A | (83,652 | ) | D, L | 663 | 958,047 | 65,313 | 1,023,360 | Accounts receivable and other assets, net | ||||||||||||||||||||
Deferred Income Tax asset, net | 78,166 | — | M | (63,614 | ) | 14,552 | 1,477 | 16,029 | Deferred income tax asset, net | |||||||||||||||||||||
|
|
|
|
|
|
|
|
|
|
|
| |||||||||||||||||||
Total assets | 33,212,784 | 27,426 | 345,576 | 33,585,786 | 2,593,370 | 36,179,156 | Total assets | |||||||||||||||||||||||
|
|
|
|
|
|
|
|
|
|
|
| |||||||||||||||||||
Liabilities and equity | Liabilities and equity | |||||||||||||||||||||||||||||
Deposits and obligations: | 20,148,821 | — | — | 20,148,821 | 1,918,638 | 22,067,459 | Deposits and obligations: | |||||||||||||||||||||||
Inter-bank funds | 100,022 | — | — | 100,022 | — | 100,022 | Inter-bank funds | |||||||||||||||||||||||
Due to banks and correspondents | 2,537,405 | — | — | 2,537,405 | 224,711 | 2,762,116 | Due to banks and correspondents | |||||||||||||||||||||||
Bonds, notes and other obligations | 3,426,557 | — | — | 3,426,557 | (1,602 | ) | 3,424,955 | Bonds, notes and other obligations | ||||||||||||||||||||||
Due from customers on acceptances | — | N | 22,310 | �� | — | 22,310 | — | 22,310 | Due from customers on acceptances | |||||||||||||||||||||
Insurance contract liabilities | 3,046,611 | — | K | 90,572 | 3,137,183 | — | 3,137,183 | Insurance contract liabilities | ||||||||||||||||||||||
Accounts payable, provisions and other liabilities | 928,570 | 5,116 | B, E | (13,335 | ) | 920,351 | 17,668 | 938,019 | Accounts payable, provisions and other liabilities | |||||||||||||||||||||
Deferred Income Tax liability, net | 647 | — | M | 13,999 | 14,646 | — | 14,646 | Deferred income tax liability, net | ||||||||||||||||||||||
|
|
|
|
|
|
|
|
|
|
|
| |||||||||||||||||||
Total liabilities | 30,188,633 | 27,426 | 91,236 | 30,307,295 | 2,159,415 | 32,466,710 | Total liabilities | |||||||||||||||||||||||
|
|
|
|
|
|
|
|
|
|
|
| |||||||||||||||||||
Equity | Equity | |||||||||||||||||||||||||||||
Equity attributable to Group’s shareholders: | Equity attributable to Group’s shareholders: | |||||||||||||||||||||||||||||
Capital stock | 799,581 | — | — | 799,581 | 246,400 | 1,045,981 | Capital stock | |||||||||||||||||||||||
Treasury stock | (221,703 | ) | — | — | (221,703 | ) | (6,004 | ) | (227,707 | ) | Treasury stock | |||||||||||||||||||
Capital surplus | 268,077 | — | — | 268,077 | — | 268,077 | Capital surplus | |||||||||||||||||||||||
Unrealized results, net | (15,259 | ) | — | G, H, I | (44,679 | ) | (59,938 | ) | 87,030 | 27,092 | Unrealized results, net | |||||||||||||||||||
Retained earnings | 2,174,290 | — | (*) | 297,955 | 2,472,245 | 106,529 | 2,578,774 | Retained earnings | ||||||||||||||||||||||
|
|
|
|
|
|
|
|
|
|
|
| |||||||||||||||||||
| 3,004,986 | — | 253,276 | 3,258,262 | 433,955 | 3,692,217 | |||||||||||||||||||||||||
Non-controlling interest | 19,165 | — | 1,064 | 20,229 | — | 20,229 | Non-controlling interest | |||||||||||||||||||||||
|
|
|
|
|
|
|
|
|
|
|
| |||||||||||||||||||
Total equity | 3,024,151 | — | 254,340 | 3,278,491 | 433,955 | 3,712,446 | Total equity | |||||||||||||||||||||||
|
|
|
|
|
|
|
|
|
|
|
| |||||||||||||||||||
Total liabilities and equity | 33,212,784 | 27,426 | 345,576 | 33,585,786 | 2,593,370 | 36,179,156 | Total liabilities and equity | |||||||||||||||||||||||
|
|
|
|
|
|
|
|
|
|
|
| |||||||||||||||||||
| (*) | C, B, D, E, L, G, H, I, J, K. |
F-33
Table of Contents
Notes to the combined financial statements (continued)
Group reconciliation of combined income statement for the year ended December 31, 2013:
| Peruvian SBS GAAP line items | Peruvian SBS GAAP | Reclassifications(*) | Remeasurements | Note 3.5 | IFRS as of December 31, 2013 | Inteligo Group IFRS, net of combination eliminations | IFRS of combined structure | IFRS line items | ||||||||||||||||||||||||
| S/.(000) | S/.(000) | S/.(000) | S/.(000) | S/.(000) | S/.(000) | |||||||||||||||||||||||||||
Interest and similar income | 2,528,251 | (225,854 | ) | (553 | ) | 2,301,844 | 103,699 | 2,405,543 | Interest and similar income | |||||||||||||||||||||||
Commissions for credit cards and merchant fees | (252,278 | ) | (8) | |||||||||||||||||||||||||||||
Net gain on sale of securities | 25,746 | (5) | ||||||||||||||||||||||||||||||
Others | 678 | |||||||||||||||||||||||||||||||
Interest and similar expenses | (591,213 | ) | (23,991 | )(1) | — | (615,204 | ) | (42,605 | ) | (657,809 | ) | Interest and similar expenses | ||||||||||||||||||||
|
|
|
|
|
|
|
|
|
|
|
| |||||||||||||||||||||
Net interest and similar income | 1,937,038 | (249,845 | ) | (553 | ) | 1,686,640 | 61,094 | 1,747,734 | Net interest and similar income | |||||||||||||||||||||||
Provision for loan losses, net of recoveries | (367,468 | ) | — | (9,774 | ) | B | (377,242 | ) | — | (377,242 | ) | Provision for loan losses, net of recoveries | ||||||||||||||||||||
|
|
|
|
|
|
|
|
|
|
|
| |||||||||||||||||||||
Net interest and similar income after provision for loan losses | 1,569,570 | (249,845 | ) | (10,327 | ) | 1,309,398 | 61,094 | 1,370,492 | Net interest and similar income after provision for loan losses | |||||||||||||||||||||||
| Other income | ||||||||||||||||||||||||||||||||
Banking services commissions | 224,532 | 327,701 | (7,894 | ) | E | 544,339 | 77,684 | 622,023 | Fee income from financial services, net | |||||||||||||||||||||||
Commissions for credit cards and merchant fees | 252,278 | (8) | ||||||||||||||||||||||||||||||
Administration of mutual funds | 53,015 | (2) | ||||||||||||||||||||||||||||||
Deposit Insurance Fund fees | 23,991 | (1) | ||||||||||||||||||||||||||||||
Other services commissions | (1,583 | ) | (3) | |||||||||||||||||||||||||||||
Result of financial operations – RFO | ||||||||||||||||||||||||||||||||
Net gain on foreign exchange transactions | 183,444 | — | — | 183,444 | — | 183,444 | Net gain on foreign exchange transactions | |||||||||||||||||||||||||
Translation result | (15,844 | ) | 15,844 | (4) | — | — | — | — | - | |||||||||||||||||||||||
Net gain on sale of securities | 216,837 | (25,746 | )(5) | 2,163 | I | 193,254 | 48,678 | 241,932 | Net gain on sale of securities | |||||||||||||||||||||||
Net trading income (loss) | 5,296 | 4,107 | (22,129 | ) | G, L | (12,726 | ) | 5,248 | (7,478 | ) | Net trading income (loss) | |||||||||||||||||||||
Rental income | 36,109 | (2,472 | ) | — | 33,637 | — | 33,637 | Rental income | ||||||||||||||||||||||||
Profit from sale of investment property | 101,600 | — | (76,402 | ) | J | 25,198 | (21,164 | ) | 4,034 | Profit from sale of investment property | ||||||||||||||||||||||
| — | — | 77,310 | J | 77,310 | 19,265 | 96,575 | Valuation gain from investment property | |||||||||||||||||||||||||
Other RFO | (4,563 | ) | 4,563 | — | — | — | — | |||||||||||||||||||||||||
|
|
|
|
|
|
|
|
|
| |||||||||||||||||||||||
Total RFO | 522,879 | (3,704 | ) | (19,058 | ) | 500,117 | 52,027 | |||||||||||||||||||||||||
Other income | 134,790 | (40,489 | ) | 3,180 | 97,481 | (8,107 | ) | 89,374 | Other | |||||||||||||||||||||||
Administration of mutual funds | (53,015 | ) | (2) | |||||||||||||||||||||||||||||
Other services commissions | 1,583 | (3) | ||||||||||||||||||||||||||||||
Other income-insurance | 5,132 | (7) | ||||||||||||||||||||||||||||||
Other | 5,811 | |||||||||||||||||||||||||||||||
|
|
|
|
|
|
|
|
|
|
|
| |||||||||||||||||||||
Total other income | 882,201 | 283,508 | (23,772 | ) | 1,141,937 | 121,604 | 1,263,541 | Total other income | ||||||||||||||||||||||||
F-34
Table of Contents
Notes to the combined financial statements (continued)
| Peruvian SBS GAAP line items | Peruvian SBS GAAP | Reclassifications(*) | Remeasurements | Note 3.5 | IFRS as of December 31, 2013 | Inteligo Group IFRS, net of combination eliminations | IFRS of combined structure | IFRS line items | ||||||||||||||||||||||||
| S/.(000) | S/.(000) | S/.(000) | S/.(000) | S/.(000) | S/.(000) | |||||||||||||||||||||||||||
Result from insurance underwriting, net | Insurance premiums and claims | |||||||||||||||||||||||||||||||
Net premiums earned | 129,990 | — | 133,756 | K | 263,746 | — | 263,746 | Net premiums earned | ||||||||||||||||||||||||
Net claims and benefits incurred for life insurance contracts and others | (172,684 | ) | — | (1,124 | ) | K | (173,808 | ) | — | (173,808 | ) | Net claims and benefits incurred for life insurance contracts and others | ||||||||||||||||||||
Other income | 5,132 | (5,132 | )(7) | — | — | — | — | |||||||||||||||||||||||||
Other expense | (19,018 | ) | 19,018 | (6) | — | — | — | — | ||||||||||||||||||||||||
|
|
|
|
|
|
|
|
|
|
|
| |||||||||||||||||||||
Total result from insurance under writing | (56,580 | ) | 13,886 | 132,632 | 89,938 | — | 89,938 | Total premiums earned less claims and benefits | ||||||||||||||||||||||||
| Other expense | ||||||||||||||||||||||||||||||||
Salaries and employee benefits | (590,916 | ) | (164 | ) | — | (591,080 | ) | (35,454 | ) | (626,534 | ) | Salaries and employee benefits | ||||||||||||||||||||
Administrative expenses | (623,563 | ) | 8,606 | — | (614,957 | ) | (22,816 | ) | (637,773 | ) | Administrative expenses | |||||||||||||||||||||
Depreciation and amortization | (103,533 | ) | (5,818 | ) | 12,559 | C | (96,792 | ) | 369 | (96,423 | ) | Depreciation and amortization | ||||||||||||||||||||
Premium amortization | (3,249 | ) | 3,249 | — | — | — | — | |||||||||||||||||||||||||
Impairment loss on available-for-sale investments | — | — | (14,120 | ) | H | (14,120 | ) | 40 | (14,080 | ) | Impairment loss on available-for-sale investments | |||||||||||||||||||||
- | — | (6,108 | ) | — | (6,108 | ) | — | (6,108 | ) | Expenses related to rental income | ||||||||||||||||||||||
Other expenses | (57,888 | ) | (36,165 | ) | 3,842 | D, J | (90,211 | ) | — | (90,211 | ) | Other | ||||||||||||||||||||
Other expenses insurance | (19,018 | ) | (6) | |||||||||||||||||||||||||||||
Other expenses | (17,147 | ) | ||||||||||||||||||||||||||||||
|
|
|
|
|
|
|
|
|
|
|
| |||||||||||||||||||||
Other expenses | (1,379,149 | ) | (36,400 | ) | 2,281 | (1,413,268 | ) | (57,861 | ) | (1,471,129 | ) | Total other expenses | ||||||||||||||||||||
Provision for contingencies and others | (4,695 | ) | 4,695 | — | — | — | — | |||||||||||||||||||||||||
|
|
|
|
|
|
|
|
|
| |||||||||||||||||||||||
Total other expenses | (1,383,844 | ) | (31,705 | ) | 2,281 | (1,413,268 | ) | (57,861 | ) | |||||||||||||||||||||||
|
|
|
|
|
|
|
|
|
|
|
| |||||||||||||||||||||
Income before translation result and income tax | 1,011,347 | 15,844 | 100,814 | 1,128,005 | 124,837 | 1,252,842 | Income before translation result and income tax | |||||||||||||||||||||||||
- | — | (15,844 | )(4) | — | (15,844 | ) | 3,367 | (12,477 | ) | Translation result | ||||||||||||||||||||||
Income tax | (262,107 | ) | — | (2,936 | ) | M | (265,043 | ) | (713 | ) | (265,756 | ) | Income tax | |||||||||||||||||||
|
|
|
|
|
|
|
|
|
|
|
| |||||||||||||||||||||
Profit for the year | 749,240 | — | 97,878 | 847,118 | 127,491 | 974,609 | Profit for the year | |||||||||||||||||||||||||
|
|
|
|
|
|
|
|
|
|
|
| |||||||||||||||||||||
Attributable to: | Attributable to: | |||||||||||||||||||||||||||||||
Equity holders of the Group | 744,589 | — | 98,095 | 842,684 | 127,491 | 970,175 | Equity holders of the Group | |||||||||||||||||||||||||
Non – controlling interest | 4,651 | — | (217 | ) | 4,434 | — | 4,434 | Non-controlling interest | ||||||||||||||||||||||||
|
|
|
|
|
|
|
|
|
|
|
| |||||||||||||||||||||
| 749,240 | — | 97,878 | 847,118 | 127,491 | 974,609 | |||||||||||||||||||||||||||
|
|
|
|
|
|
|
|
|
|
|
| |||||||||||||||||||||
| (*) | Under the Peruvian SBS GAAP income statement items are grouped differently; for IFRS purposes the required reclassifications were made, see Note A. |
F-35
Table of Contents
Notes to the combined financial statements (continued)
Group reconciliation of combined comprehensive income for the year ended December 31, 2013:
| Peruvian SBS GAAP | Note | Remeasurements | IFRS as of December 31, 2013 | Inteligo Group IFRS, net of combination eliminations | IFRS of combined structure | |||||||||||||||||
| S/.(000) | 3.5 | S/.(000) | S/.(000) | S/.(000) | S/.(000) | |||||||||||||||||
Profit for the year | 749,240 | 98,095 | 847,335 | 127,274 | 974,609 | |||||||||||||||||
Other comprehensive income | ||||||||||||||||||||||
Other comprehensive income to be reclassified to profit or loss in subsequent periods: | ||||||||||||||||||||||
Net loss on investments available-for-sale | (240,854 | ) | I | (208,496 | ) | (449,350 | ) | (38,575 | ) | (487,925 | ) | |||||||||||
Income tax | 22,582 | — | 22,582 | — | 22,582 | |||||||||||||||||
|
|
|
|
|
|
|
|
|
| |||||||||||||
| (218,272 | ) | (208,496 | ) | (426,768 | ) | (38,575 | ) | (465,343 | ) | |||||||||||||
Net movement on cash flow hedges | (7,216 | ) | G | 18,848 | 11,632 | — | 11,632 | |||||||||||||||
Income tax | 2,166 | (5,626 | ) | (3,460 | ) | — | (3,460 | ) | ||||||||||||||
|
|
|
|
|
|
|
|
|
| |||||||||||||
| (5,050 | ) | 13,222 | 8,172 | — | 8,172 | |||||||||||||||||
Exchange differences on translation of foreign operation | — | — | — | 32,301 | 32,301 | |||||||||||||||||
|
|
|
|
|
|
|
|
|
| |||||||||||||
Net other comprehensive income to be reclassified to profit or loss in subsequent periods, net of income tax | (223,322 | ) | (195,274 | ) | (418,596 | ) | (6,274 | ) | (424,870 | ) | ||||||||||||
|
|
|
|
|
|
|
|
|
| |||||||||||||
Total comprehensive income for the year, net of income tax | 525,918 | (97,179 | ) | 428,739 | 121,000 | 549,739 | ||||||||||||||||
|
|
|
|
|
|
|
|
|
| |||||||||||||
Attributable to: | ||||||||||||||||||||||
Equity holders of IFS Group | 522,069 | (97,054 | ) | 425,015 | 121,000 | 546,015 | ||||||||||||||||
Non-controlling interest | 3,849 | (125 | ) | 3,724 | — | 3,724 | ||||||||||||||||
|
|
|
|
|
|
|
|
|
| |||||||||||||
| 525,918 | (97,179 | ) | 428,739 | 121,000 | 549,739 | |||||||||||||||||
|
|
|
|
|
|
|
|
|
| |||||||||||||
| 3.5 | Notes to the reconciliation of equity as of January 1, 2012 and December 31, 2013 and total comprehensive income for the year ended December 31, 2013 |
As of January 1, 2012 (transition date) and as of December 31, 2013, remeasurement adjustments that affected the “Retained earnings” caption of the statements of financial position, net of its deferred income tax of S/.70,360.000 and S/.77,613,000, respectively (see paragraph M), were the following:
| Item | Paragraph | 01.01.2012 | 12.31.2013 | |||||||
| S/.(000) | S/.(000) | |||||||||
Allowance for loan losses | B | 95,108 | 93,540 | |||||||
Property, furniture and equipment | C | 63,705 | 81,711 | |||||||
Foreclosed assets | D | 1,009 | 852 | |||||||
Deferred fee income | E | (1,602 | ) | (21,708 | ) | |||||
Hedge accounting | G | (64 | ) | (20,681 | ) | |||||
Impairment of investments available for sale | H | — | (14,120 | ) | ||||||
Financial instruments | I | 7,664 | 459 | |||||||
Investment property | J | 294,486 | 262,471 | |||||||
Insurance contract liabilities – IBNR | K | (11,491 | ) | — | ||||||
Accounts receivable and other assets, net – IBNR | K | 3,230 | — | |||||||
Insurance contract liabilities – Technical reserves | K | (233,737 | ) | (90,572 | ) | |||||
Fair value measurement | L | (144 | ) | (2,618 | ) | |||||
Other | 6,047 | 9,541 | ||||||||
Minority interest | (1,163 | ) | (920 | ) | ||||||
|
|
|
| |||||||
| 223,048 | 297,955 | |||||||||
|
|
|
| |||||||
F-36
Table of Contents
Notes to the combined financial statements (continued)
| A. | Reclassifications |
Reclassifications made in the statement of financial position –
Under Peruvian SBS GAAP certain balances were presented or grouped differently as compared with IFRS. Therefore, the required reclassifications for IFRS presentation were made.
As of January 1, 2012, “Accounts receivable and other assets, net” caption reclassifications mainly included S/.121,669,000 and S/.1,124,000 of granted financial leasing loans that were reclassified to the captions “Loans, net of unearned income” and “Allowance for loan losses”, respectively (see paragraph F) and S/.23,592,000 of accounts receivables that were reclassified from the caption “Investments held to maturity” (see paragraph I).
On the other hand, until December 31, 2012, Peruvian SBS GAAP required tax liabilities to be presented in the caption “Deposits and obligations”; therefore, as of January 1, 2012 S/.47,647,000 were reclassified from said caption to the “Accounts payable, provision and other liabilities” caption, after netting them with tax prepayments for an amount of S/.37,842,000, that under Peruvian SBS GAAP were presented in the caption “Accounts receivables and other assets, net”.
As of December 31, 2013, “Accounts receivables and other assets, net” caption reclassifications mainly included S/.88,743,000 and S/.904,000 of granted financial leasing loans (see paragraph F) and S/.2,533,000 of accounts receivables that were reclassified from investments held to maturity (see paragraph I).
Reclassifications made in the income statement –
Under Peruvian SBS GAAP income statement items are grouped differently, therefore the Group, in order to comply with IFRS presentation made the required reclassifications. Reclassifications made are not errors and are presented in numbers (1) to (8) in the Group reconciliation of combined income statement for the year ended December 31, 2013.
| B. | Allowance for loan losses – |
According to Peruvian SBS GAAP, the provision for loan losses is calculated and recorded following SBS Resolution N° 11356-2008, which sets parameters to determine the calculation of provisions which is based on formulas and the use of specific percentages over the balances of loans and collateral received. Also, it requires constitution of generic provisions based on total loan portfolio, including generic provisions on not-impaired loans.
IFRS:
IAS 39 determines that an entity should assess, on each reporting date, whether there is objective evidence that a loan or group of loans is impaired. A loan or group of loans is impaired if there is objective evidence of impairment as a consequence of one or more events that occurred after the initial recognition of the loan (loss event), this event or events impact the future cash flow and it can be reliably estimated.
The amount of the loss is measured as the difference between the carrying amount and the present value of estimated future cash flows (excluding future credit losses that have not been incurred) discounted at the original effective interest rate of the loan.
Initially, it is necessary to assess, on an individual basis, if there is objective evidence of impairment for exposures that are individually significant, or collectively for exposures that are
F-37
Table of Contents
Notes to the combined financial statements (continued)
not individually significant. If there is no objective evidence for an exposure individually assessed, be it significant or not, it should be included in a group of exposures with similar characteristics and assessed collectively. The exposures that are individually assessed and for which a loss has been recorded should not be included in the collective assessment.
The differences between Peruvian SBS GAAP and IFRS methodologies resulted in different amounts of the allowance for loan losses and, as a result, as of January 1, 2012 (IFRS transition date), it was recognized a decrease of S/.95,249,000 in the “Allowance for loan losses” caption, due to direct loans; a decrease of S/.40,618,000 in “Accounts payable, provisions and other liabilities” caption, due to indirect loans; and an increase of S/.95,108,000 in “Retained earnings” caption, net of its deferred income tax. As of December 31, 2013, it was recognized a decrease of S/.93,144,000 in the “Allowance for loan losses” caption; a decrease of S/.40,484,000 in “Accounts payable, provisions and other liabilities” caption; and an increase of S/.93,540,000 in “Retained earnings” caption, net of its deferred income tax. Also, S/.9,777,000 was recorded as an additional expense in “Provision for loan losses” caption in the combined income statement for the year ended December 31, 2013.
| C. | Property, furniture and equipment, net – |
Cost
Peruvian SBS GAAP:
The cost of some land and buildings included voluntary revaluations made by Interbank in previous years with the authorization of the SBS; as well, for such assets depreciation was not computed by component and useful life used for depreciation purposes was established considering tax regulation.
IFRS:
In accordance with IFRS 1, an entity may, on the transition date to IFRS, measure a fixed asset at its fair value and this amount will be considered the deemed cost of said asset from such date on. IFS has elected to measure certain items of property at fair value at the date of transition to IFRS, and for such assets it has reviewed their useful lives and residual values. As result, at the date of transition to IFRS, January 1, 2012, the caption “Property, furniture and equipment” increased by S/.91,007,000 (S/.116,730,000 as of December 31, 2013), this amount was recognized against “Retained earnings” for S/.63,705,000, net of its deferred income tax (S/.81,711,00 as of December 31, 2013).
Also, for the year ended December 31, 2013, the net effect of the depreciation adjustment considering the new useful life’s resulted in a decrease in depreciation expense of S/.12,559,000.
| D. | Foreclosed assets |
Peruvian SBS GAAP
Foreclosed assets are recorded at the value of its judicial assignment, extrajudicial assignment, the outstanding loan balance or its net realization value, the lowest. Additionally, an initial provision equivalent to 20 percent of the recorded value for the foreclosed asset is recognized; subsequently, the recorded value is depreciated in full in a maximum period of 36 months.
IFRS:
Foreclosed assets are initially recorded at the lower of cost (the carrying amount of the loan) or estimated market value less cost to sell.
F-38
Table of Contents
Notes to the combined financial statements (continued)
As a result of IFRS adoption, as of January 1, 2012 (IFRS transition date), it was recognized an increase of S/.1,443,000 in “Accounts receivable and other assets, net” against an increase of S/.1,009,000 in the “Retained earnings” caption, net of its deferred income tax (S/.1,218,000 and S/.852,000, net of deferred income tax as of December 31, 2013, respectively). Also, S/.254,000 was recorded as expenses for the year ended December 31, 2013.
| E. | Deferred fee income |
Peruvian SBS GAAP:
Up to May 2013, certain commissions and fees for financial services were recognized as income when they were collected.
IFRS:
The recognition of fee revenue (including commissions) is determined by the purpose of the fees and the basis of accounting for any associated financial instruments. If there is an associated financial instrument, fees that are an integral part of the effective interest rate of that financial instrument are included within the effective yield calculation. Fees earned from services that are provided over a specified service period are recognized over that service period. Fees earned for the completion of a specific service or significant event are recognized when the service has been completed or the event has occurred.
As a result of IFRS adoption, as of January 1, 2012 (IFRS transition date), it was recognized an increase of S/.2,288,000 in “Accounts payable, provisions and other liabilities” caption (S/.27,149,000 as of December 31, 2013); and a decrease of S/.1,602,000 in “Retained earnings” caption, net of its deferred income tax (S/.21,708,000, net of its deferred income tax as of December 31, 2013). Also, S/.7,894,000 was recorded as a decrease in the fee income for the year ended December 31, 2013, in the “Banking services commissions” caption of the income statement.
| F. | Finance lease |
Peruvian SBS GAAP:
Following SBS rules, certain loans granted by the Group under finance leases were included as part of the “Other assets” caption in the statement of financial position and not as part of the loan portfolio.
IFRS
IAS 39 “Financial instruments: recognition and measurement” requires that loans granted must be recognized as part of the loan portfolio.
As a result of IAS 39 application, S/.121,669,000 and its related provision of S/.1,124,000 were reclassified from “Accounts receivables and other assets, net” caption to “Loans, net of unearned income” caption and “Allowance for loan losses” caption, respectively, of the statement of financial position as of January 1, 2012 (S/.88,743,000 and S/.904,000, respectively, as of December 31, 2013). See paragraph A.
F-39
Table of Contents
Notes to the combined financial statements (continued)
| G. | Hedge accounting |
Peruvian SBS GAAP:
In certain circumstances, the SBS could specifically allow the classification of a derivative financial instrument as a hedge, even though it did not comply with all IAS 39 required characteristics to be classified as hedge.
IFRS:
An entity should not apply hedge accounting (as defined by IAS 39) in its statement of financial position at the transition date if the instrument did not qualify as a hedge in accordance with IAS 39.
As a result of this requirement, hedge accounting was not applied for IFRS purposes on the transition date to certain hedge relationships that meet the criteria for hedge accounting under Peruvian SBS GAAP, but that do not meet all requirements of IAS 39 as of such date. Those financial agreements must be considered as held for trading and the effect of its valuation must be recognized in the statement of income.
As a result of the application of IAS 39, it was recognized an increase of the “Unrealized results, net” caption of S/.45,000, net of its deferred income tax; and a decrease in the “Retained earnings” caption of S/.64,000, as of January 1, 2012 (increase of the “Unrealized results, net” caption of S/.14,477,000, net of its deferred income tax and a decrease in the “Retained earnings” caption of S/.20,681,000, as of December 31, 2013).
Also, for the year ended December 31, 2013, the net effect resulted in an increase of the valuation expense of S/.18,755,000 which is presented in the income statement caption “Net trading income (loss)”.
In addition, the effect of the net variation of the unrealized result for the year ended December 31, 2013, resulted in a net gain of S/.18,848,000 on cash flow hedges, net of its deferred income tax in the statement of comprehensive income.
| H. | Impairment of investments available for sale |
Peruvian SBS GAAP
Impairment of available for sale equity investments must be recognized according to SBS Resolution 7034-2012, which established that an impairment must be recorded when: (i) a significant decrease in fair value (50%) has occurred over a prolonged period of time (defined as 12 months), or (ii) when fair value has decreased for a period of 12 consecutive months and a decrease of 20% in fair value has occurred; and considering certain qualitative criteria of the issuer. However, if the Group is aware of the existence of any impairment before the mentioned thresholds are surpassed, it records an impairment loss immediately.
IFRS
According to IAS 39, a financial asset is impaired and an impairment loss must be recorded only if there is objective evidence of impairment as a result of one or more subsequent events since initial recognition of the asset (a loss event incurred). In the case of equity instruments classified as investments available for sale, a significant or prolonged decline in the fair value of the instrument below its cost is evidence of impairment. Management has established as significant any decline over 30% and as prolonged any decline for a period over 12 months.
F-40
Table of Contents
Notes to the combined financial statements (continued)
As a result of this, it was recognized a increase of the “Unrealized results, net” caption of S/.14,120,000, against a decrease of “Retained earnings”, as of December 31, 2013. Also, it was recognized in the combined income statement an expense, for the realized loss, of S/.14,120,000 for the year ended December 31, 2013.
| I. | Financial instruments designated as investments held to maturity |
Peruvian SBS GAAP:
According to SBS Resolution No.7034-2012, Interseguro holds financial instruments designated as investments held to maturity, which are recorded at amortized cost.
IFRS
IAS 39 permits an entity to designate financial instruments as financial assets or liabilities at fair value through profit or loss, or available-for-sale financial assets, on the date of acquisition or issue of the financial instrument. In accordance with an IFRS 1 exemption, a new designation may be made on the transition date, even if the instrument has originally been designated in another category.
As a result of IFRS adoption, as of January 1, 2012 (IFRS transition date), IFS reclassified S/.1,083,677,000 of its investments held to maturity to investments available for sale (S/.2,219,153,000 as of December 3, 2013). Therefore, IFS also estimated the fair value of said financial instruments, which resulted in the recognition of an increase in “Unrealized gains” of S/.38,325,000 as of January 1, 2012 and an “Unrealized loss” of S/.72,672,000 as of December 31, 2013. In addition, the effect of the net variation of the unrealized result for the year ended December 31, 2013, resulted in a net loss of S/.208,496,000 on investment available -for- sale in the statement of comprehensive income.
Also, under Peruvian SBS GAAP, loans granted by insurance entities are presented as held to maturity investments. Following IFRS, as of January 1, 2012 (transition date) S/.23,592,000 were reclassified to the caption “Accounts receivable and other assets” (S/.2,533,000 as of December 31, 2013). See paragraph A.
Peruvian SBS GAAP:
For SBS rules, the calculation of a realized gain or loss of a debt instruments sold is not based on the amortized cost book value calculated under the effective interest method.
IFRS
Under IFRS, the amortization of premium and discounts are based on the effective interest rate method, which results in a difference amortized cost balance, which in turn affects the realized gain or loss on the sale of the debt instrument. The effect of this change generated an increase of S/.7,664,000 in the caption “Retained earnings” as of January 1, 2012 and a decrease of S/.7,664,000 in the caption “Unrealized results, net”. As of December 31,2013, said change resulted in an increase of S/.459,000 in “Retained earnings” and a decrease of S/.459,000 in “Unrealized results, net” in the statement of financial position and an increase of S/.2,163,000 in the “Net gain on sale of securities” caption of the income statement.
| J. | Investment property – |
Peruvian SBS GAAP:
Under Peruvian SBS GAAP investment property is recorded at cost, less accumulated depreciation and accumulated impairment, if any.
F-41
Table of Contents
Notes to the combined financial statements (continued)
IFRS:
Under IAS 40, the Group elected to record investment property at its fair value.
As a result of IFRS adoption, as of January 1, 2012 (IFRS transition date), IFS recognized an increase in “Investment property” caption of S/.294,486,000 against “Retained earnings” caption; as of December 31, 2013, an increase in “Investment property” caption of S/.262,471,000 against “Retained earnings” caption. On the other hand, this change resulted in an increase in the income statement caption “Valuation gain from investments property” for the year ended December 31, 2013 of S/.77,310,000 and the reversal of the depreciation expense recorded under Peruvian SBS GAAP amounting to S/.4,096,000, which was included in the “Other expenses” caption of the income statement.
Finally, for the year ended December 31, 2013, considering that under Peruvian SBS GAAP the cost of investment property sold corresponded to the historical cost and not fair value, S/.76,402,000 were deducted from the income statement caption “Profit from sale of investment property”.
| K. | Insurance contract liabilities |
Reserves for incurred but non-reported claims (IBNR)
Peruvian SBS GAAP
Until December 31, 2012, technical reserves for incurred but non-reported claims (IBNR) were calculated based on certain percentages established by the SBS, based on the amount of recognized retained claims during the last twelve months at the date of the calculation (for insurance with annual or longer maturity) or based on the monthly average amount of the recognized retained claims during the last six months at the date of calculation (for insurance with maturity of less than one year). Such method was based on the number of occurred claims during a specific term of time, as well as the average amount disbursed in the related claims. As of December 31, 2013, the SBS established the Chain Ladder methodology, which was adopted prospectively and therefore the initial effect of this adoption was recorded in “Retained earnings” as of December 31, 2013; therefore there is no difference compared to IFRS for this item in the statement of financial position as of December 31, 2013.
IFRS
In order to make the financial statements information more reliable and no less relevant, Management determined to calculate the IBNR reserves as of December 31, 2013 and 2012 and as of January 1, 2012 using the Chain Ladder methodology (an actuarial method generally accepted) using past experience based on cumulative claims losses to estimate future claims developments.
As of January 1, 2012 (IFRS transition date), the effect of this change in methodology generated an increase in the reserves for IBNR of S/.11,491,000 in the caption “Insurance contract liabilities”, with the corresponding increase of S/.3,230,000 in the caption “Accounts receivable and other assets, net”, that correspond to the balance that will be recoverable from the reinsurer with net effect recorded as a decrease in “Retained earnings”.
As explained above, for the year ended December 31, 2013, the SBS adopted the above described methodology, but authorized Interseguro to record any difference in “Retained earnings” as of December 31, 2012. Therefore, the adoption of IFRS Interseguro recorded an expense of S/.1,124,000 in the income statement caption “Net claims and benefits incurred for life insurance contracts and others”.
F-42
Table of Contents
Notes to the combined financial statements (continued)
Technical reserves
Peruvian SBS GAAP
Reserves for retirement, disability and survival insurances and annuities are determined based on actuarial methodologies approved by the SBS. Said reserves are equivalent to the present value of all future payments to be made to the insured person and or its beneficiaries.
On the other hand, for annuities the mortality table and the discount interest rate determined by the SBS are “RV-2004 Modified” for annuities sold since August 2006 and RV-85 for annuities sold before that date and 3 – 4.7 percent, respectively.
For technical reserves for disability and survival insurances, the SBS has approved mortality tables MI-85 and B-85 and an interest rate equivalent to 3 – 4.5 percent, respectively.
IFRS
Liabilities for annuities and for retirement, disability and survival insurances are the present value of expected future payments in a grant and not grant period, based on current mortality and morbidity tables and current interest rates described in Note 13(e).
Based on IFRS and in order to make the financial statements information more reliable and no less relevant, the Group considered current mortality and morbidity tables which differ from those established by the SBS at the IFRS transition date and set, the interest rate to discount the future cash flows of these liabilities as the current interest rate that reflects the interest rate performance of the debt instruments in the portfolio, adjusted for credit risk. The effect of the change in the mortality table and in the discount interest rate, generated an increase in technical reserves of S/.233,737,000 as of January 1, 2012 (transition date) in the “Insurance contract liabilities” caption of the statement of financial position. As of December 31, 2013, the change in the discount interest rate generated an increase in technical reserves of S/.90,572,000 in the “Insurance contract liabilities” caption of the statement of financial position. Nevertheless, the “Insurance contract liability” caption under IFRS as of December 31, 2013 as compared with the IFRS balance as of December 31, 2012, decreased by S/.133,756, 000 which was recorded as a gain in the “Net premiums earned” caption of the combined income statements for the year ended December 31, 2013.
| L. | Fair value |
Peruvian SBS GAAP
Peruvian SBS GAAP considered “Fair value” as the amount for which an asset could be exchanged or a liability settled, between knowledgeable, willing parties in an arm’s length transaction on the measurement date.
IFRS
IFRS 13 set a single guidance under IFRS for all fair value measurement but did not modify when an entity is required to use fair value. IFRS 13 defines fair value as the price that would be received to sell an asset or paid to transfer a liability in an orderly transaction between market participants at the measurement date (an exit price).
As result of the application of IFRS 13, the Group has reassessed its policies for fair value measurements of assets and liabilities without any significant change in fair value measurements, except for recognition of counterparty credit risk in certain derivative financial instruments which generated a decrease of S/.206,000 in the caption “Accounts receivable and other assets, net” and a decrease in the “Retained earnings” caption of S/.144,000 as of January 1, 2012 (transition date) (S/.3,740,000 and S/.2,618,000, respectively, as December 31, 2013).
F-43
Table of Contents
Notes to the combined financial statements (continued)
Also, for the year ended December 31, 2013, the net effect resulted in an expense of S/.3,374,000, recorded in the caption “Net trading income (loss)” of the income statement.
| M. | Deferred income tax |
As a result of the previously explained IFRS remeasurements, the related effects in deferred income tax, according with their temporality, were estimated. Deferred income tax effects as a result of IFRS adoption as of January 1, 2012, resulted in a decrease in the “Deferred income tax asset, net” caption of S/.54,237,000 and an increase in the “Deferred income tax liability, net” caption of S/.16,123,000, these variations generated a total effect of S/.70,360,000. As of December 31, 2013, resulted in a decrease in the “Deferred Income Tax asset, net” caption of S/.63,614,000 and an increase in the “Deferred Income Tax liability, net” caption of S/.13,999,000, these variations generated a total effect of S/.77,613,000. Also, for the year ended December 31, 2013, the net effect in the income statement was an increase of the deferred income tax expense of S/.2,936,000.
| N. | Due from customers on acceptances – |
According to Peruvian SBS GAAP the amount of “Due from customers on acceptances” is recorded as an Off-balance sheet account, for control purposes.
IFRS:
Due from customers on acceptances corresponds to accounts receivables from customers for import and export transactions, whose obligations have been accepted and, because the counterparties are different, following IAS 32 – “Financial Instruments: Presentation” an account receivable and an account payable for the same amount must be recorded. The account receivable and the account payable amounted to S/.19,853,000 and S/.22,310,000 as of January 1, 2012 (transition date) and as of December 31, 2013, respectively.
| 3.6 | Standards issued but not yet effective – |
The standards and interpretations that are issued, but not yet effective, up to the date of issuance of the Group’s combined financial statements are disclosed below. The Group intends to adopt these standards, if applicable, when they become effective.
| • | IFRS 9 “Financial Instruments” |
On July 24, 2014, the International Accounting Standards Board (IASB) issued the final version of IFRS 9 “Financial Instruments”, bringing together the classification and measurement, impairment and hedge accounting phases of the IASB’s project to replace IAS 39 “Financial Instruments: Recognition and Measurement” and is effective for annual periods beginning on or after 1 January 2018. Accounting for dynamic risk management, commonly referred to as macro hedging, does not form part of the guidance in IFRS 9 and is a separate project.
IFRS 9 introduces principles-based requirements for classification and measurement. Also, the IASB has addressed the key concern that arose as a result of the global financial crisis of 2008 and 2009 that the incurred loss model in IAS 39 contributed to the delayed recognition of credit losses, by issuing new impairment requirements that are based on a more forward-looking expected credit loss model.
Entities have the option to early apply the accounting for own credit risk-related fair value gains and losses arising on financial liabilities designated at fair value through profit or loss without applying the other requirements of IFRS 9.
F-44
Table of Contents
Notes to the combined financial statements (continued)
| • | IFRS 15 “Revenue from Contract with Customers” |
IFRS 15 replaces all existing IFRS revenue requirements. The standard applies to all revenue contracts and provides a model for the recognition and measurement of sales of some non-financial assets (e.g. disposals of property, plant and equipment). IFRS 15 is effective for annual periods beginning on or after January 1, 2017.
| • | Investment Entities (Amendments to IFRS 10, IFRS 12 and IAS 27) |
The amendments are effective for annual periods beginning on or after January 1, 2014 and provide an exception to the consolidation requirement for entities that meet the definition of an investment entity under IFRS 10. The exception to consolidation requires investments entities account for subsidiaries at fair value through profit or loss.
| • | IAS 32 “Offsetting Financial Assets and Financial Liabilities – Amendments to IAS 32” |
These amendments clarify the meaning of “currently has a legally enforceable right to set-off” and the criteria for non-simultaneous settlement mechanisms of clearing houses to qualify for offsetting. These amendments are effective for annual periods beginning on or after January 1, 2014.
| • | IFRIC Interpretation 21 “Levies (IFRIC 21)” |
IFRIC 21 clarifies that an entity recognizes a liability for a levy when activity that triggers payment, as identified by the relevant legislation, occurs. For a levy that is triggered upon reaching a minimum threshold, the interpretation clarifies that no liability should be anticipated before the specified minimum threshold is reached. IFRIC 21 is effective for annual periods begging on or after January 1, 2014.
| • | IAS 39 Novation of Derivatives and Continuation of Hedge Accounting – Amendments to IAS 39 – |
These amendments provide relief from discounting hedge accounting when novation of a derivative designated as a hedging instrument meets certain criteria. These amendments are effective for annual periods beginning on or after January 1, 2014.
The Group is in the process of assessing the impact, if any, that the application of these standards may have on its combined financial statements.
| 4. | Cash and due from banks |
This item is made up as follows:
| 2013 | 2012 | 01.01.2012 | ||||||||||
| S/.(000) | S/.(000) | S/.(000) | ||||||||||
Cash and clearing | 1,562,357 | 1,509,274 | 1,146,422 | |||||||||
Deposits in Central Reserve Bank of Peru – BCRP | 4,338,596 | 3,541,560 | 1,032,869 | |||||||||
Deposits in banks | 1,305,423 | 456,598 | 245,703 | |||||||||
Restricted funds | 193,895 | 80,131 | 84,619 | |||||||||
|
|
|
|
|
| |||||||
| 7,400,271 | 5,587,563 | 2,509,613 | ||||||||||
Accrued interest | 825 | 1,736 | 979 | |||||||||
|
|
|
|
|
| |||||||
Total | 7,401,096 | 5,589,299 | 2,510,592 | |||||||||
|
|
|
|
|
| |||||||
The cash and cash equivalents excludes the restricted funds and the accrued interest, see Note 3.3(ac).
F-45
Table of Contents
Notes to the combined financial statements (continued)
As of December 31, 2013, the “Cash and due from banks” caption includes approximately U.S.$1,454,091,000 and S/.1,014,241,000 (U.S.$940,937,000 and S/.1,651,874,000 as of December 31, 2012 and U.S.$468,784,000 and S/.504,891,000 as of January 1, 2012), which represent the legal reserve that Interbank must maintain for its obligations with the public. These funds are kept in Interbank’s vaults and in the Central Reserve Bank of Peru (hereinafter “BCRP”, for its Spanish acronym) and are within the limits required by prevailing Peruvian regulations at those dates.
The legal reserve funds maintained at the BCRP are non interest bearing, except for the part that exceeds the minimum reserve required in Nuevos Soles and U.S. Dollars. As of December 31, 2013, the excess in U.S. Dollars amounted to approximately U.S.$315,362,000, equivalent to approximately S/.881,438,000, and bear interest at an annual average rate of 0.04 percent (U.S.$ 263,045,000, equivalent to S/.670,765,000, and an annual average rate of 0.11 percent as of December 31, 2012, and U.S.$155,598,000, equivalent to S/.419,492,000, and an annual average rate of 0.17 percent as of January 1, 2012). The excess amount in Nuevos Soles amounted to approximately S/.277,301,000 and accrued interest at an annual average rate of 1.25 percent (S/.68,122,000 and an annual average rate of 1.70 percent as of December 31, 2012, and S/.120,038,000 and an annual average rate of 2.45 percent as of January 1, 2012).
Deposits in banks are mainly in Nuevos Soles and US Dollars. All amounts bear interest at market rates. As of December 31, 2013 and 2012 and as of January 1, 2012, the Group does not have significant deposits in any specific financial institution.
As of December 31, 2013 and 2012 and January 1, 2012, the balance of restricted funds amounted to S/.193,895,000, S/.80,131,000 and S/.84,619,000, respectively, which mainly relate to requirements from counterparties of derivative financial instruments transactions – see Note 9(e) – and funds from remittances received via SWIFT messages which guarantee the payment of the notes issued by IBK DPR Securitizadora; see further detail in Note 12(d) and 12(e).
F-46
Table of Contents
Notes to the combined financial statements (continued)
| 5. | Investments available –for –sale |
| (a) | This item is made up as follows: |
| 2013 | 2012 | 01.01.12 | ||||||||||||||||||||||||||||||||||||||||||||||
| Unrealized gross amount | Unrealized gross amount | Unrealized gross amount | ||||||||||||||||||||||||||||||||||||||||||||||
| Amortized cost | Gains | Losses | Estimated fair value | Amortized cost | Gains | Losses | Estimated fair value | Amortized cost | Gains | Losses | Estimated fair value | |||||||||||||||||||||||||||||||||||||
| S/.(000) | S/.(000) | S/.(000) | S/.(000) | S/.(000) | S/.(000) | S/.(000) | S/.(000) | S/.(000) | S/.(000) | S/.(000) | S/.(000) | |||||||||||||||||||||||||||||||||||||
Corporate, leasing and subordinated bonds | 2,607,203 | 50,148 | (147,059 | ) | 2,510,292 | 2,440,379 | 168,737 | (4,708 | ) | 2,604,408 | 2,358,517 | 54,757 | (26,552 | ) | 2,386,722 | |||||||||||||||||||||||||||||||||
Peruvian sovereign bonds | 807,166 | 11,259 | (65,982 | ) | 752,443 | 362,199 | 48,795 | (75 | ) | 410,919 | 327,446 | 8,366 | (1,037 | ) | 334,775 | |||||||||||||||||||||||||||||||||
Negotiable Certificates of Deposit issued by BCRP | 653,739 | 385 | (99 | ) | 654,025 | 628,584 | 485 | (70 | ) | 628,999 | 1,500,580 | — | (1,359 | ) | 1,499,221 | |||||||||||||||||||||||||||||||||
Mutual funds and investments participations | 351,198 | 52,990 | (10,296 | ) | 393,892 | 274,678 | 57,959 | (5,037 | ) | 327,600 | 353,535 | 4,488 | (7,576 | ) | 350,447 | |||||||||||||||||||||||||||||||||
Bonds guaranteed by the Peruvian Government | 307,952 | 17,552 | (4,763 | ) | 320,741 | 237,662 | 28,822 | (195 | ) | 266,289 | 215,150 | 8,901 | (1,083 | ) | 222,968 | |||||||||||||||||||||||||||||||||
Indexed Certificates of Deposit issued by BCRP | 117,978 | — | — | 117,978 | — | — | — | — | — | — | — | — | ||||||||||||||||||||||||||||||||||||
United States of America Treasury Bonds | 110,694 | — | (1,400 | ) | 109,294 | 49,676 | — | (373 | ) | 49,303 | 73,821 | 211 | (77 | ) | 73,955 | |||||||||||||||||||||||||||||||||
Peruvian Global Bonds | 63,992 | 63 | (2,315 | ) | 61,740 | — | — | — | — | 75,020 | 1,353 | — | 76,373 | |||||||||||||||||||||||||||||||||||
Colombian Global Bonds | 36,872 | — | (659 | ) | 36,213 | — | — | — | — | 9,806 | 223 | — | 10,029 | |||||||||||||||||||||||||||||||||||
Mexican Global Bonds | 18,114 | — | (428 | ) | 17,686 | 9,937 | 748 | — | 10,685 | 24,656 | 1,497 | — | 26,153 | |||||||||||||||||||||||||||||||||||
Brazilian Global Bonds | 15,123 | — | (655 | ) | 14,468 | — | — | — | — | 19,782 | 32 | — | 19,814 | |||||||||||||||||||||||||||||||||||
Chilean Global Bonds | — | — | — | — | 5,043 | 10 | — | 5,053 | — | — | — | — | ||||||||||||||||||||||||||||||||||||
|
|
|
|
|
|
|
|
|
|
|
|
|
|
|
|
|
|
|
|
|
|
|
| |||||||||||||||||||||||||
Total | 5,090,031 | 132,397 | (233,656 | ) | 4,988,772 | 4,008,158 | 305,556 | (10,458 | ) | 4,303,256 | 4,958,313 | 79,828 | (37,684 | ) | 5,000,457 | |||||||||||||||||||||||||||||||||
Listed shares | ||||||||||||||||||||||||||||||||||||||||||||||||
Peruvian and foreign entities | 216,347 | 46,131 | (6,335 | ) | 256,143 | 203,063 | 43,460 | (3,802 | ) | 242,721 | 229,374 | 14,592 | (2,450 | ) | 241,516 | |||||||||||||||||||||||||||||||||
InRetail Perú Corp. (e) | 94,511 | 35,829 | (4,318 | ) | 126,022 | 139,305 | 62,638 | — | 201,943 | — | — | — | — | |||||||||||||||||||||||||||||||||||
Non listed shares and participations | ||||||||||||||||||||||||||||||||||||||||||||||||
Royalty Pharma (f) | 64,398 | 63,562 | — | 127,960 | 321,567 | 124,516 | — | 446,083 | 314,758 | 83,348 | — | 398,106 | ||||||||||||||||||||||||||||||||||||
Other | 806 | — | (353 | ) | 453 | 736 | — | (728 | ) | 8 | — | — | — | — | ||||||||||||||||||||||||||||||||||
|
|
|
|
|
|
|
|
|
|
|
|
|
|
|
|
|
|
|
|
|
|
|
| |||||||||||||||||||||||||
| 376,062 | 145,522 | (11,006 | ) | 510,578 | 664,671 | 230,614 | (4,530 | ) | 890,755 | 544,132 | 97,940 | (2,450 | ) | 639,622 | ||||||||||||||||||||||||||||||||||
|
|
|
|
|
|
|
|
|
|
|
|
|
|
|
|
|
|
|
|
|
|
|
| |||||||||||||||||||||||||
| 5,466,093 | 277,919 | (244,662 | ) | 5,499,350 | 4,672,829 | 536,170 | (14,988 | ) | 5,194,011 | 5,502,445 | 177,768 | (40,134 | ) | 5,640,079 | ||||||||||||||||||||||||||||||||||
|
|
|
|
|
|
|
|
|
|
|
|
|
|
|
|
|
| |||||||||||||||||||||||||||||||
Add – Accrued Interest on investments | 51,644 | 33,456 | 36,774 | |||||||||||||||||||||||||||||||||||||||||||||
|
|
|
|
|
| |||||||||||||||||||||||||||||||||||||||||||
Total | 5,550,994 | 5,227,467 | 5,676,853 | |||||||||||||||||||||||||||||||||||||||||||||
|
|
|
|
|
| |||||||||||||||||||||||||||||||||||||||||||
F-47
Table of Contents
Notes to the combined financial statements (continued)
| (b) | The Group has determined that the unrealized losses as of December 31, 2013 and 2012 and as of January 1, 2012 are of temporary nature. The Group intends and has the ability to hold each investment for a period of time sufficient to allow for an anticipated recovery in fair value, until the earlier of its anticipated recovery or maturity. |
The Group has considered the following criteria in determining whether a loss is temporary or not for equity investments (shares):
| • | the length of time and the extent to which fair value has been below cost; |
| • | the severity of the impairment; |
| • | the cause of the impairment and the financial condition and near-term prospects of the issuer; and |
| • | activity in the market of the issuer, which may indicate adverse credit conditions. |
The Group has considered the following criteria in determining whether a loss is temporary or not for debt investments (fixed maturity):
| • | Assess whether it is probable that the Group will receive all amounts due according to the contractual terms of the security (principal and interest). The identification of credit-impaired securities considers a number of factors, including the nature of the security and the underlying collateral, the amount of subordination or credit enhancement supporting the security, published credit rating and other information and other evidentiary analyses of the probable cash flows from the security. If recovery of all amounts due is not probable, a “credit impairment” is deemed to exist and the unrealized loss is recorded directly in the combined income statement. This unrealized loss recorded in income represents the security’s decline in fair value, including the decline due to forecasted cash flow shortfalls as well as general market spread widening. |
| • | For financial instruments with unrealized losses but not identified as impaired, the Group determines whether it has the positive intent and ability to hold each investment for a period of time sufficient to allow for an anticipated recovery in its amortized cost. The Group estimates the forecasted recovery period using current estimates of volatility in market interest rates (including liquidity and risk premiums). The Group assertion regarding its intent and ability to hold investments considers a number of factors, including a quantitative estimate of the expected recovery period and the length of that period (which may extend to maturity), the severity of the impairment and the Group intended strategy with respect to the identified security or portfolio. If the Group does not have the intent and ability to hold the security for a sufficient time period, the unrealized loss is recorded directly in the combined statements of income. |
| (c) | As a result of the impairment assessment of its investments available-for-sale, the Group recorded an impairment loss amounting to S/.14,080,000 and S/.7,119,000 during 2013 and 2012, respectively, which is presented in the caption “Impairment loss on available-for-sale investments” of the combined statements of income. |
The movement of available-for-sale investments unrealized results, net of deferred income tax and non-controlling interest, is presented in Note 15(d).
F-48
Table of Contents
Notes to the combined financial statements (continued)
As of December 31, 2013, the detail of unrealized losses on debt investments available for sale is as follows:
| Issuer | Unrealized loss | Rating | ||||
| S/.(000) | ||||||
Peruvian Goverment | 73,059 | BBB + (**) | ||||
Corporación Financiera de Desarrollo S.A. | 21,868 | AAA (*) | ||||
Odebrecht S.A. | 17,237 | BBB – (**) | ||||
Banco Votorantim S.A. | 15,954 | BBB – (**) | ||||
Southern Perú Copper Corporation S.A.A. | 12,764 | BBB (**) | ||||
Petróleo Brasileiro S.A. | 7,160 | BBB – (**) | ||||
Empresa de Distribución Eléctrica de Lima Norte S.A.A. | 6,795 | AAA (*) | ||||
Línea Amarilla S.A.C. | 6,326 | AAA (*) | ||||
Export-Import Bank of Korea | 4,967 | AA – (**) | ||||
Red de Energía del Perú S.A. | 10,375 | AAA (*) | ||||
H2Olmos S.A. | 8,486 | AA + (*) | ||||
BBVA Banco Continental | 2,139 | AAA (*) | ||||
Vale S.A. | 6,495 | BBB (**) | ||||
Banco de Crédito del Perú | 3,140 | AAA (*) | ||||
Instituto Costarricence de Electricidad | 2,608 | BB + (**) | ||||
Crediscotia Financiera S.A. | 2,616 | AA – (*) | ||||
Mutual funds and investments participations | 10,296 | — | ||||
Other | 21,371 | — | ||||
|
| |||||
| 233,656 | ||||||
|
| |||||
| (*) | Instruments rated in Peru. |
| (**) | Instruments rated abroad. |
F-49
Table of Contents
Notes to the combined financial statements (continued)
| (d) | As of December 31, 2013 and 2012 and as of January 1, 2012, the maturities and the annual effective interest rates of the most significant investments available-for-sale are as follows: |
| Maturity | Annual effective interest rates | |||||||||||||||||||||||||||||||||||||||||||||||||||||
| 2013 | 2012 | 01.01.2012 | 2013 | 2012 | 01.01.2012 | |||||||||||||||||||||||||||||||||||||||||||||||||
| S/. | U.S.$ | S/. | U.S.$ | S/. | U.S.$ | |||||||||||||||||||||||||||||||||||||||||||||||||
| Min | Max | Min | Max | Min | Max | Min | Max | Min | Max | Min | Max | |||||||||||||||||||||||||||||||||||||||||||
| % | % | % | % | % | % | % | % | % | % | % | % | |||||||||||||||||||||||||||||||||||||||||||
Corporate, leasing and subordinated bonds | Jan-2014 / Oct-2096 | Feb-2013 / Oct-2096 | Oct-2012 / Apr-2070 | 3.14 | 8.92 | 1.66 | 9.75 | 2.49 | 8.34 | 1.77 | 9.75 | 3.43 | 8.28 | 2.96 | 9.75 | |||||||||||||||||||||||||||||||||||||||
Peruvian sovereign bonds | Feb-2018 / Aug-2046 | Sep-2023 / Aug-2046 | Sep-2013 / Aug-2046 | 2.11 | 7.21 | — | — | 3.05 | 7.09 | — | — | 2.81 | 6.65 | — | — | |||||||||||||||||||||||||||||||||||||||
Negotiable Certificates of Deposit issued by BCRP | Jan-2014 / Nov-2014 | Jan-2013 / Dec-2013 | Jan-2012 / Sep-2012 | 3.61 | 3.69 | — | — | 3.66 | 4.02 | — | — | 4.10 | 4.21 | — | — | |||||||||||||||||||||||||||||||||||||||
Bonds guaranteed by the Peruvian Government | May-2018 / Oct-2033 | May-2018 / Nov-2029 | May-2018 / Jan-2029 | 4.10 | 6.01 | 5.16 | 7.74 | 5.22 | 6.01 | 5.23 | 7.74 | 4.43 | 5.49 | 5.76 | 7.74 | |||||||||||||||||||||||||||||||||||||||
Indexed Certificates of Deposit issued by BCRP | Jan-2014 / Feb-2014 | — | — | — | — | 0.08 | 0.13 | — | — | — | — | — | — | — | — | |||||||||||||||||||||||||||||||||||||||
United States of America Treasury Bonds | Aug-2023 | Jan-2015 / Aug-2037 | Nov-2016 / Aug-2032 | — | — | 2.78 | 2.78 | — | — | 0.26 | 2.71 | — | — | 0.96 | 3.09 | |||||||||||||||||||||||||||||||||||||||
Peruvian Global Bonds | Mar-2019 / Nov-2033 | — | Feb-2015 / Nov-2033 | — | — | 2.74 | 5.22 | — | — | — | — | — | — | 1.84 | 4.81 | |||||||||||||||||||||||||||||||||||||||
See Note 29.2 (b) (ii) for the analysis by currency of these investments.
| (e) | As of December 31, 2013 and 2012, the Group held 2,847,700 and 3,782,777 shares, which represent 2.77 and 3.68 percent, respectively, of InRetail Perú Corp. (a related entity) capital stock. |
During 2013, the Group sold 870,657 shares at their fair value generating a gain of approximately S/.646,000 that was recorded as part of the “Net gain on sale of securities” caption of the combined statements of income.
| (f) | As of December 31, 2013 and 2012 and January 1, 2012, corresponded to participations in RPI International Holding, LP (RPI Partnership) and Royalty Pharma Cayman Holding, LP (RPS Partnership), which were formed as exempted limited partnerships under the laws of the Cayman Islands. The RPI Partnership and the RPS Partnership invests in a series of feeder funds whose objective is to invest in Royalty Pharma Investments and Royalty Pharma Select, respectively, unit trust established under the laws of Ireland and authorized by the Central Bank of Ireland. These unit trusts are dedicated to the purchase of royalty rights on medical patents and biotechnology. The participations in RPI Partnership and RPS Partnership are not liquid and require authorization for their trading. |
As of December 31, 2013, the Group held 54,978 and 501,286 participations of RPS Partnership and RPI Partnership, respectively, whose fair values amounted to approximately U.S.$3,798,000 and U.S.$41,983,000 (equivalent to approximately S/.10,618,000 and S/.117, 342,000, respectively). As of December 31, 2012, the Group held 414,290 and 2,142,562 shares of RPI Partnership and RPS Partnership, respectively, at fair value of approximately U.S.$25,558,000 and U.S.$146,635,000 (equivalent to approximately S/.65,173,000 and S/.380,910,000, respectively). As of January 1, 2012, the Group held 469,105 and 2,392,407 shares of RPI Partnership and RPS Partnership, respectively, at fair value of approximately U.S.$19,491,000 and U.S.$142,621,000 (equivalent to approximately S/.52,548,000 and S/.345,558,000, respectively).
F-50
Table of Contents
Notes to the combined financial statements (continued)
During 2013 and 2012, the Group received dividends from these participations for approximately S/.8,412,000 and S/.22,788,000, respectively, which are included in the “Interest and similar income” caption in the combined statements of income; see Note 18.
During 2013, the Group sold 359,312 and 1,641,276 participations in RPS Partnership and RPI Partnership (approximately U.S.$139,927,000, equivalent to S/.367,168,000) at their fair value; a gain of approximately S/.149,352,000 was recorded in the “Net gain on sale of securities” caption of the combined statements of income.
| (g) | The table below presents the balance of available-for-sale investments as of December 31, 2013 and 2012 and as of January 1, 2012, classified by maturity dates: |
| 2013 | 2012 | 01.01.2012 | ||||||||||
| S/.(000) | S/.(000) | S/.(000) | ||||||||||
Up to 3 months | 222,223 | 41,072 | 646,679 | |||||||||
From 3 months to 1 year | 722,299 | 666,007 | 1,135,836 | |||||||||
From 1 to 3 years | 54,004 | 246,419 | 186,970 | |||||||||
From 3 to 5 years | 103,163 | 116,871 | 12,763 | |||||||||
Over 5 years | 3,493,191 | 2,905,287 | 2,667,762 | |||||||||
Shares and participations (without maturity) | 904,470 | 1,218,355 | 990,069 | |||||||||
|
|
|
|
|
| |||||||
Total | 5,499,350 | 5,194,011 | 5,640,079 | |||||||||
|
|
|
|
|
| |||||||
| 6. | Loans, net |
| (a) | This item is made up as follows: |
| 2013 | 2012 | 01.01.12 | ||||||||||
| S/.(000) | S/.(000) | S/.(000) | ||||||||||
Direct loans | ||||||||||||
Loans | 14,869,505 | 11,377,835 | 9,897,681 | |||||||||
Credit cards receivables | 2,547,560 | 2,117,160 | 2,179,593 | |||||||||
Leasing receivables | 2,217,742 | 2,018,379 | 1,783,325 | |||||||||
Discounted notes | 457,092 | 433,437 | 318,544 | |||||||||
Factoring receivables | 256,637 | 175,207 | 249,783 | |||||||||
Advances and overdrafts | 128,135 | 14,432 | 109,499 | |||||||||
Refinanced loans | 123,897 | 108,293 | 87,122 | |||||||||
Past-due and under legal collection loans | 346,627 | 291,156 | 216,418 | |||||||||
|
|
|
|
|
| |||||||
| 20,947,195 | 16,535,899 | 14,841,965 | ||||||||||
Add (less) | ||||||||||||
Accrued interest | 228,453 | 186,584 | 171,742 | |||||||||
Unearned interest | (14,112 | ) | (11,491 | ) | (11,504 | ) | ||||||
Allowance for loan losses (c) | (694,375 | ) | (588,632 | ) | (500,373 | ) | ||||||
|
|
|
|
|
| |||||||
Total direct loans, net | 20,467,161 | 16,122,360 | 14,501,830 | |||||||||
|
|
|
|
|
| |||||||
Indirect loans, Note 17(b) | 4,107,238 | 3,770,984 | 3,699,267 | |||||||||
|
|
|
|
|
| |||||||
F-51
Table of Contents
Notes to the combined financial statements (continued)
| (b) | Direct loans by class are as follows: |
| 2013 | 2012 | 01.01.12 | ||||||||||
| S/.(000) | S/.(000) | S/.(000) | ||||||||||
Commercial loans | 10,688,490 | 7,804,106 | 7,074,524 | |||||||||
Mortgage loans | 3,745,408 | 2,988,296 | 2,333,082 | |||||||||
Consumer loans | 5,960,122 | 5,212,510 | 4,928,259 | |||||||||
Micro-business loans | 553,175 | 530,987 | 506,100 | |||||||||
|
|
|
|
|
| |||||||
Total | 20,947,195 | 16,535,899 | 14,841,965 | |||||||||
|
|
|
|
|
| |||||||
| (c) | The changes in the allowance for loan losses (direct and indirect) were as follows: |
| 2013 | ||||||||||||||||||||
| Commercial | Mortgage | Consumer | Micro-business | Total | ||||||||||||||||
| S/.(000) | S/.(000) | S/.(000) | S/.(000) | S/.(000) | ||||||||||||||||
Beginning balances | 90,498 | 14,788 | 449,247 | 47,164 | 601,697 | |||||||||||||||
Provision | 20,595 | 6,302 | 325,310 | 25,035 | 377,242 | |||||||||||||||
Recovery of written–off loans | 357 | 246 | 92,120 | 3,475 | 96,198 | |||||||||||||||
Loan portfolio written-off | (7,105 | ) | (135 | ) | (357,821 | ) | (17,865 | ) | (382,926 | ) | ||||||||||
Translation result | 8,452 | 2,931 | 1,998 | 1,916 | 15,297 | |||||||||||||||
|
|
|
|
|
|
|
|
|
| |||||||||||
Ending balances (*) | 112,797 | 24,132 | 510,854 | 59,725 | 707,508 | |||||||||||||||
|
|
|
|
|
|
|
|
|
| |||||||||||
| 2012 | ||||||||||||||||||||
| Commercial | Mortgage | Consumer | Micro-business | Total | ||||||||||||||||
| S/.(000) | S/.(000) | S/.(000) | S/.(000) | S/.(000) | ||||||||||||||||
Beginning balances | 89,572 | 9,550 | 369,270 | 43,846 | 512,238 | |||||||||||||||
Provision | 7,216 | 7,088 | 368,719 | 17,730 | 400,753 | |||||||||||||||
Recovery of written–off loans | 1,180 | 138 | 76,030 | 2,994 | 80,342 | |||||||||||||||
Loan portfolio written-off | (1,332 | ) | (355 | ) | (363,822 | ) | (17,165 | ) | (382,674 | ) | ||||||||||
Translation result | (6,138 | ) | (1,633 | ) | (950 | ) | (241 | ) | (8,962 | ) | ||||||||||
|
|
|
|
|
|
|
|
|
| |||||||||||
Ending balances (*) | 90,498 | 14,788 | 449,247 | 47,164 | 601,697 | |||||||||||||||
|
|
|
|
|
|
|
|
|
| |||||||||||
| (*) | The allowance for loan losses includes the allowance for indirect loans amounting to S/.13,133,000, S/.13,065,000 and S/.11,865,000 as of December 31, 2013 and 2012 and as of January 1, 2012, respectively, which is presented in the “Accounts payable, provisions and other liabilities” caption of the combined statements of financial position; see Note 9(a). |
In Management’s opinion, the allowance for loan losses recorded as of December 31, 2013 and 2012 and as of January 1, 2012, has been established in accordance with IAS 39 and is sufficient to cover incurred losses on the loan portfolio.
| (d) | Interest rates on loans are freely determined based on the rates prevailing in the Peruvian market. Part of the loan portfolio is collateralized with guarantees received from clients, which mainly consist of mortgages, trust assignments, financial instruments and industrial and mercantile pledges. |
| (e) | For the years 2013 and 2012, the Group has not recorded in the combined income statements interest on past-due loans for more than 90 days and under legal collection because such interest is excluded from interest income until collected. Interest income that would have been recorded for these loans in accordance with their original contract terms and have not been recognized as income amounts approximately to S/.153,137,000 and S/.120,645,000 as of December 31, 2013 and 2012, respectively. |
F-52
Table of Contents
Notes to the combined financial statements (continued)
| (f) | The table below presents the direct loan portfolio as of December 31, 2013 and 2012 and as of January 1, 2012, classified by maturity dates: |
| 2013 | 2012 | 01.01.12 | ||||||||||
| S/.(000) | S/.(000) | S/.(000) | ||||||||||
Outstanding - | ||||||||||||
Up to 1 month | 1,848,124 | 1,906,026 | 2,078,609 | |||||||||
From 1 to 3 months | 2,586,805 | 1,961,687 | 1,907,023 | |||||||||
From 3 months to 1 year | 5,295,215 | 3,900,490 | 2,983,975 | |||||||||
From 1 to 5 years | 7,344,988 | 5,668,083 | 5,572,598 | |||||||||
More than 5 years | 3,525,436 | 2,808,457 | 2,083,342 | |||||||||
|
|
|
|
|
| |||||||
| 20,600,568 | 16,244,743 | 14,625,547 | ||||||||||
Past-due loans - | ||||||||||||
Up to 4 months | 98,378 | 93,305 | 64,956 | |||||||||
Over 4 months | 135,387 | 121,629 | 71,959 | |||||||||
Under legal collection | 112,862 | 76,222 | 79,503 | |||||||||
|
|
|
|
|
| |||||||
| 20,947,195 | 16,535,899 | 14,841,965 | ||||||||||
|
|
|
|
|
| |||||||
F-53
Table of Contents
Notes to the combined financial statements (continued)
| 7. | Investment property |
| (a) | This item is made up as follows: |
Acquisition or | 2013 Hierarchy (ii) | Total gain in results 2013 | Valuation methodology (d) | |||||||||||||||||||||||||||
| 2013 | 2012 | 01.01.2012 | 2013 | 2012 | 01.01.2012 | |||||||||||||||||||||||||
| S/.(000) | S/.(000) | S/.(000) | S/.(000) | |||||||||||||||||||||||||||
Land - | ||||||||||||||||||||||||||||||
San Isidro (*), Note 33 (a) | 209,938 | 145,442 | 120,393 | 2008 | Level 3 | 50,453 | Appraisal | Appraisal | Appraisal | |||||||||||||||||||||
Puruchuco (*), Note 33 (b) | 87,894 | 67,274 | 61,060 | 2008 | Level 3 | 20,570 | Appraisal | Appraisal | Appraisal | |||||||||||||||||||||
Sullana (iv) | — | 39,021 | — | 2012 | — | — | — | Appraisal | — | |||||||||||||||||||||
Piura | 26,566 | 22,323 | 20,200 | 2009 | Level 3 | 3,977 | Appraisal | Appraisal | Appraisal | |||||||||||||||||||||
Pucalpa (iv) | — | 15,982 | — | 2012 | — | — | — | Appraisal | — | |||||||||||||||||||||
Lurín (*) | 19,239 | 17,358 | 13,269 | 2012 | Level 3 | 1,872 | Appraisal | Appraisal | Appraisal | |||||||||||||||||||||
Others | 30,356 | 26,041 | 15,463 | — | Level 3 | 4,815 | Appraisal | Appraisal | Appraisal | |||||||||||||||||||||
|
|
|
|
|
|
|
| |||||||||||||||||||||||
| 373,993 | 333,441 | 230,385 | 81,687 | |||||||||||||||||||||||||||
|
|
|
|
|
|
|
| |||||||||||||||||||||||
Completed investment property | �� | |||||||||||||||||||||||||||||
Shopping malls “Real Plaza” - | ||||||||||||||||||||||||||||||
Piura (*) | — | 125,189 | 91,743 | 2009 | — | — | — | DCF | DCF | |||||||||||||||||||||
Chiclayo (*) | — | — | 130,760 | 2005 | — | — | — | — | DCF | |||||||||||||||||||||
Chorrillos | — | — | 55,542 | 2011 | — | — | — | — | DCF | |||||||||||||||||||||
|
|
|
|
|
|
|
| |||||||||||||||||||||||
| — | 125,189 | 278,045 | — | |||||||||||||||||||||||||||
|
|
|
|
|
|
|
| |||||||||||||||||||||||
Buildings- | ||||||||||||||||||||||||||||||
Ate Vitarte (*) | 33,754 | 31,325 | 30,865 | — | Level 3 | 2,428 | DCF | DCF | DCF | |||||||||||||||||||||
Pardo y Aliaga | 2,193 | 2,035 | 2,029 | 2010 | Level 3 | 158 | DCF | DCF | DCF | |||||||||||||||||||||
|
|
|
|
|
|
|
| |||||||||||||||||||||||
| 35,947 | 33,360 | 32,894 | 2,586 | |||||||||||||||||||||||||||
|
|
|
|
|
|
|
| |||||||||||||||||||||||
Built on leased land - | ||||||||||||||||||||||||||||||
Real Plaza Centro Cívico shopping mall (i) | 187,832 | 175,136 | 172,777 | 2007 | Level 3 | 12,302 | DCF | DCF | DCF | |||||||||||||||||||||
Others | 2,333 | 2,191 | 2,440 | — | — | — | — | — | — | |||||||||||||||||||||
|
|
|
|
|
|
|
| |||||||||||||||||||||||
| 190,165 | 177,327 | 175,217 | 12,302 | |||||||||||||||||||||||||||
|
|
|
|
|
|
|
| |||||||||||||||||||||||
Investment property under construction - | ||||||||||||||||||||||||||||||
Real Plaza Pucalpa shopping mall (iv) (*) | 125,823 | — | — | 2012 | — | — | Cost + appraisal | — | — | |||||||||||||||||||||
Real Plaza Sullana shopping mall (iv) | 64,611 | — | — | 2012 | — | — | Cost + appraisal | — | — | |||||||||||||||||||||
Other | 1,884 | 10,667 | 4,882 | — | — | — | — | — | — | |||||||||||||||||||||
|
|
|
|
|
|
|
| |||||||||||||||||||||||
| 192,318 | 10,667 | 4,882 | — | |||||||||||||||||||||||||||
|
|
|
|
|
|
|
| |||||||||||||||||||||||
Total investment property | 792,423 | 679,984 | 721,423 | 96,575 | ||||||||||||||||||||||||||
|
|
|
|
|
|
|
| |||||||||||||||||||||||
| (*) | Contributed to the Patrimonio Fideicometido – Interproperties Perú, see Note 2(b). |
DCF: Discounted cash flow
| (i) | Interseguro holds land leases on these buildings for a term of 30 years (ends in the year 2037) extendable for an additional term of 30 years at maturity. Interseguro pays an annual rent equivalent to a certain percentage of the gross income obtained from the operations of the shopping mall, which shall not be less than U.S.$800,000. During 2013 and 2012, Interseguro has recognized an expense of S/.4,103,000 and S/.3,331,000, respectively, which was recorded in the caption “Expenses related to rental income”, of the combined income statement. Rental income amounted to S/.33,637,000 (S/.27,844,000 for Real Plaza Centro Cívico, S/.5,198,000 for Ate Vitarte building and S/.595,000 for other investment property). |
| (ii) | There were no transfers between Levels during the year. |
| (iii) | As of December 31, 2013 and 2012 and as of January 1, 2012, there were no encumbrances on any investment property. |
| (iv) | Investment property under construction includes the fair value of the respective land. |
F-54
Table of Contents
Notes to the combined financial statements(continued)
The movement of investment property for the years ended December 31, 2013 and 2012 are as follows:
2013 S/.(000) | 2012 S/.(000) | |||||||
Beginning balance | 679,984 | 721,423 | ||||||
Additions (b) | 147,063 | 105,748 | ||||||
Disposal of property (c) | (131,199 | ) | (186,302 | ) | ||||
Fair value adjustment | 96,575 | 39,115 | ||||||
|
|
|
| |||||
Ending balance | 792,423 | 679,984 | ||||||
|
|
|
| |||||
| (b) | During 2013, the main additions correspond to capital expenditures made for the construction of the Real Plaza Pucalpa Shopping Mall and the Real Plaza Sullana Shopping Mall, which are work in progress, for approximately S/.98,454,000 and S/.25,422,000, respectively, and the purchase from third parties of land lots located in different Peruvian cities for approximately S/.5,144,000. During 2012, the main additions correspond to capital expenditures made for the expansion of the Real Plaza Piura Shopping Mall for approximately S/.33,446,000 and the purchase of land lots. |
| (c) | Corresponds mainly to the sale done in January 2013 by Interseguro, for cash and at its fair value, of the Real Plaza Piura Shopping Mall to a related entity, recognizing a gain of approximately S/.3,763,000, that has been recorded in the “Profit from sale of investment property” caption of the combined statements of income. |
In May and June, 2012, Interseguro sold, for cash and at its fair value, the Real Plaza Chorrillos Shopping Mall and the Real Plaza Chiclayo Shopping Mall, respectively, to a related entity, recognizing a gain of approximately S/.17,654,000, that has been recorded in the “Profit from sale of investment property” caption of the combined statements of income.
| (d) | Fair value measurement – Investment property and investment property under construction |
Valuation techniques -
The discounted cash flow (DCF) method is used for completed shopping malls, buildings and investment property built on land leases.
This method involves the projection of a series of periodic cash flows at present value through a discount rate. The periodic calculation of the cash flows is normally determined as rental income net of operating expenses for functioning investment property. These series of periodic net operating income, together with an estimation of the terminal value (which uses the traditional valuation method) at the end of the projection period, is discounted at present value. The sum of the net current values is equal to the investment property’s fair value.
The fair value of land is determined based on the value assigned by an external appraiser. The external appraiser uses the market comparable method; under this method a property’s fair value is estimated based on comparable transactions. The unit of comparison applied by the Group is the price per square meter. The range of San Isidro land price per square meter is between U.S.$5,000 and U.S.$8,200 and the average is U.S.$6,133, the range of Puruchuco land price per square meter is between U.S.$1,400 and U.S.$1,550 and the average is U.S.$1,450, and the range of the other land price per square meter is between U.S.$230 and U.S.$400 and the average is U.S.$325.
F-55
Table of Contents
Notes to the combined financial statements(continued)
Main assumptions -
A brief description of the cash flow assumptions used as of December 31, 2013 and 2012 and as of January 1, 2012, is presented below:
| • | ERV - |
Corresponds to Estimated Rental Values which is the rent at which space could be let in the market conditions prevailing at the date of valuation.
| • | Long-term inflation - |
Is the increase of the general level of prices expected in Peru for the long term.
| • | Long-term average occupancy rate - |
Is the expected occupancy level of tenants in the leased properties.
| • | Average growth rate of rental income - |
Is the index that expresses the rental income growth and includes growth factors of the industry, inflation rates, stable exchange rate, per capita income and increasing expenses.
| • | Average Net Operating Income (NOI) margin - |
Is projected from the rental income from leasable areas by property and marketing income, less costs related to administration fees, other administrative expenses, insurance, taxes and other expenses.
| • | Discount rate - |
It reflects the current market risk and the uncertainty associated to obtaining cash flows.
The main assumptions used in the valuation and estimation of the market value of investment property are detailed below:
| Percentage | ||||||||||||
| 2013 | 2012 | 01.01.12 | ||||||||||
ERV | 103.0 | 107.2 | 101.7 | |||||||||
Long-term inflation | 2.5 | 2.50 | 2.5 | |||||||||
Long-term average occupancy rate | 95.0 | 95.0 | 95.0 | |||||||||
Average growth rate of rental income | 2.5 | 2.5 | 2.63 | |||||||||
Average NOI margin | 80.4 | 80.1 | 78.9 | |||||||||
Discount rate | 9.6 | 9.74 | 9.72 | |||||||||
Sensitivity analysis -
The sensitivity analysis on the valuation of property investments, against changes in factors deemed relevant by Management, is presented below:
| Rates change | 2013 S/.(000) | 2012 S/.(000) | ||||||||||
Average growth rate of rental income (basis) – 2.50% | ||||||||||||
Increase | +0.25 | % | 5,070 | 5,396 | ||||||||
Decrease | -0.25 | % | (4,603 | ) | (5,131 | ) | ||||||
Long-term inflation (basis) – 2.50% | ||||||||||||
Increase | +0.25 | % | 4,176 | 4,537 | ||||||||
Decrease | -0.25 | % | (3,825 | ) | (4,305 | ) | ||||||
Discount rate (basis) – 9.60% | ||||||||||||
Increase | +0.5 | % | (10,579 | ) | (12,226 | ) | ||||||
Decrease | -0.5 | % | 11,535 | 13,447 | ||||||||
F-56
Table of Contents
Notes to the combined financial statements(continued)
A significant increase (decrease) in land price per square meter could result in a significantly higher (lower) fair value measurement.
| (e) | The amount of the future minimum fixed rental income for the lease of the Group’s investment property is as follows: |
| Year | 2013 S/.(000) | 2012 S/.(000) | ||||||
Within 1 year | 12,477 | 12,944 | ||||||
After 1 year but not more than 5 years | 52,366 | 67,759 | ||||||
More than 5 years | 278,301 | 338,898 | ||||||
|
|
|
| |||||
Total | 343,144 | 419,601 | ||||||
|
|
|
| |||||
| 8. | Property, furniture and equipment, net |
| (a) | The movement of property, furniture and equipment and accumulated depreciation for the years ended December 31, 2013 and 2012, is as follows: |
| Description | Land | Buildings, facilities and leasehold improvements | Furniture and equipment | Vehicles | In-transit equipment and work-in-progress | Total 2013 | Total 2012 | |||||||||||||||||||||
| S/.(000) | S/.(000) | S/.(000) | S/.(000) | S/.(000) | S/.(000) | S/.(000) | ||||||||||||||||||||||
Cost | ||||||||||||||||||||||||||||
Balance as of January 1 | 180,417 | 388,976 | 431,837 | 1,132 | 29,407 | 1,031,769 | 976,545 | |||||||||||||||||||||
Additions | 125 | 20,573 | 38,174 | 117 | 18,448 | 77,437 | 81,237 | |||||||||||||||||||||
Transfers | — | 4,193 | 14,316 | — | (18,509 | ) | — | — | ||||||||||||||||||||
Disposals and write-offs (d) | — | (1,589 | ) | (11,090 | ) | — | — | (12,679 | ) | (26,013 | ) | |||||||||||||||||
|
|
|
|
|
|
|
|
|
|
|
|
|
| |||||||||||||||
Balance as of December 31 | 180,542 | 412,153 | 473,237 | 1,249 | 29,346 | 1,096,527 | 1,031,769 | |||||||||||||||||||||
|
|
|
|
|
|
|
|
|
|
|
|
|
| |||||||||||||||
Accumulated depreciation | ||||||||||||||||||||||||||||
Balance as of January 1 | — | 193,358 | 274,738 | 890 | — | 468,986 | 430,710 | |||||||||||||||||||||
Depreciation of the year | — | 16,905 | 47,290 | 71 | — | 64,266 | 60,508 | |||||||||||||||||||||
Disposals and write-offs (d) | — | (7 | ) | (10,713 | ) | (191 | ) | — | (10,911 | ) | (22,232 | ) | ||||||||||||||||
|
|
|
|
|
|
|
|
|
|
|
|
|
| |||||||||||||||
Balance as of December 31 | — | 210,256 | 311,315 | 770 | — | 522,341 | 468,986 | |||||||||||||||||||||
|
|
|
|
|
|
|
|
|
|
|
|
|
| |||||||||||||||
Net book value | 180,542 | 201,897 | 161,922 | 479 | 29,346 | 574,186 | 562,783 | |||||||||||||||||||||
|
|
|
|
|
|
|
|
|
|
|
|
|
| |||||||||||||||
| (b) | Financial entities in Peru are prohibited from pledging their fixed assets. |
| (c) | Management periodically reviews the residual values, useful life and the depreciation method to ensure they are consistent with the economic benefits and life expectation for the property, furniture and equipment. In Management’s opinion, there is no evidence of impairment in its property, furniture and equipment as of December 31, 2013 and 2012 and as of January 1, 2012. |
| (d) | During 2013 and 2012, correspond mainly to write-offs performed on fully depreciated assets. |
F-57
Table of Contents
Notes to the combined financial statements(continued)
| 9. | Accounts receivable and other assets, net; accounts payable, provisions and other liabilities |
| (a) | This item is made up as follows: |
| 2013 S/.(000) | 2012 S/.(000) | 01.01.2012 S/.(000) | ||||||||||
Accounts receivable and other assets | ||||||||||||
Financial instruments | ||||||||||||
Other accounts receivable, net | 164,757 | 158,467 | 162,392 | |||||||||
Accounts receivable related to derivative financial instruments (e) | 125,816 | 57,015 | 32,731 | |||||||||
Accounts receivable from sale of investments | 73,050 | 18,191 | 20,299 | |||||||||
Operations in process (c) | 64,288 | 44,440 | 30,207 | |||||||||
Credit card commission | 14,807 | 12,589 | 3,940 | |||||||||
Insurance operation receivables, net | 21,222 | 12,161 | 6,739 | |||||||||
Accounts receivable from reinsurer and coinsurer entities | 1,677 | 2,244 | 8,079 | |||||||||
|
|
|
|
|
| |||||||
Total | 465,617 | 305,107 | 264,387 | |||||||||
|
|
|
|
|
| |||||||
Non-financial instrument | ||||||||||||
Value-Added-Tax credit (b) | 270,309 | 254,085 | 213,247 | |||||||||
Intangible assets, net (d) | 135,670 | 128,409 | 111,492 | |||||||||
Prepaid expenses | 53,117 | 50,090 | 54,636 | |||||||||
Investments in associates | 38,099 | 32,100 | 36,093 | |||||||||
Income tax credit | 29,473 | 34,343 | 14,119 | |||||||||
Prepaid expenses to related entity, Note 26(f) | 25,123 | 29,401 | 34,461 | |||||||||
Other | 5,952 | 30,271 | 44,088 | |||||||||
|
|
|
|
|
| |||||||
| 557,743 | 558,699 | 508,136 | ||||||||||
|
|
|
|
|
| |||||||
Total | 1,023,360 | 863,806 | 772,523 | |||||||||
|
|
|
|
|
| |||||||
Accounts payable, provisions and other liabilities | ||||||||||||
Financial instruments | ||||||||||||
Other accounts payable | 285,311 | 262,644 | 207,005 | |||||||||
Accounts payable for acquisitions of investments | 161,533 | 87,799 | 74,808 | |||||||||
Accounts payable related to derivative financial instruments (e) | 159,269 | 80,231 | 68,254 | |||||||||
Operations in process (c) | 142,068 | 204,361 | 145,202 | |||||||||
Workers’ profit sharing and salaries payable | 79,655 | 94,537 | 60,017 | |||||||||
Allowance for indirect loan losses, Note 6(c) | 13,133 | 13,065 | 11,865 | |||||||||
Accounts payable to reinsurer and coinsurer | 2,371 | 1,350 | 2,613 | |||||||||
Taxes payable | 14,775 | 12,883 | 14,301 | |||||||||
|
|
|
|
|
| |||||||
| 858,115 | 756,870 | 584,065 | ||||||||||
|
|
|
|
|
| |||||||
Non-financial instrument | ||||||||||||
Provision for contingencies | 8,231 | 11,583 | 14,240 | |||||||||
Deferred fee income | 53,179 | 32,130 | 12,831 | |||||||||
Other | 18,494 | 25,357 | 45,652 | |||||||||
|
|
|
|
|
| |||||||
| 79,904 | 69,070 | 72,723 | ||||||||||
|
|
|
|
|
| |||||||
Total | 938,019 | 825,940 | 656,788 | |||||||||
|
|
|
|
|
| |||||||
F-58
Table of Contents
Notes to the combined financial statements(continued)
| (b) | Corresponds to the Value-Added-Tax resulting from the purchase of goods devoted mostly to grant financial leasing loans, which is recovered through the collection of the loans. |
| (c) | Operations in process include transactions performed in the last days of the month and other similar types of transactions which are reclassified to their final balance sheets accounts in the following month. These transactions do not affect the combined results. |
| (d) | The movement in intangibles assets and accumulated amortization for the years ended December 31, 2013 and 2012 is as follows: |
| 2013 | 2012 | |||||||||||||||||||
| Description | Software S/.(000) | In-transit- software S/.(000) | Other Intangibles S/.(000) | Total S/.(000) | Total S/.(000) | |||||||||||||||
Cost | ||||||||||||||||||||
Balance as of January 1 | 191,729 | 23,072 | 24,567 | 239,368 | 197,928 | |||||||||||||||
Additions and transfers | 43,258 | (15,247 | ) | 11,721 | 39,732 | 48,430 | ||||||||||||||
Disposals and write-offs | — | — | (3,916 | ) | (3,916 | ) | (6,990 | ) | ||||||||||||
|
|
|
|
|
|
|
|
|
| |||||||||||
Balance as of December 31 | 234,987 | 7,825 | 32,372 | 275,184 | 239,368 | |||||||||||||||
|
|
|
|
|
|
|
|
|
| |||||||||||
Accumulated amortization | ||||||||||||||||||||
Balance as of January 1 | 103,327 | — | 7,632 | 110,959 | 86,436 | |||||||||||||||
Amortization of the year | 30,923 | — | 1,234 | 32,157 | 25,749 | |||||||||||||||
Disposals and write-offs | (371 | ) | — | (3,231 | ) | (3,602 | ) | (1,226 | ) | |||||||||||
|
|
|
|
|
|
|
|
|
| |||||||||||
Balance as of December 31 | 133,879 | — | 5,635 | 139,514 | 110,959 | |||||||||||||||
|
|
|
|
|
|
|
|
|
| |||||||||||
Net book value | 101,108 | 7,825 | 26,737 | 135,670 | 128,409 | |||||||||||||||
|
|
|
|
|
|
|
|
|
| |||||||||||
Management assesses periodically the amortization method applied with the purpose of ensuring that it is consistent with the economic benefit of the intangibles. In Management’s opinion, there is no evidence of impairment in the Group’s intangibles as of December 31, 2013 and 2012 and as of January 1, 2012.
F-59
Table of Contents
Notes to the combined financial statements(continued)
| (e) | The following table presents as of December 31, 2013 and 2012 and as of January 1, 2012 the fair value of derivative financial instruments recorded as an asset or a liability, including their notional amounts. The notional amount is the nominal amount of the derivative’s underlying asset and is the base over which changes in fair value are measured; see Note 17(a): |
| 2013 | ||||||||||||||||||
| Note | Assets | Liabilities | Notional amount | Maturity | Hedged instrument | |||||||||||||
| S/.(000) | S/.(000) | S/.(000) | ||||||||||||||||
Derivatives held for trading (i) - | ||||||||||||||||||
Forward exchange contracts | 65,200 | 71,269 | 6,458,049 | Between January 2014 and January 2016 | ||||||||||||||
Interest rate swaps | 7,968 | 2,003 | 382,634 | Between February 2014 and August 2024 | ||||||||||||||
Currency swaps | 52,179 | 36,649 | 970,162 | Between January 2014 and May 2023 | ||||||||||||||
Cross currency swaps (CCS) | 469 | 35,189 | 164,509 | January 11, 2023 | ||||||||||||||
|
|
|
|
|
| |||||||||||||
| 125,816 | 145,110 | 7,975,354 | ||||||||||||||||
Derivatives helds as hedges (ii) - | ||||||||||||||||||
Cash flow hedges: | ||||||||||||||||||
Interest rate swaps (IRS) | 12(d) | — | 3,702 | 131,529 | June 16, 2014 and June 15, 2015 | Negotiable notes (DPR) | ||||||||||||
Interest rate swaps (IRS) | 12(e) | — | 10,300 | 213,416 | June 15, 2016 | Negotiable notes (DPR) | ||||||||||||
Interest rate swaps (IRS) | 12(f) | — | 157 | 3,056 | November 4, 2015 | Mortgage bonds | ||||||||||||
|
|
|
|
|
| |||||||||||||
| — | 14,159 | 348,001 | ||||||||||||||||
|
|
|
|
|
| |||||||||||||
| 125,816 | 159,269 | 8,323,355 | ||||||||||||||||
|
|
|
|
|
| |||||||||||||
| 2012 | ||||||||||||||||||
| Note | Assets | Liabilities | Notional amount | Maturity | Hedged instrument | |||||||||||||
| S/.(000) | S/.(000) | S/.(000) | ||||||||||||||||
Derivatives held for trading (i) - | ||||||||||||||||||
Forward exchange contracts | 28,938 | 42,340 | 4,898,640 | Between January 2013 and September 2014 | ||||||||||||||
Interest rate swaps | 3,083 | 4,108 | 123,357 | Between December 2013 and June 2024 | ||||||||||||||
Currency swaps | 11,824 | 7,998 | 387,593 | Between January 2013 and March 2022 | ||||||||||||||
Cross currency swaps (CCS) | 13,170 | — | 127,500 | March 27, 2013 | ||||||||||||||
|
|
|
|
|
| |||||||||||||
| 57,015 | 54,446 | 5,537,090 | ||||||||||||||||
Derivatives helds as hedges (ii) - | ||||||||||||||||||
Cash flow hedges: | ||||||||||||||||||
Interest rate swaps (IRS) | 12(d) | — | 9,495 | 224,000 | June 16, 2014 and June 15, 2015 | Negotiable notes (DPR) | ||||||||||||
Interest rate swaps (IRS) | 12(e) | — | 15,985 | 234,886 | June 15, 2016 | Negotiable notes (DPR) | ||||||||||||
Interest rate swaps (IRS) | 12(f) | — | 305 | 4,182 | November 4, 2015 | Mortgage bonds | ||||||||||||
|
|
|
|
|
| |||||||||||||
| — | 25,785 | 463,068 | ||||||||||||||||
|
|
|
|
|
| |||||||||||||
| 57,015 | 80,231 | 6,000,158 | ||||||||||||||||
|
|
|
|
|
| |||||||||||||
F-60
Table of Contents
Notes to the combined financial statements(continued)
| 01.01.12 | ||||||||||||||||||
| Note | Assets | Liabilities | Notional amount | Maturity | Hedged instrument | |||||||||||||
| S/.(000) | S/.(000) | S/.(000) | ||||||||||||||||
Derivatives held for trading (i) - | ||||||||||||||||||
Forward exchange contracts | 20,463 | 25,671 | 3,961,781 | Between January 2012 and January 2013 | ||||||||||||||
Interest rate swaps | 624 | 759 | 51,224 | Between December 2013 and November 2021 | ||||||||||||||
Currency swaps | 6,197 | 1,841 | 169,828 | Between February 2012 and April 2021 | ||||||||||||||
Cross currency swaps (CCS) | 5,447 | — | 134,800 | March 27, 2013 | ||||||||||||||
|
|
|
|
|
| |||||||||||||
| 32,731 | 28,271 | 4,317,633 | ||||||||||||||||
Derivatives helds as hedges (ii) - | ||||||||||||||||||
Cash flow hedges: | ||||||||||||||||||
Interest rate swaps (IRS) | 12(d) | — | 17,953 | 346,780 | June 16, 2014 and June 15, 2015 | Negotiable notes (DPR) | ||||||||||||
Interest rate swaps (IRS) | 12(e) | — | 21,472 | 284,277 | June 15, 2016 | Negotiable notes (DPR) | ||||||||||||
Interest rate swaps (IRS) | 12(f) | — | 558 | 7,370 | November 4, 2015 | Mortgage bonds | ||||||||||||
|
|
|
|
|
| |||||||||||||
| — | 39,983 | 638,427 | ||||||||||||||||
|
|
|
|
|
| |||||||||||||
| 32,731 | 68,254 | 4,956,060 | ||||||||||||||||
|
|
|
|
|
| |||||||||||||
As of December 31, 2013 and 2012 and as of January 1, 2012 certain derivative financial instruments required the establishment of collateral deposits for approximately S/.145,792,000, S/.39,723,000 and S/.41,694,000, respectively, see Note 4.
| (i) | Derivatives held for trading are principally negotiated to satisfy client’s needs. The Group may also take positions with the expectation of profiting from favorable movements in prices or rates. Also, this caption includes any derivatives which do not comply with IAS 39 hedging accounting requirements. |
| (ii) | A schedule indicating the periods when the current cash flow hedges are expected to occur and affect the combined statement of income, net of the deferred income tax is presented below: |
| As of December 31, 2013 | As of December 31, 2012 | 01.01.2012 | ||||||||||||||||||||||||||||||||||||||||||
| Up to 1 year | From 1 to 3 years | From 3 to 5 years | Over 5 years | Total | Up to 1 year | From 1 to 3 years | From 3 to 5 years | Over 5 years | Total | Total | ||||||||||||||||||||||||||||||||||
| S/.(000) | S/.(000) | S/.(000) | S/.(000) | S/.(000) | S/.(000) | S/.(000) | S/.(000) | S/.(000) | S/.(000) | S/.(000) | ||||||||||||||||||||||||||||||||||
Cash outflows (liabilities) | 175,430 | 201,081 | — | — | 376,511 | 169,873 | 292,013 | 50,035 | — | 511,921 | 714,252 | |||||||||||||||||||||||||||||||||
|
|
|
|
|
|
|
|
|
|
|
|
|
|
|
|
|
|
|
|
|
| |||||||||||||||||||||||
Combined income statements | (6,987 | ) | (3,149 | ) | — | — | (10,136 | ) | (8,380 | ) | (8,457 | ) | (337 | ) | — | (17,174 | ) | (27,704 | ) | |||||||||||||||||||||||||
|
|
|
|
|
|
|
|
|
|
|
|
|
|
|
|
|
|
|
|
|
| |||||||||||||||||||||||
As of December 31, 2013, the accumulated balance of unrealized loss on cash flow hedges recorded as other comprehensive income in the caption “Cash flow hedges reserve” results from the current hedges. Likewise, the transfer of net unrealized loss on cash flow hedges to the combined statements of income is presented in Note 15(d).
F-61
Table of Contents
Notes to the combined financial statements(continued)
| 10. | Deposits and obligations |
| (a) | This item is made up as follows: |
| 2013 S/.(000) | 2012 S/.(000) | 01.01.12 S/.(000) | ||||||||||
Time deposits (d) | 9,773,506 | 7,293,076 | 6,492,504 | |||||||||
Savings deposits | 5,370,923 | 4,371,398 | 4,144,805 | |||||||||
Demand deposits | 6,917,007 | 4,468,072 | 3,953,550 | |||||||||
Other obligations | 6,023 | 6,063 | 8,467 | |||||||||
|
|
|
|
|
| |||||||
Total | 22,067,459 | 16,138,609 | 14,599,326 | |||||||||
|
|
|
|
|
| |||||||
| (b) | Interest rates applied to deposits and obligations accounts are determined based on interest rates prevailing in the Peruvian market. |
| (c) | As of December 31, 2013, 2012 and January 1, 2012, approximately S/.5,799,518,000, S/.5,040,065,000 and S/.4,919,650,000, respectively, of deposits and obligations are covered by the Peruvian Deposit Insurance Fund. |
| (d) | The table below presents the balance of time deposits classified by maturity as of December 31, 2013 and 2012 and January 1, 2012: |
| 2013 S/.(000) | 2012 S/.(000) | 01.01.12 S/.(000) | ||||||||||
Due within 1 month | 3,420,730 | 1,684,432 | 1,936,043 | |||||||||
From 1 to 3 months | 2,683,516 | 522,605 | 447,581 | |||||||||
From 3 months to 1 year | 2,545,421 | 3,912,404 | 3,191,615 | |||||||||
From 1 to 5 years | 1,098,432 | 1,173,494 | 917,128 | |||||||||
More than 5 years | 25,407 | 141 | 137 | |||||||||
|
|
|
|
|
| |||||||
Total | 9,773,506 | 7,293,076 | 6,492,504 | |||||||||
|
|
|
|
|
| |||||||
| 11. | Due to banks and correspondents |
| (a) | This item is made up as follows: |
| 2013 | 2012 | 01.01.12 | ||||||||||
| S/.(000) | S/.(000) | S/.(000) | ||||||||||
By type - | ||||||||||||
Loans received from foreign entities (b) | 1,488,367 | 1,858,235 | 849,393 | |||||||||
Promotional credit lines (d) | 1,259,727 | 1,011,188 | 812,497 | |||||||||
|
|
|
|
|
| |||||||
| 2,748,094 | 2,869,423 | 1,661,890 | ||||||||||
Interest and commissions payable | 14,022 | 10,007 | 12,379 | |||||||||
Due to Peruvian banks | — | — | 30,595 | |||||||||
|
|
|
|
|
| |||||||
| 2,762,116 | 2,879,430 | 1,704,864 | ||||||||||
|
|
|
|
|
| |||||||
By term - | ||||||||||||
Short term | 678,648 | 1,551,437 | 284,440 | |||||||||
Long term | 2,083,468 | 1,327,993 | 1,420,424 | |||||||||
|
|
|
|
|
| |||||||
Total | 2,762,116 | 2,879,430 | 1,704,864 | |||||||||
|
|
|
|
|
| |||||||
F-62
Table of Contents
Notes to the combined financial statements(continued)
| (b) | As of December 31, 2013, 2012 and January 1, 2012 includes the following: |
| Entity | Country | Final maturity | 2013 | 2012 | 01.01.12 | |||||||||||||
| S/.(000) | S/.(000) | S/.(000) | ||||||||||||||||
Syndicated loan (c) | — | 2016 | 551,020 | — | — | |||||||||||||
Bladex | Multilateral | 2018 | 214,936 | 304,470 | 134,800 | |||||||||||||
Wells Fargo Bank & Co. | United States of America | 2014 | 195,650 | 127,500 | — | |||||||||||||
Corporación Andina de Fomento | Multilateral | 2016 | 69,875 | 191,250 | 134,800 | |||||||||||||
China Development Bank | China | 2016 | 69,875 | 76,500 | 80,880 | |||||||||||||
HSBC Bank PLC | England | 2014 | 55,900 | 51,000 | — | |||||||||||||
Cobank | United States of America | 2014 | 54,058 | 180,128 | 274,352 | |||||||||||||
RBC Wealth Management | United States of America | 2014 | 112,855 | 63,883 | — | |||||||||||||
Deutsche Bank A.G. | Germany | 2014 | 52,398 | 162,254 | 196,822 | |||||||||||||
JP Morgan Chase & Co. | United States of America | 2013-2014 | 111,800 | 229,500 | — | |||||||||||||
Bank of America N.A. | United States of America | 2013 | — | 102,000 | — | |||||||||||||
Citibank N.A | United States of America | 2013 | — | 102,000 | — | |||||||||||||
Sumitomo Mitsui Banking Corporation | Japan | 2013 | — | 76,500 | — | |||||||||||||
Standard Chartered Bank | England | 2013 | — | 191,250 | — | |||||||||||||
Other | — | — | 27,739 | |||||||||||||||
|
|
|
|
|
| |||||||||||||
| 1,488,367 | 1,858,235 | 849,393 | ||||||||||||||||
|
|
|
|
|
| |||||||||||||
Transactions with foreign entities bear an effective annual average interest rate of 2.90 percent as of December 31, 2013 (3.16 percent as of December 31, 2012 and 2.96 percent as of January 1, 2012).
| (c) | Corresponds to a syndicated loan received in July 2013 for approximately U.S.$200,000,000 in which fifteen foreign financial entities participate, of which Bank of America N.A. (USA) and Citibank N.A. (USA) participated with U.S.$40,000,000 each. This loan accrues an annual interest rate of Libor 6 months plus 185 basis points. |
| (d) | Promotional credit lines represent loans in Nuevos Soles and US Dollars granted by Corporación Financiera de Desarrollo (“COFIDE”) to promote Peru’s development. These liabilities are guaranteed by a loan portfolio amounting to S/.1,259,727,000, S/.1,011,188,000 and S/.812,497,000 as of December 31, 2013 and 2012 and as of January 1, 2012, respectively. These borrowings accrued an annual interest rate that fluctuated between 4 and 10 percent during 2013 (between 5 and 10 during 2012) and have maturities between February 2014 and April 2028 as of December 31, 2013 (between January 2014 and February 2022 as of December 31, 2012, and between January 2012 and February 2020 as of January 1, 2012). |
| (e) | Some of the loan agreements include standard covenants related to financial ratios, use of funds criteria and other administrative matters, which in Management’s opinion, do not limit the Group’s operations and the Group has complied with at the dates of the combined statements of financial position. |
F-63
Table of Contents
Notes to the combined financial statements(continued)
| (f) | As of December 31, 2013, 2012 and as of January 1, 2012, maturities of due to bank and correspondents are the following, based on their remaining period to repayment date: |
| Year | 2013 | 2012 | 01.01.12 | |||||||||
| S/.(000) | S/.(000) | S/.(000) | ||||||||||
2012 | — | — | 284,440 | |||||||||
2013 | — | 1,551,437 | 570,317 | |||||||||
2014 | 678,648 | 385,709 | 162,931 | |||||||||
2015 | 204,831 | 128,639 | 97,411 | |||||||||
2016 and thereafter | 1,878,637 | 813,645 | 589,765 | |||||||||
|
|
|
|
|
| |||||||
Total | 2,762,116 | 2,879,430 | 1,704,864 | |||||||||
|
|
|
|
|
| |||||||
| 12. | Bonds, notes and other obligations |
| (a) | This item is made up as follows: |
| Outstanding balances | ||||||||||||||||||||||||||||||
| Issuer | Issuance | Annual interest rate | Interest payment | Maturity | Authorized amount | Used amount | 2013 | 2012 | 01.01.2012 | |||||||||||||||||||||
| (000) | (000) | S/.(000) | S/.(000) | S/.(000) | ||||||||||||||||||||||||||
Negotiable notes (DPR) | ||||||||||||||||||||||||||||||
IBK DPR Securitizadora (d) | — | Libor 3M + 2.75%/ Libor 3M+3.00% | Quarterly | 2014-2015 | U.S.$ | 200,000 | U.S.$ | 200,000 | 131,370 | 223,578 | 318,397 | |||||||||||||||||||
IBK DPR Securitizadora (e) | — | Libor 3M+4.25% | Quarterly | 2016 | U.S.$ | 121,000 | U.S.$ | 121,000 | 212,497 | 233,469 | 273,917 | |||||||||||||||||||
|
|
|
|
|
| |||||||||||||||||||||||||
| 343,867 | 457,047 | 592,314 | ||||||||||||||||||||||||||||
|
|
|
|
|
| |||||||||||||||||||||||||
Subordinated bonds (b) – First Program | ||||||||||||||||||||||||||||||
Interbank | First (A Series) | 6.75% | Semiannually | 2013 | U.S.$ | 30,000 | U.S.$ | 15,000 | — | 38,250 | 40,170 | |||||||||||||||||||
Interbank | Second (B series) | 9.50% | Semiannually | 2023 | U.S.$ | 50,000 | U.S.$ | 30,000 | 83,850 | 76,500 | 80,880 | |||||||||||||||||||
Interbank | Third (A series) | 3.5% plus VAC (*) | Semiannually | 2023 | S/.135,000 | S/.110,000 | 110,000 | 110,000 | 110,000 | |||||||||||||||||||||
Interbank | Fifth (A series) | 8.50% | Semiannually | 2019 | S/.135,000 | S/.3,300 | 3,300 | 3,300 | 3,300 | |||||||||||||||||||||
Interbank | Sixth (A series) | 8.16% | Semiannually | 2019 | U.S.$ | 45,000 | U.S.$ | 15,110 | 42,232 | 38,531 | 40,737 | |||||||||||||||||||
Interbank | Eighth (A series) | 6.91% | Semiannually | 2022 | S/.300,000 | S/.137,900 | 137,900 | 137,900 | — | |||||||||||||||||||||
Interseguro | First | 9.00% | Quarterly | 2016 | U.S.$ | 5,000 | U.S.$ | 5,000 | 13,975 | 12,750 | 13,480 | |||||||||||||||||||
|
|
|
|
|
| |||||||||||||||||||||||||
| 391,257 | 417,231 | 288,567 | ||||||||||||||||||||||||||||
|
|
|
|
|
| |||||||||||||||||||||||||
F-64
Table of Contents
Notes to the combined financial statements(continued)
| Outstanding balances | ||||||||||||||||||||||||||||||
| Issuer | Issuance | Annual interest rate | Interest payment | Maturity | Authorized amount | Used amount | 2013 | 2012 | 01.01.2012 | |||||||||||||||||||||
| (000) | (000) | S/.(000) | S/.(000) | S/.(000) | ||||||||||||||||||||||||||
Subordinated bonds (b) – Second Program | ||||||||||||||||||||||||||||||
Interbank | Second (A Series) | 5.80% | Semiannually | 2023 | S/.450,000 | S/.150,000 | 149,563 | — | — | |||||||||||||||||||||
Interbank | Third (A Series) | 7.50% | Semiannually | 2023 | U.S.$ | 125,000 | U.S.$ | 50,000 | 139,305 | — | — | |||||||||||||||||||
|
|
|
|
|
| |||||||||||||||||||||||||
| 288,868 | — | — | ||||||||||||||||||||||||||||
|
|
|
|
|
| |||||||||||||||||||||||||
Leasing bonds (c) | ||||||||||||||||||||||||||||||
Interbank | First (Second program) | 6.45% | Semiannually | 2013 | S/.136,600 | S/.136,450 | — | 136,450 | 136,450 | |||||||||||||||||||||
|
|
|
|
|
| |||||||||||||||||||||||||
| — | 136,450 | 136,450 | ||||||||||||||||||||||||||||
|
|
|
|
|
| |||||||||||||||||||||||||
Mortgage bonds – First Program | ||||||||||||||||||||||||||||||
Interbank | First (A series) | 4.90% | Semiannually | 2014 | U.S.$ | 10,000 | U.S.$ | 10,000 | 1,118 | 3,570 | 6,470 | |||||||||||||||||||
Interbank (f) | Second (A and B series) | 5.6355%/ Libor 6M+0.90bps | Semiannually | 2015 | U.S.$ | 10,000 | U.S.$ | 10,000 | 3,354 | 4,590 | 8,088 | |||||||||||||||||||
|
|
|
|
|
| |||||||||||||||||||||||||
| 4,472 | 8,160 | 14,558 | ||||||||||||||||||||||||||||
|
|
|
|
|
| |||||||||||||||||||||||||
International Issuance through Panamanian Branch | ||||||||||||||||||||||||||||||
Junior subordinated notes (g) | First | 8.50% | Semiannually | 2070 | U.S.$ | 200,000 | U.S.$ | 200,000 | 547,627 | 499,835 | 523,833 | |||||||||||||||||||
Senior bonds (h) | First | 5.75% | Semiannually | 2020 | U.S.$ | 400,000 | U.S.$ | 400,000 | 1,110,632 | 936,074 | 1,043,594 | |||||||||||||||||||
Senior bonds (h) | Second | 5.75% | Semiannually | 2020 | U.S.$ | 250,000 | U.S.$ | 250,000 | 682,632 | 671,729 | — | |||||||||||||||||||
|
|
|
|
|
| |||||||||||||||||||||||||
| 2,340,891 | 2,107,638 | 1,567,427 | ||||||||||||||||||||||||||||
|
|
|
|
|
| |||||||||||||||||||||||||
Interest payable | 55,600 | 50,547 | 40,287 | |||||||||||||||||||||||||||
|
|
|
|
|
| |||||||||||||||||||||||||
| 3,424,955 | 3,177,073 | 2,639,603 | ||||||||||||||||||||||||||||
|
|
|
|
|
| |||||||||||||||||||||||||
| (*) | Constantly Updating Value (VAC) for its Spanish acronym. |
F-65
Table of Contents
Notes to the combined financial statements(continued)
| (b) | Subordinated bonds do not have specific guarantees and in accordance to SBS rules they qualified as second level equity (Tier 2), see Note 15 (f). |
| (c) | Leasing bond are collaterized by the fixed assets financed by the Group. |
| (d) | These notes were issued in two tranches, U.S.$60,000,000 and U.S.$140,000,000, respectively, and accrue interest at 3 month Libor rate plus a margin between 275 and 300 basis points. They are guaranteed by remittances received by Interbank through SWIFT transfers. |
In order to hedge the variable rate component, Interbank has entered into two interest-rate swap agreements, with notional amounts of U.S.$60,000,000 and U.S.$140,000,000, respectively, by which it receives the 3 month Libor rate and pays an annual fixed rate of 3.70 and 3.75 percent, respectively, starting in March 2009. The swaps’ payment schedules are identical to those of the notes and were designated as cash flow hedges; see Note 9(e).
| (e) | These notes were issued in June 2009 and accrue interest at a 3 month Libor rate plus 425 basis points. They are guaranteed by remittances received by Interbank through SWIFT transfers. |
In order to hedge the variable rate component, Interbank has entered into an interest-rate swap agreement, with notional amount of U.S.$121,000,000, by which it receives the 3 month Libor rate plus 425 basis points and pays an annual fixed rate of 7.90 percent, starting in September 2009. The swap payment schedule is identical to those of the notes and were designated as a cash-flow hedge; see Note 9(e).
| (f) | As of December 31, 2013 and 2012, Interbank holds an interest rate swap that has been designated as a cash flow hedge (Note 9(e); through this operation, the bonds were economically converted into fixed rate bonds. |
| (g) | These notes accrue a fixed annual interest rate of 8.50% for the first ten years, which starting April 2020 becomes a floating rate equal to the 3 month Libor rate for US dollar deposits plus 674 basis points, provided that the floating rate for any interest period will not be less than 10.5 percent per annum. Starting on that date and on any interest payment date, Interbank can redeem 100 percent of the notes without penalties. Interest payments are non-cumulative in case an interest payment is not performed in full or cancelled as set forth, due to Interbank’s right to cancel interest payments, a mandatory prohibition established by the SBS, or if the SBS determines that Interbank is not in compliance with applicable minimum regulatory capital requirements. In such cases, Interbank will not declare, pay or distribute a dividend for the period in which interest payments are not made. The principal payment will take place at the maturity date or when Interbank redeems the bonds. |
This issuance qualifies as Tier 1 equity, nevertheless, the SBS establishes a 17.65 percent limit, which is computed over capital, reserves and retained earnings with capitalization agreement, any excess qualifies as Tier 2 equity.
| (h) | Starting April 2016, Interbank can redeem, on any coupon payment date, these bonds, paying as a penalty an interest rate equal to the American Treasury Bonds rate plus 50 basis points. The principal payment of both issuances will take place at the maturity date of the bonds or when Interbank redeems them. |
| (i) | International issuances are listed at the Luxembourg Stock Exchange. On the other hand, local and international issuances have standard covenants related to financial ratios, use of funds and other administrative matters, which in Management’s opinion, do not limit the Group´s operations and the Group has complied with at the dates of the combined statements of financial position. |
F-66
Table of Contents
Notes to the combined financial statements(continued)
| (j) | The table below presents the repayment schedule of these obligations as of December 31, 2013 and 2012 and as of January 1, 2012: |
| Year | 2013 | 2012 | 01.01.12 | |||||||||
| S/.(000) | S/.(000) | S/.(000) | ||||||||||
2012 | — | — | 179,166 | |||||||||
2013 | — | 359,213 | 329,625 | |||||||||
2014 | 199,337 | 143,199 | 133,011 | |||||||||
2015 | 136,773 | 125,157 | 122,324 | |||||||||
2016 and thereafter | 3,088,845 | 2,549,504 | 1,875,477 | |||||||||
|
|
|
|
|
| |||||||
Total | 3,424,955 | 3,177,073 | 2,639,603 | |||||||||
|
|
|
|
|
| |||||||
| 13. | Insurance contract liabilities |
| (a) | This item is made up as follows: |
| 2013 | 2012 | 01.01.12 | ||||||||||
| S/.(000) | S/.(000) | S/.(000) | ||||||||||
Technical reserves (b) | 3,070,333 | 2,631,043 | 2,363,544 | |||||||||
Claims reserves (c) | 66,850 | 63,465 | 63,294 | |||||||||
|
|
|
|
|
| |||||||
| 3,137,183 | 2,694,508 | 2,426,838 | ||||||||||
|
|
|
|
|
| |||||||
| (b) | Technical reserves disclosed by type of insurance are the following: |
| 2013 | 2012 | 01.01.12 | ||||||||||
| S/.(000) | S/.(000) | S/.(000) | ||||||||||
Annuities | 2,823,489 | 2,404,319 | 2,124,414 | |||||||||
Retirement, disability and survival annuities | 144,193 | 152,139 | 170,784 | |||||||||
Life insurance | 80,569 | 63,228 | 57,697 | |||||||||
General insurance | 22,082 | 11,357 | 10,649 | |||||||||
|
|
|
|
|
| |||||||
| 3,070,333 | 2,631,043 | 2,363,544 | ||||||||||
|
|
|
|
|
| |||||||
The movement of technical reserves for the years ended December 31, 2013 and 2012 is as follows:
| 2013 | ||||||||||||||||||||
| Annuities | Retirement, disability and survival annuities | Life insurance | General insurance | Total | ||||||||||||||||
| S/.(000) | S/.(000) | S/.(000) | S/.(000) | S/.(000) | ||||||||||||||||
Beginning balances | 2,404,319 | 152,139 | 63,228 | 11,357 | 2,631,043 | |||||||||||||||
Insurance subscriptions | 433,930 | — | 3,181 | 30,132 | 467,243 | |||||||||||||||
Time course expenses | (152,852 | ) | (7,946 | ) | 11,466 | (19,437 | ) | (168,769 | ) | |||||||||||
Maturities and recoveries | — | — | (3,330 | ) | — | (3,330 | ) | |||||||||||||
Exchange differences | 138,092 | — | 6,024 | 30 | 144,146 | |||||||||||||||
|
|
|
|
|
|
|
|
|
| |||||||||||
Ending balances | 2,823,489 | 144,193 | 80,569 | 22,082 | 3,070,333 | |||||||||||||||
|
|
|
|
|
|
|
|
|
| |||||||||||
F-67
Table of Contents
Notes to the combined financial statements(continued)
| 2012 | ||||||||||||||||||||
| Annuities | Retirement, disability and survival annuities | Life insurance | General insurance | Total | ||||||||||||||||
| S/.(000) | S/.(000) | S/.(000) | S/.(000) | S/.(000) | ||||||||||||||||
Beginning balances | 2,124,414 | 170,784 | 57,697 | 10,649 | 2,363,544 | |||||||||||||||
Insurance subscriptions | 385,907 | — | 1,848 | 14,741 | 402,496 | |||||||||||||||
Time course expenses | (20,669 | ) | (18,645 | ) | 9,894 | (13,933 | ) | (43,353 | ) | |||||||||||
Maturities and recoveries | — | — | (3,004 | ) | — | (3,004 | ) | |||||||||||||
Exchange differences | (85,333 | ) | — | (3,207 | ) | (100 | ) | (88,640 | ) | |||||||||||
|
|
|
|
|
|
|
|
|
| |||||||||||
Ending balances | 2,404,319 | 152,139 | 63,228 | 11,357 | 2,631,043 | |||||||||||||||
|
|
|
|
|
|
|
|
|
| |||||||||||
| (c) | Claims reserves disclosed by type of insurance are the following: |
| 2013 | ||||||||||||
| Reported claims | IBNR | Total | ||||||||||
| S/.(000) | S/.(000) | S/.(000) | ||||||||||
Annuities | 1,440 | — | 1,440 | |||||||||
Retirement, disability and survival annuities | 36,912 | 14 | 36,926 | |||||||||
Life insurance | 9,139 | 11,285 | 20,424 | |||||||||
General insurance | 7,429 | 631 | 8,060 | |||||||||
|
|
|
|
|
| |||||||
| 54,920 | 11,930 | 66,850 | ||||||||||
|
|
|
|
|
| |||||||
| 2012 | ||||||||||||
| Reported claims | IBNR | Total | ||||||||||
| S/.(000) | S/.(000) | S/.(000) | ||||||||||
Annuities | 1,478 | — | 1,478 | |||||||||
Retirement, disability and survival annuities | 37,724 | 14 | 37,738 | |||||||||
Life insurance | 6,787 | 10,033 | 16,820 | |||||||||
General insurance | 2,575 | 4,854 | 7,429 | |||||||||
|
|
|
|
|
| |||||||
| 48,564 | 14,901 | 63,465 | ||||||||||
|
|
|
|
|
| |||||||
| 01.01.12 | ||||||||||||
| Reported claims | IBNR | Total | ||||||||||
| S/.(000) | S/.(000) | S/.(000) | ||||||||||
Annuities | 1,433 | — | 1,433 | |||||||||
Retirement, disability and survival annuities | 39,572 | 14 | 39,586 | |||||||||
Life insurance | 4,936 | 9,424 | 14,360 | |||||||||
General insurance | 3,577 | 4,338 | 7,915 | |||||||||
|
|
|
|
|
| |||||||
| 49,518 | 13,776 | 63,294 | ||||||||||
|
|
|
|
|
| |||||||
F-68
Table of Contents
Notes to the combined financial statements(continued)
The movement for the years ended December 31, 2013 and 2012 is as follows:
| 2013 | ||||||||||||||||||||
| Annuities | Retirement, disability and survival | Life insurance | General Insurance | Total | ||||||||||||||||
| S/.(000) | S/.(000) | S/.(000) | S/.(000) | S/.(000) | ||||||||||||||||
Beginning balances | 1,478 | 37,738 | 16,820 | 7,429 | 63,465 | |||||||||||||||
Claims | 127,255 | 6,293 | 29,239 | 14,116 | 176,903 | |||||||||||||||
Adjustments to prior years claim | — | 1,497 | 18 | (2,352 | ) | (837 | ) | |||||||||||||
Payments | (127,388 | ) | (8,602 | ) | (26,199 | ) | (11,178 | ) | (173,367 | ) | ||||||||||
Exchange differences | 95 | — | 546 | 45 | 686 | |||||||||||||||
|
|
|
|
|
|
|
|
|
| |||||||||||
Ending balances | 1,440 | 36,926 | 20,424 | 8,060 | 66,850 | |||||||||||||||
|
|
|
|
|
|
|
|
|
| |||||||||||
| 2012 | ||||||||||||||||||||
| Annuities reserves | Retirement, disability and survival | Life insurance | General Insurance | Total | ||||||||||||||||
| S/.(000) | S/.(000) | S/.(000) | S/.(000) | S/.(000) | ||||||||||||||||
Beginning balances | 1,433 | 39,586 | 14,360 | 7,915 | 63,294 | |||||||||||||||
Claims | 106,970 | 7,022 | 24,123 | 19,267 | 157,382 | |||||||||||||||
Adjustments to prior years claim | — | 1,719 | 63 | (8,501 | ) | (6,719 | ) | |||||||||||||
Payments | (106,879 | ) | (10,589 | ) | (21,641 | ) | (11,223 | ) | (150,332 | ) | ||||||||||
Exchange differences | (46 | ) | — | (85 | ) | (29 | ) | (160 | ) | |||||||||||
|
|
|
|
|
|
|
|
|
| |||||||||||
Ending balances | 1,478 | 37,738 | 16,820 | 7,429 | 63,465 | |||||||||||||||
|
|
|
|
|
|
|
|
|
| |||||||||||
| (d) | In Management’s opinion, these balances reflect the exposure of life and general insurance contracts as of December 31, 2013 and 2012 and January 1, 2012 in accordance with IFRS 4. |
F-69
Table of Contents
Notes to the combined financial statements(continued)
| (e) | As of December 31, 2013 and 2012, no additional reserves were needed as a result of the liability adequacy test. The main assumptions used in estimation of retirement, disability and survival annuities and individual life reserves as of those dates, were the following: |
| 2013 | 2012 | 01.01.12 | ||||||||||
| Modality | Mortality table | Technical rates | Mortality table | Technical rates | Mortality table | Technical rates | ||||||
Annuities | RV – 2009, B-2006 and MI –2006 with improvement factor for mortality | 6.28% (*)(**) in U.S.$ 6.29% (*)(**) in adjusted S/. 3.78% (*)(**) in S/. 7.05% (*)(**) in adjusted S/. | RV – 2009, B- 2006 and MI – 2006 with improvement factor | 5.08%(*)(**) in U.S.$ 5.08% in adjusted U.S.$ 2.46%(*)(**) in S/. 5.16%(*)(**) in adjusted S/. | RV – 2009, B – 2006 and MI – 2006 with improvement factor for mortality | Technical rates 5.85%(*)(**) in U.S.$ 5.85%(*)(**) in adjusted $ 3.37%(*)(**) in S/. 6.32%(*)(**) in adjusted S/. | ||||||
Retirement, disability and survival | B – 2006 and MI – 2006 with improvement factor for mortality | 3.78% | B – 2006 and MI – 2006 with improvement | 2.46% | B – 2006 and MI – 2006 with improvement factor for mortality | 3.37% | ||||||
Individual life insurance contracts (included unit linked insurance contracts) | CS0 80 adjusted | 3.00% | CS0 80 adjusted | 3.00% | CS0 80 adjusted | 3.00% | ||||||
| (*) | Adjusted for credit risk |
| (**) | In the tranches where the term of investments differs from the obligations, the discount rate is the lower between the market selling rate published monthly by the SBS and 3%, which is the technical rate established by the SBS |
| VAC: | Inflation Adjustment Nuevos Soles |
F-70
Table of Contents
Notes to the combined financial statements(continued)
The sensitivity of the estimates used by the Group to measure its insurance risks is represented primarily by the life insurance risks; the main variables as of December 31, 2013 and 2012, are the interest rates and the mortality and morbidity tables used. The Group has evaluated the changes of the reserves related to its most significant life insurance contracts included in annuities retirement, disability and survival contracts of +/- 100 bps of the interest rates and of +/- 5 bps of the mortality factors, being the results as follows:
| 2013 | 2012 | |||||||||||||||||||||||
| Variation of the reserve | Variation of the reserve | |||||||||||||||||||||||
| Variables | Amount of the reserve | Amount | Percentage | Amount of the reserve | Amount | Percentage | ||||||||||||||||||
| S/.(000) | S/.(000) | % | S/.(000) | S/.(000) | % | |||||||||||||||||||
Annuities - | ||||||||||||||||||||||||
Portfolio in S/. and U.S. Dollars – Basis amount | ||||||||||||||||||||||||
Changes in interest rates: + 100 bps | 2,712,272 | (111,218 | ) | (3.94 | %) | 2,306,047 | (98,272 | ) | (4.09 | %) | ||||||||||||||
Changes in interest rates: - 100 bps | 2,947,500 | 124,011 | 4.39 | % | 2,514,749 | 110,431 | 4.59 | % | ||||||||||||||||
Changes in Mortality tables to 105% | 2,790,263 | (33,227 | ) | (1.18 | %) | 2,377,893 | (26,425 | ) | (1.10 | %) | ||||||||||||||
Changes in Mortality tables to 95% | 2,858,612 | 35,122 | 1.24 | % | 2,432,827 | 28,508 | 1.19 | % | ||||||||||||||||
Retirements, disability and survival - | ||||||||||||||||||||||||
Portfolio in S/. – Basis amount | ||||||||||||||||||||||||
Changes in interest rates: + 100 bps | 138,975 | (5,218 | ) | (3.62 | %) | 146,761 | (5,378 | ) | (3.54 | %) | ||||||||||||||
Changes in interest rates: - 100 bps | 150,142 | 5,950 | 4.13 | % | 158,198 | 6,059 | 3.98 | % | ||||||||||||||||
Changes in Mortality tables to 105% | 142,408 | (1,784 | ) | (1.24 | %) | 150,309 | (1,830 | ) | (1.20 | %) | ||||||||||||||
Changes in Mortality tables to 95% | 146,065 | 1,872 | 1.30 | % | 154,029 | 1,890 | 1.24 | % | ||||||||||||||||
| 14. | Deferred income tax asset and liability |
| (a) | The following table presents a summary of the Group’s deferred income tax: |
| 2013 | 2012 | 01.01.2012 | ||||||||||
| S/.(000) | S/.(000) | S/.(000) | ||||||||||
Net deferred income tax asset | ||||||||||||
Deferred assets | ||||||||||||
Leasehold improvements depreciation | 1,138 | 710 | 313 | |||||||||
Other | 14,891 | 2,300 | 2,421 | |||||||||
|
|
|
|
|
| |||||||
Total | 16,029 | 3,010 | 2,734 | |||||||||
|
|
|
|
|
| |||||||
Net deferred income tax liability | ||||||||||||
Deferred assets | ||||||||||||
Allowance for loan losses, net | 64,545 | 48,400 | 43,348 | |||||||||
Unrealized loss on hedge derivatives valuations | 4,613 | 8,073 | 12,369 | |||||||||
Other | 3,127 | 4,597 | 305 | |||||||||
Deferred liabilities | ||||||||||||
Deemed cost of fixed assets | (46,646 | ) | (43,307 | ) | (39,796 | ) | ||||||
Amortization of intangibles assets, net | (30,192 | ) | (26,214 | ) | (22,175 | ) | ||||||
Unrealized gain on available –for-sale investments | (9,727 | ) | (32,309 | ) | (4,326 | ) | ||||||
Other | (366 | ) | (548 | ) | (8,346 | ) | ||||||
|
|
|
|
|
| |||||||
Total | (14,646 | ) | (41,308 | ) | (18,621 | ) | ||||||
|
|
|
|
|
| |||||||
| (b) | In Management’s opinion, the deferred income tax assets will be recovered from the taxable income that will be generated by the Group over the coming years, including the portion that is recorded in the combined shareholders’ equity. |
F-71
Table of Contents
Notes to the combined financial statements(continued)
| (c) | The table below presents the amounts reported in the combined income statements for the years ended December 31, 2013 and 2012: |
| 2013 | 2012 | |||||||
| S/.(000) | S/.(000) | |||||||
Current – Expense | 286,315 | 223,240 | ||||||
Deferred – (Income) | (20,559 | ) | (9,868 | ) | ||||
|
|
|
| |||||
| 265,756 | 213,372 | |||||||
|
|
|
| |||||
| (d) | The table below presents the reconciliation of the effective income tax rate to the statutory tax rate in 2013 and 2012: |
| 2013 | 2012 | |||||||||||||||
| S/.(000) | % | S/.(000) | % | |||||||||||||
Income before Income Tax | 1,240,365 | 100.00 | 978,353 | 100.00 | ||||||||||||
|
|
|
|
|
|
|
| |||||||||
Peruvian theoretical tax (see Note 16) | 372,110 | 30.00 | 293,506 | 30.00 | ||||||||||||
Net income of subsidiaries not domiciled in Peru | (48,799 | ) | (3.93 | ) | (74,801 | ) | (7.65 | ) | ||||||||
Permanent non-taxable income, net | (72,346 | ) | (5.83 | ) | (32,989 | ) | (3.37 | ) | ||||||||
Permanent non-deductible expenses | 27,268 | 2.20 | 21,138 | 2.16 | ||||||||||||
Translation results permanently not considered for tax purposes | (12,477 | ) | (1.01 | ) | 6,518 | 0.67 | ||||||||||
|
|
|
|
|
|
|
| |||||||||
Income Tax | 265,756 | 21.43 | 213,372 | 21.81 | ||||||||||||
|
|
|
|
|
|
|
| |||||||||
Peruvian life insurance companies are exempt from income tax regarding the income derived from assets linked to technical reserves for the purposes of payment of retirement, disability and survivor pensions within the private pension fund administration system, see Note 16(d).
| 15. | Equity |
| (a) | Capital stock - |
As of December 31, 2013 and 2012 and as of January 1, 2012, IFS’s capital stock is represented by 93,615,451 shares with a par value of U.S.$9.72 per share (totally paid and issued).
As of December 31, 2013 and 2012 and as of January 1, 2012, Inteligo Group’s capital stock is represented by 837,454 shares.
As of July 18, 2014, date in which the reorganization described in Note 1 was approved, IFS shareholders’ equity was represented by 113,110,864 common shares issued and paid, with no par value, issued at U.S.$9.72 per share.
IFS’s Board of Directors meeting held on April 8, 2013 agreed to distribute dividends corresponding to 2012 for U.S.$150,000,000 (equivalent to approximately S/.391,935,000).
IFS’s Board of Directors meeting held on March 30, 2012, agreed to distribute dividends corresponding to 2011 for U.S.$139,000,000 (equivalent to approximately S/.373,632,000).
During the year ended December 31, 2013, Inteligo Group declared and paid dividends for an amount of U.S.$15,800,000 (equivalent to S/.40,824,000).
During the year ended December 31, 2012, Inteligo Group declared and paid dividends for an amount of U.S.$29,400,000 (equivalent to S/.78,527,000).
F-72
Table of Contents
Notes to the combined financial statements(continued)
| (b) | Treasury stock held by Subsidiaries - |
As of December 31, 2013, the Group holds 3,315,311 IFS’s shares whose acquisition cost amounts to S/.227,707,000 (3,115,028 and 3,092,740 shares whose acquisition cost amounts to S/.191,401,000 and S/.201,172,000 as of December 31, 2012 and as of January 1, 2012, respectively).
| (c) | Capital surplus - |
Corresponds to the difference between the par value of shares issued and their sell or exchange value. Capital surplus is presented net of the expenses incurred and related to the issuance of shares and the difference between par value and acquisition costs of treasury stock.
| (d) | Unrealized results on financial instruments - |
This item is made-up as follows:
| Gain (loss) unrealized | ||||||||||||||||
| Available- for-sale investments | Cash flow hedging derivatives | Foreign currency translation reserve | Total | |||||||||||||
| S/.(000) | S/.(000) | S/.(000) | S/.(000) | |||||||||||||
Balance as of January 1, 2012 | 129,709 | (28,680 | ) | — | 101,029 | |||||||||||
Net unrealized gain from available-for-sale investments, net of unrealized loss | 504,893 | — | — | 504,893 | ||||||||||||
Transfer of realized gain from available-for-sale investment to combined income statements, net of realized loss | (149,887 | ) | — | — | (149,887 | ) | ||||||||||
Net unrealized loss on cash flow hedges | — | (5,984 | ) | — | (5,984 | ) | ||||||||||
Transfer of realized loss on cash flow hedges to combined income statements, net of realized gain | — | 15,942 | — | 15,942 | ||||||||||||
Foreign currency translation | — | — | (14,741 | ) | (14,741 | ) | ||||||||||
|
|
|
|
|
|
|
| |||||||||
Balance as of December 31, 2012 | 484,715 | (18,722 | ) | (14,741 | ) | 451,252 | ||||||||||
Net unrealized loss from available-for-sale investments, net of unrealized gain | (255,020 | ) | — | — | (255,020 | ) | ||||||||||
Transfer of realized gain from available-for-sale investment to combined income statements, net of realized loss | (209,556 | ) | — | — | (209,556 | ) | ||||||||||
Net unrealized loss on cash flow hedges | — | (5,889 | ) | — | (5,889 | ) | ||||||||||
Transfer of realized loss on cash flow hedges to combined income statements, net of realized gain | — | 14,004 | — | 14,004 | ||||||||||||
Foreign currency translation | — | — | 32,301 | 32,301 | ||||||||||||
|
|
|
|
|
|
|
| |||||||||
Balance as of December 31, 2013 | 20,139 | (10,607 | ) | 17,560 | 27,092 | |||||||||||
|
|
|
|
|
|
|
| |||||||||
F-73
Table of Contents
Notes to the combined financial statements(continued)
| (e) | Components of other comprehensive income - |
The combined statements of comprehensive income include other comprehensive income from investment available-for-sale, derivative financial instruments used as cash flow hedges and foreign currency translation reserve, as follows:
| 2013 | 2012 | |||||||
| S/.(000) | S/.(000) | |||||||
Available-for-sale investments: | ||||||||
Net unrealized (loss) gain | (255,020 | ) | 504,893 | |||||
Transfer of realized gain to combined income statements, net of realized loss | (209,556 | ) | (149,887 | ) | ||||
|
|
|
| |||||
Sub total | (464,576 | ) | 355,006 | |||||
Non controlling interest | (767 | ) | 559 | |||||
Income tax | (22,582 | ) | 27,983 | |||||
|
|
|
| |||||
Total | (487,925 | ) | 383,548 | |||||
|
|
|
| |||||
Cash flow hedges: | ||||||||
Net unrealized loss | (5,889 | ) | (5,984 | ) | ||||
Transfer of net realized loss to combined income statements | 14,004 | 15,942 | ||||||
|
|
|
| |||||
Sub total | 8,115 | 9,958 | ||||||
Non controlling interest | 57 | 71 | ||||||
Income tax | 3,460 | 4,296 | ||||||
|
|
|
| |||||
Total | 11,632 | 14,325 | ||||||
|
|
|
| |||||
Exchange difference on translation of foreign operation | 32,301 | (14,741 | ) | |||||
|
|
|
| |||||
| (f) | Shareholders’ equity for legal purposes (regulatory capital) - |
IFS and Inteligo Group are not required to establish shareholders’ equity for legal purposes (regulatory capital).
As of December 31, 2013 and 2012, the shareholders’ equity for legal purposes, required for IFS’s Subsidiaries (Interbank and Interseguro) and Inteligo Group’s subsidiaries are detailed below:
Interbank’s shareholders’ equity for legal purposes (regulatory capital) -
According to the provisions of Legislative Decree No. 1028, Interbank’s regulatory capital must be equal to or greater than 10 percent of total risk weighted assets and contingent operations, represented by the sum of: the regulatory capital requirement for market risk multiplied by 10, the regulatory capital requirement for operational risk multiplied by 10 and the weighted assets and indirect credits by credit risk. This calculation must include all balance sheet exposures on assets in Peruvian or foreign currency. As of December 31, 2013 and 2012, the minimum requirement is 10 percent.
In application of Peruvian Legislative Decree No. 1028, as of December 31, 2013 and 2012, Interbank maintains the following amounts related to weighted assets and contingent credits by total risk and regulatory capital (basic and supplementary):
| 2013 | 2012 | |||||||
Total risk weighted assets and credits | 26,684,039 | 21,086,081 | ||||||
Total regulatory capital | 3,572,147 | 2,799,456 | ||||||
Basic regulatory capital (Level 1) | 2,590,903 | 2,168,667 | ||||||
Supplementary regulatory capital (Level 2) | 981,244 | 630,789 | ||||||
Global regulatory capital ratio | 13.39 | % | 13.28 | % | ||||
F-74
Table of Contents
Notes to the combined financial statements(continued)
As of December 31, 2013 and 2012, Interbank has complied with SBS Resolutions No.2115-2009, No.6328-2009 and No.14354-2009, “Regulations for Regulatory Capital Requirements for Operational Risk”, “Market Risk” and “Credit Risk”, respectively and their amendments. These resolutions established, mainly, the methodologies to be applied by financial entities to calculate their risk-weighted assets for each type of risk.
In July 2011, the SBS issued Resolution No. 8425-2011, which states that an entity must determine an additional regulatory capital. In this sense, Peruvian financial institutions must develop a process to assess the adequacy of their regulatory capital in relation with their risk profile, which must follow the methodology described in said resolution. The additional regulatory capital shall be equivalent to the amount of regulatory capital requirements calculated for each of the following components: economic cycle, concentration risk, market concentration risk and interest rate risk, among others. Likewise, financial institutions have a term of five years, ending in July 2016, to bring their regulatory capital into compliance with the new requirements. As of December 31, 2013, the percentage of adequacy established by the SBS is 55 percent, therefore the additional regulatory capital requirement for legal purposes estimated by Interbank amounts to approximately S/.399,774,000 (S/.233,307,000 with a 40 percent requirement as of December 31, 2012).
Interseguro’s shareholder’s equity for legal purposes (regulatory capital) -
In accordance with SBS Resolution No. 1124-2006, amended by SBS Resolutions No. 8243-2008, No. 12687-2008 and No. 5587-2009, the regulatory capital must be greater than the amount resulting from the sum of the solvency net equity and the guarantee fund.
The solvency net equity is represented by the greater of the solvency margin or the minimal capital. As of December 31, 2013 and 2012, the solvency net equity is represented by the solvency margin. The solvency margin is the complementary support that insurance entities must maintain to deal with possible situations of excess claims not foreseen in the estimation of technical reserves.
The guarantee fund represents the additional equity support that insurance entities must maintain to deal with other risks that can affect them and that are not covered by the regulatory net equity, such as investment risk. The guarantee fund is equivalent to 35 percent of the regulatory net equity, calculated in accordance with SBS Resolution No. 1124-2006.
As of December 2013 and 2012, Interseguro’s shareholders’ equity for legal purposes is as follows:
| 2013 | 2012 | |||||||
| S/.(000) | S/.(000) | |||||||
Regulatory net equity | 274,223 | 265,195 | ||||||
Minus: | ||||||||
Solvency equity (solvency margin) | 177,568 | 140,336 | ||||||
Guarantee fund | 62,149 | 49,118 | ||||||
|
|
|
| |||||
Surplus | 34,506 | 75,741 | ||||||
|
|
|
| |||||
Inteligo Bank shareholders’ equity for legal purposes (regulatory capital) -
The Central Bank of the Bahamas requires Inteligo Bank to maintain capital of not less than 8% of its risk weighted assets. Inteligo Bank’s capital ratio as of December 31, 2013 and 2012, is the following:
| 2013 | 2012 | |||||||
| U.S.$(000) | U.S.$(000) | |||||||
Total eligible capital | 94,487 | 91,388 | ||||||
|
|
|
| |||||
Total risk weighted assets | 509,152 | 574,967 | ||||||
|
|
|
| |||||
Capital adequacy ratio | 18.56 | % | 15.89 | % | ||||
|
|
|
| |||||
F-75
Table of Contents
Notes to the combined financial statements(continued)
| (g) | Subsidiaries’ legal and special reserves - |
Reserves -
Some of the Group’s subsidiaries are required to establish a reserve equivalent to a certain percentage of their paid-in capital (20 or 35 percent, depending on their activity and country of incorporation) through annual transfers of 10 percent of their net income. As of December 31, 2013, 2012 and as of January 1, 2012, these reserves amounted to approximately S/.478,822,000, S/.409,813,000 and S/.354,487,000, respectively.
| 16. | Tax situation |
| (a) | IFS and Inteligo Group and their Subsidiaries that are incorporated and domiciled in the Republic of Panama and the Commonwealth of the Bahamas – see Note 2, are not subject to any income tax, or any taxes on capital gains, equity or property. |
As of December 31, 2013, there was no income tax liability reflected in the financial statements, for Inteligo Bank, as there is no income tax imposed by the Government of The Commonwealth of The Bahamas.
In accordance with the current tax regulations in Panama, the Branches of Inteligo Bank and Interbank are exempt from the payment of income taxes on profits derived from foreign operations.
| (b) | Non-Peruvian resident taxpayers (entities or individuals) are subject to a 4.1 percent income tax withholding over the gross amount of dividends distributed by Peruvian entities. Such income tax must be withheld by the Peruvian entity that distributes the dividends. In this regard, since IFS and Inteligo Group hold Peruvian entities that distribute dividends, they recognize the amount of said income tax in the period to which dividends corresponds. In this sense, as of December 31, 2013 and 2012, the Group has recorded expenses for S/.17,944,000 and S/.14,462,000, respectively, in the combined income statements. |
| (c) | The Group’s Subsidiaries incorporated in Peru are subject to Peruvian taxes; hence, they must assess their income tax burden on the basis of separate financial statements. As of December 31, 2013 and 2012, the statutory corporate income tax rate was 30 percent over net basis. |
| (d) | According to the amendments introduced by Peruvian Law No. 29645, as from January 1, 2011, interest and other income derived from foreign loans granted to Peruvian governmental entities is exempt from income tax on a permanent basis. |
Also, according to the provisions of the Peruvian Law No. 29663, subsequently amended by Law No. 29757, capital gains derived from the indirect disposal of Peruvian shares are deemed to be sourced in Peru.
To this extent, an indirect disposal of Peruvian shares occurs when shares issued by non-Peruvian entities are transferred, provided that such entity holds, directly or indirectly, shares (or participation interests) of one or more Peruvian subsidiaries (“indirect transfer”) and the following conditions are met at any time within a 12 month period:
| - | at least 50% of the fair market value of the non-resident corporation derives from the Peruvian shares held; and |
| - | at least 10% of the shares issued by the non-resident corporation are transferred. |
The law has established certain cases in which the Peruvian issuer of the shares being indirectly transferred is jointly liable for the payment of the income tax derived from such operation.
F-76
Table of Contents
Notes to the combined financial statements(continued)
On the other hand, as from January 1, 2010, Peruvian life insurance companies are exempt from income tax regarding the income derived from assets linked to technical reserves for the purposes of payment of retirement, disability and survivor pensions within the private pension fund administration system.
Such exemption covers the income derived from assets linked to technical reserves established by law for purposes of payment of annuities pensions, as well as the technical reserves linked to insurance products that include a saving or investment component.
The exemption shall be applicable as long as the assets continue to be linked to the technical reserves abovementioned.
| (e) | Peruvian Tax Authority – SUNAT - |
SUNAT is legally entitled to perform tax audits procedures for up to four years subsequent to the date on which the tax return regarding a taxable period must be filed. SUNAT is also entitled to challenge the income tax assessment performed by taxpayers in their tax returns. Said years will be considered as from January 1st of the next year in which the tax return was filed.
Currently, the following taxable periods are pending to be audited by SUNAT:
| - | Interbank: income tax regarding fiscal years 2009 to 2013. |
| - | Interseguro: income tax regarding fiscal years 2012 and 2013. |
On the other hand, in April 2004, June 2006, February 2007, June 2007, November 2007, October 2008 and December 2010, Interbank was notified with the Tax Assessments and Tax Fine Resolutions regarding the corporate income tax borne by Interbank with respect to fiscal years 2000, 2001, 2002, 2003, 2004, 2005 and 2006. Interbank has filed Tax Claims and Tax Appeals regarding said Tax Assessment and Tax Fine Resolutions in March 2009, August 2010 and December 2011; SUNAT solved the Tax Claims regarding fiscal years 2000, 2001, 2003, 2004, 2005 and 2006; Interbank filed tax appeals against the resolutions that solved such tax claims.
During 2013, SUNAT closed the tax audit procedures regarding the Corporate Income Tax borne by Interbank with respect to fiscal years 2007 and 2008. As a result, SUNAT issued several Tax Assessment Resolutions, but no payment was required.
As of December 31, 2013 SUNAT is tax auditing the corporate income tax borne by Interbank with respect to fiscal years 2009.
Since tax regulations are subject to interpretation by SUNAT, it is not possible to determine up to date whether such tax audits procedures would result in additional liabilities for the Group’s Subsidiaries or not. Therefore, any unpaid tax, penalties or interests that might result from said audit procedures will be expensed in the year in which they are determined. Nevertheless, Management and its legal advisors consider that any additional tax assessments would not have a significant impact on the combined financial statements as of December 31, 2013 and 2012 and as of January 1, 2012.
F-77
Table of Contents
Notes to the combined financial statements(continued)
| 17. | Off-balance sheet accounts |
| (a) | The table below presents the components of this caption: |
| 2013 | 2012 | 01.01.12 | ||||||||||
| S/.(000) | S/.(000) | S/.(000) | ||||||||||
Contingent credits - indirect loans (b), Note 6(a) | ||||||||||||
Guarantees and standby letters | 3,789,891 | 3,376,096 | 3,093,913 | |||||||||
Import and export letters of credit | 317,347 | 394,888 | 605,354 | |||||||||
|
|
|
|
|
| |||||||
| 4,107,238 | 3,770,984 | 3,699,267 | ||||||||||
|
|
|
|
|
| |||||||
Derivatives | ||||||||||||
Held for trading: note 9(e) | ||||||||||||
Foreign currency forward contracts on Nuevo Sol, see Note 29.2(b)(ii): | ||||||||||||
Foreign currency purchases | 2,780,824 | 2,406,841 | 2,025,055 | |||||||||
Foreign currency sales | 3,145,263 | 2,228,906 | 1,776,458 | |||||||||
Foreign currency forward contracts on currencies other than Nuevo sol | 531,962 | 262,893 | 160,268 | |||||||||
Interest rate swaps | 382,634 | 123,357 | 51,224 | |||||||||
Currency swap contracts, see Note 29.2(b)(ii): | ||||||||||||
Foreign currency delivery/ Nuevo Sol receipt | 475,751 | 184,569 | 86,338 | |||||||||
Nuevo Sol delivery/ Foreign currency receipt | 494,411 | 203,024 | 83,490 | |||||||||
Cross currency swaps | 164,509 | 127,500 | 134,800 | |||||||||
Held as hedges: note 9(e) | ||||||||||||
Cash flow hedges: | ||||||||||||
Interest rate swaps | 348,001 | 463,068 | 638,427 | |||||||||
|
|
|
|
|
| |||||||
| 8,323,355 | 6,000,158 | 4,956,060 | ||||||||||
|
|
|
|
|
| |||||||
Responsibilities under credit lines agreements (c) | 6,223,041 | 5,655,673 | 5,638,439 | |||||||||
|
|
|
|
|
| |||||||
Total | 18,653,634 | 15,426,815 | 14,293,766 | |||||||||
|
|
|
|
|
| |||||||
| (b) | In the normal course of its operations, the Group performs contingent operations (indirect loans). These transactions expose the Group to additional credit risk beyond the amounts recognized in the combined statements of financial position. |
The Group applies the same credit policies for granting and evaluating the provisions required for direct loans when performing contingent operations – see Note 6(a) – including obtaining guarantees when it deems it necessary. Guarantees vary and include deposits in financial institutions or other assets.
Taking into account that many of the contingent operations are expected to expire without the Group having to disburse funds, the total committed amounts do not necessarily represent future cash requirements.
| (c) | Responsibilities under credit lines agreements include credit lines and other consumer loans facilities (credits cards) and are cancelable upon notification to the client. |
F-78
Table of Contents
Notes to the combined financial statements(continued)
| 18. | Interest and similar income and expense |
This item is made up as follows:
| 2013 | 2012 | |||||||
| S/.(000) | S/.(000) | |||||||
Interest and similar income | ||||||||
Interest on loans | 2,082,906 | 1,825,537 | ||||||
Interest on investments available-for sale | 240,360 | 227,502 | ||||||
Interest on due from banks and inter-bank funds | 46,288 | 30,527 | ||||||
Other interest and similar income | 35,989 | 45,208 | ||||||
|
|
|
| |||||
Total | 2,405,543 | 2,128,774 | ||||||
|
|
|
| |||||
Interest and similar expense | ||||||||
Interest on deposits and obligations | 291,624 | 252,915 | ||||||
Interest on bonds, notes and other obligations | 185,240 | 149,891 | ||||||
Interest and fees on due to banks and correspondents | 149,611 | 134,432 | ||||||
Deposits Insurance Fund fees | 23,991 | 22,290 | ||||||
Other interest and similar expenses | 7,343 | 7,235 | ||||||
|
|
|
| |||||
Total | 657,809 | 566,763 | ||||||
|
|
|
| |||||
During the years 2013 and 2012, the interest and similar income accrued on impaired financial instruments recognized in the combined statements of income amounted to S/.14,080,000 and S/.7,119,000, respectively.
| 19. | Fee income from financial services, net |
This item is made up as follows:
| 2013 | 2012 | |||||||
| S/.(000) | S/.(000) | |||||||
Income | ||||||||
Maintenance and mailing of accounts, interchange fees, transfers and credit and debit card services | 396,160 | 445,435 | ||||||
Funds management | 105,216 | 82,057 | ||||||
Commissions from banking services | 87,845 | 116,093 | ||||||
Fees for indirect loans | 49,037 | 40,657 | ||||||
Collection services | 19,460 | 20,912 | ||||||
Brokerage and custody services | 8,820 | 10,441 | ||||||
Other | 25,453 | 32,395 | ||||||
|
|
|
| |||||
Total | 691,991 | 747,990 | ||||||
|
|
|
| |||||
Expenses | ||||||||
Insurance | 24,461 | 37,551 | ||||||
Fees paid to foreign banks | 17,957 | 14,001 | ||||||
Brokerage and custody services | 163 | 264 | ||||||
Other | 27,387 | 24,661 | ||||||
|
|
|
| |||||
Total | 69,968 | 76,477 | ||||||
|
|
|
| |||||
Net | 622,023 | 671,513 | ||||||
|
|
|
| |||||
F-79
Table of Contents
Notes to the combined financial statements(continued)
| 20. | Other income and expenses |
These items are made up as follow:
| 2013 | 2012 | |||||||
| S/.(000) | S/.(000) | |||||||
Other income | ||||||||
ATM rental income | 17,251 | 17,609 | ||||||
Participation from investments in associates | 15,313 | 10,042 | ||||||
Services granted to third parties | 10,096 | 4,841 | ||||||
Recovery of accounts receivables provision | 8,368 | 603 | ||||||
Other technical income for insurance operations | 5,132 | 3,709 | ||||||
Insurance recovery | 3,847 | 76 | ||||||
Gain on sale of foreclosed assets | 362 | — | ||||||
Other income | 29,005 | 35,824 | ||||||
|
|
|
| |||||
Total other income | 89,374 | 72,704 | ||||||
|
|
|
| |||||
Other expenses | ||||||||
Commissions from insurance activities | 17,430 | 3,160 | ||||||
Provision for sundry risk | 3,898 | 6,481 | ||||||
Sundry technical insurance expenses | 6,827 | 5,856 | ||||||
Donations | 6,703 | 4,537 | ||||||
Administrative and tax sanctions | 6,351 | 1,058 | ||||||
Termination of employees | 6,315 | 6,482 | ||||||
Provision for other accounts receivables | 1,091 | 8,768 | ||||||
Loss on sale of foreclosed assets | — | 1,713 | ||||||
Other expenses | 41,596 | 34,196 | ||||||
|
|
|
| |||||
Total other expenses | 90,211 | 72,251 | ||||||
|
|
|
| |||||
F-80
Table of Contents
Notes to the combined financial statements(continued)
| 21. | Net premiums earned |
| (a) | This item is made up as follows: |
| Premiums assumed | Adjustment of technical reserves | Gross premiums earned (*) | Premiums ceded to reinsurers | Net premiums earned | Percentage net premiums earned | |||||||||||||||||||||||||||||||||||||||||||
| 2013 | 2012 | 2013 | 2012 | 2013 | 2012 | 2013 | 2012 | 2013 | 2012 | 2013 | 2012 | |||||||||||||||||||||||||||||||||||||
| S/.(000) | S/.(000) | S/.(000) | S/.(000) | S/.(000) | S/.(000) | S/.(000) | S/.(000) | S/.(000) | S/.(000) | % | % | |||||||||||||||||||||||||||||||||||||
Life insurance | ||||||||||||||||||||||||||||||||||||||||||||||||
Annuities (**) | 395,721 | 326,529 | (281,105 | ) | (362,551 | ) | 114,616 | (36,022 | ) | — | — | 114,616 | (36,022 | ) | 43.46 | (41.44 | ) | |||||||||||||||||||||||||||||||
Group life | 73,131 | 51,875 | (76 | ) | (837 | ) | 73,055 | 51,038 | (2,497 | ) | (2,285 | ) | 70,558 | 48,753 | 26.75 | 56.08 | ||||||||||||||||||||||||||||||||
Individual life | 30,354 | 23,777 | (10,210 | ) | (9,066 | ) | 20,144 | 14,711 | (1,557 | ) | (733 | ) | 18,587 | 13,978 | 7.05 | 16.08 | ||||||||||||||||||||||||||||||||
Retirement, disability and survival | 150 | 271 | 7,973 | 18,221 | 8,123 | 18,492 | — | — | 8,123 | 18,492 | 3.08 | 21.27 | ||||||||||||||||||||||||||||||||||||
Others | 4,416 | 4,139 | (939 | ) | 4 | 3,477 | 4,143 | (1,448 | ) | (1,393 | ) | 2,029 | 2,750 | 0.77 | 3.16 | |||||||||||||||||||||||||||||||||
General insurance | 60,536 | 40,045 | (10,476 | ) | (810 | ) | 50,060 | 39,235 | (227 | ) | (252 | ) | 49,833 | 38,983 | 18.89 | 44.85 | ||||||||||||||||||||||||||||||||
|
|
|
|
|
|
|
|
|
|
|
|
|
|
|
|
|
|
|
|
|
|
|
| |||||||||||||||||||||||||
| 564,308 | 446,636 | (294,833 | ) | (355,039 | ) | 269,475 | 91,597 | (5,729 | ) | (4,663 | ) | 263,746 | 86,934 | 100.00 | 100.00 | |||||||||||||||||||||||||||||||||
|
|
|
|
|
|
|
|
|
|
|
|
|
|
|
|
|
|
|
|
|
|
|
| |||||||||||||||||||||||||
| (*) | Includes the annual variation of technical reserves and unearned premiums. |
| (**) | The variation of the adjustment of technical reserves is due to increases in current rates with which the technical reserves are determined and are shown in note 13(e). |
| (b) | Gross premiums earned by insurance type and its participation over total gross premiums are described below: |
| 2013 | 2012 | |||||||||||||||
| S/.(000) | % | S/.(000) | % | |||||||||||||
Life insurance | 219,415 | 81 | 52,362 | 57 | ||||||||||||
General insurance | 50,060 | 19 | 39,235 | 43 | ||||||||||||
|
|
|
|
|
|
|
| |||||||||
Total | 269,475 | 100 | 91,597 | 100 | ||||||||||||
|
|
|
|
|
|
|
| |||||||||
F-81
Table of Contents
Notes to the combined financial statements(continued)
| 22. | Net claims and benefits incurred for life insurance contracts and others |
This item is made up as follows:
| Gross claims and benefits | Ceded claims and benefits | Net insurance claims and benefits | ||||||||||||||||||||||
| 2013 | 2012 | 2013 | 2012 | 2013 | 2012 | |||||||||||||||||||
| S/.(000) | S/.(000) | S/.(000) | S/.(000) | S/.(000) | S/.(000) | |||||||||||||||||||
Life insurance | ||||||||||||||||||||||||
Annuities | (127,257 | ) | (106,970 | ) | — | — | (127,257 | ) | (106,970 | ) | ||||||||||||||
Group life | (25,995 | ) | (20,709 | ) | 788 | 1,909 | (25,207 | ) | (18,800 | ) | ||||||||||||||
Individual life | (2,795 | ) | (3,231 | ) | 741 | 186 | (2,054 | ) | (3,045 | ) | ||||||||||||||
Retirement, disability and survival | (7,790 | ) | (8,741 | ) | — | — | (7,790 | ) | (8,741 | ) | ||||||||||||||
Others | (435 | ) | (742 | ) | 729 | 438 | 294 | (304 | ) | |||||||||||||||
General insurance | (11,794 | ) | (10,270 | ) | — | 652 | (11,794 | ) | (9,618 | ) | ||||||||||||||
|
|
|
|
|
|
|
|
|
|
|
| |||||||||||||
| (176,066 | ) | (150,663 | ) | 2,258 | 3,185 | (173,808 | ) | (147,478 | ) | |||||||||||||||
|
|
|
|
|
|
|
|
|
|
|
| |||||||||||||
| 23. | Salaries and employee benefits |
This item is made up as follows:
| 2013 | 2012 | |||||||
| S/.(000) | S/.(000) | |||||||
Salaries | 467,195 | 418,401 | ||||||
Workers’ profit sharing | 56,618 | 37,443 | ||||||
Social security | 37,861 | 30,585 | ||||||
Severance indemnities | 33,370 | 29,580 | ||||||
Vacations, medical assistance and others | 31,490 | 36,590 | ||||||
|
|
|
| |||||
Total | 626,534 | 552,599 | ||||||
|
|
|
| |||||
The average number of employees for the years 2013 and 2012 was 7,460 and 7,219, respectively.
| 24. | Administrative expenses |
This item is made up as follows:
| 2013 | 2012 | |||||||
| S/.(000) | S/.(000) | |||||||
Services received from third parties (a) | 605,300 | 566,295 | ||||||
Taxes and contributions | 32,473 | 29,823 | ||||||
|
|
|
| |||||
Total | 637,773 | 596,118 | ||||||
|
|
|
| |||||
| (a) | Services received from third parties correspond mainly to transportation services, repairing and maintenance services, telecommunication costs, advertising expenses, professional fees, rent, among others. |
F-82
Table of Contents
Notes to the combined financial statements(continued)
| 25. | Pro-forma earnings per share |
The following table reflects basic and diluted earnings per share computations, on a pro-forma basis, reflecting the reorganization under common control described in Note 1 and further detailed in Note 33, as if the equity structure of the Group had been in place for all periods presented:
| IFS Outstanding shares | IFS shares considered in | Shares issued in the acquisition of Inteligo Group | Total shares considered in computation | Days as of the end of year | Weighted average number of shares | |||||||||||||||||||
| (in thousands) | (in thousands) | (in thousands) | (in thousands) | (in thousands) | ||||||||||||||||||||
2012 | ||||||||||||||||||||||||
Balance as of January 1, 2012 | 90,523 | 90,523 | 19,495 | 110,018 | 365 | 110,018 | ||||||||||||||||||
Sale of treasury stock | 15 | 15 | — | 15 | 351 | 15 | ||||||||||||||||||
Purchase of treasury stock | (172 | ) | (172 | ) | — | (172 | ) | 333 | (157 | ) | ||||||||||||||
Purchase of treasury stock | (61 | ) | (61 | ) | — | (61 | ) | 265 | (44 | ) | ||||||||||||||
Sale of treasury stock | 100 | 100 | — | 100 | 222 | 61 | ||||||||||||||||||
Purchase of treasury stock | (10 | ) | (10 | ) | — | (10 | ) | 130 | (4 | ) | ||||||||||||||
Sale of treasury stock | 105 | 105 | — | 105 | 53 | 15 | ||||||||||||||||||
|
|
|
|
|
|
|
|
|
| |||||||||||||||
Balance as of December 31, 2012 | 90,500 | 90,500 | 19,495 | 109,995 | 109,904 | |||||||||||||||||||
|
|
|
|
|
|
|
|
|
| |||||||||||||||
Pro-forma net earnings attributable to IFS S/.(000) (*) | 751,034 | |||||||||||||||||||||||
|
| |||||||||||||||||||||||
Pro-forma net basic and diluted earnings per share attributable to IFS (nuevos soles) | 6.834 | |||||||||||||||||||||||
|
| |||||||||||||||||||||||
2013 | ||||||||||||||||||||||||
Balance as of January 1, 2013 | 90,500 | 90,500 | 19,495 | 109,995 | 365 | 109,995 | ||||||||||||||||||
Sale of treasury stock | 38 | 38 | — | 38 | 336 | 35 | ||||||||||||||||||
Purchase of treasury stock | (320 | ) | (320 | ) | — | (320 | ) | 169 | (148 | ) | ||||||||||||||
Purchase of treasury stock | (10 | ) | (10 | ) | — | (10 | ) | 153 | (4 | ) | ||||||||||||||
Sale of treasury stock | 82 | 82 | — | 82 | 55 | 12 | ||||||||||||||||||
Purchase of treasury stock | 10 | 10 | — | 10 | 68 | 2 | ||||||||||||||||||
|
|
|
|
|
|
|
|
|
| |||||||||||||||
Balance as of December 31, 2013 | 90,300 | 90,300 | 19,495 | 109,795 | 109,892 | |||||||||||||||||||
|
|
|
|
|
|
|
|
|
| |||||||||||||||
Pro-forma net earnings attributable to IFS S/.(000) (*) | 950,332 | |||||||||||||||||||||||
|
| |||||||||||||||||||||||
Pro-forma net basic and diluted earnings per share attributable to IFS (nuevos soles) | 8.647 | |||||||||||||||||||||||
|
| |||||||||||||||||||||||
| (*) | See Note 33, subsequent events. The difference in the “Profit for the year” presented in the combined income statement and the pro-forma earnings per share, amounting to S/.19,843,000 and S/.9,852,000 for the year ended December 31, 2013 and 2012, respectively, is the result of the spin-off of Inteligo Real Estate Corp. prior to its acquisition by IFS. |
There have been no other transactions involving ordinary shares or potential ordinary shares between the reporting date and the date of completion of these combined financial statements.
F-83
Table of Contents
Notes to the combined financial statements(continued)
| 26. | Transactions with related parties and affiliated companies |
| (a) | The table below presents the balances with related parties and affiliated companies as of December 31, 2013 and 2012 and as of January 1, 2012: |
| 2013 | 2012 | 01.01.12 | ||||||||||
| S/.(000) | S/.(000) | S/.(000) | ||||||||||
Assets | ||||||||||||
Investments available - for - sale | ||||||||||||
Royalty Pharma, Note 5(f) | 127,960 | 446,083 | 398,106 | |||||||||
InRetail Perú Corp.,Note 5(e) | 126,022 | 201,943 | — | |||||||||
Loan portfolio, net (b) | 652,855 | 386,333 | 215,030 | |||||||||
Other assets (f) | 53,405 | 29,476 | 67,574 | |||||||||
Liabilities | ||||||||||||
Deposits and obligations | 457,173 | 491,000 | 263,914 | |||||||||
Other liabilities | 10,998 | 11,922 | 118 | |||||||||
Off-balance sheet accounts | ||||||||||||
Indirect loans | 58,453 | 64,370 | 54,819 | |||||||||
Income (expense) | ||||||||||||
Interest income | 25,174 | 33,112 | — | |||||||||
Finance expense | (7,433 | ) | (2,991 | ) | — | |||||||
Rental income | 5,882 | 7,879 | — | |||||||||
Profit from sale of investment property, Note 7(c) | 4,034 | 17,654 | — | |||||||||
Administrative expenses | (11,483 | ) | (4,480 | ) | — | |||||||
Other, net | 24,670 | (9,910 | ) | — | ||||||||
| (b) | As of December 31, 2013 and 2012 and as of January 1, 2012, the detail of loans to shareholder and related entities is the following: |
| 2013 | 2012 | 01.01.12 | ||||||||||
| S/.(000) | S/.(000) | S/.(000) | ||||||||||
Supermercados Peruanos S.A. | 115,876 | 84,428 | 46,693 | |||||||||
Intercorp Perú Ltd. | 111,664 | 45,901 | 53,920 | |||||||||
Inmobiliaria Puerta del Sol S.A. | 60,000 | — | — | |||||||||
Cineplex S.A. | 58,123 | 19,095 | 8,380 | |||||||||
Homecenters Peruanos S.A. | 43,097 | 22,873 | — | |||||||||
Financiera Uno S.A. | 39,149 | 29,102 | — | |||||||||
Eckerd Perú S.A. | 38,743 | 38,353 | 5,770 | |||||||||
Tiendas Peruanas S.A. | 31,669 | 12,313 | 9,045 | |||||||||
Victoria Global Opportunities S.A.C | 30,953 | 36,619 | 43,729 | |||||||||
Nessus Hoteles Perú S.A. | 29,389 | 10,519 | 11,401 | |||||||||
Agrícola Don Ricardo S.A.C. | 21,224 | 8,415 | — | |||||||||
Club de Socios S.A. | 19,409 | 22,090 | — | |||||||||
Domus Hogares del Norte S.A. | 11,946 | 13,397 | 2,087 | |||||||||
Bellavista Global Opportunities S.A.C. | 11,311 | 11,418 | 13,121 | |||||||||
Other | 30,302 | 31,810 | 20,884 | |||||||||
|
|
|
|
|
| |||||||
| 652,855 | 386,333 | 215,030 | ||||||||||
|
|
|
|
|
| |||||||
| (c) | As of December 31, 2013 and 2012, directors, officers and employees of the Group have been involved, directly and indirectly, in credit transactions with certain subsidiaries of the Group, as permitted by Peruvian Banking and Insurance Law, which regulates and limits certain transactions with |
F-84
Table of Contents
Notes to the combined financial statements(continued)
| employees, directors and officers of a bank or an insurance company. As of December 31, 2013 and 2012, and as of January 1, 2012 direct loans to employees, directors and key Management amounted to S/.115,367,000, S/.79,583,000 and S/.68,409,000, respectively; said loans are paid monthly and earn interest at market rates. |
There are no loans to the Group’s directors and key personnel guaranteed with any Subsidiaries’ shares.
| (d) | The Group’s key executives’ compensation (including the related income taxes assumed by the Group) for the years ended December 31, 2013 and 2012, comprised the following: |
| 2013 | 2012 | |||||||
| S/.(000) | S/.(000) | |||||||
Salaries | 14,056 | 12,686 | ||||||
Directors’ compensations | 25,874 | 21,220 | ||||||
|
|
|
| |||||
Total | 39,930 | 33,906 | ||||||
|
|
|
| |||||
| (e) | As of December 31, 2013 and 2012 and as of January 1, 2012, IFS and its Subsidiaries participate in domestic and foreign mutual and investment funds, recorded as available-for-sale investments which are managed by Interfondos S.A. Sociedad Administradora de Fondos, that amount to S/.41,361,000 and S/.15,313,000 and S/.40,495,000, respectively. |
| (f) | Correspond mainly to prepaid expenses for concession agreements with Supermercados Peruanos S.A. for spaces ceded to Interbank in the stores of Supermercados Peruanos S.A., for the operation of financial stores for a term of 15 years, and for an amount of approximately S/.25,123,000, S/.29,401,000 and S/.34,461,000 as of December 31, 2013 and 2012 and as of January 1, 2012, respectively, see Note 9(a). Interbank may renew the term of the agreement for an additional term of 15 years. Other assets also include an account receivable to Intercorp Peru for an amount of U.S.$10,000,000 (equivalent to S/.27,696,000) and U.S.$3,650,000 (equivalent to S/.10,488,000) as of December 31, 2013 and as of January 1, 2012, respectively. These accounts receivables generate interest at market rates and mature in the short term. |
| (g) | In Management’s opinion, transactions with related companies have been performed under Normal market conditions and within the limits permitted by SBS. Taxes generated by these transactions and the taxable base used for computing them are those customarily used in the industry and are determined according to prevailing tax standards. |
| 27. | Business segments |
As explained in Note 1, these combined financial statements comprise the combination of IFS and Subsidiaries and Inteligo Group and Subsidiaries. Therefore, segment information is presented for the combined entities, considering that IFS has determined that Inteligo Group is a reportable segment (wealth management) since the reorganization under common control.
IFS and Subsidiaries -
The Chief Operating Decision Maker (CODM) of IFS and Subsidiaries is the Chief Executive Officer (CEO) and presents two operating segments based on products and services as follows:
Banking -
Principally handling loans, credit facilities, deposits and current accounts.
F-85
Table of Contents
Notes to the combined financial statements(continued)
Insurance -
Provider of annuities, traditional life insurance products, as well as other retail focused insurance products.
Inteligo Group and Subsidiaries -
The Chief Operating Decision Maker (CODM) of Inteligo Group and Subsidiaries is the Chief Executive Officer (CEO) and presents one operating segment based on products and services as follows:
Wealth management -
Provider of financial advisory services and brokerage services. Inteligo caters mainly to Peruvian high net worth individuals.
The combined entities monitors the operating results of its business units separately for the purpose of making decisions about resource allocation and performance assessment. Segment performance is evaluated based on operating profit or loss and is measured consistently with operating profit or loss in the combined financial statements.
Transfer prices between operating segments are on an arm’s length basis in a manner similar to transactions with third parties.
No revenue from transactions with a single external customer or counterparty amounted to 10 percent or more of the Group’s total revenue in the years 2013 and 2012.
F-86
Table of Contents
Notes to the combined financial statements(continued)
| (i) | The following table presents the Group’s financial information by business segments as of December 31, 2013 and 2012 and as of January 1, 2012 and for year ended December 31, 2013 and 2012: |
| 2013 | 2012 | |||||||||||||||||||||||||||||||||||||||
| Banking | Insurance | Wealth Management | Corporate and eliminations | Total Combined | Banking | Insurance | Wealth Management | Corporate and eliminations | Total Combined | |||||||||||||||||||||||||||||||
| S/.(000) | S/.(000) | S/.(000) | S/.(000) | S/.(000) | S/.(000) | S/.(000) | S/.(000) | S/.(000) | S/.(000) | |||||||||||||||||||||||||||||||
Total income (*) | ||||||||||||||||||||||||||||||||||||||||
Third party | 3,100,202 | 628,560 | 212,284 | (8,216 | ) | 3,932,830 | 2,816,892 | 404,556 | 194,611 | (10,909 | ) | 3,405,150 | ||||||||||||||||||||||||||||
Inter-segment | (42,530 | ) | (4,371 | ) | (1,882 | ) | 48,783 | — | (41,499 | ) | (1,751 | ) | (2,523 | ) | 45,773 | — | ||||||||||||||||||||||||
|
|
|
|
|
|
|
|
|
|
|
|
|
|
|
|
|
|
|
| |||||||||||||||||||||
Total income | 3,057,672 | 624,189 | 210,402 | 40,567 | 3,932,830 | 2,775,393 | 402,805 | 192,088 | 34,864 | 3,405,150 | ||||||||||||||||||||||||||||||
|
|
|
|
|
|
|
|
|
|
|
|
|
|
|
|
|
|
|
| |||||||||||||||||||||
Extracts of results | ||||||||||||||||||||||||||||||||||||||||
Interest and similar income | 2,146,363 | 169,747 | 99,837 | (10,404 | ) | 2,405,543 | 1,931,000 | 134,449 | 81,348 | (18,023 | ) | 2,128,774 | ||||||||||||||||||||||||||||
Interest and similar expenses | (614,011 | ) | (1,350 | ) | (43,204 | ) | 756 | (657,809 | ) | (532,904 | ) | (1,243 | ) | (34,533 | ) | 1,917 | (566,763 | ) | ||||||||||||||||||||||
|
|
|
|
|
|
|
|
|
|
|
|
|
|
|
|
|
|
|
| |||||||||||||||||||||
Net interest and similar income | 1,532,352 | 168,397 | 56,633 | (9,648 | ) | 1,747,734 | 1,398,096 | 133,206 | 46,815 | (16,106 | ) | 1,562,011 | ||||||||||||||||||||||||||||
|
|
|
|
|
|
|
|
|
|
|
|
|
|
|
|
|
|
|
| |||||||||||||||||||||
Provision for loan losses, net of recoveries | (377,242 | ) | — | — | — | (377,242 | ) | (400,753 | ) | — | — | — | (400,753 | ) | ||||||||||||||||||||||||||
|
|
|
|
|
|
|
|
|
|
|
|
|
|
|
|
|
|
|
| |||||||||||||||||||||
Net interest and similar income after provision for loan losses | 1,155,110 | 168,397 | 56,633 | (9,648 | ) | 1,370,492 | 997,343 | 133,206 | 46,815 | (16,106 | ) | 1,161,258 | ||||||||||||||||||||||||||||
|
|
|
|
|
|
|
|
|
|
|
|
|
|
|
|
|
|
|
| |||||||||||||||||||||
Fee income from financial services, net | 574,662 | (1,679 | ) | 78,514 | (29,474 | ) | 622,023 | 625,843 | (996 | ) | 61,417 | (14,751 | ) | 671,513 | ||||||||||||||||||||||||||
Other income | 379,176 | 196,746 | 33,933 | 31,663 | 641,518 | 260,049 | 184,169 | 51,846 | 21,865 | 517,929 | ||||||||||||||||||||||||||||||
Total premiums earned less claims and benefits | — | 89,938 | — | — | 89,938 | — | (60,544 | ) | — | — | (60,544 | ) | ||||||||||||||||||||||||||||
Depreciation and amortization | (90,942 | ) | (2,464 | ) | (2,880 | ) | (137 | ) | (96,423 | ) | (81,304 | ) | (1,881 | ) | (2,522 | ) | (550 | ) | (86,257 | ) | ||||||||||||||||||||
Other expenses | (1,134,911 | ) | (163,970 | ) | (59,518 | ) | (16,307 | ) | (1,374,706 | ) | (1,045,139 | ) | (102,392 | ) | (57,331 | ) | (27,202 | ) | (1,232,064 | ) | ||||||||||||||||||||
|
|
|
|
|
|
|
|
|
|
|
|
|
|
|
|
|
|
|
| |||||||||||||||||||||
Income before translation result and income tax | 883,095 | 286,968 | 106,682 | (23,903 | ) | 1,252,842 | 756,792 | 151,562 | 100,225 | (36,744 | ) | 971,835 | ||||||||||||||||||||||||||||
Translation result | (21,122 | ) | (5,275 | ) | 3,367 | 10,553 | (12,477 | ) | 9,559 | (1,287 | ) | (251 | ) | (1,503 | ) | 6,518 | ||||||||||||||||||||||||
Income tax | (246,962 | ) | (137 | ) | (712 | ) | (17,945 | ) | (265,756 | ) | (197,913 | ) | (303 | ) | (694 | ) | (14,462 | ) | (213,372 | ) | ||||||||||||||||||||
|
|
|
|
|
|
|
|
|
|
|
|
|
|
|
|
|
|
|
| |||||||||||||||||||||
Profit for the year | 615,011 | 281,556 | 109,337 | (31,295 | ) | 974,609 | 568,438 | 149,972 | 99,280 | (52,709 | ) | 764,981 | ||||||||||||||||||||||||||||
|
|
|
|
|
|
|
|
|
|
|
|
|
|
|
|
|
|
|
| |||||||||||||||||||||
Attributable to: | ||||||||||||||||||||||||||||||||||||||||
Equity holders of the Group | 615,011 | 281,482 | 109,337 | (35,655 | ) | 970,175 | 568,438 | 149,904 | 99,280 | (56,736 | ) | 760,886 | ||||||||||||||||||||||||||||
Attributable to non-controlling interest | — | 74 | — | 4,360 | 4,434 | — | 68 | — | 4,027 | 4,095 | ||||||||||||||||||||||||||||||
|
|
|
|
|
|
|
|
|
|
|
|
|
|
|
|
|
|
|
| |||||||||||||||||||||
| 615,011 | 281,556 | 109,337 | (31,295 | ) | 974,609 | 568,438 | 149,972 | 99,280 | (52,709 | ) | 764,981 | |||||||||||||||||||||||||||||
|
|
|
|
|
|
|
|
|
|
|
|
|
|
|
|
|
|
|
| |||||||||||||||||||||
| (*) | Correspond to interest and similar income, other income and net premiums earned |
F-87
Table of Contents
Notes to the combined financial statements(continued)
| 2013 | ||||||||||||||||||||
| Banking | Insurance | Wealth Management | Corporate and eliminations | Total Combined | ||||||||||||||||
| S/.(000) | S/.(000) | S/.(000) | S/.(000) | S/.(000) | ||||||||||||||||
Capital expenditures (*) | 98,794 | 74,292 | 91,146 | — | 264,232 | |||||||||||||||
Total assets | 29,872,998 | 3,870,084 | 2,718,713 | (282,639 | ) | 36,179,156 | ||||||||||||||
Total liabilities | 27,068,117 | 3,328,947 | 2,265,009 | (195,363 | ) | 32,466,710 | ||||||||||||||
Impairment loss on available-for-sale investments | — | (14,080 | ) | — | — | (14,080 | ) | |||||||||||||
| 2012 | ||||||||||||||||||||
| Banking | Insurance | Wealth Management | Corporate and eliminations | Total Combined | ||||||||||||||||
| S/.(000) | S/.(000) | S/.(000) | S/.(000) | S/.(000) | ||||||||||||||||
Capital expenditures (*) | 122,675 | 108,325 | 4,415 | — | 235,415 | |||||||||||||||
Total assets | 23,805,931 | 3,512,289 | 2,244,236 | (88,907 | ) | 29,473,549 | ||||||||||||||
Total liabilities | 21,258,961 | 2,807,425 | 1,873,582 | (85,720 | ) | 25,854,248 | ||||||||||||||
Impairment loss on available-for-sale investments | — | — | (7,119 | ) | — | (7,119 | ) | |||||||||||||
| 01.01.2012 | ||||||||||||||||||||
| Banking | Insurance | Wealth Management | Corporate and eliminations | Total Combined | ||||||||||||||||
| S/.(000) | S/.(000) | S/.(000) | S/.(000) | S/.(000) | ||||||||||||||||
Total assets | 20,122,755 | 3,052,096 | 1,900,448 | (67,930 | ) | 25,007,369 | ||||||||||||||
Total liabilities | 17,996,023 | 2,564,841 | 1,594,122 | (82,091 | ) | 22,072,895 | ||||||||||||||
| (*) | Includes the purchase of property, furniture and equipment, intangible assets and investment property. |
| (ii) | The distribution of the Group’s total income based on the location of the customer and its assets, for the year ended 31, December 2013 is S/.3,722,428,000 in Peru and S/.210,402,000 in Panama (for the year ended 31, December 2012 is S/.3,213,062,000 in Peru and S/.192,088,000 in Panama). The distribution of the Group’s total assets based on the location of the customer and its assets, as of December 31, 2013 is S/.33,460,443,000 in Peru and S/.2,718,713,000 in Panama (S/.27,229,313,000 in Peru and S/.2,244,236,000 in Panama as of December 31, 2012; and S/.23,106,921,000 in Peru and S/1,900,448,000 in Panama as of January 1, 2012). |
F-88
Table of Contents
Notes to the combined financial statements(continued)
| 28. | Financial instruments classification |
Following are presented the carrying amounts of financial assets and liabilities captions in the combined statements of financial position, classified by category in accordance with IAS 39 “Financial Instruments”:
| As of December 31, 2013 | ||||||||||||||||||||
| Financial assets at fair value through profit or loss held for trading or hedging | Loans and receivables | Investment available-for- sale | Financial liabilities at amortized cost | Total | ||||||||||||||||
| S/.(000) | S/.(000) | S/.(000) | S/.(000) | S/.(000) | ||||||||||||||||
Financial Assets | ||||||||||||||||||||
Cash and due from banks | — | 7,401,096 | — | — | 7,401,096 | |||||||||||||||
Inter-bank funds | — | 204,905 | — | — | 204,905 | |||||||||||||||
Trading securities | 126,692 | — | — | — | 126,692 | |||||||||||||||
Investments available-for-sale, net | — | — | 5,550,994 | — | 5,550,994 | |||||||||||||||
Loans, net | — | 20,467,161 | — | — | 20,467,161 | |||||||||||||||
Due from customers on acceptances | — | 22,310 | — | — | 22,310 | |||||||||||||||
Accounts receivables and other assets, net | 125,816 | 339,801 | — | — | 465,617 | |||||||||||||||
|
|
|
|
|
|
|
|
|
| |||||||||||
| 252,508 | 28,435,273 | 5,550,994 | — | 34,238,775 | ||||||||||||||||
|
|
|
|
|
|
|
|
|
| |||||||||||
Financial liabilities | ||||||||||||||||||||
Deposits and obligations | — | — | — | 22,067,459 | 22,067,459 | |||||||||||||||
Inter-bank funds | — | — | — | 100,022 | 100,022 | |||||||||||||||
Due to banks and correspondents | — | — | — | 2,762,116 | 2,762,116 | |||||||||||||||
Bonds, notes and other obligations | — | — | — | 3,424,955 | 3,424,955 | |||||||||||||||
Due from customers on acceptances | — | — | — | 22,310 | 22,310 | |||||||||||||||
Insurance contract liabilities | — | — | — | 3,137,183 | 3,137,183 | |||||||||||||||
Accounts payables, provision and other liabilities | 159,269 | — | — | 698,846 | 858,115 | |||||||||||||||
|
|
|
|
|
|
|
|
|
| |||||||||||
| 159,269 | — | — | 32,212,891 | 32,372,160 | ||||||||||||||||
|
|
|
|
|
|
|
|
|
| |||||||||||
F-89
Table of Contents
Notes to the combined financial statements(continued)
| As of December 31, 2012 | ||||||||||||||||||||
| Financial assets at fair value through profit or loss held for trading or hedging | Loans and receivables | Investment available-for- sale | Financial liabilities at amortized cost | Total | ||||||||||||||||
| S/.(000) | S/.(000) | S/.(000) | S/.(000) | S/.(000) | ||||||||||||||||
Financial Assets | ||||||||||||||||||||
Cash and due from banks | — | 5,589,299 | — | — | 5,589,299 | |||||||||||||||
Inter-bank funds | — | 192,026 | — | — | 192,026 | |||||||||||||||
Trading securities | 144,744 | — | — | — | 144,744 | |||||||||||||||
Investments available-for-sale, net | — | — | 5,227,467 | — | 5,227,467 | |||||||||||||||
Loans, net | — | 16,122,360 | — | — | 16,122,360 | |||||||||||||||
Due from customers on acceptances | — | 88,070 | — | — | 88,070 | |||||||||||||||
Accounts receivables and other assets, net | 57,015 | 248,092 | — | — | 305,107 | |||||||||||||||
|
|
|
|
|
|
|
|
|
| |||||||||||
| 201,759 | 22,239,847 | 5,227,467 | — | 27,669,073 | ||||||||||||||||
|
|
|
|
|
|
|
|
|
| |||||||||||
Financial liabilities | ||||||||||||||||||||
Deposits and obligations | — | — | — | 16,138,609 | 16,138,609 | |||||||||||||||
Inter-bank funds | — | — | — | 9,310 | 9,310 | |||||||||||||||
Due to banks and correspondents | — | — | — | 2,879,430 | 2,879,430 | |||||||||||||||
Bonds, notes and other obligations | — | — | — | 3,177,073 | 3,177,073 | |||||||||||||||
Due from customers on acceptances | — | — | — | 88,070 | 88,070 | |||||||||||||||
Insurance contract liabilities | — | — | — | 2,694,508 | 2,694,508 | |||||||||||||||
Accounts payables, provision and other liabilities | 80,231 | — | — | 676,639 | 756,870 | |||||||||||||||
|
|
|
|
|
|
|
|
|
| |||||||||||
| 80,231 | — | — | 25,663,639 | 25,743,870 | ||||||||||||||||
|
|
|
|
|
|
|
|
|
| |||||||||||
| As of January 1, 2012 | ||||||||||||||||||||
| Financial assets at fair value through profit or loss held for trading or hedging | Loans and receivables | Investment available-for- sale | Financial liabilities at amortized cost | Total | ||||||||||||||||
| S/.(000) | S/.(000) | S/.(000) | S/.(000) | S/.(000) | ||||||||||||||||
Financial Assets | ||||||||||||||||||||
Cash and due from banks | — | 2,510,592 | — | — | 2,510,592 | |||||||||||||||
Inter-bank funds | — | 34,421 | — | — | 34,421 | |||||||||||||||
Trading securities | 221,305 | — | — | — | 221,305 | |||||||||||||||
Investments available-for-sale, net | — | — | 5,676,853 | — | 5,676,853 | |||||||||||||||
Loans, net | — | 14,501,830 | — | — | 14,501,830 | |||||||||||||||
Due from customers on acceptances | — | 19,853 | — | — | 19,853 | |||||||||||||||
Accounts receivables and other assets, net | 32,731 | 231,656 | — | — | 264,387 | |||||||||||||||
|
|
|
|
|
|
|
|
|
| |||||||||||
| 254,036 | 17,298,352 | 5,676,853 | — | 23,229,241 | ||||||||||||||||
|
|
|
|
|
|
|
|
|
| |||||||||||
Financial liabilities | ||||||||||||||||||||
Deposits and obligations | — | — | — | 14,599,326 | 14,599,326 | |||||||||||||||
Inter-bank funds | — | — | — | 7,002 | 7,002 | |||||||||||||||
Due to banks and correspondents | — | — | — | 1,704,864 | 1,704,864 | |||||||||||||||
Bonds, notes and other obligations | — | — | — | 2,639,603 | 2,639,603 | |||||||||||||||
Due from customers on acceptances | — | — | — | 19,853 | 19,853 | |||||||||||||||
Insurance contract liabilities | — | — | — | 2,426,838 | 2,426,838 | |||||||||||||||
Accounts payables, provision and other liabilities | 68,254 | 515,811 | 584,065 | |||||||||||||||||
|
|
|
|
|
|
|
|
|
| |||||||||||
| 68,254 | — | — | 21,913,297 | 21,981,551 | ||||||||||||||||
|
|
|
|
|
|
|
|
|
| |||||||||||
F-90
Table of Contents
Notes to the combined financial statements(continued)
| 29. | Financial risk management |
It comprises the management of the main risks that the Group is exposed to because of the nature of its operations: credit risk, market risk, liquidity risk and insurance. Unless otherwise noted, descriptions apply to both IFS Group and Inteligo Group.
| • | Credit risk: probability of loss due to inability or lack of willingness to pay of the debtors, counterparts or third parties bound to comply with their contractual obligations. |
| • | Market risk: probability of losses in positions on and off-balance sheets derived from variations in market conditions. It generally includes the following risk types: exchange rate, fair value by interest rate type and price, among others. |
| • | Liquidity risk: probability of loss due to noncompliance with the requirements of financing and fund application that arise from imbalances of cash flows. |
| • | Insurance risk: probability of losses due to inadequate processes, personnel and information technologies failures, or external events. |
In order to manage said risks, every Group Subsidiary has a specialized structure and organization in the management, measurement, mitigation and coverage processes that considers the specific needs and regulatory requirements to develop their business. The Group (IFS and Inteligo) and its Subsidiaries, mainly Interbank, Interseguro and Inteligo Bank operate independently but in coordination with the general provisions issued by the Board and management of IFS Group.
| (a) | Structure and organization of risk management - |
The structure and organization of risk management of IFS and its Subsidiaries is as follows:
| (i) | Interbank - |
Board of Directors
Interbank’s Board of Directors is responsible of establishing an appropriate and integral risk management and of promoting an internal environment that facilitates its control. The Board is continuously informed about the exposure degree of the diverse risks managed by Interbank.
The Board has created several specialized committees to which it has delegated specific tasks in order to enhance risk management and internal control.
Audit Committee
The Audit Committee’s main purpose is to monitor the appropriateness of the processes of accounting and financial reporting, as well as to evaluate the activities performed by the auditors, both internal and external. The Committee is comprised of three members of the Board and also can have the participation of the General Manager, the Internal Auditor, the Manager of Legal Affairs and other executives, when required. The Committee meets at least six times a year in ordinary sessions and submits to the Board a copy of its minutes, thus making known the most relevant issues discussed.
Risk Management Committee
The Risk Management Committee (“GIR”, by its Spanish acronym) is responsible of approving the policies and organization for the comprehensive risk management, as well as the amendments to said policies. This Committee defines the level of tolerance and the exposure degree to risk that
F-91
Table of Contents
Notes to the combined financial statements(continued)
Interbank is willing to assume in its business and also decides the necessary actions aimed at implementing the required corrective measures in case of deviations from the levels of tolerance to risk. It is comprised of two members of the Board, the General Manager, the Vice-Presidents and the Manager of Legal Affairs. The Committee reports monthly to the Board of Directors the main issues it has discussed and the agreements adopted in the previous meeting.
Assets and Liabilities Committee
The Assets and Liabilities Committee (“ALCO”) main purpose is to manage the structure of the Bank’s financial position, in function of its profitability and risk targets. The ALCO is also responsible for the proposal of new products or operations that contain components of market risk. Likewise, it is the communications channel with the units that generate market risk. The ALCO meets monthly and is comprised of the General Management, the Vice-President of Risks, the Vice-President of Commercial, the Vice-President of Finance and Capital Markets and the Manager of Markets.
Internal Audit Division
Risk management processes throughout Interbank are monitored by the internal audit function, which examines both the adequacy of the procedures and the compliance with them. Internal Audit discusses the results of all assessments with Management and reports its findings and recommendations to the Audit Committee and Board of Directors.
| (ii) | Interseguro - |
Board of Directors
The Board of Directors is responsible for the overall approach to risk management and is responsible for the adoption of policies and strategies currently in use. The Board of Directors provides principles for overall risk management, as well as policies covering specific areas, such as foreign exchange risk, interest rate risk, credit risk and the use of derivative and non-derivative financial instruments.
Investment Risk Unit
This unit is responsible for implementing the strategy aimed at mitigating investment and financial risks; as well as to establish the general principles, policies and limits for different types of financial and real estate risks and the monitoring thereof.
Internal Audit Division
Risk management processes throughout Interseguro are monitored by the internal audit function, which examines both the adequacy of the procedures and the compliance of them. Internal Audit discusses the results of all assessments with Management and reports its finding and recommendations to the Audit Committee and Board of Directors.
The structure and organization of risk management of Inteligo Group main Subsidiary is a following:
Inteligo Bank -
Inteligo Bank’s Board of Directors is responsible for the establishment and monitoring of the risk administration policies instruments. In order to manage and monitor the various risks Inteligo Bank is exposed to, the Board of Directors has created the Credit and Investment Committee, the Assets and Liabilities Committee, the Credit Risk Committee and the Audit Committee. These committees are engaged in managing these risks and in making periodic reviews.
F-92
Table of Contents
Notes to the combined financial statements(continued)
| (b) | Risk measurement and reporting systems - |
The Group uses different models and rating tools. These tools measure and value the risk with a prospective vision, thus allowing the making of better risk decisions in the different stages or life cycle of each loan, client or product level.
Said tools are permanently monitored and periodically validated in order to assure that the levels of prediction and performance are being maintained and to make the corrective actions or adjustments to the models, when needed.
| (c) | Risk mitigation and risk coverage - |
In order to mitigate its exposure and provide it with adequate risk coverage, the Group has established a series of measures, among which the following stand out:
| • | policies, procedures, methodologies, models and parameters aimed to allow the identification, measurement, control and reporting of risk; |
| • | review and assessment of credit risk through specialized units of risk screening; |
| • | timely monitoring and tracking of risk and its maintenance within a defined tolerance level; and |
| • | compliance with regulatory limits and establishment of internal limits for exposure concentrations. |
Likewise, as part of the comprehensive risk management, in certain circumstances the Group uses derivative financial instruments to mitigate the risk exposure which arises from the variations in interest rates and exchange rates.
The Group actively uses collateral to reduce its credit risks.
| (d) | Risk concentration - |
Through its policies and procedures, the Group has established the patterns and mechanisms needed to prevent excessive risk concentration as well as to allow a diversified portfolio. In case any concentration risk is identified, the Group works with specialized units whose aim is to control and manage said risks.
| 29.1 | Credit risk |
| (a) | The Group opts for a credit risk policy that ensures sustained and profitable growth in all its products. In doing so, it applies assessment procedures for the adequate decision-making, tools and methodologies that allow the identification, measurement, mitigation and control of the different risks in the most efficient manner. Likewise, the Group develops management models that allow an adequate measurement, quantification and monitoring of the loans granted by each business unit and also encouraging the continuous improvement of its policies, tools, methodologies and processes. |
| (b) | The Group takes on exposure to credit risk, which is the risk that counterparty causes a financial loss by failing to discharge an obligation. Credit risk is the most important risk for the Group’s business; therefore, Management carefully manages its exposure to credit risk. Credit exposures arise principally in lending activities that lead to loans and investment activities that bring debt securities and other bills into the Group’s asset portfolio. There is also credit risk in off-balance sheet financial instruments, such as contingent credits (indirect loans), which expose the Group to similar risks to loans (direct loans); they are both mitigated by the same control processes and policies. Likewise, credit risk arising from derivative financial instruments is, at any time, limited to those with positive fair values, as recorded in the combined statements of financial position. |
F-93
Table of Contents
Notes to the combined financial statements(continued)
Impairment provisions are provided for losses that have been incurred at the date of the combined statements of financial position. Significant changes in the economy or in the particular situation of an industry segment that represents a concentration in the Group’s portfolio could result in losses that are different from those provided for at the date of the combined statements of financial position.
The Group structures the levels of credit risk it undertakes by placing limits on the amount of risk accepted in relation to one borrower or groups of borrowers and to geographical and industry segments. Such risks are monitored on a revolving basis and subject to frequent reviews.
The Group’s exposure to credit risk is managed through the regular assessment of the debtors and potential debtors ability to comply with the interests and principal payments of their obligations and through the change in the loan limits when appropriate. Some other specific control and mitigation measures are outlined below:
| (i) | Collateral |
The exposure to credit risk is also partly managed through personal and corporate collateral; nevertheless there is a significant part of the loans upon which collateral cannot be obtained.
Policies and procedures for its management and valuation -
The Group has policies and guidelines established for the management of collateral received for loans granted. Assets that guarantee loan operations bear a certain value prior to the loan approval and the procedures for their updating are described in internal Manuals.
In order to manage guarantees, the Group operates specialized divisions on the establishment, management and release of guarantees.
Types of collateral -
Collateral that backs loan operations include different goods and property and financial instruments (including cash and securities); their preferential status depends on the following conditions:
| • | Easy convertibility into cash. |
| • | Proper legal documentation, duly registered at the corresponding public records. |
| • | Do not present previous obligations that could reduce their value. |
| • | Their fair value is updated. |
Collateral held as security for financial assets other than loans is determined by the nature of the instrument. Debt securities, treasury and other eligible bills are generally unsecured, with the exception of asset-backed securities and similar instruments, which are secured by portfolios of financial instruments.
Management monitors the market value of collateral, requests additional collateral in accordance with the underlying agreement and monitors the market value of collateral obtained during its review of the adequacy of the allowance for impairment losses. It is the Group’s policy to dispose of repossessed properties in an orderly manner. The proceeds are used to reduce or repay the outstanding claim. In general, the Group does not use repossessed properties for its own business.
F-94
Table of Contents
Notes to the combined financial statements(continued)
| (ii) | Derivatives |
The Group maintains strict control limits on net open derivative positions (for example, the difference between purchase and sale contracts), by both amount and term. The amount subject to credit risk is limited to the current fair value of instruments that are favorable to the Group (for example, an asset when fair value is positive), which in relation to derivatives is only a small fraction of the contract, or notional amount used to express the volume of instruments outstanding. This credit risk exposure is managed as part of the overall lending limits with customers, together with potential exposures from market movements. Collateral or other security is not usually obtained for credit risk exposures on these instruments.
Settlement risk arises in any situation where a payment in cash, securities or equity is made in the expectation of a corresponding receipt in cash, securities or equity. Daily settlement limits are established for each counterparty in order to cover the aggregate of all settlement risk arising from the Group’s market transactions on any single day.
| (iii) | Credit-related commitments |
The primary purpose of these instruments is to ensure that funds are available to a customer as required. Guarantees and standby letters of credit have the same credit risk as loans. Documentary and commercial letters of credit - which are written undertakings by the Group on behalf of a customer authorizing a third party to draw drafts on the Group up to a stipulated amount under specific terms and conditions - are collateralized by the underlying shipments of goods to which they relate and therefore have less risk than a direct loan. The Group has no mandatory commitments to extend credit.
| (c) | Maximum exposure to credit risk - |
As of December 31, 2013 and 2012 and as of January 1, 2012, Management estimates that the maximum credit risk to which the Group is exposed is represented by the book value of the financial assets which show a potential credit risk and consist mostly of deposits in banks, investments, loans (direct and indirect; without considering the fair value of the collateral received) derivative financial instruments transactions, receivables from insurance transactions and other monetary assets. The exposure for any borrower, including banks and investments, is further structured by sub-limits covering on and off-balance sheet exposures (contingent account) and risk limits for trading items such as forward foreign exchange contracts. Actual exposure against limits is frequency monitored.
In that sense, as of December 31, 2013 and 2012 and as of January 1, 2012:
| • | 79.7 percent, 90.4 percent and 86.8 percent, respectively, of the cash and due from banks represent amounts deposited in the Group’s vaults or in the BCRP; |
| • | 96.0 percent, 95.5 percent and 95.6 percent, respectively, of the loan portfolio are classified into the two upper credit risk categories defined by the Group; |
| • | 91.7 percent, 91.8 percent and 92.8 percent, respectively, of the loan portfolio is deemed non-past-due and non-impaired; and |
| • | 72.8 percent, 61.2 percent and 64.0 percent, respectively, of available-for-sale-investments are rated investment grade (BBB- or higher) or are debt instruments issued by the BCRP or the Peruvian Government. |
| • | 97 percent, 99 percent and 99 percent, of the accounts receivable from insurance premiums and leases of investments property is deemed non past-due and non impaired. |
F-95
Table of Contents
Notes to the combined financial statements(continued)
| (d) | Credit risk management for loan placements - |
The Group classifies its loan portfolio into one of five risk categories, depending upon the degree of risk of non-payment of each debtor. The categories used are: (i) normal - A, (ii) potential problems - B, (iii) substandard - C, (iv) doubtful - D and (v) loss - E, which have the following characteristics:
Normal (Class A): Debtors of commercial loans that fall into this category have complied on a timely basis with their obligations and at the time of evaluation do not present any reason for doubt with respect to repayment of interest and principal on the agreed dates and there is no reason to believe that the status will change before the next evaluation. To place a loan in Class A, a clear understanding of the use to be made of the funds and the origin of the cash flows to be used by the debtor to repay the loan is required. Consumer and micro-business loans are categorized as Class A if payments are current or up to 8 days past-due. Residential mortgage loans warrant Class A classification if payments are current or up to 30 days past-due.
Potential problems (Class B): Debtors of commercial loans included in this category are those that at the time of the evaluation demonstrate certain deficiencies, which, if not corrected on a timely manner, imply risks with respect to the recovery of the loan. Certain common characteristics of loans or credits in the category include: delays in loan payments which are promptly covered, a general lack of information required to analyze the credit, out-of-date financial information, temporary economic or financial imbalances on the part of the debtor which could affect its ability to repay the loan and market conditions that could affect the economic sector in which the debtor is active. Consumer and micro-business loans are categorized as Class B if payments are between 9 and 30 days late. Residential mortgage loans become Class B when payments are between 31 and 60 days late.
Substandard (Class C): Debtors of commercial loans included in this category demonstrate serious financial weakness, often with operating results or available income insufficient to cover financial obligations on agreed upon terms, with no reasonable short-term prospects for a strengthening of their financial capacity. Debtors demonstrating the same deficiencies that warrant classification as category B warrant classification as Class C if those deficiencies are such that if they are not corrected in the near term, they could impede the recovery of principal and interest on the loan on the originally agreed terms. In addition, commercial loans are classified in this category when payments are between 61 and 120 days late. Consumer and micro-business loans are categorized as Class C if payments are between 31 and 60 days late. Residential mortgage loans are classified as Class C when payments are between 61 and 120 days late.
Doubtful (Class D): Debtors of commercial loans included in this category present characteristics that make doubtful the recovery of the loan. Although the loan recovery is doubtful, if there is a reasonable possibility that in the near future the creditworthiness of the debtor might improve, a Class D categorization is appropriate. These credits are distinguished from Class E credits by the requirement that the debtor remain in operation, generate cash flow and make payments on the loan, although at a rate less than that specified in its contractual obligations. In addition, commercial loans are classified in this category when payments are between 121 and 365 days late. Consumer and micro-business loans are categorized as Class D if payments are between 61 and 120 days late. Residential mortgage loans are Class D when payments are between 121 and 365 days late.
Loss (Class E): Commercial loans which are considered unrecoverable or which for any other reason should not appear on the Group’s books as an asset based on the originally contracted terms fall into this category. In addition, commercial loans are classified in this category when
F-96
Table of Contents
Notes to the combined financial statements(continued)
payments are more than 365 days late. Consumer and micro-business loans are categorized as Class E if payments are more than 120 days late. Residential mortgage loans are Class E when payments are more than 365 days late.
The Group reviews its loan portfolio on a continuing basis in order to assess the completeness and accuracy of its classifications.
All loans considered impaired (the ones classified as substandard, doubtful or loss) are analyzed by the Group’s Management, which addresses impairment in two areas: individually assessed allowance and collectively assessed allowance, as follows:
| - | Individually assessed allowance - |
The Group determines the appropriate allowance for each individually significant loan or advance on an individual basis. Items considered when determining allowance amounts include the sustainability of the counterparty’s business plan, its ability to improve its performance once a financial difficulty has arisen, projected cash flows and the expected payout should bankruptcy happens, the availability of other financial support, including the realizable value of collateral and the timing of the expected cash flows.
The methodology and assumptions used for estimating future cash flows are reviewed regularly by the Group in order to reduce any differences between loss estimates and actual loss experience.
| - | Collectively assessed allowance - |
Allowance requirements are assessed collectively for losses on loans and advances that are not individually significant (including consumer, micro-business and residential mortgages) and for individually significant loans and advances where there is not yet objective evidence of individual impairment (included in categories A and B).
The collective assessment takes account of impairment that is likely to be present in the portfolio even though there is not yet objective evidence of the impairment in an individual assessment. Impairment losses are estimated by taking into consideration the following information: historical losses on the portfolio, current economic conditions, the approximate delay between the time a loss is likely to have been incurred and the time it will be identified as requiring an individually assessed impairment allowance and expected receipts and recoveries once impaired. Management is responsible for deciding the length of this period which can extend for as long as one year. The impairment allowance is then reviewed by Management to ensure alignment with the Group’s overall policy.
The methodology includes three estimation scenarios: base, upper threshold and lower threshold. These scenarios are generated by modifying some assumptions, such as collateral recovery values and adverse effects due to changes in the political and economic environments. The process to select the best estimate within the range is based on Management´s best judgment, complemented by historical loss experience and the Group’s strategy (e.g. penetration in new segments).
Impairment losses are evaluated at each reporting date as to whether there is any objective evidence that a financial asset or group of assets is impaired.
Financial guarantees and letter of credit (indirect loans) are assessed and a provision estimated following a similar procedure as for loans.
F-97
Table of Contents
Notes to the combined financial statements(continued)
When a loan is uncollectible, it is written off against the related provision for loan impairment. Such loans are written off after all the necessary legal procedures have been completed. Subsequent recoveries of amounts previously written off decrease the amount of the provision for loan impairment in the combined statements of income.
The table below presents three groups of direct loans: (i) Non-past-due and non-impaired loans, which comprise direct loans that currently do not present delinquency characteristics and are related to clients classified as “Normal” and “with Potential problems”; (ii) Past-due but non impaired loans, which comprise past-due loans of clients classified as “Normal” or “with Potential problems”; and (iii) impaired loans, those past-due loans classified as “Substandard”, “Doubtful” or “Loss”. Also, it is presented the allowance for loan loss for each loan type.
| As of December 31, 2013 | ||||||||||||||||||||||||
| Commercial loans | Mortgage loans | Consumer loans | Micro-business loans | Total | % | |||||||||||||||||||
| S/.(000) | S/.(000) | S/.(000) | S/.(000) | S/.(000) | ||||||||||||||||||||
Neither past-due nor impaired | ||||||||||||||||||||||||
Normal | 10,229,133 | 3,143,320 | 5,157,763 | 489,438 | 19,019,654 | 93 | ||||||||||||||||||
Potential problems | 119,010 | 25,957 | 47,928 | 4,536 | 197,431 | 1 | ||||||||||||||||||
|
|
|
|
|
|
|
|
|
| |||||||||||||||
| 10,348,143 | 3,169,277 | 5,205,691 | 493,974 | 19,217,085 | ||||||||||||||||||||
|
|
|
|
|
|
|
|
|
| |||||||||||||||
Past-due but not impaired | ||||||||||||||||||||||||
Normal | 198,192 | 356,114 | 14,097 | 13,570 | 581,973 | 3 | ||||||||||||||||||
Potential problems | 55,352 | 68,083 | 175,032 | 12,514 | 310,981 | 2 | ||||||||||||||||||
|
|
|
|
|
|
|
|
|
| |||||||||||||||
| 253,544 | 424,197 | 189,129 | 26,084 | 892,954 | ||||||||||||||||||||
Impaired | ||||||||||||||||||||||||
Substandard | 26,426 | 55,722 | 130,223 | 6,645 | 219,016 | 1 | ||||||||||||||||||
Doubtful | 27,837 | 48,112 | 255,778 | 6,738 | 338,465 | 2 | ||||||||||||||||||
Loss | 32,540 | 48,100 | 179,301 | 19,734 | 279,675 | 2 | ||||||||||||||||||
|
|
|
|
|
|
|
|
|
| |||||||||||||||
| 86,803 | 151,934 | 565,302 | 33,117 | 837,156 | ||||||||||||||||||||
|
|
|
|
|
|
|
|
|
| |||||||||||||||
Total loan portfolio gross | 10,688,490 | 3,745,408 | 5,960,122 | 553,175 | 20,947,195 | 104 | ||||||||||||||||||
|
|
|
|
|
|
|
|
|
| |||||||||||||||
Less: Allowance for loan losses | 100,194 | 24,132 | 510,854 | 59,195 | 694,375 | 4 | ||||||||||||||||||
|
|
|
|
|
|
|
|
|
| |||||||||||||||
Total, net | 10,588,296 | 3,721,276 | 5,449,268 | 493,980 | 20,252,820 | 100 | ||||||||||||||||||
|
|
|
|
|
|
|
|
|
| |||||||||||||||
F-98
Table of Contents
Notes to the combined financial statements(continued)
| As of December 31, 2012 | ||||||||||||||||||||||||
| Commercial loans | Mortgage loans | Consumer loans | Micro-business loans | Total | % | |||||||||||||||||||
| S/.(000) | S/.(000) | S/.(000) | S/.(000) | S/.(000) | ||||||||||||||||||||
Neither past-due nor impaired | ||||||||||||||||||||||||
Normal | 7,545,183 | 2,522,594 | 4,406,966 | 478,957 | 14,953,700 | 94 | ||||||||||||||||||
Potential problems | 138,355 | 26,133 | 49,950 | 3,247 | 217,685 | 1 | ||||||||||||||||||
|
|
|
|
|
|
|
|
|
| |||||||||||||||
| 7,683,538 | 2,548,727 | 4,456,916 | 482,204 | 15,171,385 | ||||||||||||||||||||
|
|
|
|
|
|
|
|
|
| |||||||||||||||
Past-due but not impaired | ||||||||||||||||||||||||
Normal | 53,249 | 295,430 | 6,526 | 11,755 | 366,960 | 2 | ||||||||||||||||||
Potential problems | 4,888 | 48,923 | 185,594 | 8,488 | 247,893 | 2 | ||||||||||||||||||
|
|
|
|
|
|
|
|
|
| |||||||||||||||
| 58,137 | 344,353 | 192,120 | 20,243 | 614,853 | ||||||||||||||||||||
|
|
|
|
|
|
|
|
|
| |||||||||||||||
Impaired | ||||||||||||||||||||||||
Substandard | 23,529 | 29,643 | 135,361 | 6,018 | 194,551 | 1 | ||||||||||||||||||
Doubtful | 19,978 | 29,815 | 266,484 | 5,302 | 321,579 | 2 | ||||||||||||||||||
Loss | 18,924 | 35,758 | 161,629 | 17,220 | 233,531 | 2 | ||||||||||||||||||
|
|
|
|
|
|
|
|
|
| |||||||||||||||
| 62,431 | 95,216 | 563,474 | 28,540 | 749,661 | ||||||||||||||||||||
|
|
|
|
|
|
|
|
|
| |||||||||||||||
Total loan portfolio, gross | 7,804,106 | 2,988,296 | 5,212,510 | 530,987 | 16,535,899 | 104 | ||||||||||||||||||
|
|
|
|
|
|
|
|
|
| |||||||||||||||
Less: Allowance for loan losses | 78,224 | 14,788 | 449,247 | 46,373 | 588,632 | 4 | ||||||||||||||||||
|
|
|
|
|
|
|
|
|
| |||||||||||||||
Total, net | 7,725,882 | 2,973,508 | 4,763,263 | 484,614 | 15,947,267 | 100 | ||||||||||||||||||
|
|
|
|
|
|
|
|
|
| |||||||||||||||
F-99
Table of Contents
Notes to the combined financial statements(continued)
| As of January 1, 2012 | ||||||||||||||||||||||||
| Commercial loans | Mortgage loans | Consumer loans | Micro-business loans | Total | % | |||||||||||||||||||
| S/.(000) | S/.(000) | S/.(000) | S/.(000) | S/.(000) | ||||||||||||||||||||
Neither past-due nor impaired | ||||||||||||||||||||||||
Normal | 6,716,544 | 2,083,469 | 4,215,077 | 453,980 | 13,469,070 | 94 | ||||||||||||||||||
Potential problems | 220,006 | 25,186 | 48,927 | 2,652 | 296,771 | 2 | ||||||||||||||||||
|
|
|
|
|
|
|
|
|
| |||||||||||||||
| 6,936,550 | 2,108,655 | 4,264,004 | 456,632 | 13,765,841 | ||||||||||||||||||||
|
|
|
|
|
|
|
|
|
| |||||||||||||||
Past-due but not impaired | ||||||||||||||||||||||||
Normal | 55,732 | 135,707 | 2,536 | 10,060 | 204,035 | 2 | ||||||||||||||||||
Potential problems | 1,185 | 19,953 | 183,307 | 9,649 | 214,094 | 2 | ||||||||||||||||||
|
|
|
|
|
|
|
|
|
| |||||||||||||||
| 56,917 | 155,660 | 185,843 | 19,709 | 418,129 | ||||||||||||||||||||
|
|
|
|
|
|
|
|
|
| |||||||||||||||
Impaired | ||||||||||||||||||||||||
Substandard | 37,674 | 17,456 | 129,797 | 5,785 | 190,712 | 1 | ||||||||||||||||||
Doubtful | 23,563 | 17,304 | 230,288 | 6,125 | 277,280 | 2 | ||||||||||||||||||
Loss | 19,820 | 34,007 | 118,327 | 17,849 | 190,003 | 1 | ||||||||||||||||||
|
|
|
|
|
|
|
|
|
| |||||||||||||||
| 81,057 | 68,767 | 478,412 | 29,759 | 657,995 | ||||||||||||||||||||
|
|
|
|
|
|
|
|
|
| |||||||||||||||
Total loan portfolio, gross | 7,074,524 | 2,333,082 | 4,928,259 | 506,100 | 14,841,965 | 104 | ||||||||||||||||||
|
|
|
|
|
|
|
|
|
| |||||||||||||||
Less: Provision for loan losses | 78,040 | 9,550 | 369,270 | 43,513 | 500,373 | 4 | ||||||||||||||||||
|
|
|
|
|
|
|
|
|
| |||||||||||||||
Total, net | 6,996,484 | 2,323,532 | 4,558,989 | 462,587 | 14,341,592 | 100 | ||||||||||||||||||
|
|
|
|
|
|
|
|
|
| |||||||||||||||
In accordance with IFRS 7, the entire loan balance is considered past-due when debtors have failed to make a payment when contractually due.
As of December 31, 2013 and 2012 and as of January 1, 2012 loans amounting to approximately S/.892,955, S/614,853 and S/418,129, respectively, were not impaired and were past-due principally for less than 30 days.
As of December 31, 2013 and 2012 and as of January 1, 2012, the refinanced loans (current, past-due and under legal collection) amount to S/.144,363,000, S/.119,748,000 and S/.98,099,000, respectively, out of which S/.16,897,000, S/.13,745,000 and S/.11,347,000, respectively, are classified as non-past-due and non-impaired; S/.2,859,000, S/.1,901,000 and S/.1,734,000, are past-due but non - impaired and S/.124,607,000, S/.104,102,000 and S/.85,018,000, are substandard, respectively.
Following is the detail of the gross amount of impaired loans by loan type, along with the estimated fair value of the related collateral and the amounts of the allowance for loan losses:
| As of December 31, 2013 | ||||||||||||||||||||
| Impaired loans | Commercial loans | Mortgage loans | Consumer loans | Micro-business loans | Total | |||||||||||||||
| S/.(000) | S/.(000) | S/.(000) | S/.(000) | S/.(000) | ||||||||||||||||
Impaired loans | 86,803 | 151,934 | 565,302 | 33,117 | 837,156 | |||||||||||||||
|
|
|
|
|
|
|
|
|
| |||||||||||
Fair value of collateral | 43,338 | 144,457 | 18,454 | 12,611 | 218,860 | |||||||||||||||
|
|
|
|
|
|
|
|
|
| |||||||||||
Allowance for loan losses | 52,353 | 18,171 | 234,938 | 30,758 | 336,220 | |||||||||||||||
|
|
|
|
|
|
|
|
|
| |||||||||||
F-100
Table of Contents
Notes to the combined financial statements(continued)
| As of December 31, 2012 | ||||||||||||||||||||
| Impaired loans | Commercial loans | Mortgage loans | Consumer loans | Micro-business loans | Total | |||||||||||||||
| S/.(000) | S/.(000) | S/.(000) | S/.(000) | S/.(000) | ||||||||||||||||
Impaired loans | 62,431 | 95,216 | 563,474 | 28,540 | 749,661 | |||||||||||||||
|
|
|
|
|
|
|
|
|
| |||||||||||
Fair value of collateral | 35,764 | 82,936 | 14,587 | 5,336 | 138,623 | |||||||||||||||
|
|
|
|
|
|
|
|
|
| |||||||||||
Allowance for loan losses | 41,245 | 9,679 | 231,994 | 22,360 | 305,278 | |||||||||||||||
|
|
|
|
|
|
|
|
|
| |||||||||||
| As of January 1, 2012 | ||||||||||||||||||||
| Impaired loans | Commercial loans | Mortgage loans | Consumer loans | Micro-business loans | Total | |||||||||||||||
| S/.(000) | S/.(000) | S/.(000) | S/.(000) | S/.(000) | ||||||||||||||||
Impaired loans | 81,057 | 68,767 | 478,412 | 29,759 | 657,995 | |||||||||||||||
|
|
|
|
|
|
|
|
|
| |||||||||||
Fair value of collateral | 48,183 | 66,919 | 6,495 | 5,936 | 127,533 | |||||||||||||||
|
|
|
|
|
|
|
|
|
| |||||||||||
Allowance for loan losses | 45,555 | 5,911 | 174,945 | 21,168 | 247,579 | |||||||||||||||
|
|
|
|
|
|
|
|
|
| |||||||||||
| (e) | Credit risk management in investment available-for-sale - |
The Group controls the credit risk of its investments based on the risk assessment of issuers and instruments. In the case of investments abroad, the assessment takes into account the ratings issued by international agencies, as well as the country-risk of the issuer’s country, which is assessed considering its main macroeconomic variables. In the case of Peruvian investments, it considers the ratings issued locally and, being the case, internal analysis of the issuer’s financial position.
F-101
Table of Contents
Notes to the combined financial statements(continued)
The table below presents the risk classification of available-for-sale investments:
| As of December 31, 2013 | As of December 31, 2012 | As of January 1, 2012 | ||||||||||||||||||||||
| S/.(000) | % | S/.(000) | % | S/.(000) | % | |||||||||||||||||||
Instruments issued and rated in Peru: | ||||||||||||||||||||||||
AAA | 791,286 | 14.3 | 724,189 | 13.9 | 594,016 | 10.5 | ||||||||||||||||||
AA- a AA+ | 271,936 | 4.9 | 200,130 | 3.8 | 61,615 | 1.1 | ||||||||||||||||||
A- a A+ | 8,869 | 0.2 | 10,075 | 0.2 | 6,973 | 0.1 | ||||||||||||||||||
BBB- a BBB+ | 778,308 | 14.0 | 663,893 | 12.7 | 320,739 | 5.6 | ||||||||||||||||||
BB- BB+ | 232,110 | 4.1 | 152,100 | 2.9 | 314,361 | 5.5 | ||||||||||||||||||
|
|
|
|
|
|
|
|
|
|
|
| |||||||||||||
| 2,082,509 | 37.5 | 1,750,387 | 33.5 | 1,297,704 | 22.8 | |||||||||||||||||||
|
|
|
|
|
|
|
|
|
|
|
| |||||||||||||
Instruments issued in Peru and rated abroad: | ||||||||||||||||||||||||
AAA | 11,389 | 0.2 | — | — | 29,331 | 0.5 | ||||||||||||||||||
AA- a AA+ | 5,693 | 0.1 | 10,180 | 0.2 | 14,470 | 0.3 | ||||||||||||||||||
BBB- a BBB+ | 422,926 | 7.6 | 155,431 | 3.0 | 273,583 | 4.8 | ||||||||||||||||||
BB- a BB+ | 70,333 | 1.3 | 131,515 | 2.5 | 7,080 | 0.1 | ||||||||||||||||||
B- a B+ | 5,157 | 0.1 | — | — | — | — | ||||||||||||||||||
|
|
|
|
|
|
|
|
|
|
|
| |||||||||||||
| 515,498 | 9.3 | 297,126 | 5.7 | 324,464 | 5.7 | |||||||||||||||||||
|
|
|
|
|
|
|
|
|
|
|
| |||||||||||||
Instruments issued and rated abroad: | ||||||||||||||||||||||||
AAA | 75 | — | 39,201 | 0.7 | 81,837 | 1.4 | ||||||||||||||||||
AA- a AA+ | 201,486 | 3.6 | 67,891 | 1.3 | 75,761 | 1.3 | ||||||||||||||||||
A- A+ | 110,702 | 2.0 | 65,767 | 1.3 | 84,136 | 1.5 | ||||||||||||||||||
BBB- a BBB+ | 665,381 | 12.0 | 632,383 | 12.1 | 593,596 | 10.5 | ||||||||||||||||||
BB- a BB+ | 149,054 | 2.7 | 413,899 | 7.9 | 684,574 | 12.1 | ||||||||||||||||||
B- B+ | 56,370 | 1.0 | 77,592 | 1.5 | — | — | ||||||||||||||||||
Lower than a B- | 58,587 | 1.1 | 5,685 | 0.1 | — | — | ||||||||||||||||||
|
|
|
|
|
|
|
|
|
|
|
| |||||||||||||
| 1,241,655 | 22.4 | 1,302,418 | 24.9 | 1,519,904 | 26.8 | |||||||||||||||||||
|
|
|
|
|
|
|
|
|
|
|
| |||||||||||||
Unrated | ||||||||||||||||||||||||
BCRP Certificates of Deposit | 772,003 | 13.9 | 628,999 | 12.0 | 1,499,221 | 26.4 | ||||||||||||||||||
Mutual funds and investments participations (*) | 371,042 | 6.7 | 312,779 | 6.0 | 349,692 | 6.2 | ||||||||||||||||||
Otros | 6,511 | 0.1 | 11,549 | 0.2 | 9,472 | 0.2 | ||||||||||||||||||
Listed Shares | ||||||||||||||||||||||||
Peruvian private and foreign sector | 256,143 | 4.6 | 242,721 | 4.6 | 241,516 | 4.3 | ||||||||||||||||||
Inretail Peru Corp. | 126,022 | 2.3 | 201,943 | 3.9 | — | — | ||||||||||||||||||
Non listed shares and participations | ||||||||||||||||||||||||
Royalty Pharma | 127,960 | 2.3 | 446,083 | 8.6 | 398,106 | 7.0 | ||||||||||||||||||
Others | 7 | — | 6 | — | — | — | ||||||||||||||||||
|
|
|
|
|
|
|
|
|
|
|
| |||||||||||||
Total | 5,499,350 | 99.1 | 5,194,011 | 99.4 | 5,640,079 | 99.4 | ||||||||||||||||||
|
|
|
|
|
|
|
|
|
|
|
| |||||||||||||
Accrued interests (**) | 51,644 | 0.9 | 33,456 | 0.6 | 36,774 | 0.6 | ||||||||||||||||||
|
|
|
|
|
|
|
|
|
|
|
| |||||||||||||
Total | 5,550,994 | 100.0 | 5,227,467 | 100.0 | 5,676,853 | 100.0 | ||||||||||||||||||
|
|
|
|
|
|
|
|
|
|
|
| |||||||||||||
| (*) | It includes mutual and investments funds which do not have a risk classification. |
| (**) | It mainly corresponds to interest of investment available-for-sale which are rated investment grade (BBB-or higher). |
F-102
Table of Contents
Notes to the combined financial statements(continued)
| (f) | Financial instruments exposed to credit risk |
Financial instruments exposed to credit risk were distributed according to the following economic sectors:
| As of December 31, 2013 | ||||||||||||||||
| At fair value through profit or loss | Loans and receivables | Available-for-sale investments | Total | |||||||||||||
| S/.(000) | S/.(000) | S/.(000) | S/.(000) | |||||||||||||
Financial services | 135,780 | 9,100,012 | 1,260,079 | 10,495,871 | ||||||||||||
Consumer loans | — | 5,960,121 | — | 5,960,121 | ||||||||||||
Mortgage loans | — | 3,745,408 | — | 3,745,408 | ||||||||||||
Manufacturing | 22,204 | 2,497,753 | 135,177 | 2,655,134 | ||||||||||||
Commerce | 9,554 | 1,949,288 | 143,505 | 2,102,347 | ||||||||||||
Leaseholds and real estate activities | — | 941,199 | — | 941,199 | ||||||||||||
Agriculture | 30,400 | 920,475 | 7,565 | 958,440 | ||||||||||||
Communication, storage and transportation | 2,178 | 813,591 | 254,727 | 1,070,496 | ||||||||||||
Construction | 5,309 | 630,857 | 210,452 | 846,618 | ||||||||||||
Electricity, gas, water and oil | 8,726 | 422,661 | 645,147 | 1,076,534 | ||||||||||||
Mining | 6,894 | 382,723 | 425,432 | 815,049 | ||||||||||||
Community services | — | 329,348 | — | 329,348 | ||||||||||||
Fishing | 3,358 | 116,397 | 8,355 | 128,110 | ||||||||||||
Education, health and other services | 7,827 | 92,333 | 21,443 | 121,603 | ||||||||||||
Insurance | — | 74,651 | — | 74,651 | ||||||||||||
Public administration and defense | 16,306 | 18,990 | 47,857 | 83,153 | ||||||||||||
National Government | — | — | 1,906,927 | 1,906,927 | ||||||||||||
Foreign Government | — | — | 177,661 | 177,661 | ||||||||||||
Medical and biotechnology | — | — | 127,960 | 127,960 | ||||||||||||
Other | 3,972 | 919,500 | 127,063 | 1,050,535 | ||||||||||||
|
|
|
|
|
|
|
| |||||||||
Total | 252,508 | 28,915,307 | 5,499,350 | 34,667,165 | ||||||||||||
|
|
|
|
|
|
|
| |||||||||
Allowance for loan losses | (694,375 | ) | ||||||||||||||
Accrued interest | 265,985 | |||||||||||||||
|
| |||||||||||||||
Total | 34,238,775 | |||||||||||||||
|
| |||||||||||||||
F-103
Table of Contents
Notes to the combined financial statements(continued)
| As of December 31, 2012 | ||||||||||||||||
| At fair value through profit or loss | Loans and receivables | Available-for-sale investments | Total | |||||||||||||
| S/.(000) | S/.(000) | S/.(000) | S/.(000) | |||||||||||||
Financial services | 153,873 | 6,880,092 | 1,240,765 | 8,274,730 | ||||||||||||
Consumer loans | — | 5,212,510 | — | 5,212,510 | ||||||||||||
Mortgage loans | — | 2,988,297 | — | 2,988,297 | ||||||||||||
Manufacturing | 2,478 | 1,935,658 | 103,965 | 2,042,101 | ||||||||||||
Commerce | 288 | 1,672,131 | 272,520 | 1,944,939 | ||||||||||||
Leaseholds and real estate activities | 534 | 614,615 | 43,540 | 658,689 | ||||||||||||
Agriculture | 1,281 | 605,843 | 10,042 | 617,166 | ||||||||||||
Communication, storage and transportation | 505 | 524,206 | 289,940 | 814,651 | ||||||||||||
Construction | 316 | 470,587 | 184,568 | 655,471 | ||||||||||||
Mining | 5,074 | 372,726 | 397,974 | 775,774 | ||||||||||||
Electricity, gas, water and oil | 2,694 | 290,426 | 596,798 | 889,918 | ||||||||||||
Community services | — | 289,629 | 1,011 | 290,640 | ||||||||||||
Fishing | 148 | 105,702 | 2,917 | 108,767 | ||||||||||||
Education, health and other services | 772 | 59,671 | 28,109 | 88,552 | ||||||||||||
Insurance | — | 21,231 | 5,845 | 27,076 | ||||||||||||
Public administration and defense | 32,858 | 4,844 | 105,526 | 143,228 | ||||||||||||
National Government | — | — | 1,306,207 | 1,306,207 | ||||||||||||
Foreign Government | — | — | 65,041 | 65,041 | ||||||||||||
Medical and biotechnology | — | — | 446,083 | 446,083 | ||||||||||||
Other | 938 | 605,218 | 93,160 | 699,316 | ||||||||||||
|
|
|
|
|
|
|
| |||||||||
Total | 201,759 | 22,653,386 | 5,194,011 | 28,049,156 | ||||||||||||
|
|
|
|
|
|
|
| |||||||||
Allowance for loan losses | (588,632 | ) | ||||||||||||||
Accrued interest | 208,549 | |||||||||||||||
|
| |||||||||||||||
Total | 27,669,073 | |||||||||||||||
|
| |||||||||||||||
F-104
Table of Contents
Notes to the combined financial statements(continued)
| As of January 1, 2012 | ||||||||||||||||
| At fair value through profit or loss | Loans and receivables | Available-for-sale investments | Total | |||||||||||||
| S/.(000) | S/.(000) | S/.(000) | S/.(000) | |||||||||||||
Consumer loans | — | 4,928,259 | — | 4,928,259 | ||||||||||||
Financial services | 229,782 | 3,533,356 | 1,328,128 | 5,091,266 | ||||||||||||
Mortgage loans | — | 2,333,082 | — | 2,333,082 | ||||||||||||
Manufacturing | 937 | 1,964,900 | 138,959 | 2,104,796 | ||||||||||||
Commerce | — | 1,334,170 | — | 1,334,170 | ||||||||||||
Agriculture | — | 616,033 | 6,083 | 622,116 | ||||||||||||
Leaseholds and real estate activities | 6,010 | 454,651 | 69,680 | 530,341 | ||||||||||||
Communication, storage and transportation | — | 414,103 | 226,632 | 640,735 | ||||||||||||
Mining | 967 | 356,118 | 390,738 | 747,823 | ||||||||||||
Construction | — | 333,448 | 31,400 | 364,848 | ||||||||||||
Community services | — | 300,576 | — | 300,576 | ||||||||||||
Electricity, gas, water and oil | 10 | 221,786 | 509,950 | 731,746 | ||||||||||||
Fishing | — | 167,766 | 7,739 | 175,505 | ||||||||||||
Education, health and other services | — | 46,568 | 1,078 | 47,646 | ||||||||||||
Insurance | — | 20,204 | — | 20,204 | ||||||||||||
Public administration and defense | 16,075 | 6,044 | 268,298 | 290,417 | ||||||||||||
National Government | — | — | 2,133,337 | 2,133,337 | ||||||||||||
Foreign Government | — | — | 129,951 | 129,951 | ||||||||||||
Medical and biotechnology | — | — | 398,106 | 398,106 | ||||||||||||
Other | 255 | 607,423 | — | 607,678 | ||||||||||||
|
|
|
|
|
|
|
| |||||||||
Total | 254,036 | 17,638,487 | 5,640,079 | 23,532,602 | ||||||||||||
|
|
|
|
|
|
|
| |||||||||
Allowance for loan losses | (500,373 | ) | ||||||||||||||
Accrued interest | 197,012 | |||||||||||||||
|
| |||||||||||||||
Total | 23,229,241 | |||||||||||||||
|
| |||||||||||||||
F-105
Table of Contents
Notes to the combined financial statements(continued)
Financial instruments exposed to credit risk according to geographic area are the following:
| As of December 31, 2013 | ||||||||||||||||
| At fair value through profit or loss | Loans and receivables | Available-for-sale investments | Total | |||||||||||||
| S/.(000) | S/.(000) | S/.(000) | S/.(000) | |||||||||||||
Peru | 162,431 | 26,891,952 | 3,575,604 | 30,629,987 | ||||||||||||
United States of America | 11,168 | 827,680 | 631,563 | 1,470,411 | ||||||||||||
Panama | 890 | 332,891 | 128,213 | 461,994 | ||||||||||||
Chile | 400 | 70,912 | 145,668 | 216,980 | ||||||||||||
Mexico | 7,076 | 1,073 | 45,368 | 53,517 | ||||||||||||
Brazil | 6,903 | 239 | 310,629 | 317,771 | ||||||||||||
Colombia | 7,875 | — | 64,082 | 71,957 | ||||||||||||
Ireland | — | — | 130,763 | 130,763 | ||||||||||||
Supranational | — | — | 60,113 | 60,113 | ||||||||||||
Others | 55,765 | 790,560 | 407,347 | 1,253,672 | ||||||||||||
|
|
|
|
|
|
|
| |||||||||
Total | 252,508 | 28,915,307 | 5,499,350 | 34,667,165 | ||||||||||||
|
|
|
|
|
|
|
| |||||||||
Allowance for loan losses | (694,375 | ) | ||||||||||||||
Accrued interest | 265,985 | |||||||||||||||
|
| |||||||||||||||
Total | 34,238,775 | |||||||||||||||
|
| |||||||||||||||
| As of December 31, 2012 | ||||||||||||||||
| At fair value through profit or loss | Loans and receivables | Available-for-sale investments | Total | |||||||||||||
| S/.(000) | S/.(000) | S/.(000) | S/.(000) | |||||||||||||
Peru | 33,152 | 21,658,370 | 2,858,338 | 24,549,860 | ||||||||||||
United States of America | 58,531 | 368,147 | 810,754 | 1,237,432 | ||||||||||||
Panama | 534 | 348,019 | 228,730 | 577,283 | ||||||||||||
Chile | — | 25,884 | 137,678 | 163,562 | ||||||||||||
Brazil | 12,891 | 962 | 231,481 | 245,334 | ||||||||||||
Mexico | — | 173 | 66,122 | 66,295 | ||||||||||||
Colombia | 8,056 | 162 | 24,704 | 32,922 | ||||||||||||
Ireland | — | — | 448,520 | 448,520 | ||||||||||||
Supranational | — | — | 64,409 | 64,409 | ||||||||||||
Others | 88,595 | 251,669 | 323,275 | 663,539 | ||||||||||||
|
|
|
|
|
|
|
| |||||||||
Total | 201,759 | 22,653,386 | 5,194,011 | 28,049,156 | ||||||||||||
|
|
|
|
|
|
|
| |||||||||
Allowance for loan losses | (588,632 | ) | ||||||||||||||
Accrued interest | 208,549 | |||||||||||||||
|
| |||||||||||||||
Total | 27,669,073 | |||||||||||||||
|
| |||||||||||||||
F-106
Table of Contents
Notes to the combined financial statements(continued)
| As of January 1, 2012 | ||||||||||||||||
| At fair value through profit or loss | Loans and receivables | Available-for-sale investments | Total | |||||||||||||
| S/.(000) | S/.(000) | S/.(000) | S/.(000) | |||||||||||||
Peru | 36,196 | 16,867,153 | 3,418,594 | 20,321,943 | ||||||||||||
Panama | 1,077 | 285,805 | 16,097 | 302,979 | ||||||||||||
United States of America | 77,056 | 219,967 | 844,461 | 1,141,484 | ||||||||||||
Chile | 7,983 | 58,981 | 143,982 | 210,946 | ||||||||||||
Brazil | — | 32,031 | 248,602 | 280,633 | ||||||||||||
Mexico | — | 507 | 46,905 | 47,412 | ||||||||||||
Colombia | — | 206 | 52,598 | 52,804 | ||||||||||||
Ireland | — | — | 398,106 | 398,106 | ||||||||||||
Supranational | — | — | 68,996 | 68,996 | ||||||||||||
Others | 131,724 | 173,837 | 401,738 | 707,299 | ||||||||||||
|
|
|
|
|
|
|
| |||||||||
Total | 254,036 | 17,638,487 | 5,640,079 | 23,532,602 | ||||||||||||
|
|
|
|
|
|
|
| |||||||||
Allowance for loan losses | (500,373 | ) | ||||||||||||||
Accrued interest | 197,012 | |||||||||||||||
|
| |||||||||||||||
Total | 23,229,241 | |||||||||||||||
|
| |||||||||||||||
| (g) | Offsetting financial assets and liabilities |
The disclosures set out in the tables below include financial assets and liabilities that:
| • | are offset in the Group statement of financial position; or |
| • | are subject to an enforceable master netting arrangement or similar agreement that covers similar financial statements, irrespective of whether they are offset in the statement of financial position. |
Similar arrangements of the Group include derivatives clearing agreements. Financial instruments such as loans and deposits are not described in the following tables unless they are offset in the statement of financial position.
The offsetting framework agreement issued by the International Swaps and Derivatives Association Inc. (“ISDA”) and similar master netting arrangements do not meet the criteria for offsetting in the statement of financial position because of such agreements were created in order for both parties to have an enforceable offsetting right in cases of default, insolvency or bankruptcy of the Group or the counterparties or following other predetermined events. In addition, the Group and its counterparties do not intend to settle such instruments on a net basis or to realize the assets and settle the liabilities simultaneously.
The Group receives and gives collateral in the form of cash in respect of derivatives transactions.
F-107
Table of Contents
Notes to the combined financial statements(continued)
Financial asset subject to offsetting, enforceable master netting arrangement and similar agreement:
| As of December 31, 2013 | ||||||||||||||||||||||||
| Related amounts not offset in the combined statement of financial position | ||||||||||||||||||||||||
| Description | Gross amounts of recognized financial assets | Gross amounts of recognized financial liabilities and offset in the consolidated statement of financial position | Net amounts of financial assets presented in the consolidated statement of financial position | Financial instruments non-cash collateral) | Cash collateral received | Net amount | ||||||||||||||||||
| S/.(000) | S/.(000) | S/.(000) | S/.(000) | S/.(000) | S/.(000) | |||||||||||||||||||
Derivatives, Note 9(e) | 125,816 | — | 125,816 | (6,755 | ) | — | 119,061 | |||||||||||||||||
|
|
|
|
|
|
|
|
|
|
|
| |||||||||||||
Total | 125,816 | — | 125,816 | (6,755 | ) | — | 119,061 | |||||||||||||||||
|
|
|
|
|
|
|
|
|
|
|
| |||||||||||||
| As of December 31, 2012 | ||||||||||||||||||||||||
| Related amounts not offset in the combined statement of financial position | ||||||||||||||||||||||||
| Description | Gross amounts of recognized financial assets | Gross amounts of recognized financial liabilities and offset in the consolidated statement of financial position | Net amounts of financial assets presented in the consolidated statement of financial position | Financial instruments (including non-cash collateral) | Cash collateral received | Net amount | ||||||||||||||||||
| S/.(000) | S/.(000) | S/.(000) | S/.(000) | S/.(000) | S/.(000) | |||||||||||||||||||
Derivatives, Note 9(e) | 57,015 | — | 57,015 | (5,615 | ) | — | 51,400 | |||||||||||||||||
|
|
|
|
|
|
|
|
|
|
|
| |||||||||||||
Total | 57,015 | — | 57,015 | (5,615 | ) | — | 51,400 | |||||||||||||||||
|
|
|
|
|
|
|
|
|
|
|
| |||||||||||||
| 01.01.2012 | ||||||||||||||||||||||||
| Related amounts not offset in the combined statement of financial position | ||||||||||||||||||||||||
| Description | Gross amounts of recognized financial assets | Gross amounts of recognized financial liabilities and offset in the consolidated statement of financial position | Net amounts of financial assets presented in the consolidated statement of financial position | Financial instruments (including non-cash collateral) | Cash collateral received | Net amount | ||||||||||||||||||
| S/.(000) | S/.(000) | S/.(000) | S/.(000) | S/.(000) | S/.(000) | |||||||||||||||||||
Derivatives, Note 9(e) | 32,731 | — | 32,731 | (3,073 | ) | — | 29,658 | |||||||||||||||||
|
|
|
|
|
|
|
|
|
|
|
| |||||||||||||
Total | 32,731 | — | 32,731 | (3,073 | ) | — | 29,658 | |||||||||||||||||
|
|
|
|
|
|
|
|
|
|
|
| |||||||||||||
Financial liability subject to offsetting, enforceable master netting arrangement and similar agreement:
| As of December 31, 2013 | ||||||||||||||||||||||||
| Related amounts not offset in the combined statement of financial position | ||||||||||||||||||||||||
| Description | Gross amounts of recognized financial liabilities | Gross amounts of recognized financial assets and offset in the statement of financial position | Net amounts of financial liabilities presented in the statement of financial position | Financial instruments (including non-cash collateral) | Cash collateral pledged | Net amount | ||||||||||||||||||
| S/.(000) | S/.(000) | S/.(000) | S/.(000) | S/.(000) | S/.(000) | |||||||||||||||||||
Derivatives, Note 9(e) | 159,269 | — | 159,269 | (6,755 | ) | (145,792 | ) | 6,722 | ||||||||||||||||
|
|
|
|
|
|
|
|
|
|
|
| |||||||||||||
Total | 159,269 | — | 159,269 | (6,755 | ) | (145,792 | ) | 6,722 | ||||||||||||||||
|
|
|
|
|
|
|
|
|
|
|
| |||||||||||||
F-108
Table of Contents
Notes to the combined financial statements(continued)
| As of December 31, 2012 | ||||||||||||||||||||||||
| Related amounts not offset in the combined statement of financial position | ||||||||||||||||||||||||
| Description | Gross amounts of recognized financial liabilities | Gross amounts of recognized financial assets and offset in the statement of financial position | Net amounts of financial liabilities presented in the statement of financial position | Financial instruments (including non-cash collateral) | Cash collateral pledged | Net amount | ||||||||||||||||||
| S/.(000) | S/.(000) | S/.(000) | S/.(000) | S/.(000) | S/.(000) | |||||||||||||||||||
Derivatives, Note 9(e) | 80,231 | — | 80,231 | (5,615 | ) | (39,723 | ) | 34,893 | ||||||||||||||||
|
|
|
|
|
|
|
|
|
|
|
| |||||||||||||
Total | 80,231 | — | 80,231 | (5,615 | ) | (39,723 | ) | 34,893 | ||||||||||||||||
|
|
|
|
|
|
|
|
|
|
|
| |||||||||||||
| 01.01.2012 | ||||||||||||||||||||||||
| Related amounts not offset in the combined statement of financial position | ||||||||||||||||||||||||
| Description | Gross amounts of recognized financial liabilities | Gross amounts of recognized financial assets and offset in the statement of financial position | Net amounts of financial liabilities presented in the statement of financial position | Financial instruments (including non-cash collateral) | Cash collateral pledged | Net amount | ||||||||||||||||||
| S/.(000) | S/.(000) | S/.(000) | S/.(000) | S/.(000) | S/.(000) | |||||||||||||||||||
Derivatives, Note 9(e) | 68,254 | — | 68,254 | (3,073 | ) | (41,694 | ) | 23,487 | ||||||||||||||||
|
|
|
|
|
|
|
|
|
|
|
| |||||||||||||
Total | 68,254 | — | 68,254 | (3,073 | ) | (41,694 | ) | 23,487 | ||||||||||||||||
|
|
|
|
|
|
|
|
|
|
|
| |||||||||||||
| 29.2 | Market risk management |
Market risk is the probability of loss due to variations in financial market conditions. The main variations to which the Group is exposed to are: exchange rates, interest rates and prices. Said variations can affect the value of the Group’s financial assets and liabilities.
The Group separates exposures to market risk into two blocks: Trading Book, which comprises positions in liquid investments; and Banking Book, which comprises banking assets and liabilities inherent to the intermediation business – mainly deposits and loans – whose exposure to market risk arises from the changes in portfolio structural positions.
| (a) | Trading Book |
In order to control and monitor the risks arising from the volatility of risk factors involved within each instrument, it has been established maximum exposure limits by currency, investment type, Value-at-Risk (VaR) and tolerance to expected maximum loss (Stop Loss), which are controlled on a daily basis. Likewise, reports for the GIR and ALCO committees are submitted regularly.
The main technique used to measure and control market risk is VaR, which is a statistical measurement that quantifies the maximum loss expected for the investment portfolio for a period of time and a determined significance level under normal market conditions. The Group uses the Monte Carlo VaR model for a period of one day, with exponential volatility and a 99 percent confidence level. The VaR is calculated through each risk factor: interest rate, exchange rate and investment type: derivatives, fixed income and variable income.
VaR models are designed to measure the market risk within a normal market environment. Those models assume that all modifications in risk factors affecting the use of weighted historical data will follow a normal distribution. Said distribution is calculated through the use of weighted historical data in an exponential manner. Given that VaR is based mainly on historical data to
F-109
Table of Contents
Notes to the combined financial statements(continued)
provide information and does not clearly predict future changes and modifications in risk factors, the probability of big market movements may be underestimated if said changes in risk factors cannot be aligned with the considered normal distribution. VaR can also be under or overestimated due to the hypotheses made on the risk factors and the relation among these factors with the specific instruments. In order to determine the reliability of VaR models, the actual results are regularly monitored to prove the validity of the assumptions and parameters used in the calculation of VaR.
The Group includes within the VaR calculation the potential loss that may arise from the exposure to exchange risk. This risk is included in the calculation because the exchange position is the result of the spot position plus the position in derivative products. Likewise, the total VaR includes the diversification effect that arises as result of the interaction of diverse market risk factors to which the IFS and its Subsidiaries are exposed.
The validity of the VaR calculation is proven through a back-testing proof, which uses historical data to ensure that the model adequately estimates the potential losses. Additionally, it is calculated the risk factors sensitivity, which shows the potential portfolio losses in the face of certain fluctuations in factors. Said fluctuations include: interest rate shocks, exchange rate shocks and price shocks.
The VaR results of the Group’s portfolio by asset type are presented in the table below:
| 2013 | 2012 | |||||||
| S/.(000) | S/.(000) | |||||||
Equity investments | 13,801 | 17,106 | ||||||
Debt investments | 1,451 | 3,358 | ||||||
Derivatives | 3,428 | 2,179 | ||||||
Diversification effect | (1,595 | ) | (4,151 | ) | ||||
|
|
|
| |||||
Combined VaR by asset type (*) | 17,085 | 18,492 | ||||||
|
|
|
| |||||
Group’s VaR results by risk type are the following:
| 2013 | 2012 | |||||||
| S/.(000) | S/.(000) | |||||||
Exchange risk | 1,383 | 2,213 | ||||||
Interest rate risk | 2,776 | 3,330 | ||||||
Equity risk | 13,752 | 16,955 | ||||||
Diversification effect | (826 | ) | (4,006 | ) | ||||
|
|
|
| |||||
Combined VaR by risk type (*) | 17,085 | 18,492 | ||||||
|
|
|
| |||||
| (*) | The total VaR is smaller than its components due to the benefits of risk diversification. |
| (b) | Banking Book - |
The Group holds positions that are not actively traded which are part of its assets and liabilities. These positions include all loan placements and funds raised through the Bank’s intermediation business, as well as investments that are not deemed as trading.
| (i) | Interest rate risk |
Interest rates fluctuate permanently on the market. These fluctuations affect the Group in two ways: first, through the change in the valuation of assets and liabilities; and second, affecting the cash flows at repricing. The variation in the valuation of assets and liabilities is
F-110
Table of Contents
Notes to the combined financial statements(continued)
increasingly sensitive as the term at which the asset or liability repricing increases. This process consists of the assessment of the repricing periods. On the other side, cash flows are affected when the instruments reach maturity, given that they are invested or placed at the new market interest rates.
Repricing gap
An analysis of the repricing gaps is performed in order to determine the impact of the interest rates movements. Said analysis consists of assigning the balances of the operations that will change the interest rate into different time gaps. The impact of the variation in the valuation of assets and liabilities on each gap is calculated in function of this analysis.
The following table summarizes the Group’s exposure to interest rate risks. The Group’s financial instruments are presented at book value, classified by the period of the contract’s interest rate repricing or maturity date, whichever occurs first:
| As of December 31, 2013 | ||||||||||||||||||||||||||||
| Up to 1 month | From 1 to 3 months | From 3 to 12 months | From 1 to 5 years | More than 5 years | Non-interest bearing | Total | ||||||||||||||||||||||
| S/.(000) | S/.(000) | S/.(000) | S/.(000) | S/.(000) | S/.(000) | S/.(000) | ||||||||||||||||||||||
Financial Assets | ||||||||||||||||||||||||||||
Cash and due from banks | 5,354,494 | — | — | — | — | 2,046,602 | 7,401,096 | |||||||||||||||||||||
Inter-bank funds | 204,905 | — | — | — | — | — | 204,905 | |||||||||||||||||||||
Investments | 195,105 | 142,303 | 902,202 | 916,702 | 2,521,329 | 1,000,045 | 5,677,686 | |||||||||||||||||||||
Loans, net | 2,557,021 | 2,489,821 | 4,967,857 | 7,276,514 | 3,526,169 | (350,221 | ) | 20,467,161 | ||||||||||||||||||||
Other assets | 50,664 | 39,419 | 6,485 | 19,869 | 58,666 | 2,253,205 | 2,428,308 | |||||||||||||||||||||
|
|
|
|
|
|
|
|
|
|
|
|
|
| |||||||||||||||
Total assets | 8,362,189 | 2,671,543 | 5,876,544 | 8,213,085 | 6,106,164 | 4,949,631 | 36,179,156 | |||||||||||||||||||||
|
|
|
|
|
|
|
|
|
|
|
|
|
| |||||||||||||||
Financial liabilities | ||||||||||||||||||||||||||||
Deposits and obligations | 7,877,265 | 1,411,320 | 3,017,123 | 5,176,774 | 21,292 | 4,563,685 | 22,067,459 | |||||||||||||||||||||
Inter-bank funds | 100,022 | — | — | — | — | — | 100,022 | |||||||||||||||||||||
Due to banks and correspondents | 653,319 | 243,148 | 690,404 | 362,551 | 812,694 | — | 2,762,116 | |||||||||||||||||||||
Bonds, notes and other obligations | 135,458 | 343,868 | 37,710 | 14,124 | 2,893,795 | — | 3,424,955 | |||||||||||||||||||||
Insurance contract liabilities | 20,258 | 40,122 | 180,151 | 840,120 | 2,056,532 | — | 3,137,183 | |||||||||||||||||||||
Other liabilities | 128,560 | 36,792 | 13,633 | 39,556 | 58,849 | 697,585 | 974,975 | |||||||||||||||||||||
Equity | — | — | — | — | — | 3,712,446 | 3,712,446 | |||||||||||||||||||||
|
|
|
|
|
|
|
|
|
|
|
|
|
| |||||||||||||||
Total liabilities and equity | 8,914,882 | 2,075,250 | 3,939,021 | 6,433,125 | 5,843,162 | 8,973,716 | 36,179,156 | |||||||||||||||||||||
|
|
|
|
|
|
|
|
|
|
|
|
|
| |||||||||||||||
Off-balance sheet items | ||||||||||||||||||||||||||||
Derivative assets | 1,694,528 | 2,404,046 | 519,562 | 1,120,611 | 2,584,608 | — | 8,323,355 | |||||||||||||||||||||
Derivative liabilities | 2,385,037 | 2,633,767 | 554,000 | 1,085,774 | 1,664,777 | — | 8,323,355 | |||||||||||||||||||||
|
|
|
|
|
|
|
|
|
|
|
|
|
| |||||||||||||||
| (690,509 | ) | (229,721 | ) | (34,438 | ) | 34,837 | 919,831 | — | — | |||||||||||||||||||
|
|
|
|
|
|
|
|
|
|
|
|
|
| |||||||||||||||
Marginal gap | (1,243,202 | ) | 366,572 | 1,903,085 | 1,814,797 | 1,182,833 | (4,024,085 | ) | — | |||||||||||||||||||
|
|
|
|
|
|
|
|
|
|
|
|
|
| |||||||||||||||
Accumulated gap | (1,243,202 | ) | (876,630 | ) | 1,026,455 | 2,841,252 | 4,024,085 | — | — | |||||||||||||||||||
|
|
|
|
|
|
|
|
|
|
|
|
|
| |||||||||||||||
F-111
Table of Contents
Notes to the combined financial statements(continued)
| As of December 31, 2012 | ||||||||||||||||||||||||||||
| Up to 1 month | From 1 to 3 months | From 3 to 12 months | From 1 to 5 years | More than 5 years | Non-interest bearing | Total | ||||||||||||||||||||||
| S/.(000) | S/.(000) | S/.(000) | S/.(000) | S/.(000) | S/.(000) | S/.(000) | ||||||||||||||||||||||
Financial Assets | ||||||||||||||||||||||||||||
Cash and due from banks | 3,927,192 | — | — | — | 1,662,107 | 5,589,299 | ||||||||||||||||||||||
Inter-bank funds | 192,026 | — | — | — | — | — | 192,026 | |||||||||||||||||||||
Investments | 117,666 | 19,395 | 800,125 | 1,316,784 | 2,275,276 | 842,965 | 5,372,211 | |||||||||||||||||||||
Loans, net | 2,568,535 | 1,882,037 | 3,616,061 | 5,558,345 | 2,793,012 | (295,630 | ) | 16,122,360 | ||||||||||||||||||||
Accounts receivables and other assets, net | 28,595 | 28,233 | 8,967 | 8,762 | 13,339 | 2,109,757 | 2,197,653 | |||||||||||||||||||||
|
|
|
|
|
|
|
|
|
|
|
|
|
| |||||||||||||||
Total assets | 6,834,014 | 1,929,665 | 4,425,153 | 6,883,891 | 5,081,627 | 4,319,199 | 29,473,549 | |||||||||||||||||||||
|
|
|
|
|
|
|
|
|
|
|
|
|
| |||||||||||||||
Financial liabilities | ||||||||||||||||||||||||||||
Deposits and obligations | 5,517,010 | 1,035,104 | 2,478,394 | 4,113,118 | 141 | 2,994,842 | 16,138,609 | |||||||||||||||||||||
Inter-bank funds | 9,310 | — | — | — | — | — | 9,310 | |||||||||||||||||||||
Due to banks and correspondents | 467,739 | 603,063 | 788,333 | 384,381 | 635,914 | — | 2,879,430 | |||||||||||||||||||||
Bonds, notes and other obligations | 127,749 | 595,771 | 75,642 | 14,042 | 2,363,869 | — | 3,177,073 | |||||||||||||||||||||
Insurance contract liabilities | 16,176 | 31,593 | 140,785 | 713,008 | 1,792,946 | — | 2,694,508 | |||||||||||||||||||||
Accounts payables, provision and other liabilities | 101,068 | 17,051 | 19,015 | 41,215 | 2,528 | 774,441 | 955,318 | |||||||||||||||||||||
Equity | — | — | — | — | — | 3,619,301 | 3,619,301 | |||||||||||||||||||||
|
|
|
|
|
|
|
|
|
|
|
|
|
| |||||||||||||||
Total liabilities and equity | 6,239,052 | 2,282,582 | 3,502,169 | 5,265,764 | 4,795,398 | 7,388,584 | 29,473,549 | |||||||||||||||||||||
|
|
|
|
|
|
|
|
|
|
|
|
|
| |||||||||||||||
Off-balance sheet items | ||||||||||||||||||||||||||||
Derivative assets | 1,221,555 | 1,733,034 | 374,543 | 807,828 | 1,863,198 | — | 6,000,158 | |||||||||||||||||||||
Derivative liabilities | 1,719,330 | 1,898,636 | 399,369 | 782,715 | 1,200,108 | — | 6,000,158 | |||||||||||||||||||||
|
|
|
|
|
|
|
|
|
|
|
|
|
| |||||||||||||||
| (497,775 | ) | (165,602 | ) | (24,826 | ) | 25,113 | 663,090 | — | — | |||||||||||||||||||
|
|
|
|
|
|
|
|
|
|
|
|
|
| |||||||||||||||
Marginal gap | 97,187 | (518,519 | ) | 898,158 | 1,643,240 | 949,319 | (3,069,385 | ) | — | |||||||||||||||||||
|
|
|
|
|
|
|
|
|
|
|
|
|
| |||||||||||||||
Accumulated gap | 97,187 | (421,332 | ) | 476,826 | 2,120,066 | 3,069,385 | — | — | ||||||||||||||||||||
|
|
|
|
|
|
|
|
|
|
|
|
|
| |||||||||||||||
F-112
Table of Contents
Notes to the combined financial statements(continued)
| As of January 1, 2012 | ||||||||||||||||||||||||||||
| Up to 1 month | From 1 to 3 months | From 3 to 12 months | From 1 to 5 years | More than 5 years | Non-interest bearing | Total | ||||||||||||||||||||||
| S/.(000) | S/.(000) | S/.(000) | S/.(000) | S/.(000) | S/.(000) | S/.(000) | ||||||||||||||||||||||
Financial Assets | ||||||||||||||||||||||||||||
Cash and due from banks | 1,297,269 | — | — | — | — | 1,213,323 | 2,510,592 | |||||||||||||||||||||
Inter-bank funds | 34,421 | — | — | — | — | — | 34,421 | |||||||||||||||||||||
Investments | 399,369 | 328,600 | 972,336 | 841,209 | 1,951,736 | 1,404,908 | 5,898,158 | |||||||||||||||||||||
Loans, net | 2,763,447 | 1,813,873 | 2,654,188 | 5,273,509 | 2,275,276 | (278,463 | ) | 14,501,830 | ||||||||||||||||||||
Accounts receivables and other assets, net | 19,074 | 5,296 | 6,597 | 6,980 | 5,449 | 2,018,972 | 2,062,368 | |||||||||||||||||||||
|
|
|
|
|
|
|
|
|
|
|
|
|
| |||||||||||||||
Total assets | 4,513,580 | 2,147,769 | 3,633,121 | 6,121,698 | 4,232,461 | 4,358,740 | 25,007,369 | |||||||||||||||||||||
|
|
|
|
|
|
|
|
|
|
|
|
|
| |||||||||||||||
Financial liabilities | ||||||||||||||||||||||||||||
Deposits and obligations | 1,751,564 | 2,094,362 | 4,913,925 | 2,001,158 | 1,265,436 | 2,572,881 | 14,599,326 | |||||||||||||||||||||
Inter-bank funds | 7,002 | — | — | — | — | — | 7,002 | |||||||||||||||||||||
Due to banks and correspondents | 150,787 | 384,467 | 454,504 | 220,981 | 463,530 | 30,595 | 1,704,864 | |||||||||||||||||||||
Bonds, notes and other obligations | 134,840 | 594,514 | 19,484 | 194,575 | 1,696,190 | — | 2,639,603 | |||||||||||||||||||||
Insurance contract liabilities | 14,856 | 28,882 | 125,550 | 622,108 | 1,635,442 | — | 2,426,838 | |||||||||||||||||||||
Accounts payables, provision and other liabilities | 8,488 | 7,948 | 11,124 | 2,466 | 39,985 | 625,251 | 695,262 | |||||||||||||||||||||
Equity | — | — | — | — | — | 2,934,474 | 2,934,474 | |||||||||||||||||||||
|
|
|
|
|
|
|
|
|
|
|
|
|
| |||||||||||||||
Total liabilities and equity | 2,067,537 | 3,110,173 | 5,524,587 | 3,041,288 | 5,100,583 | 6,163,201 | 25,007,369 | |||||||||||||||||||||
|
|
|
|
|
|
|
|
|
|
|
|
|
| |||||||||||||||
Off-balance sheet items | ||||||||||||||||||||||||||||
Derivative assets | 1,008,990 | 1,431,466 | 309,368 | 667,257 | 1,538,979 | — | 4,956,060 | |||||||||||||||||||||
Derivative liabilities | 1,420,146 | 1,568,251 | 329,874 | 646,514 | 991,275 | — | 4,956,060 | |||||||||||||||||||||
|
|
|
|
|
|
|
|
|
|
|
|
|
| |||||||||||||||
| (411,156 | ) | (136,785 | ) | (20,506 | ) | 20,743 | 547,704 | — | — | |||||||||||||||||||
|
|
|
|
|
|
|
|
|
|
|
|
|
| |||||||||||||||
Marginal gap | 2,034,887 | (1,099,189 | ) | (1,911,972 | ) | 3,101,153 | (320,418 | ) | (1,804,461 | ) | — | |||||||||||||||||
|
|
|
|
|
|
|
|
|
|
|
|
|
| |||||||||||||||
Accumulated gap | 2,034,887 | 935,698 | (976,274 | ) | 2,124,879 | 1,804,461 | — | — | ||||||||||||||||||||
|
|
|
|
|
|
|
|
|
|
|
|
|
| |||||||||||||||
Sensitivity to changes in interest rates
The following table presents the sensitivity to a reasonable possible change in interest rates, with all other variables held constant, of the Group’s combined income statements and combined statements of comprehensive incomes; before income tax and non-controlling interest.
In the case of the combined income statement, the calculation reflects the expected variation of the financial margin for a period equivalent to one year. In doing so, it takes into account the current position of revenues and expenses and annualizes the effect of the interest rates variations. The figures express the expected change in the value of assets minus liabilities for various time gaps. Likewise, it includes the effect of the derivative financial instruments that are subject to interest rates.
The fluctuations in interest rates are applied equally all through the yield curve, which means that it considers a parallel move of the curve. The effects are considered independently for each of the two currencies presented. The calculations are based on the interest rate risk regulatory model approved by the SBS in force at the date of the combined statements of financial position. The sensitivities are calculated prior to the Income Tax effect.
F-113
Table of Contents
Notes to the combined financial statements(continued)
The interest rate exposure of Interbank is overseen by the ALCO, as well as the GIR Committee, the latter being in charge of approving the permitted maximum limits. For Interseguro and Inteligo Bank their Boards sets limits, which are monitored by the investment risk unit.
The effects due to estimated changes in interest rates as of December 31, 2013 and 2012, are the following:
| 2013 | ||||||||||||||||||||
| Currency | Changes in basis points | Sensitivity of net income | Sensitivity of comprehensive income | |||||||||||||||||
| S/.(000) | S/.(000) | |||||||||||||||||||
US Dollar | +/-50 | + /- | 9,379 | + /- | 44,593 | |||||||||||||||
US Dollar | +/-75 | + /- | 14,068 | + /- | 69,728 | |||||||||||||||
US Dollar | +/-100 | + /- | 18,757 | + /- | 96,769 | |||||||||||||||
US Dollar | +/-150 | + /- | 28,135 | + /- | 156,653 | |||||||||||||||
Nuevos Soles | +/-50 | - / + | 8,776 | - / + | 47,690 | |||||||||||||||
Nuevos Soles | +/-75 | - / + | 13,164 | - / + | 74,695 | |||||||||||||||
Nuevos Soles | +/-100 | - / + | 17,552 | - / + | 103,830 | |||||||||||||||
Nuevos Soles | +/-150 | - / + | 26,328 | - / + | 168,596 | |||||||||||||||
| 2012 | ||||||||||||
| Currency | Changes in basis points | Sensitivity of net income | Sensitivity of comprehensive income | |||||||||
| S/.(000) | S/.(000) | |||||||||||
US Dollar | +/-50 | 3,812 | 38,071 | |||||||||
US Dollar | +/-75 | 5,717 | 60,247 | |||||||||
US Dollar | +/-100 | 7,622 | 84,534 | |||||||||
US Dollar | +/-150 | 11,434 | 139,533 | |||||||||
Nuevos Soles | +/-50 | 2,355 | 28,972 | |||||||||
Nuevos Soles | +/-75 | 3,533 | 46,258 | |||||||||
Nuevos Soles | +/-100 | 4,710 | 65,434 | |||||||||
Nuevos Soles | +/-150 | 7,065 | 109,548 | |||||||||
The interest rate sensitivities set out in the table above are illustrative only and are based on simplified scenarios. The figures represent the effect of the pro-forma movements in the net interest income based on the projected yield curve scenarios and the Group’s current interest rate risk profile. This effect, however, does not incorporate actions that would be taken by Management to mitigate the impact of this interest rate risk. In addition, the Group seeks proactively to change the interest rate risk profile to minimize losses and optimize net revenues. The projections above also assume that interest rate of all maturities move by the same amount and, therefore, do not reflect the potential impact on net interest income of some rates changing while others remain unchanged. The projections make other simplifying assumptions too, including that all positions run to maturity.
F-114
Table of Contents
Notes to the combined financial statements(continued)
Sensitivity to price variations
Shares and mutual funds and investment are not considered as part of investment securities for interest rate sensitivity calculation purposes; however a 10, 25 and 30 percent of changes in market prices is conducted to these price-sensitive securities and the effect on expected unrealized gain or loss in statements of comprehensive income, before tax, as of December 31, 2013 and 2012 is presented below:
Sensitivity of comprehensive income | ||||||||||||
| Market price sensitivity | Changes in market princes | 2013 | 2012 | |||||||||
| % | S/.(000) | S/.(000) | ||||||||||
Shares | +/-10 | 51,058 | 89,076 | |||||||||
Shares | +/-25 | 127,645 | 222,689 | |||||||||
Shares | +/-30 | 153,173 | 267,227 | |||||||||
Mutual funds and investment | +/-10 | 39,389 | 32,760 | |||||||||
Mutual funds and investment | +/-25 | 98,473 | 81,900 | |||||||||
Mutual funds and investment | +/-30 | 118,168 | 98,280 | |||||||||
| (ii) | Foreign exchange risk- |
The Group is exposed to the effects of fluctuations in the exchange rates of foreign currency prevailing on its financial position and cash flows. The Managements of the Subsidiaries set limits on the levels of exposure by currency and in total “overnight” transactions, which are monitored daily. Most of the assets and liabilities in foreign currency are stated in U.S. dollars. Transactions in foreign currency are accounted for by using exchange rates prevailing on the market.
As of December 31, 2013, the market exchange rate published by the SBS for transactions in US Dollars was S/.2.794 per U.S.$1.00 bid and S/.2.796 per U.S.$1.00 ask (S/.2.549 and S/.2.551 as of December 31, 2012, respectively; S/.2.695 and S/.2.697 as of January 1, 2012, respectively). As of December 31, 2013, the exchange rate for the accounting of asset and liability accounts in foreign currency set by the SBS was S/.2.795 per U.S.$1.00 (S/.2.550 as of December 31, 2012 and S/.2.696 as of January 1, 2012).
F-115
Table of Contents
Notes to the combined financial statements(continued)
The table below presents a detail of the Group currency position:
| As of December 31, 2013 | As of December 31, 2012 | As of January 1, 2012 | ||||||||||||||||||||||||||||||||||||||||||||||
| U.S. Dollars | Nuevos soles | Other currency | Total | U.S. Dollars | Nuevos soles | Other currency | Total | U.S. Dollars | Nuevos soles | Other currency | Total | |||||||||||||||||||||||||||||||||||||
| S/.(000) | S/.(000) | S/.(000) | S/.(000) | S/.(000) | S/.(000) | S/.(000) | S/.(000) | S/.(000) | S/.(000) | S/.(000) | S/.(000) | |||||||||||||||||||||||||||||||||||||
Assets | ||||||||||||||||||||||||||||||||||||||||||||||||
Cash and due from bank | 5,945,428 | 1,201,689 | 253,979 | 7,401,096 | 2,706,478 | 2,641,548 | 241,273 | 5,589,299 | 1,551,642 | 759,080 | 199,870 | 2,510,592 | ||||||||||||||||||||||||||||||||||||
Inter-bank funds | 69,875 | 135,030 | — | 204,905 | 139,003 | 53,023 | — | 192,026 | 27,418 | 7,003 | — | 34,421 | ||||||||||||||||||||||||||||||||||||
Trading security | 102,758 | 23,934 | — | 126,692 | 141,608 | 3,136 | — | 144,744 | 210,780 | 10,525 | — | 221,305 | ||||||||||||||||||||||||||||||||||||
Investment available-for-sale | 3,248,251 | 2,258,384 | 44,359 | 5,550,994 | 3,322,996 | 1,879,380 | 25,091 | 5,227,467 | 3,285,796 | 2,330,161 | 60,896 | 5,676,853 | ||||||||||||||||||||||||||||||||||||
Loans, net | 9,041,462 | 11,425,699 | — | 20,467,161 | 7,766,516 | 8,355,844 | — | 16,122,360 | 7,184,195 | 7,317,635 | — | 14,501,830 | ||||||||||||||||||||||||||||||||||||
Due from customers on acceptances | 22,310 | — | — | 22,310 | 88,070 | — | — | 88,070 | 19,853 | — | — | 19,853 | ||||||||||||||||||||||||||||||||||||
Accounts receivables and other assets, net | 134,417 | 327,570 | 3,630 | 465,617 | 39,135 | 194,510 | 71,462 | 305,107 | 158,466 | 105,911 | 10 | 264,387 | ||||||||||||||||||||||||||||||||||||
|
|
|
|
|
|
|
|
|
|
|
|
|
|
|
|
|
|
|
|
|
|
|
| |||||||||||||||||||||||||
| 18,564,501 | 15,372,306 | 301,968 | 34,238,775 | 14,203,806 | 13,127,441 | 337,826 | 27,669,073 | 12,438,150 | 10,530,315 | 260,776 | 23,229,241 | |||||||||||||||||||||||||||||||||||||
|
|
|
|
|
|
|
|
|
|
|
|
|
|
|
|
|
|
|
|
|
|
|
| |||||||||||||||||||||||||
Liabilities | ||||||||||||||||||||||||||||||||||||||||||||||||
Deposits and obligations | 11,000,145 | 10,897,173 | 170,141 | 22,067,459 | 7,233,224 | 8,777,054 | 128,331 | 16,138,609 | 7,225,791 | 7,373,535 | — | 14,599,326 | ||||||||||||||||||||||||||||||||||||
Inter-bank funds | — | 100,022 | — | 100,022 | 9,310 | — | — | 9,310 | — | 7,002 | — | 7,002 | ||||||||||||||||||||||||||||||||||||
Due to banks and correspondents | 1,691,210 | 1,070,906 | — | 2,762,116 | 2,010,874 | 840,924 | 27,632 | 2,879,430 | 1,084,754 | 620,110 | — | 1,704,864 | ||||||||||||||||||||||||||||||||||||
Bonds, notes and other obligations | 3,001,426 | 423,529 | — | 3,424,955 | 2,772,161 | 404,912 | — | 3,177,073 | 2,375,996 | 263,607 | — | 2,639,603 | ||||||||||||||||||||||||||||||||||||
Due from customers on acceptances | 22,310 | — | — | 22,310 | 88,070 | — | — | 88,070 | 19,853 | — | — | 19,853 | ||||||||||||||||||||||||||||||||||||
Insurance contract liabilities | 1,692,563 | 1,444,620 | — | 3,137,183 | 1,640,677 | 1,053,831 | — | 2,694,508 | 1,672,484 | 754,354 | — | 2,426,838 | ||||||||||||||||||||||||||||||||||||
Accounts payables, provision and other liabilities | 230,587 | 752,401 | (124,873 | ) | 858,115 | (460,406 | ) | 646,662 | 570,614 | 756,870 | (134,282 | ) | 389,376 | 328,971 | 584,065 | |||||||||||||||||||||||||||||||||
|
|
|
|
|
|
|
|
|
|
|
|
|
|
|
|
|
|
|
|
|
|
|
| |||||||||||||||||||||||||
| 17,638,241 | 14,688,651 | 45,268 | 32,372,160 | 13,293,910 | 11,723,383 | 726,577 | 25,743,870 | 12,244,596 | 9,407,984 | 328,971 | 21,981,551 | |||||||||||||||||||||||||||||||||||||
|
|
|
|
|
|
|
|
|
|
|
|
|
|
|
|
|
|
|
|
|
|
|
| |||||||||||||||||||||||||
Forward position, net | (276,061 | ) | 364,439 | (88,378 | ) | — | 280,434 | (177,935 | ) | (102,499 | ) | — | 316,188 | (248,597 | ) | (67,591 | ) | — | ||||||||||||||||||||||||||||||
Currency swaps position, net | 18,660 | (18,660 | ) | — | — | 18,455 | (18,455 | ) | — | — | (2,848 | ) | 2,848 | — | — | |||||||||||||||||||||||||||||||||
Cross currency swaps position, net | (164,509 | ) | 164,509 | — | — | (127,500 | ) | 127,500 | — | — | (134,800 | ) | 134,800 | — | — | |||||||||||||||||||||||||||||||||
|
|
|
|
|
|
|
|
|
|
|
|
|
|
|
|
|
|
|
|
|
|
|
| |||||||||||||||||||||||||
Net monetary position | 504,350 | 1,193,943 | 168,322 | 1,866,615 | 1,081,285 | 1,335,168 | (491,250 | ) | 1,925,203 | 372,094 | 1,011,382 | (135,786 | ) | 1,247,690 | ||||||||||||||||||||||||||||||||||
|
|
|
|
|
|
|
|
|
|
|
|
|
|
|
|
|
|
|
|
|
|
|
| |||||||||||||||||||||||||
As of December 31, 2013, the Group granted indirect loans (contingent operations) in foreign currency for approximately U.S.$836,518,000, equivalent to S/.2,338,069,000 (U.S.$847,572,000, equivalent to S/.2,161,310,000 as of December 31, 2012 and U.S.$790,035,000, equivalent to S/.2,014,589,000 as of January 1, 2012); Note 17.
The Group manages the exchange rate risk through the matching of its asset and liability operations, overseeing the global exchange position on a daily basis. The Group’s global exchange position is equivalent to the result of long positions minus short positions in currencies different to the Nuevo Sol. The global exchange position includes the spot positions and also the derivative positions.
F-116
Table of Contents
Notes to the combined financial statements(continued)
The table below shows the sensitivity analysis of the U.S. Dollar currency, the currency to which the Group had significant exposure as of December 31, 2013 and 2012. The analysis calculates the effect of a reasonably possible movement of the currency rate against the Nuevo Sol, with all other variables held constant on the combined statements of comprehensive income before income tax. A negative amount in the table reflects a potential net reduction in the combined income statements, while a positive amount reflects a net potential increase:
| Sensitivity analysis | Changes in currency rates | 2013 | 2012 | |||||||||
| % | S/.(000) | S/.(000) | ||||||||||
Devaluation | ||||||||||||
US Dollar | 5 | (25,218 | ) | (54,064 | ) | |||||||
US Dollar | 10 | (50,435 | ) | (108,129 | ) | |||||||
Revaluation | ||||||||||||
US Dollar | 5 | 25,218 | 54,064 | |||||||||
US Dollar | 10 | 50,435 | 108,129 | |||||||||
| 29.3 | Liquidity risk |
The liquidity risk consists of the Group’s inability to comply with the maturity of its obligations, thus incurring losses that importantly affect its equity position. This risk may arise as result of diverse events such as: the unexpected decrease of funding sources, the inability to rapidly settle assets, among others.
The Group has a set of indicators that control and report daily liquidity. Said indicators establish the minimum liquidity levels allowed for the short-term and reflex several risk aspects such as: concentration, stability, position by currency, main depositors, etc.
Likewise, the Group assess the medium-term and long-term liquidity through a structural analysis of its funds inflows and outflows on diverse maturity terms. This process allows it to know, for each currency, the diverse funding sources, how liquidity needs increase and which terms are mismatched. Both for assets and liabilities, there are considered assumptions for the operations that do not have determined maturity dates, for example: revolving loans, savings and others similar as well as contingent liabilities, such as guarantee letters or non-used credit lines. On the basis of this information, the necessary decisions to maintain the target liquidity levels are taken.
In the case of Interbank, liquidity is managed by the Vice-Presidency of Capital Markets, which leads the ALCO – where positions, movements, indicators and limits on liquidity management are presented. Liquidity risk is itself overseen by the GIR Committee – where the risk level that Interbank is willing to take is defined and the corresponding indicators, limits and controls are reviewed. The Market Risk Division is in charge of tracking said indicators. Interbank takes short-term deposits and transforms them into longer-term loans. Therefore, its exposure to liquidity risk increases. Interbank maintains a set of deposits that historically are renewed or maintained and which represent a stable funding source.
In the case of Interseguro, liquidity is managed by the Board, which sets limits on the minimum proportion of the available maturity funds to meet its requirements and a minimum level of credit lines that should be available to cover maturities, claims and disclaimers to unexpected levels of demand.
In the case of Inteligo Bank the Board of Directors has established liquidity levels as to the minimum amount of available funds required to comply with such requirements and the minimum level of inter-banking facilities and other loan facilities that should exist to cover unexpected withdrawals. Inteligo Bank holds a short-term asset portfolio, comprised of loans and liquid investment to ensure sufficient liquidity.
F-117
Table of Contents
Notes to the combined financial statements(continued)
Inteligo Bank’s financial assets include unlisted equity investments, which generally are liquid. In addition Inteligo Bank holds investments in unlisted closed and open-ended investment funds, which may be subject to redemption restrictions such as side pockets or redemption gates. As a result, Inteligo Bank may not be able to liquidate some of its investments in these instruments in due time in order to meet its liquidity requirements.
F-118
Table of Contents
Notes to the combined financial statements(continued)
Following are the Group’s cash flows payable, by agreed contractual maturity. The amounts disclosed are undiscounted cash flows in accordance with contracted terms and include their respective accrued interests.
| As of December 31, 2013 | ||||||||||||||||||||||||
| Up to a month | From 1 to 3 months | From 3 to 12 months | From 1 a 5 years | Over 5 years | Total | |||||||||||||||||||
| S/.(000) | S/.(000) | S/.(000) | S/.(000) | S/.(000) | S/.(000) | |||||||||||||||||||
Deposits and obligations | 17,659,261 | 1,408,074 | 2,869,431 | 404,237 | 49,141 | 22,390,144 | ||||||||||||||||||
Inter-bank funds | 100,022 | — | — | — | — | 100,022 | ||||||||||||||||||
Due to banks and correspondents | 48,909 | 153,856 | 711,122 | 1,737,269 | 1,098,025 | 3,749,181 | ||||||||||||||||||
Bonds, notes and other obligations | 11,727 | 2,474 | 191,004 | 803,784 | 3,591,682 | 4,600,671 | ||||||||||||||||||
Due from customers on acceptances | 22,310 | — | — | — | — | 22,310 | ||||||||||||||||||
Insurance contracts liabilities | 20,258 | 40,122 | 180,151 | 840,120 | 4,238,880 | 5,319,531 | ||||||||||||||||||
Accounts payables provision and other liabilities | 554,695 | 144,708 | 58,453 | 105,438 | 124,092 | 987,386 | ||||||||||||||||||
|
|
|
|
|
|
|
|
|
|
|
| |||||||||||||
Total | 18,417,182 | 1,749,234 | 4,010,161 | 3,890,848 | 9,101,820 | 37,169,245 | ||||||||||||||||||
|
|
|
|
|
|
|
|
|
|
|
| |||||||||||||
Derivatives financial liabilities (*) - | 61,600 | 7,782 | 16,767 | 17,150 | 55,970 | 159,269 | ||||||||||||||||||
|
|
|
|
|
|
|
|
|
|
|
| |||||||||||||
| (*) | Included the amounts of derivates financial liability contracts as presented in Note 9(e) by contractual terms. |
| As of December 31, 2012 | ||||||||||||||||||||||||
| Up to a month | From 1 to 3 months | From 3 to 12 months | From 1 a 5 years | Over 5 years | Total | |||||||||||||||||||
| S/.(000) | S/.(000) | S/.(000) | S/.(000) | S/.(000) | S/.(000) | |||||||||||||||||||
Deposits and obligations | 11,246,182 | 569,154 | 3,967,477 | 598,279 | 1,135 | 16,382,227 | ||||||||||||||||||
Inter-bank funds | 9,501 | — | — | — | — | 9,501 | ||||||||||||||||||
Due to banks and correspondents | 375,164 | 436,397 | 977,570 | 1,245,178 | 880,257 | 3,914,566 | ||||||||||||||||||
Bonds, notes and other obligations | 3,074 | 143,298 | 203,949 | 673,131 | 3,116,788 | 4,140,240 | ||||||||||||||||||
Due from customers on acceptances | 88,070 | — | — | — | — | 88,070 | ||||||||||||||||||
Insurance contract liabilities | 16,176 | 31,593 | 140,785 | 713,008 | 3,538,047 | 4,439,609 | ||||||||||||||||||
Accounts payables provision and other liabilities | 444,095 | 94,396 | 62,364 | 114,254 | 110,847 | 825,956 | ||||||||||||||||||
|
|
|
|
|
|
|
|
|
|
|
| |||||||||||||
Total | 12,182,262 | 1,274,838 | 5,352,145 | 3,343,850 | 7,647,074 | 29,800,169 | ||||||||||||||||||
|
|
|
|
|
|
|
|
|
|
|
| |||||||||||||
Derivatives financial liabilities (*) - | 16,798 | 31,351 | 12,018 | 9,972 | 10,092 | 80,231 | ||||||||||||||||||
|
|
|
|
|
|
|
|
|
|
|
| |||||||||||||
| (*) | Included the amounts of derivates financial liability contracts as presented in Note 9(e) by contractual terms. |
F-119
Table of Contents
Notes to the combined financial statements(continued)
| As of January 1, 2012 | ||||||||||||||||||||||||
| Up to a month | From 1 to 3 months | From 3 to 12 months | From 1 a 5 years | Over 5 years | Total | |||||||||||||||||||
| S/.(000) | S/.(000) | S/.(000) | S/.(000) | S/.(000) | S/.(000) | |||||||||||||||||||
Deposits and obligations | 10,761,947 | 465,426 | 3,196,306 | 480,260 | 1,197 | 14,905,136 | ||||||||||||||||||
Inter-bank funds | 7,002 | — | — | — | — | 7,002 | ||||||||||||||||||
Due to banks and correspondents | 62,472 | 85,976 | 343,469 | 1,585,186 | 702,077 | 2,779,180 | ||||||||||||||||||
Bonds, notes and other obligations | 3,308 | 2,418 | 127,907 | 698,777 | 2,378,232 | 3,210,642 | ||||||||||||||||||
Due from customers on acceptances | 19,853 | — | — | — | — | 19,853 | ||||||||||||||||||
Insurance claims reserves and technical reserves | 14,536 | 27,924 | 124,592 | 613,489 | 3,052,791 | 3,833,332 | ||||||||||||||||||
Accounts payables provision and other liabilities | 334,266 | 103,543 | 53,641 | 77,137 | 128,176 | 696,763 | ||||||||||||||||||
|
|
|
|
|
|
|
|
|
|
|
| |||||||||||||
Total | 11,203,384 | 685,287 | 3,845,915 | 3,454,849 | 6,262,473 | 25,451,908 | ||||||||||||||||||
|
|
|
|
|
|
|
|
|
|
|
| |||||||||||||
Derivatives financial liabilities (*) - | 8,438 | 16,371 | 5,574 | 27,965 | 9,906 | 68,254 | ||||||||||||||||||
|
|
|
|
|
|
|
|
|
|
|
| |||||||||||||
| (*) | Included the amounts of derivates financial liability contracts as presented in Note 9(e) by contractual terms. |
The table below shows the contractual maturity of the Group’s contingent credits at the date of the consolidated statements of financial position:
| As of December 31, 2013 | ||||||||||||||||||||||||
| Up to a month | From 1 to 3 months | From 3 to 12 months | From 1 a 5 years | Over 5 years | Total | |||||||||||||||||||
| S/.(000) | S/.(000) | S/.(000) | S/.(000) | S/.(000) | S/.(000) | |||||||||||||||||||
Contingent credits (indirect loans) | 1,209,760 | 1,057,961 | 1,614,489 | 200,694 | 24,334 | 4,107,238 | ||||||||||||||||||
| As of December 31, 2012 | ||||||||||||||||||||||||
| Up to a month | From 1 to 3 months | From 3 to 12 months | From 1 a 5 years | Over 5 years | Total | |||||||||||||||||||
| S/.(000) | S/.(000) | S/.(000) | S/.(000) | S/.(000) | S/.(000) | |||||||||||||||||||
Contingent credits (indirect loans) | 885,992 | 1,233,201 | 1,543,837 | 107,954 | — | 3,770,984 | ||||||||||||||||||
| As of January 1, 2012 | ||||||||||||||||||||||||
| Up to a month | From 1 to 3 months | From 3 to 12 months | From 1 a 5 years | Over 5 years | Total | |||||||||||||||||||
| S/.(000) | S/.(000) | S/.(000) | S/.(000) | S/.(000) | S/.(000) | |||||||||||||||||||
Contingent credits (indirect loans) | 809,266 | 1,153,015 | 1,442,236 | 294,750 | — | 3,699,267 | ||||||||||||||||||
The Group expects that not all of the contingent liabilities or commitments will be drawn before expiration of the commitments.
F-120
Table of Contents
Notes to the combined financial statements(continued)
| 29.4 | Operational risk - |
Operational risk is the risk of loss arising from systems failure, human error, fraud or external events. When controls fail to perform, operational risks can cause damage to reputation, have legal or regulatory implications, or lead to financial loss. The Group cannot expect to eliminate all operational risks, but through a control framework and by monitoring and responding to potential risks, the Group is able to manage the risks. Controls include effective segregation of duties, access, authorization and reconciliation procedures, staff education and assessment processes, including the use of internal audit.
| 29.5 | Insurance risk management |
The risk covered under an insurance contract, in any of its various forms, is the possibility that the insured event occurs and, therefore, uncertainty is realized in the amount of the resulting claim. Given the nature of the insurance contract, this risk is random and, therefore, unpredictable.
In relation to a portfolio of insurance contracts where the theory of large numbers and probabilities for pricing and availability provisions is applied, the main risk facing the insurance business of the Group, managed by Interseguro, is that claims and/or payment of benefits covered by the policies exceed the carrying amount of insurance liabilities. This could happen to the extent that the frequency and/or severity of claims and benefits are greater than estimated. The factors that are considered to perform the assessment of insurance risks are the following:
| • | frequency and severity of claims; |
| • | sources of uncertainty in the calculation of payment of future claims; |
| • | mortality tables for different coverage plans in the life insurance segment; |
| • | changes in market rates of investments that directly affect the discount rates to calculate mathematical reserves; and |
| • | requirements established by the SBS according to specific insurance contracts. |
| (a) | Life insurance contracts - |
Interseguro has contracts that have automatic reinsurance coverage that protect it from frequency losses and severity. The purpose of reinsurance is that the total net insurance losses do not affect the equity and liquidity of Interseguro in any year.
Interseguro has developed its insurance underwriting strategy to diversify the type of insurance risks accepted. Factors that aggravate the insurance risk include lack of risk diversification in terms of type and amount of risk and geographic location. The underwriting strategy aims to ensure that underwriting risks are well diversified in terms of type and amount of risk. Subscription limits serve to implement the selection criterion for appropriate risk.
The sufficiency of reserves is a principle of insurance management. Technical reserves for claims and premiums are estimated by Interseguro’s actuaries and reviewed by independent experts when deemed necessary.
Interseguro’s Management constantly monitors trends in claims, which allows it to perform estimates of claims incurred but not reported (IBNR) that are supported by recent information.
On the other hand, Interseguro is exposed to the risk that mortality rates associated with customers do not reflect the actual mortality and may cause the premium calculated for the coverage offered to be insufficient to cover claims. For this reason, Interseguro performs a careful risk selection or subscription when issuing policies, because by doing so it can classify the degree of risk presented by a proposed insured, analyzing characteristics such as gender, smoking conditions, health status, among others.
F-121
Table of Contents
Notes to the combined financial statements(continued)
In the case of annuities business, the risk assumed by Interseguro is that the real life expectancy of the insured population is greater than that estimated when determining income, which would mean a deficit of reserves to meet the payment of pensions.
Regarding the reinsurance risk, Interseguro’s policy consists of only subscribing contracts with companies with international classification risk as determined by the SBS regulations (minimal BBB). Likewise, Interseguro subscribes reinsurance contracts as part of its program of risk reduction, which can be either proportional-based or non-proportional-based. Most automatic proportional reinsurance contracts correspond to those which are obtained for reducing exposure to certain categories of Interseguro’s business. Non-proportional reinsurance is primarily the excess of loss reinsurance designed to mitigate Interseguro’s net exposure to losses from catastrophic risk. The limits for the retention of excess of reinsurance loss vary by product line and geographic area. Interseguro has also limited its exposure by setting maximum claim amounts on certain contracts.
Insurance products do not have particularly significant terms or clauses that could have a significant impact or represent significant uncertainties about Interseguro’s cash flows.
| (b) | Investment property management - |
Most investment property is held by Interseguro in order to manage its long term inflows for its obligations and match its technical reserves. SBS Resolution No. 2840-2012 dated May 11, 2012 (“Regulation on Real Estate Risk Management in Insurance Companies”) requires the identification, measurement, control and reporting of level of investment property risk of insurance companies. Investment property risk is defined as the possibility of losses due to changes or volatility of market prices of properties.
Interseguro has identified the following risks associated with its investment property portfolio, see Note 7:
| • | The cost to develop a project may increase if there are delays in the planning process. Interseguro receives services from expert advisors in order to reduce the risks that may arise in the planning process. |
| • | A major tenant may become insolvent thus causing a significant loss in rental income and a reduction in the value of the associated property. To reduce this risk, Interseguro reviews the financial status of all prospective tenants and decides on the appropriate level of safety required as lease deposits or guarantees. |
| • | Exposure of the fair value of the investment property portfolio and the cash flows generated by the occupants and/or tenants. |
| 29.6 | Capital management |
The Group manages in an active manner a capital base in order to cover the risks inherent to its activities. The capital adequacy of the Group is monitored by using regulations and ratios established by its different regulators. See Note 15(f).
F-122
Table of Contents
Notes to the combined financial statements(continued)
| 30. | Fair value |
| (a) | Determination of fair value and fair value hierarchy of financial instruments |
The following table analyses financial instruments measured at fair value at the reporting date, by the level in the fair value hierarchy into which the fair value measurement is categorized. The amounts are based on the values recognized in the combined statement, of financial position:
| As of December 31, 2013 | As of December 31, 2012 | As of January 1, 2012 | ||||||||||||||||||||||||||||||||||||||||||||||
| Level 1 | Level 2 | Level 3 | Total | Level 1 | Level 2 | Level 3 | Total | Level 1 | Level 2 | Level 3 | Total | |||||||||||||||||||||||||||||||||||||
| S/.(000) | S/.(000) | S/.(000) | S/.(000) | S/.(000) | S/.(000) | S/.(000) | S/.(000) | S/.(000) | S/.(000) | S/.(000) | S/.(000) | |||||||||||||||||||||||||||||||||||||
Assets | ||||||||||||||||||||||||||||||||||||||||||||||||
Investments at fair value through profit or loss | 91,922 | 34,770 | — | 126,692 | 94,394 | 50,350 | — | 144,744 | 119,768 | 101,537 | �� | — | 221,305 | |||||||||||||||||||||||||||||||||||
Available-for-sale investments | ||||||||||||||||||||||||||||||||||||||||||||||||
Debt instruments | 3,430,084 | 1,164,796 | — | 4,594,880 | 2,973,298 | 1,002,358 | — | 3,975,656 | 2,923,239 | 1,726,771 | — | 4,650,010 | ||||||||||||||||||||||||||||||||||||
InRetail Perú Corp. | 126,022 | — | — | 126,022 | 201,943 | — | — | 201,943 | — | — | — | — | ||||||||||||||||||||||||||||||||||||
Royalty Pharma | — | — | 127,960 | 127,960 | — | — | 446,083 | 446,083 | — | — | 398,106 | 398,106 | ||||||||||||||||||||||||||||||||||||
Mutual funds and investments participations | 118,244 | 25,378 | 250,270 | 393,892 | 84,853 | 16,690 | 226,057 | 327,600 | 90,697 | 86,456 | 173,294 | 350,447 | ||||||||||||||||||||||||||||||||||||
Peruvian and foreign entities and other | 193,013 | 63,583 | — | 256,596 | 186,662 | 56,067 | — | 242,729 | 235,444 | 6,072 | — | 241,516 | ||||||||||||||||||||||||||||||||||||
Derivatives receivable | 125,816 | — | 125,816 | — | 57,015 | — | 57,015 | — | 32,731 | 32,731 | ||||||||||||||||||||||||||||||||||||||
|
|
|
|
|
|
|
|
|
|
|
|
|
|
|
|
|
|
|
|
|
|
|
| |||||||||||||||||||||||||
| 3,959,285 | 1,414,343 | 378,230 | 5,751,858 | 3,541,150 | 1,182,480 | 672,140 | 5,395,770 | 3,369,148 | 1,953,567 | 571,400 | 5,894,115 | |||||||||||||||||||||||||||||||||||||
|
|
|
|
|
|
|
|
|
|
|
|
|
|
|
|
|
|
|
|
|
|
|
| |||||||||||||||||||||||||
Accrued interest | — | — | — | 51,644 | — | — | — | 33,456 | — | — | — | 36,774 | ||||||||||||||||||||||||||||||||||||
|
|
|
|
|
| |||||||||||||||||||||||||||||||||||||||||||
| 5,803,502 | 5,429,226 | 5,930,889 | ||||||||||||||||||||||||||||||||||||||||||||||
|
|
|
|
|
| |||||||||||||||||||||||||||||||||||||||||||
Liabilities | ||||||||||||||||||||||||||||||||||||||||||||||||
Derivatives payable | — | 159,269 | — | 159,269 | — | 80,231 | — | 80,231 | — | 68,254 | — | 68,254 | ||||||||||||||||||||||||||||||||||||
|
|
|
|
|
|
|
|
|
|
|
|
|
|
|
|
|
|
|
|
|
|
|
| |||||||||||||||||||||||||
Financial assets included in Level 1 are those measured on the basis of information that is available in the market, to the extent that their quoted prices reflect an active and liquid market and that are available in some centralized trading mechanism, trading agent, price supplier or regulatory entity.
Financial instruments included in Level 2 are valued with the market prices of other instruments possessing similar characteristics or with financial valuation models based on information of variables that can be available on the market (interest rate curves, price vectors, etc.). The Group uses this method mainly to value derivative financial instruments.
Financial assets included in Level 3 are valued by using assumptions and data that do not correspond to prices of operations traded on the market. Fair value is estimated using a discounted cash flow (DCF) model. The valuation requires Management to make certain assumptions about the model inputs, including forecast cash flow, the discount rate, credit risk and volatility. The probabilities of the various estimates within the range can be reasonably assessed and are used in Management’s estimate of fair value for these unquoted investments.
F-123
Table of Contents
Notes to the combined financial statements(continued)
The table below presents a description of significant unobservable inputs to valuation:
| Valuation technique | Significant unobservable inputs | Value | Sensitivity of the input to fair value | |||||
Royalty Pharma | DFC Method | Sales Forecast | Sector Analysts Average Estimates | 10% increase (decrease) in the sales forecast would result in increase (decrease) in fair value by S/.7,970,000 | ||||
500 basis points increase in the WACC would result in decrease in fair value by S/.4,180,000 | ||||||||
| WACC | 10.0% | 500 basis points decrease in the WACC would result in increase in fair value by S/.5,231,400 | ||||||
Mutual funds and Investments participations | DCF Method | Discount rate | Depends on the credit risk | 500 basis points increase in the discount rate would result in decrease in fair value by S/4,743,100 | ||||
500 basis points decrease in the discount rate would result in increase in fair value by S/.5,794,000 | ||||||||
F-124
Table of Contents
Notes to the combined financial statements(continued)
The tables below include a reconciliation of fair value measurement of financial instruments classified by the Group within Level 3 of the valuation hierarchy:
| 2013 | 2012 | |||||||
| Investments available for sale | Investments available for sale | |||||||
| S/.(000) | S/.(000) | |||||||
Balance at January 1 | 672,140 | 571,400 | ||||||
Purchases | 77,579 | 129,367 | ||||||
Settlements | (452,480 | ) | (152,937 | ) | ||||
Total gain (losses) recognized in the combined income statement | — | — | ||||||
Remeasurements recognized in the combined statement of comprehensive income | 80,991 | 124,310 | ||||||
|
|
|
| |||||
Ending Balance | 378,230 | 672,140 | ||||||
|
|
|
| |||||
As of December 31, 2013 and 2012 and as of January 1, 2012, the net unrealized gain on Level 3 financial instruments amounts to S/.111,012,000, S/.164,556,000 and S/.90,449,000, respectively. During 2013 and 2012 there were no transfers of financial instrument from Level 3 to Level 1 or to Level 2.
| (b) | Financial instruments not measured at fair value - |
Set out below is the disclosure of the comparison between the carrying amounts and fair values of the Group´s financial instruments, that are not measured at fair value, presented by level of the fair value hierarchy:
| As of December 31, 2013 | Level 1 | Level 2 | Level 3 | Fair value | Book value | |||||||||||||||
| S/(000) | S/(000) | S/(000) | S/(000) | S/(000) | ||||||||||||||||
Assets | ||||||||||||||||||||
Cash and due from banks | — | 7,401,096 | — | 7,401,096 | 7,401,096 | |||||||||||||||
Inter-bank funds | — | 204,905 | — | 204,905 | 204,905 | |||||||||||||||
Loans, net | — | 20,347,161 | — | 20,347,161 | 20,467,161 | |||||||||||||||
Due from customers on acceptances | — | 22,310 | — | 22,310 | 22,310 | |||||||||||||||
Accounts receivables and other assets | — | 339,801 | — | 339,801 | 339,801 | |||||||||||||||
|
|
|
|
|
|
|
|
|
| |||||||||||
Total | — | 28,315,273 | — | 28,315,273 | 28,435,273 | |||||||||||||||
|
|
|
|
|
|
|
|
|
| |||||||||||
Liabilities | ||||||||||||||||||||
Deposits and obligations | — | 22,017,965 | — | 22,017,965 | 22,067,459 | |||||||||||||||
Inter-bank funds | — | 100,022 | — | 100,022 | 100,022 | |||||||||||||||
Due to banks and correspondents | — | 2,769,038 | — | 2,769,038 | 2,762,116 | |||||||||||||||
Bonds, notes and notes issued | — | 3,483,218 | — | 3,483,218 | 3,424,955 | |||||||||||||||
Insurance contract liabilities | — | 3,137,183 | — | 3,137,183 | 3,137,183 | |||||||||||||||
Due from customers on acceptances | — | 22,310 | — | 22,310 | 22,310 | |||||||||||||||
Accounts payable and other liabilities | — | 698,846 | — | 698,846 | 698,846 | |||||||||||||||
|
|
|
|
|
|
|
|
|
| |||||||||||
Total | — | 32,228,582 | — | 32,228,582 | 32,212,891 | |||||||||||||||
|
|
|
|
|
|
|
|
|
| |||||||||||
F-125
Table of Contents
Notes to the combined financial statements(continued)
| As of December 31, 2012 | Level 1 | Level 2 | Level 3 | Fair Value | Book value | |||||||||||||||
| S/(000) | S/(000) | S/(000) | S/(000) | S/(000) | ||||||||||||||||
Assets | ||||||||||||||||||||
Cash and due from banks | — | 5,589,299 | — | 5,589,299 | 5,589,299 | |||||||||||||||
Inter-bank funds | — | 192,026 | — | 192,026 | 192,026 | |||||||||||||||
Loans, net | — | 16,513,603 | — | 16,513,603 | 16,122,360 | |||||||||||||||
Due from customes on acceptances | — | 88,070 | — | 88,070 | 88,070 | |||||||||||||||
Accounts receivables and other assets | — | 248,092 | — | 248,092 | 248,092 | |||||||||||||||
|
|
|
|
|
|
|
|
|
| |||||||||||
Total | — | 22,631,090 | — | 22,631,090 | 22,239,847 | |||||||||||||||
|
|
|
|
|
|
|
|
|
| |||||||||||
Liabilities | ||||||||||||||||||||
Deposits and obligations | — | 16,116,985 | — | 16,116,985 | 16,138,609 | |||||||||||||||
Inter-bank funds | — | 9,310 | — | 9,310 | 9,310 | |||||||||||||||
Due to banks and correspondents | — | 2,910,771 | — | 2,910,771 | 2,879,430 | |||||||||||||||
Bonds, notes and notes issued | — | 3,440,214 | — | 3,440,214 | 3,177,073 | |||||||||||||||
Insurance contract liabilities | — | 2,694,508 | — | 2,694,508 | 2,694,508 | |||||||||||||||
Due from customers on acceptances | — | 88,070 | — | 88,070 | 88,070 | |||||||||||||||
Accounts payable and other liabilities | — | 676,639 | — | 676,639 | 676,639 | |||||||||||||||
|
|
|
|
|
|
|
|
|
| |||||||||||
Total | — | 25,936,497 | — | 25,936,497 | 25,663,639 | |||||||||||||||
|
|
|
|
|
|
|
|
|
| |||||||||||
| As of January 1, 2012 | Level 1 | Level 2 | Level 3 | Fair Value | Book value | |||||||||||||||
| S/(000) | S/(000) | S/(000) | S/(000) | S/(000) | ||||||||||||||||
Assets | ||||||||||||||||||||
Cash and due from banks | — | 2,510,592 | — | 2,510,592 | 2,510,592 | |||||||||||||||
Inter-bank funds | — | 34,421 | — | 34,421 | 34,421 | |||||||||||||||
Loans, net | — | 14,728,430 | — | 14,728,430 | 14,501,830 | |||||||||||||||
Due from customers on acceptances | — | 19,853 | — | 19,853 | 19,853 | |||||||||||||||
Accounts receivables and other assets | — | 231,656 | — | 231,656 | 231,656 | |||||||||||||||
|
|
|
|
|
|
|
|
|
| |||||||||||
Total | — | 17,524,952 | — | 17,524,952 | 17,298,352 | |||||||||||||||
|
|
|
|
|
|
|
|
|
| |||||||||||
Liabilities | ||||||||||||||||||||
Deposits and obligations | — | 14,603,553 | — | 14,603,553 | 14,599,326 | |||||||||||||||
Inter-bank funds | — | 7,002 | — | 7,002 | 7,002 | |||||||||||||||
Due to banks and correspondents | — | 1,710,394 | — | 1,710,394 | 1,704,864 | |||||||||||||||
Bonds, notes and notes issued | — | 2,853,328 | — | 2,853,328 | 2,639,603 | |||||||||||||||
Insurance contract liabilities | — | 2,426,838 | — | 2,426,838 | 2,426,838 | |||||||||||||||
Due from customers on acceptances | — | 19,853 | — | 19,853 | 19,853 | |||||||||||||||
Accounts payable and other liabilities | — | 515,811 | — | 515,811 | 515,811 | |||||||||||||||
|
|
|
|
|
|
|
|
|
| |||||||||||
Total | — | 22,136,779 | — | 22,136,779 | 21,913,297 | |||||||||||||||
|
|
|
|
|
|
|
|
|
| |||||||||||
The methodologies and assumptions used to determine fair values depend on the terms and risk characteristics of the various financial instruments and include the following:
| (i) | Long-term fixed-rate and variable-rate loans are evaluated by the Group based on parameters such as interest rates, specific country risk factors, individual creditworthiness of the customer and the risk characteristics of the financed project. Based on this evaluation, allowances are taken into account for the expected losses of these loans. As of December 31, 2013 and 2012 and January 1, 2012, the carrying amounts of loans, net of allowances, were not materially different from their calculated fair values. |
F-126
Table of Contents
Notes to the combined financial statements(continued)
| (ii) | Assets for which fair values approximate their carrying value - For financial assets and financial liabilities that are liquid or having a short term maturity (less than three months) it is assumed that the carrying amounts approximate to their fair values. This assumption is also applied to demand deposits, savings accounts without a specific maturity and variable rate financial instruments. |
| (iii) | Fixed rate financial instruments - The fair value of fixed rate financial assets and liabilities carried at amortized cost are estimated by comparing market interest rates when they were first recognized with current market rates offered for similar financial instruments for the remaining term to maturity. The estimated fair value of fixed interest bearing deposits is based on discounted cash flows using prevailing market interest rates for financial instruments with similar credit risk and maturity. For quoted debt issued the fair values are calculated based on quoted market prices. When quoted market prices are not available, a discounted cash flow model is used based on a current interest rate yield curve appropriate for the remaining term to maturity. |
| 31. | Fiduciary activities and management of funds - |
The Group provides custody, trustee, investment management and advisory services to third parties; therefore, the Group makes allocations and purchase and sale decisions in relation to a wide range of financial instruments. Assets that are held in a fiduciary capacity are not included in these consolidated financial statements. These services give rise to the risk that the Group will be accused of poor administration or under-performance.
As of December 31, 2013 and 2012, the assigned value of the financial assets under administration is as follows:
| 2013 | 2012 | |||||||
| S/.(000) | S/.(000) | |||||||
Investments funds | 7,259,794 | 5,743,426 | ||||||
Mutual Funds | 2,444,515 | 2,840,471 | ||||||
Equity managed | 4,926,965 | 2,705,905 | ||||||
|
|
|
| |||||
Total | 14,631,274 | 11,289,802 | ||||||
|
|
|
| |||||
| 32. | Contingencies |
Inteligo Bank has been named as a defendant in the following litigation matters involving the Bernie Madoff cases, with each of the claims below involving approximately US$11 million:
| • | Fairfield Case (Madoff Liquidator) filed September 2, 2010; and |
| • | Irving Picard (Madoff Trustee) filed October 6, 2011. |
This litigation involves the request for return of certain redemption payments received by Inteligo as a result of an agreement with Madoff liquidator and trustee by which all funds collected are to be distributed in a proportion of 40% to the liquidator and 60% to the trustee. Inteligo’s redemption payments were less than its subscription payments.
| 33. | Subsequent events |
| (a) | On July 16 and 18, 2014, the restructuring of Inteligo Group and IFS was approved. The reorganization effective date was August 1, 2014 and included: (i) the spin-off of Inteligo Group’s real estate subsidiaries, Inteligo Real Estate Corp. and Inteligo Real Estate Peru (hereinafter, “Inteligo Real Estate”) to Intercorp Peru; and, (ii) on July 18, 2014, Intercorp Peru contributed all of the outstanding shares of Inteligo Group to IFS in exchange of 19,495,413 new shares issued by IFS to Intercorp Peru. |
F-127
Table of Contents
Notes to the combined financial statements(continued)
The share exchange ratio of 23.28 shares of IFS per one share of Inteligo Group was fixed based on the Lima Stock Exchange quotation as of the date of the transaction.
Under IFRS, reorganizations under common control are accounted for at book values, therefore no fair value adjustment or goodwill has been recognized and all amounts have been accounted for under their book values. On a consolidated pro-forma basis, of the total net assets of Inteligo Group as of December 31, 2013 amounting to S/.453,704,000, S/.82,857,000 was transferred to Intercorp Perú as a result of the aforementioned spin-off and the remaining S/.370,847,000 were contributed to IFS.
The reorganization also affected the combined income statement and non-controlling interest. Inteligo Real Estate had acquired a 39.33% participation in an investment property from Interseguro on December 17, 2013; however, since such investment property belonged to Interseguro throughout all periods presented within the combined financial statements of IFS up to the date of the reorganization and will continue to be consolidated by IFS after the restructuring (IFS concluded it controls the investment property with its 60.67% ownership), the impact of the corresponding pro-forma adjustments is limited to a decrease in equity attributable to the Group’s shareholders and a related increase in the non-controlling interest of S/.82,857,000 and S/.57,202,000 as of December 31, 2013 and 2012, respectively, and a related decrease in the profit for the year attributable to the Group’s shareholders and related increase to the profit for the year attributable to non-controlling interest on the combined income statement of S/.19,843,000 and S/.9,852,000 for the years ended on December 31, 2013 and 2012, respectively. The income statement effect is solely related to the fair value revaluation of such property valuation The effects on the pro-forma earnings per share are included in Note 25.
| (b) | In June 2014, Interseguro sold, for cash and its fair value, investment property (Puruchuco land) to a related entity for approximately S/.99,858,000. |
F-128
Table of Contents
Shares of Common Stock
Intercorp Financial Services Inc.

Global Coordinators and Bookrunners
BofA Merrill Lynch
Credit Suisse
Table of Contents
PART II
INFORMATION NOT REQUIRED IN THE PROSPECTUS
Item 6. Indemnification of Directors and Officers
According to the Registrant’s Articles of Incorporation, its directors and its chief executive officer shall be indemnified by the Registrant for any reasonable expenses incurred and for any loss or damage suffered in connection with any action, lawsuit or proceeding to which they have been a party as a result of their position as director or chief executive officer, to the extent such action, lawsuit or proceeding is not attributable to them. We maintain liability insurance which insure our directors and officers against liability which he or she may incur in his or her capacity as such.
Item 7. Recent Sales of Unregistered Securities
None.
Item 8. Exhibits and Financial Statement Schedules
| (a) | Exhibits |
Exhibit Number | Description of Document | |
| 1.1* | Form of Underwriting Agreement | |
| 3.1* | Articles of Incorporation of the Registrant, as currently in effect | |
| 5.1* | Form of Opinion of Arias, Aleman & Mora regarding the validity of the common shares being registered | |
| 21.1* | Subsidiaries of the Registrant | |
| 23.1* | Consent of Medina, Zaldívar, Paredes & Asociados, a member firm of Ernst & Young Global | |
| 23.2* | Consent of Arias, Aleman & Mora, Panamanian legal counsel of the Registrant | |
| 24.1* | Powers of Attorney (included on signature pages in Part II to the Registration Statement) | |
| * | To be filed by amendment. |
| (b) | Financial Statement Schedules |
All schedules are omitted because the required information is included in the Registrant’s financial statements in the prospectus part of this Registration Statement.
Item 9. Undertakings
The undersigned Registrant hereby undertakes that:
(1) For purposes of determining any liability under the Securities Act, the information omitted from the form of prospectus filed as part of this registration statement in reliance upon Rule 430A and contained in a form of prospectus filed by the Registrant pursuant to Rule 424(b)(1) or (4) or 497(h) under the Securities Act shall be deemed to be part of this registration statement as of the time it was declared effective.
(2) For the purpose of determining any liability under the Securities Act, eachpost-effective amendment that contains a form of prospectus shall be deemed to be a new registration statement relating to the securities offered therein, and the offering of such securities at that time shall be deemed to be the initialbona fide offering thereof.
II-1
Table of Contents
(3) Insofar as indemnification for liabilities arising under the Securities Act may be permitted to directors, officers and controlling persons of the Registrant pursuant to the provisions described in Item 6 of this Registration Statement, or otherwise, the Registrant has been advised that in the opinion of the Securities and Exchange Commission such indemnification is against public policy as expressed in the Securities Act and is, therefore, unenforceable. In the event that a claim for indemnification against such liabilities (other than the payment by the Registrant of expenses incurred or paid by a director, officer or controlling person of the Registrant in the successful defense of any action, suit or proceeding) is asserted against the Registrant by such director, officer or controlling person in connection with the securities being registered, the Registrant will, unless in the opinion of its counsel the matter has been settled by controlling precedent, submit to a court of appropriate jurisdiction the question whether such indemnification by it is against public policy as expressed in the Securities Act and will be governed by the final adjudication of such issue.
(4) For the purposes of Item 512(F) ofRegulation S-K, the Registrant undertakes to provide the Underwriters at the closing specified in the Underwriting Agreement common shares in such denominations and registered in such names as required by the Underwriters to permit prompt delivery to each purchaser.
II-2
Table of Contents
SIGNATURES
Pursuant to the requirements of the Securities Act of 1933, as amended (the “Securities Act”), the Registrant certifies that it has reasonable grounds to believe that it meets all of the requirements for filing onForm F-1 and has duly caused this registration statement to be signed on its behalf by the undersigned, thereunto duly authorized, in the City of Lima, Peru, on this th day of , 2014.
| Intercorp Financial Services Inc. |
/s/ |
| Name: |
| Title: |
II-3
Table of Contents
POWER OF ATTORNEY
KNOW ALL PERSONS BY THESE PRESENTS, that each person whose signature appears below hereby constitutes and appoints , as his true and lawfulattorney-in-fact and agent, with full power of substitution and resubstitution, for him and in his name, place and stead in any and all capacities, in connection with this Registration Statement, including to sign in the name and on behalf of the undersigned, this Registration Statement and any and all amendments thereto, includingpost-effective amendments and registrations filed pursuant to Rule 462 under the Securities Act, and to file the same, with all exhibits thereto, and other documents in connection therewith, with the Securities and Exchange Commission, granting unto suchattorney-in-fact and agent full power and authority to do and perform each and every act and thing requisite and necessary to be done in and about the premises, as fully to all intents and purposes as he might or could do in person, hereby ratifying and confirming all that saidattorney-in-fact and agent, or his substitute, may lawfully do or cause to be done by virtue hereof.
Pursuant to the requirements of the Securities Act, this Registration Statement has been signed by the following persons on , 2014 in the capacities indicated.
Signature | Title | |
| Chief Executive Officer/Director | |
| Chief Financial Officer | |
| Chief Accounting Officer | |
| Director | |
| Director | |
| Director | |
| Director | |
| Director | |
| Director | |
| Director | |
| Director | |
| Director | |
II-4
Table of Contents
SIGNATURE OF AUTHORIZED REPRESENTATIVE IN THE UNITED STATES
Pursuant to the Securities Act of 1933, the undersigned, the duly authorized representative in the United States of Intercorp Financial Services Inc. has signed this registration statement or amendment thereto in New York, New York, on , 2014.
| Authorized Representative | ||
| By: |
| |
II-5