
Investor Presentation November 2016 Exhibit 99.2
Disclaimer Forward-looking Statements Various statements in this presentation are “forward-looking statements” within the meaning of the U.S. federal securities laws. Forward-looking statements provide the Company’s current expectations or forecasts of future events and are not statements of historical fact. This presentation also contains forward-looking statements by third parties relating to market and industry data and forecasts; forecasts and other forward-looking information obtained from these sources are subject to the same qualifications and uncertainties as the other forward-looking statements contained in this presentation. These forward-looking statements include information about possible or assumed future events, including, among other things, discussion and analysis of the Company’s future financial condition, results of operations, funds from operations (“FFO”), adjusted funds from operations (“AFFO”), the Company’s strategic plans and objectives, cost management, potential property acquisitions, anticipated capital expenditures (and access to capital), amounts of anticipated cash distributions to the Company’s stockholders in the future and other matters. Words such as “anticipates,” “expects,” “intends,” “plans,” “believes,” “seeks,” “estimates” and variations of these words and other similar expressions are intended to identify forward-looking statements. These statements are not guarantees of future performance and are subject to risks, uncertainties and other factors, some of which are beyond the Company’s control, are difficult to predict and/or could cause actual results to differ materially from those expressed or forecasted in the forward-looking statements. Forward-looking statements involve inherent uncertainty and may ultimately prove to be incorrect or false. You are cautioned to not place undue reliance on forward-looking statements. Except as otherwise may be required by law, the Company undertakes no obligation to update or revise forward-looking statements to reflect changed assumptions, the occurrence of unanticipated events or actual operating results. The Company’s actual results could differ materially from those anticipated in these forward-looking statements as a result of various factors. For a discussion of these and other factors that could cause the Company’s future results to differ significantly from any forward-looking statements, see the sections entitled “Management’s Discussion and Analysis of Financial Condition and Results of Operations” and “Risk Factors” included in the Company’s Registration Statement on Form S-11 (File No. 333-206519), which was filed with the Securities and Exchange Commission (the “SEC”) on November 3, 2016, and other documents filed by the Company with the SEC. Information regarding our operators, tenants, and guarantors This presentation includes information regarding the operations of our properties and guarantors of our leases. All facility and guarantor information was derived solely from information provided by operators/tenants and relevant guarantors without independent verification by the Company and is presented as of June 30, 2016 unless otherwise noted. We have not independently verified this information, but have no reason to believe that such information is inaccurate in any material respect. We are providing this information for informational purposes only. Definitions and Reconciliations For definitions of certain terms used throughout this presentation, including certain non-GAAP financial measures, see the Glossary included in the Appendix on pages 21-23. For reconciliations of the non-GAAP financial measures to the most directly comparable GAAP measures, see page 17 in the Appendix.
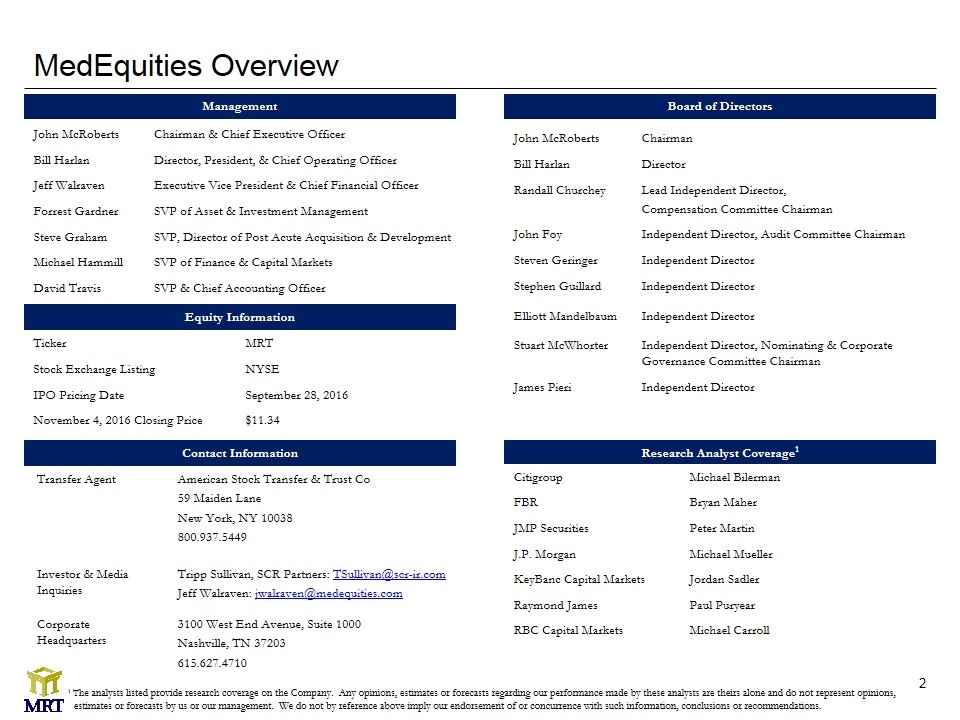
MedEquities Overview Management John McRoberts Chairman & Chief Executive Officer Bill Harlan Director, President, & Chief Operating Officer Jeff Walraven Executive Vice President & Chief Financial Officer Forrest Gardner SVP of Asset & Investment Management Steve Graham SVP, Director of Post Acute Acquisition & Development Michael Hammill SVP of Finance & Capital Markets David Travis SVP & Chief Accounting Officer Contact Information Transfer Agent American Stock Transfer & Trust Co 59 Maiden Lane New York, NY 10038 800.937.5449 Investor & Media Inquiries Tripp Sullivan, SCR Partners: TSullivan@scr-ir.com Jeff Walraven: jwalraven@medequities.com Corporate Headquarters 3100 West End Avenue, Suite 1000 Nashville, TN 37203 615.627.4710 Research Analyst Coverage1 Citigroup Michael Bilerman FBR Bryan Maher JMP Securities Peter Martin J.P. Morgan Michael Mueller KeyBanc Capital Markets Jordan Sadler Raymond James Paul Puryear RBC Capital Markets Michael Carroll Equity Information Ticker MRT Stock Exchange Listing NYSE IPO Pricing Date September 28, 2016 November 4, 2016 Closing Price $11.34 Board of Directors John McRoberts Chairman Bill Harlan Director Randall Churchey Lead Independent Director, Compensation Committee Chairman John Foy Independent Director, Audit Committee Chairman Steven Geringer Independent Director Stephen Guillard Independent Director Elliott Mandelbaum Independent Director Stuart McWhorter Independent Director, Nominating & Corporate Governance Committee Chairman James Pieri Independent Director 1 The analysts listed provide research coverage on the Company. Any opinions, estimates or forecasts regarding our performance made by these analysts are theirs alone and do not represent opinions, estimates or forecasts by us or our management. We do not by reference above imply our endorsement of or concurrence with such information, conclusions or recommendations.
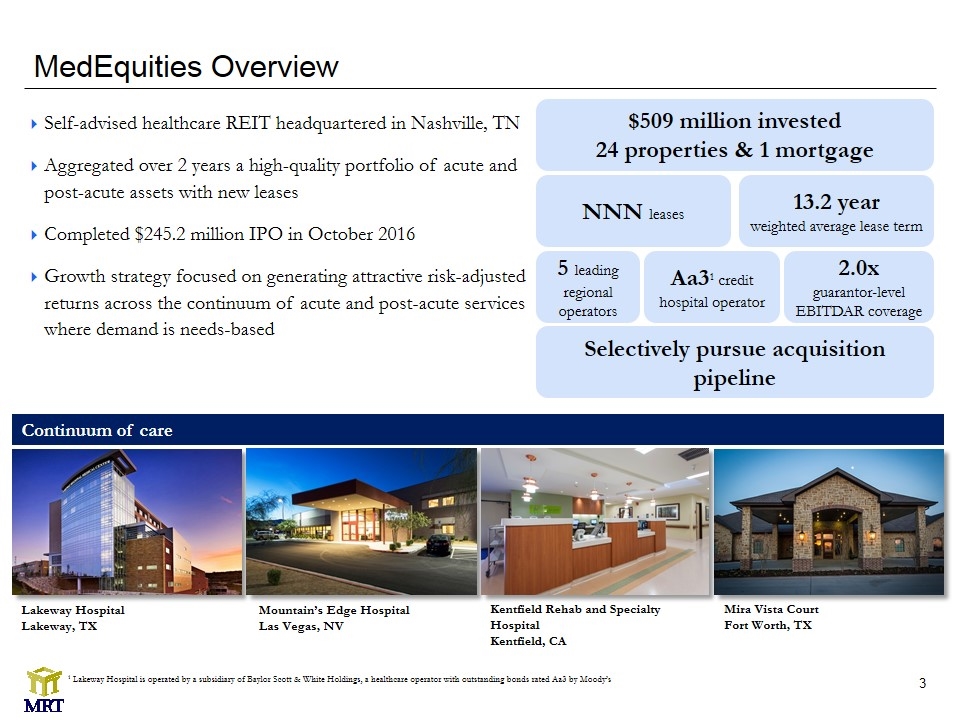
Self-advised healthcare REIT headquartered in Nashville, TN Aggregated over 2 years a high-quality portfolio of acute and post-acute assets with new leases Completed $245.2 million IPO in October 2016 Growth strategy focused on generating attractive risk-adjusted returns across the continuum of acute and post-acute services where demand is needs-based MedEquities Overview Lakeway Hospital Lakeway, TX Mountain’s Edge Hospital Las Vegas, NV $509 million invested 24 properties & 1 mortgage 5 leading regional operators 2.0x guarantor-level EBITDAR coverage Selectively pursue acquisition pipeline 1 Lakeway Hospital is operated by a subsidiary of Baylor Scott & White Holdings, a healthcare operator with outstanding bonds rated Aa3 by Moody’s Aa31 credit hospital operator NNN leases 13.2 year weighted average lease term Continuum of care Mira Vista Court Fort Worth, TX Kentfield Rehab and Specialty Hospital Kentfield, CA
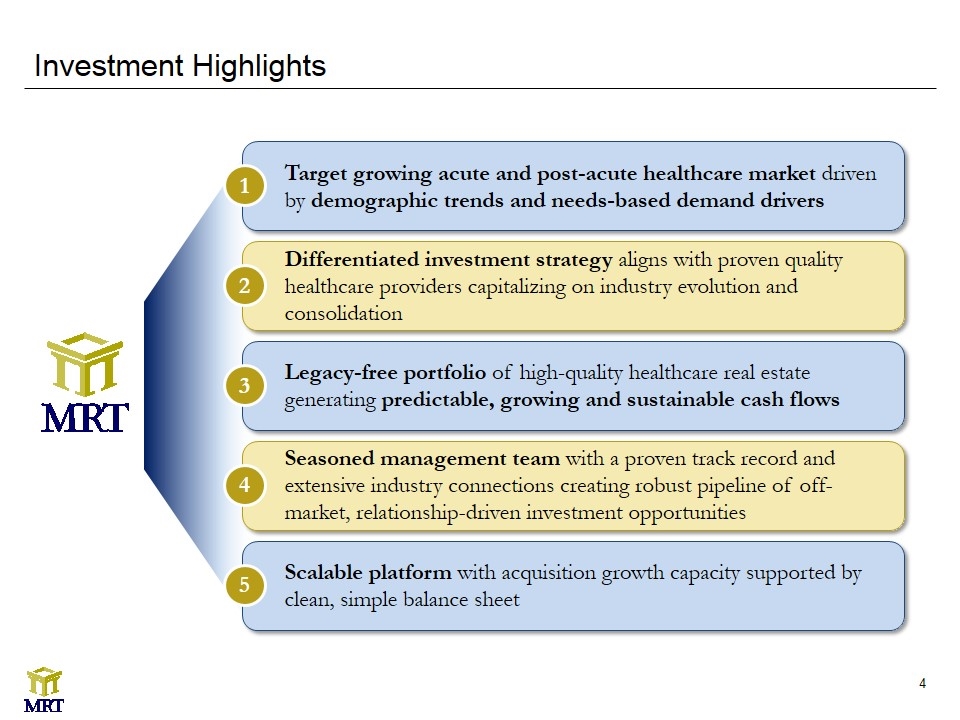
Investment Highlights Target growing acute and post-acute healthcare market driven by demographic trends and needs-based demand drivers 1 Differentiated investment strategy aligns with proven quality healthcare providers capitalizing on industry evolution and consolidation 2 Legacy-free portfolio of high-quality healthcare real estate generating predictable, growing and sustainable cash flows 3 Seasoned management team with a proven track record and extensive industry connections creating robust pipeline of off-market, relationship-driven investment opportunities 4 Scalable platform with acquisition growth capacity supported by clean, simple balance sheet 5
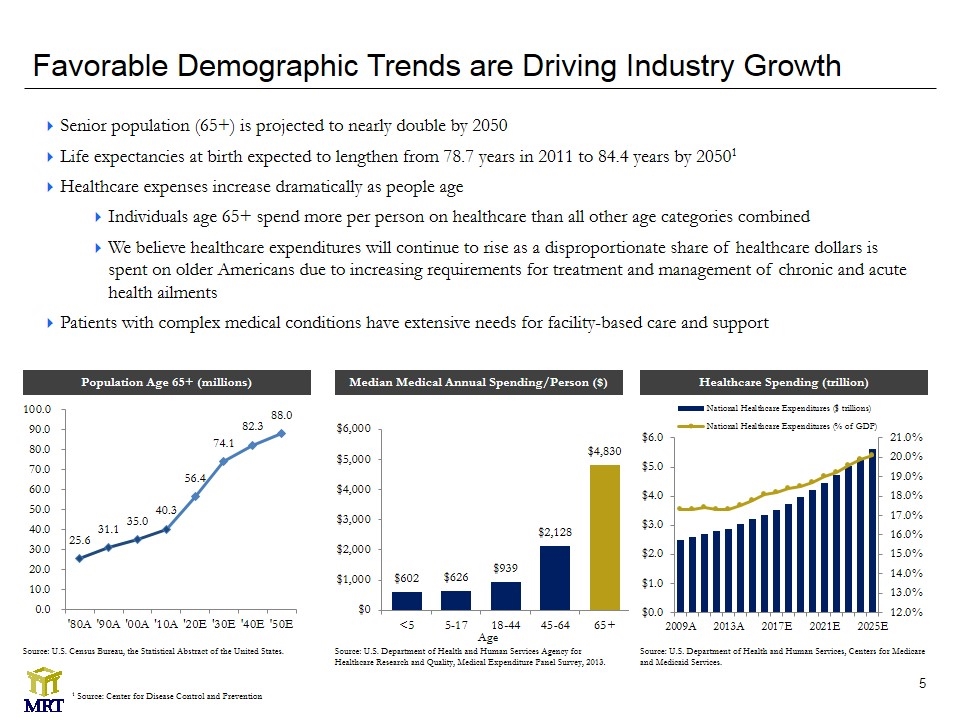
Favorable Demographic Trends are Driving Industry Growth Source: U.S. Department of Health and Human Services Agency for Healthcare Research and Quality, Medical Expenditure Panel Survey, 2013. Median Medical Annual Spending/Person ($) Population Age 65+ (millions) Healthcare Spending (trillion) Senior population (65+) is projected to nearly double by 2050 Life expectancies at birth expected to lengthen from 78.7 years in 2011 to 84.4 years by 20501 Healthcare expenses increase dramatically as people age Individuals age 65+ spend more per person on healthcare than all other age categories combined We believe healthcare expenditures will continue to rise as a disproportionate share of healthcare dollars is spent on older Americans due to increasing requirements for treatment and management of chronic and acute health ailments Patients with complex medical conditions have extensive needs for facility-based care and support Age Source: U.S. Census Bureau, the Statistical Abstract of the United States. Source: U.S. Department of Health and Human Services, Centers for Medicare and Medicaid Services. 1 Source: Center for Disease Control and Prevention
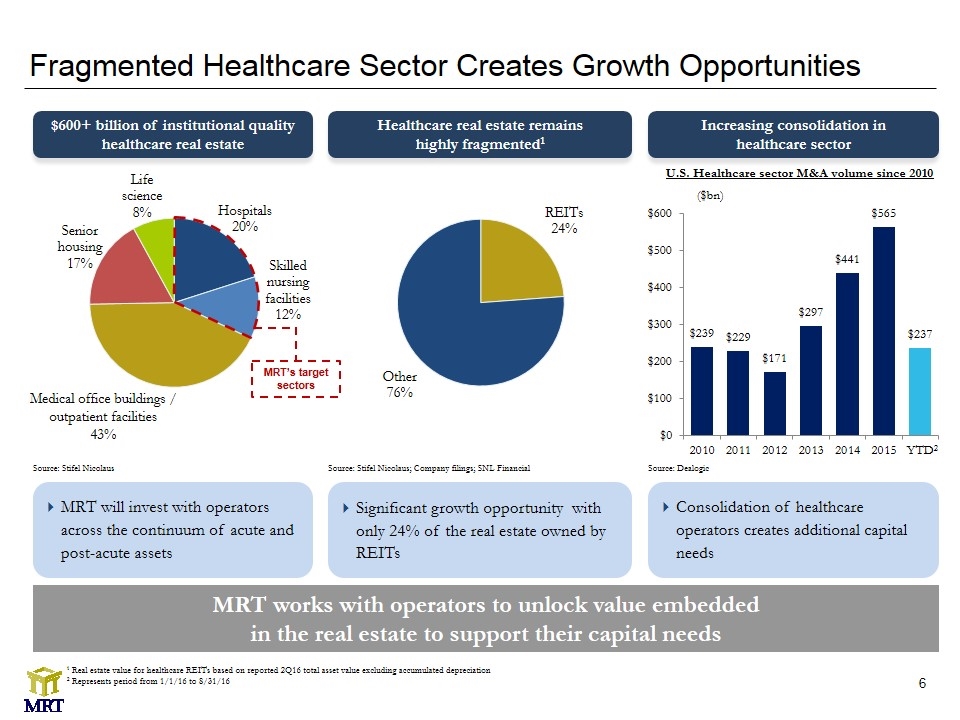
Fragmented Healthcare Sector Creates Growth Opportunities MRT works with operators to unlock value embedded in the real estate to support their capital needs Healthcare real estate remains highly fragmented1 Increasing consolidation in healthcare sector $600+ billion of institutional quality healthcare real estate MRT will invest with operators across the continuum of acute and post-acute assets Significant growth opportunity with only 24% of the real estate owned by REITs Consolidation of healthcare operators creates additional capital needs 1 Real estate value for healthcare REITs based on reported 2Q16 total asset value excluding accumulated depreciation 2 Represents period from 1/1/16 to 8/31/16 2 ($bn) U.S. Healthcare sector M&A volume since 2010 Source: Stifel Nicolaus Source: Stifel Nicolaus; Company filings; SNL Financial Source: Dealogic Medical office buildings / outpatient facilities 43% MRT’s target sectors
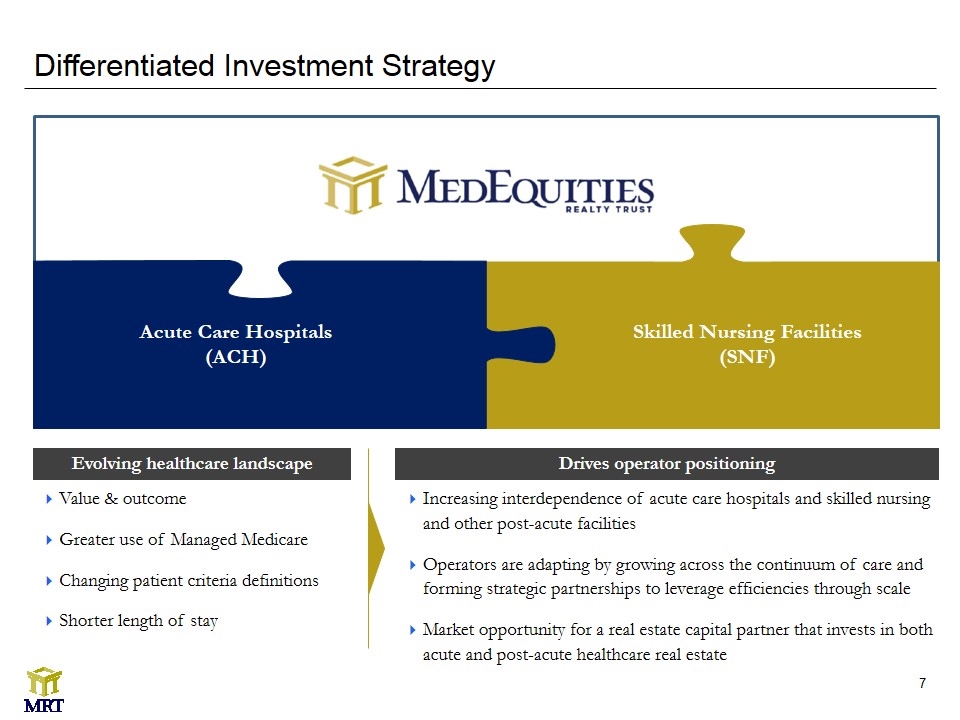
Differentiated Investment Strategy Acute Care Hospitals (ACH) Skilled Nursing Facilities (SNF) Increasing interdependence of acute care hospitals and skilled nursing and other post-acute facilities Operators are adapting by growing across the continuum of care and forming strategic partnerships to leverage efficiencies through scale Market opportunity for a real estate capital partner that invests in both acute and post-acute healthcare real estate Evolving healthcare landscape Value & outcome Greater use of Managed Medicare Changing patient criteria definitions Shorter length of stay Drives operator positioning
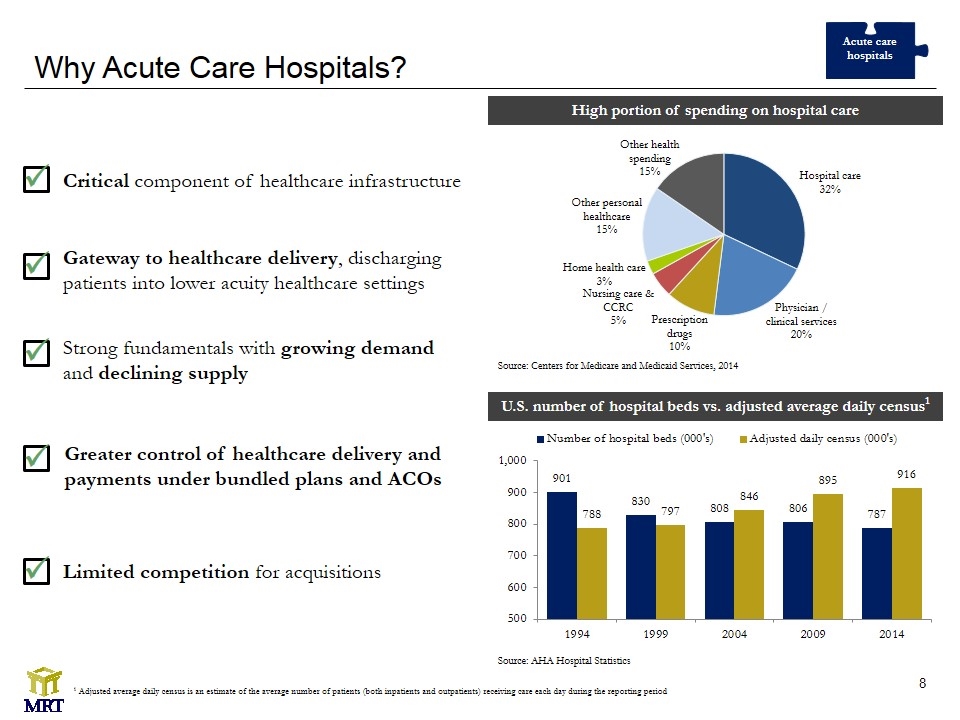
Why Acute Care Hospitals? High portion of spending on hospital care Critical component of healthcare infrastructure ü Gateway to healthcare delivery, discharging patients into lower acuity healthcare settings ü Greater control of healthcare delivery and payments under bundled plans and ACOs ü Strong fundamentals with growing demand and declining supply ü Source: Centers for Medicare and Medicaid Services, 2014 Source: AHA Hospital Statistics Acute care hospitals U.S. number of hospital beds vs. adjusted average daily census1 1 Adjusted average daily census is an estimate of the average number of patients (both inpatients and outpatients) receiving care each day during the reporting period Limited competition for acquisitions ü
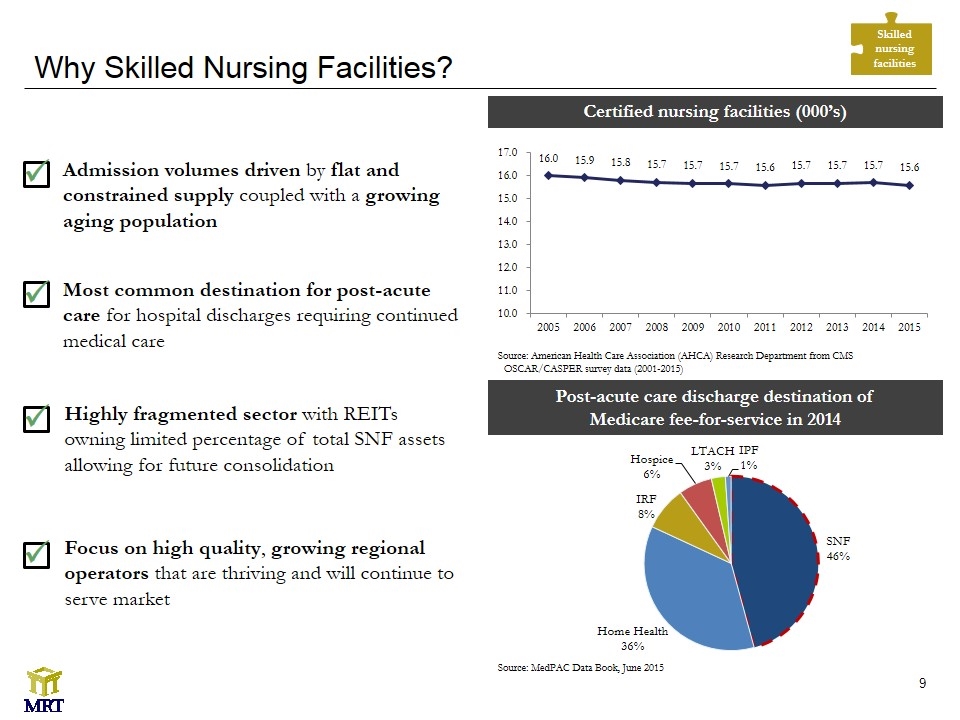
Why Skilled Nursing Facilities? Certified nursing facilities (000’s) Post-acute care discharge destination of Medicare fee-for-service in 2014 Most common destination for post-acute care for hospital discharges requiring continued medical care ü Admission volumes driven by flat and constrained supply coupled with a growing aging population ü Highly fragmented sector with REITs owning limited percentage of total SNF assets allowing for future consolidation ü Source: American Health Care Association (AHCA) Research Department from CMS OSCAR/CASPER survey data (2001-2015) Source: MedPAC Data Book, June 2015 Skilled nursing facilities Focus on high quality, growing regional operators that are thriving and will continue to serve market ü
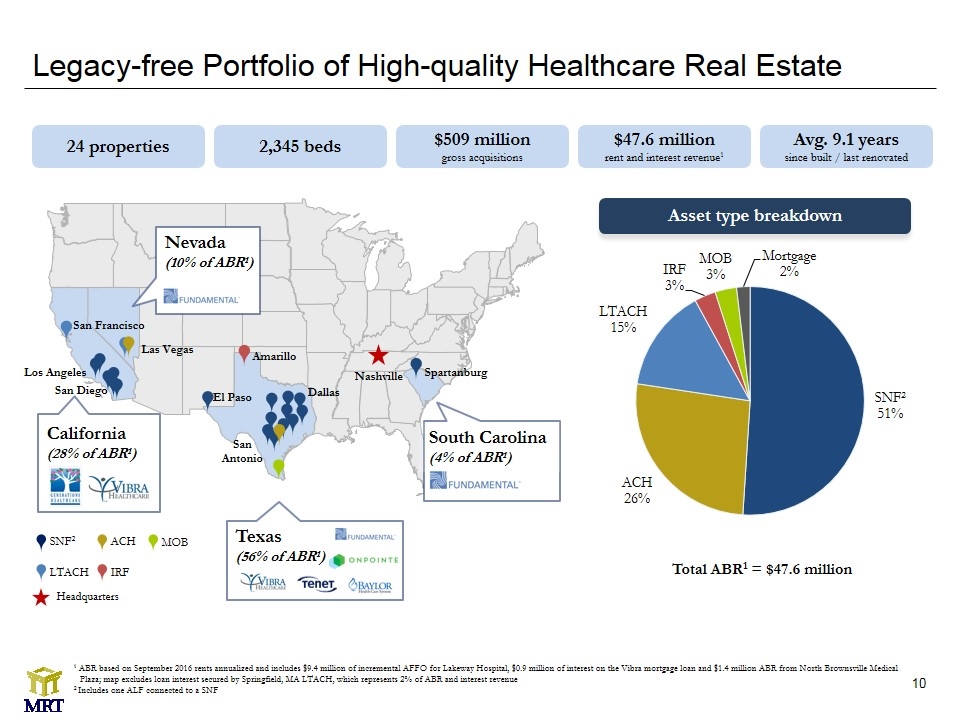
1 ABR based on September 2016 rents annualized and includes $9.4 million of incremental AFFO for Lakeway Hospital, $0.9 million of interest on the Vibra mortgage loan and $1.4 million ABR from North Brownsville Medical Plaza; map excludes loan interest secured by Springfield, MA LTACH, which represents 2% of ABR and interest revenue 2 Includes one ALF connected to a SNF Legacy-free Portfolio of High-quality Healthcare Real Estate Texas (56% of ABR1) Headquarters SNF2 LTACH MOB ACH IRF El Paso California (28% of ABR1) South Carolina (4% of ABR1) Nevada (10% of ABR1) San Francisco Las Vegas San Diego Amarillo Nashville Spartanburg San Antonio Dallas 24 properties $509 million gross acquisitions $47.6 million rent and interest revenue1 Avg. 9.1 years since built / last renovated 2,345 beds Asset type breakdown Total ABR1 = $47.6 million Los Angeles
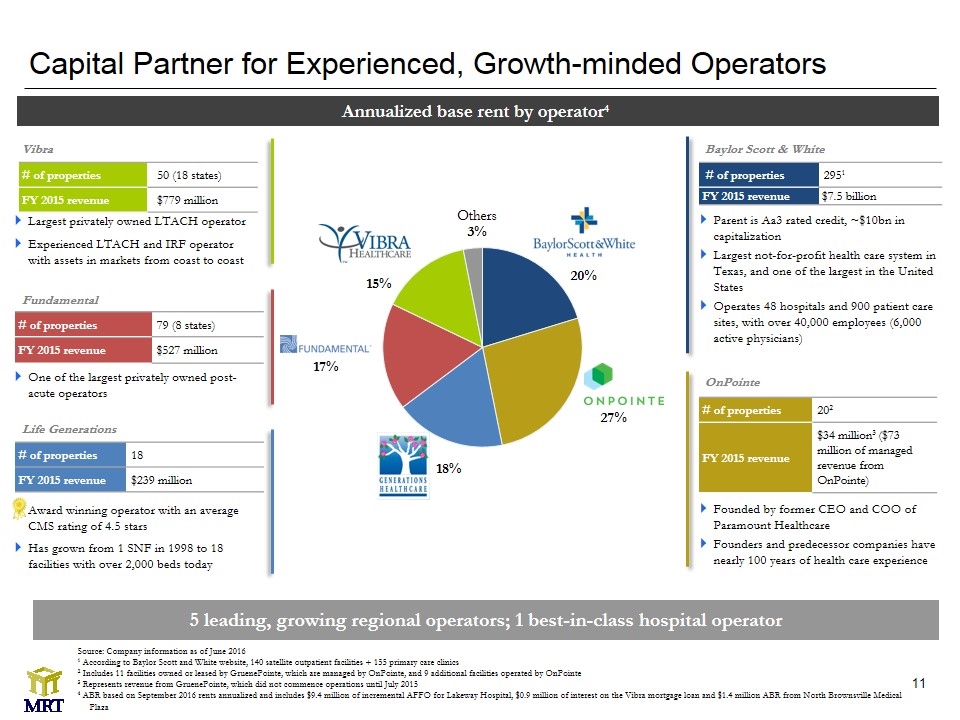
Capital Partner for Experienced, Growth-minded Operators Parent is Aa3 rated credit, ~$10bn in capitalization Largest not-for-profit health care system in Texas, and one of the largest in the United States Operates 48 hospitals and 900 patient care sites, with over 40,000 employees (6,000 active physicians) Founded by former CEO and COO of Paramount Healthcare Founders and predecessor companies have nearly 100 years of health care experience Award winning operator with an average CMS rating of 4.5 stars Has grown from 1 SNF in 1998 to 18 facilities with over 2,000 beds today One of the largest privately owned post-acute operators Largest privately owned LTACH operator Experienced LTACH and IRF operator with assets in markets from coast to coast 18% Source: Company information as of June 2016 1 According to Baylor Scott and White website, 140 satellite outpatient facilities + 155 primary care clinics 2 Includes 11 facilities owned or leased by GruenePointe, which are managed by OnPointe, and 9 additional facilities operated by OnPointe 3 Represents revenue from GruenePointe, which did not commence operations until July 2015 4 ABR based on September 2016 rents annualized and includes $9.4 million of incremental AFFO for Lakeway Hospital, $0.9 million of interest on the Vibra mortgage loan and $1.4 million ABR from North Brownsville Medical Plaza Annualized base rent by operator4 # of properties 50 (18 states) FY 2015 revenue $779 million # of properties 79 (8 states) FY 2015 revenue $527 million # of properties 18 FY 2015 revenue $239 million # of properties 2951 FY 2015 revenue $7.5 billion # of properties 202 FY 2015 revenue $34 million3 ($73 million of managed revenue from OnPointe) 5 leading, growing regional operators; 1 best-in-class hospital operator Baylor Scott & White OnPointe Life Generations Fundamental Vibra
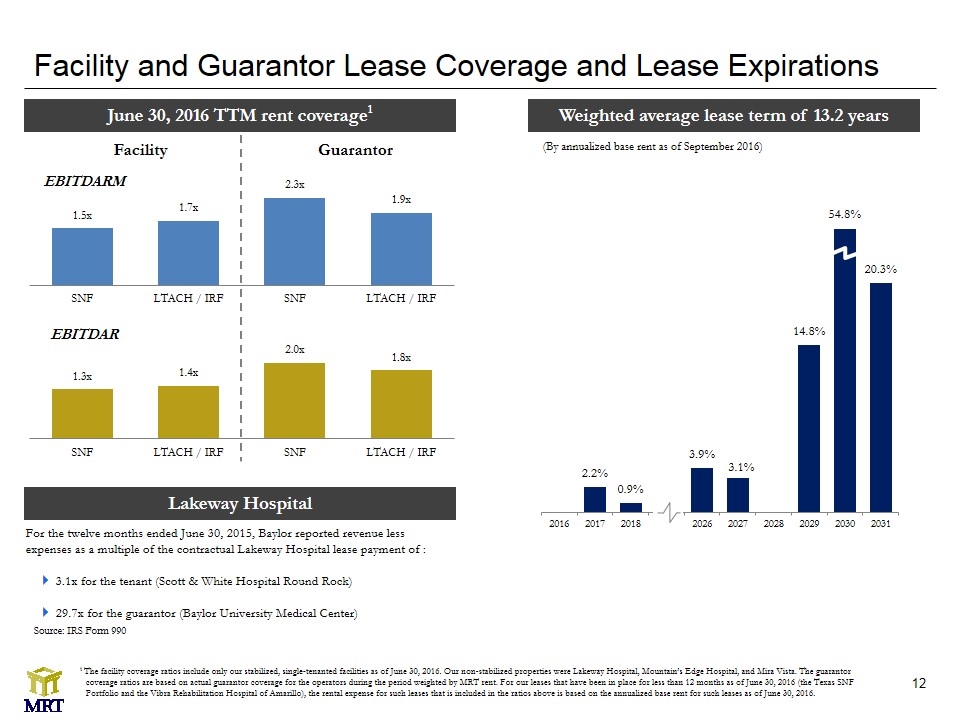
Facility and Guarantor Lease Coverage and Lease Expirations June 30, 2016 TTM rent coverage1 Weighted average lease term of 13.2 years 54.8% EBITDARM EBITDAR Facility Guarantor (By annualized base rent as of September 2016) Lakeway Hospital For the twelve months ended June 30, 2015, Baylor reported revenue less expenses as a multiple of the contractual Lakeway Hospital lease payment of : 3.1x for the tenant (Scott & White Hospital Round Rock) 29.7x for the guarantor (Baylor University Medical Center) Source: IRS Form 990 1 The facility coverage ratios include only our stabilized, single-tenanted facilities as of June 30, 2016. Our non-stabilized properties were Lakeway Hospital, Mountain’s Edge Hospital, and Mira Vista. The guarantor coverage ratios are based on actual guarantor coverage for the operators during the period weighted by MRT rent. For our leases that have been in place for less than 12 months as of June 30, 2016 (the Texas SNF Portfolio and the Vibra Rehabilitation Hospital of Amarillo), the rental expense for such leases that is included in the ratios above is based on the annualized base rent for such leases as of June 30, 2016.
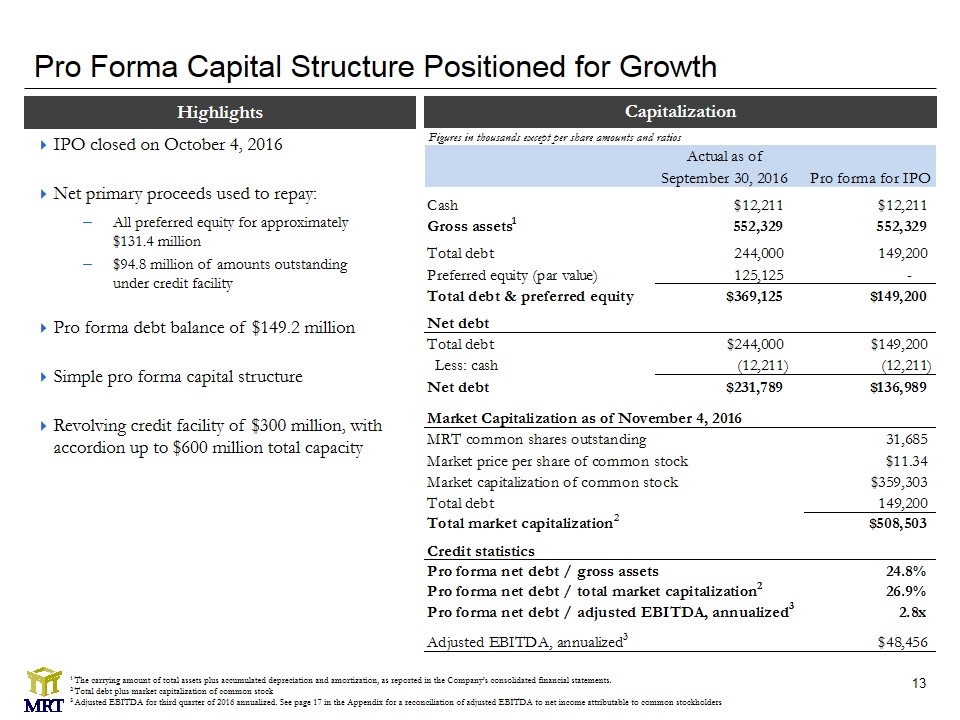
Pro Forma Capital Structure Positioned for Growth IPO closed on October 4, 2016 Net primary proceeds used to repay: All preferred equity for approximately $131.4 million $94.8 million of amounts outstanding under credit facility Pro forma debt balance of $149.2 million Simple pro forma capital structure Revolving credit facility of $300 million, with accordion up to $600 million total capacity Capitalization Highlights Figures in thousands except per share amounts and ratios 1 The carrying amount of total assets plus accumulated depreciation and amortization, as reported in the Company’s consolidated financial statements. 2 Total debt plus market capitalization of common stock 3 Adjusted EBITDA for third quarter of 2016 annualized. See page 17 in the Appendix for a reconciliation of adjusted EBITDA to net income attributable to common stockholders
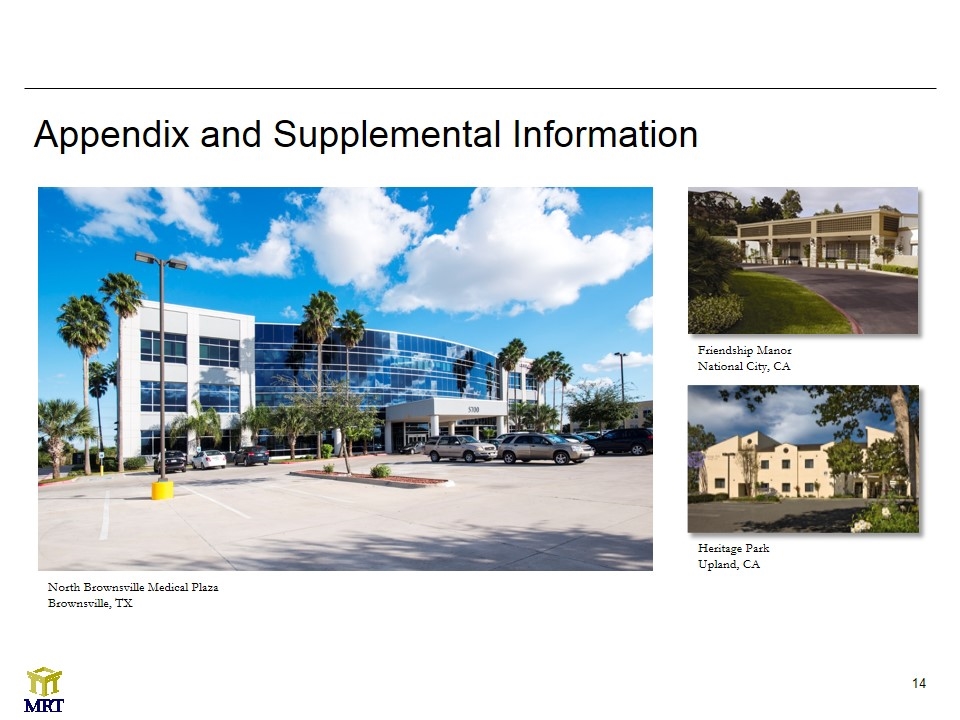
Appendix and Supplemental Information North Brownsville Medical Plaza Brownsville, TX Friendship Manor National City, CA Heritage Park Upland, CA

Balance Sheet Figures in thousands
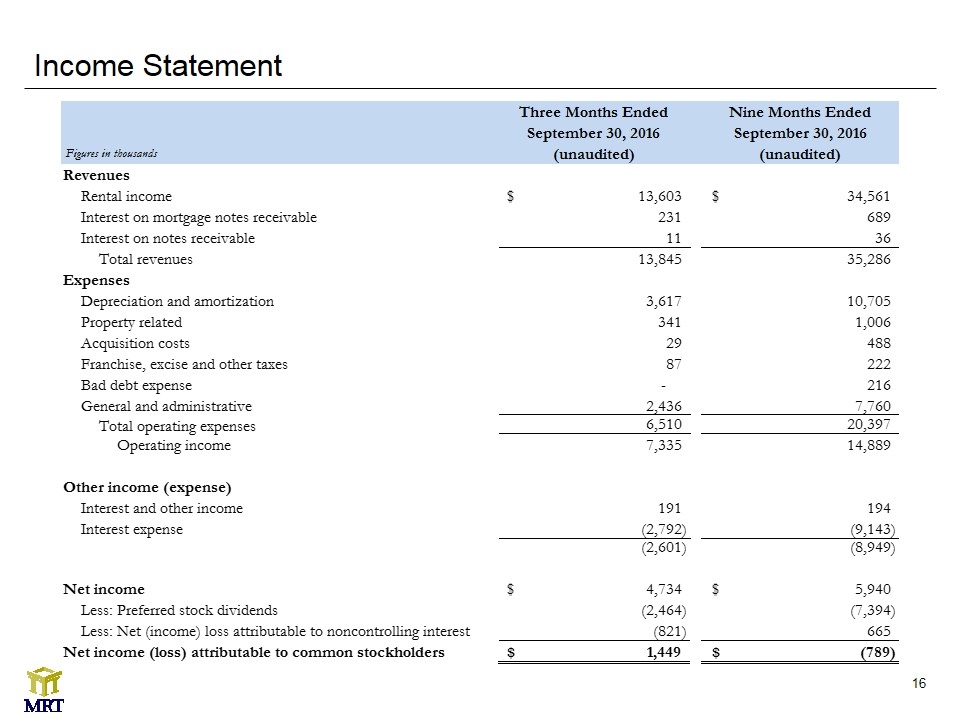
Income Statement Figures in thousands
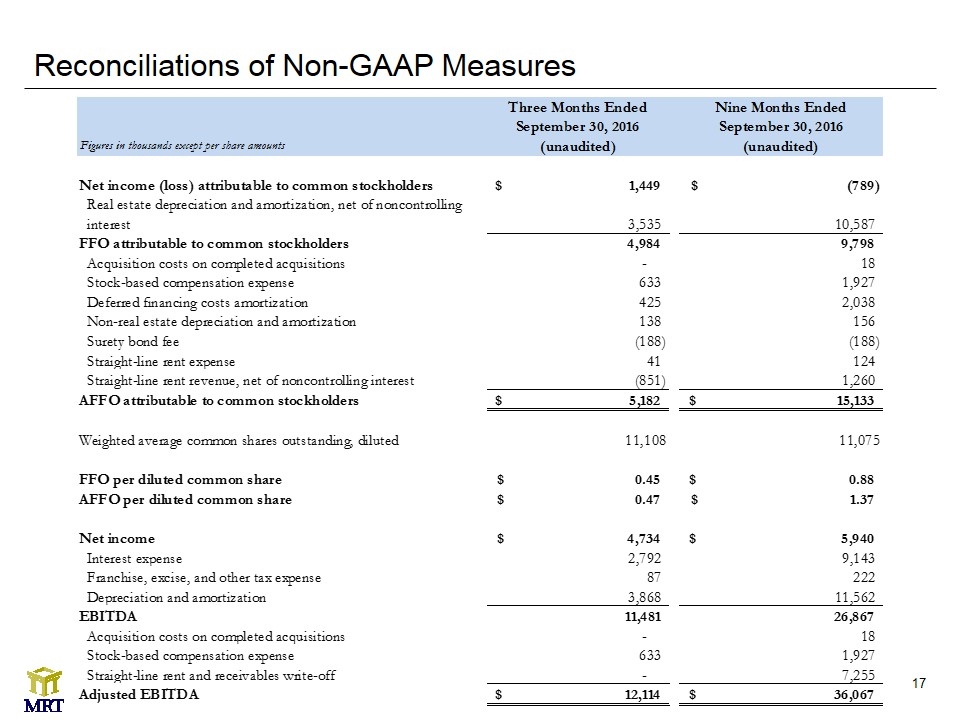
Reconciliations of Non-GAAP Measures Figures in thousands except per share amounts
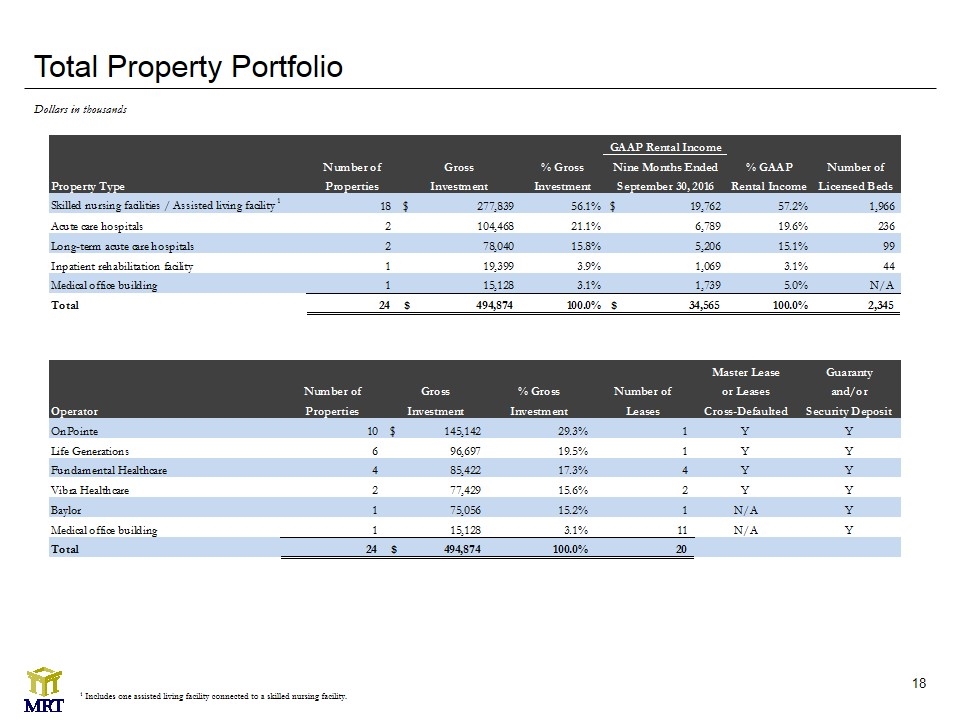
Total Property Portfolio 1 Includes one assisted living facility connected to a skilled nursing facility. Dollars in thousands
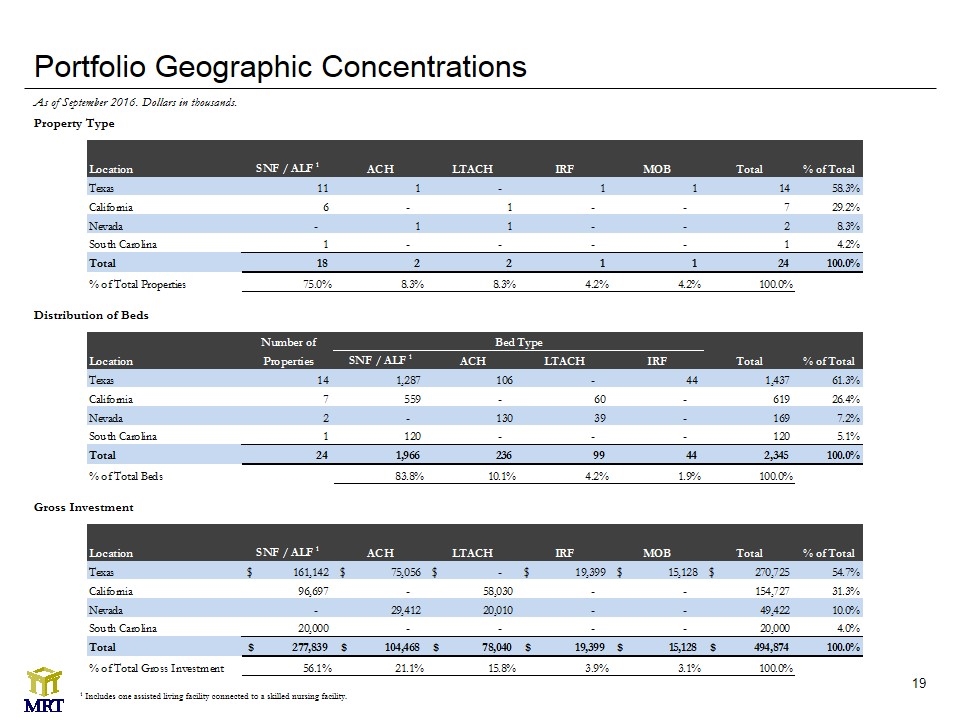
Portfolio Geographic Concentrations 1 Includes one assisted living facility connected to a skilled nursing facility. Property Type Distribution of Beds Gross Investment As of September 2016. Dollars in thousands.
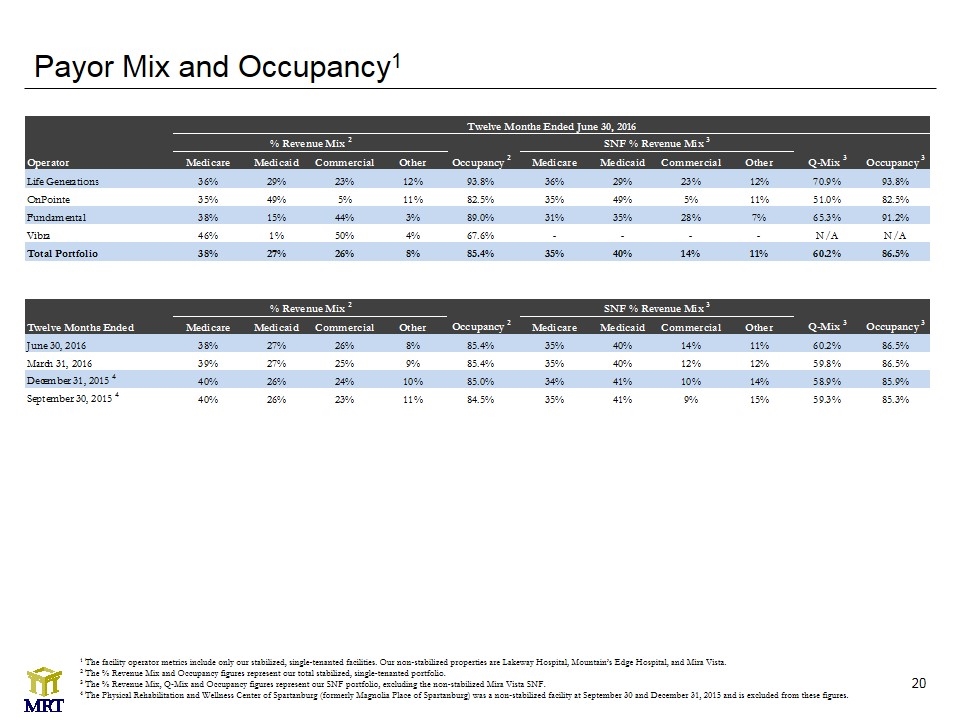
Payor Mix and Occupancy1 1 The facility operator metrics include only our stabilized, single-tenanted facilities. Our non-stabilized properties are Lakeway Hospital, Mountain’s Edge Hospital, and Mira Vista. 2 The % Revenue Mix and Occupancy figures represent our total stabilized, single-tenanted portfolio. 3 The % Revenue Mix, Q-Mix and Occupancy figures represent our SNF portfolio, excluding the non-stabilized Mira Vista SNF. 4 The Physical Rehabilitation and Wellness Center of Spartanburg (formerly Magnolia Place of Spartanburg) was a non-stabilized facility at September 30 and December 31, 2015 and is excluded from these figures.
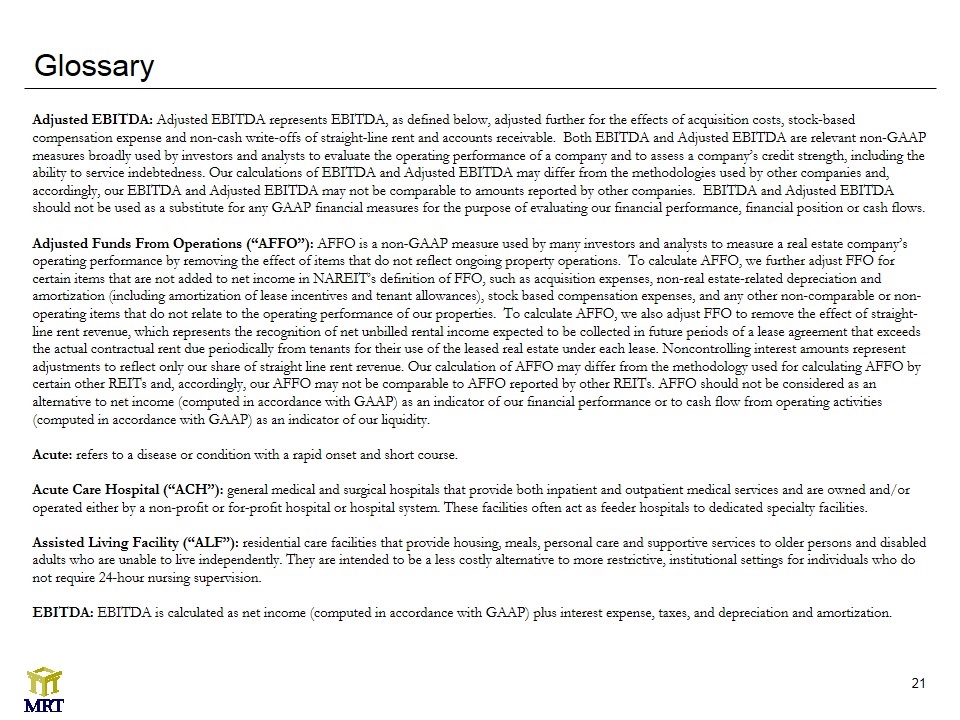
Glossary Adjusted EBITDA: Adjusted EBITDA represents EBITDA, as defined below, adjusted further for the effects of acquisition costs, stock-based compensation expense and non-cash write-offs of straight-line rent and accounts receivable. Both EBITDA and Adjusted EBITDA are relevant non-GAAP measures broadly used by investors and analysts to evaluate the operating performance of a company and to assess a company’s credit strength, including the ability to service indebtedness. Our calculations of EBITDA and Adjusted EBITDA may differ from the methodologies used by other companies and, accordingly, our EBITDA and Adjusted EBITDA may not be comparable to amounts reported by other companies. EBITDA and Adjusted EBITDA should not be used as a substitute for any GAAP financial measures for the purpose of evaluating our financial performance, financial position or cash flows. Adjusted Funds From Operations (“AFFO”): AFFO is a non-GAAP measure used by many investors and analysts to measure a real estate company’s operating performance by removing the effect of items that do not reflect ongoing property operations. To calculate AFFO, we further adjust FFO for certain items that are not added to net income in NAREIT’s definition of FFO, such as acquisition expenses, non-real estate-related depreciation and amortization (including amortization of lease incentives and tenant allowances), stock based compensation expenses, and any other non-comparable or non-operating items that do not relate to the operating performance of our properties. To calculate AFFO, we also adjust FFO to remove the effect of straight-line rent revenue, which represents the recognition of net unbilled rental income expected to be collected in future periods of a lease agreement that exceeds the actual contractual rent due periodically from tenants for their use of the leased real estate under each lease. Noncontrolling interest amounts represent adjustments to reflect only our share of straight line rent revenue. Our calculation of AFFO may differ from the methodology used for calculating AFFO by certain other REITs and, accordingly, our AFFO may not be comparable to AFFO reported by other REITs. AFFO should not be considered as an alternative to net income (computed in accordance with GAAP) as an indicator of our financial performance or to cash flow from operating activities (computed in accordance with GAAP) as an indicator of our liquidity. Acute: refers to a disease or condition with a rapid onset and short course. Acute Care Hospital (“ACH”): general medical and surgical hospitals that provide both inpatient and outpatient medical services and are owned and/or operated either by a non-profit or for-profit hospital or hospital system. These facilities often act as feeder hospitals to dedicated specialty facilities. Assisted Living Facility (“ALF”): residential care facilities that provide housing, meals, personal care and supportive services to older persons and disabled adults who are unable to live independently. They are intended to be a less costly alternative to more restrictive, institutional settings for individuals who do not require 24-hour nursing supervision. EBITDA: EBITDA is calculated as net income (computed in accordance with GAAP) plus interest expense, taxes, and depreciation and amortization.
Glossary EBITDAR: Represents earnings from the operator’s financial statements before interest, taxes, depreciation, amortization and rent. EBITDAR Rent Coverage: Represents the operator EBITDAR of our stabilized facilities for the trailing twelve months divided by the contractual lease rent for the same period. For the leases that have been in place for less than 12 months as of the date presented, the annualized base rent under the applicable lease as of such date is used. EBITDARM: Represents earnings from the operator’s financial statements before interest, taxes, depreciation, amortization, rent and management fees. EBITDARM Rent Coverage: Represents the operator EBITDARM of our stabilized facilities for the trailing twelve months divided by the contractual lease rent for the same period. For the leases that have been in place for less than 12 months as of the date presented, the annualized base rent under the applicable lease as of such date is used. Funds From Operations (“FFO”): FFO is a non-GAAP measure used by many investors and analysts that follow the real estate industry. FFO, as defined by the National Association of Real Estate Investment Trusts (“NAREIT”), represents net income (computed in accordance with GAAP), excluding gains (losses) on sales of real estate and impairments of real estate assets, plus real estate-related depreciation and amortization and after adjustments for unconsolidated partnerships and joint ventures. Noncontrolling interest amounts represent adjustments to reflect only our share of depreciation and amortization. We compute FFO in accordance with NAREIT’s definition, which may differ from the methodology for calculating FFO, or similarly titled measures, used by other companies. Historical cost accounting for real estate assets implicitly assumes that the value of real estate assets diminishes predictably over time. Since real estate values instead have historically risen or fallen with market conditions, most real estate industry investors consider FFO to be helpful in evaluating a real estate company’s operations. We believe that the presentation of FFO provides useful information to investors regarding our operating performance by excluding the effect of real-estate related depreciation and amortization, gains or losses from sales for real estate, including impairments, extraordinary items and the portion of items related to unconsolidated entities, all of which are based on historical cost accounting, and that FFO can facilitate comparisons of operating performance between periods and between REITs, even though FFO does not represent an amount that accrues directly to common stockholders. Our calculation of FFO may not be comparable to measures calculated by other companies that do not use the NAREIT definition of FFO or do not calculate FFO per diluted share in accordance with NAREIT guidance. FFO should not be considered as an alternative to net income (computed in accordance with GAAP) as an indicator of our financial performance or to cash flow from operating activities (computed in accordance with GAAP) as an indicator of our liquidity.
Glossary Gross assets: The carrying amount of total assets plus accumulated depreciation and amortization, as reported in the company’s consolidated financial statements. Inpatient Rehabilitation Facility (“IRF”): facilities that provide inpatient rehabilitation services for patients recovering from injuries, organ transplants, amputations, cardiovascular surgery, strokes, and complex neurological, orthopedic and other medical conditions following stabilization of their acute medical issues. Long-term Acute Care Hospital (“LTACH”): facilities designed for patients with serious medical problems that require intense, special treatment for an extended period of time (typically at least 25 days), offer more individualized and resource-intensive care than a skilled nursing facility, nursing home or acute rehabilitation facility, and patients are typically transferred to a long-term acute care hospital from the intensive care unit of a traditional hospital. Medical Office Building (“MOB”): single-tenant or multi-tenant buildings where doctors, physician practice groups, hospitals, hospital systems or other healthcare providers lease space and are typically located near or adjacent to acute care hospitals or other facilities where healthcare services are rendered. Medical office buildings can include outpatient surgical centers, diagnostic labs, physical therapy providers and physician office space in a single building. Occupancy: Occupancy is calculated by dividing the daily number of beds occupied each day during the period presented by the beds in operation (available) for the same period. Post-acute: the period of time following acute care, in which the patient continues to require elevated levels of medical treatment. Q-Mix: Quality mix is presented as non-Medicaid revenue as a percentage of total revenue. Skilled Nursing Facility (“SNF”): facilities that usually house elderly patients and provide restorative, rehabilitative and nursing care for patients not requiring more extensive and sophisticated treatment that may be available at acute care hospitals or long-term acute care hospitals. They are distinct from and offer a much higher level of care for older adults compared to senior housing facilities. Patients typically enter skilled nursing facilities after hospitalization. Stabilized Portfolio: As of June 30, 2016, our stabilized portfolio includes only our 16 stabilized skilled nursing facilities, our two stabilized long-term acute care hospitals, our one stabilized assisted living facility (that is connected to a skilled nursing facility in our portfolio) and our one stabilized inpatient rehabilitation facility. Our non-stabilized properties as of June 30, 2016 were Lakeway Hospital, Mountain’s Edge Hospital and Mira Vista. We consider a facility to be non-stabilized if it is a newly completed development, is undergoing or has recently undergone a significant addition or renovation, or is being repositioned or transitioned to new operators, but in no event beyond 24 months after the date of classification as non-stabilized.
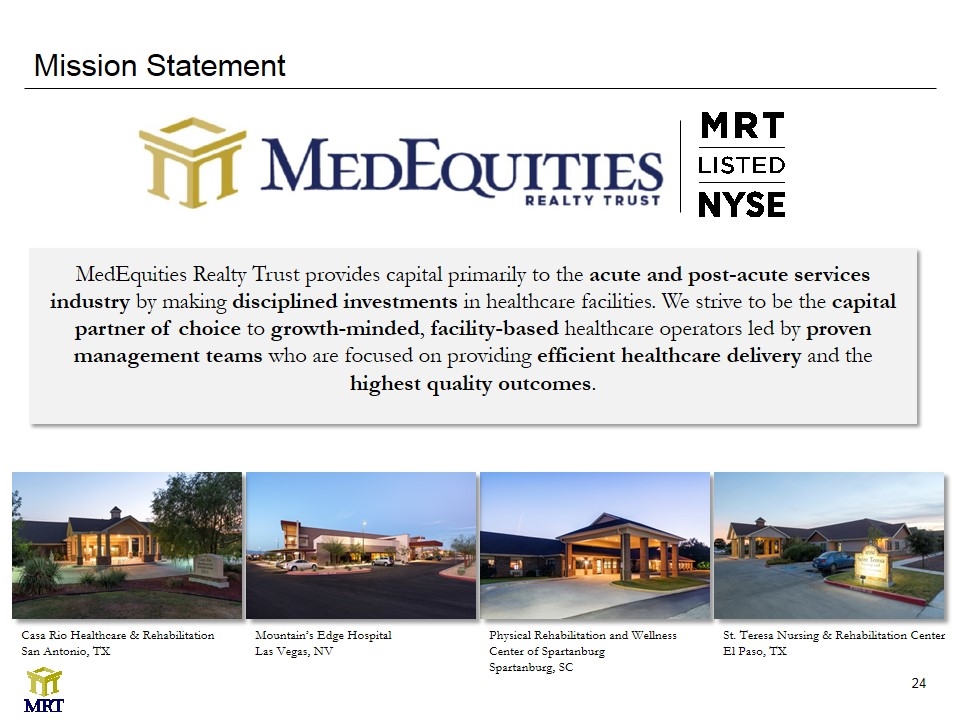
Mission Statement MedEquities Realty Trust provides capital primarily to the acute and post-acute services industry by making disciplined investments in healthcare facilities. We strive to be the capital partner of choice to growth-minded, facility-based healthcare operators led by proven management teams who are focused on providing efficient healthcare delivery and the highest quality outcomes. Mountain’s Edge Hospital Las Vegas, NV Casa Rio Healthcare & Rehabilitation San Antonio, TX Physical Rehabilitation and Wellness Center of Spartanburg Spartanburg, SC St. Teresa Nursing & Rehabilitation Center El Paso, TX


