AMERICAN AXLE & MANUFACTURING HOLDINGS, INC. LENDER PRESENTATION FEBRUARY 23, 2017
Today’s Presenters * David Dauch – Chairman of the Board & Chief Executive OfficerChristopher May – Vice President & Chief Financial OfficerShannon Curry – TreasurerJason Parsons – Director, Investor Relations American Axle J.P. Morgan David Walker – Managing DirectorGeoff Benson – Managing Director
2016 AAM Highlights2017 AAM TargetsAAM’s 2017 – 2019 New Business BacklogTechnology LeadershipAcquisition of MPGTransaction OverviewQuestions Agenda *
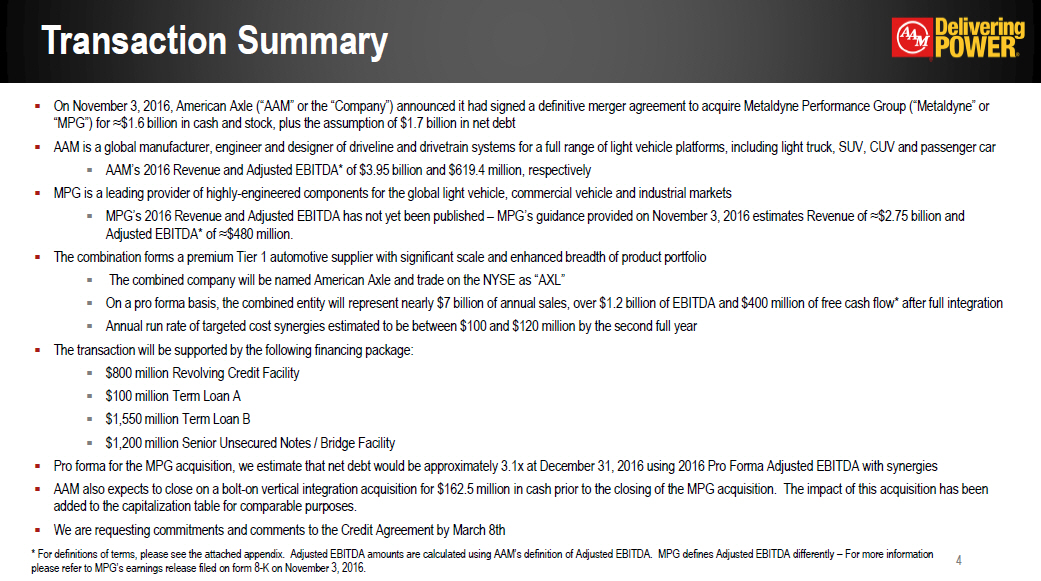
Transaction Summary * On November 3, 2016, American Axle (“AAM” or the “Company”) announced it had signed a definitive merger agreement to acquire Metaldyne Performance Group (“Metaldyne” or “MPG”) for ≈$1.6 billion in cash and stock, plus the assumption of $1.7 billion in net debtAAM is a global manufacturer, engineer and designer of driveline and drivetrain systems for a full range of light vehicle platforms, including light truck, SUV, CUV and passenger carAAM’s 2016 Revenue and Adjusted EBITDA* of $3.95 billion and $619.4 million, respectivelyMPG is a leading provider of highly-engineered components for the global light vehicle, commercial vehicle and industrial marketsMPG’s 2016 Revenue and Adjusted EBITDA has not yet been published – MPG’s guidance provided on November 3, 2016 estimates Revenue of ≈$2.75 billion and Adjusted EBITDA* of ≈$480 million.The combination forms a premium Tier 1 automotive supplier with significant scale and enhanced breadth of product portfolio The combined company will be named American Axle and trade on the NYSE as “AXL”On a pro forma basis, the combined entity will represent nearly $7 billion of annual sales, over $1.2 billion of EBITDA and $400 million of free cash flow* after full integrationAnnual run rate of targeted cost synergies estimated to be between $100 and $120 million by the second full yearThe transaction will be supported by the following financing package:$800 million Revolving Credit Facility $100 million Term Loan A$1,550 million Term Loan B$1,200 million Senior Unsecured Notes / Bridge Facility Pro forma for the MPG acquisition, we estimate that net debt would be approximately 3.1x at December 31, 2016 using 2016 Pro Forma Adjusted EBITDA with synergiesAAM also expects to close on a bolt-on vertical integration acquisition for $162.5 million in cash prior to the closing of the MPG acquisition. The impact of this acquisition has been added to the capitalization table for comparable purposes.We are requesting commitments and comments to the Credit Agreement by March 8th * For definitions of terms, please see the attached appendix. Adjusted EBITDA amounts are calculated using AAM’s definition of Adjusted EBITDA. MPG defines Adjusted EBITDA differently – For more information please refer to MPG’s earnings release filed on form 8-K on November 3, 2016.
AAM HIGHLIGHTS AND TARGETS *
Some of the information presented in this document and discussions that follow, including, without limitation, statements with respect to the proposed acquisition of Metaldyne Performance Group, Inc (“MPG”) and the anticipated consequences and benefits of the acquisition, the targeted close date for the acquisition, product development, market trends, price, expected growth and earnings, cash flow generation, costs and cost synergies, portfolio diversification, economic trends, outlook and all other information relating to matters that are not historical facts may constitute forward-looking statements within the meaning of the Private Securities Litigation Reform Act of 1995. There can be no assurance that actual results will not differ materially. Factors that could cause actual results to differ materially include, without limitation: the receipt and timing of necessary regulatory approvals; the ability to finance the acquisition; the ability to successfully operate and integrate MPG’s operations and realize estimated synergies; reduced purchases of our products by General Motors Company (GM), FCA US LLC (FCA), or other customers; reduced demand for our customers' products (particularly light trucks and sport utility vehicles (SUVs) produced by GM and FCA); our ability to develop and produce new products that reflect market demand; lower-than-anticipated market acceptance of new or existing products; our ability to respond to changes in technology, increased competition or pricing pressures; our ability to attract new customers and programs for new products; our ability to achieve the level of cost reductions required to sustain global cost competitiveness; supply shortages or price increases in raw materials, utilities or other operating supplies for us or our customers as a result of natural disasters or otherwise; liabilities arising from warranty claims, product recall or field actions, product liability and legal proceedings to which we are or may become a party, or the impact of product recall or field actions on our customers; our ability or our customers' and suppliers' ability to successfully launch new product programs on a timely basis; our ability to realize the expected revenues from our new and incremental business backlog; risks inherent in our international operations (including adverse changes in trade agreements, tariffs, immigration policies, political stability, taxes and other law changes, potential disruptions of production and supply, tariff and trade restrictions and currency rate fluctuations, including those resulting from the United Kingdom's vote to exit the European Union); negative or unexpected tax consequences; our ability to consummate and integrate acquisitions and joint ventures; global economic conditions; our ability to maintain satisfactory labor relations and avoid work stoppages; our suppliers', our customers' and their suppliers' ability to maintain satisfactory labor relations and avoid work stoppages; price volatility in, or reduced availability of, fuel; our ability to protect our intellectual property and successfully defend against assertions made against us; our ability to successfully maintain the security of, and integrate MPG’s, information technology networks and systems; our ability to attract and retain key associates; availability of financing for working capital, capital expenditures, research and development (R&D) or other general corporate purposes including acquisitions, as well as our ability to comply with financial covenants; our customers' and suppliers' availability of financing for working capital, capital expenditures, R&D or other general corporate purposes; changes in liabilities arising from pension and other postretirement benefit obligations; risks of noncompliance with environmental laws and regulations or risks of environmental issues that could result in unforeseen costs at our facilities; adverse changes in laws, government regulations or market conditions affecting our products or our customers' products (such as the Corporate Average Fuel Economy (CAFE) regulations); our ability or our customers' and suppliers' ability to comply with the Dodd-Frank Act and other regulatory requirements and the potential costs of such compliance; and the other factors detailed from time to time in the reports we file with the Securities and Exchange Commission (“SEC”), including those described under "Risk Factors" in our Annual Report on Form 10-K and our Quarterly Reports on Form 10-Q. These forward-looking statements speak only as of the date of this communication. We expressly disclaim any obligation or undertaking to disseminate any updates or revisions to any forward-looking statement contained herein to reflect any change in our expectations with regard thereto or any change in events, conditions or circumstances on which any such statement is based.Information with respect to MPG, including non-GAAP information is taken or derived from MPG’s public filings and management estimates and we take no responsibility for the accuracy or completeness of such information. It should be noted that this presentation contains certain financial measures, including Adjusted EBITDA and Adjusted free cash flow, that are not required by, or presented in accordance with, accounting principles generally accepted in the United States, or GAAP. These measures are presented here to provide additional useful measurements to review our operations, provide transparency to investors and enable period-to-period comparability of financial performance. A description of non-GAAP financial measures that we use to evaluate our operations and financial performance, and reconciliation of these non-GAAP financial measures to the most directly comparable financial measures calculated and reported in accordance with GAAP, can be found starting on slide 49 under “Reconciliation of Non-GAAP Measures”. Forward Looking Statements *
Important Information for Stockholders and Investors This presentation is provided for informational purposes only and is neither an offer to purchase nor a solicitation of an offer to sell shares of AAM or MPG. In connection with the proposed acquisition of MPG, AAM has filed with the SEC a Registration Statement on Form S-4 (the “Registration Statement”), which includes the preliminary joint proxy statement/prospectus of AAM and MPG and which also constitutes a preliminary prospectus of AAM. The information in the preliminary joint proxy statement/prospectus is not complete and may be changed. The definitive joint proxy statement/prospectus will be mailed to stockholders of AAM and MPG after the Registration Statement is declared effective by the SEC. Investors are urged to read the Registration Statement and joint proxy statement/prospectus (including any amendments or supplements thereto) and other documents filed by AAM and MPG with the SEC in connection with the proposed acquisition, as these documents contain (or will contain) important information. Those documents, as well as AAM’s and MPG’s other public filings with the SEC, may be obtained without charge at the SEC’s website at www.sec.gov. Investors may also obtain a free copy of the Registration Statement and joint proxy statement/prospectus and the filings with the SEC that are incorporated by reference in the Registration Statement and joint proxy statement/prospectus by directing a request to AAM at www.aam.com.Participants in Solicitation AAM, MPG and their respective directors, executive officers and other members of their management and employees may be deemed to be participants in a solicitation of proxies from their respective stockholders in connection with the proposed transaction. Information regarding AAM’s directors and executive officers is available in AAM’s proxy statement for its 2016 annual meeting of stockholders, which was filed with the SEC on March 24, 2016. Information regarding MPG’s directors and executive officers is available in MPG’s proxy statement for its 2016 annual meeting of stockholders, which was filed with the SEC on April 11, 2016. Other information regarding the participants in the proxy solicitation and a description of their direct and indirect interests, by security holdings or otherwise, is contained in the Registration Statement and joint proxy statement/prospectus (or will be contained in any amendments or supplements thereto) and other relevant materials filed with the SEC. These documents can be obtained free of charge from the sources indicated above. Other Information *
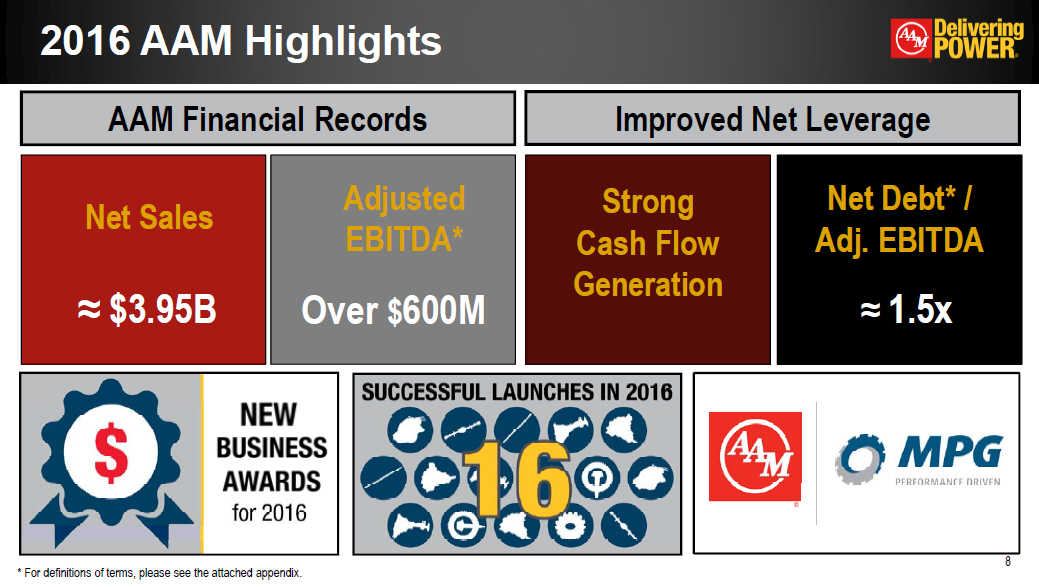
2016 AAM Highlights Net Debt* / Adj. EBITDA≈ 1.5x AAM Financial Records Improved Net Leverage Net Sales Adjusted EBITDA* Strong Cash Flow Generation Net Debt* / Adj. EBITDA ≈ $3.95B Over $600M ≈ 1.5x * For definitions of terms, please see the attached appendix. *

* 2016 Actuals Net Sales $3.95B Adjusted EBITDA* $619.4M or 15.7% of sales Adjusted Free Cash Flow* $198.6M 2016 AAM Financial Performance * For definitions of terms, please see the attached appendix. Adjusted EBITDA and Adjusted Free Cash Flow exclude the impact of restructuring and acquisition-related costs and non-recurring items. Record sales and profit in 2016Adjusted free cash flow includes the impact of ≈ $30 million of payments related to Mexican transfer pricing matters and a $20 million customer collection related to an upcoming capacity increase requirement.
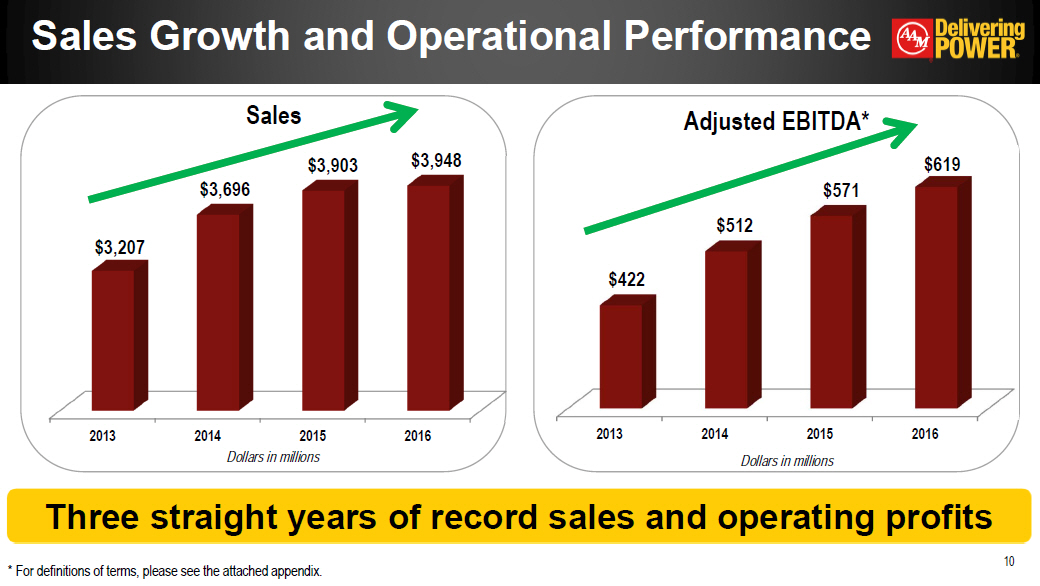
* Sales Growth and Operational Performance Three straight years of record sales and operating profits Dollars in millions $123.1 $189.5 Dollars in millions * For definitions of terms, please see the attached appendix.
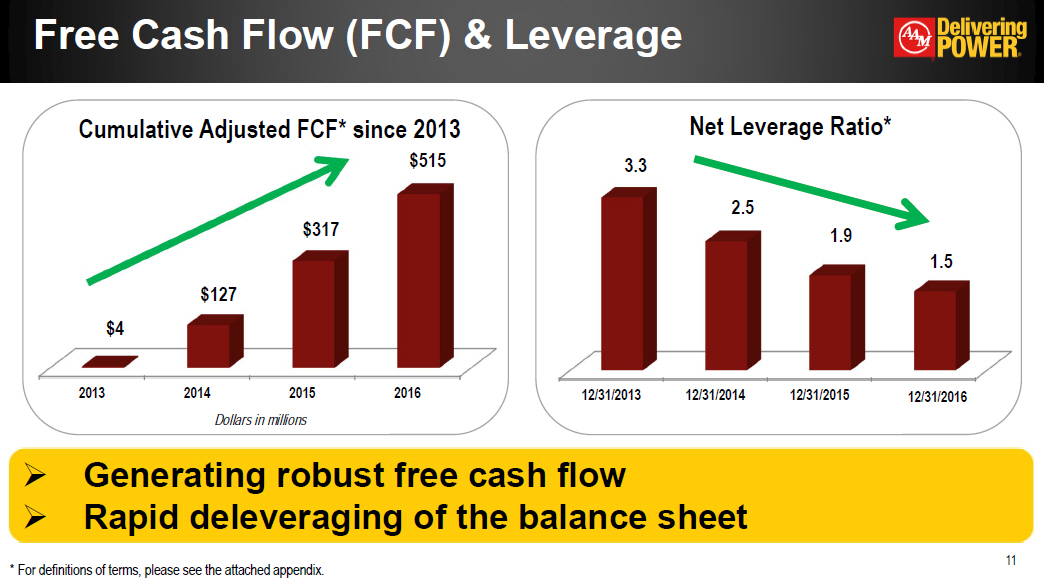
* Free Cash Flow (FCF) & Leverage Generating robust free cash flow Rapid deleveraging of the balance sheet Dollars in millions $123.1 $189.5 * For definitions of terms, please see the attached appendix.
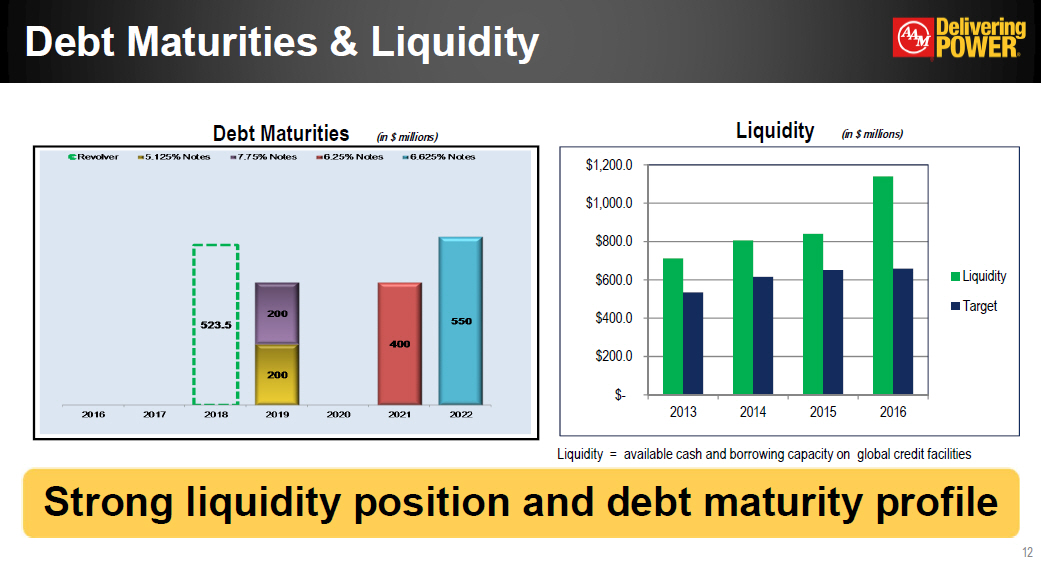
Debt Maturities & Liquidity * Strong liquidity position and debt maturity profile Liquidity (in $ millions) Debt Maturities (in $ millions) Liquidity = available cash and borrowing capacity on global credit facilities
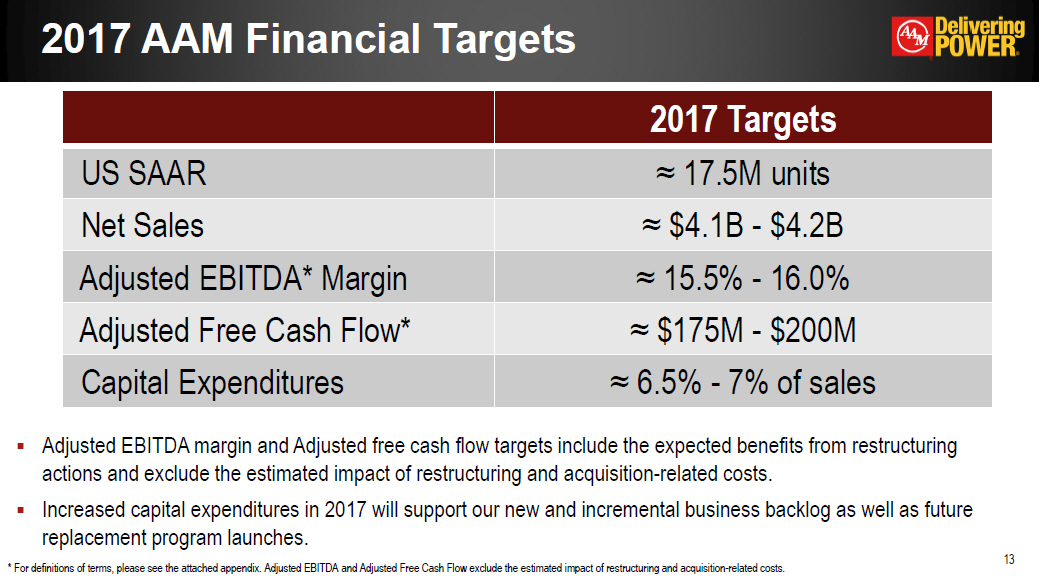
2017 AAM Financial Targets * 2017 Targets US SAAR ≈ 17.5M units Net Sales ≈ $4.1B - $4.2B Adjusted EBITDA* Margin ≈ 15.5% - 16.0% Adjusted Free Cash Flow* ≈ $175M - $200M Capital Expenditures ≈ 6.5% - 7% of sales Adjusted EBITDA margin and Adjusted free cash flow targets include the expected benefits from restructuring actions and exclude the estimated impact of restructuring and acquisition-related costs.Increased capital expenditures in 2017 will support our new and incremental business backlog as well as future replacement program launches. * For definitions of terms, please see the attached appendix. Adjusted EBITDA and Adjusted Free Cash Flow exclude the estimated impact of restructuring and acquisition-related costs.
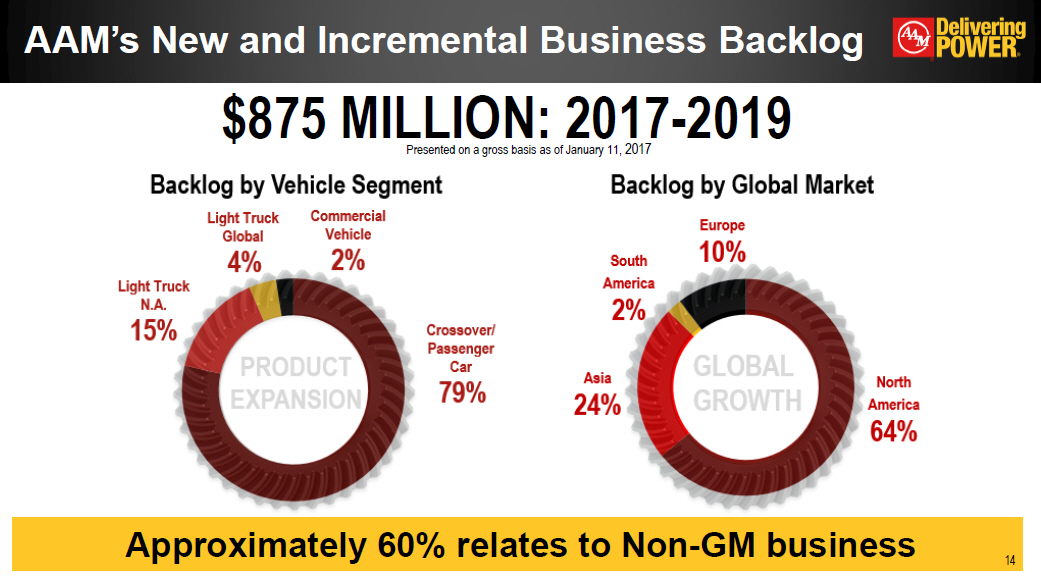
AAM’s New and Incremental Business Backlog $875 MILLION: 2017-2019 Presented on a gross basis as of January 11, 2017 Approximately 60% relates to Non-GM business *
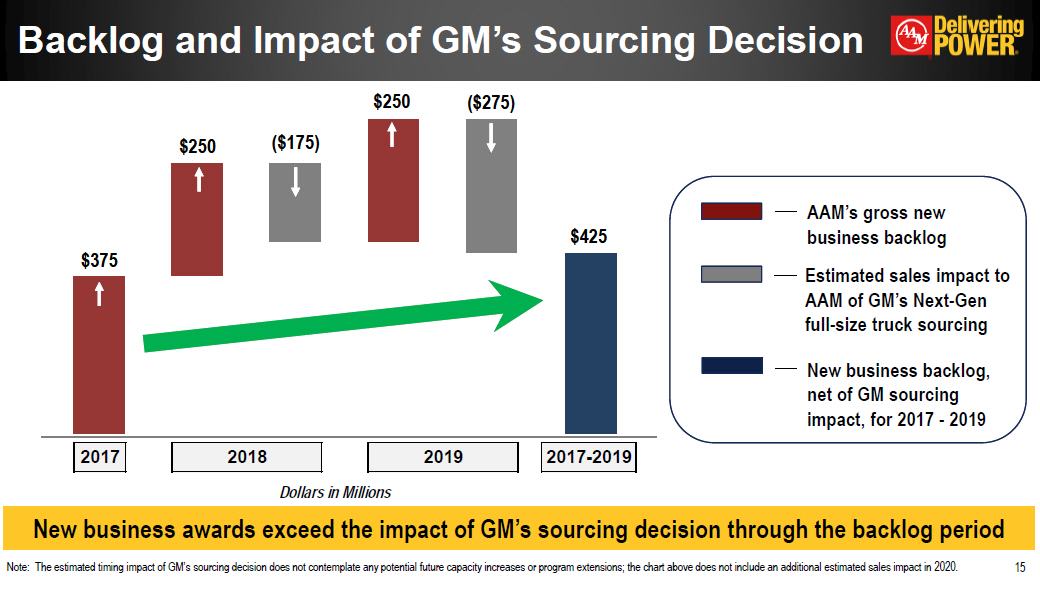
Backlog and Impact of GM’s Sourcing Decision * New business awards exceed the impact of GM’s sourcing decision through the backlog period AAM’s gross new business backlog Estimated sales impact to AAM of GM’s Next-Gen full-size truck sourcing New business backlog, net of GM sourcing impact, for 2017 - 2019 $375 $250 ($175) $250 ($275) $425 Note: The estimated timing impact of GM’s sourcing decision does not contemplate any potential future capacity increases or program extensions; the chart above does not include an additional estimated sales impact in 2020. Dollars in Millions
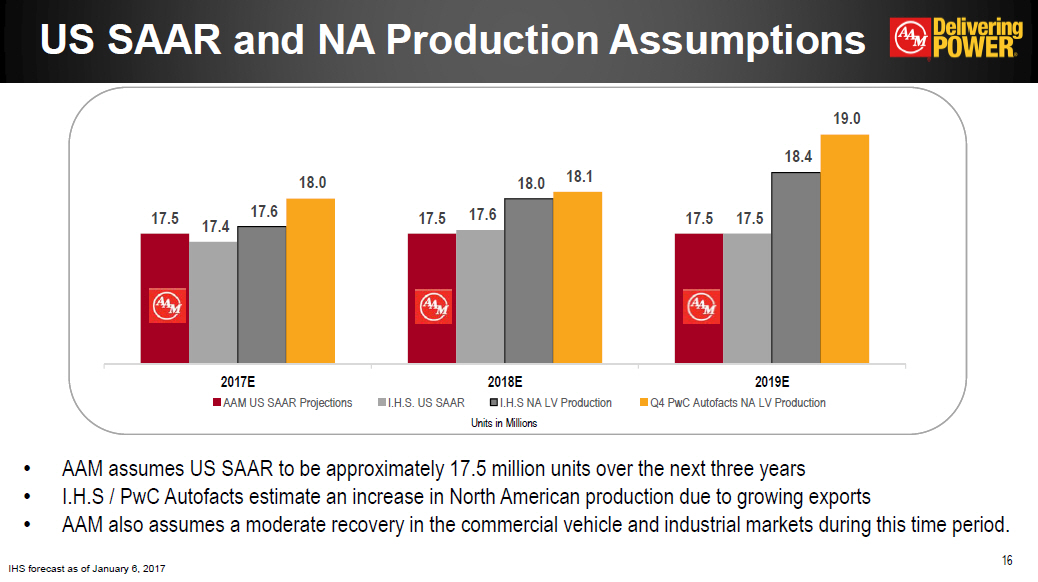
US SAAR and NA Production Assumptions * AAM assumes US SAAR to be approximately 17.5 million units over the next three yearsI.H.S / PwC Autofacts estimate an increase in North American production due to growing exportsAAM also assumes a moderate recovery in the commercial vehicle and industrial markets during this time period. IHS forecast as of January 6, 2017
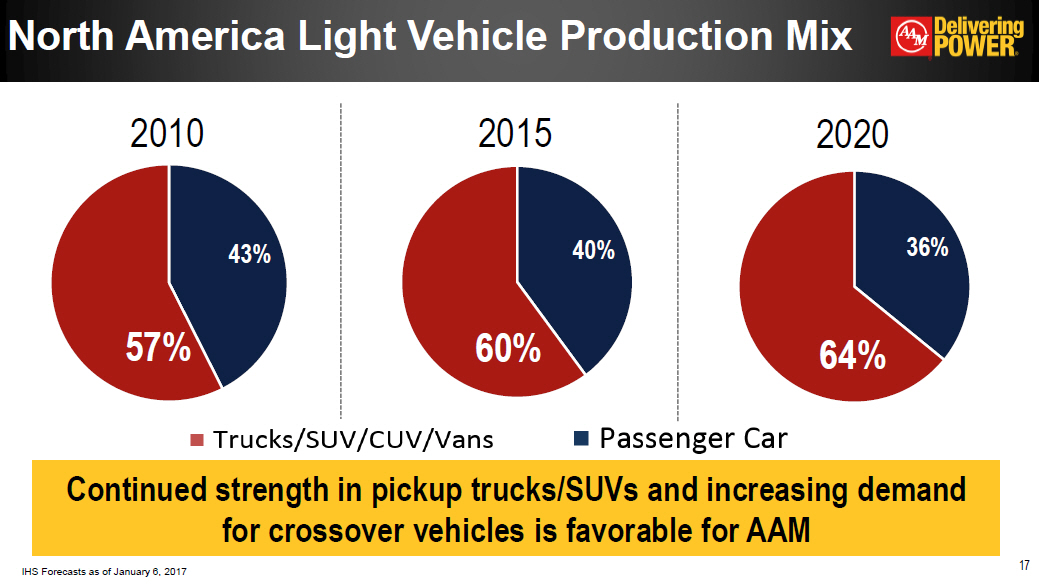
* 2010 2015 2020 North America Light Vehicle Production Mix Continued strength in pickup trucks/SUVs and increasing demand for crossover vehicles is favorable for AAM IHS Forecasts as of January 6, 2017
TECHNOLOGY LEADERSHIP *
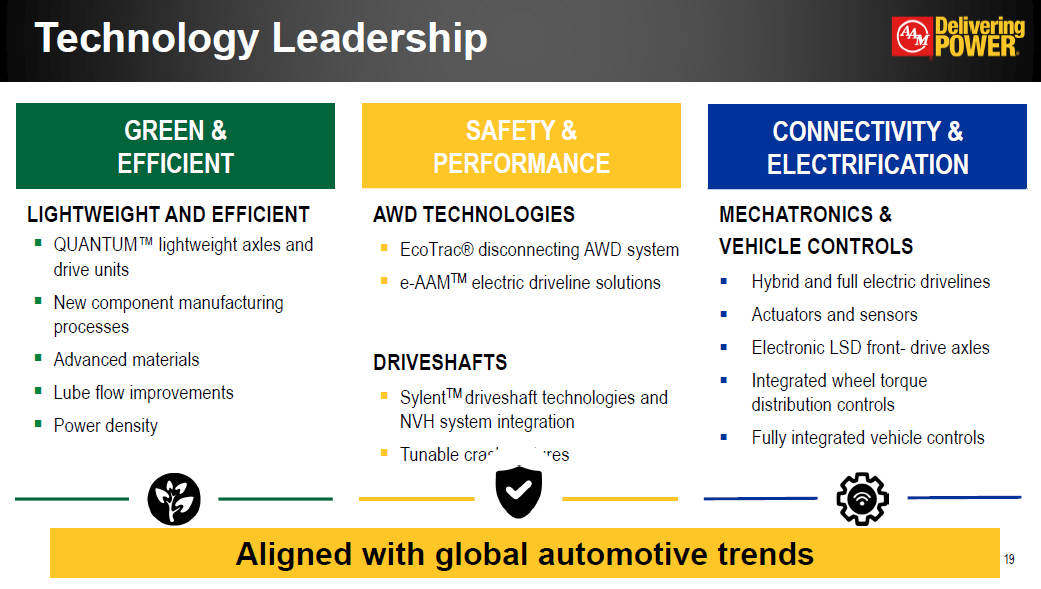
* Technology Leadership LIGHTWEIGHT AND EFFICIENTQUANTUM™ lightweight axles and drive unitsNew component manufacturing processesAdvanced materialsLube flow improvementsPower density GREEN & EFFICIENT SAFETY & PERFORMANCE CONNECTIVITY & ELECTRIFICATION MECHATRONICS & VEHICLE CONTROLSHybrid and full electric drivelinesActuators and sensorsElectronic LSD front- drive axlesIntegrated wheel torque distribution controlsFully integrated vehicle controls AWD TECHNOLOGIESEcoTrac® disconnecting AWD systeme-AAMTM electric driveline solutionsDRIVESHAFTSSylentTM driveshaft technologies and NVH system integration Tunable crash features Aligned with global automotive trends
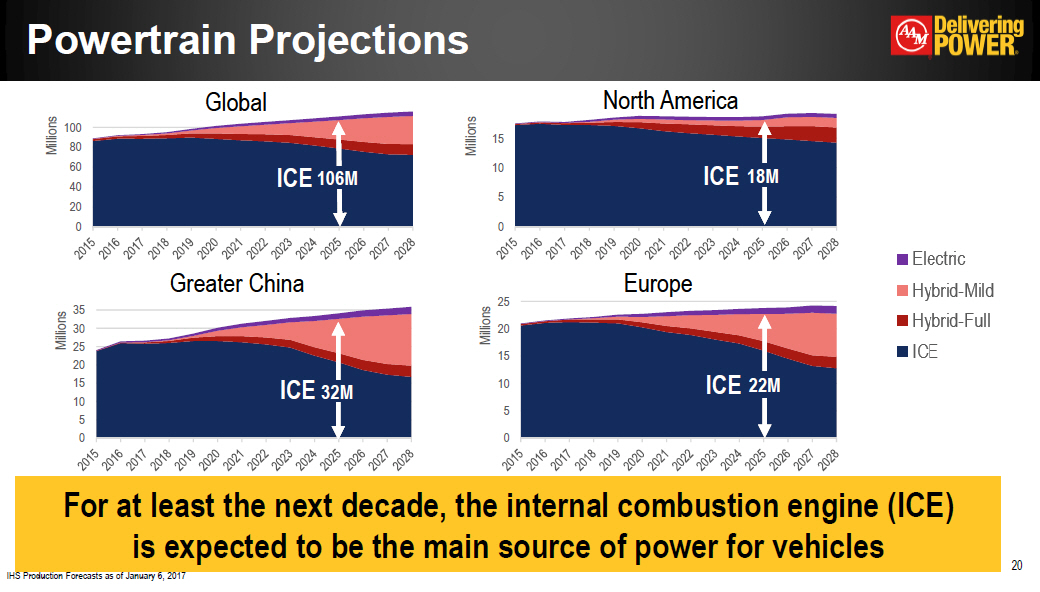
Powertrain Projections * Global North America For at least the next decade, the internal combustion engine (ICE) is expected to be the main source of power for vehicles Greater China Europe 106M 18M 32M 22M ICE ICE ICE ICE IHS Production Forecasts as of January 6, 2017
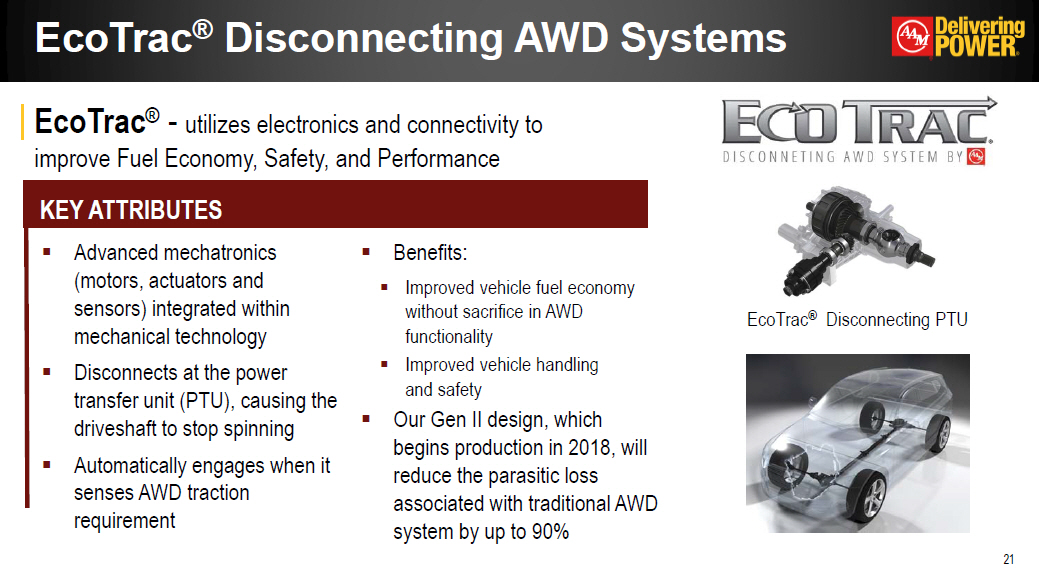
* EcoTrac® Disconnecting AWD Systems EcoTrac® Disconnecting PTU KEY ATTRIBUTES EcoTrac® - utilizes electronics and connectivity to improve Fuel Economy, Safety, and Performance
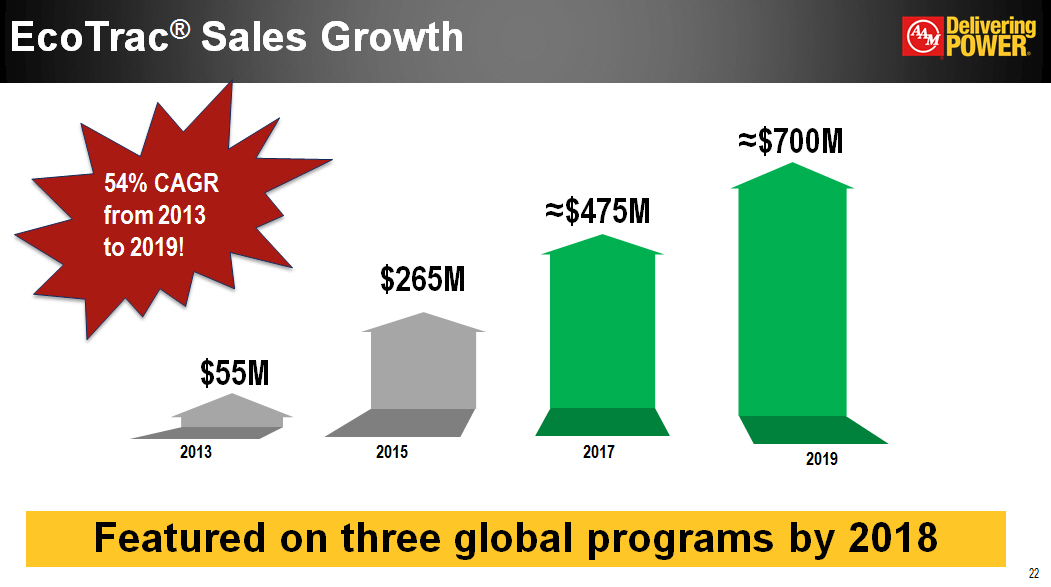
* EcoTrac® Sales Growth $55M ≈$700M 54% CAGR from 2013 to 2019! Featured on three global programs by 2018 $265M ≈$475M
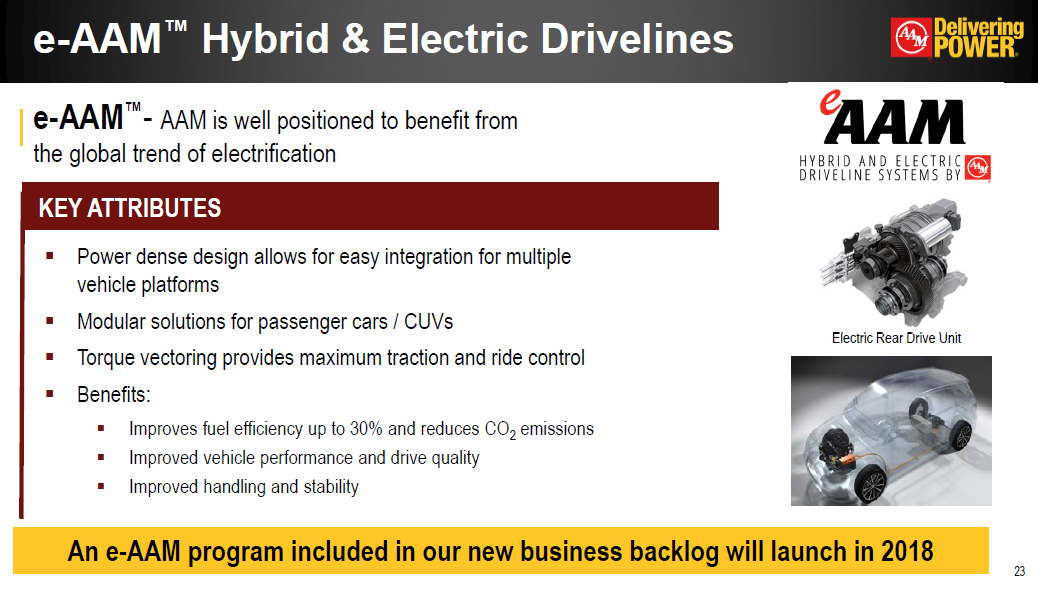
* e-AAM™ Hybrid & Electric Drivelines Power dense design allows for easy integration for multiple vehicle platformsModular solutions for passenger cars / CUVsTorque vectoring provides maximum traction and ride control Benefits:Improves fuel efficiency up to 30% and reduces CO2 emissionsImproved vehicle performance and drive quality Improved handling and stability Electric Rear Drive Unit KEY ATTRIBUTES e-AAM™- AAM is well positioned to benefit from the global trend of electrification An e-AAM program included in our new business backlog will launch in 2018
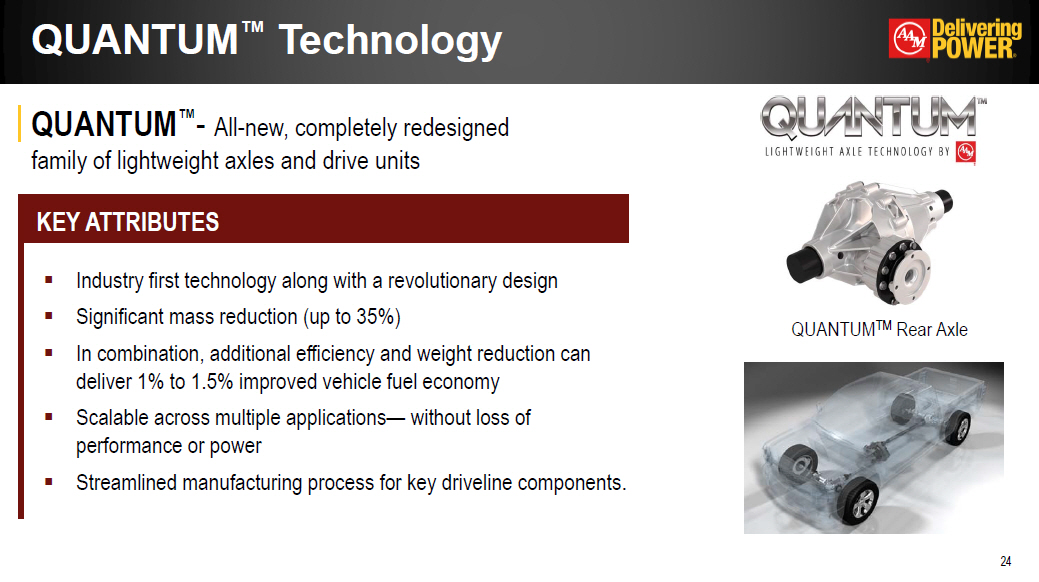
* QUANTUM™ Technology Industry first technology along with a revolutionary designSignificant mass reduction (up to 35%)In combination, additional efficiency and weight reduction can deliver 1% to 1.5% improved vehicle fuel economyScalable across multiple applications— without loss of performance or powerStreamlined manufacturing process for key driveline components. QUANTUMTM Rear Axle KEY ATTRIBUTES QUANTUM™- All-new, completely redesigned family of lightweight axles and drive units

AAM’S ACQUISITION OF MPG (METALDYNE PERFORMANCE GROUP) Increased Global Scale │ Expanded Product Portfolio │ Accelerated Diversification │ Enhanced Cash Flow Generation
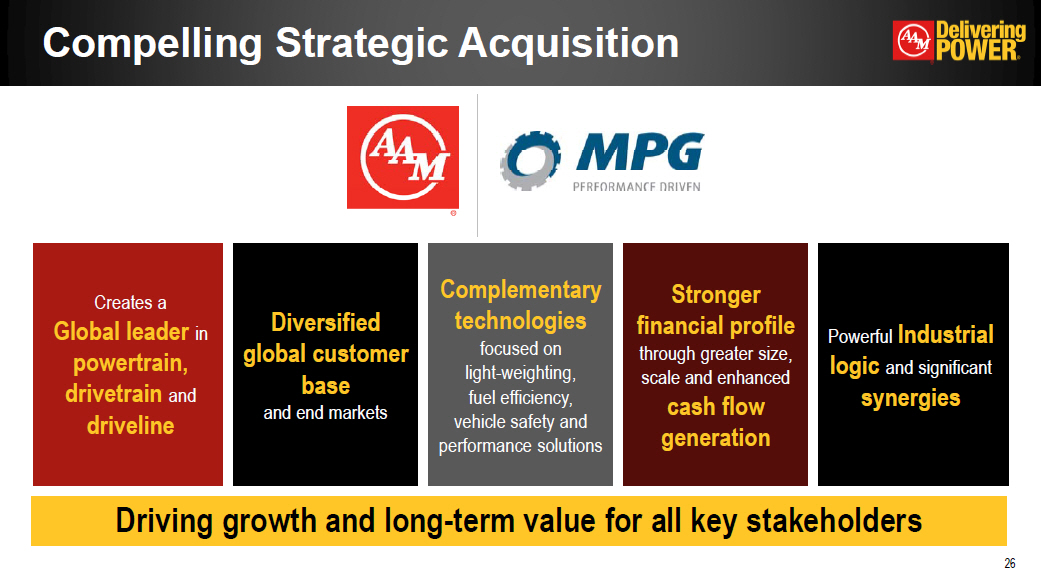
Driving growth and long-term value for all key stakeholders Creates a Global leader in powertrain, drivetrain and driveline Diversified global customer base and end markets Complementary technologies focused on light-weighting, fuel efficiency, vehicle safety and performance solutions Stronger financial profile through greater size, scale and enhanced cash flow generation Powerful Industrial logic and significant synergies Compelling Strategic Acquisition *
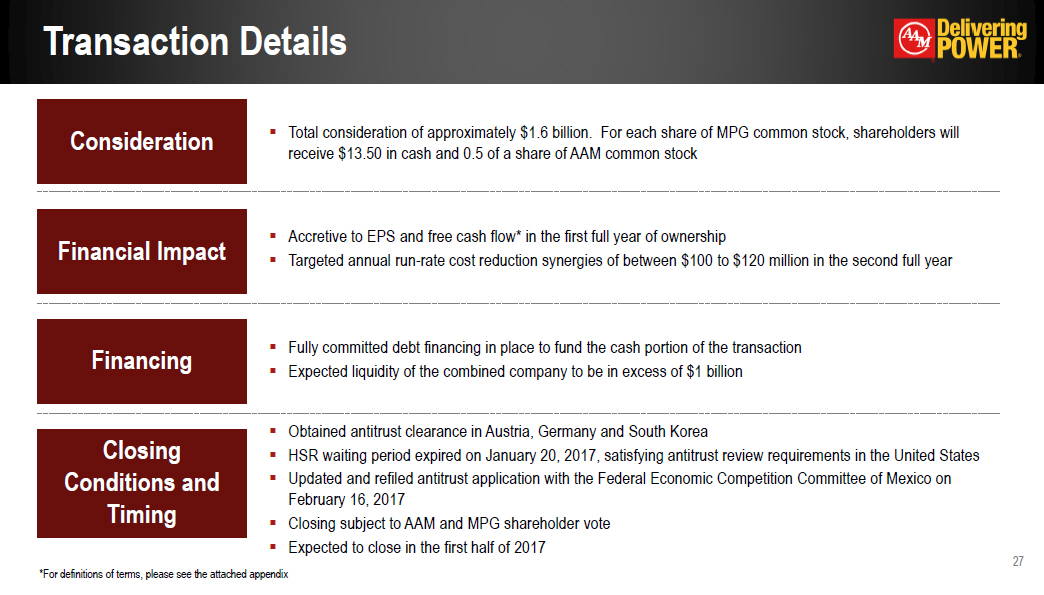
Transaction Details * Consideration Total consideration of approximately $1.6 billion. For each share of MPG common stock, shareholders will receive $13.50 in cash and 0.5 of a share of AAM common stock Financial Impact Accretive to EPS and free cash flow* in the first full year of ownershipTargeted annual run-rate cost reduction synergies of between $100 to $120 million in the second full year Fully committed debt financing in place to fund the cash portion of the transactionExpected liquidity of the combined company to be in excess of $1 billion Obtained antitrust clearance in Austria, Germany and South KoreaHSR waiting period expired on January 20, 2017, satisfying antitrust review requirements in the United StatesUpdated and refiled antitrust application with the Federal Economic Competition Committee of Mexico on February 16, 2017Closing subject to AAM and MPG shareholder voteExpected to close in the first half of 2017 Financial Impact Consideration Financing Closing Conditions and Timing *For definitions of terms, please see the attached appendix
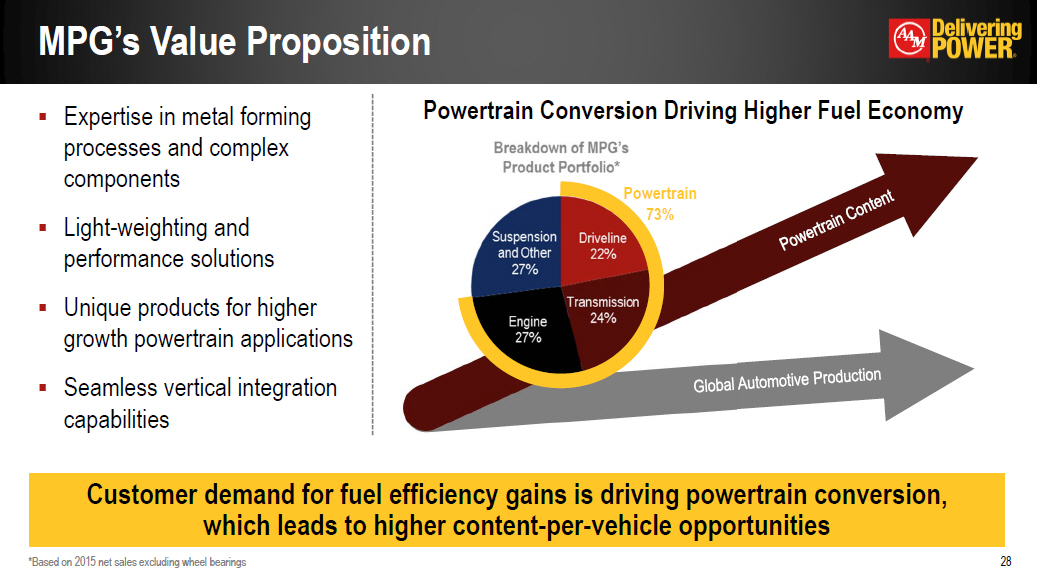
Expertise in metal forming processes and complex componentsLight-weighting and performance solutionsUnique products for higher growth powertrain applicationsSeamless vertical integration capabilities MPG’s Value Proposition * Powertrain73% Powertrain Content Global Automotive Production Powertrain Conversion Driving Higher Fuel Economy Customer demand for fuel efficiency gains is driving powertrain conversion, which leads to higher content-per-vehicle opportunities *Based on 2015 net sales excluding wheel bearings
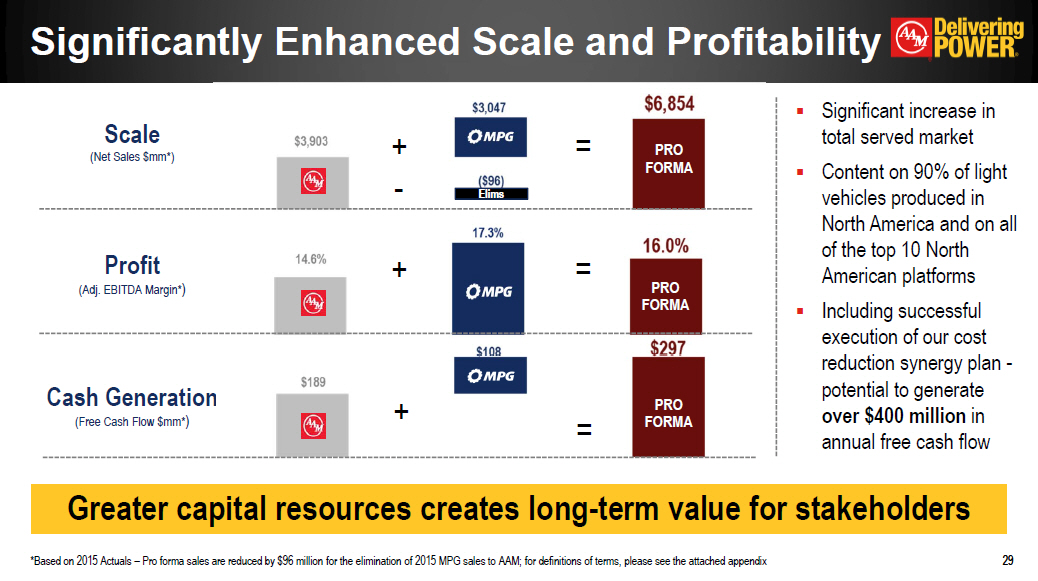
Significantly Enhanced Scale and Profitability * Scale(Net Sales $mm*) Profit(Adj. EBITDA Margin*) Cash Generation(Free Cash Flow $mm*) Significant increase in total served marketContent on 90% of light vehicles produced in North America and on all of the top 10 North American platformsIncluding successful execution of our cost reduction synergy plan - potential to generate over $400 million in annual free cash flow PROFORMA PROFORMA PROFORMA + + + = = = * Greater capital resources creates long-term value for stakeholders - Elims *Based on 2015 Actuals – Pro forma sales are reduced by $96 million for the elimination of 2015 MPG sales to AAM; for definitions of terms, please see the attached appendix
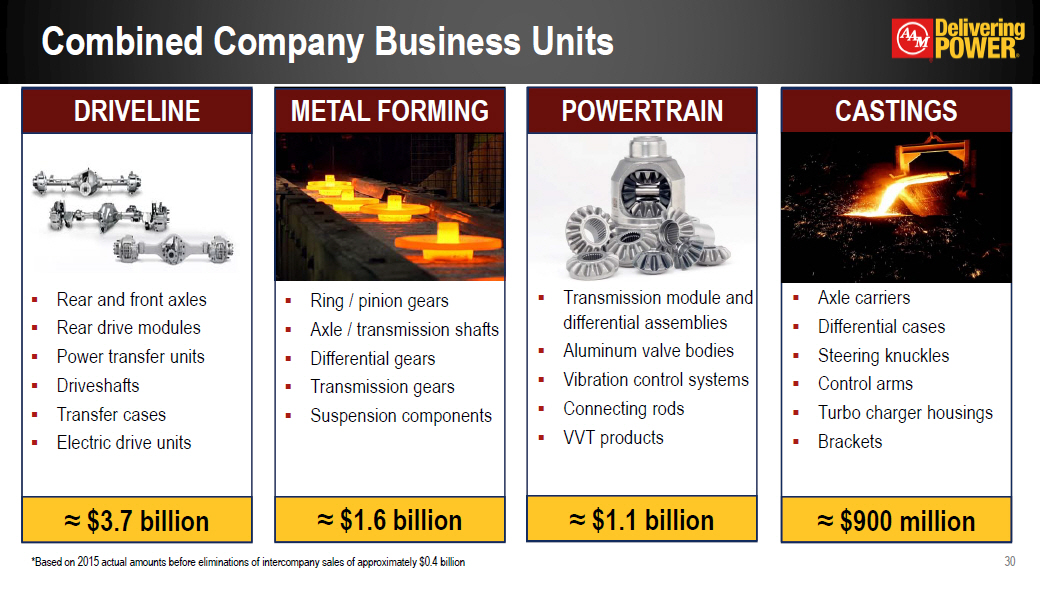
Combined Company Business Units * Rear and front axlesRear drive modulesPower transfer unitsDriveshaftsTransfer casesElectric drive units ≈ $3.7 billion DRIVELINE Ring / pinion gearsAxle / transmission shaftsDifferential gearsTransmission gearsSuspension components ≈ $1.6 billion METAL FORMING Transmission module and differential assembliesAluminum valve bodiesVibration control systemsConnecting rodsVVT products ≈ $1.1 billion POWERTRAIN Axle carriersDifferential casesSteering knucklesControl armsTurbo charger housingsBrackets ≈ $900 million *Based on 2015 actual amounts before eliminations of intercompany sales of approximately $0.4 billion
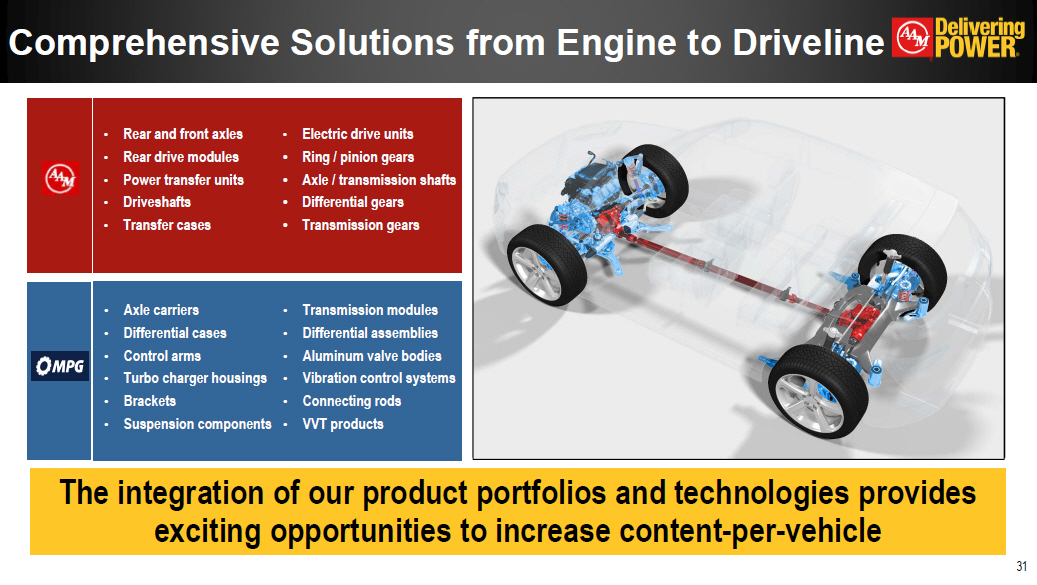
Comprehensive Solutions from Engine to Driveline * The integration of our product portfolios and technologies provides exciting opportunities to increase content-per-vehicle
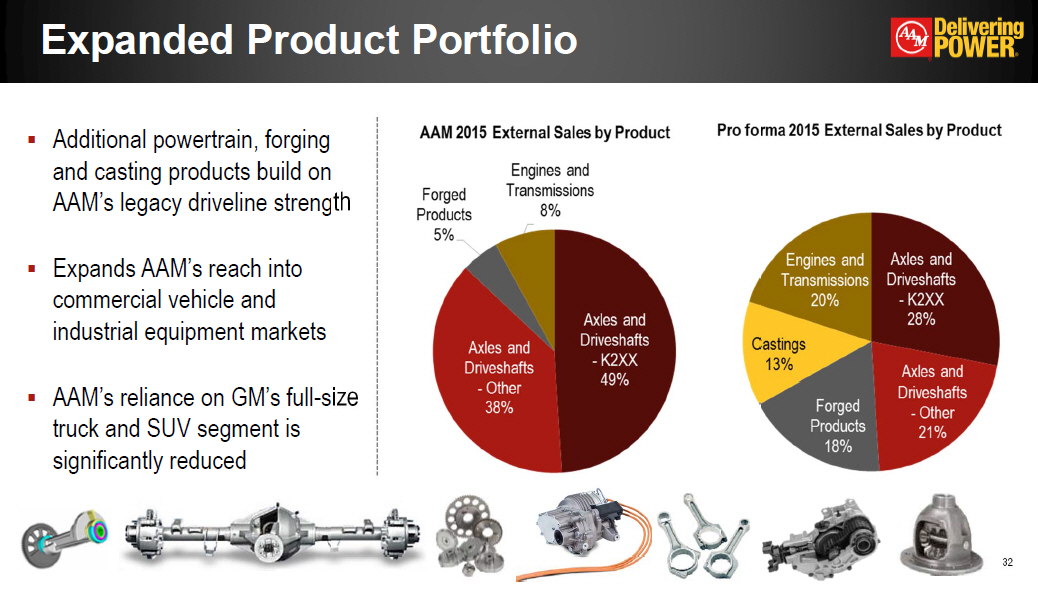
Additional powertrain, forging and casting products build on AAM’s legacy driveline strengthExpands AAM’s reach into commercial vehicle and industrial equipment marketsAAM’s reliance on GM’s full-size truck and SUV segment is significantly reduced Expanded Product Portfolio *
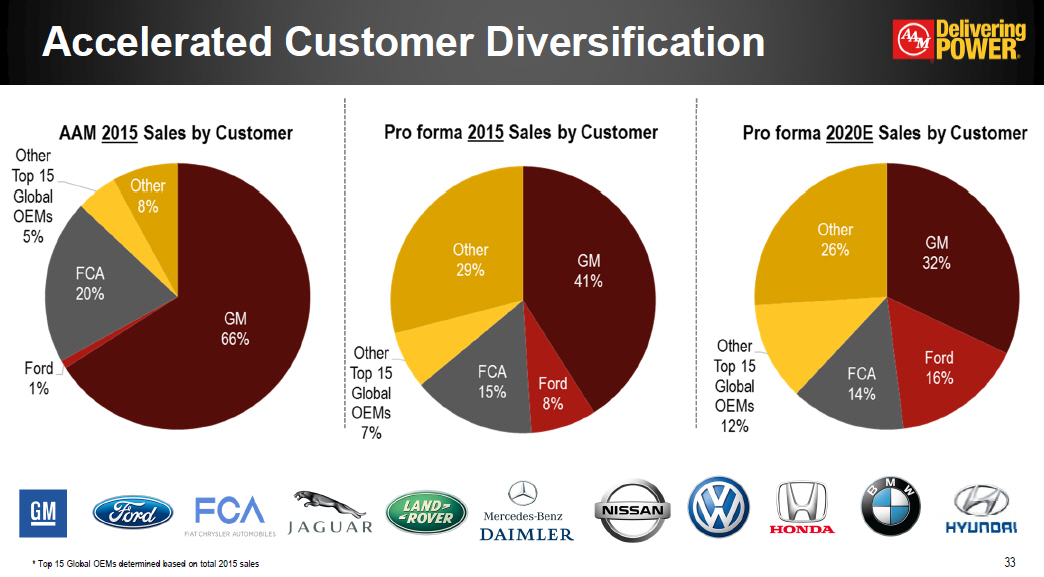
Accelerated Customer Diversification * * Top 15 Global OEMs determined based on total 2015 sales
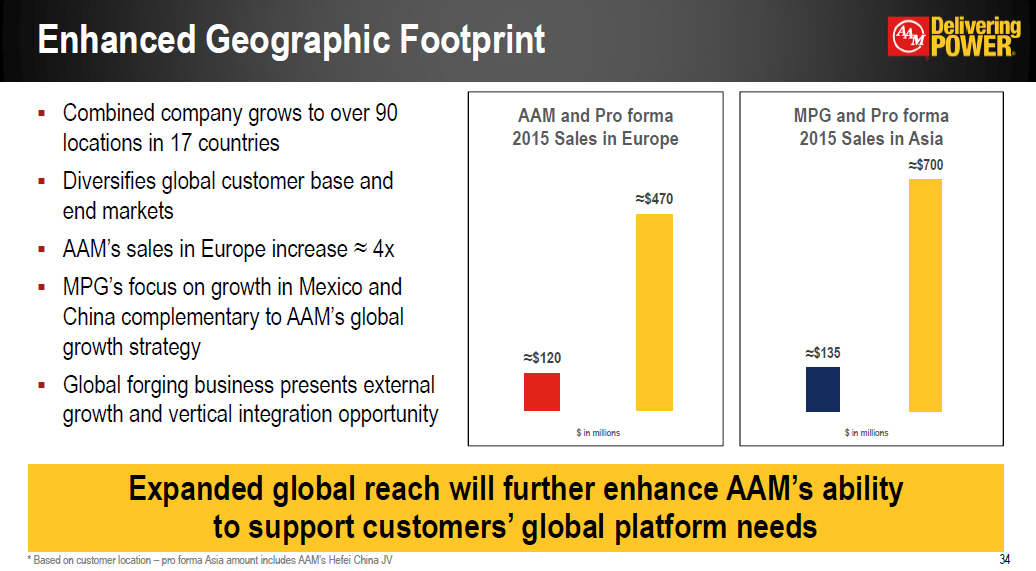
Combined company grows to over 90 locations in 17 countriesDiversifies global customer base and end marketsAAM’s sales in Europe increase ≈ 4xMPG’s focus on growth in Mexico and China complementary to AAM’s global growth strategyGlobal forging business presents external growth and vertical integration opportunity Enhanced Geographic Footprint * Expanded global reach will further enhance AAM’s ability to support customers’ global platform needs * Based on customer location – pro forma Asia amount includes AAM’s Hefei China JV
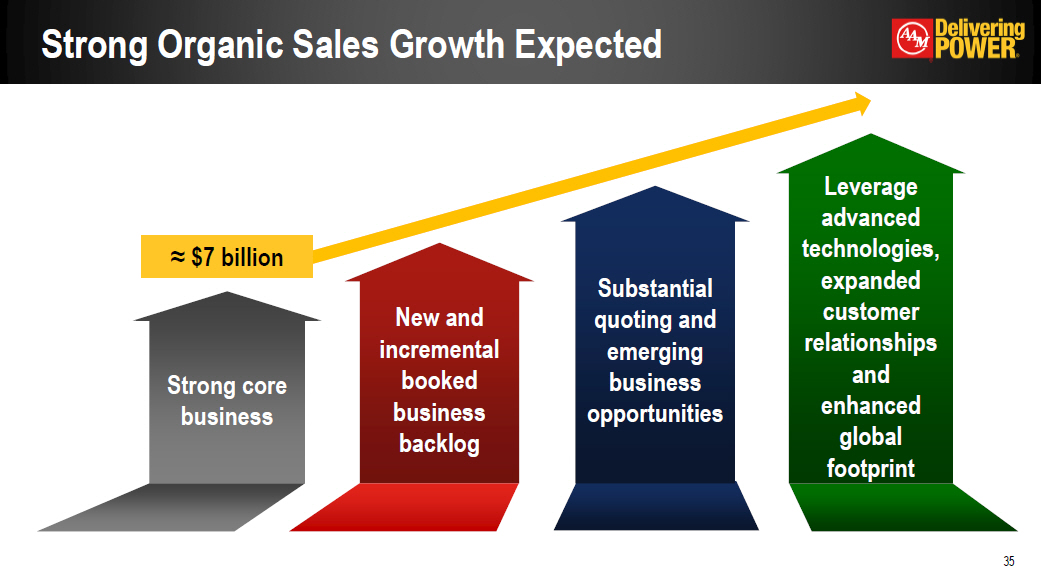
Strong Organic Sales Growth Expected * ≈ $7 billion
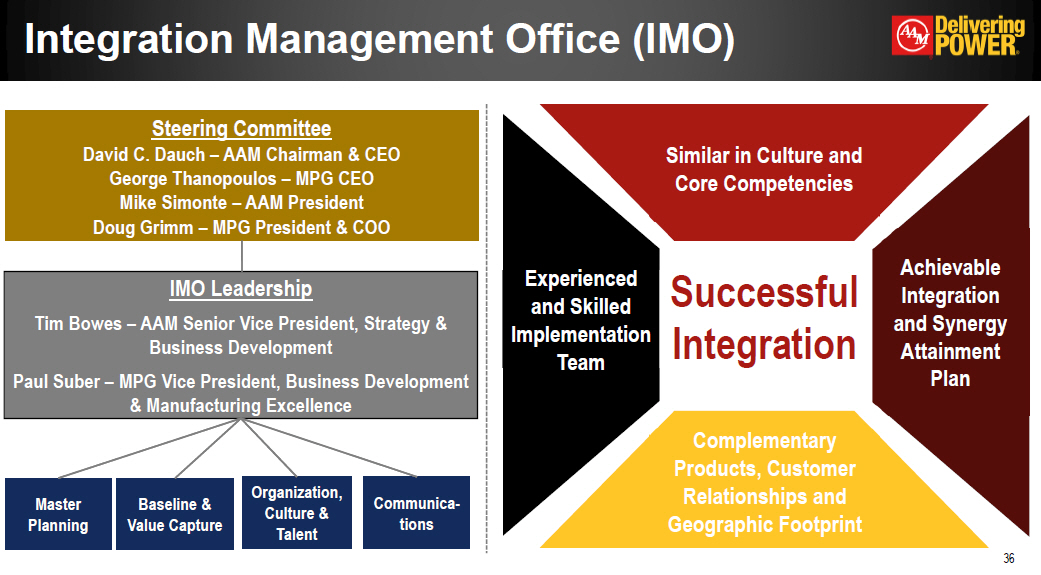
Integration Management Office (IMO) * Successful Integration Steering CommitteeDavid C. Dauch – AAM Chairman & CEOGeorge Thanopoulos – MPG CEOMike Simonte – AAM PresidentDoug Grimm – MPG President & COO IMO LeadershipTim Bowes – AAM Senior Vice President, Strategy & Business DevelopmentPaul Suber – MPG Vice President, Business Development & Manufacturing Excellence Baseline &Value Capture Organization, Culture & Talent Master Planning Communica-tions
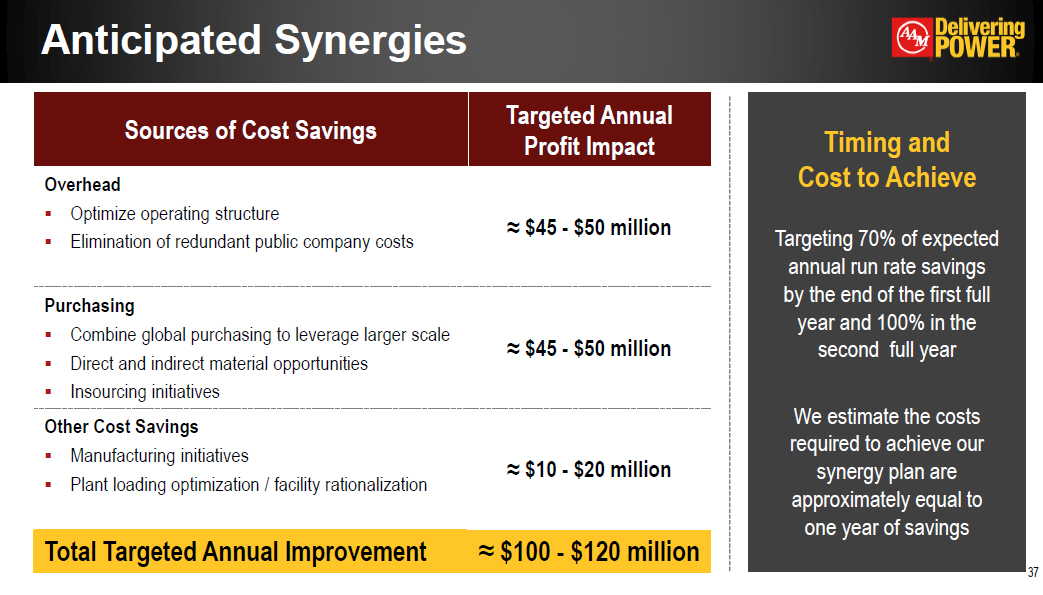
Anticipated Synergies * Sources of Cost Savings Targeted Annual Profit Impact OverheadOptimize operating structureElimination of redundant public company costs ≈ $45 - $50 million PurchasingCombine global purchasing to leverage larger scaleDirect and indirect material opportunitiesInsourcing initiatives ≈ $45 - $50 million Other Cost SavingsManufacturing initiativesPlant loading optimization / facility rationalization ≈ $10 - $20 million Total Targeted Annual Improvement ≈ $100 - $120 million Timing andCost to AchieveTargeting 70% of expected annual run rate savings by the end of the first full year and 100% in the second full year We estimate the costs required to achieve our synergy plan are approximately equal to one year of savings
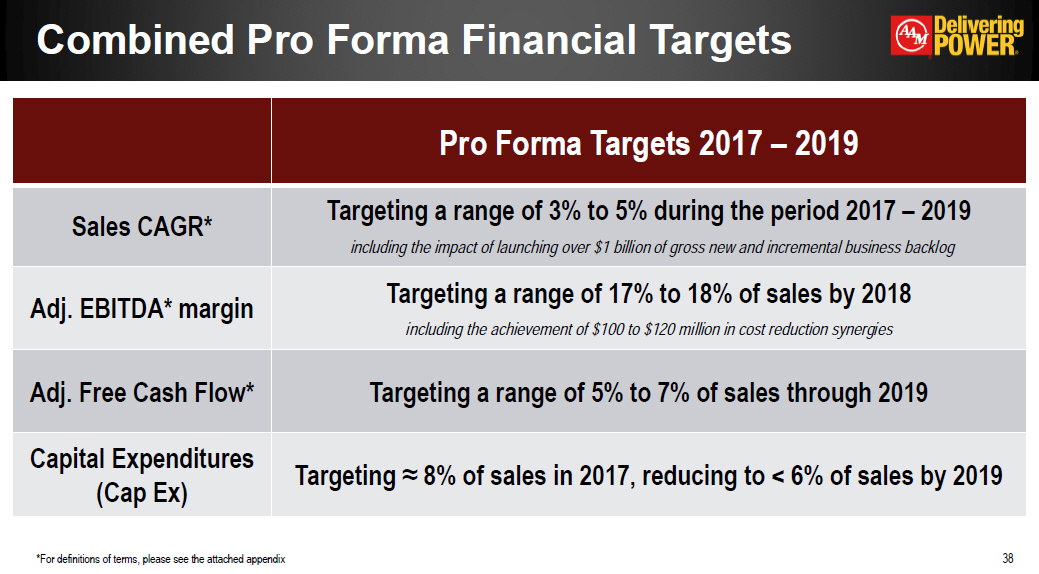
Combined Pro Forma Financial Targets * Pro Forma Targets 2017 – 2019 Sales CAGR* Targeting a range of 3% to 5% during the period 2017 – 2019 including the impact of launching over $1 billion of gross new and incremental business backlog Adj. EBITDA* margin Targeting a range of 17% to 18% of sales by 2018including the achievement of $100 to $120 million in cost reduction synergies Adj. Free Cash Flow* Targeting a range of 5% to 7% of sales through 2019 Capital Expenditures(Cap Ex) Targeting ≈ 8% of sales in 2017, reducing to < 6% of sales by 2019 *For definitions of terms, please see the attached appendix
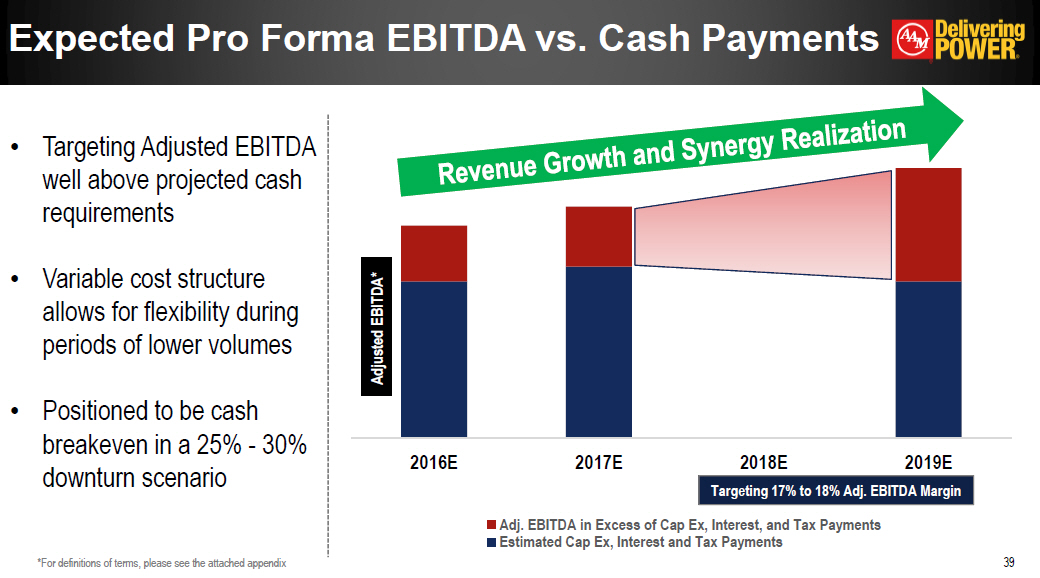
Expected Pro Forma EBITDA vs. Cash Payments * Revenue Growth and Synergy Realization Adjusted EBITDA* Targeting Adjusted EBITDA well above projected cash requirementsVariable cost structure allows for flexibility during periods of lower volumesPositioned to be cash breakeven in a 25% - 30% downturn scenario *For definitions of terms, please see the attached appendix
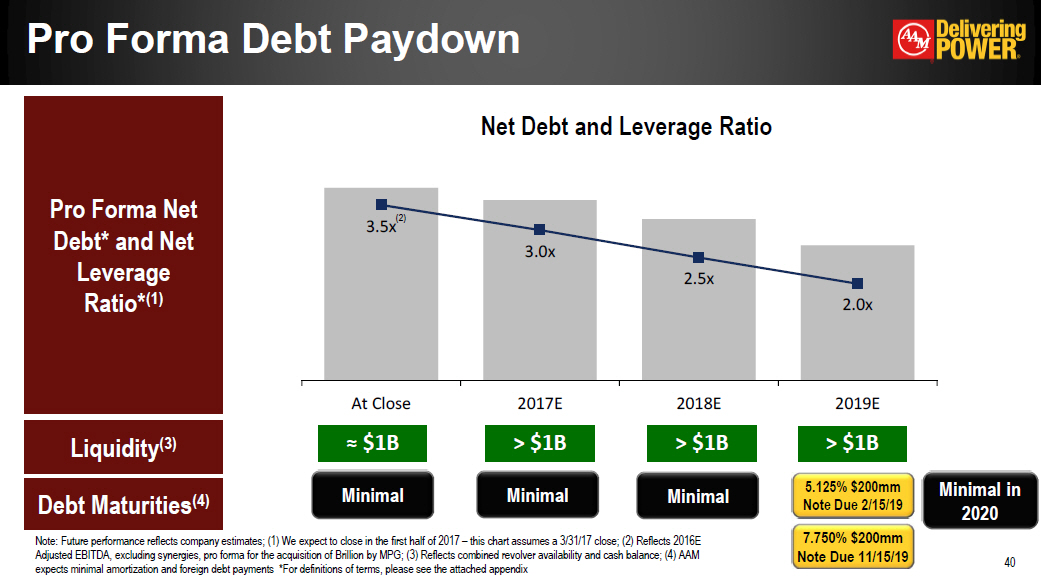
* Note: Future performance reflects company estimates; (1) We expect to close in the first half of 2017 – this chart assumes a 3/31/17 close; (2) Reflects 2016E Adjusted EBITDA, excluding synergies, pro forma for the acquisition of Brillion by MPG; (3) Reflects combined revolver availability and cash balance; (4) AAM expects minimal amortization and foreign debt payments *For definitions of terms, please see the attached appendix Pro Forma Debt Paydown Pro Forma Net Debt* and Net Leverage Ratio*(1) Debt Maturities(4) Minimal Minimal Minimal * Liquidity(3) ≈ $1B > $1B > $1B > $1B Net Debt and Leverage Ratio Minimal in 2020 (2)

Enhanced Credit Profile * Stronger Financial Profile and Enhanced Cash Flow Generation Increased size and scaleCustomer and product diversificationEnhanced geographic footprintServed market and content per vehicle expansionStrong profit and free cash flow marginsIdentifiable cost synergies of ≈$100 – 120 millionExtended debt maturity profileStrong liquidity position *
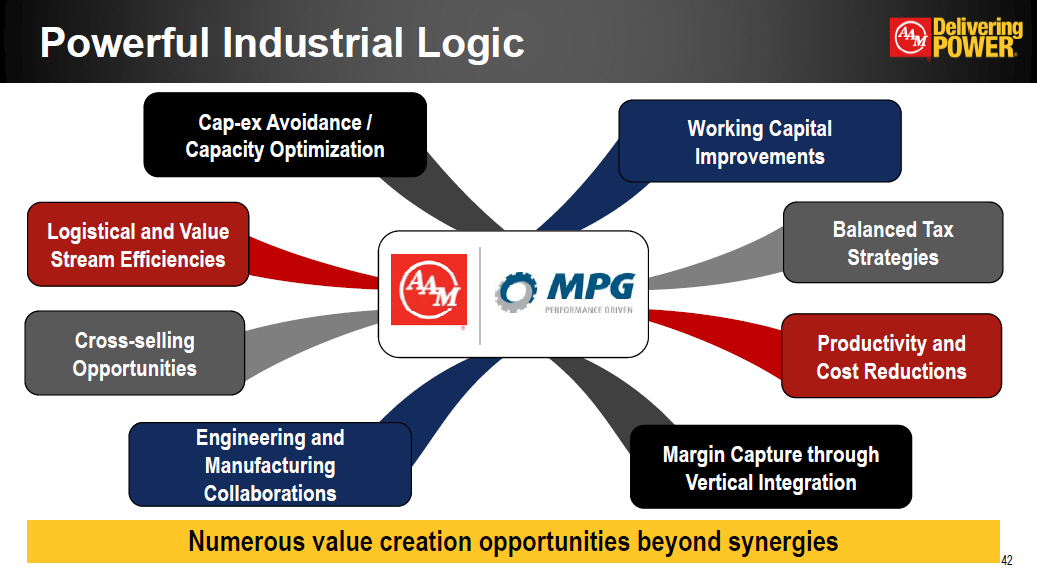
Powerful Industrial Logic * Logistical and Value Stream Efficiencies Cross-selling Opportunities Cap-ex Avoidance / Capacity Optimization Balanced Tax Strategies Margin Capture through Vertical Integration Productivity and Cost Reductions Working Capital Improvements Numerous value creation opportunities beyond synergies
TRANSACTION OVERVIEW *
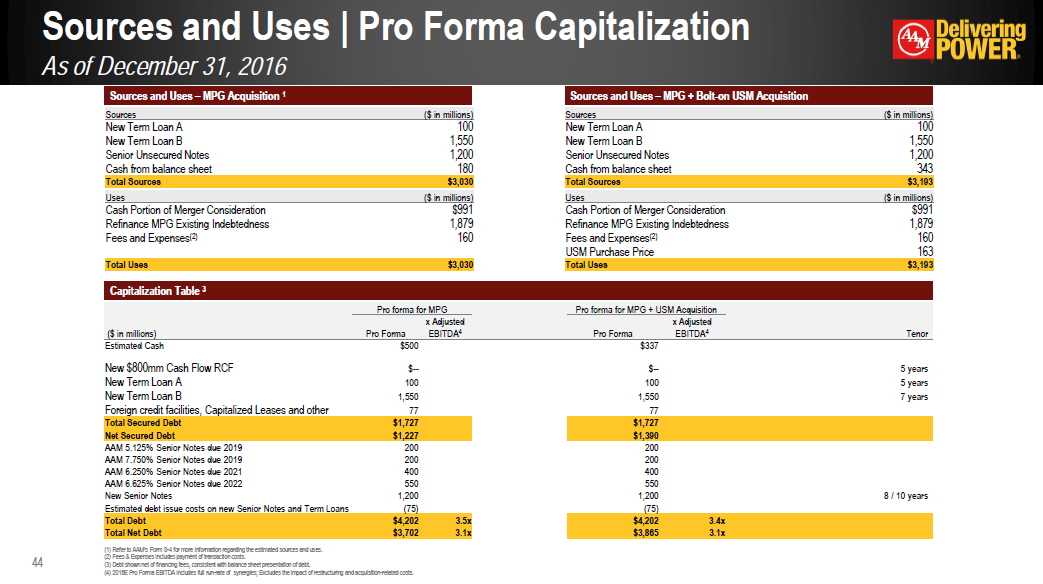
* Sources and Uses – MPG Acquisition 1 Capitalization Table 3 Sources ($ in millions) Sources ($ in millions) New Term Loan A 100 New Term Loan A 100 New Term Loan B 1,550 New Term Loan B 1,550 Senior Unsecured Notes 1,200 Senior Unsecured Notes 1,200 Cash from balance sheet 180 Cash from balance sheet 343 Total Sources $3,030 Total Sources $3,193 Uses ($ in millions) Uses ($ in millions) Cash Portion of Merger Consideration $991 Cash Portion of Merger Consideration $991 Refinance MPG Existing Indebtedness 1,879 Refinance MPG Existing Indebtedness 1,879 Fees and Expenses(2) 160 Fees and Expenses(2) 160 USM Purchase Price 163 Total Uses $3,030 Total Uses $3,193 Sources and Uses – MPG + Bolt-on USM Acquisition Pro forma for MPG Pro forma for MPG Pro forma for MPG + USM Acquisition Pro forma for MPG + USM Acquisition ($ in millions) Pro Forma x Adjusted EBITDA4 Pro Forma x Adjusted EBITDA4 Tenor Estimated Cash $500 $337 New $800mm Cash Flow RCF $-- $-- 5 years New Term Loan A 100 100 5 years New Term Loan B 1,550 1,550 7 years Foreign credit facilities, Capitalized Leases and other 77 77 Total Secured Debt $1,727 $1,727 Net Secured Debt $1,227 $1,390 AAM 5.125% Senior Notes due 2019 200 200 AAM 7.750% Senior Notes due 2019 200 200 AAM 6.250% Senior Notes due 2021 400 400 AAM 6.625% Senior Notes due 2022 550 550 New Senior Notes 1,200 1,200 8 / 10 years Estimated debt issue costs on new Senior Notes and Term Loans (75) (75) Total Debt $4,202 3.5x $4,202 3.4x Total Net Debt $3,702 3.1x $3,865 3.1x (1) Refer to AAM’s Form S-4 for more information regarding the estimated sources and uses.(2) Fees & Expenses includes payment of transaction costs.(3) Debt shown net of financing fees, consistent with balance sheet presentation of debt.(4) 2016E Pro Forma EBITDA includes full run-rate of synergies; Excludes the impact of restructuring and acquisition-related costs. Sources and Uses | Pro Forma CapitalizationAs of December 31, 2016
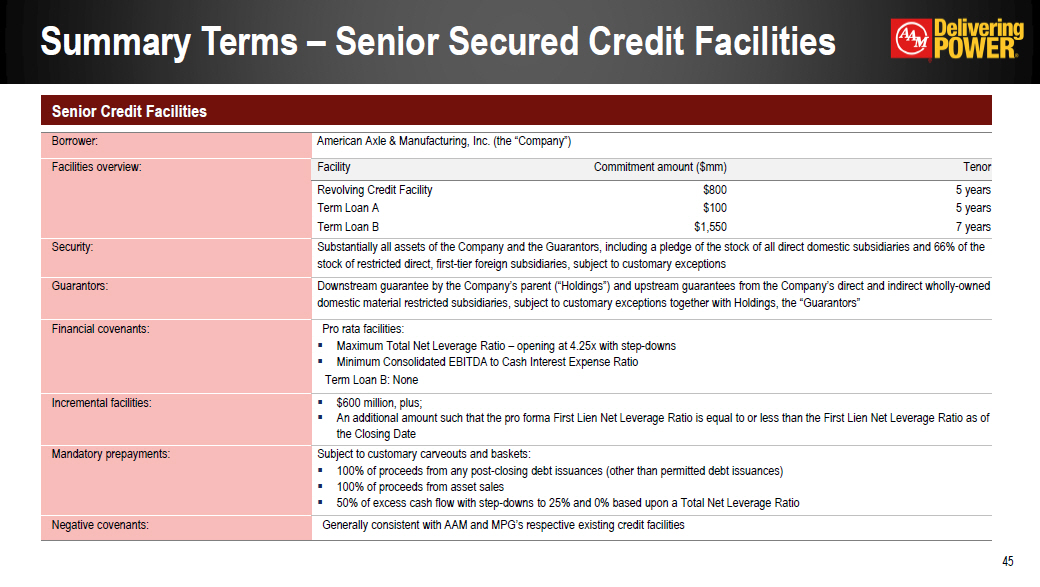
Summary Terms – Senior Secured Credit Facilities Senior Credit Facilities * Borrower: American Axle & Manufacturing, Inc. (the “Company”) American Axle & Manufacturing, Inc. (the “Company”) American Axle & Manufacturing, Inc. (the “Company”) Facilities overview: Facility Commitment amount ($mm) Tenor Revolving Credit Facility $800 5 years Term Loan A $100 5 years Term Loan B $1,550 7 years Security: Substantially all assets of the Company and the Guarantors, including a pledge of the stock of all direct domestic subsidiaries and 66% of the stock of restricted direct, first-tier foreign subsidiaries, subject to customary exceptions Substantially all assets of the Company and the Guarantors, including a pledge of the stock of all direct domestic subsidiaries and 66% of the stock of restricted direct, first-tier foreign subsidiaries, subject to customary exceptions Substantially all assets of the Company and the Guarantors, including a pledge of the stock of all direct domestic subsidiaries and 66% of the stock of restricted direct, first-tier foreign subsidiaries, subject to customary exceptions Guarantors: Downstream guarantee by the Company’s parent (“Holdings”) and upstream guarantees from the Company’s direct and indirect wholly-owned domestic material restricted subsidiaries, subject to customary exceptions together with Holdings, the “Guarantors” Downstream guarantee by the Company’s parent (“Holdings”) and upstream guarantees from the Company’s direct and indirect wholly-owned domestic material restricted subsidiaries, subject to customary exceptions together with Holdings, the “Guarantors” Downstream guarantee by the Company’s parent (“Holdings”) and upstream guarantees from the Company’s direct and indirect wholly-owned domestic material restricted subsidiaries, subject to customary exceptions together with Holdings, the “Guarantors” Financial covenants: Pro rata facilities:Maximum Total Net Leverage Ratio – opening at 4.25x with step-downsMinimum Consolidated EBITDA to Cash Interest Expense Ratio Term Loan B: None Pro rata facilities:Maximum Total Net Leverage Ratio – opening at 4.25x with step-downsMinimum Consolidated EBITDA to Cash Interest Expense Ratio Term Loan B: None Pro rata facilities:Maximum Total Net Leverage Ratio – opening at 4.25x with step-downsMinimum Consolidated EBITDA to Cash Interest Expense Ratio Term Loan B: None Incremental facilities: $600 million, plus;An additional amount such that the pro forma First Lien Net Leverage Ratio is equal to or less than the First Lien Net Leverage Ratio as of the Closing Date $600 million, plus;An additional amount such that the pro forma First Lien Net Leverage Ratio is equal to or less than the First Lien Net Leverage Ratio as of the Closing Date $600 million, plus;An additional amount such that the pro forma First Lien Net Leverage Ratio is equal to or less than the First Lien Net Leverage Ratio as of the Closing Date Mandatory prepayments: Subject to customary carveouts and baskets:100% of proceeds from any post-closing debt issuances (other than permitted debt issuances)100% of proceeds from asset sales50% of excess cash flow with step-downs to 25% and 0% based upon a Total Net Leverage Ratio Subject to customary carveouts and baskets:100% of proceeds from any post-closing debt issuances (other than permitted debt issuances)100% of proceeds from asset sales50% of excess cash flow with step-downs to 25% and 0% based upon a Total Net Leverage Ratio Subject to customary carveouts and baskets:100% of proceeds from any post-closing debt issuances (other than permitted debt issuances)100% of proceeds from asset sales50% of excess cash flow with step-downs to 25% and 0% based upon a Total Net Leverage Ratio Negative covenants: Generally consistent with AAM and MPG’s respective existing credit facilities Generally consistent with AAM and MPG’s respective existing credit facilities Generally consistent with AAM and MPG’s respective existing credit facilities
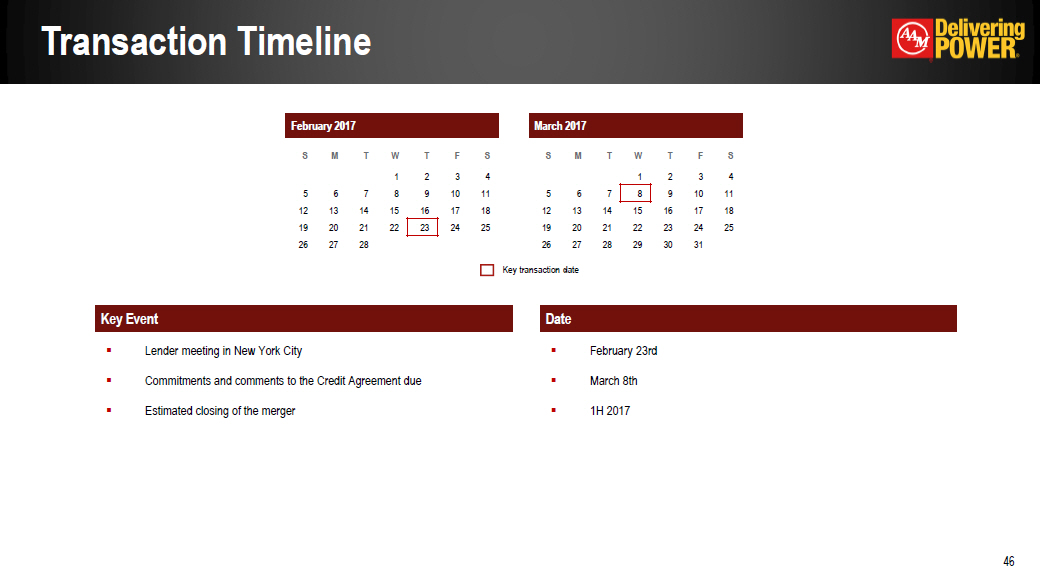
Transaction Timeline Lender meeting in New York CityCommitments and comments to the Credit Agreement dueEstimated closing of the merger February 2017 February 2017 February 2017 February 2017 February 2017 February 2017 February 2017 March 2017 March 2017 March 2017 March 2017 March 2017 March 2017 March 2017 S M T W T F S S M T W T F S 1 2 3 4 1 2 3 4 5 6 7 8 9 10 11 5 6 7 8 9 10 11 12 13 14 15 16 17 18 12 13 14 15 16 17 18 19 20 21 22 23 24 25 19 20 21 22 23 24 25 26 27 28 26 27 28 29 30 31 Key Event Date Key transaction date February 23rdMarch 8th1H 2017 *
Q&A *
APPENDIX *
In addition to the results reported in accordance with accounting principles generally accepted in the United States of America (GAAP) included within this presentation, we have provided certain information, which includes non-GAAP financial measures. Such information is reconciled to its closest GAAP measure in accordance with Securities and Exchange Commission rules and is included in the following slides.Certain of the forward-looking financial measures included in this presentation are provided on a non-GAAP basis. A reconciliation of 2017 non-GAAP targets and pro forma forward-looking financial measures to the most directly comparable financial measures calculated and presented in accordance with GAAP is not practical given the difficulty of projecting event driven transactional and other non-core operating items in any future period. The magnitude of these items, however, may be significant. Reconciliation of Non-GAAP Measures *
Reconciliation of Non-GAAP Measures *
Reconciliation of Non-GAAP Measures *
Reconciliation of Non-GAAP Measures *
Reconciliation of Non-GAAP Measures *
Reconciliation of Non-GAAP Measures *
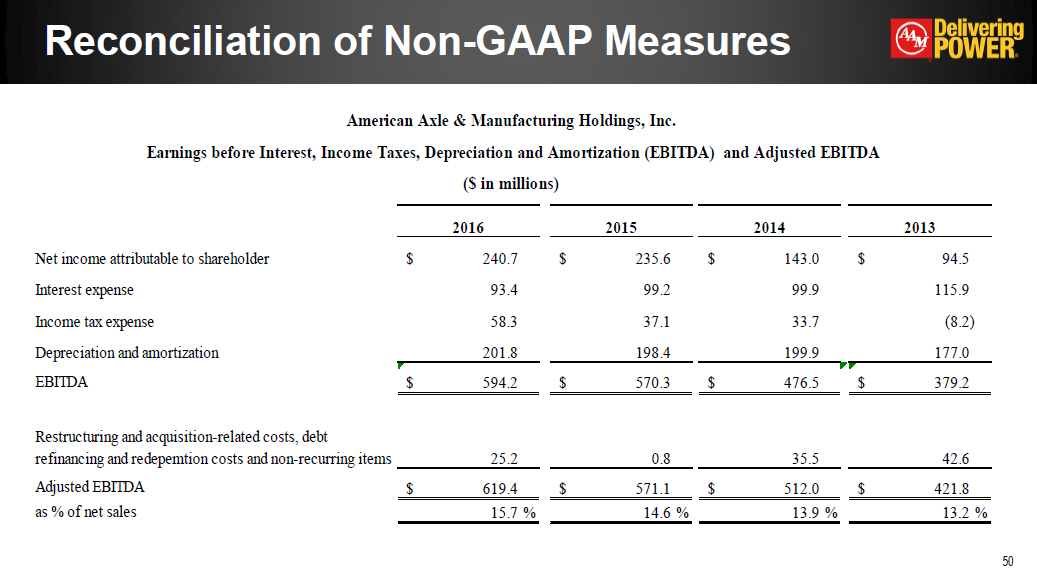
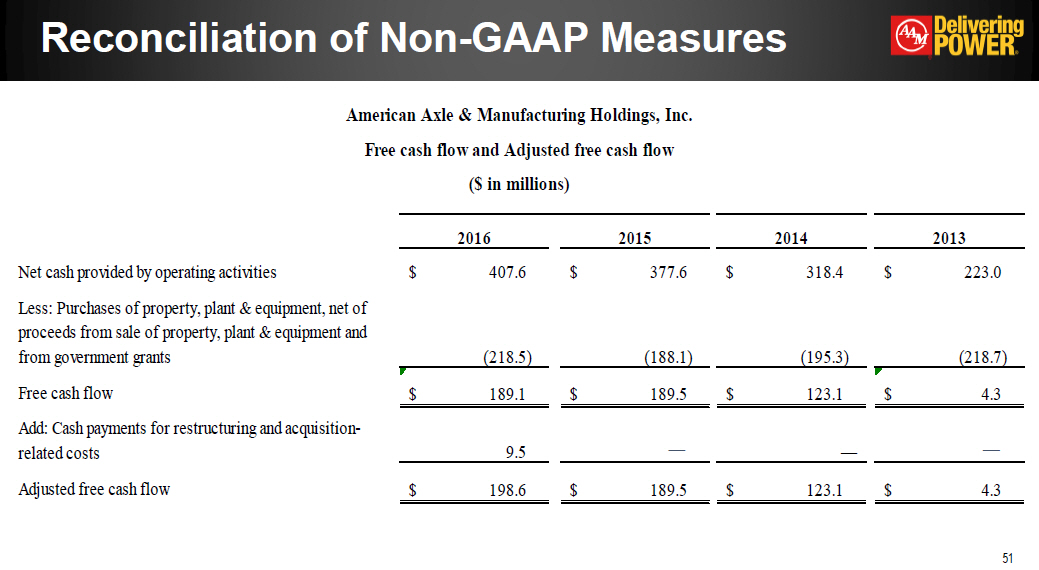
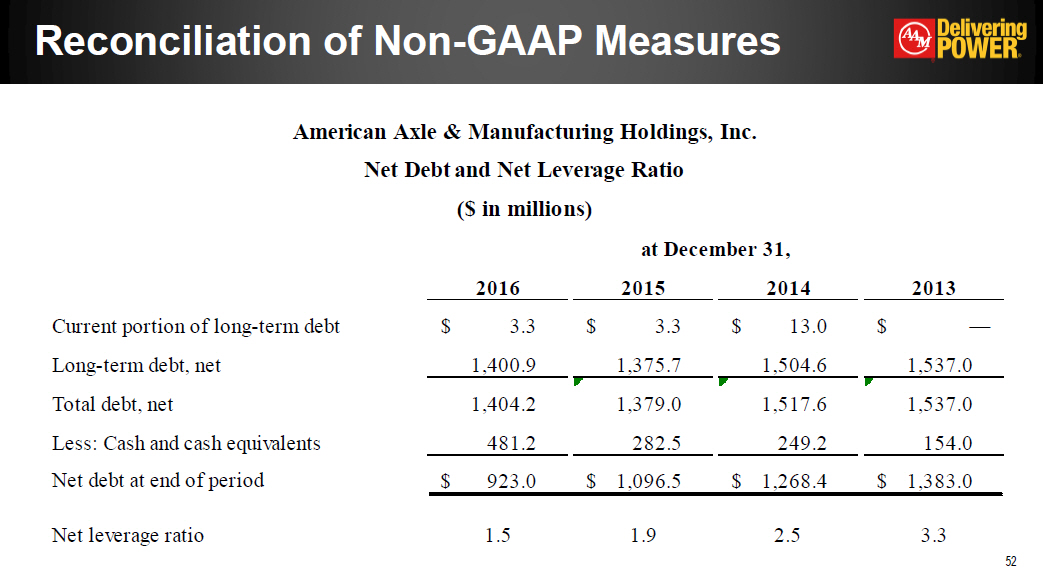
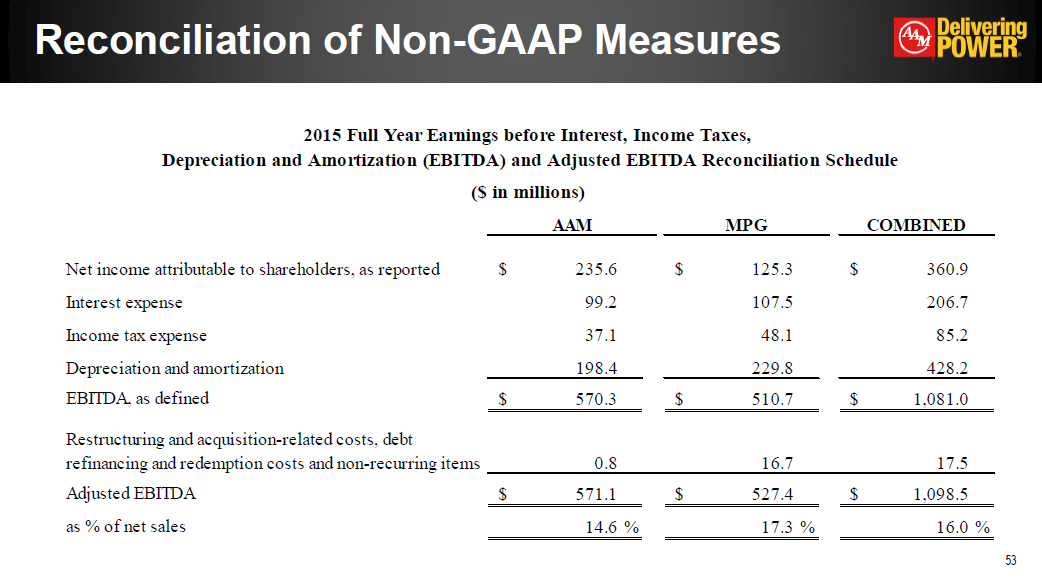
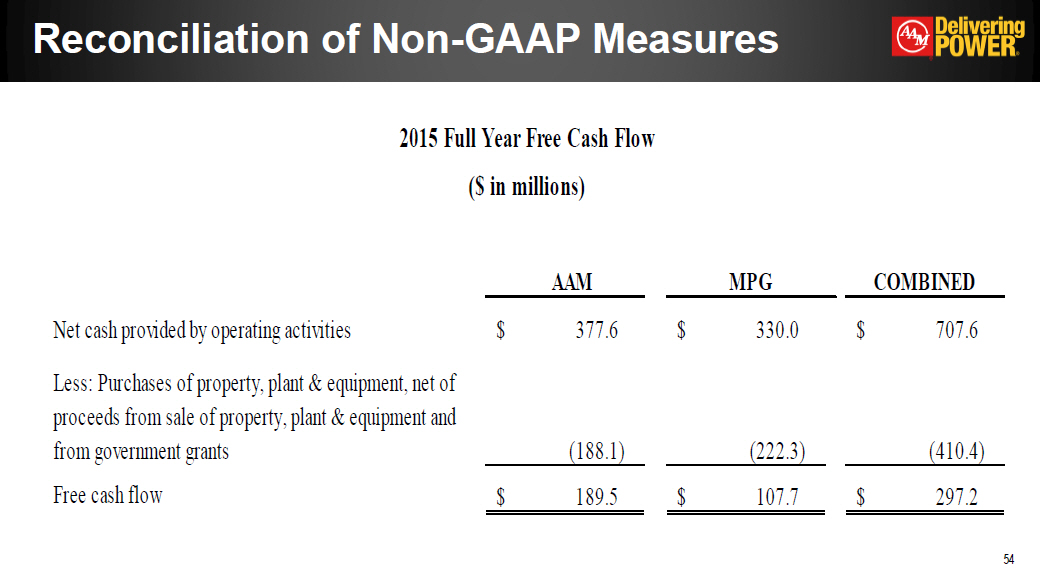
Reconciliation of Non-GAAP Measures We define EBITDA to be earnings before interest expense, income taxes, depreciation and amortization. Adjusted EBITDA excludes the impact of restructuring and acquisition related-costs, debt refinancing and redemption costs and non-recurring items. We believe EBITDA and Adjusted EBITDA are meaningful measures of performance as they are commonly utilized by management and investors to analyze operating performance and entity valuation. Our management, the investment community and banking institutions routinely use EBITDA and Adjusted EBITDA, together with other measures, to measure our operating performance relative to other Tier 1 automotive suppliers. EBITDA and Adjusted EBITDA should not be construed as income from operations, net income or cash flow from operating activities as determined under GAAP. Other companies may calculate EBITDA and Adjusted EBITDA differently.We define free cash flow to be net cash provided by operating activities less capital expenditures net of proceeds from the sale of property, plant and equipment and government grants. Adjusted free cash flow excludes the impact of cash payments for restructuring and acquisition-related costs. We believe free cash flow and Adjusted free cash flow are meaningful measures as it is commonly utilized by management and investors to assess our ability to generate cash flow from business operations to repay debt and return capital to our stockholders. Free cash flow is also a key metric used in our calculation of incentive compensation. Other companies may calculate free cash flow and adjusted free cash flow differently.We define net debt to be total debt, net less cash and cash equivalents. We define net leverage ratio to be net debt divided by Adjusted EBITDA. We believe that net leverage ratio is a meaningful measure of financial condition as it is commonly used by management, investors and creditors to assess capital structure risk. Other companies may calculate net leverage ratio differently.We define US SAAR as the seasonally adjusted annual rate of light vehicle sales in the United StatesWe define CAGR to be the compound annual growth rate of sales. *