 March 11, 2015 Axalta Coating Systems Ltd. Q4 & Full Year 2014 Conference Call Exhibit 99.2 |
 Axalta Coating Systems Ltd. Notice Regarding Forward Looking Statements, Non-GAAP Financial Measures and Defined Terms 2 Forward-Looking Statements This presentation and the oral remarks made in connection herewith may contain “forward-looking statements” within the meaning of the U.S. Private Securities Litigation Reform Act of 1995, including those relating to 2015 net sales, Adjusted EBITDA, tax rate, capital expenditures and net working capital. Any forward-looking statements involve risks, uncertainties and assumptions. These statements often include words such as “believe,” “expect,” “anticipate,” “intend,” “plan,” “estimate,” “target,” “project,” “forecast,” “seek,” “will,” “may,” “should,” “could,” “would,” or similar expressions. These statements are based on certain assumptions that we have made in light of our experience in the industry and our perceptions of historical trends, current conditions, expected future developments and other factors we believe are appropriate under the circumstances as of the date hereof. Although we believe that the assumptions and analysis underlying these statements are reasonable as of the date hereof, investors are cautioned not to place undue reliance on these statements. We do not have any obligation to and do not intend to update any forward-looking statements included herein, which speak only as of the date hereof. You should understand that these statements are not guarantees of future performance or results. Actual results could differ materially from those described in any forward-looking statements contained herein or the oral remarks made in connection herewith as a result of a variety of factors, including known and unknown risks and uncertainties, many of which are beyond our control. Non-GAAP Financial Measures The historical financial information included in this presentation includes financial information that is not presented in accordance with generally accepted accounting principles in the United States (“GAAP”), including EBITDA and Adjusted EBITDA. Management uses these non-GAAP financial measures in the analysis of our financial and operating performance because they assist in the evaluation of underlying trends in our business. Our use of the terms EBITDA and Adjusted EBITDA may differ from that of others in our industry. EBITDA and Adjusted EBITDA should not be considered as alternatives to net income (loss), operating income or any other performance measures derived in accordance with GAAP as measures of operating performance or operating cash flows or as measures of liquidity. EBITDA and Adjusted EBITDA have important limitations as analytical tools and should be considered in conjunction with, and not as substitutes for, our results as reported under GAAP. This presentation includes a reconciliation of certain non-GAAP financial measures with the most directly comparable financial measures calculated in accordance with GAAP. Defined Terms All capitalized terms contained within this presentation have been previously defined in our filings with the United States Securities and Exchange Commission. |
 Axalta Coating Systems Ltd. 3 Axalta – A Leader in Coatings Segments Performance Coatings 59% of Sales Transportation Coatings 41% of Sales End- Markets Focus Areas Body Shops Electrical Insulation, Architectural, Oil and Gas, General Industrial Net Sales 1 $4,362 million Adjusted EBITDA 1,2 $841 million Adjusted EBITDA Margin 3 19.3% Light Vehicle / Automotive OEMs Heavy Duty Truck, Bus, Rail, Agriculture & Construction OEMs (42% of Sales) (17% of Sales) (32% of Sales) (9% of Sales) Refinish Industrial Light Vehicle Commercial Vehicle ____________________________ 1. Financials for FY 2014. 2. Adjusted EBITDA reconciliation can be found in the Appendix of this presentation. 3. Adjusted EBITDA Margin is defined as Adjusted EBITDA as a percentage of reported net sales. |
 Axalta Coating Systems Ltd. Q4 & Full Year 2014 Highlights 4 • Solid Q4 2014 results across both segments – Net sales up 5% compared to 2013, excluding currency, with volume and price growth in both segments; reported net sales down 1% as a result of negative currency movements – Adjusted EBITDA of $205 million, representing a 19.0% margin, was up 4% compared to 2013 and was Axalta’s seventh straight quarter of YoY growth • Strong Performance in 2014 – Net sales up 4% YoY, excluding 2% of negative currency; reported net sales up 2% – Adjusted EBITDA up 14.0% YoY with increases in both segments; EBITDA margin of 19.3%, represents YoY increase of 210bps – Completed all remaining transitions from DuPont – Successfully completed IPO in November 2014 – Strong balance sheet with net leverage ratio of 4.0x at December 31, 2014 • Significant progress on previously announced capital expansions – Jiading expansion fully operational with opening ceremonies last week – Germany project expected to be operational in 1H 2015 and Mexico at the end of 2015 • Continued momentum into 2015 despite currency headwinds and challenging economic environment in Latin America |
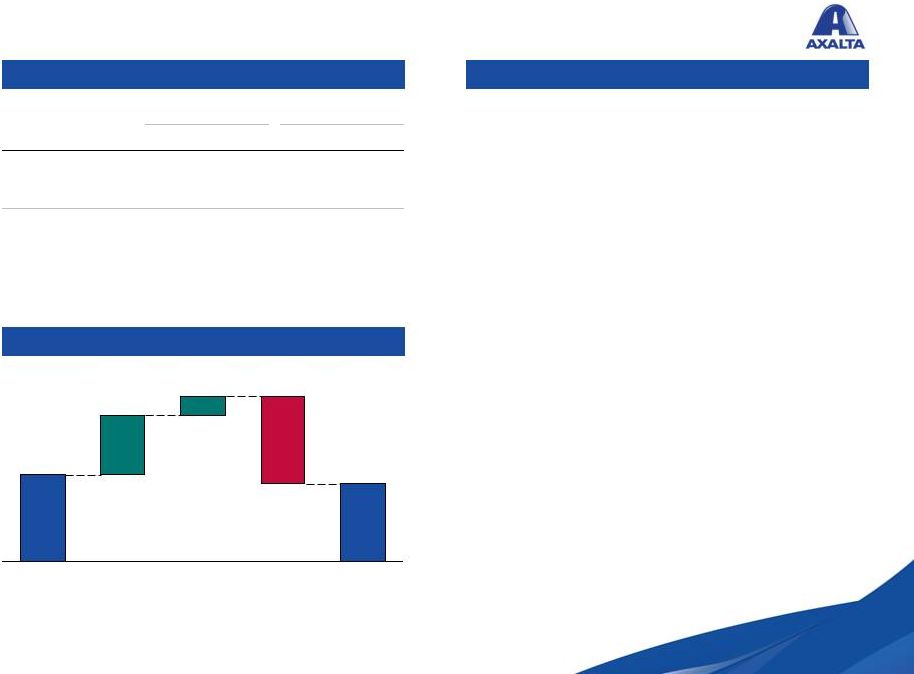
 Axalta Coating Systems Ltd. Q4 2014 Consolidated Results 5 Financial Performance Net sales increased 5.1% YoY, excluding currency • Volume growth in North America, Latin America and Asia Pacific while EMEA volumes were slightly down • Moderate price increases in select regions • Over 6% unfavorable currency impact, driven primarily by Euro and currencies in Latin America Adjusted EBITDA margin of 19.0%, representing an increase of 90bps YoY • Higher sales through volume and price delivered Adjusted EBITDA growth • Since the acquisition, Adjusted EBITDA has achieved seven consecutive quarters of YoY growth Commentary $1,079 Volume Q4 2013 FX Price Q4 2014 Net Sales Variance +3.1% +2.0% -6.4% -1.3% ($ in millions) 2014 2013 Incl. F/X Excl. F/X Performance 640 645 (0.8%) 6.3% Transportation 438 448 (2.1%) 3.2% Net Sales 1,079 1,093 (1.3%) 5.1% Adjusted EBITDA 205 197 3.7% % margin 19.0% 18.1% Q4 % Change $1,093 |
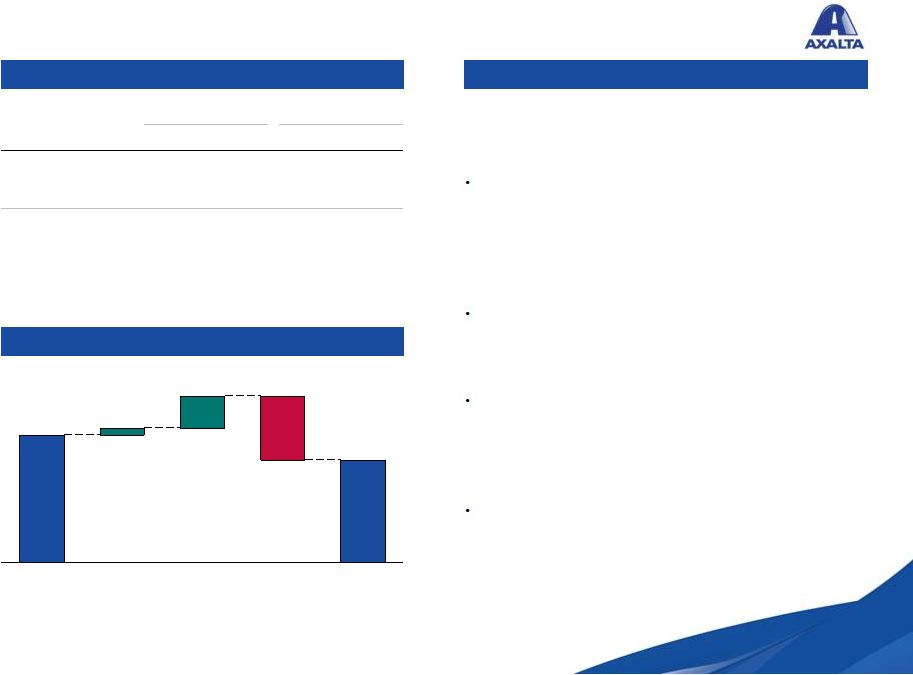
 Axalta Coating Systems Ltd. Q4 2014 Performance Coatings Results 6 Financial Performance • Refinish experienced increased volume across all regions except for EMEA • Industrial volumes increased across all regions • 7% unfavorable currency impact • Increased volume and price offset by increased costs from investing in future growth Commentary Q4 2013 Q4 2014 Price FX Volume Net Sales Variance +4.8% +1.5% -7.1% -0.7% ($ in millions) 2014 2013 Incl. F/X Excl. F/X Refinish 466 467 (0.1%) 7.6% Industrial 174 178 (2.4%) 2.9% Net Sales 640 645 (0.8%) 6.3% Adjusted EBITDA 138 140 (1.5%) % margin 21.5% 21.7% Q4 % Change Adjusted EBITDA margin of 21.5%, down slightly YoY Net sales increased 6.3% YoY, excluding currency $640 $645 |
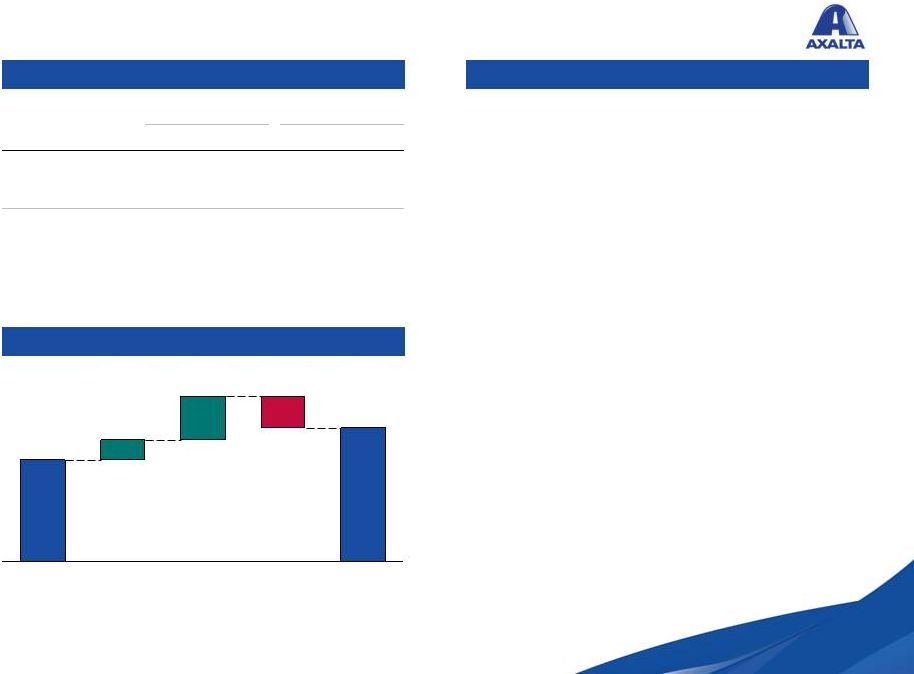
 Axalta Coating Systems Ltd. Q4 2014 Transportation Coatings Results 7 Financial Performance Commentary Net sales increased 3.2% YoY, excluding currency $438 $448 FX Q4 2014 Q4 2013 Volume Price Net Sales Variance +0.6% +2.6% -5.3% -2.1% ($ in millions) 2014 2013 Incl. F/X Excl. F/X Light Vehicle 339 353 (3.9%) 1.4% Commercial Vehicle 99 95 4.8% 10.2% Net Sales 438 448 (2.1%) 3.2% Adjusted EBITDA 67 57 16.4% % margin 15.2% 12.8% Q4 % Change Light vehicle volume increases in Asia Pacific offset by lower volume in Latin America from challenging economic conditions and North America due to downtime at certain customer plants Commercial Vehicle net sales showed strong growth in North America, Latin America and Asia Pacific 5% unfavorable currency impact Increase in Adjusted EBITDA attributable to higher price points on new launches and cost saving operational improvement initiatives Adjusted EBITDA margin of 15.2%, representing an increase of 240bps YoY |
 Axalta Coating Systems Ltd. ($ in millions) 2014 2013 Incl. F/X Excl. F/X Performance 2,585 2,512 2.9% 5.0% Transportation 1,777 1,765 0.6% 2.5% Net Sales 4,362 4,277 2.0% 4.0% Adjusted EBITDA 841 738 14.0% % margin 19.3% 17.2% Full Year % Change FY 2014 Consolidated Results 8 Financial Performance Net sales increased 4.0% YoY, excluding currency • Net sales volume growth in North America and Asia Pacific partially offset by decreased volume in EMEA and Latin America due to challenging economic conditions • All regions exhibited price increases, which included actions in Latin America to offset inflation and currency devaluation • 2% unfavorable currency impact Adjusted EBITDA margin of 19.3%, representing an increase of 210bps YoY • Adjusted EBITDA growth primarily a result of top line growth and cost improvement initiatives • Continued Adjusted EBITDA margin improvement Commentary Net Sales Variance FX Volume Price 2013 2014 +1.2% +2.8% -2.0% +2.0% (1) (1) Pro Forma 2013, including $5.7 million cost savings benefit in the Predecessor Period. $4,362 $4,277 |
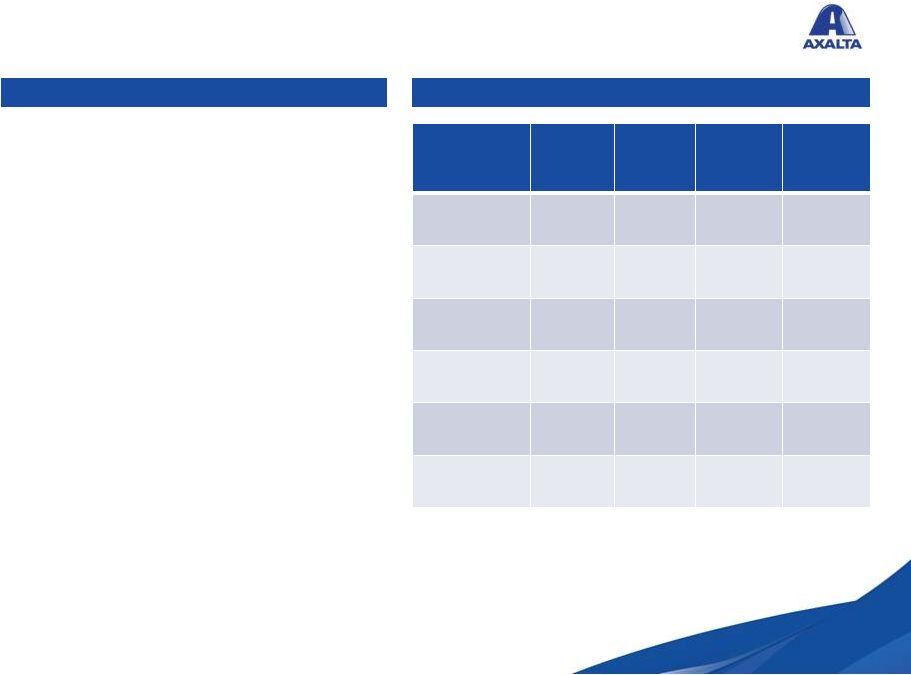
 Axalta Coating Systems Ltd. Update on Transition-Related and One-Time Costs • Transition-related expenses from separation from DuPont are now complete. Q4 expenses primarily related to the remainder of our IT transition and stabilization as well as completion of rebranding requirements • Incurred restructuring expenses associated with (1) our previously announced productivity initiatives and (2) new actions in Latin America during Q4 in response to a challenging economic environment • Incurred incremental one-time costs associated with the IPO (including termination of sponsor management fee) 9 Impact on Statement of Operations ($ in millions) Q1 2014 Q2 2014 Q3 2014 Q4 2014 FY 2014 Termination benefits and other employee-related costs $3 $3 $3 $9 $18 Consulting and advisory fees 13 8 9 7 36 Transition-related costs 14 34 34 21 102 IPO-related expenses - - 3 19 22 Total Expense $30 $44 $49 $56 $179 |
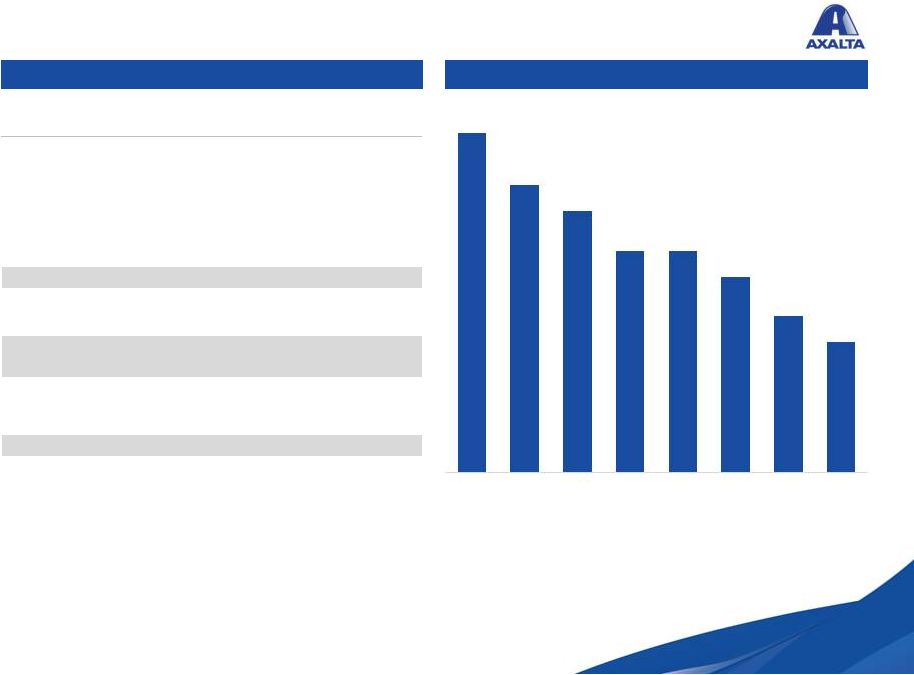 Axalta Coating Systems Ltd. Debt and Liquidity Summary 10 Net Leverage Capitalization ($ in millions) @ 12/31/2014 Maturity Cash and Cash Equivalents $382 Debt: Revolver ($400 capacity) - 2018 First Lien Term Loan (USD) 2,166 2020 First Lien Term Loan (EUR) (1) 481 2020 Senior Secured Notes (EUR) (1) 305 2021 Total Senior Secured Debt $2,952 Senior Unsecured Notes (USD) 750 2021 Notes Payable and Other Borrowings 13 Total Debt $3,715 Total Net Debt $3,333 Adjusted EBITDA $841 Credit Statistics: Total Net Leverage 4.0x (1) Assumes exchange rate of $1.2208 USD/Euro. Note: Excludes unamortized original issue discount. 5.6x 5.2x 5.0x 4.7x 4.7x 4.5x 4.2x 4.0x At LBO Q2 '13 Q3 '13 Q4 '13 Q1 '14 Q2 '14 Q3 '14 Q4 '14 |
 Axalta Coating Systems Ltd. Full Year 2015 Guidance 11 • We intend to provide annual guidance in Q1 and update it quarterly • Excluding F/X, net sales are expected to increase 5% to 7% versus 2014 while net sales including F/X are expected to be flat to slightly down YoY – Increase across all regions and end-markets excluding F/X – Performance Coatings: Driven by increased volumes as well as selective price increases – Transportation Coatings: Driven primarily by the launch of Light Vehicle business previously won and strong momentum in our Commercial Vehicle end-market – F/X represents a significant headwind, particularly in Q1 2015 as the US Dollar strengthened throughout 2014 into 2015 • We expect to generate Adjusted EBITDA of $860 million to $900 million – Driven by increased sales and continued savings from our optimization initiatives – Continued strong Adjusted EBITDA margins of approximately 20% – Expect 2H of 2015 to be stronger in light of new capacity coming online • Normalized effective tax rate of 27% to 29% • Capital expenditures of approximately $150 million, of which ~60% is anticipated for growth projects • Net working capital, excluding transition-related items which were expensed previously, is expected to be in the range of 13% to 15% of net sales |
 Axalta Coating Systems Ltd. Full Year 2015 Assumptions 12 Currency % Axalta Net Sales 2014 Avg. Rate 2015 Avg. Guidance Rate % Change in F/X Rate US$ per Euro ~30% 1.33 1.10 (17.3%) Chinese Yuan per US$ ~11% 6.17 6.25 (1.3%) Mexican Peso per US$ ~6% 13.33 15.00 (12.5%) Brazilian Real per US$ ~5% 2.36 2.90 (22.9%) Venezuelan Bolivar per US$ ~3% 8.91 25.00 (180.6%) Russian Ruble per US$ ~2% 38.48 65.00 (68.9%) • Global GDP growth of approximately 3% • Global industrial production of approximately 4% • Global auto build growth of approximately 3% • Modest benefit from lower oil prices given extended supply chain and category specific supply and demand dynamics Currency Assumptions Macroeconomic Assumptions |
 Axalta Coating Systems Ltd. Strong Earnings Momentum with Potential Upside 13 Underlying Market Growth Axalta Growth Initiatives Operational Improvements Attractive Potential Upside Strong underlying demand growth Robust industry trends favor global suppliers Strong momentum driven by customer-centric approach Accelerating growth in emerging markets Globalizing existing products to reach underserved markets Optimize procurement Streamline operations Enhance productivity Bolt-on acquisitions Partnerships Consolidation opportunities Ongoing Initiatives Future Today |
 Appendix |
 Adjusted EBITDA Reconciliation 15 (1) The Pro Forma results for the year ended December 31, 2013 represent the addition of the Predecessor period January 1 through January 31, 2013 and the Successor year ended December 31, 2013. The Pro Forma results reflect the Acquisition and the associated Financing as if they had occurred on January 1, 2013, in accordance with Article 11 of Regulation S-X. The Pro Forma results do not reflect the actual results we would have achieved had the Acquisition been completed as of January 1, 2013 and are not indicative of our future results of operations. ($ in millions) Pro Forma FY 2013 Predecessor January 1, through January 31, 2013 Successor FY 2013 Successor FY 2014 Successor Q4 2013 Successor Q4 2014 Net Income (Loss) (107) $9 (219) $35 (47) $1 Interest Expense 235 - 215 217 62 51 Provision (Benefit) for Income Taxes (1) 7 (45) 2 (11) (16) Depreciation & Amortization 327 10 301 309 73 80 EBITDA (1) $454 $26 $252 $563 $77 $116 A Inventory Step Up - - 104 - - - B Merger & Acquisition Related Costs - - 28 - - - C Financing Costs and Extinguishment - - 25 6 - - D Foreign exchange remeasurement (gains) losses 34 5 49 81 (1) 36 E Long-term employee benefit plan adjustments 12 2 9 (1) 5 (1) F Termination benefits and other employee related costs 148 - 148 18 83 9 G Consulting and advisory fees 55 - 55 36 21 7 H Transition-related costs 29 - 29 102 13 21 I IPO-related costs - - - 22 - 19 J Other adjustments 2 - 2 11 (1) (2) K Dividends in respect of noncontrolling interest (5) - (5) (2) (1) (1) L Management fee expense 3 - 3 3 1 1 M Allocated corporate and standalone costs, net 6 - - - - - Total Adjustments $284 $7 $447 $278 $120 $89 Adjusted EBITDA $738 $33 $699 $841 $197 $205 Note: Numbers might not foot due to rounding Axalta Coating Systems Ltd. |
 Axalta Coating Systems Ltd. Adjusted EBITDA Reconciliation (cont’d) 16 A. During the Successor year ended December 31, 2013, we recorded a non-cash fair value adjustment associated with our acquisition accounting for inventories. These amounts increased cost of goods sold by $104 million. B. In connection with the Acquisition, we incurred $28 million of merger and acquisition costs during the Successor years ended December 31, 2013. These costs consisted primarily of investment banking, legal and other professional advisory services costs. C. On August 30, 2012, we signed a debt commitment letter, which included the Bridge Facility. Upon the issuance of the Senior Notes and the entry into the Senior Secured Credit Facilities, the commitments under the Bridge Facility terminated. Commitment fees related to the Bridge Facility of $21 million and associated fees of $4 million were expensed upon the payment and termination of the Bridge Facility. In connection with the amendment to the Senior Secured Credit Facilities in February 2014, we recognized $3 million of costs during the Successor year ended December 31, 2014. In addition to the credit facility amendment, we also incurred a $3 million loss on extinguishment of debt recognized during the Successor year ended December 31, 2014, which resulted directly from the pro-rata write off of unamortized deferred financing costs and original issue discounts associated with the pay-down of $100.0 million of principal on the New Dollar Term Loan. D. Eliminates foreign exchange gains and losses resulting from the remeasurement of assets and liabilities denominated in foreign currencies, including a $19 million loss related to the acquisition date settlement of a foreign currency contract used to hedge the variability of Euro-based financing. E. For the Successor years ended December 31, 2014 and 2013, eliminates the non-service cost components of employee benefit costs. Additionally, we deducted a pension curtailment gain of $7 million recorded during the Successor year ended December 31, 2014. For the Predecessor period January 1, 2013 through January 31, 2013, eliminates (1) all U.S. pension and other long-term employee benefit costs that were not assumed as part of the Acquisition and (2) the non-service cost component of the pension and other long- term employee benefit costs for the foreign pension plans that were assumed as part of the Acquisition. F. Represents expenses primarily related to employee termination benefits, including our initiative to improve the overall cost structure within the European region, and other employee-related costs. Termination benefits include the costs associated with our headcount initiatives for establishment of new roles and elimination of old roles and other costs associated with cost saving opportunities that were related to our transition to a standalone entity. G. Represents fees paid to consultants, advisors, and other third-party professional organizations for professional services rendered in conjunction with the transition from DuPont to a standalone entity. H. Represents charges associated with the transition from DuPont to a standalone entity, including branding and marketing, information technology related costs, and facility transition costs. |
 Axalta Coating Systems Ltd. Adjusted EBITDA Reconciliation (cont’d) 17 Predecessor Period from January 1, 2013 through January 31, 2013 Allocated corporate costs $ 25.4 Standalone costs (19.7) Total $ 5.7 I. Represents costs associated with the IPO including a $13 million payment to terminate consulting agreement (see note L). J. Represents costs for certain unusual or non-operational (gains) and losses and the non-cash impact of natural gas and currency hedge losses allocated to DPC by DuPont, stock-based compensation, asset impairments, equity investee dividends, indemnity (income) losses associated with the Acquisition, gains resulting from amendments to long-term benefit plans and loss (gain) on sale and disposal of property, plant and equipment. K. Represents the payment of dividends to our joint venture partners by our consolidated entities that are not wholly owned. L. Pursuant to Axalta’s management agreement with Carlyle Investment Management, L.L.C., an affiliate of Carlyle, for management and financial advisory services and oversight provided to Axalta and its subsidiaries, Axalta was required to pay an annual management fee of $3 million and out-of-pocket expenses. This agreement was terminated upon completion of the IPO. M. Represents (1) the add-back of corporate allocations from DuPont to DPC for the usage of DuPont’s facilities, functions and services; costs for administrative functions and services performed on behalf of DPC by centralized staff groups within DuPont; a portion of DuPont’s general corporate expenses; and certain pension and other long-term employee benefit costs, in each case because we believe these costs are not indicative of costs we would have incurred as a standalone company net, of (2) estimated standalone costs based on a corporate function resource analysis that included a standalone executive office, the costs associated with supporting a standalone information technology infrastructure, corporate functions such as legal, finance, treasury, procurement and human resources and certain costs related to facilities management. This resource analysis included anticipated headcount and the associated overhead costs of running these functions effectively as a standalone company of our size and complexity. This estimate is provided for additional information and analysis only, as we believe that it facilitates enhanced comparability between Predecessor and Successor periods. It represents the difference between the costs that were allocated to our predecessor by its parent and the costs that we believe would be incurred if it operated as a standalone entity. This estimate is not intended to represent a pro forma adjustment presented within the guidance of Article 11 of Regulation S-X. Although we believe this estimate is reasonable, actual results may have differed from this estimate, and any difference may be material. |
 |