Exhibit 99.2

Investor Presentation September 2015
Forward-Looking Statements CAUTIONARY STATEMENT This presentation contains forward-looking statements, which include all statements that do not relate solely to historical or current facts. These forward-looking statements are subject to a number of known and unknown uncertainties and risks which are described in headings such as “Risk Factors” in Fidelity National Financial’s (“FNF”) annual report on Form 10-K and other reports filed with the Securities and Exchange Commission and in the Registration Statement on Form 10 relating to the proposed spinoff of common stock of J. Alexander’s Holdings, Inc. (the “Company”). As a consequence, actual results may differ significantly from those expressed in any forward-looking statements in the presentation. We do not intend to update any of these forward-looking statements. This presentation contains forward-looking statements within the meaning of Section 27A of the Securities Act, Section 21E of the Exchange Act and the Private Securities Litigation Reform Act of 1995 that involve risk and uncertainties. All statements in this presentation other than statements of historical fact, including statements regarding projections, expected operating results, expected timing of the completion of the spin-off transaction, the benefits of the spin-off transaction, the tax-free treatment of the spin-off transaction, the anticipated management of the business to be spun off, the market position of the business to be spun off and other events that depend upon or refer to future events or conditions or that include words such as “expects,” “anticipates,” “intends,” “plans,” “believes,” “estimates,” “thinks,” and similar expressions, are forward-looking statements. Although FNF and the Company believe that these forward-looking statements are based on reasonable assumptions, these assumptions are inherently subject to significant risks, uncertainties and contingencies, which are difficult or impossible to predict accurately and are beyond the control of FNF and the Company. Accordingly, there can be no assurance that the proposed transaction or these future events will occur as anticipated, if at all, or that actual results will be as expected. A number of factors could affect the future results of the Company or the restaurant industry generally and could cause the Company’s expected results to differ materially from those expressed in this presentation. In addition, as it relates to the proposed transaction, such differences may result from a number of factors, including but not limited to: the timing and completion of the proposed transaction; a failure to obtain assurances of anticipated tax treatment; a deterioration in the business or prospects of the Company or its restaurant operations; adverse developments in the Company or the markets in which the Company’s restaurants are located; adverse developments in the U.S. or global capital markets, credit markets or economies generally; the risk that the benefits of the proposed transaction may not be fully realized or may take longer to realize than expected. Additional risks and factors that may affect results are set forth in filings by FNF and the Company with the Securities and Exchange Commission, including FNF’s most recent Annual Report on Form 10-K and the Company’s Registration Statement on Form 10. The consolidated operating results of the Company for the three and six months ended June 28, 2015, are not necessarily indicative of the results that may be experienced for any such future period or for any future year. FNF and the Company caution that the guidance for 2015 set forth in this presentation is given as of the date hereof based on currently available information. The forward-looking statements speak only as of the date of this presentation. Neither FNF nor the Company undertakes any obligation to revise or update any of these statements, or to make any other forward-looking statements, whether as a result of new information, future events or otherwise.

Senior Management Presenters Lonnie J. Stout II Chief Executive Officer Mark A. Parkey Chief Financial Officer
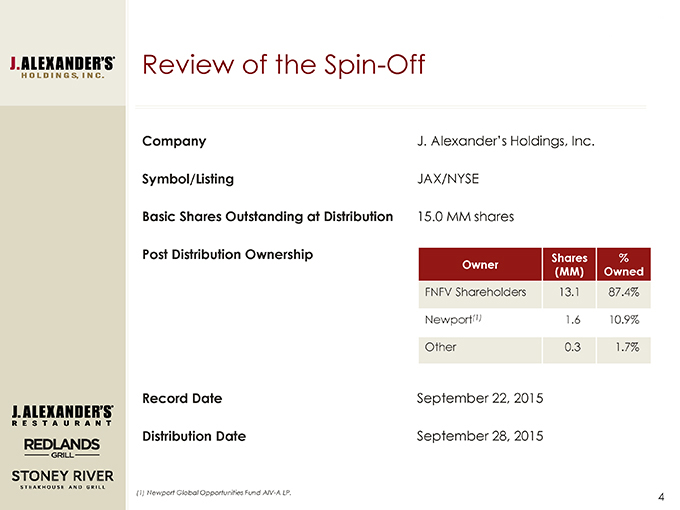
Review of the Spin-Off Company J. Alexander’s Holdings, Inc. Symbol/Listing JAX/NYSE Basic Shares Outstanding at Distribution 15.0 MM shares Post Distribution Ownership Owner Shares % (MM) Owned FNFV Shareholders 13.1 87.4% Newport(1) 1.6 10.9% Other 0.3 1.7% Record Date September 22, 2015 Distribution Date September 28, 2015 (1) Newport Global Opportunities Fund AIV-A LP.
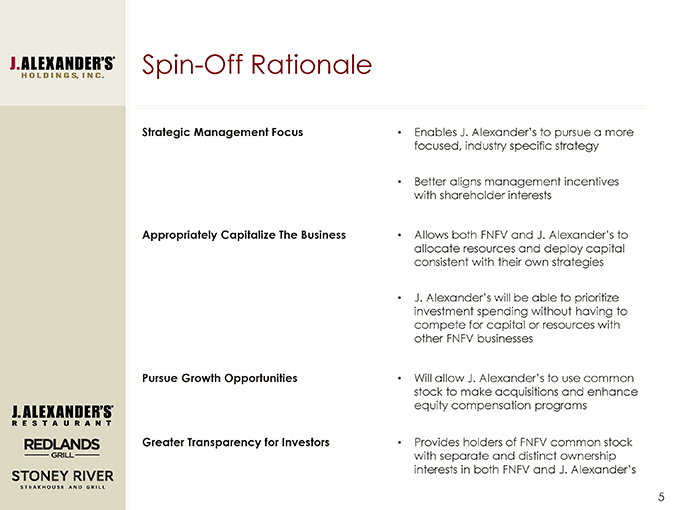
Spin-Off Rationale Strategic Management Focus • Enables J. Alexander’s to pursue a more focused, industry specific strategy • Better aligns management incentives with shareholder interests Appropriately Capitalize The Business • Allows both FNFV and J. Alexander’s to allocate resources and deploy capital consistent with their own strategies • J. Alexander’s will be able to prioritize investment spending without having to compete for capital or resources with other FNFV businesses Pursue Growth Opportunities • Will allow J. Alexander’s to use common stock to make acquisitions and enhance equity compensation programs Greater Transparency for Investors • Provides holders of FNFV common stock with separate and distinct ownership interests in both FNFV and J. Alexander’s
We are Unchained To view the video please go to http://investor.jalexandersholdings.com.
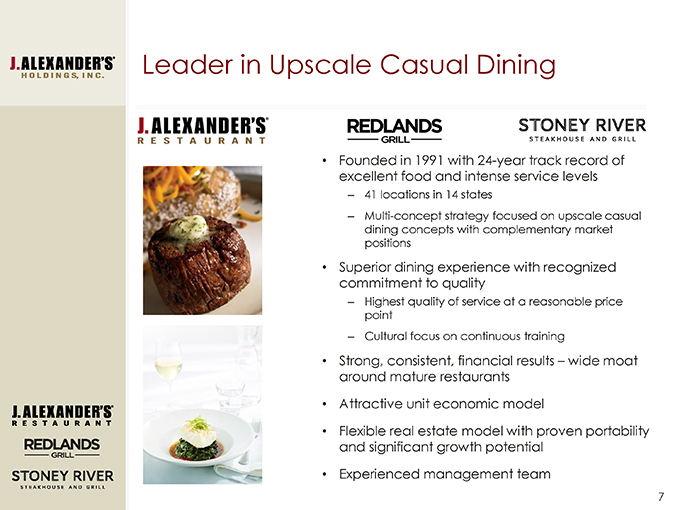
Leader in Upscale Casual Dining • Founded in 1991 with 24-year track record of excellent food and intense service levels – 41 locations in 14 states – Multi-concept strategy focused on upscale casual dining concepts with complementary market positions • Superior dining experience with recognized commitment to quality – Highest quality of service at a reasonable price point – Cultural focus on continuous training • Strong, consistent, financial results – wide moat around mature restaurants • Attractive unit economic model • Flexible real estate model with proven portability and significant growth potential • Experienced management team
What Sets Us Apart Our concepts are similar in style but each location is unique, giving them a boutique “unchained” look and feel Our concepts share a focus on highly professional, unparalleled service Our concepts have a commitment to quality food with 95% of items made from scratch, in-house
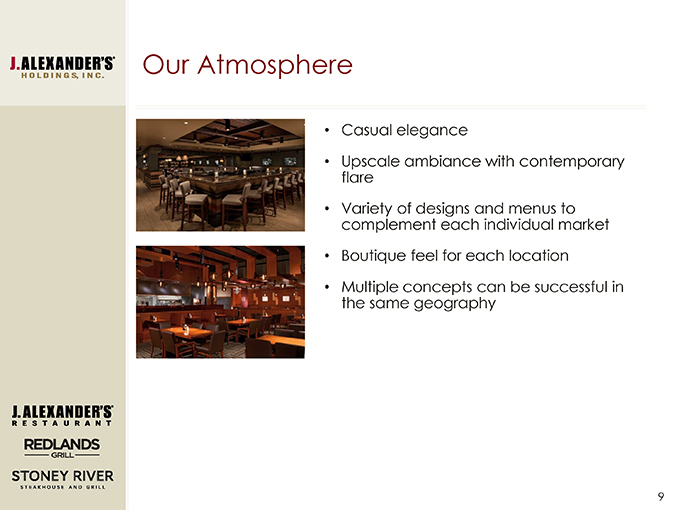
Our Atmosphere • Casual elegance • Upscale ambiance with contemporary flare • Variety of designs and menus to complement each individual market • Boutique feel for each location • Multiple concepts can be successful in the same geography
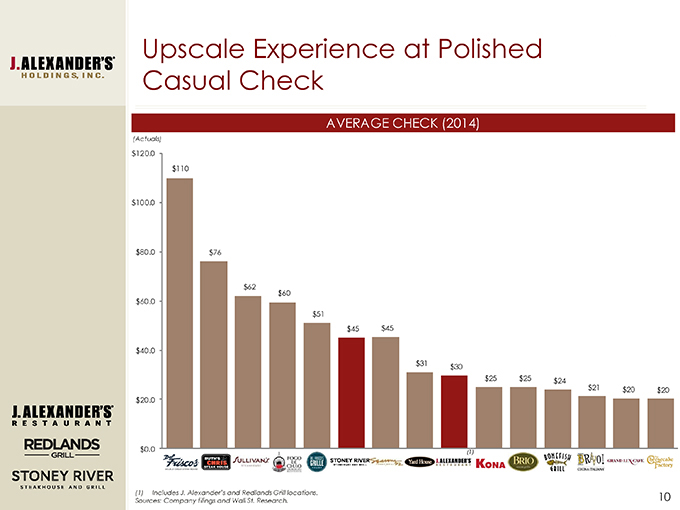
Upscale Experience at Polished Casual Check AVERAGE CHECK (2014) (Actuals) $120.0 $110 $100.0 $80.0 $76 $62 $60 $60.0 $51 $45 $45 $40.0 $31 $30 $25 $25 $24 $21 $20 $20 $20.0 $0.0 (1) (1) Includes J. Alexander’s and Redlands Grill locations. Sources: Company filings and Wall St. Research.
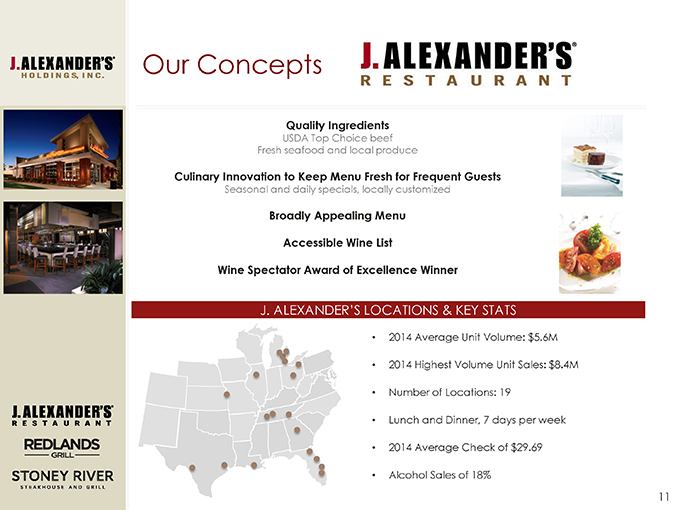
Our Concepts Quality Ingredients USDA Top Choice beef Fresh seafood and local produce Culinary Innovation to Keep Menu Fresh for Frequent Guests Seasonal and daily specials, locally customized Broadly Appealing Menu Accessible Wine List Wine Spectator Award of Excellence Winner J. ALEXANDER’S LOCATIONS & KEY STATS 2014 Average Unit Volume: $5.6M 2014 Highest Volume Unit Sales: $8.4M Number of Locations: 19 Lunch and Dinner, 7 days per week 2014 Average Check of $29.69 Alcohol Sales of 18%
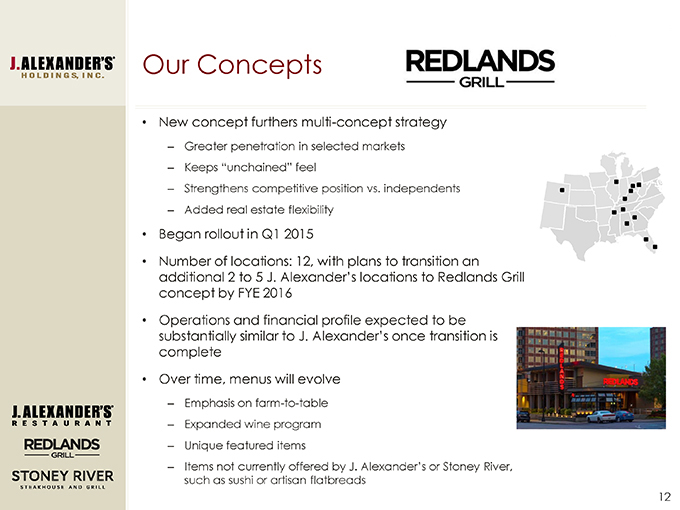
Our Concepts • New concept furthers multi-concept strategy – Greater penetration in selected markets – Keeps “unchained” feel – Strengthens competitive position vs. independents – Added real estate flexibility • Began rollout in Q1 2015 • Number of locations: 12, with plans to transition an additional 2 to 5 J. Alexander’s locations to Redlands Grill concept by FYE 2016 • Operations and financial profile expected to be substantially similar to J. Alexander’s once transition is complete • Over time, menus will evolve – Emphasis on farm-to-table – Expanded wine program – Unique featured items – Items not currently offered by J. Alexander’s or Stoney River, such as sushi or artisan flatbreads
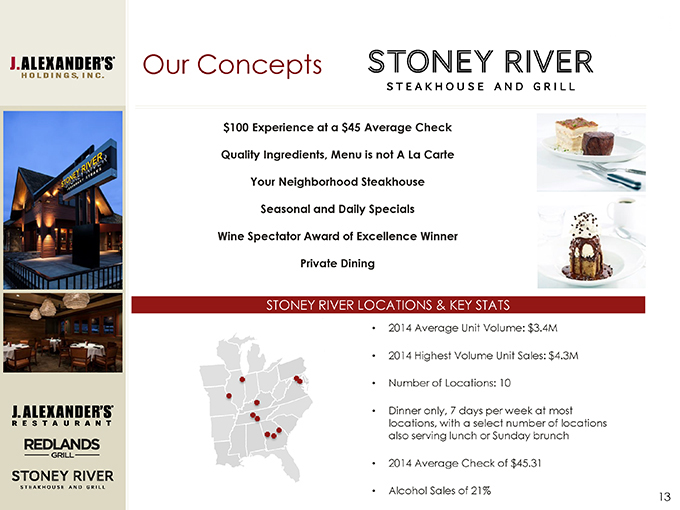
Our Concepts $100 Experience at a $45 Average Check Quality Ingredients, Menu is not A La Carte Your Neighborhood Steakhouse Seasonal and Daily Specials Wine Spectator Award of Excellence Winner Private Dining STONEY RIVER LOCATIONS & KEY STATS • 2014 Average Unit Volume: $3.4M • 2014 Highest Volume Unit Sales: $4.3M • Number of Locations: 10 • Dinner only, 7 days per week at most locations, with a select number of locations also serving lunch or Sunday brunch • 2014 Average Check of $45.31 • Alcohol Sales of 21%
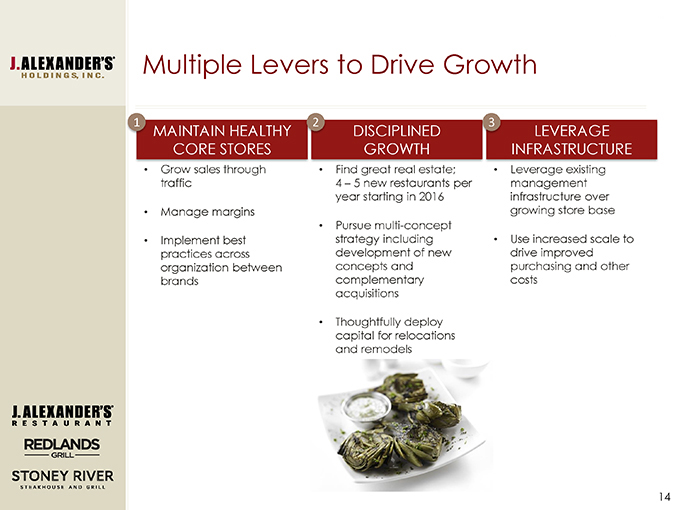
Multiple Levers to Drive Growth 1 MAINTAIN HEALTHY CORE STORES Grow sales through traffic • Manage margins • Implement best practices across organization between brands 2 DISCIPLINED GROWTH • Find great real estate; 4 – 5 new restaurants per year starting in 2016 • Pursue multi-concept strategy including development of new concepts and complementary acquisitions • Thoughtfully deploy capital for relocations and remodels 3 LEVERAGE INFRASTRUCTURE • Leverage existing management infrastructure over growing store base • Use increased scale to drive improved purchasing and other costs
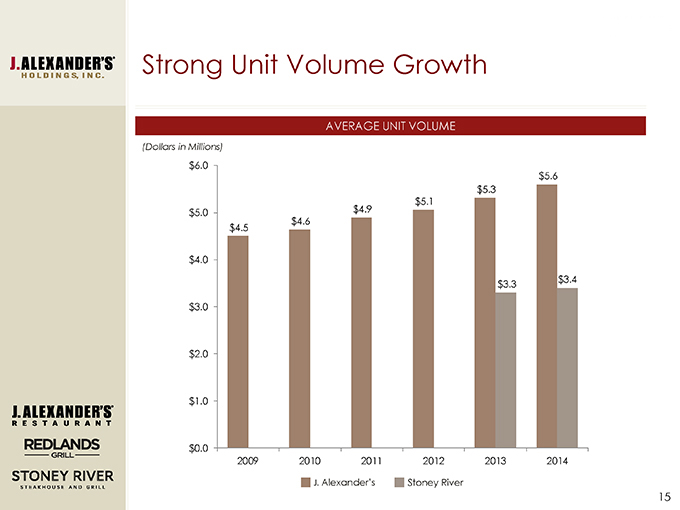
Strong Unit Volume Growth AVERAGE UNIT VOLUME (Dollars in Millions) $6.0 $5.6 $5.3 $5.1 $5.0 $4.9 $4.6 $4.5 $4.0 $3.4 $3.3 $3.0 $2.0 $1.0 $0.0 2009 2010 2011 2012 2013 2014 J. Alexander’s Stoney River
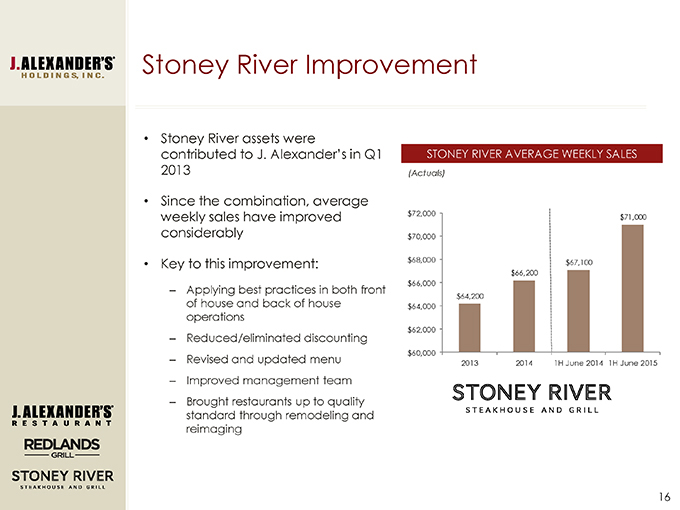
Stoney River Improvement • Stoney River assets were contributed to J. Alexander’s in Q1 2013 • Since the combination, average weekly sales have improved considerably • Key to this improvement: – Applying best practices in both front of house and back of house operations – Reduced/eliminated discounting – Revised and updated menu – Improved management team – Brought restaurants up to quality standard through remodeling and reimaging STONEY RIVER AVERAGE WEEKLY SALES (Actuals) $72,000 $71,000 $70,000 $68,000 $67,100 $66,200 $66,000 $64,200 $64,000 $62,000 $60,000 2013 2014 1H June 2014 1H June 2015
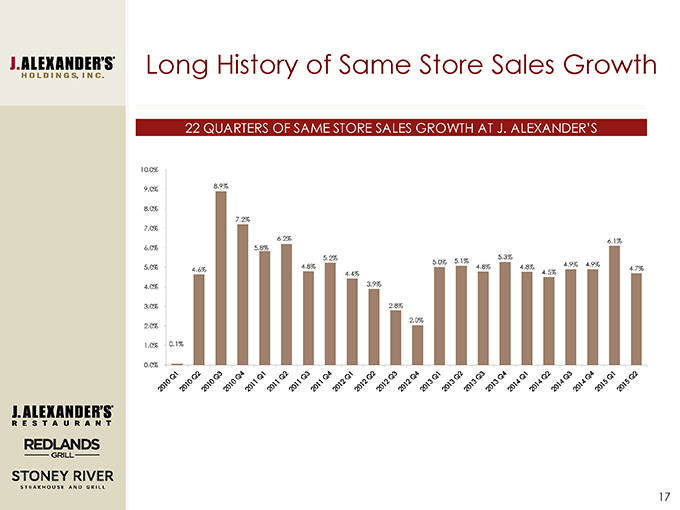
Long History of Same Store Sales Growth 22 QUARTERS OF SAME STORE SALES GROWTH AT J. ALEXANDER’S 10.0% 9.0% 8.9% 8.0% 7.2% 7.0% 6.2% 6.1% 6.0% 5.8% 5.2% 5.3% 5.0% 5.1% 4.8% 5.0% 4.8% 4.8% 4.5% 4.9% 4.9% 4.6% 4.7% 4.4% 4.0% 3.9% 3.0% 2.8% 2.0% 2.0% 1.0% 0.1% 0.0%
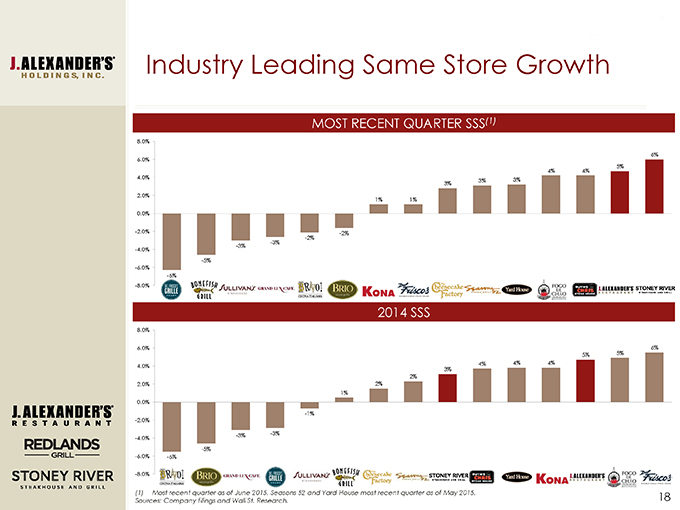
Industry Leading Same Store Growth MOST RECENT QUARTER SSS(1) 8.0% 6% 6.0% 5% 4% 4% 4.0% 3% 3% 3% 2.0% 1% 1% 0.0% -2.0% -2% -2% -3% -3% -4.0% -5% -6.0% -6% -8.0% 2014 SSS 8.0% 6.0% 5% 6% 5% 4% 4% 4% 4.0% 3% 2% 2.0% 2% 1% 0.0% -1% -2.0% -3% -3% -4.0% -5% -6.0% -6% -8.0% (1) Most recent quarter as of June 2015. Seasons 52 and Yard House most recent quarter as of May 2015. Sources: Company filings and Wall St. Research.
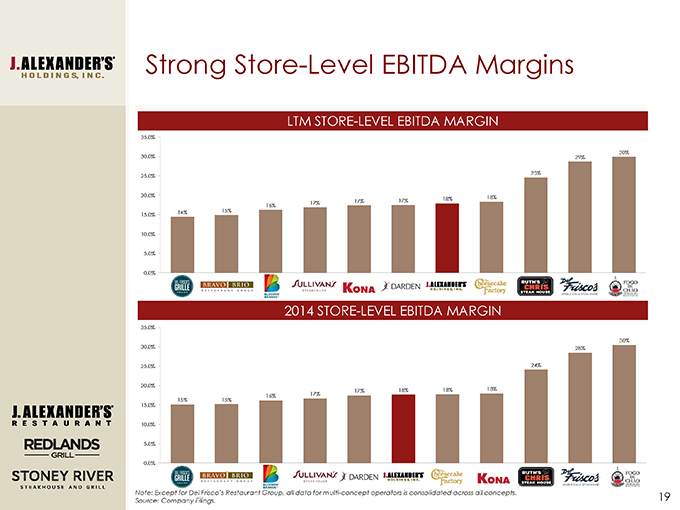
Strong Store-Level EBITDA Margins LTM STORE-LEVEL EBITDA MARGIN 35.0% 30% 30.0% 29% 25% 25.0% 20.0% 18% 17% 17% 18% 16% 17% 14% 15% 15.0% 10.0% 5.0% 0.0% 2014 STORE-LEVEL EBITDA MARGIN 35.0% 30% 30.0% 28% 25.0% 24% 20.0% 17% 17% 18% 18% 18% 16% 15.0% 15% 15% 10.0% 5.0% 0.0% Note: Except for Del Frisco’s Restaurant Group, all data for multi-concept operators is consolidated across all concepts. Source: Company Filings.
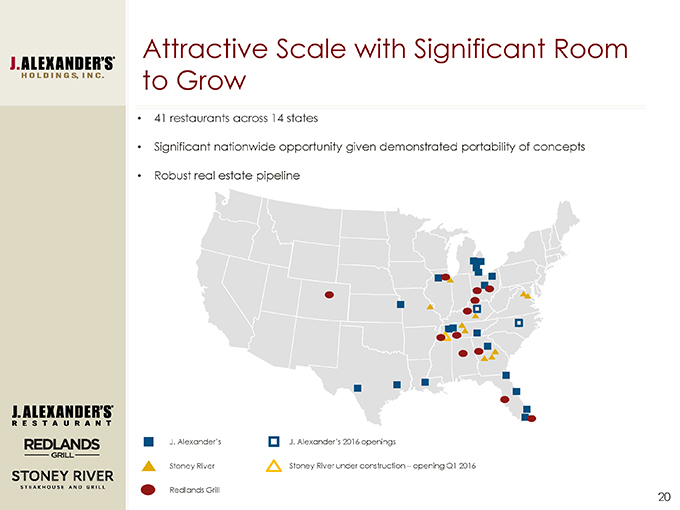
Attractive Scale with Significant Room to Grow • 41 restaurants across 14 states • Significant nationwide opportunity given demonstrated portability of concepts • Robust real estate pipeline J. Alexander’s J. Alexander’s 2016 openings Stoney River Stoney River under construction – opening Q1 2016 Redlands Grill
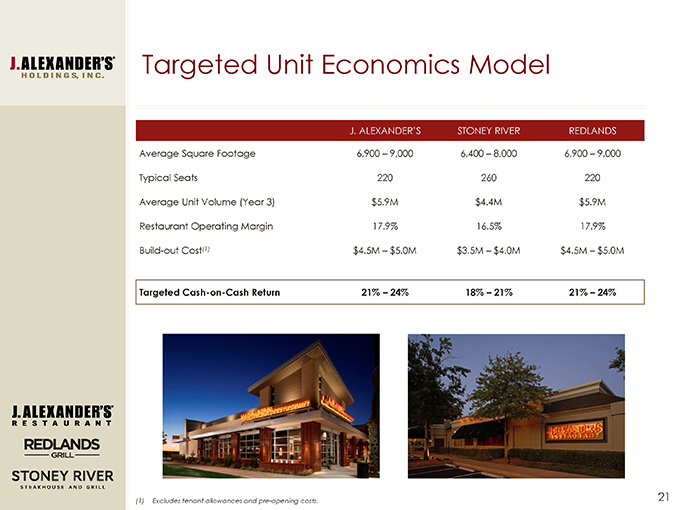
Targeted Unit Economics Model J. ALEXANDER’S STONEY RIVER REDLANDS Average Square Footage 6,900 – 9,000 6,400 – 8,000 6,900 – 9,000 Typical Seats 220 260 220 Average Unit Volume (Year 3) $5.9M $4.4M $5.9M Restaurant Operating Margin 17.9% 16.5% 17.9% Build-out Cost(1) $4.5M – $5.0M $3.5M – $4.0M $4.5M – $5.0M Targeted Cash-on-Cash Return 21% – 24% 18% – 21% 21% – 24% (1) Excludes tenant allowances and pre-opening costs.
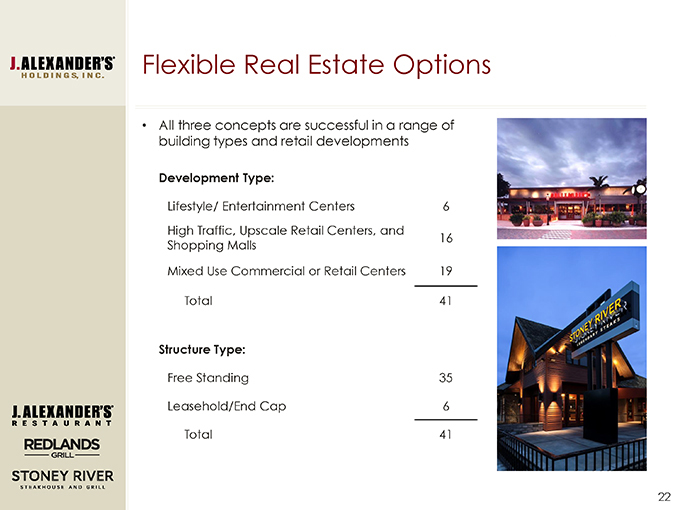
Flexible Real Estate Options • All three concepts are successful in a range of building types and retail developments Development Type: Lifestyle/ Entertainment Centers 6 High Traffic, Upscale Retail Centers, and 16 Shopping Malls Mixed Use Commercial or Retail Centers 19 Total 41 Structure Type: Free Standing 35 Leasehold/End Cap 6 Total 41
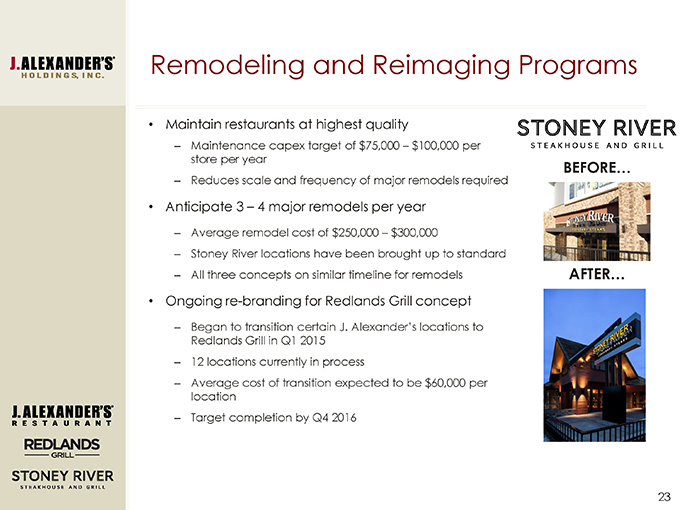
Remodeling and Reimaging Programs • Maintain restaurants at highest quality – Maintenance capex target of $75,000 – $100,000 per store per year – Reduces scale and frequency of major remodels required • Anticipate 3 – 4 major remodels per year – Average remodel cost of $250,000 – $300,000 – Stoney River locations have been brought up to standard – All three concepts on similar timeline for remodels • Ongoing re-branding for Redlands Grill concept – Began to transition certain J. Alexander’s locations to Redlands Grill in Q1 2015 – 12 locations currently in process – Average cost of transition expected to be $60,000 per location – Target completion by Q4 2016 Before After
Cultural Focus on Continuous Training • Our team members are experts in our food, drink, and the art of hospitality • Focus on providing superior professional service • Low table to server ratio • Comprehensive initial training program • Dedicated wine, spirits, and bar training • Rigorous investment in ongoing training for existing team members • Enhance culture with focus on promoting from within • Bench strength to support substantial growth INTENSE LEVELS OF SERVICE
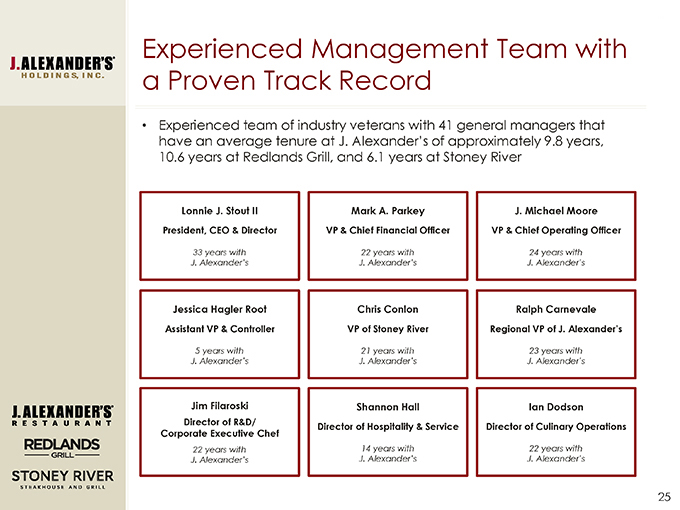
Experienced Management Team with a Proven Track Record • Experienced team of industry veterans with 41 general managers that have an average tenure at J. Alexander’s of approximately 9.8 years, 10.6 years at Redlands Grill, and 6.1 years at Stoney River Lonnie J. Stout II President, CEO & Director 33 years with J. Alexander’s Jessica Hagler Root Assistant VP & Controller 5 years with J. Alexander’s Jim Filaroski Director of R&D/ Corporate Executive Chef 22 years with J. Alexander’s Mark A. Parkey VP & Chief Financial Officer 22 years with J. Alexander’s Chris Conlon VP of Stoney River 21 years with J. Alexander’s Shannon Hall Director of Hospitality & Service 14 years with J. Alexander’s J. Michael Moore VP & Chief Operating Officer 24 years with J. Alexander’s Ralph Carnevale Regional VP of J. Alexander’s 23 years with J. Alexander’s Ian Dodson Director of Culinary Operations 22 years with J. Alexander’s
Black Knight Advisory Services • J. Alexander’s has entered into a management consulting agreement with Black Knight Advisory Services, LLC (“Black Knight”) which is owned and controlled by several key executive officers and directors of FNFV and J. Alexander’s—The Black Knight team has been an active part of the management and Board of J. Alexander’s and provided key Board-level strategic guidance during the Company’s ownership by FNF and FNFV—They have helped us achieve significant milestones since 2012n Successful integration of Stoney Rivern Accelerated unit growth pipelinen Doubling of EBITDA • The agreement with Black Knight gives the Company access to best-in-class expertise in capital raising, tax matters, legal advice and mergers and acquisitions execution generally not accessible or affordable for a company of this size—The current consulting agreement has a seven year term, and Black Knight will earn a fee equal to 3% of Adjusted EBITDA each year—Additionally, Black Knight was issued non-voting Class B units of J. Alexander’s Holdings, LLC, a part of the Profits Interest plan, in the amount of 10% which will have a strike price equal to the value at distribution Note: For further information regarding the agreement with Black Knight and the Profits Interest Plan please see the “Executive Compensation” and “Certain Relationships and Related Party Transactions” sections of the Company’s Registration Statement on Form 10.

Financial Performance
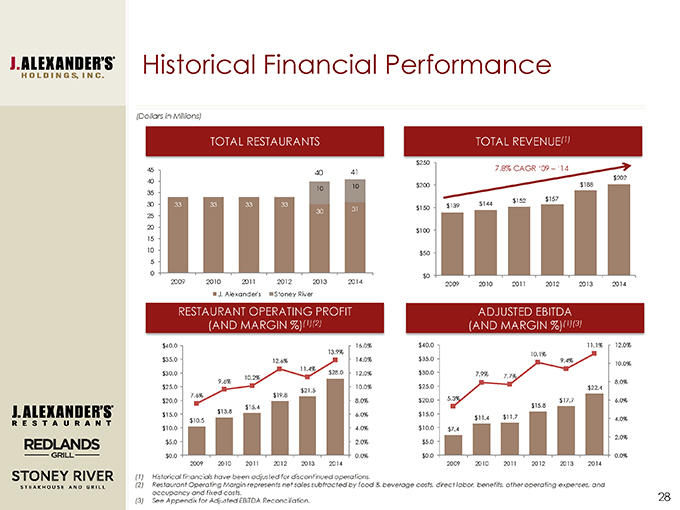
Historical Financial Performance (Dollars in Millions) TOTAL RESTAURANTS 45 40 41 40 35 10 10 30 33 33 33 33 25 30 31 20 15 10 5 0 2009 2010 2011 2012 2013 2014 J. Alexander’s Stoney River RESTAURANT OPERATING PROFIT (AND MARGIN %)(1)(2) $40.0 16.0% 13.9% $35.0 12.6% 14.0% 11.4% $30.0 $28.0 12.0% 10.2% $25.0 9.6% 10.0% $21.5 $20.0 7.6% $19.8 8.0% $15.4 $13.8 $15.0 $10.5 6.0% $10.0 4.0% $5.0 2.0% 15.1% $0.0 0.0% 2009 2010 2011 2012 2013 2014 TOTAL REVENUE(1) $250 7.8% CAGR ‘09 – ‘14 $202 $200 $188 $152 $157 $139 $144 $150 $100 $50 $0 2009 2010 2011 2012 2013 2014 ADJUSTED EBITDA (AND MARGIN %)(1)(3) $40.0 11.1% 12.0% 10.1% $35.0 9.4% 10.0% $30.0 7.9% 7.7% 8.0% $25.0 $22.4 $20.0 5.3% $17.7 6.0% $15.8 $15.0 $11.7 $11.4 4.0% $10.0 $7.4 2.0% $5.0 12.2% .2% $0.0 0.0% 2009 2010 2011 2012 2013 2014 (1) Historical financials have been adjusted for discontinued operations. (2) Restaurant Operating Margin represents net sales subtracted by food & beverage costs, direct labor, benefits, other operating expenses, and occupancy and fixed costs. (3) See Appendix for Adjusted EBITDA Reconciliation.

Momentum Continues in 1H 2015 (Dollars in Millions) TOTAL RESTAURANTS 50 40 10 10 30 30 31 20 10 0 Q2 June 2014 Q2 June 2015 J. Alexander’s Stoney River RESTAURANT OPERATING PROFIT (AND MARGIN %)(1) 10.7% $20.0 $14.9 $16.5 $15.0 $10.0 15.1% 14.6% $5.0 $0.0 1H June 2014 1H June 2015 TOTAL REVENUE 6.9% $120.0 $102.2 $109.3 $100.0 $80.0 $60.0 5.4% 4.6% $40.0 SSS SSS Growth $20.0 Growth $0.0 1H June 2014 1H June 2015 ADJUSTED EBITDA (AND MARGIN %)(2) $20.0 6.4% $15.0 $13.3 $12.5 $10.0 $5.0 12.2% 12.2% $0.0 1H June 2014 1H June 2015 (1) Restaurant Operating Margin represents net sales subtracted by food & beverage costs, direct labor, benefits, other operating expenses, and occupancy and fixed costs. (2) See Appendix for Adjusted EBITDA Reconciliation.
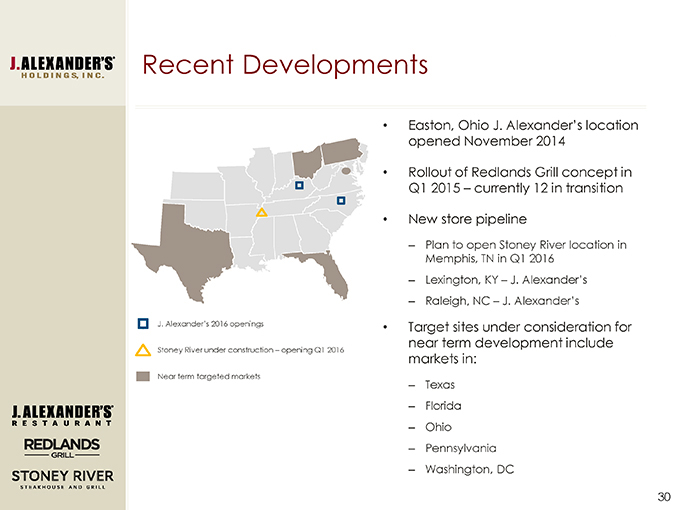
Recent Developments J. Alexander’s 2016 openings Stoney River under construction – opening Q1 2016 Near term targeted markets • Easton, Ohio J. Alexander’s location opened November 2014 • Rollout of Redlands Grill concept in Q1 2015 – currently 12 in transition • New store pipeline – Plan to open Stoney River location in Memphis, TN in Q1 2016 – Lexington, KY – J. Alexander’s – Raleigh, NC – J. Alexander’s • Target sites under consideration for near term development include markets in: – Texas – Florida – Ohio – Pennsylvania – Washington, DC
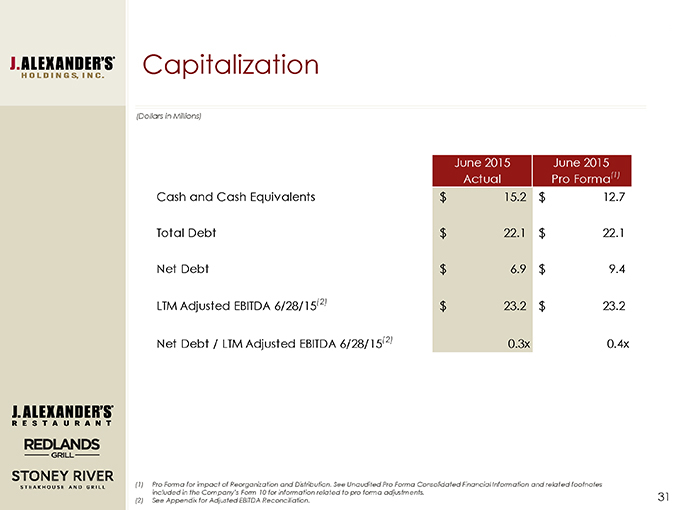
Capitalization (Dollars in Millions) June 2015 June 2015 Actual Pro Forma(1) Cash and Cash Equivalents $ 15.2 $ 12.7 Total Debt $ 22.1 $ 22.1 Net Debt $6.9 $9.4 LTM Adjusted EBITDA 6/28/15(2) $ 23.2 $ 23.2 Net Debt / LTM Adjusted EBITDA 6/28/15(2) 0.3x 0.4x (1) Pro Forma for impact of Reorganization and Distribution. See Unaudited Pro Forma Consolidated Financial Information and related footnotes included in the Company’s Form 10 for information related to pro forma adjustments. (2) See Appendix for Adjusted EBITDA Reconciliation.
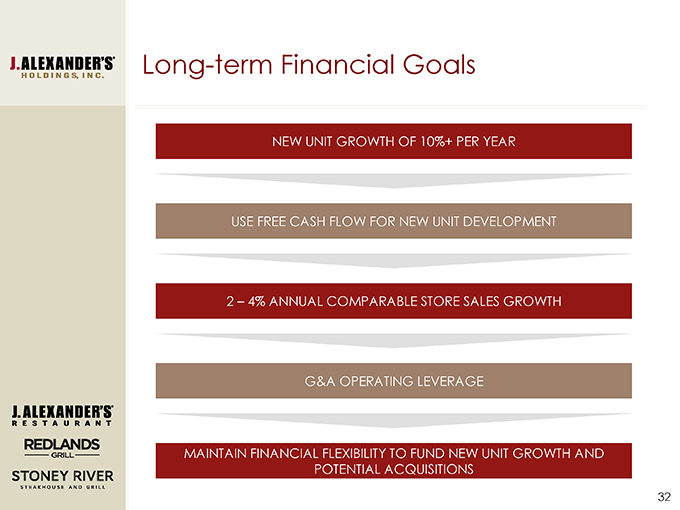
Long-term Financial Goals NEW UNIT GROWTH OF 10%+ PER YEAR USE FREE CASH FLOW FOR NEW UNIT DEVELOPMENT 2 – 4% ANNUAL COMPARABLE STORE SALES GROWTH G&A OPERATING LEVERAGE MAINTAIN FINANCIAL FLEXIBILITY TO FUND NEW UNIT GROWTH AND POTENTIAL ACQUISITIONS
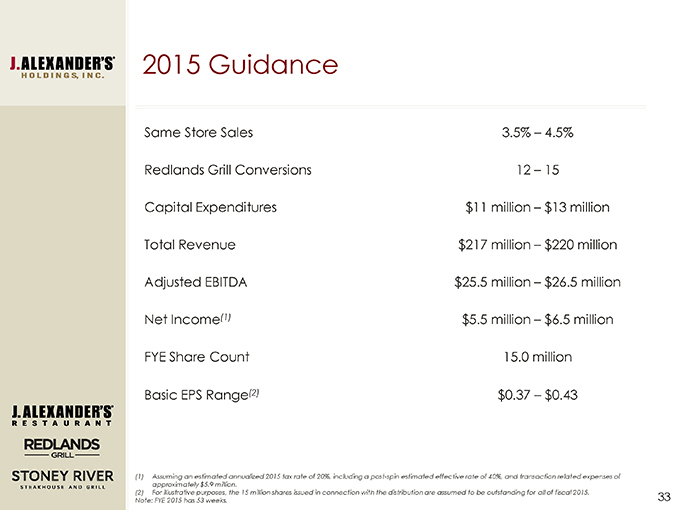
2015 Guidance Same Store Sales 3.5% – 4.5% Redlands Grill Conversions 12 – 15 Capital Expenditures $11 million – $ 13 million Total Revenue $217 million – $ 220 million Adjusted EBITDA $25.5 million – $ 26.5 million Net Income(1) $5.5 million – $ 6.5 million FYE Share Count 15.0 million Basic EPS Range(2) $0.37 – $0.43 (1) Assuming an estimated annualized 2015 tax rate of 20%, including a post-spin estimated effective rate of 40%, and transaction related expenses of approximately $5.9 million. (2) For illustrative purposes, the 15 million shares issued in connection with the distribution are assumed to be outstanding for all of fiscal 2015. Note: FYE 2015 has 53 weeks.

Appendix
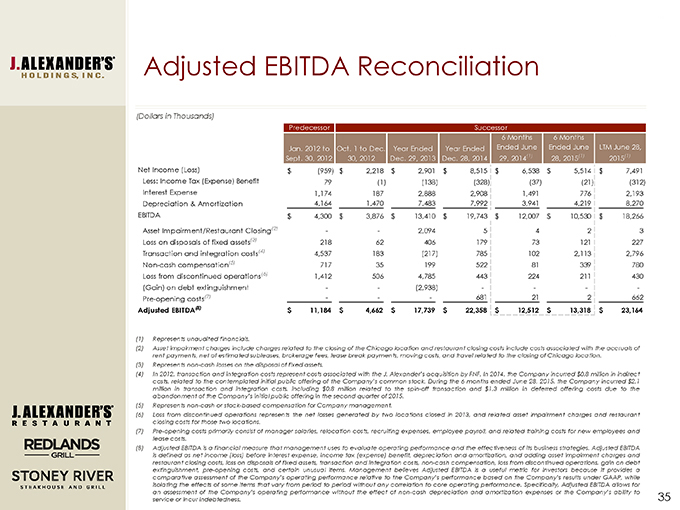
Adjusted EBITDA Reconciliation (Dollars in Thousands) Predecessor Successor 6 Months 6 Months Jan. 2012 to Oct. 1 to Dec. Year Ended Year Ended Ended June Ended June LTM June 28, Sept. 30, 2012 30, 2012 Dec. 29, 2013 Dec. 28, 2014 29, 2014(1) 28, 2015(1) 2015(1) Net Income (Loss) $ (959) $ 2,218 $ 2,901 $ 8,515 $ 6,538 $ 5,514 $ 7,491 Less: Income Tax (Expense) Benefit 79 (1) (138) (328) (37) (21) (312) Interest Expense 1,174 187 2,888 2,908 1,491 776 2,193 Depreciation & Amortization 4,164 1,470 7,483 7,992 3,941 4,219 8,270 EBITDA $ 4,300 $ 3,876 $ 13,410 $ 19,743 $ 12,007 $ 10,530 $ 18,266 Asset Impairment/Restaurant Closing(2) — 2,094 5 4 2 3 Loss on disposals of fixed assets(3) 218 62 406 179 73 121 227 Transaction and integration costs(4) 4,537 183 (217) 785 102 2,113 2,796 Non-cash compensation(5) 717 35 199 522 81 339 780 Loss from discontinued operations(6) 1,412 506 4,785 443 224 211 430 (Gain) on debt extinguishment — (2,938) — — Pre-opening costs(7) ——681 21 2 662 Adjusted EBITDA(8) $ 11,184 $ 4,662 $ 17,739 $ 22,358 $ 12,512 $ 13,318 $ 23,164 (1) Represents unaudited financials. (2) Asset impairment charges include charges related to the closing of the Chicago location and restaurant closing costs include costs associated with the accruals of rent payments, net of estimated subleases, brokerage fees, lease break payments, moving costs, and travel related to the closing of Chicago location. (3) Represents non-cash losses on the disposal of fixed assets. (4) In 2012, transaction and integration costs represent costs associated with the J. Alexander’s acquisition by FNF. In 2014, the Company incurred $0.8 million in indirect costs, related to the contemplated initial public offering of the Company’s common stock. During the 6 months ended June 28, 2015, the Company incurred $2.1 million in transaction and integration costs, including $0.8 million related to the spin-off transaction and $1.3 million in deferred offering costs due to the abandonment of the Company’s initial public offering in the second quarter of 2015. (5) Represents non-cash or stock-based compensation for Company management. (6) Loss from discontinued operations represents the net losses generated by two locations closed in 2013, and related asset impairment charges and restaurant closing costs for those two locations. (7) Pre-opening costs primarily consist of manager salaries, relocation costs, recruiting expenses, employee payroll, and related training costs for new employees and lease costs. (8) Adjusted EBITDA is a financial measure that management uses to evaluate operating performance and the effectiveness of its business strategies. Adjusted EBITDA is defined as net income (loss) before interest expense, income tax (expense) benefit, depreciation and amortization, and adding asset impairment charges and restaurant closing costs, loss on disposals of fixed assets, transaction and integration costs, non-cash compensation, loss from discontinued operations, gain on debt extinguishment, pre-opening costs, and certain unusual items. Management believes Adjusted EBITDA is a useful metric for investors because it provides a comparative assessment of the Company’s operating performance relative to the Company’s performance based on the Company’s results under GAAP, while isolating the effects of some items that vary from period to period without any correlation to core operating performance. Specifically, Adjusted EBITDA allows for an assessment of the Company’s operating performance without the effect of non-cash depreciation and amortization expenses or the Company’s ability to service or incur indebtedness.