 Annual Meeting of Shareholders Nasdaq: KRNY October 27, 2016 Exhibit 99.2 |
 This presentation may include certain “forward-looking statements,” which are made in good faith by Kearny Financial Corp. (the “Company”) pursuant to the “safe harbor” provisions of the Private Securities Litigation Reform Act of 1995. These forward-looking statements involve risks and uncertainties, such as statements of the Company’s plans, objectives, expectations, estimates and intentions that are subject to change based on various important factors (some of which are beyond the Company’s control). In addition to the factors described under Item 1A. Risk Factors in the Company’s Annual Report on Form 10-K, the following factors, among others, could cause the Company’s financial performance to differ materially from the plans, objectives, expectations, estimates and intentions expressed in such forward-looking statements: • the strength of the United States economy in general and the strength of the local economy in which the Company conducts operations, • the effects of and changes in, trade, monetary and fiscal policies and laws, including interest rate policies of the Board of Governors of the Federal Reserve System, inflation, interest rates, market and monetary fluctuations, • the impact of changes in financial services laws and regulations (including laws concerning taxation, banking, securities and insurance), • changes in accounting policies and practices, as may be adopted by regulatory agencies, the Financial Accounting Standards Board (“FASB”) or the Public Company Accounting Oversight Board, • technological changes. • competition among financial services providers and, • the success of the Company at managing the risks involved in the foregoing and managing its business. The Company cautions that the foregoing list of important factors is not exclusive. The Company does not undertake to update any forward-looking statement, whether written or oral, that may be made from time to time by or on behalf of the Company. Forward Looking Statements |
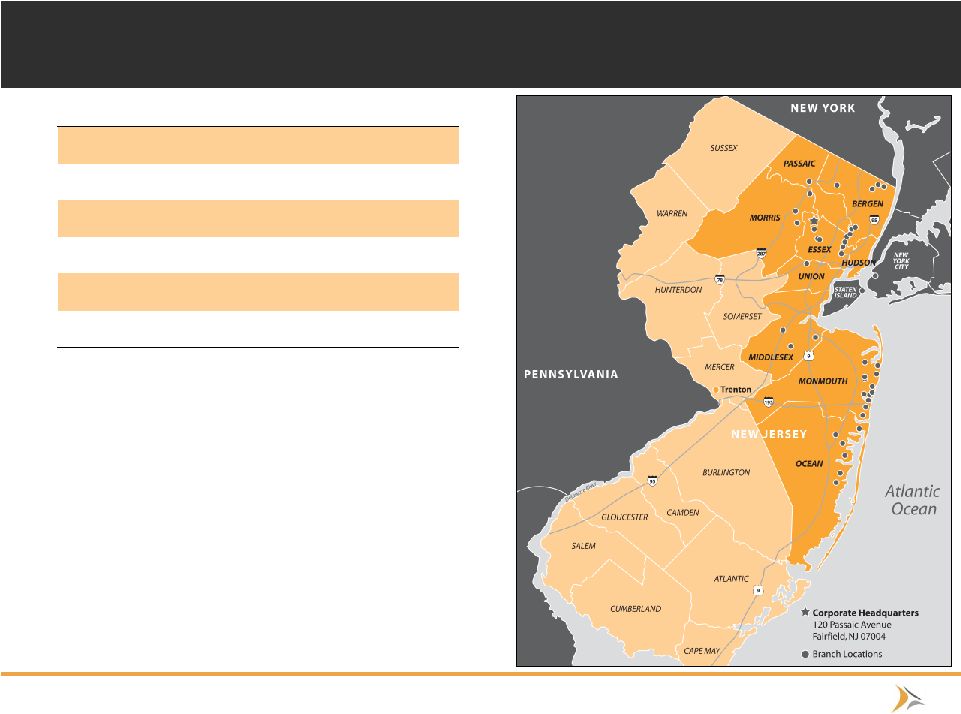 2 Overview of Kearny Financial Corp 1) As of October 24, 2016 2) As of June 30, 2016 Source: SNL Financial, Company Filings • Founded in 1884 • 9 th Largest New Jersey based deposit franchise – 42 branch locations in 11 counties throughout Northern and Central New Jersey and Southern New York – Top 15 deposit market share in the counties of Bergen, Hudson, Ocean, and Monmouth, New Jersey ² • Active acquirer – Completed 5 bank acquisitions since 1999 including most recently Brooklyn, NY based Atlas Bank in June, 2014 (dollars in millions) as of June 30, 2016 Total Assets $4,500.1 Total Deposits $2,694.8 Total Loans $2,677.3 Corporate Headquarters Fairfield, NJ Branches 42 Market Capitalization¹ $1,250.4 |
 3 Kearny Bank Mission Statement Kearny Bank is dedicated to providing professional service and sound financial advice to our client and shareholder base. This is successfully accomplished through deep-rooted guiding principles of strong values consisting of ethics and integrity, and by giving back to the communities we serve. Through our financial expertise, strong leadership, and loyal relationships, we help our clients achieve their financial goals both for today and for tomorrow. |
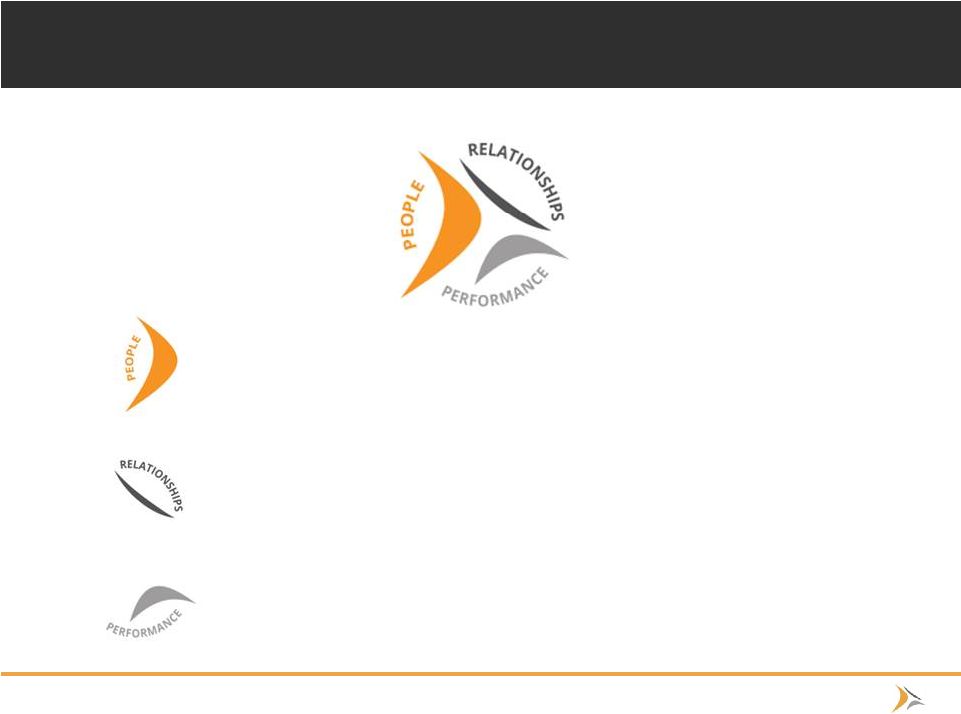 4 Core Values People Our significant stakeholders, including employees, current and future customers, stockholders, and the communities we serve. Relationships Delivery of superior service, a keen understanding of clients’ needs, and a welcoming environment has resulted in high levels of customer satisfaction, loyalty, and strong long-lasting relationships. Performance A strong resolve to remain true to sound, conservative practices, and superior customer service which has led to steady progress and growth throughout the years |
 5 Kearny Value Chain • Optimization of asset mix – Grow and diversify our commercial real estate lending portfolio – Expand our commercial lending business into new markets – Increase residential mortgage lending – Reinvest cashflows from the investment portfolio into loans while still maintaining a diverse composition and allocation to reduce exposure to long term interest rate risk • Shift funding mix to focus more on core deposits: noninterest and interest bearing non-maturity deposits • Expand existing fee based business lines (Mortgage Banking & SBA Lending) • Control noninterest expense • Significant opportunities to grow in market and in contiguous markets • Conservative lending policies and strong credit culture • Focused and disciplined approach to M&A |
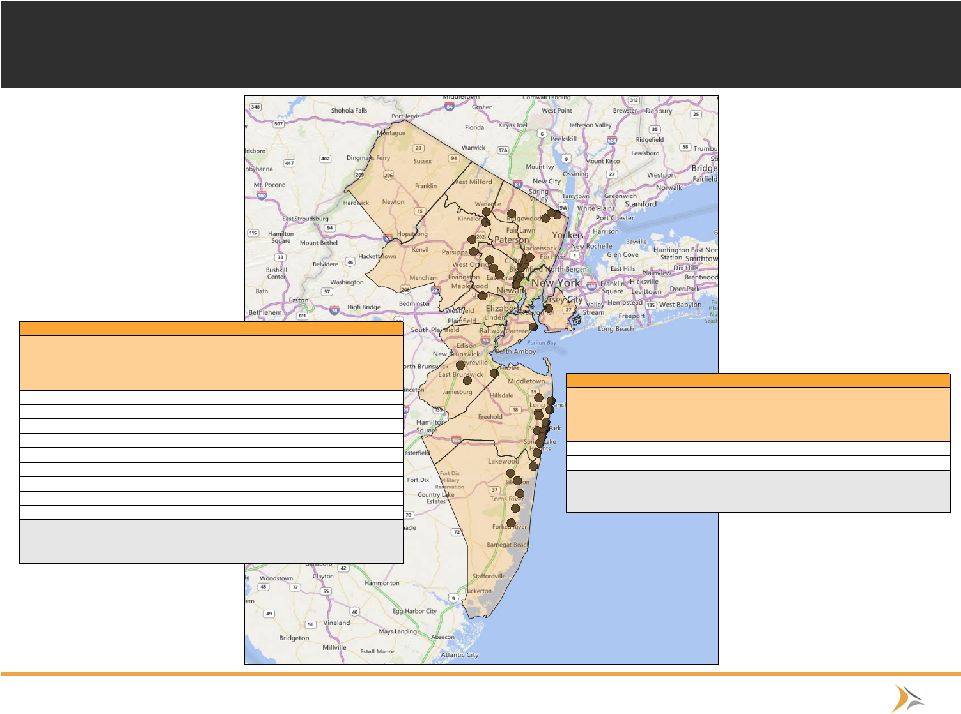 6 Attractive Market Demographics Note Deposit numbers as of June 30, 2016 1) Defined as the New York-Northern New Jersey-Long Island MSA Source: SNL Financial • Attractive markets • Part of the largest MSA¹ in the U.S • Opportunities still exist for organic growth in existing branch footprint • Weighted average median 2017 projected household income in Kearny franchise counties was $78,304 vs. $57,462 median household income nationwide – Household income poised to grow New York Market Demographics by County County Kearny Market Rank Number of Branches Kearny Deposits in Market ($000) Market Share (%) Projected Population Change 2017-2022 (%) Median HHI 2017 ($) Projected HHI Change 2017-2022 (%) Kings 31 1 55,179 0.11 3.72 50,530 10.45 Richmond 19 1 10,073 0.08 1.62 73,481 2.84 Weighted Average: New York Franchise 3.40 54,073 9.28 Aggregate: Entire State of New York 1.99 62,222 6.04 Aggregate: National 3.77 57,462 7.27 New Jersey Market Demographics by County County Kearny Market Rank Number of Branches Kearny Deposits in Market ($000) Market Share (%) Projected Population Change 2017-2022 (%) Median HHI 2017 ($) Projected HHI Change 2017-2022 (%) Hudson 9 2 853,266 2.85 4.15 62,864 7.36 Bergen 15 9 818,446 1.63 3.03 88,821 5.49 Monmouth 12 12 503,448 2.12 0.51 92,229 7.60 Ocean 13 6 220,477 1.46 2.23 67,134 8.74 Middlesex 22 3 163,649 0.50 2.98 84,008 8.36 Morris 20 3 161,363 0.69 1.40 105,146 7.10 Essex 19 3 141,179 0.62 1.94 58,124 7.36 Union 26 1 55,906 0.22 2.94 72,505 8.38 Passaic 19 1 33,663 0.26 1.88 63,674 7.28 Weighted Average: New Jersey Franchise 2.71 78,839 7.04 Aggregate: Entire State of New Jersey 1.82 75,854 8.08 Aggregate: National 3.77 57,462 7.27 |
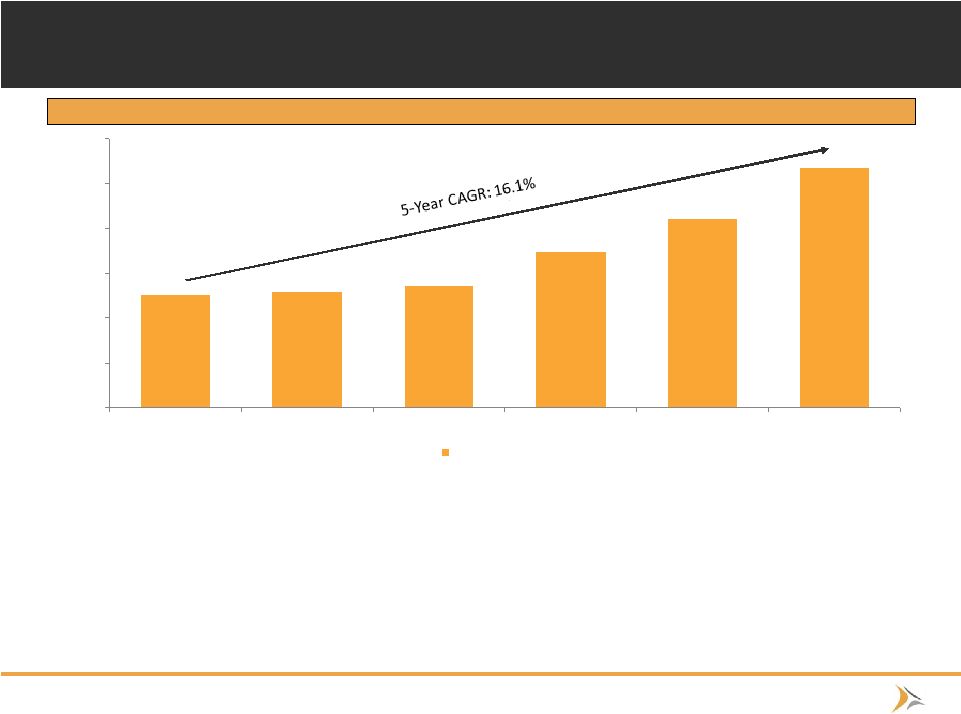 7 $1,268 $1,284 $1,361 $1,741 $2,103 $2,677 $0 $500 $1,000 $1,500 $2,000 $2,500 $3,000 2011FY 2012FY 2013FY 2014FY 2015FY 2016FY Total Loans Loan Portfolio Growth Kearny Financial Corp. Historical Loan Growth (dollars in millions) • Loan growth focus: – Expand upon expertise in commercial real estate, C&I, multifamily, SBA, and construction lending; – Continue to hire additional commercial lenders and credit administration personnel to increase market share; – Lift out small teams of residential lenders to fill in strategic gaps in current footprint (NY, NJ, PA); • Over $500 million in organic commercial loan originations in fiscal 2016; • Solid mortgage banking pipeline growth during 4 th quarter of fiscal 2016 |
 8 Loan Portfolio Composition • As of June 30, 2016 KRNY had $2.7 billion in loans receivable, comprising 59.5% of total assets • Kearny’s yield on loans was 3.92% for the 2016 fiscal year • Kearny continues to make progress towards its intended shift in loan mix • Maintain conservative underwriting and credit standards • Avg. LTV – 1-4 Family: 55% – Multifamily: 66% – CRE: 63% MRQ Loan Portfolio 0% 20% 40% 60% 80% 100% 2014FY 2015FY 2016FY 1-4 Family Multifamily CRE C&D Consumer Commercial 1-4 Family - 22.6% Multifamily - 38.9% CRE - 30.7% C&D - 0.1% Consumer - 4.3% Commercial - 3.3% New York 36% New Jersey 59% PA 4% Outside (NY, NJ & PA Markets) 1% Other 5% CRE, Multifamily & Resi. Portfolio Distribution |
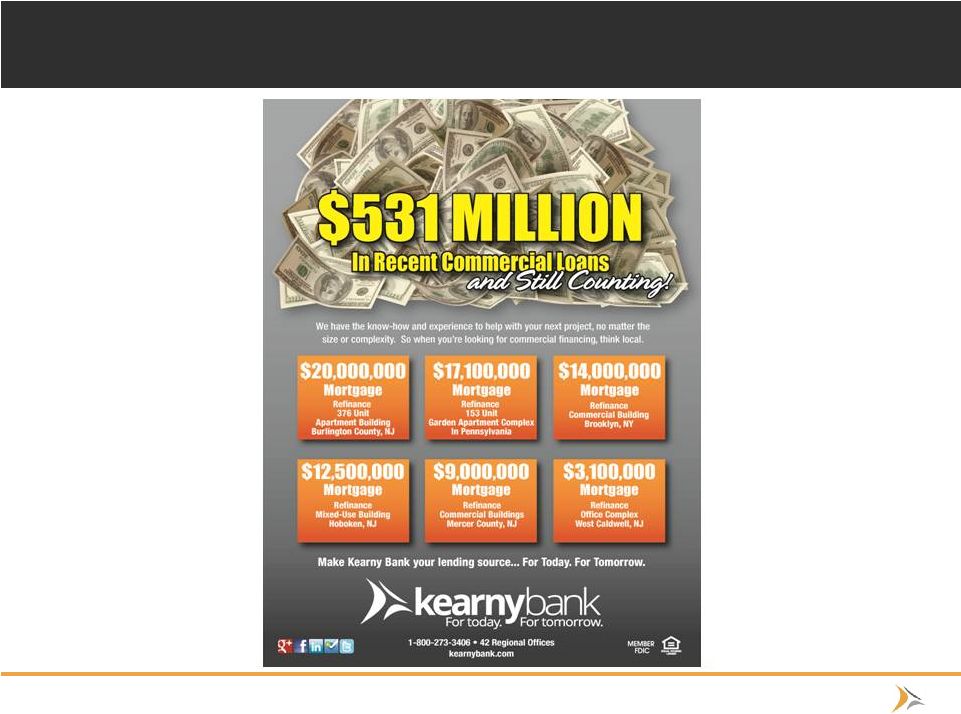 9 Commercial Lending Success Continues |
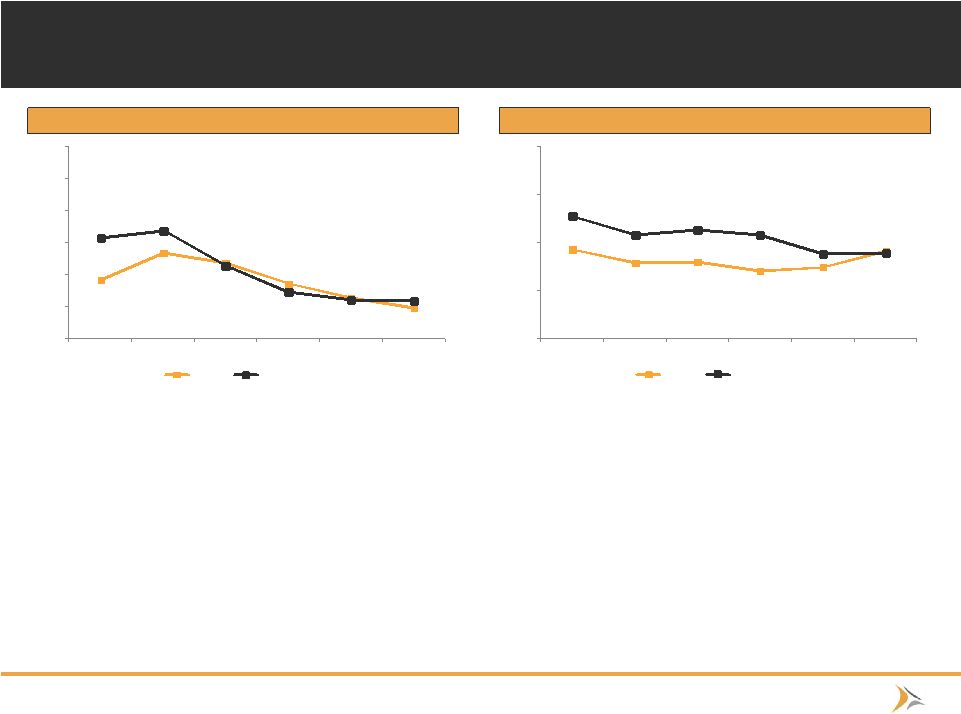 10 Credit Metrics 1) NPAs as defined by SNL to include nonaccrual loans and leases, renegotiated loans and leases, and real estate owned 2) Peer group as shown on page 19 Note: Peer comparison periods changed to conform to the same time periods as Kearny Financial Corp.’s fiscal periods (June 30 fiscal year-end) Source: SNL Financial NPAs / Assets¹ Loan Loss Reserves / Gross Loans • Kearny has been successful in reducing its percentage of nonperforming assets over the past four calendar years • Kearny’s conservative underwriting standards and prompt attention to potential problem loans supports consistently superior asset quality • Continue to refine ALLL methodology based on growth and changes to loan portfolio • ALLL coverage ratio increased by 55.3% to 0.91% in fiscal 2016 0.92% 1.34% 1.18% 0.86% 0.64% 0.49% 1.58% 1.69% 1.15% 0.74% 0.61% 0.60% 0.0% 0.5% 1.0% 1.5% 2.0% 2.5% 3.0% 2011FY 2012FY 2013FY 2014FY 2015FY 2016FY KRNY Peer Median² 0.93% 0.79% 0.80% 0.71% 0.74% 0.91% 1.28% 1.08% 1.14% 1.08% 0.88% 0.89% 0.0% 0.5% 1.0% 1.5% 2.0% 2011FY 2012FY 2013FY 2014FY 2015FY 2016FY KRNY Peer Median² |
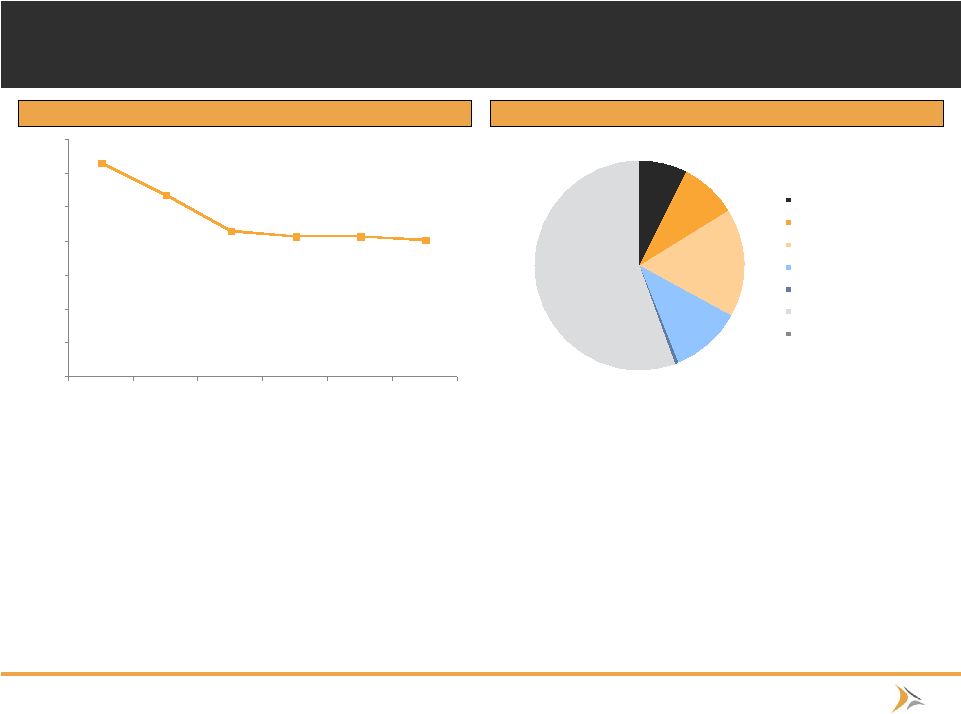 11 Securities Portfolio Source: SNL Financial, Company Filings • Kearny’s yield on securities was 2.02% for the 2016 fiscal year, a decrease of 6 basis points from 2015 • Kearny is working to reduce the portion of securities as a percent of total assets – As of June 30, 2016, 27.8% of Kearny’s total assets were comprised of securities as compared to 42.2% of total assets at June 30, 2011 MRQ Securities Portfolio Yield on Securities 3.15% 2.69% 2.16% 2.08% 2.08% 2.02% 0.00% 0.50% 1.00% 1.50% 2.00% 2.50% 3.00% 3.50% 2011FY 2012FY 2013FY 2014FY 2015FY 2016FY U.S. Agency Obligations - 7.31% Municipal Bonds - 8.84% CLO & ABS Securities - 16.79% Corporate Bonds - 10.99% TPS - 0.61% Agency MBS - 55.45% Non-Agency MBS - 0.01% |
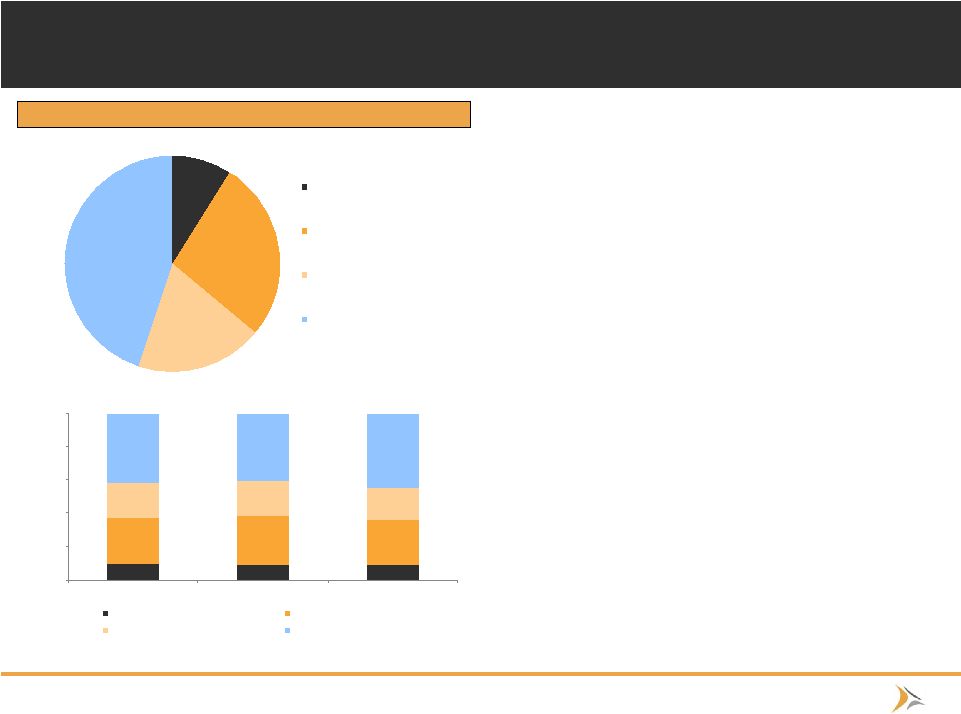 12 Deposit Composition MRQ Deposit Portfolio • Kearny Financial Corp. had $2.69 billion in deposits as of June 30, 2016 – The quarter ended June 30, 2016’s cost of total deposits was 0.72% down from 1.06% for the quarter ended June 30, 2011 • Shift deposit mix to more core deposits: interest bearing non-maturity and noninterest bearing • Increase term funding ahead of rising rates • Challenging deposit gathering environment in Northeast 0.0% 20.0% 40.0% 60.0% 80.0% 100.0% 2014FY 2015FY 2016FY Noninterest bearing deposits Interest bearing DDA Savings and clubs Certificates of deposit Noninterest bearing deposits - 8.9% Interest bearing DDA - 27.2% Savings and clubs - 19.1% Certificates of deposit - 44.8% |
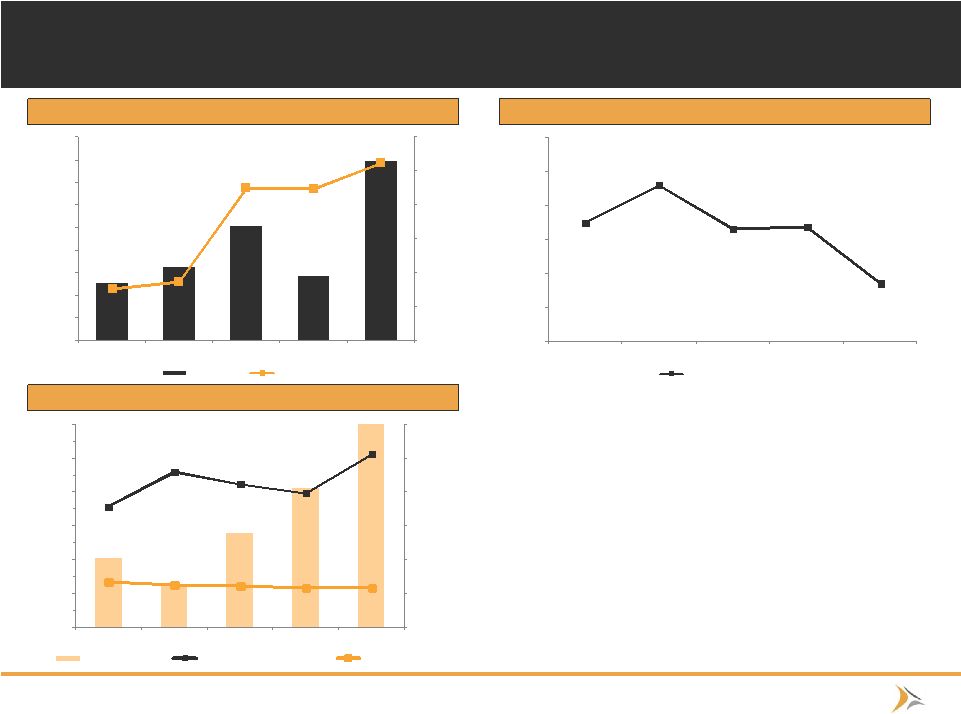 13 Improving Performance Metrics Profitability Efficiency Ratio Performance Metrics • Performance metrics are improving • Since 2010 Kearny has nearly doubled the portion of operating revenue derived from noninterest sources • Both efficiency ratio and ROAA have improved over the past three years $5,078 $6,506 $10,188 $5,629 $15,822 0.18% 0.19% 0.32% 0.32% 0.36% 0.10% 0.15% 0.20% 0.25% 0.30% 0.35% 0.40% $0 $2,000 $4,000 $6,000 $8,000 $10,000 $12,000 $14,000 $16,000 $18,000 2012FY 2013FY 2014FY 2015FY 2016FY Net Income Core ROAA 77.45% 83.02% 76.52% 76.89% 68.50% 60.00% 65.00% 70.00% 75.00% 80.00% 85.00% 90.00% 2012FY 2013FY 2014FY 2015FY 2016FY Core Efficiency Ratio $70,180 $66,257 $73,821 $80,608 7.18% 9.23% 8.46% 7.92% 10.26% 2.65% 2.50% 2.44% 2.34% 2.35% $60,000 $65,000 $70,000 $75,000 $80,000 $85,000 $90,000 0.00% 2.00% 4.00% 6.00% 8.00% 10.00% 12.00% 2012FY 2013FY 2014FY 2015FY 2016FY Net Interest Income Noninterest Inc/ Operating Rev Net Interest Margin |
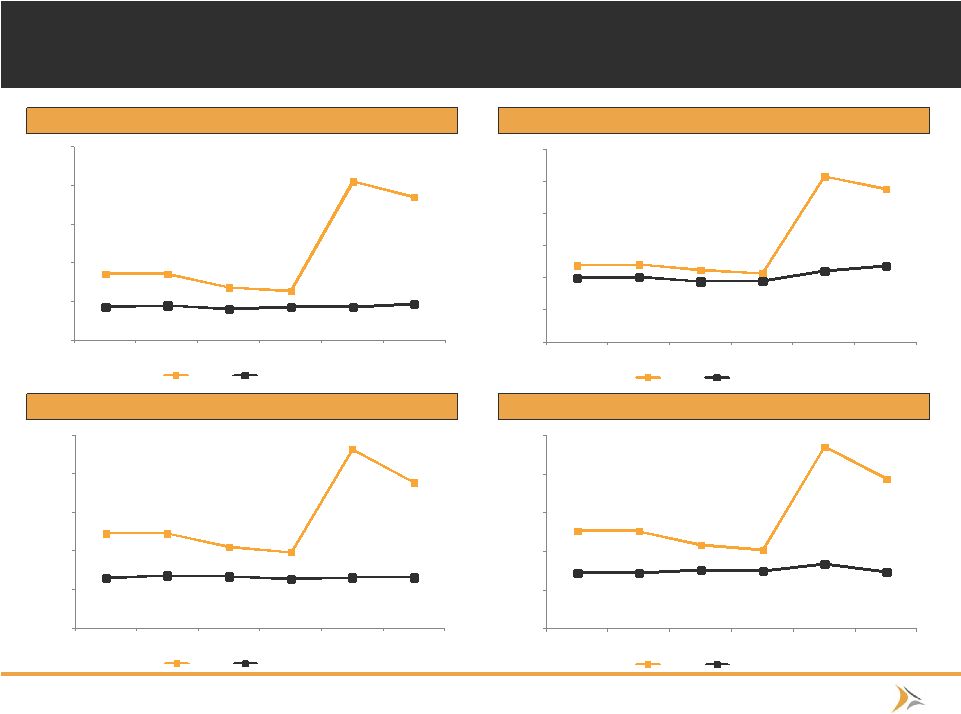 14 12.0% 12.1% 11.3% 10.8% 25.8% 23.9% 10.0% 10.2% 9.5% 9.6% 11.2% 11.8% 0.0% 5.0% 10.0% 15.0% 20.0% 25.0% 30.0% 2011FY 2012FY 2013FY 2014FY 2015FY 2016FY KRNY Peer Median¹ 25.3% 25.4% 21.8% 20.5% 47.2% 38.8% 14.5% 14.7% 15.2% 15.0% 17.0% 14.8% 0.0% 10.0% 20.0% 30.0% 40.0% 50.0% 2011FY 2012FY 2013FY 2014FY 2015FY 2016FY KRNY Peer Median¹ 24.5% 24.6% 21.1% 19.8% 46.5% 37.9% 13.0% 13.6% 13.5% 12.6% 13.3% 13.1% 0.0% 10.0% 20.0% 30.0% 40.0% 50.0% 2011FY 2012FY 2013FY 2014FY 2015FY 2016FY KRNY Peer Median¹ 13.5% 13.5% 11.8% 11.3% 25.6% 23.7% 9.3% 9.5% 9.0% 9.2% 9.2% 9.7% 5.0% 10.0% 15.0% 20.0% 25.0% 30.0% 2011FY 2012FY 2013FY 2014FY 2015FY 2016FY KRNY Peer Median¹ Maintenance of Strong Capital Ratios 1) Peer group as shown on page 19 Source: SNL Financial. Bank level financial numbers used where unavailable at the holding company Tangible Common Equity to Tangible Assets Tier 1 Leverage Ratio Tier 1 Risk Based Capital Ratio Risk-Based Capital Ratio |
 15 M&A History and Strategy Source: SNL Financial, Company Filings Seller Completed Type Assets ($000) Branches Atlas Bank June 30, 2014 Thrift 110,480 2 Central Jersey Bancorp November 30, 2010 Bank 571,295 13 West Essex Bancorp July 1, 2003 Thrift 390,333 8 Pulaski Bancorp, Inc. MHC October 18, 2002 Thrift 237,596 6 1 st Bergen Bancorp March 31, 1999 Thrift 300,755 4 • Kearny is an experienced acquirer and integrator, having successfully completed 5 bank acquisitions over the past 15 years • Kearny actively seeks out opportunities to deploy capital, including through mergers and acquisitions with other financial institutions – The greatest emphasis of future expansion opportunities will be on expanding within existing markets or areas contiguous to current markets – In addition to acquiring banks and their branches, the Company will also consider opportunities to broaden the product and services offerings of the bank – Management is sensitive to key merger metrics such as TBV dilution and earn-back periods |
 16 • Robust capital to support continued growth – The second step offering allows Kearny to pursue organic and strategic growth opportunities that will continue Kearny’s historically strong loan growth • Facilitates future mergers and acquisitions – Allows for increased flexibility to use common stock while bidding for potential strategic targets – Potential to make Kearny a more attractive participant in the mergers and acquisitions market, particularly in the NY, NJ, and PA market places – Larger public float and strong liquidity results in an active market for Kearny’s common stock. Average daily trading volume 508,616 shares • Index membership – ABA Nasdaq Indices (ABAQ, ABQI, QABA, XABQ) – Nasdaq Bank Index – Russel 2000 A Stronger Kearny Financial |
 17 • Traditional Relationship Banking Focus – Growth/ Diversification of loan mix: CRE/Multifamily/C&I/SBA/Residential/Construction/Consumer – Grow funding thru traditional deposit sources utilizing a technological focus: mobile banking/on-line account opening/RDC • Growth/Opportunities – Mortgage banking platform (Fee income) – SBA (Fee Income) – Government & Small Business Banking teams • Expand customer relationships – Extraordinary service – Competitively priced products and services – Digital marketing/On-boarding • Utilize Traditional Capital Market Strategies – Dividends – Buybacks (10% Buyback announced 5/18/2016) – M&A • Control operating expenses – Technology – Business line profitability analysis – Branch rationalization vs new branching opportunities 2016 Strategic Focus |
 18 (20%) 0% 20% 40% 60% 80% 100% 120% 1/1/12 7/1/12 1/1/13 7/1/13 1/1/14 7/1/14 1/1/15 7/1/15 1/1/16 7/1/16 KRNY KRNY Peers S&P 500 Comparative Stock Price Performance Note: Market data as of October 24, 2016 1) Peer group as shown on page 19 Source: SNL Financial Stock Price Performance since January 1, 2012 103.4% 66.2% 71.1% |
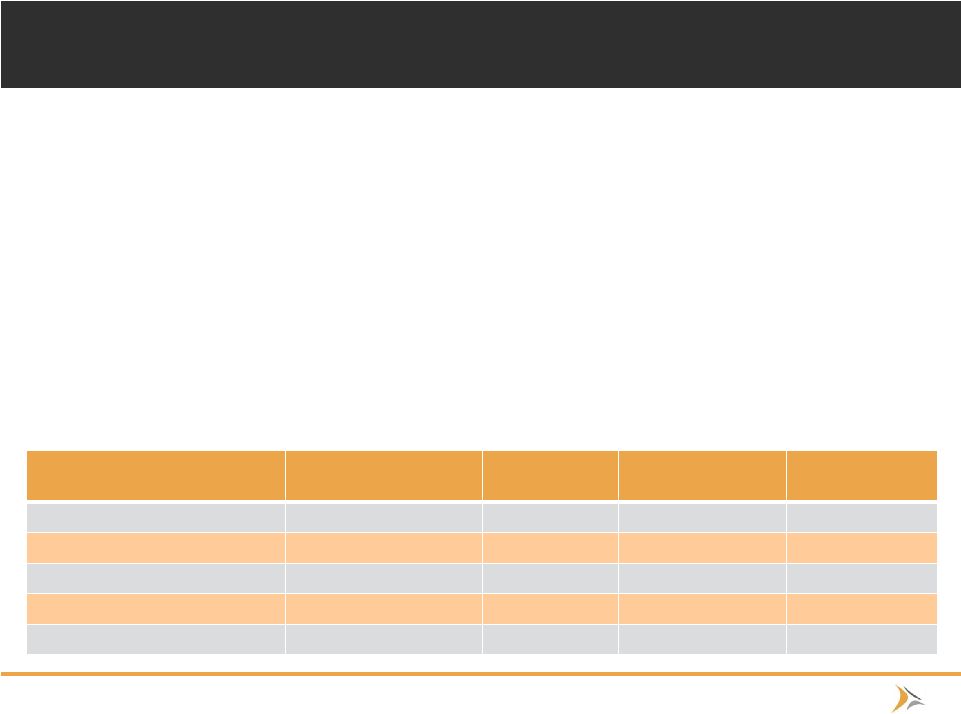
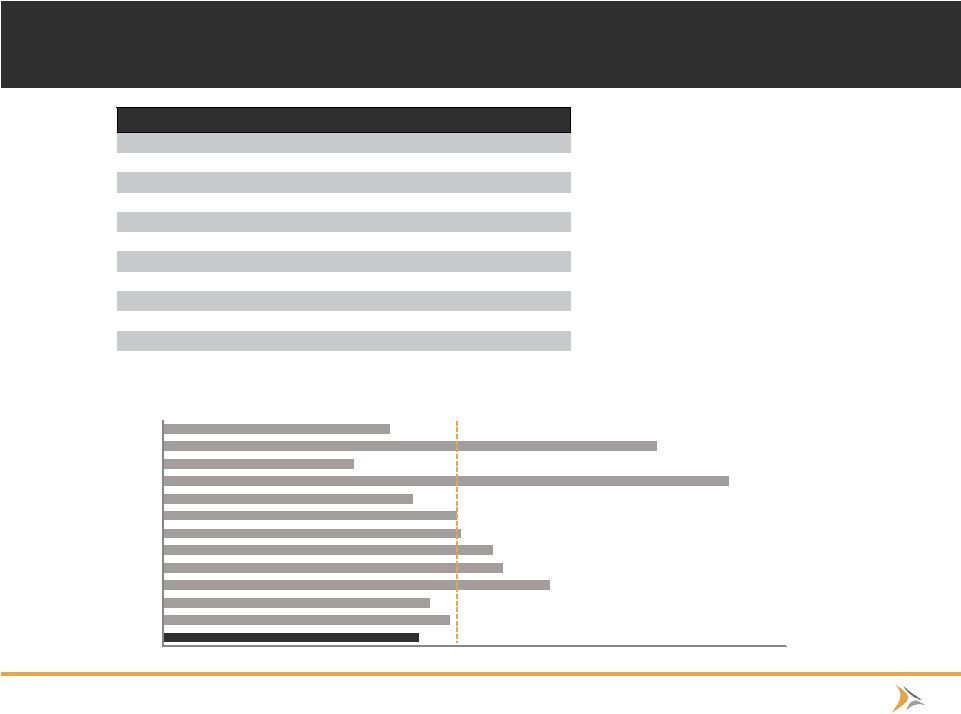 19 Peer Group Valuation Comparison Note: Market data as of October 24, 2016 Source: SNL Financial ($ in thousands) Total Price/ Peer Company Ticker Headquarters Assets TBV Flushing Financial Corporation FFIC Uniondale, NY $5,987 133% Dime Community Bancshares, Inc. DCOM Brooklyn, NY $5,556 127% ConnectOne Bancorp, Inc. CNOB Englewood Cliffs, NJ $4,263 162% OceanFirst Financial Corp. OCFC Toms River, NJ $4,047 148% Meridian Bancorp, Inc. EBSB Peabody, MA $3,929 145% Northfield Bancorp, Inc. NFBK Woodbridge, NJ $3,741 136% Oritani Financial Corp. ORIT Township of Washington, NJ $3,669 135% Peapack-Gladstone Financial Corporation PGC Bedminster, NJ $3,605 122% Bryn Mawr Bank Corporation² BMTC Bryn Mawr, PA $3,174 214% Blue Hills Bancorp, Inc. BHBK Norwood, MA $2,241 105% Sun Bancorp, Inc. SNBC Mount Laurel, NJ $2,187 193% Clifton Bancorp Inc. CSBK Clifton, NJ $1,286 115% Mean 3,640 145% Median 3,705 135% 124% 133% 127% 162% 148% 145% 136% 135% 122% 214% 105% 193% 115% 50% 70% 90% 110% 130% 150% 170% 190% 210% 230% KRNY FFIC DCOM CNOB OCFC EBSB NFBK ORIT PGC BMTC BHBK SNBC CSBK Peer Median P/TBV: 135% |