UNITED STATES
SECURITIES AND EXCHANGE COMMISSION
Washington, D.C. 20549
FORM 10‑K
(Mark One)
☒ | ANNUAL REPORT PURSUANT TO SECTION 13 OR 15(d) OF THE SECURITIES EXCHANGE ACT OF 1934 |
For the Fiscal Year Ended June 30, 2018
or
☐ | TRANSITION REPORT PURSUANT TO SECTION 13 OR 15(d) OF THE SECURITIES EXCHANGE ACT OF 1934 |
For the transition period from to
Commission File Number: 001-37399
KEARNY FINANCIAL CORP.
(Exact name of Registrant as specified in its Charter)
Maryland | | 30-0870244 |
(State or Other Jurisdiction of Incorporation or Organization) | | (I.R.S. Employer
Identification No.) |
| | |
120 Passaic Avenue, Fairfield, New Jersey | | 07004 |
(Address of Principal Executive Offices) | | (Zip Code) |
Registrant’s telephone number, including area code: (973) 244-4500
Securities registered pursuant to Section 12(b) of the Act:
Title of Each Class | | Name of Each Exchange on Which Registered |
Common Stock, $0.01 par value | | The NASDAQ Stock Market LLC |
Securities registered pursuant to Section 12(g) of the Act: None
Indicate by check mark if the registrant is a well-known seasoned issuer, as defined in Rule 405 of the Securities Act. ☒ YES ☐ NO
Indicate by check mark if the registrant is not required to file reports pursuant to Section 13 or Section 15(d) of the Act. ☐ YES ☒ NO
Indicate by check mark whether the Registrant (1) has filed all reports required to be filed by Section 13 or 15(d) of the Securities Exchange Act of 1934 during the preceding 12 months (or for such shorter period that the Registrant was required to file such reports), and (2) has been subject to such filing requirements for the past 90 days. ☒ YES ☐ NO
Indicate by check mark whether the registrant has submitted electronically and posted on its corporate Website, if any, every Interactive Data File required to be submitted and posted pursuant to Rule 405 of Regulation S-T (§229.405 of this chapter) during the preceding 12 months (or for such shorter period that the registrant was required to submit and post such files). ☒ YES ☐ NO
Indicate by check mark if disclosure of delinquent filers pursuant to Item 405 of Regulation S-K is not contained herein and will not be contained, to the best of registrant’s knowledge, in definitive proxy or information statements incorporated by reference in Part III of this Form 10-K or any amendment to this Form 10-K. ☒
Indicate by check mark whether the registrant is a large accelerated filer, an accelerated filer, a non-accelerated filer, smaller reporting company, or an emerging growth company. See the definitions of “large accelerated filer”, “accelerated filer”, “smaller reporting company” and “emerging growth company” in Rule 12b-2 of the Exchange Act.
Large accelerated filer | ☒ | | Accelerated filer | ☐ |
| | | | |
Non-accelerated filer | ☐ | (Do not check if a smaller reporting company) | Smaller reporting company | ☐ |
Emerging growth company ☐
If an emerging growth company, indicate by check mark if the registrant has elected not to use the extended transition period for complying with any new or revised financial accounting standards provided pursuant to Section 13(a) of the Exchange Act. ☐
Indicate by check mark whether the registrant is a shell company (as defined in Rule 12b-2 of the Act). ☐ YES ☒ NO
The aggregate market value of the voting and non-voting common equity held by non‑affiliates of the Registrant on December 31, 2017 (the last business day of the Registrant’s most recently completed second fiscal quarter) was $1.02 billion. Solely for purposes of this calculation, shares held by directors, executive officers and greater than 10% stockholders are treated as shares held by affiliates.
As of August 20, 2018 there were outstanding 98,243,200 shares of the Registrant’s Common Stock.
DOCUMENTS INCORPORATED BY REFERENCE
1. | Portions of the definitive Proxy Statement for the Registrant’s 2018 Annual Meeting of Stockholders. (Part III) |
KEARNY FINANCIAL CORP.
ANNUAL REPORT ON FORM 10-K
For the Fiscal Year Ended June 30, 2018
INDEX
i
PART I
Item 1. Business
Forward-Looking Statements
This Annual Report contains forward-looking statements, which can be identified by the use of words such as “estimate,” “project,” “believe,” “intend,” “anticipate,” “plan,” “seek,” “expect” and words of similar meaning. These forward-looking statements include, but are not limited to:
| • | statements of our goals, intentions and expectations; |
| • | statements regarding our business plans, prospects, growth and operating strategies; |
| • | statements regarding the quality of our loan and investment portfolios; and |
| • | estimates of our risks and future costs and benefits. |
These forward-looking statements are based on current beliefs and expectations of our management and are inherently subject to significant business, economic and competitive uncertainties and contingencies, many of which are beyond our control. In addition, these forward-looking statements are subject to assumptions with respect to future business strategies and decisions that are subject to change. We are under no duty to and do not take any obligation to update any forward-looking statements after the date of the Annual Report on Form 10-K.
The following factors, among others, could cause actual results to differ materially from the anticipated results or other expectations expressed in the forward-looking statements:
| • | general economic conditions, either nationally or in our market areas, that are worse than expected; |
| • | changes in the level and direction of loan delinquencies and write-offs and changes in estimates of the adequacy of the allowance for loan losses; |
| • | our ability to access cost-effective funding; |
| • | fluctuations in real estate values and both residential and commercial real estate market conditions; |
| • | demand for loans and deposits in our market area; |
| • | our ability to implement changes in our business strategies; |
| • | competition among depository and other financial institutions; |
| • | inflation and changes in the interest rate environment that reduce our margins and yields, or reduce the fair value of financial instruments or reduce the origination levels in our lending business, or increase the level of defaults, losses and prepayments on loans we have made and make whether held in portfolio or sold in the secondary markets; |
| • | adverse changes in the securities markets; |
| • | changes in laws or government regulations or policies affecting financial institutions, including changes in regulatory fees and capital requirements; |
| • | changes in monetary or fiscal policies of the U.S. Government, including policies of the U.S. Treasury and the Federal Reserve Board; |
| • | our ability to manage market risk, credit risk and operational risk in the current economic conditions; |
| • | our ability to enter new markets successfully and capitalize on growth opportunities; |
| • | our ability to successfully integrate any assets, liabilities, customers, systems and management personnel we have acquired or may acquire into our operations and our ability to realize related revenue synergies and cost savings within expected time frames and any goodwill charges related thereto; |
| • | changes in consumer demand, borrowing and savings habits; |
| • | changes in accounting policies and practices, as may be adopted by bank regulatory agencies, the Financial Accounting Standards Board, the Securities and Exchange Commission or the Public Company Accounting Oversight Board; |
| • | our ability to retain key employees; |
2
| • | significant increases in our loan losses; |
| • | cyber attacks, computer viruses and other technological risks that may breach the security of our websites or other systems to obtain unauthorized access to confidential information and destroy data or disable our systems; |
| • | technological changes that may be more difficult or expensive than expected; |
| • | the ability of third-party providers to perform their obligations to us; |
| • | the ability of the U.S. Government to manage federal debt limits; |
| • | changes in the financial condition, results of operations or future prospects of issuers of securities that we own; and |
| • | other economic, competitive, governmental, regulatory and operational factors affecting our operations, pricing products and services described elsewhere in this Annual Report on Form 10-K. |
Because of these and other uncertainties, our actual future results may be materially different from the results indicated by these forward-looking statements.
General
Kearny Financial Corp. (the “Company,” or “Kearny Financial”), is a Maryland corporation that is the holding company for Kearny Bank (the “Bank” or “Kearny Bank”), a nonmember New Jersey stock savings bank. The Bank converted its charter to that of a New Jersey savings bank on June 29, 2017 having previously been chartered as a federally chartered stock savings bank.
On May 18, 2015, the Company completed its second-step conversion and stock offering through which it converted from the mutual holding company structure to a fully publicly held company. In conjunction with that transaction, the Company sold 71,750,000 shares of its common stock at $10.00 per share, resulting in gross proceeds of $717.5 million. The new shares issued included 3,612,500 shares sold to the Bank’s Employee Stock Ownership Plan (“ESOP”) with an aggregate value of $36.1 million based on the sales price of $10.00 per share. Concurrent with the closing of the transaction, the Company also issued an additional 500,000 shares of its common stock with an aggregate value of $5.0 million and contributed these shares with an additional $5.0 million in cash to the KearnyBank Foundation.
The Company recognized direct stock offering costs of $10.7 million in conjunction with the transaction which reduced the net proceeds credited to capital. After adjusting for transaction costs and the value of the shares issued to the Bank’s ESOP, the Company recognized a net increase in equity capital of $670.7 million, of which $353.4 million was contributed to the Bank by the Company as an additional investment in the Bank’s common equity. Approximately $34.5 million of new capital proceeds were funded through withdrawals of existing customer deposits previously held by the Bank.
Each outstanding share held by the public stockholders of Kearny Financial Corp., a federal corporation, immediately prior to the closing of the conversion and stock offering was converted into 1.3804 shares of the Company’s new common stock while the shares previously held by Kearny MHC, the former mutual holding company, were cancelled concurrent with the closing of the transaction. As a result of the completion of the second-step conversion and stock offering, all historical share and per share information has been revised to reflect the 1.3804-to-one exchange ratio. At June 30, 2018, the Company had 99,626,400 shares outstanding.
The Company is a unitary savings and loan holding company, regulated by the Board of Governors of the Federal Reserve Bank (“FRB”) and conducts no significant business or operations of its own. The Bank’s deposits are federally insured by the Deposit Insurance Fund as administered by the Federal Deposit Insurance Corporation (“FDIC”) and the Bank is primarily regulated by the New Jersey Department of Banking and Insurance (“NJDBI”) and, as a nonmember bank, the FDIC. References in this Annual Report on Form 10‑K to the Company or Kearny Financial generally refer to the Company and the Bank, unless the context indicates otherwise. References to “we”, “us”, or “our” refer to the Bank or Company, or both, as the context indicates.
The Company’s primary business is the ownership and operation of the Bank. The Bank is principally engaged in the business of attracting deposits from the general public in New Jersey and New York and using these deposits, together with other funds, to originate or purchase loans for its portfolio and invest in securities. Our loan portfolio is primarily comprised of loans collateralized by commercial and residential real estate augmented by secured and unsecured loans to businesses and consumers. We also maintain a portfolio of investment securities, primarily comprised of U.S. agency mortgage-backed securities, U.S. government and agency debentures, bank-qualified municipal obligations, corporate bonds, asset-backed securities, collateralized loan obligations and subordinated debt.
3
At June 30, 2018, net loans receivable comprised 67.9% of our total assets while investment securities, including mortgage‑backed and non-mortgage-backed securities, comprised 20.0% of our total assets. By comparison, at June 30, 2017, net loans receivable comprised 66.7% of our total assets while securities comprised 23.0% of our total assets. A significant long-term goal of our business plan continues to be the reallocation of our balance sheet to reflect a greater percentage of interest-earning assets in loans while reducing the relative size of the securities portfolio.
We operate from our administrative headquarters in Fairfield, New Jersey and had 54 branch offices as of June 30, 2018. The Company maintains a website at www.kearnybank.com. We make available through that website, free of charge, copies of our Annual Reports on Form 10-K, Quarterly Reports on Form 10-Q, Current Reports on Form 8-K, amendments to those reports and proxy materials as soon as is reasonably practical after the Company electronically files those materials with, or furnishes them to, the Securities and Exchange Commission. You may access these materials by following the links under “Investor Relations” under the “Company Info” tab at the Company’s website. Information on the Company’s website is not and should not be considered a part of this Annual Report on Form 10-K.
Acquisition of Clifton
On April 2, 2018, the Company completed its acquisition of Clifton Bancorp Inc. (“Clifton”), the parent company of Clifton Savings Bank, a federally chartered stock savings bank. In conjunction with the acquisition, the Company acquired assets with aggregate fair values totaling $1.61 billion including loans and securities with fair values of $1.12 billion and $326.9 million, respectively. The Company assumed liabilities with aggregate fair values totaling $1.38 billion in conjunction with the Clifton acquisition including deposits and borrowings with fair values of $949.8 million and $414.1 million, respectively.
Merger consideration associated with the acquisition totaled $333.9 million and primarily comprised 25.4 million shares of the Company’s common stock valued at $330.7 million that were issued to Clifton stockholders to reflect an exchange of 1.191 of Company shares for each outstanding share of Clifton common stock at the time of closing. Merger consideration also included $3.2 million in cash distributed to eligible holders of outstanding options to purchase Clifton stock as well as cash distributed to Clifton stockholders for the settlement of fractional shares. The amount by which merger consideration exceeds the fair value of net assets acquired resulted in the Company’s recognition of $102.3 million in goodwill associated with the Clifton acquisition.
Business Strategy
Our goal is to continue to evolve from a traditional thrift business model toward that of a full service community bank, profitably deploying capital and enhancing earnings through a variety of balance sheet growth and diversification strategies. The key strategic initiatives of our business plan are presented below accompanied by an overview of our activities and achievements in support of those initiatives:
| • | Continue to Increase Commercial Mortgage Lending |
During fiscal 2018, our commercial mortgage loan portfolio, including multi-family and nonresidential mortgage loans, increased by 22.6%, or $563.9 million, to $3.06 billion at June 30, 2018 from $2.50 billion at June 30, 2017. This increase reflected commercial mortgage loan originations in fiscal 2018 totaling $458.8 million. Additionally, we acquired commercial mortgage loans with fair values totaling approximately $397.0 million pursuant to our acquisition of Clifton. At June 30, 2018, our commercial mortgage loan portfolio comprised 67.0% of total loans compared to 77.0% of total loans at June 30, 2017.
We plan to continue to increase our portfolio of commercial mortgage loans by continuing to acquire loans through all available channels, including retail and broker originations, which may be supplemented with individual and pooled loan purchases and participations. Additionally, we intend to continue to expand our commercial lending infrastructure and resources, which will be supported by new product and pricing strategies designed to increase origination volume in a very competitive marketplace.
| • | Increase Commercial Business Lending |
We plan to continue to focus our efforts on expanding our commercial non-real estate secured and unsecured business lending activities through all available channels. During fiscal 2018, our commercial business loan origination and purchase volume totaled $54.2 million, reflecting retail originations of $25.9 million augmented by the acquisition of commercial and industrial (“C&I”) loans through wholesale channels totaling $28.3 million. Additionally, we acquired commercial business loans with fair values totaling approximately $5.4 million pursuant to our acquisition of Clifton.
We continued the realignment and expansion of our commercial business lending infrastructure during fiscal 2018 which contributed to a modest increase in aggregate commercial business loan origination and purchase volume for the year. As a result of those enhancements, we anticipate that the outstanding balance of this loan segment will continue to increase in fiscal 2019 and thereafter. Our business lending strategies will continue to be undertaken within a larger set of strategic
4
initiatives designed to promote other business banking services intended to increase commercial deposit balances and services and the associated increase in the level of non-interest income recognized in conjunction with those business customer relationships.
| • | Modestly Increase Residential Mortgage Portfolio Lending |
We plan to increase the outstanding balance of our residential mortgage loans, including one- to four-family first mortgage loans and home equity loans and home equity lines of credit, while generally maintaining the allocation of such loans as a percentage of the total loan portfolio. Notwithstanding, a significant portion of one- to four-family first mortgage loans originated will continue to be sold into the secondary market, as discussed below. During fiscal 2018, our aggregate portfolio of one- to four-family mortgage loans increased by $738.1 million to $1.39 billion, or 30.4% of total loans, from $650.1 million or 20.1% of total loans at June 30, 2017. During the year ended June 30, 2018, we originated and purchased $53.0 million and $26.3 million, respectively, of one- to four-family first mortgage loans held in portfolio. Additionally, we acquired residential mortgage loans totaling approximately $713.9 million pursuant to our acquisition of Clifton.
| • | Continue Residential Mortgage Banking |
We plan to expand and enhance our residential mortgage lending infrastructure to support the continuing origination of residential mortgage loans for sale into the secondary market. Our mortgage banking business strategy resulted in the recognition of $742,000 in gains on the sale of $78.8 million of mortgage loans held for sale during the year ended June 30, 2018, compared to recorded gains of $713,000 on the sale of $84.4 million of mortgage loans during the year ended June 30, 2017. We anticipate that residential mortgage loan origination and sale activity will continue to support long-term growth in our non-interest income through the recognition of recurring loan sale gains, while also serving to help manage the Company’s exposure to interest rate risk through the sale of longer-duration, fixed-rate loans into the secondary market.
| • | Reduce Securities as a Percentage of Assets while Maintaining Portfolio Diversity |
In recent years, we have diversified the composition and allocation of our investment portfolio into new asset sectors, including asset-backed securities, corporate bonds, municipal obligations, collateralized loan obligations, commercial mortgage-backed securities (“MBS”) and subordinated debt while reducing our concentration in traditional residential MBS. Several of the added sectors include floating rate securities that reduce the level of interest rate risk (“IRR”) embedded in our securities portfolio.
Our securities portfolio increased by $207.7 million, or 18.8%, to $1.31 billion, or 20.0% of total assets, at June 30, 2018 from $1.11 billion, or 23.0% of total assets, at June 30, 2017. The increase in the outstanding balance of securities portfolio for the year ended June 30, 2018, largely reflected the impact of securities with fair values of $326.9 million acquired from Clifton. The Company sold a significant portion of the securities originally acquired from Clifton with a portion of the sale proceeds reinvested into shorter-duration, higher-yielding securities and the remainder reinvested into loans.
The decrease in the portfolio as a percentage of total assets is indicative of the Company’s intent to continue to reduce the portion of earning assets held in the securities portfolio in favor of additional growth in loans. As such, we expect to continue utilizing cash flows from the securities portfolio to fund a portion of our expected loan growth while maintaining the diversity of sectors represented in the portfolio.
| • | Maintain Strong Asset Quality |
We continue to emphasize and maintain strong asset quality as we grow and diversify our loan portfolio. Nonperforming assets decreased by $2.9 million to $17.6 million, or 0.27% of total assets, at June 30, 2018 compared to $20.5 million, or 0.43% of total assets, at June 30, 2017 and $21.9 million, or 0.49% of total assets, at June 30, 2016.
| • | Expand Funding Through Retail Deposits |
Our total deposit balances increased by $1.14 billion during fiscal 2018 with aggregate deposits totaling $4.07 billion at June 30, 2018 compared to $2.93 billion at June 30, 2017. The increase in deposits for the year ended June 30, 2018 largely reflected the impact of deposits with fair values of $949.8 million assumed in conjunction with the Clifton acquisition while also reflecting the continuing effects of product, pricing and marketing strategies implemented during fiscal 2018. The deposits assumed from Clifton are housed across a retail banking network of 12 branches located in New Jersey’s Passaic, Bergen, Hudson and Essex counties.
The increase in overall deposits during fiscal 2018 reflected a $418.2 million increase in non-maturity deposits coupled with a net increase of $725.7 million in certificates of deposit. The net increase in non-maturity deposits included a $44.5 million, or 16.7%, increase in non-interest-bearing deposit accounts for fiscal 2018.
5
At June 30, 2018, we had a total of 54 branches comprising 52 branches located in northern and central New Jersey with two additional branches located in Brooklyn and Staten Island, New York. We plan to selectively evaluate branch network expansion opportunities, with a particular focus on limited branch expansion in Brooklyn and Staten Island. We will also continue to evaluate additional de novo branch opportunities to contiguously expand our existing New Jersey branch network with an emphasis on “fill-ins” between our northern and central New Jersey locations.
In light of the Clifton acquisition, we expect to continue placing strategic emphasis on leveraging the opportunities to increase market share and expand the depth and breadth of customer relationships within our expanded branch network while also considering select branch consolidation opportunities to optimize that network. We continue to develop and deploy strategies to promote the “relationship banking” business model throughout our branch network with an emphasis on expanding business customer relationships linked to business lending initiatives.
| • | Seek Out Merger and Acquisition Opportunities |
As a complement to the “organic” growth strategies, we continue to actively seek out opportunities to prudently deploy capital, diversify our balance sheet, enter new markets and enhance earnings through mergers and acquisitions with other financial institutions. With the completion of the Clifton acquisition during fiscal 2018, we have now acquired a total of six banks in the last 18 years. We expect to place the greatest emphasis on opportunities to expand within the existing markets we serve or to enter new markets that are generally contiguous to such markets.
In addition to potential acquisitions of financial institutions or their branches, we may explore additional opportunities for acquisitions or strategic partnerships to broaden our product and service offerings in the future.
| • | Improve Operating Efficiency |
In conjunction with our efforts to improve operating efficiency and control operating expenses, while expanding and enhancing product and service offerings, we continued to deploy a number of technologies during fiscal 2018 that support our internal IT infrastructure as well as our external customer-facing systems. We consider the noted enhancements to be one of several continuing strategies to control growth in non-interest expenses and improve our overall operating efficiency.
The Company’s operating efficiency is also expected to be enhanced as a result of the Clifton acquisition through which the Company’s primary sources of revenue, including net interest income and non-interest income, are expected to increase proportionately greater than the increase in non-interest expenses arising from the acquisition.
For the year ended June 30, 2018, the Company’s ratio of non-interest expense to average assets totaled 1.86% compared to 1.76% for the year ended June 30, 2017. For those same comparative periods, the Company’s operating efficiency ratio increased to 72.7% from 71.2%, respectively. The increase in the non-interest expense ratio and efficiency ratio in fiscal 2018 primarily reflected merger-related expenses of $6.7 million that were recognized in conjunction with the Clifton acquisition. The Company estimates that merger-related expenses increased its ratio of non-interest expense to average assets by 0.13% for the year ended June 30, 2018 while adding 5.00% to its efficiency ratio for the same period.
Market Area. At June 30, 2018, our primary market area consisted of the counties in which we currently operate branches, including Bergen, Essex, Hudson, Middlesex, Monmouth, Morris, Ocean, Passaic and Union counties in New Jersey and Kings (Brooklyn) and Richmond (Staten Island) counties in New York. Our lending is concentrated in these markets and our predominant sources of deposits are the communities in which our offices are located as well as the neighboring communities.
Our primary market area is largely urban and suburban with a broad economic base as is typical within the New York metropolitan area. Service jobs represent the largest employment sector followed by wholesale/retail trade. A downturn in the local economy could reduce the amount of funds available for deposit and the ability of borrowers to repay their loans which would adversely affect our profitability.
Competition. We operate in a market area with a high concentration of banking and financial institutions and we face substantial competition in attracting deposits and in originating loans. A number of our competitors are significantly larger institutions with greater financial and managerial resources and lending limits. Our ability to compete successfully is a significant factor affecting our growth potential and profitability.
6
Our competition for deposits and loans historically has come from other insured financial institutions such as local and regional commercial banks, savings institutions and credit unions located in our primary market area. We also compete with mortgage banking and finance companies for real estate loans and with commercial banks and savings institutions for consumer loans. We also face competition for attracting funds from providers of alternative investment products such as equity and fixed income investments, including securities such as corporate, agency and government securities, as well as the mutual funds that invest in these instruments.
There are large retail banking competitors operating throughout our primary market area, including Bank of America, Citibank, JP Morgan Chase Bank, PNC Bank, TD Bank, and Wells Fargo Bank and we also face strong competition from other community-based financial institutions.
Lending Activities
General. In conjunction with our strategic efforts to evolve from a traditional thrift to a full-service community bank, our lending strategies have placed increasing emphasis on the origination of commercial loans compared to one- to four-family mortgage portfolio lending. The year-to-year trends in the composition and allocation of our loan portfolio, as reported in the table below, generally highlight those changes in business strategy while also highlighting the growth in residential mortgage loans resulting from the Clifton acquisition in fiscal 2018. In particular, the outstanding balance of our commercial mortgages, including loans secured by multi‑family, mixed‑use and nonresidential properties, have increased significantly over the past several years. By comparison, the outstanding balance of our residential mortgage loans, including one- to four-family and home equity loans, remained fairly stable throughout the four years ended June 30, 2017 while increasing during the latest fiscal year ended June 30, 2018 due primarily to the Clifton acquisition.
Our commercial loan offerings also include secured business loans, many of which are secured by real estate, and unsecured business loans. Commercial loan offerings include programs offered through the SBA in which Kearny Bank participates as a Preferred Lender. Our consumer loan offerings primarily include home equity loans and home equity lines of credit as well as account loans, overdraft lines of credit, vehicle loans and personal loans. We also offer construction loans to builders/developers as well as individual homeowners. We have also purchased out-of-state one- to four-family first mortgage loans to supplement our in-house originations. For more information, please see “Lending Activities (Loan Originations, Purchases, Sales, Solicitation and Processing).”
7
Loan Portfolio Composition. The following table sets forth the composition of our loan portfolio in dollar amounts and as a percentage of the total portfolio at the dates indicated.
| At June 30, |
| 2018 | | 2017 | | 2016 | | 2015 | | 2014 |
| Amount | | | Percent | | Amount | | | Percent | | Amount | | | Percent | | Amount | | | Percent | | Amount | | | Percent |
| (Dollars In Thousands) | | |
Real estate mortgage: | | | | | | | | | | | | | | | | | | | | | | | | | | | | | | | | | | | | | | | | | | | | |
One- to four-family | $ | 1,297,453 | | | | 28.40 | | % | | $ | 567,323 | | | | 17.50 | | % | | $ | 605,203 | | | | 22.66 | | % | | $ | 592,321 | | | | 28.17 | | % | | $ | 580,612 | | | | 33.31 | | % |
Multi-family | | 1,758,584 | | | | 38.50 | | | | | 1,412,575 | | | | 43.57 | | | | | 1,040,293 | | | | 38.94 | | | | | 728,379 | | | | 34.65 | | | | | 431,007 | | | | 24.73 | | |
Nonresidential | | 1,302,961 | | | | 28.52 | | | | | 1,085,064 | | | | 33.46 | | | | | 820,673 | | | | 30.72 | | | | | 580,724 | | | | 27.62 | | | | | 552,748 | | | | 31.71 | | |
Commercial business | | 85,825 | | | | 1.88 | | | | | 74,471 | | | | 2.30 | | | | | 88,207 | | | | 3.30 | | | | | 99,451 | | | | 4.73 | | | | | 67,261 | | | | 3.86 | | |
Consumer: | | | | | | | | | | | | | | | | | | | | | | | | | | | | | | | | | | | | | | | | | | | | |
Home equity loans | | 90,761 | | | | 1.99 | | | | | 82,822 | | | | 2.55 | | | | | 89,566 | | | | 3.35 | | | | | 91,671 | | | | 4.36 | | | | | 99,621 | | | | 5.72 | | |
Passbook or certificate | | 3,283 | | | | 0.07 | | | | | 2,863 | | | | 0.09 | | | | | 3,349 | | | | 0.13 | | | | | 3,999 | | | | 0.19 | | | | | 3,965 | | | | 0.23 | | |
Other | | 5,777 | | | | 0.13 | | | | | 13,520 | | | | 0.41 | | | | | 22,052 | | | | 0.82 | | | | | 292 | | | | 0.01 | | | | | 373 | | | | 0.02 | | |
Construction | | 23,271 | | | | 0.51 | | | | | 3,815 | | | | 0.12 | | | | | 2,038 | | | | 0.08 | | | | | 5,711 | | | | 0.27 | | | | | 7,281 | | | | 0.42 | | |
Total loans | | 4,567,915 | | | | 100.00 | | % | | | 3,242,453 | | | | 100.00 | | % | | | 2,671,381 | | | | 100.00 | | % | | | 2,102,548 | | | | 100.00 | | % | | | 1,742,868 | | | | 100.00 | | % |
Less: | | | | | | | | | | | | | | | | | | | | | | | | | | | | | | | | | | | | | | | | | | | | |
Allowance for loan losses | | 30,865 | | | | | | | | | 29,286 | | | | | | | | | 24,229 | | | | | | | | | 15,606 | | | | | | | | | 12,387 | | | | | | |
Unamortized yield adjustments including net premiums on purchased loans and net deferred loan costs and fees | | 66,567 | | | | | | | | | (2,808 | ) | | | | | | | | (2,606 | ) | | | | | | | | (316 | ) | | | | | | | | 1,397 | | | | | | |
Total adjustments | | 97,432 | | | | | | | | | 26,478 | | | | | | | | | 21,623 | | | | | | | | | 15,290 | | | | | | | | | 13,784 | | | | | | |
| | | | | | | | | | | | | | | | | | | | | | | | | | | | | | | | | | | | | | | | | | | | |
Total loans, net | $ | 4,470,483 | | | | | | | | $ | 3,215,975 | | | | | | | | $ | 2,649,758 | | | | | | | | $ | 2,087,258 | | | | | | | | $ | 1,729,084 | | | | | | |
Loan Maturity Schedule. The following table sets forth the maturities of our loan portfolio at June 30, 2018. Demand loans, loans having no stated maturity and overdrafts are shown as due in one year or less. Loans are stated in the following table at contractual maturity and actual maturities could differ due to prepayments.
| Real estate mortgage: One- to four-family | | | Real estate mortgage: Multi-Family | | | Real estate mortgage: Non-Residential | | | Commercial Business | | | Home Equity Loans | | | Passbook or certificate | | | Other | | | Construction | | | Total | |
| (In Thousands) | |
Amounts due: | | | | | | | | | | | | | | | | | | | | | | | | | | | | | | | | | | | |
Within one year | $ | 684 | | | $ | 16,675 | | | $ | 11,054 | | | $ | 17,798 | | | $ | 844 | | | $ | 1,394 | | | $ | 1,390 | | | $ | 18,372 | | | $ | 68,211 | |
After one year: | | | | | | | | | | | | | | | | | | | | | | | | | | | | | | | | | | | |
1 to 3 years | | 5,720 | | | | 128,943 | | | | 72,606 | | | | 17,850 | | | | 2,835 | | | | 467 | | | | 4,229 | | | | 4,899 | | | | 237,549 | |
3 to 5 years | | 19,690 | | | | 155,506 | | | | 188,034 | | | | 22,135 | | | | 6,919 | | | | 124 | | | | 2 | | | | - | | | | 392,410 | |
5 to 10 years | | 151,447 | | | | 1,164,831 | | | | 697,587 | | | | 17,441 | | | | 24,657 | | | | - | | | | - | | | | - | | | | 2,055,963 | |
10 to 15 years | | 142,740 | | | | 105,252 | | | | 149,077 | | | | 4,965 | | | | 30,909 | | | | 19 | | | | - | | | | - | | | | 432,962 | |
Over 15 years | | 977,172 | | | | 187,377 | | | | 184,603 | | | | 5,636 | | | | 24,597 | | | | 1,279 | | | | 156 | | | | - | | | | 1,380,820 | |
Total due after one year | | 1,296,769 | | | | 1,741,909 | | | | 1,291,907 | | | | 68,027 | | | | 89,917 | | | | 1,889 | | | | 4,387 | | | | 4,899 | | | | 4,499,704 | |
| | | | | | | | | | | | | | | | | | | | | | | | | | | | | | | | | | | |
Total amount due | $ | 1,297,453 | | | $ | 1,758,584 | | | $ | 1,302,961 | | | $ | 85,825 | | | $ | 90,761 | | | $ | 3,283 | | | $ | 5,777 | | | $ | 23,271 | | | $ | 4,567,915 | |
8
The following table shows the dollar amount of loans as of June 30, 2018 due after June 30, 2019 according to rate type and loan category.
| Fixed Rates | | | Floating or Adjustable Rates | | | Total | |
| (In Thousands) | |
Real estate mortgage: | | | | | | | | | | | |
One- to four-family | $ | 933,883 | | | $ | 362,886 | | | $ | 1,296,769 | |
Multi-family | | 414,287 | | | | 1,327,622 | | | | 1,741,909 | |
Nonresidential | | 508,162 | | | | 783,745 | | | | 1,291,907 | |
Commercial business | | 31,923 | | | | 36,104 | | | | 68,027 | |
Consumer: | | | | | | | | | | | |
Home equity loans | | 70,112 | | | | 19,805 | | | | 89,917 | |
Passbook or certificate | | 164 | | | | 1,725 | | | | 1,889 | |
Other | | 4,328 | | | | 59 | | | | 4,387 | |
Construction | | 182 | | | | 4,717 | | | | 4,899 | |
| | | | | | | | | | | |
Total loans | $ | 1,963,041 | | | $ | 2,536,663 | | | $ | 4,499,704 | |
Multi-Family and Nonresidential Real Estate Mortgage Loans. We originate commercial mortgage loans on multi-family and nonresidential properties, including loans on apartment buildings, retail/service properties and land as well as other income-producing properties, such as mixed-use properties combining residential and commercial space. Our continued strategic emphasis in commercial lending resulted in the origination of approximately $458.8 million of multi-family and nonresidential real estate mortgages during the year ended June 30, 2018. We originated $727.4 million of multi-family and nonresidential real estate mortgages during the year ended June 30, 2017. Additionally, we acquired multi-family and nonresidential real estate mortgage loans with fair values totaling approximately $397.0 million in conjunction with our acquisition of Clifton.
Our commercial mortgage acquisition strategies also included purchases of whole loans and participations totaling $126.7 million during the year ended June 30, 2017. However, there were no such purchases during fiscal 2018. The loan purchases in fiscal 2017 were funded during the first quarter ended September 30, 2016 and reflected the deployment of excess liquidity that had accumulated through June 30, 2016 due to an increase in loan prepayments during the fourth quarter of fiscal 2016.
In total, commercial mortgage loan acquisition volume, including the loans acquired in conjunction with the Clifton acquisition, outpaced loan repayments during fiscal 2018, resulting in the reported net increase in the outstanding balance of this segment of the loan portfolio. Our business plan continues to call for maintaining our strategic emphasis on commercial mortgage lending by increasing this segment of the portfolio on a dollar basis while maintaining its basis as a percentage of total loans.
We generally require no less than a 25% down payment or equity position for mortgage loans on multi-family and nonresidential properties. For such loans, we generally require personal guarantees. However, the Bank may consider multi-family and nonresidential real estate mortgages for approval on a non-personally guaranteed (non-recourse) basis when the overall strengths of a proposed loan asset sufficiently mitigates the risk of exculpating the principal owners from their personal guarantee. In such cases, the Bank generally requires borrowers to execute an indemnification agreement which personally obligates those individuals in the circumstances of fraud, negligence, environmental issues, improper conveyance, condemnation, bankruptcy or other additional provisions deemed appropriate by the Bank.
We generally offer fixed-rate and adjustable-rate balloon mortgage loans on multi-family and non-residential properties with final stated maturities ranging from five to twelve years and initial interest rate reset terms ranging from five to seven years, where applicable. Our balloon mortgage loans within this category generally have payments based on amortization terms from 25 to 30 years. We also offer fully amortizing fixed-rate and adjustable-rate mortgage loans on multi-family and non-residential properties with terms up to 25 years. Our commercial mortgage loans are primarily secured by properties located in New Jersey and New York and, to a lesser extent, properties located in eastern Pennsylvania.
Commercial Business Loans. We originate commercial term loans and lines of credit to a variety of professionals, sole proprietorships and small businesses in our market area. Our business loan products include our Small Business Express Loan, which offers customers a simplified and expedited application and approval process for term loans and lines of credit up to $100,000, as well as loans originated through the SBA in which Kearny Bank participates as a Preferred Lender. We originated approximately $25.9 million of commercial business loans during the year ended June 30, 2018 compared to $34.1 million during the year ended June 30, 2017. Additionally, we acquired commercial business loans with fair values totaling approximately $5.4 million in our acquisition of Clifton.
9
Our commercial business loan acquisition strategies included purchases of wholesale C&I loan participations totaling $28.3 million and $17.0 million during the years ended June 30, 2018 and 2017, respectively. Our C&I loan participations at June 30, 2018 included 24 loans with an outstanding balance of $35.3 million. These participations were comprised entirely of our pro rata interest in the obligations of 16 separate commercial borrowers that were acquired through Kearny Bank’s membership in BancAlliance, a cooperative network of lending institutions that serves as a conduit for institutional investors to participate in middle-market commercial credits. The BancAlliance network is supported and managed on a day-to-day basis by Alliance Partners and its wholly-owned subsidiary AP Commercial LLC which acts as investment advisor and asset manager for loans acquired through the BancAlliance network while retaining a portion of such loans as an investor. At June 30, 2017, our C&I loan participations had an outstanding balance of $27.4 million representing our pro rata interest in 13 loans.
In total, the aggregate volume of commercial business loans originated, purchased and acquired outpaced loan repayments during fiscal 2018 resulting in the reported net increase in the outstanding balance of this segment of the loan portfolio. As noted earlier, we continued to realign and expand our commercial business lending infrastructure during fiscal 2018. As a result of those enhancements, we anticipate this loan segment will increase as we continue to emphasize loans acquired through retail origination channels while diminishing the emphasis on loans and participations purchased through wholesale channels. Through these efforts, we hope to increase this segment of the loan portfolio on both a dollar basis and as a percentage of total loans.
At June 30, 2018, approximately $50.5 million or 58.9% of our commercial business loans represent loans originated through our retail channel while the remaining $35.3 million or 41.1% comprise loans acquired through the wholesale C&I loan participation channels discussed earlier. Of the retail originated loans, approximately $43.2 million or 85.5% are “non-SBA” loans consisting of secured and unsecured loans totaling $39.6 million and $3.6 million, respectively. We generally require personal guarantees on all “non-SBA” commercial business loans originated. The loan to value limit on secured commercial lines of credit and term loans is otherwise generally limited to 70%. Unsecured commercial loans may take the form of overdraft checking authorization up to $10,000 and unsecured lines of credit up to $100,000. Our “non-SBA” commercial term loans generally have terms of up to 10 years and are mostly adjustable-rate loans. Our commercial lines of credit have terms of up to one year and are generally adjustable-rate loans.
The remaining $7.3 million or 14.5% of commercial business loans originated represent the retained portion of SBA loan originations, of which approximately $688,000 is guaranteed by the SBA. Such loans are generally secured by various forms of collateral, including real estate, business equipment and other forms of collateral. Kearny Bank generally sells the guaranteed portion of eligible SBA loans originated, which ranges from 50% to 90% of the loan’s outstanding balance while retaining the nonguaranteed portion of such loans in portfolio. Kearny Bank also retains both the guaranteed and non-guaranteed portion of those SBA originations that are generally ineligible for sale in the secondary market. The Company sold $2.8 million of SBA loan participations which resulted in the recognition of related sale gains totaling approximately $262,000 for the year ended June 30, 2018. By comparison, we sold $9.6 million of SBA loan participations during fiscal 2017 which resulted in the recognition of related sale gains totaling approximately $822,000.
Construction Lending. Our construction lending includes loans to individuals for construction of one- to four-family residences or for major renovations or improvements to an existing dwelling. Our construction lending also includes loans to builders and developers for multi-unit buildings or multi-house projects. At June 30, 2018, construction loans totaled $23.3 million.
During the year ended June 30, 2018, construction loan disbursements were $25.2 million compared to $3.0 million during the year ended June 30, 2017. Construction loan disbursements outpaced repayments during fiscal 2018 resulting in the reported increase in the outstanding balance of this segment of the loan portfolio.
Construction borrowers must hold title to the land free and clear of any liens. Financing for construction loans is limited to 80% of the anticipated appraised value of the completed property. Disbursements are made in accordance with inspection reports by our approved appraisal firms. Terms of financing are generally limited to one year with an interest rate tied to the prime rate published in the Wall Street Journal and may include a premium of one or more points. In some cases, we convert a construction loan to a permanent mortgage loan upon completion of construction.
We have no formal limits as to the number of projects a builder has under construction or development and make a case-by-case determination on loans to builders and developers who have multiple projects under development. The Board of Directors reviews Kearny Bank’s business relationship with a builder or developer prior to accepting a loan application for processing. We generally do not make construction loans to builders on a speculative basis. There must be a contract for sale in place. Financing is provided for up to two houses at a time in a multi-house project, requiring a contract on one of the two houses before financing for the next house may be obtained.
10
We continue to evaluate lending opportunities and strategies through which we may expect to expand our construction lending activity, funding commitments and outstanding balances in the future. If undertaken, we expect that the growth in our construction lending program will be supported by a corresponding expansion of our internal lending infrastructure and resources to support a growing number of relationships and projects with builders/borrowers.
One- to Four-Family First Mortgage Loans Held in Portfolio. Our portfolio lending activities include the origination of one- to four-family first mortgage loans, of which approximately $1.25 billion or 96.2% are secured by properties located within New Jersey and New York as of June 30, 2018 with the remaining $49.3 million or 3.8% secured by properties in other states.
During the year ended June 30, 2018, Kearny Bank originated $53.0 million of one- to four-family first mortgage portfolio loans compared to $67.9 million in the year ended June 30, 2017. To supplement portfolio loan originations, we also purchased one- to four-family first mortgages totaling $26.3 million during the year ended June 30, 2018, while no such loans were purchased during fiscal 2017.
One- to four-family first mortgage loan repayments generally outpaced the origination volume of such loans during fiscal 2018. However, we acquired one- to four-family first mortgage loans with fair values totaling approximately $703.1 million in conjunction with the Clifton acquisition which resulted in the net increase in the outstanding balance of this segment of the loan portfolio during fiscal 2018. Our business plan generally calls for increasing the aggregate balance of residential mortgage loans, including one- to four-family first mortgage loans as well as home equity loans and home equity lines of credit discussed below, on a dollar basis while maintaining the aggregate balance of such loans as a percentage of the total loan portfolio.
We will originate a one- to four-family mortgage loan on an owner-occupied property with a principal amount of up to 95% of the lesser of the appraised value or the purchase price of the property, with private mortgage insurance required if the loan-to-value ratio exceeds 80%. At June 30, 2018, our one- to four-family mortgage loan portfolio was primarily comprised of loans secured by owner-occupied properties. Our loan-to-value limit on a non-owner-occupied property is 75%. Loans in excess of $2.0 million are handled on a case-by-case basis and are subject to lower loan-to-value limits, generally no more than 50%.
We offer a first-time homebuyer program for persons who have not previously owned real estate and are purchasing a one- to four-family property in our primary lending area for use as a primary residence. This program is also available outside these areas, but only to persons who are existing deposit or loan customers of Kearny Bank and/or members of their immediate families. The financial incentives offered under this program are a one-eighth of one percentage point rate reduction on all first mortgage loan types and the refund of the application fee at closing.
The fixed-rate residential mortgage loans that we originate for portfolio generally meet the secondary mortgage market standards of the Federal Home Loan Mortgage Corporation (“Freddie Mac”).
Substantially all of our residential mortgages include “due on sale” clauses, which give us the right to declare a loan immediately payable if the borrower sells or otherwise transfers an interest in the property to a third party. Property appraisals on real estate securing our one- to four-family first mortgage loans are made by state certified or licensed independent appraisers approved by Kearny Bank’s Board of Directors. Appraisals are performed in accordance with applicable regulations and policies. We require title insurance policies on all first mortgage real estate loans originated. Homeowners, liability and fire insurance and, if applicable, flood insurance, are also required.
One- to Four-Family Mortgage Loans Held for Sale. During fiscal 2018, we further expanded and enhanced our mortgage banking infrastructure to support the continued origination of one- to four-family mortgage loans for sale into the secondary market. As above, the loans we originate for sale generally meet the same secondary mortgage market standards as those applicable to loans originated for portfolio. Moreover, such loans are generally originated by, and sourced from, the same resources and markets as those loans originated and held in portfolio, as discussed above.
As noted earlier, our mortgage banking business strategy resulted in the recognition of $742,000 in gains associated with the sale of $78.8 million of mortgage loans held for sale during the year ended June 30, 2018. As of that date, an additional $863,000 of loans were held and committed for sale into the secondary market. As noted earlier, we anticipate that residential mortgage loan origination and sale activity will continue to support long-term growth in our non-interest income through the recognition of recurring loan sale gains, while also serving to help manage the Company’s exposure to interest rate risk through the sale of longer-duration, fixed-rate loans into the secondary market. However, the volume of such originations and sales is likely to reflect variations in the levels of consumer demand for refinancing which generally moves inversely with movements in longer-term market interest rates.
11
Home Equity Loans and Lines of Credit. Our home equity loans are fixed-rate loans for terms of generally up to 20 years. We also offer fixed-rate and adjustable-rate home equity lines of credit with terms of up to 20 years. During the year ended June 30, 2018, Kearny Bank originated $20.2 million of home equity loans and home equity lines of credit compared to $18.5 million in the year ended June 30, 2017. Repayments of home equity loans and lines of credit generally outpaced loan origination volume during fiscal 2018. However, the Company acquired home equity loans and lines of credit with fair values of $10.8 million in conjunction with Clifton acquisition which resulted in a net increase in the outstanding balance of this segment of the loan portfolio.
Collateral value is determined through a property value analysis report, or full appraisal where appropriate, provided by a state certified or licensed independent appraiser. Home equity loans and lines of credit do not require title insurance but do require homeowner, liability and fire insurance and, if applicable, flood insurance.
Home equity loans and fixed-rate home equity lines of credit are generally originated in our market area and are generally made in amounts of up to 80% of value on term loans and of up to 75% of value on home equity adjustable-rate lines of credit. We originate home equity loans secured by either a first lien or a second lien on the property.
As noted earlier, our business plan generally calls for increasing the aggregate balance of residential mortgage loans, including home equity loans and home equity lines of credit as well as one- to four-family first mortgage loans discussed above, on a dollar basis while maintaining the aggregate balance of such loans as a percentage of the total loan portfolio
Consumer Loans. Our consumer loan portfolio includes unsecured overdraft lines of credit and personal loans as well as loans secured by savings accounts and certificates of deposit on deposit with Kearny Bank. Our unsecured consumer loans at June 30, 2018 primarily include $5.5 million of loans acquired through the Company’s relationship with Lending Club, an established peer-to-peer (i.e. marketplace) lender. Through this relationship, the Company had previously purchased high-quality, unsecured consumer loans originated through Lending Club’s online platform. The Company limited its original investment in Lending Club loans to approximately $25.0 million in aggregate outstanding balances and has since discontinued purchases of such loans in favor of investing in other loan alternatives.
The remaining balance of consumer loans at June 30, 2018 includes $3.4 million of loans fully secured by savings accounts or certificates of deposit held by the Bank and $109,000 of other unsecured consumer loans. Additionally, we acquired consumer loans with fair values totaling approximately $476,000 in our acquisition of Clifton. We will generally lend up to 90% of the account balance on a loan secured by a savings account or certificate of deposit.
Our consumer loans generally entail greater risks compared to the other categories of loans that we originate or purchase and hold in portfolio. Consumer loan repayment is dependent on the borrower’s continuing financial stability and is more likely to be adversely affected by job loss, divorce, illness or personal bankruptcy. The application of various federal laws, including federal and state bankruptcy and insolvency laws, may limit the amount that can be recovered on consumer loans in the event of a default.
Our underwriting standards for internally originated consumer loans include a determination of the applicant’s credit history and an assessment of the applicant’s ability to meet existing obligations and payments on the proposed loan. The stability of the applicant’s monthly income may be determined by verification of gross monthly income from primary employment and any additional verifiable secondary income.
Loans to One Borrower. New Jersey law generally limits the amount that a savings bank may lend to a single borrower and related entities to 15% of the institution’s capital funds. Accordingly, as of June 30, 2018, our loans-to-one-borrower limit was approximately $148.1 million.
Notwithstanding regulatory limitations regarding loans to one borrower, the Bank has established a more conservative set of internal thresholds that further limit our lending exposure to any single borrower or set of borrowers affiliated by common ownership. In that regard, the Bank’s internal “house limits” are $35.0 million for a single loan transaction and $85.0 million to a common ownership or an affiliated group of borrowers/guarantors. These limits apply irrespective of whether the obligations are on a personally guaranteed/recourse basis or non-personally guaranteed/non-recourse basis. Exceptions to these internal limits may be considered on a case-by-case basis, subject to the review and approval of each exception by the Bank’s Board of Directors.
12
At June 30, 2018, our largest single borrower had an aggregate outstanding loan balance of approximately $58.2 million comprising one commercial mortgage loan and four multi-family mortgage loans. Our second largest single borrower had an aggregate outstanding loan balance of approximately $56.9 million comprising six multi-family mortgage loans. Our third largest borrower had an aggregate outstanding loan balance of approximately $44.2 million comprising four multi-family mortgage loans. At June 30, 2018, all of these lending relationships were current and performing in accordance with the terms of their loan agreements. By comparison, at June 30, 2017, loans outstanding to Kearny Bank’s three largest borrowers totaled approximately $48.2 million, $46.3 million and $44.6 million, respectively.
Loan Originations, Purchases, Sales, Solicitation and Processing. The following table shows portfolio loans originated, purchased, acquired and repaid during the periods indicated.
| For the Years Ended June 30, | |
| | 2018 | | | | 2017 | | | | 2016 | |
| (In Thousands) | |
Loan originations: (1) | | | | | | | | | | | |
Real estate mortgage: | | | | | | | | | | | |
One- to four-family | $ | 52,974 | | | $ | 67,907 | | | $ | 87,197 | |
Multi-family | | 358,521 | | | | 578,682 | | | | 379,416 | |
Nonresidential | | 100,249 | | | | 148,767 | | | | 109,876 | |
Commercial business | | 25,896 | | | | 34,071 | | | | 20,789 | |
Consumer: | | | | | | | | | | | |
Home equity loans | | 20,234 | | | | 18,489 | | | | 22,709 | |
Passbook or certificate | | 781 | | | | 739 | | | | 918 | |
Other | | 587 | | | | 1,077 | | | | 604 | |
Construction | | 25,213 | | | | 2,961 | | | | 1,065 | |
Total loan originations | | 584,455 | | | | 852,693 | | | | 622,574 | |
Loan purchases: | | | | | | | | | | | |
Real estate mortgage: | | | | | | | | | | | |
One- to four-family | | 26,298 | | | | - | | | | 36,250 | |
Multi-family | | - | | | | 20,800 | | | | 32,897 | |
Nonresidential | | - | | | | 105,880 | | | | 242,000 | |
Commercial business | | 28,292 | | | | 16,953 | | | | 19,808 | |
Other | | - | | | | - | | | | 25,466 | |
Total loan purchases | | 54,590 | | | | 143,633 | | | | 356,421 | |
Loans acquired from Clifton (2) | | 1,116,821 | | | | - | | | | - | |
Loan sales: (1) | | | | | | | | | | | |
Real estate mortgage: | | | | | | | | | | | |
Multi-family | | - | | | | - | | | | (10,000 | ) |
Commercial business | | (2,802 | ) | | | (9,589 | ) | | | (3,872 | ) |
Total loans sold | | (2,802 | ) | | | (9,589 | ) | | | (13,872 | ) |
| | | | | | | | | | | |
Loan repayments | | (497,306 | ) | | | (412,234 | ) | | | (393,225 | ) |
Decrease due to other items | | (1,250 | ) | | | (8,286 | ) | | | (9,398 | ) |
| | | | | | | | | | | |
Net increase in loan portfolio | $ | 1,254,508 | | | $ | 566,217 | | | $ | 562,500 | |
(1) | Excludes origination and sales of one- to four-family mortgage loans held for sale. |
(2) | For information on loans acquired in the Clifton acquisition, see Note 3 to the audited consolidated financial statements. |
Our customary sources of loan applications include loans originated by our commercial and residential loan officers, repeat customers, referrals from realtors and other professionals and “walk-in” customers. These sources are supported in varying degrees by our newspaper and electronic advertising and marketing strategies.
We have also entered into purchase agreements with a number of bank and non-bank originators to supplement our loan production pipeline. These agreements call for our purchase of one- to four-family first mortgage loans on either a servicing released or servicing retained basis from the seller. During the year ended June 30, 2018, we purchased one- to four-family first mortgages totaling $26.3 million, while no such loans were purchased during fiscal 2017.
As of June 30, 2018, our portfolio of “out-of-state” residential mortgages included loans located in nine states outside of New Jersey and New York that totaled approximately $49.3 million or 3.8% of one- to four-family mortgage loans. The states with the three largest concentrations of such loans at June 30, 2018 were Massachusetts, Pennsylvania and Georgia, with outstanding principal
13
balances totaling $40.7 million, $4.8 million and $976,000, respectively. The aggregate outstanding balances of loans in each of the remaining six states total approximately $2.9 million and comprise approximately 5.9% of the total balance of out-of-state residential mortgage loans with aggregate balances by state ranging from $242,000 to $631,000.
In addition to purchasing one- to four-family loans, we have also purchased commercial mortgage loans and participations originated by other banks and non-bank originators. Although no such loans were purchased during the year ended June 30, 2018, the aggregate carrying value of the loans and participations purchased from these sources during the year ended June 30, 2017 totaled approximately $126.7 million comprising loans secured primarily by multi-family and non-residential properties located in New York and eastern Pennsylvania. We also purchased commercial business loans totaling $28.3 million during the year ended June 30, 2018, as discussed above.
Loan Approval Procedures and Authority. Senior management recommends and the Board of Directors approves our lending policies and loan approval limits. Kearny Bank’s Loan Committee consists of the Chief Executive Officer, Chief Operating Officer, Chief Lending Officer, Chief Credit Officer, Regional President, Director of Commercial Real Estate Lending, Director of Residential Lending and Special Assets Manager. Our Chief Lending Officer may approve residential loans up to $750,000. Loan department personnel of Kearny Bank serving in the following positions may approve loans as follows: residential mortgage loan managers, mortgage loans up to $500,000; residential mortgage loan underwriters, mortgage loans up to $250,000; consumer loan managers, consumer loans up to $250,000; and consumer loan underwriters, consumer loans up to $150,000. In addition to these principal amount limits, there are established limits for different levels of approval authority as to minimum credit scores and maximum loan-to-value ratios and debt-to-income ratios or debt service coverage. Our Chief Executive Officer and Chief Operating Officer have authorization to countersign loans for amounts that exceed $750,000 up to a limit of $1.0 million. Our Chief Lending Officer must approve loans between $750,000 and $1.0 million along with one of these designated officers. Non-conforming residential mortgage loans and loans over $1.0 million up to $2.0 million require the approval of the Loan Committee. The Committee may approve individual commercial loans or an aggregate commercial lending relationship up to $5.0 million. Commercial loans or aggregate relationships in excess of $5.0 million require approval by the Board of Directors while such approval is also required for residential mortgage loans in excess of $2.0 million and commercial business loans in excess of $1.0 million.
Asset Quality
Collection Procedures on Delinquent Loans. We regularly monitor the payment status of all loans within our portfolio and promptly initiate collection efforts on past due loans in accordance with applicable policies and procedures. Delinquent borrowers are notified by both mail and telephone when a loan is 30 days past due. If the delinquency continues, subsequent efforts are made to contact the delinquent borrower and additional collection notices and letters are sent. All reasonable attempts are made to collect from borrowers prior to referral to an attorney for collection. However, when a loan is 90 days delinquent, it is our general practice to refer it to an attorney for repossession, foreclosure or other form of collection action, as appropriate. In certain instances, we may modify the loan or grant a limited moratorium on loan payments to enable the borrower to reorganize his or her financial affairs and we attempt to work with the borrower to establish a repayment schedule to cure the delinquency.
As to mortgage loans, if a foreclosure action is taken and the loan is not reinstated, paid in full or refinanced, the property is sold at judicial sale at which we may be the buyer if there are no adequate offers to satisfy the debt. Any property acquired as the result of foreclosure or by deed in lieu of foreclosure is classified as real estate owned until it is sold or otherwise disposed of. When real estate owned is acquired, it is recorded at its fair market value less estimated selling costs. The initial write-down of the property, if necessary, is charged to the allowance for loan losses. Adjustments to the carrying value of the properties that result from subsequent declines in value are charged to operations in the period in which the declines are identified.
Past Due Loans. A loan’s “past due” status is generally determined based upon its “P&I delinquency” status in conjunction with its “past maturity” status, where applicable. A loan’s “P&I delinquency” status is based upon the number of calendar days between the date of the earliest P&I payment due and the “as of” measurement date. A loan’s “past maturity” status, where applicable, is based upon the number of calendar days between a loan’s contractual maturity date and the “as of” measurement date. Based upon the larger of these criteria, loans are categorized into the following “past due” tiers for financial statement reporting and disclosure purposes: Current (including 1-29 days past due), 30-59 days, 60-89 days and 90 or more days.
Nonaccrual Loans. Loans are generally placed on nonaccrual status when contractual payments become 90 days or more past due, and are otherwise placed on nonaccrual when we do not expect to receive all P&I payments owed substantially in accordance with the terms of the loan agreement. Loans that become 90 days past maturity, but remain non-delinquent with regard to ongoing P&I payments, may remain on accrual status if: (1) we expect to receive all P&I payments owed substantially in accordance with the terms of the loan agreement, past maturity status notwithstanding, and (2) the borrower is working actively and cooperatively with us to remedy the past maturity status through an expected refinance, payoff or modification of the loan agreement that is not expected to result in a troubled debt restructuring (“TDR”) classification. All TDRs are placed on nonaccrual status for a period of no less than six months after restructuring, irrespective of past due status. The sum of nonaccrual loans plus accruing loans that are 90 days or more past due are generally defined as “nonperforming loans.”
14
Payments received in cash on nonaccrual loans, including both the principal and interest portions of those payments, are generally applied to reduce the carrying value of the loan for financial statement purposes. When a loan is returned to accrual status, any accumulated interest payments previously applied to the carrying value of the loan during its nonaccrual period are recognized as interest income as an adjustment to the loan’s yield over its remaining term.
Loans that are not considered to be TDRs are generally returned to accrual status when payments due are brought current and we expect to receive all remaining P&I payments owed substantially in accordance with the terms of the loan agreement. Non-TDR loans may also be returned to accrual status when a loan’s payment status falls below 90 days past due and we: (1) expect receipt of the remaining past due amounts within a reasonable timeframe, and (2) expect to receive all remaining P&I payments owed substantially in accordance with the terms of the loan agreement.
Nonperforming Assets. The following table provides information regarding our nonperforming assets which are comprised of nonaccrual loans, accruing loans 90 days or more past due and real estate owned.
| At June 30, | |
| 2018 | | | 2017 | | | 2016 | | | 2015 | | | 2014 | |
| (Dollars In Thousands) | |
Nonaccrual loans: | | | | | | | | | | | | | | | | | | | |
Real estate mortgage: | | | | | | | | | | | | | | | | | | | |
One- to four-family | $ | 9,192 | | | $ | 8,790 | | | $ | 10,732 | | | $ | 7,952 | | | $ | 9,944 | |
Multi-family | | 116 | | | | 158 | | | | 205 | | | | - | | | | - | |
Nonresidential | | 5,340 | | | | 5,720 | | | | 6,588 | | | | 7,177 | | | | 6,935 | |
Commercial business | | 1,238 | | | | 2,634 | | | | 1,965 | | | | 3,944 | | | | 4,919 | |
Consumer: | | | | | | | | | | | | | | | | | | | |
Home equity loans | | 913 | | | | 1,241 | | | | 1,170 | | | | 1,783 | | | | 1,930 | |
Other | | - | | | | - | | | | - | | | | 2 | | | | 2 | |
Construction | | - | | | | 255 | | | | 357 | | | | 2,037 | | | | 1,448 | |
Total nonaccrual loans (1) | | 16,799 | | | | 18,798 | | | | 21,017 | | | | 22,895 | | | | 25,178 | |
Accruing loans 90 days or more past due: | | | | | | | | | | | | | | | | | | | |
Real estate mortgage: | | | | | | | | | | | | | | | | | | | |
Multi-family | | - | | | | - | | | | - | | | | - | | | | - | |
Nonresidential | | - | | | | - | | | | - | | | | - | | | | - | |
Commercial business | | - | | | | - | | | | - | | | | - | | | | - | |
Consumer: | | | | | | | | | | | | | | | | | | | |
Other | | 60 | | | | 74 | | | | 38 | | | | - | | | | 125 | |
Total accruing loans 90 days or more past due | | 60 | | | | 74 | | | | 38 | | | | - | | | | 125 | |
| | | | | | | | | | | | | | | | | | | |
Total nonperforming loans | $ | 16,859 | | | $ | 18,872 | | | $ | 21,055 | | | $ | 22,895 | | | $ | 25,303 | |
Real estate owned | $ | 725 | | | $ | 1,632 | | | $ | 826 | | | $ | 942 | | | $ | 1,624 | |
Total nonperforming assets | $ | 17,584 | | | $ | 20,504 | | | $ | 21,881 | | | $ | 23,837 | | | $ | 26,927 | |
Total nonperforming loans to total loans | | 0.37 | % | | | 0.58 | % | | | 0.79 | % | | | 1.09 | % | | | 1.45 | % |
Total nonperforming loans to total assets | | 0.26 | % | | | 0.39 | % | | | 0.47 | % | | | 0.54 | % | | | 0.72 | % |
Total nonperforming assets to total assets | | 0.27 | % | | | 0.43 | % | | | 0.49 | % | | | 0.56 | % | | | 0.77 | % |
(1) | TDRs on accrual status not included above totaled $3.5 million, $2.5 million, $2.9 million, $3.1 million and $3.3 million at June 30, 2018, 2017, 2016, 2015 and 2014, respectively. |
Total nonperforming assets decreased by $2.9 million to $17.6 million at June 30, 2018 from $20.5 million at June 30, 2017. The decrease comprised a net decline in nonperforming loans of $2.0 million coupled with a net decrease in real estate owned of $907,000. For those same comparative periods, the number of nonperforming loans increased to 80 loans from 78 loans while the number of real estate owned properties was four at June 30, 2018 and June 30, 2017, respectively.
The unpaid principal balance of loans acquired from Clifton included $5.4 million of nonperforming loans whose fair values at acquisition reflected negligible levels of impairment. The increase in nonperforming loans attributable to the Clifton acquisition was more than offset by the net decrease in the balance of other nonperforming loans during the year ended June 30, 2018.
At June 30, 2018, nonperforming loans comprised $16.8 million of “nonaccrual” loans and $60,000 of loans being reported as “accruing loans over 90 days past due.” By comparison, at June 30, 2017, nonperforming loans comprised $18.8 million of “nonaccrual” loans and $74,000 of loans being reported as “accruing loans over 90 days past due.”
15
Nonperforming one- to four-family mortgage loans at June 30, 2018 include 39 nonaccrual loans totaling $9.2 million whose net outstanding balances range from $15,000 to $781,000, with an average balance of approximately $236,000 as of that date. The loans are in various stages of collection, workout or foreclosure. Of these loans, 36 are secured by New Jersey properties while one loan is secured by a property located in New York, one loan is secured by a property located in Georgia and one loan is secured by a property in Connecticut. We have identified approximately $79,000 of specific impairment relating to three of the nonperforming loans for which valuation allowances are maintained in the allowance for loan losses at June 30, 2018.
The number and balance of nonperforming one- to four-family mortgage loans at June 30, 2018 includes eight loans totaling $2.6 million that were originally acquired from Countrywide with such loans comprising 15.5% of total nonperforming loans as of June 30, 2018. As of that same date, Kearny Bank owned a total of 40 residential mortgage loans with an aggregate outstanding balance of $9.7 million that were originally acquired from Countrywide.
Nonperforming commercial real estate loans, including multi-family and nonresidential mortgage loans, include 15 nonaccrual loans totaling $5.5 million. At June 30, 2018, the outstanding balances of these loans range from $31,000 to $1.6 million with an average balance of approximately $364,000 as of that date. The loans are in various stages of collection, workout or foreclosure and are secured by New Jersey properties. There was no specific impairment identified relating to these nonperforming loans at June 30, 2018.
Nonperforming commercial business loans at June 30, 2018 include 10 nonaccrual loans totaling $1.2 million. At June 30, 2018, the outstanding balances of these loans range from $14,000 to $246,000 with an average balance of approximately $124,000 as of that date. The loans are in various stages of collection, workout or foreclosure and are primarily secured by New Jersey and New York properties and, to a lesser extent, other forms of collateral. We have identified approximately $227,000 of specific impairment relating to two of these nonperforming loans for which valuation allowances are maintained in the allowance for loan losses at June 30, 2018.
Home equity loans and home equity lines of credit that are reported as nonperforming at June 30, 2018 include 15 nonaccrual loans totaling $913,000. At June 30, 2018, the outstanding balances of these loans range from $1,600 to $414,000 with an average balance of approximately $61,000 as of that date. The loans are in various stages of collection, workout or foreclosure and are primarily secured by New Jersey properties. There was no specific impairment identified relating to these nonperforming loans at June 30, 2018.
Other consumer loans that are reported as nonperforming at June 30, 2018 included five unsecured loans totaling $60,000 reported as “accruing loans over 90 days past due.”
There were no nonperforming construction loans in nonaccrual status at June 30, 2018.
During the years ended June 30, 2018, 2017 and 2016, gross interest income of $484,000, $883,000 and $1.9 million, respectively, would have been recognized on loans accounted for on a nonaccrual basis if those loans had been current.
At June 30, 2018, 2017, and 2016, Kearny Bank had loans with aggregate outstanding balances totaling $10.2 million, $11.0 million and $11.6 million, respectively, reported as troubled debt restructurings.
Loan Review System. We maintain a loan review system consisting of several related functions including, but not limited to, classification of assets, calculation of the allowance for loan losses, independent credit file review as well as internal audit and lending compliance reviews. We utilize both internal and external resources, where appropriate, to perform the various loan review functions. For example, we have engaged the services of a third party firm specializing in loan review and analysis to perform several loan review functions. The firm reviews the loan portfolio in accordance with the scope and frequency determined by senior management and the Audit and Compliance Committee of the Board of Directors. The third party loan review firm assists senior management and the Board of Directors in identifying potential credit weaknesses; in reviewing and confirming risk ratings or adverse classifications internally ascribed to loans by management; in identifying relevant trends that affect the collectability of the portfolio and identifying segments of the portfolio that are potential problem areas; in verifying the appropriateness of the allowance for loan losses; in evaluating the activities of lending personnel including compliance with lending policies and the quality of their loan approval, monitoring and risk assessment; and by providing an objective assessment of the overall quality of the loan portfolio. Currently, independent loan reviews are being conducted quarterly and include non-performing loans as well as samples of performing loans of varying types within our portfolio.
16
Our loan review system also includes the internal audit and compliance functions, which operate in accordance with a scope determined by the Audit and Compliance Committee of the Board of Directors. Internal audit resources assess the adequacy of, and adherence to, internal credit policies and loan administration procedures. Similarly, our compliance resources monitor adherence to relevant lending-related and consumer protection-related laws and regulations.
As noted, the loan review system also comprises our policies and procedures relating to the regulatory classification of assets and the allowance for loan loss functions each of which are described in greater detail below.
Classification of Assets. In compliance with the regulatory guidelines, our loan review system includes an evaluation process through which certain loans exhibiting adverse credit quality characteristics are classified “Special Mention”, “Substandard”, “Doubtful” or “Loss”.
An asset is classified as “Substandard” if it is inadequately protected by the paying capacity and net worth of the obligor or the collateral pledged, if any. Substandard assets include those characterized by the distinct possibility that the insured institution will sustain some loss if the deficiencies are not corrected. Assets classified as “Doubtful” have all of the weaknesses inherent in those classified as “Substandard”, with the added characteristic that the weaknesses present make collection or liquidation in full highly questionable and improbable, on the basis of currently existing facts, conditions and values. Assets, or portions thereof, classified as “Loss” are considered uncollectible or of so little value that their continuance as assets is not warranted.
Management evaluates loans classified as “Substandard” or “Doubtful” for impairment in accordance with applicable accounting requirements. As discussed in greater detail below, a valuation allowance is established through the provision for loan losses for any impairment identified through such evaluations. To the extent that impairment identified on a loan is classified as “Loss”, that portion of the loan is charged off against the allowance for loan losses.
The classification of loan impairment as “Loss” is based upon a confirmed expectation for loss. For loans primarily secured by real estate, the expectation for loss is generally confirmed when: (a) impairment is identified on a loan individually evaluated in the manner described below, and (b) the loan is presumed to be collateral-dependent such that the source of loan repayment is expected to arise solely from sale of the collateral securing the applicable loan. Impairment identified on non-collateral-dependent loans may or may not be eligible for a “Loss” classification depending upon the other salient facts and circumstances that affect the manner and likelihood of loan repayment. Loan impairment that is classified as “Loss” is charged off against the ALLL concurrent with that classification.
The timeframe between when we first identify loan impairment and when such impairment may ultimately be charged off varies by loan type. For example, unsecured consumer and commercial loans are generally classified as “Loss” at 120 days past due, resulting in their outstanding balances being charged off at that time. For our secured loans, the condition of collateral dependency, as noted above, generally serves as the basis upon which a “Loss” classification is ascribed to a loan’s impairment thereby confirming an expected loss and triggering charge off of that impairment.
While the facts and circumstances that effect the manner and likelihood of repayment vary from loan to loan, we generally consider the referral of a loan to foreclosure, coupled with the absence of other viable sources of loan repayment, to be demonstrable evidence of collateral dependency. Depending upon the nature of the collections process applicable to a particular loan, an early determination of collateral dependency could result in a nearly concurrent charge off of a newly identified impairment. By contrast, a presumption of collateral dependency may only be determined after the completion of lengthy loan collection and/or workout efforts, including bankruptcy proceedings, which may extend several months or more after a loan’s impairment is first identified.
In a limited number of cases, the entire net carrying value of a loan may be determined to be impaired based upon a collateral-dependent impairment analysis. However, the borrower’s adherence to contractual repayment terms precludes the recognition of a “Loss” classification and charge off. In these limited cases, a valuation allowance equal to 100% of the impaired loan’s carrying value may be maintained against the net carrying value of the asset.
Assets which do not currently expose us to a sufficient degree of risk to warrant an adverse classification but have some credit deficiencies or other potential weaknesses are designated as “Special Mention” by management. Adversely classified assets, together with those rated as “Special Mention”, are generally referred to as “Classified Assets”. Non-classified assets are internally rated within one of four “Pass” categories or as “Watch” with the latter denoting a potential deficiency or concern that warrants increased oversight or tracking by management until remediated.
17
Management performs a classification of assets review, including the regulatory classification of assets, generally on a monthly basis. The results of the classification of assets review are validated by our third party loan review firm during their quarterly independent review. In the event of a difference in rating or classification between those assigned by the internal and external resources, we will generally utilize the more critical or conservative rating or classification. Final loan ratings and regulatory classifications are presented monthly to the Board of Directors and are reviewed by regulators during the examination process.
The following table discloses our designation of certain loans as special mention or adversely classified during each of the five years presented.
| At June 30, | |
| 2018 | | | 2017 | | | 2016 | | | 2015 | | | 2014 | |
| (In Thousands) | |
Special mention | $ | 592 | | | $ | 2,594 | | | $ | 2,528 | | | $ | 13,501 | | | $ | 12,258 | |
Substandard | | 28,752 | | | | 29,428 | | | | 33,052 | | | | 34,748 | | | | 41,564 | |
Doubtful | | 1 | | | | 3 | | | | 2 | | | | 273 | | | | 290 | |
Loss (1) | | - | | | | - | | | | - | | | | - | | | | - | |
Total classified loans | $ | 29,345 | | | $ | 32,025 | | | $ | 35,582 | | | $ | 48,522 | | | $ | 54,112 | |
(1) | Net of specific valuation allowances where applicable. |
At June 30, 2018, six loans were classified as Special Mention and 127 loans were classified as Substandard. As of that same date, four loans were classified as Doubtful. As noted above, all loans, or portions thereof, classified as Loss during fiscal 2018 were charged off against the allowance for loan losses.
Allowance for Loan Losses. Our allowance for loan loss calculation methodology utilizes a “two-tier” loss measurement process that is generally performed monthly. Based upon the results of the classification of assets and credit file review processes described earlier, we first identify the loans that must be reviewed individually for impairment. Factors considered in identifying individual loans to be reviewed include, but may not be limited to, loan type, classification status, contractual payment status, performance/accrual status and impaired status.
The loans we consider to be eligible for individual impairment review include our commercial mortgage loans, comprising multi-family and nonresidential real estate loans, construction loans and commercial business loans as well as our one- to four-family mortgage loans, home equity loans and home equity lines of credit.
A reviewed loan is deemed to be impaired when, based on current information and events, it is probable that we will be unable to collect all amounts due according to the contractual terms of the loan agreement. Once a loan is determined to be impaired, management performs an analysis to determine the amount of impairment associated with that loan.
In measuring the impairment associated with collateral-dependent loans, the fair value of the collateral securing the loan is generally used as a measurement proxy for that of the impaired loan itself as a practical expedient. In the case of real estate collateral, such values are generally determined based upon a discounted market value obtained through an automated valuation module or prepared by a qualified, independent real estate appraiser. The value of non-real estate collateral is similarly determined based upon the independent assessment of fair market value by a qualified resource.
We generally obtain independent appraisals on properties securing mortgage loans when such loans are initially placed on nonperforming or impaired status with such values updated approximately every six to twelve months thereafter throughout the collections, bankruptcy and/or foreclosure processes. Appraised values are typically updated at the point of foreclosure, where applicable, and approximately every six to twelve months thereafter while the repossessed property is held as real estate owned.
As supported by accounting and regulatory guidance, we reduce the fair value of the collateral by estimated selling costs, such as real estate brokerage commissions, to measure impairment when such costs are expected to reduce the cash flows available to repay the loan.
We establish valuation allowances in the fiscal period during which the loan impairments are identified. The results of management’s individual loan impairment evaluations are validated by our third party loan review firm during their quarterly independent review. Such valuation allowances are adjusted in subsequent fiscal periods, where appropriate, to reflect any changes in carrying value or fair value identified during subsequent impairment evaluations which are generally updated monthly by management.
18
The second tier of the loss measurement process involves estimating the probable and estimable losses on loans not otherwise reviewed individually for impairment as well as those individually reviewed loans that are determined to be non-impaired. Such loans include groups of smaller-balance homogeneous loans that may generally be excluded from individual impairment analysis, and therefore collectively evaluated for impairment, as well as the non-impaired loans within categories that are otherwise eligible for individual impairment review.
Valuation allowances established through the second tier of the loss measurement process utilize historical and environmental loss factors to collectively estimate the level of probable losses within defined segments of our loan portfolio. These segments aggregate homogeneous subsets of loans with similar risk characteristics based upon loan type. For allowance for loan loss calculation and reporting purposes, we currently stratify our loan portfolio into seven primary segments: residential mortgage loans, multi-family mortgage loans, non-residential mortgage loans, construction loans, commercial business loans, home equity loans and other consumer loans.
The risks presented by residential mortgage loans are primarily related to adverse changes in the borrower’s financial condition that threaten repayment of the loan in accordance with its contractual terms. Such risk to repayment can arise from job loss, divorce, illness and the personal bankruptcy of the borrower. For collateral dependent residential mortgage loans, additional risk of loss is presented by potential declines in the fair value of the collateral securing the loan.
Home equity loans and home equity lines of credit generally share the same risks as those applicable to residential mortgage loans. However, to the extent that such loans represent junior liens, they are comparatively more susceptible to such risks given their subordinate position behind senior liens.
In addition to sharing similar risks as those presented by residential mortgage loans, risks relating to multi-family and non-residential mortgage loans also arise from comparatively larger loan balances to single borrowers or groups of related borrowers. Moreover, the repayment of such loans is typically dependent on the successful operation of an underlying real estate project and may be further threatened by adverse changes to demand and supply of multi-family and non-residential real estate as well as changes generally impacting overall business or economic conditions.
The risks presented by construction loans are generally considered to be greater than those attributable to residential, multi-family and non-residential mortgage loans. Risks from construction lending arise, in part, from the concentration of principal in a limited number of loans and borrowers and the effects of general economic conditions on developers and builders. Moreover, a construction loan can involve additional risks because of the inherent difficulty in estimating both a property's value at completion of the project and the estimated cost, including interest, of the project. The nature of these loans is such that they are comparatively more difficult to evaluate and monitor than permanent mortgage loans.
Commercial business loans are also considered to present a comparatively greater risk of loss due to the concentration of principal in a limited number of loans and/or borrowers and the effects of general economic conditions on the business. Commercial business loans may be secured by varying forms of collateral including, but not limited to, business equipment, receivables, inventory and other business assets which may not provide an adequate source of repayment of the outstanding loan balance in the event of borrower default. Moreover, the repayment of commercial business loans is primarily dependent on the successful operation of the underlying business which may be threatened by adverse changes to the demand for the business’ products and/or services as well as the overall efficiency and effectiveness of the business’ operations and infrastructure.
Finally, our unsecured consumer loans generally have shorter terms and higher interest rates than other forms of lending but generally involve more credit risk due to the lack of collateral to secure the loan in the event of borrower default. Consumer loan repayment is dependent on the borrower's continuing financial stability, and therefore is more likely to be adversely affected by job loss, divorce, illness and personal bankruptcy. By contrast, our consumer loans also include account loans that are fully secured by the borrower’s deposit accounts and generally present nominal risk to the Company.
Each primary category is further stratified to distinguish between loans originated and purchased directly from third party lenders from loans acquired through wholesale channels or through business combinations. Where applicable, such primary categories separately identify loans that are supported by government guarantees, such as those issued by the SBA. Within these primary categories, loans are grouped into more granular segments based on common risk characteristics. For example, loans secured by real estate, such as residential and commercial mortgage loans, are generally grouped into segments by underlying property type while commercial business loans are grouped into segments based on business or industry type.
19
In regard to historical loss factors, our allowance for loan loss calculation calls for an analysis of historical charge-offs and recoveries for each of the defined segments within the loan portfolio. We generally utilize a two-year moving average of annualized net charge-off rates (charge-offs net of recoveries) by loan segment, where available, to calculate our actual historical loss experience. The outstanding principal balance of the non-impaired portion of each loan segment is multiplied by the applicable historical loss factor, which is updated quarterly, to estimate the level of probable losses. In circumstances where the Company does not have sufficient or relevant historical loss experience on which to base the calculation of the average historical losses for one or more loan segments, management may utilize historical loss "proxies" to derive the historical loss factors for such loans. Such proxies are generally based on the historical loss experience of loans with similar risk characteristics held by other financial institutions or enterprises.
As noted, the second tier of our allowance for loan loss calculation also utilizes environmental loss factors to estimate the probable losses within the loan portfolio. Environmental loss factors are based on specific quantitative and qualitative criteria that are used to assess the level of loss exposure arising from key sources of risk within the loan portfolio. Such sources of risk include those relating to the level of and trends in nonperforming loans; the level of and trends in credit risk management effectiveness, the levels and trends in lending resource capability; levels and trends in economic and market conditions; levels and trends in loan concentrations; levels and trends in loan composition and terms, levels and trends in independent loan review effectiveness, levels and trends in collateral values and the effects of other external factors.
We utilize a set of seven risk tranches, ranging from “negligible risk” to “severe risk”, that establishes a pre-defined range of potential risk ratings to be ascribed to each criteria component supporting an environmental loss factor. Risk ratings of zero and 30 are ascribed to the “negligible risk” and “severe risk” tranches, respectively, which generally serve as the upper and lower thresholds for the potential range of risk rating values across all risk tranches. The remaining five risk tranches, ranging from “low risk” to “high risk”, utilize progressively higher ranges of potential risk ratings reflecting the increased level of risk associated with each tranche.
As noted earlier, we utilize both quantitative and qualitative criteria to support our assessment of risk and associated credit loss estimates using environmental loss factors. In the case of quantitative criteria, we associate pre-defined ranges of potential criteria values with each of the risk tranches noted above. Through this mechanism, quantitative criteria values are correlated to specific risk tranches. For loss factor criteria that are based on wholly qualitative metrics, we simply ascribe a risk tranche directly to that criteria based on management judgement. In both cases, the actual risk ratings ascribed by management to criteria components are generally expected to fall within the pre-defined range of risk ratings assigned to the applicable risk tranche.
Risk ratings are multiplied by .01% to calculate a loss factor value attributable to each of the criteria components supporting an environmental loss factor. The average of the loss factor values ascribed to the criteria components generally serves as the aggregate value for that loss factor. Where appropriate, the criteria components supporting a loss factor may be “weighted” in relation to one another to allow for greater emphasis on certain criteria in the calculation of an environmental loss factor.
Like the historical loss factors discussed above, we generally utilize a two-year moving average of criteria values, where available, to determine the risk tranche and associated set of potential risk ratings to be ascribed to the criteria components supporting an environmental loss factor. By doing so, estimated losses should be directionally consistent with the overall credit risk characteristics and performance of the loan portfolio over time while avoiding significant short-term volatility arising from incremental changes to criteria values. Where appropriate, we may extend or compress criteria look-back periods to properly reflect the level of credit risk and estimated losses within a specified subset of loans. The outstanding principal balance of the non-impaired portion of each loan segment is multiplied by the aggregate value of each environmental loss factor, which is updated quarterly, to estimate the level of probable losses attributable to that factor.
The sum of the probable and estimable loan losses calculated through the first and second tiers of the loss measurement processes as described above, represents the total targeted balance for our allowance for loan losses at the end of a fiscal period. As noted earlier, we establish all additional valuation allowances in the fiscal period during which additional individually identified loan impairments and additional estimated losses on loans collectively evaluated for impairment are identified. We adjust our balance of valuation allowances through the provision for loan losses as required to ensure that the balance of the allowance for loan losses reflects all probable and estimable loans losses at the close of the fiscal period. Notwithstanding calculation methodology and the noted distinction between valuation allowances established on loans collectively versus individually evaluated for impairment, our entire allowance for loan losses is available to cover all charge-offs that arise from the loan portfolio.
Although we believe that our allowance for loans losses is established in accordance with management’s best estimate, actual losses are dependent upon future events and, as such, further additions to the level of loan loss allowances may be necessary.
20
The following table sets forth information with respect to activity in the allowance for loan losses for the periods indicated.
| For the Years Ended June 30, | |
| | 2018 | | | | 2017 | | | | 2016 | | | | 2015 | | | | 2014 | |
| (Dollars in Thousands) | |
Allowance balance (at beginning of period) | $ | 29,286 | | | $ | 24,229 | | | $ | 15,606 | | | $ | 12,387 | | | $ | 10,896 | |
Provision for loan losses | | 2,706 | | | | 5,381 | | | | 10,690 | | | | 6,108 | | | | 3,381 | |
Charge offs: | | | | | | | | | | | | | | | | | | | |
One- to four-family mortgage | | (521 | ) | | | (76 | ) | | | (1,213 | ) | | | (1,985 | ) | | | (1,202 | ) |
Home equity loans | | (18 | ) | | | (96 | ) | | | (93 | ) | | | (77 | ) | | | (47 | ) |
Multi-family | | - | | | | - | | | | (133 | ) | | | (14 | ) | | | - | |
Nonresidential | | (45 | ) | | | (149 | ) | | | - | | | | (636 | ) | | | (44 | ) |
Commercial business | | (145 | ) | | | (221 | ) | | | (1,464 | ) | | | (491 | ) | | | (1,170 | ) |
Other | | (829 | ) | | | (849 | ) | �� | | (55 | ) | | | (1 | ) | | | (30 | ) |
Total charge offs: | | (1,558 | ) | | | (1,391 | ) | | | (2,958 | ) | | | (3,204 | ) | | | (2,493 | ) |
Recoveries: | | | | | | | | | | | | | | | | | | | |
One- to four-family mortgage | | 172 | | | | 256 | | | | 88 | | | | 297 | | | | 67 | |
Home equity loans | | 65 | | | | 16 | | | | 41 | | | | - | | | | 2 | |
Nonresidential | | - | | | | - | | | | - | | | | - | | | | 525 | |
Commercial business | | 90 | | | | 727 | | | | 760 | | | | 18 | | | | 9 | |
Other | | 104 | | | | 68 | | | | 2 | | | | - | | | | - | |
Total recoveries: | | 431 | | | | 1,067 | | | | 891 | | | | 315 | | | | 603 | |
Net charge offs: | | (1,127 | ) | | | (324 | ) | | | (2,067 | ) | | | (2,889 | ) | | | (1,890 | ) |
Allowance balance (at end of period) | $ | 30,865 | | | $ | 29,286 | | | $ | 24,229 | | | $ | 15,606 | | | $ | 12,387 | |
Total loans outstanding | $ | 4,567,915 | | | $ | 3,242,453 | | | $ | 2,671,381 | | | $ | 2,102,548 | | | $ | 1,742,868 | |
Average loans outstanding | $ | 3,577,598 | | | $ | 2,955,686 | | | $ | 2,512,231 | | | $ | 1,849,785 | | | $ | 1,548,746 | |
Allowance for loan losses as a percent of total loans outstanding | | 0.68 | % | | | 0.90 | % | | | 0.91 | % | | | 0.74 | % | | | 0.71 | % |
Net loan charge-offs as a percent of average loans outstanding | | 0.03 | % | | | 0.01 | % | | | 0.08 | % | | | 0.16 | % | | | 0.12 | % |
Allowance for loan losses to non-performing loans | | 183.08 | % | | | 155.18 | % | | | 115.07 | % | | | 68.17 | % | | | 48.96 | % |
Allocation of Allowance for Loan Losses. The following table sets forth the allocation of the total allowance for loan losses by loan category and segment and the percent of loans in each category’s segment to total net loans receivable at the dates indicated. The portion of the loan loss allowance allocated to each loan segment does not represent the total available for future losses which may occur within a particular loan segment since the total loan loss allowance is a valuation reserve applicable to the entire loan portfolio.
| At June 30, |
| 2018 | | 2017 | | 2016 | | 2015 | | 2014 |
| Amount | | | Percent of Loans to Total Loans | | Amount | | | Percent of Loans to Total Loans | | Amount | | | Percent of Loans to Total Loans | | Amount | | | Percent of Loans to Total Loans | | Amount | | | Percent of Loans to Total Loans |
| (Dollars In Thousands) | | |
At end of period allocated to: | | | | | | | | | | | | | | | | | | | | | | | | | | | | | | | | | | | | | | | | | | | | |
Real estate mortgage: | | | | | | | | | | | | | | | | | | | | | | | | | | | | | | | | | | | | | | | | | | | | |
One- to four-family | $ | 2,479 | | | | 8.03 | | % | | $ | 2,384 | | | | 17.50 | | % | | $ | 2,370 | | | | 22.66 | | % | | $ | 2,210 | | | | 28.17 | | % | | $ | 2,729 | | | | 33.31 | | % |
Multi-family | | 14,946 | | | | 48.42 | | | | | 13,941 | | | | 43.57 | | | | | 9,995 | | | | 38.94 | | | | | 6,355 | | | | 34.65 | | | | | 3,380 | | | | 24.73 | | |
Nonresidential | | 9,787 | | | | 31.71 | | | | | 9,939 | | | | 33.46 | | | | | 7,846 | | | | 30.72 | | | | | 4,765 | | | | 27.62 | | | | | 4,357 | | | | 31.71 | | |
Commercial business | | 2,552 | | | | 8.27 | | | | | 1,709 | | | | 2.30 | | | | | 2,784 | | | | 3.30 | | | | | 1,860 | | | | 4.73 | | | | | 1,284 | | | | 3.86 | | |
Consumer: | | | | | | | | | | | | | | | | | | | | | | | | | | | | | | | | | | | | | | | | | | | | |
Home equity loans | | 430 | | | | 1.39 | | | | | 501 | | | | 2.55 | | | | | 432 | | | | 3.35 | | | | | 366 | | | | 4.36 | | | | | 548 | | | | 5.72 | | |
Other | | 413 | | | | 1.34 | | | | | 777 | | | | 0.50 | | | | | 778 | | | | 0.95 | | | | | 16 | | | | 0.20 | | | | | 22 | | | | 0.25 | | |
Construction | | 258 | | | | 0.84 | | | | | 35 | | | | 0.12 | | | | | 24 | | | | 0.08 | | | | | 34 | | | | 0.27 | | | | | 67 | | | | 0.42 | | |
Total | $ | 30,865 | | | | 100.00 | | % | | $ | 29,286 | | | | 100.00 | | % | | $ | 24,229 | | | | 100.00 | | % | | $ | 15,606 | | | | 100.00 | | % | | $ | 12,387 | | | | 100.00 | | % |
21
The following table sets forth the allocation of the allowance for loan losses by loan category and segment within each valuation allowance category at the dates indicated. The valuation allowance categories presented reflect the allowance for loan loss calculation methodology in effect at the time.
| At June 30, | |
| 2018 | | | 2017 | | | 2016 | | | 2015 | | | 2014 | |
| (In Thousands) | |
Valuation allowance for loans individually evaluated for impairment | | | | | | | | | | | | | | | | | | | |
Real estate mortgage: | | | | | | | | | | | | | | | | | | | |
One- to four-family | $ | 79 | | | $ | 154 | | | $ | 77 | | | $ | 116 | | | $ | 528 | |
Multi-family | | - | | | | - | | | | - | | | | 267 | | | | 284 | |
Nonresidential | | - | | | | 39 | | | | 53 | | | | 262 | | | | 285 | |
Commercial business | | 227 | | | | 6 | | | | 400 | | | | 370 | | | | 444 | |
Consumer: | | | | | | | | | | | | | | | | | | | |
Home equity loans | | - | | | | - | | | | 78 | | | | 36 | | | | 132 | |
Total valuation allowance | | 306 | | | | 199 | | | | 608 | | | | 1,051 | | | | 1,673 | |
Valuation allowance for loans collectively evaluated for impairment: | | | | | | | | | | | | | | | | | | | |
Historical loss factors | | 2,074 | | | | 2,131 | | | | 3,439 | | | | 1,913 | | | | 2,058 | |
Environmental loss factors: | | | | | | | | | | | | | | | | | | | |
Real estate mortgage: | | | | | | | | | | | | | | | | | | | |
One- to four-family | | 2,368 | | | | 1,988 | | | | 1,621 | | | | 1,236 | | | | 1,175 | |
Multi-family | | 14,946 | | | | 13,941 | | | | 9,985 | | | | 6,079 | | | | 3,096 | |
Nonresidential | | 9,686 | | | | 9,701 | | | | 7,269 | | | | 4,393 | | | | 3,621 | |
Commercial business | | 750 | | | | 731 | | | | 810 | | | | 606 | | | | 374 | |
Consumer: | | | | | | | | | | | | | | | | | | | |
Home equity loans | | 410 | | | | 401 | | | | 306 | | | | 287 | | | | 317 | |
Other | | 67 | | | | 159 | | | | 167 | | | | 7 | | | | 8 | |
Construction | | 258 | | | | 35 | | | | 24 | | | | 34 | | | | 65 | |
Total environmental factors | | 28,485 | | | | 26,956 | | | | 20,182 | | | | 12,642 | | | | 8,656 | |
| | | | | | | | | | | | | | | | | | | |
Total allowance for loan losses | $ | 30,865 | | | $ | 29,286 | | | $ | 24,229 | | | $ | 15,606 | | | $ | 12,387 | |
During the year ended June 30, 2018, the balance of the allowance for loan losses increased by $1.6 million to $30.9 million or 0.68% of total loans at June 30, 2018 from $29.3 million or 0.90% of total loans at June 30, 2017. The increase in the dollar amount of the allowance resulted from provisions of $2.7 million during the year ended June 30, 2018 that were partially offset by charge-offs, net of recoveries, totaling $1.1 million during that same period. The noted decrease in the “total loan coverage ratio” from 0.90% to 0.68% for the year ended June 30, 2018 largely reflects the impact of the Clifton acquisition and the related purchase accounting standards which generally preclude acquired loan balances from being considered in the balance of the allowance for loan losses at the time of their acquisition. In lieu thereof, an accretable “credit mark” is established as a component of the purchase accounting fair value adjustments which directly reduces the carrying value of the acquired loan portfolio.
With regard to loans individually evaluated for impairment, the balance of our allowance for loan losses attributable to such loans increased by $107,000 to $306,000 at June 30, 2018 from $199,000 at June 30, 2017. The balance at June 30, 2018 reflected the allowance for impairment identified on $1.0 million of impaired loans while an additional $22.3 million of impaired loans had no allowance for impairment as of that date. By comparison, the balance at June 30, 2017 reflected the allowance for impairment identified on $3.1 million of impaired loans while an additional $18.9 million of impaired loans had no allowance for impairment as of that date. The outstanding balances of impaired loans reflect the cumulative effects of various adjustments including, but not limited to, purchase accounting valuations and prior charge-offs, where applicable, which are considered in the evaluation of impairment.
With regard to loans evaluated collectively for impairment, the balance of our allowance for loan losses attributable to such loans increased by $1.5 million to $30.6 million at June 30, 2018 from $29.1 million at June 30, 2017. The increase in valuation was partly attributable to the aggregate growth in the outstanding balance of non-acquired loans collectively evaluated for impairment as well as the ongoing reallocation of the applicable loans within the portfolio in favor of commercial loans against which we generally assign comparatively higher historical and environmental loss factors in our allowance for loan loss calculation. The increase in the allowance also reflected updates to historical and environmental loss factors during the year ended June 30, 2018.
22
With regard to historical loss factors, our loan portfolio experienced a net annualized charge-off rate of 0.03% for the year ended June 30, 2018 representing an increase of two basis points from the 0.01% of charge offs reported for the year ended June 30, 2017. The annual average net charge off rate for June 30, 2017 had previously decreased by seven basis points from 0.08% for the prior year ended June 30, 2016. Given the effects of these annual changes, the two-year average net charge off rate for our loan portfolio decreased by three basis points to 0.02% for the period ended June 30, 2018 from 0.05% for the period ended June 30, 2017. The historical loss factors used in our allowance for loan loss calculation methodology were updated to reflect the effect of these changes by individual loan segment reflecting the two year look-back period used by that methodology.
The effects of the net decrease in historical loss factors arising from the changes noted above modestly offset the effect of the increase in the overall balance of the unimpaired portion of the loan portfolio during the year ended June 30, 2018. Consequently, the applicable portion of the allowance attributable to these factors remained stable at $2.1 million at June 30, 2018 and June 30, 2017.
With regard to environmental loss factors, the Company made minor adjustments to such factors during the year ended June 30, 2018. Such adjustments partly reflected decreasing loss exposure due to incremental improvements in asset quality and portfolio seasoning metrics that were largely offset by increasing loss exposure due to elevated commercial mortgage loan collateral values and increased uncertainty in economic and market conditions. Consequently, the $1.5 million increase in the portion of the allowance for loan losses attributable to environmental loss factors to $28.5 million at June 30, 2018 from $27.0 million at June 30, 2017 was largely attributable to the growth in the unimpaired portion of the loan portfolio.
An overview of the balances and activity within the allowance for loan loss during the prior fiscal year ended June 30, 2017 generally reflected the effects of the overall growth and reallocation of the loan portfolio arising from our increased strategic emphasis on commercial lending during that earlier year while also reflecting a consistent improvement in asset quality and reduction in specific loan-level impairment losses.
In that regard, the balance of the allowance for loan losses increased by approximately $5.1 million to $29.3 million or 0.90% of total loans at June 30, 2017 from $24.2 million or 0.91% of total loans at June 30, 2016. The increase resulted from provisions of $5.4 million that were partially offset by net charge offs of $324,000 during fiscal 2017. Valuation allowances attributable to impairment identified on individually evaluated loans decreased by $409,000 to $199,000 at June 30, 2017 from $608,000 at June 30, 2016. For those same comparative periods, valuation allowances on loans evaluated collectively for impairment increased by approximately $5.5 million to $29.1 million from $23.6 million. The growth during fiscal 2017 in the portion of the allowance attributable to collectively evaluated loans largely reflected the overall growth in the balance of non-impaired loans in the portfolio in conjunction with changes to the historical and environmental loss factors used in the allowance for loan loss calculation during the year.
The calculation of probable losses within a loan portfolio and the resulting allowance for loan losses is subject to estimates and assumptions that are susceptible to significant revisions as more information becomes available and as events or conditions effecting individual borrowers and the marketplace as a whole change over time. Future additions to the allowance for loan losses may be necessary if economic and market conditions deteriorate in the future from those currently prevalent in the marketplace. In addition, the federal banking regulators, as an integral part of their examination process, periodically review our loan and foreclosed real estate portfolios and the related allowance for loan losses and valuation allowance for foreclosed real estate. The regulators may require the allowance for loan losses to be increased based on their review of information available at the time of the examination, which may negatively affect our earnings. Finally, changes in accounting standards promulgated by the Financial Accounting Standards Board, such as those discussed in Note 2 to the audited consolidated financial statements regarding the use of a current expected credit loss (“CECL”) model to calculate credit losses, may require increases in the allowance for loan losses upon adoption of the applicable accounting standard.
Securities Portfolio
Our deposits and borrowings have traditionally exceeded our outstanding balance of loans receivable. We have generally invested excess funds into investment securities with a historical emphasis on U.S. agency mortgage-backed securities and U.S. agency debentures. Such assets were a significant component of our investment portfolio at June 30, 2018 and are expected to remain so in the future. However, enhancements to our investment policies, strategies and infrastructure in recent years have enabled us to diversify the composition and allocation of our securities portfolio as described below.
At June 30, 2018, our securities portfolio totaled $1.31 billion and comprised 20.0% of our total assets. By comparison, at June 30, 2017, our securities portfolio totaled $1.11 billion and comprised 23.0% of our total assets.
23
The year-over-year net increase in the securities portfolio totaled approximately $207.7 million which partly reflected the impact of securities acquired from Clifton with fair values totaling $326.9 million. The growth in securities also reflected additional security purchases that were partially offset by security sales and calls. A portion of the noted security purchases and sales reflected a partial restructuring of the securities portfolio acquired from Clifton. The increase in the portfolio was also partially offset by a $1.9 million decrease in the fair value of the available for sale securities portfolio to an unrealized loss of $4.3 million at June 30, 2018 from an unrealized loss of $2.4 million at June 30, 2017.
Notwithstanding the increase in the securities portfolio from June 30, 2018 compared to June 30, 2017, the stated goals and objectives of our business plan continues to call for shifting the mix of our earning assets toward greater balances of loans and lesser balances of securities.
Our investment policy, which is approved by the Board of Directors, is designed to foster earnings and manage cash flows within prudent interest rate risk and credit risk guidelines. Generally, our investment policy is to invest funds in various categories of securities and maturities based upon our liquidity needs, asset/liability management policies, investment quality, and marketability and performance objectives. Our Chief Executive Officer, Chief Operating Officer, Chief Financial Officer and Treasurer/Chief Investment Officer are the senior management members of our Capital Markets Committee (“CMC”) that are generally designated by the Board of Directors as the officers primarily responsible for securities portfolio management and all transactions require the approval of at least two of these designated officers. The Board of Directors is responsible for the oversight of the securities portfolio and the CMC’s activities relating thereto.
The investments authorized for purchase under the investment policy approved by our Board of Directors include U.S. government and agency mortgage-backed securities (including U.S. agency commercial MBS), U.S. government and government agency debentures, municipal obligations (consisting of bank-qualified municipal bond obligations of state and local governments), corporate bonds, asset-backed securities, collateralized loan obligations and subordinated debt. We also hold small balances of single-issuer trust preferred securities and non-agency mortgage-backed securities that were acquired through bank acquisitions, but generally do not purchase such securities for the portfolio. On a short-term basis, our investment policy authorizes investment in securities purchased under agreements to resell, federal funds, certificates of deposits of insured banks and savings institutions and Federal Home Loan Bank term deposits.
The carrying value of our mortgage-backed securities totaled $568.5 million at June 30, 2018 and comprised 43.2% of total investments and 8.6% of total assets as of that date. We generally invest in mortgage-backed securities issued by U.S. government agencies or government-sponsored entities, such as the Government National Mortgage Association (“Ginnie Mae”), Federal Home Loan Mortgage Corporation (“Freddie Mac”) and the Federal National Mortgage Association (“Fannie Mae”). Mortgage-backed securities issued or sponsored by U.S. government agencies and government-sponsored entities are guaranteed as to the payment of principal and interest to investors. Mortgage-backed securities generally yield less than the mortgage loans underlying such securities because of the costs of servicing and of their payment guarantees or credit enhancements which minimize the level of credit risk to the security holder. In addition to those mortgage-backed securities issued by U.S. agencies and GSEs, the Company also held a nominal balance of non-agency collateralized mortgage obligations with credit-ratings equaling or exceeding “A” by Standard & Poor’s Financial Services (“S&P”) and/or “Baa3” by Moody’s Investor Service (“Moody’s”), where rated by those agencies.
The carrying value of our U.S. agency debt securities totaled $4.4 million at June 30, 2018 and comprised less than one percent of total investments and total assets as of that date. Such securities were fully comprised of securitized pools of loans issued and fully guaranteed by the SBA.
The carrying value of our securities representing obligations of state and political subdivisions totaled $135.6 million at June 30, 2018 and comprised 10.3% of total investments and 2.1% of total assets as of that date. Such securities primarily included highly-rated, fixed-rate bank-qualified securities representing general obligations of municipalities located within the U.S. or the obligations of their related entities such as boards of education or school districts. The portfolio also includes a nominal balance of non-rated municipal obligations totaling approximately $2.0 million comprising two short-term, bond anticipation notes (“BANs”) issued by a total of two New Jersey municipalities. Each of our municipal obligations were consistently rated by Moody’s and S&P well above the thresholds that generally support our investment grade assessment with such ratings equaling or exceeding “A-” or higher by S&P and/or “A3” or higher by Moody’s, where rated by those agencies. In the absence of such ratings, we rely upon our own internal analysis of the issuer’s financial condition to validate its investment grade assessment.
The carrying value of our asset-backed securities totaled $182.6 million at June 30, 2018 and comprised 13.9% of total investments and 2.8% of total assets as of that date. This category of securities is comprised entirely of structured, floating-rate securities representing securitized federal education loans with 97% U.S. government guarantees. The securities represent tranches of a larger investment vehicle designed to reallocate credit risk among the individual tranches comprised within that vehicle. Through this process, investors in different tranches are subject to varying degrees of risk that the cash flows of their tranche will be adversely impacted by borrowers defaulting on the underlying loans. Our securities represent the highest credit-quality tranches within the overall structures with each being rated “AA+” or higher by S&P/or “A1” or higher by Moody’s, where rated by those agencies, at June 30, 2018.
24
The outstanding balance of our collateralized loan obligations totaled $226.1 million at June 30, 2018 and comprised 17.2% of total investments and 3.4% of total assets as of that date. This category of securities is comprised entirely of structured, floating-rate securities comprised of securitized commercial loans to large, U.S. corporations. Our securities represent tranches of a larger investment vehicle designed to reallocate cash flows and credit risk among the individual tranches comprised within that vehicle. Through this process, investors in different tranches are subject to varying degrees of risk that the cash flows of their tranche will be adversely impacted by borrowers defaulting on the underlying loans. At June 30, 2018, each of our collateralized loan obligations were consistently rated by Moody’s and S&P well above the thresholds that generally support our investment grade assessment with such ratings equaling “AAA” by S&P and “Aaa” or by Moody’s, where rated by those agencies.
The carrying value of our corporate bonds totaled $147.6 million at June 30, 2018 and comprised 11.2% of total investments and 2.2% of total assets as of that date. This category of securities is comprised entirely of floating-rate corporate debt obligations issued by large financial institutions. Such issuers include domestic institutions, such as The Goldman Sachs Group, Inc., General Electric Corporation, JPMorgan Chase & Co. and Wells Fargo and Co., as well as non-domestic financial institutions such as Barclays Bank PLC and Deutsche Bank AG. The Company generally limits its investment in the unsecured corporate debt of any single issuer to $25.0 million. At June 30, 2018, each of our corporate bonds were consistently rated by Moody’s and S&P well above the thresholds that generally support our investment grade assessment with such ratings equaling or exceeding “BBB+” or higher by S&P and/or “A3” or higher by Moody’s, where rated by those agencies.
The carrying value of our subordinated debt totaled $46.3 million at June 30, 2018 and comprised 3.5% of total investments and less than 1.0% of total assets as of that date. This balance is comprised of eight securities representing eight separate issuers. The typical structure of the subordinated debt is a 10-year final maturity, with a fixed rate coupon for the first five years of the term, and then at a variable rate that will reset quarterly to a level equal to the then current 3-month LIBOR plus a spread over the remainder of the term. The notes are redeemable after five years subject to satisfaction of certain conditions. Seven of the securities totaling $31.3 million in carrying value are rated BBB- or higher by Kroll Bond Rating Agency while one security with a carrying value of $15.0 million is non-rated. All issuers of the Company’s investments in subordinated debt represent profitable, well-capitalized, small- to mid-sized community banks in the mid-Atlantic region of the U.S. In each case, the indebtedness evidenced by the subordinated notes, including principal and interest, is unsecured and subordinate and junior to the issuer’s general and secured creditors and depositors. The Company may consider additional purchases of subordinated debt issued by financial institutions in the future.
The carrying value of our trust preferred securities totaled $3.8 million at June 30, 2018 and comprised less than one percent of total investments and total assets as of that date. The category comprises a total of three “single-issuer” (i.e. non-pooled) trust preferred securities that were originally issued by two separate financial institutions. As a result of bank mergers involving the issuers of these securities, our three trust preferred securities currently represent the de-facto obligations of two separate financial institutions. At June 30, 2018, two of the securities at an amortized cost of $3.0 million were consistently rated by Moody’s and S&P above the thresholds that generally support our investment grade assessment, with such ratings equaling “BBB-” by S&P and “Baa2” by Moody’s. The securities were originally issued through Chase Capital II and currently represent de-facto obligations of JP Morgan Chase & Co. We hold one non-rated trust preferred security with a par value of $1.0 million representing a de-facto obligation of Mercantil Commercebank Florida Bancorp, Inc.
Current accounting standards require that securities be categorized as “held to maturity”, “trading securities” or “available for sale”, based on management’s intent as to the ultimate disposition of each security. These standards allow debt securities to be classified as “held to maturity” and reported in financial statements at amortized cost only if the reporting entity has the positive intent and ability to hold these securities to maturity. Securities that might be sold in response to changes in market interest rates, changes in the security’s prepayment risk, increases in loan demand, or other similar factors cannot be classified as “held to maturity”.
We do not currently use or maintain a trading account. Securities not classified as “held to maturity” are classified as “available for sale”. These securities are reported at fair value and unrealized gains and losses on the securities are excluded from earnings and reported, net of deferred taxes, as adjustments to accumulated other comprehensive income, a separate component of equity. As of June 30, 2018, our held to maturity securities portfolio had a carrying value of $589.7 million or 44.9% of our total securities with the remaining $725.1 million or 55.1% of securities classified as available for sale.
Other than mortgage-backed or debt securities issued or guaranteed by the U.S. government or its agencies, we did not hold securities of any one issuer having an aggregate book value in excess of 10% of our equity at June 30, 2018. All of our securities carry market risk insofar as increases in market rates of interest may cause a decrease in their market value. We have determined that none of our securities with unrealized losses at June 30, 2018 are other than temporarily impaired as of that date.
Purchases of securities are made based on certain considerations, which include the interest rate, tax considerations, volatility, yield, settlement date and maturity of the security, our liquidity position and anticipated cash needs and sources. The effect that the proposed security would have on our credit and interest rate risk and risk-based capital is also considered. We do not purchase securities that are determined to be below investment grade.
25
During the year ended June 30, 2018, proceeds from sales of securities available for sale totaled $254.6 million and resulted in gross losses of $31,000. During the year ended June 30, 2017, proceeds from sales of securities available for sale totaled $83.0 million and resulted in gross gains of $1.3 million and gross losses of $1.7 million. There were no sales of securities available for sale during the year ended June 30, 2016. During the year ended June, 30, 2018, proceeds from sales of securities held to maturity totaled $211,000 which resulted in gross losses of $8,000. The securities sold were limited to those securities where there was evidence of a deterioration of creditworthiness. During the year ended June 30, 2017, proceeds from sales of securities held to maturity totaled $5.3 million which resulted in gross gains of $370,000 and gross losses of $1,000. The securities sold were limited to those whose remaining outstanding balances had declined to the required thresholds, in relation to the original amount purchased or acquired, that allowed their sale from the held to maturity portfolio. There were no sales of held to maturity securities during the year ended June 30, 2016.
The following table sets forth the carrying value of our securities portfolio at the dates indicated. Mortgage-backed securities include mortgage pass-through securities and collateralized mortgage obligations.
| At June 30, | |
| 2018 | | | 2017 | | | 2016 | | | 2015 | | | 2014 | |
| (In Thousands) | |
Debt securities available for sale: | | | | | | | | | | | | | | | | | | | |
U.S. agency securities | $ | 4,411 | | | $ | 5,316 | | | $ | 6,440 | | | $ | 7,263 | | | $ | 4,205 | |
Obligations of state and political subdivisions | | 26,088 | | | | 27,740 | | | | 28,398 | | | | 26,835 | | | | 26,773 | |
Asset-backed securities | | 182,620 | | | | 162,429 | | | | 82,625 | | | | 88,032 | | | | 87,316 | |
Collateralized loan obligations | | 226,066 | | | | 98,154 | | | | 127,374 | | | | 128,171 | | | | 119,572 | |
Corporate bonds | | 147,594 | | | | 142,318 | | | | 137,404 | | | | 162,608 | | | | 162,234 | |
Trust preferred securities | | 3,783 | | | | 8,540 | | | | 7,669 | | | | 7,751 | | | | 7,798 | |
Total debt securities available for sale | | 590,562 | | | | 444,497 | | | | 389,910 | | | | 420,660 | | | | 407,898 | |
| | | | | | | | | | | | | | | | | | | |
Mortgage-backed securities available for sale: | | | | | | | | | | | | | | | | | | | |
Government National Mortgage Association | | - | | | | - | | | | 1,960 | | | | 2,655 | | | | 3,276 | |
Federal Home Loan Mortgage Corporation | | 83,475 | | | | 104,728 | | | | 151,296 | | | | 183,528 | | | | 231,910 | |
Federal National Mortgage Association | | 51,048 | | | | 64,535 | | | | 130,247 | | | | 160,271 | | | | 201,827 | |
Non-agency | | - | | | | - | | | | 124 | | | | 165 | | | | 210 | |
Total mortgage-backed securities available for sale | | 134,523 | | | | 169,263 | | | | 283,627 | | | | 346,619 | | | | 437,223 | |
| | | | | | | | | | | | | | | | | | | |
Total securities available for sale | | 725,085 | | | | 613,760 | | | | 673,537 | | | | 767,279 | | | | 845,121 | |
| | | | | | | | | | | | | | | | | | | |
Debt securities held to maturity: | | | | | | | | | | | | | | | | | | | |
U.S. agency securities | | - | | | | 35,000 | | | | 84,992 | | | | 143,334 | | | | 144,349 | |
Obligations of state and political subdivisions | | 109,483 | | | | 94,713 | | | | 82,179 | | | | 76,528 | | | | 72,065 | |
Subordinated debt | | 46,294 | | | | 15,000 | | | | - | | | | - | | | | - | |
Total debt securities held to maturity | | 155,777 | | | | 144,713 | | | | 167,171 | | | | 219,862 | | | | 216,414 | |
| | | | | | | | | | | | | | | | | | | |
Mortgage-backed securities held to maturity: | | | | | | | | | | | | | | | | | | | |
Government National Mortgage Association | | 55,747 | | | | 4,188 | | | | 10,551 | | | | 10,119 | | | | 9 | |
Federal Home Loan Mortgage Corporation | | 48,637 | | | | 50,811 | | | | 63,783 | | | | 60,026 | | | | 303 | |
Federal National Mortgage Association | | 329,554 | | | | 293,587 | | | | 335,748 | | | | 373,292 | | | | 295,292 | |
Non-agency | | 15 | | | | 22 | | | | 33 | | | | 42 | | | | 54 | |
Total mortgage-backed securities held to maturity | | 433,953 | | | | 348,608 | | | | 410,115 | | | | 443,479 | | | | 295,658 | |
| | | | | | | | | | | | | | | | | | | |
Total securities held to maturity | | 589,730 | | | | 493,321 | | | | 577,286 | | | | 663,341 | | | | 512,072 | |
| | | | | | | | | | | | | | | | | | | |
Total securities | $ | 1,314,815 | | | $ | 1,107,081 | | | $ | 1,250,823 | | | $ | 1,430,620 | | | $ | 1,357,193 | |
| | | | | | | | | | | | | | | | | | | |
26
The following table sets forth certain information regarding the carrying values, weighted average yields and maturities of our securities portfolio at June 30, 2018. This table shows contractual maturities and does not reflect re-pricing or the effect of prepayments. Actual maturities may differ from contractual maturities because issuers may have the right to call or prepay obligations with or without prepayment penalties. At June 30, 2018, securities with a carrying value of $19.3 million are callable within one year.
| At June 30, 2018 | |
| One Year or Less | | One to Five Years | | Five to Ten Years | | More Than Ten Years | | Total Securities | |
| Carrying Value | | | Weighted Average Yield | | Carrying Value | | | Weighted Average Yield | | Carrying Value | | | Weighted Average Yield | | Carrying Value | | | Weighted Average Yield | | Carrying Value | | | Weighted Average Yield | | Fair Market Value | |
| (Dollars In Thousands) | |
Debt securities: | | | | | | | | | | | | | | | | | | | | | | | | | | | | | | | | | | | | | | | | | | | | | | | | |
U.S. agency securities | $ | 2 | | | | 1.96 | | % | | $ | 190 | | | | 2.01 | | % | | $ | 1,308 | | | | 2.95 | | % | | $ | 2,911 | | | | 2.39 | | % | | $ | 4,411 | | | | 2.54 | | % | | $ | 4,411 | |
Obligations of state and political subdivisions | | 5,073 | | | | 1.59 | | | | | 37,778 | | | | 1.69 | | | | | 84,955 | | | | 2.28 | | | | | 7,765 | | | | 2.52 | | | | | 135,571 | | | | 2.10 | | | | | 133,785 | |
Asset-backed securities | | - | | | | - | | | | | - | | | | - | | | | | - | | | | - | | | | | 182,620 | | | | 3.23 | | | | | 182,620 | | | | 3.23 | | | | | 182,620 | |
Collateralized loan obligations | | - | | | | - | | | | | - | | | | - | | | | | 20,033 | | | | 3.60 | | | | | 206,033 | | | | 3.46 | | | | | 226,066 | | | | 3.47 | | | | | 226,066 | |
Corporate bonds | | - | | | | - | | | | | 142,584 | | | | 3.32 | | | | | 5,010 | | | | 2.34 | | | | | - | | | | - | | | | | 147,594 | | | | 3.29 | | | | | 147,594 | |
Trust preferred securities | | - | | | | - | | | | | - | | | | - | | | | | 3,783 | | | | 4.62 | | | | | - | | | | - | | | | | 3,783 | | | | 4.62 | | | | | 3,783 | |
Subordinated debt | | - | | | | - | | | | | - | | | | - | | | | | 46,294 | | | | 4.97 | | | | | - | | | | - | | | | | 46,294 | | | | 4.97 | | | | | 46,047 | |
Mortgage-backed securities: | | | | | | | | | | | | | | | | | | | | | | | | | | | | | | | | | | | | | | | | | | | | | | | | |
Residential pass-through securities: | | | | | | | | | | | | | | | | | | | | | | | | | | | | | | | | | | | | | | | | | | | | | | | | |
Government National Mortgage Association | | - | | | | - | | | | | - | | | | - | | | | | - | | | | - | | | | | 2,553 | | | | 3.20 | | | | | 2,553 | | | | 3.20 | | | | | 2,538 | |
Federal Home Loan Mortgage Corporation | | - | | | | - | | | | | 4,115 | | | | 2.69 | | | | | 57,154 | | | | 1.94 | | | | | 51,595 | | | | 2.33 | | | | | 112,864 | | | | 2.15 | | | | | 111,915 | |
Federal National Mortgage Association | | - | | | | - | | | | | 34,421 | | | | 1.75 | | | | | 16,579 | | | | 1.69 | | | | | 136,564 | | | | 3.04 | | | | | 187,564 | | | | 2.69 | | | | | 184,542 | |
Commercial pass-through securities: | | | | | | | | | | | | | | | | | | | | | | | | | | | | | | | | | | | | | | | | | | | | | | | | |
Government National Mortgage Association | | - | | | | - | | | | | - | | | | - | | | | | - | | | | - | | | | | 32,149 | | | | 3.40 | | | | | 32,149 | | | | 3.40 | | | | | 31,944 | |
Federal National Mortgage Association | | - | | | | - | | | | | 149,811 | | | | 2.53 | | | | | 2,357 | | | | 3.08 | | | | | - | | | | - | | | | | 152,168 | | | | 2.54 | | | | | 149,503 | |
Collateralized mortgage obligations: | | | | | | | | | | | | | | | | | | | | | | | | | | | | | | | | | | | | | | | | | | | | | | | | |
Government National Mortgage Association | | - | | | | - | | | | | - | | | | - | | | | | 1,753 | | | | 1.67 | | | | | 19,292 | | | | 2.68 | | | | | 21,045 | | | | 2.60 | | | | | 20,374 | |
Federal Home Loan Mortgage Corporation | | - | | | | - | | | | | - | | | | - | | | | | 11,563 | | | | 1.53 | | | | | 7,685 | | | | 2.21 | | | | | 19,248 | | | | 1.80 | | | | | 18,745 | |
Federal National Mortgage Association | | - | | | | - | | | | | - | | | | - | | | | | 52 | | | | 1.99 | | | | | 40,818 | | | | 2.71 | | | | | 40,870 | | | | 2.71 | | | | | 40,702 | |
Non-agency securities | | - | | | | - | | | | | - | | | | - | | | | | - | | | | - | | | | | 15 | | | | 3.95 | | | | | 15 | | | | 3.95 | | | | | 15 | |
Total securities | $ | 5,075 | | | | 1.59 | | % | | $ | 368,899 | | | | 2.68 | | % | | $ | 250,841 | | | | 2.77 | | % | | $ | 690,000 | | | | 3.13 | | % | | $ | 1,314,815 | | | | 2.93 | | % | | $ | 1,304,584 | |
| | | | | | | | | | | | | | | | | | | | | | | | | | | | | | | | | | | | | | | | | | | | | | | | |
27
Sources of Funds
General. Retail deposits are our primary source of funds for lending and other investment purposes. In addition, we derive funds from loan and mortgage‑backed securities principal repayments and proceeds from the maturities and calls of non-mortgage-backed securities. Loan and securities payments are a relatively stable source of funds, while deposit inflows are significantly influenced by general interest rates and money market conditions. Wholesale funding sources including, but not limited to, borrowings from the FHLB of New York (“FHLB”), wholesale deposits and other short term-borrowings are also used to supplement the funding for loans and investments.
Deposits. Our current deposit products include interest-bearing and non-interest-bearing checking accounts, money market deposit accounts, savings accounts and certificates of deposit accounts ranging in terms from 30 days to five years. Certificates of deposit with terms ranging from one year to five years are available for individual retirement account plans. Deposit account terms, such as interest rate earned, applicability of certain fees and service charges and funds accessibility, will vary based upon several factors including, but not limited to, minimum balance, term to maturity, and transaction frequency and form requirements.
Deposits are obtained primarily from within New Jersey and New York through Kearny Bank’s network of retail branches. Traditional methods of advertising are used to attract new customers and deposits, including radio, print media, outdoor advertising, direct mail and inserts included with customer statements. Premiums or incentives for opening accounts are sometimes offered. One of our key retail products in recent years has been “Star Banking”, which bundles a number of banking services and products together for those customers with a checking account with direct deposit and combined deposits of $20,000 or more, including Internet banking, bill pay, mobile banking, telephone banking and a 15 basis point premium on certificates of deposit with a term of at least one year. We also offer “High Yield Checking” which is primarily designed to attract core deposits in the form of customers’ primary checking accounts through interest rate and fee reimbursement incentives to qualifying customers. The comparatively higher interest expense associated with the “High Yield Checking” product in relation to our other checking products is partially offset by the transaction fee income associated with the account.
We may also offer a 15 basis point premium on certificate of deposit accounts with a term of at least one year, excluding special promotions, to certificate of deposit accountholders that have $500,000 or more on deposit with Kearny Bank. Though certificates of deposit with non-standard maturities are popular in our market, we generally promote certificates of deposit with traditional maturities, including three and six months and one, two, three, four and five years. During the term of our non-standard 17-month and 29-month certificates of deposit, we offer customers a “one-time option” to “step up” the rate paid from the original rate set on the certificate to the current rate being offered by Kearny Bank for certificates of that particular maturity.
The determination of interest rates on retail deposits is based upon a number of factors, including: (1) our need for funds based on loan demand, current maturities of deposits and other cash flow needs; (2) a current survey of a selected group of competitors’ rates for similar products; (3) our current cost of funds, yield on assets and asset/liability position; and (4) the alternate cost of funds on a wholesale basis. Interest rates are reviewed by senior management on a regular basis, with deposit product and pricing updated, as appropriate, during recurring and “ad-hoc” senior management meetings.
We also utilize “non-retail” deposits as an alternative source of wholesale funding to traditional borrowings such as FHLB advances. Such funds are generally used to manage our exposure to interest rate risk and liquidity risk in conjunction with our overall asset/liability management process. At June 30, 2018, the balance of our interest-bearing checking accounts includes a total of $210.8 million of brokered money market deposits acquired through Promontory Interfinancial Network’s (“Promontory”) Insured Network Deposits (“IND”) program, a brokered deposit network that is sourced by Promontory from large retail and institutional brokerage firms whose individual clients seek to have a portion of their investments held in interest-bearing accounts at FDIC-insured institutions. The terms of the program generally establish a reciprocal commitment for Promontory to deliver and Kearny Bank to accept such deposits for a period of no less than five years during which time total aggregate balances shall be maintained within a range of $200.0 million to $230.0 million. Such deposits are generally sourced by Promontory from large retail and institutional brokerage firms whose individual clients seek to have a portion of their investments held in interest-bearing accounts at FDIC-insured institutions.
Our Promontory IND program agreement matured and was terminated in July 2018 at which time all IND program deposits held by the Company were returned to Promontory. The funding provided by the IND program deposits at June 30, 2018 was largely replaced by FHLB advances totaling $200.0 million that were drawn concurrent with the return of the IND deposits to Promontory, as discussed in greater detail below.
We also maintain a small portfolio of brokered certificates of deposit whose balances and weighted average remaining term to maturity totaled approximately $84.3 million and 2.2 years, respectively, at June 30, 2018. In combination with the Promontory IND money market deposits noted above, Kearny Bank’s brokered deposits totaled $295.2 million, or 7.2% of deposits, at June 30, 2018.
28
We also utilize the QwickRate deposit listing service to attract “non-brokered” wholesale time deposits targeting institutional investors with an original investment horizon of up to five years. The balance of time deposits we acquired through the QwickRate listing totaled $104.3 million, or 2.6% of deposits, at June 30, 2018 with such funds having a weighted average remaining term to maturity of 1.2 years. We generally prohibit the withdrawal of our listing service deposits prior to maturity.
Additional sources of non-retail deposits including, but not limited to, deposits acquired through other listing service and brokered deposit resources may be utilized in the future as additional, alternative sources of wholesale funding.
A large percentage of our deposits are in certificates of deposit, which represented 49.5% and 44.1% of total deposits at June 30, 2018 and June 30, 2017, respectively. Our liquidity could be reduced if a significant amount of certificates of deposit maturing within a short period were not renewed. At June 30, 2018 and June 30, 2017, certificates of deposit maturing within one year were $1.12 billion and $610.8 million, respectively. Historically, a significant portion of the certificates of deposit remain with us after they mature and we believe that this will continue.
At June 30, 2018, $1.15 billion or 57.0% of our certificates of deposit were certificates of $100,000 or more compared to $730.1 million or 56.6% at June 30, 2017. The general level of market interest rates and money market conditions significantly influence deposit inflows and outflows. The effects of these factors are particularly pronounced on deposit accounts with larger balances. In particular, certificates of deposit with balances of $100,000 or greater are traditionally viewed as being a more volatile source of funding than comparatively lower balance certificates of deposit or non-maturity transaction accounts. In order to retain certificates of deposit with balances of $100,000 or more, we may have to pay a premium rate, resulting in an increase in our cost of funds. In a rising rate environment, we may be unwilling or unable to pay a competitive rate. To the extent that such deposits do not remain with us, they may need to be replaced with borrowings, which could increase our cost of funds and negatively impact our interest rate spread and our financial condition.
The following table sets forth the distribution of average deposits for the periods indicated and the weighted average nominal interest rates for each period on each category of deposits presented.
| For the Years Ended June 30, |
| 2018 | | | | 2017 | | | | 2016 |
| Average Balance | | | Percent of Total Deposits | | Weighted Average Nominal Rate | | | | Average Balance | | | Percent of Total Deposits | | Weighted Average Nominal Rate | | | | Average Balance | | | Percent of Total Deposits | | Weighted Average Nominal Rate |
| (Dollars In Thousands) |
Non-interest-bearing deposits | $ | 281,262 | | | | 8.67 | | % | | | - | | % | | $ | 249,693 | | | | 8.98 | | % | | | - | | % | | $ | 225,396 | | | | 8.73 | | % | | | - | | % |
Interest-bearing demand | | 896,695 | | | | 27.64 | | | | | 0.82 | | | | | 769,767 | | | | 27.68 | | | | | 0.66 | | | | | 722,980 | | | | 28.01 | | | | | 0.59 | | |
Savings and clubs | | 569,777 | | | | 17.56 | | | | | 0.17 | | | | | 519,506 | | | | 18.68 | | | | | 0.13 | | | | | 516,353 | | | | 20.01 | | | | | 0.16 | | |
Certificates of deposit | | 1,496,743 | | | | 46.13 | | | | | 1.42 | | | | | 1,241,958 | | | | 44.66 | | | | | 1.32 | | | | | 1,116,151 | | | | 43.25 | | | | | 1.22 | | |
| | | | | | | | | | | | | | | | | | | | | | | | | | | | | | | | | | | | | | | | | |
Total deposits | $ | 3,244,477 | | | | 100.00 | | % | | | 0.91 | | % | | $ | 2,780,924 | | | | 100.00 | | % | | | 0.80 | | % | | $ | 2,580,880 | | | | 100.00 | | % | | | 0.72 | | % |
The following table sets forth certificates of deposit classified by interest rate as of the dates indicated.
| At June 30, | |
| 2018 | | | 2017 | | | 2016 | |
| (In Thousands) | |
Interest Rate | | | | | | | | | | | |
0.00 - 0.99% | $ | 185,765 | | | $ | 327,358 | | | $ | 430,426 | |
1.00 - 1.99% | | 1,272,580 | | | | 782,920 | | | | 609,086 | |
2.00 - 2.99% | | 552,459 | | | | 174,792 | | | | 161,866 | |
3.00 - 3.99% | | 5,834 | | | | 5,882 | | | | 6,022 | |
| | | | | | | | | | | |
Total certificates of deposit | $ | 2,016,638 | | | $ | 1,290,952 | | | $ | 1,207,400 | |
29
The following table shows the amount of certificates of deposit of $100,000 or more by time remaining until maturity as of the dates indicated.
| At June 30, | |
| 2018 | | | 2017 | | | 2016 | |
| (In Thousands) | |
Maturity Period | | | | | | | | | | | |
Within three months | $ | 134,479 | | | $ | 102,373 | | | $ | 42,729 | |
Three through six months | | 115,748 | | | | 60,396 | | | | 93,936 | |
Six through twelve months | | 370,853 | | | | 163,958 | | | | 194,754 | |
Over twelve months | | 528,709 | | | | 404,182 | | | | 329,586 | |
| | | | | | | | | | | |
Total certificates of deposit | $ | 1,149,789 | | | $ | 730,909 | | | $ | 661,005 | |
The following table sets forth the amount and maturities of certificates of deposit at June 30, 2018.
| At June 30, 2018 | |
| Within One Year | | | Over One Year to Two Years | | | Over Two Years to Three Years | | | Over Three Years to Four Years | | | Over Four Years to Five Years | | | Over Five Years | | | Total | |
| (In Thousands) | |
Interest Rate | | | | | | | | | | | | | | | | | | | | | | | | | | | |
0.00 - 0.99% | $ | 172,494 | | | $ | 12,055 | | | $ | 1,216 | | | $ | - | | | $ | - | | | $ | - | | | $ | 185,765 | |
1.00 - 1.99% | | 788,781 | | | | 330,938 | | | | 65,470 | | | | 70,178 | | | | 5,568 | | | | 11,645 | | | | 1,272,580 | |
2.00 - 2.99% | | 162,702 | | | | 150,173 | | | | 132,603 | | | | 31,098 | | | | 75,787 | | | | 96 | | | | 552,459 | |
3.00 - 3.99% | | - | | | | - | | | | - | | | | - | | | | - | | | | 5,834 | | | | 5,834 | |
| | | | | | | | | | | | | | | | | | | | | | | | | | | |
Total certificates of deposit | $ | 1,123,977 | | | $ | 493,166 | | | $ | 199,289 | | | $ | 101,276 | | | $ | 81,355 | | | $ | 17,575 | | | $ | 2,016,638 | |
Borrowings. The sources of wholesale funding we utilize include borrowings in the form of advances from the FHLB as well as other forms of borrowings. We generally use wholesale funding to manage our exposure to interest rate risk and liquidity risk in conjunction with our overall asset/liability management process. Toward that end, FHLB advances are primarily utilized to extend the effective duration of funding to partially offset the interest rate risk presented by our investment in longer-term fixed-rate loans and mortgage-backed securities. Extending the effective duration of funding may be achieved by simply utilizing fixed-rate borrowings with longer terms to maturity. Alternately, we may utilize derivatives such as interest rate swaps and caps in conjunction with either short-term fixed-rate or floating-rate borrowings to extend the effective duration of those funding sources.
Advances from the FHLB are typically secured by our FHLB capital stock and certain investment securities as well as residential and multi-family mortgage loans that we choose to utilize as collateral for such borrowings. Additional information regarding our FHLB advances is included under Note 12 to the audited consolidated financial statements.
Short‑term FHLB advances generally have original maturities of less than one year and may also include overnight borrowings which Kearny Bank may utilize to address short term funding needs, where applicable. At June 30, 2018, we had a total $625.0 million of short-term FHLB advances at a weighted average interest rate of 2.22%. Such advances represented 90-day FHLB term advances that are generally forecasted to be periodically redrawn at maturity for the same term as the original advance. Based on this presumption, we utilized interest rate swaps to effectively extend the duration of each of these advances at the time they were drawn to effectively fix their cost for periods of approximately four to five years. Our balance of short-term FHLB advances at June 30, 2018 included no overnight borrowings drawn for daily liquidity management purposes.
Long-term advances generally include term advances with original maturities of greater than one year. At June 30, 2018, our outstanding balance of long-term FHLB advances totaled $551.8 million at a weighted average interest rate of 2.28%. Such advances included $145.0 million of callable advances at a weighted average interest rate of 3.04%, $406.4 million non-callable, term advances at a weighted average interest rate of 2.01% and an amortizing advance of $360,000 at an interest rate of 4.94%.
30
Our FHLB advances mature as follows:
| At June 30, | |
| 2018 | | | 2017 | | | 2016 | |
| (In Thousands) | |
Maturing in Years Ending June 30, | | | | | | | | | | | |
2017 | $ | - | | | $ | - | | | $ | 428,000 | |
2018 | | - | | | | 630,225 | | | | 5,225 | |
2019 | | 741,000 | | | | | | | | | |
2020 | | 48,400 | | | | - | | | | | |
2021 | | 64,160 | | | | 469 | | | | 572 | |
2022 | | 35,700 | | | | - | | | | - | |
2023 | | 155,000 | | | | 145,000 | | | | 145,000 | |
2024 | | 22,500 | | | | - | | | | - | |
2025 | | 103,500 | | | | - | | | | - | |
2026 | | 6,500 | | | | - | | | | - | |
Total advances | | 1,176,760 | | | | 775,694 | | | | 578,797 | |
Fair value adjustments | | (6,616 | ) | | | 2 | | | | (9 | ) |
Total advances, net of fair value adjustments | $ | 1,170,144 | | | $ | 775,696 | | | $ | 578,788 | |
Based upon the market value of investment securities and mortgage loans that are posted as collateral for FHLB advances at June 30, 2018, we are eligible to borrow up to an additional $1.2 billion of advances from the FHLB as of that date. We are further authorized to post additional collateral in the form of other unencumbered investments securities and eligible mortgage loans that may expand our borrowing capacity with the FHLB up to 30% of our total assets. Additional borrowing capacity up to 50% of our total assets may be authorized with the approval of the FHLB’s Board of Directors or Executive Committee.
The balance of borrowings at June 30, 2018 also included overnight borrowings in the form of depositor sweep accounts totaling $28.5 million. Depositor sweep accounts are short-term borrowings representing funds that are withdrawn from a customer’s non-interest bearing deposit account and invested in an uninsured overnight investment account that is collateralized by specified investment securities owned by Kearny Bank.
Interest Rate Derivatives and Hedging
We utilize derivative instruments in the form of interest rate swaps and caps to hedge our exposure to interest rate risk in conjunction with our overall asset/liability management process. In accordance with accounting requirements, we formally designate all of our hedging relationships as either fair value hedges, intended to offset the changes in the value of certain financial instruments due to movements in interest rates, or cash flow hedges, intended to offset changes in the cash flows of certain financial instruments due to movement in interest rates, and documents the strategy for undertaking the hedge transactions and its method of assessing ongoing effectiveness.
At June 30, 2018, our derivative instruments are comprised entirely of interest rate swaps and caps with total notional amounts of $700 million, $375.0 million and $150.0 million respectively, with Wells Fargo Bank, N.A., Bank of Montreal and PNC Bank, serving as the counterparties to the transactions. These instruments are intended to manage the interest rate exposure relating to certain wholesale funding positions that were outstanding at June 30, 2018.
Additional information regarding our use of interest rate derivatives and our hedging activities is presented in Note 1 and Note 13 to the audited consolidated financial statements.
Subsidiary Activity
At June 30, 2018, Kearny Bank was the only wholly-owned operating subsidiary of Kearny Financial Corp. As of that date, Kearny Bank had two wholly-owned subsidiaries: KFS Financial Services, Inc. and CJB Investment Corp.
KFS Financial Services, Inc. is a service corporation subsidiary originally organized for selling insurance products to Kearny Bank customers and the general public through a third party networking arrangement. KFS Financial Services, Inc. has one wholly-owned subsidiary named, KFS Insurance Services, Inc., that was created for the primary purpose of acquiring insurance agencies. Both KFS Financial Services Inc. and KFS Insurance Services, Inc. were considered inactive through the three-year period ended June 30, 2018.
31
CJB Investment Corp. is a New Jersey Investment Company and remained active through the three-year period ended June 30, 2018.
Personnel
As of June 30, 2018, we had 520 full‑time employees and 45 part‑time employees equating to a total of 543 full time equivalent (“FTE”) employees. By comparison, at June 30, 2017, we had 430 full-time employees and 36 part-time employees equating to a total of 448 FTEs.
REGULATION
General
Kearny Bank and Kearny Financial operate in a highly regulated industry. This regulation establishes a comprehensive framework of activities in which a savings and loan holding company and New Jersey savings bank may engage and is intended primarily for the protection of the deposit insurance fund and depositors. Set forth below is a brief description of certain laws that relate to the regulation of Kearny Bank and Kearny Financial. The description does not purport to be complete and is qualified in its entirety by reference to applicable laws and regulations.
Regulatory authorities have extensive discretion in connection with their supervisory and enforcement activities, including the imposition of restrictions on the operation of an institution and its holding company, the classification of assets by the institution and the adequacy of an institution’s allowance for loan losses. Any change in such regulation and oversight, whether in the form of regulatory policy, regulations, or legislation, including changes in the regulations governing savings and loan holding companies, could have a material adverse impact on Kearny Financial, Kearny Bank and their operations. The adoption of regulations or the enactment of laws that restrict the operations of Kearny Bank and/or Kearny Financial or impose burdensome requirements upon one or both of them could reduce their profitability and could impair the value of Kearny Bank’s franchise, resulting in negative effects on the trading price of our common stock.
Regulation of Kearny Bank
Kearny Bank was formerly a federal savings bank. On June 29, 2017, it converted its charter to that of a nonmember New Jersey savings bank regulated by the NJDBI and the FDIC.
General. As a nonmember New Jersey savings bank with deposits insured by the FDIC, Kearny Bank is subject to extensive regulation. The regulatory structure gives the agencies authority’s extensive discretion in connection with their supervisory and enforcement activities and examination policies, including policies regarding the classification of assets and the level of the allowance for loan losses. The activities of New Jersey savings banks are subject to extensive regulation including restrictions or requirements with respect to loans to one borrower, dividends, permissible investments and lending activities, liquidity, transactions with affiliates and community reinvestment. New Jersey savings banks are also subject to reserve requirements imposed by the Federal Reserve Board. Both state and federal law regulate a savings bank’s relationship with its depositors and borrowers, especially in such matters as the ownership of savings accounts and the form and content of Kearny Bank’s mortgage documents.
Kearny Bank must file reports with the NJDBI and FDIC concerning its activities and financial condition and obtain regulatory approvals prior to entering into certain transactions such as mergers with or acquisitions of other financial institutions. The NJDBI and FDIC regularly examine Kearny Bank and prepare reports to Kearny Bank’s Board of Directors on deficiencies, if any, found in its operations. The agencies have substantial discretion to take enforcement action with respect to an institution that fails to comply with applicable regulatory requirements or engages in violations of law or unsafe and unsound practices. Such actions can include, among others, the issuance of a cease and desist order, assessment of civil money penalties, removal of officers and directors and the appointment of a receiver or conservator.
Activities and Powers. Kearny Bank derives its lending, investment and other powers primarily from the applicable provisions of the New Jersey Banking Act and the related regulations. Under these laws and regulations, New Jersey savings banks, including Kearny Bank, generally may invest in real estate mortgages; consumer and commercial loans; specific types of debt securities, including certain corporate debt securities and obligations of federal, state and local governments and agencies; certain types of corporate equity securities and certain other assets.
A savings bank may also invest pursuant to a “leeway” power that permits investments not otherwise permitted by the New Jersey Banking Act. “Leeway” investments must comply with a number of limitations on the individual and aggregate amounts of “leeway” investments. New Jersey savings banks may also exercise those powers, rights, benefits or privileges authorized for national banks, federal savings banks or federal savings associations, or their subsidiaries. New Jersey savings banks may exercise powers,
32
rights, benefits and privileges of out-of-state banks, savings banks and savings associations, or their subsidiaries, provided that prior approval by the NJDBI is required before exercising any such power, right, benefit or privilege. The exercise of these lending, investment and activity powers is further limited by federal law and the related regulations. See “—Activity Restrictions on State-Chartered Banks” below.
Activity Restrictions on State-Chartered Banks. Federal law and FDIC regulations generally limit the activities as principal and equity investments of state-chartered FDIC insured banks and their subsidiaries to those permissible for national banks and their subsidiaries, unless such activities and investments are specifically exempted by law or approved by the FDIC.
Before engaging as principal in a new activity that is not permissible for a national bank or otherwise permissible under federal law or FDIC regulations, an insured bank must seek approval from the FDIC, subject to certain specified exceptions. The FDIC will not approve the activity unless the bank meets its minimum capital requirements and the FDIC determines that the activity does not present a significant risk to the FDIC’s Deposit Insurance Fund. Certain activities of subsidiaries that are engaged in activities permitted for national banks only through a “financial subsidiary” are subject to additional restrictions. Equity investments by state banks are generally limited to those permissible for national banks subject to certain exceptions.
Federal Deposit Insurance. Kearny Bank’s deposits are insured to applicable limits by the FDIC. The maximum deposit insurance amount is $250,000.
The FDIC assesses insured depository institutions to maintain the Deposit Insurance Fund. Under the FDIC’s risk-based assessment system, institutions deemed less risky pay lower assessments. Assessments for institutions of less than $10 billion of assets, such as Kearny Bank, are now based on financial measures and supervisory ratings derived from statistical modeling estimating the probability of failure of an institution’s failure within three years. That system, effective July 1, 2016, replaced the previous system under which institutions were placed into risk categories.
Federal legislation required the FDIC to revise its procedures to base assessments upon each insured institution’s total assets less tangible equity instead of deposits. The FDIC finalized a rule, effective April 1, 2011, that set the assessment range at 2.5 to 45 basis points of total assets less tangible equity. In conjunction with the Deposit Insurance Fund’s reserve ratio achieving 1.15%, the assessment range was reduced for insured institutions of less than $10 billion of total assets to 1.5 basis points to 30 basis points, effective July 1, 2016.
Federal legislation increased the minimum target Deposit Insurance Fund ratio from 1.15% of estimated insured deposits to 1.35% of estimated insured deposits. The FDIC must seek to achieve the 1.35% ratio by September 30, 2020. The law requires insured institutions with assets of $10 billion or more to fund the increase from 1.15% to 1.35% and, effective July 1, 2016, such institutions are subject to a surcharge to achieve that goal. The legislation eliminated the 1.5% maximum fund ratio, instead leaving it to the discretion of the FDIC, and the FDIC has exercised that discretion by establishing a long-range fund ratio of 2.0%.
In addition to the FDIC assessments, the Financing Corporation (“FICO”) is authorized to impose and collect assessments for anticipated payments, issuance costs and custodial fees on bonds issued by the FICO in the 1980s to recapitalize the former Federal Savings and Loan Insurance Corporation. The bonds issued by the FICO are due to mature by 2019. For the quarter ended June 30, 2018, the annualized FICO assessment was equal to 0.44 basis point of total assets less tangible capital.
The FDIC has authority to increase insurance assessments. Any significant increases would have an adverse effect on the operating expenses and results of operations of Kearny Bank. Management cannot predict what assessment rates will be in the future.
Insurance of deposits may be terminated by the FDIC upon a finding that an institution has engaged in unsafe or unsound practices, is in an unsafe or unsound condition to continue operations or has violated any applicable law, regulation, rule, order or condition imposed by the FDIC. We do not currently know of any practice, condition or violation that may lead to termination of our deposit insurance.
Regulatory Capital Requirements. FDIC regulations require nonmember banks to meet several minimum capital standards: a common equity Tier 1 capital to risk-based assets ratio of 4.5%, a Tier 1 capital to risk-based assets ratio of 6.0%, a total capital to risk-based assets of 8%, and a 4% Tier 1 capital to total assets leverage ratio. The present capital requirements were effective January 1, 2015 and represent increased standards over the previous requirements. The current requirements implement recommendations of the Basel Committee on Banking Supervision and certain requirements of federal law.
The capital standards require the maintenance of common equity Tier 1 capital, Tier 1 capital and total capital to risk-weighted assets of at least 4.5%, 6% and 8%, respectively, and a leverage ratio of at least 4% Tier 1 capital. Common equity Tier 1 capital is generally defined as common stockholders’ equity and retained earnings. Tier 1 capital is generally defined as common equity Tier 1
33
and additional Tier 1 capital. Additional Tier 1 capital includes certain noncumulative perpetual preferred stock and related surplus and minority interests in equity accounts of consolidated subsidiaries. Total capital includes Tier 1 capital (common equity Tier 1 capital plus additional Tier 1 capital) and Tier 2 capital. Tier 2 capital is comprised of capital instruments and related surplus, meeting specified requirements, and may include cumulative preferred stock and long-term perpetual preferred stock, mandatory convertible securities, intermediate preferred stock and subordinated debt. Also included in Tier 2 capital is the allowance for loan and lease losses limited to a maximum of 1.25% of risk-weighted assets and, for institutions that have exercised an opt-out election regarding the treatment of Accumulated Other Comprehensive Income, up to 45% of net unrealized gains on available-for-sale equity securities with readily determinable fair market values. Calculation of all types of regulatory capital is subject to deductions and adjustments specified in the regulations.
In determining the amount of risk-weighted assets for purposes of calculating risk-based capital ratios, all assets, including certain off-balance sheet assets (e.g., recourse obligations, direct credit substitutes, residual interests) are multiplied by a risk weight factor assigned by the regulations based on the risks believed inherent in the type of asset. Higher levels of capital are required for asset categories believed to present greater risk. For example, a risk weight of 0% is assigned to cash and U.S. government securities, a risk weight of 50% is generally assigned to prudently underwritten first lien one- to four-family residential mortgages, a risk weight of 100% is assigned to commercial and consumer loans, a risk weight of 150% is assigned to certain past due loans and a risk weight of between 0% to 600% is assigned to equity interests depending on certain specified factors.
In addition to establishing the minimum regulatory capital requirements, the regulations limit capital distributions and certain discretionary bonus payments to management if the institution does not hold a “capital conservation buffer” consisting of 2.5% of common equity Tier 1 capital to risk-weighted assets above the amount necessary to meet its minimum risk-based capital requirements. The capital conservation buffer requirement is being phased in beginning January 1, 2016 at 0.625% of risk-weighted assets and increasing each year until fully implemented at 2.5% on January 1, 2019. The capital conservation buffer effective for calendar 2018 is 1.25%.
In assessing an institution’s capital adequacy, the FDIC takes into consideration, not only these numeric factors, but qualitative factors as well, and has the authority to establish higher capital requirements for individual institutions where deemed necessary. The Economic Growth, Regulatory Relief, and Consumer Protection Act enacted in May 2018 requires the federal banking agencies, including the FDIC, to establish for banks with assets of less than $10 billion of assets a “community bank leverage ratio” (the ratio of a bank’s tangible equity capital to average total consolidated assets) of 8 to 10%. A “qualifying community bank” with capital meeting the specified requirement will be considered to meet all applicable regulatory capital requirements including the risk-based requirements. The federal banking agencies may consider a financial institution’s risk profile when evaluating whether it qualifies as a community bank for purposes of the capital ratio requirement. A financial institution can elect to be subject to this new definition. The establishment of the community bank leverage ratio is subject to notice and comment rulemaking by the federal regulators.
Prompt Corrective Regulatory Action. Federal law requires that federal bank regulatory authorities take “prompt corrective action” with respect to institutions that do not meet minimum capital requirements. For these purposes, the law establishes five capital categories: well capitalized, adequately capitalized, undercapitalized, significantly undercapitalized and critically undercapitalized.
The FDIC has adopted regulations to implement the prompt corrective action legislation. The regulations were amended to incorporate the previously mentioned increased regulatory capital standards that were effective January 1, 2015. An institution is deemed to be “well capitalized” if it has a total risk-based capital ratio of 10.0% or greater, a Tier 1 risk-based capital ratio of 8.0% or greater, a leverage ratio of 5.0% or greater and a common equity Tier 1 ratio of 6.5% or greater. An institution is “adequately capitalized” if it has a total risk-based capital ratio of 8.0% or greater, a Tier 1 risk-based capital ratio of 6.0% or greater, a leverage ratio of 4.0% or greater and a common equity Tier 1 ratio of 4.5% or greater. An institution is “undercapitalized” if it has a total risk-based capital ratio of less than 8.0%, a Tier 1 risk-based capital ratio of less than 6.0%, a leverage ratio of less than 4.0% or a common equity Tier 1 ratio of less than 4.5%. An institution is deemed to be “significantly undercapitalized” if it has a total risk-based capital ratio of less than 6.0%, a Tier 1 risk-based capital ratio of less than 4.0%, a leverage ratio of less than 3.0% or a common equity Tier 1 ratio of less than 3.0%. An institution is considered to be “critically undercapitalized” if it has a ratio of tangible equity (as defined in the regulations) to total assets that is equal to or less than 2.0%. The previously referenced 2018 legislation states that banks which comply with the “community bank leverage ratio” (when established by the regulatory agencies) will be considered “well-capitalized” under the prompt corrective action regulations.
“Undercapitalized” banks must adhere to growth, capital distribution (including dividend) and other limitations and are required to submit a capital restoration plan. A bank’s compliance with such a plan must be guaranteed by any company that controls the undercapitalized institution in an amount equal to the lesser of 5% of the institution’s total assets when deemed undercapitalized or the amount necessary to achieve the status of adequately capitalized. If an “undercapitalized” bank fails to submit an acceptable plan, it is treated as if it is “significantly undercapitalized.” “Significantly undercapitalized” banks must comply with one or more of a number of additional measures, including, but not limited to, a required sale of sufficient voting stock to become adequately capitalized, a requirement to reduce total assets, cessation of taking deposits from correspondent banks, the dismissal of directors or officers and
34
restrictions on interest rates paid on deposits, compensation of executive officers and capital distributions by the parent holding company. “Critically undercapitalized” institutions are subject to additional measures including, subject to a narrow exception, the appointment of a receiver or conservator within 270 days after it obtains such status. These actions are in addition to other discretionary supervisory or enforcement actions that the FDIC may take.
Dividend Limitations. Federal regulations impose various restrictions or requirements on Kearny Bank to pay dividends to Kearny Financial. An institution that is a subsidiary of a savings and loan holding company, such as Kearny Bank, must file notice with the Federal Reserve Board at least thirty days before paying a dividend. The Federal Reserve Board may disapprove a notice if: (i) the savings institution would be undercapitalized following the capital distribution; (ii) the proposed capital distribution raises safety and soundness concerns; or (iii) the capital distribution would violate a prohibition contained in any statute, regulation, enforcement action or agreement or condition imposed in connection with an application.
New Jersey law specifies that no dividend may be paid if the dividend would impair the capital stock of the savings bank. In addition, no dividend may be paid unless the savings bank would, after payment of the dividend, have a surplus of at least 50% of its capital stock (or if the payment of dividend would not reduce surplus).
Transactions with Related Parties. Transactions between a savings institution (and, generally, its subsidiaries) and its related parties or affiliates are limited by Sections 23A and 23B of the Federal Reserve Act. An affiliate of an institution is any company or entity that controls, is controlled by or is under common control with the institution. In a holding company context, the parent holding company and any companies which are controlled by such parent holding company are affiliates of the institution. Generally, Section 23A of the Federal Reserve Act limits the extent to which the institution or its subsidiaries may engage in “covered transactions” with any one affiliate to 10% of such institution’s capital stock and surplus and contain an aggregate limit on all such transactions with all affiliates to an amount equal to 20% of such institution’s capital stock and surplus. The term “covered transaction” includes an extension of credit, purchase of assets, issuance of a guarantee or letter of credit and similar transactions. In addition, loans or other extensions of credit by the institution to the affiliate are required to be collateralized in accordance with specified requirements. The law also requires that affiliate transactions be on terms and conditions that are substantially the same, or at least as favorable to the institution, as those provided to non-affiliates.
Kearny Bank’s authority to extend credit to its directors, executive officers and 10% stockholders, as well as to entities controlled by such persons, is currently governed by the requirements of Sections 22(g) and 22(h) of the Federal Reserve Act and Regulation O of the Federal Reserve Board. Among other things and subject to certain exceptions, these provisions generally require that extensions of credit to insiders:
| • | be made on terms that are substantially the same as, and follow credit underwriting procedures that are not less stringent than, those prevailing for comparable transactions with unaffiliated persons and that do not involve more than the normal risk of repayment or present other unfavorable features; and |
| • | not to exceed certain limitations on the amount of credit extended to such persons, individually and in the aggregate, which limits are based, in part, on the amount of Kearny Bank’s capital. |
In addition, extensions of credit in excess of certain limits must be approved by Kearny Bank’s Board of Directors. Extensions of credit to executive officers are subject to additional limits based on the type of extension involved.
Community Reinvestment Act. Under the Community Reinvestment Act (the “CRA”), every insured depository institution, including Kearny Bank, has a continuing and affirmative obligation consistent with its safe and sound operation to help meet the credit needs of its entire community, including low and moderate income neighborhoods. The CRA does not establish specific lending requirements or programs for financial institutions nor does it limit an institution’s discretion to develop the types of products and services that it believes are best suited to its particular community. The CRA requires the FDIC to assess the depository institution’s record of meeting the credit needs of its community and to consider such record in its evaluation of certain applications by such institution, such as a merger or the establishment of a branch office by Kearny Bank. The FDIC may use an unsatisfactory CRA examination rating as the basis for the denial of an application. Kearny Bank received a “satisfactory” CRA rating from its then primary federal regulator, the Office of the Comptroller of the Currency, in its most recent CRA examination.
Federal Home Loan Bank System. Kearny Bank is a member of the FHLB of New York, which is one of eleven regional Federal Home Loan Banks. Each FHLB serves as a reserve or central bank for its members within its assigned region. It is funded primarily from funds deposited by financial institutions and proceeds derived from the sale of consolidated obligations of the FHLB System. It makes loans to members pursuant to policies and procedures established by the Board of Directors of the FHLB.
35
As a member, Kearny Bank is required to purchase and maintain stock in the FHLB of New York in specified amounts. The FHLB imposes various limitations on advances such as limiting the amount of certain types of real estate related collateral and limiting total advances to a member.
The FHLB of New York may pay periodic dividends to members. These dividends are affected by factors such as the FHLB’s operating results and statutory responsibilities that may be imposed such as providing certain funding for affordable housing and interest subsidies on advances targeted for low- and moderate-income housing projects. The payment of such dividends or any particular amount cannot be assumed.
Other Laws and Regulations
Interest and other charges collected or contracted for by Kearny Bank are subject to state usury laws and federal laws concerning interest rates. Kearny Bank’s operations are also subject to federal laws (and their implementing regulations) applicable to credit transactions, such as the:
| • | Truth-In-Lending Act, governing disclosures of credit terms to consumer borrowers; |
| • | Real Estate Settlement Procedures Act, requiring that borrowers for mortgage loans for one- to four-family residential real estate receive various disclosures, including good faith estimates of settlement costs, lender servicing and escrow account practices, and prohibiting certain practices that increase the cost of settlement services; |
| • | Home Mortgage Disclosure Act, requiring financial institutions to provide information to enable the public and public officials to determine whether a financial institution is fulfilling its obligation to help meet the housing needs of the community it serves; |
| • | Equal Credit Opportunity Act, prohibiting discrimination on the basis of race, creed or other prohibited factors in extending credit; |
| • | Fair Credit Reporting Act, governing the use and provision of information to credit reporting agencies; |
| • | Fair Debt Collection Act, governing the manner in which consumer debts may be collected by collection agencies; and |
| • | Truth in Savings Act, prescribing disclosure and advertising requirements with respect to deposit accounts. |
The operations of Kearny Bank also are subject to the:
| • | Right to Financial Privacy Act, which imposes a duty to maintain confidentiality of consumer financial records and prescribes procedures for complying with administrative subpoenas of financial records; |
| • | Electronic Funds Transfer Act and Regulation E promulgated thereunder, governing automatic deposits to and withdrawals from deposit accounts and customers’ rights and liabilities arising from the use of automated teller machines and other electronic banking services; |
| • | Check Clearing for the 21st Century Act (also known as “Check 21”), which gives “substitute checks,” such as digital check images and copies made from that image, the same legal standing as the original paper check; |
| • | USA PATRIOT Act, which requires institutions operating to, among other things, establish broadened anti-money laundering compliance programs, due diligence policies and controls to ensure the detection and reporting of money laundering. Such required compliance programs are intended to supplement existing compliance requirements, also applicable to financial institutions, under the Bank Secrecy Act and the Office of Foreign Assets Control regulations; and |
| • | Gramm-Leach-Bliley Act, which places limitations on the sharing of consumer financial information by financial institutions with unaffiliated third parties. Specifically, the Gramm-Leach-Bliley Act requires all financial institutions offering financial products or services to retail customers to provide such customers with the financial institution’s privacy policy and provide such customers the opportunity to “opt out” of the sharing of certain personal financial information with unaffiliated third parties. |
Regulation of Kearny Financial
General. Kearny Financial is a savings and loan holding company within the meaning of federal law. Kearny Financial maintained its savings and loan holding company status (rather than becoming a bank holding company), notwithstanding the conversion of Kearny Bank to a New Jersey savings bank charter, by exercising an election available to it under federal law. Kearny Bank is required to file reports with, and is subject to regulation and examination by, the Federal Reserve Board. Kearny Financial must also obtain regulatory approval from the Federal Reserve Board before engaging in certain transactions, such as mergers with or
36
acquisitions of other financial institutions. In addition, the Federal Reserve Board has enforcement authority over Kearny Financial and any non-depository subsidiaries. This permits the Federal Reserve Board to restrict or prohibit activities that are determined to pose a serious risk to Kearny Bank. This regulation is intended primarily for the protection of the depositors and not for the benefit of stockholders of Kearny Financial.
The Federal Reserve Board has indicated that, to the greatest extent possible taking into account any unique characteristics of savings and loan holding companies and the requirements of federal law, its approach is to apply to savings and loan holding companies its supervisory approach to the supervision of bank holding companies. The stated objective of the Federal Reserve Board is to ensure the savings and loan holding company and its non-depository subsidiaries are effectively supervised, can serve as a source of strength for, and do not threaten the safety and soundness of, the subsidiary depository institutions.
Nonbanking Activities. As a savings and loan holding company, Kearny Financial Bancorp is permitted to engage in those activities permissible for financial holding companies (if certain criteria are met and an election is submitted) and for multiple savings and loan holding companies. A financial holding company may engage in activities that are financial in nature, including underwriting equity securities and insurance, as well as activities that are incidental to financial activities or complementary to a financial activity. A multiple savings and loan holding company is generally limited to activities permissible for bank holding companies under Section 4(c)(8) of the Bank Holding Company Act and certain additional activities authorized by federal regulations, subject to the approval of the Federal Reserve Board.
Mergers and Acquisitions. Kearny Financial must obtain approval from the Federal Reserve Board before acquiring, directly or indirectly, more than 5% of the voting stock of another savings institution or savings and loan holding company or acquiring such an institution or holding company by merger, consolidation, or purchase of its assets. Federal law also prohibits a savings and loan holding company from acquiring more than 5% of a company engaged in activities other than those authorized for savings and loan holding companies by federal law or acquiring or retaining control of a depository institution that is not insured by the FDIC. In evaluating an application for Kearny Financial to acquire control of a savings institution, the Federal Reserve Board considers factors such as the financial and managerial resources and future prospects of Kearny Financial and the target institution, the effect of the acquisition on the risk to the deposit insurance fund, the convenience and the needs of the community and competitive factors.
Consolidated Capital Requirements. Savings and loan holding companies have historically not been subjected to consolidated regulatory capital requirements. Federal legislation, however, required the Federal Reserve Board to promulgate consolidated capital requirements for bank and savings and loan holding companies that are no less stringent, both quantitatively and in terms of components of capital, than those applicable to their subsidiary depository institutions. Instruments such as cumulative preferred stock and trust-preferred securities, which were previously includable as Tier 1 capital (within limit) by bank holding companies are no longer includable as Tier 1 capital, subject to certain grandfathering. The previously discussed final rule regarding regulatory capital requirements implemented the legislative directives as to holding company capital requirements. Consolidated regulatory capital requirements identical to those applicable to the subsidiary depository institutions applied to savings and loan holding companies as of January 1, 2015. As is the case with institutions themselves, the capital conservation buffer is being phased in between 2016 and 2019.
Source of Strength Doctrine; Dividends. Federal law extended the “source of strength” doctrine, which has long applied to bank holding companies, to savings and loan holding companies. The Federal Reserve Board has promulgated regulations implementing the “source of strength” policy, which requires holding companies to act as a source of strength to their subsidiary depository institutions by providing capital, liquidity and other support in times of financial distress. Further, the Federal Reserve Board has issued a policy statement regarding the payment of dividends by bank holding companies that it has also applied to savings and loan holding companies. In general, the policy provides that dividends should be paid only out of current earnings and only if the prospective rate of earnings retention by the holding company appears consistent with the organization’s capital needs, asset quality and overall financial condition. Regulatory guidance provides for prior consultation with Federal Reserve supervisory staff as to dividends in certain circumstances such as where net income for the past four quarters, net of dividends previously paid over that period, is insufficient to fully fund the dividend or the overall rate of earnings retention is inconsistent with capital needs and overall financial condition. The ability of a holding company to pay dividends may be restricted if a subsidiary depository institution becomes undercapitalized. In addition, a subsidiary institution of a savings and loan holding company must file prior notice with the Federal Reserve Board, and receive its non-objection, before paying dividends to the parent savings and loan holding company. Federal Reserve Board guidance also provides for regulatory review of certain stock redemption and repurchase proposals by holding companies. These regulatory policies could affect the ability of Kearny Financial to pay dividends, engage in stock redemptions or repurchases or otherwise engage in capital distributions.
Qualified Thrift Lender Test. In order for Kearny Financial to be regulated by the Federal Reserve Board as a savings and loan holding company (rather than as a bank holding company), Kearny Bank must remain a “qualified thrift lender” under applicable law or satisfy the “domestic building and loan association” test under the Internal Revenue Code. Under the qualified thrift lender test, an institution is required to maintain at least 65% of its “portfolio assets” (total assets less: (i) specified liquid assets up to 20% of total
37
assets; (ii) intangible assets, including goodwill; and (iii) the value of property used to conduct business) in certain “qualified thrift investments” (primarily residential mortgages and related investments, including certain mortgage-backed and related securities) in at least nine months out of each 12 month period.
Acquisition of Control. Under the federal Change in Bank Control Act, a notice must be submitted to the Federal Reserve Board if any person (including a company), or group acting in concert, seeks to acquire “control” of a savings and loan holding company. An acquisition of “control” can occur upon the acquisition of 10% or more of the voting stock of a savings and loan holding company or as otherwise defined by the Federal Reserve Board. Under the Change in Bank Control Act, the Federal Reserve Board has 60 days from the filing of a complete notice to act, taking into consideration certain factors, including the financial and managerial resources of the acquirer and the anti‑trust effects of the acquisition. Any company that so acquires control is then subject to regulation as a savings and loan holding company.
Item 1A. Risk Factors
An investment in our securities is subject to risks inherent in our business and the industry in which we operate. Before making an investment decision, you should carefully consider the risks and uncertainties described below and all other information included in this Annual Report on Form 10-K. The risks described below may adversely affect our business, financial condition and operating results. In addition to these risks and any other risks or uncertainties described in “Item 1. Business—Forward-Looking Statements” and “Item 7. Management’s Discussion and Analysis of Financial Condition and Results of Operations,” there may be additional risks and uncertainties that are not currently known to us or that we currently deem to be immaterial that could materially and adversely affect our business, financial condition or operating results. The value or market price of our securities could decline due to any of these identified or other risks. Past financial performance may not be a reliable indicator of future performance, and historical trends should not be used to anticipate results or trends in future periods.
Changes in interest rates may adversely affect our profitability and financial condition.
We derive our income mainly from the difference or “spread” between the interest earned on loans, securities and other interest-earning assets and interest paid on deposits, borrowings and other interest-bearing liabilities. In general, the larger the spread, the more we earn. When market rates of interest change, the interest we receive on our assets and the interest we pay on our liabilities will fluctuate. This can cause decreases in our spread and can adversely affect our income. From an interest rate risk perspective, we have generally been liability sensitive, which indicates that liabilities generally re-price faster than assets.
In response to improving economic conditions, the Federal Reserve Board’s Open Market Committee has slowly increased its federal funds rate target from a range of 0.00% - 0.25% that was in effect for several years to the current target range of 1.75% - 2.00% that was in effect at June 30, 2018. Given our liability sensitivity, our net interest rate spread and net interest margin are at risk of being reduced due to potential increases in our cost of funds that may outpace any increases in our yield on interest-earning assets.
Interest rates also affect how much money we lend. For example, when interest rates rise, the cost of borrowing increases and loan originations tend to decrease. In addition, changes in interest rates can affect the average life of loans and securities. For example, a reduction in interest rates generally results in increased prepayments of loans and mortgage-backed securities, as borrowers refinance their debt in order to reduce their borrowing cost. This causes reinvestment risk, because we generally are not able to reinvest prepayments at rates that are comparable to the rates we earned on the prepaid loans or securities in a declining rate environment.
Changes in market interest rates also impact the value of our interest-earning assets and interest-bearing liabilities as well as the value of our derivatives portfolios. In particular, the unrealized gains and losses on securities available for sale and changes in the fair value of interest rate derivatives serving as cash flows hedges are reported, net of tax, in accumulated other comprehensive income which is a component of stockholders’ equity. Consequently, declines in the fair value of these instruments resulting from changes in market interest rates may adversely affect stockholders’ equity.
If our allowance for loan losses is not sufficient to cover actual loan losses, our earnings will decrease.
We make various assumptions and judgments about the collectability of our loan portfolio, including the creditworthiness of our borrowers and the value of the real estate and other assets serving as collateral for the repayment of many of our loans. In determining the required amount of the allowance for loan losses, we evaluate certain loans individually and establish loan loss allowances for specifically identified impairments. For all non-impaired loans, including those not individually reviewed, we estimate losses and establish loan loss allowances based upon historical and environmental loss factors. If the assumptions used in our calculation methodology are incorrect, our allowance for loan losses may not be sufficient to cover losses inherent in our loan portfolio, resulting in further additions to our allowance. Our allowance for loan losses was 0.68% of total loans at June 30, 2018 and significant additions to our allowance could materially decrease our net income.
38
In addition, bank regulators periodically review our allowance for loan losses and may require us to increase our provision for loan losses or recognize further loan charge-offs. Any increase in our allowance for loan losses or loan charge-offs as required by these regulatory authorities might have a material adverse effect on our financial condition and results of operations.
Our acquisitions, including our recent acquisition of Clifton Bancorp, Inc., and the integration of acquired businesses, subject us to various risks and may not result in all of the cost savings and benefits anticipated, which could adversely affect our financial condition or results of operations.
We have in the past, and may in the future, seek to grow our business by acquiring other businesses. In April 2018, we completed our acquisition of Clifton Bancorp, Inc., and its wholly owned subsidiary, Clifton Savings Bank. There is risk that our acquisitions may not have the anticipated positive results, including results relating to: correctly assessing the asset quality of the assets being acquired; the total cost and time required to complete the integration successfully; being able to profitably deploy funds acquired in an acquisition; or the overall performance of the combined entity.
Acquisitions may also result in business disruptions that could cause customers to remove their accounts from us and move their business to competing financial institutions. It is possible that the integration process related to acquisitions could result in the disruption of our ongoing businesses or inconsistencies in standards, controls, procedures and policies that could adversely affect our ability to maintain relationships with clients, customers, and employees. The loss of key employees in connection with an acquisition could adversely affect our ability to successfully conduct our business. Acquisition and integration efforts could divert management attention and resources, which could have an adverse effect on our financial condition and results of operations. Additionally, the operation of the acquired branches may adversely affect our existing profitability, and we may not be able to achieve results in the future similar to those achieved by the existing banking business or manage growth resulting from the acquisition effectively.
A new accounting standard will likely require us to increase our allowance for loan losses and may have a material adverse effect on our financial condition and results of operations.
The Financial Accounting Standards Board has adopted a new accounting standard that will be effective for the Company for our first fiscal year after December 15, 2019. This standard, referred to as Current Expected Credit Loss, or CECL, will require financial institutions to determine periodic estimates of lifetime expected credit losses on loans, and recognize the expected credit losses as allowances for loan losses. This will change the current method of providing allowances for loan losses that are probable, which would likely require us to increase our allowance for loan losses, and to greatly increase the types of data we would need to collect and review to determine the appropriate level of the allowance for loan losses. Any increase in our allowance for loan losses or expenses incurred to determine the appropriate level of the allowance for loan losses may have a material adverse effect on our financial condition and results of operations.
A significant portion of our assets consists of investment securities, which generally have lower yields than loans, and we classify a significant portion of our investment securities as available for sale, which creates potential volatility in our equity and may have an adverse impact on our net income.
As of June 30, 2018, our securities portfolio, which includes both mortgage-backed and non-mortgage-backed debt securities, totaled $1.31 billion, or 20.0% of our total assets. Investment securities typically have lower yields than loans. For the year ended June 30, 2018, the weighted average yield of our investment securities portfolio was 2.52%, as compared to 3.87% for our loan portfolio. Accordingly, our net interest margin is lower than it would have been if a higher proportion of our interest-earning assets consisted of loans. Additionally, at June 30, 2018, $725.1 million, or 55.1% of our investment securities, are classified as available for sale and reported at fair value with unrealized gains or losses excluded from earnings and reported in other comprehensive income, which affects our reported equity. Accordingly, given the significant size of the investment securities portfolio classified as available for sale and due to possible mark-to-market adjustments of that portion of the portfolio resulting from market conditions, we may experience greater volatility in the value of reported equity. Moreover, given that we actively manage our investment securities portfolio classified as available for sale, we may sell securities which could result in a realized loss, thereby reducing our net income.
Our increased commercial lending exposes us to additional risk.
Our commercial loans have increased to 69.4% of total loans at June 30, 2018 from 60.7% of total loans at June 30, 2014. Our commercial lending operations include commercial mortgage loans, comprising multi-family loans and non-residential mortgage loans, commercial business loans as well as construction loans. We intend to continue increasing commercial lending as part of our planned transition from a traditional thrift to a full-service community bank. We have also increased our commercial lending staff and are seeking additional commercial lenders to help grow the commercial loan portfolio. Our increased commercial lending, however, exposes us to greater risks than one- to four-family residential lending. Unlike single-family, owner-occupied residential mortgage loans, which generally are made on the basis of the borrower’s ability to make repayment from his or her employment and other income and are secured by real property whose value tends to be more easily ascertainable and realizable, the repayment of
39
commercial loans typically is dependent on the successful operation and income stream of the borrower, which can be significantly affected by economic conditions, and are secured, if at all, by collateral that is more difficult to value or sell or by collateral which may depreciate in value. In addition, commercial loans generally carry larger balances to single borrowers or related groups of borrowers than one- to four-family mortgage loans, which increases the financial impact of a borrower’s default.
We may be adversely affected by recent changes in tax laws.
The Tax Cuts and Jobs Act (the “Tax Act”), which was enacted in December 2017, is likely to have both positive and negative effects on our financial performance. For example, the new legislation will result in a reduction in our federal corporate tax rate from 35% to 21% beginning in 2018, which will have a favorable impact on our earnings and capital generation abilities. However, the new legislation also enacted limitations on certain deductions that will have an impact on the banking industry, borrowers and the market for single-family residential real estate. These limitations include (1) a lower limit on the deductibility of mortgage interest on single-family residential mortgage loans, (2) the elimination of interest deductions for certain home equity loans, (3) a limitation on the deductibility of business interest expense, and (4) a limitation on the deductibility of property taxes and state and local income taxes.
The recent changes in the federal tax laws may have an adverse effect on the market for, and the valuation of, residential properties, and on the demand for such loans in the future, and could make it harder for borrowers to make their loan payments. In addition, these recent changes may also have a disproportionate effect on taxpayers in states with high residential home prices and high state and local taxes, like New Jersey and New York. If home ownership becomes less attractive, demand for mortgage loans could decrease. The value of the properties securing loans in our loan portfolio may be adversely impacted as a result of the changing economics of home ownership, which could require an increase in our provision for loan losses, which would reduce our profitability and could materially adversely affect our business, financial condition and results of operations.
Additionally, legislation in New Jersey that was adopted in July 2018 will increase our state income tax liability and could increase our overall tax expense. The legislation imposes a temporary surtax on corporations earning New Jersey allocated income in excess of $1 million of 2.5% for tax years beginning on or after January 1, 2018 through December 31, 2019, and of 1.5% for tax years beginning on or after January 1, 2020 through December 31, 2021. The new legislation also requires combined filing for members of an affiliated group for tax years beginning on or after January 1, 2019, changing New Jersey's current status as a separate return state, and limits the deductibility of dividends received. These changes are not temporary. Regulations implementing the legislative changes have not yet been issued, so we cannot yet fully evaluate the impact of the legislation on our overall tax expense. However, the new legislation may cause us to lose the benefit of certain of our tax management strategies and may cause our total tax expense to increase.
Our loan portfolio contains a significant portion of loans that are unseasoned. It is difficult to evaluate the future performance of unseasoned loans.
Our loan portfolio has grown to $4.50 billion at June 30, 2018, from $1.74 billion at June 30, 2014. This increase reflects the acquisition of Clifton coupled with increases in commercial loans resulting from internal loan originations, as well as purchases and participations in loans originated by other financial institutions. It is difficult to assess the future performance of these loans recently added to our portfolio because our relatively limited experience with such loans does not provide us with a significant payment history from which to evaluate future collectability. These loans may experience higher delinquency or charge-off levels than our historical loan portfolio experience, which could adversely affect our future performance.
Because we intend to continue to increase our commercial business loan originations, our credit risk will increase.
Kearny Bank historically has not had a significant portfolio of commercial business loans. We intend to increase our originations of commercial business loans, including C&I and SBA loans, which generally have more risk than both one- to four-family residential and commercial mortgage loans. Since repayment of commercial business loans may depend on the successful operation of the borrower’s business, repayment of such loans can be affected by adverse conditions in the real estate market or the local economy. Because we plan to continue to increase our originations of these loans, it may be necessary to increase the level of our allowance for loan losses because of the increased risk characteristics associated with these types of loans. Any such increase to our allowance for loan losses would adversely affect our earnings.
Income from secondary mortgage market operations is volatile, and we may incur losses with respect to our secondary mortgage market operations that could negatively affect our earnings.
A component of our business strategy is to sell a portion of residential mortgage loans originated into the secondary market, earning non-interest income in the form of gains on sale. For the year ended June 30, 2018, sale gains attributable to the sale of residential mortgage loans totaled $742,000 or approximately 5.6% of our non-interest income. When interest rates rise, the demand
40
for mortgage loans tends to fall and may reduce the number of loans we can originate for sale. Weak or deteriorating economic conditions also tend to reduce loan demand. If the residential mortgage loan demand decreases or we are unable to sell such loans for an adequate profit, then our non-interest income will likely decline which would adversely affect our earnings.
Our reliance on wholesale deposits could adversely affect our liquidity and operating results.
Among other sources of funds, we rely on wholesale deposits, including “brokered” deposits and “non-brokered” deposits acquired through listing services, to provide funds with which to make loans and provide for other liquidity needs. On June 30, 2018, brokered deposits totaled $295.2 million, or approximately 7.2% of total deposits. Historically, our primary source for brokered money market deposits is the Promontory IND program, a brokered deposit network that is sourced by Promontory from large retail and institutional brokerage firms whose individual clients seek to have a portion of their investments held in interest-bearing accounts at FDIC-insured institutions. Our Promontory IND deposits totaled $210.8 million at June 30, 2018. However, our Promontory IND program agreement matured and was terminated in July 2018 at which time all IND program deposits held by the Company were returned to Promontory. The funding provided by the IND program deposits was largely replaced with FHLB advances that were drawn concurrent with the return of the IND deposits to Promontory. The IND program funds were augmented by a portfolio of longer-term, brokered certificates of deposit whose total balances were $84.3 million at June 30, 2018. As of that same date, the outstanding balance of certificates of deposit acquired through listing services totaled $104.3 million or 2.6% of total deposits.
Generally wholesale deposits may not be as stable deposits acquired through traditional retail channels. In the future, those depositors may not replace their deposits with us as they mature, or we may have to pay a higher rate of interest to keep those deposits or to replace them with other deposits or other sources of funds. Not being able to maintain or replace those deposits as they mature would adversely affect our liquidity. Paying higher deposit rates to maintain or replace brokered deposits would adversely affect our net interest margin and operating results.
We may be required to record impairment charges with respect to our investment securities portfolio.
We review our securities portfolio at the end of each quarter to determine whether the fair value is below the current carrying value. When the fair value of any of our investment securities has declined below its carrying value, we are required to assess whether the impairment is other than temporary, such assessment is completed internally, on a quarterly basis. If we conclude that the impairment is other than temporary, we are required to write down the value of that security. The “credit-related” portion of the impairment is recognized through earnings whereas the “noncredit-related” portion is generally recognized through other comprehensive income in the circumstances where the future sale of the security is unlikely.
At June 30, 2018, we had investment securities with fair values of approximately $1.30 billion on which we had approximately $18.1 million in gross unrealized losses and $3.5 million of gross unrealized gains. All unrealized losses on investment securities at June 30, 2018 represented temporary impairments of value. However, if changes in the expected cash flows of these securities and/or prolonged price declines result in our concluding in future periods that the impairment of these securities is other than temporary, we will be required to record an impairment charge against income equal to the credit-related impairment.
Our investments in corporate and municipal debt securities, trust preferred and subordinated debt securities and collateralized loan obligations expose us to additional credit risks.
The composition and allocation of our investment portfolio has historically emphasized U.S. agency mortgage-backed securities and U.S. agency debentures. While such assets remain a significant component of our investment portfolio at June 30, 2018, prior enhancements to our investment policies, strategies and infrastructure have enabled us to diversify the composition and allocation of our securities portfolio. Such diversification has included investing in corporate debt and bank-qualified municipal obligations, trust preferred and subordinated debt securities issued by financial institutions and collateralized loan obligations. With the exception of collateralized loan obligations, these securities are generally backed only by the credit of their issuers while investments in collateralized loan obligations generally rely on the structural characteristics of an individual tranche within a larger investment vehicle to protect the investor from credit losses arising from borrowers defaulting on the underlying securitized loans.
While we have invested primarily in investment grade securities, these securities are not backed by the federal government and expose us to a greater degree of credit risk than U.S. agency securities. Any decline in the credit quality of these securities exposes us to the risk that the market value of the securities could decrease which may require us to write down their value and could lead to a possible default in payment.
41
We hold certain intangible assets that could be classified as impaired in the future. If these assets are considered to be either partially or fully impaired in the future, our earnings would decrease.
At June 30, 2018, we had approximately $217.2 million in intangible assets on our balance sheet comprising $210.9 million of goodwill and $6.3 million of core deposit intangibles. We are required to periodically test our goodwill and identifiable intangible assets for impairment. The impairment testing process considers a variety of factors, including the current market price of our common stock, the estimated net present value of our assets and liabilities, and information concerning the terminal valuation of similarly situated insured depository institutions. If an impairment determination is made in a future reporting period, our earnings and the book value of these intangible assets will be reduced by the amount of the impairment. If an impairment loss is recorded, it will have little or no impact on the tangible book value of our common stock or our regulatory capital levels, but recognition of such an impairment loss could significantly restrict Kearny Bank’s ability to make dividend payments to Kearny Financial and therefore adversely impact the Company’s ability to pay dividends to stockholders.
We operate in a highly regulated environment and may be adversely affected by changes in federal and state laws and regulations.
The financial services industry is extensively regulated. Federal and state banking regulations are designed primarily to protect the deposit insurance funds and consumers, not to benefit a company’s shareholders. These regulations may sometimes impose significant limitations on operations. The significant federal and state banking regulations that affect us are described under the heading “Item 1. Business—Regulation.” These regulations, along with the currently existing tax, accounting, securities, insurance, and monetary laws, regulations, rules, standards, policies, and interpretations control the methods by which financial institutions conduct business, implement strategic initiatives and tax compliance, and govern financial reporting and disclosures. New proposals for legislation continue to be introduced in the U.S. Congress that could further alter the regulation of the bank and non-bank financial services industries and the manner in which companies within the industry conduct business.
In addition, federal and state regulatory agencies also frequently adopt changes to their regulations or change the manner in which existing regulations are applied. Future changes in federal policy and at regulatory agencies may occur over time through policy and personnel changes, which could lead to changes involving the level of oversight and focus on the financial services industry. These changes may require us to invest significant management attention and resources to make any necessary changes to operations to comply and could have an adverse effect on our business, financial condition and results of operations.
A natural disaster could harm our business.
Natural disasters can disrupt our operations, result in damage to our properties, reduce or destroy the value of the collateral for our loans and negatively affect the local economies in which we operate, which could have a material adverse effect on our results of operations and financial condition. The occurrence of a natural disaster could result in one or more of the following: (i) an increase in loan delinquencies; (ii) an increase in problem assets and foreclosures; (iii) a decrease in the demand for our products and services; or (iv) a decrease in the value of the collateral for loans, especially real estate, in turn reducing customers’ borrowing power, the value of assets associated with problem loans and collateral coverage.
Acts of terrorism and other external events could impact our ability to conduct business.
Financial institutions have been, and continue to be, targets of terrorist threats aimed at compromising operating and communication systems. Additionally, the metropolitan New York area and northern New Jersey remain central targets for potential acts of terrorism. Such events could cause significant damage, impact the stability of our facilities and result in additional expenses, impair the ability of our borrowers to repay their loans, reduce the value of collateral securing repayment of our loans, and result in the loss of revenue. While we have established and regularly test disaster recovery procedures, the occurrence of any such event could have a material adverse effect on our business, operations and financial condition.
Because the nature of the financial services business involves a high volume of transactions, we face significant operational risks.
We operate in diverse markets and rely on the ability of our employees and systems to process a high number of transactions. Operational risk is the risk of loss resulting from our operations, including but not limited to, the risk of fraud by employees or persons outside the Company, the execution of unauthorized transactions by employees, errors relating to transaction processing and technology, breaches of the internal control system and compliance requirements, and business continuation and disaster recovery. Insurance coverage may not be available for such losses, or where available, such losses may exceed insurance limits. This risk of loss also includes the potential legal actions that could arise as a result of an operational deficiency or as a result of noncompliance with applicable regulatory standards, adverse business decisions or their implementation, and customer attrition due to potential negative publicity. In the event of a breakdown in the internal control system, improper operation of systems or improper employee actions, we could suffer financial loss, face regulatory action, and suffer damage to our reputation.
42
Our risk management framework may not be effective in mitigating risk and reducing the potential for significant losses.
Our risk management framework is designed to effectively manage and mitigate risk while minimizing exposure to potential losses. We seek to identify, measure, monitor, report and control our exposure to risk, including strategic, market, liquidity, compliance and operational risks. While we use a broad and diversified set of risk monitoring and mitigation techniques, these techniques are inherently limited because they cannot anticipate the existence or future development of currently unanticipated or unknown risks. Recent economic conditions and heightened legislative and regulatory scrutiny of the financial services industry, among other developments, have increased our level of risk. Accordingly, we could suffer losses as a result of our failure to properly anticipate and manage these risks.
We could be adversely affected by failure in our internal controls.
A failure in our internal controls could have a significant negative impact not only on our earnings, but also on the perception that customers, regulators and investors may have of us. We continue to devote a significant amount of effort, time and resources to continually strengthening our controls and ensuring compliance with complex accounting standards and banking regulations.
Risks associated with system failures, service interruptions or other performance exceptions could negatively affect our earnings.
Information technology systems are critical to our business. We use various technology systems to manage our customer relationships, general ledger, securities investments, deposits, and loans. We have established policies and procedures to prevent or limit the effect of system failures, service interruptions or other performance exceptions, but such events may still occur or may not be adequately addressed if they do occur. In addition, performance failures or other exceptions of our customer-facing technologies could deter customers from using our products and services.
In addition, we outsource a majority of our data processing to certain third-party service providers. If these service providers encounter difficulties, or if we have difficulty communicating with them, our ability to timely and accurately process and account for transactions could be adversely affected.
The occurrence of any system failures, service interruptions or other performance exceptions could damage our reputation and result in a loss of customers and business thereby subjecting us to additional regulatory scrutiny, or could expose us to litigation and possible financial liability. Any of these events could have a material adverse effect on our financial condition and results of operations.
Risks associated with cyber-security could negatively affect our earnings.
The financial services industry has experienced an increase in both the number and severity of reported cyber-attacks aimed at gaining unauthorized access to bank systems as a way to misappropriate assets and sensitive information, corrupt and destroy data, or cause operational disruptions.
We have established policies and procedures to prevent or limit the impact of security breaches, but such events may still occur or may not be adequately addressed if they do occur. Although we rely on security safeguards to secure our data, these safeguards may not fully protect our systems from compromises or breaches.
We also rely on the integrity and security of a variety of third party processors, payment, clearing and settlement systems, as well as the various participants involved in these systems, many of which have no direct relationship with us. Failure by these participants or their systems to protect our customers' transaction data may put us at risk for possible losses due to fraud or operational disruption.
Our customers are also the target of cyber-attacks and identity theft. Large scale identity theft could result in customers' accounts being compromised and fraudulent activities being performed in their name. We have implemented certain safeguards against these types of activities but they may not fully protect us from fraudulent financial losses.
The occurrence of a breach of security involving our customers' information, regardless of its origin, could damage our reputation and result in a loss of customers and business and subject us to additional regulatory scrutiny, and could expose us to litigation and possible financial liability. Any of these events could have a material adverse effect on our financial condition and results of operations.
43
Our inability to effectively deploy our excess capital may negatively affect return on equity and shareholder value.
Our successful second step conversion and stock offering during fiscal 2015 resulted in the Company holding a significant level of excess capital in relation to its overall asset size and risk profile. Our business plan calls for us to execute a variety of strategies to deploy this excess capital including, but not limited to, continued organic balance sheet growth and diversification, implementation of share repurchase plans and payment of regular cash dividends. Additionally, we will carefully consider acquisition opportunities to further deploy our excess capital when we expect such opportunities to significantly enhance long-term shareholder value. Our inability to effectively and timely deploy our excess capital through these strategies may constrain growth in earnings and return on equity and thereby diminish potential growth in shareholder value.
Our inability to achieve profitability on new branches may negatively affect our earnings.
We have expanded our presence throughout our market area and we intend to pursue further expansion through de novo branching or the purchase of branches from other financial institutions. The profitability of our expansion strategy will depend on whether the income that we generate from the new branches will offset the increased expenses resulting from operating these branches. We expect that it may take a period of time before these branches can become profitable, especially in areas in which we do not have an established presence. During this period, the expense of operating these branches may negatively affect our net income.
Item 1B. Unresolved Staff Comments
Not applicable.
Item 2. Properties
The Company and the Bank conduct business from their administrative headquarters at 120 Passaic Avenue in Fairfield, New Jersey and 54 branch offices located in Bergen, Essex, Hudson, Middlesex, Monmouth, Morris, Ocean, Passaic and Union counties, New Jersey and Kings and Richmond counties, New York. Twenty-five of our offices are leased with remaining terms between nine months and 14 years. At June 30, 2018, our net investment in property and equipment totaled $56.2 million.
Additional information regarding our properties as of June 30, 2018, is presented in Note 9 to the audited consolidated financial statements.
Item 3. Legal Proceedings
We are, from time to time, party to routine litigation, which arises in the normal course of business, such as claims to enforce liens, condemnation proceedings on properties in which we hold security interests, claims involving the making and servicing of real property loans and other issues incident to our business. At June 30, 2018, there were no lawsuits pending or known to be contemplated against us that would be expected to have a material effect on operations or income.
Item 4. Mine Safety Disclosures
Not applicable.
44
PART II
Item 5. Market for Registrant’s Common Equity, Related Stockholder Matters and Issuer Purchases of Equity Securities
(a) Market Information. The Company’s common stock trades on The NASDAQ Global Select Market under the symbol “KRNY”. The table below shows the reported high and low prices of the common stock and dividends declared per public share for each quarter during the last two fiscal years.
| High | | | Low | | | Dividends Declared | |
Fiscal Year 2018 | | | | | | | | | | | |
Quarter ended June 30, 2018 | $ | 14.80 | | | $ | 12.95 | | | $ | 0.04 | |
Quarter ended March 31, 2018 | $ | 14.60 | | | $ | 12.75 | | | $ | 0.03 | |
Quarter ended December 31, 2017 | $ | 15.60 | | | $ | 14.05 | | | $ | 0.03 | |
Quarter ended September 30, 2017 | $ | 15.45 | | | $ | 13.35 | | | $ | 0.15 | |
| | | | | | | | | | | |
Fiscal Year 2017 | | | | | | | | | | | |
Quarter ended June 30, 2017 | $ | 15.63 | | | $ | 13.75 | | | $ | 0.03 | |
Quarter ended March 31, 2017 | $ | 15.85 | | | $ | 14.25 | | | $ | 0.03 | |
Quarter ended December 31, 2016 | $ | 16.10 | | | $ | 13.45 | | | $ | 0.02 | |
Quarter ended September 30, 2016 | $ | 14.09 | | | $ | 12.40 | | | $ | 0.02 | |
Declarations of dividends by the Board of Directors depend on a number of factors, including investment opportunities, growth objectives, financial condition, profitability, tax considerations, minimum capital requirements, regulatory limitations, stock market characteristics and general economic conditions. The timing, frequency and amount of dividends are determined by the Board of Directors.
The Company’s ability to pay dividends may also depend on the receipt of dividends from the Bank, which is subject to a variety of limitations under federal banking regulations regarding the payment of dividends. For discussion of corporate and regulatory limitations applicable to the payment of dividends, see “Item 1. Business-Regulation”.
As of August 20, 2018, there were 4,550 registered holders of record of the Company’s common stock, plus approximately 8,152 beneficial (street name) owners.
(b) Use of Proceeds. Not applicable.
(c) Issuer Purchases of Equity Securities. Set forth below is information regarding the Company’s stock repurchases during the fourth quarter of the fiscal year ended June 30, 2018.
Period | | Total Number of Shares Purchased | | | Average Price Paid per Share | | | Total Number of Shares Purchased as Part of Publicly Announced Plans or Programs (1) | | | Maximum Number of Shares that May Yet Be Purchased Under the Plans or Programs | |
April 1-30, 2018 | | | 1,813,348 | | | $ | 13.29 | | | | 1,813,348 | | | | 10,238,557 | |
May 1-31, 2018 | | | 1,370,200 | | | $ | 14.24 | | | | 1,370,200 | | | | 8,868,357 | |
June 1-30, 2018 | | | 1,325,260 | | | $ | 14.22 | | | | 1,325,260 | | | | 7,543,097 | |
| | | | | | | | | | | | | | | | |
Total | | | 4,508,808 | | | $ | 13.85 | | | | 4,508,808 | | | | 7,543,097 | |
(1) | On April 27, 2018, the Company announced the authorization of a third stock repurchase plan for up to 10,238,557 shares or 10% of shares then outstanding. This plan has no expiration date. The plan commenced upon the completion of the second stock repurchase plan, which was announced on May 24, 2017, and authorized the purchase of up to 8,559,084 shares or 10% of shares then outstanding. The second stock repurchase plan had no expiration date. |
45
Stock Performance Graph. The following stock performance graph compares the cumulative total shareholder return on the Company’s common stock with (a) the cumulative total shareholder return on stocks included in the NASDAQ Composite Index, (b) the cumulative total shareholder return on stocks included in the SNL Thrift $5 Billion - $10 Billion Index and (c) the cumulative total shareholder return on stocks included in the SNL Thrift MHC Index, in each case assuming an investment of $100.00 as of June 30, 2013. The cumulative total returns for the indices and the Company are computed assuming the reinvestment of dividends that were paid during the period. It is assumed that the investment in the Company’s common stock was made at the initial public offering price of $10.00 per share.
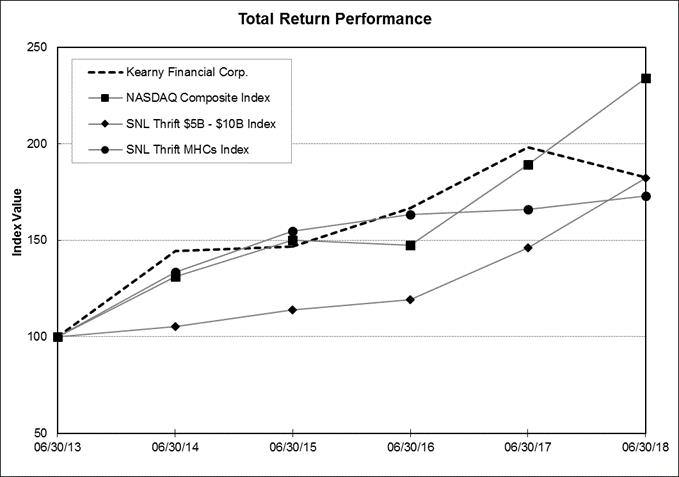
| At June 30, | |
| 2013 | | | 2014 | | | 2015 | | | 2016 | | | 2017 | | | 2018 | |
Kearny Financial Corp. | $ | 100 | | | $ | 144 | | | $ | 147 | | | $ | 167 | | | $ | 198 | | | $ | 182 | |
NASDAQ Composite | | 100 | | | | 131 | | | | 150 | | | | 148 | | | | 189 | | | | 234 | |
SNL Thrift $5B - $10B Index | | 100 | | | | 105 | | | | 114 | | | | 119 | | | | 146 | | | | 182 | |
SNL Thrift MHC Index | | 100 | | | | 133 | | | | 155 | | | | 163 | | | | 166 | | | | 173 | |
The NASDAQ Composite Index measures all NASDAQ domestic and international based common type stocks listed on The NASDAQ Stock Market. The SNL indices were prepared by S&P Global Market Intelligence. The SNL Thrift $5 Billion - $10 Billion Index includes all thrift institutions with total assets between $5.0 billion and $10.0 billion. The SNL Thrift MHC Index includes all publicly traded mutual holding companies.
There can be no assurance that the Company’s future stock performance will be the same or similar to the historical stock performance shown in the graph above. The Company neither makes nor endorses any predictions as to stock performance.
46
Item 6. Selected Financial Data
The following financial information and other data in this section are derived from the Company’s audited consolidated financial statements and should be read together therewith.
| At June 30, | | |
| 2018 | | | | | 2017 | | | | | 2016 | | | | | 2015 | | | | | 2014 | | |
| (In Thousands) | | |
Balance Sheet Data: | | | | | | | | | | | | | | | | | | | | | | | | |
Assets | $ | 6,579,874 | | | | $ | 4,818,127 | | | | $ | 4,500,059 | | | | $ | 4,237,187 | | | | $ | 3,510,009 | | |
Net loans receivable | | 4,470,483 | | | | | 3,215,975 | | | | | 2,649,758 | | | | | 2,087,258 | | | | | 1,729,084 | | |
Investment securities available for sale | | 725,085 | | | | | 613,760 | | | | | 673,537 | | | | | 767,279 | | | | | 845,121 | | |
Investment securities held to maturity | | 589,730 | | | | | 493,321 | | | | | 577,286 | | | | | 663,341 | | | | | 512,072 | | |
Cash and equivalents | | 128,864 | | | | | 78,237 | | | | | 199,200 | | | | | 340,136 | | | | | 135,034 | | |
Goodwill | | 210,895 | | | | | 108,591 | | | | | 108,591 | | | | | 108,591 | | | | | 108,591 | | |
Deposits | | 4,073,604 | | | | | 2,929,745 | | | | | 2,694,687 | | | | | 2,465,570 | | | | | 2,479,872 | | |
Borrowings | | 1,198,646 | | | | | 806,228 | | | | | 614,423 | | | | | 571,499 | | | | | 512,257 | | |
Stockholders' equity | | 1,268,748 | | | | | 1,057,181 | | | | | 1,147,629 | | | | | 1,167,375 | | | | | 494,676 | | |
| For the Years Ended June 30, | | |
| 2018 | | | | | 2017 | | | | | 2016 | | | | | 2015 | | | | | 2014 | | |
| (In Thousands, Except Percentage and Per Share Amounts) | | |
Summary of Operations: | | | | | | | | | | | | | | | | | | | | | | | | |
Interest income | $ | 171,431 | | | | $ | 139,093 | | | | $ | 126,888 | | | | $ | 106,039 | | | | $ | 95,819 | | |
Interest expense | | 50,138 | | | | | 36,519 | | | | | 31,903 | | | | | 25,431 | | | | | 21,998 | | |
Net interest income | | 121,293 | | | | | 102,574 | | | | | 94,985 | | | | | 80,608 | | | | | 73,821 | | |
Provision for loan losses | | 2,706 | | | | | 5,381 | | | | | 10,690 | | | | | 6,108 | | | | | 3,381 | | |
Net interest income after loan loss provision | | 118,587 | | | | | 97,193 | | | | | 84,295 | | | | | 74,500 | | | | | 70,440 | | |
Non-interest income, excluding asset gains, losses and write-downs | | 12,270 | | | | | 9,920 | | | | | 10,426 | | | | | 8,616 | | | | | 6,967 | | |
Non-interest income (loss) from asset gains, losses and write-downs | | 993 | | | | | 1,428 | | | | | 301 | | | | | (675 | ) | | | | 1,156 | | |
Contribution to charitable foundation | | - | | | | | - | | | | | - | | | | | 10,000 | | | | | - | | |
Other non-interest expenses | | 97,850 | | | | | 81,118 | | | | | 72,417 | | | | | 68,081 | | | | | 64,158 | | |
Income before taxes | | 34,000 | | | | | 27,423 | | | | | 22,605 | | | | | 4,360 | | | | | 14,405 | | |
Income tax expense (benefit) | | 14,404 | | | | | 8,820 | | | | | 6,783 | | | | | (1,269 | ) | | | | 4,217 | | |
Net income | $ | 19,596 | | | | $ | 18,603 | | | | $ | 15,822 | | | | $ | 5,629 | | | | $ | 10,188 | | |
| | | | | | | | | | | | | | | | | | | | | | | | |
Per Share Data: | | | | | | | | | | | | | | | | | | | | | | | | |
Net income per share - Basic and diluted | $ | 0.24 | | | | $ | 0.22 | | | | $ | 0.18 | | | | $ | 0.06 | | | | $ | 0.11 | | |
Weighted average number of common shares outstanding (in thousands): | | | | | | | | | | | | | | | | | | | | | | | | |
Basic | | 82,587 | | | | | 84,590 | | | | | 89,591 | | | | | 91,717 | | | | | 90,825 | | |
Diluted | | 82,643 | | | | | 84,661 | | | | | 89,625 | | | | | 91,841 | | | | | 90,880 | | |
Cash dividends per share | $ | 0.25 | | | | $ | 0.10 | | | | $ | 0.08 | | | | $ | - | | | | $ | - | | |
Dividend payout ratio (1) | | 102.87 | | % | | | 44.99 | | % | | | 45.28 | | % | | | - | | % | | | - | | % |
(1)Represents cash dividends declared divided by net income.
47
| At or For the Years Ended June 30, | | |
| 2018 | | | | | 2017 | | | | | 2016 | | | | | 2015 | | | | | 2014 | | |
Performance ratios: | | | | | | | | | | | | | | | | | | | | | | | | |
Return on average assets (net income divided by average total assets) | | 0.37 | | % | | | 0.40 | | % | | | 0.36 | | % | | | 0.15 | | % | | | 0.31 | | % |
Return on average equity (net income divided by average total equity) | | 1.81 | | | | | 1.68 | | | | | 1.36 | | | | | 0.98 | | | | | 2.17 | | |
Net interest rate spread | | 2.25 | | | | | 2.14 | | | | | 2.06 | | | | | 2.20 | | | | | 2.32 | | |
Net interest margin | | 2.50 | | | | | 2.41 | | | | | 2.35 | | | | | 2.34 | | | | | 2.44 | | |
Average interest-earning assets to average interest-earning liabilities | | 125.12 | | | | | 132.14 | | | | | 136.23 | | | | | 119.08 | | | | | 116.82 | | |
Efficiency ratio (non-interest expenses divided by sum of net interest income and non-interest income) | | 72.72 | | | | | 71.20 | | | | | 68.50 | | | | | 88.18 | | | | | 78.30 | | |
Non-interest expense to average assets | | 1.86 | | | | | 1.76 | | | | | 1.64 | | | | | 2.10 | | | | | 1.96 | | |
| | | | | | | | | | | | | | | | | | | | | | | | |
Asset Quality Ratios: | | | | | | | | | | | | | | | | | | | | | | | | |
Non-performing loans to total loans | | 0.37 | | | | | 0.58 | | | | | 0.79 | | | | | 1.09 | | | | | 1.45 | | |
Non-performing assets to total assets | | 0.27 | | | | | 0.43 | | | | | 0.49 | | | | | 0.56 | | | | | 0.77 | | |
Net charge-offs to average loans outstanding | | 0.03 | | | | | 0.01 | | | | | 0.08 | | | | | 0.16 | | | | | 0.12 | | |
Allowance for loan losses to total loans | | 0.68 | | | | | 0.90 | | | | | 0.91 | | | | | 0.74 | | | | | 0.71 | | |
Allowance for loan losses to non-performing loans | | 183.08 | | | | | 155.18 | | | | | 115.07 | | | | | 68.17 | | | | | 48.96 | | |
| | | | | | | | | | | | | | | | | | | | | | | | |
Capital Ratios: | | | | | | | | | | | | | | | | | | | | | | | | |
Average equity to average assets | | 20.54 | | | | | 24.02 | | | | | 26.47 | | | | | 15.49 | | | | | 14.29 | | |
Equity to assets at period end | | 19.28 | | | | | 21.94 | | | | | 25.50 | | | | | 27.55 | | | | | 14.09 | | |
Tangible equity to tangible assets at period end (1) | | 16.53 | | | | | 20.14 | | | | | 23.65 | | | | | 25.63 | | | | | 11.32 | | |
(1)Tangible equity equals total stockholders’ equity reduced by goodwill and core deposit intangible assets.
48
Item 7. Management’s Discussion and Analysis of Financial Condition and Results of Operations
General
This discussion and analysis reflects Kearny Financial Corp.’s consolidated financial statements and other relevant statistical data, and is intended to enhance your understanding of our financial condition and results of operations. You should read the information in this section in conjunction with the business and financial information regarding Kearny Financial Corp. and the consolidated financial statements and notes thereto contained in this Annual Report on Form 10-K.
Overview
Financial Condition. Total assets increased $1.76 billion to $6.58 billion at June 30, 2018 from $4.82 billion at June 30, 2017 which largely reflected the acquisition of Clifton on April 2, 2018. In conjunction with the acquisition, the Company acquired assets with aggregate fair values totaling $1.61 billion including loans and securities with fair values of $1.12 billion and $326.9 million, respectively. The Company assumed liabilities with aggregate fair values totaling $1.38 billion in conjunction with the Clifton acquisition including deposits and borrowings with fair values of $949.8 million and $414.1 million, respectively.
Merger consideration associated with the acquisition totaled $333.9 million and primarily comprised 25.4 million shares of the Company’s common stock valued at $330.7 million that were issued to Clifton stockholders to reflect an exchange of 1.191 of Company shares for each outstanding share of Clifton common stock at the time of closing. Merger consideration also included $3.2 million in cash distributed to eligible holders of outstanding options to purchase Clifton stock as well as cash distributed to Clifton stockholders for the settlement of fractional shares. The amount by which merger consideration exceeds the fair value of net assets acquired resulted in the Company’s recognition of $102.3 million in goodwill associated with the Clifton acquisition.
For the year ended June 30, 2018, loans receivable, excluding loans held for sale, increased by $1.26 billion to $4.50 billion, or 68.4% of total assets, from $3.25 billion, or 67.4% of total assets, at June 30, 2017. In addition to the effects of the Clifton acquisition, the growth in loans during fiscal 2018 continued to reflect our strategic emphasis in growing our commercial loan portfolio, including multi-family and nonresidential commercial mortgage loans, commercial business loans and construction loans. The increase in commercial loans during fiscal 2018 totaled $594.7 million, or 23.1%, to $3.17 billion, or 69.4% of total loans at June 30, 2018, from $2.58 billion, or 79.4% of total loans, at June 30, 2017. For those same comparative periods, one- to four-family mortgage loans, including first mortgages and home equity loans and lines of credit, increased by $738.1 million to $1.39 billion, or 30.4% of total loans, from $650.1 million, or 20.1% of total loans.
For those same comparative periods, total securities increased by $207.7 million to $1.31 billion, or 20.0% of total assets, at June 30, 2018 from $1.11 billion, or 23.0% of total assets, at June 30, 2017. The increase in the securities portfolio for the year ended June 30, 2018, largely reflected the impact of securities acquired from Clifton. The Company sold a significant portion of the securities originally acquired from Clifton with a portion of the sale proceeds reinvested into shorter-duration, higher-yielding securities and the remainder reinvested into loans. Non-mortgage-backed securities, including U.S. agency debentures, corporate bonds, single-issuer trust preferred securities, collateralized loan obligations, municipal obligations, subordinated debt, and asset-backed securities, increased by $157.1 million to $746.3 million, or 56.8% of securities, at June 30, 2018 from $589.2 million, or 53.2% of securities, at June 30, 2017. For those same comparative periods, the balance of mortgage-backed securities, primarily comprising U.S. government and agency pass-through securities and collateralized mortgage obligations, increased by $50.6 million to $568.5 million, or 43.2% of securities, from $517.9 million, or 46.8% of securities.
For the year ended June 30, 2018, our total deposits increased by $1.14 billion to $4.07 billion from $2.93 billion at June 30, 2017. The increase in deposits for the year ended June 30, 2018 largely reflected the impact of deposits assumed from Clifton while also reflecting the continuing effects of product, pricing and marketing strategies implemented during fiscal 2018. The net increase in deposits reflected a $418.2 million increase in the balance of non-maturity deposits, comprising increases of $373.6 million and $44.5 million in interest-bearing and non-interest-bearing deposits, respectively, as well as an increase of $725.7 million in certificates of deposit.
The balance of borrowings increased by $392.4 million to $1.20 billion at June 30, 2018 from $806.2 million at June 30, 2017. The increase in borrowings for the year ended June 30, 2018 largely reflected the impact of borrowings assumed from Clifton. Such borrowings were comprised entirely of FHLB advances. The increase in borrowings attributable to the acquisition was partly offset by the repayment of maturing FHLB advances coupled with changes in depositor sweep account balances representing normal day-to-day fluctuations in such balances.
49
Stockholders’ equity increased by $211.6 million to $1.27 billion at June 30, 2018 from $1.06 billion at June 30, 2017. The increase in stockholders’ equity for the year ended June 30, 2018 partly reflected $330.7 million of capital stock issued by the Company in conjunction with the acquisition of Clifton. The increase also reflected net income of $19.6 million earned during fiscal 2018 that was offset by $20.2 million of cash dividends declared and paid to stockholders during fiscal 2018. The increase in stockholders’ equity also reflected a $1.9 million decrease in unearned ESOP shares coupled with a $17.5 million increase in accumulated other comprehensive income primarily reflecting net changes in the fair value of the Company’s derivatives and available for sale securities portfolios. The increase in stockholders’ equity was partially offset by the Company’s share repurchases activity during the period. For the year ended June 30, 2018, the Company repurchased a total of 10,014,544 shares at an aggregate cost of $142.6 million, or an average cost of $14.24 per share.
Results of Operations. Our results of operations depend primarily on our net interest income. Net interest income is the difference between the interest income we earn on our interest‑earning assets and the interest we pay on our interest‑bearing liabilities. It is a function of the average balances of loans and investments versus deposits and borrowed funds outstanding in any one period and the yields earned on those loans and investments and the cost of those deposits and borrowed funds. Our results of operations are also affected by our provision for loan losses, non‑interest income and non‑interest expense.
Net income for the fiscal year ended June 30, 2018 was $19.6 million or $0.24 per diluted share; an increase of $993,000 from $18.6 million, or $0.22 per diluted share, for the fiscal year ended June 30, 2017. As discussed in greater detail below, net income for the year ended June 30, 2018 reflected the effects of merger-related expenses recognized in conjunction with our acquisition of Clifton and a non-recurring increase in income tax expense arising from federal income tax reform that was codified during the first half of fiscal 2018.
Our net interest income increased $18.7 million to $121.3 million for the year ended June 30, 2018 from $102.6 million for the year ended June 30, 2017. The increase in net interest income primarily reflected a $32.3 million increase in interest income to $171.4 million from $139.1 million. The increase in interest income primarily reflected an increase in the average balance of interest-earning assets coupled with an increase in their average yield. For the year ended June 30, 2018, the average balance of interest-earning assets increased by $595.9 million to $4.85 billion compared to $4.25 billion for the year ended June 30, 2017. For those same comparative periods, the average yield on interest-earning assets increased by 27 basis points to 3.54% from 3.27%.
The increase in interest income for the year ended June 30, 2018 was partially offset by a $13.6 million increase in interest expense. The increase in interest expense between the two periods reflected an increase in the average balance of interest-bearing liabilities coupled with an increase in their average cost. For the year ended June 30, 2018 the average balance of interest-bearing liabilities increased by $656.7 million to $3.87 billion compared to $3.22 billion for the year ended June 30, 2017. For those same comparative periods, the average cost of interest-bearing liabilities increased 16 basis points to 1.29% from 1.13%.
The net interest rate spread increased 11 basis points to 2.25% for fiscal 2018 from 2.14% for fiscal 2017 while the net interest margin increased nine basis points to 2.50% from 2.41% for those same comparative periods.
The provision for loan losses decreased $2.7 million to $2.7 million for fiscal 2018 from $5.4 million for fiscal 2017. As discussed in greater detail below, the decrease was partly attributable to a lower provision on non-impaired loans evaluated collectively for impairment that was partially offset by an increase in the provision attributable to losses recognized on loans individually reviewed for impairment.
Non-interest income increased $1.9 million to $13.3 million for fiscal 2018 from $11.3 million for fiscal 2017. As discussed in greater detail below, the increase in non-interest income primarily reflected an increase in fees and service charges that was primarily attributable to an increase in loan prepayment penalties while also reflecting an increase in deposit-related service charges. The increase in non-interest income was partially offset by a decrease in loan sale gains arising primarily from a decrease in the volume of SBA loans originated and sold between comparative periods.
Non-interest expense increased by $16.7 million to $97.8 million for the year ended June 30, 2018 from $81.1 million for the year ended June 30, 2017. The net increase in non-interest expense partly reflected the recognition of $6.7 million in non-recurring merger-related expenses related to the Company’s acquisition of Clifton. The Company estimates that net income for the year ended June 30, 2018 was adversely impacted by approximately $5.1 million due to the limited income tax deductibility of merger-related expenses. The remaining increase was reflected across most other categories of non-interest expense and also reflected the effects of the Clifton acquisition. Most notably, the increase in salaries and employee benefits, premises occupancy expense, equipment and systems expense and deposit insurance expense were largely attributable to the increase in recurring non-interest expenses arising from the Clifton acquisition.
50
The increases in salaries and employee benefit expense and director compensation expense also reflected increases in stock benefit plan expenses arising from the benefits to employees and directors under the terms of the Company’s 2016 Equity Incentive Plan approved by stockholders in October 2016.
The increase in advertising and marketing expense were generally unrelated to the Clifton acquisition and largely reflected increases in advertising expenses across a variety of advertising formats including outdoor and electronic media reflecting normal fluctuations in the timing of certain advertising campaigns supporting the Company’s loan and deposit growth initiatives.
The provision for income taxes increased by $5.6 million to $14.4 million for the year ended June 30, 2018 from $8.8 million for the year ended June 30, 2017. The variance in income tax expense partly reflected the impact of the underlying differences in the level of the taxable portion of pre-tax income between comparative periods. As discussed in greater detail below, the increase in income tax expense also reflected the effects of federal income tax reform which permanently reduced the Company’s federal income tax rate from 35% to 21% while also including other provisions that altered the deductibility of certain recurring expenses recognized by the Company. While federal income tax reform had a positive impact on the Company’s earnings during the second half of fiscal 2018, it resulted in a $3.5 million net reduction in the carrying value of the Company’s deferred income tax assets and liabilities with an equal and offsetting charge to income tax expense during the first half of fiscal 2018 which was partially offset by a $769,000 reduction in current-year income tax expense attributable to the noted reduction in the Company’s income tax rate during that period.
Critical Accounting Policies
Our accounting policies are integral to understanding the results reported. We describe them in detail in Note 1 to our audited consolidated financial statements included as an exhibit to this document. In preparing the audited consolidated financial statements, management is required to make estimates and assumptions that affect the reported amounts of assets and liabilities as of the dates of the consolidated statements of financial condition and revenues and expenses for the periods then ended. Actual results could differ significantly from those estimates. Material estimates that are particularly susceptible to significant changes relate to the determination of the allowance for loan losses, the evaluation of securities impairment and the impairment testing of goodwill.
Allowance for Loan Losses. The allowance for loan losses is a valuation account that reflects our estimation of the losses in our loan portfolio to the extent they are both probable and reasonable to estimate. The balance of the allowance is generally maintained through provisions for loan losses that are charged to income in the period that estimated losses on loans are identified by our loan review system. We charge losses on loans against the allowance as such losses are actually incurred. Recoveries on loans previously charged-off are added back to the allowance.
As described in greater detail in the notes to audited consolidated financial statements, our allowance for loan loss calculation methodology utilizes a “two-tier” loss measurement process that is generally performed monthly. Through the first tier of the process, we identify the loans that must be reviewed individually for impairment. Such loans generally include our larger and/or more complex loans including commercial mortgage loans, comprising multi-family and nonresidential real estate loans, construction loans and commercial business loans as well as our one- to four-family mortgage loans, home equity loans and home equity lines of credit. A reviewed loan is deemed to be impaired when, based on current information and events, it is probable that we will be unable to collect all amounts due according to the contractual terms of the loan agreement. Once a loan is determined to be impaired, management measures the amount of the estimated impairment associated with that loan which is generally defined as the amount by which the carrying value of a loan exceeds its fair value. We establish valuation allowances for loan impairments in the fiscal period during which they are identified. Impairments on individually evaluated loans generally are charged off against the applicable valuation allowance when they are determined to be confirmed, expected losses.
The second tier of the loss measurement process involves estimating the probable and estimable losses on loans not otherwise individually reviewed for impairment. Such loans generally comprise large groups of smaller-balance homogeneous loans as well as the remaining non-impaired loans of those types noted above that are otherwise eligible for individual impairment evaluation.
Valuation allowances established through the second tier of the loss measurement process utilize historical and environmental loss factors to collectively estimate the level of probable losses within defined segments of our loan portfolio. To calculate the historical loss factors, our allowance for loan loss methodology generally utilizes a two-year moving average of annualized net charge-off rates (charge-offs net of recoveries) by loan segment, where available, to calculate the actual, historical loss experience. The outstanding principal balance of each loan segment is multiplied by the applicable historical loss factor to estimate the level of probable losses based upon our historical loss experience.
51
Environmental loss factors are based upon specific quantitative and qualitative criteria representing key sources of risk within the loan portfolio. Such sources of risk include those relating to the level of and trends in nonperforming loans; the level of and trends in credit risk management effectiveness, the levels and trends in lending resource capability; levels and trends in economic and market conditions; levels and trends in loan concentrations; levels and trends in loan composition and terms, levels and trends in independent loan review effectiveness, levels and trends in collateral values and the effects of other external factors. The outstanding principal balance of each applicable loan segment is multiplied by the applicable environmental loss factors to estimate the level of probable losses based upon their supporting quantitative and qualitative criteria.
The sum of the probable and estimable loan losses calculated in accordance with loss measurement processes, as described above, represents the total targeted balance for our allowance for loan losses at the end of a fiscal period. A more detailed discussion of our allowance for loan loss calculation methodology is presented in Note 1 to our audited consolidated financial statements.
Business Combinations. We account for business combinations under the purchase method of accounting. The application of this method of accounting requires the use of significant estimates and assumptions in the determination of the fair value of assets acquired and liabilities assumed in order to properly allocate purchase price consideration between assets that are amortized, accreted or depreciated from those that are recorded as goodwill. Our estimates of the fair values of assets acquired and liabilities assumed are based upon assumptions that we believe to be reasonable, and whenever necessary, include assistance from independent third-party appraisal and valuation firms.
Comparison of Financial Condition at June 30, 2018 and June 30, 2017
General. Total assets increased $1.76 billion to $6.58 billion at June 30, 2018 from $4.82 billion at June 30, 2017. As described in greater detail below, the increase was reflected across all categories of interest-earning and non-interest-earning assets primarily due to the Company’s acquisition of Clifton. The acquisition resulted in corresponding increases in all categories of interest-bearing and non-interest-bearing liabilities as well as an increase in stockholders’ equity that partly reflected the effects of the Company’s issuance of capital stock in conjunction with the acquisition.
Cash and Cash Equivalents. Cash and cash equivalents, which consist primarily of interest-earning and non-interest-earning deposits in other banks, increased by $50.6 million to $128.9 million at June 30, 2018 from $78.2 million at June 30, 2017. The increase for the year ended June 30, 2018 partly reflected day-to-day operating fluctuations in the Company’s balance of short-term liquidity coupled with the acquisition of $36.6 million in cash and cash equivalents acquired from Clifton. Notwithstanding the increase in the balance of cash and cash equivalents at June 30, 2018, the Company generally endeavors to limit the balance of cash and cash equivalents held to the minimum levels needed to meet the Bank’s short-term funding obligations and overall liquidity risk management objectives while reinvesting excess liquidity into comparatively higher-yielding assets. As such, the excess balance of cash and cash equivalents held at June 30, 2018 is generally expected to be redeployed into higher-yielding assets during the quarter ending September 30, 2018.
Investment Securities Available for Sale. Investment securities classified as available for sale increased by $111.3 million to $725.1 million at June 30, 2018 from $613.8 million at June 30, 2017. The increase in the portfolio largely reflected the impact of securities acquired from Clifton whose fair values totaled $258.9 million at the time of acquisition. In addition to the securities acquired from Clifton, the increase in available for sale securities also reflected additional security purchases totaling $189.3 million. The increase in the portfolio was partially offset by security sales totaling $254.6 million during the year ended June 30, 2018. A portion of the noted security purchases and sales reflected a partial restructuring of the available for sale securities portfolio acquired from Clifton. The increase in the portfolio was also partially offset by principal repayments, net of premium amortization and discount accretion, totaling $80.3 million during the year ended June 30, 2018 while also reflecting a $1.9 million decrease in the fair value of the portfolio to a net unrealized loss of $4.3 million at June 30, 2018 from a net unrealized loss of $2.4 million at June 30, 2017.
The noted decrease in the fair value of securities available for sale partly reflected an aggregate $5.0 million decrease in the fair value of mortgage-backed securities, including agency pass-through securities and collateralized mortgage obligations; government and agency securities, including U.S. agency debentures and municipal obligations, to an unrealized loss of $5.7 million at June 30, 2018 from an unrealized loss of $699,000 at June 30, 2017. The decrease in the fair values of this subset of securities was largely attributable to an increase in market interest rates between comparative periods. The decrease in the noted subset of securities was partially offset by an increase in the fair value of the securities comprising the “credit sectors” of the portfolio. Such securities include asset-backed securities, collateralized loan obligations, corporate bonds and non-pooled trust preferred securities. The fair value of this latter subset of securities increased by $3.0 million to a net unrealized gain of $1.3 million at June 30, 2018 from a net unrealized loss of $1.7 million at June 30, 2017. The increase in the fair value of the “credit sector” securities largely reflected a general tightening of pricing spreads within these sectors.
52
Based on its evaluation, management has concluded that no other-than-temporary impairment was present within the available for sale segment of the investment portfolio as of June 30, 2018.
Additional information regarding securities available for sale at June 30, 2018 is presented in “Item 1. Business” of this Annual Report on Form 10-K, as well as in Note 4 and Note 6 to the audited consolidated financial statements.
Investment Securities Held to Maturity. Investment securities classified as held to maturity increased by $96.4 million to $589.7 million at June 30, 2018 from $493.3 million at June 30, 2017. The increase in the portfolio largely reflected the impact of securities acquired from Clifton whose fair values totaled $68.0 million at the time of acquisition. In addition to the securities acquired from Clifton, the increase in held to maturity securities also reflected additional security purchases totaling $122.5 million. The noted increase in the portfolio was partially offset by cash repayment of principal, net of discount accretion and premium amortization, totaling $93.9 million for the year ended June 30, 2018 as well as the sale of one municipal security with a carrying value of $219,000. The sale of that security reflected a deterioration of the issuer’s financial condition that allowed for its sale from the held to maturity portfolio.
The held to maturity investment securities portfolio primarily included municipal obligations, subordinated debt, agency pass-through securities and agency collateralized mortgage obligations at June 30, 2018.
Based on its evaluation, management has concluded that no other-than-temporary impairment was present within the held to maturity segment of the investment portfolio as of June 30, 2018.
Additional information regarding securities held to maturity at June 30, 2018 is presented under “Item 1. Business” of this Annual Report on Form 10-K, as well as in Note 5 and Note 6 to the audited consolidated financial statements.
Loans Held-for-Sale. The Company’s residential lending infrastructure continues to support strategies focused on the origination volume of residential mortgage loans for sale into the secondary market which has enabled the Company to increase its level of non-interest income through the recognition of recurring loan sale gains while helping to manage the Company’s exposure to interest rate risk. During the year ended June 30, 2018, we sold $78.8 million of residential mortgage loans resulting in net sale gains totaling $742,000 for the period. Loans held for sale totaled $863,000 at June 30, 2018 compared to $4.7 million at June 30, 2017 and are reported separately from the balance of net loans receivable as of those dates.
Loans Receivable. Loans receivable, net of unamortized premiums, deferred costs and the allowance for loan losses, increased by $1.25 billion to $4.47 billion at June 30, 2018 from $3.22 billion at June 30, 2017. The increase largely reflected loans with fair values totaling $1.12 billion that were acquired in conjunction with Clifton acquisition. The loan portfolio acquired from Clifton primarily comprised residential and commercial mortgage loans. The growth in loans receivable attributable to the Clifton acquisition was augmented by organic loan origination and purchase volume outpacing loan repayments during the year ended June 30, 2018.
Residential mortgage loans held in portfolio, including home equity loans and lines of credit, increased by $738.1 million to $1.39 billion at June 30, 2018 from $650.1 million at June 30, 2017. The increase reflected an increase in the balance of one- to four-family first mortgage loans of $730.1 million to $1.30 billion at June 30, 2018 from $567.3 million at June 30, 2017 and an increase of $7.9 million in the balance of home equity loans and home equity lines of credit to $90.8 million at June 30, 2018 from $82.8 million at June 30, 2017.
Residential mortgage loan origination volume for the year ended June 30, 2018 totaled $73.2 million, comprised of $53.0 million of one- to four-family first mortgage loan originations and $20.2 million of home equity loan and home equity line of credit originations during the period. Residential mortgage loan originations were augmented with the purchase of one- to four-family first mortgage loans totaling $26.3 million during the year ended June 30, 2018. The Company may increase the outstanding balance of residential mortgage loans held in portfolio in the future to generally maintain the segment as a percentage of the loan portfolio.
Commercial loans, including multi-family and nonresidential commercial mortgage loans, commercial business loans and construction loans, increased by $594.7 million to $3.17 billion at June 30, 2018 from $2.58 billion at June 30, 2017. The components of the aggregate increase included an increase in commercial mortgage loans totaling $563.9 million that was augmented by increases in the outstanding balances of construction loans and commercial business loans of $19.4 million and $11.4 million, respectively. The outstanding balance of commercial mortgage loans at June 30, 2018 totaled $3.06 billion while the outstanding balances of construction and commercial business loans, totaled $23.3 million and $85.8 million, respectively, as of that date.
Commercial loan origination volume for the year ended June 30, 2018 totaled $509.9 million, comprised of $458.8 million of commercial mortgage loan originations augmented by $25.9 million of commercial business loan originations and construction loan disbursements totaling $25.2 million during the period. Commercial loan originations were augmented with the purchase of business loans totaling $28.3 million during the year ended June 30, 2018.
53
Other loans, primarily account loans, deposit account overdraft lines of credit and other consumer loans, decreased by $7.3 million to $9.1 million at June 30, 2018 from $16.4 million at June 30, 2017. The balance of other consumer loans at June 30, 2018 included loans with outstanding balances totaling $5.5 million that were originally acquired through the Company’s relationship with Lending Club, an established peer-to-peer (i.e. marketplace) lender. The Company limited its original investment in Lending Club loans to approximately $25.0 million in aggregate outstanding balances and has since discontinued purchases of such loans in favor of investing in other loan alternatives.
The Company originated a total of $1.4 million of passbook/certificate loans and other consumer loans during the year ended June 30, 2018, while no additional consumer loans were purchased during the period.
Nonperforming Loans. Nonperforming loans decreased by $2.0 million to $16.9 million, or 0.37% of total loans at June 30, 2018, from $18.9 million, or 0.58% of total loans at June 30, 2017. Nonperforming loans generally include loans reported as “accruing loans over 90 days past due” and loans reported as “nonaccrual” with such balances totaling $60,000 and $16.8 million, respectively, at June 30, 2018. The balance of loans acquired from Clifton included $5.4 million of nonperforming loans whose fair values at acquisition reflected negligible levels of impairment. The increase in nonperforming loans attributable to the Clifton acquisition was more than offset by the net decrease in the balance of other nonperforming loans during the year ended June 30, 2018.
Additional information about the Company’s nonperforming loans at June 30, 2018 is presented under “Item 1. Business” of this Annual Report on Form 10-K, as well as in Note 8 to the audited consolidated financial statements.
Allowance for Loan Losses. During the year ended June 30, 2018, the balance of the allowance for loan losses increased by $1.6 million to $30.9 million, or 0.68% of total loans at June 30, 2018, from $29.3 million, or 0.90% of total loans at June 30, 2017. The increase resulted from provisions of $2.7 million during the year ended June 30, 2018 that were partially offset by charge-offs, net of recoveries, totaling $1.1 million during that same period. The noted decrease in the “total loan coverage ratio” from 0.90% to 0.68% for the year ended June 30, 2018 largely reflects the impact of the Clifton acquisition and the related accounting standards which generally preclude acquired loan balances from being considered in the balance of the allowance for loan losses at the time of their acquisition. In lieu thereof, an accretable “credit mark” is established as a component of the purchase accounting fair value adjustments which directly reduces the carrying value of the acquired loan portfolio.
Additional information about the allowance for loan losses at June 30, 2018 is presented under “Item 1. Business” of this Annual Report on Form 10-K, as well as in Note 1 and Note 8 to the audited consolidated financial statements.
Other Assets. The aggregate balance of other assets, including premises and equipment, FHLB stock, interest receivable, goodwill, bank owned life insurance, deferred income taxes and other assets, increased by $252.7 million to $664.8 million at June 30, 2018 from $412.1 million at June 30, 2017. The increase in other assets primarily reflected the impact of the Clifton acquisition through which the Company acquired Clifton’s investments in premises and equipment, Federal Home Loan Bank of New York stock, accrued interest receivable, bank-owned life insurance, deferred income taxes and other miscellaneous assets at their respective fair values. The increase in other assets also reflected the Company’s recognition of a core deposit intangible totaling $6.4 million arising from the Clifton acquisition while the amount by which merger consideration exceeded the fair value of net assets acquired resulted in the recognition of $102.3 million in goodwill attributable to the Clifton acquisition.
In addition to those changes attributable to the acquisition of Clifton, the increase in other assets partly reflected a $24.1 million increase in the fair value of the Company’s interest rate derivatives portfolio to a net asset value of $31.9 million at June 30, 2018 compared to a net asset value of $7.8 million at June 30, 2017.
The increase in deferred income taxes resulting from the Clifton acquisition was partially offset by the impact of federal income tax reform that was codified through the passage of the Tax Act on December 22, 2017. As noted earlier, the Tax Act resulted in a $3.5 million net reduction in the carrying value of the Company’s deferred income tax assets and liabilities with an equal and offsetting charge to income tax expense during the year ended June 30, 2018.
The increase in other assets was also partially offset by a $907,000 decrease in the balance of real estate owned (“REO”) which decreased to $725,000, representing the carrying value of four properties at June 30, 2018, from $1.6 million, representing the carrying value of four properties at June 30, 2017.
Additional information regarding goodwill and other assets acquired from Clifton during fiscal 2018 is presented in Note 3 of the consolidated financial statements.
54
Deposits. Total deposits increased by $1.14 billion to $4.07 billion at June 30, 2018 from $2.93 billion at June 30, 2017. The increase in deposit balances reflected a $44.5 million increase in non-interest-bearing deposits coupled with a $1.10 billion increase in interest-bearing deposits. The increase in interest-bearing deposits included increases in the balances of interest-bearing checking accounts, certificates of deposit and savings and clubs accounts totaling $153.6 million, $725.7 million and $220.1 million, respectively. The increase in deposits largely reflected the effects of the Clifton acquisition through which the Company assumed deposits with fair values totaling $949.8 million that are housed across a retail banking network of 12 branches located in New Jersey’s Passaic, Bergen, Hudson and Essex counties.
The change in deposit balances for the year ended June 30, 2018 reflected changes in the balances of retail deposits as well as “non-retail” deposits acquired through various wholesale channels. The $153.6 million increase in the balance of interest-bearing checking accounts primarily reflected a $165.4 million increase in the balance of retail accounts. The growth in such accounts included retail deposits assumed in conjunction with the Clifton acquisition coupled with organic growth in other retail accounts. The increase in retail account balances was partially offset by an $11.8 million decrease in the balance of brokered money market deposits acquired through Promontory Interfinancial Network’s (“Promontory”) Insured Network Deposits (“IND”) program to $210.8 million, or 5.2% of total deposits at June 30, 2018 from $222.6 million, or 7.6% of total deposits at June 30, 2017.
Our Promontory IND program agreement matured and was terminated in July 2018 at which time all IND program deposits held by the Company were returned to Promontory. The funding provided by the IND program deposits at June 30, 2018 was largely replaced by FHLB advances totaling $200.0 million that were drawn concurrent with the return of the IND deposits to Promontory, as discussed in greater detail below.
We continued to utilize a deposit listing service through which we attract “non-brokered” wholesale time deposits targeting institutional investors with an original investment horizon of up to five years. We generally prohibit the withdrawal of our listing service deposits prior to maturity. The balance of the Bank’s listing service time deposits increased by $2.9 million to $104.3 million, or 2.6% of total deposits at June 30, 2018, compared to $101.4 million, or 3.5% of total deposits at June 30, 2017.
We also maintain a portfolio of brokered certificates of deposit whose balances increased by $62.7 million to $84.3 million at June 30, 2018 from $21.6 million at June 30, 2017. In combination with our Promontory IND money market deposits, our brokered deposits totaled $295.2 million, or 7.2% of deposits at June 30, 2018, compared to $244.2 million, or 8.3% of deposits at June 30, 2017.
Additional information regarding deposits acquired from Clifton during fiscal 2018 is presented in Note 3 of the consolidated financial statements.
Borrowings. The balance of borrowings increased by $392.4 million to $1.20 billion at June 30, 2018 from $806.2 million at June 30, 2017. The increase in borrowings largely reflected the effects of the Clifton acquisition through which the Company assumed FHLB term advances with fair values totaling $414.1 million. The increase in borrowings attributable to the Clifton acquisition was partly offset by the repayment of maturing FHLB advances coupled with changes in depositor sweep account balances representing normal day-to-day fluctuations in such balances.
Additional information regarding borrowings acquired from Clifton during fiscal 2018 is presented in Note 3 of the consolidated financial statements.
Other Liabilities. The balance of other liabilities, including advance payments by borrowers for taxes and other miscellaneous liabilities, increased by $13.9 million to $38.9 million at June 30, 2018 from $24.9 million at June 30, 2017. The change generally reflected the impact of the acquisition of Clifton coupled with normal operating fluctuations in the balances of other liabilities during the period.
Stockholders’ Equity. Stockholders’ equity increased by $211.6 million to $1.27 billion at June 30, 2018 from $1.06 billion at June 30, 2017. The increase in stockholders’ equity for the year ended June 30, 2018 partly reflected $330.7 million of capital stock issued by the Company in conjunction with the acquisition of Clifton. The increase also reflected net income of $19.6 million for the year ended June 30, 2018 from which the Company declared and paid regular quarterly cash dividends totaling $0.13 per share to stockholders during the period. Additionally, in September 2017, the Company declared a $0.12 special cash dividend payable to stockholders in October 2017. When combined with the regular cash dividends of $0.10 declared and paid during the prior fiscal year, the special dividend of $0.12 effectively increased the Company’s dividend payout ratio to approximately 100% based on its basic and diluted earnings per share of $0.22 reported for the prior fiscal year ended June 30, 2017. Together, the regular and special cash dividends declared during the year ended June 30, 2018 reduced stockholders’ equity by $20.2 million during the period.
55
The increase in stockholders’ equity also reflected a $1.9 million decrease in unearned ESOP shares coupled with a $17.5 million increase in accumulated other comprehensive income primarily reflecting net changes in the fair value of the Company’s derivatives and available for sale securities portfolios.
The factors contributing to the increase in stockholders’ equity noted above were partially offset by the impact of the Company’s share repurchases during fiscal 2018. In April 2018, the company announced the completion of its second share repurchase program, originally announced in May 2017, through which it repurchased a total of 8,559,084 shares, or 10%, of its outstanding shares, at a total cost of $122.0 million and at an average cost of $14.25 per share. Concurrently, the company announced its third share repurchase program through which it intends to repurchase a total of 10,238,557 shares, or 10% of its outstanding shares. Through June 30, 2018, the Company has repurchased a total of 2,695,460 shares or 26.3% of the shares to be repurchased under its third share repurchase plan, at a total cost of $38.4 million and at an average cost of $14.23 per share. Cumulatively for the year ended June 30, 2018, the Company has repurchased a total of 10,014,544 shares, at a total cost of $142.6 million, or an average cost of $14.24 per share. The cumulative cost of the Company’s repurchased shares has directly reduced the balance of stockholders’ equity at June 30, 2018.
At June 30, 2018, the Company had 99,626,400 shares outstanding, comprising 93,528,092 shares originally issued in conjunction with the Company’s “second step” stock offering, 25,438,042 shares issued in conjunction with the Company’s acquisition of Clifton, plus 1,267,619 net shares issued and cancelled relating to stock benefit plan obligations less 20,607,353 cumulative shares repurchased and cancelled through that date.
Comparison of Operating Results for the Years Ended June 30, 2018, and June 30, 2017
General. Net income for the year ended June 30, 2018 was $19.6 million, or $0.24 per diluted share; an increase of $993,000 from $18.6 million, or $0.22 per diluted share, for the year ended June 30, 2017. The increase in net income reflected increases in net-interest income and non-interest income coupled with a decrease in the provision for loan losses that were partially offset by an increase in non-interest expense. These factors contributed to an overall increase in pre-tax income and a corresponding increase in the provision for income taxes.
As discussed in greater detail below, the noted increase in income tax expense partly reflected the impact of federal income tax reform that was codified during the year ended June 30, 2018 while the increase in non-interest expense partly reflected the recognition of certain merger-related expenses related to the Company’s acquisition of Clifton.
Net Interest Income. Net interest income for the year ended June 30, 2018 was $121.3 million; an increase of $18.7 million from $102.6 million for the year ended June 30, 2017. The increase in net interest income between the comparative periods resulted from an increase in interest income of $32.3 million that was partially offset by a $13.6 million increase in interest expense. The increase in interest income was attributable to an increase in the average balance of interest-earning assets coupled with an increase in their average yield. The increase in interest expense resulted from an increase in the average balance of interest-bearing liabilities coupled with an increase in their average cost.
The noted increase in the average balances of interest-earning assets and interest-bearing liabilities and the associated increases in their average yields and costs, respectively, reflected the impact of the Clifton acquisition which closed on April 2, 2018. As required by applicable accounting standards, the Company recorded purchase accounting adjustments to the carrying value of all assets acquired and liabilities assumed from Clifton to reflect their fair values at the time of acquisition. With specific regard to the interest-earning assets acquired and interest-bearing liabilities assumed, such adjustments generally accrete or amortize into interest income and interest expense, respectively, on a level-yield/cost basis over their estimated remaining lives. As a result, the “post-acquisition” yield or cost recognized by the Company on the assets and liabilities acquired generally reflect the comparable market interest rates for such instruments at the time of their acquisition.
As presented in the separate discussion and analysis of interest income and interest expense below, these acquisition-related factors contributed significantly to the 11 basis point increase in our net interest rate spread to 2.25% for the year ended June 30, 2018 from 2.14% for the year ended June 30, 2017. The increase in the net interest rate spread reflected a 27 basis points increase in the average yield on interest-earning assets to 3.54% for the year ended June 30, 2018 from 3.27% for the year ended June 30, 2017. For those same comparative periods, the average cost of interest-bearing liabilities increased by 16 basis points to 1.29% from 1.13%.
The factors resulting in the reported increase in our net interest rate spread also affected our net interest margin. In total, the Company’s net interest margin increased nine basis point to 2.50% for the year ended June 30, 2018 compared to 2.41% for the year ended June 30, 2017.
56
Interest Income. Total interest income increased $32.3 million to $171.4 million for the year ended June 30, 2018 from $139.1 million for the year ended June 30, 2017. The increase in interest income partly reflected a $595.9 million increase in the average balance of interest-earning assets to $4.85 billion for the year ended June 30, 2018 from $4.25 billion for the year ended June 30, 2017. For those same comparative periods, the yield on earning assets increased by 27 basis points to 3.54% from 3.27%.
Interest income from loans increased $27.2 million to $138.4 million for the year ended June 30, 2018 from $111.2 million for the year ended June 30, 2017. The increase in interest income on loans was attributable to a net increase in the average balance of loans coupled by an increase in the average yield.
The average balance of loans increased by $621.9 million to $3.58 billion for the year ended June 30, 2018 from $2.96 billion for the year ended June 30, 2017. The increase in the average balance of loans primarily reflected an aggregate increase of $475.5 million in the average balance of commercial loans to $2.74 billion for the year ended June 30, 2018 from $2.27 billion for the year ended June 30, 2017. Our commercial loans generally comprise commercial mortgage loans, including multi-family and nonresidential mortgage loans, as well as secured and unsecured commercial business loans and construction loans secured by one- to four-family residential, multi-family and non-residential properties.
The increase in the average balance of commercial loans was coupled with a $172.6 million increase in the average balance of residential mortgage loans to $835.6 million for the year ended June 30, 2018 from $663.0 million for the year ended June 30, 2017. Our residential mortgages generally comprise one- to four-family first mortgage loans, home equity loans and home equity lines of credit.
For those same comparative periods, the average balance of other loans, primarily comprising unsecured consumer term loans, account loans and deposit account overdraft lines of credit, decreased by $8.4 million to $12.2 million from $20.6 million. The decrease in the average balance of other loans largely reflected a decrease in the average outstanding balance of unsecured consumer term loans acquired through Lending Club.
The average yield on loans increased by 11 basis points to 3.87% for the year ended June 30, 2018 from 3.76% for the year ended June 30, 2017. The increase in the average balance and average yield on loans primarily reflected the effects of the Clifton acquisition through which the “post-acquisition” yield on the loans acquired reflect the comparable market interest rates for such loans at the time of their acquisition, as discussed earlier. In general, the “post-acquisition” yield on the acquired loans exceeded that of the Company’s existing loan portfolio which contributed to the overall increase in the yield on loans between comparative periods.
Interest income from taxable investment securities increased by $3.5 million to $27.1 million for the year ended June 30, 2018 from $23.5 million for the year ended June 30, 2017. The increase in interest income reflected an increase in the average yield of taxable investment securities that was partially offset by a decrease in their average balance.
The average yield on taxable investment securities increased by 37 basis points to 2.58% for the year ended June 30, 2018 from 2.21% for the year ended June 30, 2017. The increase in yield on taxable investment securities was partly attributable to the effects of the Clifton acquisition noted above coupled with an increase in floating rate securities whose yields increased in conjunction with increases in short-term market interest. For those same comparative periods, the average balance of taxable investment securities decreased by $18.3 million to $1.05 billion from $1.07 billion. The decrease in the average balance of taxable investment securities largely reflected the level of aggregate principal repayments outpacing aggregate security purchases.
Interest income from tax-exempt investment securities increased by $316,000 to $2.6 million for the year ended June 30, 2018 from $2.3 million for the year ended June 30, 2017. The increase in interest income reflected an increase in the average balance of tax-exempt investment securities coupled with an increase in their average yield. The average balance of tax-exempt investment securities increased by $13.2 million to $127.8 million for the year ended June 30, 2018 from $114.5 million for the year ended June 30, 2017. For those same comparative periods, the average yield of tax-exempt investment securities increased four basis points to 2.05% during the year ended June 30, 2018 from 2.01%.
Interest income from other interest-earning assets increased by $1.2 million to $3.3 million for the year ended June 30, 2018 from $2.1 million for the year ended June 30, 2017. The increase in interest income reflected an increase in the average yield on other interest-earning assets that was partially offset by a decrease in their average balance. The average yield on other interest-earning assets increased by 177 basis points to 3.58% for the year ended June 30, 2018 from 1.81% for the year ended June 30, 2017. For those same comparative periods, the average balance of other interest-earning assets decreased by $20.9 million to $93.2 million from $114.1 million.
57
The increase in average yield on other interest earning assets primarily reflected the effects of recent increases in short-term market interest rates on the yield on Company’s short-term liquid assets. The corresponding decrease in the average balance largely reflected the Company’s efforts to reduce the opportunity cost of maintaining excess liquidity by reinvesting a portion of cash and cash equivalents into the loan portfolio. The effect of these efforts was partially offset by an increase in the average balance of the Bank’s required investment in FHLB stock.
Interest Expense. Total interest expense increased by $13.6 million to $50.1 million for the year ended June 30, 2018 from $36.5 million for the year ended June 30, 2017. The increase in interest expense resulted from an increase in the average balance of interest-bearing liabilities coupled with an increase in their average cost. The average balance of interest-bearing liabilities increased by $656.8 million to $3.87 billion for the year ended June 30, 2018 from $3.22 billion for the year ended June 30, 2017. For those same comparative periods, the average cost of interest-bearing liabilities increased 16 basis points to 1.29% from 1.13%.
Interest expense attributed to deposits increased by $7.5 million to $29.6 million for the year ended June 30, 2018 from $22.1 million for the year ended June 30, 2017. The increase in interest expense was attributable to increases in the average balance and average cost of interest-bearing deposits.
The average balance of interest-bearing deposits increased by $432.0 million to $2.96 billion for the year ended June 30, 2018 from $2.53 billion for the year ended June 30, 2017. The increase in the average balance was reflected across all categories of interest-bearing deposits and reflected the combined effects of the Clifton acquisition coupled with organic growth in deposits. For the comparative periods noted, the average balance of interest-bearing checking accounts increased by $127.1 million to $897.0 million from $769.9 million, the average balance of certificates of deposit increased by $255.2 million to $1.50 billion from $1.24 billion and the average balance of savings and club accounts increased by $50.3 million to $569.8 million from $519.5 million.
The average cost of interest-bearing deposits increased by 13 basis points to 1.00% for the year ended June 30, 2018 from 0.87% for the year ended June 30, 2017. The net increase in the average cost was reflected across all categories of interest-bearing deposits. For the comparative periods noted, the average cost of certificates of deposit increased 10 basis points to 1.42% from 1.32%, the average cost of interest-bearing checking accounts increased 16 basis points to 0.82% from 0.66% and the average cost of savings and club accounts increased four basis point to 0.17% from 0.13%.
Interest expense attributed to borrowings increased by $6.1 million to $20.5 million for the year ended June 30, 2018 from $14.4 million for the year ended June 30, 2017. The increase in interest expense reflected an increase in the average balance of borrowings coupled with an increase in their average cost. The average balance of borrowings increased by $224.7 million to $910.5 million for the year ended June 30, 2018, from $685.8 million for the year ended June 30, 2017. For those same comparative periods, the average cost of borrowings increased by 15 basis points to 2.25% from 2.10%.
The increase in the average balance of borrowings primarily reflected a $228.9 million increase in the average balance of FHLB advances to $876.3 million for the year ended June 30, 2018 from $647.4 million for the year ended June 30, 2017. For those same comparative periods, the average cost of FHLB advances increased by 11 basis points to 2.32% from 2.21%. The increase in the average balance and average cost of FHLB advances largely reflected the impact of the Clifton acquisition while also reflecting the effect of additional short-term FHLB advances drawn during the latter half of fiscal 2017 to fund a portion of our growth during the prior fiscal year. With regard to the noted advances that we drew during fiscal 2017, we utilized interest rate derivatives at the time the borrowings were drawn to effectively swap their rolling 90-day maturity/repricing characteristics into fixed rates for longer terms.
The increase in the average balance of borrowings was partially offset by a $4.1 million decrease in the average balance of depositor sweep accounts to $34.3 million for the year ended June 30, 2018 from $38.4 million for the year ended June 30, 2017. The average cost of other borrowings increased by seven basis points to 0.40% from 0.33% between the same comparative periods.
Provision for Loan Losses. The provision for loan losses decreased by $2.7 million to $2.7 million for the year ended June 30, 2018 from $5.4 million for the year ended June 30, 2017. The decrease was partly attributable to a lower provision on non-impaired loans evaluated collectively for impairment that was partially offset by an increase in the provision attributable to losses recognized on loans individually reviewed for impairment. Regarding the provision on non-impaired loans, the net decrease in the provision expense largely reflected the lower growth in the outstanding balance of the non-acquired loan portfolio that was collectively evaluated for impairment during fiscal 2018 compared to fiscal 2017. To a lesser extent, the change in the provision on such loans also reflected the comparative effects of periodic updates to historical and environmental loss factors between periods. The decrease in provision expense attributable to non-impaired loans was partially offset by an increase in the provision for specific losses recognized on nonperforming loans charged off or individually evaluated for impairment between comparative periods.
Additional information regarding the allowance for loan losses and the associated provisions recognized during the year ended June 30, 2018 is presented under “Item 1. Business” of this Annual Report on Form 10-K as well as in Note 1 and Note 8 to the audited consolidated financial statements.
58
Non-Interest Income. Non-interest income, excluding gains and losses on the sale of securities and gains and losses on the sale and write-down of real estate owned, increased by $1.8 million to $13.3 million for the year ended June 30, 2018 from $11.5 million for the year ended June 30, 2017. The increase in non-interest income primarily reflected a $2.1 million increase in fees and service charges. The noted increase primarily reflected an increase in loan-related fees and charges attributable to an increase in loan prepayment penalties, while also reflecting an increase in deposit-related service charges. The increase in non-interest income also reflected a $155,000 increase in the income recognized on bank-owned life insurance that was largely attributable to the additional income earned on the cash surrender value of the applicable policies acquired in conjunction the Clifton acquisition.
The increase in non-interest income was partially offset by a decrease in the gain on sale of loans of $531,000. The decrease in loan sale gains was largely attributable to a decrease in SBA loan sale gains that primarily reflected a lower volume of loans originated and sold between comparative periods. The decrease in SBA loan sale gains was partially offset by an increase in sale gains associated with residential mortgage loans sold in conjunction with the Company’s mortgage banking strategy.
We also recognized net losses totaling $19,000 arising from the write down and sale of REO during the year ended June 30, 2018 compared to $106,000 of such losses recognized during the earlier comparative period. Additionally, we recognized net gains of $8,000 on sale and calls of securities during the year ended June 30, 2018 compared to net losses of $1,000 recognized during the earlier comparative period.
The remaining changes in the other components of non-interest income between comparative periods generally reflected normal operating fluctuations within those line items.
Non-Interest Expenses. Non-interest expense increased by $16.7 million to $97.8 million for the year ended June 30, 2018 from $81.1 million for the year ended June 30, 2017. The net increase in non-interest expense partly reflected the recognition of $6.7 million in merger-related expenses related to the Company’s acquisition of Clifton. The remaining $10.0 million increase in non-interest expense was reflected across most other categories of non-interest expense and also reflected the effects of the Clifton acquisition. Most notably, the increase in salaries and employee benefits, premises occupancy expense, equipment and systems expense and deposit insurance expense were largely attributable to the increase in recurring non-interest expenses arising from the Clifton acquisition.
Salaries and employee benefits expense increased by $6.2 million to $54.0 million for the year ended June 30, 2018 from $47.8 million for the year ended June 30, 2017. The increase in salaries and employees benefits expense generally reflected increases associated with the additional employees retained in conjunction with the Clifton acquisition while also reflecting increases in certain compensation and benefit expenses attributable to the Company’s existing roster of employees. Such increase included annual increases in non-executive wages and salaries for fiscal 2018 and the cost of “non-acquisition-related” staffing additions within certain lending, business development and operational support functions. The increase also reflected an increase in employee stock benefit plan expenses arising from the benefits to employees under the terms of the Company’s 2016 Equity Incentive Plan approved by stockholders in October 2016 as well as increases in health insurance and employee retirement plan expenses. These increases were partially offset by decreases in employee bonus and commission compensation expenses as well as a decrease in ESOP expense reflecting a decrease in the average market price of the Company’s shares of common stock between comparative periods.
Premises occupancy expense increased by $1.2 million to $9.2 million for the year ended June 30, 2018 from $8.0 million for the year ended June 30, 2017. The increase was attributable to the ongoing operating expenses associated with the owned and leased office facilities acquired by the Company in conjunction with the Clifton acquisition. The increase in premises occupancy expense also reflected an increase in facility lease expenses arising from costs associated with forthcoming branch additions and relocations, coupled with increases in facility repairs and maintenance and depreciation expenses relating to existing administrative and branch facilities. The increase in premises occupancy expense also reflected an increase in property tax expense arising from the effects of successful real estate tax appeals negotiated and settled during the earlier comparative period coupled with current period increases attributable to the forthcoming branch additions noted earlier.
Equipment and systems expense increased by $1.1 million to $9.5 million for the year ended June 30, 2018 from $8.4 million for the year ended June 30, 2017. The increase in equipment and systems expense was largely attributable to the ongoing operating expenses associated with the in-house and outsourced information technology, core processing and electronic banking delivery channel infrastructure acquired by the Company in conjunction with the Clifton acquisition.
Advertising and marketing expense increased by $334,000 to $3.0 million for the year ended June 30, 2018 from $2.6 million for the year ended June 30, 2017. Unlike the other categories of non-interest expense discussed above, the increase in advertising and marketing expense was generally unrelated to the Clifton acquisition and largely reflected increases in advertising expenses across a variety of advertising formats including outdoor and electronic media reflecting normal fluctuations in the timing of certain advertising campaigns supporting the Company’s loan and deposit growth initiatives.
59
Finally, directors’ compensation expense increased by $838,000 to $2.8 million for the year ended June 30, 2018 from $2.0 million for the year ended June 30, 2017. The increase in expense primarily reflected an increase in stock benefit plan expenses arising from the benefits to directors under the terms of the Company’s 2016 Equity Incentive Plan, as noted above. The increase also reflected an increase in director fees attributable to the three directors added to the Company’s board in conjunction with the Clifton acquisition.
Provision for Income Taxes. The provision for income taxes increased by $5.6 million to $14.4 million for the year ended June 30, 2018 from $8.8 million for the year ended June 30, 2017. The variance in income tax expense partly reflected the impact of the underlying differences in the level of the taxable portion of pre-tax income between comparative periods. However, the increase in income tax expense also reflected the impact of federal income tax reform that was codified through the passage of the Tax Act on December 22, 2017. The Tax Act permanently reduced the Company’s federal income tax rate from 35% to 21% while also including other provisions that altered the deductibility of certain recurring expenses recognized by the Company. The provisions of the Tax Act resulted in a $3.5 million net reduction in the carrying value of the Company’s deferred income tax assets and liabilities with an equal and offsetting charge to income tax expense during the year ended June 30, 2018. The $3.5 million charge to income tax expense resulted from a $4.9 million charge to reflect the reduced carrying value of the Company’s net deferred tax asset attributable to timing differences in the recognition of certain income and expense items for financial statement reporting purposes versus that recognized for income tax reporting purposes. That charge was partially offset by a $1.4 million reduction in the net deferred income tax liability primarily attributable to the net unrealized gains and losses on the Company’s interest rate derivatives and available for sale securities portfolios.
The net charge of $3.5 million attributable to the changes in the carrying value of deferred income tax items was partially offset by a $769,000 reduction in current-year income tax expense attributable to the noted reduction in the Company’s income tax rate. For the current transition year ended June 30, 2018, the Company’s statutory federal income tax rate has been reduced to 28%, reflecting effective statutory rates of 35% and 21% for the first and second halves of the year, respectively. For the fiscal year ending June 30, 2019 and thereafter, the Company’s statutory federal income tax rate will be reduced to 21%.
Our effective tax rates during the years ended June 30, 2018 and June 30, 2017 were 42.4% and 32.2%, respectively. In relation to statutory income tax rates, the effective tax rate for both periods reflected the effects of recurring sources of tax-favored income included in pre-tax income. However, the effective tax rate for the year ended June 30, 2018 reflected the effects of federal income tax reform and certain non-deductible merger-related expenses, as discussed earlier, whose effects collectively increased the effective income tax rate during the period. By contrast, the effective income tax rate for the year ended June 30, 2017 reflected the effects of non-recurring tax deductions recognized on the disqualifying disposition of incentive stock options by employees which decreased the effective income tax rate during the period.
Comparison of Operating Results for the Years Ended June 30, 2017 and June 30, 2016
General. Net income for the year ended June 30, 2017 was $18.6 million or $0.22 per diluted share, an increase of $2.8 million from $15.8 million or $0.18 per diluted share for the year ended June 30, 2016. The increase in net income reflected increases in net interest income and non-interest income coupled with a decrease in the provision for loan losses that were partially offset by an increase in non-interest expense. These factors contributed to an overall increase in pre-tax net income and a corresponding increase in the provision for income taxes.
Net Interest Income. Net interest income for the year ended June 30, 2017 was $102.6 million; an increase of $7.6 million from $95.0 million for the year ended June 30, 2016. The increase in net interest income between the comparative periods resulted from an increase in interest income that was partially offset by an increase in interest expense. The increase in interest income was attributable to an increase in the average balance of interest-earning assets coupled with an increase in their average yield. The increase in interest expense resulted from an increase in the average balance of interest-bearing liabilities coupled with an increase in their average cost.
As a result of these factors, our net interest rate spread increased eight basis points to 2.14% for the year ended June 30, 2017 from 2.06% for the year ended June 30, 2016. The increase in the net interest rate spread reflected a 14 basis points increase in the average yield on interest-earning assets to 3.27% for the year ended June 30, 2017 from 3.13% for the year ended June 30, 2016. For those same comparative periods, the average cost of interest-bearing liabilities increased by six basis points to 1.13% from 1.07%. A discussion of the factors contributing to changes in the average yield and average cost of categories within interest-earning assets and interest-bearing liabilities, respectively, is presented in the separate discussion and analysis of interest income and interest expense below.
60
The factors resulting in the reported increase in our net interest rate spread also affected our net interest margin. In total, the Company’s net interest margin increased six basis points to 2.41% for the year ended June 30, 2017 compared to 2.35% for the year ended June 30, 2016.
Interest Income. Total interest income increased $12.2 million to $139.1 million for the year ended June 30, 2017 from $126.9 million for the year ended June 30, 2016. As noted above, the increase in interest income partly reflected a $200.6 million increase in the average balance of interest-earning assets to $4.25 billion for the year ended June 30, 2017 from $4.05 billion for the year ended June 30, 2016. For those same comparative periods, the yield on earning assets increased by 14 basis points to 3.27% from 3.13%.
Interest income from loans increased $13.2 million to $111.2 million for the year ended June 30, 2017 from $98.0 million for the year ended June 30, 2016. The increase in interest income on loans was attributable to a net increase in the average balance of loans that was partially offset by a decline in their average yield.
The average balance of loans increased by $443.5 million to $2.96 billion for the year ended June 30, 2017 from $2.51 billion for the year ended June 30, 2016. The reported increase in the average balance of loans primarily reflected an aggregate increase of $483.7 million in the average balance of commercial loans to $2.27 billion for the year ended June 30, 2017 from $1.78 billion for the year ended June 30, 2016.
For those same comparative periods, the average balance of other loans, primarily comprising unsecured consumer term loans, account loans and deposit account overdraft lines of credit, increased by $5.1 million to $20.6 million from $15.5 million. The increase in the average balance of other loans primarily reflected the increased balance of unsecured consumer term loans acquired through Lending Club.
The increase in the average balance of commercial and consumer loans was partially offset by a $43.3 million decrease in the average balance of residential mortgage loans to $663.0 million for the year ended June 30, 2017 from $706.3 million for the year ended June 30, 2016. For those same comparative periods, the average balance of construction loans decreased by $2.6 million to $1.6 million for the year ended June 30, 2017 from $4.2 million for the year ended June 30, 2016.
The effect on interest income attributable to the net increase in the average balance of loans was partially offset by the noted decrease in their average yield. The average yield on loans decreased by 14 basis points to 3.76% for the year ended June 30, 2017 from 3.90% for the year ended June 30, 2016. The reduction in the overall yield on our loan portfolio largely reflected the effect of the comparatively lower average yield on most newly originated loans in relation to that of the portfolio of existing loans which reduced the overall yield of the aggregate portfolio. To a lesser extent, the decline in the average yield generally reflected the effects of low market interest rates that provide “rate reduction” refinancing incentive to existing borrowers while also contributing to the downward re-pricing of adjustable rate loans.
Interest income from taxable investment securities decreased by $1.4 million to $23.5 million for the year ended June 30, 2017 from $25.0 million for the year ended June 30, 2016. The decrease in interest income reflected a decrease in the average balance of taxable investment securities that was partially offset by an increase in their average yield.
The average balance of taxable investment securities decreased by $167.0 million to $1.1 billion for the year ended June 30, 2017 from $1.2 billion for the year ended June 30, 2016. The decrease in the average balance of taxable investment securities largely reflected the level of aggregate principal repayments and security sales between comparative periods outpacing aggregate security purchases. For those same comparative periods, the average yield on taxable investment securities increased by 19 basis points to 2.21% for the year ended June 30, 2017 from 2.02% for the year ended June 30, 2016. The increase in yield on taxable investment securities was partly attributable to floating rate securities whose interest rates had increased due to increases in short-term market interest rates.
Interest income from tax-exempt investment securities increased by $109,000 million to $2.3 million for the year ended June 30, 2017 from $2.2 million for the year ended June 30, 2016. The increase in interest income reflected an increase in the average balance of tax-exempt investment securities coupled with an increase in their average yield.
The average balance of tax-exempt investment securities increased by $4.5 million to $114.5 million for the year ended June 30, 2017 from $110.0 million for the year ended June 30, 2016. The increase in the average yield reflected a two basis points increase in the yield on tax-exempt investment securities to 2.01% during the year ended June 30, 2017 from 1.99% during the year ended June 30, 2016.
61
Interest income from other interest-earning assets increased by $298,000 to $2.1 million for the year ended June 30, 2017 from $1.8 million for the year ended June 30, 2016 reflecting an increase in their average yield that was partially offset by a decrease in their average balance. The average yield on other interest-earning assets increased by 90 basis points to 1.81% for the year ended June 30, 2017 from 0.91% for the year ended June 30, 2016. For those same comparative periods, the average balance of other interest-earning assets decreased by $80.3 million to $114.1 million from $194.5 million. The increase in average yield and decrease in the average balance of other interest earning assets largely reflected the Company’s efforts to reduce the opportunity cost of maintaining excess liquidity by reinvesting a portion of cash and cash equivalents into the loan portfolio during the fiscal year ended June 30, 2017.
Interest Expense. Total interest expense increased by $4.6 million to $36.5 million for the year ended June 30, 2017 from $31.9 million for the year ended June 30, 2016. As noted earlier, the increase in interest expense resulted from an increase in the average balance of interest-bearing liabilities coupled with an increase in their average cost. The average balance of interest-bearing liabilities increased by $244.2 million to $3.22 billion for the year ended June 30, 2017 from $2.97 billion for the year ended June 30, 2016. For those same comparative periods, the average cost of interest-bearing liabilities increased six basis points to 1.13% from 1.07%.
Interest expense attributed to deposits increased by $3.4 million to $22.1 million for the year ended June 30, 2017 from $18.7 million for the year ended June 30, 2016. The increase in interest expense was attributable to increases in the average cost and average balance of interest-bearing deposits.
The average cost of interest-bearing deposits increased by eight basis points to 0.87% for the year ended June 30, 2017 from 0.79% for the year ended June 30, 2016. The net increase in the average cost largely reflected an increase in the average cost of certificates of deposit, which increased 10 basis points to 1.32% for the year ended June 30, 2017 from 1.22% for the year ended June 30, 2016. For those same comparative periods, the average cost of interest-bearing checking accounts increased seven basis points to 0.66% from 0.59% while the average cost of savings and club accounts decreased three basis points to 0.13% from 0.16%.
The average balance of interest-bearing deposits increased by $175.9 million to $2.53 billion for the year ended June 30, 2017 from $2.36 billion for the year ended June 30, 2016. The increase in the average balance was reflected across all categories of interest-bearing deposits. For the comparative periods noted, the average balance of certificates of deposit increased by $126.0 million to $1.24 billion from $1.12 billion, the average balance of interest-bearing checking accounts increased by $46.8 million to $769.8 million from $723.0 million and the average balance of savings and club accounts increased by $3.1 million to $519.5 million from $516.4 million.
Interest expense attributed to borrowings increased by $1.2 million to $14.4 million for the year ended June 30, 2017 from $13.2 million for the year ended June 30, 2016. The increase in interest expense on borrowings reflected an increase in their average balance that was partially offset by a decrease in their average cost. The average balance of borrowings increased by $68.3 million to $685.8 million for the year ended June 30, 2017 from $617.5 million for the year ended June 30, 2016. For those same comparative periods, the average cost of borrowings decreased four basis points to 2.10% from 2.14%.
The increase in the average balance of borrowings largely reflected a $65.2 million increase in the average balance of FHLB advances to $647.4 million for the year ended June 30, 2017 from $582.1 million for the year ended June 30, 2016. For those same comparative periods, the average cost of FHLB advances decreased three basis points to 2.21% from 2.24% largely reflecting the Company’s greater use of lower-costing, overnight borrowings to temporarily fund a portion of loan growth during the year ended June 30, 2017.
The noted increase in the average balance of borrowings also reflected a $3.0 million increase in the average balance of other borrowings, comprised primarily of depositor sweep accounts, to $38.4 million from $35.4 million. The average cost of sweep accounts decreased by 18 basis points to 0.33% from 0.51% between the same comparative periods.
Provision for Loan Losses. The provision for loan losses decreased by $5.3 million to $5.4 million for the year ended June 30, 2017 from $10.7 million for the year ended June 30, 2016. The decrease was largely attributable to a lower provision on non-impaired loans evaluated collectively for impairment coupled with a decrease in specific losses recognized on nonperforming loans individually reviewed for impairment.
62
Regarding the provision on non-impaired loans, the noted decrease largely reflected the comparative effects of updates to historical and environmental loss factors between periods. The changes to historical loss factors generally reflected the impact of a decreased level of net charge offs recognized during the year ended June 30, 2017 on the two-year lookback period used to calculate the Company’s historical loss factors coupled with the “roll off” of the net charge offs from the same period two years earlier. The Company also updated certain environmental loss factors during the year ended June 30, 2017. Such updates primarily reflected an increase in the level of estimated credit losses attributable to the increased concentration and decreased seasoning in the Company’s commercial mortgage loan sectors. To a lesser extent, the net decrease in the provision expense reflected slightly lower growth in the outstanding balance of loans collectively evaluated for impairment during fiscal 2017 compared to fiscal 2016.
The provision for loan losses for the year ended June 30, 2017 reflected the impact of the “re-segmentation” of the loan portfolio on the Company’s environmental loss factors. As noted therein, such loss factors were re-evaluated and re-allocated, where appropriate, to reflect the more granular segmentation of loans in the allowance for loan loss calculation during the first quarter of fiscal 2017. Where appropriate, the specific criteria and/or basis upon which the Company derives the environmental loss factors ascribed to loans was also revised or enhanced in conjunction with the segmentation changes noted.
The implementation of the segmentation changes within the loan portfolio in the calculation of the allowance for loan loss did not result in a significant change in the required, aggregate balance of the allowance attributable to loans evaluated collectively for impairment. Consequently, the decrease in the provision for loan losses during the year ended June 30, 2017 largely reflected updates to the historical and environmental loss factors coupled with the lesser effect of a comparatively lower level of growth in the unimpaired portion of the loan portfolio between comparative periods. As noted above, the decrease in provision also reflected a decrease in losses recognized on specific loans individually reviewed for impairment.
Additional information regarding the allowance for loan losses and the associated provisions recognized during the year ended June 30, 2017 is presented in “Item 1. Business” of this Annual Report on Form 10-K, as well as in Note 1 and Note 8 to the audited consolidated financial statements.
Non-Interest Income. Non-interest income, excluding gains and losses on the sale of securities and gains and losses on the sale and write-down of real estate owned, increased by $593,000 to $11.5 million for the year ended June 30, 2017 from $10.9 million for the year ended June 30, 2016. The increase was largely attributable to a $1.1 million increase in the gain on sale of loans. The increase in loan sale gains included a $468,000 increase in gains associated with the sale of SBA loans arising from an increase in loans originated and sold. The increase in loan sale gains also included $631,000 in gains on sale of residential mortgage loans reflecting the continued expansion of the Company’s mortgage banking business strategy during fiscal 2017.
The noted increases in non-interest income were partially offset by a $356,000 decrease in the income recognized on bank-owned life insurance that largely reflected the effects of lower market interest rates on the yields earned by the Company on its underlying policies. A decrease in fees and service charges also offset a portion of the overall increase in non-interest income. A significant portion of the decrease in fees and service charges reflected a reduction in deposit-related merchant processing fees that was fully offset by a corresponding decrease in merchant processing service provider expenses that partially offset the increase in non-interest expense within the category of equipment and systems expenses. To a lesser extent, the decrease in fees and service charges also reflected decreases in other deposit-related fees and charges, including account overdraft and electronic banking fees and charges, as well as a reduction in loan-related prepayment charges.
We also recognized net losses totaling $106,000 arising from the write down and sale of REO during the year ended June 30, 2017 compared to net losses of $137,000 recognized during the earlier comparative period. The decrease in losses relating to the disposal of real estate owned were partially offset by a nominal decrease in gains and losses arising from the sale and call of securities.
Non-Interest Expenses. Non-interest expense increased by $8.7 million to $81.1 million for the year ended June 30, 2017 from $72.4 million for the year ended June 30, 2016. The net increase in non-interest expense primarily reflected increases in salary and employee benefits expense, director compensation expense and miscellaneous expense with lesser increases reflected in premises occupancy expense, equipment and system expense and advertising and marketing expense. These increases were partially offset by a decrease in deposit insurance expense.
Salaries and employee benefits expense increased by $5.7 million to $47.8 million for the year ended June 30, 2017 from $42.1 million for the year ended June 30, 2016. The increases in salaries and employee benefits partly reflected the impact of the Company’s 2016 Equity Incentive Plan approved by shareholders in October 2016. Based on the original value of the grants at the time they were issued on December 1, 2016, coupled with the five year vesting period, the aggregate “pre-tax” and “after-tax” expense associated with the noted grants total approximately $6.2 million and $4.3 million per year, respectively, of which approximately $3.6 million and $2.5 million were recognized during the latter seven months of fiscal 2017, respectively. Approximately $2.5 million of such “pre-tax” expenses were allocated and reported in salaries and employee benefits with the remaining $1.1 million included in director compensation, as discussed below.
63
The increase in salaries and employee benefits also reflected increases in employee compensation costs arising from an incremental increase in the number of FTE employees during fiscal 2017, as well as overall increases in employee health insurance costs. Additionally, retirement plan-related expenses increased due to an increase in the Company’s contribution to its employee defined-benefit pension plan as well as an increase in ESOP expense attributable to the increase in the average market price of the Company’s shares of capital stock during fiscal 2017 compared to fiscal 2016.
The $1.2 million increase in director compensation expense for fiscal 2017 primarily reflected $1.1 million in allocated expenses attributable to director benefits associated with the Company’s 2016 Equity Incentive Plan, as noted above. The remaining portion of the variance reflected an increase in director fees that was primarily attributable to the addition of two independent directors during fiscal 2016 whose “full-year” annual compensation expense were fully reflected during fiscal 2017.
While reflecting a variety of increases across a number of general and administrative expenses, the $1.4 million increase in miscellaneous expense for fiscal 2017 largely reflected the noteworthy effect of the Company’s recognition of a $931,000 non-recurring recovery of pension plan expense during fiscal 2016 that resulted from amending the terms of its Director Consultation and Retirement Plan (the “DCRP“).
The increase in premises occupancy expense partly reflected an increase in facility rent expense due to the revised terms of certain facility leases renewed during fiscal 2017 coupled with the additional cost of a new ground lease associated with a forthcoming branch relocation. The increase in premises occupancy expense also reflected an increase in facility repairs and maintenance expenses and real estate tax expenses relating to the Company’s branch and administrative facilities.
The increase in equipment and systems expense largely reflected the recognition of a non-recurring recovery of certain historical data network charges that reduced technology service provider expenses during the fiscal year ended June 30, 2016.
The increase in advertising and marketing expense were primarily attributable to increased print, electronic media and outdoor advertising costs associated with specific campaigns supporting targeted business strategies focused on expansion of commercial business banking and consumer deposit products, services and relationships.
Finally, the decrease in deposit insurance expense primarily reflected a reduction in the Bank’s FDIC assessment rate that went into effect on July 1, 2016.
Provision for Income Taxes. The provision for income taxes increased by $2.0 million to $8.8 million for the year ended June 30, 2017 from $6.8 million for the year ended June 30, 2016. The increase in income tax expense primarily reflected the underlying differences in the level of the taxable portion of pre-tax income between comparative periods.
Our effective tax rates during the years ended June 30, 2017 and June 30, 2016 were 32.2% and 30.0%, respectively, which in relation to statutory income tax rates, reflected the effects of recurring sources of tax-favored income included in pre-tax income as well as the effects of non-recurring tax deductions recognized on the disqualifying disposition of incentive stock options by employees.
64
Average Balance Sheet. The following table sets forth certain information relating to Kearny Financial at and for the periods indicated. We derived the average yields and costs by dividing income or expense by the average balance of assets or liabilities, respectively, for the periods presented with daily balances used to derive average balances. No tax equivalent adjustments have been made to yield or costs.
| | | | | | | | | | For the Years Ended June 30, |
| At June 30, 2018 | | 2018 | | 2017 | | 2016 |
| Actual Balance | | | Weighted Average Interest Rate | | Average Balance | | | Interest | | | Average Yield/ Cost | | Average Balance | | | Interest | | | Average Yield/ Cost | | Average Balance | | | Interest | | | Average Yield/ Cost |
| (Dollars In Thousands) |
Interest-earning assets: | | | | | | | | | | | | | | | | | | | | | | | | | | | | | | | | | | | | | | | | | | | | | | | |
Loans receivable (1) | $ | 4,502,210 | | | | 3.77 | | % | | $ | 3,577,598 | | | $ | 138,426 | | | | 3.87 | | % | | $ | 2,955,686 | | | $ | 111,181 | | | | 3.76 | | % | | $ | 2,512,231 | | | $ | 97,956 | | | | 3.90 | | % |
Taxable investment securities (2) | | 1,182,860 | | | | 3.02 | | | | | 1,048,163 | | | | 27,053 | | | | 2.58 | | | | | 1,066,508 | | | | 23,543 | | | | 2.21 | | | | | 1,233,544 | | | | 24,970 | | | | 2.02 | | |
Tax-exempt securities (2) | | 136,276 | | | | 2.10 | | | | | 127,779 | | | | 2,616 | | | | 2.05 | | | | | 114,545 | | | | 2,300 | | | | 2.01 | | | | | 110,023 | | | | 2,191 | | | | 1.99 | | |
Other interest-earning assets (3) | | 161,669 | | | | 4.02 | | | | | 93,209 | | | | 3,336 | | | | 3.58 | | | | | 114,121 | | | | 2,069 | | | | 1.81 | | | | | 194,451 | | | | 1,771 | | | | 0.91 | | |
Total interest-earning assets | | 5,983,015 | | | | 3.59 | | | | | 4,846,749 | | | | 171,431 | | | | 3.54 | | | | | 4,250,860 | | | | 139,093 | | | | 3.27 | | | | | 4,050,249 | | | | 126,888 | | | | 3.13 | | |
Non-interest-earning assets | | 596,859 | | | | | | | | | 420,219 | | | | | | | | | | | | | 355,554 | | | | | | | | | | | | | 355,110 | | | | | | | | | | |
Total assets | $ | 6,579,874 | | | | | | | | $ | 5,266,968 | | | | | | | | | | | | $ | 4,606,414 | | | | | | | | | | | | $ | 4,405,359 | | | | | | | | | | |
| | | | | | | | | | | | | | | | | | | | | | | | | | | | | | | | | | | | | | | | | | | | | | | |
Interest-bearing liabilities: | | | | | | | | | | | | | | | | | | | | | | | | | | | | | | | | | | | | | | | | | | | | | | | |
Interest-bearing demand | $ | 1,000,989 | | | | 0.92 | | | | $ | 896,695 | | | $ | 7,390 | | | | 0.82 | | | | $ | 769,767 | | | $ | 5,050 | | | | 0.66 | | | | $ | 722,980 | | | $ | 4,245 | | | | 0.59 | | |
Savings and club | | 744,039 | | | | 0.36 | | | | | 569,777 | | | | 993 | | | | 0.17 | | | | | 519,506 | | | | 663 | | | | 0.13 | | | | | 516,353 | | | | 851 | | | | 0.16 | | |
Certificates of deposit | | 2,016,638 | | | | 1.62 | | | | | 1,496,743 | | | | 21,266 | | | | 1.42 | | | | | 1,241,958 | | | | 16,387 | | | | 1.32 | | | | | 1,116,151 | | | | 13,577 | | | | 1.22 | | |
Total interest-bearing deposits | | 3,761,666 | | | | 1.18 | | | | | 2,963,215 | | | | 29,649 | | | | 1.00 | | | | | 2,531,231 | | | | 22,100 | | | | 0.87 | | | | | 2,355,484 | | | | 18,673 | | | | 0.79 | | |
Borrowings | | 1,198,646 | | | | 2.20 | | | | | 910,527 | | | | 20,489 | | | | 2.25 | | | | | 685,772 | | | | 14,419 | | | | 2.10 | | | | | 617,510 | | | | 13,230 | | | | 2.14 | | |
Total interest-bearing liabilities | | 4,960,312 | | | | 1.43 | | | | | 3,873,742 | | | | 50,138 | | | | 1.29 | | | | | 3,217,003 | | | | 36,519 | | | | 1.13 | | | | | 2,972,994 | | | | 31,903 | | | | 1.07 | | |
Non-interest-bearing liabilities (4) | | 350,814 | | | | | | | | | 311,560 | | | | | | | | | | | | | 283,109 | | | | | | | | | | | | | 266,227 | | | | | | | | | | |
Total liabilities | | 5,311,126 | | | | | | | | | 4,185,302 | | | | | | | | | | | | | 3,500,112 | | | | | | | | | | | | | 3,239,221 | | | | | | | | | | |
Stockholders' equity | | 1,268,748 | | | | | | | | | 1,081,666 | | | | | | | | | | | | | 1,106,302 | | | | | | | | | | | | | 1,166,138 | | | | | | | | | | |
Total liabilities and stockholders' equity | $ | 6,579,874 | | | | | | | | $ | 5,266,968 | | | | | | | | | | | | $ | 4,606,414 | | | | | | | | | | | | $ | 4,405,359 | | | | | | | | | | |
| | | | | | | | | | | | | | | | | | | | | | | | | | | | | | | | | | | | | | | | | | | | | | | |
Net interest income | | | | | | | | | | | | | | $ | 121,293 | | | | | | | | | | | | $ | 102,574 | | | | | | | | | | | | $ | 94,985 | | | | | | |
Interest rate spread (5) | | | | | | 2.16 | | % | | | | | | | | | | | 2.25 | | % | | | | | | | | | | | 2.14 | | % | | | | | | | | | | | 2.06 | | % |
Net interest margin (6) | | | | | | | | | | | | | | | | | | | 2.50 | | % | | | | | | | | | | | 2.41 | | % | | | | | | | | | | | 2.35 | | % |
Ratio of interest-earning assets to interest-bearing liabilities | | 1.21 | | X | | | | | | | 1.25 | | X | | | | | | | | | | | 1.32 | | X | | | | | | | | | | | 1.36 | | X | | | | | | | | |
(1) | Loans held-for-sale and non-accruing loans have been included in loans receivable and the effect of such inclusion was not material. Allowance for loan losses has been included in non-interest-earning assets. |
(2) | Mark-to-market valuation allowances have been excluded in the balances of interest-earning assets. |
(3) | Includes interest-bearing deposits at other banks and Federal Home Loan Bank of New York capital stock. |
(4) | Includes actual balance of non-interest-bearing deposits of $311,938,000 at June 30, 2018 and average balances of non-interest-bearing deposits of $281,262,000, $249,693,000, and $225,396,000 for the years ended June 30, 2018, 2017 and 2016, respectively. |
(5) | Interest rate spread represents the difference between the yield on interest-earning assets and the cost of interest-bearing liabilities. |
(6) | Net interest margin represents net interest income as a percentage of average interest-earning assets. |
65
Rate/Volume Analysis. The following table reflects the dollar amount of changes in interest income and interest expense to changes in volume and in prevailing interest rates during the periods indicated. Each category reflects the: (1) changes in volume (changes in volume multiplied by old rate); (2) changes in rate (changes in rate multiplied by old volume); and (3) net change. The net change attributable to the combined impact of volume and rate has been allocated proportionally to the absolute dollar amounts of change in each.
| Year Ended June 30, 2018 versus Year Ended June 30, 2017 | | | Year Ended June 30, 2017 versus Year Ended June 30, 2016 | |
| Increase (Decrease) Due to | | | Increase (Decrease) Due to | |
| Volume | | | Rate | | | Net | | | Volume | | | Rate | | | Net | |
Interest and dividend income | | | | | | | | | | | | | | | | | | | | | | | |
Loans receivable | $ | 23,919 | | | $ | 3,326 | | | $ | 27,245 | | | $ | 16,836 | | | $ | (3,611 | ) | | $ | 13,225 | |
Taxable investment securities | | (408 | ) | | | 3,918 | | | | 3,510 | | | | (3,608 | ) | | | 2,181 | | | | (1,427 | ) |
Tax-exempt securities | | 270 | | | | 46 | | | | 316 | | | | 88 | | | | 21 | | | | 109 | |
Other interest-earning assets | | (438 | ) | | | 1,705 | | | | 1,267 | | | | (943 | ) | | | 1,241 | | | | 298 | |
Total interest-earning assets | $ | 23,343 | | | $ | 8,995 | | | $ | 32,338 | | | $ | 12,371 | | | $ | (166 | ) | | $ | 12,205 | |
| | | | | | | | | | | | | | | | | | | | | | | |
Interest expense: | | | | | | | | | | | | | | | | | | | | | | | |
Interest-bearing demand | $ | 947 | | | $ | 1,393 | | | $ | 2,340 | | | $ | 284 | | | $ | 521 | | | $ | 805 | |
Savings and club | | 79 | | | | 251 | | | | 330 | | | | 4 | | | | (192 | ) | | | (188 | ) |
Certificates of deposit | | 3,563 | | | | 1,316 | | | | 4,879 | | | | 1,627 | | | | 1,183 | | | | 2,810 | |
Borrowings | | 4,984 | | | | 1,086 | | | | 6,070 | | | | 1,440 | | | | (251 | ) | | | 1,189 | |
Total interest-bearing liabilities | | 9,573 | | | | 4,046 | | | | 13,619 | | | | 3,354 | | | | 1,262 | | | | 4,616 | |
| | | | | | | | | | | | | | | | | | | | | | | |
Change in net interest income | $ | 13,770 | | | $ | 4,949 | | | $ | 18,719 | | | $ | 9,017 | | | $ | (1,428 | ) | | $ | 7,589 | |
Liquidity and Commitments
Our liquidity, represented by cash and cash equivalents, is a product of our operating, investing and financing activities. Our primary sources of funds are deposits, amortization, prepayments and maturities of mortgage-backed securities and outstanding loans, maturities and calls of securities and funds provided from operations. In addition, we invest excess funds in short-term interest-earning assets, such as overnight deposits or U.S. agency securities, which provide liquidity to meet lending requirements. While scheduled payments from the amortization of loans and mortgage-backed securities and maturing securities and short-term investments are relatively predictable sources of funds, general interest rates, economic conditions and competition greatly influence deposit flows and prepayments on loans and mortgage-backed securities.
Kearny Bank is required to have enough investments that qualify as liquid assets in order to maintain sufficient liquidity to ensure a safe operation. Liquidity may increase or decrease depending upon the availability of funds and comparative yields on investments in relation to the return on loans. We attempt to maintain adequate but not excessive liquidity and liquidity management is both a daily and long-term function of business management.
Cash and cash equivalents, consisting primarily of deposits in other banks, increased $50.6 million to $128.9 million at June 30, 2018 from $78.2 million at June 30, 2017. As noted earlier, the increase in cash and cash equivalents partly reflected day-to-day operating fluctuations in the Company’s balance of short-term liquidity coupled with the acquisition of $36.6 million in cash and cash equivalents acquired from Clifton. Notwithstanding the increase in the balance of cash and cash equivalents at June 30, 2018, the Company generally endeavors to limit the balance of cash and cash equivalents held to the minimum levels needed to meet the Bank’s short-term funding obligations and overall liquidity risk management objectives while reinvesting excess liquidity into comparatively higher-yielding assets. Toward that end, the Company’s average balance of cash and equivalents declined to $70.1 million for the year ended June 30, 2018 compared to their average balance of $100.3 million for the prior fiscal year ended June 30, 2017.
The balance of cash and cash equivalents at June 30, 2018 included funds on deposit at other institutions totaling $110.6 million and other cash-related items, consisting primarily of vault cash and cash held by, or in transit to/from, our cash repository service provider, totaling $18.3 million. Cash and equivalents on deposit at other institutions at June 30, 2018 included $19.4 million held by the FHLB, $83.3 million held by the FRB as well as $7.9 million held at two U.S. domestic commercial banks representing funds on deposit totaling $5.5 million and $2.4 million, respectively, at June 30, 2018.
66
Management reviews and updates cash flow projections at least monthly in order to maintain liquid assets at levels believed to meet the requirements of normal operations, including loan commitments and potential deposit outflows from maturing certificates of deposit and other deposit withdrawals. At June 30, 2018, Kearny Bank had commitments to originate and purchase loans totaling $142.7 million compared to $95.2 million at June 30, 2017. As of those comparative dates, construction loans in process and unused lines of credit were $9.9 million and $71.6 million, compared to $8.1 million and $60.7 million, respectively. Kearny Bank had $1.12 billion of certificates of deposit maturing in one year at June 30, 2018 compared to $610.8 million at June 30, 2017.
Deposits increased $1.14 billion to $4.07 billion at June 30, 2018 from $2.93 billion at June 30, 2017. Between those comparative periods, non-interest-bearing demand deposits increased $44.5 million to $311.9 million, interest-bearing demand deposits increased $153.6 million to $1.0 billion, savings and club deposits increased $220.1 million to $744.0 million while certificates of deposit increased $725.7 million to $2.02 billion. The increases in deposit balances largely reflected the impact of the Clifton acquisition discussed earlier.
Borrowings from the FHLB of New York and other sources are generally available to supplement Kearny Bank’s liquidity position and to the extent that maturing deposits do not remain with us, management may replace the funds with such borrowings. Kearny Bank has the capacity to borrow additional funds from the FHLB by taking additional long-term or short-term advances including overnight borrowings. As of June 30, 2018, Kearny Bank’s borrowing potential was $1.2 billion without pledging additional collateral.
The following table sets forth information concerning balances and interest rates on our short-term borrowings at and for the periods shown:
| At or For the Years Ended June 30, |
| 2018 | | 2017 | | 2016 |
| (Dollars in Thousands) |
Balance at end of year | $ | 625,000 | | | | $ | 625,000 | | | | $ | 425,000 | | |
Average balance during year | $ | 629,008 | | | | $ | 498,115 | | | | $ | 425,025 | | |
Maximum outstanding at any month end | $ | 667,000 | | | | $ | 625,000 | | | | $ | 425,000 | | |
Weighted average interest rate at end of year | | 2.22 | | % | | | 1.29 | | % | | | 0.69 | | % |
Weighted average interest rate during year | | 1.64 | | % | | | 0.85 | | % | | | 0.58 | | % |
The following table discloses our contractual obligations and commitments as of June 30, 2018.
| At June 30, 2018 | |
| Less than One Year | | | One to Three Years | | | Over Three Years to Five Years | | | Over Five Years | | | Total | |
| (In Thousands) | |
Contractual obligations | | | | | | | | | | | | | | | | | | | |
Operating lease obligations | $ | 2,985 | | | $ | 5,342 | | | $ | 4,210 | | | $ | 9,893 | | | $ | 22,430 | |
Certificates of deposit | | 1,123,977 | | | | 692,455 | | | | 182,631 | | | | 17,575 | | | | 2,016,638 | |
Federal Home Loan Bank Advances | | 741,000 | | | | 112,560 | | | | 190,700 | | | | 132,500 | | | | 1,176,760 | |
| | | | | | | | | | | | | | | | | | | |
Total contractual obligations | $ | 1,867,962 | | | $ | 810,357 | | | $ | 377,541 | | | $ | 159,968 | | | $ | 3,215,828 | |
| | | | | | | | | | | | | | | | | | | |
Commitments | | | | | | | | | | | | | | | | | | | |
Undisbursed funds from approved lines of credit (1) | $ | 19,517 | | | $ | 9,986 | | | $ | 5,187 | | | $ | 36,882 | | | $ | 71,572 | |
Construction loans in process (1) | | 9,935 | | | | - | | | | - | | | | - | | | | 9,935 | |
Other commitments to extend credit (1) | | 142,745 | | | | - | | | | - | | | | - | | | | 142,745 | |
| | | | | | | | | | | | | | | | | | | |
Total commitments | $ | 172,197 | | | $ | 9,986 | | | $ | 5,187 | | | $ | 36,882 | | | $ | 224,252 | |
(1) | Represents amounts committed to customers. |
In addition to the loan commitments noted above, the Company’s pipeline of loans held for sale included $10.8 million of “in process” loans whose terms included interest rate locks to borrowers that were paired with a “non-binding” best-efforts commitment to sell the loan to a buyer at a fixed price and within a predetermined timeframe after the sale commitment is established.
67
Off-Balance Sheet Arrangements
We are a party to financial instruments with off-balance-sheet risk in the normal course of our business of investing in loans and securities as well as in the normal course of maintaining and improving Kearny Bank’s facilities. These financial instruments include significant purchase commitments, such as commitments related to capital expenditure plans and commitments to purchase securities or mortgage-backed securities and commitments to extend credit to meet the financing needs of our customers. We had no significant off-balance sheet commitments to purchase securities as of June 30, 2018.
In addition to the commitments noted above, Kearny Bank is party to standby letters of credit totaling approximately $912,000 at June 30, 2018 through which we guarantee certain specific business obligations of our commercial customers.
Commitments to extend credit are agreements to lend to a customer as long as there is no violation of any condition established in the contract. Commitments generally have fixed expiration dates or other termination clauses and may require payment of a fee. Our exposure to credit loss in the event of nonperformance by the other party to the financial instrument for commitments to extend credit is represented by the contractual notional amount of those instruments. We use the same credit policies in making commitments and conditional obligations as we do for on‑balance‑sheet instruments.
At June 30, 2018, outstanding loan commitments relating to loans held in portfolio totaled $224.3 million compared to $163.9 million at June 30, 2017. As of that same date, the Company’s pipeline of loans held for sale included $10.8 million of “in process” loans whose terms included interest rate locks to borrowers which are considered free-standing derivative instruments whose values are not considered to be material for financial statement reporting purposes. Since some of the commitments are expected to expire without being drawn upon, the total commitment amounts do not necessarily represent future cash requirements. For additional information regarding our outstanding lending commitments at June 30, 2018, see Note 13 and Note 17 to the audited consolidated financial statements.
Capital
Consistent with our goals to operate as a sound and profitable financial organization, Kearny Financial and Kearny Bank actively seek to maintain our well capitalized status in accordance with regulatory standards. As of June 30, 2018, Kearny Financial and Kearny Bank exceeded all capital requirements of the federal banking regulators and were considered “well capitalized”.
Kearny Bank’s regulatory capital ratios at June 30, 2018 were as follows: Tier 1 leverage ratio 15.10%; Common Equity Tier I risk‑based capital 23.31%; Tier I risk‑based capital 23.31%; and total risk‑based capital 24.07%.
Kearny Financial’s regulatory capital ratios at June 30, 2018 were as follows: Tier 1 leverage ratio 16.24%; Common Equity Tier I risk‑based capital 25.05%; Tier I risk‑based capital 25.05%; and total risk‑based capital 25.80%.
The regulatory capital requirements to be considered well capitalized at June 30, 2018 were as follows: Tier 1 leverage ratio 5.0%; Common Equity Tier I risk‑based capital 6.5%; Tier I risk‑based capital 8.0%; and total risk‑based capital 10.0%.
For additional information regarding regulatory capital at June 30, 2018, see Note 15 to the audited consolidated financial statements.
Impact of Inflation
The financial statements included in this document have been prepared in accordance with accounting principles generally accepted in the United States of America. These principles require the measurement of financial position and operating results in terms of historical dollars, without considering changes in the relative purchasing power of money over time due to inflation.
Our primary assets and liabilities are monetary in nature. As a result, interest rates have a more significant impact on our performance than the effects of general levels of inflation. Interest rates, however, do not necessarily move in the same direction or with the same magnitude as the price of goods and services, since such prices are affected by inflation. In a period of rapidly rising interest rates, the liquidity and maturities of our assets and liabilities are critical to the maintenance of acceptable performance levels.
The principal effect of inflation on earnings, as distinct from levels of interest rates, is in the area of non-interest expense. Expense items such as employee compensation, employee benefits and occupancy and equipment costs may be subject to increases as a result of inflation. An additional effect of inflation is the possible increase in the dollar value of the collateral securing loans that we have made. We are unable to determine the extent, if any, to which properties securing our loans have appreciated in dollar value due to inflation.
68
Recent Accounting Pronouncements
For a discussion of the expected impact of recently issued accounting pronouncements that have yet to be adopted by us, please refer to Note 2 to the audited consolidated financial statements.
Item 7A. Quantitative and Qualitative Disclosures About Market Risk
Management of Interest Rate Risk and Market Risk
Qualitative Analysis. The majority of our assets and liabilities are sensitive to changes in interest rates. Consequently, interest rate risk is a significant form of business risk that we must manage. Interest rate risk is generally defined in regulatory nomenclature as the risk to our earnings or capital arising from the movement of interest rates. It arises from several risk factors including: the differences between the timing of rate changes and the timing of cash flows (re-pricing risk); the changing rate relationships among different yield curves that affect bank activities (basis risk); the changing rate relationships across the spectrum of maturities (yield curve risk); and the interest-rate-related options embedded in bank products (option risk).
Regarding the risk to our earnings, movements in interest rates significantly influence the amount of net interest income we recognized. Net interest income is the difference between:
| • | the interest income recorded on our interest-earning assets, such as loans, securities and other interest-earning assets; and |
| • | the interest expense recorded on our interest-bearing liabilities, such as interest-bearing deposits and borrowings. |
Net interest income is, by far, our largest revenue source to which we add our non-interest income and from which we deduct our provision for loan losses, non-interest expense and income taxes to calculate net income. Movements in market interest rates, and the effect of such movements on the risk factors noted above, significantly influence the “spread” between the interest earned on our loans, securities and other interest-earning assets and the interest paid on our deposits and borrowings. Movements in interest rates that increase, or “widen”, that net interest spread enhance our net income. Conversely, movements in interest rates that reduce, or “tighten”, that net interest spread adversely impact our net income.
For any given movement in interest rates, the resulting degree of movement in an institution’s yield on interest-earning assets compared with that of its cost of interest-bearing liabilities determines if an institution is deemed “asset sensitive” or “liability sensitive”. An asset sensitive institution is one whose yield on interest-earning assets reacts more quickly to movements in interest rates than its cost of interest-bearing liabilities. In general, the earnings of asset sensitive institutions are enhanced by upward movements in interest rates through which the yield on its interest-earning assets increases faster than its cost of interest-bearing liabilities resulting in a widening of its net interest spread. Conversely, the earnings of asset sensitive institutions are adversely impacted by downward movements in interest rates through which the yield on its interest-earning assets decreases faster than its cost of interest-bearing liabilities resulting in a tightening of its net interest spread.
In contrast, a liability sensitive institution is one whose cost of interest-bearing liabilities reacts more quickly to movements in interest rates than its yield on interest-earning assets. In general, the earnings of liability sensitive institutions are enhanced by downward movements in interest rates through which the cost of interest-bearing liabilities decreases faster than its yield on its interest-earning assets resulting in a widening of its net interest spread. Conversely, the earnings of liability sensitive institutions are adversely impacted by upward movements in interest rates through which the cost of interest-bearing liabilities increases faster than its yield on its interest-earning assets resulting in a tightening of its net interest spread.
Based upon the findings of our internal interest rate risk analysis, we are generally considered to be liability sensitive. Liability sensitivity is generally attributable to the comparatively shorter contractual maturity and/or re-pricing characteristics of the institution’s deposits and borrowings versus those of its loans and investment securities.
Our liability-based funding sources totaled $5.27 billion at June 30, 2018 and comprised $4.07 billion of total deposits and $1.20 billion of total borrowings. Total deposits as of that date included certificates of deposit totaling $2.02 billion representing 49.5% of total deposits and 38.3% of total funding. The interest rates paid on the Company’s certificates of deposit are generally fixed until maturity at which time the customer has the option to “re-price” the certificate for a new interest rate and/or term to maturity. Alternately, the customer may opt to transfer or close the account at maturity. Given these considerations, the degree of liability sensitivity of the Company’s certificates of deposit is largely determined by the aggregate term to maturity characteristics of the underlying accounts. In this regard, $1.12 billion, or 55.7%, of our certificates of deposit mature within one year with an additional $493.2 million, or 24.5%, of our certificates of deposit maturing after one year but within two years. The remaining $399.5 million or 19.8% of certificates at June 30, 2018 have remaining terms to maturity exceeding two years.
69
The liability sensitivity of the Company’s certificates of deposit is also affected by the degree to which interest rates offered and paid on such accounts reflect movements in overall market interest rates. The Company’s offering rates on certificates of deposit are generally correlated to current market interest rates for similar terms to maturity. The degree of such correlation is reflected in the direction, timing and magnitude of changes in certificate of deposit offering rates by term in relation to those of comparable market interest rates. A greater correlation between movements in certificate of deposit offering rates to movements in comparable duration market interest rates implies a greater degree of liability sensitivity, and vice versa.
In addition to certificates of deposit, the balance of deposits at June 30, 2018 also included “non-maturity” deposit balances totaling $2.06 billion representing 50.5% of total deposits and 39.0% of total funding. Such balances included interest-bearing checking accounts and savings and club accounts totaling $1.00 billion and $744.0 million, respectively, as well as non-interest-bearing checking account balances totaling $311.9 million at June 30, 2018. Historically, the repricing characteristics of the Company’s interest-bearing, non-maturity accounts are generally correlated to movements in short-term market interest rates. As above, the degree of such correlation is generally determined by the direction, timing and magnitude of changes in interest rates paid on non-maturity deposits in relation to those of short-term market interest rates.
Excluding fair value adjustments, the balance of FHLB advances totaled $1.18 billion at June 30, 2018 and comprised both short-term and long-term advances with fixed rates of interest. Short-term FHLB advances generally have original maturities of less than one year and may include overnight borrowings which the Bank typically utilizes to address short term funding needs as they arise. Short-term FHLB advances at June 30, 2018 include $625.0 million of 90-day FHLB term advances that are generally forecasted to be periodically redrawn at maturity for the same 90 day term as the original advance. Based on this presumption, the Bank has utilized interest rate derivatives to extend the effective duration of each of these advances at the time they were drawn thereby effectively fixing their cost for longer periods of time. Given the effects of the interest rate derivatives, the effective fixed-rate, weighted average remaining term to maturity of the noted advances was approximately 3.5 years at June 30, 2018.
Long-term advances generally include advances with original maturities of greater than one year. At June 30, 2018, our outstanding balance of long-term FHLB advances totaled $551.8 million. Such advances included $145.0 million of fixed-rate, callable term advances and $406.4 million of fixed-rate, non-callable term advances as well as a $360,000 fixed-rate amortizing advance. The weighted average remaining term to maturity of the Company’s long-term, fixed rate FHLB advances was approximately 3.6 years at June 30, 2018.
In addition to FHLB advances, the balance of borrowings at June 30, 2018 also included $28.5 million in overnight “sweep account” balances linked to customer demand deposits.
With respect to the maturity and re-pricing of our interest-earning assets, at June 30, 2018, $68.2 million, or 1.5% of our total loans, will reach their contractual maturity dates within one year with the remaining $4.50 billion, or 98.5% of total loans having remaining terms to contractual maturity in excess of one year. Of loans maturing after one year, $1.96 billion had fixed rates of interest while the remaining $2.54 billion had adjustable rates of interest, with such loans representing 43.0% and 55.5% of total loans, respectively.
At June 30, 2018, $5.1 million, or 0.4% of our total securities, will reach their contractual maturity dates within one year with the remaining $1.31 billion, or 99.6% of total securities, having remaining terms to contractual maturity in excess of one year. Of the latter category, $702.4 million comprising 53.4% of our total securities had fixed rates of interest while the remaining $607.3 million comprising 46.2% of our total securities had adjustable or floating rates of interest.
At June 30, 2018, mortgage-related assets, including mortgage loans and mortgage-backed securities, totaled $5.0 billion and comprised 76.3% of total assets. In addition to remaining term to maturity and interest rate type as discussed above, other factors contribute significantly to the level of interest rate risk associated with mortgage-related assets. In particular, the scheduled amortization of principal and the borrower’s option to prepay any or all of a mortgage loan’s principal balance, where applicable, have a significant effect on the average lives of such assets and, therefore, the interest rate risk associated with them. In general, the prepayment rate on lower yielding assets tends to slow as interest rates rise due to the reduced financial incentive for borrowers to refinance their loans. By contrast, the prepayment rate of higher yielding assets tends to accelerate as interest rates decline due to the increased financial incentive for borrowers to prepay or refinance their loans to comparatively lower interest rates. These characteristics tend to diminish the benefits of falling interest rates to liability sensitive institutions while exacerbating the adverse impact of rising interest rates.
As a liability-sensitive institution, our net interest spread is generally expected to benefit from overall reductions in market interest rates. Conversely, our net interest spread is generally expected to be adversely impacted by overall increases in market interest rates. However, the general effects of movements in market interest rates can be diminished or exacerbated by “nonparallel” movements in interest rates across a yield curve. Nonparallel movements in interest rates generally occur when shorter term and
70
longer term interest rates move disproportionately in a directionally consistent manner. For example, shorter term interest rates may decrease faster than longer term interest rates which would generally result in a “steeper” yield curve. Alternately, nonparallel movements in interest rates may also occur when shorter term and longer term interest rates move in a directionally inconsistent manner. For example, shorter term interest rates may rise while longer term interest rates remain steady or decline which would generally result in a “flatter” yield curve.
In general, the interest rates paid on our deposits tend to be determined based upon the level of shorter-term interest rates. By contrast, the interest rates earned on our loans and investment securities generally tend to be based upon the level of comparatively longer-term interest rates to the extent such assets are fixed-rate in nature. As such, the overall “spread” between shorter-term and longer-term interest rates when earning assets and costing liabilities re-price greatly influences our overall net interest spread over time. In general, a wider spread between shorter-term and longer-term interest rates, implying a “steeper” yield curve, is beneficial to our net interest spread. By contrast, a narrower spread between shorter-term and longer-term interest rates, implying a “flatter” yield curve, or a negative spread between those measures, implying an “inverted” yield curve, adversely impacts our net interest spread.
We continue to execute various strategies to mitigate the risk to our net interest rate spread and margin arising from adverse changes in interest rates and the shape of the yield curve. Such strategies include deploying excess liquidity in higher yielding interest-earning assets, such as commercial loans and investment securities, while continuing to limiting increases in our cost of interest-bearing liabilities while extending their duration through various deposit pricing strategies. For example, we have extended the duration of our wholesale funding sources through cost effective use of interest rate derivatives that effectively converted short-term wholesale funding sources into longer-term, fixed-rate funding sources.
Notwithstanding these efforts, the risk of further net interest rate spread and margin compression is significant as the yield on our interest-earning assets reflects the lingering impact of greater declines in longer term market interest rates in prior years compared to the lesser concurrent reductions in shorter term market interest rates that affect the cost of our interest-bearing liabilities. Moreover, our liability sensitivity may adversely affect net income in the future as market interest rates continue to increase from their prior historical lows and our cost of interest-bearing liabilities may rise faster than our yield on interest-earning assets. This risk to earnings could be exacerbated by the flattening of the yield curve through which recent increases in shorter term market interest rates have recently outpaced increases in longer term market interest rates.
Given the inherent liability sensitivity of our balance sheet, our business plan also calls for greater expansion into C&I and construction lending. Toward that end, we are seeking to expand our retail lending resources with experienced business lenders focused on the origination of floating-rate and shorter-term fixed-rate loans and the corresponding core deposit account balances typically associated with such relationships. We have also developed an interest rate risk management strategy through which certain longer-duration, fixed-rate commercial mortgage loan originations may be effectively converted into floating-rate assets through the use of interest rate derivatives in “loan-level” and “pool-level” hedging transactions.
We maintain an Asset/Liability Management (“ALM”) Program to address all matters relating to the management of interest rate risk and liquidity risk. The program is overseen by the Board of Directors through our Interest Rate Risk Management Committee comprising five members of the Board with our Chief Operating Officer, Chief Financial Officer, Treasurer/Chief Investment Officer and Chief Risk Officer participating as management’s liaison to the committee. The committee meets quarterly to address management of our assets and liabilities, including review of our liquidity and interest rate risk profiles, loan and deposit pricing and production volumes, investment and wholesale funding strategies, and a variety of other asset and liability management topics. The results of the committee’s quarterly review are reported to the full Board, which adjusts our ALM policies and strategies, as it considers necessary and appropriate.
The Board of Directors has assigned the responsibility for the operational aspects of the ALM program to our Asset/Liability Management Committee (“ALCO”). The ALCO is a management committee comprising the Chief Executive Officer, Chief Operating Officer, Chief Financial Officer, Chief Lending Officer, Chief Banking Officer, Chief Risk Officer and Treasurer/Chief Investment Officer. Additional members of our management team may be asked to participate on the ALCO, as appropriate.
Responsibilities conveyed to the ALCO by the Board of Directors include:
| • | developing ALM-related policies and associated operating procedures and controls that will identify and measure the risks associated with ALM while establishing the limits and thresholds relating thereto; |
| • | developing ALM-related operating strategies and tactics designed to manage the relevant risks within the applicable policy thresholds and limits while supporting the achievement of the goals and objectives of our strategic business plan; |
| • | developing, implementing and maintaining a management- and Board-level ALM monitoring and reporting system; |
71
| • | ensuring that the ALCO and the Board of Directors are kept abreast of current technologies, procedures and industry best practices that may be utilized to carry out their ALM-related duties and responsibilities; |
| • | ensuring the periodic independent validation of the Company’s ALM risk management policies and operating practices and controls; and |
| • | conducting periodic ALCO committee meetings to review all matters relating to ALM strategies and risk management activities. |
Quantitative Analysis. The quantitative analysis regularly conducted by management measures interest rate risk from both a capital and earnings perspective. With regard to capital, our internal interest rate risk analysis calculates the sensitivity of our Economic Value of Equity (“EVE”) ratio to movements in interest rates. EVE represents the present value of the expected cash flows from our assets less the present value of the expected cash flows arising from our liabilities adjusted for the value of off-balance sheet contracts. The EVE ratio represents the dollar amount of our EVE divided by the present value of our total assets for a given interest rate scenario. In essence, EVE attempts to quantify our economic value using a discounted cash flow methodology while the EVE ratio reflects that value as a form of capital ratio. The degree to which the EVE ratio changes for any hypothetical interest rate scenario from its “base case” measurement is a reflection of an institution’s sensitivity to interest rate risk.
Our EVE ratio is first calculated in a “base case” scenario that assumes no change in interest rates as of the measurement date. The model then measures the change in the EVE ratio throughout a series of interest rate scenarios representing immediate and permanent, parallel shifts in the yield curve up and down 100, 200 and 300 basis points with additional scenarios modeled where appropriate. The model requires that interest rates remain positive for all points along the yield curve for each rate scenario which may preclude the modeling of certain “down rate” scenarios during periods of lower market interest rates. Our interest rate risk management policy establishes acceptable floors for the EVE ratio and caps for the maximum percentage change in the dollar amount of EVE throughout the scenarios modeled.
As illustrated in the tables below, our EVE would be negatively impacted by an increase in interest rates. This result is expected given our liability sensitivity noted earlier. Specifically, based upon the comparatively shorter maturity and/or re-pricing characteristics of our interest-bearing liabilities compared with that of our interest-earning assets, an upward movement in interest rates would have a disproportionately adverse impact on the present value of our assets compared to the beneficial impact arising from the reduced present value of our liabilities. Hence, our EVE and EVE ratio decline in the increasing interest rate scenarios. The low level of interest rates prevalent at June 30, 2018 and June 30, 2017 precluded the modeling of certain decreasing rate scenarios as parallel downward shifts in the yield curve would have resulted in negative interest rates for several points along that curve as of those analysis dates.
The following tables present the results of our internal EVE analysis as of June 30, 2018 and June 30, 2017, respectively.
| | June 30, 2018 |
| | Economic Value of Equity ("EVE") | | EVE as a % of Present Value of Assets |
Change in Interest Rates | | $ Amount of EVE | | | $ Change in EVE | | | % Change in EVE | | EVE Ratio | | Change in EVE Ratio |
| | (Dollars in Thousands) | | | | | | | | | | |
+300 bps | | | 912,671 | | | | (212,562 | ) | | | (19 | ) | % | | | 16.06 | | % | | | (193 | ) | bps |
+200 bps | | | 976,386 | | | | (148,847 | ) | | | (13 | ) | % | | | 16.67 | | % | | | (132 | ) | bps |
+100 bps | | | 1,056,154 | | | | (69,079 | ) | | | (6 | ) | % | | | 17.44 | | % | | | (55 | ) | bps |
0 bps | | | 1,125,233 | | | - | | | - | | | | | 17.99 | | % | | - | | |
-100 bps | | | 1,134,786 | | | | 9,553 | | | | 1 | | % | | | 17.67 | | % | | | (32 | ) | bps |
72
| | June 30, 2017 |
| | Economic Value of Equity ("EVE") | | EVE as a % of Present Value of Assets |
Change in Interest Rates | | $ Amount of EVE | | | $ Change in EVE | | | % Change in EVE | | EVE Ratio | | Change in EVE Ratio |
| | (Dollars in Thousands) | | | | | | | | | | |
+300 bps | | | 846,983 | | | | (147,879 | ) | | | (15 | ) | % | | | 19.60 | | % | | | (176 | ) | bps |
+200 bps | | | 903,090 | | | | (91,772 | ) | | | (9 | ) | % | | | 20.37 | | % | | | (99 | ) | bps |
+100 bps | | | 954,652 | | | | (40,210 | ) | | | (4 | ) | % | | | 20.99 | | % | | | (37 | ) | bps |
0 bps | | | 994,862 | | | - | | | - | | | | | 21.36 | | % | | - | | |
-100 bps | | | 1,020,221 | | | | 25,359 | | | | 3 | | % | | | 21.42 | | % | | | 6 | | bps |
As seen in the table above, the dollar amount of EVE has increased between comparative periods across most scenarios modeled. The increase largely reflects the effect of the additional capital stock issued by the Company in conjunction with the acquisition of Clifton. By contrast, the EVE ratios have decreased across all rate scenarios largely reflected the overall decrease in stockholders’ equity arising from the Company’s repurchase of its shares of common stock during the year ended June 30, 2018. In total, the sensitivity of those measures to movements in interest rates increased modestly between comparative periods which primarily reflected the modest increase in the Company’s long-term interest rate risk profile resulting from the acquisition of Clifton. In general, Clifton’s “pre-acquisition” exposure to interest rate risk was greater than the Company’s due to Clifton’s comparatively higher level of liability sensitivity.
In addition to the specific considerations noted above, there are numerous internal and external factors that may also contribute to changes in an institution’s EVE ratio and its sensitivity. Internally, changes in the composition and allocation of an institution’s balance sheet and the interest rate risk characteristics of its components can significantly alter the exposure to interest rate risk as quantified by the changes in the EVE sensitivity measures. Notwithstanding the modest increase in sensitivity attributable to the Clifton acquisition noted above, the overall stability in the sensitivity of EVE to movements in interest rates largely reflected a corresponding stability in both the composition and allocation of the Company’s interest-earning assets and interest-bearing liabilities between the comparative periods noted. Changes to certain external factors, most notably changes in the level of market interest rates and overall shape of the yield curve, can also alter the projected cash flows of the institution’s interest-earning assets and interest-costing liabilities and the associated present values thereof. Changes in internal and external factors from period to period can complement one another’s effects to reduce overall sensitivity, partly or wholly offset one another’s effects, or exacerbate one another’s adverse effects and thereby increase the institution’s exposure to interest rate risk as quantified by EVE sensitivity measures.
Our internal interest rate risk analysis also includes an “earnings-based” component. A quantitative, earnings-based approach to measuring interest rate risk is strongly encouraged by bank regulators as a complement to the “EVE-based” methodology. However, there are no commonly accepted “industry best practices” that specify the manner in which “earnings-based” interest rate risk analysis should be performed with regard to certain key modeling variables. Such variables include, but are not limited to, those relating to rate scenarios (e.g., immediate and permanent rate “shocks” versus gradual rate change “ramps”, “parallel” versus “nonparallel” yield curve changes), measurement periods (e.g., one year versus two year, cumulative versus noncumulative), measurement criteria (e.g., net interest income versus net income) and balance sheet composition and allocation (“static” balance sheet, reflecting reinvestment of cash flows into like instruments, versus “dynamic” balance sheet, reflecting internal budget and planning assumptions).
The absence of a commonly shared, industry-standard set of analysis criteria and assumptions on which to base an “earnings-based” analysis could result in inconsistent or misinterpreted disclosure concerning an institution’s level of interest rate risk. Consequently, we limit the presentation of our earnings-based interest rate risk analysis to the scenarios presented in the table below. Consistent with the EVE analysis above, such scenarios utilize immediate and permanent rate “shocks” that result in parallel shifts in the yield curve. For each scenario, projected net interest income is measured over a one year period utilizing a static balance sheet assumption through which incoming and outgoing asset and liability cash flows are reinvested into the same instruments. Product pricing and earning asset prepayment speeds are appropriately adjusted for each rate scenario.
As illustrated in the tables below, at both June 30, 2018 and June 30, 2017, our net interest income (“NII”) would have been only modestly impacted by a parallel upward shift in the yield curve. In large part, the stability of NII sensitivity between comparative periods largely reflected the corresponding stability in both the composition and allocation of the Company’s interest-earning assets and interest-bearing liabilities between the comparative periods, as noted above.
The NII-based findings are generally consistent with those of the EVE-based analysis discussed above by indicating that the interest rate risk exposure increased modestly from June 30, 2017 to June 30, 2018. As noted above, the increase in interest rate risk was primarily attributable to the acquisition of Clifton, as discussed above. Notwithstanding, the exposure to interest rate risk assessed by the NII-based and EVE-based methodologies may differ in both magnitude and direction based on the comparative terms
73
over which risk exposure is measured by those methodologies. As noted earlier, EVE-based analysis generally takes a longer-term view of interest rate risk by measuring changes in the present value of cash flows of interest-earning assets and interest-bearing liabilities over their expected lives. By contrast, the NII-based analysis presented below takes a comparatively shorter-term view of interest rate risk by measuring the forecasted changes in the net interest income generated by those interest-earning assets and interest-bearing liabilities over a one-year period. As noted above, the low level of interest rates prevalent at June 30, 2018 and June 30, 2017 precluded the modeling of many decreasing rate scenarios as parallel downward shifts in the yield curve would have resulted in negative interest rates for several points along that curve as of those analysis dates.
The following tables present the results of our internal NII analysis as of June 30, 2018 and June 30, 2017, respectively.
| | | | | | June 30, 2018 |
| | | | | | Net Interest Income ("NII") |
Change in Interest Rates | | Balance Sheet Composition | | Measurement Period | | $ Amount of NII | | | $ Change in NII | | | % Change in NII |
| | | | | | (Dollars In Thousands) | | | | | | |
+300 bps | | Static | | One Year | | $ | 151,420 | | | $ | (6,540 | ) | | | (4.14 | ) | % |
+200 bps | | Static | | One Year | | | 153,792 | | | | (4,168 | ) | | | (2.64 | ) | |
+100 bps | | Static | | One Year | | | 156,617 | | | | (1,343 | ) | | | (0.85 | ) | |
0 bps | | Static | | One Year | | | 157,960 | | | | - | | | | - | | |
-100 bps | | Static | | One Year | | | 152,956 | | | | (5,004 | ) | | | (3.17 | ) | |
| | | | | | June 30, 2017 |
| | | | | | Net Interest Income ("NII") |
Change in Interest Rates | | Balance Sheet Composition | | Measurement Period | | $ Amount of NII | | | $ Change in NII | | | % Change in NII |
| | | | | | (Dollars In Thousands) | | | | | | |
+300 bps | | Static | | One Year | | $ | 105,658 | | | $ | (727 | ) | | | (0.68 | ) | % |
+200 bps | | Static | | One Year | | | 106,436 | | | | 51 | | | | 0.05 | | |
+100 bps | | Static | | One Year | | | 106,614 | | | | 229 | | | | 0.22 | | |
0 bps | | Static | | One Year | | | 106,385 | | | | - | | | | - | | |
-100 bps | | Static | | One Year | | | 104,900 | | | | (1,485 | ) | | | (1.40 | ) | |
Notwithstanding the rate change scenarios presented in the EVE and earnings-based analyses above, future interest rates and their effect on net portfolio value or net interest income are not predictable. Computations of prospective effects of hypothetical interest rate changes are based on numerous assumptions, including relative levels of market interest rates, prepayments and deposit run-offs and should not be relied upon as indicative of actual results. Certain shortcomings are inherent in this type of computation. Although certain assets and liabilities may have similar maturity or periods of re-pricing, they may react at different times and in different degrees to changes in market interest rates. The interest rate on certain types of assets and liabilities, such as demand deposits and savings accounts, may fluctuate in advance of changes in market interest rates, while rates on other types of assets and liabilities may lag behind changes in market interest rates. Certain assets, such as adjustable-rate mortgages, generally have features which restrict changes in interest rates on a short-term basis and over the life of the asset. In the event of a change in interest rates, prepayments and early withdrawal levels could deviate significantly from those assumed in making calculations set forth above. Additionally, an increased credit risk may result as the ability of many borrowers to service their debt may decrease in the event of an interest rate increase.
Item 8. Financial Statements and Supplementary Data
The Company’s consolidated financial statements are contained in this Annual Report on Form 10-K immediately following Item 16.
Item 9. Changes In and Disagreements With Accountants on Accounting and Financial Disclosure
On August 30, 2017, Kearny Financial Corp. (the "Company") dismissed BDO, LLP ("BDO") as the Company's independent registered public accounting firm. The dismissal of BDO was approved by the Audit Committee (the “Committee”) of the Board of Directors and was effective on August 30, 2017.
74
BDO's audit reports on the Company's consolidated financial statements as of and for the years ended June 30, 2017 and June 30, 2016, did not contain any adverse opinion or disclaimer of opinion, nor were they qualified or modified as to uncertainty, audit scope or accounting principles.
During the two fiscal years ended June 30, 2017 and June 30, 2016, there were (i) no disagreements between the Company and BDO on any matter of accounting principles or practices, financial statement disclosure, or auditing scope or procedures, which, if not resolved to the satisfaction of BDO, would have caused BDO to make reference thereto in their reports on the consolidated financial statements for such years, and (ii) no "reportable events" as that term is defined in Item 304(a)(1)(v) of Regulation S-K.
Also on August 30, 2017 the Committee completed a competitive selection process and selected Crowe LLP ("Crowe") as the Company's independent registered public accounting firm, effective August 30, 2017. During the two fiscal years ended June 30, 2017 and June 30, 2016, the Company did not consult with Crowe regarding: (i) the application of accounting principles to a specified transaction, either completed or proposed; (ii) the type of audit opinion that might be rendered on the Company's financial statements, and Crowe did not provide any written report or oral advice that Crowe concluded was an important factor considered by the Company in reaching a decision as to any such accounting, auditing or financial reporting issue; or (iii) any matter that was either the subject of a disagreement with BDO on any matter of accounting principles or practices, financial statement disclosure or auditing scope or procedure or the subject of a reportable event.
Item 9A. Controls and Procedures
(a) | Disclosure Controls and Procedures |
Based on their evaluation of the Company’s disclosure controls and procedures (as defined in Rules 13a-15(e) and 15d-15(e) under the Securities Exchange Act of 1934 (the “Exchange Act”)), the Company’s principal executive officer and principal financial officer have concluded that as of the end of the period covered by this Annual Report on Form 10-K such disclosure controls and procedures are effective to ensure that information required to be disclosed by the Company in reports that it files or submits under the Exchange Act is recorded, processed, summarized and reported within the time periods specified in Securities and Exchange Commission rules and forms and is accumulated and communicated to the Company’s management, including the principal executive and principal financial officer, as appropriate to allow timely decisions regarding required disclosures.
(b) | Internal Control over Financial Reporting |
| 1. | Management’s Annual Report on Internal Control Over Financial Reporting. |
Management’s report on the Company’s internal control over financial reporting appears in the Company’s consolidated financial statements that are contained in this Annual Report on Form 10-K immediately following Item 16. Such report is incorporated herein by reference.
| 2. | Report of Independent Registered Public Accounting Firm. |
The report of Crowe LLP, an independent registered public accounting firm, on the Company’s internal control over financial reporting appears in the Company’s consolidated financial statements that are contained in this Annual Report on Form 10-K immediately following Item 16. Such report is incorporated herein by reference.
| 3. | Changes in Internal Control Over Financial Reporting. |
During the last quarter of the year under report, there was no change in the Company’s internal control over financial reporting that has materially affected, or is reasonably likely to materially affect, the Company’s internal control over financial reporting.
Item 9B. Other Information
None.
75
PART III
Item 10. Directors, Executive Officers and Corporate Governance
The information that appears under the headings included under “Proposal I – Election of Directors” and “Corporate Governance Matters” in the Registrant’s definitive proxy statement for the Registrant’s 2018 Annual Meeting of Stockholders to be filed with the Securities and Exchange Commission within 120 days of the Registrant’s fiscal year end (the “Proxy Statement”) is incorporated herein by reference.
The Company has adopted a code of ethics that applies to its principal executive officer, principal financial officer and principal accounting officer. A copy of the code of ethics is available on our website at www.kearnybank.com on the “Company Info” tab under the link “Governance Documents” or without charge upon request to the Corporate Secretary, Kearny Financial Corp., 120 Passaic Avenue, Fairfield, New Jersey 07004.
Item 11. Executive Compensation
The information that appears under the headings “Executive Compensation”, “Director Compensation” and “Compensation Discussion and Analysis” in the Proxy Statement is incorporated herein by reference.
Item 12. Security Ownership of Certain Beneficial Owners and Management and Related Stockholder Matters
| (a) | Security Ownership of Certain Beneficial Owners. Information required by this item is incorporated herein by reference to the section captioned “Security Ownership of Certain Beneficial Owners and Management” in the Proxy Statement. |
| (b) | Security Ownership of Management. Information required by this item is incorporated herein by reference to the section captioned “Proposal I – Election of Directors” in the Proxy Statement. |
| (c) | Changes in Control. Management of the Company knows of no arrangements, including any pledge by any person of securities of the Company, the operation of which may at a subsequent date result in a change in control of the registrant. |
| (d) | Securities Authorized for Issuance Under Equity Compensation Plans. Set forth below is information as of June 30, 2018 with respect to compensation plans under which equity securities of the Registrant are authorized for issuance. |
| | (A) | | | (B) | | | (C) | |
| | Number of Securities to be Issued Upon Exercise of Outstanding Options, Warrants and Rights | | | Weighted Average Exercise Price of Outstanding Options, Warrants and Rights | | | Number of Securities Remaining Available for Future Issuance Under Equity Compensation Plans - Excluding Securities Reflected in Column (A) | |
Equity compensation plans approved by stockholders (1): | | | | | | | | | | | | |
2005 Stock Compensation and Incentive Plan | | | 243,505 | | | $ | 9.96 | | | | - | |
2016 Equity Incentive Plan | | | 4,211,910 | | | $ | 15.35 | | | | 713,434 | |
| | | | | | | | | | | | |
Equity compensation plans not approved by stockholders: | | | | | | | | | | | | |
None. | | | - | | | $ | - | | | | - | |
| | | | | | | | | | | | |
Total | | | 4,455,415 | | | $ | 15.06 | | | | 713,434 | |
(1) | The number of securities reported in column (A) includes 834,692 vested options and 2,563,074 non-vested options outstanding as of June 30, 2018. In addition to these options, restricted stock awards of 1,057,649 shares were also non-vested as of June 30, 2018. The non-vested options and restricted stock awards are earned at the rate of 20% one year after the date of the grant and 20% annually thereafter. As of June 30, 2018, there were 195,806 restricted shares and 517,628 options remaining available for award under the approved equity compensation plans and are reported under column (C) as securities remaining available for future issuance under such plans. |
76
Item 13. Certain Relationships and Related Transactions and Director Independence
The information that appears under the section captioned “Corporate Governance Matters – Transactions with Certain Related Persons” – “Board Independence” in the Proxy Statement is incorporated herein by reference.
Item 14. Principal Accounting Fees and Services
The information relating to this item is incorporated herein by reference to the information contained under the section captioned “Proposal II – Ratification of Appointment of Independent Auditor” in the Proxy Statement.
77
PART IV
Item 15. Exhibits, Financial Statement Schedules
(1) The following financial statements and the independent auditors’ report appear in this Annual Report on Form 10-K immediately after Item 16:
(2) All schedules are omitted because they are not required or applicable, or the required information is shown in the consolidated financial statements or the notes thereto.
(3) The following exhibits are filed as part of this Annual Report on Form 10-K:
3.1 | | Articles of Incorporation of Kearny Financial Corp. (Incorporated by reference to the Registrant’s Registration Statement on Form S-1 (File No. 333-198602), originally filed on September 5, 2014) |
| | |
3.2 | | Bylaws of Kearny Financial Corp. (Incorporated by reference to the Registrant’s Registration Statement on Form S-1 (File No. 333-198602), originally filed on September 5, 2014) |
| | |
4 | | Form of Common Stock Certificate of Kearny Financial Corp. (Incorporated by reference to the Registrant’s Registration Statement on Form S-1 (File No. 333-198602), originally filed on September 5, 2014) |
| | |
10.1 | | Amended and Restated Employment Agreement between Kearny Bank and Craig Montanaro dated May 18, 2015 (Incorporated by reference to Exhibit 10.1 to Kearny Financial Corp.’s Annual Report on Form 10-K (File No. 001-37399), originally filed on September 14, 2015)† |
| | |
10.2 | | Amended and Restated Employment Agreement between Kearny Financial Corp. and Craig Montanaro dated May 18, 2015 (Incorporated by reference to Exhibit 10.2 to Kearny Financial Corp.’s Annual Report on Form 10-K (File No. 001-37399), originally filed on September 14, 2015)† |
| | |
10.3 | | Employment Agreement between Kearny Bank and William C. Ledgerwood dated May 18, 2015 (Incorporated by reference to Exhibit 10.3 to Kearny Financial Corp.’s Annual Report on Form 10-K (File No. 001-37399), originally filed on September 14, 2015)† |
| | |
10.4 | | Employment Agreement between Kearny Bank and Patrick M. Joyce dated May 18, 2015 (Incorporated by reference to Exhibit 10.4 to Kearny Financial Corp.’s Annual Report on Form 10-K (File No. 001-37399), originally filed on September 14, 2015)† |
| | |
10.5 | | Amended and Restated Employment Agreement between Kearny Bank and Eric B. Heyer dated July 1, 2018† |
| | |
10.6 | | Employment Agreement between Kearny Bank and Erika K. Parisi dated May 18, 2015 (Incorporated by reference to Exhibit 10.6 to Kearny Financial Corp.’s Annual Report on Form 10-K (File No. 001-37399), originally filed on September 14, 2015)† |
| | |
10.7 | | Amended and Restated Change in Control Agreement between Kearny Bank and Keith Suchodolski dated July 1, 2018† |
| | |
10.8 | | Amended and Restated Non-Competition Agreement by and between Kearny Bank and Paul M. Aguggia, dated November 29, 2017 (Incorporated by reference to Exhibit 10.1 to Kearny Financial Corp.’s Registration Statement on Form S-4 (File No. 333-222038), originally filed on December 13, 2017)† |
| | |
78
10.9 | | Settlement Agreement by and among Paul M. Aguggia, Kearny Financial Corp., Kearny Bank, Clifton Bancorp Inc. and Clifton Savings Bank, dated November 1, 2017 (Incorporated by reference to Exhibit 10.1 to Clifton Bancorp Inc.’s Current Report on Form 8-K (File No. 001-36390), originally filed on November 2, 2017)† |
| | |
10.10 | | Form of Two Year Change in Control Agreement between Kearny Bank and Certain Officers (Incorporated by reference to Exhibit 10.7 to Kearny Financial Corp.’s Annual Report on Form 10-K (File No. 001-37399), originally filed on September 14, 2015)† |
| | |
10.11 | | Directors Consultation and Retirement Plan as Amended and Restated (Incorporated by reference to Exhibit 10.8 to Kearny Financial Corp.’s Annual Report on Form 10-K (File No. 001-37399), originally filed on September 14, 2015)† |
| | |
10.12 | | Amended and Restated Benefit Equalization Plan for Pension Plan (Incorporated by reference to Exhibit 10.9 to Kearny Financial Corp.’s Annual Report on Form 10-K (File No. 001-37399), originally filed on September 14, 2015)† |
| | |
10.13 | | Amended and Restated Benefits Equalization Plan Related to the Employee Stock Ownership Plan (Incorporated by reference to Exhibit 10.10 to Kearny Financial Corp.’s Annual Report on Form 10-K (File No. 001-37399), originally filed on September 14, 2015)† |
| | |
10.14 | | Kearny Bank Director Life Insurance Agreement (Incorporated by reference to Exhibit 10.1 to Kearny Financial Corp.’s Current Report on Form 8-K (File No. 000-51093), originally filed on August 18, 2005) † |
| | |
10.15 | | Form of Amendment to Kearny Bank Director Life Insurance Agreement (Incorporated by reference to Exhibit 10.14 to Kearny Financial Corp.’s Annual Report on Form 10-K (File No. 001-37399), originally filed on September 14, 2015)† |
| | |
10.16 | | Kearny Bank Executive Life Insurance Agreement (Incorporated by reference to Exhibit 10.2 to Kearny Financial Corp.’s Current Report on Form 8-K (File No. 000-51093), originally filed on August 18, 2005) † |
| | |
10.17 | | Form of Amendment to Kearny Bank Executive Life Insurance Agreement (Incorporated by reference to Exhibit 10.16 to Kearny Financial Corp.’s Annual Report on Form 10-K (File No. 001-37399), originally filed on September 14, 2015)† |
| | |
10.18 | | Kearny Bank Officer Change in Control Severance Pay Plan (Incorporated by reference to Exhibit 10.17 to Kearny Financial Corp.’s Annual Report on Form 10-K (File No. 001-37399), originally filed on September 14, 2015) † |
| | |
10.19 | | Kearny Bank Executive Management Incentive Compensation Plan (Incorporated by reference to Exhibit 10.1 to Kearny Financial Corp.’s Current Report on Form 8-K (File No. 001-37399), originally filed on September 23, 2016) † |
| | |
10.20 | | Amendment to Freeze Benefit Accruals Under the Kearny Financial Corp. Directors Consultation and Retirement Plan (Incorporated by reference to Exhibit 10.1 to Kearny Financial Corp.’s Current Report on Form 8-K (File No. 001-37399), originally filed on December 23, 2015) † |
| | |
10.21 | | Kearny Financial Corp. 2016 Equity Incentive Plan (Incorporated by reference to Appendix A to Kearny Financial Corp’s Proxy Statement (File No. 001-37399), originally filed on September 14, 2016) † |
| | |
11 | | Statement Regarding Computation of Earnings per Share |
| | |
14 | | Code of Ethics* |
| | |
21 | | Subsidiaries of Registrant (Incorporated by reference to the Registrant’s Registration Statement on Form S-1 (File No. 333-198602), originally filed on September 5, 2014) |
| | |
23.1 | | Consent of BDO USA, LLP |
| | |
23.2 | | Consent of Crowe LLP |
| | |
31.1 | | Certification of Chief Executive Officer pursuant to Section 302 of the Sarbanes-Oxley Act of 2002 |
| | |
31.2 | | Certification of Chief Financial Officer pursuant to Section 302 of the Sarbanes-Oxley Act of 2002 |
| | |
32.1 | | Certification of Chief Executive Officer and Chief Financial Officer pursuant to Section 906 of the Sarbanes-Oxley Act of 2002 |
| | |
| | |
| | |
| | |
79
101 | | The following materials from the Company’s Annual Report to Stockholders on Form 10-K for the year ended June 30, 2018, formatted in XBRL (Extensible Business Reporting Language): (i) the Consolidated Statements of Financial Condition, (ii) the Consolidated Statements of Operations; (iii) the Consolidated Statements of Comprehensive Income, (iv) the Consolidated Statements of Changes in Stockholder’s Equity, (v) the Consolidated Statements of Cash Flows and (vi) the Notes to Consolidated Financial Statements. |
| | |
101.INS | | XBRL Instance Document |
| | |
101.SCH | | XBRL Taxonomy Extension Schema Document |
| | |
101.CAL | | XBRL Taxonomy Extension Calculation Linkbase Document |
| | |
101.DEF | | XBRL Taxonomy Extension Definition Linkbase Document |
| | |
101.LAB | | XBRL Taxonomy Extension Labels Linkbase Document |
| | |
101.PRE | | XBRL Taxonomy Extension Presentation Linkbase Document |
† | Management contract or compensatory plan or arrangement required to be filed as an exhibit. |
* | Available on Registrant’s website. |
Item 16. Form 10-K Summary
Not applicable.
80
| 
| |
| | |
| 120 Passaic Avenue ● Fairfield, NJ 07004-3510 ● 973-244-4500 | |
| | |
August 28, 2018
Management Report on Internal Control over Financial Reporting
The management of Kearny Financial Corp. and Subsidiaries (collectively the “Company”) is responsible for establishing and maintaining adequate internal control over financial reporting. The Company’s internal control system is a process designed to provide reasonable assurance to the management and board of directors regarding the preparation and fair presentation of published consolidated financial statements.
The Company’s internal control over financial reporting includes policies and procedures that pertain to the maintenance of records that, in reasonable detail, accurately and fairly reflect transactions and dispositions of assets; provide reasonable assurances that transactions are recorded as necessary to permit preparation of consolidated financial statements in accordance with U.S. generally accepted accounting principles and that receipts and expenditures are being made only in accordance with authorizations of management and the directors of the Company; and provide reasonable assurance regarding prevention or timely detection of unauthorized acquisition, use or disposition of the Company’s assets that could have a material effect on our consolidated financial statements.
All internal control systems, no matter how well designed, have inherent limitations. Therefore, even those systems determined to be effective can provide only reasonable assurance with respect to consolidated financial statement preparation and presentation. Also, projections of any evaluation of effectiveness to future periods are subject to the risk that controls may become inadequate because of changes in conditions, or that the degree of compliance with the policies or procedures may deteriorate.
The Company’s management assessed the effectiveness of internal control over financial reporting as of June 30, 2018. In making this assessment, management used the criteria set forth by the Committee of Sponsoring Organizations of the Treadway Commission in Internal Control-Integrated Framework (2013). Based on its assessment, management believes that, as of June 30, 2018, the Company’s internal control over financial reporting is effective based on those criteria.
The Company acquired Clifton Bancorp Inc. on April 2, 2018. As permitted, management has excluded Clifton Bancorp Inc. from its assessment of the effectiveness of the Company's internal control over financial reporting as of June 30, 2018. The acquisition is described in Note 3 of the consolidated financial statements included with the Company’s Annual Report on Form 10-K for the year ended June 30, 2018.
The Company’s independent registered public accounting firm that audited the consolidated financial statements has issued an audit report on the effective operation of the Company’s internal control over financial reporting as of June 30, 2018, a copy of which is included in this annual report.
/s/ Craig L. Montanaro | | /s/ Keith Suchodolski |
Craig L. Montanaro | | Keith Suchodolski |
President and Chief Executive Officer | | Executive Vice President and Chief Financial Officer |
F-1
REPORT OF INDEPENDENT REGISTERED PUBLIC ACCOUNTING FIRM
The Board of Directors and Stockholders of
Kearny Financial Corp. and Subsidiaries
Fairfield, New Jersey
Opinions on the Financial Statements and Internal Control over Financial Reporting
We have audited the accompanying consolidated statement of financial condition of Kearny Financial Corp. and Subsidiaries (the "Company") as of June 30, 2018, and the related consolidated statements of income, comprehensive income, changes in stockholders’ equity, and cash flows for the year ended June 30, 2018, and the related notes (collectively referred to as the "financial statements"). We also have audited the Company’s internal control over financial reporting as of June 30, 2018, based on criteria established in Internal Control – Integrated Framework: (2013) issued by the Committee of Sponsoring Organizations of the Treadway Commission (“COSO”).
In our opinion, the financial statements referred to above present fairly, in all material respects, the financial position of the Company as of June 30, 2018, and the results of its operations and its cash flows for the year ended June 30, 2018 in conformity with accounting principles generally accepted in the United States of America. Also in our opinion, the Company maintained, in all material respects, effective internal control over financial reporting as of June 30, 2018, based on criteria established in Internal Control – Integrated Framework: (2013) issued by COSO.
Basis for Opinions
The Company’s management is responsible for these financial statements, for maintaining effective internal control over financial reporting, and for its assessment of the effectiveness of internal control over financial reporting, included in the accompanying Management’s Report on Internal Control over Financial Reporting. Our responsibility is to express an opinion on the Company’s financial statements and an opinion on the Company’s internal control over financial reporting based on our audits. We are a public accounting firm registered with the Public Company Accounting Oversight Board (United States) ("PCAOB") and are required to be independent with respect to the Company in accordance with the U.S. federal securities laws and the applicable rules and regulations of the Securities and Exchange Commission and the PCAOB.
We conducted our audits in accordance with the standards of the PCAOB. Those standards require that we plan and perform the audits to obtain reasonable assurance about whether the financial statements are free of material misstatement, whether due to error or fraud, and whether effective internal control over financial reporting was maintained in all material respects.
Our audit of the financial statements included performing procedures to assess the risks of material misstatement of the financial statements, whether due to error or fraud, and performing procedures that respond to those risks. Such procedures included examining, on a test basis, evidence regarding the amounts and disclosures in the financial statements. Our audit also included evaluating the accounting principles used and significant estimates made by management, as well as evaluating the overall presentation of the financial statements. Our audit of internal control over financial reporting included obtaining an understanding of internal control over financial reporting, assessing the risk that a material weakness exists, and testing and evaluating the design and operating effectiveness of internal control based on the assessed risk. As permitted, the Company has excluded the operations of Clifton Bancorp Inc. acquired during 2018, which is described in Note 3 of the financial statements, from the scope of management’s report on internal control over financial reporting. As such, it has also been excluded from the scope of our audit of internal control over financial reporting. Our audit also included performing such other procedures as we considered necessary in the circumstances. We believe that our audits provide a reasonable basis for our opinions.
F-2
Definition and Limitations of Internal Control over Financial Reporting
A company’s internal control over financial reporting is a process designed to provide reasonable assurance regarding the reliability of financial reporting and the preparation of financial statements for external purposes in accordance with generally accepted accounting principles. A company’s internal control over financial reporting includes those policies and procedures that (1) pertain to the maintenance of records that, in reasonable detail, accurately and fairly reflect the transactions and dispositions of the assets of the company; (2) provide reasonable assurance that transactions are recorded as necessary to permit preparation of financial statements in accordance with generally accepted accounting principles, and that receipts and expenditures of the company are being made only in accordance with authorizations of management and directors of the company; and (3) provide reasonable assurance regarding prevention or timely detection of unauthorized acquisition, use, or disposition of the company’s assets that could have a material effect on the financial statements.
Because of its inherent limitations, internal control over financial reporting may not prevent or detect misstatements. Also, projections of any evaluation of effectiveness to future periods are subject to the risk that controls may become inadequate because of changes in conditions, or that the degree of compliance with the policies or procedures may deteriorate.
/s/ Crowe LLP
We have served as the Company's auditor since 2017.
Livingston, New Jersey
August 28, 2018
F-3
Report of Independent Registered Public Accounting Firm
Board of Directors and Stockholders
Kearny Financial Corp.
Fairfield, New Jersey
We have audited the accompanying consolidated statements of financial condition of Kearny Financial Corp. and Subsidiaries (collectively the “Company”) at June 30, 2017, and the related consolidated statements of income, comprehensive income, changes in stockholders’ equity, and cash flows for each of the years in the two-year period ended June 30, 2017. These financial statements are the responsibility of the Company’s management. Our responsibility is to express an opinion on these financial statements based on our audits.
We conducted our audits in accordance with the standards of the Public Company Accounting Oversight Board (United States). Those standards require that we plan and perform the audit to obtain reasonable assurance about whether the financial statements are free of material misstatement. An audit includes examining, on a test basis, evidence supporting the amounts and disclosures in the financial statements, assessing the accounting principles used and significant estimates made by management, as well as evaluating the overall financial statement presentation. We believe that our audits provide a reasonable basis for our opinion.
In our opinion, the consolidated financial statements referred to above present fairly, in all material respects, the financial position of Kearny Financial Corp. and Subsidiaries as of June 30, 2017, and the results of their operations and their cash flows for each of the years in the two-year period ended June 30, 2017, in conformity with accounting principles generally accepted in the United States of America.
/s/ BDO USA, LLP
New York, New York
August 29, 2017
F-4
KEARNY FINANCIAL CORP. AND SUBSIDIARIES
Consolidated Statements of Financial Condition
(In Thousands, Except Share and Per Share Data)
| June 30, | |
| 2018 | | | 2017 | |
Assets | | | | | | | |
Cash and amounts due from depository institutions | $ | 26,199 | | | $ | 18,889 | |
Interest-bearing deposits in other banks | | 102,665 | | | | 59,348 | |
Cash and cash equivalents | | 128,864 | | | | 78,237 | |
Investment securities available for sale, at fair value | | 725,085 | | | | 613,760 | |
Investment securities held to maturity (fair value $579,499 and $495,794) | | 589,730 | | | | 493,321 | |
Loans held-for-sale | | 863 | | | | 4,692 | |
Loans receivable, including (unaccreted) unamortized yield adjustments of $(66,567) and $2,808 | | 4,501,348 | | | | 3,245,261 | |
Less allowance for loan losses | | (30,865 | ) | | | (29,286 | ) |
Net loans receivable | | 4,470,483 | | | | 3,215,975 | |
Premises and equipment | | 56,240 | | | | 39,585 | |
Federal Home Loan Bank of New York stock | | 59,004 | | | | 39,958 | |
Accrued interest receivable | | 18,510 | | | | 12,493 | |
Goodwill | | 210,895 | | | | 108,591 | |
Core deposit intangible | | 6,295 | | | | 292 | |
Bank owned life insurance | | 249,816 | | | | 181,223 | |
Deferred income tax assets, net | | 23,754 | | | | 15,454 | |
Other real estate owned | | 725 | | | | 1,632 | |
Other assets | | 39,610 | | | | 12,914 | |
Total Assets | $ | 6,579,874 | | | $ | 4,818,127 | |
| | | | | | | |
Liabilities and Stockholders' Equity | | | | | | | |
Liabilities | | | | | | | |
Deposits: | | | | | | | |
Non-interest-bearing | $ | 311,938 | | | $ | 267,412 | |
Interest-bearing | | 3,761,666 | | | | 2,662,333 | |
Total deposits | | 4,073,604 | | | | 2,929,745 | |
Borrowings | | 1,198,646 | | | | 806,228 | |
Advance payments by borrowers for taxes | | 18,088 | | | | 8,711 | |
Other liabilities | | 20,788 | | | | 16,262 | |
Total Liabilities | | 5,311,126 | | | | 3,760,946 | |
| | | | | | | |
Stockholders' Equity | | | | | | | |
Preferred stock, $0.01 par value, 100,000,000 shares authorized; none issued and outstanding | | - | | | | - | |
Common stock, $0.01 par value; 800,000,000 shares authorized; 99,626,400 shares and 84,350,848 shares issued and outstanding, respectively | | 996 | | | | 844 | |
Paid-in capital | | 922,711 | | | | 728,790 | |
Retained earnings | | 359,096 | | | | 361,039 | |
Unearned employee stock ownership plan shares; 3,361,684 shares and 3,562,382 shares, respectively | | (32,590 | ) | | | (34,536 | ) |
Accumulated other comprehensive income | | 18,535 | | | | 1,044 | |
Total Stockholders' Equity | | 1,268,748 | | | | 1,057,181 | |
Total Liabilities and Stockholders' Equity | $ | 6,579,874 | | | $ | 4,818,127 | |
See notes to consolidated financial statements.
F-5
KEARNY FINANCIAL CORP. AND SUBSIDIARIES
Consolidated Statements of Income
(In Thousands, Except Per Share Data)
| Years Ended June 30, | |
| | 2018 | | | | 2017 | | | | 2016 | |
Interest Income | | | | | | | | | | | |
Loans | $ | 138,426 | | | $ | 111,181 | | | $ | 97,956 | |
Taxable investment securities | | 27,053 | | | | 23,543 | | | | 24,970 | |
Tax-exempt investment securities | | 2,616 | | | | 2,300 | | | | 2,191 | |
Other interest-earning assets | | 3,336 | | | | 2,069 | | | | 1,771 | |
Total Interest Income | | 171,431 | | | | 139,093 | | | | 126,888 | |
| | | | | | | | | | | |
Interest Expense | | | | | | | | | | | |
Deposits | | 29,649 | | | | 22,100 | | | | 18,673 | |
Borrowings | | 20,489 | | | | 14,419 | | | | 13,230 | |
Total Interest Expense | | 50,138 | | | | 36,519 | | | | 31,903 | |
Net Interest Income | | 121,293 | | | | 102,574 | | | | 94,985 | |
Provision for Loan Losses | | 2,706 | | | | 5,381 | | | | 10,690 | |
Net Interest Income after Provision for Loan Losses | | 118,587 | | | | 97,193 | | | | 84,295 | |
| | | | | | | | | | | |
Non-Interest Income | | | | | | | | | | | |
Fees and service charges | | 5,412 | | | | 3,289 | | | | 3,516 | |
Gain (loss) on sale and call of securities | | 8 | | | | (1 | ) | | | 2 | |
Gain on sale of loans | | 1,004 | | | | 1,535 | | | | 436 | |
Loss on sale and write down of real estate owned | | (19 | ) | | | (106 | ) | | | (137 | ) |
Income from bank owned life insurance | | 5,362 | | | | 5,207 | | | | 5,563 | |
Electronic banking fees and charges | | 1,101 | | | | 1,080 | | | | 1,091 | |
Miscellaneous | | 395 | | | | 344 | | | | 256 | |
Total Non-Interest Income | | 13,263 | | | | 11,348 | | | | 10,727 | |
| | | | | | | | | | | |
Non-Interest Expense | | | | | | | | | | | |
Salaries and employee benefits | | 54,034 | | | | 47,818 | | | | 42,105 | |
Net occupancy expense of premises | | 9,178 | | | | 8,018 | | | | 7,487 | |
Equipment and systems | | 9,482 | | | | 8,350 | | | | 7,729 | |
Advertising and marketing | | 2,960 | | | | 2,626 | | | | 2,020 | |
Federal deposit insurance premium | | 1,516 | | | | 1,334 | | | | 2,708 | |
Directors' compensation | | 2,820 | | | | 1,982 | | | | 812 | |
Merger-related expenses | | 6,743 | | | | - | | | | - | |
Miscellaneous | | 11,117 | | | | 10,990 | | | | 9,556 | |
Total Non-Interest Expense | | 97,850 | | | | 81,118 | | | | 72,417 | |
Income before Income Taxes | | 34,000 | | | | 27,423 | | | | 22,605 | |
Income tax expense | | 14,404 | | | | 8,820 | | | | 6,783 | |
Net Income | $ | 19,596 | | | $ | 18,603 | | | $ | 15,822 | |
| | | | | | | | | | | |
Net Income per Common Share (EPS) | | | | | | | | | | | |
Basic | $ | 0.24 | | | $ | 0.22 | | | $ | 0.18 | |
Diluted | $ | 0.24 | | | $ | 0.22 | | | $ | 0.18 | |
Weighted Average Number of Common Shares Outstanding | | | | | | | | | | | |
Basic | | 82,587 | | | | 84,590 | | | | 89,591 | |
Diluted | | 82,643 | | | | 84,661 | | | | 89,625 | |
| | | | | | | | | | | |
Dividends Declared Per Common Share | $ | 0.25 | | | $ | 0.10 | | | $ | 0.08 | |
| | | | | | | | | | | |
See notes to consolidated financial statements.
F-6
KEARNY FINANCIAL CORP. AND SUBSIDIARIES
Consolidated Statements of Comprehensive Income
(In Thousands)
| Years Ended June 30, | |
| | 2018 | | | | 2017 | | | | 2016 | |
Net Income | $ | 19,596 | | | $ | 18,603 | | | $ | 15,822 | |
Other Comprehensive Income (Loss), net of tax: | | | | | | | | | | | |
Net unrealized (loss) gain on securities available for sale | | (1,423 | ) | | | 1,108 | | | | (2,502 | ) |
Change in net unrealized gain (loss) on securities transferred to held to maturity | | 146 | | | | (31 | ) | | | 5 | |
Net realized (gain) loss on securities available for sale | | (12 | ) | | | 238 | | | | - | |
Fair value adjustments on derivatives | | 17,212 | | | | 16,347 | | | | (6,026 | ) |
Benefit plan adjustments | | 187 | | | | 169 | | | | (503 | ) |
Total Other Comprehensive Income (Loss) | | 16,110 | | | | 17,831 | | | | (9,026 | ) |
Total Comprehensive Income | $ | 35,706 | | | $ | 36,434 | | | $ | 6,796 | |
See notes to consolidated financial statements.
F-7
KEARNY FINANCIAL CORP. AND SUBSIDIARIES
Consolidated Statements of Changes in Stockholders’ Equity
(In Thousands)
| Common Stock | | | Paid-In | | | Retained | | | Unearned ESOP | | | Accumulated Other Comprehensive | | | | | |
| Shares | | | Amount | | | Capital | | | Earnings | | | Shares | | | Loss | | | Total | |
Balance - June 30, 2015 | | 93,528 | | | $ | 935 | | | $ | 870,480 | | | $ | 342,148 | | | $ | (38,427 | ) | | $ | (7,761 | ) | | $ | 1,167,375 | |
| | | | | | | | | | | | | | | | | | | | | | | | | | | |
Net income | | - | | | | - | | | | - | | | | 15,822 | | | | - | | | | - | | | | 15,822 | |
Other comprehensive loss, net of income tax benefit | | - | | | | - | | | | - | | | | - | | | | - | | | | (9,026 | ) | | | (9,026 | ) |
ESOP shares committed to be released (201 shares) | | - | | | | - | | | | 492 | | | | - | | | | 1,946 | | | | - | | | | 2,438 | |
Stock option expense | | - | | | | - | | | | 160 | | | | - | | | | - | | | | - | | | | 160 | |
Share repurchases | | (1,706 | ) | | | (17 | ) | | | (22,269 | ) | | | - | | | | - | | | | - | | | | (22,286 | ) |
Restricted stock plan shares earned (35 shares) | | - | | | | - | | | | 310 | | | | - | | | | - | | | | - | | | | 310 | |
Cash dividends declared ($0.08 per common share) | | - | | | | - | | | | - | | | | (7,164 | ) | | | - | | | | - | | | | (7,164 | ) |
| | | | | | | | | | | | | | | | | | | | | | | | | | | |
Balance - June 30, 2016 | | 91,822 | | | $ | 918 | | | $ | 849,173 | | | $ | 350,806 | | | $ | (36,481 | ) | | $ | (16,787 | ) | | $ | 1,147,629 | |
| Common Stock | | | | | Paid-In | | | | | Retained | | | | | Unearned ESOP | | | | | Accumulated Other Comprehensive | | | | | |
| Shares | | | | | Amount | | | | | Capital | | | | | Earnings | | | | | Shares | | | | | (Loss) Income | | | Total | |
Balance - June 30, 2016 | | 91,822 | | | | | $ | 918 | | | | | $ | 849,173 | | | | | $ | 350,806 | | | | | $ | (36,481 | ) | | | | $ | (16,787 | ) | | $ | 1,147,629 | |
| | | | | | | | | | | | | | | | | | | | | | | | | | | | | | | | | | | | | |
Net income | | - | | | | | | - | | | | | | - | | | | | | 18,603 | | | | | | - | | | | | | - | | | | 18,603 | |
Other comprehensive income, net of income tax expense | | - | | | | | | - | | | | | | - | | | | | | - | | | | | | - | | | | | | 17,831 | | | | 17,831 | |
ESOP shares committed to be released (201 shares) | | - | | | | | | - | | | | | | 972 | | | | | | - | | | | | | 1,945 | | | | | | - | | | | 2,917 | |
Stock option exercise | | 62 | | | | | | 1 | | | | | | 481 | | | | | | - | | | | | | - | | | | | | - | | | | 482 | |
Stock option expense | | - | | | | | | - | | | | | | 1,275 | | | | | | - | | | | | | - | | | | | | - | | | | 1,275 | |
Share repurchases | | (8,886 | ) | | | | | (89 | ) | | | | | (125,913 | ) | | | | | - | | | | | | - | | | | | | - | | | | (126,002 | ) |
Issuance of shares for stock benefit plan | | 1,387 | | | | | | 14 | | | | | | (14 | ) | | | | | - | | | | | | - | | | | | | - | | | | - | |
Cancellation of expired, ungranted shares issued for stock benefit plan | | (34 | ) | | | | | - | | | | | | 183 | | | | | | - | | | | | | - | | | | | | - | | | | 183 | |
Restricted stock plan shares earned (176 shares) | | - | | | | | | - | | | | | | 2,633 | | | | | | - | | | | | | - | | | | | | - | | | | 2,633 | |
Cash dividends declared ($0.10 per common share) | | - | | | | | | - | | | | | | - | | | | | | (8,370 | ) | | | | | - | | | | | | - | | | | (8,370 | ) |
| | | | | | | | | | | | | | | | | | | | | | | | | | | | | | | | | | | | | |
Balance - June 30, 2017 | | 84,351 | | | | | $ | 844 | | | | | $ | 728,790 | | | | | $ | 361,039 | | | | | $ | (34,536 | ) | | | | $ | 1,044 | | | $ | 1,057,181 | |
See notes to consolidated financial statements.
F-8
KEARNY FINANCIAL CORP. AND SUBSIDIARIES
Consolidated Statements of Changes in Stockholders’ Equity
(In Thousands)
| Common Stock | | | Paid-In | | | Retained | | | Unearned ESOP | | | Accumulated Other Comprehensive | | | | | |
| Shares | | | Amount | | | Capital | | | Earnings | | | Shares | | | Income | | | Total | |
Balance - June 30, 2017 | | 84,351 | | | $ | 844 | | | $ | 728,790 | | | $ | 361,039 | | | $ | (34,536 | ) | | $ | 1,044 | | | $ | 1,057,181 | |
| | | | | | | | | | | | | | | | | | | | | | | | | | | |
Net income | | - | | | | - | | | | - | | | | 19,596 | | | | - | | | | - | | | | 19,596 | |
Other comprehensive income, net of income tax expense | | - | | | | - | | | | - | | | | - | | | | - | | | | 16,110 | | | | 16,110 | |
ESOP shares committed to be released (201 shares) | | - | | | | - | | | | 903 | | | | - | | | | 1,946 | | | | - | | | | 2,849 | |
Stock option exercise | | 10 | | | | - | | | | 102 | | | | - | | | | - | | | | - | | | | 102 | |
Stock option expense | | - | | | | - | | | | 2,016 | | | | - | | | | - | | | | - | | | | 2,016 | |
Share repurchases | | (10,015 | ) | | | (100 | ) | | | (142,502 | ) | | | - | | | | - | | | | - | | | | (142,602 | ) |
Restricted stock plan shares earned (288 shares) | | - | | | | - | | | | 4,330 | | | | - | | | | - | | | | - | | | | 4,330 | |
Cancellation of shares issued for restricted stock awards | | (158 | ) | | | (2 | ) | | | (1,368 | ) | | | - | | | | - | | | | - | | | | (1,370 | ) |
Reclassification of stranded tax effects from Accumulated Other Comprehensive Income | | - | | | | - | | | | - | | | | (1,381 | ) | | | - | | | | 1,381 | | | | - | |
Acquisition of Clifton Bancorp | | 25,438 | | | | 254 | | | | 330,440 | | | | - | | | | - | | | | - | | | | 330,694 | |
Cash dividends declared ($0.25 per common share) | | - | | | | - | | | | - | | | | (20,158 | ) | | | - | | | | - | | | | (20,158 | ) |
| | | | | | | | | | | | | | | | | | | | | | | | | | | |
Balance - June 30, 2018 | | 99,626 | | | $ | 996 | | | $ | 922,711 | | | $ | 359,096 | | | $ | (32,590 | ) | | $ | 18,535 | | | $ | 1,268,748 | |
See notes to consolidated financial statements.
F-9
KEARNY FINANCIAL CORP. AND SUBSIDIARIES
Consolidated Statements of Cash Flows
(In Thousands)
| Years Ended June 30, | |
| | 2018 | | | | 2017 | | | | 2016 | |
Cash Flows from Operating Activities: | | | | | | | | | | | |
Net income | $ | 19,596 | | | $ | 18,603 | | | $ | 15,822 | |
Adjustment to reconcile net income to net cash provided by operating activities: | | | | | | | | | | | |
Depreciation and amortization of premises and equipment | | 3,224 | | | | 2,843 | | | | 2,988 | |
Net amortization of premiums, discounts and loan fees and costs | | 986 | | | | 4,935 | | | | 4,739 | |
Deferred income taxes and valuation allowance | | 6,700 | | | | (1,843 | ) | | | (1,578 | ) |
Amortization of intangible assets | | 364 | | | | 138 | | | | 167 | |
Amortization of benefit plans’ unrecognized net (gain) loss | | (39 | ) | | | 65 | | | | 59 | |
Provision for loan losses | | 2,706 | | | | 5,381 | | | | 10,690 | |
Loss on write-down and sales of real estate owned | | 19 | | | | 106 | | | | 137 | |
Loans originated for sale | | (74,937 | ) | | | (85,806 | ) | | | (9,215 | ) |
Proceeds from sale of mortgage loans held-for-sale | | 79,509 | | | | 85,144 | | | | 5,981 | |
Gain on sale of mortgage loans held-for-sale, net | | (742 | ) | | | (713 | ) | | | (82 | ) |
Proceeds from sale of SBA loans | | 3,064 | | | | 10,411 | | | | 14,224 | |
Realized gain on sale of SBA loans | | (262 | ) | | | (822 | ) | | | (354 | ) |
Realized (gain) loss on sale/call of securities available for sale | | (16 | ) | | | 401 | | | | - | |
Realized loss (gain) on sale/call of securities held to maturity | | 8 | | | | (400 | ) | | | (2 | ) |
Realized loss (gain) on disposition of premises and equipment | | 10 | | | | (9 | ) | | | (14 | ) |
Increase in cash surrender value of bank owned life insurance | | (5,362 | ) | | | (5,207 | ) | | | (5,563 | ) |
ESOP, stock option plan and restricted stock plan expenses | | 9,195 | | | | 6,825 | | | | 2,908 | |
Increase in interest receivable | | (1,875 | ) | | | (1,281 | ) | | | (1,339 | ) |
Decrease (increase) in other assets | | 138 | | | | 59 | | | | (1,145 | ) |
Increase in interest payable | | 558 | | | | 468 | | | | 205 | |
Increase (decrease) in other liabilities | | 2,251 | | | | (768 | ) | | | 549 | |
Net Cash Provided by Operating Activities | | 45,095 | | | | 38,530 | | | | 39,177 | |
| | | | | | | | | | | |
Cash Flows from Investing Activities: | | | | | | | | | | | |
Purchases of: | | | | | | | | | | | |
Investment securities available for sale | | (189,255 | ) | | | (169,051 | ) | | | - | |
Investment securities held to maturity | | (122,512 | ) | | | (34,429 | ) | | | (29,783 | ) |
Proceeds from: | | | | | | | | | | | |
Repayments/calls/maturities of investment securities available for sale | | 79,853 | | | | 147,133 | | | | 88,075 | |
Repayments/calls/maturities of investment securities held to maturity | | 92,437 | | | | 111,324 | | | | 113,508 | |
Sale of investment securities available for sale | | 254,606 | | | | 83,008 | | | | - | |
Sale of investment securities held to maturity | | 211 | | | | 5,300 | | | | - | |
Purchase of loans | | (54,590 | ) | | | (143,633 | ) | | | (356,421 | ) |
Net increase in loans receivable | | (87,831 | ) | | | (440,845 | ) | | | (233,913 | ) |
Proceeds from sale of real estate owned | | 2,492 | | | | 1,026 | | | | 2,225 | |
Additions to premises and equipment | | (8,268 | ) | | | (4,035 | ) | | | (2,193 | ) |
Proceeds from cash settlement of premises and equipment | | - | | | | - | | | | 14 | |
Purchase of FHLB stock | | (7,646 | ) | | | (26,765 | ) | | | (3,711 | ) |
Redemption of FHLB stock | | 8,957 | | | | 17,419 | | | | 567 | |
Net cash acquired in acquisition | | 30,099 | | | | - | | | | - | |
Net Cash Used in Investing Activities | $ | (1,447 | ) | | $ | (453,548 | ) | | $ | (421,632 | ) |
See notes to consolidated financial statements.
F-10
KEARNY FINANCIAL CORP. AND SUBSIDIARIES
Consolidated Statements of Cash Flows
(In Thousands)
| Years Ended June 30, | |
| | 2018 | | | | 2017 | | | | 2016 | |
Cash Flows from Financing Activities: | | | | | | | | | | | |
Net increase in deposits | $ | 194,174 | | | $ | 235,079 | | | $ | 229,164 | |
Repayment of term FHLB advances | | (2,520,334 | ) | | | (2,103,103 | ) | | | (1,657,599 | ) |
Proceeds from term FHLB advances | | 2,500,000 | | | | 2,300,000 | | | | 1,700,000 | |
Net (decrease) increase in other short-term borrowings | | (2,030 | ) | | | (5,103 | ) | | | 541 | |
Net (decrease) increase in advance payments by borrowers for taxes | | (400 | ) | | | 805 | | | | (1,137 | ) |
Repurchase and cancellation of common stock of Kearny Financial Corp. | | (142,602 | ) | | | (126,002 | ) | | | (22,286 | ) |
Cancellation of expired, ungranted shares issued for stock benefit plan | | - | | | | 183 | | | | - | |
Cancellation of shares repurchased on vesting to pay taxes | | (1,370 | ) | | | - | | | | - | |
Exercise of stock options | | 102 | | | | 482 | | | | - | |
Dividends paid | | (20,561 | ) | | | (8,286 | ) | | | (7,164 | ) |
Net Cash Provided by Financing Activities | | 6,979 | | | | 294,055 | | | | 241,519 | |
Net Increase (decrease) in Cash and Cash Equivalents | | 50,627 | | | | (120,963 | ) | | | (140,936 | ) |
Cash and Cash Equivalents - Beginning | | 78,237 | | | | 199,200 | | | | 340,136 | |
Cash and Cash Equivalents - Ending | $ | 128,864 | | | $ | 78,237 | | | $ | 199,200 | |
| | | | | | | | | | | |
Supplemental Disclosures of Cash Flows Information: | | | | | | | | | | | |
Cash paid during the year for: | | | | | | | | | | | |
Income taxes, net of refunds | $ | 9,333 | | | $ | 9,483 | | | $ | 9,177 | |
Interest | $ | 49,581 | | | $ | 36,051 | | | $ | 31,698 | |
| | | | | | | | | | | |
Non-cash investing activities: | | | | | | | | | | | |
Acquisition of real estate owned in settlement of loans | $ | 1,463 | | | $ | 1,939 | | | $ | 2,247 | |
Fair value of assets acquired, net of cash and cash equivalents acquired | $ | 1,607,496 | | | $ | - | | | $ | - | |
Fair value of liabilites assumed | $ | 1,375,859 | | | $ | - | | | $ | - | |
See notes to consolidated financial statements.
F-11
KEARNY FINANCIAL CORP. AND SUBSIDIARIES
Notes to Consolidated Financial Statements
Note 1 - Summary of Significant Accounting Policies
Basis of Consolidated Financial Statement Presentation
The consolidated financial statements include the accounts of Kearny Financial Corp. (the “Company”), its wholly-owned subsidiary, Kearny Bank (the “Bank”) and the Bank’s wholly-owned subsidiaries, CJB Investment Corp. and KFS Financial Services, Inc. and its wholly-owned subsidiary, KFS Insurance Services, Inc. The Company conducts its business principally through the Bank. Management prepared the consolidated financial statements in conformity with accounting principles generally accepted in the United States of America (“GAAP”), including the elimination of all significant inter-company accounts and transactions during consolidation.
In preparing the consolidated financial statements, management is required to make estimates and assumptions that affect the reported amounts of assets and liabilities as of the dates of the consolidated statements of financial condition and revenues and expenses for the periods then ended. Actual results could differ significantly from those estimates.
Business of the Company and Subsidiaries
The Company’s primary business is the ownership and operation of the Bank. The Bank is principally engaged in the business of attracting deposits from the general public at its 54 retail branches in New Jersey and New York and using these deposits, together with other funds, to originate or purchase loans for its portfolio and invest in securities. Loans originated or purchased by the Bank generally include loans collateralized by residential and commercial real estate augmented by secured and unsecured loans to businesses and consumers. The investment securities purchased by the Bank generally include U.S. agency mortgage-backed securities, U.S. government and agency debentures, bank-qualified municipal obligations, corporate bonds, asset-backed securities, collateralized loan obligations and subordinated debt. The Company maintains a small balance of single issuer trust preferred securities and non-agency mortgage-backed securities that were acquired through its purchase of other institutions.
At June 30, 2018, the Bank had two wholly owned subsidiaries: KFS Financial Services, Inc. and CJB Investment Corp. KFS Financial Services, Inc., incorporated as a New Jersey corporation in 1994 under the name of South Bergen Financial Services, Inc., was acquired in Kearny’s merger with South Bergen Savings Bank in 1999 and was renamed KFS Financial Services, Inc. in 2000. It is a service corporation subsidiary originally organized for selling insurance products to Bank customers and the general public through a third party networking arrangement.
KFS Insurance Services, Inc. is a wholly owned subsidiary of KFS Financial Services, Inc. for the primary purpose of acquiring insurance agencies. Both KFS Financial Services Inc. and KFS Insurance Services Inc. were considered inactive during the three-year period ended June 30, 2018.
CJB Investment Corp was organized under New Jersey law as a New Jersey Investment Company and remained active through the three-year period ended June 30, 2018.
F-12
KEARNY FINANCIAL CORP. AND SUBSIDIARIES
Notes to Consolidated Financial Statements
Note 1 - Summary of Significant Accounting Policies (continued)
Cash and Cash Equivalents
Cash and cash equivalents include cash, deposits with other financial institutions with maturities fewer than 90 days, and federal funds sold. Net cash flows are reported for customer loan and deposit transactions, interest bearing deposits in other financial institutions, borrowings with original maturities fewer than 90 days.
Securities
The Company classifies its investment securities among two categories: held to maturity and available for sale. The Company does not use or maintain a trading account. Investments in debt and equity securities that we have the positive intent and ability to hold to maturity are classified as held to maturity securities and reported at amortized cost. Debt and equity securities not classified as held to maturity securities are classified as available for sale securities and reported at fair value, with unrealized holding gains or losses, net of deferred income taxes, reported in the accumulated other comprehensive income (“OCI”) component of stockholders’ equity.
If the fair value of a security is less than its amortized cost, the security is deemed to be impaired. Management evaluates all securities with unrealized losses quarterly to determine if such impairments are “temporary” or “other-than-temporary”.
The Company accounts for temporary impairments based upon their classification as either available for sale or held to maturity. Temporary impairments on “available for sale” securities are recognized, on a tax-effected basis, through OCI with offsetting entries adjusting the carrying value of the security and the balance of deferred taxes. Conversely, the Company does not adjust the carrying value of “held to maturity” securities for temporary impairments, although information concerning the amount and duration of impairments on held to maturity securities is disclosed in periodic financial statements.
The Company accounts for other-than-temporary impairments based upon several considerations. First, other-than-temporary impairments on securities that the Company has decided to sell as of the close of a fiscal period, or will, more likely than not, be required to sell prior to the full recovery of their fair value to a level equal to or exceeding their amortized cost, are recognized in earnings. If neither of these conditions regarding the likelihood of the securities’ sale are applicable, then, for debt securities, the other-than-temporary impairment is bifurcated into credit-related and noncredit-related components. A credit-related impairment generally represents the amount by which the present value of the cash flows that are expected to be collected on a debt security fall below its amortized cost. The noncredit-related component represents the remaining portion of the impairment not otherwise designated as credit-related. The Company recognizes credit-related, other-than-temporary impairments in earnings. However, noncredit-related, other-than-temporary impairments on debt securities are recognized in OCI.
Premiums and discounts on all securities are generally amortized/accreted to maturity by use of the level-yield method considering the impact of principal amortization and prepayments on mortgage-backed securities. Premiums on callable securities are generally amortized to the call date whereas discounts on such securities are accreted to the maturity date. Gain or loss on sales of securities is based on the specific identification method.
F-13
KEARNY FINANCIAL CORP. AND SUBSIDIARIES
Notes to Consolidated Financial Statements
Note 1 - Summary of Significant Accounting Policies (continued)
Concentration of Risk
Financial instruments which potentially subject the Company and its subsidiaries to concentrations of credit risk consist of cash and cash equivalents, investment securities and loans receivable. Cash and cash equivalents include deposits placed in other financial institutions. At June 30, 2018, the Company had cash and cash equivalents of $128.9 million comprising funds on deposit at other institutions totaling $110.6 million and other cash-related items, consisting primarily of vault cash and cash held by, or in transit to/from, our cash repository service provider, totaling $18.3 million. Cash and equivalents on deposit at other institutions at June 30, 2018 included $19.4 million held by the Federal Home Loan Bank of New York (“FHLB”), $83.3 million held by the Federal Reserve Bank of New York (“FRB”) as well as $7.9 million held at two U.S. domestic commercial banks representing funds on deposit totaling $5.5 million and $2.4 million, respectively, at June 30, 2018.
By comparison, at June 30, 2017, the Company had cash and cash equivalents of $78.2 million comprising funds on deposit at other institutions totaling $62.5 million and other cash-related items, consisting primarily of vault cash and cash held by, or in transit to/from, our cash repository service provider, totaling $15.7 million. Cash and equivalents on deposit at other institutions at June 30, 2017 was comprised of $4.8 million held by the FHLB, $53.6 million held by the FRB and a total of $4.2 million held at two U.S. domestic commercial banks representing funds on deposit totaling $3.2 million and $1.0 million, respectively, at June 30, 2017.
Securities include concentrations of investments backed by U.S. government agencies and U.S. government sponsored enterprises (“GSEs”), including the Federal National Mortgage Association (“Fannie Mae”), the Federal Home Loan Mortgage Corporation (“Freddie Mac”), the Government National Mortgage Association (“Ginnie Mae”) and the Small Business Administration (“SBA”). Additional concentration risk exists in the Company’s municipal and corporate obligations, asset-backed securities and collateralized loan obligations. Lesser concentration risk exists in the Company’s non-agency mortgage-backed securities and single issuer trust preferred securities due to comparatively lower total balances of such securities held by the Company and the variety of issuers represented.
The Company’s lending activity is primarily concentrated in loans collateralized by real estate in the states of New Jersey and New York. As a result, credit risk is broadly dependent on the real estate market and general economic conditions in these states. Additionally, the Company’s lending policies limit the amount of credit extended to any single borrower and their related interests thereby limiting the concentration of credit risk to any single borrower.
Loans Receivable
Loans receivable, net are stated at unpaid principal balances, net of deferred loan origination fees and costs, purchased discounts and premiums, purchase accounting fair value adjustments and the allowance for loan losses. Certain direct loan origination costs net of loan origination fees, are deferred and amortized, using the level-yield method, as an adjustment of yield over the contractual lives of the related loans. Unearned premiums and discounts are amortized or accreted by use of the level-yield method over the contractual lives of the related loans.
Loans Held-for-Sale
Loans held-for-sale are carried at the lower of cost or estimated fair value, as determined on an aggregate basis. Net unrealized losses, if any, are recognized in a valuation allowance through charges to earnings. Premiums and discounts and origination fees and costs on loans held-for-sale are deferred and recognized as a component of the gain or loss on sale. Gains and losses on sales of loans held-for-sale are recognized on settlement dates and are determined by the difference between the sale proceeds and the carrying value of the loans. These transactions are accounted for as sales based on our satisfaction of the criteria for such accounting which provide that, as transferor, we have surrendered control over the loans.
F-14
KEARNY FINANCIAL CORP. AND SUBSIDIARIES
Notes to Consolidated Financial Statements
Note 1 - Summary of Significant Accounting Policies (continued)
Past Due Loans
A loan’s “past due” status is generally determined based upon its principal and interest payment (“P&I”) delinquency status in conjunction with its “past maturity” status, where applicable. A loan’s “P&I delinquency” status is based upon the number of calendar days between the date of the earliest P&I payment due and the “as of” measurement date. A loan’s “past maturity” status, where applicable, is based upon the number of calendar days between a loan’s contractual maturity date and the “as of” measurement date. Based upon the larger of these criteria, loans are categorized into the following “past due” tiers for financial statement reporting and disclosure purposes: Current (including 1-29 days past due), 30-59 days, 60-89 days and 90 or more days.
Nonaccrual Loans
Loans are generally placed on nonaccrual status when contractual payments become 90 days or more past due, and are otherwise placed on nonaccrual when the Company does not expect to receive all P&I payments owed substantially in accordance with the terms of the loan agreement. Loans that become 90 days past maturity, but remain non-delinquent with regard to ongoing P&I payments, may remain on accrual status if: (1) the Company expects to receive all P&I payments owed substantially in accordance with the terms of the loan agreement, past maturity status notwithstanding, and (2) the borrower is working actively and cooperatively with the Company to remedy the past maturity status through an expected refinance, payoff or modification of the loan agreement that is not expected to result in a troubled debt restructuring (“TDR”) classification. All TDRs are placed on nonaccrual status for a period of no less than six months after restructuring, irrespective of past due status. The sum of nonaccrual loans plus accruing loans that are 90 days or more past due are generally defined collectively as “nonperforming loans”.
Payments received in cash on nonaccrual loans, including both the principal and interest portions of those payments, are generally applied to reduce the carrying value of the loan. When a loan is returned to accrual status, any accumulated interest payments previously applied to the carrying value of the loan during its nonaccrual period are recognized as interest income as an adjustment to the loan’s yield over its remaining term.
Loans that are not considered to be TDRs are generally returned to accrual status when payments due are brought current and the Company expects to receive all remaining P&I payments owed substantially in accordance with the terms of the loan agreement. Non-TDR loans may also be returned to accrual status when a loan’s payment status falls below 90 days past due and the Company: (1) expects receipt of the remaining past due amounts within a reasonable timeframe, and (2) expects to receive all remaining P&I payments owed substantially in accordance with the terms of the loan agreement.
Acquired Loans
Loans that we acquire through acquisitions are recorded at fair value with no carryover of the related allowance for credit losses. Determining the fair value of the loans involves estimating the amount and timing of principal and interest cash flows expected to be collected on the loans and discounting those cash flows at a market rate of interest.
The excess of cash flows expected at acquisition over the estimated fair value is referred to as the accretable yield and is recognized into interest income over the remaining life of the loan. The difference between contractually required payments at acquisition and the cash flows expected to be collected at acquisition is referred to as the nonaccretable yield. The nonaccretable yield represents estimated future credit losses expected to be incurred over the life of the loan. Subsequent decreases to the expected cash flows require us to evaluate the need for an allowance for credit losses. Subsequent improvements in expected cash flows result in the reversal of a corresponding amount of the nonaccretable yield which we then reclassify as accretable yield that is recognized into interest income over the remaining life of the loan using the interest method. Our evaluation of the amount of future cash flows that we expect to collect is performed in a similar manner as that used to determine our allowance for credit losses. Charge-offs of the principal amount on acquired loans would be first applied to the nonaccretable yield portion of the fair value adjustment.
F-15
KEARNY FINANCIAL CORP. AND SUBSIDIARIES
Notes to Consolidated Financial Statements
Note 1 - Summary of Significant Accounting Policies (continued)
Classification of Assets
In compliance with the regulatory guidelines, the Company’s loan review system includes an evaluation process through which certain loans exhibiting adverse credit quality characteristics are classified “Special Mention”, “Substandard”, “Doubtful” or “Loss”.
An asset is classified as “Substandard” if it is inadequately protected by the paying capacity and net worth of the obligor or the collateral pledged, if any. Substandard assets include those characterized by the distinct possibility that the insured institution will sustain some loss if the deficiencies are not corrected. Assets classified as “Doubtful” have all of the weaknesses inherent in those classified as “Substandard”, with the added characteristic that the weaknesses present make collection or liquidation in full highly questionable and improbable, on the basis of currently existing facts, conditions and values. Assets, or portions thereof, classified as “Loss” are considered uncollectible or of so little value that their continuance as assets is not warranted.
Assets which do not currently expose the Company to a sufficient degree of risk to warrant an adverse classification but have some credit deficiencies or other potential weaknesses are designated as “Special Mention” by management. Adversely classified assets, together with those rated as “Special Mention”, are generally referred to as “Classified Assets”. Non-classified assets are internally rated within one of four “Pass” categories or as “Watch” with the latter denoting a potential deficiency or concern that warrants increased oversight or tracking by management until remediated.
Management performs a classification of assets review, including the regulatory classification of assets, generally on an ongoing basis. The results of the classification of assets review are validated by the Company’s third party loan review firm during their quarterly independent review. In the event of a difference in rating or classification between those assigned by the internal and external resources, the Company will generally utilize the more critical or conservative rating or classification. Final loan ratings and regulatory classifications are presented monthly to the Board of Directors and are reviewed by regulators during the examination process.
Management evaluates loans classified as substandard or doubtful for impairment in accordance with applicable accounting requirements. As discussed in greater detail below, a valuation allowance is established through the provision for loan losses for any impairment identified through such evaluations.
To the extent that impairment identified on a loan is classified as “Loss”, that portion of the loan is charged off against the allowance for loan losses. The classification of loan impairment as “Loss” is based upon a confirmed expectation for loss. For loans primarily secured by real estate, the expectation for loss is generally confirmed when: (a) impairment is identified on a loan individually evaluated in the manner described below, and (b) the loan is presumed to be collateral-dependent such that the source of loan repayment is expected to arise solely from sale of the collateral securing the applicable loan. Impairment identified on non-collateral-dependent loans may or may not be eligible for a “Loss” classification depending upon the other salient facts and circumstances that effect the manner and likelihood of loan repayment. However, loan impairment that is classified as “Loss” is charged off against the allowance for loan losses concurrent with that classification.
The timeframe between when loan impairment is first identified by the Company and when such impairment may ultimately be charged off varies by loan type. For example, unsecured consumer and commercial loans are generally classified as “Loss” at 120 days past due, resulting in their outstanding balances being charged off at that time. For the Company’s secured loans, the condition of collateral dependency generally serves as the basis upon which a “Loss” classification is ascribed to a loan’s impairment thereby confirming an expected loss and triggering charge off of that impairment. While the facts and circumstances that effect the manner and likelihood of repayment vary from loan to loan, the Company generally considers the referral of a loan to foreclosure, coupled with the absence of other viable sources of loan repayment, to be demonstrable evidence of collateral dependency. Depending upon the nature of the collections process applicable to a particular loan, an early determination of collateral dependency could result in a nearly concurrent charge off of a newly identified impairment. By contrast, a presumption of collateral dependency may only be determined after the completion of lengthy loan collection and/or workout efforts, including bankruptcy proceedings, which may extend several months or more after a loan’s impairment is first identified.
In a limited number of cases, the entire net carrying value of a loan may be determined to be impaired based upon a collateral-dependent impairment analysis. However, the borrower’s adherence to contractual repayment terms precludes the recognition of a “Loss” classification and charge off. In these limited cases, a valuation allowance equal to 100% of the impaired loan’s carrying value may be maintained against the net carrying value of the asset.
F-16
KEARNY FINANCIAL CORP. AND SUBSIDIARIES
Notes to Consolidated Financial Statements
Note 1 - Summary of Significant Accounting Policies (continued)
Allowance for Loan Losses
The allowance for loan losses is a valuation account that reflects the Company’s estimation of the losses in its loan portfolio to the extent they are both probable and reasonable to estimate. The balance of the allowance is generally maintained through provisions for loan losses that are charged to income in the period that estimated losses on loans are identified by the Company’s loan review system. The Company charges confirmed losses on loans against the allowance as such losses are identified. Recoveries on loans previously charged-off are added back to the allowance.
The Company’s allowance for loan loss calculation methodology utilizes a “two-tier” loss measurement process that is generally performed monthly. Based upon the results of the classification of assets and credit file review processes described earlier, the Company first identifies the loans that must be reviewed individually for impairment. Factors considered in identifying individual loans to be reviewed include, but may not be limited to, loan type, classification status, contractual payment status, performance/accrual status and impaired status.
The loans considered by the Company to be eligible for individual impairment review include its commercial mortgage loans, comprising multi-family and nonresidential real estate loans, construction loans, commercial business loans as well as its one- to four-family mortgage loans, home equity loans and home equity lines of credit.
A reviewed loan is deemed to be impaired when, based on current information and events, it is probable that we will be unable to collect all amounts due according to the contractual terms of the loan agreement. Once a loan is determined to be impaired, management performs an analysis to determine the amount of impairment associated with that loan.
In measuring the impairment associated with collateral-dependent loans, the fair value of the collateral securing the loan is generally used as a measurement proxy for that of the impaired loan itself as a practical expedient. In the case of real estate collateral, such values are generally determined based upon a discounted market value obtained through an automated valuation module or prepared by a qualified, independent real estate appraiser. The value of non-real estate collateral is similarly determined based upon an independent assessment of fair market value by a qualified resource.
The Company generally obtains independent appraisals on properties securing mortgage loans when such loans are initially placed on nonperforming or impaired status with such values updated approximately every six to 12 months thereafter throughout the collections, bankruptcy and/or foreclosure processes. Appraised values are typically updated at the point of foreclosure, where applicable, and approximately every six to 12 months thereafter while the repossessed property is held as real estate owned.
As supported by accounting and regulatory guidance, the Company reduces the fair value of the collateral by estimated selling costs, such as real estate brokerage commissions, to measure impairment when such costs are expected to reduce the cash flows available to repay the loan.
The Company establishes valuation allowances in the fiscal period during which the loan impairments are identified. The results of management’s individual loan impairment evaluations are validated by the Company’s third party loan review firm during their quarterly independent review. Such valuation allowances are adjusted in subsequent fiscal periods, where appropriate, to reflect any changes in carrying value or fair value identified during subsequent impairment evaluations which are generally updated monthly by management.
The second tier of the loss measurement process involves estimating the probable and estimable losses which addresses loans not otherwise reviewed individually for impairment as well as those individually reviewed loans that are determined to be non-impaired. Such loans include groups of smaller-balance homogeneous loans that may generally be excluded from individual impairment analysis, and therefore collectively evaluated for impairment, as well as the non-impaired loans within categories that are otherwise eligible for individual impairment review.
F-17
KEARNY FINANCIAL CORP. AND SUBSIDIARIES
Notes to Consolidated Financial Statements
Note 1 - Summary of Significant Accounting Policies (continued)
Valuation allowances established through the second tier of the loss measurement process utilize historical and environmental loss factors to collectively estimate the level of probable losses within defined segments of the Company’s loan portfolio. These segments aggregate homogeneous subsets of loans with similar risk characteristics based upon loan type. For allowance for loan loss calculation and reporting purposes, the Company currently stratifies its loan portfolio into seven primary categories: residential mortgage loans, multi-family mortgage loans, non-residential mortgage loans, construction loans, commercial business loans, home equity loans, and other consumer loans.
The risks presented by residential mortgage loans are primarily related to adverse changes in the borrower’s financial condition that threaten repayment of the loan in accordance with its contractual terms. Such risk to repayment can arise from job loss, divorce, illness and the personal bankruptcy of the borrower. For collateral dependent residential mortgage loans, additional risk of loss is presented by potential declines in the fair value of the collateral securing the loan.
Home equity loans generally share the same risks as those applicable to residential mortgage loans. However, to the extent that such loans represent junior liens, they are comparatively more susceptible to such risks given their subordinate position behind senior liens.
In addition to sharing similar risks as those presented by residential mortgage loans, risks relating to multi-family and non-residential mortgage loans also arise from comparatively larger loan balances to single borrowers or groups of related borrowers. Moreover, the repayment of such loans is typically dependent on the successful operation of an underlying real estate project and may be further threatened by adverse changes to demand and supply of commercial real estate as well as changes generally impacting overall business or economic conditions.
The risks presented by construction loans are generally considered to be greater than those attributable to residential and commercial mortgage loans. Risks from construction lending arise, in part, from the concentration of principal in a limited number of loans and borrowers and the effects of general economic conditions on developers and builders. Moreover, a construction loan can involve additional risks because of the inherent difficulty in estimating both a property's value at completion of the project and the estimated cost, including interest, of the project. The nature of these loans is such that they are comparatively more difficult to evaluate and monitor than permanent mortgage loans.
Commercial business loans are also considered to present a comparatively greater risk of loss due to the concentration of principal in a limited number of loans and/or borrowers and the effects of general economic conditions on the business. Commercial business loans may be secured by varying forms of collateral including, but not limited to, business equipment, receivables, inventory and other business assets which may not provide an adequate source of repayment of the outstanding loan balance in the event of borrower default. Moreover, the repayment of commercial business loans is primarily dependent on the successful operation of the underlying business which may be threatened by adverse changes to the demand for the business’ products and/or services as well as the overall efficiency and effectiveness of the business’ operations and infrastructure.
Finally, our unsecured consumer loans generally have shorter terms and higher interest rates than other forms of lending but generally involve more credit risk due to the lack of collateral to secure the loan in the event of borrower default. Consumer loan repayment is dependent on the borrower's continuing financial stability, and therefore is more likely to be adversely affected by job loss, divorce, illness and personal bankruptcy. By contrast, our consumer loans also include account loans that are fully secured by the borrower’s deposit accounts and generally present nominal risk to the Company.
Each primary category is further stratified to distinguish between loans originated and purchased directly from third party lenders, from loans acquired through wholesale channels or through business combinations. Where applicable, such primary categories separately identify loans that are supported by government guarantees, such as those issued by the SBA. Within these primary categories, loans are grouped into more granular segments based on common risk characteristics. For example, loans secured by real estate, such as residential and commercial mortgage loans, are generally grouped into segments by underlying property type while commercial business loans are grouped into segments based on business or industry type.
F-18
KEARNY FINANCIAL CORP. AND SUBSIDIARIES
Notes to Consolidated Financial Statements
Note 1 - Summary of Significant Accounting Policies (continued)
In regard to historical loss factors, the Company’s allowance for loan loss calculation calls for an analysis of historical charge-offs and recoveries for each of the defined segments within the loan portfolio. The Company generally utilizes a two-year moving average of annualized net charge-off rates (charge-offs net of recoveries) by loan segment, where available, to calculate its actual, historical loss experience. The outstanding principal balance of the non-impaired portion of each loan segment is multiplied by the applicable historical loss factor, which is updated quarterly, to estimate the level of probable losses based upon the Company’s historical loss experience.
As noted, the second tier of the Company’s allowance for loan loss calculation also utilizes environmental loss factors to estimate the probable losses within the loan portfolio. Environmental loss factors are based on specific quantitative and qualitative criteria that are used to assess the level of loss exposure arising from key sources of risk within the loan portfolio. Such sources of risk include those relating to the level of and trends in nonperforming loans; the level of and trends in credit risk management effectiveness, the levels and trends in lending resource capability; levels and trends in economic and market conditions; levels and trends in loan concentrations; levels and trends in loan composition and terms, levels and trends in independent loan review effectiveness, levels and trends in collateral values and the effects of other external factors.
The Company utilizes a set of seven risk tranches, ranging from “negligible risk” to “severe risk”, that establishes a pre-defined range of potential risk ratings to be ascribed each criteria component supporting an environmental loss factor. Risk ratings of zero and 30 are ascribed to the “negligible risk” and “severe risk” tranches, respectively, which generally serve as the upper and lower thresholds for the potential range of risk rating values across all risk tranches. The remaining five risk tranches, ranging from “low risk” to “high risk”, utilize progressively higher ranges of potential risk ratings reflecting the increased level of risk associated with each tranche.
As noted earlier, the Company utilizes both quantitative and qualitative criteria to support its assessment of risk and associated credit loss estimates using environmental loss factors. In the case of quantitative criteria, the Company associates pre-defined ranges of potential criteria values with each of the risk tranches noted above. Through this mechanism, quantitative criteria values are correlated to specific risk tranches. For loss factor criteria that are based on wholly qualitative metrics, the Company simply ascribes a risk tranche directly to that criteria based on management judgement. In both cases, the actual risk ratings ascribed by management to criteria components are generally expected to fall within the pre-defined range of risk ratings assigned to the applicable risk tranche.
Risk ratings are multiplied by .01% to calculate a loss factor value attributable to each of the criteria components supporting an environmental loss factor. The average of the loss factor values ascribed to the criteria components generally serves as the aggregate value for that loss factor. Where appropriate, the criteria components supporting a loss factor may be “weighted” in relation to one another to allow for greater emphasis on certain criteria in the calculation of an environmental loss factor.
Like the historical loss factors discussed above, the Company generally utilizes a two-year moving average of criteria values, where available, to determine the risk tranche and associated set of potential risk ratings to be ascribed to the criteria components supporting an environmental loss factor. By doing so, estimated losses should be directionally consistent with the overall credit risk characteristics and performance of the loan portfolio over time while avoiding significant short-term volatility arising from incremental changes to criteria values. Where appropriate, the Company may extend or compress criteria look-back periods to properly reflect the level of credit risk and estimated losses within a specified subset of loans. The outstanding principal balance of the non-impaired portion of each loan segment is multiplied by the aggregate value of each environmental loss factor, which is updated quarterly, to estimate the level of probable losses attributable to that factor.
The sum of the probable and estimable loan losses calculated through the first and second tiers of the loss measurement processes as described above, represents the total targeted balance for the Company’s allowance for loan losses at the end of a fiscal period. As noted earlier, the Company establishes all additional valuation allowances in the fiscal period during which additional individually identified loan impairments and additional estimated losses on loans collectively evaluated for impairment are identified. The Company adjusts its balance of valuation allowances through the provision for loan losses as required to ensure that the balance of the allowance for loan losses reflects all probable and estimable loans losses at the close of the fiscal period. Notwithstanding calculation methodology and the noted distinction between valuation allowances established on loans collectively versus individually evaluated for impairment, the Company’s entire allowance for loan losses is available to cover all charge-offs that arise from the loan portfolio.
F-19
KEARNY FINANCIAL CORP. AND SUBSIDIARIES
Notes to Consolidated Financial Statements
Note 1 - Summary of Significant Accounting Policies (continued)
Although the Company’s allowance for loans losses is established in accordance with management’s best estimate, actual losses are dependent upon future events and, as such, further additions to the level of loan loss allowances may be necessary.
Troubled Debt Restructurings
A modification to the terms of a loan is generally considered a TDR if the Company grants a concession to the borrower, that it would not otherwise consider for economic or legal reasons, related to the debtor’s financial difficulties. In granting the concession, the Company’s general objective is to make the best of a difficult situation by obtaining more cash or other value from the borrower or otherwise increase the probability of repayment.
A TDR may include, but is not necessarily limited to, the modification of loan terms such as a temporary or permanent reduction of the loan’s stated interest rate, extension of the maturity date and/or reduction or deferral of amounts owed under the terms of the loan agreement. In measuring the impairment associated with restructured loans that qualify as TDRs, the Company compares the present value of the cash flows that are expected to be received in accordance with the loan’s modified terms, discounted at the loan’s original contractual interest rate, with the pre-modification carrying value to measure impairment. The impairment is charged off directly against the allowance for loan loss at the time of restructuring resulting in a reduction in carrying value of the modified loan that is accreted into interest income as a yield adjustment over the remaining term of the modified cash flows.
All restructured loans that qualify as TDRs are placed on nonaccrual status for a period of no less than six months after restructuring, irrespective of the borrower’s adherence to a TDR’s modified repayment terms during which time TDRs continue to be adversely classified and reported as impaired. TDRs may be returned to accrual status if (1) the borrower has paid timely P&I payments in accordance with the terms of the restructured loan agreement for no less than six consecutive months after restructuring, and (2) the Company expects to receive all P&I payments owed substantially in accordance with the terms of the restructured loan agreement at which time the loan may also be returned to a non-adverse classification while retaining its impaired status.
Premises and Equipment
Land is carried at cost. Buildings and improvements, furnishings and equipment and leasehold improvements are carried at cost, less accumulated depreciation and amortization computed on the straight-line method over the following estimated useful lives:
| | |
| | Years |
Building and improvements | | 10 - 50 |
Furnishings and equipment | | 3 - 20 |
Leasehold improvements | | Shorter of useful lives or lease term |
Construction in progress primarily represents facilities under construction for future use in our business and includes all costs to acquire land and construct buildings, as well as capitalized interest during the construction period. Interest is capitalized at the Company’s average cost of interest-bearing liabilities.
Significant renewals and betterments are charged to the premises and equipment account. Maintenance and repairs are charged to operations in the year incurred. Rental income is netted against occupancy costs in the consolidated statements of income.
Federal Home Loan Bank Stock
Federal law requires a member institution of the FHLB system to hold restricted stock of its district FHLB according to a predetermined formula. The restricted stock is carried at cost, less any applicable impairment. Both cash and stock dividends are reported as income.
F-20
KEARNY FINANCIAL CORP. AND SUBSIDIARIES
Notes to Consolidated Financial Statements
Note 1 - Summary of Significant Accounting Policies (continued)
Goodwill and Other Intangible Assets
Goodwill and other intangible assets principally represent the excess cost over the fair value of the net assets of the institutions acquired in purchase transactions. Goodwill is evaluated annually by reporting unit and an impairment loss recorded if indicated. The impairment test is performed in two phases. The first step of the goodwill impairment test compares the fair value of the reporting unit with its carrying amount, including goodwill. If the fair value of the reporting unit exceeds its carrying amount, goodwill of the reporting unit is considered not impaired; however, if the carrying amount of the reporting unit exceeds its fair value, an additional impairment evaluation must be performed. That additional evaluation compares the implied fair value of the reporting unit’s goodwill with the carrying amount of that goodwill. An impairment loss is recorded to the extent that the carrying amount of goodwill exceeds its implied fair value. No impairment charges were required to be recorded in the years ended June 30, 2018, 2017 or 2016. If an impairment loss is determined to exist in the future, such loss will be reflected as an expense in the consolidated statements of income in the period in which the impairment loss is determined. The balance of other intangible assets at June 30, 2018 and 2017 totaled $6.3 million and $292,000, respectively, representing the remaining unamortized balance of the core deposit intangibles ascribed to the value of deposits acquired by the Bank through the acquisition of Central Jersey Bancorp in November 2010, Atlas Bank in June 2014 and Clifton Bancorp Inc. in 2018.
Bank Owned Life Insurance
Bank owned life insurance is accounted for using the cash surrender value method and is recorded at its net realizable value. The change in the net asset value is recorded as a component of non-interest income. A deferred liability has been recorded for the estimated cost of postretirement life insurance benefits accruing to applicable employees and directors covered by an endorsement split-dollar life insurance arrangement. The Company recorded expenses (benefits) of approximately $7,000, $69,000 and $(25,000) for the years ended June 30, 2018, 2017 and 2016, respectively, attributable to this deferred liability.
Transfers of Financial Assets
Transfers of financial assets are accounted for as sales, when control over the assets has been surrendered. Control over transferred assets is deemed to be surrendered when (1) the assets have been isolated from the Company - put presumptively beyond the reach of the transferor and its creditors, even in bankruptcy or other receivership, (2) the transferee obtains the right (free of conditions that constrain it from taking advantage of that right) to pledge or exchange the transferred assets, and (3) the Company does not maintain effective control over the transferred assets through an agreement to repurchase them before their maturity or the ability to unilaterally cause the holder to return specific assets.
Income Taxes
The Company and its subsidiaries file consolidated federal income tax returns. Federal income taxes are allocated to each entity based on their respective contributions to the taxable income of the consolidated income tax returns. Separate state income tax returns are filed for the Company and its subsidiaries on either a consolidated or unconsolidated basis as required by the jurisdiction. For the year ended June 30, 2018, income tax expense included the impact of the enactment of the Tax Act which reduced the maximum statutory federal income tax rate from 35% to 21%, that resulted in a charge to reduce the carrying value of the Company’s net deferred income tax assets, which are included in the consolidated statements of financial condition. For the year ended June 30, 2018, the federal income tax rate applicable to the company was 28% which reflects the transitional effect of a reduction in the Company’s federal income tax rate from 35%, applicable to the prior year ended June 30, 2017, to 21%, applicable to the forthcoming year ending June 30, 2019.
Federal and state income taxes have been provided on the basis of the Company’s income or loss as reported in accordance with GAAP. The amounts reflected on the Company’s state and federal income tax returns differ from these provisions due principally to temporary differences in the reporting of certain items for financial statement reporting and income tax reporting purposes. The tax effect of these temporary differences is accounted for as deferred taxes applicable to future periods. Deferred income tax expense or benefit is determined by recognizing deferred tax assets and liabilities for the estimated future tax consequences attributable to differences between the financial statement carrying amounts of existing assets and liabilities and their respective tax basis. Deferred tax assets and liabilities are measured using enacted tax rates expected to apply to taxable income in the years in which those temporary differences are expected to be recovered or settled. The effect on deferred tax assets and liabilities of a change in tax rates is recognized in earnings in the period that includes the enactment date. The realization of deferred tax assets is assessed and a valuation allowance provided for the full amount which is not more likely than not to be realized.
F-21
KEARNY FINANCIAL CORP. AND SUBSIDIARIES
Notes to Consolidated Financial Statements
Note 1 - Summary of Significant Accounting Policies (continued)
The Company identified no significant income tax uncertainties through the evaluation of its income tax positions as of June 30, 2018 and 2017. Therefore, the Company has no unrecognized income tax benefits as of those dates. Our policy is to recognize interest and penalties on unrecognized tax benefits in income tax expense in the consolidated statements of income. The Company recognized no interest and penalties during the years ended June 30, 2018, 2017 and 2016. The tax years subject to examination by the taxing authorities are the years ended June 30, 2017, 2016 and 2015.
Retirement Plans
Pension expense is the net of service and interest cost, return on plan assets and amortization of gains and losses not immediately recognized. Employee 401(k) and profit sharing plan expense is the amount of matching contributions. Deferred compensation plan expense allocates the benefits over years of service.
Employee Stock Ownership Plan
The cost of shares issued to the ESOP, but not yet allocated to participants, is shown as a reduction of shareholders’ equity. Compensation expense is based on the market price of shares as they are committed to be released to participant accounts. Dividends on allocated and unallocated ESOP shares either reduce retained earnings or reduce debt and accrued interest as determined by the ESOP Plan Administrator.
Other Comprehensive Income
Comprehensive income is divided into net income and other comprehensive income (loss). Other comprehensive income (loss) includes items recorded in equity, such as unrealized gains and losses on securities available for sale, unrealized gains and losses on derivatives, unrealized gains and losses on securities transferred from available for sale to held to maturity and amortization related to post-retirement obligations. Comprehensive income is presented in a separate Consolidated Statement of Comprehensive Income.
Loss Contingencies
Loss contingencies, including claims and legal actions arising in the ordinary course of business, are recorded as liabilities when the likelihood of loss is probable and an amount or range of loss can be reasonably estimated. Management does not believe there now are such matters that will have a material effect on the financial statements.
Derivatives and Hedging
The Company utilizes derivative instruments in the form of interest rate swaps and caps to hedge its exposure to interest rate risk in conjunction with its overall asset/liability management process. In accordance with accounting requirements, the Company formally designates all of its hedging relationships as either fair value hedges, intended to offset the changes in the value of certain financial instruments due to movements in interest rates, or cash flow hedges, intended to offset changes in the cash flows of certain financial instruments due to movement in interest rates, and documents the strategy for undertaking the hedge transactions and its method of assessing ongoing effectiveness. The Company does not use derivative instruments for speculative purposes.
All derivatives are recognized as either assets or liabilities in the Consolidated Financial Statements at their fair values. For derivatives designated cash flow hedges, the gain or loss on the derivative is recorded in other comprehensive income and subsequently reclassified into interest expense in the same period during which the hedged transaction affects earnings. For a derivative designated as a fair value hedge, the gain or loss on the derivative as well as the offsetting loss or gain on the hedged item attributable to the hedged risk are recognized in current earnings.
Derivative instruments qualify for hedge accounting treatment only if they are designated as such on the date on which the derivative contract is entered and are expected to be, and are, effective in substantially reducing interest rate risk arising from the assets and liabilities identified as exposing the Company to risk. Those derivative financial instruments that do not meet the hedging criteria discussed below would be classified as undesignated derivatives and would be recorded at fair value with changes in fair value recorded in income.
F-22
KEARNY FINANCIAL CORP. AND SUBSIDIARIES
Notes to Consolidated Financial Statements
Note 1 - Summary of Significant Accounting Policies (continued)
The Company discontinues hedge accounting when (a) it determines that a derivative is no longer effective in offsetting changes in cash flows of a hedged item; (b) the derivative expires or is sold, terminated or exercised; (c) probability exists that the forecasted transaction will no longer occur; or (d) management determines that designating the derivative as a hedging instrument is no longer appropriate. In all cases in which hedge accounting is discontinued and a derivative remains outstanding, the Company will carry the derivative at fair value in the Consolidated Financial Statements, recognizing changes in fair value in current period income in the consolidated statement of income.
In accordance with the applicable accounting guidance, the Company takes into account the impact of collateral and master netting agreements that allow it to settle all derivative contracts held with a single counterparty on a net basis, and to offset the net derivative position with the related collateral when recognizing derivative assets and liabilities. As a result, the Company’s Statements of Financial Condition could reflect derivative contracts with negative fair values included in derivative assets, and contracts with positive fair values included in derivative liabilities.
The Company’s interest rate derivatives are comprised entirely of interest rate swaps and caps hedging floating-rate and forecasted issuances of fixed-rate liabilities and accounted for as cash flow hedges. The carrying value of interest rate derivatives is included in the balance of other assets or other liabilities and comprises the remaining unamortized cost of interest rate caps and the cumulative changes in the fair value of interest rate derivatives. Such changes in fair value are offset against accumulated other comprehensive income, net of deferred income tax.
In general, the cash flows received and/or exchanged with counterparties for those derivatives qualifying as interest rate hedges, and the amortization of the original cost of qualifying caps, are generally classified in the financial statements in the same category as the cash flows of the items being hedged.
Interest differentials paid or received under the swap and cap agreements are reflected as adjustments to interest expense. The notional amounts of the interest rate swaps are not exchanged and do not represent exposure to credit loss. In the event of default by a counter party, the risk in these transactions is the cost of replacing the agreements at current market rates.
Net Income per Common Share (“EPS”)
Basic EPS is based on the weighted average number of common shares actually outstanding adjusted for the Employee Stock Ownership Plan (“the ESOP”) shares not yet committed to be released. Diluted EPS reflects the potential dilution that could occur if securities or other contracts to issue common stock, such as outstanding stock options, were exercised or converted into common stock or resulted in the issuance of common stock that then shared in the earnings of the Company. Diluted EPS is calculated by adjusting the weighted average number of shares of common stock outstanding to include the effect of contracts or securities exercisable or which could be converted into common stock, if dilutive, using the treasury stock method. Shares issued and reacquired during any period are weighted for the portion of the period they were outstanding.
Fair Value of Financial Instruments
Fair values of financial instruments are estimated using relevant market information and other assumptions, as more fully disclosed in Note 18. Fair value estimates involve uncertainties and matters of significant judgment regarding interest rates, credit risk, prepayments, and other factors, especially in the absence of broad markets for particular items. Changes in assumptions or in market conditions could significantly affect these estimates.
Operating Segments
Public companies are required to report certain financial information about significant revenue-producing segments of the business for which such information is available and utilized by the chief operating decision makers. Substantially all of the Company’s operations occur through the Bank and involve the delivery of loan and deposit products to customers. Management makes operating decisions and assesses performance based on an ongoing review of its banking operation, which constitutes the Company’s only operating segment for financial reporting purposes.
F-23
KEARNY FINANCIAL CORP. AND SUBSIDIARIES
Notes to Consolidated Financial Statements
Note 1 - Summary of Significant Accounting Policies (continued)
Stock Compensation Plans
Compensation expense related to stock options and non-vested stock awards is based on the fair value of the award on the measurement date with expense recognized on a straight-line basis over the service period of the award. The fair value of stock options is estimated using the Black-Scholes valuation model. The fair value of non-vested stock awards is generally the closing market price of the Company’s common stock on the date of grant. The Company accounts for forfeitures as they occur.
Advertising and Marketing Expenses
The Company expenses advertising and marketing costs as incurred.
Reclassification
Certain reclassifications have been made in the consolidated financial statements to conform with the current year presentation. Such reclassifications had no impact on net income or stockholders’ equity as previously reported.
Note 2 – Recent Accounting Pronouncements
In May 2014, the Financial Accounting Standards Board (“FASB”) issued Accounting Standards Update (“ASU”) ASU 2014-09, Revenue from Contracts with Customers (Topic 606). The objective of this amendment is to clarify the principles for recognizing revenue and to develop a common revenue standard for U.S. GAAP and international financial reporting standards (“IFRS”). This update affects any entity that either enters into contracts with customers to transfer goods or services or enters into contracts for the transfer of nonfinancial assets unless those contracts are in the scope of other standards. For public entities, the guidance is effective for annual periods, and interim periods within those annual periods, beginning after December 15, 2017.
Subsequently, the FASB issued the following standards related to ASU 2014-09: ASU 2016-08, “Revenue from Contracts with Customers (Topic 606): Principal versus Agent Considerations”; ASU 2016-10, “Revenue from Contracts with Customers (Topic 606): Identifying Performance Obligations and Licensing”; ASU 2016-11, “Revenue Recognition (Topic 605) and Derivatives and Hedging (Topic 815): Rescission of SEC Guidance Because of Accounting Standards Updates 2014-09 and 2014-16 Pursuant to Staff Announcements at the March 3, 2016 EITF Meeting”; ASU 2016-12, “Revenue from Contracts with Customers (Topic 606): Narrow-Scope Improvements and Practical Expedients”; and ASU 2017-05, “Other Income-Gains and Losses from the Derecognition of Nonfinancial Assets (Subtopic 610-20): Clarifying the Scope of Asset Derecognition Guidance and Accounting for Partial Sales of Nonfinancial Assets.” These amendments are intended to improve and clarify the implementation guidance of ASU 2014-09 and have the same effective date as the original standard. The Company’s main source of revenue is comprised of net interest income on interest earning assets and liabilities and non-interest income. The scope of this ASU explicitly excludes net interest income as well as other revenues associated with financial assets and liabilities, including loans, leases, securities, certain insurance revenues and derivatives. Upon adoption on July 1, 2018, there were no material changes related to the timing or amount of revenue recognition and therefore, the Company did not record a cumulative effective adjustment for the adoption. The Company will continue to evaluate the need for additional disclosures.
In January 2016, the FASB issued ASU 2016-01, Financial Instruments – Overall (Subtopic 825-10): Recognition and Measurement of Financial Assets and Financial Liabilities. The ASU requires an entity to: (i) measure equity investments at fair value through net income, with certain exceptions; (ii) present in OCI the changes in instrument-specific credit risk for financial liabilities measured using the fair value option; (iii) present financial assets and financial liabilities by measurement category and form of financial asset; (iv) calculate the fair value of financial instruments for disclosure purposes based on an exit price and; (v) assess a valuation allowance on deferred tax assets related to unrealized losses of AFS debt securities in combination with other deferred tax assets. The Update provides an election to subsequently measure certain nonmarketable equity investments at cost less any impairment and adjusted for certain observable price changes. The Update also requires a qualitative impairment assessment of such equity investments and amends certain fair value disclosure requirements. For public business entities, the amendments in this Update are effective for fiscal years beginning after December 15, 2017, including interim periods within those fiscal years. The Company adopted this ASU on July 1, 2018 and there was no material impact upon adoption. The adoption of this standard will impact disclosures of fair value (Note 18) in future periods.
F-24
KEARNY FINANCIAL CORP. AND SUBSIDIARIES
Notes to Consolidated Financial Statements
Note 2 – Recent Accounting Pronouncements (continued)
In February 2016, the FASB issued ASU 2016-02, Leases (Topic 842). The ASU requires all lessees to recognize a lease liability and right-of-use asset, measured at the present value of the future minimum lease payments, at the lease commencement date for leases classified as operating leases or finance leases. This update also requires new quantitative disclosures related to leases in the Company’s consolidated financial statements. There are practical expedients in this update that relate to leases that commenced before the effective date, initial direct costs and the use of hindsight to extend or terminate a lease or purchase the lease asset. Lessor accounting remains largely unchanged under the new guidance. For public business entities, the amendments in this Update are effective for fiscal years beginning after December 15, 2018, including interim reporting periods within that reporting period, with early adoption permitted. A modified retrospective approach must be applied for leases existing at, or entered into after, the beginning of the earliest comparative period presented in the financial statements. The Company continues to evaluate the impact of the guidance, including determining whether other contracts exist that are deemed to be in scope. As such, no final conclusions have been reached regarding the potential impact of adoption on the Company’s consolidated financial statements and regulatory capital and risk-weighted assets; however, at this time the Company does not expect the amendment to have a material impact on its results of operations.
In June 2016, the FASB issued ASU 2016-13, Financial Instruments—Credit Losses (Topic 326): Measurement of Credit Losses on Financial Instruments. The ASU requires credit losses on most financial assets measured at amortized cost and certain other instruments to be measured using an expected credit loss model (referred to as the current expected credit loss (“CECL”) model). Under this model, entities will estimate credit losses over the entire contractual term of the instrument (considering estimated prepayments, but not expected extensions or modifications unless reasonable expectation of a troubled debt restructuring exists) from the date of initial recognition of that instrument.
The ASU also replaces the current accounting model for purchased credit impaired loans and debt securities. The allowance for credit losses for purchased financial assets with a more-than insignificant amount of credit deterioration since origination (“PCD assets”), should be determined in a similar manner to other financial assets measured on an amortized cost basis. However, upon initial recognition, the allowance for credit losses is added to the purchase price (“gross up approach”) to determine the initial amortized cost basis. The subsequent accounting for PCD financial assets is the same expected loss model described above.
Further, the ASU made certain targeted amendments to the existing impairment model for available-for-sale (“AFS”) debt securities. For an AFS debt security for which there is neither the intent nor a more-likely-than-not requirement to sell, an entity will record credit losses as an allowance rather than a write-down of the amortized cost basis.
For public business entities that are SEC filers, the amendments are effective for fiscal years beginning after December 15, 2019, including interim periods within those fiscal years. The Company will apply the standard’s provisions as a cumulative-effect adjustment to retained earnings as of the beginning of the first reporting period in which the guidance is effective (i.e. modified retrospective approach). The Company has begun its evaluation of this ASU including the potential impact on its consolidated financial statements. The extent of change is indeterminable at this time as it will be dependent upon portfolio composition and credit quality at the adoption date, as well as economic conditions and forecasts at that time. Upon adoption, any impact to the allowance for credit losses, currently allowance for loan and lease losses, will have an offsetting impact on retained earnings.
In August 2016, the FASB issued ASU 2016-15, Statement of Cash Flows (Topic 230), a consensus of the FASB’s Emerging Issues Task Force. The new guidance is intended to reduce diversity in practice in how certain transactions are classified in the statement of cash flows. The new guidance addresses eight classification issues related to the statement of cash flows, which include proceeds from settlement of corporate-owned and bank-owned life insurance policies. For a public entity, ASU 2016-15 is effective for fiscal years beginning after December 15, 2017, including interim periods within those fiscal years. The Company is currently evaluating the impact of adopting this ASU on its consolidated financial statements.
In January 2017, the FASB issued ASU 2017-04, Intangibles - Goodwill and Other (Topic 350): Simplifying the Test for Goodwill Impairment. This ASU simplifies subsequent measurement of goodwill by eliminating Step 2 of the impairment test while retaining the option to perform the qualitative assessment for a reporting unit to determine whether the quantitative impairment test is necessary. The ASU also eliminates the requirements for any reporting unit with a zero or negative carrying amount to perform a qualitative assessment and, if it fails that qualitative test, to perform Step 2 of the goodwill impairment test. Therefore, the same impairment assessment applies to all reporting units. For public entities, ASU 2017-04 is effective for fiscal years beginning after December 15, 2019 with early adoption permitted for interim or annual goodwill impairment testing dates beginning after January 1, 2017. The Company is currently evaluating the impact of adopting this ASU on its consolidated financial statements.
F-25
KEARNY FINANCIAL CORP. AND SUBSIDIARIES
Notes to Consolidated Financial Statements
Note 2 – Recent Accounting Pronouncements (continued)
In March 2017, the FASB issued ASU 2017-07, Compensation-Retirement Benefits (Topic715), to improve the presentation of net periodic pension cost and net periodic postretirement benefit cost in the income statement, and to narrow the amounts eligible for capitalization in assets. Topic 715 does not currently prescribe where the amount of net benefit cost should be presented in an employer’s income statement, nor does it require entities to disclose by line item the amount of net benefit cost that is included in the income statement or capitalized in assets. This lack of guidance has resulted in diversity in practice in the presentation of such costs. For public entities, ASU 2017-07 becomes effective for fiscal years beginning after December 15, 2017, including interim periods within those years. The Company is currently evaluating the impact of adopting this ASU on its consolidated financial statements.
In March 2017, the FASB issued ASU 2017-08, Receivables-Nonrefundable Fees and Other Costs (Subtopic 310-20), to amend the amortization period to the earliest call date for purchased callable debt securities held at a premium. Previously, GAAP generally required an investor to amortize the premium on a callable debt security as a component of interest income over the contractual life of the instrument (i.e., yield-to-maturity amortization) even when the issuer was certain to exercise the call option at an earlier date. This resulted in the investor recording a loss equal to the unamortized premium when the call option was exercised by the issuer. For public entities, ASU 2017-08 becomes effective for fiscal years beginning after December 15, 2018 including interim periods within those years. The Company is currently evaluating the impact of adopting this ASU on its consolidated financial statements.
In May 2017, the FASB issued ASU 2017-09, Compensation—Stock Compensation (Topic 718): Scope of Modification Accounting, to clarify which changes to the terms or conditions of a share-based payment award require an entity to apply modification accounting in Topic 718. Topic 718 provides an accounting framework applicable to modifications of share-based payments, and currently defines a modification as “a change in any of the terms or conditions of a share-based payment award.” This definition is open to a broad range of interpretation and has resulted in diversity in practice as to whether certain changes in terms or conditions are treated as modifications. ASU 2017-09 further clarifies that an entity must apply modification accounting to changes in the terms or conditions of a share-based payment award unless certain criteria are met. For public entities, ASU 2017-09 becomes effective for fiscal years beginning after December 15, 2017. The Company is currently evaluating the impact of adopting this ASU on its consolidated financial statements.
Adoption of New Accounting Standards
In August 2017, the FASB issued ASU 2017-12, Derivatives and Hedging: Targeted Improvements to Accounting for Hedging Activities, to improve its hedge accounting guidance and simplify and expand eligible hedging strategies for financial and nonfinancial risks. ASU 2017-12 also enhances the transparency of how hedging results are presented and disclosed and provides partial relief on the timing of certain aspects of hedge documentation and eliminates the requirement to recognize hedge ineffectiveness separately in earnings. This ASU more closely aligns hedge accounting with a company’s risk management activities and simplifies its application through targeted improvements in key practice areas. This includes expanding the list if items eligible to be hedged and amending the methods used to measure the effectiveness of hedging relationships. ASU 2017-12 eliminates the concept of benchmark interest rates, instead an entity can hedge any contractually specified interest rate, however for fair value hedges; the concept of benchmark interest rates was retained. Similar to the amendments for cash flow hedges of interest-rate risk, this ASU permits an entity to hedge the variability in cash flows attributable to changes in any contractually specified component of a nonfinancial asset. ASU 2017-12 eliminates the concept of hedge ineffectiveness for financial statement recognition purposes. While the hedging relationship is still required to be highly effective in order to apply hedge accounting, the ineffective portion of the hedging instrument is no longer required to be recognized currently in earnings or disclosed. Further, for cash flow and net investment hedges, all changes in the fair value of the hedging instrument, both the effective and ineffective portions, will be deferred to other comprehensive income and recognized in earnings at the same time that the hedged item affects earnings. For fair value hedges, the entire fair value change of the hedging instruments is presented in the same income statement line item that included the hedged item’s impact on earnings. For public entities, the amendments in this Update are effective for fiscal years beginning after December 15, 2018, and interim periods within those fiscal years. Early adoption is permitted in any interim period or annual period for existing hedging relationships on the date of adoption. The effect of adoption should be reflected as of the beginning of the fiscal year of adoption. The Company early adopted ASU 2017-12 on July 1, 2017, and its adoption did not have a significant impact on the Company’s consolidated financial statements.
F-26
KEARNY FINANCIAL CORP. AND SUBSIDIARIES
Notes to Consolidated Financial Statements
Note 2 – Recent Accounting Pronouncements (continued)
In February 2018, the FASB issued ASU 2018-02, Income Statement-Reporting Comprehensive income (Topic 220), Reclassification of Certain Tax Effects from Accumulated Other Comprehensive Income. This update was issued to address a narrow-scope financial reporting issue that arose as a consequence of the change in the tax law. On December 22, 2017, the U.S. government enacted the Tax Act, ASU 2018-02 permits a reclassification from accumulated other comprehensive income to retained earnings for stranded tax effects resulting from the newly enacted federal corporate income tax rate. The amount of the reclassification would be the difference between the historical corporate income tax rate of 35% and the newly enacted 21% corporate income tax rate.
ASU 2018-02 is effective for all entities for fiscal years beginning after December 15, 2018, and interim periods within those fiscal years with early adoption permitted, including adoption in any interim period, for (i) public business entities for reporting periods for which financial statements have not yet been issued and (ii) all other entities for reporting periods for which financial statements have not yet been made available for issuance. The changes are required to be applied retrospectively to each period (or periods) in which the effect of the change in the U.S. federal corporate income tax rate in the Tax Act is recognized. The Company early adopted ASU 2018-02, which resulted in the reclassification from accumulated other comprehensive income to retained earnings totaling $1.4 million, which is reflected in the Consolidated Statements of Changes in Stockholders’ Equity.
Note 3 – Acquisition of Clifton Bancorp Inc.
On April 2, 2018, the Company completed its acquisition of Clifton Bancorp Inc. (“Clifton”), the parent company of Clifton Savings Bank, a federally chartered stock savings bank. At the time of closing, Clifton had $1.7 billion in total assets, including $1.2 billion in net loans receivable and $332.2 million in securities, and $1.4 billion in total liabilities, including $945.0 million in deposits and $421.4 million in borrowings. The deposits acquired from Clifton were held across a network of 12 branches located in New Jersey throughout Bergen, Passaic, Hudson, and Essex counties.
Clifton’s stockholders’ equity totaled approximately $272.0 million at the time of closing. Under the terms of the merger agreement, each outstanding share of Clifton common stock was exchanged for 1.191 shares of the Company’s common stock, resulting in the Company issuing 25.4 million shares of common stock to Clifton stockholders in conjunction with the merger’s closing.
The assets acquired and liabilities assumed have been accounted for under the acquisition method of accounting. The assets and liabilities, both tangible and intangible were recorded at their fair values as of April 2, 2018 based on management’s best estimate using the information available as of the merger date. The application of the acquisition method of accounting resulted in the recognition of goodwill of $102.3 million and a core deposit intangible of $6.4 million. Accounting guidance provides that an acquirer must recognize adjustments to provisional amounts that are identified during the measurement period, which runs through April 2, 2019, in the measurement period in which the adjustment amounts are determined. The acquirer must record in the financial statements, the effect on earnings of changes in depreciation, amortization or other income effects, if any, as a result of the changes to the provisional amounts, calculated as if the accounting had been completed at the acquisition date. The Company is preparing tax returns related to the operation of the combined entities through June 30, 2018 and, due to state apportionment factors, believes certain adjustments to income tax balances and goodwill may result upon completion of these returns.
F-27
KEARNY FINANCIAL CORP. AND SUBSIDIARIES
Notes to Consolidated Financial Statements
Note 3 – Acquisition of Clifton Bancorp Inc. (continued)
The Company recorded the assets acquired and liabilities assumed through the merger at fair value as summarized in the following table:
| As Recorded by Clifton | | | Fair Value Adjustments | | | As Recorded at Acquisition | |
| (In Thousands) | |
Cash and cash equivalents | $ | 36,585 | | | $ | - | | | $ | 36,585 | |
Investment securities | | 332,183 | | | | (5,270 | ) | (a) | | 326,913 | |
Loans receivable | | 1,191,748 | | | | (74,927 | ) | (b) | | 1,116,821 | |
Allowance for loan losses | | (8,025 | ) | | | 8,025 | | (c) | | - | |
Premises and equipment | | 8,066 | | | | 3,556 | | (d) | | 11,622 | |
FHLB stock | | 20,357 | | | | - | | | | 20,357 | |
Accrued interest receivable | | 4,142 | | | | - | | | | 4,142 | |
Bank owned life insurance | | 63,231 | | | | - | | | | 63,231 | |
Deferred income taxes, net | | 6,837 | | | | 16,149 | | (e) | | 22,986 | |
Core deposit and other intangibles | | - | | | | 6,367 | | (f) | | 6,367 | |
Other real estate owned | | 163 | | | | (23 | ) | (g) | | 140 | |
Other assets | | 1,438 | | | | 133 | | (h) | | 1,571 | |
Total assets acquired | $ | 1,656,725 | | | $ | (45,990 | ) | | $ | 1,610,735 | |
| | | | | | | | | | | |
Deposits | $ | 944,988 | | | $ | 4,801 | | (i) | $ | 949,789 | |
FHLB borrowings | | 421,400 | | | | (7,268 | ) | (j) | | 414,132 | |
Advance payments by borrowers for taxes | | 9,777 | | | | - | | | | 9,777 | |
Other liabilities | | 5,288 | | | | 112 | | (k) | | 5,400 | |
Total liabilities assumed | $ | 1,381,453 | | | $ | (2,355 | ) | | $ | 1,379,098 | |
| | | | | | | | | | | |
Net assets acquired | | | | | | | | | $ | 231,637 | |
Purchase price | | | | | | | | | | 333,941 | |
Goodwill recorded in Merger | | | | | | | | | $ | 102,304 | |
Explanation of certain fair value related adjustments:
(a) | Represents the fair value adjustments on investment securities. |
(b) | Represents the fair value adjustments on the net book value of loans, which includes an interest rate mark and credit mark adjustment and the write-off of deferred fees/costs and premiums. |
(c) | Represents the elimination of Clifton’s allowance for loan losses. |
(d) | Represents the fair value adjustments to reflect the fair value of land and buildings and premises and equipment, which will be amortized on a straight-line basis over the estimated useful lives of the individual assets. |
(e) | Represents an adjustment to net deferred tax assets resulting from the fair value adjustments related to the acquired assets, liabilities assumed and identifiable intangible assets recorded. |
(f) | Represents the intangible assets recorded to reflect the fair value of core deposits. The core deposit asset was recorded as an identifiable intangible asset and will be amortized on an accelerated basis over the estimated average life of the deposit base. |
(g) | Represents an adjustment to reduce the carrying value of other real estate owned to fair value, less costs to sell. |
(h) | Represents an adjustment to other assets acquired. |
(i) | Represents fair value adjustments on time deposits, which will be treated as a reduction of interest expense over the remaining term of the time deposits. |
(j) | Represents the fair value adjustments on FHLB borrowings, which will be treated as an increase to interest expense over the life of the borrowings. |
(k) | Represents an adjustment to other liabilities assumed. |
F-28
KEARNY FINANCIAL CORP. AND SUBSIDIARIES
Notes to Consolidated Financial Statements
Note 3 – Acquisition of Clifton Bancorp Inc. (continued)
The fair value of loans acquired from Clifton were estimated using cash flow projections based on the remaining maturity and repricing terms. Cash flows were adjusted by estimating future credit losses and the rate of prepayments. Projected monthly cash flows were then discounted to present value using a risk-adjusted market rate for similar loans. There was no carryover of Clifton’s allowance for loan losses associated with the loans that were acquired, as the loans were initially recorded at fair value on the date of the Clifton merger. Management has determined that there were no material purchased credit-impaired loans in the Clifton merger.
The core deposit intangible asset recognized is being amortized over its estimated useful life of approximately 10 years utilizing the sum-of-the-years digits method.
Goodwill is not amortized for book purposes; however, it is reviewed at least annually for impairment and is not deductible for tax purposes.
The fair value of land and buildings was estimated using appraisals. Acquired equipment was not material. Buildings are amortized over their estimated useful lives of approximately 35 to 46 years. Improvements and equipment are amortized or depreciated over their estimated useful lives ranging from one to 10 years.
The fair value of retail demand and interest bearing deposit accounts was assumed to approximate the carrying value as these accounts have no stated maturity and are payable on demand. The fair value of time deposits was estimated by discounting the contractual future cash flows using market rates offered for time deposits of similar remaining maturities.
Direct acquisition and other charges incurred in connection with the Clifton merger were expensed as incurred and totaled $6.7 million for the year ended June 30, 2018. These expenses were recorded in merger-related expense on the consolidated statements of income.
The following table presents selected unaudited pro forma financial information reflecting the Clifton merger assuming it was completed as of July 1, 2016. The unaudited pro forma financial information is presented for illustrative purposes only and is not necessarily indicative of the financial results of the combined companies had the Clifton merger actually been completed at the beginning of the periods presented, nor does it indicate future results for any other interim or full year period. Pro forma basic and diluted EPS were calculated using the Company’s actual weighted average shares outstanding for the periods presented, plus the incremental shares issued, assuming the Clifton merger occurred at the beginning of the periods presented. The unaudited pro forma information is based on the actual financial statements of the Company for the periods presented, and on the actual financial statements of Clifton for the years ended March 31, 2018 and 2017 until the date of the Clifton merger, at which time Clifton’s results of operations were included in the Company’s financial statements.
The unaudited supplemental pro forma information for years ended June 30, 2018 and 2017 set forth below reflects adjustments related to (a) purchase accounting fair value adjustments; (b) amortization of core deposit and other intangibles; and (c) adjustments to interest income and expense due to amortization of premiums and accretion of discounts. Direct merger-related expenses incurred in the year ended June 30, 2018 are assumed to have occurred prior to July 1, 2017. Furthermore, the unaudited supplemental pro forma information does not reflect management’s estimate of any revenue enhancement opportunities or anticipated potential cost savings for periods that include data as of April 2, 2018 or earlier.
| Unaudited | |
| Supplemental Pro Forma Information | |
| Years Ended June 30, | |
| 2018 | | | 2017 | |
| (In Thousands, Except Per Share Data) | |
Net interest income | $ | 169,094 | | | $ | 146,426 | |
Non-interest income | | 15,683 | | | | 13,262 | |
Non-interest expense | | 113,816 | | | | 103,957 | |
Net income available to common stockholders | | 40,216 | | | | 31,631 | |
Pro forma earnings per common share from continuing operations: | | | | | | | |
Basic | $ | 0.37 | | | | 0.29 | |
Diluted | $ | 0.37 | | | | 0.29 | |
F-29
KEARNY FINANCIAL CORP. AND SUBSIDIARIES
Notes to Consolidated Financial Statements
Note 4 - Securities Available for Sale
Amortized cost, gross unrealized gains and losses and fair value of debt securities and mortgage-backed securities at June 30, 2018 and 2017 and stratification by contractual maturity of debt securities at June 30, 2018 are presented below:
| June 30, 2018 | |
| Amortized Cost | | | Gross Unrealized Gains | | | Gross Unrealized Losses | | | Fair Value | |
| (In Thousands) | |
Securities available for sale: | | | | | | | | | | | | | | | |
Debt securities: | | | | | | | | | | | | | | | |
U.S. agency securities | $ | 4,474 | | | $ | - | | | $ | 63 | | | $ | 4,411 | |
Obligations of state and political subdivisions | | 26,793 | | | | 4 | | | | 709 | | | | 26,088 | |
Asset-backed securities | | 179,959 | | | | 2,795 | | | | 134 | | | | 182,620 | |
Collateralized loan obligations | | 226,881 | | | | 99 | | | | 914 | | | | 226,066 | |
Corporate bonds | | 147,925 | | | | 463 | | | | 794 | | | | 147,594 | |
Trust preferred securities | | 3,967 | | | | - | | | | 184 | | | | 3,783 | |
Total debt securities | | 589,999 | | | | 3,361 | | | | 2,798 | | | | 590,562 | |
| | | | | | | | | | | | | | | |
Mortgage-backed securities: | | | | | | | | | | | | | | | |
Collateralized mortgage obligations: | | | | | | | | | | | | | | | |
Federal Home Loan Mortgage Corporation | | 8,032 | | | | - | | | | 347 | | | | 7,685 | |
Federal National Mortgage Association | | 17,619 | | | | - | | | | 1,012 | | | | 16,607 | |
Total collateralized mortgage obligations | | 25,651 | | | | - | | | | 1,359 | | | | 24,292 | |
| | | | | | | | | | | | | | | |
Mortgage pass-through securities: | | | | | | | | | | | | | | | |
Residential pass-through securities: | | | | | | | | | | | | | | | |
Federal Home Loan Mortgage Corporation | | 78,639 | | | | 19 | | | | 2,868 | | | | 75,790 | |
Federal National Mortgage Association | | 27,171 | | | | 24 | | | | 626 | | | | 26,569 | |
Total residential pass-through securities | | 105,810 | | | | 43 | | | | 3,494 | | | | 102,359 | |
| | | | | | | | | | | | | | | |
Commercial pass-through securities: | | | | | | | | | | | | | | | |
Federal National Mortgage Association | | 7,946 | | | | - | | | | 74 | | | | 7,872 | |
Total commercial pass-through securities | | 7,946 | | | | - | | | | 74 | | | | 7,872 | |
| | | | | | | | | | | | | | | |
Total mortgage-backed securities | | 139,407 | | | | 43 | | | | 4,927 | | | | 134,523 | |
| | | | | | | | | | | | | | | |
Total securities available for sale | $ | 729,406 | | | $ | 3,404 | | | $ | 7,725 | | | $ | 725,085 | |
| June 30, 2018 | |
| Amortized Cost | | | Fair Value | |
| (In Thousands) | |
Debt securities available for sale: | | | | | | | |
Due in one year or less | $ | 2 | | | $ | 2 | |
Due after one year through five years | | 148,699 | | | | 148,247 | |
Due after five years through ten years | | 49,092 | | | | 48,306 | |
Due after ten years | | 392,206 | | | | 394,007 | |
Total | $ | 589,999 | | | $ | 590,562 | |
| | | | | | | |
F-30
KEARNY FINANCIAL CORP. AND SUBSIDIARIES
Notes to Consolidated Financial Statements
Note 4 - Securities Available for Sale (continued)
| June 30, 2017 | |
| Amortized Cost | | | Gross Unrealized Gains | | | Gross Unrealized Losses | | | Fair Value | |
| (In Thousands) | |
Securities available for sale: | | | | | | | | | | | | | | | |
Debt securities: | | | | | | | | | | | | | | | |
U.S. agency securities | $ | 5,304 | | | $ | 35 | | | $ | 23 | | | $ | 5,316 | |
Obligations of state and political subdivisions | | 27,465 | | | | 305 | | | | 30 | | | | 27,740 | |
Asset-backed securities | | 163,120 | | | | 316 | | | | 1,007 | | | | 162,429 | |
Collateralized loan obligations | | 98,078 | | | | 185 | | | | 109 | | | | 98,154 | |
Corporate bonds | | 143,017 | | | | 826 | | | | 1,525 | | | | 142,318 | |
Trust preferred securities | | 8,912 | | | | - | | | | 372 | | | | 8,540 | |
Total debt securities | | 445,896 | | | | 1,667 | | | | 3,066 | | | | 444,497 | |
| | | | | | | | | | | | | | | |
Mortgage-backed securities: | | | | | | | | | | | | | | | |
Collateralized mortgage obligations: | | | | | | | | | | | | | | | |
Federal Home Loan Mortgage Corporation | | 9,902 | | | | 38 | | | | 66 | | | | 9,874 | |
Federal National Mortgage Association | | 21,222 | | | | - | | | | 560 | | | | 20,662 | |
Total collateralized mortgage obligations | | 31,124 | | | | 38 | | | | 626 | | | | 30,536 | |
| | | | | | | | | | | | | | | |
Mortgage pass-through securities: | | | | | | | | | | | | | | | |
Residential pass-through securities: | | | | | | | | | | | | | | | |
Federal Home Loan Mortgage Corporation | | 95,501 | | | | 352 | | | | 999 | | | | 94,854 | |
Federal National Mortgage Association | | 35,516 | | | | 425 | | | | 245 | | | | 35,696 | |
Total residential pass-through securities | | 131,017 | | | | 777 | | | | 1,244 | | | | 130,550 | |
| | | | | | | | | | | | | | | |
Commercial pass-through securities: | | | | | | | | | | | | | | | |
Federal National Mortgage Association | | 8,108 | | | | 69 | | | | - | | | | 8,177 | |
Total commercial pass-through securities | | 8,108 | | | | 69 | | | | - | | | | 8,177 | |
| | | | | | | | | | | | | | | |
Total mortgage-backed securities | | 170,249 | | | | 884 | | | | 1,870 | | | | 169,263 | |
| | | | | | | | | | | | | | | |
Total securities available for sale | $ | 616,145 | | | $ | 2,551 | | | $ | 4,936 | | | $ | 613,760 | |
During the year ended June 30, 2018, proceeds from sales of securities available for sale totaled $254.6 million and resulted in gross losses of $31,000. During the year ended June 30, 2017, proceeds from sales of securities available for sale totaled $83.0 million and resulted in gross gains of $1.3 million and gross losses of $1.7 million. There were no sales of securities available for sale during year ended June 30, 2016.
At June 30, 2018 and 2017, securities available for sale with carrying values of approximately $42.6 million and $41.8 million, respectively, were utilized as collateral for borrowings through the FHLB of New York. As of those same dates, securities available for sale with total carrying values of approximately $6.2 million and $0, respectively, were pledged to secure public funds on deposit. At June 30, 2018 and 2017, securities available for sale with carrying values of approximately $43.0 million and $41.5 million, respectively, were utilized as collateral for potential borrowings through the Federal Reserve Bank of New York. As of those same dates, securities available for sale with total carrying values of approximately $12.8 and $8.2 million, respectively, were utilized as collateral for depositor sweep accounts.
F-31
KEARNY FINANCIAL CORP. AND SUBSIDIARIES
Notes to Consolidated Financial Statements
Note 5 – Securities Held to Maturity
Amortized cost, gross unrecognized gains and losses and fair value of debt securities and mortgage-backed securities at June 30, 2018 and 2017 and stratification by contractual maturity of debt securities at June 30, 2018 are presented below:
| June 30, 2018 | |
| Amortized Cost | | | Gross Unrecognized Gains | | | Gross Unrecognized Losses | | | Fair Value | |
| (In Thousands) | |
Securities held to maturity: | | | | | | | | | | | | | | | |
Debt securities: | | | | | | | | | | | | | | | |
Obligations of state and political subdivisions | $ | 109,483 | | | $ | 79 | | | $ | 1,865 | | | $ | 107,697 | |
Subordinated debt | | 46,294 | | | | 37 | | | | 284 | | | | 46,047 | |
Total debt securities | | 155,777 | | | | 116 | | | | 2,149 | | | | 153,744 | |
| | | | | | | | | | | | | | | |
Mortgage-backed securities: | | | | | | | | | | | | | | | |
Collateralized mortgage obligations: | | | | | | | | | | | | | | | |
Government National Mortgage Association | | 21,045 | | | | - | | | | 671 | | | | 20,374 | |
Federal Home Loan Mortgage Corporation | | 11,563 | | | | - | | | | 503 | | | | 11,060 | |
Federal National Mortgage Association | | 24,263 | | | | 6 | | | | 174 | | | | 24,095 | |
Non-agency securities | | 15 | | | | - | | | | - | | | | 15 | |
Total collateralized mortgage obligations | | 56,886 | | | | 6 | | | | 1,348 | | | | 55,544 | |
| | | | | | | | | | | | | | | |
Mortgage pass-through securities: | | | | | | | | | | | | | | | |
Residential pass-through securities: | | | | | | | | | | | | | | | |
Government National Mortgage Association | | 2,553 | | | | - | | | | 15 | | | | 2,538 | |
Federal Home Loan Mortgage Corporation | | 37,074 | | | | 1 | | | | 950 | | | | 36,125 | |
Federal National Mortgage Association | | 160,995 | | | | 18 | | | | 3,040 | | | | 157,973 | |
Total residential pass-through securities | | 200,622 | | | | 19 | | | | 4,005 | | | | 196,636 | |
| | | | | | | | | | | | | | | |
Commercial pass-through securities: | | | | | | | | | | | | | | | |
Government National Mortgage Association | | 32,149 | | | | - | | | | 205 | | | | 31,944 | |
Federal National Mortgage Association | | 144,296 | | | | - | | | | 2,665 | | | | 141,631 | |
Total commercial pass-through securities | | 176,445 | | | | - | | | | 2,870 | | | | 173,575 | |
| | | | | | | | | | | | | | | |
Total mortgage-backed securities | | 433,953 | | | | 25 | | | | 8,223 | | | | 425,755 | |
| | | | | | | | | | | | | | | |
Total securities held to maturity | $ | 589,730 | | | $ | 141 | | | $ | 10,372 | | | $ | 579,499 | |
| June 30, 2018 | |
| Amortized Cost | | | Fair Value | |
| (In Thousands) | |
Debt securities held to maturity: | | | | | | | |
Due in one year or less | $ | 5,073 | | | $ | 5,068 | |
Due after one year through five years | | 32,306 | | | | 31,979 | |
Due after five years through ten years | | 113,076 | | | | 111,470 | |
Due after ten years | | 5,322 | | | | 5,227 | |
Total | $ | 155,777 | | | $ | 153,744 | |
F-32
KEARNY FINANCIAL CORP. AND SUBSIDIARIES
Notes to Consolidated Financial Statements
Note 5 – Securities Held to Maturity (continued)
| June 30, 2017 | |
| Amortized Cost | | | Gross Unrecognized Gains | | | Gross Unrecognized Losses | | | Fair Value | |
| (In Thousands) | |
Securities held to maturity: | | | | | | | | | | | | | | | |
Debt securities: | | | | | | | | | | | | | | | |
U.S. agency securities | $ | 35,000 | | | $ | - | | | $ | 48 | | | $ | 34,952 | |
Obligations of state and political subdivisions | | 94,713 | | | | 996 | | | | 156 | | | | 95,553 | |
Subordinated debt | | 15,000 | | | | - | | | | - | | | | 15,000 | |
Total debt securities | | 144,713 | | | | 996 | | | | 204 | | | | 145,505 | |
| | | | | | | | | | | | | | | |
Mortgage-backed securities: | | | | | | | | | | | | | | | |
Collateralized mortgage obligations: | | | | | | | | | | | | | | | |
Government National Mortgage Association | | 2,199 | | | | - | | | | 46 | | | | 2,153 | |
Federal Home Loan Mortgage Corporation | | 15,522 | | | | - | | | | 357 | | | | 15,165 | |
Federal National Mortgage Association | | 111 | | | | 10 | | | | - | | | | 121 | |
Non-agency securities | | 22 | | | | - | | | | - | | | | 22 | |
Total collateralized mortgage obligations | | 17,854 | | | | 10 | | | | 403 | | | | 17,461 | |
| | | | | | | | | | | | | | | |
Mortgage pass-through securities: | | | | | | | | | | | | | | | |
Residential pass-through securities: | | | | | | | | | | | | | | | |
Federal Home Loan Mortgage Corporation | | 35,289 | | | | 1 | | | | 338 | | | | 34,952 | |
Federal National Mortgage Association | | 143,524 | | | | 428 | | | | 597 | | | | 143,355 | |
Total residential pass-through securities | | 178,813 | | | | 429 | | | | 935 | | | | 178,307 | |
| | | | | | | | | | | | | | | |
Commercial pass-through securities: | | | | | | | | | | | | | | | |
Government National Mortgage Association | | 1,989 | | | | - | | | | 11 | | | | 1,978 | |
Federal National Mortgage Association | | 149,952 | | | | 2,622 | | | | 31 | | | | 152,543 | |
Total commercial pass-through securities | | 151,941 | | | | 2,622 | | | | 42 | | | | 154,521 | |
| | | | | | | | | | | | | | | |
Total mortgage-backed securities | | 348,608 | | | | 3,061 | | | | 1,380 | | | | 350,289 | |
| | | | | | | | | | | | | | | |
Total securities held to maturity | $ | 493,321 | | | $ | 4,057 | | | $ | 1,584 | | | $ | 495,794 | |
During the year ended June 30, 2018, proceeds from sales of securities held to maturity totaled $211,000 which resulted in gross losses of $8,000. The securities sold were limited to those securities where there was evidence of a deterioration of creditworthiness. During the year ended June, 30 2017, proceeds from sales of securities held to maturity totaled $5.3 million which resulted in gross gains of $370,000 and gross losses of $1,000. The securities sold were limited to those whose remaining outstanding balances had declined to the required thresholds, in relation to the original amount purchased or acquired, that allowed their sale from the held to maturity portfolio. There were no sales of securities held to maturity during the year ended June 30, 2016.
At June 30, 2018 and 2017, securities held to maturity with carrying values of approximately $142.6 million and $117.5 million, respectively, were utilized as collateral for borrowings from the FHLB of New York. As of those same dates, securities held to maturity with total carrying values of approximately $7.6 million and $6.9 million, respectively, were pledged to secure public funds on deposit. At June 30, 2018 and 2017, securities held to maturity with carrying values of approximately $107.5 million and $88.8 million, respectively were utilized as collateral for potential borrowings from the Federal Reserve Bank of New York. As of those same dates, securities held to maturity with carrying values of approximately $26.0 million and $32.7 million, respectively, were utilized as collateral for depositor sweep accounts.
F-33
KEARNY FINANCIAL CORP. AND SUBSIDIARIES
Notes to Consolidated Financial Statements
Note 6 – Impairment of Securities
The following two tables summarize the fair values and gross unrealized losses within the available for sale and held to maturity portfolios. The gross unrealized losses, presented by security type, represent temporary impairments of value within each portfolio as of the dates presented. Temporary impairments within the available for sale portfolio have been recognized through other comprehensive income as reductions in stockholders’ equity on a tax-effected basis.
The tables are followed by a discussion that summarizes the Company’s rationale for recognizing certain impairments as “temporary” versus those, if any, are identified as “other-than-temporary”. Such rationale is presented by investment type and generally applies consistently to both the “available for sale” and “held to maturity” portfolios, except where specifically noted.
| June 30, 2018 | |
| Less than 12 Months | | | 12 Months or More | | | Total | |
| Fair Value | | | Unrealized Losses | | | Fair Value | | | Unrealized Losses | | | Fair Value | | | Unrealized Losses | |
| (In Thousands) | |
Securities Available for Sale: | | | | | | | | | | | | | | | | | | | | | | | |
U.S. agency securities | $ | 2,579 | | | $ | 43 | | | $ | 1,832 | | | $ | 20 | | | $ | 4,411 | | | $ | 63 | |
Obligations of state and political subdivisions | | 24,443 | | | | 672 | | | | 540 | | | | 37 | | | | 24,983 | | | | 709 | |
Asset-backed securities | | - | | | | - | | | | 24,728 | | | | 134 | | | | 24,728 | | | | 134 | |
Collateralized loan obligations | | 189,258 | | | | 914 | | | | - | | | | - | | | | 189,258 | | | | 914 | |
Corporate bonds | | 5,035 | | | | 4 | | | | 64,184 | | | | 790 | | | | 69,219 | | | | 794 | |
Trust preferred securities | | - | | | | - | | | | 2,783 | | | | 184 | | | | 2,783 | | | | 184 | |
Collateralized mortgage obligations | | 4,635 | | | | 135 | | | | 19,658 | | | | 1,224 | | | | 24,293 | | | | 1,359 | |
Residential pass-through securities | | 63,889 | | | | 1,921 | | | | 26,697 | | | | 1,573 | | | | 90,586 | | | | 3,494 | |
Commercial pass-through securities | | 3,890 | | | | 66 | | | | 3,982 | | | | 8 | | | | 7,872 | | | | 74 | |
| | | | | | | | | | | | | | | | | | | | | | | |
Total | $ | 293,729 | | | $ | 3,755 | | | $ | 144,404 | | | $ | 3,970 | | | $ | 438,133 | | | $ | 7,725 | |
| June 30, 2017 | |
| Less than 12 Months | | | 12 Months or More | | | Total | |
| Fair Value | | | Unrealized Losses | | | Fair Value | | | Unrealized Losses | | | Fair Value | | | Unrealized Losses | |
| (In Thousands) | |
Securities Available for Sale: | | | | | | | | | | | | | | | | | | | | | | | |
U.S. agency securities | $ | 440 | | | $ | - | | | $ | 1,746 | | | $ | 23 | | | $ | 2,186 | | | $ | 23 | |
Obligations of state and political subdivisions | | 3,872 | | | | 30 | | | | - | | | | - | | | | 3,872 | | | | 30 | |
Asset-backed securities | | 16,860 | | | | 84 | | | | 86,975 | | | | 923 | | | | 103,835 | | | | 1,007 | |
Collateralized loan obligations | | 46,016 | | | | 108 | | | | 6,000 | | | | 1 | | | | 52,016 | | | | 109 | |
Corporate bonds | | - | | | | - | | | | 73,500 | | | | 1,525 | | | | 73,500 | | | | 1,525 | |
Trust preferred securities | | - | | | | - | | | | 7,540 | | | | 372 | | | | 7,540 | | | | 372 | |
Collateralized mortgage obligations | | 26,090 | | | | 626 | | | | - | | | | - | | | | 26,090 | | | | 626 | |
Residential pass-through securities | | 77,301 | | | | 1,244 | | | | - | | | | - | | | | 77,301 | | | | 1,244 | |
| | | | | | | | | | | | | | | | | | | | | | | |
Total | $ | 170,579 | | | $ | 2,092 | | | $ | 175,761 | | | $ | 2,844 | | | $ | 346,340 | | | $ | 4,936 | |
The number of available for sale securities with unrealized losses at June 30, 2018 totaled 132 and included nine U.S. agency securities, 65 municipal obligations, three asset-backed securities, 19 collateralized loan obligations, six corporate obligations, two trust preferred securities, seven collateralized mortgage obligations, 19 residential pass-through securities and two commercial pass-through securities. The number of available for sale securities with unrealized losses at June 30, 2017 totaled 57 and included seven U.S. agency securities, nine municipal obligations, nine asset-backed securities, eight collateralized loan obligations, seven corporate obligations, four trust preferred securities, and five collateralized mortgage obligations and eight residential pass-through securities.
F-34
KEARNY FINANCIAL CORP. AND SUBSIDIARIES
Notes to Consolidated Financial Statements
Note 6 – Impairment of Securities (continued)
| June 30, 2018 | |
| Less than 12 Months | | | 12 Months or More | | | Total | |
| Fair Value | | | Unrecognized Losses | | | Fair Value | | | Unrecognized Losses | | | Fair Value | | | Unrecognized Losses | |
| (In Thousands) | |
Securities Held to Maturity: | | | | | | | | | | | | | | | | | | | | | | | |
Obligations of state and political subdivisions | $ | 86,678 | | | $ | 1,662 | | | $ | 3,151 | | | $ | 203 | | | $ | 89,829 | | | $ | 1,865 | |
Subordinated debt | | 41,010 | | | | 284 | | | | - | | | | - | | | | 41,010 | | | | 284 | |
Collateralized mortgage obligations | | 42,712 | | | | 753 | | | | 12,730 | | | | 595 | | | | 55,442 | | | | 1,348 | |
Residential pass-through securities | | 133,859 | | | | 2,258 | | | | 61,760 | | | | 1,747 | | | | 195,619 | | | | 4,005 | |
Commercial pass-through securities | | 172,382 | | | | 2,867 | | | | 1,191 | | | | 3 | | | | 173,573 | | | | 2,870 | |
| | | | | | | | | | | | | | | | | | | | | | | |
Total | $ | 476,641 | | | $ | 7,824 | | | $ | 78,832 | | | $ | 2,548 | | | $ | 555,473 | | | $ | 10,372 | |
| June 30, 2017 | |
| Less than 12 Months | | | 12 Months or More | | | Total | |
| Fair Value | | | Unrecognized Losses | | | Fair Value | | | Unrecognized Losses | | | Fair Value | | | Unrecognized Losses | |
| (In Thousands) | |
Securities Held to Maturity: | | | | | | | | | | | | | | | | | | | | | | | |
U.S. agency securities | $ | 24,969 | | | $ | 31 | | | $ | 9,983 | | | $ | 17 | | | $ | 34,952 | | | $ | 48 | |
Obligations of state and political subdivisions | | 19,232 | | | | 150 | | | | 409 | | | | 6 | | | | 19,641 | | | | 156 | |
Collateralized mortgage obligations | | 17,317 | | | | 403 | | | | 22 | | | | - | | | | 17,339 | | | | 403 | |
Residential pass-through securities | | 119,538 | | | | 887 | | | | 1,750 | | | | 48 | | | | 121,288 | | | | 935 | |
Commercial pass-through securities | | 11,110 | | | | 42 | | | | - | | | | - | | | | 11,110 | | | | 42 | |
| | | | | | | | | | | | | | | | | | | | | | | |
Total | $ | 192,166 | | | $ | 1,513 | | | $ | 12,164 | | | $ | 71 | | | $ | 204,330 | | | $ | 1,584 | |
The number of held to maturity securities with unrealized losses at June 30, 2018 totaled 371 and included 190 municipal obligations, seven subordinated debt securities, eight collateralized mortgage obligations, 131 residential pass-through securities and 35 commercial pass-through securities. The number of held to maturity securities with unrealized losses at June 30, 2017 totaled 90 and included two U.S. agency securities, 44 municipal obligations, seven collateralized mortgage obligations, 34 residential pass-through securities and three commercial pass-through securities.
In general, if the fair value of a debt security is less than its amortized cost basis at the time of evaluation, the security is “impaired” and the impairment is to be evaluated to determine if it is other than temporary. The Company evaluates the impaired securities in its portfolio for possible other than temporary impairment (OTTI) on at least a quarterly basis. The following represents the circumstances under which an impaired security is determined to be other than temporarily impaired:
| • | When the Company intends to sell the impaired debt security; |
| • | When the Company more likely than not will be required to sell the impaired debt security before recovery of its amortized cost (for example, whether liquidity requirements or contractual or regulatory obligations indicate that the security will be required to be sold before a forecasted recovery occurs); or |
| • | When an impaired debt security does not meet either of the two conditions above, but the Company does not expect to recover the entire amortized cost of the security. According to applicable accounting guidance for debt securities, this is generally when the present value of cash flows expected to be collected is less than the amortized cost of the security. |
F-35
KEARNY FINANCIAL CORP. AND SUBSIDIARIES
Notes to Consolidated Financial Statements
Note 6 – Impairment of Securities (continued)
In the first two circumstances noted above, the amount of OTTI recognized in earnings is the entire difference between the security’s amortized cost basis and its fair value at the balance sheet date. In the third circumstance, however, the OTTI is to be separated into the amount representing the credit loss from the amount related to all other factors. The credit loss component is to be recognized in earnings while the non-credit loss component is to be recognized in other comprehensive income. In these cases, OTTI is generally predicated on an adverse change in cash flows (e.g. principal and/or interest payment deferrals or losses) versus those expected at the time of purchase. The absence of an adverse change in expected cash flows generally indicates that a security’s impairment is related to other “non-credit loss” factors and is thereby generally not recognized as OTTI.
The Company considers a variety of factors when determining whether a credit loss exists for an impaired security including, but not limited to:
| • | The length of time and the extent (a percentage) to which the fair value has been less than the amortized cost basis; |
| • | Adverse conditions specifically related to the security, an industry, or a geographic area (e.g. changes in the financial condition of the issuer of the security, or in the case of an asset backed debt security, in the financial condition of the underlying loan obligors, including changes in technology or the discontinuance of a segment of the business that may affect the future earnings potential of the issuer or underlying loan obligors of the security or changes in the quality of the credit enhancement); |
| • | The historical and implied volatility of the fair value of the security; |
| • | The payment structure of the debt security; |
| • | Actual or expected failure of the issuer of the security to make scheduled interest or principal payments; |
| • | Changes to the rating of the security by external rating agencies; and |
| • | Recoveries or additional declines in fair value subsequent to the balance sheet date. |
At June 30, 2018 and June 30, 2017, the Company held no securities for which credit-related OTTI had been recognized in earnings based on the Company’s analysis and determination that the impairment reported in the tables above was “temporary” in nature as of both dates.
The rationale for making that determination is based on several factors which are generally shared among the various sectors represented in the Company’s available for sale and held to maturity portfolios. The most significant of these is the general mitigation of credit risk arising from the U.S. government, agency and GSE guarantees supporting the Company’s mortgage-backed securities, U.S. agency debt securities and asset-backed securities.
While not supported by such guarantees, the Company’s collateralized loan obligations represent tranches within a larger investment vehicle that reallocate cash flows and credit risk among the individual tranches comprised within that vehicle. Through this structure, the Company is afforded significant protection against the risk that the securities within this sector will be adversely impacted by borrowers defaulting on the underlying loans.
In the absence of the guarantor or structural protections noted above, the securities within the other sectors of the Company’s securities portfolio, including its municipal obligations, subordinated debt, corporate bonds and single-issuer trust preferred securities are generally issued by credit-worthy entities with the ability and resources to fully meet their financial obligations. The Company regularly monitors the historical cash flows and financial strength of all issuers and/or guarantors to confirm that security impairment, where applicable, is not due to an actual or expected adverse change in security cash flows that would result in the recognition of credit-related OTTI.
With credit risk being mitigated in the manner outlined above, the unrealized and unrecognized losses on the Company’s securities are due largely to the combined effects of several market-related factors including, most notably, changes in market interest rates and changing market conditions which affect the supply and demand for such securities. Those market conditions may fluctuate over time resulting in certain securities being impaired for periods in excess of 12 months. However, the longevity of such impairment is not necessarily reflective of an expectation for an adverse change in cash flows signifying a credit loss. Consequently, the impairments of value resulting directly from these changing market conditions are considered “noncredit-related” and “temporary” in nature.
F-36
KEARNY FINANCIAL CORP. AND SUBSIDIARIES
Notes to Consolidated Financial Statements
Note 6 – Impairment of Securities (continued)
The Company has the stated ability and intent to “hold until forecasted recovery” those securities so designated at June 30, 2018 and does not intend to sell the temporarily impaired available for sale securities prior to the recovery of their fair value to a level equal to or greater than the Company’s amortized cost. Furthermore, the Company has concluded that the possibility of being required to sell the securities prior to their anticipated recovery is unlikely based upon its strong liquidity, asset quality and capital position as of that date. In light of the factors noted above, the Company does not consider its balance of securities with unrealized and unrecognized losses at June 30, 2018 and June 30, 2017, to be “other-than-temporarily” impaired as of those dates.
Note 7 – Loans Receivable
| June 30, | |
| 2018 | | | 2017 | |
| (In Thousands) | |
Real estate mortgage: | | | | | | | |
One- to four-family residential | $ | 1,297,453 | | | $ | 567,323 | |
Commercial mortgage: | | | | | | | |
Multi-family | | 1,758,584 | | | | 1,412,575 | |
Nonresidential | | 1,302,961 | | | | 1,085,064 | |
Total commercial mortgage | | 3,061,545 | | | | 2,497,639 | |
| | | | | | | |
Total real estate mortgage | | 4,358,998 | | | | 3,064,962 | |
| | | | | | | |
Construction | | 23,271 | | | | 3,815 | |
| | | | | | | |
Commercial business | | 85,825 | | | | 74,471 | |
| | | | | | | |
Consumer: | | | | | | | |
Home equity loans and lines of credit | | 90,761 | | | | 82,822 | |
Passbook or certificate | | 3,283 | | | | 2,863 | |
Other | | 5,777 | | | | 13,520 | |
Total consumer | | 99,821 | | | | 99,205 | |
| | | | | | | |
Total loans | | 4,567,915 | | | | 3,242,453 | |
| | | | | | | |
Unamortized yield adjustments including net premiums and discounts on purchased and acquired loans and net deferred fees and costs on loans originated | | (66,567 | ) | | | 2,808 | |
| | | | | | | |
Total loans receivable, net of yield adjustments | $ | 4,501,348 | | | $ | 3,245,261 | |
The Bank has granted loans to officers and directors of the Company and its subsidiaries and to their associates. As of June 30, 2018 and 2017 such loans totaled approximately $3.2 million and $3.6 million, respectively. During the years ended June 30, 2018 and June 30, 2017, the Bank granted no new loans to related parties.
F-37
KEARNY FINANCIAL CORP. AND SUBSIDIARIES
Notes to Consolidated Financial Statements
Note 8 – Loan Quality and the Allowance for Loan Losses
Acquired Credit-Impaired Loans
At June 30, 2018, the remaining outstanding principal balance and carrying amount of acquired credit-impaired loans totaled approximately $586,000 and $368,000 respectively. By comparison, at June 30, 2017, the remaining outstanding principal balance and carrying amount of such loans totaled approximately $839,000 and $594,000, respectively.
The carrying amount of acquired credit-impaired loans for which interest is not being recognized due to the uncertainty of the cash flows relating to such loans totaled $346,000 and $371,000 at June 30, 2018 and June 30, 2017, respectively.
There were no valuation allowances for specifically identified impairment attributable to acquired credit-impaired loans at June 30, 2018 and June 30, 2017.
The following table presents the changes in the accretable yield relating to the acquired credit-impaired loans for the years ended June 30, 2018 and 2017.
| Years Ended June 30, | |
| 2018 | | | 2017 | |
| (In Thousands) | |
Beginning balance | $ | 215 | | | $ | 335 | |
Accretion to interest income | | (9 | ) | | | (101 | ) |
Disposals | | - | | | | (19 | ) |
Reclassifications from nonaccretable difference | | - | | | | - | |
Ending balance | $ | 206 | | | $ | 215 | |
Residential Mortgage Loans in Foreclosure
We may obtain physical possession of one- to four-family real estate collateralizing a residential mortgage loan via foreclosure or through an in-substance repossession. As of June 30, 2018, we held four single-family properties in real estate owned with an aggregate carrying value of $725,000 that were acquired through foreclosures on residential mortgage loans. As of that same date, we held 14 residential mortgage loans with aggregate carrying values totaling $2.3 million which were in the process of foreclosure.
As of June 30, 2017, we held two single-family properties in real estate owned with a carrying value of $981,000 that was acquired through a foreclosure on a residential mortgage loan. As of that same date, we held 18 residential mortgage loans with aggregate carrying values totaling $3.7 million which were in the process of foreclosure.
F-38
KEARNY FINANCIAL CORP. AND SUBSIDIARIES
Notes to Consolidated Financial Statements
Note 8 – Loan Quality and the Allowance for Loan Losses (continued)
The following tables present the balance of the allowance for loan losses at June 30, 2018, 2017 and 2016 based upon the calculation methodology described in Note 1. The tables identify the valuation allowances attributable to specifically identified impairments on individually evaluated loans, including those acquired with deteriorated credit quality, as well as valuation allowances for impairments on loans evaluated collectively. The tables include the underlying balance of loans receivable applicable to each category as of those dates as well as the activity in the allowance for loan losses for the years ended June 30, 2018, 2017 and 2016. Unless otherwise noted, the balance of loans reported in the tables below excludes yield adjustments and the allowance for loan loss.
Allowance for Loan Losses and Loans Receivable | |
At June 30, 2018 | |
| | | | | | | | | | | | | | | | | | | | | | | | | | | | | | | |
| Residential Mortgage | | | Multi-Family Mortgage | | | Non- Residential Mortgage | | | Construction | | | Commercial Business | | | Home Equity Loans | | | Other Consumer | | | Total | |
| (In Thousands) | |
Balance of allowance for loan losses: | | | | | | | | | | | | | | | | | | | | | | | | | | | | | | | |
Loans acquired with deteriorated credit quality | $ | - | | | $ | - | | | $ | - | | | $ | - | | | $ | - | | | $ | - | | | $ | - | | | $ | - | |
Loans individually evaluated for impairment | | 79 | | | | - | | | | - | | | | - | | | | 227 | | | | - | | | | - | | | | 306 | |
Loans collectively evaluated for impairment | | 2,400 | | | | 14,946 | | | | 9,787 | | | | 258 | | | | 2,325 | | | | 430 | | | | 413 | | | | 30,559 | |
| | | | | | | | | | | | | | | | | | | | | | | | | | | | | | | |
Total allowance for loan losses | $ | 2,479 | | | $ | 14,946 | | | $ | 9,787 | | | $ | 258 | | | $ | 2,552 | | | $ | 430 | | | $ | 413 | | | $ | 30,865 | |
Allowance for Loan Losses and Loans Receivable | |
Year Ended June 30, 2018 | |
| | | | | | | | | | | | | | | | | | | | | | | | | | | | | | | |
| Residential Mortgage | | | Multi-Family Mortgage | | | Non- Residential Mortgage | | | Construction | | | Commercial Business | | | Home Equity Loans | | | Other Consumer | | | Total | |
| (In Thousands) | |
Changes in the allowance for loan losses for the year ended June 30, 2018: | | | | | | | | | | | | | | | | | | | | | | | | | | | | | | | |
| | | | | | | | | | | | | | | | | | | | | | | | | | | | | | | |
At June 30, 2017: | $ | 2,384 | | | $ | 13,941 | | | $ | 9,939 | | | $ | 35 | | | $ | 1,709 | | | $ | 501 | | | $ | 777 | | | $ | 29,286 | |
| | | | | | | | | | | | | | | | | | | | | | | | | | | | | | | |
Total charge offs | | (521 | ) | | | - | | | | (45 | ) | | | - | | | | (145 | ) | | | (18 | ) | | | (829 | ) | | | (1,558 | ) |
Total recoveries | | 172 | | | | - | | | | - | | | | - | | | | 90 | | | | 65 | | | | 104 | | | | 431 | |
Total provisions | | 444 | | | | 1,005 | | | | (107 | ) | | | 223 | | | | 898 | | | | (118 | ) | | | 361 | | | | 2,706 | |
| | | | | | | | | | | | | | | | | | | | | | | | | | | | | | | |
Total allowance for loan losses | $ | 2,479 | | | $ | 14,946 | | | $ | 9,787 | | | $ | 258 | | | $ | 2,552 | | | $ | 430 | | | $ | 413 | | | $ | 30,865 | |
F-39
KEARNY FINANCIAL CORP. AND SUBSIDIARIES
Notes to Consolidated Financial Statements
Note 8 – Loan Quality and the Allowance for Loan Losses (continued)
Allowance for Loan Losses and Loans Receivable | |
At June 30, 2018 | |
| | | | | | | | | | | | | | | | | | | | | | | | | | | | | | | |
| Residential Mortgage | | | Multi-Family Mortgage | | | Non- Residential Mortgage | | | Construction | | | Commercial Business | | | Home Equity Loans | | | Other Consumer | | | Total | |
| (In Thousands) | |
Balance of loans receivable: | | | | | | | | | | | | | | | | | | | | | | | | | | | | | | | |
| | | | | | | | | | | | | | | | | | | | | | | | | | | | | | | |
Loans acquired with deteriorated credit quality | $ | 99 | | | $ | - | | | $ | - | | | $ | - | | | $ | 269 | | | $ | - | | | $ | - | | | $ | 368 | |
Loans individually evaluated for impairment | | 11,931 | | | | 116 | | | | 5,344 | | | | - | | | | 3,921 | | | | 1,601 | | | | - | | | | 22,913 | |
Loans collectively evaluated for impairment | | 1,285,423 | | | | 1,758,468 | | | | 1,297,617 | | | | 23,271 | | | | 81,635 | | | | 89,160 | | | | 9,060 | | | | 4,544,634 | |
| | | | | | | | | | | | | | | | | | | | | | | | | | | | | | | |
Total loans | $ | 1,297,453 | | | $ | 1,758,584 | | | $ | 1,302,961 | | | $ | 23,271 | | | $ | 85,825 | | | $ | 90,761 | | | $ | 9,060 | | | $ | 4,567,915 | |
Unamortized yield adjustments | | | | | | | | | | | | | | | | | | | | | | | | | | | | | | (66,567 | ) |
Loans receivable, net of yield adjustments | | | | | | | | | | | | | | | | | | | | | | | | | | | | | $ | 4,501,348 | |
Allowance for Loan Losses and Loans Receivable | |
At June 30, 2017 | |
| | | | | | | | | | | | | | | | | | | | | | | | | | | | | | | |
| Residential Mortgage | | | Multi-Family Mortgage | | | Non- Residential Mortgage | | | Construction | | | Commercial Business | | | Home Equity Loans | | | Other Consumer | | | Total | |
| (In Thousands) | |
Balance of allowance for loan losses: | | | | | | | | | | | | | | | | | | | | | | | | | | | | | | | |
| | | | | | | | | | | | | | | | | | | | | | | | | | | | | | | |
Loans acquired with deteriorated credit quality | $ | - | | | $ | - | | | $ | - | | | $ | - | | | $ | - | | | $ | - | | | $ | - | | | $ | - | |
Loans individually evaluated for impairment | | 154 | | | | - | | | | 39 | | | | - | | | | 6 | | | | - | | | | - | | | | 199 | |
Loans collectively evaluated for impairment | | 2,230 | | | | 13,941 | | | | 9,900 | | | | 35 | | | | 1,703 | | | | 501 | | | | 777 | | | | 29,087 | |
| | | | | | | | | | | | | | | | | | | | | | | | | | | | | | | |
Total allowance for loan losses | $ | 2,384 | | | $ | 13,941 | | | $ | 9,939 | | | $ | 35 | | | $ | 1,709 | | | $ | 501 | | | $ | 777 | | | $ | 29,286 | |
F-40
KEARNY FINANCIAL CORP. AND SUBSIDIARIES
Notes to Consolidated Financial Statements
Note 8 – Loan Quality and the Allowance for Loan Losses (continued)
Allowance for Loan Losses and Loans Receivable | |
Year Ended June 30, 2017 | |
| | | | | | | | | | | | | | | | | | | | | | | | | | | | | | | |
| Residential Mortgage | | | Multi-Family Mortgage | | | Non- Residential Mortgage | | | Construction | | | Commercial Business | | | Home Equity Loans | | | Other Consumer | | | Total | |
| (In Thousands) | |
Changes in the allowance for loan losses for the year ended June 30, 2017: | | | | | | | | | | | | | | | | | | | | | | | | | | | | | | | |
| | | | | | | | | | | | | | | | | | | | | | | | | | | | | | | |
At June 30, 2016: | $ | 2,370 | | | $ | 9,995 | | | $ | 7,846 | | | $ | 24 | | | $ | 2,784 | | | $ | 432 | | | $ | 778 | | | $ | 24,229 | |
| | | | | | | | | | | | | | | | | | | | | | | | | | | | | | | |
Total charge offs | | (76 | ) | | | - | | | | (149 | ) | | | - | | | | (221 | ) | | | (96 | ) | | | (849 | ) | | | (1,391 | ) |
Total recoveries | | 256 | | | | - | | | | - | | | | - | | | | 727 | | | | 16 | | | | 68 | | | | 1,067 | |
Total provisions | | (166 | ) | | | 3,946 | | | | 2,242 | | | | 11 | | | | (1,581 | ) | | | 149 | | | | 780 | | | | 5,381 | |
| | | | | | | | | | | | | | | | | | | | | | | | | | | | | | | |
Total allowance for loan losses | $ | 2,384 | | | $ | 13,941 | | | $ | 9,939 | | | $ | 35 | | | $ | 1,709 | | | $ | 501 | | | $ | 777 | | | $ | 29,286 | |
Allowance for Loan Losses and Loans Receivable | |
At June 30, 2017 | |
| | | | | | | | | | | | | | | | | | | | | | | | | | | | | | | |
| Residential Mortgage | | | Multi-Family Mortgage | | | Non- Residential Mortgage | | | Construction | | | Commercial Business | | | Home Equity Loans | | | Other Consumer | | | Total | |
| (In Thousands) | |
Balance of loans receivable: | | | | | | | | | | | | | | | | | | | | | | | | | | | | | | | |
| | | | | | | | | | | | | | | | | | | | | | | | | | | | | | | |
Loans acquired with deteriorated credit quality | $ | 97 | | | $ | - | | | $ | - | | | $ | - | | | $ | 497 | | | $ | - | | | $ | - | | | | 594 | |
Loans individually evaluated for impairment | | 10,546 | | | | 158 | | | | 5,877 | | | | 612 | | | | 2,365 | | | | 1,894 | | | | - | | | | 21,452 | |
Loans collectively evaluated for impairment | | 556,680 | | | | 1,412,417 | | | | 1,079,187 | | | | 3,203 | | | | 71,609 | | | | 80,928 | | | | 16,383 | | | | 3,220,407 | |
| | | | | | | | | | | | | | | | | | | | | | | | | | | | | | | |
Total loans | $ | 567,323 | | | $ | 1,412,575 | | | $ | 1,085,064 | | | $ | 3,815 | | | $ | 74,471 | | | $ | 82,822 | | | $ | 16,383 | | | $ | 3,242,453 | |
Unamortized yield adjustments | | | | | | | | | | | | | | | | | | | | | | | | | | | | | | 2,808 | |
Loans receivable, net of yield adjustments | | | | | | | | | | | | | | | | | | | | | | | | | | | | | $ | 3,245,261 | |
F-41
KEARNY FINANCIAL CORP. AND SUBSIDIARIES
Notes to Consolidated Financial Statements
Note 8 – Loan Quality and the Allowance for Loan Losses (continued)
Allowance for Loan Losses | |
Year Ended June 30, 2016 | |
| | | | | | | | | | | | | | | | | | | | | | | | | | | | | | | |
| Residential Mortgage | | | Multi-Family Mortgage | | | Non- Residential Mortgage | | | Construction | | | Commercial Business | | | Home Equity Loans | | | Other Consumer | | | Total | |
| (In Thousands) | |
Changes in the allowance for loan losses for the year ended June 30, 2016: | | | | | | | | | | | | | | | | | | | | | | | | | | | | | | | |
| | | | | | | | | | | | | | | | | | | | | | | | | | | | | | | |
At June 30, 2015: | $ | 2,210 | | | $ | 6,354 | | | $ | 4,766 | | | $ | 34 | | | $ | 1,860 | | | $ | 366 | | | $ | 16 | | | $ | 15,606 | |
| | | | | | | | | | | | | | | | | | | | | | | | | | | | | | | |
Total charge offs | | (1,213 | ) | | | - | | | | (133 | ) | | | - | | | | (1,464 | ) | | | (93 | ) | | | (55 | ) | | | (2,958 | ) |
Total recoveries | | 88 | | | | - | | | | - | | | | - | | | | 760 | | | | 41 | | | | 2 | | | | 891 | |
Total provisions | | 1,285 | | | | 3,641 | | | | 3,213 | | | | (10 | ) | | | 1,628 | | | | 118 | | | | 815 | | | | 10,690 | |
| | | | | | | | | | | | | | | | | | | | | | | | | | | | | | | |
Total allowance for loan losses | $ | 2,370 | | | $ | 9,995 | | | $ | 7,846 | | | $ | 24 | | | $ | 2,784 | | | $ | 432 | | | $ | 778 | | | $ | 24,229 | |
The following tables present key indicators of credit quality regarding the Company’s loan portfolio based upon loan classification and contractual payment status at June 30, 2018 and 2017.
Credit-Rating Classification of Loans Receivable | |
At June 30, 2018 | |
| | | | | | | | | | | | | | | | | | | | | | | | | | | | | | | |
| Residential Mortgage | | | Multi-Family Mortgage | | | Non- Residential Mortgage | | | Construction | | | Commercial Business | | | Home Equity Loans | | | Other Consumer | | | Total | |
| (In Thousands) | |
Non-classified | $ | 1,283,040 | | | $ | 1,758,468 | | | $ | 1,295,076 | | | $ | 23,271 | | | $ | 80,947 | | | $ | 88,831 | | | $ | 8,937 | | | $ | 4,538,570 | |
Classified: | | | | | | | | | | | | | | | | | | | | | | | | | | | | | | | |
Special Mention | | 493 | | | | - | | | | - | | | | - | | | | 13 | | | | 25 | | | | 61 | | | | 592 | |
Substandard | | 13,920 | | | | 116 | | | | 7,885 | | | | - | | | | 4,865 | | | | 1,905 | | | | 61 | | | | 28,752 | |
Doubtful | | - | | | | - | | | | - | | | | - | | | | - | | | | - | | | | 1 | | | | 1 | |
Loss | | - | | | | - | | | | - | | | | - | | | | - | | | | - | | | | - | | | | - | |
Total classified loans | | 14,413 | | | | 116 | | | | 7,885 | | | | - | | | | 4,878 | | | | 1,930 | | | | 123 | | | | 29,345 | |
| | | | | | | | | | | | | | | | | | | | | | | | | | | | | | | |
Total loans | $ | 1,297,453 | | | $ | 1,758,584 | | | $ | 1,302,961 | | | $ | 23,271 | | | $ | 85,825 | | | $ | 90,761 | | | $ | 9,060 | | | $ | 4,567,915 | |
Credit-Rating Classification of Loans Receivable | |
At June 30, 2017 | |
| | | | | | | | | | | | | | | | | | | | | | | | | | | | | | | |
| Residential Mortgage | | | Multi-Family Mortgage | | | Non- Residential Mortgage | | | Construction | | | Commercial Business | | | Home Equity Loans | | | Other Consumer | | | Total | |
| (In Thousands) | |
Non-classified | $ | 552,961 | | | $ | 1,412,417 | | | $ | 1,078,711 | | | $ | 2,894 | | | $ | 66,886 | | | $ | 80,393 | | | $ | 16,166 | | | $ | 3,210,428 | |
Classified: | | | | | | | | | | | | | | | | | | | | | | | | | | | | | | | |
Special Mention | | 928 | | | | - | | | | - | | | | 309 | | | | 1,098 | | | | 120 | | | | 139 | | | | 2,594 | |
Substandard | | 13,434 | | | | 158 | | | | 6,353 | | | | 612 | | | | 6,487 | | | | 2,309 | | | | 75 | | | | 29,428 | |
Doubtful | | - | | | | - | | | | - | | | | - | | | | - | | | | - | | | | 3 | | | | 3 | |
Loss | | - | | | | - | | | | - | | | | - | | | | - | | | | - | | | | - | | | | - | |
Total classified loans | | 14,362 | | | | 158 | | | | 6,353 | | | | 921 | | | | 7,585 | | | | 2,429 | | | | 217 | | | | 32,025 | |
| | | | | | | | | | | | | | | | | | | | | | | | | | | | | | | |
Total loans | $ | 567,323 | | | $ | 1,412,575 | | | $ | 1,085,064 | | | $ | 3,815 | | | $ | 74,471 | | | $ | 82,822 | | | $ | 16,383 | | | $ | 3,242,453 | |
F-42
KEARNY FINANCIAL CORP. AND SUBSIDIARIES
Notes to Consolidated Financial Statements
Note 8 – Loan Quality and the Allowance for Loan Losses (continued)
Contractual Payment Status of Loans Receivable | |
At June 30, 2018 | |
| | | | | | | | | | | | | | | | | | | | | | | | | | | | | | | |
| Residential Mortgage | | | Multi-Family Mortgage | | | Non- Residential Mortgage | | | Construction | | | Commercial Business | | | Home Equity Loans | | | Other Consumer | | | Total | |
| (In Thousands) | |
Current | $ | 1,290,428 | | | $ | 1,758,584 | | | $ | 1,300,570 | | | $ | 23,271 | | | $ | 85,065 | | | $ | 90,375 | | | $ | 8,917 | | | $ | 4,557,210 | |
Past due: | | | | | | | | | | | | | | | | | | | | | | | | | | | | | | | |
30-59 days | | 1,457 | | | | - | | | | 1,015 | | | | - | | | | 247 | | | | 104 | | | | 24 | | | | 2,847 | |
60-89 days | | 475 | | | | - | | | | - | | | | - | | | | - | | | | 44 | | | | 59 | | | | 578 | |
90+ days | | 5,093 | | | | - | | | | 1,376 | | | | - | | | | 513 | | | | 238 | | | | 60 | | | | 7,280 | |
Total past due | | 7,025 | | | | - | | | | 2,391 | | | | - | | | | 760 | | | | 386 | | | | 143 | | | | 10,705 | |
| | | | | | | | | | | | | | | | | | | | | | | | | | | | | | | |
Total loans | $ | 1,297,453 | | | $ | 1,758,584 | | | $ | 1,302,961 | | | $ | 23,271 | | | $ | 85,825 | | | $ | 90,761 | | | $ | 9,060 | | | $ | 4,567,915 | |
Contractual Payment Status of Loans Receivable | |
At June 30, 2017 | |
| | | | | | | | | | | | | | | | | | | | | | | | | | | | | | | |
| Residential Mortgage | | | Multi-Family Mortgage | | | Non- Residential Mortgage | | | Construction | | | Commercial Business | | | Home Equity Loans | | | Other Consumer | | | Total | |
| (In Thousands) | |
Current | $ | 560,054 | | | $ | 1,412,575 | | | $ | 1,083,736 | | | $ | 3,560 | | | $ | 72,826 | | | $ | 81,946 | | | $ | 16,083 | | | $ | 3,230,780 | |
Past due: | | | | | | | | | | | | | | | | | | | | | | | | | | | | | | | |
30-59 days | | 1,749 | | | | - | | | | 60 | | | | 255 | | | | 29 | | | | 187 | | | | 91 | | | | 2,371 | |
60-89 days | | 403 | | | | - | | | | 318 | | | | - | | | | - | | | | 141 | | | | 135 | | | | 997 | |
90+ days | | 5,117 | | | | - | | | | 950 | | | | - | | | | 1,616 | | | | 548 | | | | 74 | | | | 8,305 | |
Total past due | | 7,269 | | | | - | | | | 1,328 | | | | 255 | | | | 1,645 | | | | 876 | | | | 300 | | | | 11,673 | |
| | | | | | | | | | | | | | | | | | | | | | | | | | | | | | | |
Total loans | $ | 567,323 | | | $ | 1,412,575 | | | $ | 1,085,064 | | | $ | 3,815 | | | $ | 74,471 | | | $ | 82,822 | | | $ | 16,383 | | | $ | 3,242,453 | |
F-43
KEARNY FINANCIAL CORP. AND SUBSIDIARIES
Notes to Consolidated Financial Statements
Note 8 – Loan Quality and the Allowance for Loan Losses (continued)
The following tables present information relating to the Company’s nonperforming and impaired loans at June 30, 2018 and 2017. Loans reported as “90+ days past due and accruing” in the table immediately below are also reported in the preceding contractual payment status table under the heading “90+ days past due”.
Performance Status of Loans Receivable | |
At June 30, 2018 | |
| | | | | | | | | | | | | | | | | | | | | | | | | | | | | | | |
| Residential Mortgage | | | Multi-Family Mortgage | | | Non- Residential Mortgage | | | Construction | | | Commercial Business | | | Home Equity Loans | | | Other Consumer | | | Total | |
| (In Thousands) | |
Performing | $ | 1,288,261 | | | $ | 1,758,468 | | | $ | 1,297,621 | | | $ | 23,271 | | | $ | 84,587 | | | $ | 89,848 | | | $ | 9,000 | | | $ | 4,551,056 | |
Nonperforming: | | | | | | | | | | | | | | | | | | | | | | | | | | | | | | | |
90+ days past due accruing | | - | | | | - | | | | - | | | | - | | | | - | | | | - | | | | 60 | | | | 60 | |
Nonaccrual | | 9,192 | | | | 116 | | | | 5,340 | | | | - | | | | 1,238 | | | | 913 | | | | - | | | | 16,799 | |
Total nonperforming | | 9,192 | | | | 116 | | | | 5,340 | | | | - | | | | 1,238 | | | | 913 | | | | 60 | | | | 16,859 | |
| | | | | | | | | | | | | | | | | | | | | | | | | | | | | | | |
Total loans | $ | 1,297,453 | | | $ | 1,758,584 | | | $ | 1,302,961 | | | $ | 23,271 | | | $ | 85,825 | | | $ | 90,761 | | | $ | 9,060 | | | $ | 4,567,915 | |
Performance Status of Loans Receivable | |
At June 30, 2017 | |
| | | | | | | | | | | | | | | | | | | | | | | | | | | | | | | |
| Residential Mortgage | | | Multi-Family Mortgage | | | Non- Residential Mortgage | | | Construction | | | Commercial Business | | | Home Equity Loans | | | Other Consumer | | | Total | |
| (In Thousands) | |
Performing | $ | 558,533 | | | $ | 1,412,417 | | | $ | 1,079,344 | | | $ | 3,560 | | | $ | 71,837 | | | $ | 81,581 | | | $ | 16,309 | | | $ | 3,223,581 | |
Nonperforming: | | | | | | | | | | | | | | | | | | | | | | | | | | | | | | | |
90+ days past due accruing | | - | | | | - | | | | - | | | | - | | | | - | | | | - | | | | 74 | | | | 74 | |
Nonaccrual | | 8,790 | | | | 158 | | | | 5,720 | | | | 255 | | | | 2,634 | | | | 1,241 | | | | - | | | | 18,798 | |
Total nonperforming | | 8,790 | | | | 158 | | | | 5,720 | | | | 255 | | | | 2,634 | | | | 1,241 | | | | 74 | | | | 18,872 | |
| | | | | | | | | | | | | | | | | | | | | | | | | | | | | | | |
Total loans | $ | 567,323 | | | $ | 1,412,575 | | | $ | 1,085,064 | | | $ | 3,815 | | | $ | 74,471 | | | $ | 82,822 | | | $ | 16,383 | | | $ | 3,242,453 | |
F-44
KEARNY FINANCIAL CORP. AND SUBSIDIARIES
Notes to Consolidated Financial Statements
Note 8 – Loan Quality and the Allowance for Loan Losses (continued)
Impairment Status of Loans Receivable | |
At or Year Ended June 30, 2018 | |
| | | | | | | | | | | | | | | | | | | | | | | | | | | | | | | |
| Residential Mortgage | | | Multi-Family Mortgage | | | Non- Residential Mortgage | | | Construction | | | Commercial Business | | | Home Equity Loans | | | Other Consumer | | | Total | |
| (In Thousands) | |
Carrying value of impaired loans: | | | | | | | | | | | | | | | | | | | | | | | | | | | | | | | |
| | | | | | | | | | | | | | | | | | | | | | | | | | | | | | | |
Non-impaired loans | $ | 1,285,423 | | | $ | 1,758,468 | | | $ | 1,297,617 | | | $ | 23,271 | | | $ | 81,635 | | | $ | 89,160 | | | $ | 9,060 | | | $ | 4,544,634 | |
Impaired loans: | | | | | | | | | | | | | | | | | | | | | | | | | | | | | | | |
Impaired loans with no allowance for impairment | | 11,255 | | | | 116 | | | | 5,344 | | | | - | | | | 3,963 | | | | 1,601 | | | | - | | | | 22,279 | |
Impaired loans with allowance for impairment: | | | | | | | | | | | | | | | | | | | | | | | | | | | | | | | |
Recorded investment | | 775 | | | | - | | | | - | | | | - | | | | 227 | | | | - | | | | - | | | | 1,002 | |
Allowance for impairment | | (79 | ) | | | - | | | | - | | | | - | | | | (227 | ) | | | - | | | | - | | | | (306 | ) |
Balance of impaired loans net of allowance for impairment | | 696 | | | | - | | | | - | | | | - | | | | - | | | | - | | | | - | | | | 696 | |
Total impaired loans, excluding allowance for impairment: | | 12,030 | | | | 116 | | | | 5,344 | | | | - | | | | 4,190 | | | | 1,601 | | | | - | | | | 23,281 | |
| | | | | | | | | | | | | | | | | | | | | | | | | | | | | | | |
Total loans | $ | 1,297,453 | | | $ | 1,758,584 | | | $ | 1,302,961 | | | $ | 23,271 | | | $ | 85,825 | | | $ | 90,761 | | | $ | 9,060 | | | $ | 4,567,915 | |
| | | | | | | | | | | | | | | | | | | | | | | | | | | | | | | |
Unpaid principal balance of impaired loans: | | | | | | | | | | | | | | | | | | | | | | | | | | | | | | | |
Total impaired loans | $ | 16,263 | | | $ | 930 | | | $ | 10,033 | | | $ | 106 | | | $ | 7,671 | | | $ | 2,702 | | | $ | - | | | $ | 37,705 | |
| | | | | | | | | | | | | | | | | | | | | | | | | | | | | | | |
For the year ended June 30, 2018: | | | | | | | | | | | | | | | | | | | | | | | | | | | | | | | |
Average balance of impaired loans | $ | 9,465 | | | $ | 136 | | | $ | 6,484 | | | $ | 106 | | | $ | 2,690 | | | $ | 1,667 | | | $ | - | | | $ | 20,548 | |
Interest earned on impaired loans | $ | 131 | | | $ | - | | | $ | 5 | | | $ | - | | | $ | 44 | | | $ | 32 | | | $ | - | | | $ | 212 | |
F-45
KEARNY FINANCIAL CORP. AND SUBSIDIARIES
Notes to Consolidated Financial Statements
Note 8 – Loan Quality and the Allowance for Loan Losses (continued)
Impairment Status of Loans Receivable | |
At or Year Ended June 30, 2017 | |
| | | | | | | | | | | | | | | | | | | | | | | | | | | | | | | |
| Residential Mortgage | | | Multi-Family Mortgage | | | Non- Residential Mortgage | | | Construction | | | Commercial Business | | | Home Equity Loans | | | Other Consumer | | | Total | |
| (In Thousands) | |
Carrying value of impaired loans: | | | | | | | | | | | | | | | | | | | | | | | | | | | | | | | |
| | | | | | | | | | | | | | | | | | | | | | | | | | | | | | | |
Non-impaired loans | $ | 556,680 | | | $ | 1,412,417 | | | $ | 1,079,187 | | | $ | 3,203 | | | $ | 71,609 | | | $ | 80,928 | | | $ | 16,383 | | | $ | 3,220,407 | |
Impaired loans: | | | | | | | | | | | | | | | | | | | | | | | | | | | | | | | |
Impaired loans with no allowance for impairment | | 8,971 | | | | 158 | | | | 4,521 | | | | 612 | | | | 2,755 | | | | 1,894 | | | | - | | | | 18,911 | |
Impaired loans with allowance for impairment: | | | | | | | | | | | | | | | | | | | | | | | | | | | | | | | |
Recorded investment | | 1,672 | | | | - | | | | 1,356 | | | | - | | | | 107 | | | | - | | | | - | | | | 3,135 | |
Allowance for impairment | | (154 | ) | | | - | | | | (39 | ) | | | - | | | | (6 | ) | | | - | | | | - | | | | (199 | ) |
Balance of impaired loans net of allowance for impairment | | 1,518 | | | | - | | | | 1,317 | | | | - | | | | 101 | | | | - | | | | - | | | | 2,936 | |
Total impaired loans, excluding allowance for impairment: | | 10,643 | | | | 158 | | | | 5,877 | | | | 612 | | | | 2,862 | | | | 1,894 | | | | - | | | | 22,046 | |
| | | | | | | | | | | | | | | | | | | | | | | | | | | | | | | |
Total loans | $ | 567,323 | | | $ | 1,412,575 | | | $ | 1,085,064 | | | $ | 3,815 | | | $ | 74,471 | | | $ | 82,822 | | | $ | 16,383 | | | $ | 3,242,453 | |
| | | | | | | | | | | | | | | | | | | | | | | | | | | | | | | |
Unpaid principal balance of impaired loans: | | | | | | | | | | | | | | | | | | | | | | | | | | | | | | | |
Total impaired loans | $ | 16,479 | | | $ | 930 | | | $ | 10,002 | | | $ | 691 | | | $ | 6,682 | | | $ | 2,961 | | | $ | - | | | $ | 37,745 | |
| | | | | | | | | | | | | | | | | | | | | | | | | | | | | | | |
For the year ended June 30, 2017: | | | | | | | | | | | | | | | | | | | | | | | | | | | | | | | |
Average balance of impaired loans | $ | 12,536 | | | $ | 182 | | | $ | 6,242 | | | $ | 448 | | | $ | 3,114 | | | $ | 2,075 | | | $ | - | | | $ | 24,597 | |
Interest earned on impaired loans | $ | 107 | | | $ | - | | | $ | - | | | $ | 7 | | | $ | 15 | | | $ | 36 | | | $ | - | | | $ | 165 | |
Impairment Status of Loans Receivable | |
Year Ended June 30, 2016 | |
| | | | | | | | | | | | | | | | | | | | | | | | | | | | | | | |
| Residential Mortgage | | | Multi-Family Mortgage | | | Non- Residential Mortgage | | | Construction | | | Commercial Business | | | Home Equity Loans | | | Other Consumer | | | Total | |
| (In Thousands) | |
For the year ended June 30, 2016: | | | | | | | | | | | | | | | | | | | | | | | | | | | | | | | |
Average balance of impaired loans | $ | 12,218 | | | $ | 319 | | | $ | 7,538 | | | $ | 888 | | | $ | 8,278 | | | $ | 2,368 | | | $ | - | | | $ | 31,609 | |
Interest earned on impaired loans | $ | 176 | | | $ | - | | | $ | 40 | | | $ | - | | | $ | 161 | | | $ | 50 | | | $ | - | | | $ | 427 | |
F-46
KEARNY FINANCIAL CORP. AND SUBSIDIARIES
Notes to Consolidated Financial Statements
Note 8 – Loan Quality and the Allowance for Loan Losses (continued)
The following tables present information regarding the restructuring of the Company’s troubled debts during the years ended June 30, 2018, June 30, 2017 and June 30, 2016 and any defaults of TDRs during that year that were restructured within 12 months of the date of default.
Troubled Debt Restructurings of Loans Receivable | |
Year Ended June 30, 2018 | |
| | | | | | | | | | | | | | | | | | | | | | | | | | | | | | | |
| Residential Mortgage | | | Multi-Family Mortgage | | | Non- Residential Mortgage | | | Construction | | | Commercial Business | | | Home Equity Loans | | | Other Consumer | | | Total | |
| (Dollars in Thousands) | |
Troubled debt restructuring activity for the year ended June 30, 2018: | | | | | | | | | | | | | | | | | | | | | | | | | | | | | | | |
| | | | | | | | | | | | | | | | | | | | | | | | | | | | | | | |
Number of loans | | 6 | | | | - | | | | 2 | | | | - | | | | - | | | | 2 | | | | - | | | | 10 | |
Pre-modification outstanding recorded investment | $ | 1,635 | | | $ | - | | | $ | 315 | | | $ | - | | | $ | - | | | $ | 90 | | | $ | - | | | $ | 2,040 | |
Post-modification outstanding recorded investment | | 1,981 | | | | - | | | | 330 | | | | - | | | | - | | | | 88 | | | | - | | | | 2,399 | |
Charge offs against the allowance for loan loss recognized at modification | | 145 | | | | - | | | | 7 | | | | - | | | | - | | | | 2 | | | | - | | | | 154 | |
| | | | | | | | | | | | | | | | | | | | | | | | | | | | | | | |
Troubled debt restructuring defaults for the year ended June 30, 2018: | | | | | | | | | | | | | | | | | | | | | | | | | | | | | | | |
| | | | | | | | | | | | | | | | | | | | | | | | | | | | | | | |
Number of loans | | - | | | | - | | | | - | | | | - | | | | - | | | | - | | | | - | | | | - | |
Outstanding recorded investment | $ | - | | | $ | - | | | $ | - | | | $ | - | | | $ | - | | | $ | - | | | $ | - | | | $ | - | |
Troubled Debt Restructurings of Loans Receivable | |
Year Ended June 30, 2017 | |
| | | | | | | | | | | | | | | | | | | | | | | | | | | | | | | |
| Residential Mortgage | | | Multi-Family Mortgage | | | Non- Residential Mortgage | | | Construction | | | Commercial Business | | | Home Equity Loans | | | Other Consumer | | | Total | |
| (Dollars in Thousands) | |
Troubled debt restructuring activity for the year ended June 30, 2017: | | | | | | | | | | | | | | | | | | | | | | | | | | | | | | | |
| | | | | | | | | | | | | | | | | | | | | | | | | | | | | | | |
Number of loans | | 2 | | | | - | | | | 4 | | | | - | | | | - | | | | 1 | | | | - | | | | 7 | |
Pre-modification outstanding recorded investment | $ | 708 | | | $ | - | | | $ | 2,791 | | | $ | - | | | $ | - | | | $ | 87 | | | $ | - | | | $ | 3,586 | |
Post-modification outstanding recorded investment | | 767 | | | | - | | | | 2,699 | | | | - | | | | - | | | | 95 | | | | - | | | | 3,561 | |
Charge offs against the allowance for loan loss recognized at modification | | 14 | | | | - | | | | 99 | | | | - | | | | - | | | | 9 | | | | - | | | | 122 | |
| | | | | | | | | | | | | | | | | | | | | | | | | | | | | | | |
Troubled debt restructuring defaults for the year ended June 30, 2017: | | | | | | | | | | | | | | | | | | | | | | | | | | | | | | | |
| | | | | | | | | | | | | | | | | | | | | | | | | | | | | | | |
Number of loans | | - | | | | - | | | | - | | | | - | | | | - | | | | - | | | | - | | | | - | |
Outstanding recorded investment | $ | - | | | $ | - | | | $ | - | | | $ | - | | | $ | - | | | $ | - | | | $ | - | | | $ | - | |
F-47
KEARNY FINANCIAL CORP. AND SUBSIDIARIES
Notes to Consolidated Financial Statements
Note 8 – Loan Quality and the Allowance for Loan Losses (continued)
Troubled Debt Restructurings of Loans Receivable | |
Year Ended June 30, 2016 | |
| | | | | | | | | | | | | | | | | | | | | | | | | | | | | | | |
| Residential Mortgage | | | Multi-Family Mortgage | | | Non- Residential Mortgage | | | Construction | | | Commercial Business | | | Home Equity Loans | | | Other Consumer | | | Total | |
| (Dollars in Thousands) | |
Troubled debt restructuring activity for the year ended June 30, 2016: | | | | | | | | | | | | | | | | | | | | | | | | | | | | | | | |
| | | | | | | | | | | | | | | | | | | | | | | | | | | | | | | |
Number of loans | | 5 | | | | - | | | | 3 | | | | - | | | | 1 | | | | 5 | | | | - | | | | 14 | |
Pre-modification outstanding recorded investment | $ | 1,770 | | | $ | - | | | $ | 2,285 | | | $ | - | | | $ | 348 | | | $ | 758 | | | $ | - | | | $ | 5,161 | |
Post-modification outstanding recorded investment | | 1,472 | | | | - | | | | 2,290 | | | | - | | | | 316 | | | | 769 | | | | - | | | | 4,847 | |
Charge offs against the allowance for loan loss recognized at modification | | 300 | | | | - | | | | - | | | | - | | | | 47 | | | | 57 | | | | - | | | | 404 | |
| | | | | | | | | | | | | | | | | | | | | | | | | | | | | | | |
Troubled debt restructuring defaults for the year ended June 30, 2016: | | | | | | | | | | | | | | | | | | | | | | | | | | | | | | | |
| | | | | | | | | | | | | | | | | | | | | | | | | | | | | | | |
Number of loans | | - | | | | - | | | | - | | | | - | | | | - | | | | - | | | | - | | | | - | |
Outstanding recorded investment | $ | - | | | $ | - | | | $ | - | | | $ | - | | | $ | - | | | $ | - | | | $ | - | | | $ | - | |
The manner in which the terms of a loan are modified through a troubled debt restructuring generally includes one or more of the following changes to the loan’s repayment terms:
| • | Interest Rate Reduction: Temporary or permanent reduction of the interest rate charged against the outstanding balance of the loan. |
| • | Capitalization of Prior Past Dues: Capitalization of prior amounts due to the outstanding balance of the loan. |
| • | Extension of Maturity or Balloon Date: Extending the term of the loan past its original balloon or maturity date. |
| • | Deferral of Principal Payments: Temporary deferral of the principal portion of a loan payment. |
| • | Payment Recalculation and Re-amortization: Recalculation of the recurring payment obligation and resulting loan amortization/repayment schedule based on the loan’s modified terms. |
Note 9 – Premises and Equipment
| June 30, | |
| 2018 | | | 2017 | |
| (In Thousands) | |
Land | $ | 13,118 | | | $ | 10,820 | |
Buildings and improvements | | 46,953 | | | | 36,816 | |
Leasehold improvements | | 5,860 | | | | 4,487 | |
Furnishings and equipment | | 20,026 | | | | 17,764 | |
Construction in progress | | 5,613 | | | | 2,513 | |
| | 91,570 | | | | 72,400 | |
Less accumulated depreciation and amortization | | 35,330 | | | | 32,815 | |
Total premises and equipment | $ | 56,240 | | | $ | 39,585 | |
F-48
KEARNY FINANCIAL CORP. AND SUBSIDIARIES
Notes to Consolidated Financial Statements
Note 9 – Premises and Equipment (continued)
Depreciation expense on premises and equipment for the fiscal years ended June 30, 2018, 2017 and 2016 totaled $3.2 million, $2.8 million and $3.0 million, respectively.
Land included properties held for future expansion totaling $2,419,000 at June 30, 2018 and 2017.
Note 10 – Goodwill and Other Intangible Assets
| Goodwill | | | Core Deposit Intangibles | |
| (In Thousands) | |
Balance at June 30, 2015 | $ | 108,591 | | | $ | 597 | |
Amortization | | - | | | | (167 | ) |
Balance at June 30, 2016 | | 108,591 | | | | 430 | |
Amortization | | - | | | | (138 | ) |
Balance at June 30, 2017 | | 108,591 | | | | 292 | |
Acquisition of Clifton Bancorp Inc. | | 102,304 | | | | 6,367 | |
Amortization | | - | | | | (364 | ) |
Balance at June 30, 2018 | $ | 210,895 | | | $ | 6,295 | |
Scheduled amortization of core deposit intangibles for each of the next five years and thereafter is as follows:
Year Ending June 30, | | | Core Deposit Intangible Amortization | |
| | | | (In Thousands) | |
| 2019 | | | $ | 1,135 | |
| 2020 | | | | 1,164 | |
| 2021 | | | | 883 | |
| 2022 | | | | 596 | |
| 2023 | | | | 484 | |
Thereafter | | | | 2,033 | |
| | | | | | |
Note 11 – Deposits
| June 30, | | |
| 2018 | | | | 2017 | | |
| Balance | | | Weighted Average Interest Rate | | | | Balance | | | Weighted Average Interest Rate | | |
| (Dollars in Thousands) |
| | | | | | | | | | | | | | | | | |
Non-interest-bearing demand | $ | 311,938 | | | | 0.00 | | % | | $ | 267,412 | | | | 0.00 | | % |
Interest-bearing demand (1) | | 1,000,989 | | | | 0.92 | | | | | 847,400 | | | | 0.54 | | |
Savings and club | | 744,039 | | | | 0.36 | | | | | 523,981 | | | | 0.12 | | |
Certificates of deposits (2) | | 2,016,638 | | | | 1.62 | | | | | 1,290,952 | | | | 1.35 | | |
Total deposits | $ | 4,073,604 | | | | 1.09 | | % | | $ | 2,929,745 | | | | 0.77 | | % |
(1) | Interest-bearing demand deposits at June 30, 2018 and June 30, 2017 include $210.8 million and $222.6 million, respectively, of brokered deposits at a weighted average interest rate of 2.09% and 1.06%, excluding cost of interest rate derivatives used to hedge interest expense. |
(2) | Certificates of deposit at June 30, 2018 and June 30, 2017 include $84.3 million and $21.6 million, respectively, of brokered deposits at a weighted average interest rate of 1.95% and 2.15%. |
F-49
KEARNY FINANCIAL CORP. AND SUBSIDIARIES
Notes to Consolidated Financial Statements
Note 11 – Deposits (continued)
Certificates of deposit with balances of $250,000 or more at June 30, 2018 and 2017, totaled approximately $375.9 million and $224.0 million, respectively. The Bank’s deposits are insurable to applicable limits by the Federal Deposit Insurance Corporation.
A summary of certificates of deposit by maturity follows:
| | | June 30, | |
| | | | 2018 | | | | 2017 | |
| | | (In Thousands) | |
| | | | | | | | | |
One year or less | | | $ | 1,123,977 | | | $ | 610,647 | |
After one year to two years | | | | 493,166 | | | | 354,743 | |
After two years to three years | | | | 199,289 | | | | 137,240 | |
After three years to four years | | | | 101,276 | | | | 99,974 | |
After four years to five years | | | | 81,355 | | | | 81,882 | |
After five years | | | | 17,575 | | | | 6,466 | |
Total certificates of deposit | | | $ | 2,016,638 | | | $ | 1,290,952 | |
Note 12 – Borrowings
Fixed-rate advances from FHLB of New York mature as follows:
| June 30, 2018 | | | June 30, 2017 | | |
| Balance | | | Weighted Average Interest Rate | | | Balance | | | Weighted Average Interest Rate | | |
| (Dollars in Thousands) |
Maturing in years ending June 30: | | | | | | | | | | | | | | | | |
2018 | $ | - | | | | 0.00 | | % | $ | 630,225 | | | | 1.29 | | % |
2019 | | 741,000 | | | | 2.09 | | | | - | | | | 0.00 | | |
2020 | | 48,400 | | | | 1.66 | | | | - | | | | 0.00 | | |
2021 | | 64,160 | | | | 1.88 | | | | 469 | | | | 4.94 | | |
2022 | | 35,700 | | | | 2.17 | | | | - | | | | 0.00 | | |
2023 | | 155,000 | | | | 3.00 | | | | 145,000 | | | | 3.04 | | |
2024 | | 22,500 | | | | 2.63 | | | | - | | | | 0.00 | | |
2025 | | 103,500 | | | | 2.68 | | | | - | | | | 0.00 | | |
2026 | | 6,500 | | | | 2.82 | | | | - | | | | 0.00 | | |
Total advances | | 1,176,760 | | | | 2.25 | | % | | 775,694 | | | | 1.62 | | % |
Unamortized fair value adjustments | | (6,616 | ) | | | | | | | 2 | | | | | | |
Total advances, net of fair value adjustments | $ | 1,170,144 | | | | | | | $ | 775,696 | | | | | | |
At June 30, 2018, $741.0 million in advances are due within one year while the remaining $435.8 million in advances are due after one year of which $145.0 million became callable in April 2018.
At June 30, 2018, FHLB advances were collateralized by the FHLB capital stock owned by the Bank and mortgage loans and securities with carrying values totaling approximately $2.72 billion and $185.2 million, respectively. At June 30, 2017, FHLB advances were collateralized by the FHLB capital stock owned by the Bank and mortgage loans and securities with carrying values totaling approximately $1.9 billion and $159.4 million, respectively.
Borrowings at June 30, 2018 and 2017 also included overnight borrowings in the form of depositor sweep accounts totaling $28.5 million and $30.5 million, respectively. Depositor sweep accounts are short term borrowings representing funds that are withdrawn from a customer’s noninterest-bearing deposit account and invested in an uninsured overnight investment account that is collateralized by specified investment securities owned by the Bank.
F-50
KEARNY FINANCIAL CORP. AND SUBSIDIARIES
Notes to Consolidated Financial Statements
Note 13 – Derivative Instruments and Hedging Activities
Risk Management Objective of Using Derivatives
The Company uses various financial instruments, including derivatives, to manage its exposure to interest rate risk. The Company’s derivative financial instruments are used to manage differences in the amount, timing, and duration of the Company’s known or expected cash receipts and its known or expected cash payments principally related to specific wholesale funding positons.
Fair Values of Derivative Instruments on the Statement of Financial Condition
The table below presents the fair value of the Company’s derivative financial instruments as well as their classification on the Statement of Financial Condition as of June 30, 2018 and June 30, 2017:
| June 30, 2018 | |
| Asset Derivatives | | | Liability Derivatives | |
| Location | | Fair Value | | | Location | | Fair Value | |
| (In Thousands) | |
Derivatives designated as hedging instruments: | | | | | | | | | | | |
Interest rate swaps | Other assets | | $ | 31,881 | | | Other liabilities | | $ | - | |
Interest rate caps | Other assets | | | - | | | Other liabilities | | | - | |
Total | | | $ | 31,881 | | | | | $ | - | |
| June 30, 2017 | |
| Asset Derivatives | | | Liability Derivatives | |
| Location | | Fair Value | | | Location | | Fair Value | |
| (In Thousands) | |
Derivatives designated as hedging instruments: | | | | | | | | | | | |
Interest rate swaps | Other assets | | $ | 7,670 | | | Other liabilities | | $ | 298 | |
Interest rate caps | Other assets | | | 140 | | | Other liabilities | | | - | |
Total | | | $ | 7,810 | | | | | $ | 298 | |
Cash Flow Hedges of Interest Rate Risk
The Company’s objectives in using derivatives are primarily to add stability to interest expense and to manage its exposure to interest rate movements. To accomplish this objective, the Company has entered into interest rate swaps and caps as part of its interest rate risk management strategy. These interest rate products are designated as cash flow hedges. As of June 30, 2018, the Company had 15 interest rate swaps with a notional of $1.2 billion and one interest rate cap with a notional of $35.0 million hedging certain FHLB advances and brokered deposits.
For derivatives designated as cash flow hedges, the gain or loss on the derivatives is recorded in other comprehensive income, net of tax, and subsequently reclassified into interest expense in the same period during which the hedged transaction affects earnings.
Amounts reported in accumulated other comprehensive income related to derivatives will be reclassified to interest expense as interest payments are made on the Company’s variable rate wholesale funding positions. During the year ended June 30, 2018, the Company had $2.8 million of reclassifications to interest expense. During the next 12 months, the Company estimates that $7.0 million will be reclassified as a reduction in interest expense.
F-51
KEARNY FINANCIAL CORP. AND SUBSIDIARIES
Notes to Consolidated Financial Statements
Note 13 – Derivative Instruments and Hedging Activities (continued)
The table below presents the pre-tax effects of the Company’s derivative instruments on the Consolidated Statements of Income as of June 30, 2018, June 30, 2017 and June 30, 2016:
| Year Ended June 30, 2018 | |
| Amount of Gain (Loss) Recognized in OCI on Derivatives | | | Location of Gain (Loss) Reclassified from Accumulated OCI into Income | | Amount of Gain (Loss) Reclassified from Accumulated OCI into Income | |
| (In Thousands) | |
Derivatives in cash flow hedging relationships: | | | | | | | | | |
Interest rate swaps | $ | 22,656 | | | Interest expense | | $ | (1,853 | ) |
Interest rate caps | | 78 | | | Interest expense | | | (973 | ) |
Total | $ | 22,734 | | | | | $ | (2,826 | ) |
| Year Ended June 30, 2017 | |
| Amount of Gain (Loss) Recognized in OCI on Derivatives | | | Location of Gain (Loss) Reclassified from Accumulated OCI into Income | | Amount of Gain (Loss) Reclassified from Accumulated OCI into Income | |
| (In Thousands) | |
Derivatives in cash flow hedging relationships: | | | | | | | | | |
Interest rate swaps | $ | 20,826 | | | Interest expense | | $ | (5,914 | ) |
Interest rate caps | | 79 | | | Interest expense | | | (820 | ) |
Total | $ | 20,905 | | | | | $ | (6,734 | ) |
F-52
KEARNY FINANCIAL CORP. AND SUBSIDIARIES
Notes to Consolidated Financial Statements
Note 13 – Derivative Instruments and Hedging Activities (continued)
| Year Ended June 30, 2016 | |
| Amount of Gain (Loss) Recognized in OCI on Derivatives | | | Location of Gain (Loss) Reclassified from Accumulated OCI into Income | | Amount of Gain (Loss) Reclassified from Accumulated OCI into Income | |
| (In Thousands) | |
Derivatives in cash flow hedging relationships: | | | | | | | | | |
Interest rate swaps | $ | (17,116 | ) | | Interest expense | | $ | (7,311 | ) |
Interest rate caps | | (734 | ) | | Interest expense | | | (352 | ) |
Total | $ | (17,850 | ) | | | | $ | (7,663 | ) |
Offsetting Derivatives
The table below presents a gross presentation, the effects of offsetting, and a net presentation of the Company’s derivatives in the Consolidated Statement of Condition as of June 30, 2018 and June 30, 2017, respectively. The net amounts presented for derivative assets or liabilities can be reconciled to the tabular disclosure of fair value. The tabular disclosure of fair value provides the location that derivative assets and liabilities are presented on the Consolidated Statement of Condition.
| June 30, 2018 | |
| | | | | | | | | | | | | Gross Amounts Not Offset | | | | | |
| Gross Amount Recognized | | | Gross Amounts Offset | | | Net Amounts Presented | | | Financial Instruments | | | Cash Collateral Received | | | Net Amount | |
| (In Thousands) | |
Assets: | | | | | | | | | | | | | | | | | | | | | | | |
Interest rate swaps | $ | 31,881 | | | $ | - | | | $ | 31,881 | | | $ | - | | | $ | (31,620 | ) | | $ | 261 | |
Interest rate caps | | - | | | | - | | | | - | | | | - | | | | - | | | | - | |
Total | $ | 31,881 | | | $ | - | | | $ | 31,881 | | | $ | - | | | $ | (31,620 | ) | | $ | 261 | |
| | | | | | | | | | | | | | | | | | | | | | | |
| | | | | | | | | | | | | Gross Amounts Not Offset | | | | | |
| Gross Amount Recognized | | | Gross Amounts Offset | | | Net Amounts Presented | | | Financial Instruments | | | Cash Collateral Posted | | | Net Amount | |
| (In Thousands) | |
Liabilities: | | | | | | | | | | | | | | | | | | | | | | | |
Interest rate swaps | $ | - | | | $ | - | | | $ | - | | | $ | - | | | $ | - | | | $ | - | |
Interest rate caps | | - | | | | - | | | | - | | | | - | | | | - | | | | - | |
Total | $ | - | | | $ | - | | | $ | - | | | $ | - | | | $ | - | | | $ | - | |
F-53
KEARNY FINANCIAL CORP. AND SUBSIDIARIES
Notes to Consolidated Financial Statements
Note 13 – Derivative Instruments and Hedging Activities (continued)
| June 30, 2017 | |
| | | | | | | | | | | | | Gross Amounts Not Offset | | | | | |
| Gross Amount Recognized | | | Gross Amounts Offset | | | Net Amounts Presented | | | Financial Instruments | | | Cash Collateral Received | | | Net Amount | |
| (In Thousands) | |
Assets: | | | | | | | | | | | | | | | | | | | | | | | |
Interest rate swaps | $ | 12,839 | | | $ | (5,169 | ) | | $ | 7,670 | | | $ | - | | | $ | (5,770 | ) | | $ | 1,900 | |
Interest rate caps | | 140 | | | | - | | | | 140 | | | | - | | | | - | | | | 140 | |
Total | $ | 12,979 | | | $ | (5,169 | ) | | $ | 7,810 | | | $ | - | | | $ | (5,770 | ) | | $ | 2,040 | |
| | | | | | | | | | | | | | | | | | | | | | | |
| | | | | | | | | | | | | Gross Amounts Not Offset | | | | | |
| Gross Amount Recognized | | | Gross Amounts Offset | | | Net Amounts Presented | | | Financial Instruments | | | Cash Collateral Posted | | | Net Amount | |
| (In Thousands) | |
Liabilities: | | | | | | | | | | | | | | | | | | | | | | | |
Interest rate swaps | $ | 5,467 | | | $ | (5,169 | ) | | $ | 298 | | | $ | - | | | $ | (298 | ) | | $ | - | |
Interest rate caps | | - | | | | - | | | | - | | | | - | | | | - | | | | - | |
Total | $ | 5,467 | | | $ | (5,169 | ) | | $ | 298 | | | $ | - | | | $ | (298 | ) | | $ | - | |
Credit-risk-related Contingent Features
The Company has agreements with each of its derivative counterparties that contain a provision where if the Company defaults on any of its indebtedness, then the Company could also be declared in default on its derivative obligations and could be required to terminate its derivative positions with the counterparty. The Company also has agreements with its derivative counterparties that contain a provision where if the Company fails to maintain its status as a well-capitalized institution, then the Company could be required to terminate its derivative positions with the counterparty. As of June 30, 2018 and June 30, 2017, the termination value of derivatives in a net liability position, which includes accrued interest but excludes any adjustment for nonperformance risk, related to those agreements was $0 and $302,000, respectively.
As required under the enforceable master netting arrangement with its derivatives counterparties, at June 30, 2018 the Company received financial collateral of $31.6 million that was not included as an offsetting amount. By comparison, at June 30, 2017, the Company received financial collateral of $5.8 million and posted financial collateral in the amount of $1.0 million that were not included as offsetting amounts.
In addition to the derivative instruments noted above, the Company’s pipeline of loans held for sale at June 30, 2018 and June 30, 2017, included $10.8 million and $18.4 million, respectively, of “in process” loans whose terms included interest rate locks to borrowers, which are considered free-standing derivative instruments whose fair values are not material to our financial condition or results of operations.
F-54
KEARNY FINANCIAL CORP. AND SUBSIDIARIES
Notes to Consolidated Financial Statements
Note 14 – Benefit Plans
Employee Stock Ownership Plan
In conjunction with the closing of Company’s first-step conversion and stock offering in February 2005, the Bank established an Employee Stock Ownership Plan (“ESOP”) for all eligible employees who complete a twelve-month period of employment with the Bank. Eligible employees may enter the plan on January 1st or July 1st following the plan year they have attained the age of 21 and complete at least 1,000 hours of service in a plan year. The ESOP used $17,457,000 in proceeds from a term loan obtained from the Company to purchase 2,409,764 shares of Company common stock. Principal on the term loan was originally payable in equal installments through the maturity date of March 31, 2017 with the loan carrying an interest rate of 5.50%. The Bank made discretionary contributions to the ESOP that provided the funding it needed to pay the scheduled principal and loan payments to the Company under the terms of the original ESOP loan agreement. Such discretionary contributions were typically reduced by the amount of dividends paid on shares of the Company’s common stock held by the ESOP.
In conjunction with the closing of the Company’s second step conversion and stock offering in May 2015, the Bank augmented its ESOP by using $36,125,000 in proceeds from a new term loan obtained from the Company to the ESOP to purchase an additional 3,612,500 shares of Company common stock. The proceeds from the new term loan included an additional $3,788,000 to refinance the remaining outstanding balance and accrued interest owed under the original ESOP term loan. The original principal balance of the Company’s consolidated term loan to the ESOP totaled $39,913,000 with equal quarterly installments of principal and interest payable over 20 years at an annual interest rate of 3.25%. As with the original term loan, the Bank expects to make discretionary contributions to the ESOP equaling the principal and interest payments owed on the ESOP’s loan to the Company. As above, such payments may be reduced by the amount of dividends paid on shares of the Company’s common stock held by the ESOP.
Shares purchased with the loan proceeds provide collateral for the term loan and are held in a suspense account for future allocations among participants. Contributions to the ESOP and shares released from the suspense account are to be allocated among the participants on the basis of compensation, as described by the ESOP, in the year of allocation.
ESOP shares pledged as collateral are initially recorded as unearned ESOP shares in the consolidated statements of financial condition. On a monthly basis, 16,725 shares are committed to be released, compensation expense is recorded equal to the number of shares committed to be released times the monthly average market price of the shares, and the committed shares become outstanding for basic net income per common share computations. ESOP compensation expense was approximately $2,641,000, $2,784,000 and $2,377,000 for the years ended June 30, 2018, 2017 and 2016, respectively.
At June 30, 2018 and 2017, the ESOP shares were as follows:
| June 30, | |
| | 2018 | | | | 2017 | |
| (In Thousands) | |
Allocated shares | | 1,806 | | | | 1,790 | |
Total shares distributed to employees | | 754 | | | | 570 | |
Shares committed to be released | | 100 | | | | 100 | |
Unearned shares | | 3,362 | | | | 3,562 | |
Total ESOP shares | | 6,022 | | | | 6,022 | |
| | | | | | | |
Fair value of unearned ESOP shares | $ | 45,219 | | | $ | 52,901 | |
F-55
KEARNY FINANCIAL CORP. AND SUBSIDIARIES
Notes to Consolidated Financial Statements
Note 14 – Benefit Plans (continued)
Employee Stock Ownership Plan Benefit Equalization Plan ("ESOP BEP")
The Bank has a non-qualified plan to compensate its executive officers who participate in the Bank's ESOP for certain benefits lost under such plan by reason of benefit limitations imposed by the Internal Revenue Code (“IRC”). The ESOP BEP expense was approximately $24,000, $34,000 and $24,000 for the years ended June 30, 2018, 2017 and 2016, respectively. The liability totaled approximately $18,000 and $18,000 at June 30, 2018 and 2017, respectively.
Employees’ Savings and Profit Sharing Plan
The Bank sponsors the Employees' Savings and Profit Sharing Plan and Trust (the “Plan”), pursuant to Section 401(k) of the Internal Revenue Code, for all eligible employees. Employees may elect to save up to 75% of their compensation. The Bank will contribute a matching contribution up to 3.5% of an eligible employee’s annual compensation, provided the eligible employee has contributed 6%. The Plan expense amounted to approximately $872,000, $762,000 and $662,000 for the years ended June 30, 2018, 2017 and 2016, respectively.
Multi-Employer Retirement Plan
The Bank participates in the Pentegra Defined Benefit Plan for Financial Institutions (“The Pentegra DB Plan”), a tax-qualified defined-benefit pension plan. The Pentegra DB Plan’s Employer Identification Number is 13-5645888 and the Plan Number is 333. The Pentegra DB Plan operates as a multi-employer plan for accounting purposes and as a multiple-employer plan under the Employee Retirement Income Security Act of 1974 and the IRC. There are no collective bargaining agreements in place that require contributions to the Pentegra DB Plan.
The Pentegra DB Plan is a single plan under Internal Revenue Code Section 413(c) and, as a result, all of the assets stand behind all of the liabilities. Accordingly, under the Pentegra DB Plan contributions made by a participating employer may be used to provide benefits to participants of other participating employers.
The Pentegra DB Plan is non-contributory and covers all eligible employees. In April 2007, the Board of Directors of the Bank approved, effective July 1, 2007, “freezing” all future benefit accruals under the Pentegra DB Plan.
Funded status (market value of plan assets divided by funding target) of the Pentegra DB Plan based on valuation reports as of July 1, 2017 and 2016 was 104.23% and 102.23%, respectively. Total contributions, made to the Pentegra DB Plan, which include contributions from all participating employers and not just the Company, as reported on Form 5500, were $367.1 million and $153.2 million for the plan years ended June 30, 2017 and June 30, 2016, respectively. The Bank’s contributions to the Pentegra DB Plan were not more than 5% of the total contributions to the Pentegra DB Plan. During the years ended June 30, 2018, 2017 and 2016, the total expense recorded for the Pentegra DB Plan was approximately $1,115,000, $1,235,000 and $309,000, respectively.
F-56
KEARNY FINANCIAL CORP. AND SUBSIDIARIES
Notes to Consolidated Financial Statements
Note 14 – Benefit Plans (continued)
Atlas Bank Retirement Income Plan (“ABRIP”)
Through the merger with Atlas Bank, the Company acquired a non-contributory defined benefit pension plan covering all eligible employees of Atlas Bank. Effective January 31, 2013, the ABRIP was frozen by Atlas Bank. All benefits for eligible participants accrued in the ABRIP to the freeze date have been retained. The benefits are based on years of service and employee’s compensation. The ABRIP is funded in conformity with funding requirements of applicable government regulations.
The following tables set forth the ABRIP’s funded status and net periodic benefit cost:
| | | June 30, | |
| | | | 2018 | | | | 2017 | |
| | | (In Thousands) | |
Change in benefit obligation: | | | | | | | | | |
Projected benefit obligation - beginning | | | $ | 2,896 | | | $ | 2,799 | |
Interest cost | | | | 109 | | | | 108 | |
Actuarial (gain) loss | | | | (85 | ) | | | 192 | |
Benefit payments | | | | (204 | ) | | | (203 | ) |
Projected benefit obligation - ending | | | $ | 2,716 | | | $ | 2,896 | |
| | | | | | | | | |
Change in plan assets: | | | | | | | | | |
Fair value of assets - beginning | | | $ | 3,692 | | | $ | 3,845 | |
Actual return on assets | | | | (48 | ) | | | 50 | |
Benefit payments | | | | (204 | ) | | | (203 | ) |
Fair value of assets - ending | | | $ | 3,440 | | | $ | 3,692 | |
| | | | | | | | | |
Reconciliation of funded status: | | | | | | | | | |
Projected benefit obligation | | | $ | (2,716 | ) | | $ | (2,896 | ) |
Fair value of assets | | | | 3,440 | | | | 3,692 | |
Funded status included in other assets | | | $ | 724 | | | $ | 796 | |
| | | | | | | | | |
Accumulated benefit obligation | | | $ | (2,716 | ) | | $ | (2,896 | ) |
| | | | | | | | | |
Valuation assumptions | | | | | | | | | |
Discount rate | | | | 4.25 | % | | | 4.00 | % |
Salary increase rate | | | N/A | | | N/A | |
| | | | | | | | | |
| Years Ended June 30, | |
| | 2018 | | | | 2017 | | | | 2016 | |
| (In Thousands) | |
Net periodic benefit cost/(credit): | | | | | | | | | | | |
Interest cost | $ | 109 | | | $ | 108 | | | $ | 125 | |
Expected return on assets | | (120 | ) | | | (248 | ) | | | (258 | ) |
Amortization of net loss | | 52 | | | | 53 | | | | 9 | |
Total benefit cost (credit) | $ | 41 | | | $ | (87 | ) | | $ | (124 | ) |
| | | | | | | | | | | |
Valuation assumptions | | | | | | | | | | | |
Discount rate | | 4.00 | % | | | 3.75 | % | | | 4.50 | % |
Long term rate of return on plan assets | | 3.50 | % | | | 7.00 | % | | | 7.00 | % |
F-57
KEARNY FINANCIAL CORP. AND SUBSIDIARIES
Notes to Consolidated Financial Statements
Note 14 – Benefit Plans (continued)
The Bank does not expect to contribute to the ABRIP in the year ending June 30, 2019.
The following benefit payments, which reflect expected future service, as appropriate, are expected to be paid:
| Benefit Payments | |
| (In Thousands) | |
Years ending June 30: | | | |
2019 | $ | 210 | |
2020 | | 206 | |
2021 | | 202 | |
2022 | | 202 | |
2023 | | 198 | |
2024-2028 | | 928 | |
At June 30, 2018 and 2017, unrecognized net loss of $836,000 and $805,000, respectively, was included in accumulated other comprehensive income. For the fiscal year ending June 30, 2019, $837,000 of unrecognized net loss is expected to be recognized as a component of net periodic benefit cost.
The assets of the ABRIP are invested in a Guaranteed Deposit Fund (“GDF”) with Prudential Financial, Inc. The GDF is a group annuity fund invested in public and private-issue debt securities through various sub-accounts. The underlying assets are valued based on quoted prices for similar assets with similar terms and other observable market data and have no redemption restrictions. The investments in the plan were monitored to ensure that they complied with the investment policies set forth in the plan document. The plan’s assets were reviewed periodically by management, which included an analysis of the asset allocation and the performance of the GDF prepared by Prudential Financial, Inc.
The overall investment objective of the ABRIP is to ensure safety of principal and seek an attractive rate of return. The GDF utilizes a full spectrum of fixed income asset classes to provide the opportunity to maximize portfolio returns and diversification. Such asset classes are as follows:
| • | Commercial Mortgage Loans |
| • | Residential Mortgage Securities |
| • | Public Asset Backed Securities |
| • | Commercial Mortgage-backed Securities |
| • | Private Securitized Investments |
F-58
KEARNY FINANCIAL CORP. AND SUBSIDIARIES
Notes to Consolidated Financial Statements
Note 14 – Benefit Plans (continued)
The fair values of the ABRIP’s assets at June 30, 2018 and 2017 by asset category (see Note 18 for the definitions of levels), are as follows:
| June 30, 2018 | |
| Quoted Prices in Active Markets for Identical Assets (Level 1) | | | Significant Other Observable Inputs (Level 2) | | | Significant Unobservable Inputs (Level 3) | | | Total | |
| (In Thousands) | | | | | |
Prudential Guaranteed Deposit Fund | $ | - | | | $ | 3,440 | | | $ | - | | | $ | 3,440 | |
| | | | | | | | | | | | | | | |
| June 30, 2017 | |
| Quoted Prices in Active Markets for Identical Assets (Level 1) | | | Significant Other Observable Inputs (Level 2) | | | Significant Unobservable Inputs (Level 3) | | | Total | |
| (In Thousands) | | | | | |
Prudential Guaranteed Deposit Fund | $ | - | | | $ | 3,692 | | | $ | - | | | $ | 3,692 | |
| | | | | | | | | | | | | | | |
F-59
KEARNY FINANCIAL CORP. AND SUBSIDIARIES
Notes to Consolidated Financial Statements
Note 14 – Benefit Plans (continued)
Benefit Equalization Plan (“BEP”)
The Bank has an unfunded non-qualified plan to compensate executive officers of the Bank who participate in the Bank’s qualified defined benefit plan for certain benefits lost under such plans by reason of benefit limitations imposed by Sections 415 and 401 of the IRC. There were approximately $233,000, $231,000 and $229,000 in contributions made to and benefits paid under the BEP during each of the years ended June 30, 2018, 2017 and 2016, respectively.
The following tables set forth the BEP’s funded status and components of net periodic benefit cost:
| | | June 30, | |
| | | | 2018 | | | | 2017 | |
| | | (In Thousands) | |
Change in benefit obligation: | | | | | | | | | |
Projected benefit obligation - beginning | | | $ | 3,223 | | | $ | 3,482 | |
Interest cost | | | | 124 | | | | 134 | |
Actuarial gain | | | | (61 | ) | | | (162 | ) |
Benefit payments | | | | (233 | ) | | | (231 | ) |
Projected benefit obligation - ending | | | $ | 3,053 | | | $ | 3,223 | |
| | | | | | | | | |
Change in plan assets: | | | | | | | | | |
Fair value of assets - beginning | | | $ | - | | | $ | - | |
Contributions | | | | 233 | | | | 231 | |
Benefit payments | | | | (233 | ) | | | (231 | ) |
Fair value of assets - ending | | | $ | - | | | $ | - | |
| | | | | | | | | |
Reconciliation of funded status: | | | | | | | | | |
Accumulated benefit obligation | | | $ | (3,053 | ) | | $ | (3,223 | ) |
| | | | | | | | | |
Projected benefit obligation | | | $ | (3,053 | ) | | $ | (3,223 | ) |
Fair value of assets | | | | - | | | | - | |
Funded status included in other liabilities | | | $ | (3,053 | ) | | $ | (3,223 | ) |
| | | | | | | | | |
Valuation assumptions | | | | | | | | | |
Discount rate | | | | 4.25 | % | | | 4.00 | % |
Salary increase rate | | | N/A | | | N/A | |
| Years Ended June 30, | |
| | 2018 | | | | 2017 | | | | 2016 | |
| (In Thousands) | |
Net periodic benefit cost: | | | | | | | | | | | |
Interest cost | $ | 124 | | | $ | 134 | | | $ | 155 | |
Amortization of net actuarial loss | | 48 | | | | 72 | | | | 58 | |
Total expense | $ | 172 | | | $ | 206 | | | $ | 213 | |
| | | | | | | | | | | |
Valuation assumptions | | | | | | | | | | | |
Discount rate | | 4.00 | % | | | 3.75 | % | | | 4.50 | % |
Salary increase rate | N/A | | | N/A | | | N/A | |
F-60
KEARNY FINANCIAL CORP. AND SUBSIDIARIES
Notes to Consolidated Financial Statements
Note 14 – Benefit Plans (continued)
It is estimated that contributions of approximately $232,000 will be made during the year ending June 30, 2019.
The following benefit payments, which reflect expected future service, as appropriate, are expected to be paid:
| Benefit Payments | |
| (In Thousands) | |
Years ending June 30: | | | |
2019 | $ | 232 | |
2020 | | 231 | |
2021 | | 230 | |
2022 | | 228 | |
2023 | | 226 | |
2024-2028 | | 1,080 | |
| | | |
In April 2007, the Board of Directors of the Bank approved, effective July 1, 2007, “freezing” all future benefit accruals under the BEP related to the Bank’s defined benefit pension plan.
At June 30, 2018 and 2017, unrecognized net loss of $868,000 and $977,000, respectively, was included in accumulated other comprehensive income. For the fiscal year ending June 30, 2019, $824,000 of unrecognized net loss is expected to be recognized as a component of net periodic benefit cost.
F-61
KEARNY FINANCIAL CORP. AND SUBSIDIARIES
Notes to Consolidated Financial Statements
Note 14 – Benefit Plans (continued)
Postretirement Welfare Plan
The Bank has an unfunded postretirement group term life insurance plan covering all eligible employees. The benefits are based on age and years of service. During the years ended June 30, 2018, 2017 and 2016, contributions and benefits paid totaled $7,000, $7,000 and $7,000, respectively.
The following tables set forth the accrued accumulated postretirement benefit obligation and the net periodic benefit cost:
| | | June 30, | |
| | | | 2018 | | | | 2017 | |
| | | (In Thousands) | |
Change in benefit obligation: | | | | | | | | | |
Projected benefit obligation - beginning | | | $ | 586 | | | $ | 837 | |
Service cost | | | | 48 | | | | 31 | |
Interest cost | | | | 23 | | | | 21 | |
Actuarial gain | | | | (33 | ) | | | (296 | ) |
Premiums/claims paid | | | | (7 | ) | | | (7 | ) |
Projected benefit obligation - ending | | | $ | 617 | | | $ | 586 | |
| | | | | | | | | |
Change in plan assets: | | | | | | | | | |
Fair value of assets - beginning | | | $ | - | | | $ | - | |
Contributions | | | | 7 | | | | 7 | |
Premiums/claims paid | | | | (7 | ) | | | (7 | ) |
Fair value of assets - ending | | | $ | - | | | $ | - | |
| | | | | | | | | |
Reconciliation of funded status: | | | | | | | | | |
Projected benefit obligation | | | $ | (617 | ) | | $ | (586 | ) |
Fair value of assets | | | | - | | | | - | |
Funded status included in other liabilities | | | $ | (617 | ) | | $ | (586 | ) |
| | | | | | | | | |
Valuation assumptions | | | | | | | | | |
Discount rate | | | | 4.25 | % | | | 4.00 | % |
Salary increase rate | | | | 3.25 | % | | | 3.25 | % |
| Years Ended June 30, | |
| | 2018 | | | | 2017 | | | | 2016 | |
| (In Thousands) | |
Net periodic benefit cost: | | | | | | | | | | | |
Service cost | $ | 48 | | | $ | 31 | | | $ | 42 | |
Interest cost | | 23 | | | | 21 | | | | 34 | |
Amortization of net actuarial gain | | (55 | ) | | | (59 | ) | | | (29 | ) |
Total expense (benefit) | $ | 16 | | | $ | (7 | ) | | $ | 47 | |
| | | | | | | | | | | |
Valuation assumptions | | | | | | | | | | | |
Discount rate | | 4.00 | % | | | 3.75 | % | | | 4.50 | % |
Salary increase rate | | 3.25 | % | | | 3.25 | % | | | 3.25 | % |
F-62
KEARNY FINANCIAL CORP. AND SUBSIDIARIES
Notes to Consolidated Financial Statements
Note 14 – Benefit Plans (continued)
It is estimated that contributions of approximately $25,000 will be made during the year ending June 30, 2019.
The following benefit payments, which reflect expected future service, as appropriate, are expected to be paid:
| Benefit Payments | |
| (In Thousands) | |
Years ending June 30: | | | |
2019 | $ | 25 | |
2020 | | 30 | |
2021 | | 32 | |
2022 | | 40 | |
2023 | | 47 | |
2024-2028 | | 286 | |
| | | |
At June 30, 2018 and 2017, unrecognized net gain of $536,000 and $558,000, respectively, were included in accumulated other comprehensive income. For the fiscal year ending June 30, 2019, $488,000 of unrecognized net gain is expected to be recognized as a component of net periodic benefit cost.
F-63
KEARNY FINANCIAL CORP. AND SUBSIDIARIES
Notes to Consolidated Financial Statements
Note 14 – Benefit Plans (continued)
Directors’ Consultation and Retirement Plan (“DCRP”)
The Bank has an unfunded retirement plan for non-employee directors. The benefits are payable based on term of service as a director. During each of the years ended June 30, 2018, 2017 and 2016, contributions and benefits paid totaled $60,000, $60,000 and $60,000, respectively.
The following table sets forth the DCRP’s funded status and components of net periodic cost:
| | | June 30, | |
| | | | 2018 | | | | 2017 | |
| | | (In Thousands) | |
Change in benefit obligation: | | | | | | | | | |
Projected benefit obligation - beginning | | | $ | 2,978 | | | $ | 3,029 | |
Interest cost | | | | 118 | | | | 116 | |
Actuarial gain | | | | (193 | ) | | | (107 | ) |
Benefit payments | | | | (60 | ) | | | (60 | ) |
Projected benefit obligation - ending | | | $ | 2,843 | | | $ | 2,978 | |
| | | | | | | | | |
Change in plan assets: | | | | | | | | | |
Fair value of assets - beginning | | | $ | - | | | $ | - | |
Contributions | | | | 60 | | | | 60 | |
Benefit payments | | | | (60 | ) | | | (60 | ) |
Fair value of assets - ending | | | $ | - | | | $ | - | |
| | | | | | | | | |
Reconciliation of funded status: | | | | | | | | | |
Accumulated benefit obligation | | | $ | (2,843 | ) | | $ | (2,978 | ) |
| | | | | | | | | |
Projected benefit obligation | | | $ | (2,843 | ) | | $ | (2,978 | ) |
Fair value of assets | | | | - | | | | - | |
Funded status included in other liabilities | | | $ | (2,843 | ) | | $ | (2,978 | ) |
| | | | | | | | | |
Valuation assumptions | | | | | | | | | |
Discount rate | | | | 4.25 | % | | | 4.00 | % |
Salary increase rate | | | N/A | | | N/A | |
F-64
KEARNY FINANCIAL CORP. AND SUBSIDIARIES
Notes to Consolidated Financial Statements
Note 14 – Benefit Plans (continued)
| Years Ended June 30, | |
| | 2018 | | | | 2017 | | | | 2016 | |
| (In Thousands) | |
Net periodic benefit cost: | | | | | | | | | | | |
Service cost | $ | - | | | $ | - | | | $ | 97 | |
Interest cost | | 118 | | | | 116 | | | | 151 | |
Amortization of past service liability | | - | | | | - | | | | 22 | |
Curtailment credit | | - | | | | - | | | | (931 | ) |
Total expense (benefit) | $ | 118 | | | $ | 116 | | | $ | (661 | ) |
| | | | | | | | | | | |
Valuation assumptions | | | | | | | | | | | |
Discount rate | | 4.00 | % | | | 3.75 | % | | | 4.50 | % |
Salary increase rate | N/A | | | N/A | | | N/A | |
It is estimated that contributions of approximately $83,000 will be made during the year ending June 30, 2019.
The following benefit payments, which reflect expected future service, as appropriate, are expected to be paid:
| Benefit Payments | |
| (In Thousands) | |
Years ending June 30: | | | |
2019 | $ | 83 | |
2020 | | 105 | |
2021 | | 67 | |
2022 | | 92 | |
2023 | | 143 | |
2024-2028 | | 1,008 | |
| | | |
In December 2015, the Board of Directors of the Bank approved “freezing” all future benefit accruals under the DCRP effective December 31, 2015.
At June 30, 2018 and 2017, unrecognized net gain of $355,000 and $162,000, respectively, was included in accumulated other comprehensive income. For the fiscal year ending June 30, 2019, $346,000 of unrecognized net gain is expected to be recognized as a component of net periodic benefit cost.
F-65
KEARNY FINANCIAL CORP. AND SUBSIDIARIES
Notes to Consolidated Financial Statements
Note 14 – Benefit Plans (continued)
Stock Compensation Plans
At the Company’s 2016 Annual Meeting of Stockholder’s held on October 27, 2016, the stockholders approved the Kearny Financial Corp. 2016 Equity Incentive Plan (“2016 Plan”) which provides for the grant of stock options and restricted stock awards. The 2016 Plan authorized up to 3,687,628 shares as stock option grants and 1,523,696 shares as restricted stock awards. On December 1, 2016, the Company granted directors and certain officers a total of 3,290,000 stock options and awarded 1,387,390 shares of restricted stock comprising 899,390 of service-based stock awards and 488,000 of performance-based stock awards.
At June 30, 2018, there were 517,628 shares remaining available for future stock option grants and 195,806 shares remaining available for future restricted stock awards under the 2016 Plan.
Stock options granted under the 2016 Plan vest in equal installments over a five-year service period. Stock options were granted at an exercise price equal to the fair value of the Company's common stock on the grant date based on the closing market price and have an expiration period of 10 years.
The fair value of stock options granted on December 1, 2016 of $2.98 per option was estimated utilizing the Black-Scholes option pricing model using the following assumptions:
Weighted average risk-free interest rate | | 2.16% | |
Expected dividend yield | | 0.75% | |
Weighted average volatility factor of the expected market price of the Company's stock | | 16.08% | |
Weighted average expected life of the options | | 6.5 years | |
The weighted average expected life of the stock option represents the period of time that stock options are expected to be outstanding and is estimated using historical data of stock option exercises and forfeitures. The risk-free interest rate is based on the U.S. Treasury yield curve in effect at the time of grant. The expected volatility is based on the historical market price volatility of the Company's stock. The expected dividend yield reflects the expected level of regular cash dividends declared and paid to shareholders, based on the Company's dividend payout ratio of approximately 50% of net income, in relation to the market price of the Company's capital stock at the time of grant. The Company recognizes compensation expense for the fair values of these awards, which have graded vesting, on a straight-line basis over the requisite service period of the awards.
The Company applied ASC 718 “Compensation- Stock Compensation," ("ASC 718") and began to expense the fair value of all share-based compensation granted over the requisite service periods.
There were no restricted stock awards granted during the year ended June 30, 2018. The Company awarded 1,387,390 shares of restricted stock during the year ended June 30, 2017. There were no restricted stock awards granted during the year ended June 30, 2016.
During the years ended June 30, 2018, 2017 and 2016, the Company recorded $6.3 million, $3.9 million and $411,000, respectively, of share-based compensation expense, comprised of stock option expense of $2.0 million, $1.3 million and $160,000, respectively, and restricted stock expense of $4.3 million, $2.6 million and $252,000, respectively.
During the years ended June 30, 2018, 2017 and 2016, the income tax benefit attributed to non-qualified stock options expense was approximately $520,000, $235,000 and -0-, respectively, and attributed to restricted stock expense was approximately $1.5 million, $1.1 million and $103,000, respectively.
F-66
KEARNY FINANCIAL CORP. AND SUBSIDIARIES
Notes to Consolidated Financial Statements
Note 14 – Benefit Plans (continued)
The following is a summary of the Company's stock option activity and related information for its option plans for the year ended June 30, 2018:
| Options | | | Weighted Average Exercise Price | | | Weighted Average Remaining Contractual Term | | | Aggregate Intrinsic Value | |
| (In Thousands) | | | | | | | | | | | (In Thousands) | |
Outstanding at June 30, 2017 | | 3,539 | | | $ | 14.98 | | | | 9.3 | years | | $ | 1,199 | |
Granted | | - | | | | - | | | | 0.0 | years | | | | |
Exercised | | (10 | ) | | | 10.71 | | | | 5.8 | years | | | | |
Forfeited | | (131 | ) | | | 14.96 | | | | | | | | | |
Outstanding at June 30, 2018 | | 3,398 | | | $ | 14.99 | | | | 8.2 | years | | $ | 795 | |
| | | | | | | | | | | | | | | |
Exercisable at June 30, 2018 | | 835 | | | $ | 14.19 | | | | 7.8 | years | | $ | 633 | |
The Company generally issues shares from authorized but unissued shares upon the exercise of vested options.
A total of 9,565 vested options, with an aggregate intrinsic value of $38,000, were exercised during the year ended June 30, 2018. In fulfillment of these exercises, the Company issued 9,565 shares from authorized but unissued shares. A total of 62,216 vested options, with an aggregate intrinsic value of $470,000, were exercised during the year ended June 30, 2017. There were no vested options exercised during the year ended June 30, 2016.
The cash proceeds from stock option exercises during the year ended June 30, 2018 totaled approximately $102,000. A portion of such exercises represented disqualifying dispositions of incentive stock options for which the Company recognized $13,000 in income tax benefit. The cash proceeds from stock option exercises during the year ended June 30, 2017 totaled approximately $482,000. A portion of such exercises represented disqualifying dispositions of incentive stock options for which the Company recognized $192,000 in income tax benefit. There were no exercises of stock options during the year ended June 30, 2016.
Expected future compensation expense relating to the 2,563,074 non-vested options outstanding as of June 30, 2018 is $6.5 million over a weighted average period of 3.4 years.
Restricted shares awarded under the 2016 Plan generally vest in equal installments over a five-year service period. In addition to the requisite service period, the vesting of certain restricted shares awarded to management are also conditioned upon the achievement of one or more objective performance factors established by the Compensation Committee of the Company's Board of Directors. In accordance with the terms of the 2016 Plan, such factors may be based on the performance of the Company as a whole or on any one or more business units of the Company or its subsidiaries. Performance factors may be measured relative to a peer group, an index or certain financial targets established in the Company's strategic business plan and budget.
The vesting of the applicable performance-based restricted shares over the second year of the five-year service period was conditioned upon the achievement of the Company's earning-based performance targets for the fiscal year ended June 30, 2018. Such performance targets were established by the Board of Directors in the Company's strategic business plan and budget for that period. The Company fully achieved the applicable performance targets for fiscal 2018 and therefore expects that all eligible performance-based restricted shares will successfully vest over the second year of the five-year service period. For the fiscal year ended June 30, 2017, the Company fully achieved the applicable performance targets and all eligible performance-based restricted shares successfully vested in the first year of the five-year service period.
The performance factors and underlying cost basis of the performance-based restricted shares that are scheduled to vest over each of the latter three years of the service period are generally expected to be determined annually concurrent with the anniversary date of the original grants.
F-67
KEARNY FINANCIAL CORP. AND SUBSIDIARIES
Notes to Consolidated Financial Statements
Note 14 – Benefit Plans (continued)
For service based awards management recognizes compensation expense for the fair value of restricted shares on a straight-line basis over the requisite service period. For performance vesting awards management recognizes compensation expense for the fair value of restricted shares on a straight-line basis over the requisite service period; however, if the corporate performance goals to which the vesting of such shares are tied are not achieved, recognized compensation expense is adjusted accordingly.
The following is a summary of the status of the Company's non-vested restricted share awards as of June 30, 2018 and changes during the year ended June 30, 2018:
| Vesting Contingent on Service Conditions | | | Vesting Contingent on Performance and Service Conditions | |
| Restricted Shares | | | Weighted Average Grant Date Fair Value | | | Restricted Shares | | | Weighted Average Grant Date Fair Value | |
| (In Thousands) | | | | | | | (In Thousands) | | | | | |
Non-vested at June 30, 2017 | | 930 | | | $ | 15.19 | | | | 488 | | | $ | 15.35 | |
Granted | | - | | | | - | | | | - | | | | - | |
Vested | | (201 | ) | | | 15.05 | | | | (98 | ) | | | 15.35 | |
Forfeited | | (28 | ) | | | 14.90 | | | | (34 | ) | | | 15.35 | |
Non-vested at June 30, 2018 | | 701 | | | $ | 15.24 | | | | 356 | | | $ | 15.35 | |
During the years ended June 30, 2018, 2017 and 2016, the total fair value of vested restricted shares were $4,354,754, $208,000 and $433,000, respectively. Expected future compensation expense relating to the 2,563,074 non-vested restricted shares at June 30, 2018 is $13.6 million over a weighted average period of 3.4 years.
F-68
KEARNY FINANCIAL CORP. AND SUBSIDIARIES
Notes to Consolidated Financial Statements
Note 15 – Stockholders’ Equity
Regulatory Capital
Federal banking regulators impose various restrictions or requirements on the ability of savings institutions to make capital distributions, including cash dividends. A savings institution that is a subsidiary of a savings and loan holding company, such as the Bank, must file an application or a notice with federal banking regulators at least 30 days before making a capital distribution. A savings institution must file an application for prior approval of a capital distribution if: (i) it is not eligible for expedited treatment under the applications processing rules of federal banking regulators; (ii) the total amount of all capital distributions, including the proposed capital distribution, for the applicable calendar year would exceed an amount equal to the savings institution’s net income for that year to date plus the institution’s retained net income for the preceding two years; (iii) it would not adequately be capitalized after the capital distribution; or (iv) the distribution would violate an agreement with federal banking regulators or applicable regulations. Federal banking regulators may disapprove a notice or deny an application for a capital distribution if: (i) the savings institution would be undercapitalized following the capital distribution; (ii) the proposed capital distribution raises safety and soundness concerns; or (iii) the capital distribution would violate a prohibition contained in any statute, regulation or agreement.
No capital distributions from the Bank to the Company were initiated during the fiscal years ended June 30, 2016, June 30, 2017 and June 30, 2018.
The Bank and consolidated Company are subject to various regulatory capital requirements administered by federal banking agencies. Failure to meet minimum capital requirements can initiate certain mandatory - and possibly additional discretionary – actions by regulators that, if undertaken, could have a direct material effect on the Company’s consolidated financial statements. Under capital adequacy guidelines and the regulatory framework for prompt corrective action, the Bank and consolidated Company must meet specific capital guidelines that involve quantitative measures of their respective assets, liabilities, and certain off-balance-sheet items as calculated under regulatory accounting practices. The Bank’s and consolidated Company’s capital amounts and classification are also subject to qualitative judgments by the regulators about components, risk weighting, and other factors.
The federal banking agencies have substantially amended the regulatory risk-based capital rules applicable to the Bank and consolidated Company. The amendments implemented the “Basel III” regulatory capital reforms and changes required by the Dodd-Frank Act. The new rules apply regulatory capital requirements to both the Bank and the consolidated Company. The amended rules included new minimum risk-based capital and leverage ratios, which became effective in January 2015, with certain requirements to be phased in beginning in 2016, and refined the definition of what constitutes “capital” for purposes of calculating those ratios.
The minimum capital level requirements applicable to both the Bank and the consolidated Company include: (i) a common equity Tier 1 capital ratio of 4.5%; (ii) a Tier 1 capital ratio of 6%; (iii) a total capital ratio of 8%; and (iv) a Tier 1 leverage ratio of 4% for all institutions. The previously amended rules also established a “capital conservation buffer” of 2.5% above the new regulatory minimum capital ratios, and when fully phased in, would result in the following minimum ratios: (i) a common equity Tier 1 capital ratio of 7.0%; (ii) a Tier 1 capital ratio of 8.5%; and (iii) a total capital ratio of 10.5%. The capital conservation buffer requirement began phasing in at January 1, 2016 at 0.625% of risk-weighted assets and will increase each calendar year until fully implemented in at 2.5% on January 1, 2019. The capital conservation buffer effective for calendar 2018 is 1.25%. An institution will be subject to limitations on paying dividends, engaging in share repurchases, and paying discretionary bonuses if its capital level falls below the buffer amount. These limitations will establish a maximum percentage of eligible retained income that could be utilized for such actions.
F-69
KEARNY FINANCIAL CORP. AND SUBSIDIARIES
Notes to Consolidated Financial Statements
Note 15 – Stockholders’ Equity (continued)
The following tables present information regarding the Bank’s regulatory capital levels at June 30, 2018 and 2017.
| At June 30, 2018 |
| Actual | | | For Capital Adequacy Purposes | | | To Be Well Capitalized Under Prompt Corrective Action Provisions |
| Amount | | | Ratio | | | Amount | | | Ratio | | | Amount | | | Ratio |
| (Dollars in Thousands) |
Total capital (to risk-weighted assets) | $ | 987,251 | | | | 24.07 | | % | $ | 328,174 | | | | 8.00 | | % | $ | 410,217 | | | | 10.00 | | % |
Tier 1 capital (to risk-weighted assets) | | 956,386 | | | | 23.31 | | % | | 246,130 | | | | 6.00 | | % | | 328,174 | | | | 8.00 | | % |
Common equity tier 1 capital (to risk-weighted assets) | | 956,386 | | | | 23.31 | | % | | 184,598 | | | | 4.50 | | % | | 266,641 | | | | 6.50 | | % |
Tier 1 capital (to adjusted total assets) | | 956,386 | | | | 15.10 | | % | | 253,300 | | | | 4.00 | | % | | 316,625 | | | | 5.00 | | % |
| At June 30, 2017 |
| Actual | | | For Capital Adequacy Purposes | | | To Be Well Capitalized Under Prompt Corrective Action Provisions |
| Amount | | | Ratio | | | Amount | | | Ratio | | | Amount | | | Ratio |
| (Dollars in Thousands) |
Total capital (to risk-weighted assets) | $ | 753,790 | | | | 23.30 | | % | $ | 258,809 | | | | 8.00 | | % | $ | 323,512 | | | | 10.00 | | % |
Tier 1 capital (to risk-weighted assets) | | 724,504 | | | | 22.39 | | % | | 194,107 | | | | 6.00 | | % | | 258,809 | | | | 8.00 | | % |
Common equity tier 1 capital (to risk-weighted assets) | | 724,504 | | | | 22.39 | | % | | 145,580 | | | | 4.50 | | % | | 210,283 | | | | 6.50 | | % |
Tier 1 capital (to adjusted total assets) | | 724,504 | | | | 15.47 | | % | | 187,308 | | | | 4.00 | | % | | 234,136 | | | | 5.00 | | % |
The following table presents information regarding the consolidated Company’s regulatory capital levels at June 30, 2018 and June 30, 2017.
| At June 30, 2018 |
| Actual | | | For Capital Adequacy Purposes |
| Amount | | | Ratio | | | Amount | | | Ratio |
| (Dollars in Thousands) |
Total capital (to risk-weighted assets) | $ | 1,062,398 | | | | 25.80 | | % | $ | 329,409 | | | | 8.00 | | % |
Tier 1 capital (to risk-weighted assets) | | 1,031,533 | | | | 25.05 | | % | | 247,057 | | | | 6.00 | | % |
Common equity tier 1 capital (to risk-weighted assets) | | 1,031,533 | | | | 25.05 | | % | | 185,293 | | | | 4.50 | | % |
Tier 1 capital (to adjusted total assets) | | 1,031,533 | | | | 16.24 | | % | | 254,015 | | | | 4.00 | | % |
| At June 30, 2017 |
| Actual | | | For Capital Adequacy Purposes |
| Amount | | | Ratio | | | Amount | | | Ratio |
| (Dollars in Thousands) |
Total capital (to risk-weighted assets) | $ | 974,545 | | | | 29.98 | | % | $ | 260,065 | | | | 8.00 | | % |
Tier 1 capital (to risk-weighted assets) | | 945,259 | | | | 29.08 | | % | | 195,049 | | | | 6.00 | | % |
Common equity tier 1 capital (to risk-weighted assets) | | 945,259 | | | | 29.08 | | % | | 146,287 | | | | 4.50 | | % |
Tier 1 capital (to adjusted total assets) | | 945,259 | | | | 20.11 | | % | | 188,012 | | | | 4.00 | | % |
F-70
KEARNY FINANCIAL CORP. AND SUBSIDIARIES
Notes to Consolidated Financial Statements
Note 15 – Stockholders’ Equity (continued)
Based upon most recent notification from federal banking regulators dated July 16, 2018 the Bank was categorized as well capitalized as of September 30, 2017, under the regulatory framework for prompt corrective action. There are no conditions existing or events which have occurred since notification that management believes have changed the Bank’s category.
Stock Repurchase Plans
During the year ended June 30, 2018, the company repurchased 10,014,544 shares of its capital stock. Of these shares repurchased, 7,319,084 shares were acquired and cancelled in conjunction with the Company’s second repurchase plan announced in May 2017 through which it originally authorized the repurchase of 8,559,084 shares, or 10% of the Company’s outstanding shares. Coupled with the 1,240,000 shares previously repurchased during the fiscal year ended June 30, 2017, the shares associated with the second program were repurchased at a total cost of $122.0 million and at an average cost of $14.25 per share.
The remaining 2,695,460 shares repurchased during fiscal 2018 were acquired and cancelled in conjunction with the Company’s third share repurchase program announced in April 2018 through which it authorized the repurchase of 10,238,557 shares, or 10% of the Company’s outstanding shares. Such shares were repurchased at a total cost of $38.4 million and at an average cost of $14.23 per share.
During the year ended June 30, 2017, the Company repurchased 8,886,627 shares of its capital stock. Of these shares repurchased, 7,646,627 shares were acquired and cancelled in conjunction with the Company’s first share repurchase plan announced in May 2016 through which it originally authorized the repurchase of 9,352,809 shares, or 10%, of the Company’s outstanding shares. Coupled with the 1,706,182 shares previously repurchased during the fiscal year ended June 30, 2016, the shares associated with this first program were repurchased at a total cost of $130.6 million and at an average cost of $13.96 per share.
The remaining 1,240,000 shares repurchased during fiscal 2017 were acquired and cancelled in conjunction with the Company’s second share repurchase program announced in May 2017 through which it authorized the repurchase of 8,559,084 shares, or 10%, of the Company’s outstanding shares. Such shares were repurchased at a total cost of $17.7 million and at an average cost of $14.30 per share.
F-71
KEARNY FINANCIAL CORP. AND SUBSIDIARIES
Notes to Consolidated Financial Statements
Note 16 – Income Taxes
Retained earnings at June 30, 2018, includes approximately $36.9 million of bad debt allowance, pursuant to the IRC, for which income taxes have not been provided. If such amount is used for purposes other than to absorb bad debts, including distributions in liquidation, it will be subject to income tax at the then current rate.
The components of income taxes are as follows:
| Years Ended June 30, | |
| | 2018 | | | | 2017 | | | | 2016 | |
| (In Thousands) | |
Current income tax expense: | | | | | | | | | | | |
Federal | $ | 5,121 | | | $ | 7,790 | | | $ | 6,440 | |
State | | 2,516 | | | | 2,873 | | | | 1,921 | |
| | 7,637 | | | | 10,663 | | | | 8,361 | |
Deferred income tax benefit: | | | | | | | | | | | |
Federal | | 5,455 | | | | (1,363 | ) | | | (1,238 | ) |
State | | 656 | | | | (480 | ) | | | (340 | ) |
| | 6,111 | | | | (1,843 | ) | | | (1,578 | ) |
Valuation allowance | | 656 | | | | - | | | | - | |
| | | | | | | | | | | |
Total income tax expense | $ | 14,404 | | | $ | 8,820 | | | $ | 6,783 | |
The following table presents a reconciliation between the reported income taxes for the periods presented and the income taxes which would be computed by applying the federal income tax rates applicable to those periods. The income tax rate of 28%, applicable for the year ended June 30, 2018, reflects the transitional effect of a reduction in the Company’s federal income tax rate from 35%, applicable to the prior years ended June 30, 2017 and 2016, to 21%, applicable to the forthcoming year ending June 30, 2019.
| Years Ended June 30, | |
| | 2018 | | | | 2017 | | | | 2016 | |
| (Dollars In Thousands) | |
Income before income taxes | $ | 34,000 | | | $ | 27,423 | | | $ | 22,605 | |
Statutory federal tax rate | | 28 | % | | | 35 | % | | | 35 | % |
Federal income tax expense at statutory rate | $ | 9,520 | | | $ | 9,598 | | | $ | 7,912 | |
(Reduction) increases in income taxes resulting from: | | | | | | | | | | | |
Tax exempt interest | | (724 | ) | | | (795 | ) | | | (756 | ) |
State tax, net of federal tax effect | | 2,256 | | | | 1,555 | | | | 1,028 | |
Incentive stock options compensation expense | | 142 | | | | 124 | | | | 56 | |
Income from bank-owned life insurance | | (1,439 | ) | | | (1,798 | ) | | | (1,956 | ) |
Disqualifying disposition on incentive stock options | | (11 | ) | | | (165 | ) | | | - | |
Non-deductible merger-related expenses | | 557 | | | | - | | | | - | |
Impact of federal income tax reform | | 2,924 | | | | - | | | | - | |
Other items, net | | 523 | | | | 301 | | | | 499 | |
| | 13,748 | | | | 8,820 | | | | 6,783 | |
Valuation allowance | | 656 | | | | - | | | | - | |
| | | | | | | | | | | |
Total income tax expense | $ | 14,404 | | | $ | 8,820 | | | $ | 6,783 | |
Effective income tax rate | | 42.36 | % | | | 32.16 | % | | | 30.01 | % |
The effective income tax rate represents total income tax expense divided by income before income taxes.
F-72
KEARNY FINANCIAL CORP. AND SUBSIDIARIES
Notes to Consolidated Financial Statements
Note 16 – Income Taxes (continued)
The Company maintained a valuation allowance during the years ended June 30, 2018 and 2017 against a portion of the deferred tax asset arising from the carryover associated with its charitable contribution to the KearnyBank Foundation made in conjunction with the Company’s second step conversion and stock offering. The valuation allowance is attributable to a portion of the New Jersey state charitable contribution carryover which has been deemed more likely than not to not be realizable due to a difference in the taxable net income basis between the Company’s tax filing entities at the federal and state levels.
The tax effects of existing temporary differences that give rise to deferred income tax assets and liabilities are as follows:
| | | June 30, | |
| | | | 2018 | | | | 2017 | |
| | | (In Thousands) | |
Deferred income tax assets: | | | | | | | | | |
Purchase accounting | | | $ | 17,772 | | | $ | 466 | |
Accumulated other comprehensive income | | | | | | | | | |
Defined benefit plans | | | | 228 | | | | 434 | |
Unrealized loss on securities available for sale | | | | 1,159 | | | | 975 | |
Unrealized loss on securities available for sale transferred to held to maturity | | | | 249 | | | | 453 | |
Allowance for loan losses | | | | 8,676 | | | | 11,963 | |
Benefit plans | | | | 1,842 | | | | 2,675 | |
Compensation | | | | 1,751 | | | | 1,146 | |
Stock-based compensation | | | | 2,050 | | | | 2,278 | |
Uncollected interest | | | | 1,018 | | | | 2,700 | |
Depreciation | | | | 1,169 | | | | 1,221 | |
Charitable contribution carryover | | | | 899 | | | | 2,139 | |
Net operating loss carryover | | | | 2,564 | | | | 384 | |
Other items | | | | 509 | | | | 258 | |
| | | | 39,886 | | | | 27,092 | |
Valuation allowance | | | | (791 | ) | | | (135 | ) |
| | | | 39,095 | | | | 26,957 | |
Deferred income tax liabilities: | | | | | | | | | |
Deferred costs | | | | 1,551 | | | | 2,083 | |
Accumulated other comprehensive income | | | | | | | | | |
Derivatives | | | | 8,961 | | | | 2,582 | |
Goodwill | | | | 4,385 | | | | 6,167 | |
Other items | | | | 444 | | | | 671 | |
| | | | 15,341 | | | | 11,503 | |
Net deferred income tax asset | | | $ | 23,754 | | | $ | 15,454 | |
F-73
KEARNY FINANCIAL CORP. AND SUBSIDIARIES
Notes to Consolidated Financial Statements
Note 17 – Commitments
The Bank has non-cancelable operating leases for branch offices. The following is a schedule by years of future minimum rental payments required under operating leases that have initial or remaining non-cancelable lease terms in excess of one year as of June 30, 2018:
| Operating Lease Payments | |
| (In Thousands) | |
Years ending June 30: | | | |
2019 | | 2,985 | |
2020 | | 2,749 | |
2021 | | 2,593 | |
2022 | | 2,342 | |
2023 | | 1,868 | |
Thereafter | | 9,893 | |
Total minimum payments required | $ | 22,430 | |
The following schedule shows the composition of total rental expense for all operating leases:
| June 30, | |
| | 2018 | | | | 2017 | | | | 2016 | |
| (In Thousands) | |
Minimum rentals | $ | 2,397 | | | $ | 1,989 | | | $ | 1,843 | |
The Bank is a party to financial instruments with off-balance-sheet risk in the normal course of business to meet the financing needs of its customers. These financial instruments include commitments to extend credit. The Bank's exposure to credit loss in the event of nonperformance by the other party to the financial instrument for commitments to extend credit is represented by the contractual notional amount of those instruments. The Bank uses the same credit policies in making commitments and conditional obligations as it does for on-balance-sheet instruments.
The outstanding loan commitments are as follows:
| | | June 30, | |
| | | | 2018 | | | | 2017 | |
| | | (In Thousands) | |
Loan commitments: | | | | | | | | | |
Real estate mortgage loans | | | $ | 139,440 | | | $ | 87,666 | |
Home equity loans | | | | 1,723 | | | | 2,768 | |
Commercial business loans | | | | 1,582 | | | | 4,737 | |
Construction loans in process | | | | 9,935 | | | | 8,088 | |
Consumer home equity and overdraft lines of credit | | | | 42,674 | | | | 33,408 | |
Commercial business lines of credit | | | | 28,898 | | | | 27,264 | |
Total loan commitments | | | $ | 224,252 | | | $ | 163,931 | |
In addition to the loan commitments noted above, at June 30, 2018, the Company’s pipeline of loans held for sale included $10.8 million of “in-process” loans whose terms included interest rate locks to borrowers that were paired with a “non-binding” best-efforts commitment to sell the loan to a buyer at a fixed price within a predetermined timeframe after the sale commitment is established. The Company’s pipeline of loans held for sale are considered free-standing derivative instruments whose fair values are not considered to be material for financial statement reporting purposes.
F-74
KEARNY FINANCIAL CORP. AND SUBSIDIARIES
Notes to Consolidated Financial Statements
Note 17 – Commitments (continued)
At June 30, 2018, the outstanding mortgage loan commitments included $24.2 million for fixed-rate loans with interest rates ranging from 3.45% to 4.625% and $115.3 million for adjustable-rate loans with initial rates ranging from 3.25% to 5.75%. Home equity loan commitments include $726,000 for fixed-rate loans with interest rates ranging from 3.50% to 4.375% and $1.0 million for adjustable-rate loans with initial rates ranging from 4.25% to 6.00%. Business loan commitments total $1.6 million representing funding commitments on fixed rate loans with initial rates of 5.25% to 5.50%. Undisbursed funds from home equity lines of credit are adjustable-rate loans with interest rates ranging from 1.25% below to 1.25% above the prime rate published in the Wall Street Journal (“prime rate”) or fixed rate loans with interest rates ranging from 4.00% to 8.00%. Undisbursed funds from business lines of credit are adjustable-rate loans with interest rates ranging from 0.25% below to 5.00% above the prime rate or 1.00% to 4.50% above the 1 month London Inter-bank Offered Rate (“LIBOR”). Lines of credit providing overdraft protection for checking accounts are either adjustable-rate loans with interest rates ranging from 3.50% to 4.00% above the prime rate or fixed rate loans with interest rates ranging from 5.00% to 18.00%.
At June 30, 2017, the outstanding mortgage loan commitments included $17.8 million for fixed-rate loans with interest rates ranging from 3.975% to 4.125% and $69.9 million for adjustable-rate loans with initial rates ranging from 2.875% to 4.75%. Home equity loan commitments include $1.6 million for fixed-rate loans with interest rates ranging from 3.50% to 4.375% and $1.2 million for adjustable-rate loans with initial rates ranging from 3.50% to 6.00%. Business loan commitments total $4.7 million representing funding commitments on fixed rate loans with initial rates of 4.125% to 6.750%. Undisbursed funds from home equity and business lines of credit are adjustable-rate loans with interest rates ranging from 1.00% below to 5.25% above the prime rate. Lines of credit providing overdraft protection for checking accounts are either adjustable-rate loans with interest rates ranging from 3.50% to 4.00% above the prime rate or fixed rate loans with interest rates ranging from 5.00% to 18.00%.
Commitments to extend credit are agreements to lend to a customer as long as there is no violation of any condition established in the contract. Commitments generally have fixed expiration dates or other termination clauses and may require payment of a fee. Since many of the commitments are expected to expire without being drawn upon, the total commitment amounts do not necessarily represent future cash requirements. The Bank evaluates each customer’s creditworthiness on a case-by-case basis. The amount of collateral obtained if deemed necessary by the Bank upon extension of credit is based on management’s credit evaluation of the counterparty.
In addition to the commitments noted above, the Bank is party to standby letters of credit through which it guarantees certain specific business obligations of its commercial customers. The balance of standby letters of credit at June 30, 2018 and 2017 were approximately $912,000 and $715,000, respectively.
The Company and subsidiaries are also party to litigation which arises primarily in the ordinary course of business. In the opinion of management, the ultimate disposition of such litigation should not have a material adverse effect on the consolidated financial position of the Company.
F-75
KEARNY FINANCIAL CORP. AND SUBSIDIARIES
Notes to Consolidated Financial Statements
Note 18 – Fair Value of Financial Instruments
The guidance on fair value measurement establishes a hierarchy that prioritizes the inputs to valuation techniques used to measure fair value. The hierarchy describes three levels of inputs that may be used to measure fair value:
| Level 1: | Quoted prices in active markets for identical assets or liabilities. |
| | |
| Level 2: | Observable inputs other than Level 1 prices, such as quoted for similar assets or liabilities; quoted prices in markets that are not active; or inputs that are observable or can be corroborated by observable market data for substantially the full term of the assets or liabilities. |
| | |
| Level 3: | Unobservable inputs that are supported by little or no market activity and that are significant to the fair value of the assets or liabilities. Level 3 assets and liabilities include financial instruments whose value is determined using pricing models, discounted cash flow methodologies, or similar techniques, as well as instruments for which the determination of fair value requires significant management judgment or estimation. |
In addition, the guidance requires the Company to disclose the fair value for assets and liabilities on both a recurring and non-recurring basis.
Those assets and liabilities measured at fair value on a recurring basis are summarized below:
| June 30, 2018 | |
| Quoted Prices in Active Markets for Identical Assets (Level 1) | | | Significant Other Observable Inputs (Level 2) | | | Significant Unobservable Inputs (Level 3) | | | Total | |
| (In Thousands) | |
Assets: | | | | | | | | | | | | | | | |
Debt securities available for sale: | | | | | | | | | | | | | | | |
U.S. agency securities | $ | - | | | $ | 4,411 | | | $ | - | | | $ | 4,411 | |
Obligations of state and political subdivisions | | - | | | | 26,088 | | | | - | | | | 26,088 | |
Asset-backed securities | | - | | | | 182,620 | | | | - | | | | 182,620 | |
Collateralized loan obligations | | - | | | | 226,066 | | | | - | | | | 226,066 | |
Corporate bonds | | - | | | | 147,594 | | | | - | | | | 147,594 | |
Trust preferred securities | | - | | | | 2,783 | | | | 1,000 | | | | 3,783 | |
Total debt securities | | - | | | | 589,562 | | | | 1,000 | | | | 590,562 | |
| | | | | | | | | | | | | | | |
Mortgage-backed securities available for sale: | | | | | | | | | | | | | | | |
Collateralized mortgage obligations | | - | | | | 24,292 | | | | - | | | | 24,292 | |
Residential pass-through securities | | - | | | | 102,359 | | | | - | | | | 102,359 | |
Commercial pass-through securities | | - | | | | 7,872 | | | | - | | | | 7,872 | |
Total mortgage-backed securities | | - | | | | 134,523 | | | | - | | | | 134,523 | |
Total securities available for sale | $ | - | | | $ | 724,085 | | | $ | 1,000 | | | $ | 725,085 | |
Interest rate swaps and caps | | - | | | | 31,881 | | | | - | | | | 31,881 | |
| | | | | | | | | | | | | | | |
Total assets | $ | - | | | $ | 755,966 | | | $ | 1,000 | | | $ | 756,966 | |
| | | | | | | | | | | | | | | |
Liabilities: | | | | | | | | | | | | | | | |
Interest rate swaps | $ | - | | | $ | - | | | $ | - | | | $ | - | |
Total liabilities | $ | - | | | $ | - | | | $ | - | | | $ | - | |
F-76
KEARNY FINANCIAL CORP. AND SUBSIDIARIES
Notes to Consolidated Financial Statements
Note 18 – Fair Value of Financial Instruments (continued)
| June 30, 2017 | |
| Quoted Prices in Active Markets for Identical Assets (Level 1) | | | Significant Other Observable Inputs (Level 2) | | | Significant Unobservable Inputs (Level 3) | | | Total | |
| (In Thousands) | |
Assets: | | | | | | | | | | | | | | | |
Debt securities available for sale: | | | | | | | | | | | | | | | |
U.S. agency securities | $ | - | | | $ | 5,316 | | | $ | - | | | $ | 5,316 | |
Obligations of state and political subdivisions | | - | | | | 27,740 | | | | - | | | | 27,740 | |
Asset-backed securities | | - | | | | 162,429 | | | | - | | | | 162,429 | |
Collateralized loan obligations | | - | | | | 98,154 | | | | - | | | | 98,154 | |
Corporate bonds | | - | | | | 142,318 | | | | - | | | | 142,318 | |
Trust preferred securities | | - | | | | 7,540 | | | | 1,000 | | | | 8,540 | |
Total debt securities | | - | | | | 443,497 | | | | 1,000 | | | | 444,497 | |
| | | | | | | | | | | | | | | |
Mortgage-backed securities available for sale: | | | | | | | | | | | | | | | |
Collateralized mortgage obligations | | - | | | | 30,536 | | | | - | | | | 30,536 | |
Residential pass-through securities | | - | | | | 130,550 | | | | - | | | | 130,550 | |
Commercial pass-through securities | | - | | | | 8,177 | | | | - | | | | 8,177 | |
Total mortgage-backed securities | | - | | | | 169,263 | | | | - | | | | 169,263 | |
Total securities available for sale | | - | | | | 612,760 | | | | 1,000 | | | | 613,760 | |
Interest rate swaps and caps | | - | | | | 7,810 | | | | - | | | | 7,810 | |
| | | | | | | | | | | | | | | |
Total assets | $ | - | | | $ | 620,570 | | | $ | 1,000 | | | $ | 621,570 | |
| | | | | | | | | | | | | | | |
Liabilities: | | | | | | | | | | | | | | | |
Interest rate swaps | $ | - | | | $ | 298 | | | $ | - | | | $ | 298 | |
Total liabilities | $ | - | | | $ | 298 | | | $ | - | | | $ | 298 | |
The fair values of securities available for sale (carried at fair value) or held to maturity (carried at amortized cost) are primarily determined by obtaining matrix pricing, which is a mathematical technique widely used in the industry to value debt securities without relying exclusively on quoted prices for the specific securities but rather by relying on the securities’ relationship to other benchmark quoted securities (Level 2 inputs).
The Company held one trust preferred security whose fair value of $1.0 million for the periods ended June 30, 2018 and June 30, 2017 was determined using Level 3 inputs. For those periods, management has been unable to obtain a market quote for this security. Consequently, the security’s fair value as reported at June 30, 2018 and June 30, 2017, is based upon the present value of expected future cash flows assuming the security continues to meet all of its payment obligations and utilizing a discount rate based upon the security’s contractual interest rate.
The Company has contracted with a third party vendor to provide periodic valuations for its interest rate derivatives to determine the fair value of its interest rate caps and swaps. The vendor utilizes standard valuation methodologies applicable to interest rate derivatives such as discounted cash flow analysis and extensions of the Black-Scholes model. Such valuations are based upon readily observable market data and are therefore considered Level 2 valuations by the Company.
In addition to the financial instruments noted above, at June 30, 2018 and June 30, 2017, the Company’s pipeline of loans held for sale included $10.8 million and $18.4 million, respectively, of “in process” loans whose terms included interest rate locks to borrowers which are considered free-standing derivative instruments whose fair values are not material to our financial condition or results of operations. Given the short-term nature of the commitments and their immateriality to the statements of condition and operations, the Company assumes no change in the fair value of these derivative instruments during their outstanding period.
F-77
KEARNY FINANCIAL CORP. AND SUBSIDIARIES
Notes to Consolidated Financial Statements
Note 18 – Fair Value of Financial Instruments (continued)
Those assets and liabilities measured at fair value on a non-recurring basis are summarized below:
| June 30, 2018 | |
| Quoted Prices in Active Markets for Identical Assets (Level 1) | | | Significant Other Observable Inputs (Level 2) | | | Significant Unobservable Inputs (Level 3) | | | Total | |
| (In Thousands) | |
Impaired loans: | | | | | | | | | | | | | | | |
Residential mortgage | $ | - | | | $ | - | | | $ | 3,562 | | | $ | 3,562 | |
Non-residential mortgage | | - | | | | - | | | | 794 | | | | 794 | |
Commercial business | | - | | | | - | | | | 113 | | | | 113 | |
Total | $ | - | | | $ | - | | | $ | 4,469 | | | $ | 4,469 | |
| | | | | | | | | | | | | | | |
| June 30, 2017 | |
| Quoted Prices in Active Markets for Identical Assets (Level 1) | | | Significant Other Observable Inputs (Level 2) | | | Significant Unobservable Inputs (Level 3) | | | Total | |
| (In Thousands) | |
Impaired loans: | | | | | | | | | | | | | | | |
Residential mortgage | $ | - | | | $ | - | | | $ | 5,711 | | | $ | 5,711 | |
Non-residential mortgage | | - | | | | - | | | | 2,126 | | | | 2,126 | |
Commercial business | | - | | | | - | | | | 119 | | | | 119 | |
Total | $ | - | | | $ | - | | | $ | 7,956 | | | $ | 7,956 | |
| | | | | | | | | | | | | | | |
The following table presents additional quantitative information about assets measured at fair value on a non-recurring basis and for which the Company has utilized adjusted Level 3 inputs to determine fair value:
| June 30, 2018 | |
| Fair Value | | | Valuation Techniques | | Unobservable Input | | Range | | Weighted Average | |
| (In Thousands) | | | | | | | | | | | |
Impaired loans: | | | | | | | | | | | | | |
Residential mortgage | $ | 3,562 | | | Market valuation of underlying collateral | (1) | Adjustments to reflect current conditions/selling costs | (2) | 6% - 26% | | | 12.34 | % |
Non-residential mortgage | | 794 | | | Market valuation of underlying collateral | (1) | Adjustments to reflect current conditions/selling costs | (2) | 14% - 15% | | | 14.07 | % |
Commercial business | | 113 | | | Market valuation of underlying collateral | (1) | Adjustments to reflect current conditions/selling costs | (2) | 10% - 24% | | | 14.54 | % |
Total | $ | 4,469 | | | | | | | | | | | |
F-78
KEARNY FINANCIAL CORP. AND SUBSIDIARIES
Notes to Consolidated Financial Statements
Note 18 – Fair Value of Financial Instruments (continued)
| June 30, 2017 | |
| Fair Value | | | Valuation Techniques | | Unobservable Input | | Range | | Weighted Average | |
| (In Thousands) | | | | | | | | | | | |
Impaired loans: | | | | | | | | | | | | | |
Residential mortgage | $ | 5,711 | | | Market valuation of underlying collateral | (1) | Adjustments to reflect current conditions/selling costs | (2) | 6% - 21% | | | 8.12 | % |
Non-residential mortgage | | 2,126 | | | Market valuation of underlying collateral | (1) | Adjustments to reflect current conditions/selling costs | (2) | 0% - 12% | | | 6.93 | % |
Commercial business | | 119 | | | Market valuation of underlying collateral | (1) | Adjustments to reflect current conditions/selling costs | (2) | 9% - 20% | | | 12.79 | % |
Total | $ | 7,956 | | | | | | | | | | | |
(1) | The fair value basis of impaired loans is generally determined based on an independent appraisal of the market value of a loan’s underlying collateral. |
(2) | The fair value basis of impaired loans is adjusted to reflect management estimates of selling costs including, but not necessarily limited to, real estate brokerage commissions and title transfer fees. |
An impaired loan is evaluated and valued at the time the loan is identified as impaired at the lower of cost or market value. Loans for which it is probable that payment of interest and principal will not be made in accordance with the contractual terms of the loan agreement are considered impaired. Market value is measured based on the value of the collateral securing the loan and is classified at a Level 3 in the fair value hierarchy. Once a loan is identified as individually impaired, management measures impairment in accordance with the FASB’s guidance on accounting by creditors for impairment of a loan with the fair value estimated using the market value of the collateral reduced by estimated disposal costs. Those impaired loans not requiring an allowance represent loans for which the fair value of the expected repayments or collateral exceeds the recorded investments in such loans. Impaired loans are reviewed and evaluated on at least a quarterly basis for additional impairment and adjusted accordingly.
At June 30, 2018, impaired loans valued using Level 3 inputs comprised loans with principal balances totaling $4.8 million and valuation allowances of $306,000 reflecting fair values of $4.5 million. By comparison, at June 30, 2017, impaired loans valued using Level 3 inputs comprised loans with principal balances totaling $8.2 million and valuation allowances of $199,000 reflecting fair values of $8.0 million.
Once a loan is foreclosed, the fair value of the real estate owned continues to be evaluated based upon the market value of the repossessed real estate originally securing the loan. At June 30, 2018 and June 30 2017, the Company held no real estate owned whose carrying value was written down utilizing Level 3 inputs.
F-79
KEARNY FINANCIAL CORP. AND SUBSIDIARIES
Notes to Consolidated Financial Statements
Note 18 – Fair Value of Financial Instruments (continued)
The following methods and assumptions were used to estimate the fair value of each class of financial instruments at June 30, 2018 and June 30, 2017:
Cash and Cash Equivalents, Interest Receivable and Interest Payable. The carrying amounts for cash and cash equivalents, interest receivable and interest payable approximate fair value because they mature in three months or less.
Securities. See the discussion presented above concerning assets measured at fair value on a recurring basis.
Loans Receivable. Except for certain impaired loans as previously discussed, the fair value of loans receivable is estimated by discounting the future cash flows, using the current rates at which similar loans would be made to borrowers with similar credit ratings and for the same remaining maturities, of such loans.
FHLB of New York Stock. Due to restrictions placed on transferability, it is not practical to determine the fair value of these securities.
Deposits. The fair value of demand, savings and club accounts is equal to the amount payable on demand at the reporting date. The fair value of certificates of deposit is estimated using rates currently offered for deposits of similar remaining maturities. The fair value estimates do not include the benefit that results from the low-cost funding provided by deposit liabilities compared to the cost of borrowing funds in the market.
Advances from FHLB. Fair value is estimated using rates currently offered for advances of similar remaining maturities.
Interest Rate Derivatives. See the discussion presented above concerning assets measured at fair value on a recurring basis.
Commitments. The fair value of commitments to fund credit lines and originate or participate in loans held in portfolio or loans held for sale is estimated using fees currently charged to enter into similar agreements taking into account the remaining terms of the agreements and the present creditworthiness of the counterparties. For fixed rate loan commitments, including those relating to loans held for sale that are considered derivative instruments for financial statement reporting purposes, the fair value also considers the difference between current levels of interest and the committed rates. The carrying value, represented by the net deferred fee arising from the unrecognized commitment, and the fair value, determined by discounting the remaining contractual fee over the term of the commitment using fees currently charged to enter into similar agreements with similar credit risk, is not considered material for disclosure. The contractual amounts of unfunded commitments are presented in Note 17.
F-80
KEARNY FINANCIAL CORP. AND SUBSIDIARIES
Notes to Consolidated Financial Statements
Note 18 – Fair Value of Financial Instruments (continued)
The carrying amounts and fair values of financial instruments not measured on a recurring basis are as follows:
| June 30, 2018 | |
| Carrying Amount | | | Fair Value | | | Quoted Prices in Active Markets for Identical Assets (Level 1) | | | Significant Other Observable Inputs (Level 2) | | | Significant Unobservable Inputs (Level 3) | |
| (In Thousands) | |
Financial assets: | | | | | | | | | | | | | | | | | | | |
Cash and cash equivalents | $ | 128,864 | | | $ | 128,864 | | | $ | 128,864 | | | $ | - | | | $ | - | |
Investment securities held to maturity | | 589,730 | | | | 579,499 | | | | - | | | | 579,499 | | | | - | |
Loans held-for-sale | | 863 | | | | 863 | | | | - | | | | 863 | | | | - | |
Net loans receivable | | 4,470,483 | | | | 4,367,150 | | | | - | | | | - | | | | 4,367,150 | |
FHLB Stock | | 59,004 | | | | - | | | | - | | | | - | | | | - | |
Interest receivable | | 18,510 | | | | 18,510 | | | | 32 | | | | 5,252 | | | | 13,226 | |
| | | | | | | | | | | | | | | | | | | |
Financial liabilities: | | | | | | | | | | | | | | | | | | | |
Deposits | | 4,073,604 | | | | 4,055,543 | | | | 2,056,966 | | | | - | | | | 1,998,577 | |
Borrowings | | 1,198,646 | | | | 1,199,601 | | | | - | | | | - | | | | 1,199,601 | |
Interest payable on deposits | | 675 | | | | 675 | | | | - | | | | 675 | | | | - | |
Interest payable on borrowings | | 2,427 | | | | 2,427 | | | | - | | | | - | | | | 2,427 | |
| June 30, 2017 | |
| Carrying Amount | | | Fair Value | | | Quoted Prices in Active Markets for Identical Assets (Level 1) | | | Significant Other Observable Inputs (Level 2) | | | Significant Unobservable Inputs (Level 3) | |
| (In Thousands) | |
Financial assets: | | | | | | | | | | | | | | | | | | | |
Cash and cash equivalents | $ | 78,237 | | | $ | 78,237 | | | $ | 78,237 | | | $ | - | | | $ | - | |
Investment securities held to maturity | | 493,321 | | | | 495,794 | | | | - | | | | 495,794 | | | | - | |
Loans held-for-sale | | 4,692 | | | | 4,692 | | | | - | | | | 4,692 | | | | - | |
Net loans receivable | | 3,215,975 | | | | 3,137,304 | | | | - | | | | - | | | | 3,137,304 | |
FHLB Stock | | 39,958 | | | | - | | | | - | | | | - | | | | - | |
Interest receivable | | 12,493 | | | | 12,493 | | | | 6 | | | | 3,169 | | | | 9,318 | |
| | | | | | | | | | | | | | | | | | | |
Financial liabilities: | | | | | | | | | | | | | | | | | | | |
Deposits | | 2,929,745 | | | | 2,943,908 | | | | 1,639,059 | | | | - | | | | 1,304,849 | |
Borrowings | | 806,228 | | | | 823,435 | | | | - | | | | - | | | | 823,435 | |
Interest payable on deposits | | 382 | | | | 382 | | | | - | | | | 382 | | | | - | |
Interest payable on borrowings | | 1,391 | | | | 1,391 | | | | - | | | | - | | | | 1,391 | |
F-81
KEARNY FINANCIAL CORP. AND SUBSIDIARIES
Notes to Consolidated Financial Statements
Note 18 – Fair Value of Financial Instruments (continued)
Limitations. Fair value estimates are made at a specific point in time based on relevant market information and information about the financial instruments. These estimates do not reflect any premium or discount that could result from offering for sale at one time the entire holdings of a particular financial instrument. Because no market value exists for a significant portion of the financial instruments, fair value estimates are based on judgments regarding future expected loss experience, current economic conditions, risk characteristics of various financial instruments and other factors. These estimates are subjective in nature, involve uncertainties and matters of judgment and, therefore, cannot be determined with precision. Changes in assumptions could significantly affect the estimates.
The fair value estimates are based on existing on-and-off balance sheet financial instruments without attempting to value anticipated future business and the value of assets and liabilities that are not considered financial instruments. Other significant assets and liabilities that are not considered financial assets and liabilities include premises and equipment, and advances from borrowers for taxes and insurance. In addition, the ramifications related to the realization of the unrealized gains and losses can have a significant effect on fair value estimates and have not been considered in any of the estimates.
Finally, reasonable comparability between financial institutions may not be likely due to the wide range of permitted valuation techniques and numerous estimates which must be made given the absence of active secondary markets for many of the financial instruments. This lack of uniform valuation methodologies introduces a greater degree of subjectivity to these estimated fair values.
Note 19 – Comprehensive Income
The components of accumulated other comprehensive income (loss) included in stockholders’ equity are as follows:
| June 30, | |
| 2018 | | | 2017 | |
| (In Thousands) | |
Net unrealized loss on securities available for sale | $ | (4,321 | ) | | $ | (2,385 | ) |
Tax effect | | 1,159 | | | | 975 | |
Net of tax amount | | (3,162 | ) | | | (1,410 | ) |
| | | | | | | |
Net unrealized loss on securities available for sale transferred to held to maturity | | (887 | ) | | | (1,109 | ) |
Tax effect | | 249 | | | | 453 | |
Net of tax amount | | (638 | ) | | | (656 | ) |
| | | | | | | |
Fair value adjustments on derivatives | | 31,881 | | | | 6,319 | |
Tax effect | | (8,961 | ) | | | (2,582 | ) |
Net of tax amount | | 22,920 | | | | 3,737 | |
| | | | | | | |
Benefit plan adjustments | | (813 | ) | | | (1,061 | ) |
Tax effect | | 228 | | | | 434 | |
Net of tax amount | | (585 | ) | | | (627 | ) |
| | | | | | | |
Total accumulated other comprehensive income | $ | 18,535 | | | $ | 1,044 | |
F-82
KEARNY FINANCIAL CORP. AND SUBSIDIARIES
Notes to Consolidated Financial Statements
Note 19 – Comprehensive Income (continued)
Other comprehensive income (loss) and related tax effects are presented in the following table:
| Years Ended June 30, | |
| | 2018 | | | | 2017 | | | | 2016 | |
| (In Thousands) | |
Net unrealized holding (loss) gain on securities available for sale | $ | (1,919 | ) | | $ | 1,923 | | | $ | (4,564 | ) |
| | | | | | | | | | | |
Amortization of unrealized holding gain (loss) on securities available for sale transferred to held to maturity (1) | | 222 | | | | (53 | ) | | | 9 | |
| | | | | | | | | | | |
Net realized (gain) loss on securities available for sale (2) | | (17 | ) | | | 402 | | | | - | |
| | | | | | | | | | | |
Fair value adjustments on derivatives | | 25,560 | | | | 27,637 | | | | (10,187 | ) |
| | | | | | | | | | | |
Benefit plans: | | | | | | | | | | | |
Amortization of: | | | | | | | | | | | |
Actuarial loss (3) | | 45 | | | | 66 | | | | 37 | |
Past service cost (3) | | - | | | | - | | | | 22 | |
New actuarial gain (loss) | | 205 | | | | 219 | | | | (911 | ) |
Net change in benefit plan accrued expense | | 250 | | | | 285 | | | | (852 | ) |
| | | | | | | | | | | |
Other comprehensive income (loss) before taxes | | 24,096 | | | | 30,194 | | | | (15,594 | ) |
Tax effect | | (7,986 | ) | | | (12,363 | ) | | | 6,568 | |
Total comprehensive income (loss) | $ | 16,110 | | | $ | 17,831 | | | $ | (9,026 | ) |
(1) | Represents amounts reclassified out of accumulated other comprehensive income and included in interest income on taxable securities. |
(2) | Represents amounts reclassified out of accumulated other comprehensive income and included in gain on sale of securities on the consolidated statements of income. |
(3) | Represents amounts reclassified out of accumulated other comprehensive income and included in the computation of net periodic pension expense. See Note 14 – Benefit Plans for additional information. |
F-83
KEARNY FINANCIAL CORP. AND SUBSIDIARIES
Notes to Consolidated Financial Statements
Note 20 – Parent Only Financial Information
Kearny Financial Corp. operates its wholly owned subsidiary Kearny Bank and the Bank’s wholly-owned subsidiaries. The consolidated earnings of the subsidiaries are recognized by the Company using the equity method of accounting. Accordingly, the consolidated earnings of the subsidiaries are recorded as increases in the Company’s investment in the subsidiaries. The following are the condensed financial statements for Kearny Financial Corp. (Parent Company only) as of June 30, 2018 and 2017, and for each of the years in the three-year period ended June 30, 2018.
Condensed Statements of Financial Condition
| June 30, 2018 | | | June 30, 2017 | |
| (In Thousands) | |
Assets | | | | | | | |
| | | | | | | |
Cash and amounts due from depository institutions | $ | 25,933 | | | $ | 169,820 | |
Investment securities held to maturity | | 15,000 | | | | 15,000 | |
Loans receivable | | 34,903 | | | | 36,448 | |
Investment in subsidiary | | 1,193,601 | | | | 836,426 | |
Other assets | | 85 | | | | 84 | |
Total Assets | $ | 1,269,522 | | | $ | 1,057,778 | |
| | | | | | | |
Liabilities and Stockholders' Equity | | | | | | | |
| | | | | | | |
Other liabilities | | 774 | | | | 597 | |
Stockholders' equity | | 1,268,748 | | | | 1,057,181 | |
Total Liabilities and Stockholders' Equity | $ | 1,269,522 | | | $ | 1,057,778 | |
Condensed Statements of Income and Comprehensive Income
| Years Ended June 30, | |
| | 2018 | | | | 2017 | | | | 2016 | |
| (In Thousands) | |
Interest income | $ | 2,292 | | | $ | 2,318 | | | $ | 2,413 | |
Equity in undistributed earnings of subsidiaries | | 19,420 | | | | 18,427 | | | | 15,543 | |
Total income | | 21,712 | | | | 20,745 | | | | 17,956 | |
| | | | | | | | | | | |
Directors' compensation | | 283 | | | | 265 | | | | 242 | |
Other expenses | | 1,740 | | | | 1,755 | | | | 1,703 | |
Total expense | | 2,023 | | | | 2,020 | | | | 1,945 | |
Income before income taxes | | 19,689 | | | | 18,725 | | | | 16,011 | |
Income tax expense | | 93 | | | | 122 | | | | 189 | |
Net income | $ | 19,596 | | | $ | 18,603 | | | $ | 15,822 | |
Comprehensive income | $ | 35,706 | | | $ | 36,434 | | | $ | 6,796 | |
F-84
KEARNY FINANCIAL CORP. AND SUBSIDIARIES
Notes to Consolidated Financial Statements
Note 20 – Parent Only Financial Information (continued)
Condensed Statements of Cash Flows
| Years Ended June 30, | |
| | 2018 | | | | 2017 | | | | 2016 | |
| (In Thousands) | |
Cash Flows from Operating Activities: | | | | | | | | | | | |
Net income | $ | 19,596 | | | $ | 18,603 | | | $ | 15,822 | |
Adjustment to reconcile net income to net cash provided by operating activities: | | | | | | | | | | | |
Equity in undistributed earnings of subsidiaries | | (19,420 | ) | | | (18,427 | ) | | | (15,543 | ) |
Decrease (Increase) in other assets | | 27 | | | | (19 | ) | | | 880 | |
Increase in other liabilities | | 761 | | | | 352 | | | | 576 | |
Net Cash Provided by Operating Activities | | 964 | | | | 509 | | | | 1,735 | |
| | | | | | | | | | | |
Cash Flows from Investing Activities: | | | | | | | | | | | |
Repayment of loan to ESOP | | 1,545 | | | | 1,496 | | | | 1,444 | |
Purchase of subordinated debt security | | - | | | | (15,000 | ) | | | - | |
Sale of investment securities available for sale | | 3,738 | | | | - | | | | - | |
Net cash acquired in acquisition | | 14,297 | | | | - | | | | - | |
Net Cash Provided by (Used In) Investing Activities | | 19,580 | | | | (13,504 | ) | | | 1,444 | |
| | | | | | | | | | | |
Cash Flows from Financing Activities: | | | | | | | | | | | |
Exercise of stock options | | 102 | | | | 482 | | | | - | |
Cash dividends paid | | (20,561 | ) | | | (8,286 | ) | | | (7,481 | ) |
Repurchase and cancellation of common stock of Kearny Financial Corp. | | (142,602 | ) | | | (126,002 | ) | | | (22,286 | ) |
Cancellation of expired, ungranted shares issued for stock benefit plan | | - | | | | 183 | | | | - | |
Cancellation of shares repurchased on vesting to pay taxes | | (1,370 | ) | | | - | | | | - | |
Net Cash Used In Financing Activities | | (164,431 | ) | | | (133,623 | ) | | | (29,767 | ) |
Net Decrease in Cash and Cash Equivalents | | (143,887 | ) | | | (146,618 | ) | | | (26,588 | ) |
Cash and Cash Equivalents - Beginning | | 169,820 | | | | 316,438 | | | | 343,026 | |
Cash and Cash Equivalents - Ending | $ | 25,933 | | | $ | 169,820 | | | $ | 316,438 | |
F-85
KEARNY FINANCIAL CORP. AND SUBSIDIARIES
Notes to Consolidated Financial Statements
Note 21 – Net Income per Common Share (EPS)
The following is a reconciliation of the numerators and denominators of the basic and diluted earnings per share computations:
| Year Ended June 30, 2018 | |
| Income (Numerator) | | | Shares (Denominator) | | | Per Share Amount | |
| (In Thousands, Except Per Share Data) | |
| | | | | | | | | | | |
Net income | $ | 19,596 | | | | | | | | | |
Basic earnings per share, income available to common stockholders | $ | 19,596 | | | | 82,587 | | | $ | 0.24 | |
Effect of dilutive securities: | | | | | | | | | | | |
Stock options | | - | | | | 56 | | | | | |
| $ | 19,596 | | | | 82,643 | | | $ | 0.24 | |
| Year Ended June 30, 2017 | |
| Income (Numerator) | | | Shares (Denominator) | | | Per Share Amount | |
| (In Thousands, Except Per Share Data) | |
| | | | | | | | | | | |
Net income | $ | 18,603 | | | | | | | | | |
Basic earnings per share, income available to common stockholders | $ | 18,603 | | | | 84,590 | | | $ | 0.22 | |
Effect of dilutive securities: | | | | | | | | | | | |
Stock options | | - | | | | 71 | | | | | |
| $ | 18,603 | | | | 84,661 | | | $ | 0.22 | |
| Year Ended June 30, 2016 | |
| Income (Numerator) | | | Shares (Denominator) | | | Per Share Amount | |
| (In Thousands, Except Per Share Data) | |
| | | | | | | | | | | |
Net income | $ | 15,822 | | | | | | | | | |
Basic earnings per share, income available to common stockholders | $ | 15,822 | | | | 89,591 | | | $ | 0.18 | |
Effect of dilutive securities: | | | | | | | | | | | |
Stock options | | - | | | | 34 | | | | | |
| $ | 15,822 | | | | 89,625 | | | $ | 0.18 | |
For the years ended June 30, 2018, 2017 and 2016, the number of options which were anti-dilutive totaled approximately 3,170,000, 1,919,168 and 248,000, respectively.
F-86
KEARNY FINANCIAL CORP. AND SUBSIDIARIES
Notes to Consolidated Financial Statements
Note 22 – Quarterly Results of Operations (Unaudited)
The following is a condensed summary of quarterly results of operations for the years ended June 30, 2018 and 2017:
| Year Ended June 30, 2018 | |
| First Quarter | | | Second Quarter | | | Third Quarter | | | Fourth Quarter | |
| September 30 | | | December 31 | | | March 31 | | | June 30 | |
| (In Thousands, Except Per Share Data) | |
Interest income | $ | 37,592 | | | $ | 38,032 | | | $ | 38,545 | | | $ | 57,262 | |
Interest expense | | 10,782 | �� | | | 11,197 | | | | 11,488 | | | | 16,671 | |
Net interest income | | 26,810 | | | | 26,835 | | | | 27,057 | | | | 40,591 | |
Provision for loan losses | | 630 | | | | 936 | | | | 423 | | | | 717 | |
Net interest income after provision for loan losses | | 26,180 | | | | 25,899 | | | | 26,634 | | | | 39,874 | |
Non-interest income | | 3,094 | | | | 3,263 | | | | 3,548 | | | | 3,358 | |
Non-interest expense | | 21,286 | | | | 22,764 | | | | 22,543 | | | | 31,257 | |
Income before Income Taxes | | 7,988 | | | | 6,398 | | | | 7,639 | | | | 11,975 | |
Income taxes | | 2,756 | | | | 5,129 | | | | 2,262 | | | | 4,257 | |
Net Income | $ | 5,232 | | | $ | 1,269 | | | $ | 5,377 | | | $ | 7,718 | |
| | | | | | | | | | | | | | | |
Net income per common share: | | | | | | | | | | | | | | | |
Basic | $ | 0.07 | | | $ | 0.02 | | | $ | 0.07 | | | $ | 0.08 | |
Diluted | $ | 0.07 | | | $ | 0.02 | | | $ | 0.07 | | | $ | 0.08 | |
| | | | | | | | | | | | | | | |
Weighted average number of common shares outstanding | | | | | | | | | | | | | | | |
Basic | | 79,649 | | | | 77,174 | | | | 75,492 | | | | 98,046 | |
Diluted | | 79,708 | | | | 77,239 | | | | 75,539 | | | | 98,100 | |
| | | | | | | | | | | | | | | |
Dividends declared per common share | $ | 0.15 | | | $ | 0.03 | | | $ | 0.03 | | | $ | 0.04 | |
F-87
KEARNY FINANCIAL CORP. AND SUBSIDIARIES
Notes to Consolidated Financial Statements
Note 22 – Quarterly Results of Operations (Unaudited) (continued)
| Year Ended June 30, 2017 | |
| First Quarter | | | Second Quarter | | | Third Quarter | | | Fourth Quarter | |
| September 30 | | | December 31 | | | March 31 | | | June 30 | |
| (In Thousands, Except Per Share Data) | |
Interest income | $ | 32,806 | | | $ | 34,315 | | | $ | 35,008 | | | $ | 36,964 | |
Interest expense | | 8,785 | | | | 8,699 | | | | 8,801 | | | | 10,234 | |
Net interest income | | 24,021 | | | | 25,616 | | | | 26,207 | | | | 26,730 | |
Provision for loan losses | | 1,129 | | | | 1,255 | | | | 1,809 | | | | 1,188 | |
Net interest income after provision for loan losses | | 22,892 | | | | 24,361 | | | | 24,398 | | | | 25,542 | |
Non-interest income | | 2,629 | | | | 3,446 | | | | 2,253 | | | | 3,020 | |
Non-interest expense | | 18,660 | | | | 19,373 | | | | 21,034 | | | | 22,051 | |
Income before Income Taxes | | 6,861 | | | | 8,434 | | | | 5,617 | | | | 6,511 | |
Income taxes | | 2,194 | | | | 2,970 | | | | 1,549 | | | | 2,107 | |
Net Income | $ | 4,667 | | | $ | 5,464 | | | $ | 4,068 | | | $ | 4,404 | |
| | | | | | | | | | | | | | | |
Net income per common share: | | | | | | | | | | | | | | | |
Basic | $ | 0.05 | | | $ | 0.06 | | | $ | 0.05 | | | $ | 0.05 | |
Diluted | $ | 0.05 | | | $ | 0.06 | | | $ | 0.05 | | | $ | 0.05 | |
| | | | | | | | | | | | | | | |
Weighted average number of common shares outstanding | | | | | | | | | | | | | | | |
Basic | | 86,246 | | | | 85,174 | | | | 84,542 | | | | 82,372 | |
Diluted | | 86,304 | | | | 85,258 | | | | 84,624 | | | | 82,429 | |
| | | | | | | | | | | | | | | |
Dividends declared per common share | $ | 0.02 | | | $ | 0.02 | | | $ | 0.03 | | | $ | 0.03 | |
The Company’s net income decreased by $3.9 million to $1.3 million for the quarter ended December 31, 2017 from $5.2 million for the quarter ended September 30, 2017. The decrease in net income primarily reflected the impact of federal income tax reform that was codified through the passage of the Tax Act on December 22, 2017. The Tax Act permanently reduced the Company’s federal income tax rate from 35% to 21% while also including other provisions that altered the deductibility of certain recurring expenses recognized by the Company. While the provisions of the Tax Act are expected to benefit the Company’s future earnings, it resulted in a $3.5 million net reduction in the carrying value of the Company’s deferred income tax assets and liabilities with an equal and offsetting charge to income tax expense during the quarter ended December 31, 2017. The decrease in net income also reflected the recognition of certain merger-related expenses related to the Company’s acquisition of Clifton totaling $1.2 million for the quarter ended December 31, 2017, where no such costs were incurred during the quarter ended September 30, 2017.
The Company’s net income increased by $2.3 million to $7.7 million for the quarter ended June 30, 2018 from $5.4 million for the quarter ended March 31, 2018. The increase in net income largely reflected a significant increase in net interest income reflecting the impact of balance sheet growth associated with the acquisition of Clifton. The increase in net interest income was partially offset by an increase to non-interest expense reflecting the recognition of certain non-recurring merger-related expenses totaling $5.1 million for the quarter ended June 30, 2018 compared to $401,000 for the quarter ended March 31, 2018.
F-88
SIGNATURES
Pursuant to the requirements of Section 13 or 15(d) of the Securities Exchange Act of 1934, the Registrant has duly caused this Report to be signed on its behalf by the undersigned, thereunto duly authorized.
| | KEARNY FINANCIAL CORP. |
Dated: August 28, 2018 | | | /s/ Craig L. Montanaro |
| | By: | Craig L. Montanaro President and Chief Executive Officer (Duly Authorized Representative) |
Pursuant to the requirement of the Securities Exchange Act of 1934, this Report has been signed below by the following persons on August 28, 2018 on behalf of the Registrant and in the capacities indicated.
/s/ Craig L. Montanaro | | /s/ Keith Suchodolski |
Craig L. Montanaro President, Chief Executive Officer and Director (Principal Executive Officer) | | Keith Suchodolski Executive Vice President and Chief Financial Officer (Principal Financial and Accounting Officer) |
| | |
| | |
/s/ Theodore J. Aanensen | | /s/ Paul M. Aguggia |
Theodore J. Aanensen Director | | Paul M. Aguggia Director |
| | |
| | |
/s/ Raymond E. Chandonnet | | /s/ John N. Hopkins |
Raymond E. Chandonnet Director | | John N. Hopkins. Director |
| | |
| | |
/s/ John J. Mazur, Jr. | | /s/ Joseph P. Mazza |
John J. Mazur, Jr. Director | | Joseph P. Mazza Director |
| | |
| | |
/s/ Matthew T. McClane | | /s/ John F. McGovern |
Matthew T. McClane Director | | John F. McGovern Director |
| | |
| | |
/s/ Leopold W. Montanaro | | /s/ Christopher Petermann |
Leopold W. Montanaro Director | | Christopher D. Petermann Director |
| | |
| | |
/s/ Charles J. Pivirotto | | /s/ John F. Regan |
Charles J. Pivirotto Director | | John F. Regan Director |
| | |
| | |
/s/ Cynthia Sisco | | |
Cynthia Sisco Director | | |