 Investor Presentation December 2016 Hilton Hawaiian Village Exhibit 99.2 |
 CONFIDENTIAL | 2 Basis of Presentation References to pro forma amounts herein are not intended to reflect pro forma adjustments made pursuant to Article 11 of Regulation S-X of the Securities Exchange Act of 1934, as amended. Unless otherwise noted, the information and figures presented herein includes our 67 hotels and resorts as of September 30, 2016, as if they have been owned during all periods on a pro forma basis adjusted for management agreements that will be in effect post-spin. Forward-Looking Statements This investor presentation, and the related discussion, contains forward-looking statements within the meaning of Section 27A of the Securities Act of 1933, as amended, and Section 21E of the Securities Exchange Act of 1934, as amended, that are based on the beliefs and assumptions of management of Park Hotels & Resorts Inc. (“Park”) and on information currently available to Park’s management. Forward-looking statements include, but are not limited to, statements related to Park’s expectations regarding the performance of the business, financial results, liquidity and capital resources of Park, the benefits resulting from Park’s separation from Hilton Worldwide Holdings Inc., the effects of competition and the effects of future legislation or regulations and other non-historical statements. Forward-looking statements include all statements that are not historical facts and can be identified by the use of forward-looking terminology such as the words “outlook,” “believes,” “expects,” “potential,” “continues,” “may,” “will,” “should,” “could,” “seeks,” “approximately,” “projects,” “predicts,” “intends,” “plans,” “estimates,” “anticipates” or the negative version of these words or other comparable words. Forward-looking statements involve risks, uncertainties and assumptions. Actual results may differ materially from those expressed in these forward- looking statements. You should not put undue reliance on any forward-looking statements in this presentation. Park does not have any intention or obligation to update forward-looking statements after Park distributes this presentation. Factors that could cause Park’s results to differ materially from those expressed in forward-looking statements are included in the section entitled “Risk Factors” of Park’s Registration Statement on Form 10, originally filed with the Securities and Exchange Commission on June 2, 2016, as amended and supplemented. There may be other risks and uncertainties that Park is unable to predict at this time or that Park currently does not expect to have a material adverse effect on Park’s business. Any such risks could cause Park’s results to differ materially from those expressed in forward-looking statements. Non-GAAP Measures This investor presentation is not an offer to sell or the solicitation of an offer to buy any securities of Park, nor will there be any sales of securities of Park in any jurisdiction in which the offer, solicitation or sale would be unlawful prior to registration or qualification under the securities laws of such jurisdiction. This investor presentation, and the related discussions, also contains certain non-GAAP financial measures, which should be considered only as supplemental to, and not as superior to financial measures prepared in accordance with generally accepted accounting principles (“GAAP”). Please refer to the Appendix of this investor presentation for a reconciliation of these non-GAAP financial measures to the most directly comparable financial measures prepared in accordance with GAAP and definitions and calculation methodologies of defined terms used in this investor presentation. Safe Harbor Disclosure |
 CONFIDENTIAL | 3 “To be the preeminent Lodging REIT, focused on consistently delivering superior, risk- adjusted returns for shareholders through active asset management and a thoughtful external growth strategy, while maintaining a strong and flexible balance sheet” Mission Hilton San Francisco Union Square |
 CONFIDENTIAL | 4 Park is a leading lodging real estate company with a diverse portfolio of iconic and market-leading hotels and resorts with significant underlying real estate value in top U.S. markets and internationally Premium Brands Leading Properties Top Markets Company Highlights Sep 2016 LTM Performance (3) 67 premium-branded hotels and iconic resorts 35,000+ competitively positioned and well-maintained rooms (1) 85%+ of rooms in luxury and upper-upscale segments $1.1 Bn of CapEx or $36k per room invested over the past 5 years (2) 80% of CapEx targeted towards guest rooms, lobbies and other guest- facing areas (2) 26 properties with 25k+ sq. ft. of meeting space and 6 properties with 125k+ sq. ft. of meeting space Prime U.S. and international markets with high barriers to entry 88% of room exposure in the United States 72% of rooms in CBDs of major cities and resort / conference destinations $2.8 billion Total Portfolio Revenue (4) $763 million Adjusted EBITDA 61% / 82% Top 10 / Top 25 Assets Contribution to Ownership EBITDA 81% Total Occupancy $200 Total ADR $162 Room RevPAR $204 Avg. Room RevPAR of Top 10 Assets (1) Total rooms figure includes 25 rooms and 600 rooms from Hilton New York Midtown and Hilton Waikoloa Village, respectively, that will become part of Hilton Grand Vacations prior to the completion of the spin-off (2) Includes only CapEx made in our wholly-owned hotels during our period of ownership (3) Occupancy, ADR and RevPAR excludes Unconsolidated JVs; EBITDA figures include pro rata share from Unconsolidated JVs and reflect pro forma for new management contracts (4) Includes pro rata share of Unconsolidated JVs |
 CONFIDENTIAL | 5 Continually improve property level operating performance Consistently implement revenue management initiatives to optimize market pricing / segment mix Allocate capital effectively by leveraging scale, liquidity and M&A expertise to create value throughout all phases of the lodging cycle Employ an active capital recycling program—expanding our presence in target markets with a focus on brand and operator diversification, while reducing exposure to slower growth assets/markets Target value enhancement projects with strong unlevered ROI yields Preserve a strong and flexible balance sheet, with a targeted leverage ratio of 3x to 5x Maintain strong liquidity across lodging cycle and access to multiple types of financing Aspire to achieve investment grade rating Pillars of our Corporate Strategy Prudent Capital Allocation Aggressive Asset Management Strong and Flexible Balance Sheet |
 Leadership Hilton San Francisco Union Square |
 CONFIDENTIAL | 7 Seasoned and Experienced Management Team Officer Title Years of Experience Relevant Experience Thomas J. Baltimore, Jr. Chairman, President & Chief Executive Officer 25 • Co-founder and former President and CEO – RLJ Lodging Trust (NYSE: RLJ) • Former Executive – Hilton Hotels Corp., Host Marriott Services and Marriott Corp. (NYSE: MAR) • Director of Prudential Financial (NYSE: PRU) and Duke Realty (NYSE: DRE) • Serves as First Vice Chair – NAREIT Board Sean M. Dell’Orto Executive Vice President, Chief Financial Officer & Treasurer 20 • Former SVP and Treasurer – Hilton (NYSE: HLT) • Former SVP and CFO – Barceló Crestline Corp. • Former VP, Treasurer – Highland Hospitality Corp. (NYSE: HIH) Matthew A. Sparks Executive Vice President, Chief Investment Officer 25 • Former SVP, Luxury & Corporate Development – Hilton (NYSE: HLT) • Former SVP, Acquisitions – Sage Hospitality Resources • Former SVP, Global Development – Fairmont Raffles Hotels • Former Executive – Marriott Corp. and Starwood Hotels Robert D. Tanenbaum Executive Vice President, Asset Management 25 • Former EVP and COO – DiamondRock Hospitality (NYSE: DRH) • Former Principal – Madison Hotel Advisors, LLC • Former VP, Asset Management – Host Hotels & Resorts (NYSE:HST) Thomas C. Morey Senior Vice President & General Counsel 20 • Former SVP & General Counsel – Washington REIT (NYSE: WRE) • Former Corporate Partner – Hogan Lovells Jill C. Olander Senior Vice President, Human Resources 20 • Former VP, Human Resources - Hilton (NYSE:HLT) • Former VP, Human Resources - Allied Capital (NYSE: AFC) |
 CONFIDENTIAL | 8 Senior Management (continued) Officer Title Years of Experience Relevant Experience John C. Boettger Senior Vice President, Asset Management 25 • Former SVP, Asset Management – Hilton (NYSE: HLT) • Former MD, Asset Mgmt - Axios Hospitality • Former VP, Asset Mgmt - Host Hotels & Resorts (NYSE: HST) William Guy Lindsey Senior Vice President, Design & Construction 30 • Former SVP, Design & Construction – Sunstone Hotel Investors (NYSE: SHO) • Former Executive VP – Complete Property Services, Inc. Darren W. Robb Senior Vice President, Chief Accounting Officer 18 • Former VP, Financial Reporting & Policy – Hilton (NYSE: HLT) • Former Senior Manager, Audit – KPMG Ian C. Weissman Senior Vice President, Corporate Strategy and Investor Relations 20 • Former Managing Director and Head of REIT research – Credit Suisse (NYSE: CS) • 17 years experience as a Wall Street REIT analyst Scott D. Winer Senior Vice President, Head of Tax 30 • Former VP, Head of Tax – Rayonier, a publicly-traded timber REIT (NYSE: RYN) • Former Partner – KPMG; Arthur Andersen Dexter E. Wood, Jr. Senior Vice President, Investment Analysis & Portfolio Management 28 • Former SVP, Global Investment & Business Analytics – Hilton (NYSE: HLT) • SVP, Feasibility - Host Hotels & Resorts (NYSE: HST) • Former Executive – PwC; HVS International |
 CONFIDENTIAL | 9 Full Director slate includes: Proven leaders with strong strategic orientation Highly qualified financial experts Individuals with significant experience with real estate investment and REIT structures Leaders with relevant industry experience including real estate, consumer goods and services, travel and leisure, branding, retail, financial services, and technology Board committees have been assigned and the on-boarding process is underway for the following: Audit Compensation Nominating and Corporate Governance Total of nine Board seats (six Independent Directors; two Blackstone executives; and Tom Baltimore) Two additional Board seats may be added upon consummation of the recently announced sale of Blackstone shares to HNA Group Park has assembled a Board of experienced, diverse and successful corporate executives including current/former CEOs, CFOs and other senior corporate executives Board of Directors |
 CONFIDENTIAL | 10 Name Principal Occupation Experience Thomas J. Baltimore, Jr. Chairman, President & Chief Executive Officer Park Hotels & Resorts • Co-founder and former President and CEO – RLJ Lodging Trust (NYSE: RLJ) • Former Executive – Hilton Hotels Corp., Host Marriott Services, and Marriott Corp. (NYSE: MAR) • Director of Prudential Financial (NYSE: PRU) and Duke Realty (NYSE: DRE) • Serves as First Vice Chair – NAREIT Board Patricia M. Bedient Former Chief Financial Officer Weyerhaeuser • Former CFO of Weyerhaeuser (NYSE: WY) from April 2007 until February 2016 • A certified public accountant (CPA) since 1978; served as a managing partner of Arthur Andersen • Serves on the board of directors of Alaska Air Group, Inc. (NYSE: ALK) as Lead Independent Director, and Suncor Energy Inc. (NYSE: SU) Gordon M. Bethune Former Chairman & Chief Executive Officer Continental Airlines Lead Independent Director Park Hotels & Resorts • Retired Chairman and CEO of Continental Airlines • Held senior management positions with The Boeing Company (NYSE: BA), Piedmont Airlines, Inc., Western Airlines, Inc., and Braniff Airlines • Serves on the board of directors of Sprint Corporation (NYSE: S) Board of Directors |
 Name Principal Occupation Experience Rob G. Harper Senior Managing Director and Head of U.S. Asset Management The Blackstone Group L.P. • Head of U.S. Asset Management for The Blackstone Group (NYSE: BX) • Previously worked for Blackstone in Los Angeles and also London as head of Blackstone’s European Real Estate Debt Strategies business • Joined Blackstone in 2002; previously held positions with Morgan Stanley’s real estate private equity group • Serves as a director of ESH Hospitality (NYSE: STAY) Tyler S. Henritze Senior Managing Director and Co-head of U.S. Acquisitions The Blackstone Group L.P. • Co-Head of U.S. Acquisitions for The Blackstone Group (NYSE: BX) since Jan 2013 • Before joining Blackstone in 2004, Mr. Henritze worked at Merrill Lynch in the real estate investment banking group • Serves on the board of directors of The Cosmopolitan of Las Vegas, Motel 6 and BRE Select Hotels; previously served on the board of directors of Hilton Worldwide (NYSE: HLT) and La Quinta (NYSE: LQ) Christie B. Kelly EVP and Chief Financial Officer Jones Lang LaSalle Incorporated Chair of Audit Committee Park Hotels and Resorts • Executive Vice President and Chief Financial Officer of Jones Lang LaSalle since 2013 • Executive Vice President and Chief Financial Officer of Duke Realty (NYSE: DRE) from 2009 until June 2013 • Prior to Duke Realty, Ms. Kelly served as Senior Vice President, global real estate at Lehman Brothers • Serves on the board of Kite Realty Trust (NYSE: KRG) Board of Directors CONFIDENTIAL | 11 |
 Board of Directors Name Principal Occupation Experience Senator Joseph I. Lieberman Senior Counsel Kasowitz, Benson, Torres & Friedman LLP • Senior counsel with Kasowitz, Benson, Torres & Friedman LLP • Served 24 years in the U.S. Senate (Connecticut), retiring in January 2013; served as Chairman of the Committee on Homeland Security and Government Affairs, helping to shape legislation for homeland security, foreign policy, fiscal policy, environmental protection, human rights, health care, trade, energy, cyber security and taxes • Attorney General of the State of Connecticut - 1983 until 1988 Timothy J. Naughton Chairman, Chief Executive Officer and President AvalonBay Communities, Inc. Chair of Nominating and Corporate Governance Committee • Chairman, Chief Executive Officer and President of AvalonBay Communities (NYSE: AVB). Has served as Chairman of AvalonBay since May 2013, as Chief Executive Officer since January 2012, and as President since February 2005 • Serves on the board of directors of Welltower (NYSE: HCN) • Serves as Chair of NAREIT, is a member of The Real Estate Round Table, is a member and past Chairman of the Multifamily Council of the ULI, and is a member of the National Multi- Housing Council, where he serves on the Executive Committee Stephen I. Sadove Founding Partner JW Levin Management Partners LLC Chair of Compensation Committee • Founding partner of JW Levin Management Partners LLC, a private management and investment firm, since 2015 • Chairman and Chief Executive Officer of Saks Incorporated from 2007 until 2013 • President of Bristol-Meyers (NYSE: BMY) from 1991 until 2001 • Serves on the board of directors of Colgate-Palmolive Company (NYSE: CL), Ruby Tuesday (NYSE: RT), and Aramark (NYSE: ARMK). Also serves as the chairman of the Board of Trustees of Hamilton College CONFIDENTIAL | 12 |
 Waldorf Astoria The Reach Resort Hilton Chicago Portfolio Overview Hilton New York Midtown |
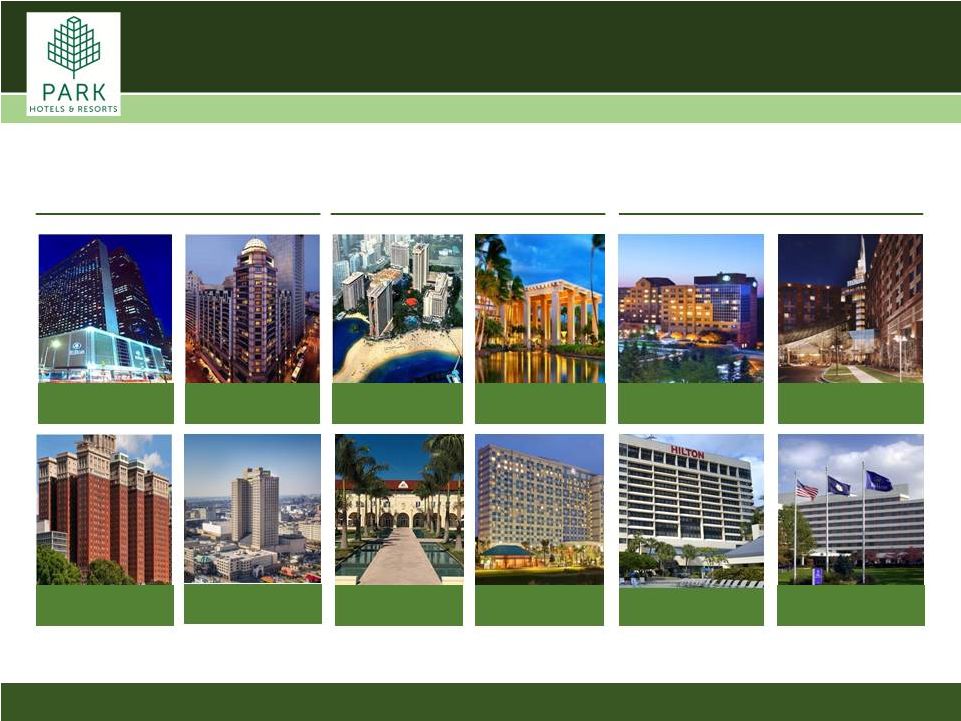 (1) Includes approximately 25 rooms that will become part of Hilton Grand Vacations prior to the completion of the spin-off (2) Includes approximately 600 rooms that will become part of Hilton Grand Vacations prior to the completion of the spin-off Hilton San Francisco 1,919 rooms Hilton New Orleans 1,622 rooms Hilton New York 1,929 rooms (1) Hilton Chicago 1,544 rooms Hilton Waikoloa Village 1,241 rooms (2) Waldorf Astoria Orlando / Hilton Orlando Bonnet Creek 1,499 rooms Hilton Hawaiian Village 2,860 rooms Waldorf Astoria Casa Marina 311 rooms Hilton Boston Logan 599 rooms Hilton Miami Airport 508 rooms Hilton Short Hills 304 rooms Hilton McLean 458 rooms High Barriers to Entry Urban and Convention Hotels Landmark Resorts Select Suburban and Strategic Airport Hotels Diversified Exposure to Attractive Markets CONFIDENTIAL | 14 |
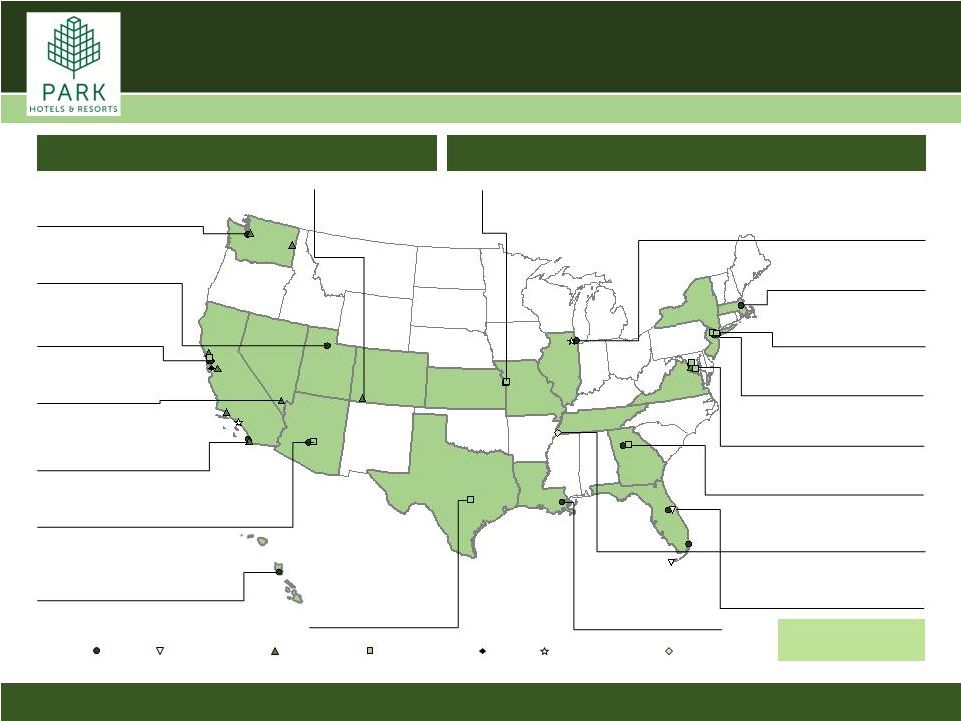 (1) As defined by STR Note: Ownership EBITDA is LTM 75% of LTM Ownership EBITDA from coastal markets 86% of Ownership EBITDA from top 25 markets & resort destinations Diversified Exposure to Attractive Markets Hilton Curio DoubleTree Embassy Suites Hampton Inn Hilton Garden Inn Waldorf Astoria Massachusetts 1 Hotels | 599 Rooms 2% Ownership EBITDA New Jersey 3 Hotels | 839 Rooms 1% Ownership EBITDA DC / VA 5 Hotels | 2,120 Rooms 3% Ownership EBITDA Georgia 2 Hotels | 748 Rooms 1% Ownership EBITDA Florida 7 Hotels | 4,699 Rooms 16% Ownership EBITDA Louisiana 2 Hotels | 1,939 Rooms 8% Ownership EBITDA Tennessee 1 Hotel | 130 Rooms <1% Ownership EBITDA Texas 1 Hotel | 259 Rooms 1% Ownership EBITDA Illinois 4 Hotels | 2,743 Rooms 6% Ownership EBITDA Washington 3 Hotels | 1,621 Rooms 2% Ownership EBITDA Northern California 7 Hotels | 4,512 Rooms 15% Ownership EBITDA Nevada 1 Hotel | 190 Rooms <1% Ownership EBITDA Southern California 6 Hotels | 2,888 Rooms 6% Ownership EBITDA Arizona 2 Hotels| 745 Rooms 1% Ownership EBITDA Hawaii 2 Hotels | 4,101 Rooms 22% Ownership EBITDA Utah 1 Hotel | 499 Rooms 1% Ownership EBITDA Colorado 1 Hotel | 159 Rooms <1% Ownership EBITDA New York 1 Hotel | 1,929 Rooms 7% Ownership EBITDA Kansas / Missouri 2 Hotels | 465 Rooms 1% Ownership EBITDA International Hotels 15 Hotels | 4,233 Rooms 6% Ownership EBITDA CONFIDENTIAL | 15 (1) |
 Geographic Diversity Diverse Revenue Stream Revenue Segmentation (1) Location Type Group vs Transient Top 10 Cities (1) Excludes laundry facilities Note: International hotels located in United Kingdom (8 hotels), Germany (2), Brazil (1), Ireland (1), Netherlands (1) and South Africa (1) Note: Revenue segmentation excludes Unconsolidated JVs Portfolio Overview (% of Total Rooms) (% of LTM Total Revenue) CONFIDENTIAL | 16 Transient Group Contract Rooms Food and Beverage Other Orlando San Francisco Honolulu Chicago New Orleans New York San Diego Seattle Waikoloa Village Atlanta International Other Urban Resort Airport Suburban |
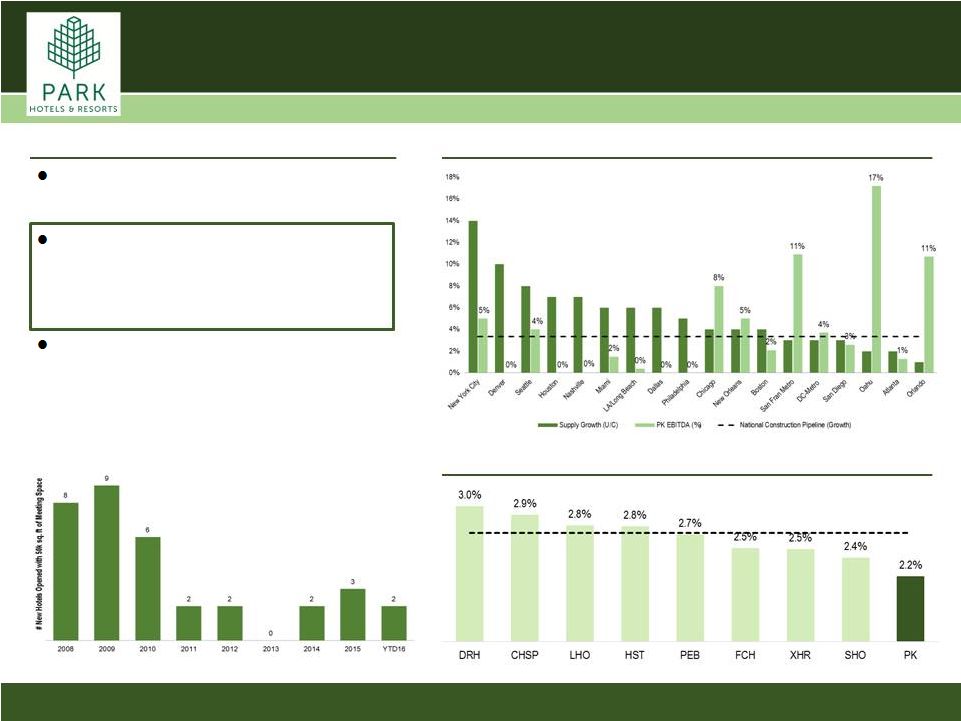 Park Portfolio: Well Insulated from Supply Favorable Supply Picture for Park’s Hotels ~2% Supply Growth for Park Against a backdrop of increased US supply growth, Park is well positioned relative to its peers With outsized exposure to Orlando, Oahu, San Francisco and New Orleans, Park anticipates just 2.2% supply growth per annum over the next 2+ years, or 50bp lower than its peer growth average Supply growth among big-box group houses has been especially muted the past five years with between just 0-3 new hotels (with meeting space of 50k+ sq. ft.) opened annually vs. 6-9 new hotels opened annually from 2008-2010 Supply Growth Exposure for Lodging REITs Note: Charts presented above based on STR Global and Park Hotels estimates (1) Comparable peers selected based on market exposure CONFIDENTIAL | 17 (1) |
 Group Portfolio Positioned to Outperform Park’s Leading Group Platform (1) LTM; remainder of mix is contract business (2) Smith Travel Research; 12-month moving average from 2006 through December 2015; includes hotels with over 1,000 rooms and 125k sq. ft. of dedicated meeting space Park Hotels & Resorts portfolio’s strong group positioning increases visibility into forward bookings and reduces operating volatility by enhancing the stability and predictability of revenue throughout the lodging cycle Group/Transient Mix: 32% / 63% (1) The portfolio contains 26 properties with over 25,000 sq. ft. of meeting space and 6 properties with over 125,000 sq. ft. of meeting space in top convention markets, generating robust corporate meeting and group business Supply and demand trends favor large, group-oriented hotels for the foreseeable future: U.S. "Big Box" Supply and Demand % Change CONFIDENTIAL | 18 (2) |
 Industry Overview: Possible Catalyst in International Demand 2.8% 2000-2015 CAGR 4.0% 2016-2020E CAGR International Visitors to the U.S. (Arrivals in Millions) Inbound travel from abroad is expected to accelerate over the next four years – increasing 4% per annum vs. just 2.8% per annum over the prior 15 years. Major gateway cities (San Francisco, New York, D.C., LA, Orlando, Boston and Hawaii) are the expected primary beneficiaries Source: US Department of Commerce Bullish predictions for inbound international travel to the U.S. could serve as a catalyst for growth in select U.S. markets CONFIDENTIAL | 19 51.2 46.9 43.6 41.2 46.1 49.2 51.0 56.1 58.0 55.1 60.0 62.8 66.7 70.0 75.0 77.5 77.3 80.2 83.6 86.9 90.3 35.0 45.0 55.0 65.0 75.0 85.0 95.0 2000 2001 2002 2003 2004 2005 2006 2007 2008 2009 2010 2011 2012 2013 2014 2015 2016E 2017E 2018E 2019E 2020E |
 Investment Highlights Hilton Bonnet Creek |
 CONFIDENTIAL | 21 Investment Highlights Size and Scale of Park Creates Competitive Advantage Iconic Assets in Key US Cities and Geographic Diversity Significant Growth Profile: Acquisitions and Redevelopment Enhanced Profitability with Aggressive Asset Management Strong and Flexible Balance Sheet 1 2 3 4 5 |
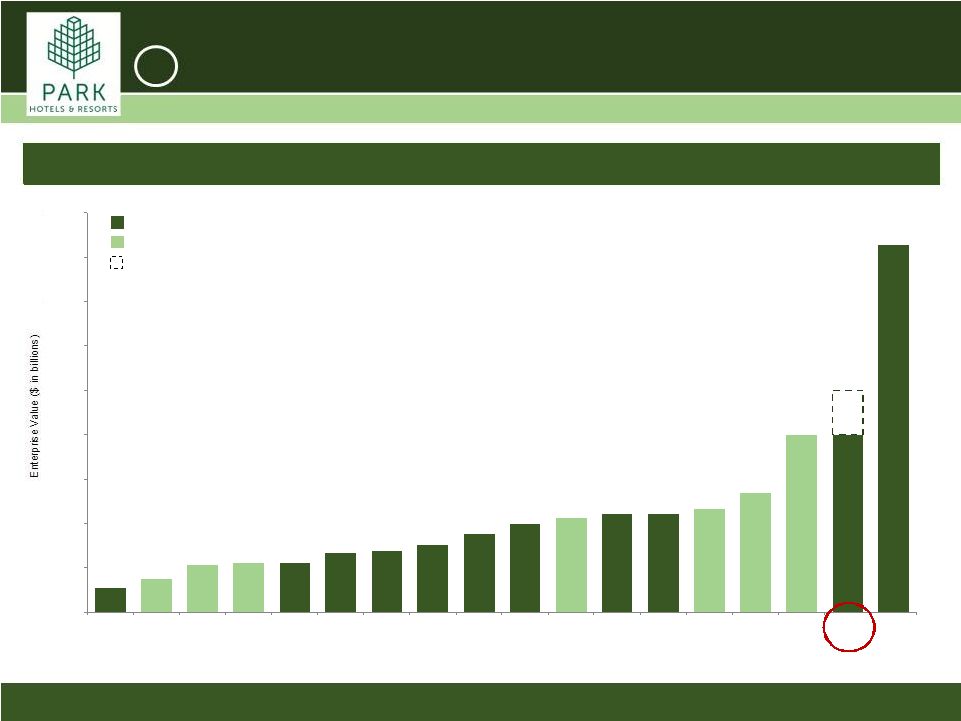 CONFIDENTIAL | 22 $8.0 $1.1 $1.5 $2.1 $2.2 $2.2 $2.7 $2.8 $3.0 $3.5 $4.0 $4.2 $4.4 $4.4 $4.7 $5.4 $8.0 $10.0 $16.6 $0.0 $2.0 $4.0 $6.0 $8.0 $10.0 $12.0 $14.0 $16.0 $18.0 AHP CLDT HT INN CHSP FCH DRH XHR PEB SHO RLJ LHO RHP AHT APLE HPT PK HST Upon spin, Park becomes a significant player as the second largest publicly traded Lodging REIT 1 Size and Scale: Park ~2.5x the Size of Most Lodging REITs (1) Source: Public company filings, as of September 30, 2016. Market data as of November 25, 2016. Note: Park EV assumes EBITDA multiple of 10.5 – 13x (1) Assumption excludes HST from calculation $8.0 $8.0 Value range for Park Mixed & Limited Service Full Service |
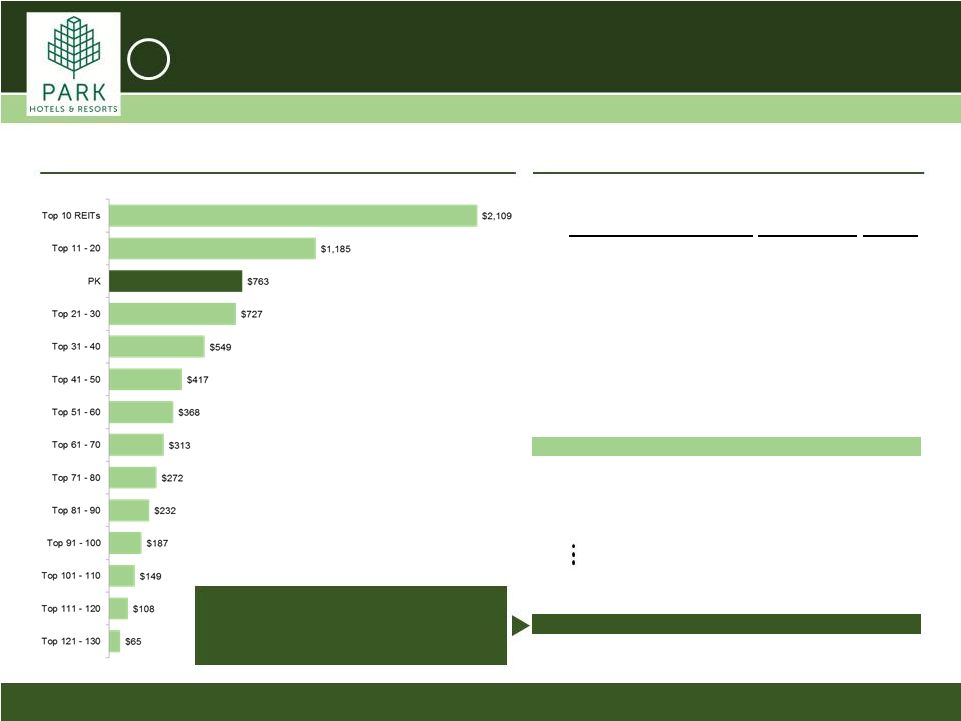 CONFIDENTIAL | 23 LTM Adj. Company Sector EBITDA 1. Simon Property Group, Inc. Malls $4,640 2. General Growth Properties, Inc. Malls $2,260 3. Welltower, Inc. Healthcare $2,204 4. Ventas, Inc. Healthcare $1,845 5. Prologis, Inc. Industrial $1,833 6. HCP, Inc. Healthcare $1,832 7. Public Storage Storage $1,804 8. Equity Residential Residential $1,680 9. Equinix, Inc. Data Center $1,554 10. Boston Properties, Inc. Office $1,529 11. Host Hotels & Resorts, Inc. Lodging $1,466 12. Vornado Realty Trust Office $1,458 13. AvalonBay Communities, Inc. Residential $1,295 14. SL Green Realty Corp. Office $1,248 15. Digital Realty Trust, Inc. Data Center $1,186 22. Brixmor Property Group, Inc. Shopping Centers $846 23. Omega Healthcare Investors, Inc. Healthcare $797 24. Park Hotels and Resorts Lodging $763 25. W. P. Carey Inc. Net Lease $754 Size and Scale: Park will Rank Among the Top 25 Largest REITs Source: Public company filings, NAREIT REITWatch and SNL Financial (1) Excludes mortgage REITs, telecommunication REITs, correctional facility REITs, timberland REITs and other REITs listed within the last twelve months Park LTM Adjusted EBITDA vs. US REITs Universe (1) Top 25 Largest REITs (1) ($ in millions) ($ in millions) 1 Park Hotels & Resorts will be within the Top 25 largest REITs out of 130 REITs based on LTM Adjusted EBITDA (1) |
 CONFIDENTIAL | 24 Hawaii Two landmark, oceanfront resorts catering to both domestic and international travelers in the group and transient business segments Overview of Top 10 Assets: Landmark Resorts Hilton Hawaiian Village: Extensive renovations over the last 5 years totaling ~$200 million, from modernization of rooms to enhancement of the F&B program; secures a ten-year $1.275 billion CMBS loan maturing in November 2026 Hilton Waikoloa Village: Major meeting space renovation in 2014 to attract growing group business; contributing 600 rooms to timeshare to reduce hotel size and maximize yield Florida Two luxury properties ideally situated within their respective markets with attributes that create strategic advantages within a resort setting Waldorf Astoria Orlando: Acquired in 2015 as part of the New York Waldorf 1031 exchange; Potential ROI project includes addition of a ballroom, as well as additional keys Waldorf Astoria Casa Marina: Highest RevPAR in the portfolio; strategic advantage as one of the few Key West resorts in an idyllic setting with a private beach location 2 |
 CONFIDENTIAL | 25 Adjacent hotels spanning 1.5 city blocks in San Francisco’s premier Union Square sub-market with ~3,000 rooms Hilton San Francisco Union Square and Parc 55 hotels Overview of Top 10 Assets: Urban Extensive room and lobby renovations; repositioned F&B program to include Herb N’ Kitchen 168k sq. ft. of meeting space provides advantage for in-house groups and less reliance on citywide conventions while Moscone Center under construction Parc 55 hotel acquired in 2015 and converted to a Hilton brand Both hotels secure a seven-year $725 million CMBS loan due November 2023 Hilton New York Midtown Premier NY conference hotel located in the heart of Midtown Significant capital invested to renovate rooms, reposition F&B platform; added 8k sq. ft. of retail space Strategic advantage in group market with 150k sq. ft. of meeting space 2 |
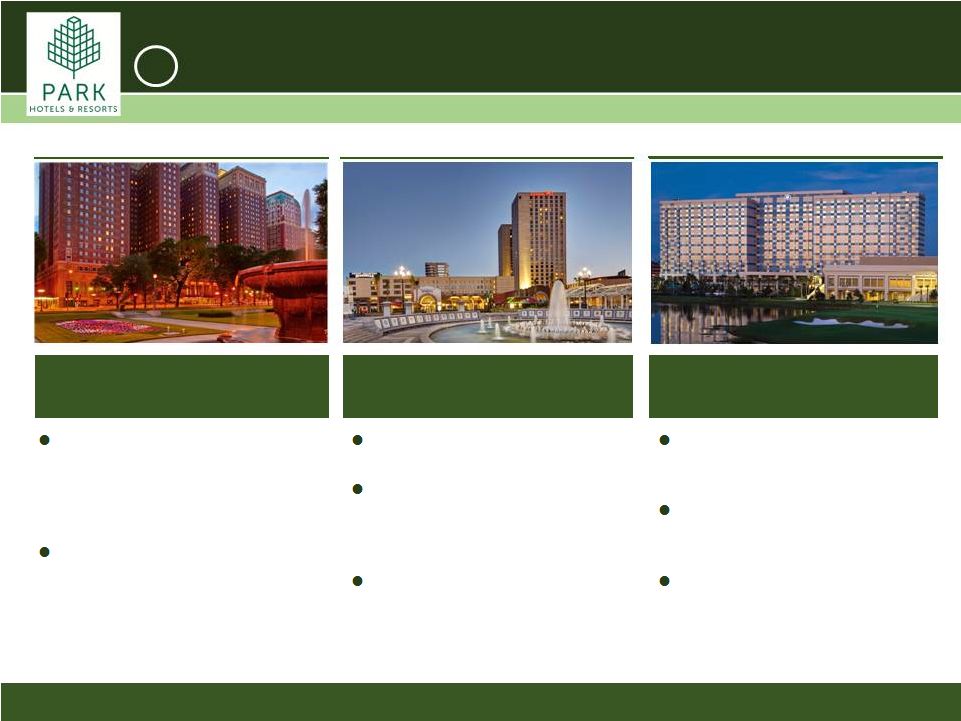 CONFIDENTIAL | 26 Hilton Chicago Downtown Hilton New Orleans Riverside Premier convention hotel located on a full city block in downtown Chicago across from McCormick Conv. Center Strategically located adjacent to convention center and proximate to the famed French Quarter Overview of Top 10 Assets: Convention/Conference Recent comprehensive renovation totaling ~$125mn that included rooms, public areas and repurposing of underutilized space into meeting space Potential ROI project includes repurposing additional underutilized space into meeting space Hilton Orlando Bonnet Creek 1,001-room conference hotel with 113k sq. ft. of self-contained meeting space; located proximate to Disney theme parks Leading convention hotel in major convention market (1) Extensive renovation in 2012 totaling $40mn to modernize main tower guestrooms and public areas Potential development opportunity with excess land parcel Acquired in 2015 as part of the New York Waldorf 1031 exchange Recent renovation of the lobby including repositioning of F&B outlets Potential ROI projects include additional rooms, as well as a poolside F&B outlet 2 (1) Source: Hilton.com |
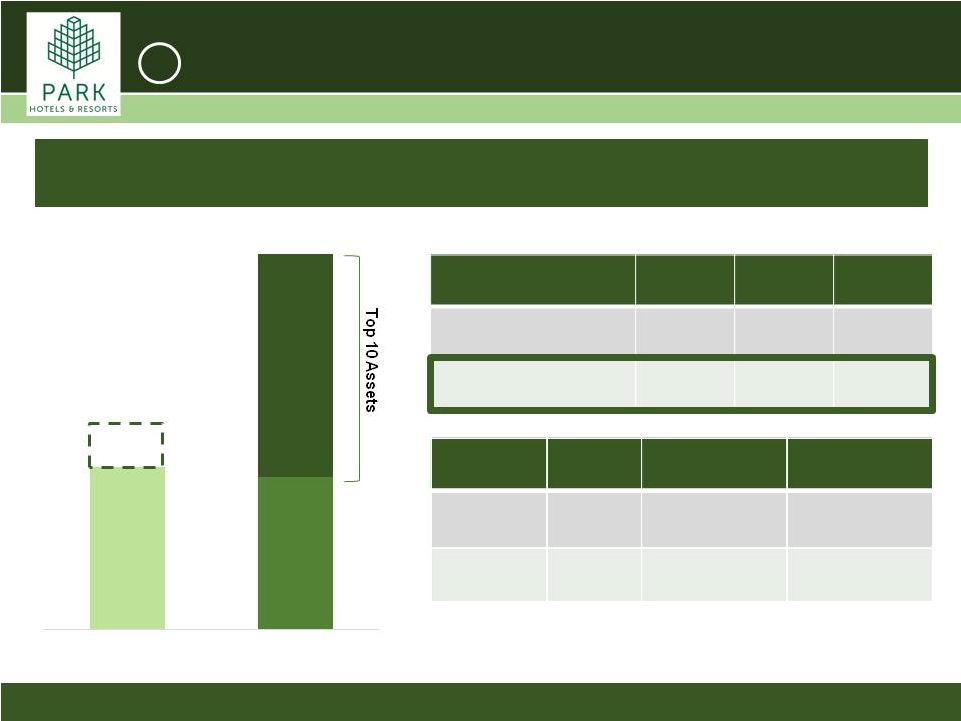 CONFIDENTIAL | 27 Note: Includes approximately 600 rooms that will become part of Hilton Grand Vacations prior to the completion of the spin-off Note: Includes approximately 25 rooms that will become part of Hilton Grand Vacations prior to the completion of the spin-off (1) Assumes EBITDA multiple range of 10.5x to 13x (2) Park Hotels & Resorts estimate 2 Iconic Assets Valued at Well Below Replacement Cost $8.0 $7.5 $11.0 $0.0 $2.0 $4.0 $6.0 $8.0 Park Enterprise Value (est.) Portfolio Replacement Cost (est.) $18.5 Assuming a peer EBITDA multiple range (1) , Park’s assets will likely be valued at a significant discount to replacement cost (2) $10.0 Rooms Mtg Space (sq. ft.) Replacement Cost ($/key) Top 10 13,949 962k $11.0 bn ($790k/key) Park Portfolio 35,418 2,300k $18.5 bn ($525k/key) PK EV Range $8.0 bn $9.0 bn $10.0 bn Portfolio Replacement Cost $18.5 bn $18.5 bn $18.5 bn Discount to Replacement Cost 57% 51% 46% |
 CONFIDENTIAL | 28 Growth through Disciplined Capital Allocation Focus on building portfolio of Upper Upscale and Luxury branded assets in Top 25 markets and premium resort destinations Pursue larger scale deals (assets and portfolios) that offer significant value add opportunities Diversify brand and operator mix to include other global manager / franchisors Strategically invest in the core hotel portfolio; execute on significant embedded ROI opportunities Opportunistically recycle capital, selling out of slower growth, non-core assets and reinvest in higher growth markets 3 |
 CONFIDENTIAL | 29 6.2% 5.3% 5.8% 6.3% 5.7% 5.0% 5.2% 6.1% 6.7% 5.5% 6.2% 6.5% $25 - $100 $100 - $250 $250 - $400 > $400 All Deals Unencumbered Encumbered Less competition exists on larger transactions as only a limited number of investors have access to equity needed to pursue $250+ million single assets Consequently, the share of deals pre-empted and executed off-market increases in conjunction with deal size, thereby enhancing the price negotiation leverage for an eligible buyer Park’s balance sheet and operating platform are well positioned to execute these larger transactions Deal Size ($ in millions) $25 - $100 $100 - $250 $250+ # of Deals 57 41 15 Avg. # of Rooms 262 386 790 Avg. Pricing ($mn) $60 $146 $504 Avg. Price per Key $299K $458K $674K Avg. # of Bids 6.9 7.2 3.8 # of Pre-Empts / Off-Market Deals 4 6 4 Pre-empt/Off-Market Deals as a % of Total Deals 7% 15% 27% Market Backdrop for Deals of Scale Summary of Eastdil First Round Bids 2014 to 2016 YTD Cap Rates for Full Service Transactions in Major Markets 2014 to 2016 YTD Source: Eastdil Secured & Real Capital Analytics Capital Allocation: Target Larger Scale Acquisitions 3 |
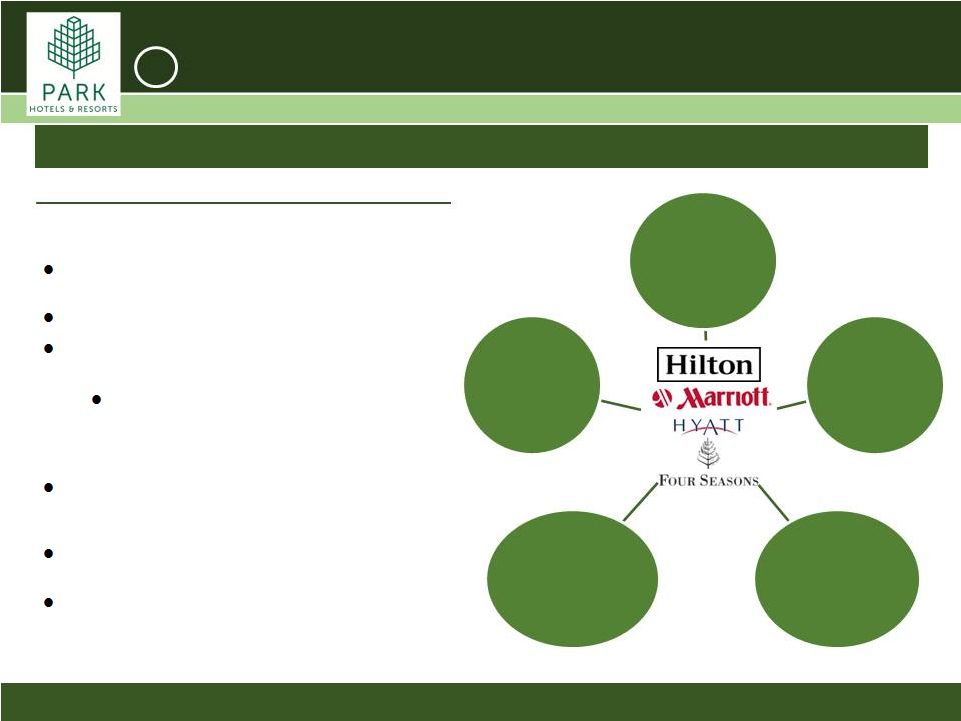 CONFIDENTIAL | 30 Worldwide Group Sales Strong Loyalty Programs Worldwide Reservation Systems Effective Brand Segmentation RevPAR Premiums Brand Strategy Maximizes Revenue and Profitability Benefits of Partnering with Brands Consistent quality through a branded product allows Park to achieve higher RevPAR and margins as a result of: Recognizable product compared to independent hotels struggling to differentiate their offerings Worldwide reservation systems Loyalty programs help to drive recurring sales, while lowering new customer acquisition costs Hilton (~58mn members) and Marriott, including Starwood (~85mn members (1) ), have ~50% of sales stemming from customers within loyalty programs Ability to achieve increased direct-to-consumer sales minimizing OTA / wholesale commissions and increasing revenue to Park Significantly lower distribution costs for OTA business given negotiating power of brands More effective competition against Airbnb, particularly with respect to frequent travelers who appreciate the reliability and security of branded hotels Brands Matter: Park will focus on owning hotels and resorts in the luxury and upper upscale segments 3 (1) Source: Marriott Form 10-Q |
 Asset Management Waldorf Astoria Orlando |
 CONFIDENTIAL | 32 Active Asset Management: Hands on Approach Every Dollar Counts Approach Hope is Not a Strategy Implementation Weekly calls with Top 25 hotel teams: Understand 90-day pricing trends Review group booking pace and transient trends Review monthly and quarterly operating performance: Analyze labor efficiency and staffing Set stretch goals to drive an incremental 25bps to 50bps of Hotel EBITDA margin Share best practices from each property and apply across the portfolio Work with in-house project management team on ROI / repositioning efforts: Adding keys and/or meeting space Energy efficiency projects and F&B optimization Utilize in-house and external resources to drive profit – retail, I.T., parking and F&B Develop strong relationships with hotel operators through proactive communication Continuous improvement of property level operating performance Build strategic plans that seek out new sources of business while developing reverse marketing plans for changes in supply Challenge existing revenue management models Maximize flow-through with the “drive for 65 mantra’” by increasing revenue and sustainable cost reduction Proactively address changes in demand shifts through strategic sales initiatives Forecast accuracy – review forecasts on the 1st and 15th of the month, which provides the ability to pivot strategy in response to changing market conditions Aggressively target non-core revenue streams: parking, rooftop farming and retail Validate highest and best use across portfolio 4 |
 CONFIDENTIAL | 33 $266 $549 $704 $864 $1,088 2011 2012 2013 2014 2015 Well-capitalized portfolio with ~$1.1 billion invested over the past 5 years to maintain competitive strength (1) Includes only CapEx made in our wholly-owned hotels during our period of ownership (2) Includes only CapEx and Total Revenue for our wholly-owned hotels during our period of ownership Invested heavily to drive market share and ensure strong competitive positioning of Park portfolio Consistently renovated to adapt to evolving customer preferences and latest technology Renovations have been focused on guestroom design, open and activated lobby areas, food and beverage and public spaces, and modernized meeting space Value creation through repositioning select hotels across brands or chain scale segments and exploring adaptive reuse opportunities for highest and best use No major deferred maintenance CapEx projects on the horizon $ in millions % of Total Revenue CapEx: Over $1bn Has Been Reinvested in Park Hotels 12.8% 13.1% 6.7% 6.5% 8.4% 2011 2012 2013 2014 2015 4 12.7% 11.3% 10.2% 10.0% 9.4% 9.3% 8.6% 8.1% 8.0% 7.0% 6.7% SHO PEB FCH LHO PK CHSP DRH XHR RHP AHP HST Full Service Lodging REIT Avg: 9.2% Historical Cumulative CapEx Spend (1) Yearly CapEx Spend as % of Total Revenue (2) 5-Year Avg. CapEx Spend vs Full Service Peers Capital Investment Overview |
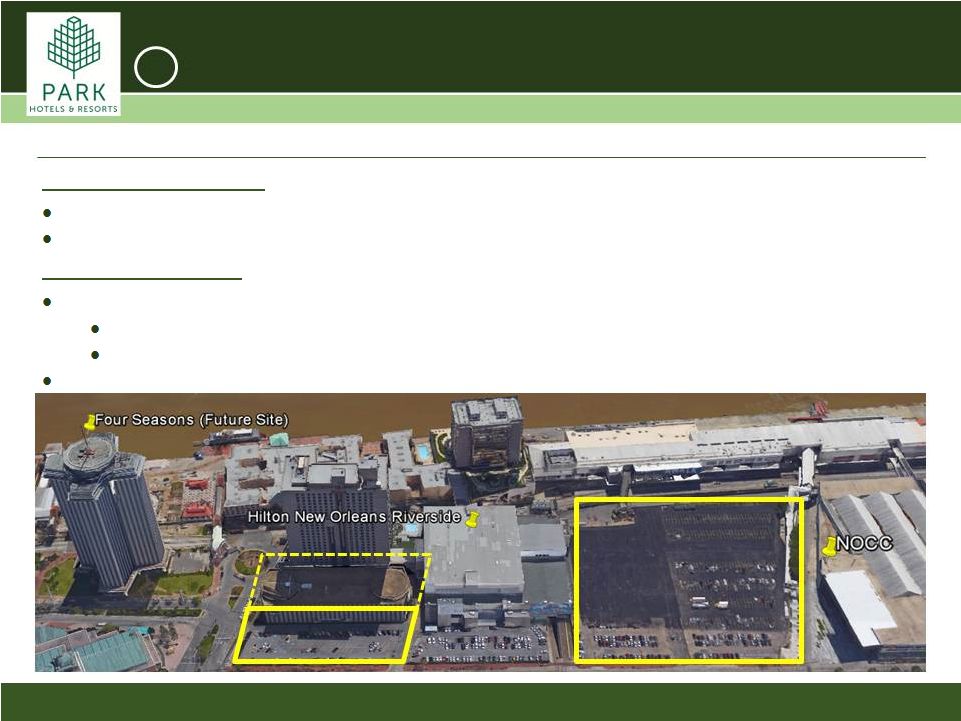 CONFIDENTIAL | 34 Hilton New Orleans Riverside: Development Rights/Land Sale Future ROI Projects: New Orleans Hilton New Orleans Riverside 1,622 room hotel with 143,000 sq. ft. of meeting space Adjacent to the 1.1 million sq. ft. New Orleans Ernest N. Morial Convention Center (NOCC) – 7 th largest in the US Opportunity: Excess Land Whale Lot: 8 acre parking lot separates Hilton Riverside and NOCC (yellow box) Sell land to NOCC for future expansion Significant FAR (Floor Area Ratio) available for a future hotel, meeting space, and/or retail WTC Garage: Potential to add a ‘luxury’ hotel tower WTC Garage ‘Whale’ Lot 4 |
 CONFIDENTIAL | 35 Hilton Hawaiian Village: Development Rights Future ROI Projects: Hawaii Hilton Hawaiian Village 22-acre oceanfront resort along Oahu’s prestigious Waikiki Beach 2,860 rooms, nearly 145,000 sq. ft. of retail space, 20 restaurants and lounges, 5 pools, a spa, and 96,000 sq. ft. of meeting space Hotel runs at 95% occupancy Potential Opportunity: Ala Moana Land Parcel Optimize available FAR at resort Develop luxury hotel tower and retail Consider highest & best use, which could include hotel, timeshare or residential 4 Rainbow Tower Lagoon Tower Ali’i Tower Diamond Head Tower Tapa Tower Grand Waikikian Tower Kalia Tower |
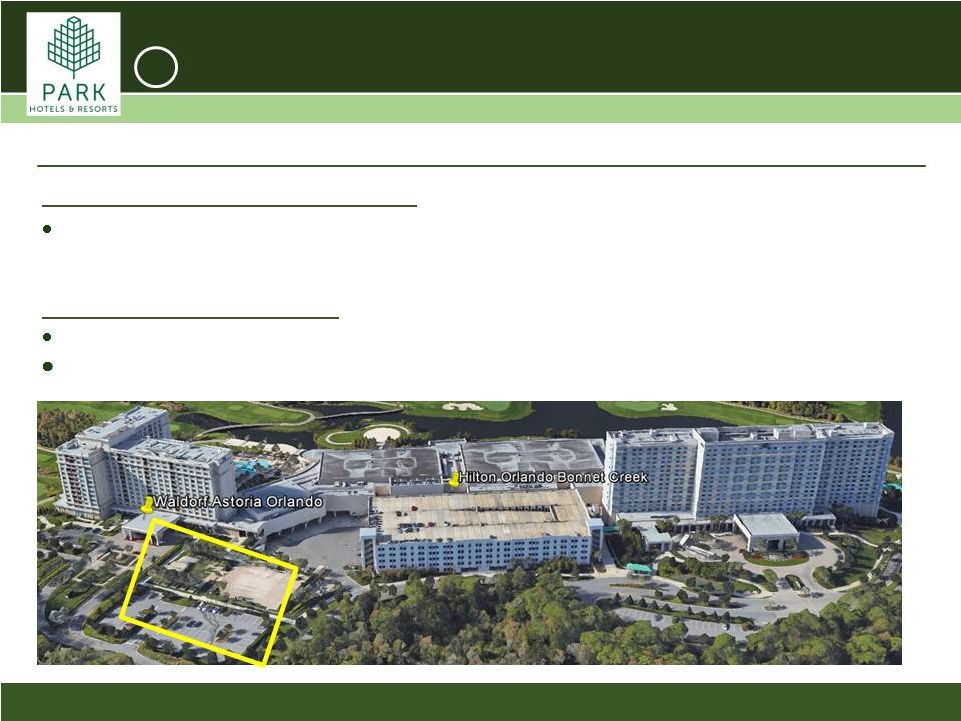 CONFIDENTIAL | 36 Bonnet Creek: Development Rights Future ROI Projects: Orlando Hilton Bonnet Creek and Waldorf Astoria Orlando The 1,001-room Hilton and the adjacent 498-room Waldorf Astoria Orlando feature a combined 147,000 sq. ft. of meeting space, a 3-acre Florida-style lazy river pool, a luxurious spa, a renowned championship golf course, fitness center and nearly a dozen dining and lounge options Opportunity: Additional Meeting Space Optimize meeting platform with 40,000 sq. ft. of additional multi-purpose space $50mn investment expected to generate an additional $10mn of EBITDA per annum starting in 2020 4 |
 Hilton Chicago Strong and Flexible Balance Sheet |
 Strong and Flexible Balance Sheet Pro Forma Debt Capital Structure Pro Forma Debt Capital Structure Overview Weighted average cost of debt: 3.7% $214 million of unconsolidated JV debt (pro rata) Target investment grade leverage profile over time Pro forma for the spin and purging distribution, Park expects to have $100-200 million of cash In addition to cash, Park is expected to have access to a $1 billion revolving credit facility which is expected to be undrawn at spin Liquidity Profile (1) Figures exclude pro rata share of Unconsolidated JVs (2) TLA (L+1.45%) and Revolver (L+1.50%) floating interest rates projected based on total leverage at spin date Park will pay a one-time dividend to purge its historical earnings and profits (E&P purge) Dividend payout ratio is expected to be approximately 65-70% of Funds from Operations (FFO) Dividend and Payout Ratio Analysis 5 CONFIDENTIAL | 38 Debt $ Amount % of Total Weighted Avg. Cost of Debt CMBS (secured) $ 2,000 66% 4.2% Term Loan A (unsecured) (2) 750 25% 2.1% Consolidated JV Debt (secured) 207 7% 3.9% Other (incl. capital lease obligations) 70 2% 7.4% Revolver (2) 0 0% 2.1% Total Long-Term Debt $ 3,027 100% 3.7% Fixed 74% Floating 26% (1) (1) |
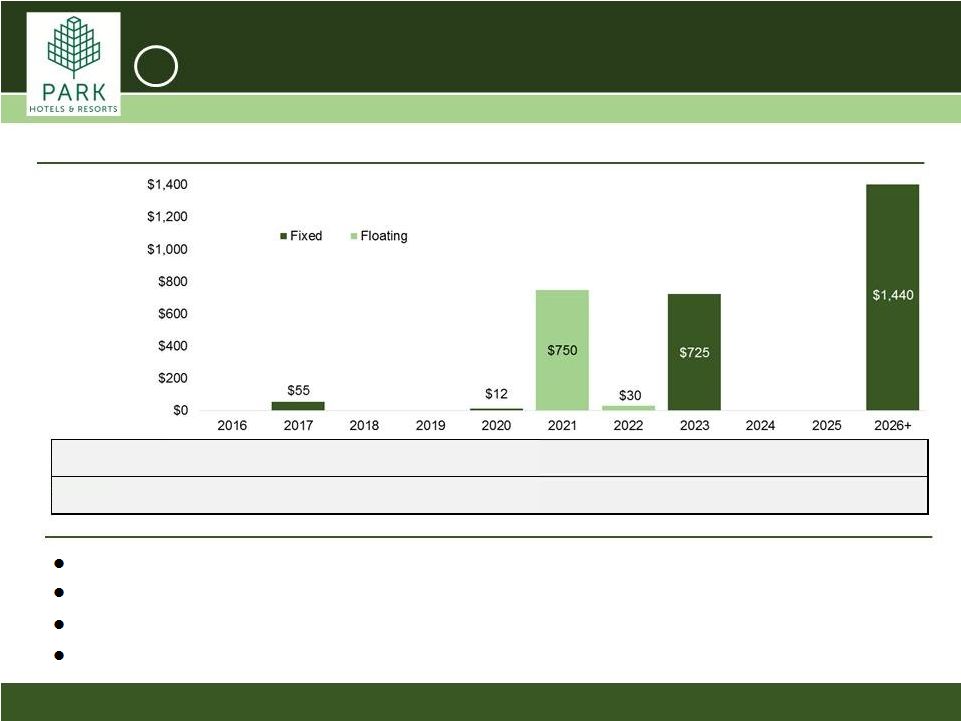 Strong and Flexible Balance Sheet Pro Forma Debt Maturity Schedule Weighted average maturity of almost eight years No meaningful maturities within the next five years $750mn of debt will be open to prepayment at par upon closing of the spin-off Approximately 50% of the debt capital stack open to prepayment at par in three years (1) Figures exclude pro rata share of Unconsolidated JV and capital leases ($ in millions) 5 (1) CONFIDENTIAL | 39 WA Fixed Rate Maturing Debt WA Floating Rate Maturing Debt 2.09% 2.89% - - - - - 4.11% - - 4.20% - - - - - - - 7.50% - - 3.55% |
 CONFIDENTIAL | 40 Investment Summary: Why Park Hotels & Resorts? Scale and Iconic Real Estate Iconic, irreplaceable assets with significant embedded value; replacement cost is estimated at $18.5bn or $525,000 per key Portfolio is well insulated from supply pressures, facing just 2.2% supply growth per annum over the next 2 years, or 50bp+ below peer average Park will rank as 24 th largest U.S. REIT and will be over 2.5x larger than the average lodging REIT (ex-HST). Historically, large cap REITs have enjoyed a 17% multiple premium over small cap peers (1) Significant Growth Profile Superior Balance Sheet and Liquidity Opportunity to actively asset manage the portfolio to help deliver strong internal growth Currently a 260bp Adjusted EBITDA margin gap between Park Hotels and its full-service lodging REIT peers. Each 50bp of Adjusted EBITDA margin improvement translates into $160mn of value creation (2) Utilize Park’s size and liquidity for strategic acquisitions, including single assets, portfolios and M&A Identified over a dozen hotels targeted for renovation (ROI projects), intends to invest nearly $200mn over the next several years, with targeted yields of 15% to 20% Maintains a very strong and flexible balance sheet with leverage of 4.0x at a weighted average cost of 3.7% 2% of debt maturing over the next 4 years (3) Park expected to have $1 billion under revolving credit facility to fund external growth opportunities (1) Per FactSet. Average of largest REITs’ multiple premium over respective subsector peers in the last five years (2) Assumes Adjusted EBITDA multiple of 11x (3) Excludes pro rata share of Unconsolidated JVs |
    Appendix Hilton New York Midtown |
 CONFIDENTIAL | 42 (1) Includes approximately 25 rooms that will become part of Hilton Grand Vacations prior to the completion of the spin-off (2) Includes approximately 600 rooms that will become part of Hilton Grand Vacations prior to the completion of the spin-off (3) Park Hotels & Resorts estimate Top 10 Assets Overview Iconic Assets Valued at Well Below Replacement Cost Hotel Rooms Meeting Space Replacement Cost (/ key) (3) Description Hilton Hawaiian Village Honolulu, Hawaii 2,860 96,000 (sq. ft.) $2.9bn ($1.0mn/key) 22-acre oceanfront resort along Waikiki Beach, with 145,000 sq. ft. of retail space Hilton San Francisco Union Square Parc 55 Hotel San Francisco San Francisco, California 1,919 1,024 136,000 32,000 $2.3bn ($775k/key) Two adjacent convention hotels together comprising 2,943 rooms with 160,000+ sq. ft. of meeting space spanning 1.5 city blocks in the Union Square area of San Francisco Hilton New York Midtown New York, New York 1,929 (1) 150,000 $2.0bn ($1.1mn/key) The hotel with the most meeting space in Manhattan, benefitting from 5,000 sq. ft. of highly desirable retail with frontage on Sixth Avenue Hilton Waikoloa Village Waikoloa Village, Hawaii 1,241 (2) 57,000 $1.0bn ($825k/key) 62-acre oceanfront resort on the Big Island of Hawaii Hilton Chicago Chicago, Illinois 1,544 190,000 $900mn ($580k/key) Convention hotel that covers a full city block in downtown Chicago Waldorf Astoria Orlando Hilton Orlando Bonnet Creek Orlando, Florida 498 1,001 34,000 113,000 $825mn ($550k/key) Secluded within a 482-acre nature preserve, the resort is located near Walt Disney World® with a Rees Jones designed championship golf course Hilton New Orleans Riverside New Orleans, Louisiana 1,622 143,000 $720mn ($445k/key) Overlooks the Mississippi River, adjacent to one of the largest U.S. convention centers and proximate to the French Quarter Waldorf Astoria Casa Marina Resort Key West, Florida 311 11,000 $348mn ($1.1mn/key) Landmark luxury beach resort in Key West overlooking nearly a quarter mile of private beachfront Top 10 Assets: Total Park Portfolio: 13,949 35,418 962,000 2,300,000+ $11.0bn ($790k/key) $18.5bn ($525k/key) Top 10 properties contributed ~61% of LTM Ownership EBITDA, while delivering annualized EBITDA growth of 11% over the last five years |
 CONFIDENTIAL | 43 Pro Forma Adjusted EBITDA (1) Waldorf=Astoria NY, Hilton Templepatrick and Doubletree Missoula included in historical GAAP results (2) Represents incremental fees based on the terms of the post spin management agreements with Hilton and the estimated excise taxes on certain REIT leases (3) Includes six properties acquired in 2015 in a 1031 Like-Kind Exchange and five Unconsolidated JVs that became Wholly-Owned properties in 2014, which were not included in historical GAAP results prior to 100% ownership FYE FYE FYE LTM ($ in millions) 2013 2014 2015 2016 GAAP Net Income 147 $ 181 $ 299 $ 191 $ Interest income (2) (1) (1) (1) Interest expense 162 186 186 188 Income tax expense 104 117 118 84 Depreciation and amortization expense 246 248 287 295 Interest, income tax and depreciation and amortization expenses 37 33 25 25 included in equity in earnings from investment in affiliates EBITDA 694 $ 764 $ 914 $ 782 $ Gain on sales of assets, net - - (143) (1) Gain on foreign currency transactions - (2) - - FF&E replacement reserve 1 2 2 2 Gain on debt extinguishment (68) - - - Impairment loss - - - 15 Other gain (loss), net - (25) 6 8 Other adjustment items 54 15 38 14 Adjusted EBITDA 681 $ 754 $ 817 $ 820 $ Less: Adjusted EBITDA from hotels disposed of (1) (79) (76) 1 (2) Spin-off adjustments (2) (67) (63) (57) (55) Add: Adjusted EBITDA from hotels prior to owning (3) 125 138 20 - Pro forma Adjusted EBITDA 660 $ 753 $ 781 $ 763 $ |
 CONFIDENTIAL | 44 Funds from Operations (1) Waldorf=Astoria NY, Hilton Templepatrick and Doubletree Missoula included in historical GAAP results. (2) Reflects adjustments to: (a) our historical debt and related balances and interest expense to give the net effect to financing transactions that will be completed prior to spin-off, (b) changes in expenses related to management and franchise agreements we will enter into with Hilton upon completion of the spin-off, (b) the removal of non-recurring separation expenses, and (d) the estimated excise taxes on certain REIT leases. (3) NAREIT FFO attributable to Parent means net income (loss) attributable to Parent (calculated in accordance with U.S. generally accepted accounting principles (“U.S. GAAP”)), excluding gains (losses) from sales of real estate, the cumulative effect of changes in accounting principles, real estate-related depreciation, amortization and impairments and adjustments for unconsolidated joint ventures. Adjustments for unconsolidated joint ventures are calculated to reflect our pro rata share of the FFO of those entities on the same basis. We calculate NAREIT FFO attributable to Parent for a given operating period in accordance with the guidelines of the National Association of Real Estate Investment Trusts (“NAREIT”). There were no adjustments to NAREIT FFO attributable to Parent during the LTM ended September 30, 2016. Historical Hotels Spin-off and Financing Pro Forma ($ in millions) LTM Disposed of (1) Adjustments (2) LTM Net income attributable to Parent 184 $ 16 $ 80 $ 280 $ Depreciation and amortization expense 295 (1) - 294 Impairment loss 15 (15) - - Gain on sales of assets, net (1) 1 - - Equity investment adjustments: - Equity in earnings from investments in affiliates (20) - - (20) Pro rata FFO of equity investments 38 - - 38 NAREIT and Adjusted FFO attributable to Parent (3) 511 $ 1 $ 80 $ 592 $ |
 CONFIDENTIAL | 45 Historical Operating Results – Consolidated Hotels (1) Includes periods prior to the Company’s ownership of the hotels and are pro forma adjusted for the incremental fees based on the terms of the post-spin management agreements with Hilton (2) Operational results of international properties reflected in 2016 FX currency neutral rates as September 30, 2016 (3) Financial results of international properties reflected using actual FX rates (4) See slide, “Reconciliation - Pro Forma Total Portfolio Revenue to Total GAAP Revenue and Pro Forma Hotel EBITDA Margin" for reconciliation to Total GAAP Revenue The following table presents the historical operating results of the Consolidated Hotels (1) : 2015 2016 ($ in millions) Q1A Q2A Q3A Q4A FYE Q1A Q2A Q3A Room Count 30,624 30,639 30,660 30,676 30,627 30,627 30,631 30,612 30,627 30,291 30,345 30,343 30,343 RevPar (2) 123.73 $ 133.53 $ 143.19 $ 153.63 $ 149.29 $ 169.44 $ 165.73 $ 156.63 $ 160.31 $ 154.87 $ 169.64 $ 164.92 $ 161.50 $ RevPar Growth % n/a 7.9% 7.2% 7.3% n/a n/a n/a n/a 4.3% 3.7% 0.1% (0.5%) 0.7% Total RevPar (2) 184.77 $ 195.67 $ 210.59 $ 226.47 $ 229.33 $ 256.31 $ 238.31 $ 236.83 $ 240.21 $ 237.22 $ 259.19 $ 239.09 $ 243.04 $ Total RevPar Growth % n/a 5.9% 7.6% 7.5% n/a n/a n/a n/a 6.1% 3.4% 1.1% 0.3% 1.2% ADR (2) 166.20 $ 174.21 $ 181.29 $ 189.86 $ 191.01 $ 197.00 $ 195.03 $ 200.24 $ 195.85 $ 200.58 $ 201.04 $ 198.50 $ 200.08 $ ADR Growth % n/a 4.8% 4.1% 4.7% n/a n/a n/a n/a 3.2% 5.0% 2.1% 1.8% 2.2% Occupancy % 74.5% 76.6% 79.0% 80.9% 78.2% 86.0% 85.0% 78.2% 81.9% 77.2% 84.4% 83.1% 80.7% Occupancy Growth (bps) n/a 220 bps 234 bps 193 bps n/a n/a n/a n/a 93 bps (95) bps (163) bps (190) bps (113) bps Pro Forma Revenue Summary (3) Room 1,421 $ 1,527 $ 1,628 $ 1,748 $ 414 $ 475 $ 469 $ 443 $ 1,801 $ 427 $ 469 $ 460 $ 1,799 $ F&B 559 564 594 632 172 192 154 177 695 178 199 156 710 Other 134 146 169 193 50 51 51 49 201 51 49 51 200 Pro Forma Hotel Revenue (4) 2,114 $ 2,237 $ 2,391 $ 2,573 $ 636 $ 718 $ 674 $ 669 $ 2,697 $ 656 $ 717 $ 667 $ 2,709 $ Departmental & Other Expenses 1,534 1,574 1,605 1,685 432 454 445 446 1,777 451 463 447 1,807 Management Fees, pro forma 103 112 124 135 33 38 35 34 140 33 38 34 139 Pro Forma Hotel Adjusted EBITDA 477 $ 551 $ 662 $ 753 $ 171 $ 226 $ 194 $ 189 $ 780 $ 172 $ 216 $ 186 $ 763 $ Pro Forma Hotel Adjusted EBITDA Margin % 22.5% 24.6% 27.6% 29.3% 26.8% 31.5% 28.8% 28.3% 28.9% 26.2% 30.1% 27.8% 28.2% LTM 2011A 2012A 2013A 2014A |
 CONFIDENTIAL | 46 Historical Operating Results – Top 10 Hotels (1) Includes periods prior to the Company’s ownership of the hotels and are pro forma adjusted for the incremental fees based on the terms of the post-spin management agreements with Hilton The following table presents the historical operating results of the Top 10 properties (1) as measured by 2015 Hotel EBITDA: 2015 2016 ($ in millions) Q1A Q2A Q3A Q4A FYE Q1A Q2A Q3A Room Count 13,978 13,980 13,981 13,996 13,948 13,948 13,952 13,953 13,951 13,904 13,953 13,951 13,951 RevPar 157.71 $ 170.93 $ 184.55 $ 195.20 $ 182.70 $ 211.77 $ 206.16 $ 206.27 $ 201.78 $ 193.89 $ 210.88 $ 204.73 $ 203.96 $ RevPar Growth % n/a 8.4% 8.0% 5.8% n/a n/a n/a n/a 3.4% 6.1% (0.4%) (0.7%) 1.1% Total RevPar 239.27 $ 253.88 $ 277.42 $ 297.18 $ 294.27 $ 335.48 $ 306.48 $ 317.10 $ 313.38 $ 310.86 $ 337.26 $ 307.88 $ 318.25 $ Total RevPar Growth % n/a 6.1% 9.3% 7.1% n/a n/a n/a n/a 5.5% 5.6% 0.5% 0.5% 1.6% ADR 202.54 $ 215.49 $ 225.34 $ 234.70 $ 229.70 $ 239.19 $ 236.68 $ 251.33 $ 239.31 $ 244.52 $ 243.64 $ 239.87 $ 244.78 $ ADR Growth % n/a 6.4% 4.6% 4.2% n/a n/a n/a n/a 2.0% 6.5% 1.9% 1.3% 2.3% Occupancy % 77.9% 79.3% 81.9% 83.2% 79.5% 88.5% 87.1% 82.1% 84.3% 79.3% 86.6% 85.4% 83.3% Occupancy Growth (bps) n/a 146 bps 257 bps 127 bps n/a n/a n/a n/a 116 bps (24) bps (198) bps (175) bps (100) bps Pro Forma Revenue Summary Room 805 $ 875 $ 942 $ 997 $ 229 $ 269 $ 265 $ 265 $ 1,028 $ 246 $ 268 $ 263 $ 1,042 $ F&B 325 328 353 382 106 121 92 107 426 113 127 97 444 Other 91 96 121 139 35 36 36 35 142 35 34 35 139 Pro Forma Hotel Revenue 1,221 $ 1,299 $ 1,416 $ 1,518 $ 370 $ 426 $ 393 $ 407 $ 1,596 $ 394 $ 429 $ 395 $ 1,625 $ Departmental & Other Expenses 864 886 914 959 247 263 254 257 1,021 262 269 259 1,047 Management Fees, pro forma 61 67 76 82 19 23 21 22 85 21 23 21 86 Pro Forma Hotel Adjusted EBITDA 296 $ 346 $ 426 $ 477 $ 104 $ 140 $ 118 $ 128 $ 490 $ 111 $ 137 $ 115 $ 492 $ Pro Forma Hotel Adjusted EBITDA Margin % 24.2% 26.6% 30.1% 31.4% 28.1% 33.0% 30.0% 31.4% 30.7% 28.2% 32.1% 29.2% 30.3% LTM 2011A 2012A 2013A 2014A |
 CONFIDENTIAL | 47 Unconsolidated Joint Venture EBITDA Segmentation by Market Historical Operating Results – Other (1) EBITDA shown at pro rata ownership share (2) Year-to-date as of September 30, 2016 (3) Includes spin-off related and other transaction expenses and acquisition costs (4) As shown in the Combined Consolidated Statements of Comprehensive Income per the Form 10 (5) Includes three laundry facilities Pro Forma Unconsolidated Joint Venture EBITDA ($ in millions) 2015 LTM Pro Forma Unconsolidated JV EBITDA (9 hotels) (1) 46 $ 45 $ Bridge from Corporate G&A to Corporate Expense and Other ($ in millions) Corporate G&A Expense 45 $ 35 $ 44 $ Adjustments: Add: Transaction Expenses & Other (3) 38 11 13 Add: Laundry Expense 13 10 15 Total Adjustments 51 $ 21 $ 28 $ Corporate Expense and Other (4) 96 $ 56 $ 72 $ LTM YTD (2) 2015A Laundry Facilities (5) ($ in millions) Revenue 13 $ 14 $ Expenses 13 $ 15 $ 2015A LTM Southern California Northern Florida International Washington DC Metro New Jersey Nevada 35% 25% 19% 16% 3% 2% |
 CONFIDENTIAL | 48 Pro Forma Debt Profile and Pro Forma Capitalization Pro Forma Debt Profile ($ in millions) Tranche Amount Maturity Rate Amortization Senior Unsecured Revolver $1,000 (undrawn) 5 years L+1.50% (1) Interest only Senior Unsecured Term Loan A $750 5 years L+1.45% (1) Interest only CMBS Loan - HHV $1,275 10 years 4.1995% Interest only CMBS Loan - SF/Parc55 $725 7 years 4.1145% Interest only Senior Unsecured Notes due 2017 $55 1 year 7.5000% Interest only DT Santa Barbara - Fess Parker Loan $165 10 years 4.1700% Interest only through 2021; 30 year amortization thereafter DT Ontario Loan $30 5 years L+2.50% Interest only through 2020; 25 year amortization thereafter DT Spokane Loan $12 4 years 3.5500% Interest only (1) Spread adjusted based on leverage metrics as defined in the credit agreement (2) Reflects repayment of existing $104 million loan and issuance of new $165 million loan closed in November 2016 (3) Includes two capital lease obligations (4) $1.275 billion loan secured by HLT Hawaiian Village hotel closed in October 2016 (5) $725 million loan secured by Hilton San Francisco Union Square and Parc 55 hotels closed in October 2016 (6) Credit facility expected to close by mid December 2016; Revolver undrawn at time of spin (7) $8 million unamortized deferred financing costs related to Revolver not included in FY2016E long term debt balance Pro Forma Capitalization Pro Forma Pro Forma Capitalization Adjustments Capitalization Adjustments Recapitalization ($ in millions) as of 12/31/2015 through Q3 2016 as of 9/30/2016 & Q4 Activity FY2016E CMBS Loan 3,418 $ (991) $ 2,427 $ (2,427) $ - $ Bonnet Creek Loan 450 (4) 446 (446) - DT Santa Barbara - Fess Parker Loan (2) 104 - 104 61 165 Senior Unsecured Notes due 2017 55 - 55 - 55 DT Ontario AP Loan 30 - 30 - 30 Capitalized Leases (3) 17 (2) 15 - 15 DT Spokane Loan 12 - 12 - 12 CMBS Loan - HHV (4) - - - 1,275 1,275 CMBS Loan - SF/Parc55 (5) - - - 725 725 Senior Unsecured Term Loan A (6) - - - 750 750 Senior Unsecured Revolver (6) - - - - - Long Term Debt 4,086 $ (997) $ 3,089 $ (62) $ 3,027 $ Less: Unamortized Deferred Financing Costs (7) (29) 13 (16) (4) (20) Total Long Term Debt 4,057 $ (984) $ 3,073 $ (66) $ 3,007 $ |
 Hilton Hawaiian Village 1 Hilton Waikoloa Village Reconciliations |
 CONFIDENTIAL | 50 Reconciliation – GAAP Net Income to Pro Forma Ownership EBITDA (1) Includes Wholly-Owned, Consolidated JVs and Unconsolidated JVs at pro rata equity share (2) Waldorf=Astoria NY, Hilton Templepatrick and Doubletree Missoula included in historical GAAP results (3) Represents incremental fees based on the terms of the post spin management agreements with Hilton and the estimated excise taxes on certain REIT leases (4) Includes six properties acquired in 2015 in a 1031 Like-Kind Exchange and five Unconsolidated JVs that became Wholly-Owned properties in 2014, which were not included in historical GAAP results prior to 100% ownership FYE FYE FYE FYE FYE LTM ($ in millions) 2011 2012 2013 2014 2015 2016 GAAP Net Income (44) $ 59 $ 147 $ 181 $ 299 $ 190 $ Other revenue (10) (10) (10) (10) (13) (14) Impairment loss 5 23 - - - 15 Depreciation and amortization expense 239 228 246 248 287 295 Corporate and other expense 54 64 103 67 96 72 Gain on sales of assets, net - - - - (143) (1) Interest income (3) (2) (2) (1) (1) (1) Interest expense 176 153 162 186 186 188 161 37 37 33 25 25 Gain on foreign currency transactions - 1 - (2) - - Gain on extinguishment of debt - - (68) - - - Other gain (loss), net - - - (25) 6 8 Income tax expense (28) 54 104 117 118 84 FF&E replacement reserve 4 2 1 2 2 2 Ownership EBITDA (1) 554 $ 609 $ 720 $ 796 $ 862 $ 863 $ Less: Adjusted EBITDA from hotels disposed of (2) (71) (68) (79) (76) 1 - Spin-off adjustments (3) (56) (61) (67) (63) (57) (55) Add: Adjusted EBITDA from hotels prior to owning (4) 83 106 125 138 20 - Pro forma Ownership EBITDA 510 $ 586 $ 699 $ 795 $ 826 $ 808 $ Interest, income tax and depreciation and amortization expenses included in equity in earnings from investment in affiliates |
 CONFIDENTIAL | 51 Reconciliation – Pro Forma Hotel Adjusted EBITDA to Ownership EBITDA (1) Waldorf=Astoria NY, HLT Templepatrick and DT Missoula included in historical GAAP results (2) Represents incremental fees based on the terms of the post spin management agreements with Hilton and the estimated excise taxes on certain REIT leases (3) Includes six properties acquired in 2015 in a 1031 Like-Kind Exchange and five Unconsolidated JVs that became Wholly-Owned properties in 2014, which were not included in historical GAAP results prior to 100% ownership (4) Excludes Unconsolidated JVs (5) See slide, “Reconciliation – GAAP Net Income to Pro Forma Ownership EBITDA” for reconciliation to GAAP Net Income FYE FYE FYE FYE FYE LTM ($ in millions) 2011 2012 2013 2014 2015 2016 Pro forma Hotel Adjusted EBITDA 477 $ 551 $ 662 $ 753 $ 780 $ 763 $ Add: Adjusted EBITDA from hotels disposed of (1) 58 54 64 67 (2) 1 Spin-off adjustments (2) 56 61 67 63 57 55 Less: Adjusted EBITDA from hotels prior to owning (3) (82) (105) (123) (136) (20) - Hotel Adjusted EBITDA (4) 509 561 670 747 815 819 Pro forma Adjusted EBITDA from Unconsolidated JVs 33 35 37 42 46 45 Add: Adjusted EBITDA from hotels disposed of (1) 13 14 15 9 1 - Less: Adjusted EBITDA from hotels prior to owning (3) (1) (1) (2) (2) - - Adjusted EBITDA from Unconsolidated JVs 45 48 50 49 47 45 Ownership EBITDA 554 $ 609 $ 720 $ 796 $ 862 $ 864 $ Pro forma Hotel Adjusted EBITDA 477 $ 551 $ 662 $ 753 $ 780 $ 763 $ Pro forma Adjusted EBITDA from Unconsolidated JVs 33 35 37 42 46 45 Pro forma Ownership EBITDA (5) 510 $ 586 $ 699 $ 795 $ 826 $ 808 $ |
 CONFIDENTIAL | 52 Reconciliation – Pro Forma Total Portfolio Revenue to Total GAAP Revenue and Pro Forma Hotel Adjusted EBITDA Margin (1) Total Portfolio Revenue consists of all Company revenues, including revenues from our Wholly-Owned, Consolidated JVs, Unconsolidated JVs, and Laundry facilities (2) Waldorf=Astoria NY, Hilton Templepatrick and Doubletree Missoula included in historical GAAP results (3) Includes six properties acquired in 2015 in a 1031 Like-Kind Exchange and five Unconsolidated JVs that became Wholly-Owned properties in 2014, which were not included in historical GAAP results prior to 100% ownership (4) See slide, “Reconciliation – Pro Forma Hotel Adjusted EBITDA to Ownership EBITDA” for reconciliation FYE FYE FYE FYE FYE LTM ($ in millions) 2011 2012 2013 2014 2015 2016 Pro forma Total Portfolio Revenue (1) 2,230 $ 2,358 $ 2,516 $ 2,707 $ 2,840 $ 2,855 $ Less: Pro rata share from Unconsolidated JVs (106) (111) (115) (124) (130) (133) Less: Revenue from Laundry facilities (10) (10) (10) (10) (13) (13) Pro forma Hotel Revenue 2,114 2,237 2,391 2,573 2,697 2,709 Add: Revenue from Laundry facilities 10 10 10 10 13 13 Add: Revenue from hotels disposed of (2) 276 275 289 298 30 10 Less: Revenue from hotels prior to owning (3) (299) (332) (357) (368) (52) - Total GAAP Revenue 2,101 $ 2,190 $ 2,333 $ 2,513 $ 2,688 $ 2,732 $ Pro forma Hotel Revenue 2,114 $ 2,237 $ 2,391 $ 2,573 $ 2,697 $ 2,709 $ Pro forma Hotel Adjusted EBITDA (4) 477 $ 551 $ 662 $ 753 $ 780 $ 763 $ Pro forma Hotel Adjusted EBITDA Margin 22.6% 24.6% 27.7% 29.3% 28.9% 28.2% |
 CONFIDENTIAL | 53 Defined Terms LTM Last twelve months as of September 30, 2016, unless stated otherwise Replacement Cost Replacement cost is the cost of developing a property similar to the subject property and includes the following elements: land value; building construction cost; furniture, fixtures, and equipment (FF&E) cost; soft costs; opening costs; and developer's costs. Replacement cost reflected in this presentation are internal Park estimates Wholly-Owned Includes all properties that are owned at 100% equity Consolidated JVs Represents entities in which Park has a controlling financial interest Unconsolidated JVs Represents entities in which Park does not have a controlling financial interest EBITDA (Includes all JV interests) EBITDA reflects net income excluding interest expense, a provision for income taxes and depreciation and amortization. We consider EBITDA to be a useful measure for investors in evaluating and facilitating comparisons of our operating performance between periods and between REITs by removing the impact of our capital structure (primarily interest expense) and asset base (primarily depreciation and amortization) from our operating results Adjusted EBITDA (Includes all JV interests) Adjusted EBITDA is calculated as EBITDA, as previously defined, further adjusted to exclude gains, losses and expenses in connection with: (i) asset dispositions for both consolidated and unconsolidated investments; (ii) foreign currency transactions; (iii) debt restructurings/retirements; (iv) non-cash impairment losses; (v) furniture, fixtures and equipment (“FF&E”) replacement reserves required by certain lease agreements; (vi) reorganization costs; (vii) share-based and certain other compensation expenses; (viii) severance, relocation and other expenses; and (ix) other items Ownership EBITDA (Includes all JV interests) Ownership Segment Adjusted EBITDA (“Ownership EBITDA”) is Hotel Adjusted EBITDA plus pro rata share of Adjusted EBITDA from Unconsolidated JVs. We present Ownership EBITDA to help us and our investors evaluate the ongoing operating performance of our entire portfolio of hotels Hotel Adjusted EBITDA (Excludes UJV interests) Consolidated Hotel Adjusted EBITDA (“Hotel Adjusted EBITDA”) measures property-level results before debt service, depreciation and corporate expenses for our consolidated properties, excluding properties owned by Unconsolidated JVs, and is a key measure of our profitability. We present Hotel Adjusted EBITDA to help us and our investors evaluate the ongoing operating performance of our consolidated properties |