
` Exhibit 99.2
1

2
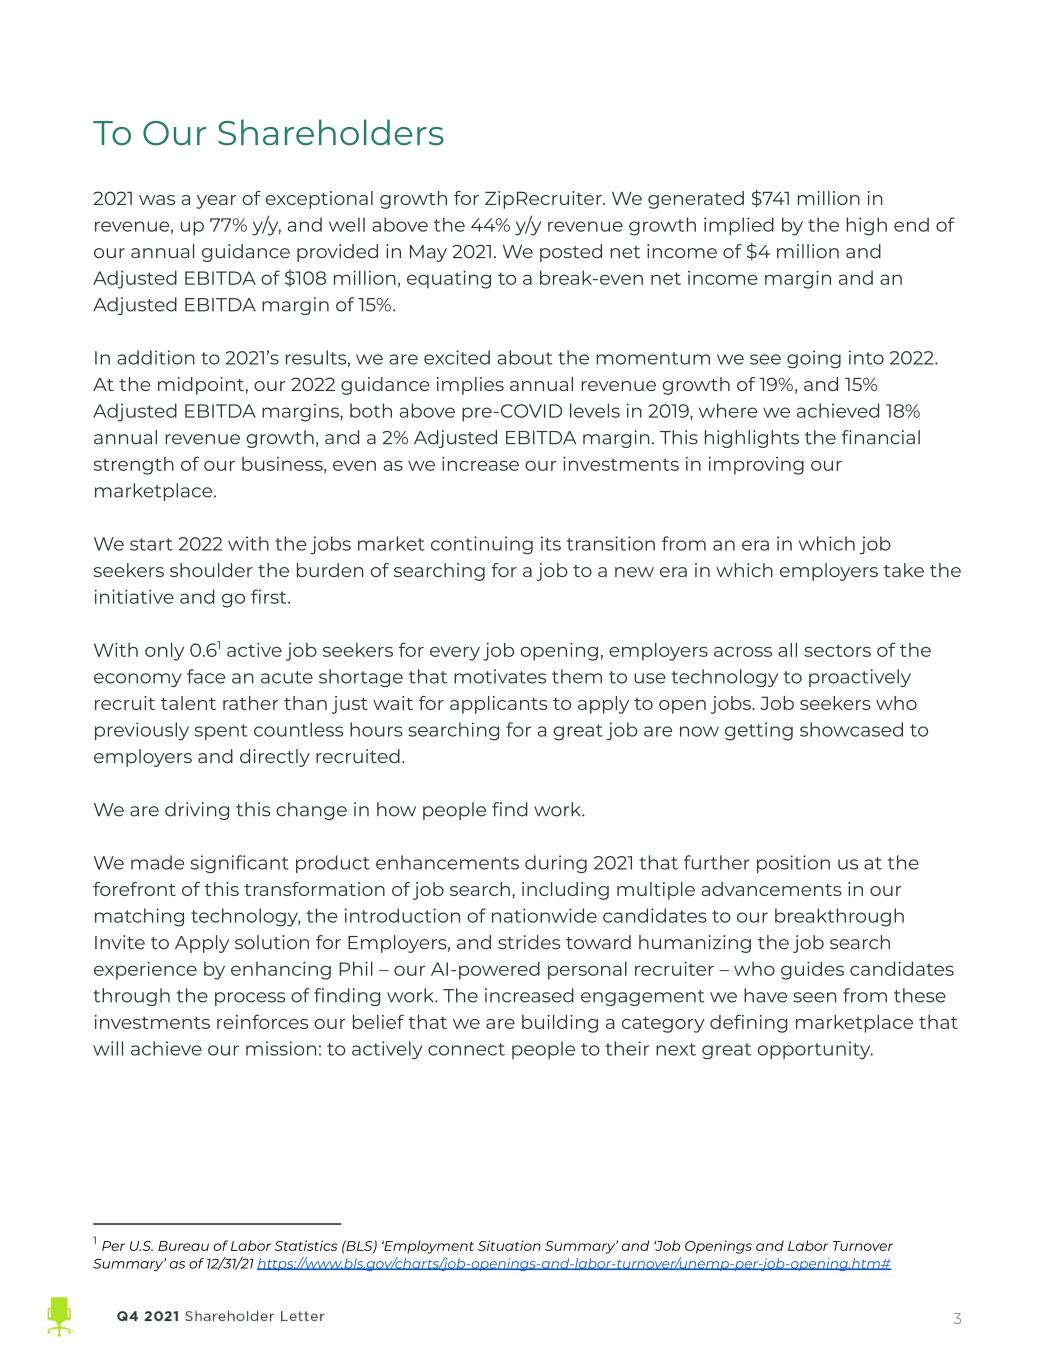
To Our Shareholders 2021 was a year of exceptional growth for ZipRecruiter. We generated $741 million in revenue, up 77% y/y, and well above the 44% y/y revenue growth implied by the high end of our annual guidance provided in May 2021. We posted net income of $4 million and Adjusted EBITDA of $108 million, equating to a break-even net income margin and an Adjusted EBITDA margin of 15%. In addition to 2021’s results, we are excited about the momentum we see going into 2022. At the midpoint, our 2022 guidance implies annual revenue growth of 19%, and 15% Adjusted EBITDA margins, both above pre-COVID levels in 2019, where we achieved 18% annual revenue growth, and a 2% Adjusted EBITDA margin. This highlights the financial strength of our business, even as we increase our investments in improving our marketplace. We start 2022 with the jobs market continuing its transition from an era in which job seekers shoulder the burden of searching for a job to a new era in which employers take the initiative and go first. With only 0.61 active job seekers for every job opening, employers across all sectors of the economy face an acute shortage that motivates them to use technology to proactively recruit talent rather than just wait for applicants to apply to open jobs. Job seekers who previously spent countless hours searching for a great job are now getting showcased to employers and directly recruited. We are driving this change in how people find work. We made significant product enhancements during 2021 that further position us at the forefront of this transformation of job search, including multiple advancements in our matching technology, the introduction of nationwide candidates to our breakthrough Invite to Apply solution for Employers, and strides toward humanizing the job search experience by enhancing Phil – our AI-powered personal recruiter – who guides candidates through the process of finding work. The increased engagement we have seen from these investments reinforces our belief that we are building a category defining marketplace that will achieve our mission: to actively connect people to their next great opportunity. 1 Per U.S. Bureau of Labor Statistics (BLS) ‘Employment Situation Summary’ and ‘Job Openings and Labor Turnover Summary’ as of 12/31/21 https://www.bls.gov/charts/job-openings-and-labor-turnover/unemp-per-job-opening.htm# 3
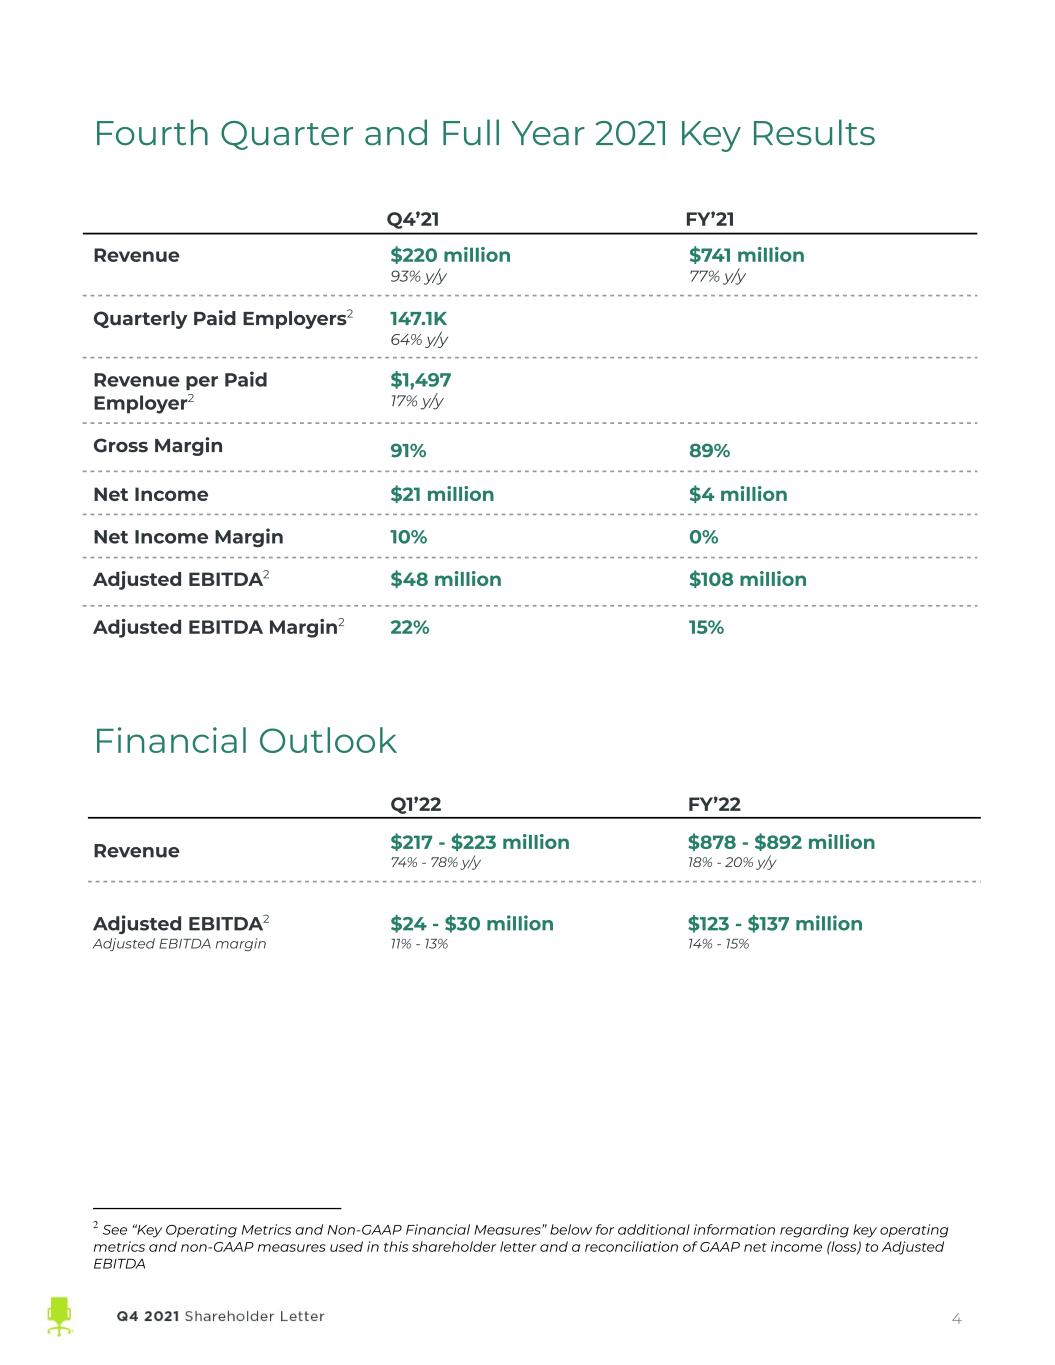
Fourth Quarter and Full Year 2021 Key Results Q4’21 FY’21 Revenue $220 million 93% y/y $741 million 77% y/y Quarterly Paid Employers2 147.1K 64% y/y Revenue per Paid Employer2 $1,497 17% y/y Gross Margin 91% 89% Net Income $21 million $4 million Net Income Margin 10% 0% Adjusted EBITDA2 $48 million $108 million Adjusted EBITDA Margin2 22% 15% Financial Outlook Q1’22 FY’22 Revenue $217 - $223 million 74% - 78% y/y $878 - $892 million 18% - 20% y/y Adjusted EBITDA2 Adjusted EBITDA margin $24 - $30 million 11% - 13% $123 - $137 million 14% - 15% 2 See “Key Operating Metrics and Non-GAAP Financial Measures” below for additional information regarding key operating metrics and non-GAAP measures used in this shareholder letter and a reconciliation of GAAP net income (loss) to Adjusted EBITDA 4
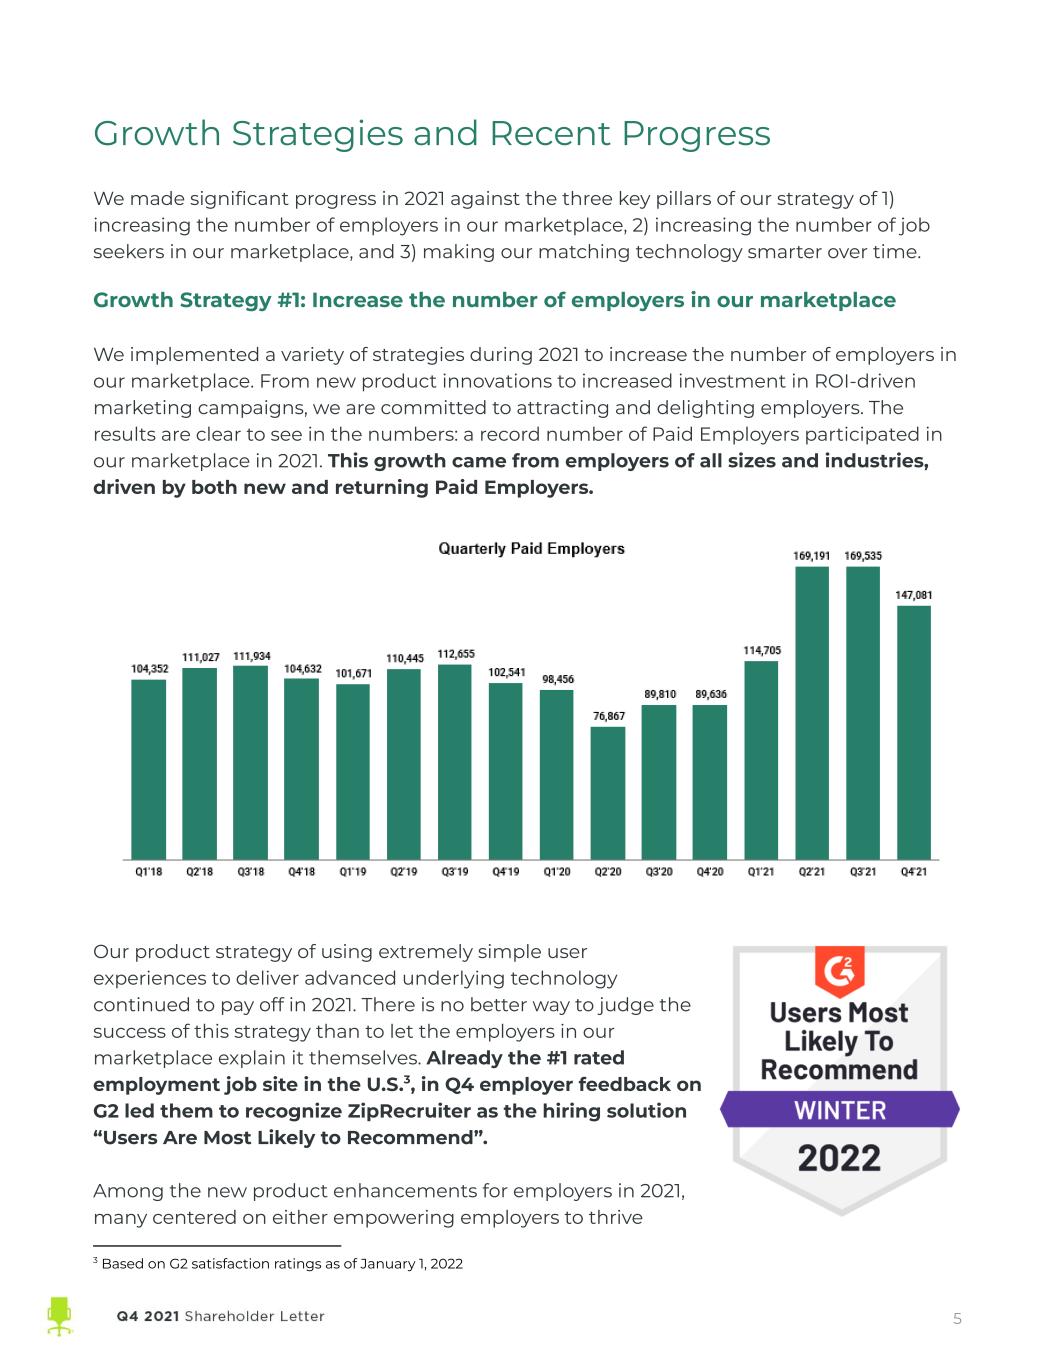
Growth Strategies and Recent Progress We made significant progress in 2021 against the three key pillars of our strategy of 1) increasing the number of employers in our marketplace, 2) increasing the number of job seekers in our marketplace, and 3) making our matching technology smarter over time. Growth Strategy #1: Increase the number of employers in our marketplace We implemented a variety of strategies during 2021 to increase the number of employers in our marketplace. From new product innovations to increased investment in ROI-driven marketing campaigns, we are committed to attracting and delighting employers. The results are clear to see in the numbers: a record number of Paid Employers participated in our marketplace in 2021. This growth came from employers of all sizes and industries, driven by both new and returning Paid Employers. Our product strategy of using extremely simple user experiences to deliver advanced underlying technology continued to pay off in 2021. There is no better way to judge the success of this strategy than to let the employers in our marketplace explain it themselves. Already the #1 rated employment job site in the U.S.3, in Q4 employer feedback on G2 led them to recognize ZipRecruiter as the hiring solution “Users Are Most Likely to Recommend”. Among the new product enhancements for employers in 2021, many centered on either empowering employers to thrive 3 Based on G2 satisfaction ratings as of January 1, 2022 5
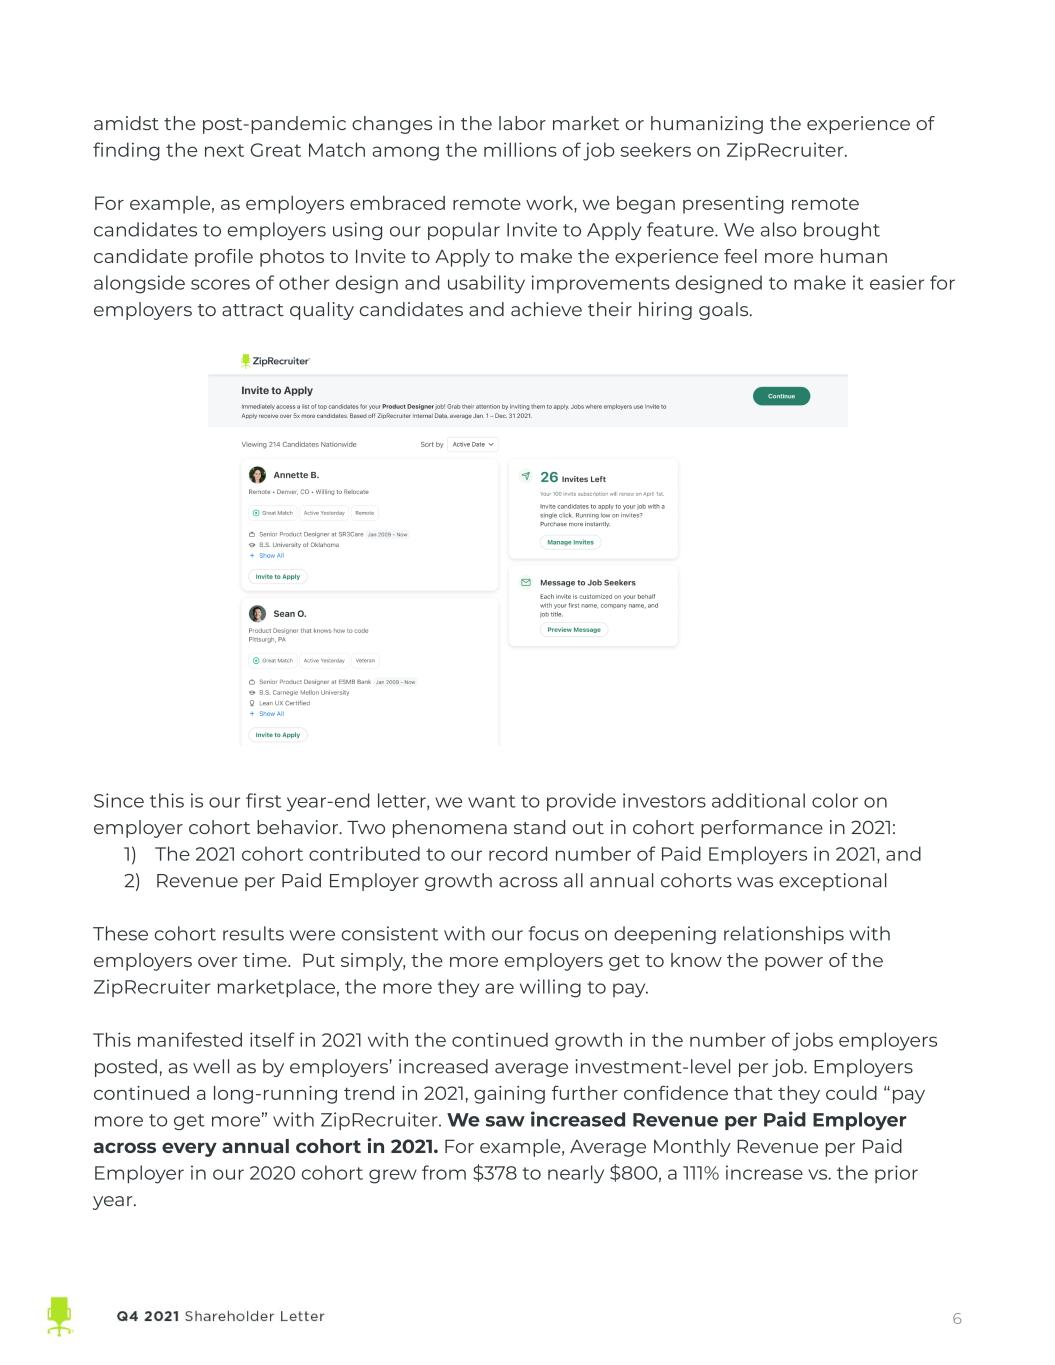
amidst the post-pandemic changes in the labor market or humanizing the experience of finding the next Great Match among the millions of job seekers on ZipRecruiter. For example, as employers embraced remote work, we began presenting remote candidates to employers using our popular Invite to Apply feature. We also brought candidate profile photos to Invite to Apply to make the experience feel more human alongside scores of other design and usability improvements designed to make it easier for employers to attract quality candidates and achieve their hiring goals. Since this is our first year-end letter, we want to provide investors additional color on employer cohort behavior. Two phenomena stand out in cohort performance in 2021: 1) The 2021 cohort contributed to our record number of Paid Employers in 2021, and 2) Revenue per Paid Employer growth across all annual cohorts was exceptional These cohort results were consistent with our focus on deepening relationships with employers over time. Put simply, the more employers get to know the power of the ZipRecruiter marketplace, the more they are willing to pay. This manifested itself in 2021 with the continued growth in the number of jobs employers posted, as well as by employers’ increased average investment-level per job. Employers continued a long-running trend in 2021, gaining further confidence that they could “pay more to get more” with ZipRecruiter. We saw increased Revenue per Paid Employer across every annual cohort in 2021. For example, Average Monthly Revenue per Paid Employer in our 2020 cohort grew from $378 to nearly $800, a 111% increase vs. the prior year. 6
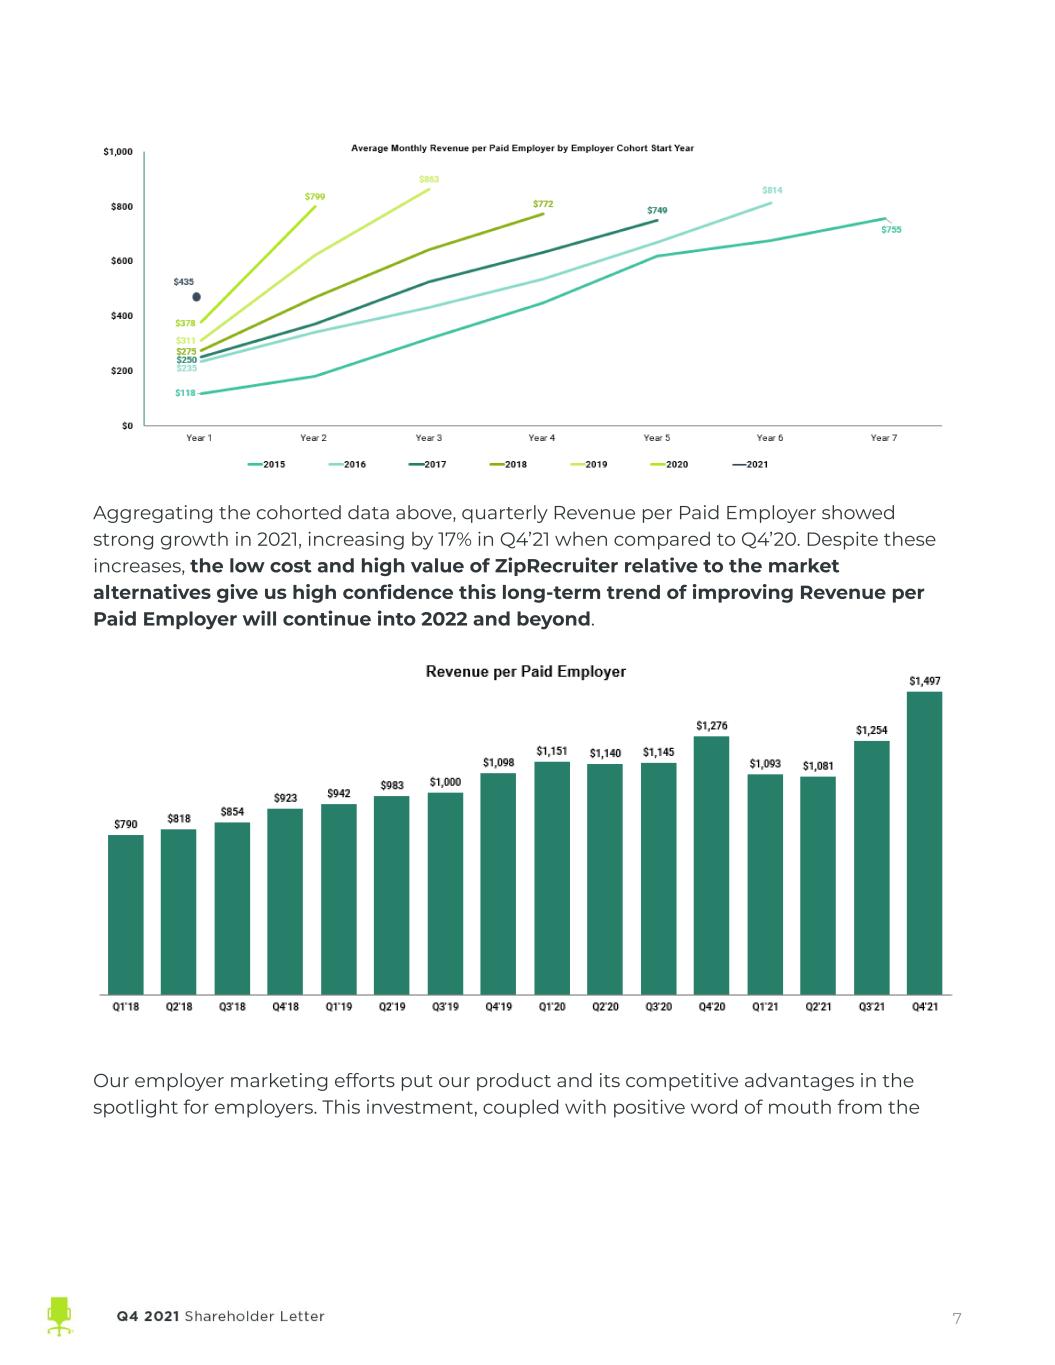
Aggregating the cohorted data above, quarterly Revenue per Paid Employer showed strong growth in 2021, increasing by 17% in Q4’21 when compared to Q4’20. Despite these increases, the low cost and high value of ZipRecruiter relative to the market alternatives give us high confidence this long-term trend of improving Revenue per Paid Employer will continue into 2022 and beyond. Our employer marketing efforts put our product and its competitive advantages in the spotlight for employers. This investment, coupled with positive word of mouth from the 7
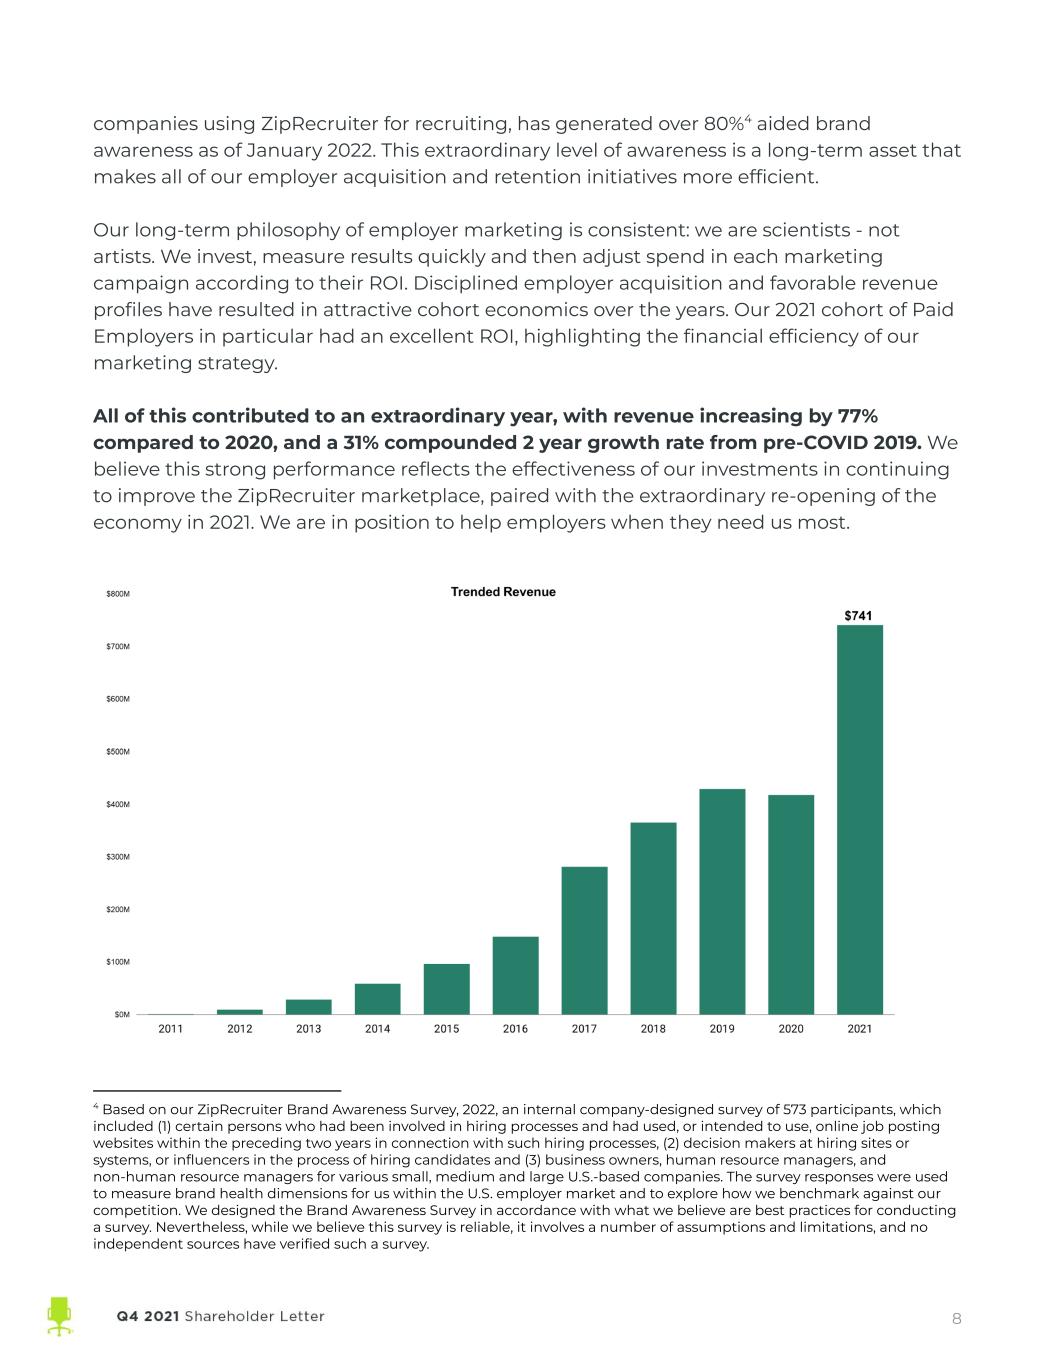
companies using ZipRecruiter for recruiting, has generated over 80%4 aided brand awareness as of January 2022. This extraordinary level of awareness is a long-term asset that makes all of our employer acquisition and retention initiatives more efficient. Our long-term philosophy of employer marketing is consistent: we are scientists - not artists. We invest, measure results quickly and then adjust spend in each marketing campaign according to their ROI. Disciplined employer acquisition and favorable revenue profiles have resulted in attractive cohort economics over the years. Our 2021 cohort of Paid Employers in particular had an excellent ROI, highlighting the financial efficiency of our marketing strategy. All of this contributed to an extraordinary year, with revenue increasing by 77% compared to 2020, and a 31% compounded 2 year growth rate from pre-COVID 2019. We believe this strong performance reflects the effectiveness of our investments in continuing to improve the ZipRecruiter marketplace, paired with the extraordinary re-opening of the economy in 2021. We are in position to help employers when they need us most. 4 Based on our ZipRecruiter Brand Awareness Survey, 2022, an internal company-designed survey of 573 participants, which included (1) certain persons who had been involved in hiring processes and had used, or intended to use, online job posting websites within the preceding two years in connection with such hiring processes, (2) decision makers at hiring sites or systems, or influencers in the process of hiring candidates and (3) business owners, human resource managers, and non-human resource managers for various small, medium and large U.S.-based companies. The survey responses were used to measure brand health dimensions for us within the U.S. employer market and to explore how we benchmark against our competition. We designed the Brand Awareness Survey in accordance with what we believe are best practices for conducting a survey. Nevertheless, while we believe this survey is reliable, it involves a number of assumptions and limitations, and no independent sources have verified such a survey. 8
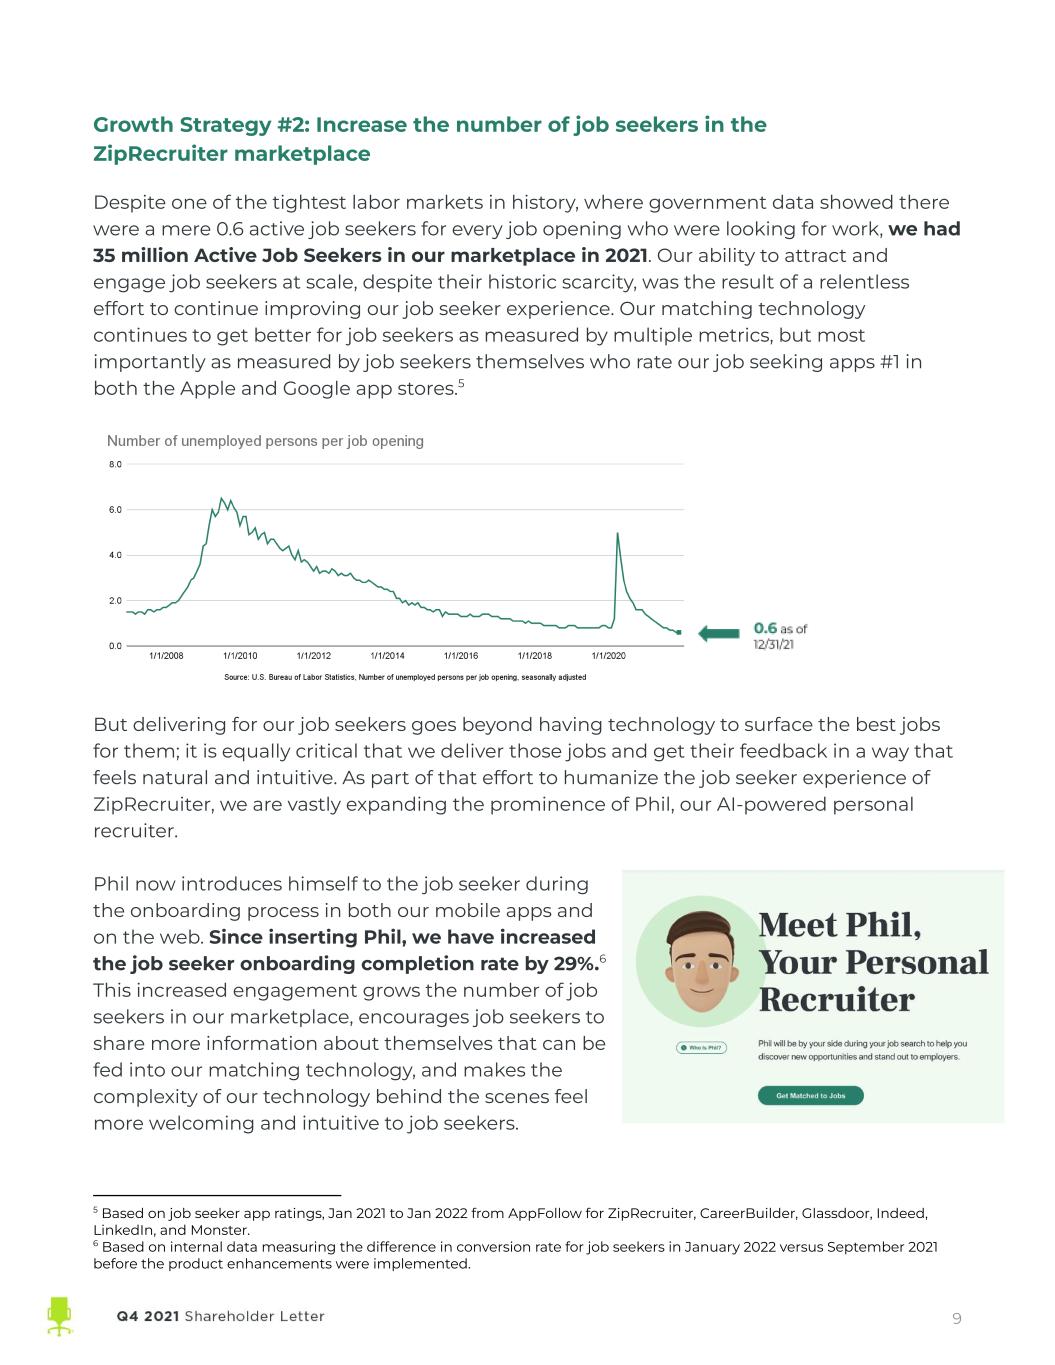
Growth Strategy #2: Increase the number of job seekers in the ZipRecruiter marketplace Despite one of the tightest labor markets in history, where government data showed there were a mere 0.6 active job seekers for every job opening who were looking for work, we had 35 million Active Job Seekers in our marketplace in 2021. Our ability to attract and engage job seekers at scale, despite their historic scarcity, was the result of a relentless effort to continue improving our job seeker experience. Our matching technology continues to get better for job seekers as measured by multiple metrics, but most importantly as measured by job seekers themselves who rate our job seeking apps #1 in both the Apple and Google app stores.5 But delivering for our job seekers goes beyond having technology to surface the best jobs for them; it is equally critical that we deliver those jobs and get their feedback in a way that feels natural and intuitive. As part of that effort to humanize the job seeker experience of ZipRecruiter, we are vastly expanding the prominence of Phil, our AI-powered personal recruiter. Phil now introduces himself to the job seeker during the onboarding process in both our mobile apps and on the web. Since inserting Phil, we have increased the job seeker onboarding completion rate by 29%.6 This increased engagement grows the number of job seekers in our marketplace, encourages job seekers to share more information about themselves that can be fed into our matching technology, and makes the complexity of our technology behind the scenes feel more welcoming and intuitive to job seekers. 6 Based on internal data measuring the difference in conversion rate for job seekers in January 2022 versus September 2021 before the product enhancements were implemented. 5 Based on job seeker app ratings, Jan 2021 to Jan 2022 from AppFollow for ZipRecruiter, CareerBuilder, Glassdoor, Indeed, LinkedIn, and Monster. 9
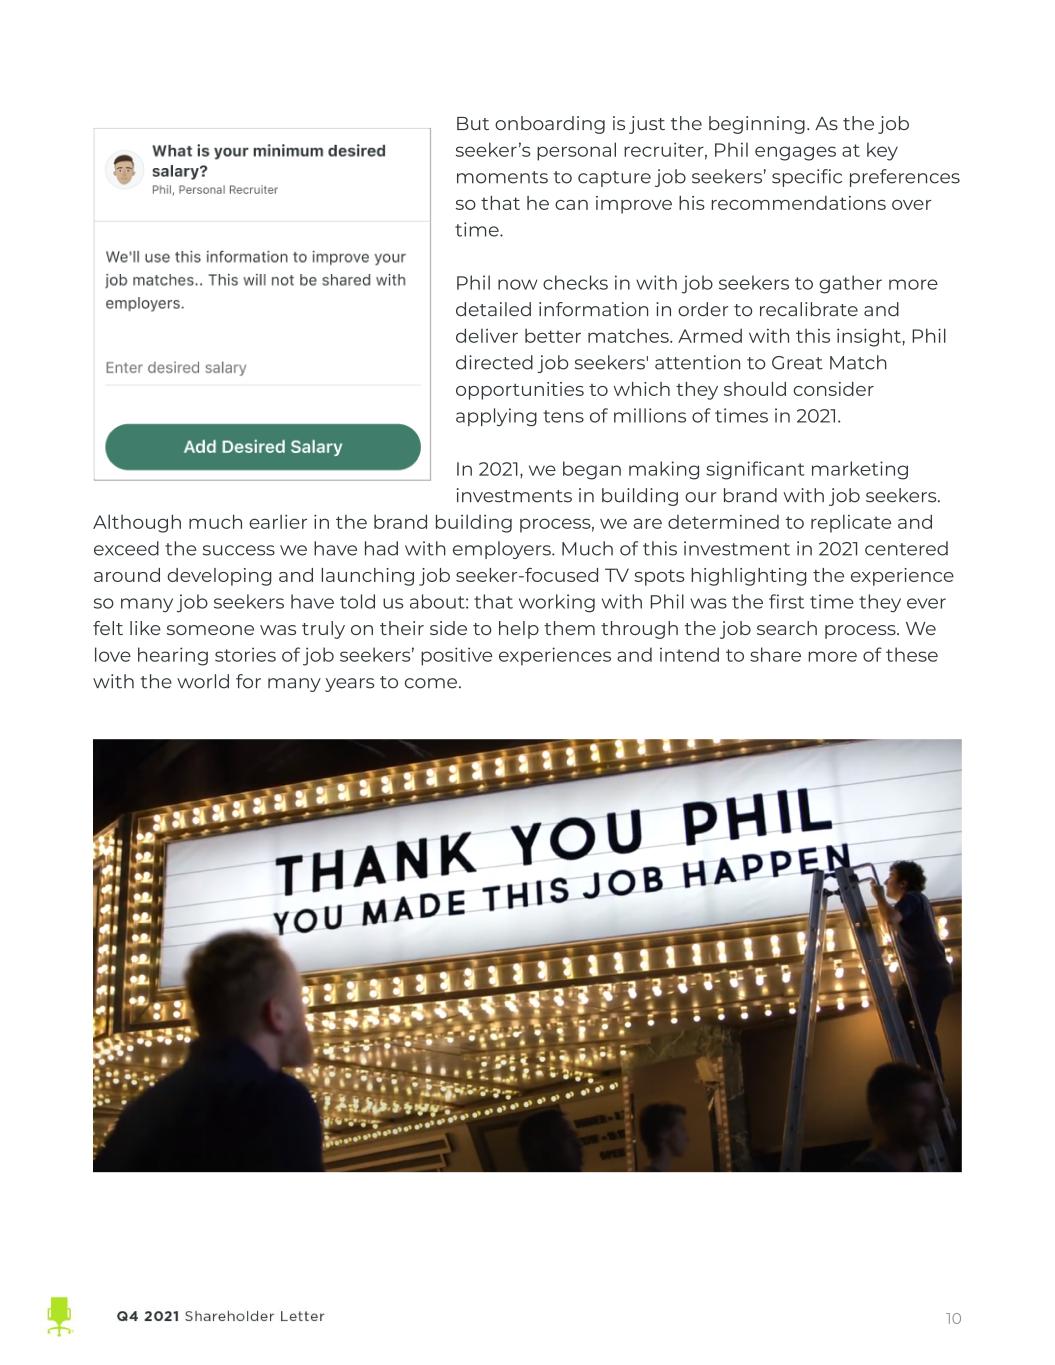
But onboarding is just the beginning. As the job seeker’s personal recruiter, Phil engages at key moments to capture job seekers’ specific preferences so that he can improve his recommendations over time. Phil now checks in with job seekers to gather more detailed information in order to recalibrate and deliver better matches. Armed with this insight, Phil directed job seekers' attention to Great Match opportunities to which they should consider applying tens of millions of times in 2021. In 2021, we began making significant marketing investments in building our brand with job seekers. Although much earlier in the brand building process, we are determined to replicate and exceed the success we have had with employers. Much of this investment in 2021 centered around developing and launching job seeker-focused TV spots highlighting the experience so many job seekers have told us about: that working with Phil was the first time they ever felt like someone was truly on their side to help them through the job search process. We love hearing stories of job seekers’ positive experiences and intend to share more of these with the world for many years to come. 10
Growth Strategy #3: Make our matching technology smarter over time Data from our growing marketplace powers our matching algorithms, which continuously learn and deliver better results. This allows us to drive Great Match opportunities to job seekers across our marketplace using products like Invite to Apply. Employers tell us our algorithms are working by rating applications as a “thumbs up”. We were able to deliver 55% more total “thumbs up” Great Match candidates in 2021 vs. 2020, despite a historically tight labor market. The flywheel created by executing against all three of our growth strategies - more employers, more job seekers, and smarter matching technology - leads to a virtuous cycle where every time we make progress on one growth strategy, pushing forward on the other two gets a little bit easier. As we look ahead to 2022 and beyond, expect to hear more about how scaling both the number of employers and job seekers in our marketplace drives more data that feeds our matching algorithms, enabling us to accelerate the rate of change in how people find work. 11
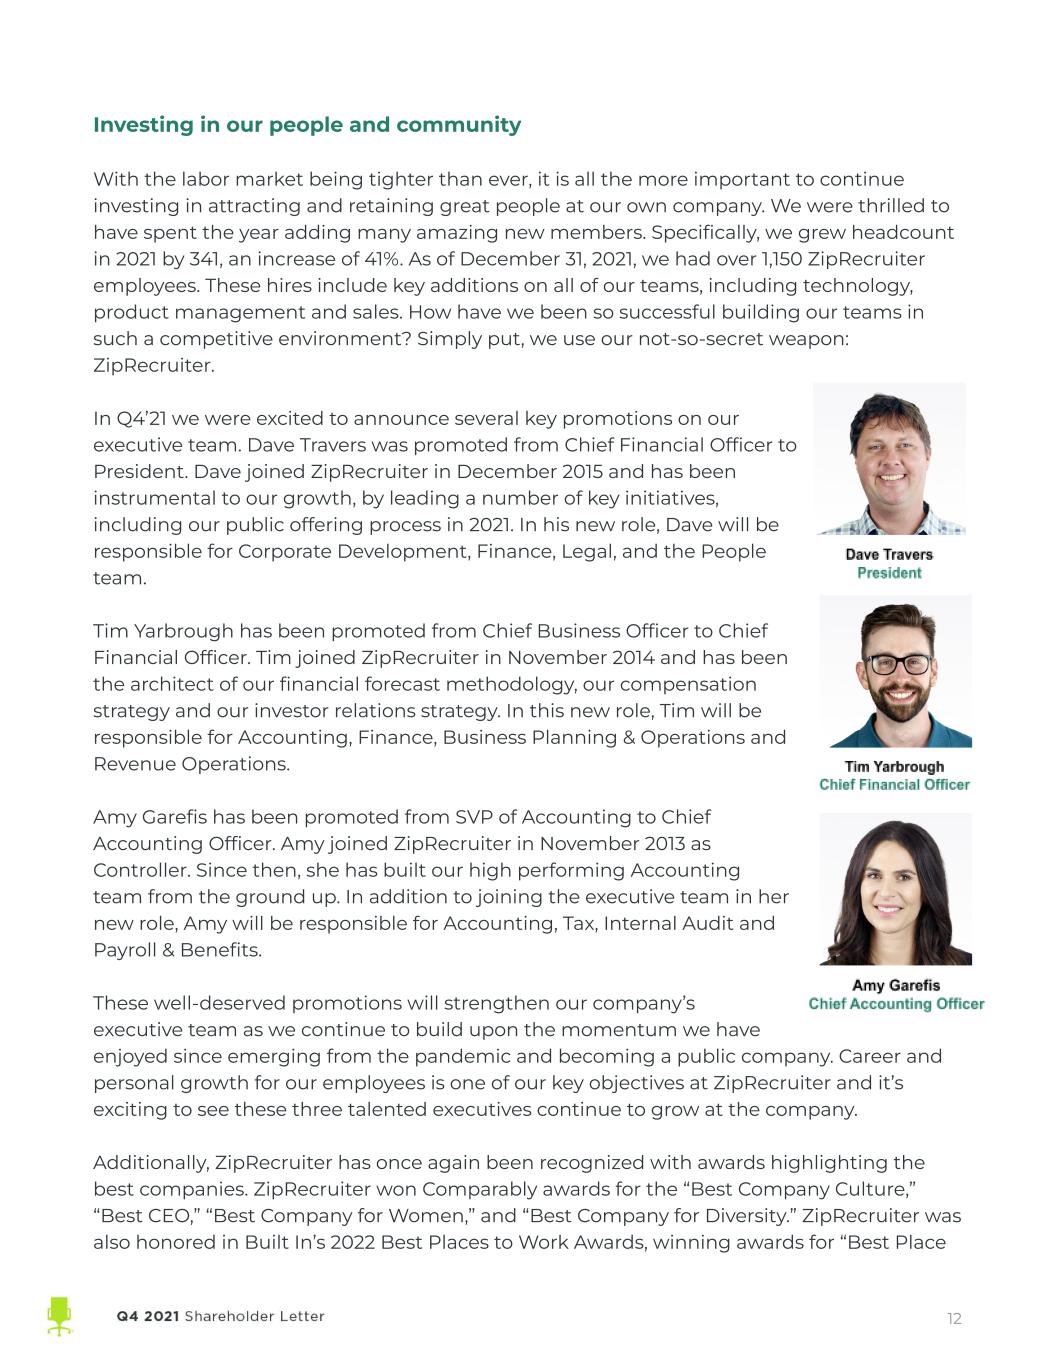
Investing in our people and community With the labor market being tighter than ever, it is all the more important to continue investing in attracting and retaining great people at our own company. We were thrilled to have spent the year adding many amazing new members. Specifically, we grew headcount in 2021 by 341, an increase of 41%. As of December 31, 2021, we had over 1,150 ZipRecruiter employees. These hires include key additions on all of our teams, including technology, product management and sales. How have we been so successful building our teams in such a competitive environment? Simply put, we use our not-so-secret weapon: ZipRecruiter. In Q4’21 we were excited to announce several key promotions on our executive team. Dave Travers was promoted from Chief Financial Officer to President. Dave joined ZipRecruiter in December 2015 and has been instrumental to our growth, by leading a number of key initiatives, including our public offering process in 2021. In his new role, Dave will be responsible for Corporate Development, Finance, Legal, and the People team. Tim Yarbrough has been promoted from Chief Business Officer to Chief Financial Officer. Tim joined ZipRecruiter in November 2014 and has been the architect of our financial forecast methodology, our compensation strategy and our investor relations strategy. In this new role, Tim will be responsible for Accounting, Finance, Business Planning & Operations and Revenue Operations. Amy Garefis has been promoted from SVP of Accounting to Chief Accounting Officer. Amy joined ZipRecruiter in November 2013 as Controller. Since then, she has built our high performing Accounting team from the ground up. In addition to joining the executive team in her new role, Amy will be responsible for Accounting, Tax, Internal Audit and Payroll & Benefits. These well-deserved promotions will strengthen our company’s executive team as we continue to build upon the momentum we have enjoyed since emerging from the pandemic and becoming a public company. Career and personal growth for our employees is one of our key objectives at ZipRecruiter and it’s exciting to see these three talented executives continue to grow at the company. Additionally, ZipRecruiter has once again been recognized with awards highlighting the best companies. ZipRecruiter won Comparably awards for the “Best Company Culture,” “Best CEO,” “Best Company for Women,” and “Best Company for Diversity.” ZipRecruiter was also honored in Built In’s 2022 Best Places to Work Awards, winning awards for “Best Place 12
to Work,” “Best Paying Company,” and “Best Large Company to Work for” in Los Angeles. These awards reflect ZipRecruiter’s values and as we grow, we will continue to work to maintain and improve our culture to make ZipRecruiter a place where employees feel valued every day. To receive these awards is an honor and a testament to our dedication in maintaining a culture of diversity and inclusion. 13

Q4’21 Financial Discussion Revenue Revenue for Q4’21 was $220 million, up 93% y/y and up 3% q/q. We experienced higher demand across all industries, geographies and from companies of all sizes, while long-term investments in product and go-to-market paid off as we delivered more value to employers just as their needs grew. Quarterly Paid Employers We had 147,081 Quarterly Paid Employers in Q4’21, up 64% y/y and down 13% q/q. While strong demand drove a healthy increase versus 2020, we experienced a seasonal decline in Q4’21, as we have in prior years, when hiring activity slows during the holiday period. Revenue per Paid Employer Revenue per Paid Employer for Q4’21 was $1,497, up 17% y/y and up 19% q/q. Employers' willingness to pay grew as they got to know ZipRecruiter better, gaining confidence they could pay more to get more by investing in upsells and increasing their effective bid in our marketplace. Gross Profit and Margin Gross profit for Q4’21 was $200 million, up 102% y/y and up 5% q/q. This increase was driven by the increase in revenue. Gross margin remained strong at 91%, as increased scale nominally improved gross margin in the quarter and more than offset increased investments in service delivery. Operating Expenses Total operating expenses for Q4’21 were $175 million, compared to $69 million in Q4’20 and $172 million in Q3’21. The increase in total operating expenses year over year was largely due to increases in sales and marketing expenses, stock-based compensation and other employee-driven expenses as we continued to invest in a post-COVID recovery environment. 14
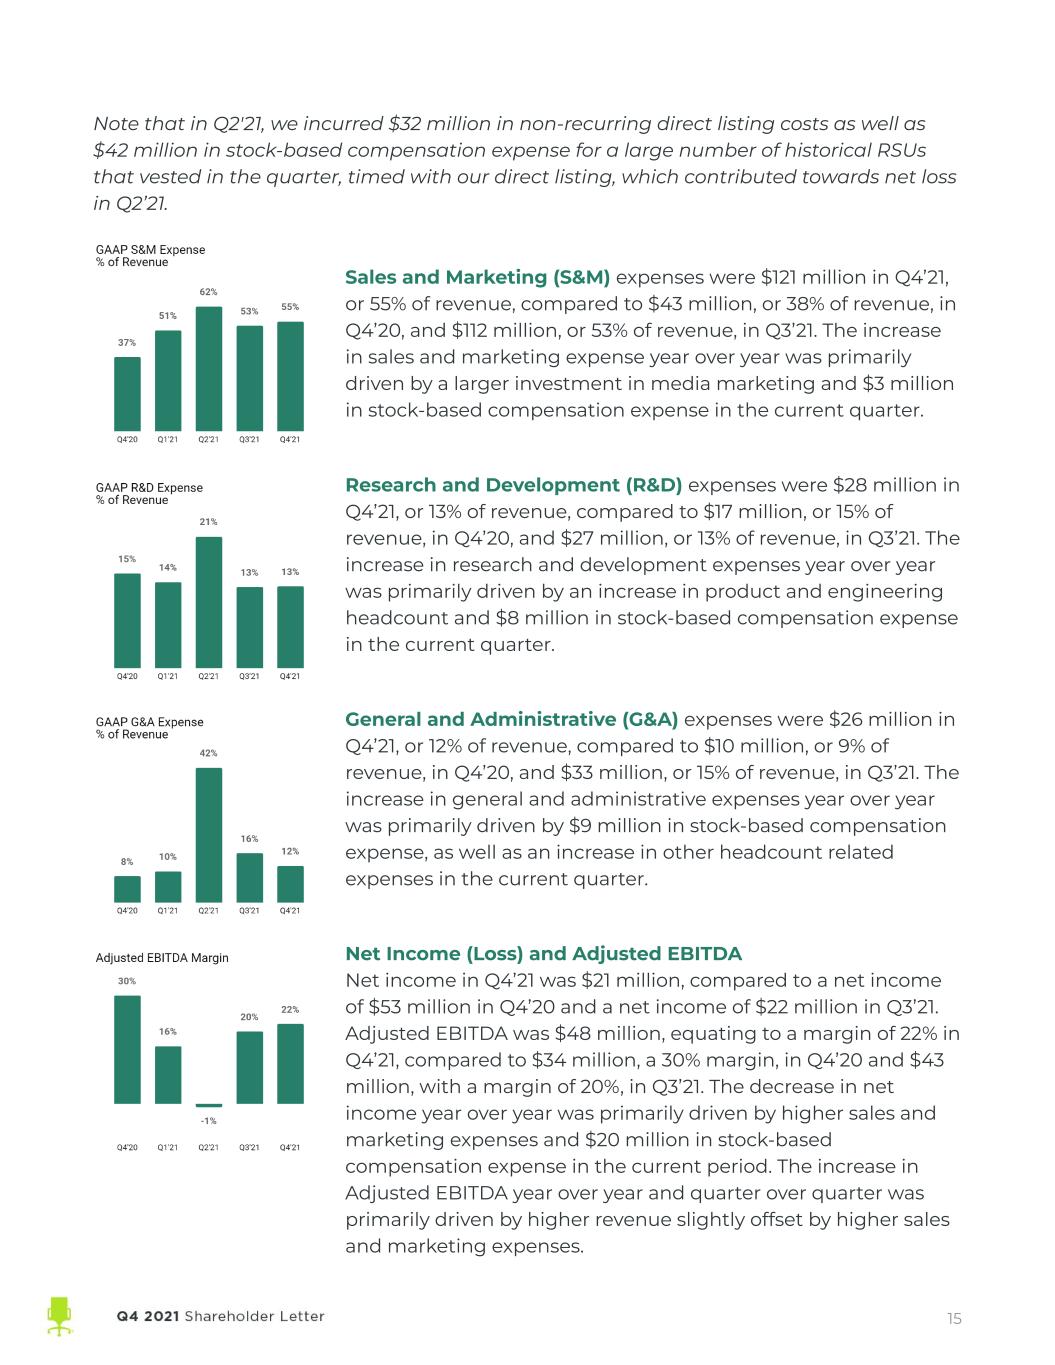
Note that in Q2'21, we incurred $32 million in non-recurring direct listing costs as well as $42 million in stock-based compensation expense for a large number of historical RSUs that vested in the quarter, timed with our direct listing, which contributed towards net loss in Q2’21. Sales and Marketing (S&M) expenses were $121 million in Q4’21, or 55% of revenue, compared to $43 million, or 38% of revenue, in Q4’20, and $112 million, or 53% of revenue, in Q3’21. The increase in sales and marketing expense year over year was primarily driven by a larger investment in media marketing and $3 million in stock-based compensation expense in the current quarter. Research and Development (R&D) expenses were $28 million in Q4’21, or 13% of revenue, compared to $17 million, or 15% of revenue, in Q4’20, and $27 million, or 13% of revenue, in Q3’21. The increase in research and development expenses year over year was primarily driven by an increase in product and engineering headcount and $8 million in stock-based compensation expense in the current quarter. General and Administrative (G&A) expenses were $26 million in Q4’21, or 12% of revenue, compared to $10 million, or 9% of revenue, in Q4’20, and $33 million, or 15% of revenue, in Q3’21. The increase in general and administrative expenses year over year was primarily driven by $9 million in stock-based compensation expense, as well as an increase in other headcount related expenses in the current quarter. Net Income (Loss) and Adjusted EBITDA Net income in Q4’21 was $21 million, compared to a net income of $53 million in Q4’20 and a net income of $22 million in Q3’21. Adjusted EBITDA was $48 million, equating to a margin of 22% in Q4’21, compared to $34 million, a 30% margin, in Q4’20 and $43 million, with a margin of 20%, in Q3’21. The decrease in net income year over year was primarily driven by higher sales and marketing expenses and $20 million in stock-based compensation expense in the current period. The increase in Adjusted EBITDA year over year and quarter over quarter was primarily driven by higher revenue slightly offset by higher sales and marketing expenses. 15
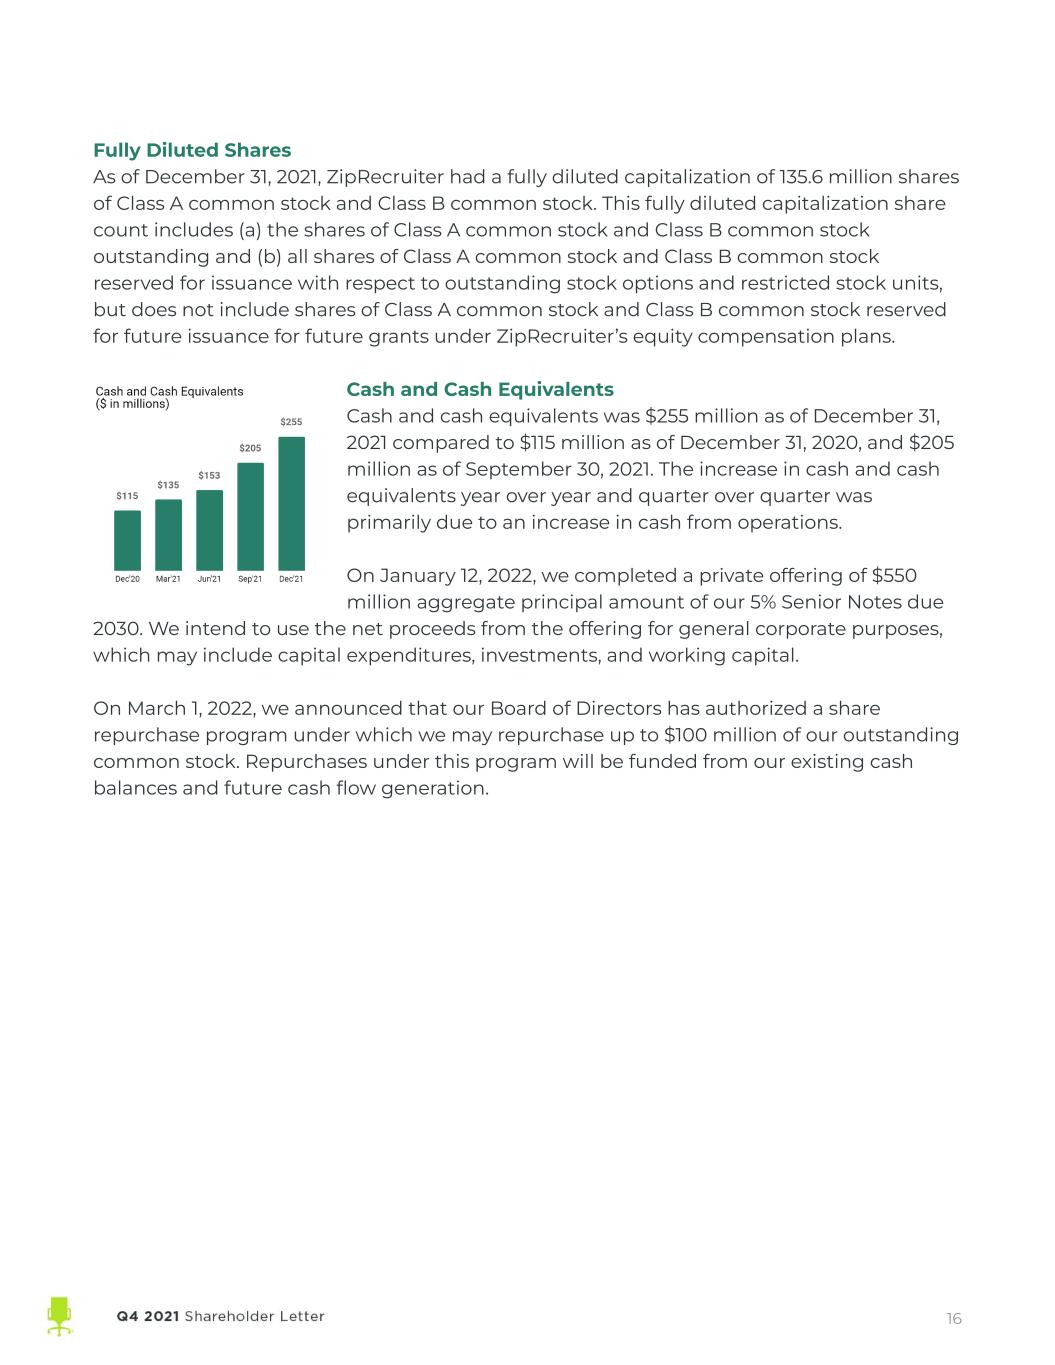
Fully Diluted Shares As of December 31, 2021, ZipRecruiter had a fully diluted capitalization of 135.6 million shares of Class A common stock and Class B common stock. This fully diluted capitalization share count includes (a) the shares of Class A common stock and Class B common stock outstanding and (b) all shares of Class A common stock and Class B common stock reserved for issuance with respect to outstanding stock options and restricted stock units, but does not include shares of Class A common stock and Class B common stock reserved for future issuance for future grants under ZipRecruiter’s equity compensation plans. Cash and Cash Equivalents Cash and cash equivalents was $255 million as of December 31, 2021 compared to $115 million as of December 31, 2020, and $205 million as of September 30, 2021. The increase in cash and cash equivalents year over year and quarter over quarter was primarily due to an increase in cash from operations. On January 12, 2022, we completed a private offering of $550 million aggregate principal amount of our 5% Senior Notes due 2030. We intend to use the net proceeds from the offering for general corporate purposes, which may include capital expenditures, investments, and working capital. On March 1, 2022, we announced that our Board of Directors has authorized a share repurchase program under which we may repurchase up to $100 million of our outstanding common stock. Repurchases under this program will be funded from our existing cash balances and future cash flow generation. 16
Financial Outlook Quarterly Guidance At $220 million, revenue in Q4’21 exceeded the high end of our previous guidance while representing another quarter of record revenue in the company’s history. Our Q1’22 revenue guidance of $217 to $223 million represents 76% growth y/y, at the midpoint, and reflects sequential growth consistent with that of Q4'19 to Q1'20, prior to the pandemic. Our Adjusted EBITDA guidance of $24 to $30 million, or 11% to 13% Adjusted EBITDA margins, for the quarter reflects our continued investments in all three pillars of our long-term strategy. Annual Guidance Despite the unprecedented macroeconomic environment in 2021 and ongoing uncertainty about the shape of the post pandemic recovery, our execution against the three key pillars of our strategy has given us confidence in our ability to achieve healthy revenue growth in 2022 while maintaining strong Adjusted EBITDA margins. We estimate revenue for the full year 2022 to be $878 to $892 million, representing 19% growth versus 2021, at the midpoint. Our guidance reflects our belief in a gradual return to a more traditional macroeconomic pattern by the end of the year, though still above our pre-COVID growth rate in 2019 of 18%. Our Adjusted EBITDA guidance of $123 to $137 million equates to an Adjusted EBITDA margin of 15%, at the midpoint. This Adjusted EBITDA margin is in line with 2021 and reflects an increased investment in our internal teams to drive continued product innovation as well as sales and marketing expenses aimed at growing both sides of our marketplace. Our Adjusted EBITDA margin guidance of 15% is above our pre-COVID Adjusted EBITDA margin of 2% in 2019, despite the increased investment. We are living through an unprecedented time in the labor market. We believe ZipRecruiter remains ideally positioned to win. 2021 was a record-breaking year for the U.S. labor market. The U.S. economy added almost 6.7 million7 net new jobs – the highest single-year total on record. We also saw the highest number of job openings8. American employers have never been as eager to hire and ZipRecruiter was ready and able to help. 2021 was also the year of the Great Resignation and severe labor shortages as many potential job seekers remained reluctant to return to the job market. In response, employers effectively rolled out the red carpet: raising wages, increasing benefits and adding flexible schedules. We're now seeing wage growth pick up across all industries. There has never been a better time for American workers to look for a job. 8 Per U.S Bureau of Labor Statistics, Total U.S. job openings https://data.bls.gov/timeseries/JTS000000000000000JOL 7 Per U.S. Bureau of Labor Statistic, Current Employment Statistics, as of February 2022, calculated as the sum of monthly net change in total non-farm employment per calendar year 17
We remain laser-focused on helping these employers find the perfect candidates for their growing list of roles and intent on helping job seekers find meaningful work. We believe we are uniquely positioned for long-term success during these extraordinary times and the many twists and turns to come as the economy continues to expand. It is incredibly gratifying for all of us at ZipRecruiter to be at the center of transforming how people find work, continuing to actively connect people to their next great opportunity. We are grateful to have you with us as fellow shareholders as we continue on this journey. _______________________________ Ian Siegel Chief Executive Officer _______________________________ David Travers President _______________________________ Tim Yarbrough Chief Financial Officer 18
Forward-Looking Statements This shareholder letter contains forward-looking statements within the meaning of the Private Securities Litigation Reform Act of 1995. All statements contained in this shareholder letter that do not relate to matters of historical fact should be considered forward-looking statements, including, without limitation, our market opportunity and momentum for the remainder of 2022; our anticipated use of the net proceeds of the private offering; statements under the section titled "Financial Outlook"; statements regarding our expected financial performance and operational performance for the first quarter of 2022 and the fiscal year ending December 31, 2022; our expected future revenue growth, Adjusted EBITDA profitability and Revenue per Paid Employer, as well as statements that include the words “expect,” “intend,” “plan,” “believe,” “project,” “forecast,” “estimate,” “may,” “should,” “anticipate” and similar statements of a future or forward-looking nature. These forward-looking statements are based on management's current expectations. These statements are neither promises nor guarantees, but involve known and unknown risks, uncertainties and other important factors that may cause actual results, performance or achievements to be materially different from any future results, performance or achievements expressed or implied by the forward-looking statements, including, but not limited to: our ability to attract and retain employers and job seekers; our ability to compete with well-established competitors and new entrants; our ability to achieve and/or maintain profitability; our ability to maintain, protect and enhance our brand and intellectual property; our dependence on macroeconomic factors; our ability to maintain and improve the quality of our platform; our dependence on the interoperability of our platform with mobile operating systems that we do not control; our ability to successfully implement our business plan during a global economic downturn caused by the COVID-19 pandemic that may impact the demand for our services or have a material adverse impact on our and our business partners’ financial condition and results of operations; our ability and the ability of third parties to protect our users’ personal or other data from a security breach and to comply with laws and regulations relating to consumer data privacy and data protection; our ability to detect errors, defects or disruptions in our platform; our ability to comply with the terms of underlying licenses of open source software components on our platform; our ability to expand into markets outside the United States; our ability to achieve desired operating margins; our compliance with a wide variety of U.S. and international laws and regulations; our reliance on Amazon Web Services; our ability to mitigate payment and fraud risks; our dependence on our senior management and our ability to attract and retain new talent; and the other important risk factors more fully discussed and described in documents we have filed with the Securities and Exchange Commission (“SEC”), including our Quarterly Report on Form 10-Q for the three months ended September 30, 2021 that we filed with the SEC and our Annual Report on Form 10-K for the twelve months ended December 31, 2021 that we will file with the SEC. In addition, we operate in a very competitive and rapidly changing environment. New risks emerge from time to time. It is not possible for our management to predict all risks, nor can we assess the impact of all factors on our business or the extent to which any factor, or combination of factors, may cause actual results to differ materially from those contained in any forward-looking statements that we may make. In light of these risks, uncertainties and assumptions, the forward-looking events and circumstances discussed in this release are inherently uncertain and may not occur, and actual results could differ materially and adversely from those anticipated or implied in the forward-looking statements. Accordingly, you should not rely upon forward-looking statements as predictions of future events. In addition, the forward-looking statements made in this shareholder letter relate only to events or information as of the date on which the statements are made in this letter. Except as required by law, we undertake no obligation to update or revise publicly any forward-looking statements, whether as a result of new information, future events or otherwise, after the date on which the statements are made or to reflect the occurrence of unanticipated events. 19
Conference Call Details We will host a conference call to discuss our financial results on Tuesday, March 1, at 2:00 p.m. Pacific Time. A live webcast of the call can be accessed from ZipRecruiter’s Investor Relations website. An archived version will be available on the website two hours after the call. Investors and analysts can participate in the conference call by dialing +1 (888) 440-4199, or +1 (646) 960-0818 for callers outside the United States, and mentioning the passcode, “ZipRecruiter”, or by referencing conference ID “9351892”. A telephonic replay of the conference call will be available until Tuesday, March 8, 2022. To listen to the replay please dial +1 (800) 770-2030 or +1 (647) 362-9199 for callers outside the United States and enter replay code “9351892”. 20
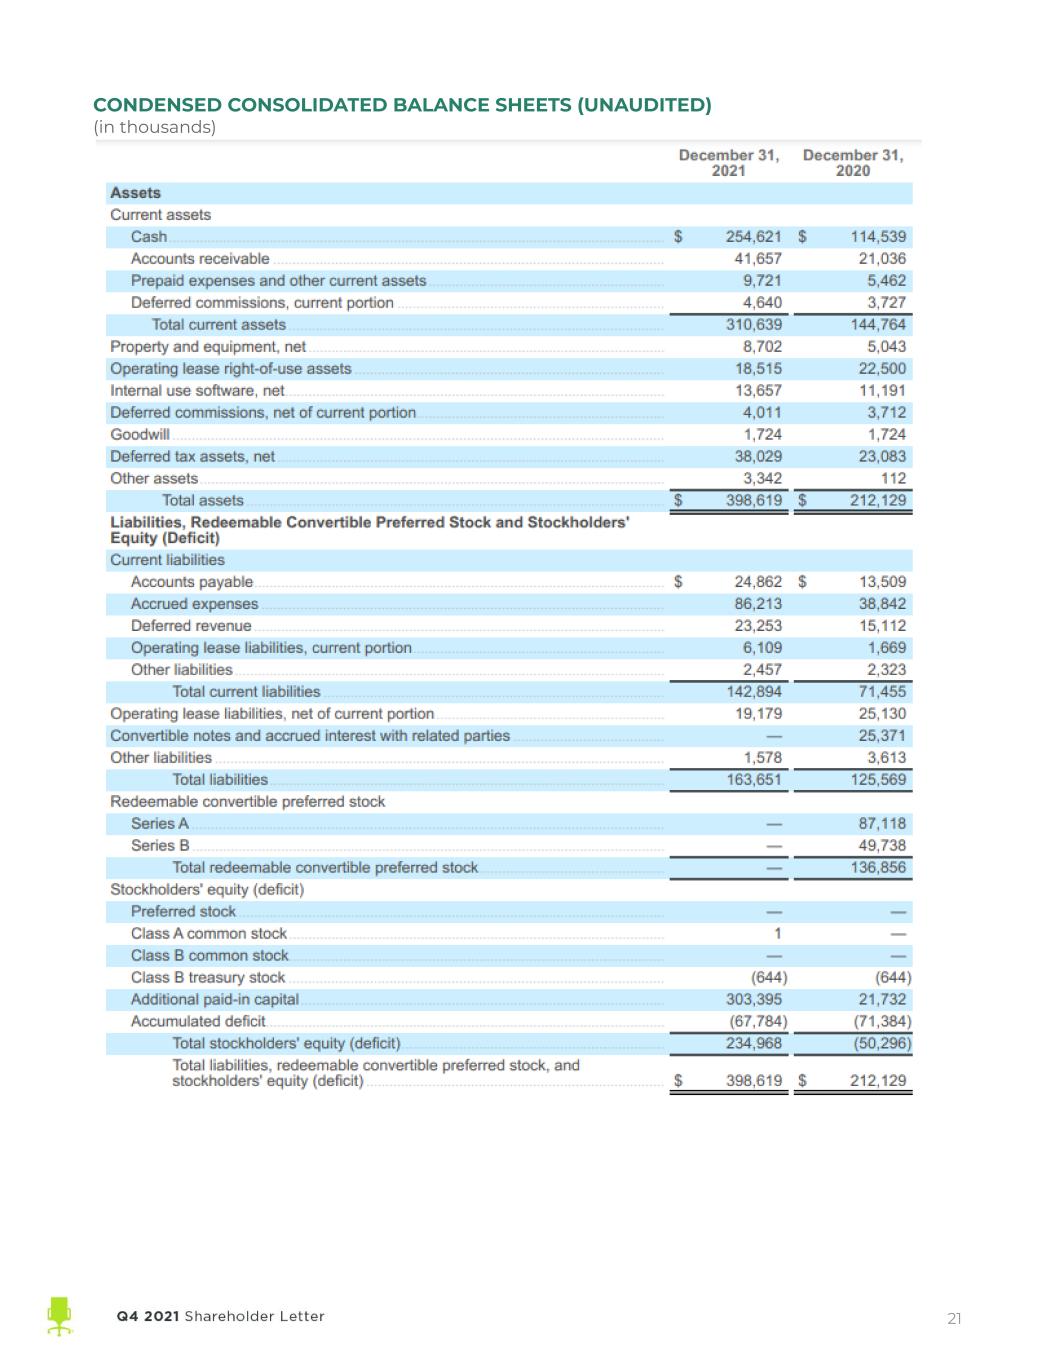
CONDENSED CONSOLIDATED BALANCE SHEETS (UNAUDITED) (in thousands) 21
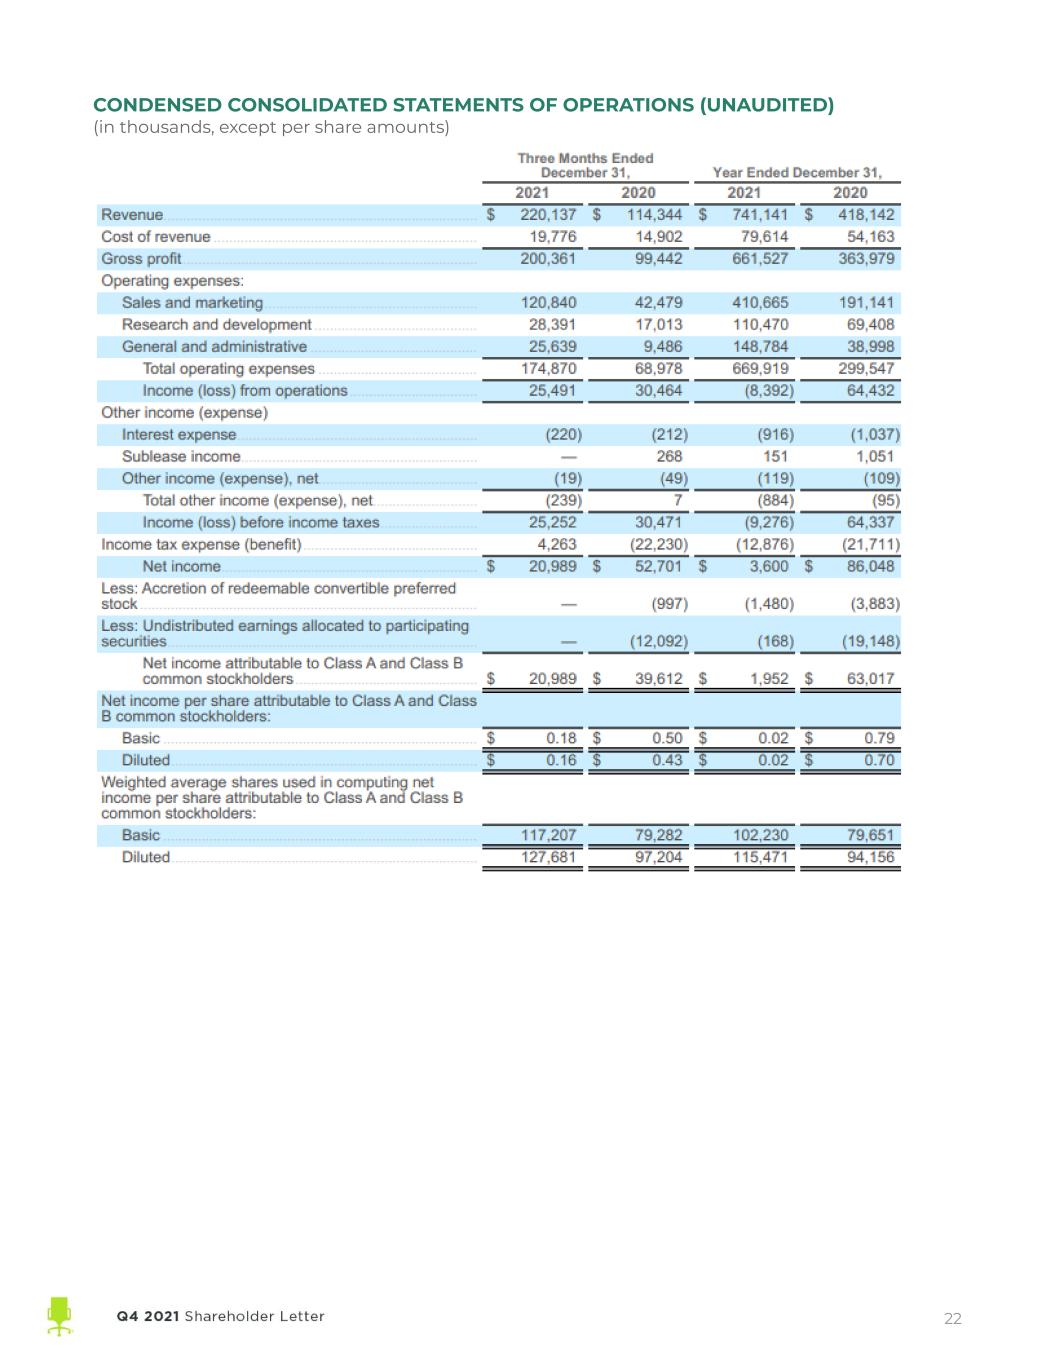
CONDENSED CONSOLIDATED STATEMENTS OF OPERATIONS (UNAUDITED) (in thousands, except per share amounts) 22
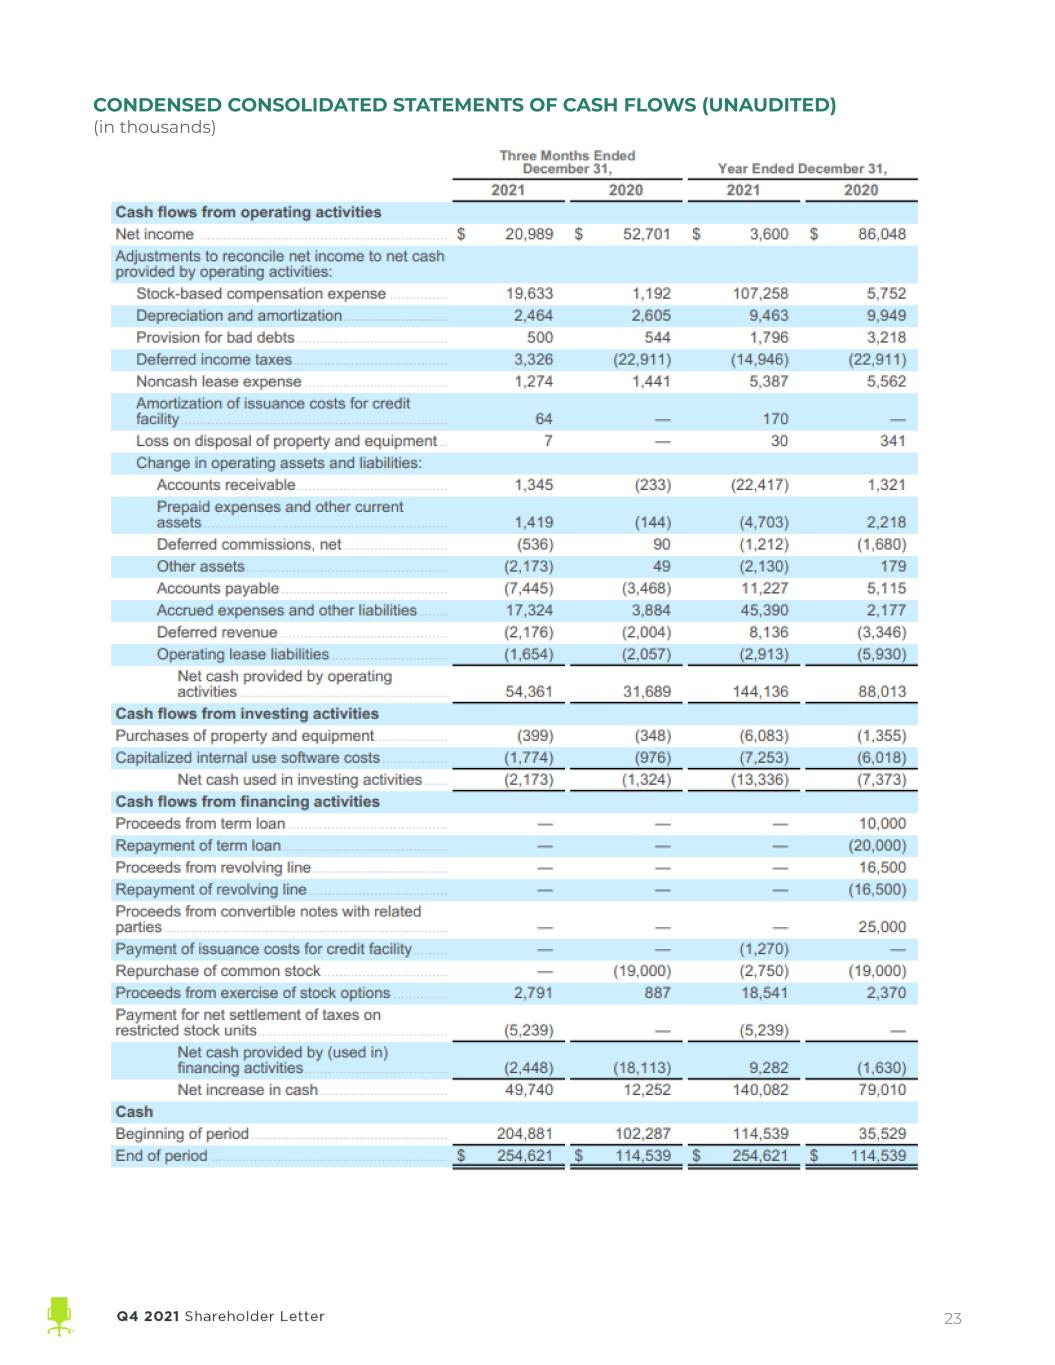
CONDENSED CONSOLIDATED STATEMENTS OF CASH FLOWS (UNAUDITED) (in thousands) 23
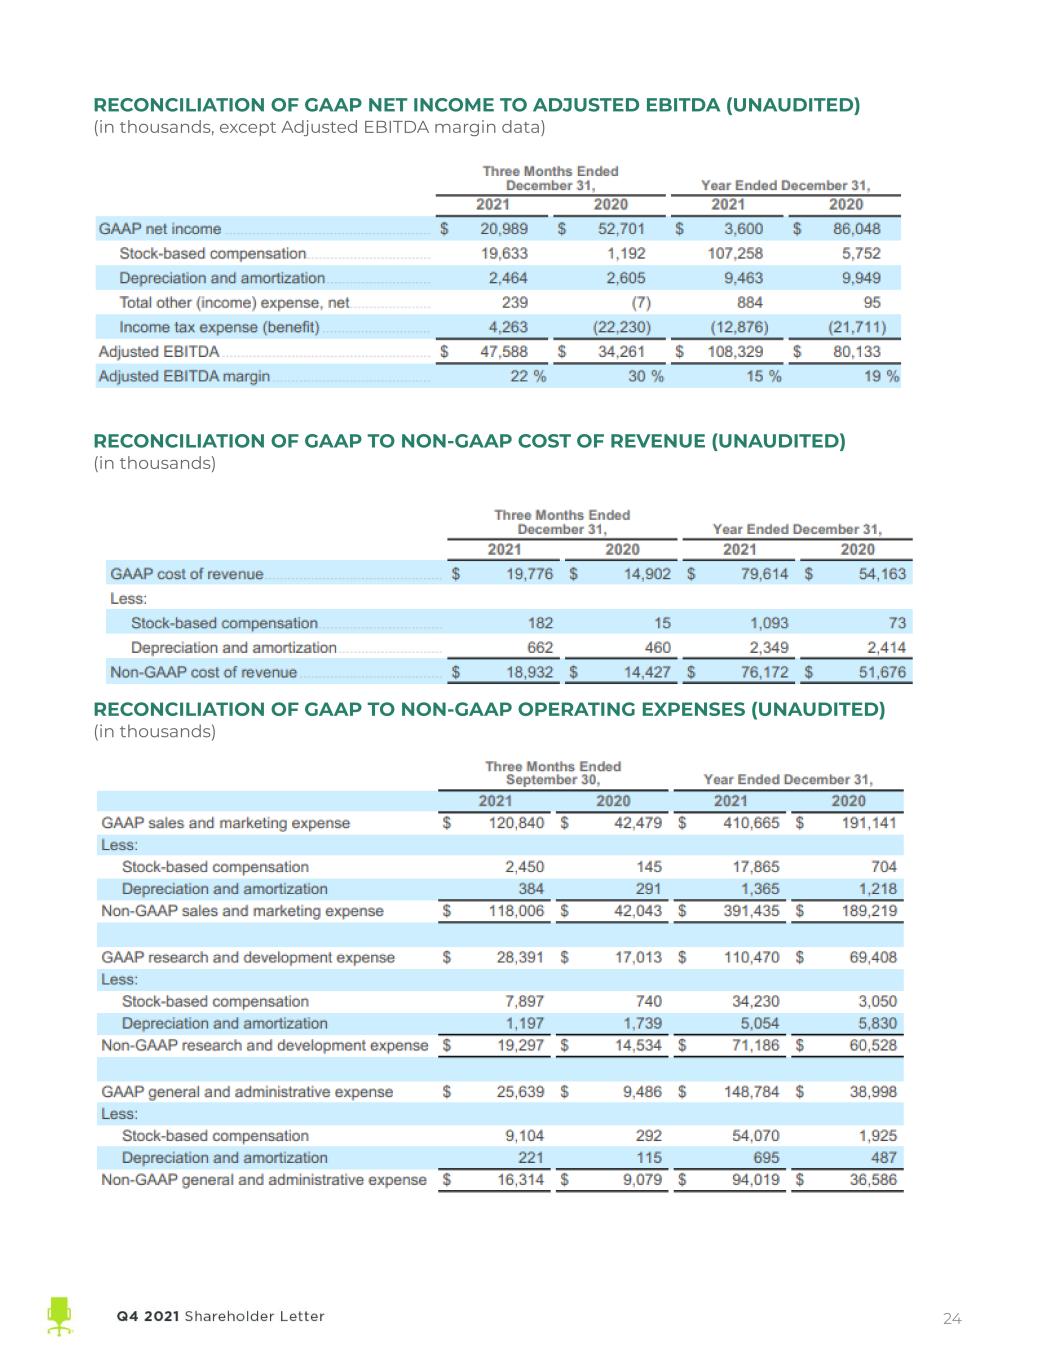
RECONCILIATION OF GAAP NET INCOME TO ADJUSTED EBITDA (UNAUDITED) (in thousands, except Adjusted EBITDA margin data) RECONCILIATION OF GAAP TO NON-GAAP COST OF REVENUE (UNAUDITED) (in thousands) RECONCILIATION OF GAAP TO NON-GAAP OPERATING EXPENSES (UNAUDITED) (in thousands) 24

FULLY DILUTED SHARES (UNAUDITED) (in thousands) 25
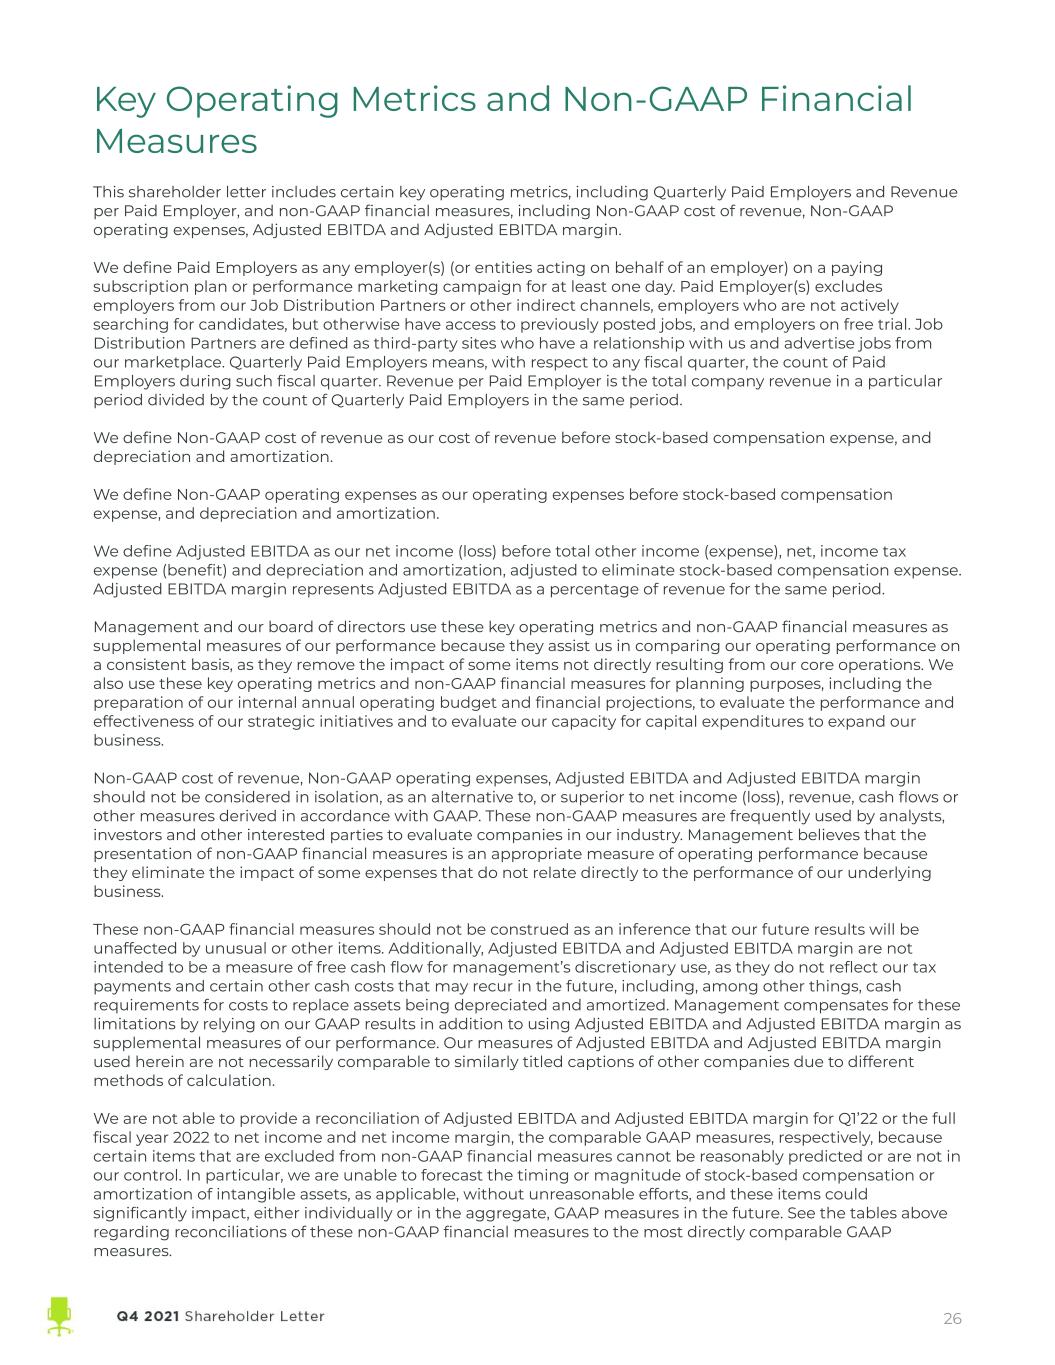
Key Operating Metrics and Non-GAAP Financial Measures This shareholder letter includes certain key operating metrics, including Quarterly Paid Employers and Revenue per Paid Employer, and non-GAAP financial measures, including Non-GAAP cost of revenue, Non-GAAP operating expenses, Adjusted EBITDA and Adjusted EBITDA margin. We define Paid Employers as any employer(s) (or entities acting on behalf of an employer) on a paying subscription plan or performance marketing campaign for at least one day. Paid Employer(s) excludes employers from our Job Distribution Partners or other indirect channels, employers who are not actively searching for candidates, but otherwise have access to previously posted jobs, and employers on free trial. Job Distribution Partners are defined as third-party sites who have a relationship with us and advertise jobs from our marketplace. Quarterly Paid Employers means, with respect to any fiscal quarter, the count of Paid Employers during such fiscal quarter. Revenue per Paid Employer is the total company revenue in a particular period divided by the count of Quarterly Paid Employers in the same period. We define Non-GAAP cost of revenue as our cost of revenue before stock-based compensation expense, and depreciation and amortization. We define Non-GAAP operating expenses as our operating expenses before stock-based compensation expense, and depreciation and amortization. We define Adjusted EBITDA as our net income (loss) before total other income (expense), net, income tax expense (benefit) and depreciation and amortization, adjusted to eliminate stock-based compensation expense. Adjusted EBITDA margin represents Adjusted EBITDA as a percentage of revenue for the same period. Management and our board of directors use these key operating metrics and non-GAAP financial measures as supplemental measures of our performance because they assist us in comparing our operating performance on a consistent basis, as they remove the impact of some items not directly resulting from our core operations. We also use these key operating metrics and non-GAAP financial measures for planning purposes, including the preparation of our internal annual operating budget and financial projections, to evaluate the performance and effectiveness of our strategic initiatives and to evaluate our capacity for capital expenditures to expand our business. Non-GAAP cost of revenue, Non-GAAP operating expenses, Adjusted EBITDA and Adjusted EBITDA margin should not be considered in isolation, as an alternative to, or superior to net income (loss), revenue, cash flows or other measures derived in accordance with GAAP. These non-GAAP measures are frequently used by analysts, investors and other interested parties to evaluate companies in our industry. Management believes that the presentation of non-GAAP financial measures is an appropriate measure of operating performance because they eliminate the impact of some expenses that do not relate directly to the performance of our underlying business. These non-GAAP financial measures should not be construed as an inference that our future results will be unaffected by unusual or other items. Additionally, Adjusted EBITDA and Adjusted EBITDA margin are not intended to be a measure of free cash flow for management’s discretionary use, as they do not reflect our tax payments and certain other cash costs that may recur in the future, including, among other things, cash requirements for costs to replace assets being depreciated and amortized. Management compensates for these limitations by relying on our GAAP results in addition to using Adjusted EBITDA and Adjusted EBITDA margin as supplemental measures of our performance. Our measures of Adjusted EBITDA and Adjusted EBITDA margin used herein are not necessarily comparable to similarly titled captions of other companies due to different methods of calculation. We are not able to provide a reconciliation of Adjusted EBITDA and Adjusted EBITDA margin for Q1’22 or the full fiscal year 2022 to net income and net income margin, the comparable GAAP measures, respectively, because certain items that are excluded from non-GAAP financial measures cannot be reasonably predicted or are not in our control. In particular, we are unable to forecast the timing or magnitude of stock-based compensation or amortization of intangible assets, as applicable, without unreasonable efforts, and these items could significantly impact, either individually or in the aggregate, GAAP measures in the future. See the tables above regarding reconciliations of these non-GAAP financial measures to the most directly comparable GAAP measures. 26


