
` Exhibit 99.2

To Our Shareholders 2022 was another year of strong, profitable growth for ZipRecruiter. We generated $904.6 million in revenue, up 22% year-over-year, and above the high end of our annual guidance. This represents a 28% compounded annual growth rate from 2019. We posted net income of $61.5 million and Adjusted EBITDA of $184.9 million, equating to a net income margin of 7% and an Adjusted EBITDA margin of 20%. This represents a 7% increase in net income margin and a 5% increase in Adjusted EBITDA margin compared to 2021, demonstrating our ability to navigate periods of macroeconomic change with disciplined capital management. ZipRecruiter has a business designed to withstand periods of economic uncertainty and a proven playbook to respond quickly. First, we have the flexibility to lean into investments in matching technology and product while remaining significantly profitable. We believe we are still in the early stages of disrupting the recruitment market and remain committed to the long-term strategic investments that will help us gain share. Second, we have a flexible financial model that allows us to adjust expenses quickly. Our sales and marketing spend is highly variable and ROI-focused, allowing us to conserve or reallocate spend to where we see the greatest returns. With 80% aided brand awareness for both employers and job seekers, we have built an enduring brand that allows ZipRecruiter to remain top-of-mind as our marketing budgets fluctuate throughout economic cycles. While our flexible business model and strong balance sheet allow us to respond nimbly to macroeconomic conditions, our long-term focus remains the same. We are as confident as ever that we will continue to grow our brand, and deliver outstanding matching technology to both employers and job seekers, capitalizing on the massive growth opportunity ahead of us. Over the course of 2022, we have made significant improvements in our marketplace. For employers, we further extended our list of integrations with applicant tracking systems, improved upon our paradigm-shifting Invite to Apply feature and saw continued growth from our large enterprise employers. All of this led to an all-time high Revenue per Paid Employer of $1,944 in Q4’22. For job seekers, we vastly expanded the role of Phil, our AI-enabled personal recruiter, giving each job seeker a personal recruiter and bringing a technology-enabled concierge experience to the otherwise painful process of finding work. We brought employers and job seekers together with category-leading matching technology. These innovations and improvements in 2022 were meaningful and important, but we expect our pace of innovation to accelerate in 2023. Q4 2022 Shareholder Letter 3

Financial Outlook January 2023 Performance and Implications for 2023 Labor Market Outlook With an increasingly uncertain macroeconomic backdrop, employers have moderated their hiring plans and reduced their recruitment budgets in the first weeks of this year. Online job postings in our marketplace remained in line with the low point of the 2022 holiday season, rather than following the longstanding seasonal pattern of beginning a run-up in January. The weakness in 2023 is more pronounced among SMBs than among larger enterprises. As a result, January’s revenue was down 15%1 year-over-year. While the shape and duration of changes in the labor market are uncertain, a core assumption embedded in our guidance is that January's trends continue throughout the balance of 2023. Quarterly Guidance Our Q1’23 revenue guidance of $179 million, at the midpoint, represents a 21% decline year-over-year. Our Adjusted EBITDA guidance of $25 million, at the midpoint, or 14% Adjusted EBITDA margin, for the quarter, reflects our continued fully funded investments into innovative new solutions for the labor market, while simultaneously moderating our Sales & Marketing investments during the slowdown. Annual Guidance Similar to our quarterly guidance, our annual guidance is based on the assumption that macroeconomic factors behind January’s 15% revenue decline year-over-year will persist throughout 2023. Accordingly, we estimate revenue for the full year 2023 to be $770 to $790 million, representing a 14% year-over-year decline versus 2022, at the midpoint. At the midpoint, our 2023 Adjusted EBITDA guidance of $185 million is in line with that of 2022, reflecting a 4% expansion of Adjusted EBITDA margin to 24%. The increase in Adjusted EBITDA margin, compared to 2022, reflects our ability to navigate dynamic macroeconomic environments while also aggressively investing in our product roadmap and extending our technology advantage. Despite top-line volatility, we remain confident in our ability to generate Adjusted EBITDA that flows through to free cash flow consistently throughout an economic cycle. 1 This figure reflects our preliminary estimate subject to the completion of our financial closing procedures. As a result, this figure may differ from the actual results that will be reflected in our financial statements when they are completed and publicly disclosed. This preliminary estimate may change and that change may be material. Q4 2022 Shareholder Letter 4

Fourth Quarter and Full Year 2022 Key Results Q4’22 FY’22 Revenue $210.5 million (4)% y/y $904.6 million 22% y/y Quarterly Paid Employers2 108.3K (26)% y/y Revenue per Paid Employer2 $1,944 30% y/y Gross Margin 90% 90% Net Income $19.4 million $61.5 million Net Income Margin 9% 7% Adjusted EBITDA2 $50.6 million $184.9 million Adjusted EBITDA Margin2 24% 20% Financial Outlook Q1’23 FY’23 Revenue $176 - $182 million (23)% - (20)% y/y $770 - $790 million (15)% - (13)% y/y Adjusted EBITDA2 Adjusted EBITDA margin $22 - $28 million 13% - 15% $178 - $192 million 23% - 24% 2 See “Key Operating Metrics and Non-GAAP Financial Measures” below for additional information regarding key operating metrics and non-GAAP measures used in this shareholder letter and a reconciliation of GAAP net income to Adjusted EBITDA. Q4 2022 Shareholder Letter 5
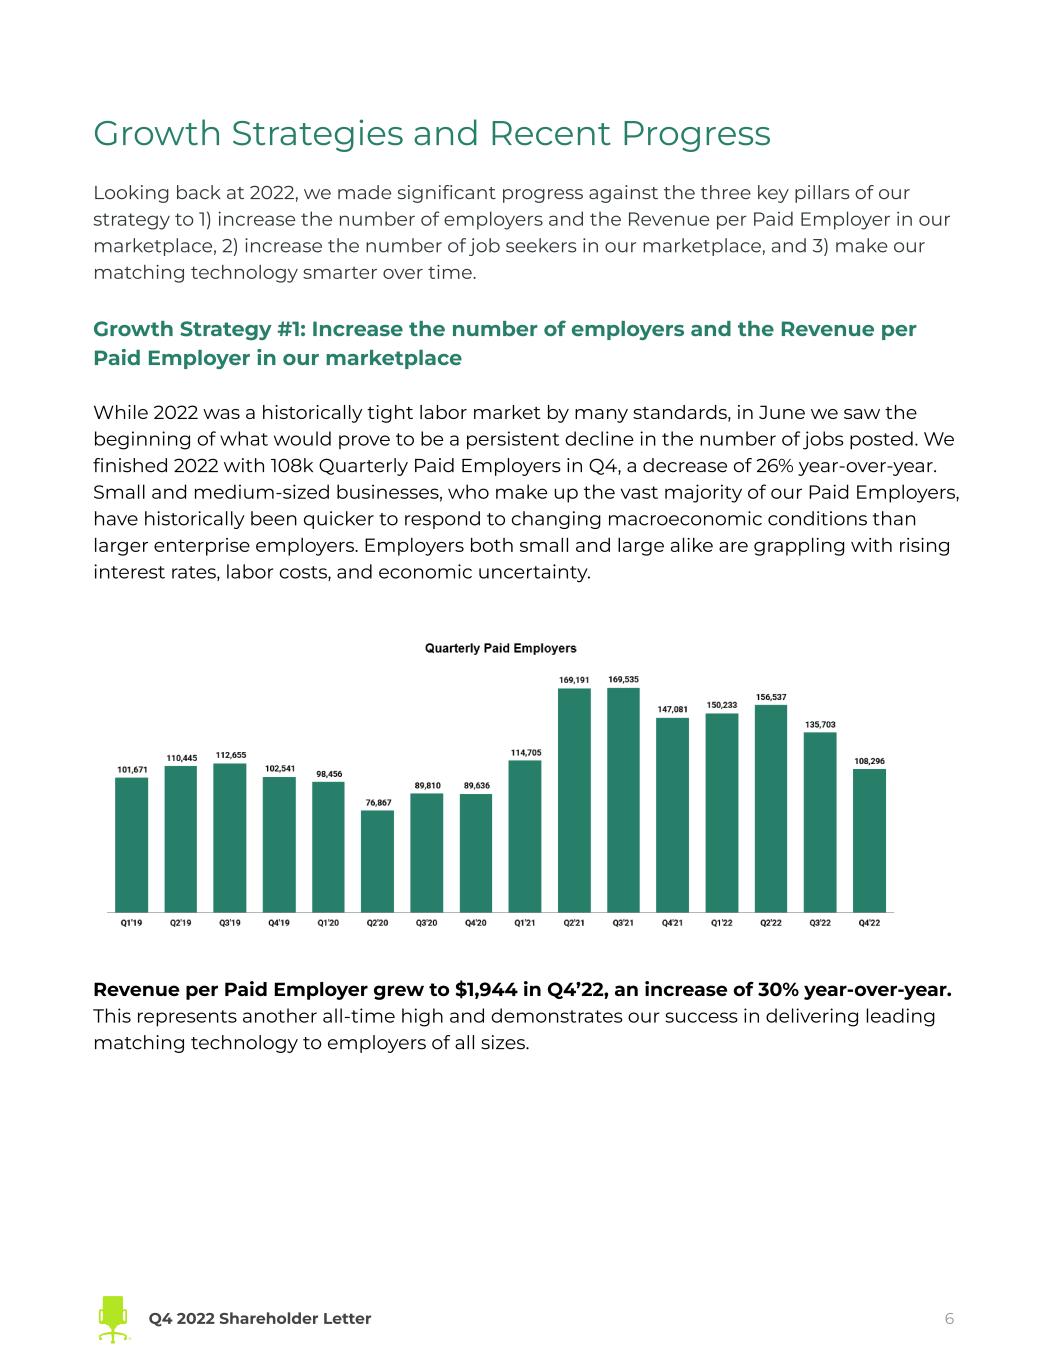
Growth Strategies and Recent Progress Looking back at 2022, we made significant progress against the three key pillars of our strategy to 1) increase the number of employers and the Revenue per Paid Employer in our marketplace, 2) increase the number of job seekers in our marketplace, and 3) make our matching technology smarter over time. Growth Strategy #1: Increase the number of employers and the Revenue per Paid Employer in our marketplace While 2022 was a historically tight labor market by many standards, in June we saw the beginning of what would prove to be a persistent decline in the number of jobs posted. We finished 2022 with 108k Quarterly Paid Employers in Q4, a decrease of 26% year-over-year. Small and medium-sized businesses, who make up the vast majority of our Paid Employers, have historically been quicker to respond to changing macroeconomic conditions than larger enterprise employers. Employers both small and large alike are grappling with rising interest rates, labor costs, and economic uncertainty. Revenue per Paid Employer grew to $1,944 in Q4’22, an increase of 30% year-over-year. This represents another all-time high and demonstrates our success in delivering leading matching technology to employers of all sizes. Q4 2022 Shareholder Letter 6
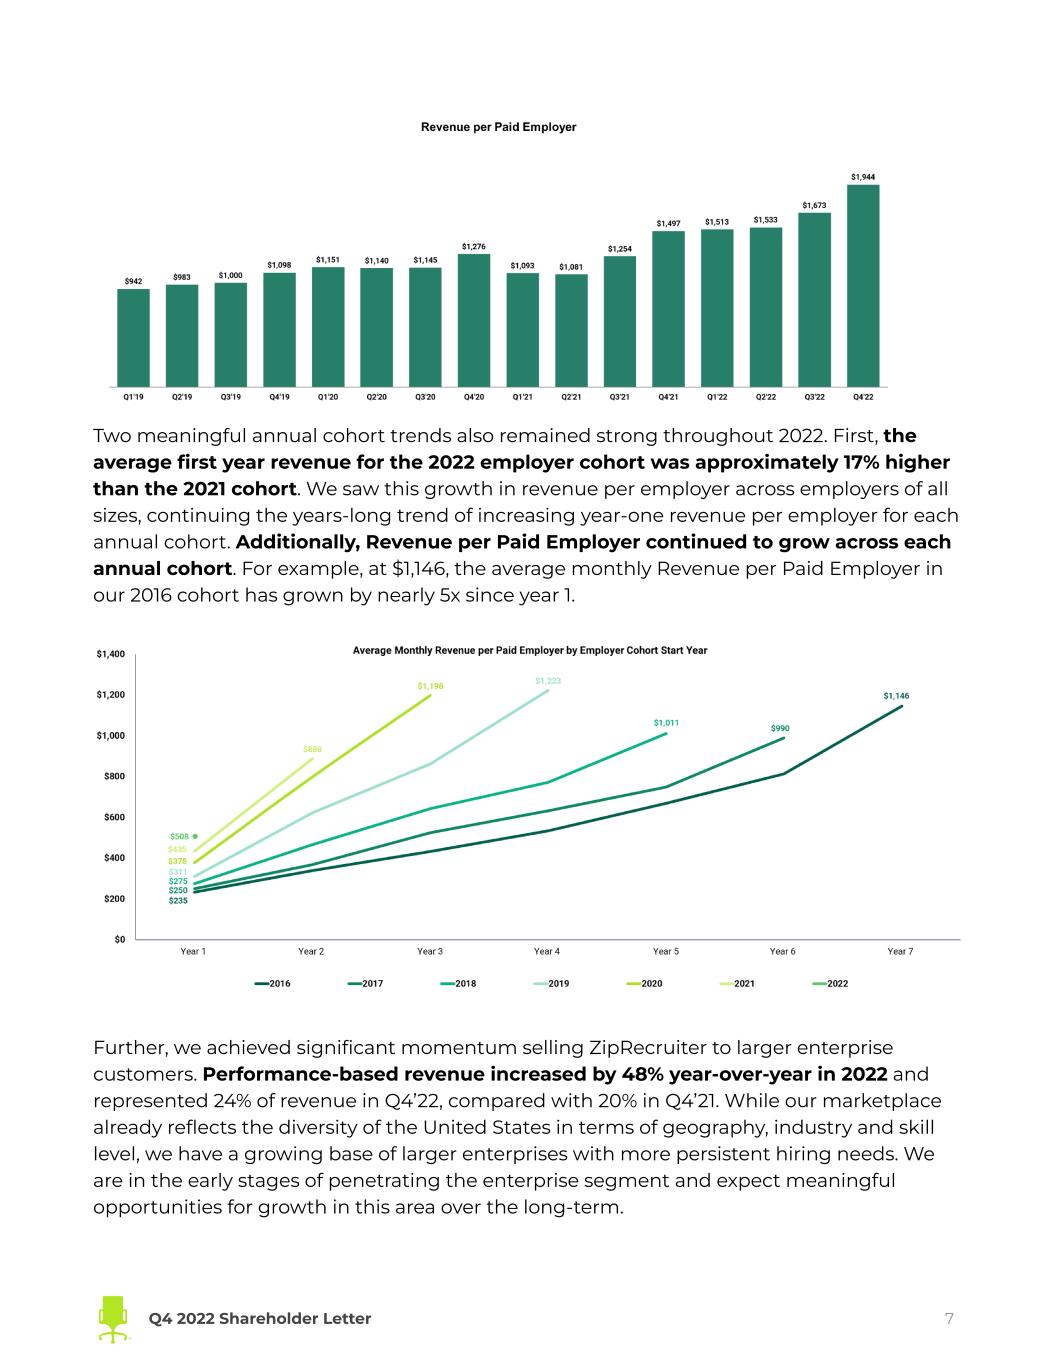
Two meaningful annual cohort trends also remained strong throughout 2022. First, the average first year revenue for the 2022 employer cohort was approximately 17% higher than the 2021 cohort. We saw this growth in revenue per employer across employers of all sizes, continuing the years-long trend of increasing year-one revenue per employer for each annual cohort. Additionally, Revenue per Paid Employer continued to grow across each annual cohort. For example, at $1,146, the average monthly Revenue per Paid Employer in our 2016 cohort has grown by nearly 5x since year 1. Further, we achieved significant momentum selling ZipRecruiter to larger enterprise customers. Performance-based revenue increased by 48% year-over-year in 2022 and represented 24% of revenue in Q4’22, compared with 20% in Q4’21. While our marketplace already reflects the diversity of the United States in terms of geography, industry and skill level, we have a growing base of larger enterprises with more persistent hiring needs. We are in the early stages of penetrating the enterprise segment and expect meaningful opportunities for growth in this area over the long-term. Q4 2022 Shareholder Letter 7
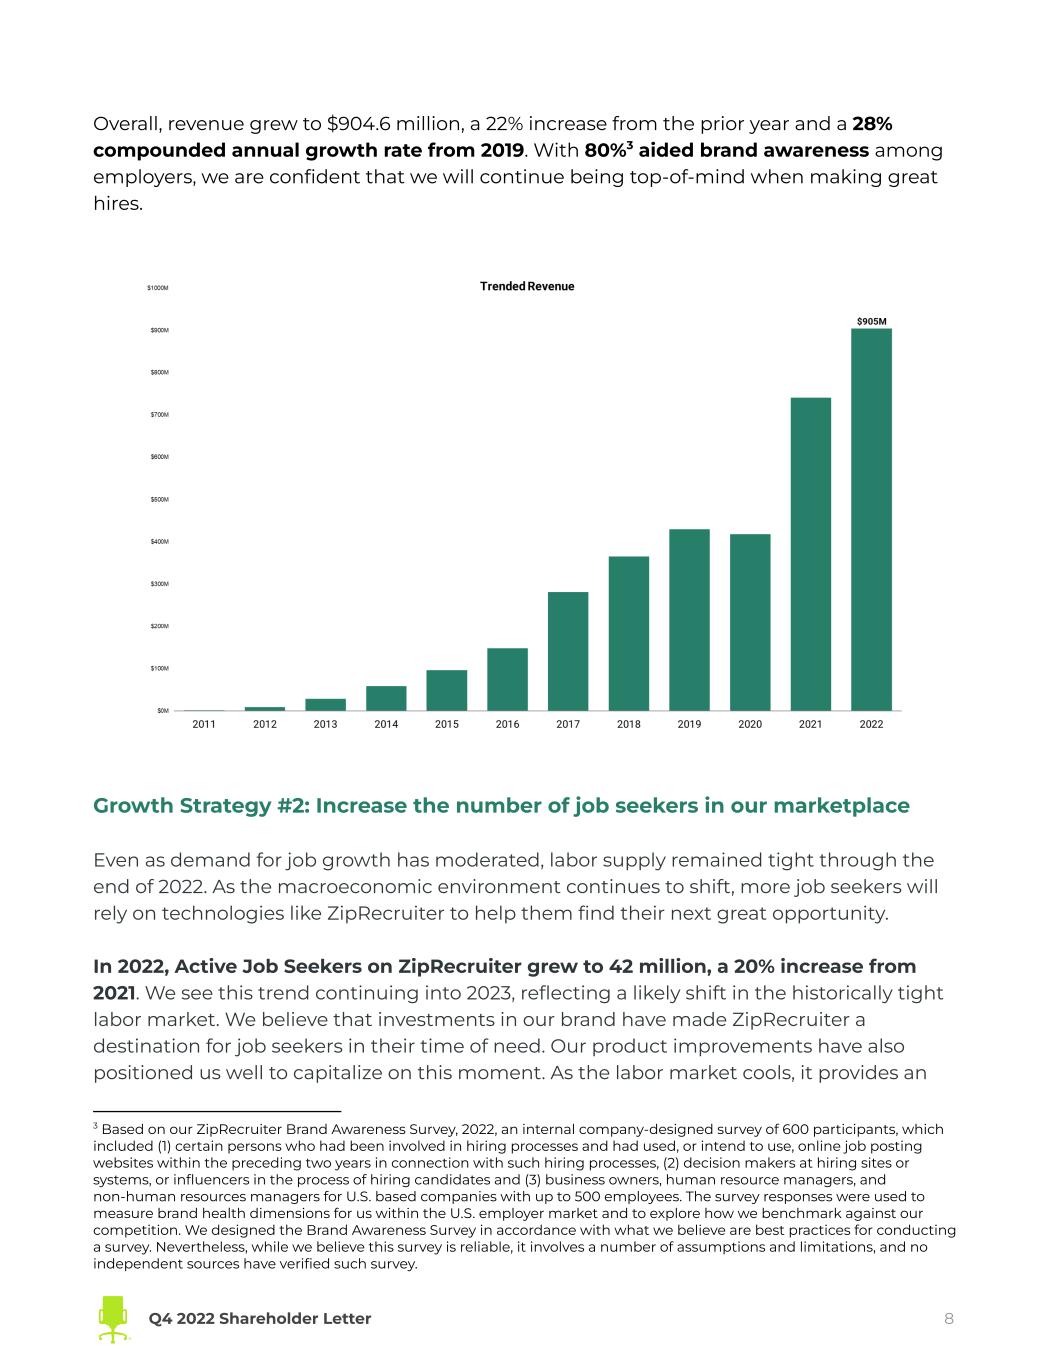
Overall, revenue grew to $904.6 million, a 22% increase from the prior year and a 28% compounded annual growth rate from 2019. With 80%3 aided brand awareness among employers, we are confident that we will continue being top-of-mind when making great hires. Growth Strategy #2: Increase the number of job seekers in our marketplace Even as demand for job growth has moderated, labor supply remained tight through the end of 2022. As the macroeconomic environment continues to shift, more job seekers will rely on technologies like ZipRecruiter to help them find their next great opportunity. In 2022, Active Job Seekers on ZipRecruiter grew to 42 million, a 20% increase from 2021. We see this trend continuing into 2023, reflecting a likely shift in the historically tight labor market. We believe that investments in our brand have made ZipRecruiter a destination for job seekers in their time of need. Our product improvements have also positioned us well to capitalize on this moment. As the labor market cools, it provides an 3 Based on our ZipRecruiter Brand Awareness Survey, 2022, an internal company-designed survey of 600 participants, which included (1) certain persons who had been involved in hiring processes and had used, or intend to use, online job posting websites within the preceding two years in connection with such hiring processes, (2) decision makers at hiring sites or systems, or influencers in the process of hiring candidates and (3) business owners, human resource managers, and non-human resources managers for U.S. based companies with up to 500 employees. The survey responses were used to measure brand health dimensions for us within the U.S. employer market and to explore how we benchmark against our competition. We designed the Brand Awareness Survey in accordance with what we believe are best practices for conducting a survey. Nevertheless, while we believe this survey is reliable, it involves a number of assumptions and limitations, and no independent sources have verified such survey. Q4 2022 Shareholder Letter 8
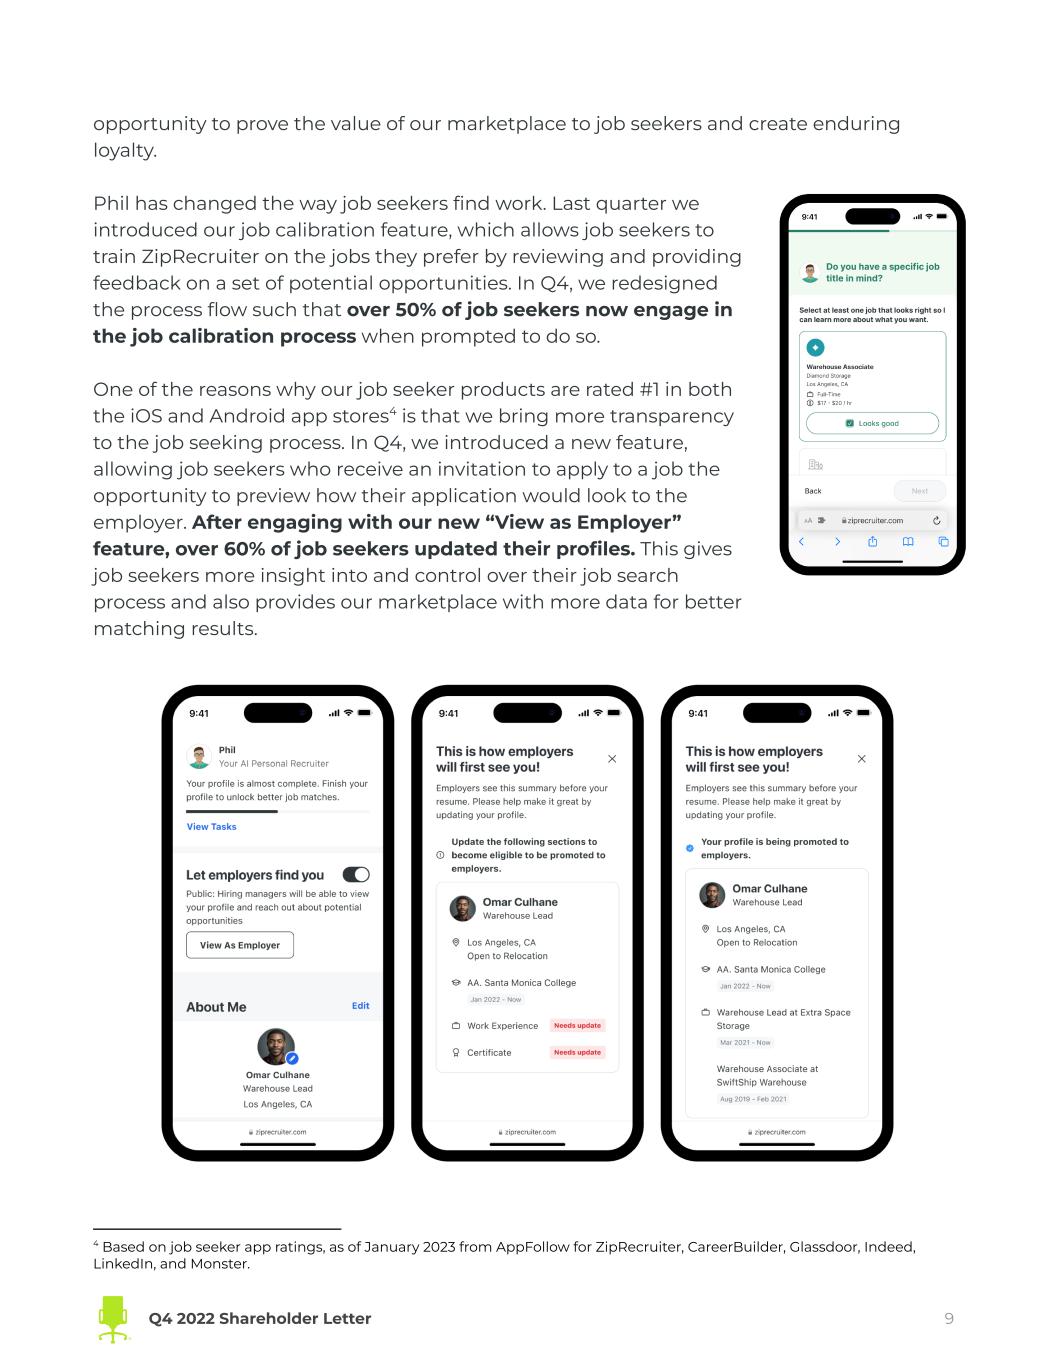
opportunity to prove the value of our marketplace to job seekers and create enduring loyalty. Phil has changed the way job seekers find work. Last quarter we introduced our job calibration feature, which allows job seekers to train ZipRecruiter on the jobs they prefer by reviewing and providing feedback on a set of potential opportunities. In Q4, we redesigned the process flow such that over 50% of job seekers now engage in the job calibration process when prompted to do so. One of the reasons why our job seeker products are rated #1 in both the iOS and Android app stores4 is that we bring more transparency to the job seeking process. In Q4, we introduced a new feature, allowing job seekers who receive an invitation to apply to a job the opportunity to preview how their application would look to the employer. After engaging with our new “View as Employer” feature, over 60% of job seekers updated their profiles. This gives job seekers more insight into and control over their job search process and also provides our marketplace with more data for better matching results. 4 Based on job seeker app ratings, as of January 2023 from AppFollow for ZipRecruiter, CareerBuilder, Glassdoor, Indeed, LinkedIn, and Monster. Q4 2022 Shareholder Letter 9

Over the course of 2022, we introduced new marketing creative, building mindshare around ZipRecruiter being the best place for job seekers to find their next great opportunity. These investments have borne fruit: aided brand awareness among job seekers grew to 80%5 in Q4’22, an all-time high. Growth Strategy #3: Make our matching technology smarter over time We bring employers and job seekers together using industry-leading matching technology. This technology benefits from the billions of data points we gather as job seekers and employers interact, leading to better matches over time. As a result of our advancements with matching, we delivered over 30 million Great Match candidates in 2022. In Q4, we introduced even more improvements to the meta learning model, giving job seekers even more relevant opportunities to apply to. For example, by more intelligently factoring in how a job seeker’s search patterns influence the jobs they are shown, our latest meta learning model drove up to 8% more applications from job seekers. 5 Based on our ZipRecruiter Brand Awareness Survey, 2022, an internal company-designed survey of 2,030 participants, which included certain persons who are active and passive job seekers over the last year. We designed the Brand Awareness Survey in accordance with what we believe are best practices for conducting a survey. Nevertheless, while we believe this survey is reliable, it involves a number of assumptions and limitations, and no independent sources have verified such survey. Q4 2022 Shareholder Letter 10
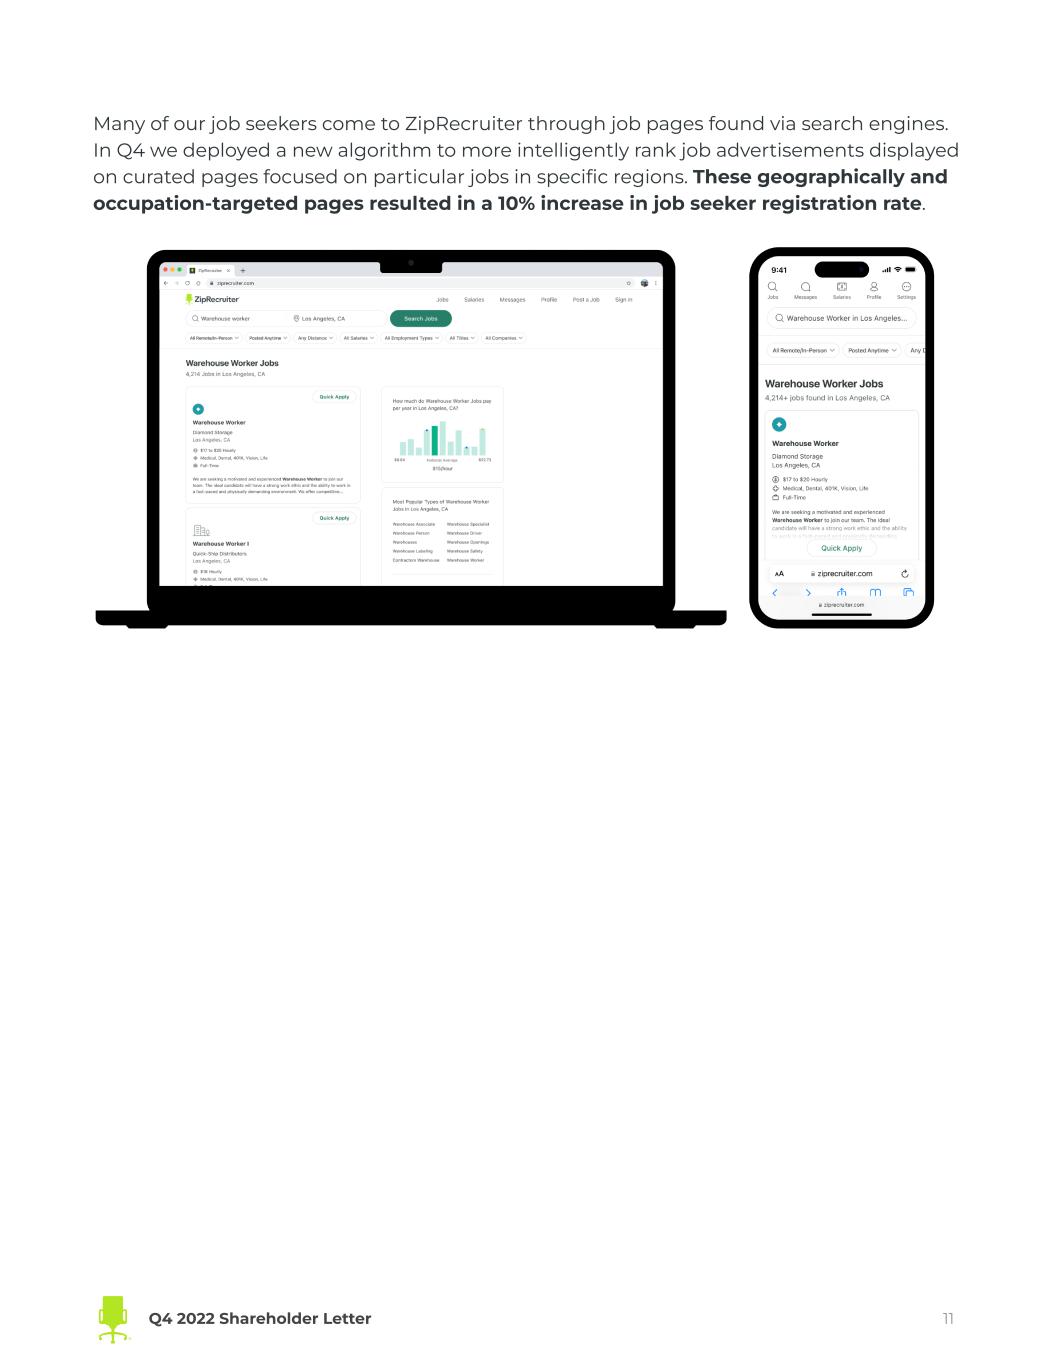
Many of our job seekers come to ZipRecruiter through job pages found via search engines. In Q4 we deployed a new algorithm to more intelligently rank job advertisements displayed on curated pages focused on particular jobs in specific regions. These geographically and occupation-targeted pages resulted in a 10% increase in job seeker registration rate. Q4 2022 Shareholder Letter 11

Investing in our people We invest in attracting and retaining great people to help achieve our goal of actively connecting people to their next great opportunity. We grew our product and engineering headcount by almost 15% in 2022, demonstrating our continued investment in building teams that deliver exceptional matching technology to both employers and job seekers. In addition to hiring great talent externally, career and personal growth for our existing employees remains one of our key objectives at ZipRecruiter. In fact, over 66% of our leadership positions are filled with people who grew internally at ZipRecruiter, demonstrating our dedication to fostering a culture of growth and development. We continue to receive recognition that ZipRecruiter is among the best places to work. Over the course of 2022, ZipRecruiter won numerous Comparably awards highlighting our commitment to ensuring ZipRecruiter is a place where employees feel valued every day. We’re also proud to have earned Great Place to Work® Certification.™ The Great Places to Work 2021 Global Employee Engagement Benchmark study reveals the state of workplaces worldwide. Conducted in the summer of 2021, the study surveyed over 14,000 workers across 37 countries to determine the average employee experience around the world. We were honored to see that 96% of employees at ZipRecruiter say it is a great place to work. ZipRecruiter’s commitment to employee growth and engagement extends across our global team. Thanks to the extraordinary accomplishments and culture of our Israeli team, we were named one of Dun’s top 25 places to work in Israel. We are delighted for our teams to be recognized across our international footprint. Q4 2022 Shareholder Letter 12
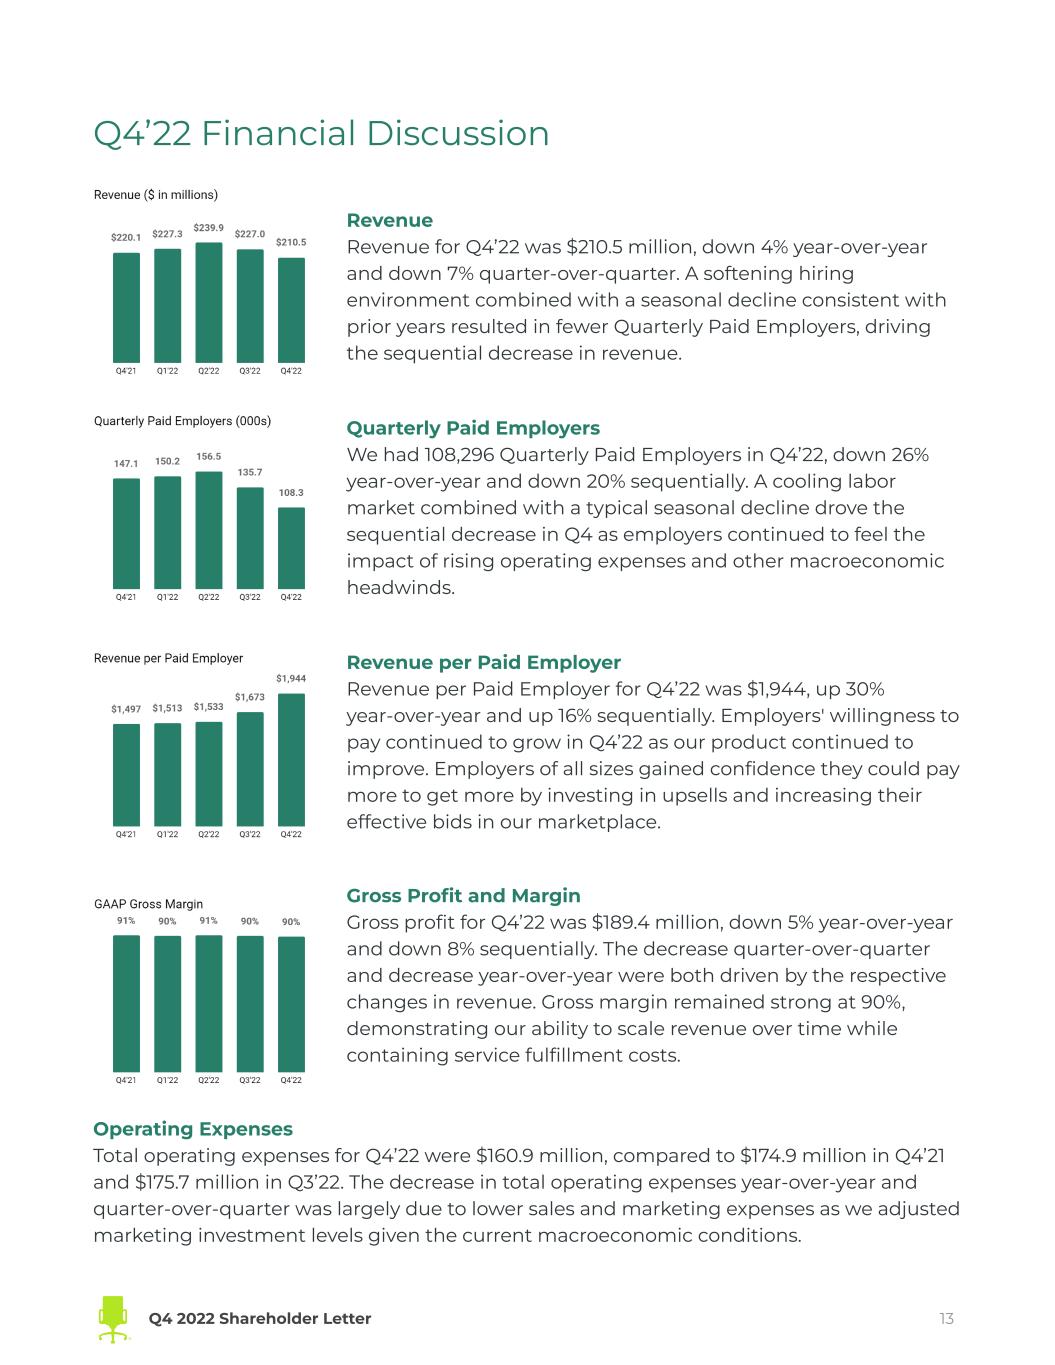
Q4’22 Financial Discussion Revenue Revenue for Q4’22 was $210.5 million, down 4% year-over-year and down 7% quarter-over-quarter. A softening hiring environment combined with a seasonal decline consistent with prior years resulted in fewer Quarterly Paid Employers, driving the sequential decrease in revenue. Quarterly Paid Employers We had 108,296 Quarterly Paid Employers in Q4’22, down 26% year-over-year and down 20% sequentially. A cooling labor market combined with a typical seasonal decline drove the sequential decrease in Q4 as employers continued to feel the impact of rising operating expenses and other macroeconomic headwinds. Revenue per Paid Employer Revenue per Paid Employer for Q4’22 was $1,944, up 30% year-over-year and up 16% sequentially. Employers' willingness to pay continued to grow in Q4’22 as our product continued to improve. Employers of all sizes gained confidence they could pay more to get more by investing in upsells and increasing their effective bids in our marketplace. Gross Profit and Margin Gross profit for Q4’22 was $189.4 million, down 5% year-over-year and down 8% sequentially. The decrease quarter-over-quarter and decrease year-over-year were both driven by the respective changes in revenue. Gross margin remained strong at 90%, demonstrating our ability to scale revenue over time while containing service fulfillment costs. Operating Expenses Total operating expenses for Q4’22 were $160.9 million, compared to $174.9 million in Q4’21 and $175.7 million in Q3’22. The decrease in total operating expenses year-over-year and quarter-over-quarter was largely due to lower sales and marketing expenses as we adjusted marketing investment levels given the current macroeconomic conditions. Q4 2022 Shareholder Letter 13
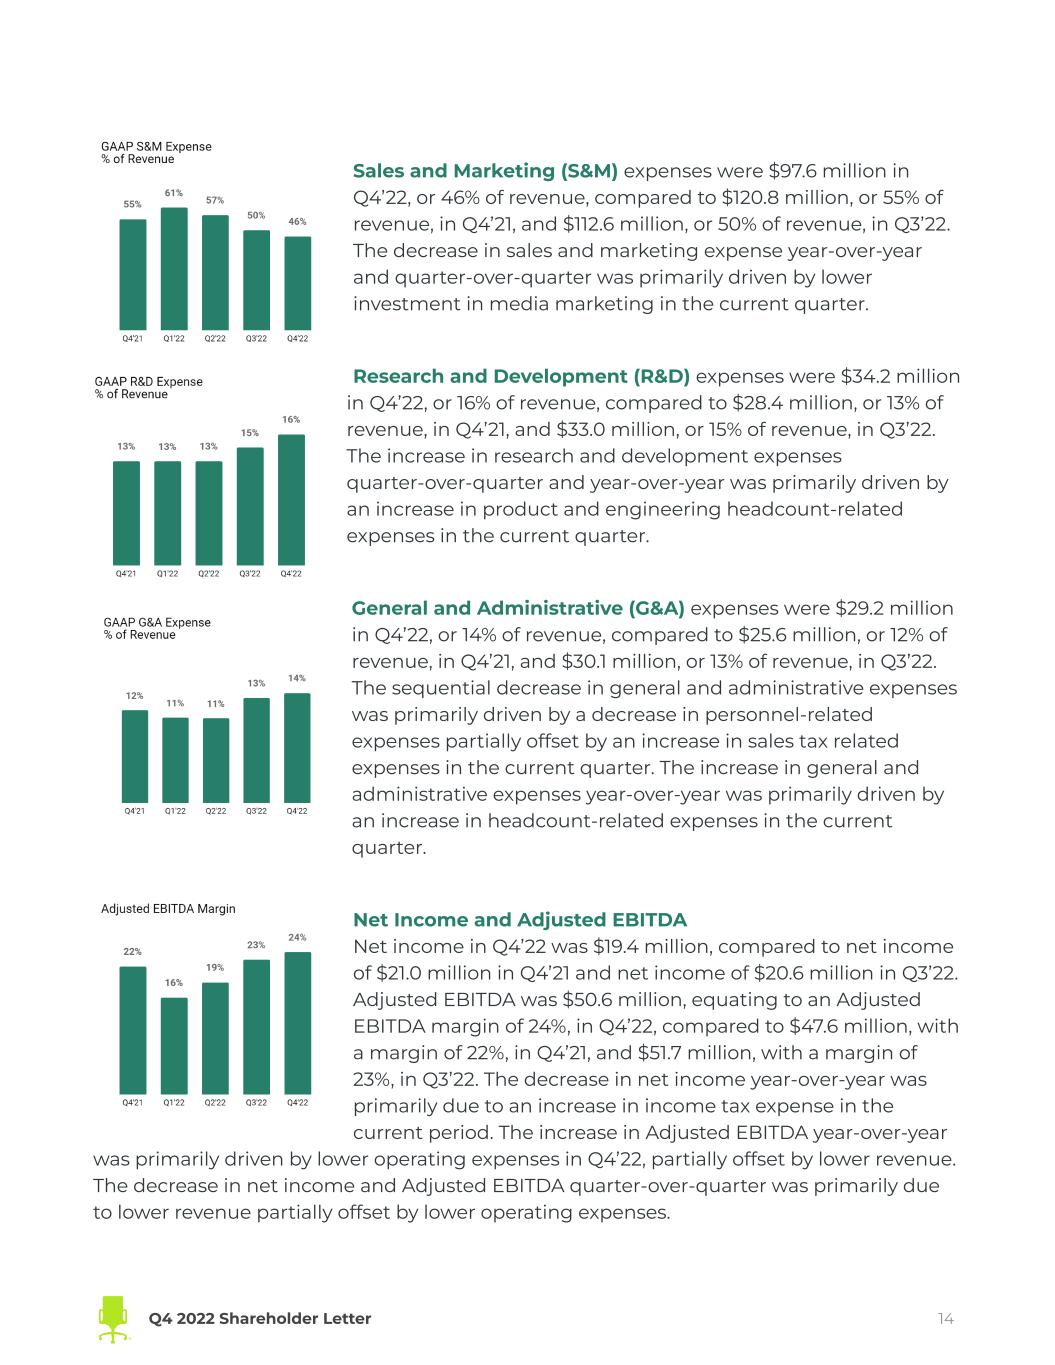
Sales and Marketing (S&M) expenses were $97.6 million in Q4’22, or 46% of revenue, compared to $120.8 million, or 55% of revenue, in Q4’21, and $112.6 million, or 50% of revenue, in Q3’22. The decrease in sales and marketing expense year-over-year and quarter-over-quarter was primarily driven by lower investment in media marketing in the current quarter. Research and Development (R&D) expenses were $34.2 million in Q4’22, or 16% of revenue, compared to $28.4 million, or 13% of revenue, in Q4’21, and $33.0 million, or 15% of revenue, in Q3’22. The increase in research and development expenses quarter-over-quarter and year-over-year was primarily driven by an increase in product and engineering headcount-related expenses in the current quarter. General and Administrative (G&A) expenses were $29.2 million in Q4’22, or 14% of revenue, compared to $25.6 million, or 12% of revenue, in Q4’21, and $30.1 million, or 13% of revenue, in Q3’22. The sequential decrease in general and administrative expenses was primarily driven by a decrease in personnel-related expenses partially offset by an increase in sales tax related expenses in the current quarter. The increase in general and administrative expenses year-over-year was primarily driven by an increase in headcount-related expenses in the current quarter. Net Income and Adjusted EBITDA Net income in Q4’22 was $19.4 million, compared to net income of $21.0 million in Q4’21 and net income of $20.6 million in Q3’22. Adjusted EBITDA was $50.6 million, equating to an Adjusted EBITDA margin of 24%, in Q4’22, compared to $47.6 million, with a margin of 22%, in Q4’21, and $51.7 million, with a margin of 23%, in Q3’22. The decrease in net income year-over-year was primarily due to an increase in income tax expense in the current period. The increase in Adjusted EBITDA year-over-year was primarily driven by lower operating expenses in Q4’22, partially offset by lower revenue. The decrease in net income and Adjusted EBITDA quarter-over-quarter was primarily due to lower revenue partially offset by lower operating expenses. Q4 2022 Shareholder Letter 14
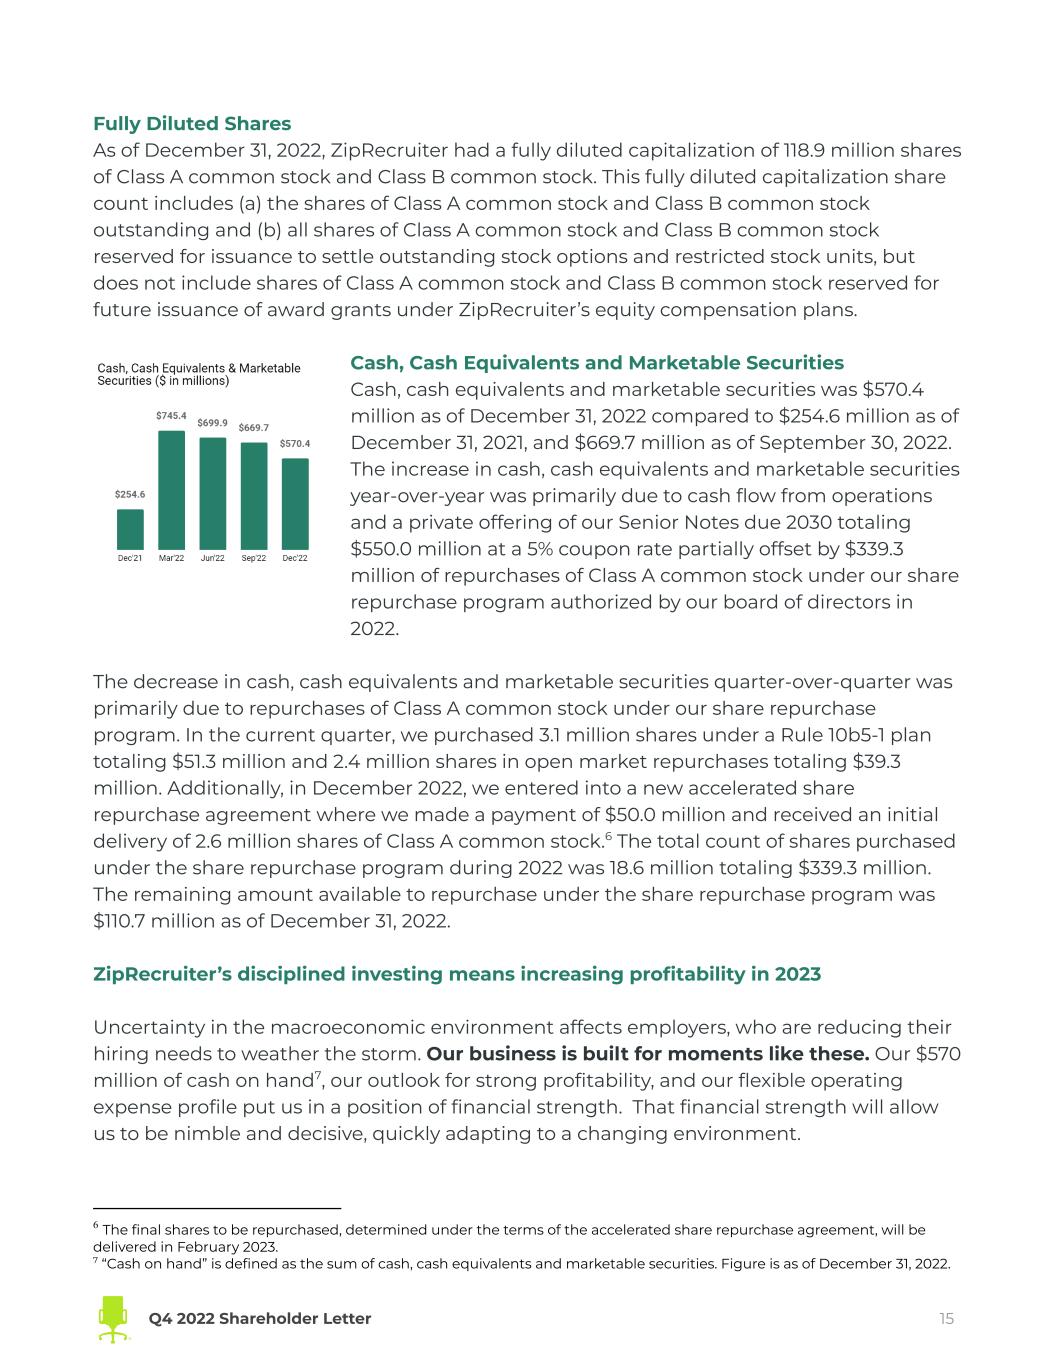
Fully Diluted Shares As of December 31, 2022, ZipRecruiter had a fully diluted capitalization of 118.9 million shares of Class A common stock and Class B common stock. This fully diluted capitalization share count includes (a) the shares of Class A common stock and Class B common stock outstanding and (b) all shares of Class A common stock and Class B common stock reserved for issuance to settle outstanding stock options and restricted stock units, but does not include shares of Class A common stock and Class B common stock reserved for future issuance of award grants under ZipRecruiter’s equity compensation plans. Cash, Cash Equivalents and Marketable Securities Cash, cash equivalents and marketable securities was $570.4 million as of December 31, 2022 compared to $254.6 million as of December 31, 2021, and $669.7 million as of September 30, 2022. The increase in cash, cash equivalents and marketable securities year-over-year was primarily due to cash flow from operations and a private offering of our Senior Notes due 2030 totaling $550.0 million at a 5% coupon rate partially offset by $339.3 million of repurchases of Class A common stock under our share repurchase program authorized by our board of directors in 2022. The decrease in cash, cash equivalents and marketable securities quarter-over-quarter was primarily due to repurchases of Class A common stock under our share repurchase program. In the current quarter, we purchased 3.1 million shares under a Rule 10b5-1 plan totaling $51.3 million and 2.4 million shares in open market repurchases totaling $39.3 million. Additionally, in December 2022, we entered into a new accelerated share repurchase agreement where we made a payment of $50.0 million and received an initial delivery of 2.6 million shares of Class A common stock.6 The total count of shares purchased under the share repurchase program during 2022 was 18.6 million totaling $339.3 million. The remaining amount available to repurchase under the share repurchase program was $110.7 million as of December 31, 2022. ZipRecruiter’s disciplined investing means increasing profitability in 2023 Uncertainty in the macroeconomic environment affects employers, who are reducing their hiring needs to weather the storm. Our business is built for moments like these. Our $570 million of cash on hand7, our outlook for strong profitability, and our flexible operating expense profile put us in a position of financial strength. That financial strength will allow us to be nimble and decisive, quickly adapting to a changing environment. 7 “Cash on hand” is defined as the sum of cash, cash equivalents and marketable securities. Figure is as of December 31, 2022. 6 The final shares to be repurchased, determined under the terms of the accelerated share repurchase agreement, will be delivered in February 2023. Q4 2022 Shareholder Letter 15

At the same time, we have an ever-growing conviction in two bedrock assumptions about our business that endure through cycles. First, the importance for employers of finding the right job seekers continues to grow. Second, we are at the beginning of a generational shift in how technology enables job seekers and employers to come together. You will see us at the forefront of that generational shift. ___________________________ Ian Siegel Chief Executive Officer _______________________________ David Travers President _______________________________ Tim Yarbrough Chief Financial Officer Q4 2022 Shareholder Letter 16

Forward-Looking Statements This shareholder letter contains forward-looking statements within the meaning of the Private Securities Litigation Reform Act of 1995. All statements contained in this shareholder letter that do not relate to matters of historical fact should be considered forward-looking statements, including, without limitation, our market opportunity and expected hiring activity for the remainder of 2023; statements under the section titled "Financial Outlook"; statements regarding our expected financial performance and operational performance for the first quarter of 2023 and the fiscal year ending December 31, 2023; statements regarding our expected future revenue growth, Adjusted EBITDA profitability, capital allocation strategy, and brand awareness; statements regarding our beliefs regarding the early stages of recruitment market disruption and enterprise segment penetration, as well as statements that include the words “expect,” “intend,” “plan,” “believe,” “project,” “forecast,” “estimate,” “may,” “should,” “anticipate” and similar statements of a future or forward-looking nature. These forward-looking statements are based on management's current expectations. These statements are neither promises nor guarantees, but involve known and unknown risks, uncertainties and other important factors that may cause actual results, performance or achievements to be materially different from any future results, performance or achievements expressed or implied by the forward-looking statements, including, but not limited to: our ability to attract and retain employers and job seekers; our ability to compete with well-established competitors and new entrants; our ability to achieve and/or maintain profitability; our ability to maintain, protect and enhance our brand and intellectual property; our dependence on macroeconomic factors; our ability to maintain and improve the quality of our platform; our dependence on the interoperability of our platform with mobile operating systems that we do not control; our ability to successfully implement our business plan during a global economic downturn that may impact the demand for our services or have a material adverse impact on our and our business partners’ financial condition and results of operations; our ability and the ability of third parties to protect our users’ personal or other data from a security breach and to comply with laws and regulations relating to consumer data privacy and data protection; our ability to detect errors, defects or disruptions in our platform; our ability to comply with the terms of underlying licenses of open source software components on our platform; our ability to expand into markets outside the United States; our ability to achieve desired operating margins; our compliance with a wide variety of U.S. and international laws and regulations; our reliance on Amazon Web Services; our ability to mitigate payment and fraud risks; our dependence on our senior management and our ability to attract and retain new talent; and the other important risk factors more fully discussed and described in documents we have filed with the Securities and Exchange Commission (“SEC”), including our Quarterly Report on Form 10-Q for the three months ended September 30, 2022 that we filed with the SEC and our Annual Report on Form 10-K for the twelve months ended December 31, 2022 that we will file with the SEC. In addition, we operate in a very competitive and rapidly changing environment. New risks emerge from time to time. It is not possible for our management to predict all risks, nor can we assess the impact of all factors on our business or the extent to which any factor, or combination of factors, may cause actual results to differ materially from those contained in any forward-looking statements that we may make. In light of these risks, uncertainties and assumptions, the forward-looking events and circumstances discussed in this release are inherently uncertain and may not occur, and actual results could differ materially and adversely from those anticipated or implied in the forward-looking statements. Accordingly, you should not rely upon forward-looking statements as predictions of future events. In addition, the forward-looking statements made in this shareholder letter relate only to events or information as of the date on which the statements are made in this letter. Except as required by law, we undertake no obligation to update or revise publicly any forward-looking statements, whether as a result of new information, future events or otherwise, after the date on which the statements are made or to reflect the occurrence of unanticipated events. Q4 2022 Shareholder Letter 17

Conference Call Details We will host a conference call to discuss our financial results on Tuesday, February 21, 2023, at 2:00 p.m. Pacific Time. A live webcast of the call can be accessed from ZipRecruiter’s Investor Relations website. An archived version will be available on the website two hours after the call. Investors and analysts can participate in the conference call by dialing +1 (888) 440-4199, or +1 (646) 960-0818 for callers outside the United States. A telephonic replay of the conference call will be available until Tuesday, February 28, 2022. To listen to the replay please dial +1 (800) 770-2030 or +1 (647) 362-9199 for callers outside the United States. Q4 2022 Shareholder Letter 18
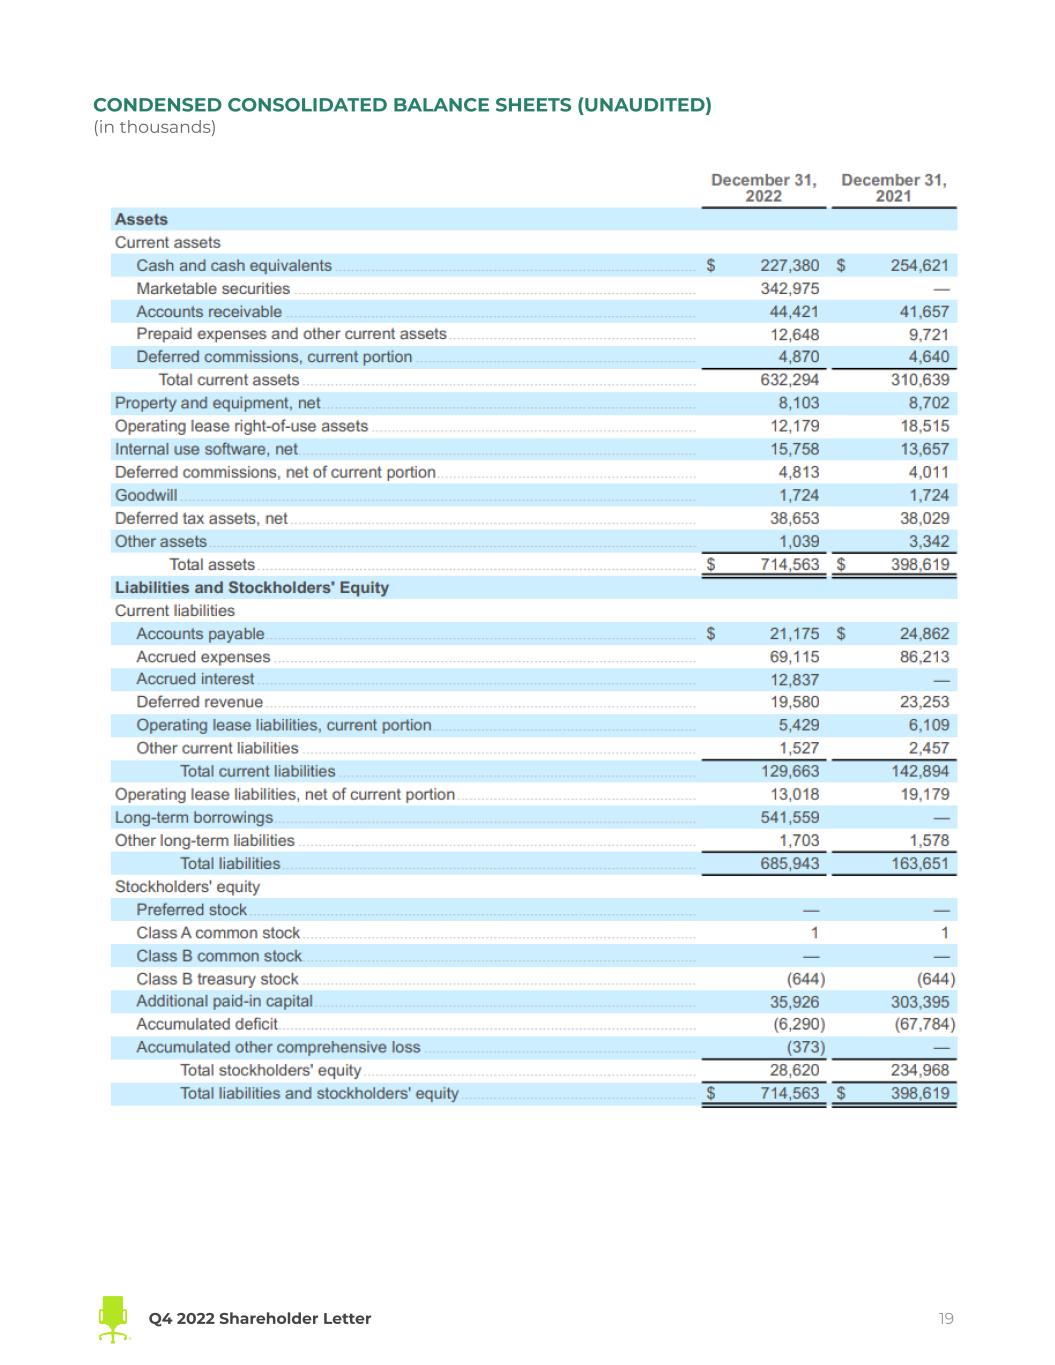
CONDENSED CONSOLIDATED BALANCE SHEETS (UNAUDITED) (in thousands) Q4 2022 Shareholder Letter 19

CONDENSED CONSOLIDATED STATEMENTS OF OPERATIONS (UNAUDITED) (in thousands, except per share amounts) Q4 2022 Shareholder Letter 20

CONDENSED CONSOLIDATED STATEMENTS OF CASH FLOWS (UNAUDITED) (in thousands) Q4 2022 Shareholder Letter 21
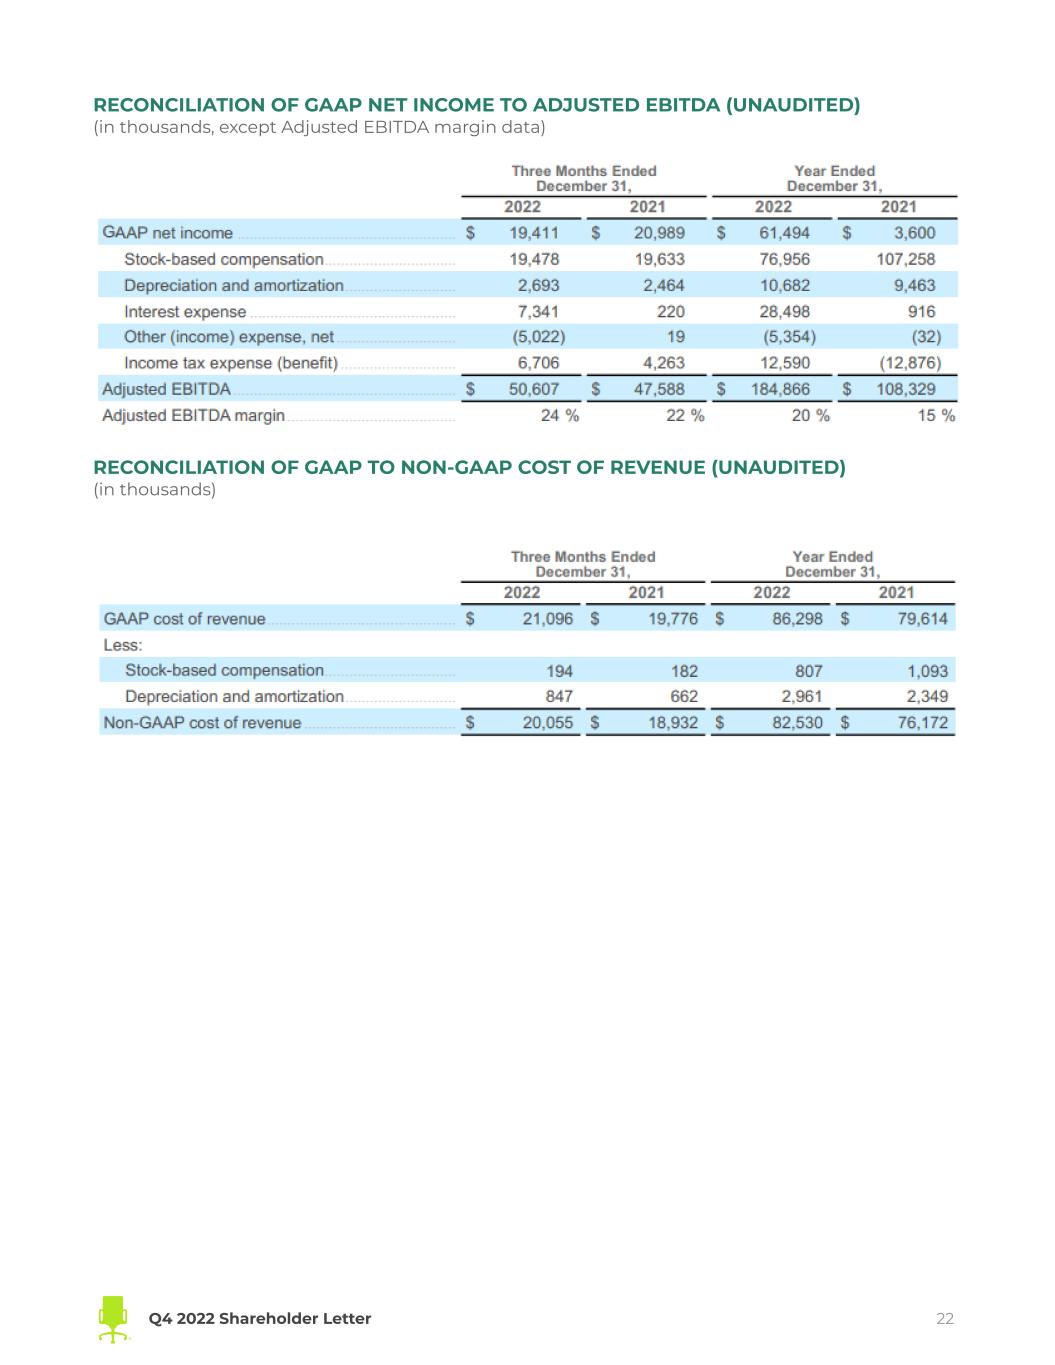
RECONCILIATION OF GAAP NET INCOME TO ADJUSTED EBITDA (UNAUDITED) (in thousands, except Adjusted EBITDA margin data) RECONCILIATION OF GAAP TO NON-GAAP COST OF REVENUE (UNAUDITED) (in thousands) Q4 2022 Shareholder Letter 22
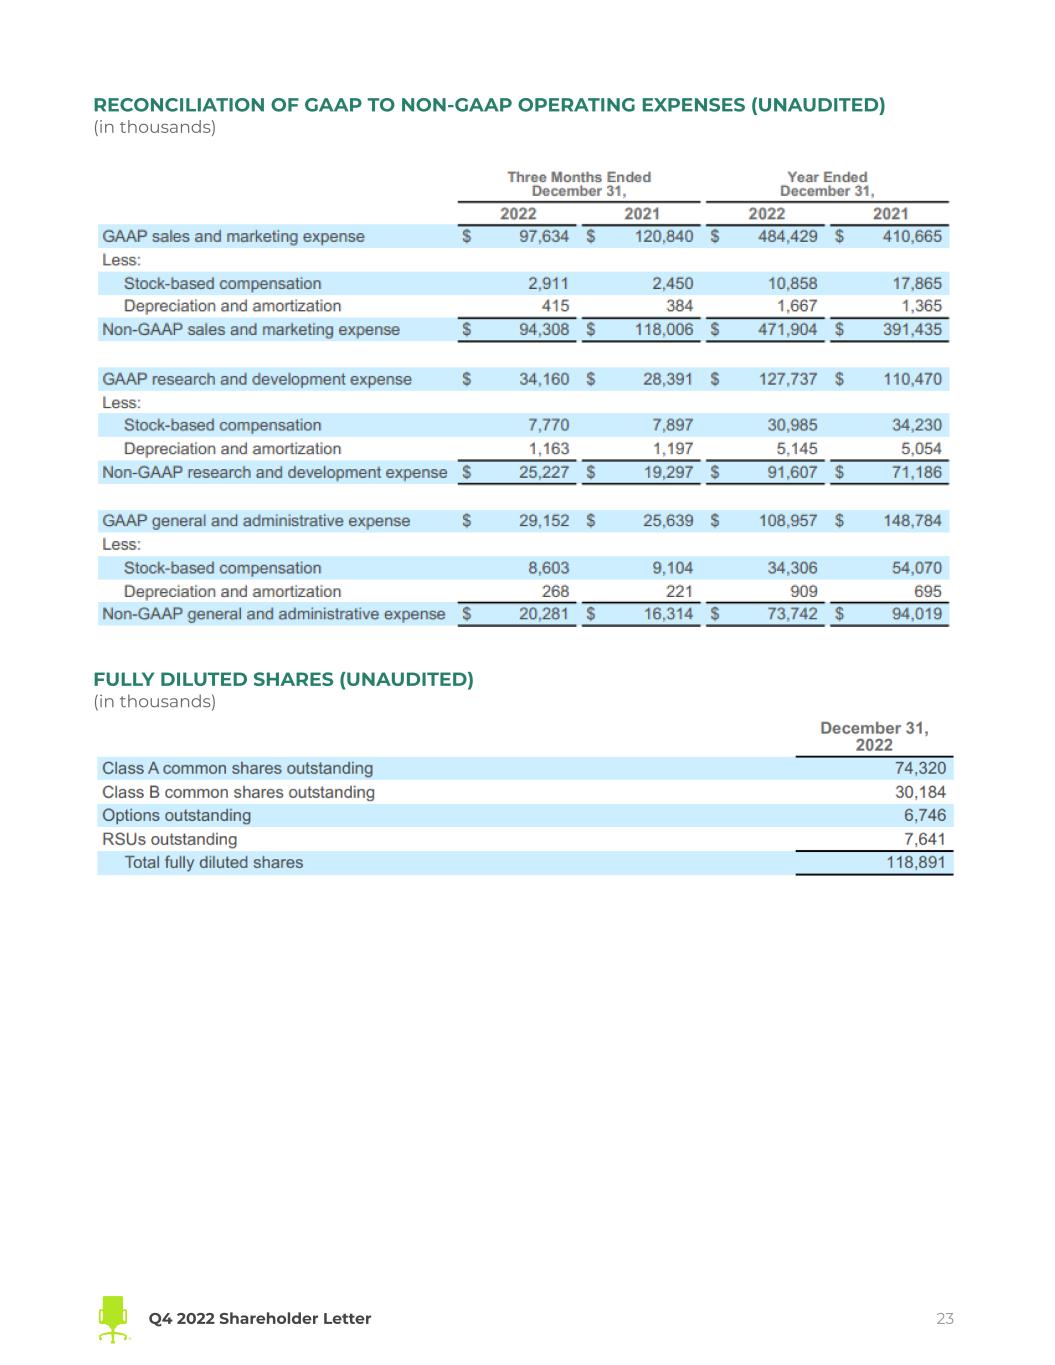
RECONCILIATION OF GAAP TO NON-GAAP OPERATING EXPENSES (UNAUDITED) (in thousands) FULLY DILUTED SHARES (UNAUDITED) (in thousands) Q4 2022 Shareholder Letter 23
Key Operating Metrics and Non-GAAP Financial Measures This shareholder letter includes certain key operating metrics, including Quarterly Paid Employers and Revenue per Paid Employer, and non-GAAP financial measures, including Non-GAAP cost of revenue, Non-GAAP operating expenses, Adjusted EBITDA and Adjusted EBITDA margin. We define Paid Employers as any employer(s) (or entities acting on behalf of an employer) on a paying subscription plan or performance marketing campaign for at least one day. Paid Employer(s) excludes employers from our Job Distribution Partners or other indirect channels, employers who are not actively searching for candidates, but otherwise have access to previously posted jobs, and employers on free trial. Job Distribution Partners are defined as third-party sites who have a relationship with us and advertise jobs from our marketplace. Quarterly Paid Employers means, with respect to any fiscal quarter, the count of Paid Employers during such fiscal quarter. Revenue per Paid Employer is the total company revenue in a particular period divided by the count of Quarterly Paid Employers in the same period. We define Non-GAAP cost of revenue as our cost of revenue before stock-based compensation expense, and depreciation and amortization. We define Non-GAAP operating expenses as our operating expenses before stock-based compensation expense, and depreciation and amortization. We define Adjusted EBITDA as our net income (loss) before interest expense, other (income) expense, net, income tax expense (benefit) and depreciation and amortization, adjusted to eliminate stock-based compensation expense. Adjusted EBITDA margin represents Adjusted EBITDA as a percentage of revenue for the same period. Management and our board of directors use these key operating metrics and non-GAAP financial measures as supplemental measures of our performance because they assist us in comparing our operating performance on a consistent basis, as they remove the impact of some items not directly resulting from our core operations. We also use these key operating metrics and non-GAAP financial measures for planning purposes, including the preparation of our internal annual operating budget and financial projections, to evaluate the performance and effectiveness of our strategic initiatives and to evaluate our capacity for capital expenditures to expand our business. Non-GAAP cost of revenue, Non-GAAP operating expenses, Adjusted EBITDA and Adjusted EBITDA margin should not be considered in isolation, as an alternative to, or superior to net income (loss), revenue, cash flows or other measures derived in accordance with GAAP. These non-GAAP measures are frequently used by analysts, investors and other interested parties to evaluate companies in our industry. Management believes that the presentation of non-GAAP financial measures is an appropriate measure of operating performance because they eliminate the impact of some expenses that do not relate directly to the performance of our underlying business. These non-GAAP financial measures should not be construed as an inference that our future results will be unaffected by unusual or other items. Additionally, Adjusted EBITDA and Adjusted EBITDA margin are not intended to be a measure of free cash flow for management’s discretionary use, as they do not reflect our tax payments and certain other cash costs that may recur in the future, including, among other things, cash requirements for costs to replace assets being depreciated and amortized including our capitalized internal use software. Management compensates for these limitations by relying on our GAAP results in addition to using Adjusted EBITDA and Adjusted EBITDA margin as supplemental measures of our performance. Our measures of Adjusted EBITDA and Adjusted EBITDA margin used herein are not necessarily comparable to similarly titled captions of other companies due to different methods of calculation. We are not able to provide a reconciliation of Adjusted EBITDA and Adjusted EBITDA margin for Q1’23 or the full fiscal year 2023 to net income and net income margin, the comparable GAAP measures, respectively, because certain items that are excluded from non-GAAP financial measures cannot be reasonably predicted or are not in our control. In particular, we are unable to forecast the timing or magnitude of stock-based compensation or amortization of intangible assets, as applicable, without unreasonable efforts, and these items could significantly impact, either individually or in the aggregate, GAAP measures in the future. See the tables above regarding reconciliations of these non-GAAP financial measures to the most directly comparable GAAP measures. Q4 2022 Shareholder Letter 24


