
Exhibit 99.2

Q4 2023 Shareholder Letter 1

Q4 2023 Shareholder Letter 2
ToOur Shareholders 2023 demonstrated ZipRecruiter’s resilience and flexibility. One of the slowest hiring markets in recent memory resulted in full-year 2023 revenue of $646 million, down 29% year-over-year. In response to the observed macroeconomic headwinds, we rapidly managed down expenses. This continues to be our playbook and is a luxury a�orded us by our business model. As a result, in 2023 we delivered net income of $49 million and Adjusted EBITDA of $175 million. This represented a net incomemargin of 8% and Adjusted EBITDAmargin of 27%, year-over-year increases of 1 and 7 percentage points, respectively. Despite all of our spending cuts, long term improvements to the business remained fully-funded and technology remains an area of focused investment. These investments are already paying dividends. Phil continues to improve as an engaging and conversational career advisor, helping job seekers understand their own goals and providing highly personalized job recommendations. Our enterprise customers now enjoy a more automated onboarding experience with programmatic campaign optimization. We have built over 140 integrations with applicant tracking systems (ATS), providing the triple benefit of 1) a smoother application experience for job seekers, 2) a higher volume of response to jobs for enterprises; and 3) an increasing number of enterprise customers sharing hiring signals which makes our matching technology smarter over time. While there have been significant top-line headwinds in 2023, product improvements have continued at full speed. 2023 was a historic year of decline in the recruiting industry as employers dramatically slowed hiring. In November, the BLS-reported hiring rate reached its lowest point since 2014 (excluding the early pandemic months), and remained subdued at 3.6% in December1. Quits and separations, some of the primary drivers of employer hiring, are down to pre-pandemic levels2. Many businesses even report being oversta�ed for current activity levels but still retain workers in anticipation of improving business conditions in the coming months. While reported job growth numbers have remained strong, this growth has been unusually concentrated. Nearly 80% of all jobs added in 2023 have been in just three sectors: healthcare, government and leisure & hospitality. Other industries, such as transportation & warehousing and information, remain below levels seen in early 2022, prior to the most recent hiring slowdown3. 3 Source: U.S. Bureau of Labor Statistics, Current Employment Statistics, as of February 2024 2 Source: U.S. Bureau of Labor Statistics, Total nonfarm quits and Total nonfarm separations, as of February 2024 1 Source: U.S. Bureau of Labor Statistics, Total nonfarm hires, as of February 2024 Q4 2023 Shareholder Letter 3
Job seeking levels also remain tempered. Employment rates remain high. While in 2021 and 2022, workers left jobs for higher wages, wage inflation has abated and macroeconomic uncertainty has increasingly kept people in their current roles. With fewer job openings and lower employee turnover, the “Great Resignation” has turned into the “Big Stay.” Although many macroeconomic forecasts are optimistic about the US economymanaging a “soft landing” without a recession in 2024, we remain nimble and prepared to adapt to a wide range of economic scenarios. Our ability to adapt quickly amidst uncertainty is built upon our strong financial foundation, defined by both a historical track record of profitability and a healthy balance sheet. Most recently, we responded to the industry wide slowdown in 2023 by reducing operating expenses, while preserving investments in the technology that builds upon our long-term competitive advantage. After the steady decline in the demand for labor over the past 18 months, we start 2024 with muted revenue expectations for Q1’24. Although we retain flexibility to manage expenses if the labor market slows further, we think it is prudent to continue investing in long-term initiatives as we see how 2024 progresses. Our focus on our matching technology, brand awareness among job seekers and employers, integrations with enterprise-grade ATSs and new product development will allow us to be optimally positioned to take advantage of the inevitable recovery in the hiring market, whenever it takes shape. The long-term opportunity to disrupt how job seekers and employers connect remains large, and we remain well-positioned for the labor market recovery. We will continue to invest in cutting-edge technology to improve our matching algorithms and products to increase engagement between employers and job seekers. While the shape and duration of the current labor market cycle remains out of our control, we remain focused on our mission of actively connecting people to their next great opportunity. _________________________ _______________________________ Ian Siegel David Travers Chief Executive O�cer President _______________________________ TimYarbrough Chief Financial O�cer Q4 2023 Shareholder Letter 4
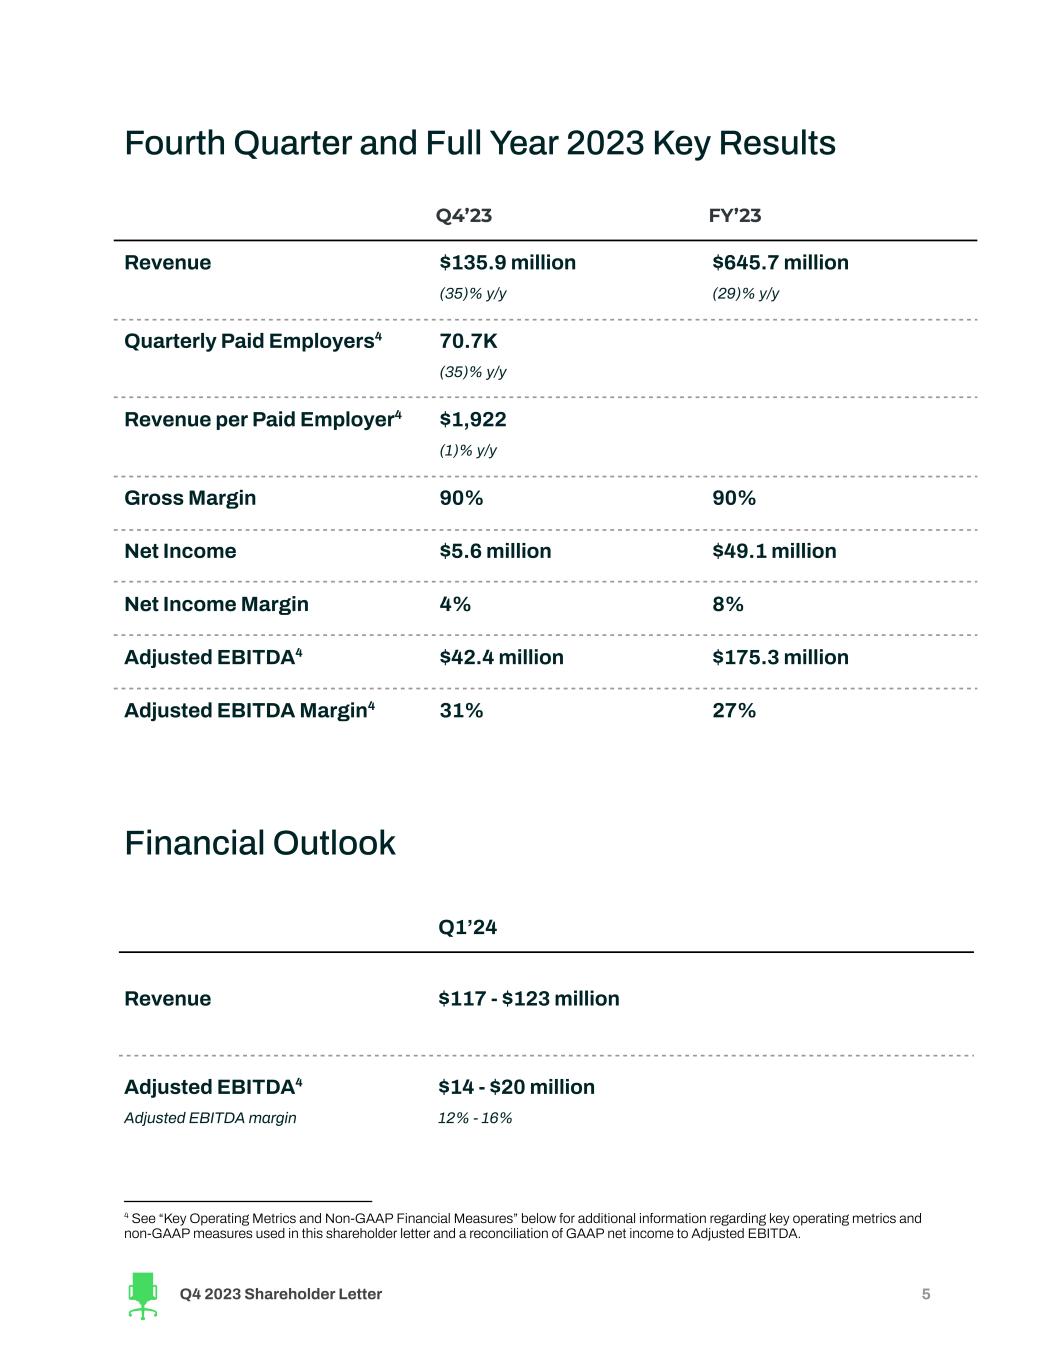
Fourth Quarter and Full Year 2023 Key Results Q4’23 FY’23 Revenue �135.9million (35)% y/y �645.7million (29)% y/y Quarterly Paid Employers4 70.7K (35)% y/y Revenue per Paid Employer4 �1,922 (1)% y/y GrossMargin 90% 90% Net Income �5.6million �49.1million Net IncomeMargin 4% 8% Adjusted EBITDA4 �42.4million �175.3million Adjusted EBITDAMargin4 31% 27% Financial Outlook Q1’24 Revenue �117 - �123million Adjusted EBITDA4 Adjusted EBITDAmargin �14 - �20million 12% - 16% 4 See “Key Operating Metrics and Non-GAAP Financial Measures” below for additional information regarding key operating metrics and non-GAAPmeasures used in this shareholder letter and a reconciliation of GAAP net income to Adjusted EBITDA. Q4 2023 Shareholder Letter 5
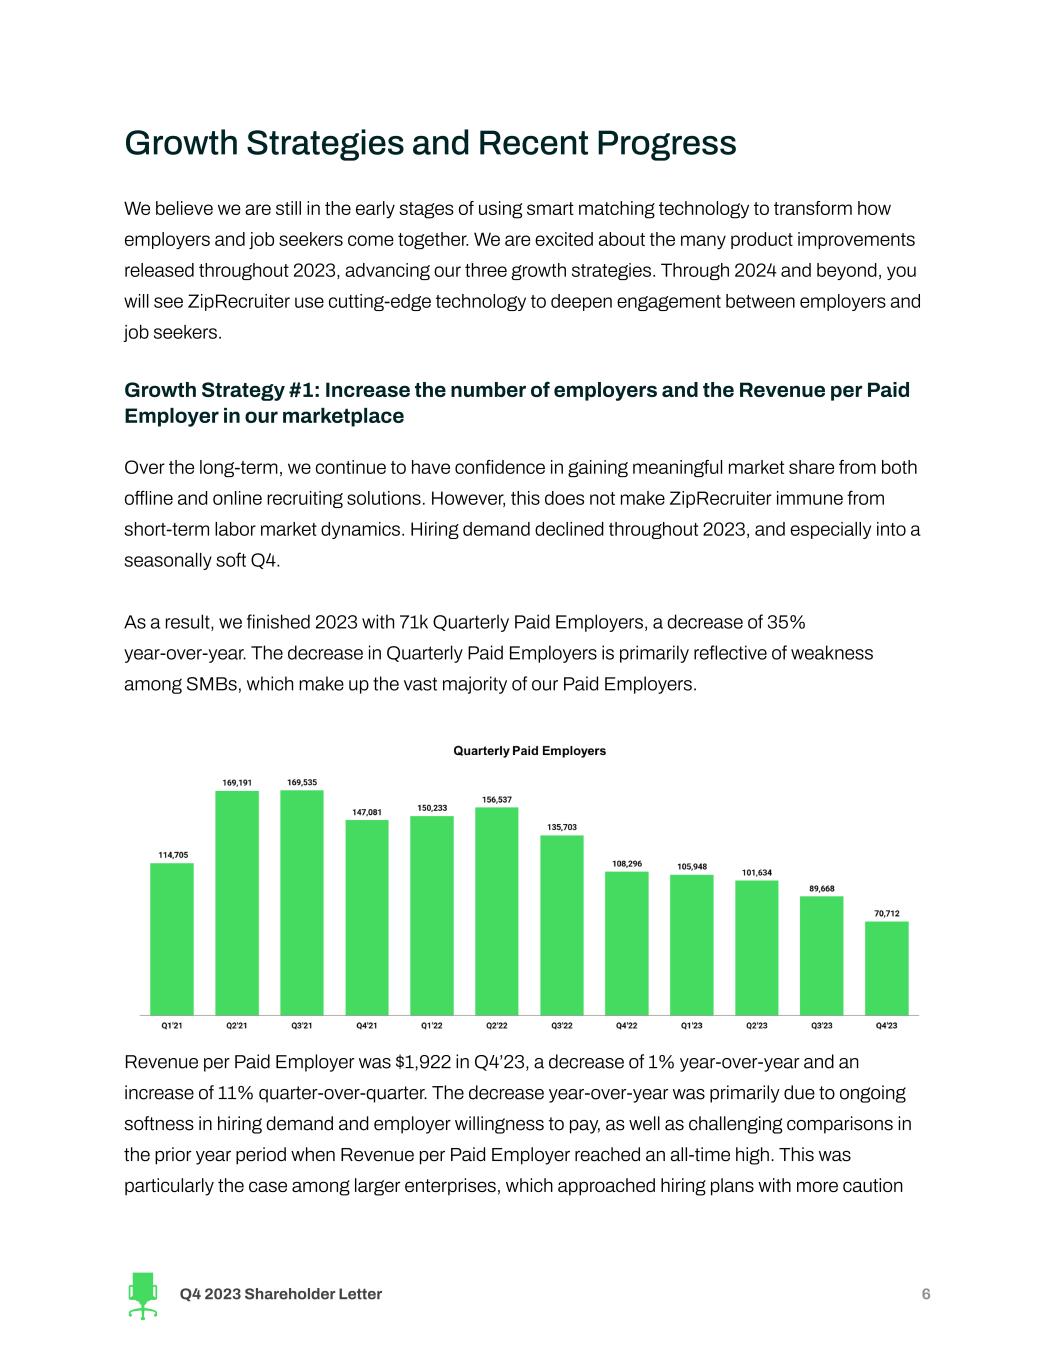
Growth Strategies and Recent Progress We believe we are still in the early stages of using smart matching technology to transform how employers and job seekers come together. We are excited about the many product improvements released throughout 2023, advancing our three growth strategies. Through 2024 and beyond, you will see ZipRecruiter use cutting-edge technology to deepen engagement between employers and job seekers. Growth Strategy #1: Increase the number of employers and the Revenue per Paid Employer in ourmarketplace Over the long-term, we continue to have confidence in gaining meaningful market share from both o�ine and online recruiting solutions. However, this does not make ZipRecruiter immune from short-term labor market dynamics. Hiring demand declined throughout 2023, and especially into a seasonally soft Q4. As a result, we finished 2023 with 71k Quarterly Paid Employers, a decrease of 35% year-over-year. The decrease in Quarterly Paid Employers is primarily reflective of weakness among SMBs, which make up the vast majority of our Paid Employers. Revenue per Paid Employer was $1,922 in Q4’23, a decrease of 1% year-over-year and an increase of 11% quarter-over-quarter. The decrease year-over-year was primarily due to ongoing softness in hiring demand and employer willingness to pay, as well as challenging comparisons in the prior year period when Revenue per Paid Employer reached an all-time high. This was particularly the case among larger enterprises, which approached hiring plans with more caution Q4 2023 Shareholder Letter 6
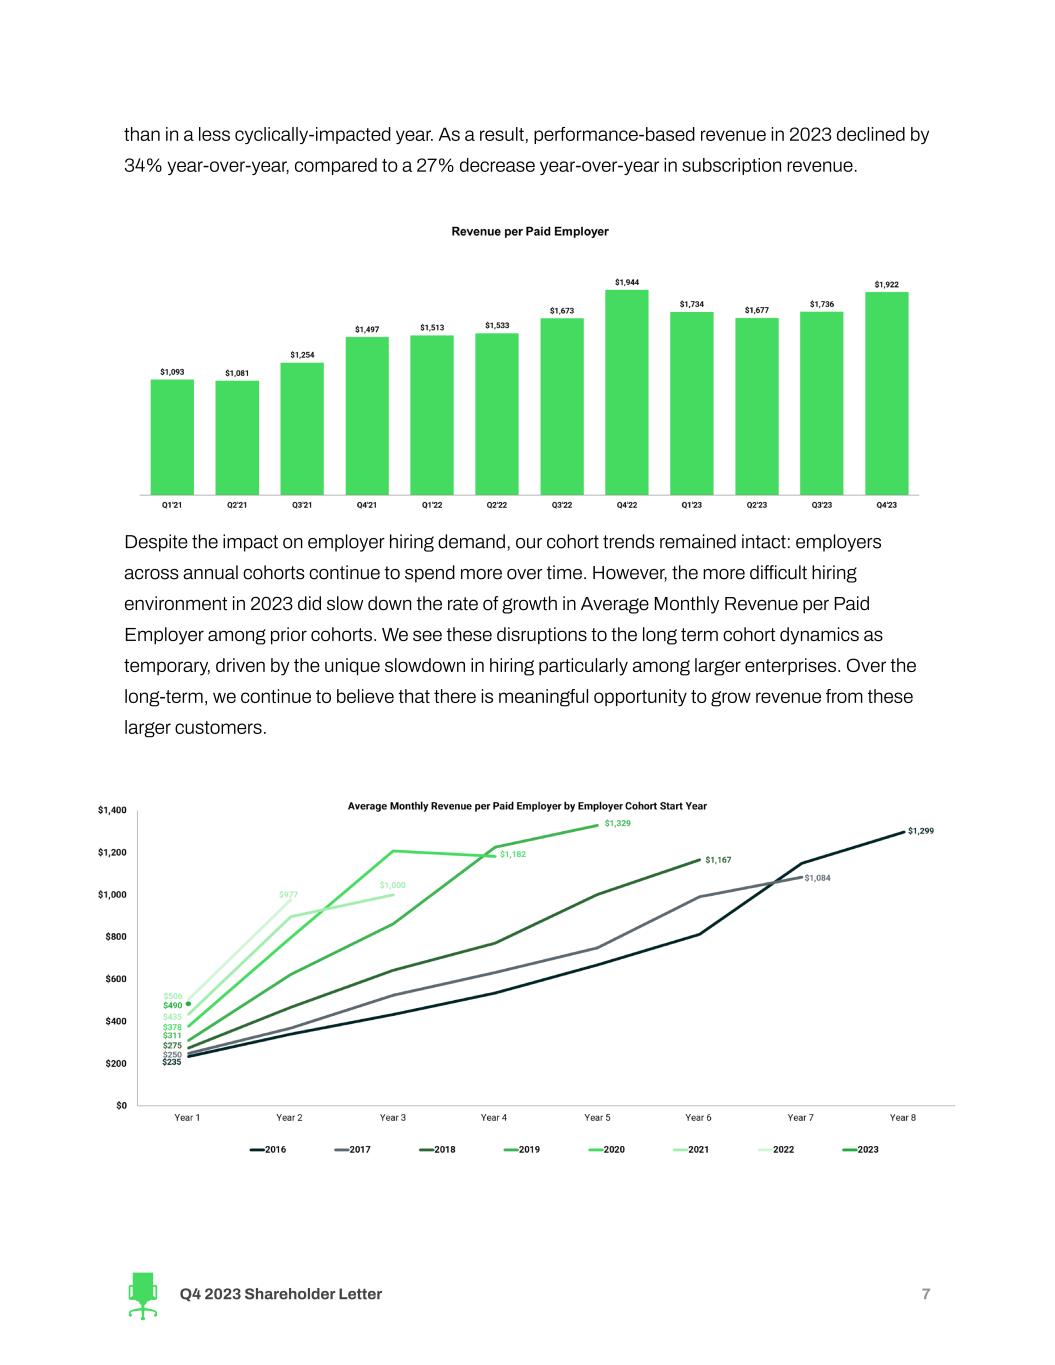
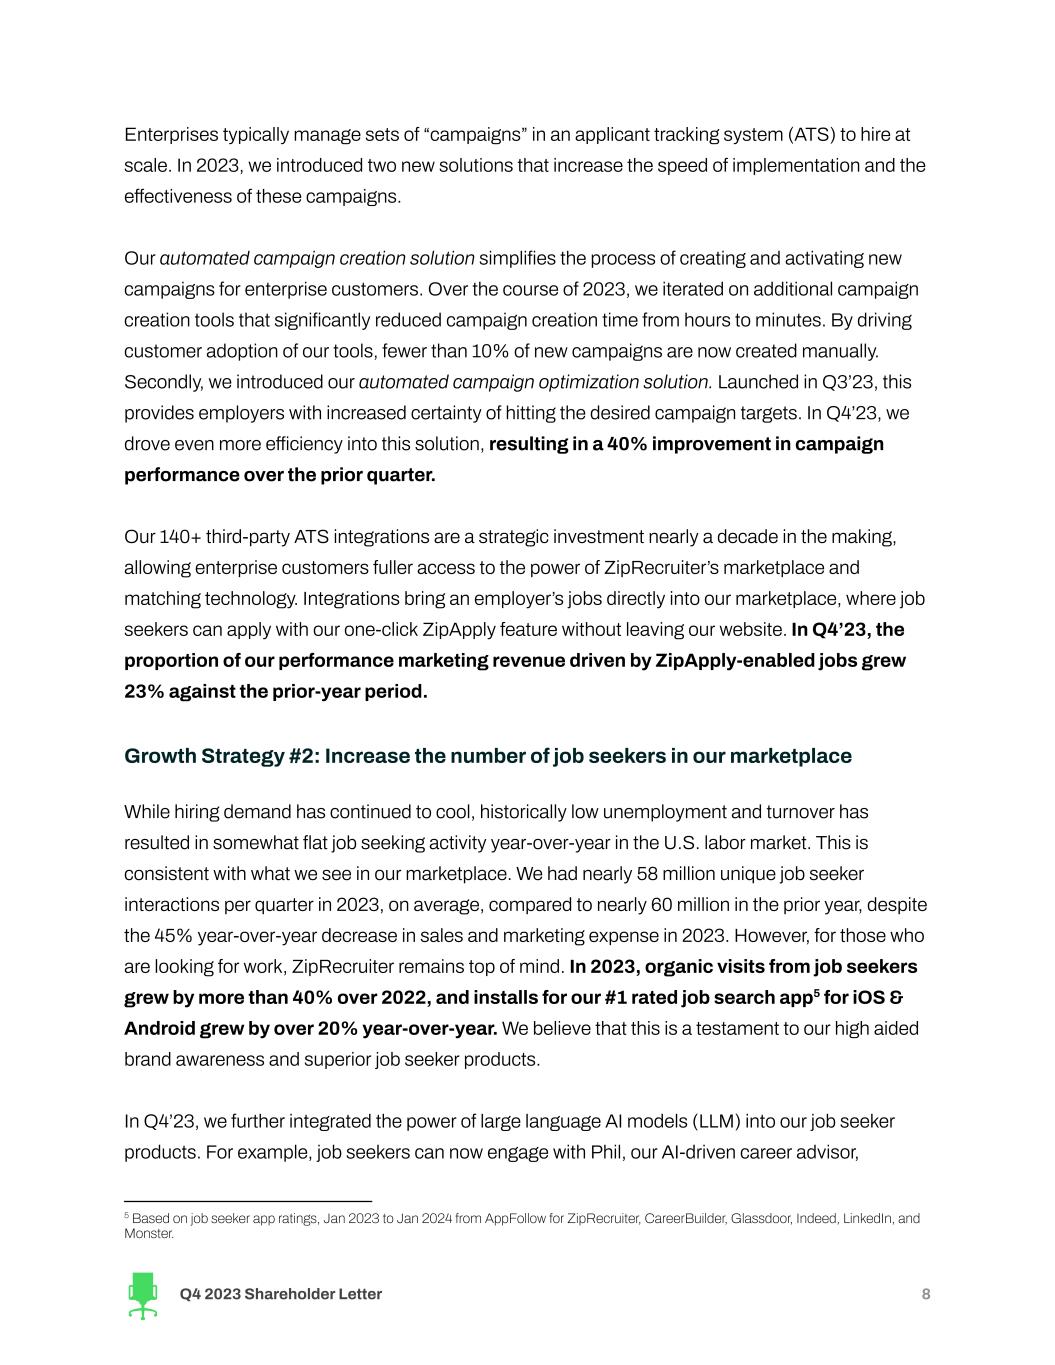
than in a less cyclically-impacted year. As a result, performance-based revenue in 2023 declined by 34% year-over-year, compared to a 27% decrease year-over-year in subscription revenue. Despite the impact on employer hiring demand, our cohort trends remained intact: employers across annual cohorts continue to spend more over time. However, the more di�cult hiring environment in 2023 did slow down the rate of growth in Average Monthly Revenue per Paid Employer among prior cohorts. We see these disruptions to the long term cohort dynamics as temporary, driven by the unique slowdown in hiring particularly among larger enterprises. Over the long-term, we continue to believe that there is meaningful opportunity to grow revenue from these larger customers. Q4 2023 Shareholder Letter 7
Enterprises typically manage sets of “campaigns” in an applicant tracking system (ATS) to hire at scale. In 2023, we introduced two new solutions that increase the speed of implementation and the e�ectiveness of these campaigns. Our automated campaign creation solution simplifies the process of creating and activating new campaigns for enterprise customers. Over the course of 2023, we iterated on additional campaign creation tools that significantly reduced campaign creation time from hours to minutes. By driving customer adoption of our tools, fewer than 10% of new campaigns are now created manually. Secondly, we introduced our automated campaign optimization solution. Launched in Q3’23, this provides employers with increased certainty of hitting the desired campaign targets. In Q4’23, we drove even more e�ciency into this solution, resulting in a 40% improvement in campaign performance over the prior quarter. Our 140+ third-party ATS integrations are a strategic investment nearly a decade in the making, allowing enterprise customers fuller access to the power of ZipRecruiter’s marketplace and matching technology. Integrations bring an employer’s jobs directly into our marketplace, where job seekers can apply with our one-click ZipApply feature without leaving our website. In Q4’23, the proportion of our performancemarketing revenue driven by ZipApply-enabled jobs grew 23%against the prior-year period. Growth Strategy #2: Increase the number of job seekers in ourmarketplace While hiring demand has continued to cool, historically low unemployment and turnover has resulted in somewhat flat job seeking activity year-over-year in the U.S. labor market. This is consistent with what we see in our marketplace. We had nearly 58 million unique job seeker interactions per quarter in 2023, on average, compared to nearly 60 million in the prior year, despite the 45% year-over-year decrease in sales and marketing expense in 2023. However, for those who are looking for work, ZipRecruiter remains top of mind. In 2023, organic visits from job seekers grew bymore than 40%over 2022, and installs for our #1 rated job search app5 for iOS& Android grew by over 20%year-over-year.We believe that this is a testament to our high aided brand awareness and superior job seeker products. In Q4’23, we further integrated the power of large language AI models (LLM) into our job seeker products. For example, job seekers can now engage with Phil, our AI-driven career advisor, 5 Based on job seeker app ratings, Jan 2023 to Jan 2024 from AppFollow for ZipRecruiter, CareerBuilder, Glassdoor, Indeed, LinkedIn, and Monster. Q4 2023 Shareholder Letter 8
conversationally. This provides an even more engaging experience, particularly when new job seekers proceed through Phil’s onboarding flow. Phil interacts with job seekers more fluently, learning about their experiences and suggesting job titles seekers may be interested in. Job seekers love our LLM-fueled Phil: users are 23%more likely to select one of the job titles suggested compared to the jobs shown in the prior onboarding experience. We also leveraged LLMs to introduce a new feature that assists job seekers with resume creation, long seen as a cumbersome task that involves the meticulous crafting of detailed job experience descriptions. Job seekers can utilize ZipRecruiter’s new AI-enabled tools to create job experience descriptions by selecting key tasks and responsibilities, eliminating a major pain point in the job search and further di�erentiating our job seeker experience. Growth Strategy #3:Make ourmatching technology smarter over time We bring employers and job seekers together using machine learning and AI. Our specialized AI-powered matching algorithms learn from observed behavior across billions of interactions between job seekers and employers in our marketplace. This means that our marketplace gets smarter over time. In 2023, we delivered nearly 40million GreatMatches, an increase of 24%over the prior year. Further, job seeker engagement has grown, with the average job seeker generating 10%more applications in Q4’23 than in Q4’22. This means that, while overall employer demand has been directly impacted by macroeconomic pressures and uncertainty, our Paid Employers are getting incredible results.Wedelivered over 60%more applications per Paid Employer in Q4'23 than inQ4'22. In the second half of 2023, we introduced new capabilities that led to better accuracy in extracting information from resumes and job postings. As previously announced in Q3’23, we leveraged cutting-edge AI and machine learning techniques to improve our resume parsing capabilities. Just one quarter later, we released an update to our resume parser that improved precision by an additional 9%. Separately, we introduced new parsing capabilities for job postings to support increased precision of our matchmaking models, taking a comprehensive look at certain job description details related to qualifications, responsibilities, compensation, and company details. With improved parsing capabilities for both resumes and job postings, our algorithms will be able to better match job seekers and employers. Q4 2023 Shareholder Letter 9
Investing in our people Our mission is to actively connect people to their next great opportunity. We have always prided ourselves on creating and maintaining an environment for ZipRecruiter employees that is welcoming, engaging, and innovative. Over the past year, several organizations have recognized ZipRecruiter as a place where employees love to work, including being named by Newsweek as a “Most LovedWorkplace” and beingCertified™ by Great Place ToWork®. Additionally, our teams were recognized numerous times by Comparably for awards such as “Best Engineering Teams” and “Best Sales Teams”. In Israel, Dun’s recognized ZipRecruiter as one of the best high-tech companies to work for. In Q4, we completed an employee engagement survey. Almost 80% of our employees participated and we are pleased to report that our eNPS (employee net promoter score) for employee engagement was nearly 10 points higher than the tech company benchmark6. Notably, we are proud that some of our highest scores on the survey came from questions regarding employees’ sense of belonging and ability to freely share their opinions at work. We regularly survey our employees to learn more about their experience working at ZipRecruiter, and are committed to high standards of satisfaction. 6 Source: CultureAmp New Tech United States Insights; https://www.cultureamp.com/science/insights/new-tech-united-states Q4 2023 Shareholder Letter 10
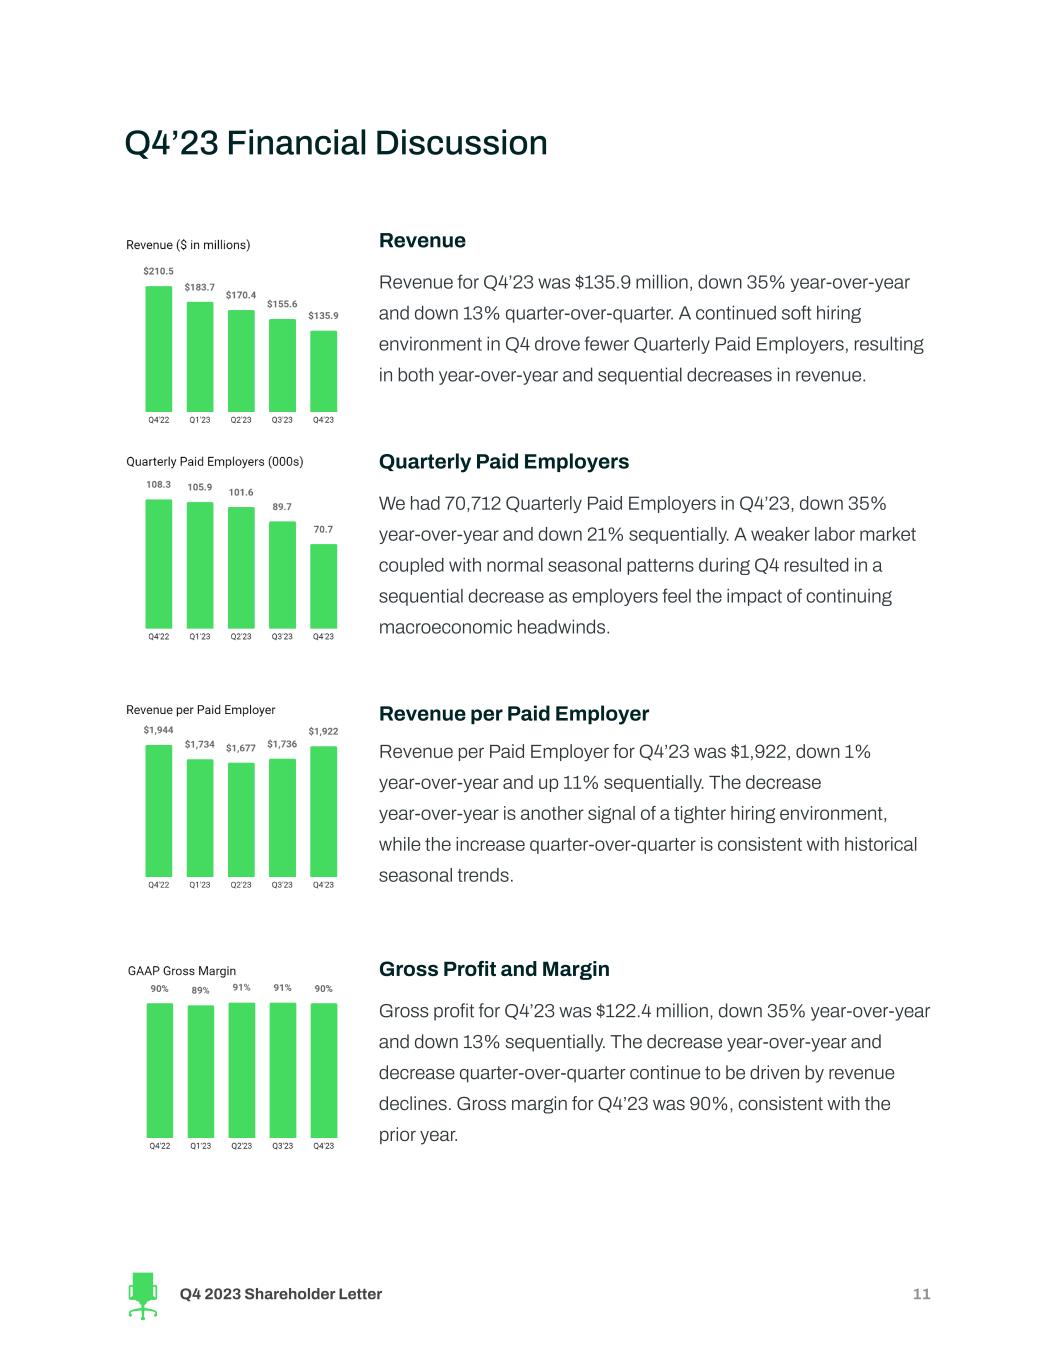
Q4’23 Financial Discussion Revenue Revenue for Q4’23 was $135.9 million, down 35% year-over-year and down 13% quarter-over-quarter. A continued soft hiring environment in Q4 drove fewer Quarterly Paid Employers, resulting in both year-over-year and sequential decreases in revenue. Quarterly Paid Employers We had 70,712 Quarterly Paid Employers in Q4’23, down 35% year-over-year and down 21% sequentially. A weaker labor market coupled with normal seasonal patterns during Q4 resulted in a sequential decrease as employers feel the impact of continuing macroeconomic headwinds. Revenue per Paid Employer Revenue per Paid Employer for Q4’23 was $1,922, down 1% year-over-year and up 11% sequentially. The decrease year-over-year is another signal of a tighter hiring environment, while the increase quarter-over-quarter is consistent with historical seasonal trends. Gross Profit andMargin Gross profit for Q4’23 was $122.4 million, down 35% year-over-year and down 13% sequentially. The decrease year-over-year and decrease quarter-over-quarter continue to be driven by revenue declines. Gross margin for Q4’23 was 90%, consistent with the prior year. Q4 2023 Shareholder Letter 11
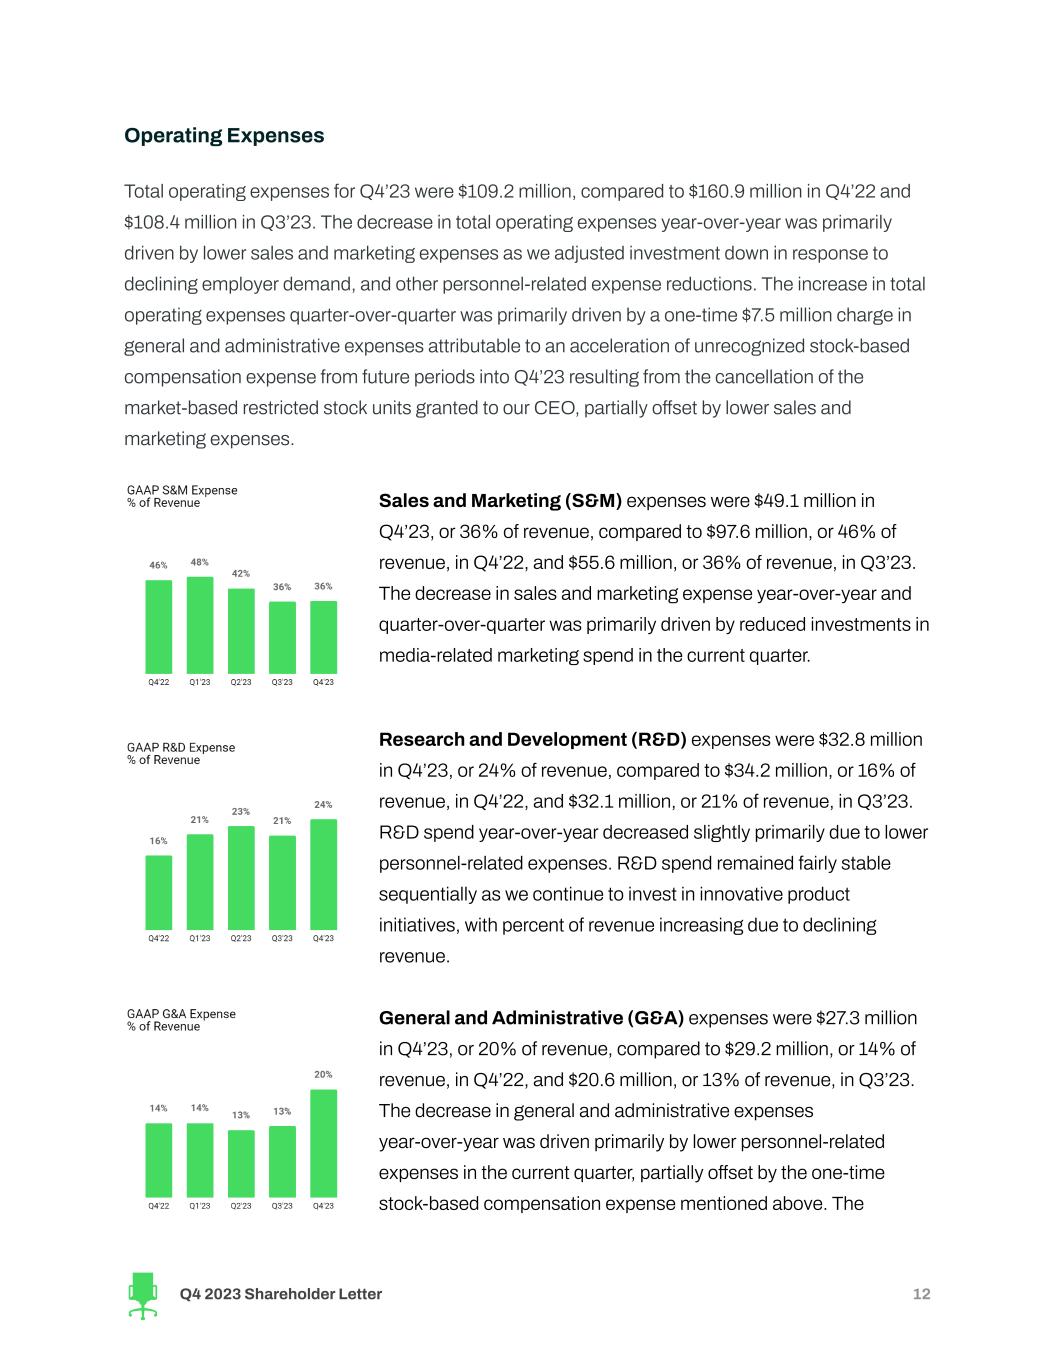
Operating Expenses Total operating expenses for Q4’23 were $109.2 million, compared to $160.9 million in Q4’22 and $108.4 million in Q3’23. The decrease in total operating expenses year-over-year was primarily driven by lower sales and marketing expenses as we adjusted investment down in response to declining employer demand, and other personnel-related expense reductions. The increase in total operating expenses quarter-over-quarter was primarily driven by a one-time $7.5 million charge in general and administrative expenses attributable to an acceleration of unrecognized stock-based compensation expense from future periods into Q4’23 resulting from the cancellation of the market-based restricted stock units granted to our CEO, partially o�set by lower sales and marketing expenses. Sales andMarketing (S&M) expenses were $49.1 million in Q4’23, or 36% of revenue, compared to $97.6 million, or 46% of revenue, in Q4’22, and $55.6 million, or 36% of revenue, in Q3’23. The decrease in sales and marketing expense year-over-year and quarter-over-quarter was primarily driven by reduced investments in media-related marketing spend in the current quarter. Research andDevelopment (R&D) expenses were $32.8 million in Q4’23, or 24% of revenue, compared to $34.2 million, or 16% of revenue, in Q4’22, and $32.1 million, or 21% of revenue, in Q3’23. R&D spend year-over-year decreased slightly primarily due to lower personnel-related expenses. R&D spend remained fairly stable sequentially as we continue to invest in innovative product initiatives, with percent of revenue increasing due to declining revenue. General and Administrative (G&A) expenses were $27.3 million in Q4’23, or 20% of revenue, compared to $29.2 million, or 14% of revenue, in Q4’22, and $20.6 million, or 13% of revenue, in Q3’23. The decrease in general and administrative expenses year-over-year was driven primarily by lower personnel-related expenses in the current quarter, partially o�set by the one-time stock-based compensation expense mentioned above. The Q4 2023 Shareholder Letter 12
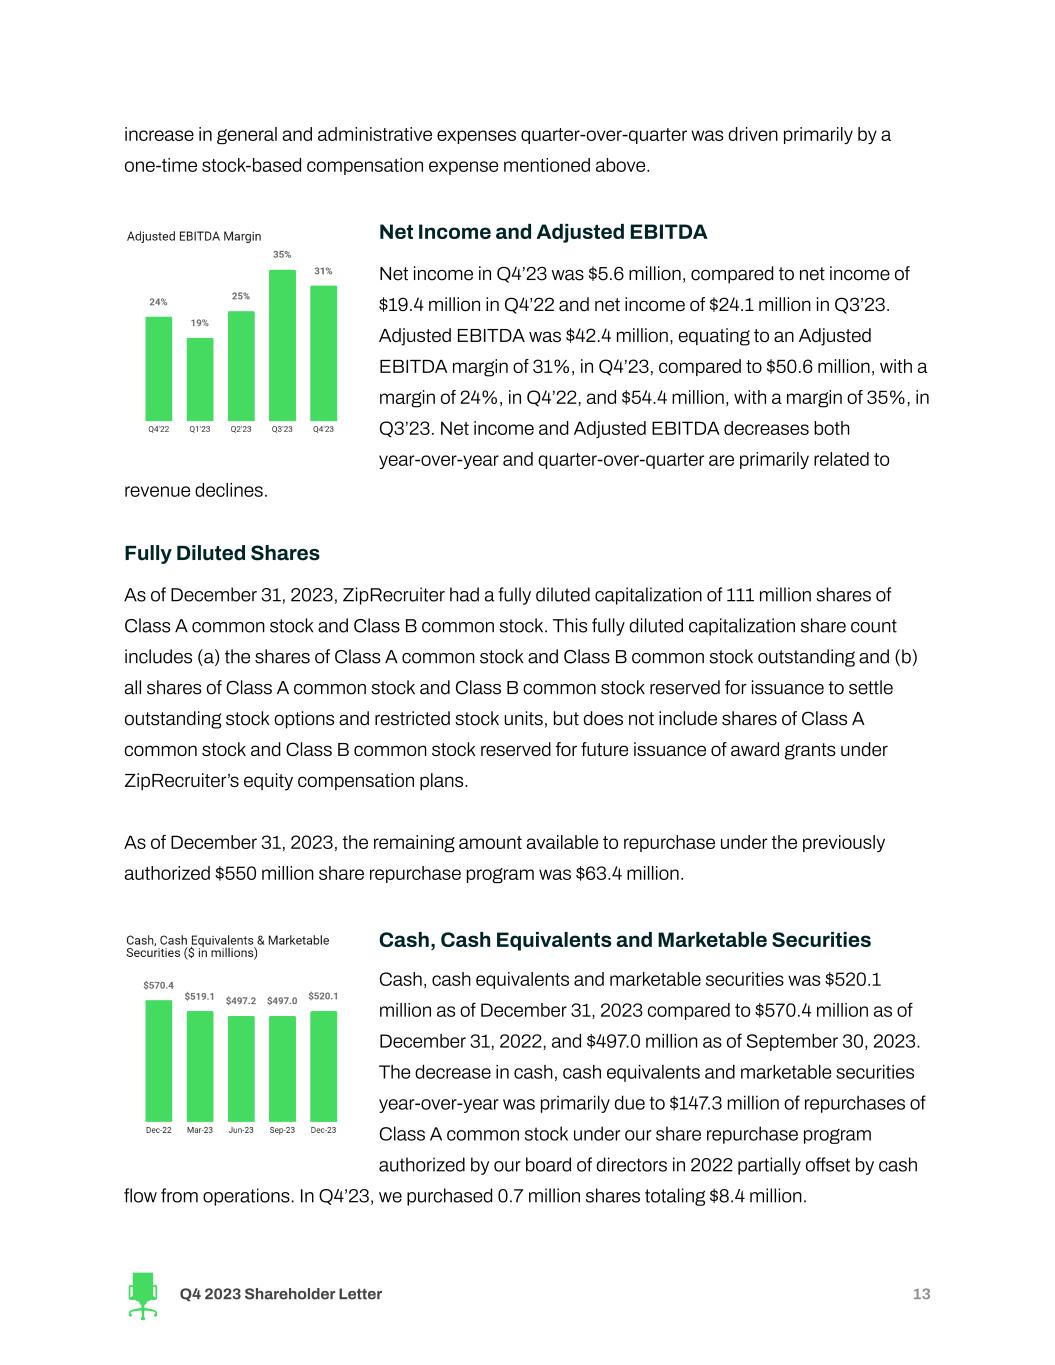
increase in general and administrative expenses quarter-over-quarter was driven primarily by a one-time stock-based compensation expense mentioned above. Net Income andAdjusted EBITDA Net income in Q4’23 was $5.6 million, compared to net income of $19.4 million in Q4’22 and net income of $24.1 million in Q3’23. Adjusted EBITDA was $42.4 million, equating to an Adjusted EBITDAmargin of 31%, in Q4’23, compared to $50.6 million, with a margin of 24%, in Q4’22, and $54.4 million, with a margin of 35%, in Q3’23. Net income and Adjusted EBITDA decreases both year-over-year and quarter-over-quarter are primarily related to revenue declines. Fully Diluted Shares As of December 31, 2023, ZipRecruiter had a fully diluted capitalization of 111 million shares of Class A common stock and Class B common stock. This fully diluted capitalization share count includes (a) the shares of Class A common stock and Class B common stock outstanding and (b) all shares of Class A common stock and Class B common stock reserved for issuance to settle outstanding stock options and restricted stock units, but does not include shares of Class A common stock and Class B common stock reserved for future issuance of award grants under ZipRecruiter’s equity compensation plans. As of December 31, 2023, the remaining amount available to repurchase under the previously authorized $550 million share repurchase program was $63.4 million. Cash, Cash Equivalents andMarketable Securities Cash, cash equivalents and marketable securities was $520.1 million as of December 31, 2023 compared to $570.4 million as of December 31, 2022, and $497.0 million as of September 30, 2023. The decrease in cash, cash equivalents and marketable securities year-over-year was primarily due to $147.3 million of repurchases of Class A common stock under our share repurchase program authorized by our board of directors in 2022 partially o�set by cash flow from operations. In Q4’23, we purchased 0.7 million shares totaling $8.4 million. Q4 2023 Shareholder Letter 13
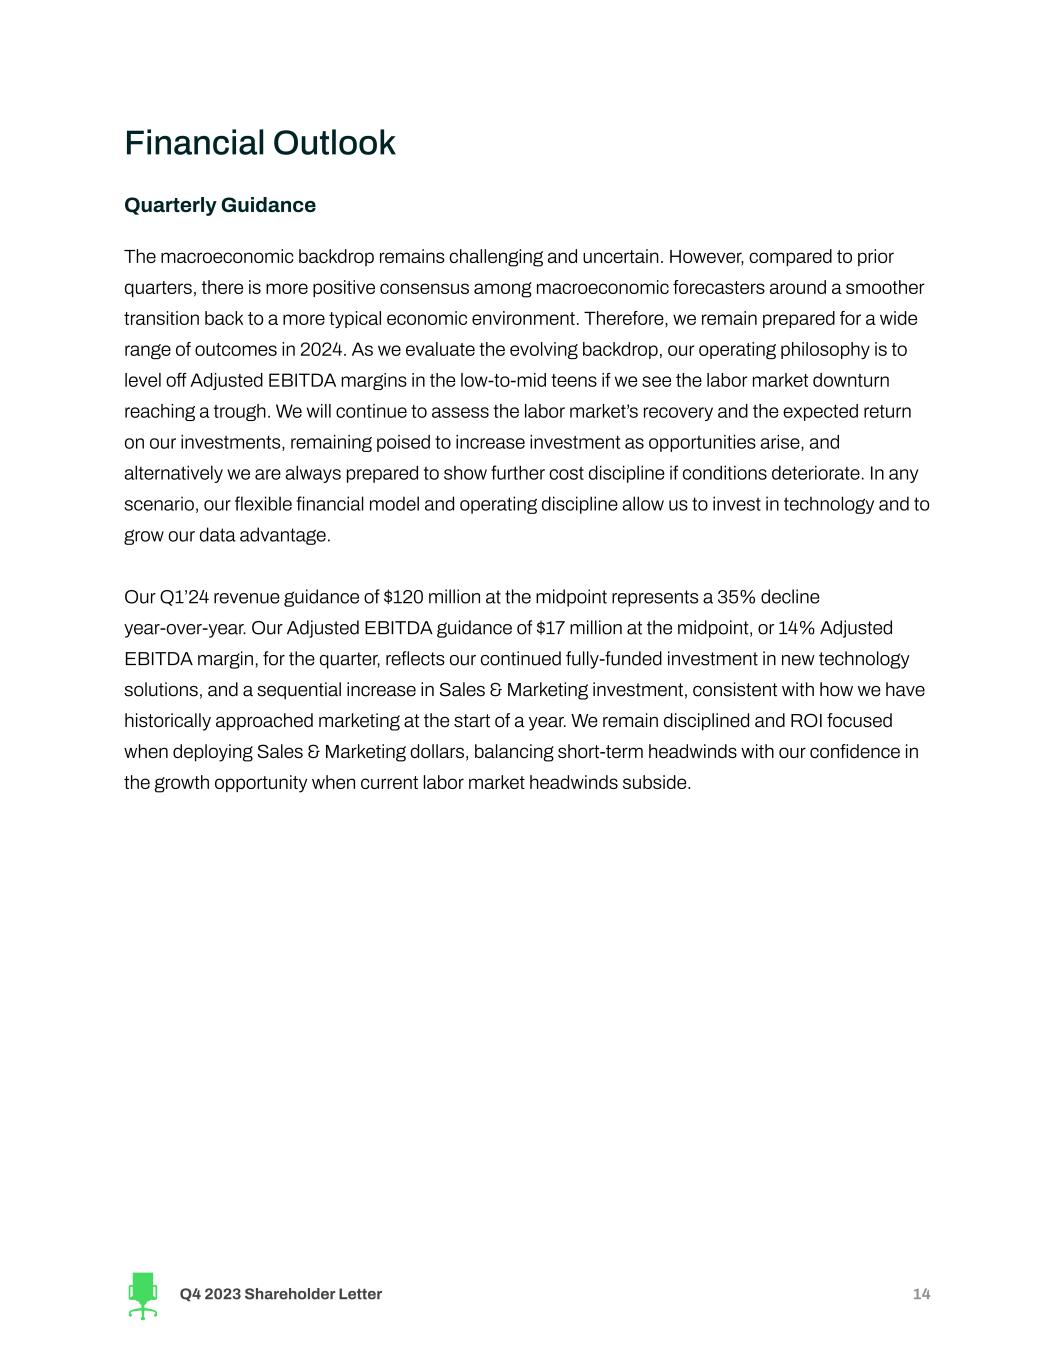
Financial Outlook Quarterly Guidance The macroeconomic backdrop remains challenging and uncertain. However, compared to prior quarters, there is more positive consensus amongmacroeconomic forecasters around a smoother transition back to a more typical economic environment. Therefore, we remain prepared for a wide range of outcomes in 2024. As we evaluate the evolving backdrop, our operating philosophy is to level o� Adjusted EBITDAmargins in the low-to-mid teens if we see the labor market downturn reaching a trough. We will continue to assess the labor market’s recovery and the expected return on our investments, remaining poised to increase investment as opportunities arise, and alternatively we are always prepared to show further cost discipline if conditions deteriorate. In any scenario, our flexible financial model and operating discipline allow us to invest in technology and to grow our data advantage. Our Q1’24 revenue guidance of $120 million at the midpoint represents a 35% decline year-over-year. Our Adjusted EBITDA guidance of $17 million at the midpoint, or 14% Adjusted EBITDAmargin, for the quarter, reflects our continued fully-funded investment in new technology solutions, and a sequential increase in Sales &Marketing investment, consistent with how we have historically approached marketing at the start of a year. We remain disciplined and ROI focused when deploying Sales &Marketing dollars, balancing short-term headwinds with our confidence in the growth opportunity when current labor market headwinds subside. Q4 2023 Shareholder Letter 14
Forward-Looking Statements This shareholder letter contains forward-looking statements within the meaning of the Private Securities Litigation Reform Act of 1995. All statements contained in this shareholder letter that do not relate to matters of historical fact should be considered forward-looking statements, including, without limitation, statements regarding our market opportunity and expected hiring activity; statements under the section titled "Financial Outlook"; statements regarding our expected financial performance and operational performance for the first quarter of 2024; statements regarding our expected future revenue growth, Adjusted EBITDA profitability, and capital allocation strategy; statements regarding our beliefs regarding the early stages of transforming how employers and job seekers come together; statements regarding increased employer and job seeker engagement, as well as statements that include the words “expect,” “intend,” “plan,” “believe,” “project,” “forecast,” “estimate,” “may,” “should,” “anticipate” and similar statements of a future or forward-looking nature. These forward-looking statements are based on management's current expectations. These statements are neither promises nor guarantees, but involve known and unknown risks, uncertainties and other important factors that may cause actual results, performance or achievements to be materially di�erent from any future results, performance or achievements expressed or implied by the forward-looking statements, including, but not limited to: our ability to attract and retain employers and job seekers; our ability to compete with well-established competitors and new entrants; our ability to achieve and/or maintain profitability; our ability to maintain, protect and enhance our brand and intellectual property; our dependence on macroeconomic factors; our ability to maintain and improve the quality of our platform; our dependence on the interoperability of our platform with mobile operating systems that we do not control; our ability to successfully implement our business plan during a global economic downturn that may impact the demand for our services or have a material adverse impact on our and our business partners’ financial condition and results of operations; our ability and the ability of third parties to protect our users’ personal or other data from a security breach and to comply with laws and regulations relating to consumer data privacy and data protection; our ability to detect errors, defects or disruptions in our platform; our ability to comply with the terms of underlying licenses of open source software components on our platform; our ability to expand into markets outside the United States; our ability to achieve desired operating margins; our compliance with a wide variety of U.S. and international laws and regulations; our reliance on AmazonWeb Services; our ability to mitigate payment and fraud risks; our dependence on our senior management and our ability to attract and retain new talent; and the other important risk factors more fully discussed and described in documents we have filed with the Securities and Exchange Commission (“SEC”), including our Quarterly Report on Form 10-Q for the three months ended September 30, 2023 that we filed with the SEC and our Annual Report on Form 10-K for the twelve months ended December 31, 2023 that we will file with the SEC. In addition, we operate in a very competitive and rapidly changing environment. New risks emerge from time to time. It is not possible for our management to predict all risks, nor can we assess the impact of all factors on our business or the extent to which any factor, or combination of factors, may cause actual results to di�er materially from those contained in any forward-looking statements that we may make. In light of these risks, uncertainties and assumptions, the forward-looking events and circumstances discussed in this release are inherently uncertain and may not occur, and actual results could di�er materially and adversely from those anticipated or implied in the forward-looking statements. Accordingly, you should not rely upon forward-looking statements as predictions of future events. In addition, the forward-looking statements made in this shareholder letter relate only to events or information as of the date on which the statements are made in this letter. Except as required by law, we undertake no obligation to update or revise publicly any forward-looking statements, whether as a result of new information, future events or otherwise, after the date on which the statements are made or to reflect the occurrence of unanticipated events. Q4 2023 Shareholder Letter 15

Conference Call Details Wewill host a conference call to discuss our financial results on Thursday, February 22, 2024, at 2:00 p.m. Pacific Time. A live webcast of the call can be accessed from ZipRecruiter’s Investor Relations website. An archived version will be available on the website two hours after the call. Investors and analysts can participate in the conference call by dialing +1 (888) 440-4199, or +1 (646) 960-0818 for callers outside the United States, and using the conference ID 9351892. A telephonic replay of the conference call will be available until Thursday, February 29, 2024. To listen to the replay please dial +1 (800) 770-2030 or +1 (647) 362-9199 for callers outside the United States and use the Conference ID 9351892. Q4 2023 Shareholder Letter 16
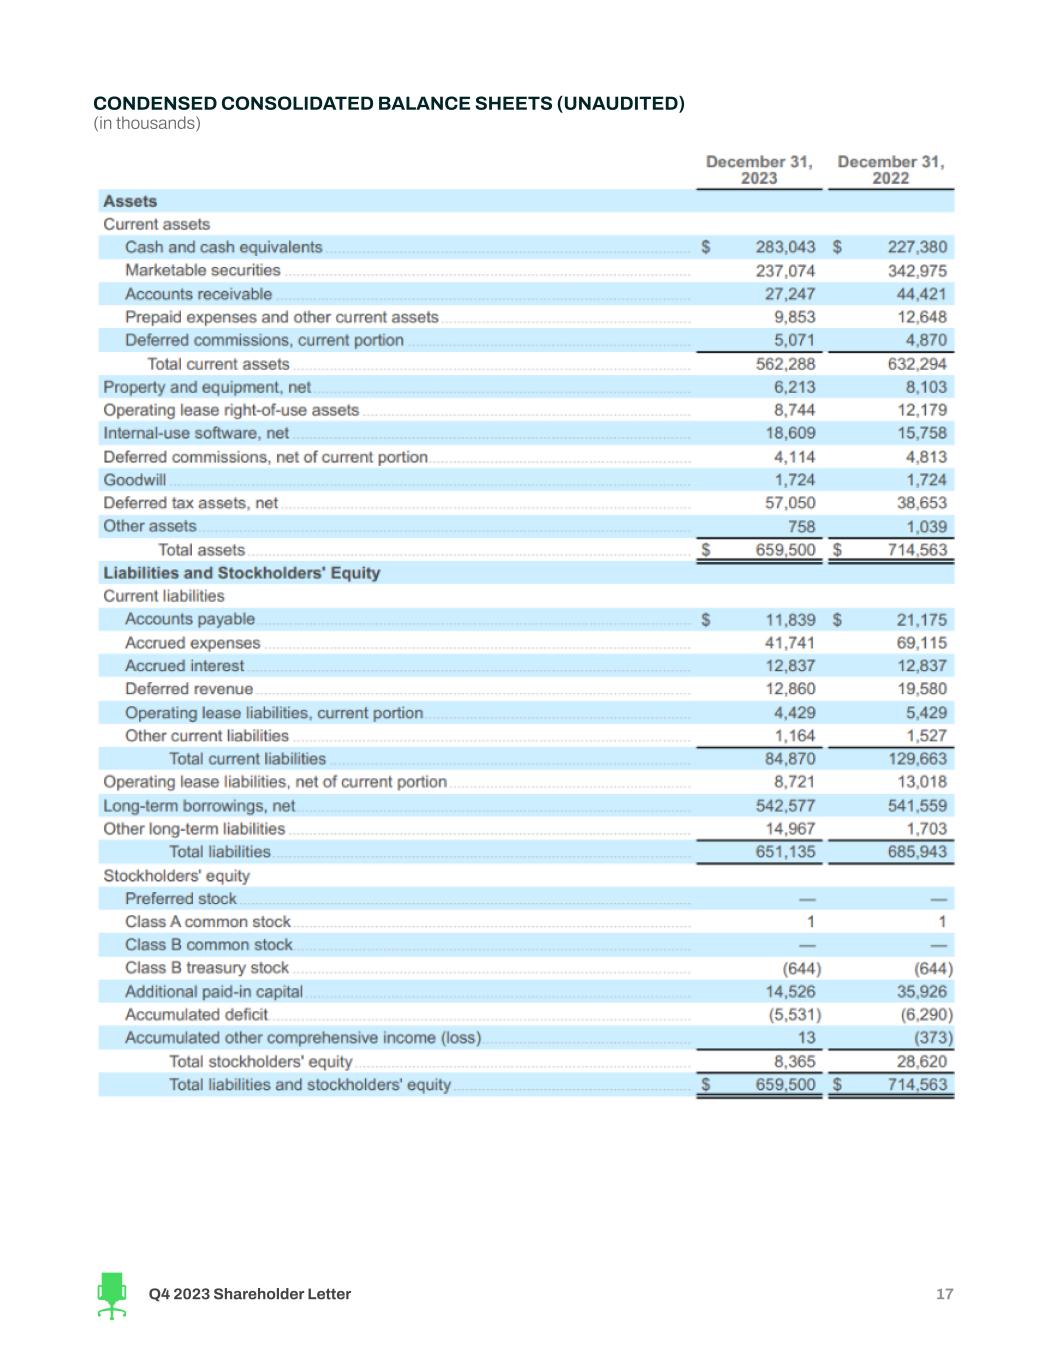
CONDENSEDCONSOLIDATEDBALANCESHEETS (UNAUDITED) (in thousands) Q4 2023 Shareholder Letter 17
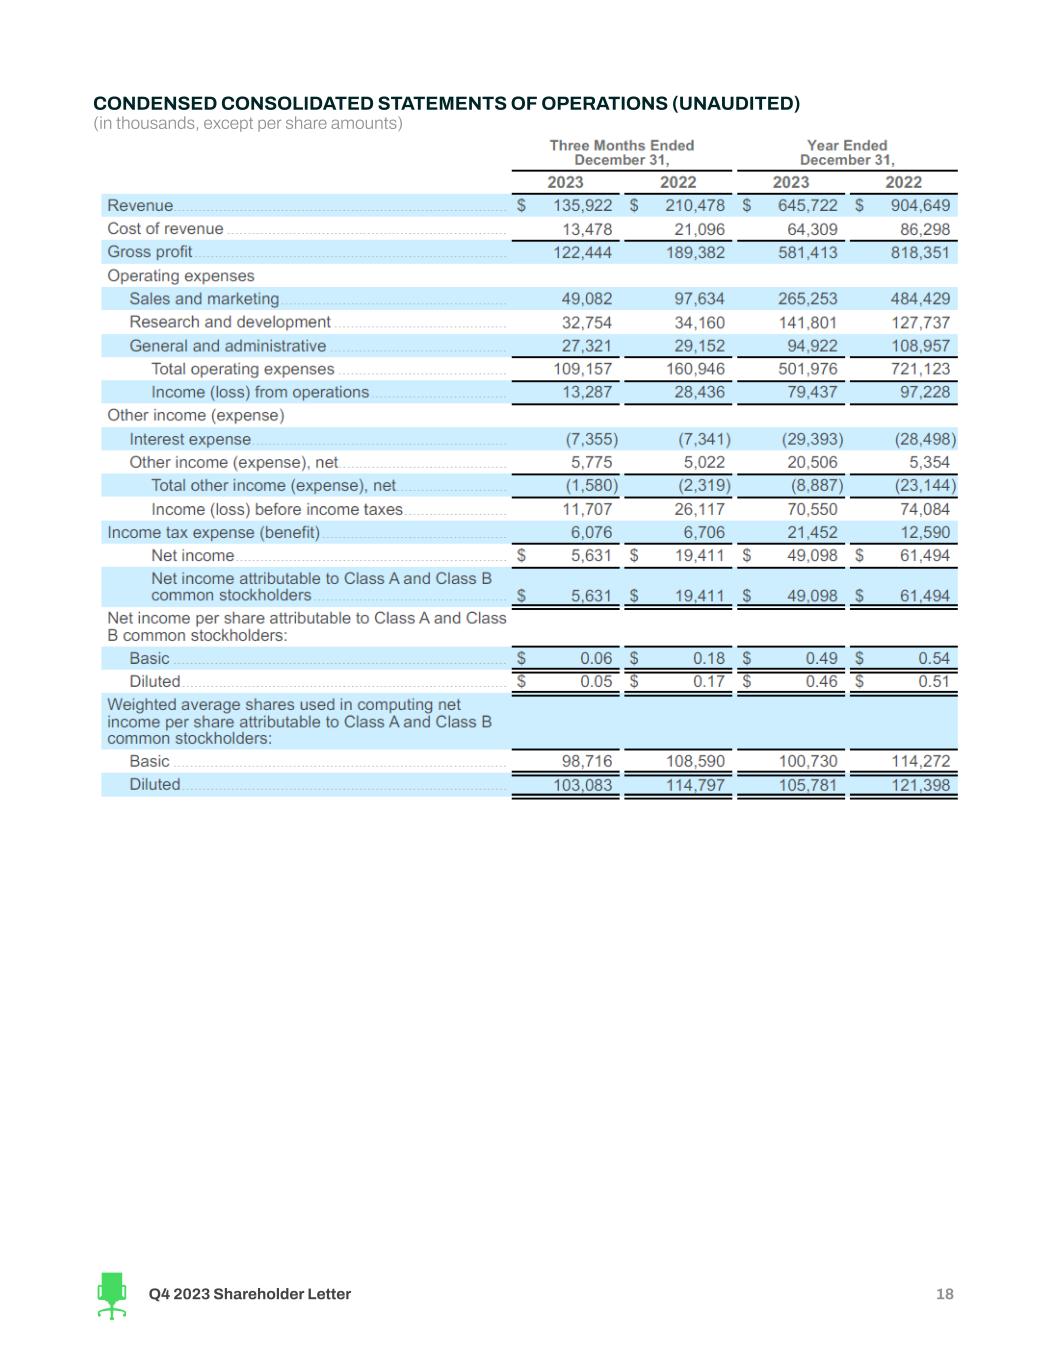
CONDENSEDCONSOLIDATEDSTATEMENTSOFOPERATIONS (UNAUDITED) (in thousands, except per share amounts) Q4 2023 Shareholder Letter 18
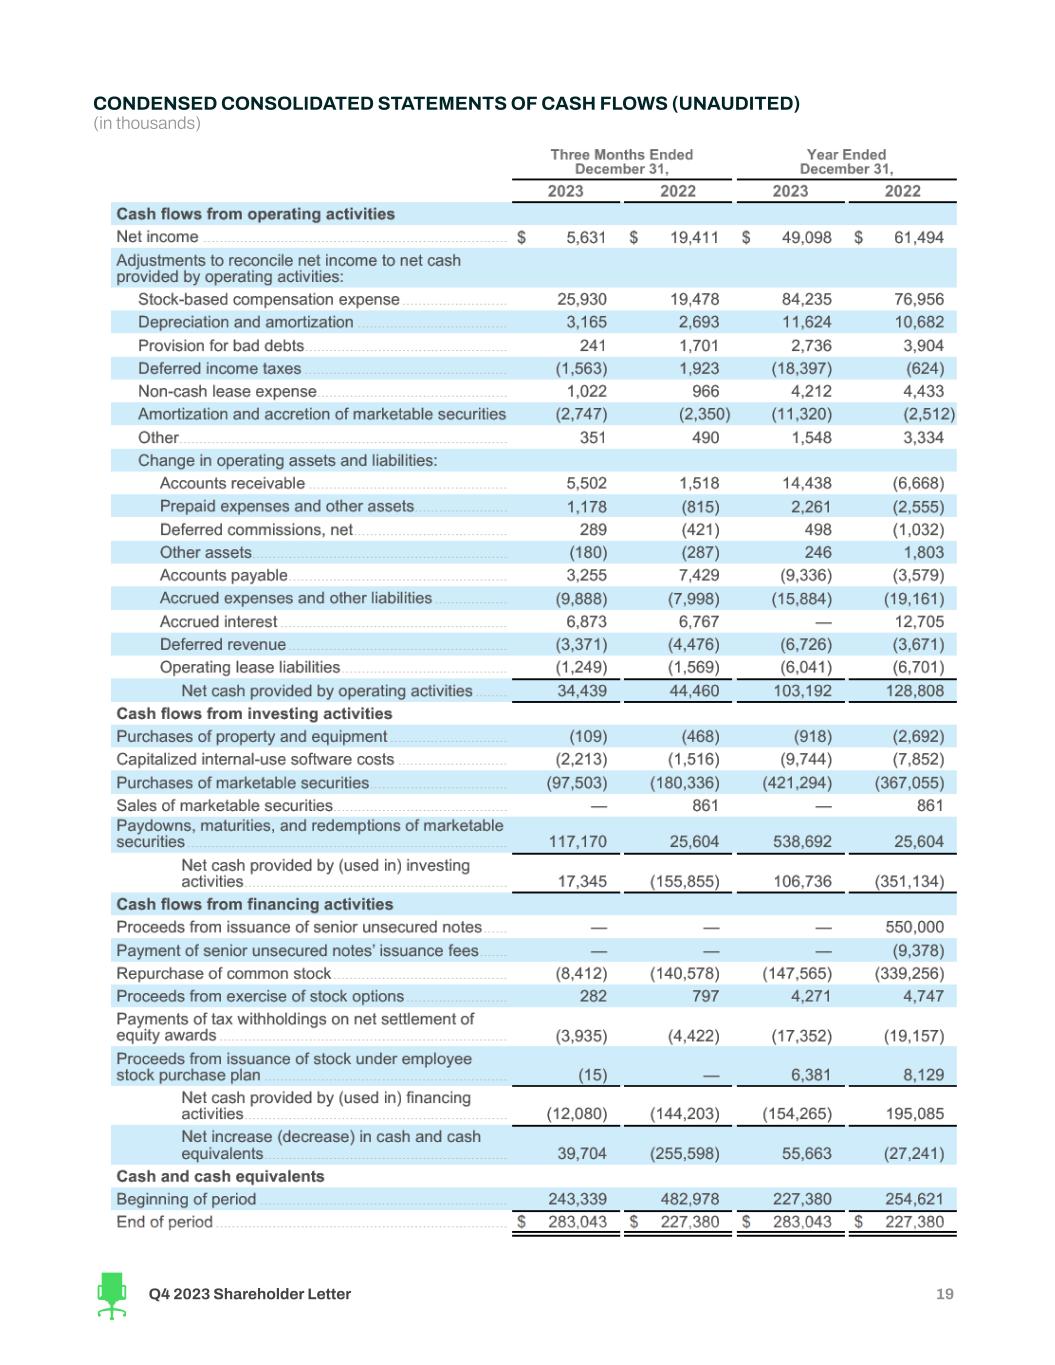
CONDENSEDCONSOLIDATEDSTATEMENTSOFCASHFLOWS (UNAUDITED) (in thousands) Q4 2023 Shareholder Letter 19
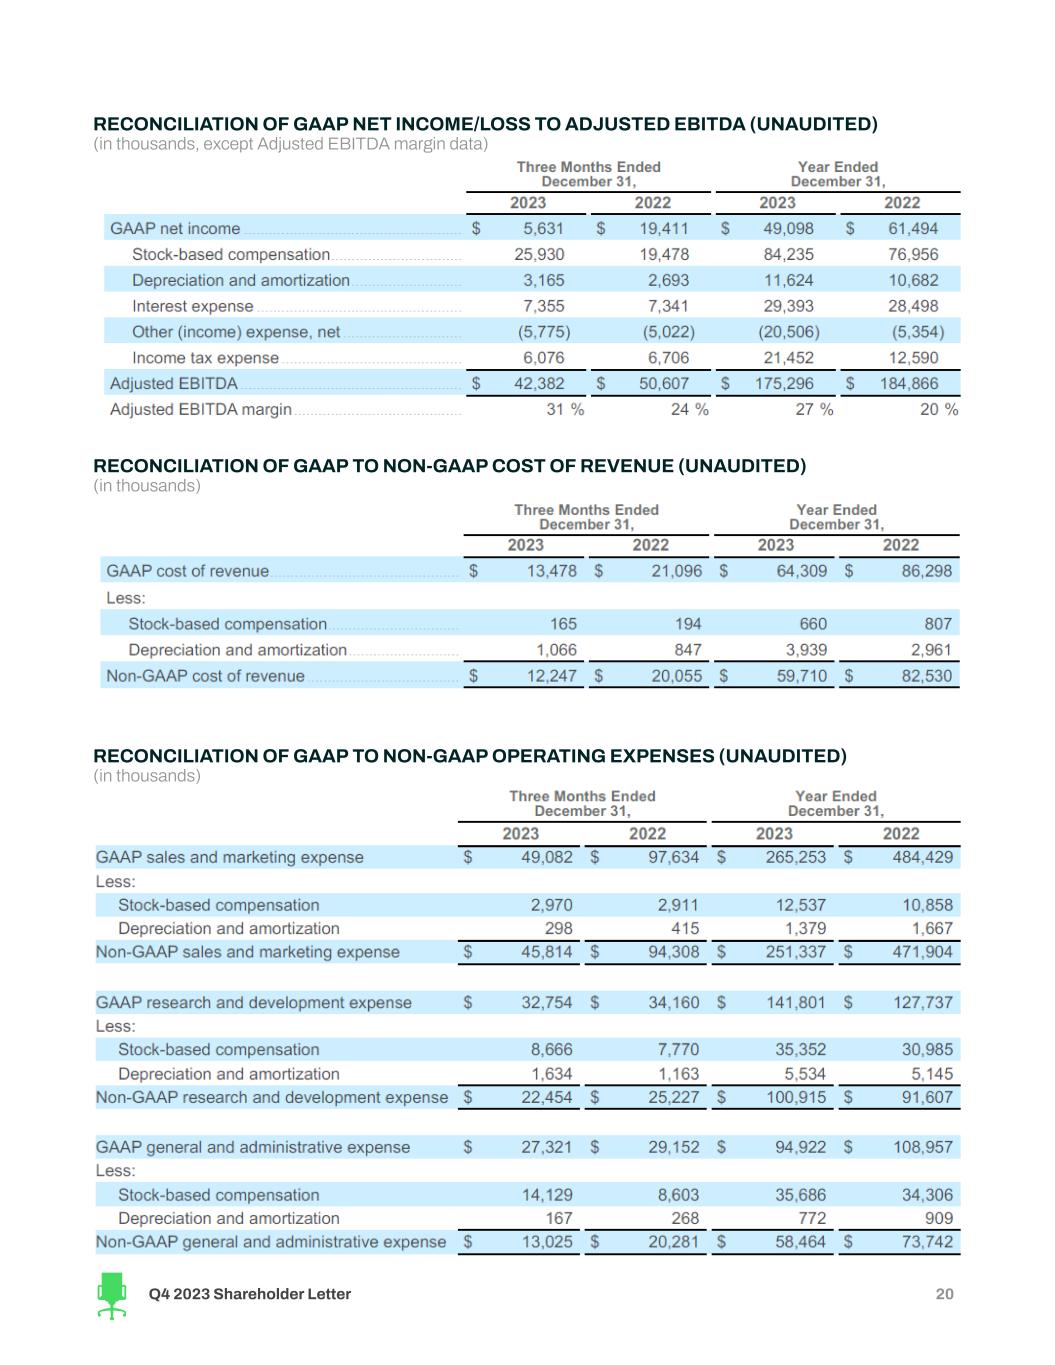
RECONCILIATIONOFGAAPNET INCOME/LOSSTOADJUSTEDEBITDA (UNAUDITED) (in thousands, except Adjusted EBITDAmargin data) RECONCILIATIONOFGAAPTONON-GAAPCOSTOFREVENUE (UNAUDITED) (in thousands) RECONCILIATIONOFGAAPTONON-GAAPOPERATINGEXPENSES (UNAUDITED) (in thousands) Q4 2023 Shareholder Letter 20
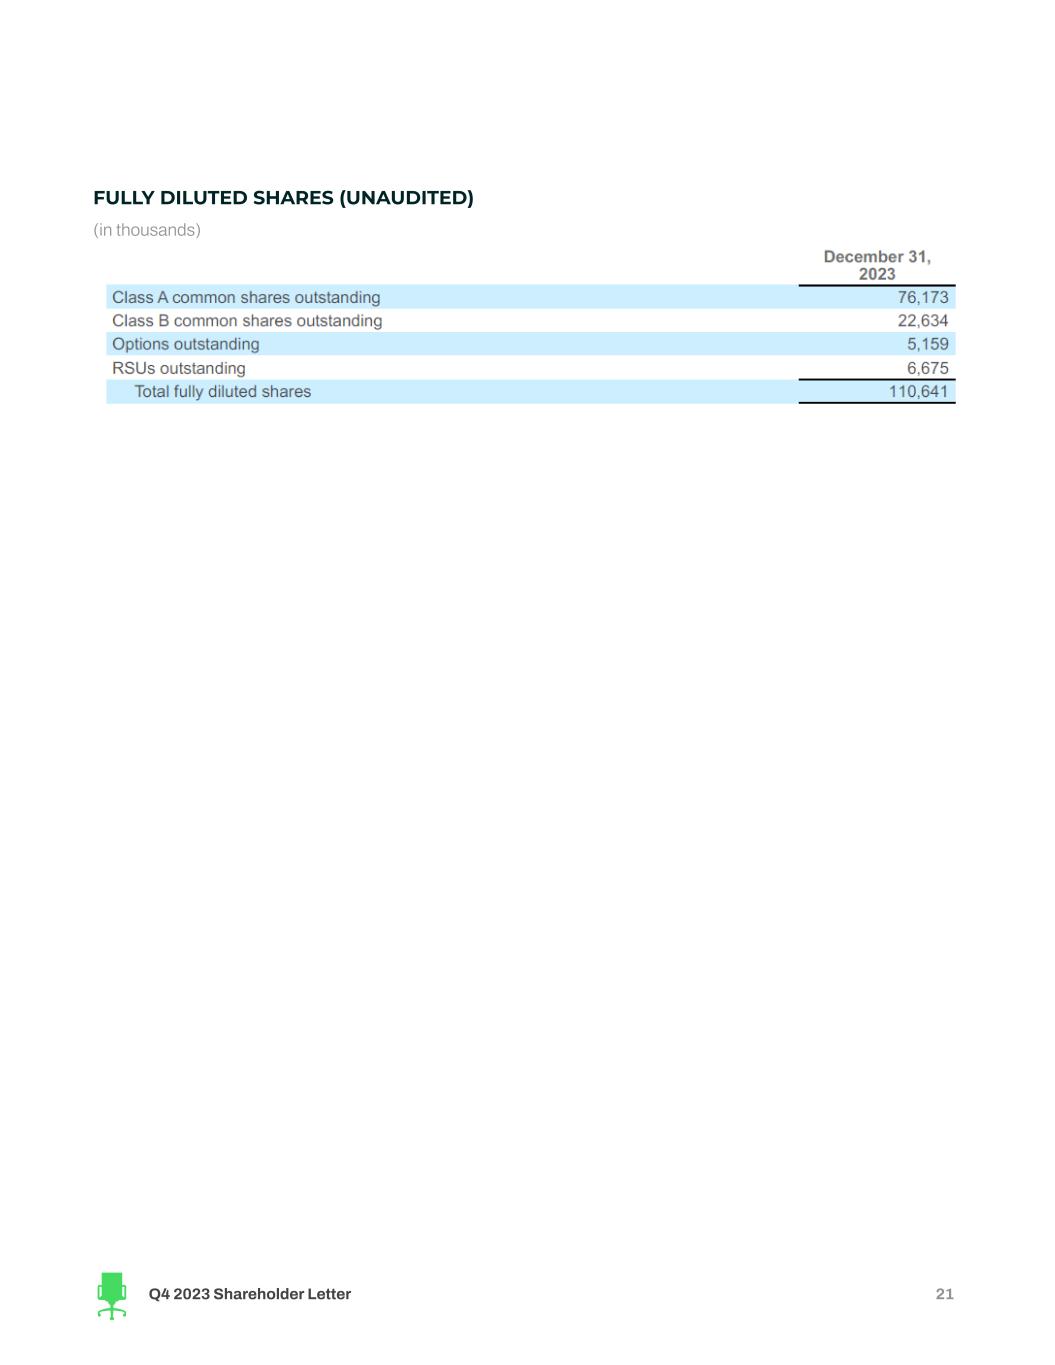
FULLY DILUTED SHARES (UNAUDITED) (in thousands) Q4 2023 Shareholder Letter 21
Key Operating Metrics and Non-GAAP Financial Measures This shareholder letter includes certain key operating metrics, including Quarterly Paid Employers and Revenue per Paid Employer, and non-GAAP financial measures, including Non-GAAP cost of revenue, Non-GAAP operating expenses, Adjusted EBITDA and Adjusted EBITDAmargin. We define Paid Employers as any employer(s) (or entities acting on behalf of an employer) on a paying subscription plan or performance marketing campaign for at least one day. Paid Employer(s) excludes employers from our Job Distribution Partners or other indirect channels, employers who are not actively searching for candidates, but otherwise have access to previously posted jobs, and employers on free trial. Job Distribution Partners are defined as third-party sites who have a relationship with us and advertise jobs from our marketplace. Quarterly Paid Employers means, with respect to any fiscal quarter, the count of Paid Employers during such fiscal quarter. Revenue per Paid Employer is the total company revenue in a particular period divided by the count of Quarterly Paid Employers in the same period. We define Non-GAAP cost of revenue as our cost of revenue before stock-based compensation expense, and depreciation and amortization. We define Non-GAAP operating expenses as our operating expenses before stock-based compensation expense, and depreciation and amortization. We define Adjusted EBITDA as our net income (loss) before interest expense, other (income) expense, net, income tax expense (benefit) and depreciation and amortization, adjusted to eliminate stock-based compensation expense. Adjusted EBITDAmargin represents Adjusted EBITDA as a percentage of revenue for the same period. Management and our board of directors use these key operating metrics and non-GAAP financial measures as supplemental measures of our performance because they assist us in comparing our operating performance on a consistent basis, as they remove the impact of some items not directly resulting from our core operations. We also use these key operating metrics and non-GAAP financial measures for planning purposes, including the preparation of our internal annual operating budget and financial projections, to evaluate the performance and e�ectiveness of our strategic initiatives and to evaluate our capacity for capital expenditures to expand our business. Non-GAAP cost of revenue, Non-GAAP operating expenses, Adjusted EBITDA and Adjusted EBITDAmargin should not be considered in isolation, as an alternative to, or superior to net income (loss), revenue, cash flows or other measures derived in accordance with GAAP. These non-GAAPmeasures are frequently used by analysts, investors and other interested parties to evaluate companies in our industry. Management believes that the presentation of non-GAAP financial measures is an appropriate measure of operating performance because they eliminate the impact of some expenses that do not relate directly to the performance of our underlying business. These non-GAAP financial measures should not be construed as an inference that our future results will be una�ected by unusual or other items. Additionally, Adjusted EBITDA and Adjusted EBITDAmargin are not intended to be a measure of free cash flow for management’s discretionary use, as they do not reflect our tax payments and certain other cash costs that may recur in the future, including, among other things, cash requirements for costs to replace assets being depreciated and amortized including our capitalized internal use software. Management compensates for these limitations by relying on our GAAP results in addition to using Adjusted EBITDA and Adjusted EBITDAmargin as supplemental measures of our performance. Our measures of Adjusted EBITDA and Adjusted EBITDAmargin used herein are not necessarily comparable to similarly titled captions of other companies due to di�erent methods of calculation. We are not able to provide a reconciliation of Adjusted EBITDA and Adjusted EBITDAmargin for Q1’24 to net income and net incomemargin, the comparable GAAPmeasures, respectively, because certain items that are excluded from non-GAAP financial measures cannot be reasonably predicted or are not in our control. In particular, we are unable to forecast the timing or magnitude of stock-based compensation or amortization of internal-use software, as applicable, without unreasonable e�orts, and these items could significantly impact, either individually or in the aggregate, GAAPmeasures in the future. See the tables above regarding reconciliations of these non-GAAP financial measures to the most directly comparable GAAPmeasures. Q4 2023 Shareholder Letter 22


