
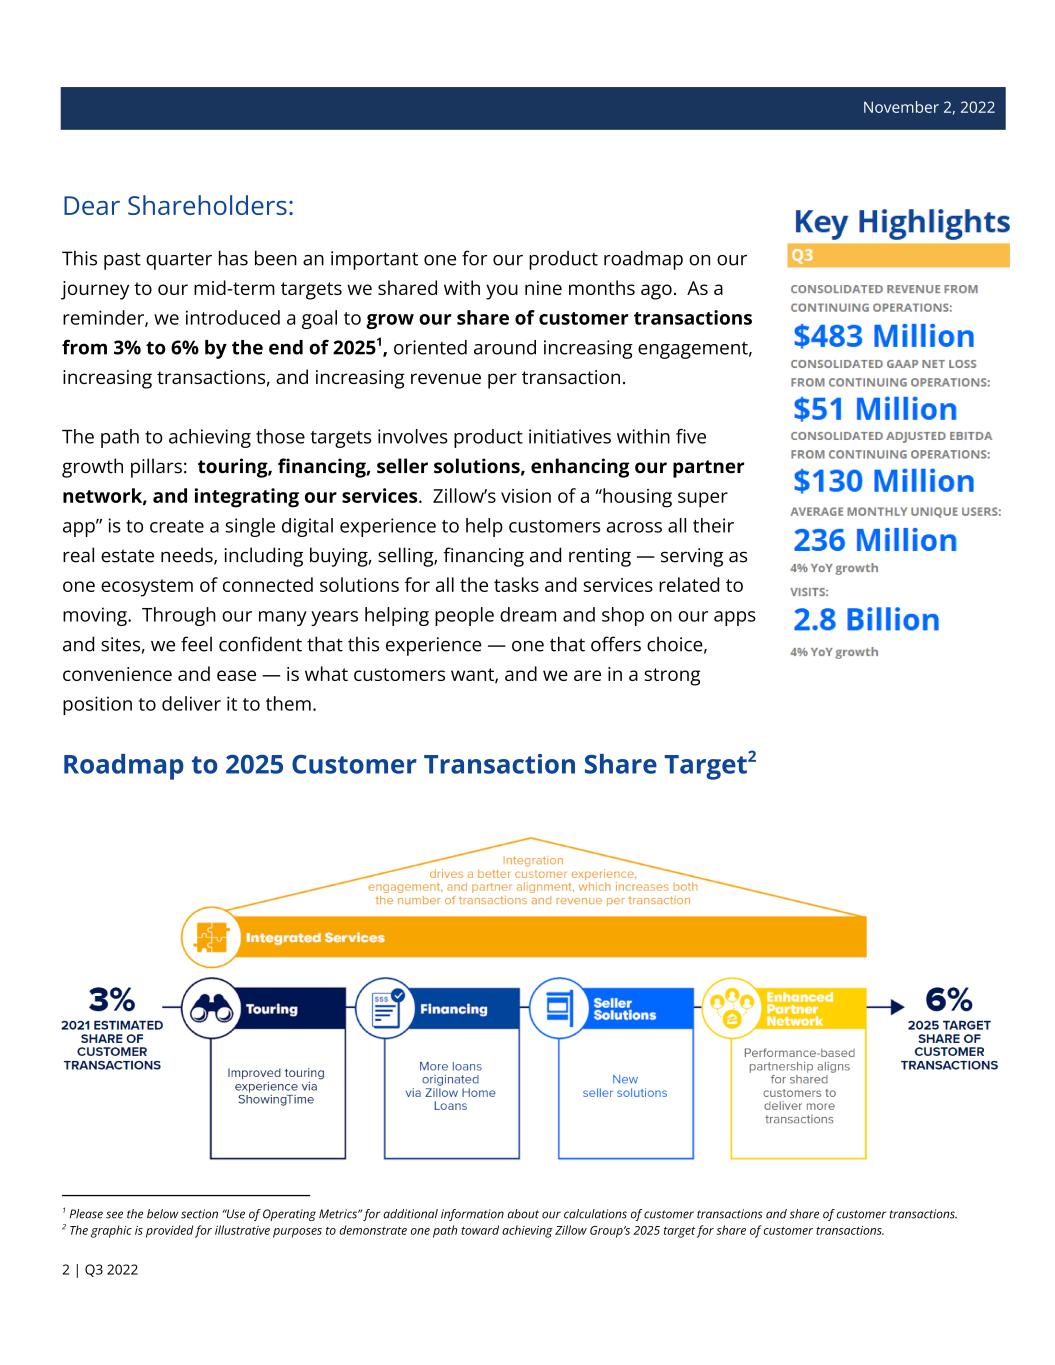
November 2, 2022 Dear Shareholders: This past quarter has been an important one for our product roadmap on our journey to our mid-term targets we shared with you nine months ago. As a reminder, we introduced a goal to grow our share of customer transactions from 3% to 6% by the end of 20251, oriented around increasing engagement, increasing transactions, and increasing revenue per transaction. The path to achieving those targets involves product initiatives within five growth pillars: touring, financing, seller solutions, enhancing our partner network, and integrating our services. Zillow’s vision of a “housing super app” is to create a single digital experience to help customers across all their real estate needs, including buying, selling, financing and renting — serving as one ecosystem of connected solutions for all the tasks and services related to moving. Through our many years helping people dream and shop on our apps and sites, we feel confident that this experience — one that offers choice, convenience and ease — is what customers want, and we are in a strong position to deliver it to them. Roadmap to 2025 Customer Transaction Share Target2 2 The graphic is provided for illustrative purposes to demonstrate one path toward achieving Zillow Group’s 2025 target for share of customer transactions. 1 Please see the below section “Use of Operating Metrics” for additional information about our calculations of customer transactions and share of customer transactions. 2 | Q3 2022
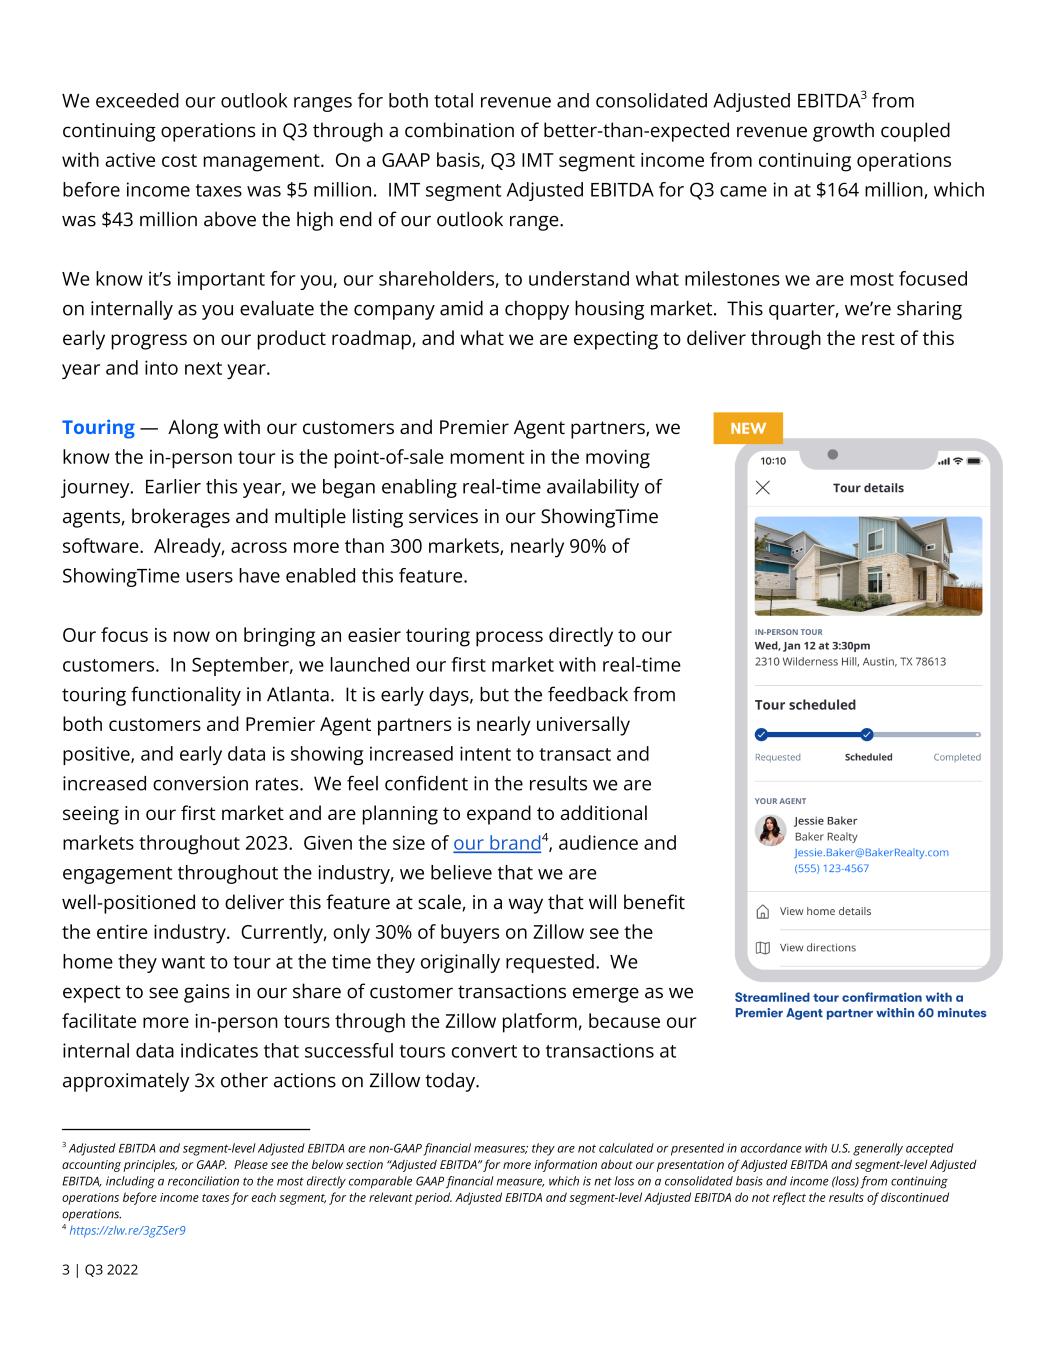
We exceeded our outlook ranges for both total revenue and consolidated Adjusted EBITDA3 from continuing operations in Q3 through a combination of better-than-expected revenue growth coupled with active cost management. On a GAAP basis, Q3 IMT segment income from continuing operations before income taxes was $5 million. IMT segment Adjusted EBITDA for Q3 came in at $164 million, which was $43 million above the high end of our outlook range. We know it’s important for you, our shareholders, to understand what milestones we are most focused on internally as you evaluate the company amid a choppy housing market. This quarter, we’re sharing early progress on our product roadmap, and what we are expecting to deliver through the rest of this year and into next year. Touring — Along with our customers and Premier Agent partners, we know the in-person tour is the point-of-sale moment in the moving journey. Earlier this year, we began enabling real-time availability of agents, brokerages and multiple listing services in our ShowingTime software. Already, across more than 300 markets, nearly 90% of ShowingTime users have enabled this feature. Our focus is now on bringing an easier touring process directly to our customers. In September, we launched our first market with real-time touring functionality in Atlanta. It is early days, but the feedback from both customers and Premier Agent partners is nearly universally positive, and early data is showing increased intent to transact and increased conversion rates. We feel confident in the results we are seeing in our first market and are planning to expand to additional markets throughout 2023. Given the size of our brand4, audience and engagement throughout the industry, we believe that we are well-positioned to deliver this feature at scale, in a way that will benefit the entire industry. Currently, only 30% of buyers on Zillow see the home they want to tour at the time they originally requested. We expect to see gains in our share of customer transactions emerge as we facilitate more in-person tours through the Zillow platform, because our internal data indicates that successful tours convert to transactions at approximately 3x other actions on Zillow today. 4 https://zlw.re/3gZSer9 3 Adjusted EBITDA and segment-level Adjusted EBITDA are non-GAAP financial measures; they are not calculated or presented in accordance with U.S. generally accepted accounting principles, or GAAP. Please see the below section “Adjusted EBITDA” for more information about our presentation of Adjusted EBITDA and segment-level Adjusted EBITDA, including a reconciliation to the most directly comparable GAAP financial measure, which is net loss on a consolidated basis and income (loss) from continuing operations before income taxes for each segment, for the relevant period. Adjusted EBITDA and segment-level Adjusted EBITDA do not reflect the results of discontinued operations. 3 | Q3 2022
Enhancing our partner network — Those who have followed Zillow for a long time know we have consistently innovated on our partner network and pricing models to create the best experience for Premier Agent partners and our shared customers. The most recent evolution is in flight in one key test market — Raleigh, North Carolina — where, earlier this year, we significantly consolidated the number of partners we worked with to enable scalable testing, send more customers to our best-performing partners and offer our shared customers an improved mortgage product experience. We also have a partner who has created a team solely built to serve Zillow customers and provide an integrated customer experience. With a roughly 15% customer adoption rate of Zillow Home Loans in Raleigh, our new approaches to serving Zillow customers in this market give us confidence in our strategy of integrating and improving our mortgage product experience. Watch the full video here5 Financing — We know 87% of buyers use a mortgage6, and this year, we’ve turned our eyes toward building a substantial direct-to-consumer purchase mortgage operation to serve them. From first dreaming about a home to the close of contract, financing is core to a buyer’s experience, which is why it’s a must in the integrated, end-to-end customer experience we envision. Beyond that, we see a large and fragmented market where we are well-positioned to take share over time. The top 25 lenders in the country combined have about one-third share of purchase mortgage loans originated7. We believe there are three key reasons for this fragmentation: The product is highly regulated, so manufacturing a loan is a commodity; few brands are nationally recognized, so acquiring customers is expensive; and distribution requires brand power and a network of local real estate agents. Against that backdrop, we see a significant opportunity for Zillow. Roughly two-thirds of actual primary homebuyers use Zillow today, and roughly 40% of all homebuyers begin their journey with financing8. Millions of Zillow users raised their hands for financing help in the past year, but the vast majority didn’t know they could get a mortgage through Zillow — and roughly 80% did not yet have a real estate agent9. We plan to overhaul our current mortgage funnels away from third-party lead generation and toward Zillow Home Loans, and bolster our loan officers’ tools and capabilities to help the customers who come their way. Our future state is one where customers who start with Zillow Home Loans work with a Premier Agent partner to whom we’ve connected them, and customers who start with a Premier Agent partner through our touring product are also choosing Zillow Home Loans as their mortgage provider. We aim to increase the number of purchase loans, loans per officer, and Zillow Home Loans customer adoption rate. 5 https://youtu.be/LDfvZmIfitU 6 March 2022 National Association of REALTORS® “2022 Home Buyers and Sellers Generational Trends Report” 7 Consumer Financial Protection Bureau “Data Point: 2021 Mortgage Market Activity and Trends” 8 Zillow Group internal data and estimates 9 Zillow Group internal data and estimates 4 | Q3 2022

Seller solutions — Beyond all the product improvements we are making to the buying experience, we are also innovating rapidly on behalf of sellers and listing agents. We announced our strategic partnership with Opendoor last quarter, and teams at both companies are working hard to launch the product in Q1 of 2023, with expansion plans outlined throughout next year. We also recently reorganized our real estate software offerings under one umbrella brand called ShowingTime+. This brand houses ShowingTime; dotloop; Bridge Interactive; and Rich Media Technology, which includes AI-generated interactive floor plans and 3D home tours. The ShowingTime+ software suite is designed to help agents and brokers win new listings, manage and market those listings, coordinate showings, and manage offers and transactions. In 2023, ShowingTime+ will offer two new tools to help agents win their next listing: Listing Media Services, a photography service and media package that captures all aspects of a home, giving shoppers an immersive digital shopping experience; and Listing Showcase, a complete media placement package that puts the listing agent’s brand front and center using the most cutting-edge interactive technology we have. We expect the combination of ShowingTime+’s software capabilities and Zillow’s audience reach and proprietary technologies to allow us to access listing agent wallet share through both software and marketing spend, further broadening our reach within the addressable market we are going after. We’ve talked about why we’re excited about what we’re building, but, of course, we’re not immune to the impacts of a choppy housing market. We’ve seen 30-year mortgage rates continue to press higher, and they recently surpassed 7%. Big weekly swings in rates continue to occur as well. What this means is that buyers are recalculating what they can afford on the fly, and are uncertain about their ability to purchase — and afford — a home. This rapid volatility has impacted our funnel as our connections decline while buyers decide whether they want to be on, or off, the sidelines in this current market. When coupled with persistently low inventory and continued lackluster flow of new listings, the setup to begin 2023 in housing looks challenged. Given how this year has played out, we continue to feel we made the right decision exiting iBuying 12 months ago, with no inventory remaining on our balance sheet as of Sept. 30. To continue responsible stewardship of capital in the current market, we’ve taken cost actions to streamline our operations and prioritize investments through a combination of a recent reduction in force, further tightening of our discretionary spend, and a decrease in committed marketing dollars. 5 | Q3 2022

Historical Existing Homes Turnover10 Nearly 60 million existing home sales will occur over the next 10 years if historical averages continue Despite the recent cost measures we’ve enacted, we continue to invest against our product roadmap and growth pillars. We have decided not to cut our product and technology investments, and in fact continue to hire in these areas, because of the confidence we have in our go-forward strategy. While the housing market is challenged right now, if long-term average turnover rates persist, we would expect 60 million homes to trade hands over the next 10 years, and that’s the basis of the opportunity we are focused on while keeping a careful eye on the current environment. Additionally, we expect to continue to be active in our repurchase program, given our go-forward opportunity. We have the benefit of a well-capitalized business that produces operating cash flow, and we plan to use that to our and your advantage. We appreciate your partnership on this journey. Sincerely, Rich Barton, Co-founder & CEO Allen Parker, CFO 10 Turnover is defined as total existing homes sold per the National Association of REALTORS® divided by Total U.S. households per the U.S. Census Bureau. The estimate of existing home sales to occur over the next 10 years assumes the historical averages of 4.2% housing turnover since 1975 and annual household growth of ~0.85% since 2000 will continue over the period 2023–2033. 6 | Q3 2022
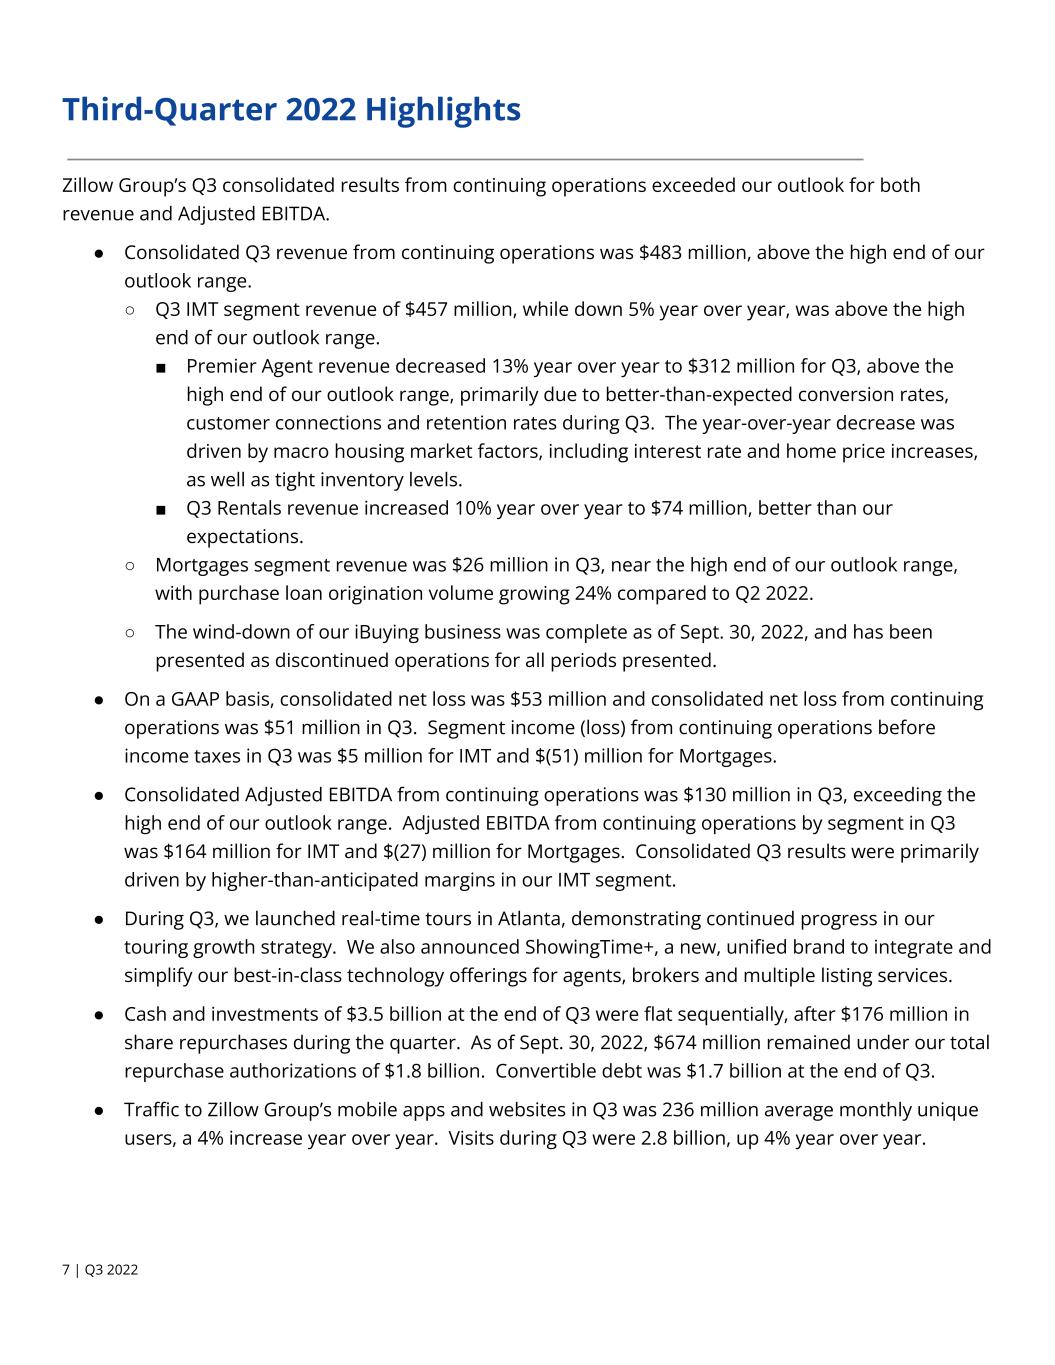
Third-Quarter 2022 Highlights Zillow Group’s Q3 consolidated results from continuing operations exceeded our outlook for both revenue and Adjusted EBITDA. ● Consolidated Q3 revenue from continuing operations was $483 million, above the high end of our outlook range. ○ Q3 IMT segment revenue of $457 million, while down 5% year over year, was above the high end of our outlook range. ■ Premier Agent revenue decreased 13% year over year to $312 million for Q3, above the high end of our outlook range, primarily due to better-than-expected conversion rates, customer connections and retention rates during Q3. The year-over-year decrease was driven by macro housing market factors, including interest rate and home price increases, as well as tight inventory levels. ■ Q3 Rentals revenue increased 10% year over year to $74 million, better than our expectations. ○ Mortgages segment revenue was $26 million in Q3, near the high end of our outlook range, with purchase loan origination volume growing 24% compared to Q2 2022. ○ The wind-down of our iBuying business was complete as of Sept. 30, 2022, and has been presented as discontinued operations for all periods presented. ● On a GAAP basis, consolidated net loss was $53 million and consolidated net loss from continuing operations was $51 million in Q3. Segment income (loss) from continuing operations before income taxes in Q3 was $5 million for IMT and $(51) million for Mortgages. ● Consolidated Adjusted EBITDA from continuing operations was $130 million in Q3, exceeding the high end of our outlook range. Adjusted EBITDA from continuing operations by segment in Q3 was $164 million for IMT and $(27) million for Mortgages. Consolidated Q3 results were primarily driven by higher-than-anticipated margins in our IMT segment. ● During Q3, we launched real-time tours in Atlanta, demonstrating continued progress in our touring growth strategy. We also announced ShowingTime+, a new, unified brand to integrate and simplify our best-in-class technology offerings for agents, brokers and multiple listing services. ● Cash and investments of $3.5 billion at the end of Q3 were flat sequentially, after $176 million in share repurchases during the quarter. As of Sept. 30, 2022, $674 million remained under our total repurchase authorizations of $1.8 billion. Convertible debt was $1.7 billion at the end of Q3. ● Traffic to Zillow Group’s mobile apps and websites in Q3 was 236 million average monthly unique users, a 4% increase year over year. Visits during Q3 were 2.8 billion, up 4% year over year. 7 | Q3 2022

Select Third-Quarter 2022 Results INTERNET, MEDIA & TECHNOLOGY SEGMENT Revenue for the Internet, Media & Technology (“IMT”) segment of $457 million was down 5% year over year in Q3 and above the high end of our outlook range of $434 million, driven by better-than-expected performance in Premier Agent and growth in Rentals. IMT segment GAAP income before income taxes in Q3 was $5 million. IMT segment Adjusted EBITDA was $164 million, or 36% of IMT segment revenue in Q3, exceeding the high end of our outlook range of $121 million IMT segment Adjusted EBITDA and 28% IMT segment Adjusted EBITDA margin. The outperformance in Q3 was driven by a combination of better-than-expected revenue, which has an outsize impact on our margins given our high incremental margin business; timing related to hiring that pushed some positions into Q4; and active cost management to drive operating efficiencies, including lower-than-anticipated advertising and marketing costs. Premier Agent Premier Agent revenue for Q3 decreased 13% year over year to $312 million, above the high end of our outlook range and above total industry transaction dollar volume, which declined 15%11 year over year in Q3. The slight year-over-year revenue outperformance relative to expectations and the industry was primarily driven by better-than-expected conversion rates, customer connections and retention rates, despite macro housing market factors. Rentals Rentals revenue of $74 million in Q3 was up 10% year over year, returning to positive year-over-year growth. Rentals traffic on Zillow grew 30% year over year to 27 million average monthly unique users in Q312. Occupancy rates have continued to drift lower from the historically high levels of the past couple of years, which increased overall rental industry demand for advertising. With our industry-leading rentals traffic, combined with investments in our sales force, our team grew the number of multifamily properties on our platform in Q3. 12 Comscore data, which includes average monthly unique users on rental listings on Zillow, Trulia and HotPads mobile apps and sites for Q3 2022 versus Q3 2021. 11 National Association of REALTORS® existing homes sold during Q3 2022 multiplied by the average selling price per home for Q3 2022, compared to the same period in 2021. 8 | Q3 2022

MORTGAGES SEGMENT Mortgages segment revenue of $26 million for Q3 was near the high end of our outlook range. While deteriorating affordability negatively impacted customer demand for financing in the quarter, we continued to make progress building our Zillow Home Loans purchase mortgage business. Purchase loan origination volume was up 24% sequentially in Q3. We are actively executing on our vision to integrate the shopping and financing experience for customers. In our test markets, we are seeing synergies as we begin to integrate Zillow Home Loans (ZHL) with our Premier Agent partners, which has resulted in customer adoption rates for ZHL in the mid-teens in our Raleigh test market. Mortgages segment loss before income taxes in Q3 was $51 million. Mortgages segment Adjusted EBITDA in Q3 was a loss of $27 million as we operate at subscale while continuing to invest in building a better consumer-facing origination experience, efficient and scalable internal loan officer tools and back-end systems, and integration with our Premier Agent business. HOMES SEGMENT The wind-down of our iBuying business was complete as of Sept. 30, 2022, and has been presented as discontinued operations for all periods presented. Third-Quarter 2022 Financial Details Unless otherwise noted, third-quarter financial details are for continuing operations. OPERATING EXPENSE SUMMARY Total operating expenses from continuing operations were $445 million in Q3, up 8% from $413 million a year ago. The increase in operating expenses was primarily driven by the August 2022 equity employee retention initiative and additional operating expenses from acquiring ShowingTime at the end of Q3 2021. IMT segment expenses were up year over year, driven primarily by headcount increases and the August 2022 equity employee retention initiative, partially offset by a $28 million year-over-year decrease in marketing and advertising. 9 | Q3 2022
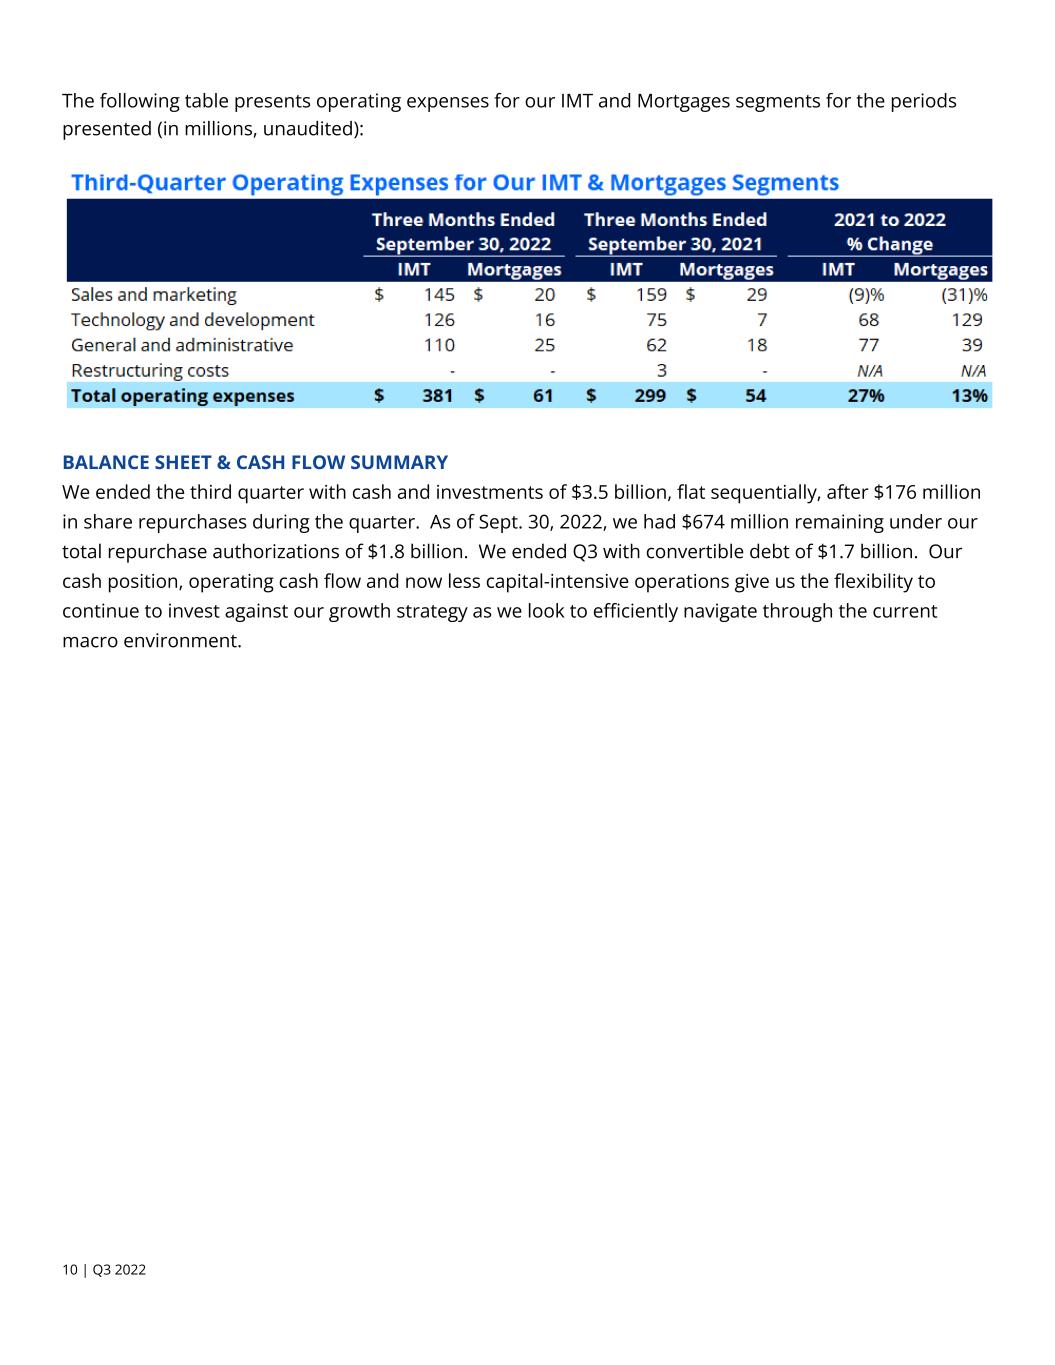
The following table presents operating expenses for our IMT and Mortgages segments for the periods presented (in millions, unaudited): BALANCE SHEET & CASH FLOW SUMMARY We ended the third quarter with cash and investments of $3.5 billion, flat sequentially, after $176 million in share repurchases during the quarter. As of Sept. 30, 2022, we had $674 million remaining under our total repurchase authorizations of $1.8 billion. We ended Q3 with convertible debt of $1.7 billion. Our cash position, operating cash flow and now less capital-intensive operations give us the flexibility to continue to invest against our growth strategy as we look to efficiently navigate through the current macro environment. 10 | Q3 2022

Outlook The following table presents our outlook for the three months ending Dec. 31, 2022 (in millions): * Zillow Group has not provided a quantitative reconciliation of forecasted GAAP net income (loss) to forecasted total Adjusted EBITDA, or of forecasted GAAP income (loss) before income taxes to forecasted segment Adjusted EBITDA, within this communication because the company is unable, without making unreasonable efforts, to calculate certain reconciling items with confidence. These items include, but are not limited to: income taxes, which are directly impacted by unpredictable fluctuations in the market price of the company’s capital stock; depreciation and amortization expense from new acquisitions; impairments of assets; the results of discontinued operations; gains or losses on extinguishment of debt; and acquisition-related costs. These items, which could materially affect the computation of forward-looking GAAP net income (loss) and income (loss) before income taxes, are inherently uncertain and depend on various factors, many of which are outside of Zillow Group’s control. For more information regarding the non-GAAP financial measures discussed in this communication, please see “Adjusted EBITDA” below. ** We have excluded from our outlook for Weighted-average shares outstanding - diluted any potentially dilutive impact of the conversion of our convertible senior notes due in 2024, 2025 and 2026 and any potentially anti-dilutive impact of future share repurchases or capped call unwinds. The maximum number of shares of Class C capital stock underlying the convertible senior notes and capped call confirmations is 33.9 million and 12.7 million shares, respectively. Consolidated Outlook We expect Q4 consolidated revenue to be $410 million at the midpoint of our outlook. We remain focused on delivering innovative services to grow customer transaction share and revenue per transaction. Internet, Media & Technology Segment In Q4, we expect IMT segment revenue to be between $380 million and $405 million, declining 19% year over year at the midpoint of our outlook range. We expect Q4 IMT segment Adjusted EBITDA to be between $90 million and $100 million and Adjusted EBITDA margin to be 24% at the midpoint of our Adjusted EBITDA outlook range. Q3 IMT segment operating costs were lower than previously expected. As a result, we now expect Q4 IMT segment operating costs to be flat to slightly up from Q3, and below our prior expectations. 11 | Q3 2022

Premier Agent In Q4, Premier Agent revenue is expected to be between $250 million and $270 million, down 27% year over year at the midpoint of our outlook range, relatively in line with our expectations for industry performance in Q4. Rentals In Rentals, we are seeing more multifamily properties on our platform as we enter Q4, and we continue to see signs that low rental vacancies are subsiding, which we expect to drive demand for Rentals advertising. Mortgages Segment In Q4, Mortgages segment revenue is expected to be between $15 million and $20 million, which is down sequentially from Q3. Our Q4 outlook reflects continued softening demand for our marketplace business. It also assumes sequential growth in purchase loan originations, despite macro headwinds and seasonality, as we continue to make progress on building our purchase mortgage platform. We expect Mortgages segment Adjusted EBITDA to be between a loss of $36 million and a loss of $31 million, given we are holding our investment levels relatively flat from Q3 as we experience macro and seasonal pressures in revenue. 12 | Q3 2022

Forward-Looking Statements This communication contains forward-looking statements within the meaning of Section 27A of the Securities Act of 1933 and Section 21E of the Securities Exchange Act of 1934 that involve risks and uncertainties, including, without limitation, statements regarding our 2025 targets, the future performance and operation of our business, the current and future health and stability of the residential housing market and economy, volatility of mortgage interest rates, and our expectations regarding future shifts in behavior by consumers and employees. Statements containing words such as “may,” “believe,” “anticipate,” “expect,” “intend,” “plan,” “project,” “predict,” “will,” “projections,” “continue,” “estimate,” “outlook,” “guidance,” “would,” “could,” or similar expressions constitute forward-looking statements. Forward-looking statements are made based on assumptions as of Nov. 2, 2022, and although we believe the expectations reflected in the forward-looking statements are reasonable, we cannot guarantee these results. Differences in Zillow Group’s actual results from those described in these forward-looking statements may result from actions taken by Zillow Group as well as from risks and uncertainties beyond Zillow Group’s control. Factors that may contribute to such differences include, but are not limited to: the current and future health and stability of the economy, financial conditions and residential housing market, including any extended downturn or slowdown; changes in general economic and financial conditions (including federal monetary policy, interest rates, inflation, home price fluctuations, and housing inventory) that may reduce demand for our products and services, lower our profitability or reduce our access to financing; actual or anticipated changes in our rates of growth and innovation relative to those of our competitors; actual or anticipated fluctuations in our financial condition and results of operations; changes in projected operational and financial results; investment of resources to pursue strategies and develop new products and services that may not prove effective or that are not attractive to customers and real estate partners; the duration and impact of the COVID-19 pandemic (including variants) or other public health crises on our ability to operate, demand for our products or services, or general economic conditions; addition or loss of a significant number of customers; acquisitions, strategic partnerships, joint ventures, capital-raising activities or other corporate transactions or commitments by us or our competitors; actual or anticipated changes in technology, products, markets or services by us or our competitors; ability to protect the information and privacy of our customers and other third parties; ability to protect our brand and intellectual property; ability to obtain or maintain licenses and permits to support our current and future businesses; ability to comply with multiple listing service rules and requirements to access and use listing data, and to maintain or establish relationships with listings and data providers; ability to operate and grow our mortgage origination business, including the ability to obtain sufficient financing and resell originated mortgages on the secondary market; the impact of natural disasters and other catastrophic events; changes in laws or government regulation affecting our business; and the impact of pending or future litigation or regulatory actions. The foregoing list of risks and uncertainties is illustrative but not exhaustive. For more information about potential factors that could affect Zillow Group’s business and financial results, please review the “Risk Factors” described in Zillow Group’s Annual Report on Form 10-K for the fiscal year ended Dec. 31, 2021 and in future quarterly and annual reports. Except as may be required by law, Zillow Group does not intend and undertakes no duty to update this information to reflect future events or circumstances. 13 | Q3 2022

No Incorporation by Reference This communication includes website addresses and references to additional materials found on those websites, including Zillow Group’s websites. These websites and materials are not incorporated by reference herein or our other filings with the Securities and Exchange Commission. Use of Estimates and Statistical Data This communication includes estimates and other statistical data made by independent third parties and by Zillow Group relating to the housing market, connection, engagement, growth, and other data about Zillow Group’s performance and the residential real estate industry. These data involve a number of assumptions and limitations, which may significantly impair their accuracy, and you are cautioned not to give undue weight to such estimates. Projections, assumptions and estimates of future performance are necessarily subject to a high degree of uncertainty and risk. Use of Operating Metrics Zillow Group reviews a number of operating metrics to evaluate its business, measure performance, identify trends, formulate business plans, and make strategic decisions. This communication includes Customer Transactions and current share of Customer Transactions as a percentage of total transactions. Zillow Group uses these operating metrics on a periodic basis to evaluate and provide investors with insight into the performance of Zillow Group’s transaction-based lines of business, which currently include Premier Agent, Zillow Home Loans and Zillow Closing Services. Revenue and transaction contributions from Zillow Offers have been excluded from the below calculations. Customer Transactions: Zillow Group calculates “Customer Transactions” as each unique purchase or sale transaction in which the homebuyer or seller uses Zillow Home Loans, Zillow Closing Services, and/or involves a Premier Agent with whom the buyer or seller connected through Zillow. In particular: • For Premier Agent, Zillow Group uses an internal approximation of the number of buy- and sell-side transactions that involve a Premier Agent with whom the buyer or seller connected through Zillow. Because of the challenges associated with measuring the conversion of connections to transactions outside of our Premier Agent Flex program, including reliance on the availability and quality of public records and data, these estimates may be inaccurate. • For Zillow Closing Services, Zillow Group counts each unique purchase or sale transaction in which the home buyer or seller uses Zillow Closing Services. • For Zillow Home Loans, Zillow Group counts each unique purchase or sale transaction in which the home buyer or seller uses Zillow Home Loans. Revenue Per Customer Transaction: Zillow Group calculates “Revenue Per Customer Transaction” as Premier Agent, Zillow Home Loans and Zillow Closing Services revenue divided by the number of Customer Transactions during the relevant period. Share of Customer Transactions: For purposes of estimating 2021 share of customer transactions, Zillow Group assumed there were 12.2M buy and sell-side transactions in 2021, based on the estimated 6.1M home transactions reported by the National Association of REALTORS® in 2021. Adjusted EBITDA To provide investors with additional information regarding our financial results, this communication includes references to Adjusted EBITDA in total and for each segment, each a non-GAAP financial measure. We have provided a reconciliation below of Adjusted EBITDA in total to net loss and Adjusted EBITDA by segment to income (loss) from continuing operations before income taxes for each segment, the most directly comparable U.S. generally accepted accounting principles (“GAAP”) financial measures. Adjusted EBITDA is a key metric used by our management and board of directors to measure operating performance and trends and to prepare and approve our annual budget. In particular, the exclusion of 14 | Q3 2022

certain expenses in calculating Adjusted EBITDA facilitates operating performance comparisons on a period-to-period basis. Our use of Adjusted EBITDA in total and for each segment has limitations as an analytical tool, and you should not consider these measures in isolation or as a substitute for analysis of our results as reported under GAAP. Some of these limitations are: • Adjusted EBITDA does not reflect changes in, or cash requirements for, our working capital needs; • Adjusted EBITDA does not reflect the results of discontinued operations; • Adjusted EBITDA does not consider the potentially dilutive impact of share-based compensation; • Although depreciation and amortization are non-cash charges, the assets being depreciated and amortized may have to be replaced in the future, and Adjusted EBITDA does not reflect cash capital expenditure requirements for such replacements or for new capital expenditures or contractual commitments; • Adjusted EBITDA does not reflect restructuring costs; • Adjusted EBITDA does not reflect acquisition-related costs; • Adjusted EBITDA does not reflect loss on extinguishment of debt; • Adjusted EBITDA does not reflect interest expense or other income; • Adjusted EBITDA does not reflect income taxes; and • Other companies, including companies in our own industry, may calculate Adjusted EBITDA differently from the way we do, limiting its usefulness as a comparative measure. Because of these limitations, you should consider Adjusted EBITDA in total and for each segment alongside other financial performance measures, including various cash-flow metrics, net loss, income (loss) from continuing operations before income taxes for each segment, and our other GAAP results. The following tables present a reconciliation of Adjusted EBITDA to the most directly comparable GAAP financial measure, which is net loss on a consolidated basis and income (loss) from continuing operations before income taxes for each segment, along with the calculation of Adjusted EBITDA margin and associated year-over-year growth rates and the most directly comparable GAAP financial measure and related year-over-year growth rates, which is net loss on a consolidated basis and income (loss) from continuing operations before income taxes margin for each segment, for each of the periods presented (in millions, unaudited): 15 | Q3 2022
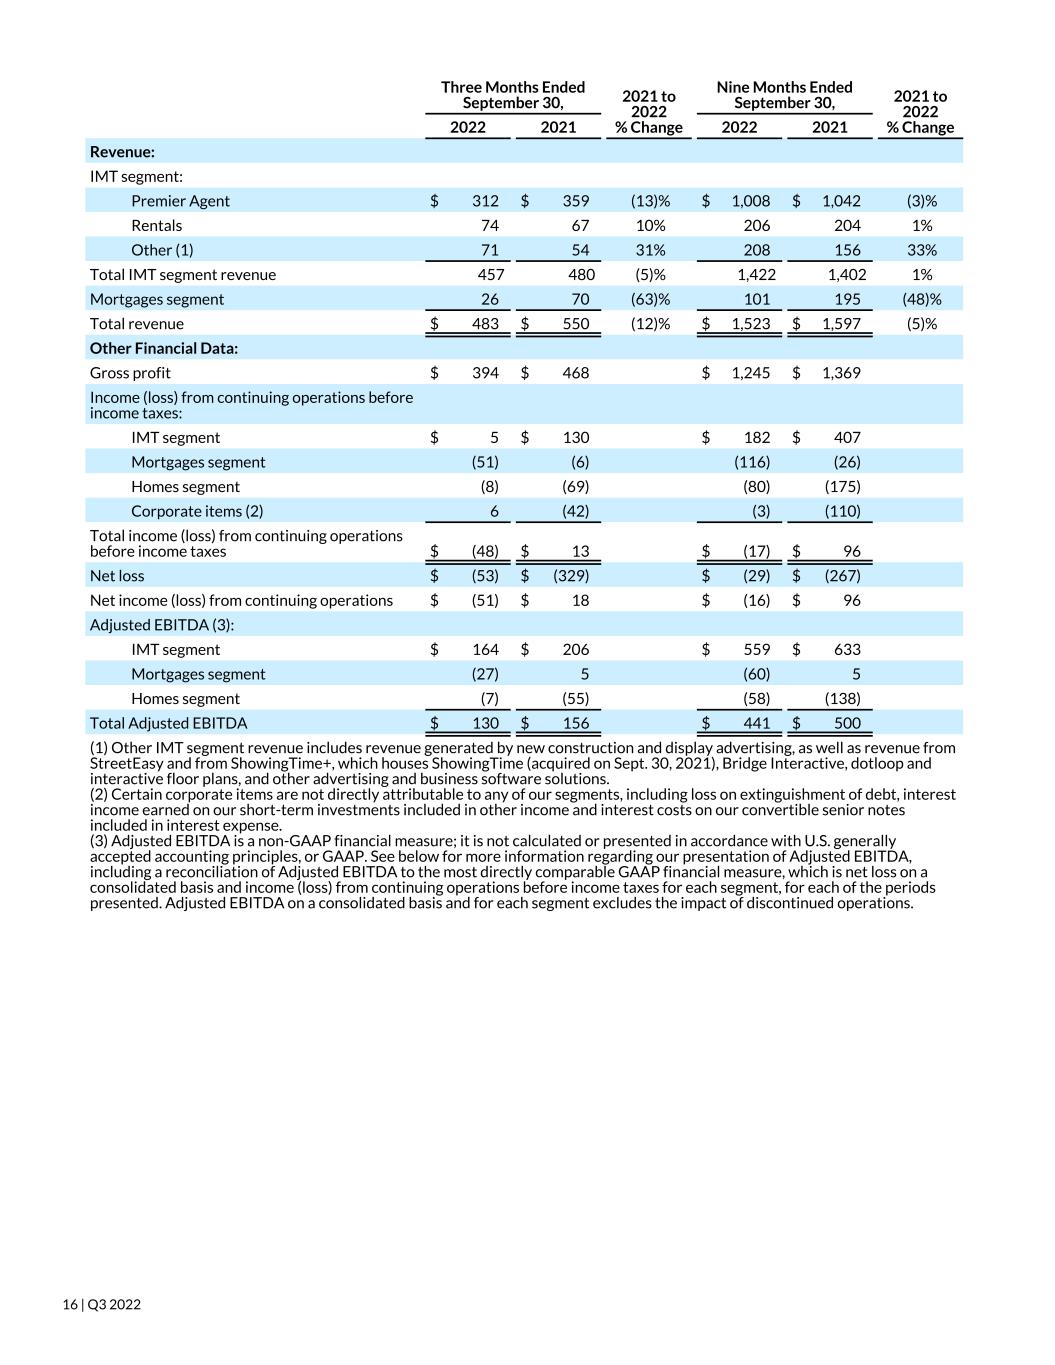
Three Months Ended September 30, 2021 to 2022 % Change Nine Months Ended September 30, 2021 to 2022 % Change2022 2021 2022 2021 Revenue: IMT segment: Premier Agent $ 312 $ 359 (13)% $ 1,008 $ 1,042 (3)% Rentals 74 67 10% 206 204 1% Other (1) 71 54 31% 208 156 33% Total IMT segment revenue 457 480 (5)% 1,422 1,402 1% Mortgages segment 26 70 (63)% 101 195 (48)% Total revenue $ 483 $ 550 (12)% $ 1,523 $ 1,597 (5)% Other Financial Data: Gross profit $ 394 $ 468 $ 1,245 $ 1,369 Income (loss) from continuing operations before income taxes: IMT segment $ 5 $ 130 $ 182 $ 407 Mortgages segment (51) (6) (116) (26) Homes segment (8) (69) (80) (175) Corporate items (2) 6 (42) (3) (110) Total income (loss) from continuing operations before income taxes $ (48) $ 13 $ (17) $ 96 Net loss $ (53) $ (329) $ (29) $ (267) Net income (loss) from continuing operations $ (51) $ 18 $ (16) $ 96 Adjusted EBITDA (3): IMT segment $ 164 $ 206 $ 559 $ 633 Mortgages segment (27) 5 (60) 5 Homes segment (7) (55) (58) (138) Total Adjusted EBITDA $ 130 $ 156 $ 441 $ 500 (1) Other IMT segment revenue includes revenue generated by new construction and display advertising, as well as revenue from StreetEasy and from ShowingTime+, which houses ShowingTime (acquired on Sept. 30, 2021), Bridge Interactive, dotloop and interactive floor plans, and other advertising and business software solutions. (2) Certain corporate items are not directly attributable to any of our segments, including loss on extinguishment of debt, interest income earned on our short-term investments included in other income and interest costs on our convertible senior notes included in interest expense. (3) Adjusted EBITDA is a non-GAAP financial measure; it is not calculated or presented in accordance with U.S. generally accepted accounting principles, or GAAP. See below for more information regarding our presentation of Adjusted EBITDA, including a reconciliation of Adjusted EBITDA to the most directly comparable GAAP financial measure, which is net loss on a consolidated basis and income (loss) from continuing operations before income taxes for each segment, for each of the periods presented. Adjusted EBITDA on a consolidated basis and for each segment excludes the impact of discontinued operations. 16 | Q3 2022
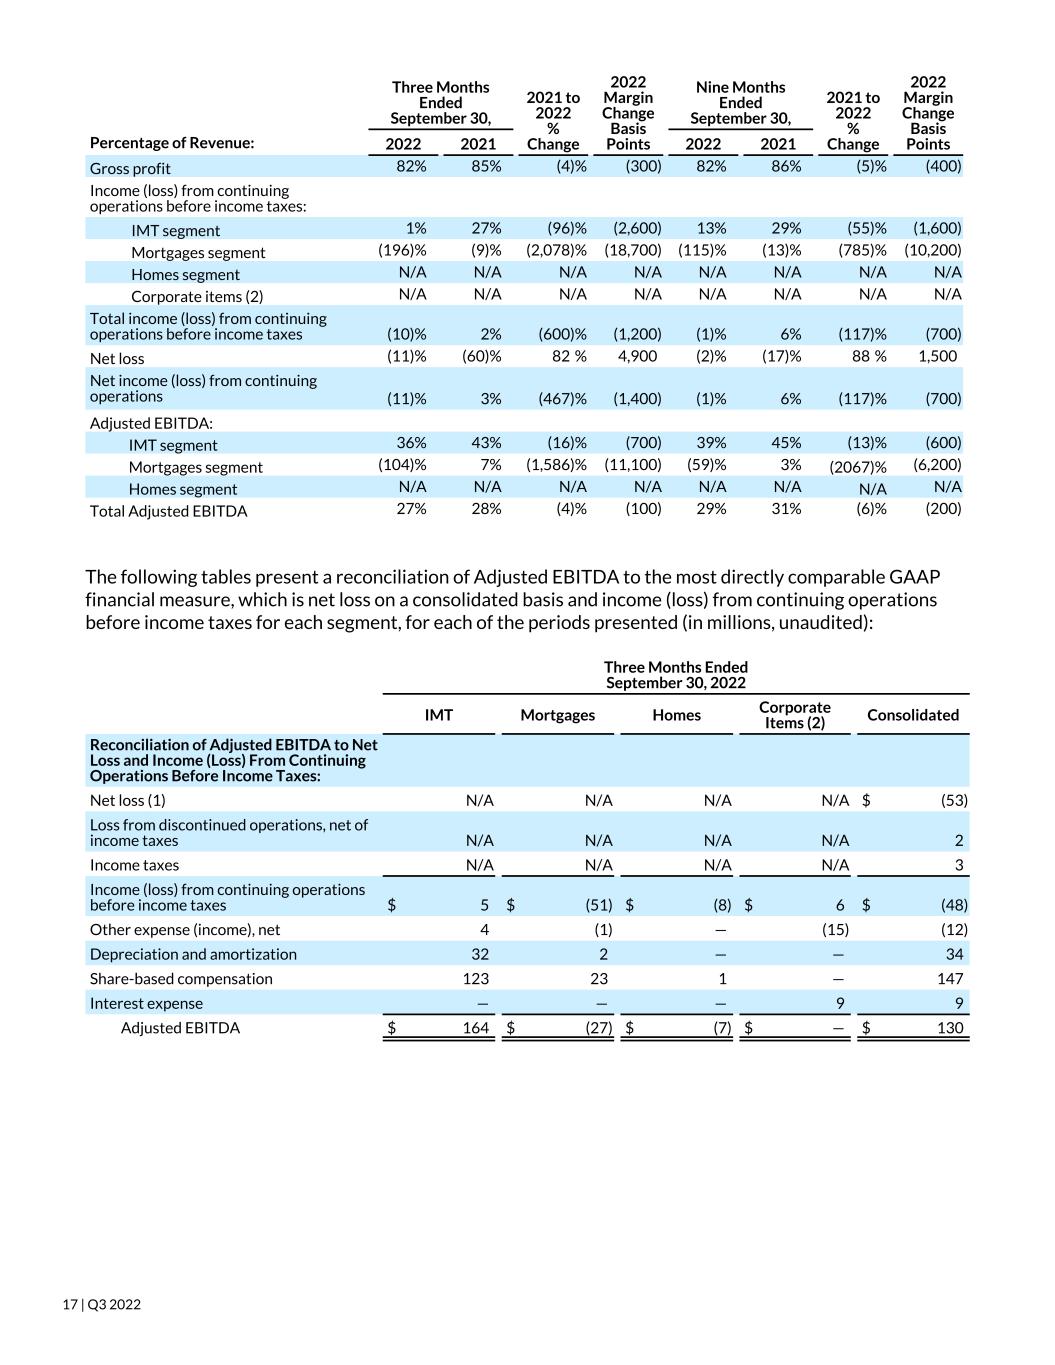
Three Months Ended September 30, 2021 to 2022 % Change 2021 to 2022 Margin Change Basis Points Nine Months Ended September 30, 2021 to 2022 % Change 2021 to 2022 Margin Change Basis PointsPercentage of Revenue: 2022 2021 2022 2021 Gross profit 82 % 85 % (4) % (300) 82 % 86 % (5) % (400) Income (loss) from continuing operations before income taxes: IMT segment 1 % 27 % (96) % (2,600) 13 % 29 % (55) % (1,600) Mortgages segment (196) % (9) % (2,078) % (18,700) (115) % (13) % (785) % (10,200) Homes segment N/A N/A N/A N/A N/A N/A N/A N/A Corporate items (2) N/A N/A N/A N/A N/A N/A N/A N/A Total income (loss) from continuing operations before income taxes (10) % 2 % (600) % (1,200) (1) % 6 % (117) % (700) Net loss (11) % (60) % 82 % 4,900 (2) % (17) % 88 % 1,500 Net income (loss) from continuing operations (11) % 3 % (467) % (1,400) (1) % 6 % (117) % (700) Adjusted EBITDA: IMT segment 36 % 43 % (16) % (700) 39 % 45 % (13) % (600) Mortgages segment (104) % 7 % (1,586) % (11,100) (59) % 3 % (2067) % (6,200) Homes segment N/A N/A N/A N/A N/A N/A N/A N/A Total Adjusted EBITDA 27 % 28 % (4) % (100) 29 % 31 % (6) % (200) The following tables present a reconciliation of Adjusted EBITDA to the most directly comparable GAAP financial measure, which is net loss on a consolidated basis and income (loss) from continuing operations before income taxes for each segment, for each of the periods presented (in millions, unaudited): Three Months Ended September 30, 2022 IMT Mortgages Homes Corporate Items (2) Consolidated Reconciliation of Adjusted EBITDA to Net Loss and Income (Loss) From Continuing Operations Before Income Taxes: Net loss (1) N/A N/A N/A N/A $ (53) Loss from discontinued operations, net of income taxes N/A N/A N/A N/A 2 Income taxes N/A N/A N/A N/A 3 Income (loss) from continuing operations before income taxes $ 5 $ (51) $ (8) $ 6 $ (48) Other expense (income), net 4 (1) — (15) (12) Depreciation and amortization 32 2 — — 34 Share-based compensation 123 23 1 — 147 Interest expense — — — 9 9 Adjusted EBITDA $ 164 $ (27) $ (7) $ — $ 130 17 | Q3 2022

Three Months Ended September 30, 2021 IMT Mortgages Homes Corporate Items (2) Consolidated Reconciliation of Adjusted EBITDA to Net Loss and Income (Loss) From Continuing Operations Before Income Taxes: Net loss (1) N/A N/A N/A N/A $ (329) Loss from discontinued operations, net of income taxes N/A N/A N/A N/A 347 Income taxes N/A N/A N/A N/A (5) Income (loss) from continuing operations before income taxes $ 130 $ (6) $ (69) $ (42) $ 13 Other income, net — (1) — (1) (2) Depreciation and amortization 23 2 3 — 28 Share-based compensation 50 9 11 — 70 Acquisition-related costs 3 — — — 3 Loss on extinguishment of debt — — — 15 15 Interest expense — 1 — 28 29 Adjusted EBITDA $ 206 $ 5 $ (55) $ — $ 156 Nine Months Ended September 30, 2022 IMT Mortgages Homes Corporate Items (2) Consolidated Reconciliation of Adjusted EBITDA to Net Loss and Income (Loss) From Continuing Operations Before Income Taxes: Net loss (1) N/A N/A N/A N/A $ (29) Loss from discontinued operations, net of income taxes N/A N/A N/A N/A 13 Income taxes N/A N/A N/A N/A (1) Income (loss) from continuing operations before income taxes $ 182 $ (116) $ (80) $ (3) $ (17) Other expense (income), net 4 (2) — (21) (19) Depreciation and amortization 104 8 2 — 114 Share-based compensation 263 46 14 — 323 Restructuring costs 6 2 6 — 14 Interest expense — 2 — 24 26 Adjusted EBITDA $ 559 $ (60) $ (58) $ — $ 441 18 | Q3 2022

Nine Months Ended September 30, 2021 IMT Mortgages Homes Corporate Items (2) Consolidated Reconciliation of Adjusted EBITDA to Net Loss and Income (Loss) From Continuing Operations Before Income Taxes: Net loss (1) N/A N/A N/A N/A $ (267) Loss from discontinued operations, net of income taxes N/A N/A N/A N/A 363 Income taxes N/A N/A N/A N/A — Income (loss) from continuing operations before income taxes $ 407 $ (26) $ (175) $ (110) $ 96 Other income, net — (3) — (2) (5) Depreciation and amortization 68 5 8 — 81 Share-based compensation 150 25 29 — 204 Acquisition-related costs 8 — — — 8 Loss on extinguishment of debt — — — 17 17 Interest expense — 4 — 95 99 Adjusted EBITDA $ 633 $ 5 $ (138) $ — $ 500 (1) We use income (loss) from continuing operations before income taxes as our profitability measure in making operating decisions and assessing the performance of our segments; therefore, net loss and income taxes are calculated and presented only on a consolidated basis within our financial statements. (2) Certain corporate items are not directly attributable to any of our segments, including the loss on extinguishment of debt, interest income earned on our short-term investments included in other income and interest costs on our convertible senior notes included in interest expense. 19 | Q3 2022


