PRELIMINARY OFFERING CIRCULAR DATED OCTOBER [___], 2015
WAYBETTER, INC.
![]()
205 East 42nd Street, 17th Floor
New York, NY 10017
www.waybetter.com
up to 20,000,000 shares of Series B Preferred Stock
SEE “SECURITIES BEING OFFERED” AT [PAGE XX]
| Price to Public | Underwriting discount and commissions** | Proceeds to issuer | Proceeds to other persons | |
| Per share/unit | $1.00* | N/A | ||
| Total Minimum | $3,000,000 | N/A | ||
| Total Maximum | $20,000,000 | N/A | ||
*We will provide final pricing information in a final or supplemental Offering Circular.
**See “Plan of Distribution” for details regarding the compensation payable to placement agents in connection with this offering. The company has engaged North Capital Private Securities Corporation to serve as its sole and exclusive placement agent to assist in the placement of its securities.
We expect that the amount of expenses of the offering that we will pay will be approximately $100,000, not including state filing fees.
This offer will terminate one year from the date this offering is qualified by the U.S. Securities and Exchange Commission, but we reserve the right to terminate the offering on an earlier date. The company has engaged [___________] as bank escrow agent to hold funds tendered by investors, and assuming we sell a minimum of $3 million in shares, may hold a series of closings at which we receive the funds from the escrow agent and issue the shares to investors. The offering will terminate at the earlier of: (1) the date at which the maximum offering amount has been sold, (2) the date which is one year from this offering being qualified by the Commission, or (3) the date at which the offering is earlier terminated by the company in our sole discretion. In the event we have not sold the minimum amount of shares by the date that is one year from the qualification of this offering with the Commission, or sooner terminated by the company, any money tendered by potential investors will be promptly returned by [__________] as bank escrow agent.
NEITHER THE SECURITIES AND EXCHANGE COMMISSION NOR ANY STATE SECURITIES COMMISSION HAS APPROVED OR DISAPPROVED OF THESE SECURITIES OR PASSED UPON THE ADEQUACY OR ACCURACY OF THIS OFFERING CIRCULAR. ANY REPRESENTATION TO THE CONTRARY IS A CRIMINAL OFFENSE.
THE UNITED STATES SECURITIES AND EXCHANGE COMMISSION DOES NOT PASS UPON THE MERITS OR GIVE ITS APPROVAL OF ANY SECURITIES OFFERED OR THE TERMS OF THE OFFERING, NOR DOES IT PASS UPON THE ACCURACY OR COMPLETENESS OF ANY OFFERING CIRCULAR OR OTHER SOLICITATION MATERIALS. THESE SECURITIES ARE OFFERED PURSUANT TO AN EXEMPTION FROM REGISTRATION WITH THE COMMISSION; HOWEVER THE COMMISSION HAS NOT MADE AN INDEPENDENT DETERMINATION THAT THE SECURITIES OFFERED ARE EXEMPT FROM REGISTRATION.
This offering is inherently risky. See “Risk Factors” on page [XX].
Sales of these securities will commence on approximately [date].
We are following the “Offering Circular” format of disclosure under Regulation A.
AN OFFERING STATEMENT PURSUANT TO REGULATION A RELATING TO THESE SECURITIES HAS BEEN FILED WITH THE SECURITIES AND EXCHANGE COMMISSION. INFORMATION CONTAINED IN THIS PRELIMINARY OFFERING CIRCULAR IS SUBJECT TO COMPLETION OR AMENDMENT. THESE SECURITIES MAY NOT BE SOLD NOR MAY OFFERS TO BUY BE ACCEPTED BEFORE THE OFFERING STATEMENT FILED WITH THE COMMISSION IS QUALIFIED. THIS PRELIMINARY OFFERING CIRCULAR SHALL NOT CONSTITUTE AN OFFER TO SELL OR THE SOLICITATION OF AN OFFER TO BUY NOR MAY THERE BE ANY SALES OF THESE SECURITIES IN ANY STATE IN WHICH SUCH OFFER, SOLICITATION OR SALE WOULD BE UNLAWFUL BEFORE REGISTRATION OR QUALIFICATION UNDER THE LAWS OF SUCH STATE. WE MAY ELECT TO SATISFY OUR OBLIGATION TO DELIVER A FINAL OFFERING CIRCULAR BY SENDING YOU A NOTICE WITHIN TWO BUSINESS DAYS AFTER THE COMPLETION OF OUR SALE TO YOU THAT CONTAINS THE URL WHERE THE FINAL OFFERING CIRCULAR OR THE OFFERING STATEMENT IN WHICH SUCH FINAL OFFERING CIRCULAR WAS FILED MAY BE OBTAINED.
2

TABLE OF CONTENTS
3
THIS OFFERING CIRCULAR MAY CONTAIN FORWARD-LOOKING STATEMENTS AND INFORMATION RELATING TO, AMONG OTHER THINGS, THE COMPANY, ITS BUSINESS PLAN AND STRATEGY, AND ITS INDUSTRY. THESE FORWARD-LOOKING STATEMENTS ARE BASED ON THE BELIEFS OF, ASSUMPTIONS MADE BY, AND INFORMATION CURRENTLY AVAILABLE TO THE COMPANY’S MANAGEMENT. WHEN USED IN THE OFFERING MATERIALS, THE WORDS “ESTIMATE,” “PROJECT,” “BELIEVE,” “ANTICIPATE,” “INTEND,” “EXPECT” AND SIMILAR EXPRESSIONS ARE INTENDED TO IDENTIFY FORWARD-LOOKING STATEMENTS. THESE STATEMENTS REFLECT MANAGEMENT’S CURRENT VIEWS WITH RESPECT TO FUTURE EVENTS AND ARE SUBJECT TO RISKS AND UNCERTAINTIES THAT COULD CAUSE THE COMPANY’S ACTUAL RESULTS TO DIFFER MATERIALLY FROM THOSE CONTAINED IN THE FORWARD-LOOKING STATEMENTS. INVESTORS ARE CAUTIONED NOT TO PLACE UNDUE RELIANCE ON THESE FORWARD-LOOKING STATEMENTS, WHICH SPEAK ONLY AS OF THE DATE ON WHICH THEY ARE MADE.
4
SUMMARY
The Company
Our Mission
WayBetter helps motivate people to adopt healthy behaviors through a combination of gamification, social support, and financial incentives.
Overview
We make games that drive healthy behaviors. Players in our games support, motivate, and hold each other accountable as they work in tandem towards a common goal.
Our first product is a social weight-loss game called DietBet that enables players to compete to lose weight with friends or strangers with real money on the line. The game is not winner-take-all as everyone who reaches the target splits the pot evenly. DietBet is accessible via the web and via mobile apps and comes in different formats, with different time horizons and targets, and with high-stakes and low-stakes games, so that our customers can choose the approach that best fits their goals. We use percentage-based weight targets so that men and women of all shapes and sizes can enjoy playing together on an even playing field.
Since we launched DietBet in 2012 through October 15, 2015, we have had over 300,000 unique paying players who have collectively logged a loss of over 3 million pounds in our games. During that time, we have processed over $22 million in transactions and winners have earned more than $14 million for reaching their targets (this does not count future payouts to players in live games).
We have seen the following growth to date (Gross Transaction Volume (GTV) represents the total dollar volume transacted by customers on the WayBetter platform. GTV is a non - GAAP measurement which differs from the presentation of revenues in the financial statements.):
| • | 2012 Gross Transaction Volume: $242,703 |
| • | 2013 Gross Transaction Volume: $4,142,192 |
| • | 2014 Gross Transaction Volume: $8,626,197 |
| • | 2015 Gross Transaction Volume: $6,453,888 through June 30th |
This is largely driven by jumps in user growth:
| • | 2012 Total Game Plays: 9,689 |
| • | 2013 Total Game Plays: 141,034 |
| • | 2014 Total Game Plays: 212,696 |
| • | 2015 Total Game Plays: 157,850 through June 30th |
5
Our Current Games
Everyone’s approach to weight loss is different, so we have created games that appeal to different people at different stages of their weight-loss journey.
| • | DietBet Kickstarter is our most popular game for new players. This game gets players to commit to losing 4% of their starting weight over a period of four weeks. To date, we have had over 500,000 players in DietBet Kickstarter games (counting people who have played multiple games as multiple players) and the average payment has been $30. On average, winners in Kickstarter games have lost 9.3 pounds in a month. | |
| • | DietBet Transformeris a longer-term game for players who are prepared to commit to lose 10% of their weight gradually over the course of six months. This game has six monthly Rounds, each with its own goal and pot. To date, we have had nearly 40,000 Transformer players whose average financial commitment per game has been $117. Players in Transformers can also purchase a $20 package of Weigh- In Tokens, a virtual product that enables them to do an official weigh-in with our Referees each week. More than half purchase Tokens, which has the effect of boosting our margins. | |
| • | DietBet Maintaineris our newest game and is still in beta testing. This is a yearlong game for people who have reached a healthy BMI and who are focused on maintaining a healthy weight. In this game, the goal is to maintain your weight within a range of +1 to -10%. |
With this trio of DietBet games - Kickstarter, Transformer, and Maintainer - we aim to give people the motivation to get started, to lose weight at a healthy pace, and to keep it off. We believe our emphasis on gradual weight loss and long-term maintenance differentiates us from the many companies in the dieting world that sell quick fixes such as pills, shakes, and supplements. We believe that a sustainable weight-management solution must address underlying motivations and behaviors.
Our Plans for New WayBetter Products
Although we have focused on weight-related games to date, we aspire to be more than a weight-loss company. We believe our approach to social motivation and behavior change can be applied to other areas of healthy lifestyles. For this reason, in August 2014 we changed the name of our company from DietBet, Inc. to WayBetter, Inc. We believe WayBetter better reflects our aspiration of having a broad range of games that can help people live better, healthier lives through a mix of gamification, social support, and financial incentives.
To this end, we recently started testing a new game called StepBet that is similar to DietBet, but instead of losing weight, StepBet is designed to motivate people to walk more. Players compete with step data from their Fit bits as well as other step trackers. We are currently incorporating feedback we have received from over 300 alpha testers and we plan to launch a beta version of StepBet in 2016.
6
We aim to roll out products that address a wide range of behaviors and healthy lifestyles. Some ideas we have contemplated include CardioBet to exercise more; SleepBet to sleep better; CigaBet to quit smoking; LearnBet to acquire new skills; LingoBet to learn languages; and MedsBet to improve adherence to taking medications; among others.
We believe there is a need for a goal-oriented social network. We aim to meet this need by bringing together large numbers of people from all over the world to collaborate, compete, and inspire each other to attain their self-improvement goals in a new way-all within a fun, safe, supportive, and friendly community.
Our Differentiated Solution—The WayBetter Way
What makes our approach different is our emphasis on social motivation, gamification, and financial incentives. We call this The WayBetter Way and it is designed to enable our users to improve their health and fitness by:
| • | Life becomes a game. Competitive people hate to lose and often find that it’s easier -and certainly more fun -to reduce their weight when they’re doing it as part of a social game. We effectively turn weight loss into a game: with a starting line, a finish line, clear predefined goals that need to be reached in order to win, and Referees. We even provide a leader board and history charts to inspire players as they track their progress. Over time we aim to gamify other areas of healthy living and behavior change, like exercising and walking more, sleeping better, and quitting smoking. | |
| • | A shared journey. Unlike traditional social networks that connect people based on social ties, DietBet connects people based onshared goals. Players in our games can and often do bond with strangers into a cohesive group as they travel together on a shared weight-loss journey. A degree of anonymity in such situations, particularly where there can be a stigma with the behavior (as with being overweight) can be liberating, especially when your friends, family, and co-workers may not fully support or understand your desire to make certain healthy lifestyle changes. To facilitate camaraderie and empathy among players, we provide in-game forums where players can share photos, recipes, and updates with each other, and also blog about their successes and their struggles. We have designed all our games to emphasize friendly collaboration rather than cutthroat competition. They are never winner-take-all. | |
| • | Carrots and sticks. Nobody likes to lose money and we require all our players to “put their money where their mouth is” at the start of the game by entering into a commitment contract. Players put money into the pot with the understanding that they will get their money back at the end, and likely a profit, too, if they successfully reach the game’s goal. The carrot and stick of winning and losing real money is a powerful motivator for many players. DietBet winners feel like they got paid to lose weight and this can build momentum and confidence and fuel a positive feedback loop of mounting rewards, both intrinsic rewards (improved health and well-being) and extrinsic rewards (making money). |
7
Our Competitive Strengths—What Sets Us Apart
We believe the following strengths will allow us to continue our growth trajectory:
| • | A growing, recognizable brand. As a result of our singular focus to date on building a gamified social motivation platform, coupled with our early entrance into this market, we believe that the DietBet brand may become synonymous with weight-loss games. We have trademarked DietBet in the United States and own the URL in top-level domains in other countries around the world (e.g., dietbet.cn and dietbet.de). | |
| • | Broad partnerships with health and wellness influencers.We have worked with over 200 influencers in the health and wellness industry, including celebrities with millions of followers on social media (such as Jillian Michaels), to lead DietBet games. These influencers have also helped to cost-effectively build awareness of our brand since each time a well-known influencer leads a DietBet game we get the branding benefits of being associated with them. | |
| • | Publicity and word-of-mouth marketing.Our growth has come in large part from press coverage in dozens of media outlets in the United States and internationally, by partnering with respected influencers, and by word-of-mouth referrals from our customers. We see customer acquisition through increased investments in advertising as a substantial new potential growth opportunity that we intend to pursue in the future. | |
| • | International market opportunity. Although we have not developed local language versions of our products, we have had players from over 70 countries and 10% of our users are outside the United States. We believe we can accelerate our penetration into foreign markets by translating our products into local languages and working with local influencers and media outlets to build our brand internationally. With this in mind, in October 2015 we signed a Memorandum of Understanding with a large weight-loss company in China to partner exclusively on launching our products in China. | |
| • | Game design expertise.We have learned a great deal about designing games that foster behavior change and we consider this proprietary domain knowledge. Given our experience, we believe we are at an advantage relative to new entrants in our space and our expertise will help us as we attempt to pioneer new kinds of behavior-change games that relate to other aspects of healthy lifestyles (beyond weight loss). |
8
| • | Direct relationship and continuous communication with our users.The nature of our game sallows us to learn about our users’ health and fitness goals and communicate the most relevant analysis, features, advice, and content to them throughout the day with our online dashboard, mobile apps, emails, and notifications. |
Our Growth Strategy
We intend to accelerate our growth by developing and launching new products. Key elements of our growth strategy include:
| • | Continue to introduce innovative products. We plan to develop new and diverse health behavior games beyond DietBet. To do so, we expect to invest in research and development to strengthen our platform and interconnect with third-party platforms and devices, such as Google Health, Apple’s Healthkit, and Fitbit, to power new games like StepBet, SleepBet, and CardioBet. We are also continually looking for potential partners to provide data that could power behavior-based games like CigaBet (to quit smoking) and MedsBet (to improve adherence to taking medications). | |
| • | Introduce new features and services.We plan to continue to introduce innovative new features and services to increase user engagement and revenue, and drive efficacy around successful and sustainable healthy behavior change. For example, in 2015 we launched alpha tests of two new games, StepBet and WayBetter Together. | |
| • | Expand brand awareness and drive sales of our products and services.We intend to increase our marketing efforts to grow awareness of our brand and drive greater sales of our products and services. | |
| • | Increase global distribution through select partners.We believe that international markets represent a significant growth opportunity for us and we intend to expand sales of our products and services globally through select partnerships, especially in Western Europe and China. | |
| • | Push into the corporate wellness market.We intend to build relationships with employers, insurers, and wellness providers and grow revenue streams through employee wellness programs. |
Industry Background and Trends
In the United States alone, 145 million people are overweight, according to the CDC. Obesity costs the United States $147 billion in health care expenditures each year and businesses in the United States lose an estimated $8.7 billion annually in absenteeism and decreased productivity.
According to MarketData Enterprises, 108 million Americans go on an average of four-to-five diets a year and Americans spend over $60 billion a year on weight-loss products and services. Despite the size of this market, the weight-loss industry is highly fragmented and has been in a state of flux with the introduction of disruptive new technologies. Traditional weight-loss companies like Weight Watchers and Jenny Craig have suffered commercially (the stock price for Weight Watchers, for example, has ranged between $85 and $4 in the last five years). Apps such as MyFitnessPal, LoseIt, and DietBet have attracted millions of users. MyFitnessPal, a free app for calorie counting and activity tracking, claims 75 million downloads.
9
Several notable trends are driving the growth of the health and fitness market:
| • | Individuals and employers are increasingly focused on health and fitness.A variety of factors, such as changing consumer lifestyles and demographics, combined with rising health care costs and employers’ increased emphasis on productivity, are leading individuals and employers to increasingly focus on health and fitness. Based on research from Fitbit, Inc., consumers spent over $200 billion in 2014 on health and fitness services, such as gym and health club memberships, commercial weight management services, and consumer health products, such as weight management products and dietary supplements. In addition, IBIS World estimates that the corporate wellness industry will grow from $7.4 billion in 2014 to $10.4 billion in 2018 in the United States. | |
| • | Advances in technology have enabled the emergence of connected devices.Recent technological advances in sensors, lower power components, and longer-life batteries, combined with the introduction of wireless standards, such as Bluetooth low energy, have enabled the emergence of connected devices that are smaller, more power-efficient, and able to track a broader range of biometric data. We see these devices as enabling our expansion into new games that depend on wearable sensors, such as StepBet, CardioBet, and SleepBet. | |
| • | Mobile devices have become the preferred platform for accessing information. Mobile devices have become the preferred platform for people to access information and manage their lives, as well as the primary hub to connect a variety of consumer devices. According to Gartner, by 2018 more than 50% of users will go to a tablet or smartphone first for all online activities. More than half our players interact with DietBet via a mobile device, which generally makes for a better user experience as players can weigh-in from the gym, read and reply to comments while waiting for the bus, and get inspiration whenever and wherever they need it. We believe this trend towards mobile computing is especially powerful for online games like ours that have offline elements. | |
| • | More individuals are turning to technology solutions to improve health and fitness. Individuals are increasingly using mobile apps and other software to improve health and fitness, allowing consumers to directly manage and track their health and fitness in unprecedented ways. According to The NPD Group, over 25% of U.S. consumers reported using a fitness app on their smartphone. |
10
Selected Risks Associated with Our Business
Our business is subject to a number of risks and uncertainties, including those highlighted in the section titled “Risk Factors” immediately following this summary. These risks include, but are not limited to, the following:
| • | We operate in a highly competitive market; | |
| • | We must successfully anticipate and satisfy consumer preferences and develop and timely introduce new products and services or enhance existing products and services to address these preferences; | |
| • | With certain new games, we will rely on partners like Fitbit, Apple, and Google for data, which could constrain us if they prove unable or unwilling to work with us; | |
| • | We could face new regulatory issues in the United States and/or in other countries which could classify our activities as gambling; | |
| • | We could encounter reputational issues if players lose trust in our weigh-in system and players think that others are cheating; | |
| • | We could become operationally burdened by opening the current fundraise to a large number of smaller investors; | |
| • | We could lose key employees and/or have difficulty filling key roles; | |
| • | The market for social motivation games is still in the early stages of growth and may not continue to develop as quickly as expected; | |
| • | An economic downturn or future economic uncertainty could adversely affect demand for our products and services; | |
| • | Our current and future products and services may experience quality problems from time to time that could result in adverse publicity, litigation, and/or regulatory proceedings; | |
| • | Material disruption or breach of our information technology systems or those of third-parties could materially damage user and business partner relationships; and |
The Offering
| Securities offered: | Minimum of 3,000,000 shares of Series B Preferred Stock |
| Maximum of 20,000,000 shares of Series B Preferred Stock |
Offering price: $1 per share of Series B Preferred Stock
Minimum investment amount: $1,000
11
Terms of the securities: Series B Preferred Stock are non-voting and non-transferable. The only exit for investors is if the company redeems the shares, is liquidated, goes public, or is acquired; a transfer by will or intestate succession; or any transfers approved in advance by the majority of the Board. See “Securities being Offered.”
12
RISK FACTORS
The SEC requires us to identify risks that are specific to our business and our financial condition. We are subject to all the same risks that all companies in our business, and all companies in the economy, are exposed to. These include risks relating to economic downturns, political and economic events and technological developments (such as hacking and the ability to prevent hacking). Additionally, early-stage companies are inherently more risky than more developed companies. You should consider general risks as well as specific risks when deciding whether to invest.
We are a startup and most startups fail.
WayBetter was incorporated in 2010 (as DietBet, Inc.) and made its first sales in January 2012. After five years we’re still small and we could get crushed by a bigger company, outmaneuvered by another startup, or fail simply because we make too many mistakes. We have a lot of passion but sometimes passion isn’t enough. If you’re investing in this company it’s because you believe in us and in our mission of helping people live better and healthier lives, because there’s no proof that we’ll be able to continue to grow the company.
Our limited track record is no guarantee of future performance.
We are what is called a development stage company, meaning we don’t have much of a financial track record. Our past performance doesn’t give you an idea of how we will perform financially in the future, and our future financial results will vary a lot as we build out our plans and our team and react to changes in our market.
We really only have one product (everything else is on the drawing board).
We have one product in the market that has generated millions of dollars in revenue: DietBet. Everything else we’re planning to launch is speculative. We have done alpha tests with several hundred users for StepBet but we don’t have nearly enough data to know if that will succeed. Products on our road map like CardioBet and SleepBet are still over the horizon.
If we cannot raise enough investment capital in the future, we’ll be in big trouble.
We are raising up to $20 million in this offering, and may close on as little as $3 million. Even if we raise $20 million, however, we might still run out of money down the road. Startups often depend on raising round after round of additional capital until they’re profitable and can fail if they’re unable to secure their next funding round on time. That could happen to us.
Our auditor has issued a “going concern” opinion.
Our auditor has issued a “going concern” opinion on our financial statements, which means they aren’t sure we’ll be able to succeed as a business without additional financing. The company has not generated profits since it was created, and has sustained net losses of $609,448 and $978,184 for the years ended December 31, 2014 and December 31, 2013, respectively. The audit report states that the company’s ability to continue as a going concern for the next twelve months is dependent upon our ability to generate sufficient cash flows from operations to meet our obligations, which the company has not been able to accomplish to date, and/or to obtain additional capital financing.
13
Future fund raising rounds could “cram you down”.
If we do manage to raise subsequent financing rounds, the terms of those rounds might be more favorable to new investors than to existing investors such as you. New equity investors or lenders could have greater rights over our financial resources than our current shareholders. Additional financings could also dilute your ownership stake, potentially drastically. See “Dilution” for more information.
We have a tiny team.
We currently depend on the skill and experience of four primary employees: James Rosen, Matthew Daniel, Alison Weick, and Sean Conrad. Each of these people play key roles and if one or more were to leave for any reason, we would have trouble operating. We also depend on a number of offshore and on-shore contractors to provide key engineering and IT services as well as other services, and we would also run into operation problems and delays if any of these contractors were to stop working with us.
Voting control is in the hands of a few large stockholders.
The class and voting structure of our stock will have the effect of concentrating voting control with a few people, including our directors, our executive officers and our significant stockholders, who currently together hold most of the voting power of our capital stock. In addition, the Series B Preferred Securities we are offering are non-voting, so you will not be able to influence corporate matters, including the election of directors, changes to our company’s governance documents, expanding the employee option pool, and any merger, consolidation, sale of all or substantially all of our assets, or other major action requiring stockholder approval.
We don’t know if people will want to buy what we’re selling.
The market size for our primary product, DietBet, is unclear given that DietBet is an emerging, alternative product to existing weight loss products and has only been around since 2012. There is even less visibility regarding the potential demand for the new products we’re hoping to launch, such as StepBet, SleepBet, CardioBet, and CigaBet. These products also depend on emerging technologies like activity trackers embedded in smartphones, smart watches, and fitness trackers (sometimes referred to as wearables). And people who do like our products today may get tired of them tomorrow. Weight loss and exercise products are notoriously short-lived, as fads come and go. We have a small sample of data from early tests to suggest there may be demand for some of our new products, but we really won’t know how big a hit they might be, if at all, until they have been out for a while.
Competitors could eat our lunch.
There are a number of existing apps, tools, websites, communities, and other products that could compete with us for market share. These competitors include HealthyWage, Stickk, Pact, SparkPeople, MyFitnessPal, Noom, LoseIt, and Weight Watchers, among many others, including some that may not even exist or be known to us today. In addition, companies that don’t look like competitors today could make lateral moves into our space, especially if we’re successful. This could include big wearables companies like Fitbit, fitness/sports companies like Nike, social network companies like Facebook, technology giants like Google, healthy lifestyle brands like Lululemon, or a traditional weight loss companies such as Weight Watchers. We operate in a new market and the competitive landscape is changing quickly. We could see rival products at a lower cost, or with cool new features, targeting the same customer base, which may force us to cut prices, lose market share, or both. All of this is even more applicable to our as-yet unlaunched new products given that we will be moving into new and unfamiliar competitive landscapes.
14
Our space is crowded and there are many competitors for share-of-wallet.
While we believe that DietBet is different from most other products in the weight-loss market, it is not the only way to motivate people to lose weight. We have to compete with a number of other approaches that wouldn’t even normally be considered competition, including health and fitness communities, tools and apps, gyms, personal trainers and coaches, books, videos, and a multitude of other companies in the health, wellness, and behavior-change space. These competitors may be better capitalized than us and outspend us, which would give them a significant advantage. Weight Watchers, for example, is a large public company with a well-established brand around the world; and MyFitnessPal and MapMyFitness (calorie counting and exercise tracking apps) are now part of Under Armour, another large public company. Fitbit raised over $700 million in a successful initial public offering, and Strava (a fitness-oriented community and app) has raised $34.6 million from private investors. There are many well-capitalized startups and also mature companies in our space.
We depend on credit cards and Paypal.
We rely heavily on credit cards to collect the initial payment, and almost exclusively on PayPal to process payouts to customers at the end of the games. If PayPal were to block us for any reason at its discretion - for example, if PayPal detected fraudulent activity related to WayBetter’s users - we would need to find a different method of getting winnings to our customers, such as cutting paper checks. Also, if PayPal were to increase its fees, we could face a reduction in our profits. We are in the process of diversifying our redemption options but we have not been able to find another potential payout partner with the market share of PayPal.
We could be regulated out of business.
Our business model involves a customer entering into a commitment contract as a means of providing motivation to reach a healthy goal (such as losing weight). Although we use the word “bet”, we do not believe that this kind of commitment contract is gambling because our games are fundamentally skill-based and the outcomes are generally under the player’s control. If our activities were deemed illegal or subject to gambling laws by appropriate authorities, however, especially in the United States, we could be squeezed. We also do not know how regulatory issues might affect our planned new products such as StepBet, CardioBet, SleepBet, CigaBet, etc. We also do not know how regulatory issues could affect our plans to expand into unfamiliar international jurisdictions, such as China.
15
We have to block cheaters.
With DietBet, we rely on a weight verification system that is not impossible to cheat. Players are required to submit two weigh-in photos for their official weigh-ins at the start and end of each game (or round of game, in the case of multi-month games). These photos are sent to our Referees who review them across a range of parameters to ensure compliance with our weigh-in rules. When appropriate, our Referees may reject a weigh-in submission and require the player to weigh in again. We also use algorithms to detect suspicious behavior and may require certain players to submit to greater scrutiny, such as with a video weigh-in (instead of photos). We also limit the number of games that any one player can player concurrently.
Despite our best efforts, however, people will attempt to cheat. While we have processed 6.5 million weigh-in photos and believe that cheating is reasonably under control now, if players came to feel that cheating is widespread, this could scare people away from playing, especially in games with strangers.
In addition, new as-yet unlaunched games will entail new methods of verification which we will have to invent and which may be similarly subjected to cheaters. We may find that it is hard, or even impossible, to deter cheating to a sufficient degree with certain new games.
We could be hacked.
We process financial transactions when we accept commitment contracts and pay out earnings, and run the risk of fraud and hacking. As a tiny company that handles substantial sums in large quantities of financial transactions every day, we could be an attractive target to criminals and hackers. We have experienced incidents of fraudulent activity in the past and may experience more fraud in the future. We conduct security audits and do our best to safeguard our systems and assets but we cannot guarantee that we will be able successfully repel future attempts to defraud us.
Our team is distributed.
Like many startups today, we work with an increasing number of contractors, employees, and other service providers who are located all over the world. A distributed workforce can offer cost-savings, the ability to hire higher-caliber talent without the limitations of geography, and better time-zone coverage, especially in the case of our Referees and customer service team, but it can also present formidable difficulties vis a vis communications, managing, hiring, oversight, building a company culture, and in the cohesiveness and morale of our team. Whatever benefits come from having a distributed team could be outweighed by the significant operational hazards and risks and could cause us to under perform or fail. Several of our most senior employees are or have been based remotely and we expect this distributed structure, not just with contractors but with employees, to continue.
We have no independent directors.
Our directors are currently all insiders who have invested in the company. In addition, the directors are connected by long-standing personal relationships preceding the launch of the company. This could lead to unintentional subjectivity in matters of corporate governance, especially in matters of compensation and related party transactions. We also do not benefit from the advantages of having an independent director, including bringing an outside perspective on strategy and control, adding new skills and knowledge that may not be available within the company, having extra checks and balances to prevent fraud and produce reliable financial reports.
16
We have no patents.
We have no patents, nor any patents pending. This opens us up to copycat competitors. We have trademarks and URLs related to DietBet and related properties but these may not be sufficient to insulate us from other companies introducing very similar competitive products.
We may not have enough cash on hand to reedem players’ winnings.
Players provide funds pursuant to their commitment contract directly to our bank account and Paypal account, where we hold the funds for the period of the game. At the end of the game, the player’s winnings are recorded as WayBetter Points. These points can be redeemed for cash, and will expire in one year with no activity. If all our players were to redeem their points at the same time, we may not have sufficient cash on hand.
As of June 30, 2015, we had cash on hand of $4,885,092, which was sufficient to cover the $3,324,874 of player’s winnings that was “deposited” in our bank account at that time. The company has no bank lines in the event that additional cash is needed on short notice in the future.
Managing many investors could be very difficult.
We are a small company and managing many investors, could take up our management’s time and limited resources. Furthermore, there may be additional issues relating to managing a company that has raised capital through a Regulation A offering to a large number of investors which prove to be burdensome. The revised Regulation A regime is new, and as one of the first companies to go through this process we may hit unanticipated operational, regulatory, legal, and investor management obstacles.
Once you buy Series B Preferred stock, you can’t resell it.
Our Series B Preferred Stock is non-transferable; as such, the shares may not be traded on the over-the-counter market. The only exit for investors is if the company redeems your shares, or the company goes public, is acquired, or is liquidated. Your investment could be tied up for years.
17
DILUTION
Dilution means a reduction in value, control, or earnings of the shares the investor owns.
Immediate dilution
An early-stage company typically sells its shares (or grants options over its shares) to its founders and early employees at a very low cash cost, because they are, in effect, putting their “sweat equity” into the company. Occasionally, strategic partners are also interested in investing at an early stage. When the company seeks cash investments from outside investors, like you, the new investors typically pay a much larger sum for their shares than the founders, early employees, or investors from prior financings, which means that the cash value of your stake is diluted because each share of the same type is worth the same amount, and you paid more for your shares than earlier investors did for theirs.
The following table compares the price that new investors are paying for their shares with the effective cash price paid by existing shareholders, giving effect to full conversion of all outstanding stock options, and assuming that the shares are sold at $1. It reflects all transactions since inception, which gives investors a better picture of what they will pay for their investment compared to the company’s insiders than just including such transactions for the last 12 months, which is what the SEC requires.
18
| Total Issued | |||||||||||||||
| Issued | Potential | and Potential | Effective Price per | ||||||||||||
| Dates Issued | Shares | Shares | Shares | Share | |||||||||||
| Founding Common Shares | 8/2010 | 9,000,000 | 9,000,000 | $ | 0.00 | ||||||||||
| Friends and Family Round Common Stock (conversions of convertible debt) | 3/2011 | 1,000,000 | 1,000,000 | $ | 0.10 | ||||||||||
| Series Seed Preferred Shares | 7/2011 - 3/2012 | 3,703,773 | (2) | 3,703,773 | $ | 0.27 | |||||||||
| Series Seed Preferred Shares (conversions of convertible debt) | 8/2014 | 3,583,542 | (2) | 3,583,542 | $ | 0.27 | |||||||||
| Series A Preferred Shares | 8/2014 - 10/2014 | 5,830,306 | (2) | 5,830,306 | $ | 0.48 | |||||||||
| Series A-1 Preferred Shares | 10/2015 | 581,838 | (2) | 581,838 | $ | 0.74 | |||||||||
| Grants: | |||||||||||||||
| Stock Grant | 2/2015 | 10,000 | 10,000 | $ | - | ||||||||||
| Warrants: | |||||||||||||||
| Friends and Family | 9/2010 | 100,000 | 100,000 | (3) | $ | 0.01 | |||||||||
| Guaranty 2013 | 8/2013 | 200,000 | 200,000 | (1) | $ | 0.27 | |||||||||
| Guaranty 2015 | Q4 2015 | 200,000 | 200,000 | (4) | $ | 0.48 | |||||||||
| Options: | |||||||||||||||
| $0.2700 Options | 1/2011 - 2/2015 | 2,784,373 | 2,784,373 | (1) | $ | 0.27 | |||||||||
| $0.4758 Options | 2/2015 - 6/2015 | 452,500 | 452,500 | (1) | $ | 0.48 | |||||||||
| Total Common Shares | 23,809,459 | 3,636,873 | 27,446,332 | $ | 0.23 | ||||||||||
| Investors in this offering, assuming $20 Million raised | 20,000,000 | 20,000,000 | $ | 1.00 | |||||||||||
| Total After Inclusion of this Offering | 43,809,459 | 3,636,873 | 47,446,332 | $ | 0.56 |
(1) Assumes conversion at exercise price of all outstanding warrants and options
(2) Assumes conversion to common stock of all issued preferred shares
(3) All Friends & Family Round Warrants were exercised in September 2015.
(4) Assumes conversion at exercise price. Warrants issued in Q4 of 2015.
The following table demonstrates the dilution that new investors will experience relative to the companys net tangible book value as of June 30, 2015 of $1,718,380, adjusted for the assumption of proceeds from conversion all other convertible instruments outstanding at current, and assuming exercise of all options (3,236,873 shares) and warrants (400,000 shares) outstanding through current, which provide $1,116,240 of proceeds from conversions resulting in the issuance of 3,636,873 shares of common stock (or convertible preferred shares), in addition to the 10,110,000 shares of common stock currently issued and outstanding and 13,699,459 shares of convertible preferred shares outstanding. Net tangible book value is the aggregate amount of the companys tangible assets, less its total liabilities. The table presents three scenarios: a $3 million raise from this offering (minimum offering), a $11.5 million raise from this offering (mid-point), and a fully subscribed $20 million raise from this offering (maximum offering).
19
| $ 3 Million Raise | $ 11.5 Million Raise | $ 20 Million Raise | |||||||
| Price per Share | $ | 1.00 | $ | 1.00 | $ | 1.00 | |||
| Shares Issued | 3,000,000 | 11,500,000 | 20,000,000 | ||||||
| Capital Raised | $ | 3,000,000 | $ | 11,500,000 | $ | 20,000,000 | |||
| Less: Offering Costs | $ | (325,000 | ) | $ | (962,500 | ) | $ | (1,600,000 | ) |
| Net Offering Proceeds | $ | 2,675,000 | $ | 10,537,500 | $ | 18,400,000 | |||
| Net Tangible Book Value Pre-Financing | $ | 2,834,620 | (2) | $ | 2,834,620 | (2) | $ | 2,834,620 | (2) |
| Net Tangible Book Value Post-Financing | $ | 5,509,620 | $ | 13,372,120 | $ | 21,234,620 | |||
| Shares issued and outstanding pre-financing, assuming full conversion | 27,446,332 | (1) | 27,446,332 | (1) | 27,446,332 | (1) | |||
| Post-Financing Shares Issued and Outstanding | 30,446,332 | 38,946,332 | 47,446,332 | ||||||
| Net tangible book value per share prior to offering | $ | 0.103 | $ | 0.103 | $ | 0.103 | |||
| Increase/(Decrease) per share atributable to new investors | $ | 0.078 | $ | 0.240 | $ | 0.344 | |||
| Net tangible book value per share after offering | $ | 0.181 | $ | 0.343 | $ | 0.448 | |||
| Dilution per share to new investors | $ | 0.819 | $ | 0.657 | $ | 0.552 |
(1) Assumes conversion of all issued preferred shares to common stock, conversion of 400,000 outstanding stock warrants, and conversion of 3,236,873 outstanding stock options.
(2) Net Tangible Book Value is adjusted for conversion proceeds for the outstanding warrants and stock options discussed at (1).
20
The next table is the same as the previous, but removes the assumption of conversion of outstanding options and warrants, instead only presenting issued shares.
| $ 3 Million Raise | $ 11.5 Million Raise | $ 20 Million Raise | |||||||
| Price per Share | $ | 1.00 | $ | 1.00 | $ | 1.00 | |||
| Shares Issued | 3,000,000 | 11,500,000 | 20,000,000 | ||||||
| Capital Raised | $ | 3,000,000 | $ | 11,500,000 | $ | 20,000,000 | |||
| Less: Offering Costs | $ | (325,000 | ) | $ | (962,500 | ) | $ | (1,600,000 | ) |
| Net Offering Proceeds | $ | 2,675,000 | $ | 10,537,500 | $ | 18,400,000 | |||
| Net Tangible Book Value Pre-Financing | $ | 1,718,380 | $ | 1,718,380 | $ | 1,718,380 | |||
| Net Tangible Book Value Post-Financing | $ | 4,393,380 | $ | 12,255,880 | $ | 20,118,380 | |||
| Shares Issued and Outstanding Pre-Financing | 23,809,459 | (1) | 23,809,459 | (1) | 23,809,459 | (1) | |||
| Post-Financing Shares Issued and Outstanding | 26,809,459 | 35,309,459 | 43,809,459 | ||||||
| Net tangible book value per share prior to offering | $ | 0.072 | $ | 0.072 | $ | 0.072 | |||
| Increase/(Decrease) per share attributable to new investors | $ | 0.092 | $ | 0.275 | $ | 0.387 | |||
| Net tangible book value per share after offering | $ | 0.164 | $ | 0.347 | $ | 0.459 | |||
| Dilution per share to new investors | $ | 0.84 | $ | 0.653 | $ | 0.541 |
* Assumes conversion of all issued preferred shares to common stock
Future dilution
Another important way of looking at dilution is the dilution that happens due to future actions by the company. The investor’s stake in a company could be diluted due to the company issuing additional shares, whether as part of a capital-raising event, or issued as compensation to the company’s employees or partners. In other words, when the company issues more shares, the percentage of the company that you own will go down, even though the value of the company may go up. You will own a smaller piece of a larger company. This increase in number of shares outstanding could result from a stock offering (such as an initial public offering, another crowd funding round, a venture capital round, angel investment), employees exercising stock options, or by conversion of certain instruments (e.g. convertible bonds, preferred shares or warrants) into stock.
If the company decides to issue more shares, an investor could experience value dilution, with each share being worth less than before, and control dilution, with the total percentage an investor owns being less than before. There may also be earnings dilution, with a reduction in the amount earned per share (though this typically occurs only if the company offers dividends, and most development stage companies do not pay dividends for some time).
21
The type of dilution that hurts early-stage investors most occurs when the company sells more shares in a “down round,” meaning at a lower valuation than in earlier offerings. An example of how this might occur is as follows (numbers are for illustrative purposes only):
| • | In June 2014 Jane invests $20,000 for shares that represent 2% of a company valued at $1 million. | |
| • | In December the company is doing very well and sells $5 million in shares to venture capitalists on a valuation (before the new investment) of $10 million. Jane now owns only 1.3% of the company but her stake is nominally worth $200,000. | |
| • | In June 2015 the company has run into serious problems and in order to stay afloat it raises $1 million at a valuation of only $2 million (the “down round”). Jane now owns only 0.89% of the company and her stake is worth only $26,660. |
If you are making an investment expecting to own a certain percentage of the company or expecting each share to hold a certain amount of value, it’s important to realize how the value of those shares can decrease by actions taken by the company. Dilution can make drastic changes to the value of each share, ownership percentage, voting control, and earnings per share. In some cases, dilution can also completely wipe out the value of investments made by early investors, without any person being at fault.
Investors should understand how dilution works and the availability of anti-dilution protection.
Dilution Protection for Other Shareholders
Previous investors have protection from dilution that does not apply to investors in this offering. Significant Holders are granted a right of first refusal in Section 4 of the WayBetter, Inc. Investors’ Rights Agreement dated October 2015, as a form of protection from dilution. We grant “Significant Holders,” or those who own at least 250,000 outstanding shares of the company, prior to the Series B Preferred offering, the right of first refusal to purchase shares in new securities we may propose to sell after the date of that agreement. When we propose to undertake an issuance of new securities, such as the Series B Preferred Shares in this offering, we must give each Significant Holder written notice describing the type of new security, the price and the general terms. Each Significant Holder will have ten days after the notice is mailed or delivered to agree to purchase their pro rata share of the new securities. If a Significant Holder does not exercise their right of first refusal within the ten-day period, we have ninety days to sell or enter into an agreement to sell that portion of new securities. The right of first refusal in the agreement will end if we make an initial public offering.
22
USE OF PROCEEDS TO ISSUER
The net proceeds of this offering to the company, after expenses of the offering (payment to the placement agent for its services, professional fees and printing) will depend on the final commission paid to North Capital Private Securities.
Assuming proceeds of $7 million are raised, resulting in net proceeds of $6.475 million, the company plans to use these proceeds as follows:
| • | Approximately $2.0 million for general operating expenses, including salaries, overhead (rent), capital expenditure (computers and office furniture). | |
| ||
| • | Approximately $1.25 million for hiring additional team members, and transitioning away from reliance on contractors. | |
| ||
| • | Approximately $1.5 million for developing and launching new products, including StepBet, SleepBet, CardioBet, and CigaBet. | |
| ||
| • | Approximately $0.75 million for international expansion, including developing and expanding our strategic partnership with a large Chinese weight-loss company, China Showyu Healthy Group Limited. | |
| ||
| • | Approximately $0.5 million in marketing and advertising, including direct marketing efforts, joint marketing efforts, brand awareness campaigns and other public relations activities. |
Approximately $0.475 million, or 7% of the net proceeds, would not be allocated for any particular purpose under this assumption.
If the maximum offering size of $20 million were raised, we would have $18.5 million in net proceeds. The amount not allocated for any particular purpose would be approximately $4.625 million, or 25% of the net proceeds.
Because the offering is a “best efforts” offering with a minimum offering size of $3 million, WayBetter may close the offering without sufficient funds for all the intended purposes set out above. If the offering size is $3 million, then the company estimates that the net proceeds to WayBetter will be $2.775 million and WayBetter will make the following adjustments to the above uses of proceeds:
| • | Approximately $0.775 million for general operating expenses, including salaries, overhead (rent), capital expenditure (computers and office furniture). |
23
| • | The remaining approximately $2.0 million will be used as follows: 30% for hiring additional team members; 35% for developing and launching new products; 15% for international expansion, and 20% for marketing and advertising. |
The company reserves the right to change the above use of proceeds if management believes it is in the best interests of the company.
24
OUR BUSINESS
Overview
We were founded in 2010, as DietBet, Inc. with the goal of developing a social game to help people lose weight. On August 13, 2014, we filed an Amended and Restated Certificate of Incorporation changing our name from DietBet, Inc. to WayBetter, Inc., to reflect a broader mission of using gamification, social support, and financial incentives to help people adopt a range of healthy behaviors, such as exercising more, quitting smoking, managing stress, sleeping better, breaking addictions, learning new skills and languages, etc. We are currently operational, and producing revenues, but have not yet realized steady profits.
Principal Products and Services
Our primary product is a social weight-loss game called DietBet which currently exists in three formats:
| • | the DietBet Kickstarter is a 4-week game in which players commit to lose 4% of their weight in 4 weeks; | |
| • | the DietBet Transformer is a 6-month game in which players commit to lose 10% of their weight in 6 months; and | |
| • | the DietBet Maintainer is a 12-month game in which players commit to maintain their weight within a predefined range (currently +1% to -10%) for a year. |
Players can sign up for whichever game they wish to play, or multiple games at the same time. The games are offered via iOS and Android apps and via web browsers. Players then pay the amount set for that game in the form of a commitment contract. At the start and at certain points in the game, players verify their starting weights with our Referees using a weigh-in protocol that entails taking and submitting photos of themselves weighing in. The commitments from all the players are pooled in the pot. Players who meet their goals without getting disqualified end up splitting the pot, less our commission (normally between 10% and 25% of the pot). We convert winnings into WayBetter Points, which can be redeemed by the players for cash (normally via Paypal). Points, however, expire without reimbursement pursuant to our Terms of Use after 12 months if an account remains inactive during that period. We expect to parlay our experience and momentum with DietBet into other areas of healthy behaviors. For example, in 2015 we started alpha testing a new game, StepBet, with 300 players. StepBet is designed to motivate players to walk more by competing with step data from Fitbit and other step trackers. It is slated for beta testing with the public in 2016.
We plan to launch other new products in order to expand into other areas of healthy behavior and lifestyle change, such as CigaBet (to quit smoking), SleepBet (to improve sleep), and CardioBet (to exercise more), among others.
25
How DietBet works
We currently offer three formats of DietBet games. Our most popular is the Kickstarter, in which players commit to lose 4% of their starting weight in four weeks. We first launched the Kickstarter in 2012 as an invite-only beta test. In all of 2012 we had a 9,689 Kickstarters players. In January of 2013, after a year of testing and iterating, we officially launched the Kickstarter to the public. On January 4, 2013 our CEO was a guest on The Today Show and we signed up 11,239 paying Kickstarter players in January alone-more than the entire previous year. In 2013, we ended up having a total of 135,896 Kickstarter players. In 2014, building on this momentum, we had 190,942Kickstarter players, up 40.5% over 2013.This game has now facilitated meaningful weight loss for thousands of players. On average, winners in our Kickstarter games lose 9.3 pounds a month.
As we grew, we started getting requests from our users for a longer-term game with larger, but more gradual, weight loss goals. In response to this demand, in November 2013, we launched a six-month game called the Transformer. In this format, players commit to lose 10% of their weight in six months, with monthly milestones (and rewards) along the way. As of March 31, 2015,of the 39,497 players who had started a Transformer game, 25% had reached the 10% goal. These winners lost, on average, 24.6 pounds in a span of six months.
With thousands of our players having reached healthy body-mass indexes (BMIs), we have been receiving increasing requests for a new kind of game tokeep off the weight. To address this pent-up demand, we introduced another game format, The Maintainer,which challenges players tomaintain their weight overt he following year (within a range of +1% and -10%), with monthly weigh-ins and rewards. We launched it as a beta test in September 2015 with a first cohort of 299 players. That beta test is ongoing.
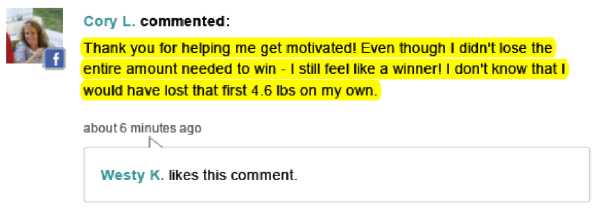
Our players are motivated by different factors. Some join with the primary motivation of winning money and competing but discover over time that they social bonds they make with their fellow “dietbetters” becomes the most sustainable aspect of the motivation. Here are some examples of interactions in our games (highlighting added by us):
26

27

28

How We Make Money and Verify Weights
At the end of our games, all the players who have reached the predefined goal, as verified by our Referees, split the pot evenly, after our cut. We make money by keeping a percentage of the pot as an administrative fee. This is normally from 10% to 25%; if all the players in a game reach their goal, we will forgo our cut in order to ensure that the winners get 100% of their deposit back. We call this our No-Lose Guarantee.
29
We verify starting and ending weights by having players submit photographic documentation of their weigh-ins to our team of Referees. Our “Refs” review these photos for compliance with our weigh-in guidelines (which include specific rules about what to wear and require a “weigh-in word,” written on a piece of paper, to appear in the photo, which serves as a timestamp).

Our Referees are all former DietBet players. In addition to overseeing our weigh-ins, they also handle customer service. We work hard to attain a high standard of quality and promptness in reviewing all weigh-in photos and in responding to customer service matters. We currently have 10 Refs who have, since our inception, reviewed 6.5 million weigh-in photos.
Our Refs are currently all based in North America and we consider them an integral part of our business, not just a machine for rote review of weigh-in photos. They play a key role in helping us to improve our products by relaying user feedback to our developers and game designers, identifying bugs and feature suggestions from players, and providing valuable player feedback. In their spare time, they also send personalized “Milestone” notes to players congratulating them on their weight-loss accomplishments.
30
We also use proprietary algorithms to help maintain the integrity of our games. Our algorithms are designed to detect suspicious activity and in some cases we require players to submit video documentation of their weigh-in instead of photos. We are continually updating and improving our algorithms to detect and prevent cheating.
You cannot play in a DietBet without putting money in the pot in the form of a commitment contract. As a result, we have generated revenue from nearly all our players since we launched. We also sell virtual products, the most popular being a $20 package of Weigh-In Tokens that lets players in our long-term games weigh-in regularly with our Referees to help them stay on track.
We anticipate that future revenue streams will continue to come from new products such as StepBet, selling advertising and sponsorships, selling curated products from our own store, and selling subscriptions to premium coaching services.
Our Most Valuable Asset: Our Community of Players
Through our game design we encourage healthy, gradual weight loss. For starters, we do this by not giving extra credit for losing the most weight, or for losing weight the fastest. Indeed, we disqualify players if they lose too much weight in a game (more than 3 times the goal amount). We also do not allow players to enter our games if their body-mass index, or BMI, is below 18.5 (considered underweight by the National Institues of Health) or if their BMI would be required to drop below 18.5 in order to reach their target. We offer money-back guarantees during the start of our games to let players try it out with no risk. We also have compassionate policies that allow players to drop out in certain cases when there is a medical necessity (such as a pregnancy).
Our users are core to our success, not just because we generate revenue from them. Our customers also volunteer to test our new products (when we have a new idea to test, we announce it in our games and get hundreds or sometimes thousands of applications for testers). They lead and host games as organizers and in the process invite their friends. They give us valuable feedback about bugs and new features. They even sometimeswork for us as we hire Referees from our player pool (we normally recruit Referees by posting job openings in our games). And they serve as testimonials: we feature over 150 players and their dramatic success stories on our home page. In addition, players who have lost weight with DietBet often become walking advertisements for DietBet as their friends and co-workers approach them to ask how they lost the weight. Many also blog and post on social media about their experiences with DietBet. This can lead to a positive feedback loop where the health and happiness of our players fuels the growth of our business.
31

To leverage the powerful network effects and collective wisdom of our community, we ask our players to complete a survey at the end of their games explaining how they lost the weight. We partnered with a team at Brown Medical School, led by Dr. Tricia Leahey, an obesity expert, to design this survey and analyze the data. (We have data from over 12,000 players to date). Our goal with this data collection is to create an objective and empirical data set on the efficacy and popularity of various diets, commercial weight-loss programs, apps, and devices. We call this The DietBetter Report and we plan to publish our findings in the future.
In addition, Dr. Leahey published a paper about the efficacy of DietBet in the Journal of Medical Internet Research: Serious Games,DietBet: A Web-Based Program that Uses Social Gaming and Financial Incentives to Promote Weight Loss. We also applied with Dr. Leahey for two NIH research grants to run randomized trials to assess our social approach to weight loss with scientific rigor. Those applications are pending.
Market
We believe the current market for our primary product, DietBet, is large. There are 108 million Americans who go on 4 to 5 diets a year, according to MarketData Enterprises. Americans spend over $60 billion annually on weight loss products and services and, according to MarketData, 83% of dieters prefer “do-it-yourself” solutions.
We believe that as we expand our services beyond weight loss to healthy lifestyle products like StepBet, we will be expanding our target audience to include people of healthy BMIs who want to be more active and use “wearables”, i.e. activity-tracking devices. The worldwide market for wearable devices is set to grow 238%, from 15.4 million units shipped in 2014 to over50 million in 2019, according to the International Data Corp. (IDC). In 2014, shipments of wearable devices more than tripled compared to the prior year, reaching a total of 21 million units. IDC expects the market for wearable devices will reach 114 million units shipped in 2018, representing a $33.7 billion worldwide revenue opportunity. IDC also reports that consumer spending on the wearable devices market is growing faster than on any segment in the global consumer electronics market. The potential growth of this market represents an opportunity for us as we plan to roll out new games in which players with these devices and sensors can compete to walk and exercise more, sleep better, etc.
32
In addition, we plan to expand internationally. According to the World Health Organization, 1.9 billion adults in the world are overweight and most of the world's population now lives in countries where overweight and obesity conditions kill more people than underweight conditions (all high-income and most middle-income countries). Over 10% of DietBet players are outside the United States and we believe there is a growing market for DietBet internationally. To this end, we recently signed a Memorandum of Understanding with a large weight-loss company in China, China Showyu Healthy Group Limited, to partner exclusively on developing the market in China. Showyu also made an equity investment in WayBetter.
Marketing/Distribution Channels
To attract players for our games, we offer a marketplace of DietBet games, where anyone with access to the Internet can find an assortment of DietBet games starting soon.
To lead these games and promote our brand, we have worked with over 200 health and wellness influencers as “game hosts”. This includes celebrities as well as a long-tail of bloggers, social media influencers, and authors. Celebrities include Jillian Michaels (former star of NBC’s The Biggest Loser television show), Chris and Heidi Powell (stars of ABC’s Extreme Weight Loss), Tim Ferriss (author), Tony Horton (star of P90X workout videos), and LailaAli (former boxer and the daughter of Muhammad Ali). Our largest Kickstarter game to date was hosted by the Powells in January 2015 with over 12,000 players and a pot of over $360,000.

In our hosted games we typically split our cut of the pot with the game host, thus giving our host-partner a financial incentive to lead large games with their fans. By enabling influencers to monetize their audiences, and to interact with their fans in an engaging way, we strive to foster partnerships that work sustain ably for our game hosts and us. Most hosts lead multiple games.
In addition, we allow our players to set up and organize their own games among friends and coworkers. In these organic games we do not normally share our cut with the game’s organizer and therefore our margins in these games are higher than in games with professional hosts.
We have also worked with magazines and other health and wellness brands like Fitness, Shape, Withings, and RunKeeper to lead games with their readers and customers. We also work with charities to host games as fund raisers, where a percentage of the pot can beset aside for the charity. In the case of charities, we will often reduce our cut to facilitate more of the pot going to the charity. We also let players in any game lose weight for a cause they support by pledging a percentage of their winnings to the charity of their choice.
33
New users are increasingly coming to us via word-of-mouth as players who have had positive experiences tell their friends about DietBet. We have also received press coverage in The Wall Street Journal, The New York Times, US Weekly, CNN, and on ABC News and The Today Show, in addition to other media outlets around the world.
We believe advertising can become a source of growth in the future, however, and we intend to increase our investment in marketing to boost brand awareness and new user acquisition in the future. We have been steadily increasing the lifetime value of each player as we launch new longer game formats that serve to retain customers for longer periods of time. An increase in lifetime value could make advertising a more cost-effective channel for us going forward.
Competition
We have competitors for our primary product, DietBet. Competitors include HealthyWage, Stickk, Pact, MyFitnessPal, Noom, LoseIt, Weight Watchers, and SparkPeople, among others. As we expand into other areas of healthy behaviors and lifestyle (beyond weight loss), we may also compete with other health and fitness companies that have communities, applications, and products to help motivate people to live healthier lives. Some competitors include FitBit, Nike, Under Armour (with its recent acquisitions of MyFitnessPal and MapMyRun), RunKeeper, Strava, Azumio, among others.
Pact, Stickk, and HealthyWage all promote commitment contracts as a way to increase your motivation and willpower. However, of these Pact does not currently offer a product specifically targeting weight loss. And none of these companies has comparable partnerships with large numbers of health and wellness influencers, an asset which we have spent years developing and cultivating.
Weight Watchers and SparkPeople both feature strong components of community support, but neither emphasizes gamification, competition, or financial incentives. In addition, Weight Watchers meetings are normally held offline, in places like church basements, schools, and in Weight Watchers’ shops. We believe such physical meetings do not appeal as much to younger consumers who are looking for more convenient, mobile solutions.
Certain other companies, such as MyFitnessPal, LoseIt, and Noom, offer sophisticated activity and nutrition tracking functionality but little by way of gamification and no financial incentives.
In addition, we may start to compete more with companies in the corporate wellness market. Such competitors include Stickk, Limeade, Keas, Rally, Retrofit, Wellcoin, Rise, and ShapeUp, among others. To penetrate the corporate wellness market we may seek partnerships with some or all of these companies rather than being direct competitors.
34
There are, of course, thousands of other companies in the highly fragmented weight-loss, fitness, and wellness space. While we would not consider most to be direct competitors, we do compete with them for mind share and share-of-wallet. Fortunately for all of the players, this is a large and fragmented space that can, and does already, support a diverse ecosystem of competing and complementary products and services. Consumers tend to try lots of approaches: gyms, commercial weight-loss programs, wearables, diet books, personal trainers and coaches, nutraceuticals, meal replacements, and apps and online tools. We believe the consumer appetite to try lots of solutions can work in our favor as a new entrant, especially if we can deliver a sustainable and efficacious solution for many of them.
Customers
To date we have had over 300,000 paying consumers who have registered a total of more than 3 million pounds lost with us. 10% of our users are outside the United States and we plan to invest in international growth. 15% of DietBet users are men, which is par for the industry and our average customer is 36 years old. The average starting weight is 236 pounds for our male users and 192 pounds for our female users.
We see a surge of customers every January, as people set their resolutions for the new year. We also see seasonal peaks in the spring as people want to get in shape for the summer and again in September and October as people return from their summer vacations. We also experience troughs during the summer and from Thanksgiving to Christmas as consumers tend focus on things other than weight loss. We believe that some of our new products, particularly StepBet, may balance out this seasonality as consumers (in the Northern Hemisphere) walk more during the warmer summer months.
Suppliers
We currently rely heavily on Paypal and credit card processors to collect payments, and we rely on PayPal to handle payouts to customers at the end of the games. We also work with several dozen vendors to provide various services, from sending out emails to customers with Mandrill, to managing business development leads with Sales force, to monitoring our servers 24/7 for outages with Pingdom, to tools that let us track and manage customer service requests like UserVoice. Whenever possible, we seek solutions that make it cheaper and faster for us to design, deploy, and maintain our products while we focus on growing our business.
Research and Development
We have invested $1,096,538 in research and development, and in new product development.
35
Employees
We currently have eight full-time employees and one part-time employee. We also currently work with over 20 contractors around the world, including technical teams in Moldova and India. As we grow, we plan to develop more technical expertise in-house and gradually reduce our reliance on technical contractors as we hire more engineers and migrate key technical functions in-house.
Intellectual Property
We have trademarks in the United States for DietBet and DietBetter and pending trademarks for WayBetter and The WayBetter Way. We own over 100 URLs that relate to our current and prospective products. We do not own any patents.
Litigation
We are not involved in any litigation.
THE COMPANY’S PROPERTY
We do not own any real estate or significant assets.
36
MANAGEMENT’S DISCUSSION AND ANALYSIS OF FINANCIAL CONDITION AND RESULTS OF OPERATIONS
Results of Operations
The sum of all monies paid by players to enter the various games (e.g. DietBet, StepBet) plus all monies paid to purchase virtual goods is defined as Gross Transaction Volume, or “GTV”. In essence GTV represents the total dollars transacted by customers on the WayBetter platform. GTV is a non-GAAP measurement which differs from the presentation of net revenues in the financial statements. The company’s net revenue refers to the sum of commissions retained by the company. The company’s commission ranges from 10-25% depending on the dollar amount of the commitment. For the vast majority of DietBet games, the company’s commission is 25%.
Other revenue includes the sale of virtual goods to players in DietBet games; the most common example of virtual goods is weigh-in tokens, which are offered to players in long-term DietBet games who are looking for weekly accountability
The company recognizes revenue according to the following guidelines:
| • | For games with a duration of 1 month or less, revenue is recognized at the conclusion of the game. | |
| • | For games with a duration over 1 month, revenue is estimated monthly over the course of the game. At the conclusion of the game, revenue is adjusted as necessary. | |
| • | Revenue from the sale of virtual goods is recognized at the time the virtual good is redeemed or when it expires. |
Pursuant to changes to the company's Terms of Use implemented in September 2015, we anticipate some number of WayBetter Points to expire and be forfeited starting in September 2016 by customers with WayBetter accounts that have been inactive for twelve months. If and when this happens, the company may be able to recognize as revenue some or all of the forfeited points at a rate of 1 point = $1.00. Because this is a new policy, the company has not estimated the amount of any potential incremental revenue from forfeited points.
GTV for the year ended December 31, 2014 (“FY 2014”) was $8,626,197, a 108% increase from GTV of $4,142,192 in FY 2013. The main driver of the GTV increase from FY 2013 was the increase in the company’s customer base. GTV for the six months ended June 2015 (“Interim 2015”) was $6,453,888.
The company’s net revenue for FY 2014 was $2,047,873, a 194% increase from $695,553 in 2013. The company’s net revenue for Interim 2015 was $1,560,979.
Cost of revenues consists of financial transaction costs, “affiliate” payments to partners who host DietBet games, the cost of prizes given away during games and data hosting fees. Cost of revenues were $978,045 in FY 2014, compared to $439,042 in FY 2013, resulting in gross margins of 52.2% and 36.9%, respectively. The improvement in gross margin was due to changes in the company’s commission structure implemented in 2013. Cost of revenues in Interim 2015 was $735,870, resulting in gross margin of 52.9%.
37
The company’s operating expenses consist of payroll, technology, sales and marketing, professional services (including contracted service providers), and general and administrative costs including rent. Operating expenses in FY 2014 amounted to $1,667,178, a 40% increase from $1,190,401 from FY 2013. The primary components of the increase from FY 2013 to FY 2014 were:
| • | a 53% increase in general and administrative expenses, including rent and insurance; | |
| • | a 245% increase in professional fees as the company utilized many more contracted service providers; and | |
| • | a 60% increase in compensation and benefits. |
For the period from January to June 2015, the operating expenses were $1,349,580. The primary components of these 2015 interim operating expenses were:
| • | $713,175 in compensation and benefits; | |
| • | $189,748 in sales and marketing; and | |
| • | $186,834 in general and administrative expenses. |
Depreciation charges included in general and administrative expenses for the six months ending June 30, 2015 amount to $2,994, and for the years ending December 31, 2014 and 2013 amounted to $2,879 and none, respectively.
Amortization charges for software development costs included in general and administrative expenses for the years ending December 31, 2014 and 2013 amounted to $33,036 and $33,036 respectively, and for Interim 2015 amounted to $2,753. The decrease is due to software development costs becoming fully amortized in 2015.
Sales and marketing totaled $253,531 and $209,294 for the years ended December 31, 2014 and 2013, respectively, and were $189,748 for Interim 2015. The increase is due to the company’s expanded efforts to attract and acquire new customers through various channels.
Our current operations focus on attracting as many players as possible to our games. Aside from overhead, the primary expense in the near future will be on payments to social media influencers to drive players into games. The company has also been testing other channels for player acquisition, including online advertising. Currently the company spends less than $10,000 a month on online advertising (mostly on Facebook and Google). Online advertising is iterative and as the company optimizes its efforts (to lower the cost of customer acquisition while at the same time increasing the annual revenue per customer), online advertising could ramp up quickly. If online advertising becomes cost-effective and profitable, the company’s investment in online advertising could outstrip that of affiliate marketing efforts to influencers. The company expects to spend at least $25,000 on online advertising over approximately the next six months.
38
Assuming continued increases in payroll and future transaction size consistent with historical transaction, we anticipate that revenues will support the operations of the company when the company has approximately 100,000 monthly active paying users of our various products. Currently the number of monthly active paying users ranges between approximately 25,000 and 50,000, depending on the time of year.
Liquidity and Capital Resources
The company has not generated profits since inception, and sustained a net loss of $609,448 in FY 2014, a decrease from the net loss of $978,184 in FY 2013. The company’s net loss for Interim 2015 was $522,579. The company has, as of June 30, 2015, $4,885,092 cash on hand. The company has recorded losses from operations from the time of inception in the total amount of $3,607,194, as of June 30, 2015.
The company’s operations have been financed to date by a combination of revenue and investment capital. The company was initially capitalized by equity investments from its shareholders in the amount of $1,109,019 when the company issued common and Series Seed Preferred Stock. In 2012 and 2013, the Company issued $908,000 of convertible notes which were subsequently converted into Series Seed Preferred Stock. In 2014, the Company issued Series A Preferred Stock, which generated $2,774,060. In October 2015, the Company issued Series A-1 Preferred Stock, which raised $433,411.
The company has not committed to make any capital expenditures. The company has no bank lines.
As listed on the balance sheet in the liabilities section, Customer Deposits include earnings from previous game winnings that are held in deposit with the company, as well as amounts from current games estimated to be paid out by the company to winners of those current games. In certain instances, the amount accumulated and estimated in the customer deposit accounts may exceed the available cash. See “Risk Factors – We may not have enough cash on hand to redeem players’ winnings.”
Trend Information
From 2012 through 2015, the company’s sole product has been DietBet games in the various formats available. Beginning in 2016, we plan to expand into other areas of healthy behavior and lifestyle change. Examples include StepBet (to exercise more), CigaBet (to quit smoking), and SleepBet (to get more sleep). As the company introduces more products, we believe we will reach a larger market. In addition, we plan to expand in China with our partnership with China Showyu Healthy Group Limited.
39
DIRECTORS, EXECUTIVE OFFICERS AND SIGNIFICANT EMPLOYEES
| Name | Position | Age | Term of Office |
| Executive Officers: | |||
| James Rosen | CEO and Founder | 45 | Appointed to indefinite term of office, July 22, 2010 |
| Matt Daniel | Vice President of Business Development | 46 | Appointed to indefinite term of office, November2013 |
| Alison Weick | Vice President of Brand Marketing | 40 | Appointed to indefinite term of office, January, 2014 |
| Sean Conrad | Vice President of Growth | 40 | Appointed to indefinite term of office, February 2015 |
| Directors | |||
| James Rosen | Chairman | 45 | Appointed to indefinite term of office, July 22, 2010 |
| Randy Nicolau | Director | 45 | Appointed to indefinite term of office, November 18, 2011 |
| Patrick George | Director | 43 | Appointed to indefinite term of office, November 18, 2011 |
James Rosen, Founder and Chief Executive Officer
Jamie Rosen is WayBetter’s founder and Chief Executive Officer. He has served in this position since he incorporated the company as DietBet, Inc. in July 2010. Jamie came up with the idea for DietBet after seeing friends competing in an office weight loss pool. Jamie has more than 20 years of experience as an inventor and entrepreneur and10 pending and/or issued US patents. In 2007, he sold several of his pending patents to Yahoo! He dropped out of Harvard Business School to launch his first internet company, Comet Systems, which was acquired in 2004 for $33.5 million. At Comet, Jamie was co-Founder and President and led new product innovation, fundraising, and business development. He has an A.B. with honors from Harvard College and was a Lemelson Fellow in Innovation, Invention, and Creativity at Hampshire College.
40
Matthew Daniel, Vice President of Business Development
Matt Daniel is one of the company’s initial team members and is currently serving as the company’s VP, Business Development and Operations. Matt has been with the company since February 2012 and has been leading the Business Development and Operations functions since that time. Matt started as a consultant and joined as a full-time employee in November 2013. Prior to joining WayBetter, Matt spent four years in Business Development and six years running operations for Town Sports International, a $500 million publicly traded health club operator. Earlier in his career Matt spent four years in management consulting with Andersen Consulting. Matt holds an MBA from the Kellogg Graduate School of Management and a B.S. in systems engineering from the University of Virginia.
Alison Weick, Vice President of Brand Marketing
Alison Weick is one of the company’s initial team members and is currently serving as the company’s VP, Brand Marketing. She has been with the company since August 2011 in various roles. She first joined as a consultant based on her previous work experience in the weight loss industry. Upon joining WayBetter full-time in January 2014, she served as the VP, Product Development until she shifted into her current marketing role in June 2015. Most notably she worked at Weight Watchers in product development and e-commerce from May 2006 to February 2010. In that role she was a brand manager for all Weight Watchers consumer products sold in meeting rooms and online (a $150 million line of business). She holds a B.S. in Applied Economics from Cornell University and an MBA from Harvard Business School.
Sean Conrad, Vice President of Growth
Sean T. Conrad is currently the VP of Growth, responsible for Marketing and Analytics. He joined Waybetter in February 2015. Prior to that, he had been the Head of Product for four years at Mindspark, Inc., a division of IAC. As Head of Product, he oversaw the product road map and creation of over 100 direct marketing desktop, mobile, and browser extension applications. Sean holds a B.S. in Biology from the Penn State University and a M.S. in Information Science from the University of Pittsburgh. He began his career as a programmer for Comet Systems, where he worked with Rosen and Daniel.
Patrick George, Director
Patrick George is a member of our Board of Directors. He is Chief Investment Officer of Halstatt, LLC, and has been in this position since June 2009. He is responsible for managing the financial assets of a large family office based in Naples, FL, where he oversees investments across a wide variety of asset classes, including public and private equities, fixed income, commodities, hedge funds and various other alternative investments. Since January 2011, he is also a partner of Halstatt Real Estate Partners, a real estate private equity firm developed and sponsored by Halstatt, which targets investments in commercial and residential real estate primarily located in South Florida. Mr. George received an undergraduate degree, with honors, from Harvard College where he concentrated in Economics. In addition, he holds an MBA from Harvard Business School, where he studied with Rosen.
41
Randy Nicolau, Director
Randy Nicolau is a member of our Board of Directors. Since December 2011, he is the CEO and Chairman of Poppin, where he is responsible for setting the strategic vision, raising capital, and overseeing operations of the company. Before Poppin, Randy founded Demdex, the first online Data Management Platform (DMP), in 2008. He served as CEO, where he was responsible for operations and growth. The company was acquired by Adobe Systems (NYSE: ADBE) in January 2011. Randy graduated from Harvard University in 1992, where he studied with Rosen.
42
COMPENSATION OF DIRECTORS AND EXECUTIVE OFFICERS
For the fiscal years ended December, 2010, 2011, 2012, 2013 and 2014, we compensated our three highest-paid directors and executive officers as follows:
| Name | Capacities in which compensation was received | 2010 Cash compensation | 2011 Cash Compensation | 2012 Cash Compensation | 2013 Cash Compensation | 2014 Cash Compensation |
| James Rosen | CEO | $12,500 | $117,500 | $148,500 | $135,000 | $224,500, of which $79,250 is back due pay for services rendered in 2012 and 2013 |
| Alison Weick | VP of Brand Marketing | N/A | N/A | $93,369 | $120,023 | $219,583, of which $74,375 is back due pay for services rendered in 2012 and 2013 |
| Matt Daniel | VP of Business Development | N/A | N/A | $71,634 | $127,500 | $219,583, of which $74,375 is back due pay for services rendered in 2012 and 2013 |
Other than cash compensation and stock options, no other compensation was provided.
43
The compensation for James Rosen, Matt Daniel, and Alison Weick was negotiated based on market rates and salary history. In addition, James Rosen, Matt Daniel and Alison Weick each have non-qualified options approximately 0.3%, 2.8% and 2.7% of the company’s fully-diluted stock based on a standard vesting basis four years from the date of grant, with a one year cliff.
James Rosen also received two relocation loans; see “Interest of Management and Others in Certain Transactions.”
For the fiscal year ended December, 2014, our directors did not receive any compensation.
44
SECURITY OWNERSHIP OF MANAGEMENT AND CERTAIN SECURITYHOLDERS
The following table sets out, as of October 20, 2015, our voting securities that are owned by executive officers and directors, and other persons holding more than 10% of our voting securities, or having the right to acquire those securities.
| Title of class | Name and address of beneficial owner | Amount and nature of beneficial ownership | Amount and nature of beneficial ownership acquirable | Percent of class |
| Common Stock | James Samuel Rosen c/o WayBetter, Inc. 205 East 42nd Street, 17th Floor, New York, NY 10017 | 8,900,000 shares, of which 4,450,000 shares are, directly owned, 4,450,000 shares held by Mariana Gomez- Pimienta, his spouse (same address) | 88,889 stock options | 88.14% |
| Common Stock | Ninth Avenue South Investments III, LLC, 2640 Golden Gate Parkway #105, Naples FL34105 | 0 shares of common stock | 2,955,021 shares, of which 2,655,021 shares are convertible from Preferred Stock, 200,000 are Warrants for Common Stock, 100,000 are Warrants for Series A Preferred Stock | 22.6% |
| Common Stock | All Executive Officers and Directors as a Group (including Mr. Rosen) | 9,010,000 shares, direct ownership (including 4,450,000 shares held by Ms. Gomez- Pimienta) | 1,675,900 stock options and 92,592 shares are convertible from Preferred Stock | 90.74% |
45
| Preferred Stock | Ninth Avenue South Investments III, LLC, 2640 Golden Gate Parkway #105, Naples FL34105 | 2,655,021 shares, direct ownership | 100,000 Series A Preferred Warrants | 16.74% |
| Preferred Stock | All Executive Officers and Directors as a Group | 92,592 shares, direct ownership | N/A | 0.67% |
The final column (Percent of Class) includes a calculation of the amount the person owns now, plus the amount that person is entitled to acquire. That amount is then shown as a percentage of the outstanding amount of securities in that class if no other person exercised their rights to acquire those securities. The result is a calculation of the maximum amount that person could ever own based on their current and acquirable ownership, which is why the amounts in this column may not add up to 100% for each class.
46
INTEREST OF MANGEMENT AND OTHERS IN CERTAIN TRANSACTIONS
In September 2014, we issued a $150,000 relocation loan to James Rosen, the founding shareholder and CEO, who relocated with his family from Mexico City to New York. The note bears interest of 1.89% per annum and matures on September 1, 2021. No payments are required on the note until maturity when all principal and unpaid interest come due, though the note can be pre-paid at any time without penalty. The note is collateralized by 1,351,108 shares of Common Stock held by James Rosen.
In September 2015, we issued a second $100,000 relocation loan to Rosen. The note bears interest of 1.89% per annum and matures on September 16, 2022. No payments are required on the note until maturity when all principal and unpaid interest come due, though the note can be pre-paid at any time without penalty. The note is collateralized by 900,739 shares of Common Stock held by James Rosen.
Patrick George, one of our directors, is also an officer, director or partner in Ninth Avenue South Investment III, LLC, whose investments are reflected in “Security Ownership of Management and Certain Security holders.”
47
SECURITIES BEING OFFERED
General
We are offering Series B Preferred Stock to investors in this offering.
The following description summarizes important terms of our capital stock. This summary does not purport to be complete and is qualified in its entirety by the provisions of the [Second]Amended and Restated Certificate of Incorporation (to be filed in an amendment to this Offering Circular) and our Bylaws, copies of which have been filed as Exhibits to the Offering Statement of which this Offering Circular is a part. For a complete description of WayBetter, Inc.’s capital stock, you should refer to its [Second]Amended and Restated Certificate of Incorporation and Bylaws, and applicable provisions of the Delaware General Corporation Law.
Immediately following the completion of this offering, our authorized capital stock will consist of [_______] shares of Common Stock, $0.001 par value per share, and 36,002,546 shares of Preferred Stock, $0.001par value per share, of which 20,000,000 shares are designated as Series B Preferred Stock, 2,684,925 shares designated as Series A-1 Preferred Stock at $0.7449 per share, 6,030,306 designated as Series A Preferred Stock, and 7,287,315 designated as Series Seed Preferred Stock.
As of October 20, 2015, the outstanding shares of WayBetter, Inc. included: 10,110,000 shares of Common Stock, 7,287,315 shares of Series Seed Preferred Stock, 5,830,306 shares of Series A Preferred Stock, and 581,838 shares of Series A-1 Preferred Stock.
Common Stock
Dividend Rights
Subject to preferences that may be applicable to any then outstanding preferred stock, holders of our common stock are entitled to receive dividends, if any, as may be declared from time to time by the board of directors out of legally available funds. We have never declared or paid cash dividends on any of our capital stock and currently do not anticipate paying any cash dividends after this offering or in the foreseeable future.
Voting Rights
Holders of our common stock are entitled to vote on all matters submitted to a vote of the stockholders, including the election of directors.
Right to Receive Liquidation Distributions
In the event of our liquidation, dissolution, or winding up, holders of common stock will be entitled to share ratably in the net assets legally available for distribution to stockholders after the payment of all our debts and other liabilities and the satisfaction of any liquidation preference granted to the holders of any then outstanding shares of preferred stock.
48
Rights and Preferences
The rights, preferences and privileges of the holders of the company’s common stock are subject to and may be adversely affected by, the rights of the holders of shares of any series of our Preferred Stock and any additional classes of preferred stock that we may designate in the future.
Series Seed Preferred Stock, Series A Preferred Stock and Series A-1 Preferred Stock
Dividend Rights
Holders of our Series Seed, Series A and Series A-1 Preferred Stock are entitled to receive dividends, if any, as may be declared from time to time by the board of directors out of legally available funds. We have never declared or paid cash dividends on any of our capital stock and currently do not anticipate paying any cash dividends after this offering or in the foreseeable future.
The dividend rate is an annual rate of $0.0216 per share for Series Seed Preferred Stock, $0.0384 per share for Series A Preferred Stock and $0.0596 per share for Series A-1 Preferred Stock, subject to adjustment from time to time. No dividend distributions may be made to our Series Seed Preferred Stock or Common Stock unless dividends on the Series A-1 Preferred Stock and Series A Preferred Stock have been declared and paid, or set aside for payment.
Voting Rights
The Series Seed Preferred Stock, Series A Preferred Stock, and Series A-1 Preferred Stock generally vote as a single class on an as-converted basis. The conversion price of preferred to common is $0.27 per share for the Series Seed Preferred Stock, $0.4758 per share for the Series A Preferred Stock, and $0.7449 per share for the Series A-1 Preferred Stock, subject to adjustment from time to time.
Right to Receive Liquidation Distributions
In the event of our liquidation, dissolution, or winding up, holders of our Series A-1 Preferred Stock and Series A Preferred Stock will be entitled to receive, prior and in preference to the holders of Series Seed Preferred Stock and the Common Stock, and all Preferred Stock will be entitled to receive, prior and in preference to holders of Common Stock, an amount per share equal to $0.27 per share for the Series Seed Preferred Stock and $0.4758 per share for the Series A Preferred Stock and $0.7449 per share for the Series A-1 Preferred Stock, subject to adjustment from time to time.
Rights and Preferences
Holders of our Preferred Stock may convert into Common Stock at a conversion price of Conversion price of $0.27 per share for Series Seed Preferred Stock, $0.4758 per share for Series A Preferred Stock and $0.7449 per share for Series A-1 Preferred Stock, subject to adjustments from time to time.
49
Holders of our Preferred Stock have rights of first refusal and right of co-sale. “Significant Holders,” or those who own at least 250,000 outstanding shares of the company, prior to the Series B Preferred offering, have the right of first refusal to purchase shares in new securities the company may propose to sell after the date of that agreement. The right of first refusal in the agreement will end if the company makes an initial public offering.
Holders of our Series A and Series A-1 Preferred Stock have preference over Series Seed Preferred Stock, and all Preferred Stock has preference over Common Stock.
Series B Preferred Stock
Dividend Rights
Series B Preferred Stock will receive dividends, in preference to the holders of common stock and any holders of Series A-1, Series A and Series Seed preferred stock, when and as dividends may be declared on common stock from time to time by the board of directors out of legally available funds.
Right to Receive Liquidation Distributions
In the event of any voluntary or involuntary liquidation, dissolution or winding up of the company’s affairs, a holder of Series B Preferred Stock will be entitled to be paid, before any distribution or payment may be made to any holders of Series A-1, Series A, Series Seed Preferred Stock, and Common Stock. If the assets of the company are insufficient to pay all holders of Preferred Stock, the amounts distributed will be reduced in proportion to the amounts they would be entitled.
Voting Rights
The Series B Preferred Stock have no voting rights except as required under law. The holders of Series B Preferred Stock are subject to drag-along provisions that provide that they will vote their shares in favor of a liquidation event or a change of control or other major corporate actions.
Rights and Preferences
The Series B Preferred Stock can be converted to Common Stock anytime at the option of the holder, subject to certain provisions. The Series B Preferred Stock have no preemptive, subscription or other rights, and there are no redemption or sinking fund provisions applicable to the Series B Preferred Stock. There is no restriction on the repurchase or redemption of shares by the company while there is any arrearage in the payment of dividends or sinking fund installments.
The Series B Preferred Stock is non-transferable, as such, the only exit for investors is if the company redeems the shares, is liquidated, goes public, or is acquired; a transfer by will or intestate succession; or any transfers approved in advance by the majority of the Board.
50
PLAN OF DISTRIBUTION AND SELLING SECURITYHOLDERS
Plan of Distribution
We are offering up to 20,000,000 shares of Series B Preferred Stock, as described in this offering circular. We have engaged North Capital Private Securities Corporation as our sole and exclusive placement agent to assist in the placement of our securities. This offering is being conducted on a “best-efforts” basis and North Capital Private Securities Corporation is under no obligation to purchase any securities or arrange for the sale of any specific number or dollar amount of securities.
Commissions and Discounts
The following table shows the total discounts and commissions payable to the placement agent in connection with this offering:
| Per | |||
| Share | |||
| Public offering price | $ | 1.00 | |
| Placement Agent commissions | |||
| Proceeds, before expenses, to the company |
Other Terms
Except as set forth above, we are not under any contractual obligation to engage North Capital Private Securities Corporation to provide any services to us after this offering, and have no present intent to do so. However, North Capital Private Securities Corporation may, among other things, introduce us to potential target businesses or assist us in raising additional capital, as needs may arise in the future. If North Capital Private Securities Corporation provides services to us after this offering, we may pay North Capital Private Securities Corporation fair and reasonable fees that would be determined at that time in an arm’s length negotiation; provided that no agreement will be entered into with North Capital Private Securities Corporation and no fees for such services will be paid to North Capital Private Securities Corporation prior to the date which is 90 days after the date this Offering Circular is qualified with the Commission, unless FINRA determines that such payment would not be deemed compensation in connection with this offering.
For a period of three years from the date of commencement of sales of the offering, we shall provide at least 30 days’ prior written notice of any proposed future Regulation A offering of our securities and therein shall provide SI Securities, LLC, in place of North Capital Private Securities Corporation, the opportunity to act as a placement agent for such offering on substantially the same terms.
North Capital Private Securities Corporation intends to use an online platform provided by SeedInvest Technology, LLC, at the domain namewww.seedinvest.com(the “Online Platform”) to provide technology tools to facilitate the sales of securities in this offering.
51
Selling Security holders
No securities are being sold for the account of security holders; all net proceeds of this offering will go to the company.
Investors’ Tender of Funds and Return of Funds
After the Offering Statement has been qualified by the Securities and Exchange Commission, we will accept tenders of funds to purchase the Series B Preferred Stock. We may close on investments on a “rolling” basis (so not all investors will receive their shares on the same date), provided that the minimum offering amount has been met. However, we may accept the tender of funds before it is clear that the minimum amount sought will be raised. Investors may subscribe by tendering funds via wire or ACH only, checks will not be accepted, to the escrow account to be set up by [_________] bank escrow agent. Tendered funds will remain in escrow until both the minimum offering amount has been reached and a closing has occurred. However, in the event we have not sold the minimum amount of shares by the date that is one year from the qualification of this offering with the Commission, or sooner terminated by the company, any money tendered by potential investors will be promptly returned by [___________] bank escrow agent.
Upon reaching the minimum offering amount, we shall have five business days to either accept or reject existing subscriptions. In addition, after the minimum offering amount has been reached, we shall similarly have five business days to either accept or reject any new subscriptions on a rolling basis. In the event we choose to reject a subscription as permitted above, we shall deliver written notice to North Capital Private Securities Corporation demonstrating our intent to do so within five business days of receipt of such subscription.
In the event that it takes some time for us to raise funds in this offering, we will rely on income from sales and cash on hand of $4,885,092, as of June 30, 2015, in addition to pursuing private financing options, to continue our operations.
You will be required to complete a subscription agreement in order to invest.
52
FINANCIAL STATEMENTS
Audited Financial Statements as of and for years ending December 31, 2014 and December 31, 2013
Unaudited Financial Statements as of and for six months ending June 30, 2015
53
Waybetter, Inc.
A Delaware Corporation
Financial Statements and Independent Auditor’s Report
December 31, 2014 and 2013

54
| WAYBETTER, INC. |
| TABLE OF CONTENTS |
![]()
To the Board of Directors of
Waybetter, Inc.
New York, New York
INDEPENDENT AUDITOR’S REPORT
Report on the Financial Statements
We have audited the accompanying financial statements of Waybetter, Inc., which comprise the balance sheets as of December 31, 2014 and December 31, 2013, and the related statements of operations, changes in stockholders’ equity, and cash flows for the years then ended, and the related notes to the financial statements.
Management’s Responsibility for the Financial Statements
Management is responsible for the preparation and fair presentation of these financial statements in accordance with accounting principles generally accepted in the United States of America; this includes the design, implementation, and maintenance of internal control relevant to the preparation and fair presentation of financial statements that are free from material misstatement, whether due to fraud or error.
Auditor’s Responsibility
Our responsibility is to express an opinion on these financial statements based on our audit. We conducted our audit in accordance with auditing standards generally accepted in the United States of America. Those standards require that we plan and perform the audit to obtain reasonable assurance about whether the financial statements are free from material misstatements.
An audit involves performing procedures to obtain audit evidence about the amounts and disclosures in the financial statements. The procedures selected depend on the auditor’s judgment, including the assessment of the risks of material misstatement of the financial statements, whether due to fraud or error. In making those risk assessments, the auditor considers internal control relevant to the entity’s preparation and fair presentation of the financial statements in order to design audit procedures that are appropriate in the circumstances, but not for the purpose of expressing an opinion on the effectiveness of the entity’s internal control. Accordingly, we express no such opinion. An audit also includes evaluating the appropriateness of accounting policies used and the reasonableness of significant accounting estimates made by management, as well as evaluating the overall presentation of the financial statements. We believe that the audit evidence we have obtained is sufficient and appropriate to provide a basis for our audit opinion.
| Artesian CPA, LLC |
| 1624 Market Street, Suite 202 | Denver, CO 80202 |
| p: 877.968.3330 f: 720.634.0905 |
| info@ArtesianCPA.com | www.ArtesianCPA.com |
Opinion
In our opinion, the financial statements referred to above present fairly, in all material respects, the financial position of Waybetter, Inc., as of December 31, 2014 and December 31, 2013, and the results of its operations and its cash flows for the years then ended, in accordance with accounting principles generally accepted in the United States of America.
Emphasis of Matter Regarding Going Concern
The accompanying financial statements have been prepared assuming that the Company will continue as a going concern. As described in Note 2 to the financial statements, the Company has not generated profits since inception, and has sustained net losses of $609,448 and $978,184 for the years ended December 31, 2014 and 2013, respectively. These factors, among others, raise substantial doubt about the Company’s ability to continue as a going concern. Management’s plans in regard to these matters are also described in Note 2. The financial statements do not include any adjustments that might result from the outcome of this uncertainty. Our opinion is not modified with respect to this matter.
/s/ Artesian CPA, LLC
Denver, Colorado
October 22, 2015
| Artesian CPA, LLC |
| 1624 Market Street, Suite 202 | Denver, CO 80202 |
| p: 877.968.3330 f: 720.634.0905 |
| info@ArtesianCPA.com | www.ArtesianCPA.com |
-2-
| WAYBETTER, INC. |
| BALANCE SHEETS |
| As of December 31, 2014 and 2013 |
| 2014 | 2013 | |||||
| ASSETS | ||||||
| Current Assets: | ||||||
| Cash and cash equivalents | $ | 4,249,672 | $ | 941,568 | ||
| Other current assets | 17,961 | 1,506 | ||||
| Deferred financing costs | - | 13,485 | ||||
| Total Current Assets | 4,267,633 | 956,559 | ||||
| Non-Current Assets: | ||||||
| Property, equipment, and software, net | 21,735 | 35,789 | ||||
| Due from related party | 150,000 | - | ||||
| Total Non-Current Assets | 171,735 | 35,789 | ||||
| TOTAL ASSETS | $ | 4,439,368 | $ | 992,348 | ||
| LIABILITIES AND STOCKHOLDERS' EQUITY (DEFICIENCY) | ||||||
| Liabilities: | ||||||
| Current Liabilities: | ||||||
| Accrued expenses and other liabilities | $ | 90,614 | $ | 46,657 | ||
| Accrued backpay - related party | - | 151,666 | ||||
| Customer deposits | 2,283,938 | 999,631 | ||||
| Deferred revenue | 276,455 | 141,781 | ||||
| Convertible notes | - | 908,000 | ||||
| Accrued interest payable - convertible notes | - | 59,560 | ||||
| Total Liabilities | 2,651,007 | 2,307,295 | ||||
| Stockholders' Equity (Deficiency): | ||||||
| Convertible Preferred Stock, 15,894,209 and 4,000,000 shares authorized, $0.001 par | ||||||
| Series A Preferred Stock, 5,830,306 and 0 shares issued and outstanding, 8,606,894 and 0 shares designated, liquidation preference of $2,774,060 and $0, at December 31, 2014 and 2013, all respectively. | 5,830 | - | ||||
| Series Seed Preferred Stock, 7,287,315 and 3,703,773 shares issued and outstanding, 7,287,315 and 0 shares designated, liquidation preference of $1,967,305 and $1,000,019, at December 31, 2014 and 2013, all respectively. | 7,288 | 3,704 | ||||
| Common Stock, $0.001 par, 30,000,000 and 18,000,000 shares authorized, 10,000,000 and 10,000,000 shares issued and outstanding at December 31, 2014 and 2013, respectively | 10,000 | 10,000 | ||||
| Additional paid-in capital | 4,849,858 | 1,146,516 | ||||
| Accumulated deficit | (3,084,615 | ) | (2,475,167 | ) | ||
| Total Stockholders' Equity (Deficiency) | 1,788,361 | (1,314,947 | ) | |||
| Total Liabilities and Stockholders' Equity (Deficency) | $ | 4,439,368 | $ | 992,348 |
See Independent Auditor’s Report and accompanying notes, which are an integral part of these financial statements.
-3-
| WAYBETTER, INC. |
| STATEMENTS OF OPERATIONS |
| For the years ended December 31, 2014 and 2013 |
| 2014 | 2013 | |||||
| Net Revenues | $ | 2,047,873 | $ | 695,553 | ||
| Cost of Net Revenues | 978,045 | 439,042 | ||||
| Gross Profit | 1,069,828 | 256,511 | ||||
| Operating Expenses: | ||||||
| Compensation & benefits | 767,988 | 479,956 | ||||
| Technology & analytics | 324,709 | 347,630 | ||||
| Sales & marketing | 253,531 | 209,294 | ||||
| General & administrative | 167,238 | 108,993 | ||||
| Professional fees | 153,712 | 44,528 | ||||
| Total Operating Expenses | 1,667,178 | 1,190,401 | ||||
| Loss from operations | (597,350 | ) | (933,890 | ) | ||
| Other Income (Expense): | ||||||
| Interest income | 1,235 | - | ||||
| Interest expense | (13,333 | ) | (44,294 | ) | ||
| Total Other Income | (12,098 | ) | (44,294 | ) | ||
| Provision for Income Taxes | - | - | ||||
| Net Loss | $ | (609,448 | ) | $ | (978,184 | ) |
| Weighted-average common shares outstanding -Basic and Diluted | 10,000,000 | 10,000,000 | ||||
| Net loss per common share -Basic and Diluted | $ | (0.06 | ) | $ | (0.10 | ) |
See Independent Auditor’s Report and accompanying notes, which are an integral part of these financial statements.
-4-
| WAYBETTER, INC. |
| STATEMENTS OF CHANGES IN STOCKHOLDERS’ EQUITY |
| For the years ended December 31, 2014 and 2013 |
| Preferred Stock | |||||||||||||||||||||||||||
| Common Stock | Series Seed Preferred Stock | Series A Preferred Stock | |||||||||||||||||||||||||
| Additional | Total | ||||||||||||||||||||||||||
| Number of | Number of | Number of | Paid-In | Accumulated | Stockholder's | ||||||||||||||||||||||
| Shares | Amount | Shares | Amount | Shares | Amount | Capital | Deficit | Equity | |||||||||||||||||||
| Balance at January 1, 2013 | 10,000,000 | $ | 10,000 | 3,703,773 | $ | 3,704 | - | $ | - | $ | 1,110,228 | $ | (1,496,983 | ) | $ | (373,051 | ) | ||||||||||
| Deferred financing costs | - | - | - | - | - | - | 17,980 | - | 17,980 | ||||||||||||||||||
| Stock-based compensation | - | - | - | - | - | - | 18,308 | - | 18,308 | ||||||||||||||||||
| Net loss | - | - | - | - | - | - | - | (978,184 | ) | (978,184 | ) | ||||||||||||||||
| Balance at December 31, 2013 | 10,000,000 | $ | 10,000 | 3,703,773 | $ | 3,704 | - | $ | - | $ | 1,146,516 | $ | (2,475,167 | ) | $ | (1,314,947 | ) | ||||||||||
| Conversion of convertible notes | - | - | 3,583,542 | 3,584 | - | - | 963,976 | - | 967,560 | ||||||||||||||||||
| Issuance of Series A Preferred Stock, net of issuance costs | - | - | - | - | 5,830,306 | 5,830 | 2,715,387 | - | 2,721,217 | ||||||||||||||||||
| Stock-based compensation | - | - | - | - | - | - | 23,979 | - | 23,979 | ||||||||||||||||||
| NetLoss loss | - | - | - | - | - | - | - | (609,448 | ) | (609,448 | ) | ||||||||||||||||
| Balance at December 31, 2014 | 10,000,000 | $ | 10,000 | 7,287,315 | $ | 7,288 | 5,830,306 | $ | 5,830 | $ | 4,849,858 | $ | (3,084,615 | ) | $ | 1,788,361 | |||||||||||
See Independent Auditor’s Report and accompanying notes, which are an integral part of these financial statements.
-5-
| WAYBETTER, INC. |
| STATEMENTS OF CASH FLOWS |
| For the years ended December 31, 2014 and 2013 |
| 2014 | 2013 | |||||
| Cash Flows From Operating Activities | ||||||
| Net Loss | $ | (609,448 | ) | $ | (978,184 | ) |
| Adjustments to reconcile net loss to net cash provided by operating activities: | ||||||
| Depreciation and amortization | 37,119 | $ | 33,036 | |||
| Stock-based compensation | 23,979 | $ | 18,308 | |||
| Amortization to interest expense on deferred financing costs | 13,485 | 4,495 | ||||
| Changes in operating assets and liabilities: | ||||||
| (Increase)/Decrease in other current assets | (16,455 | ) | (1,502 | ) | ||
| Increase/(Decrease) in accrued expenses and other liabilities | 43,957 | (1,084 | ) | |||
| Increase/(Decrease) in accrued backpay - related party | (151,666 | ) | 129,999 | |||
| Increase/(Decrease) in customer deposits | 1,284,307 | 899,819 | ||||
| Increase/(Decrease) in deferred revenue | 134,674 | 126,338 | ||||
| Increase/(Decrease) in accrued interest payable | - | 39,800 | ||||
| Net Cash Provided by Operating Activities | 759,952 | 271,025 | ||||
| Cash Flows From Investing Activities | ||||||
| Purchase of property and equipment | (12,954 | ) | - | |||
| Purchase of intangible assets | (10,111 | ) | - | |||
| Advance to related party | (150,000 | ) | - | |||
| Net Cash Used In Investing Activities | (173,065 | ) | - | |||
| Cash Flows From Financing Activities | ||||||
| Proceeds from issuance of convertible notes | - | 408,000 | ||||
| Proceeds from issuance of Series A Preferred Stock | 2,774,060 | - | ||||
| Offering costs | (52,843 | ) | - | |||
| Issuance of Membership Units for Cash | - | - | ||||
| Net Cash Provided By Financing Activities | 2,721,217 | 408,000 | ||||
| Net Change In Cash | 3,308,104 | 679,025 | ||||
| Cash at Beginning of Period | 941,568 | 262,543 | ||||
| Cash at End of Period | $ | 4,249,672 | $ | 941,568 | ||
| Supplemental disclosure of Non-Cash Financing Activities: | ||||||
| Conversion of convertible notes to Series Seed Preferred Stock | $ | 967,560 | $ | - | ||
| Fair value of warrants issued for financing arrangement | $ | - | $ | 17,980 |
See accompanying Independent Auditor’s Report and accompanying notes, which are an integral part of these financial statements.
-6-
| WAYBETTER, INC. |
| NOTES TO FINANCIAL STATEMENTS |
| For the years ended December 31, 2014 and 2013 |
NOTE 1: NATURE OF OPERATIONS
Waybetter, Inc. (the “Company”), is a corporation organized July 22, 2010 under the laws of Delaware. The Company was founded in 2010, as DietBet, Inc. in order to develop a social motivation platform that helps people lose weight. On August 13, 2014, the company filed an Amended and Restated Certificate of Incorporation changing its name from DietBet, Inc. to Waybetter, Inc., and expanded its mission to use a mix of competition, collaboration, and financial incentives to provide a social motivation platform that helps people adopt healthy behaviors, such as exercising more, quitting smoking, and managing stress.
NOTE 2: GOING CONCERN
The accompanying financial statements have been prepared on a going concern basis, which contemplates the realization of assets and the satisfaction of liabilities in the normal course of business. The Company has not generated profits since inception, and has sustained net losses of $(609,448) and $(978,184) for the years ended December 31, 2014 and December 31, 2013, respectively. The Company’s ability to continue as a going concern for the next twelve months is dependent upon its ability to generate sufficient cash flows from operations to meet its obligations, which it has not been able to accomplish to date, and/or to obtain additional capital financing. No assurance can be given that the Company will be successful in these efforts.
NOTE 3: SUMMARY OF SIGNIFICANT ACCOUNTING POLICIES
Basis of Presentation
The accounting and reporting policies of the Company conform to accounting principles generally accepted in the United States of America (GAAP) and Article 8 of Regulation S-X of the rules and regulations of the Securities and Exchange Commission (SEC).
The Company has elected to adopt early application of Accounting Standards Update No. 2014-10, Development Stage Entities (Topic 915): Elimination of Certain Financial Reporting Requirements; the Company does not present or disclose inception-to-date information and other remaining disclosure requirements of Topic 915.
The Company adopted the calendar year as its basis of reporting.
Use of Estimates
The preparation of financial statements in conformity with accounting principles generally accepted in the United States (“GAAP”) requires management to make estimates and assumptions that affect the reported amounts of assets and liabilities and disclosures of contingent assets and liabilities at the date of the financial statements and the reported amounts of revenues and expenses during the reporting period. Actual results could differ from those estimates.
See accompanying Independent Auditor’s Report
-7-
| WAYBETTER, INC. |
| NOTES TO FINANCIAL STATEMENTS |
| For the years ended December 31, 2014 and 2013 |
Cash equivalents and concentration of cash balance
The Company considers all highly liquid securities with an original maturity of less than three months to be cash equivalents. The Company’s cash and cash equivalents in bank deposit accounts, at times, may exceed federally insured limits.
Fair Value of Financial Instruments
Financial Accounting Standards Board (“FASB”) guidance specifies a hierarchy of valuation techniques based on whether the inputs to those valuation techniques are observable or unobservable. Observable inputs reflect market data obtained from independent sources, while unobservable inputs reflect market assumptions. The hierarchy gives the highest priority to unadjusted quoted prices in active markets for identical assets or liabilities (Level 1 measurement) and the lowest priority to unobservable inputs (Level 3 measurement).The three levels of the fair value hierarchy are as follows:
Level 1 - Unadjusted quoted prices in active markets for identical assets or liabilities that the reporting entity has the ability to access at the measurement date. Level 1 primarily consists of financial instruments whose value is based on quoted market prices such as exchange-traded instruments and listed equities.
Level 2 - Inputs other than quoted prices included within Level 1 that are observable for the asset or liability, either directly or indirectly (e.g., quoted prices of similar assets or liabilities in active markets, or quoted prices for identical or similar assets or liabilities in markets that are not active).
Level 3 - Unobservable inputs for the asset or liability. Financial instruments are considered Level 3 when their fair values are determined using pricing models, discounted cash flows or similar techniques and at least one significant model assumption or input is unobservable.
The carrying amounts reported inthe balance sheets for other receivables, accounts payable, accrued expenses and debt approximate their fair value based on the short-term maturity of these instruments. The warrant liability is recorded at fair value with changes in fair value reflected in the statement of operations.
Property, Equipment, and Software
Property, equipment, and software are recorded at cost. Depreciation/amortization is recorded for property, equipment, and software using the straight-line method over the estimated useful lives of assets. The useful life of the Company’s capitalized assets as of December 31, 2014 is three years. The Company reviews the recoverability of all long-lived assets, including the related useful lives, whenever events or changes in circumstances indicate that the carrying amount of a long-lived asset might not be recoverable.
The Company accounts for software development costs in accordance with several accounting pronouncements, including FASB ASC 730, Research and Development, FASB ASC 350-40, Internal-Use Software, FASB 985-20, Costs of Computer Software to be Sold, Leased, or Marketed and FASB ASC 350-50, Website Development Costs.
See accompanying Independent Auditor’s Report
-8-
| WAYBETTER, INC. |
| NOTES TO FINANCIAL STATEMENTS |
| For the years ended December 31, 2014 and 2013 |
Costs incurred during the period of planning and design, prior to the period determining technological feasibility, for all software developed for use internal and external, has been charged to operations in the period incurred as research and development costs. Additionally, costs incurred after determination of readiness for market have been expensed as research and development.
The Company capitalizes certain costs in the development of its proprietary software for the period after technological feasibility was determined and prior to marketing and initial sales. Website development costs have been capitalized, under the same criteria as marketed software.
Property, equipment, and software at December 31, 2014 and 2013 consist of the following:
| 2014 | 2013 | |||||
| Furniture and Equipment | $ | 12,954 | $ | - | ||
| Software | 99,108 | 99,108 | ||||
| Web Domains | 10,111 | - | ||||
| 122,173 | 99,108 | |||||
| Accumulated Depreciation/Amortization | (100,438 | ) | (63,319 | ) | ||
| Property, Equipment, and Software, net | $ | 21,735 | $ | 35,789 |
Depreciation and amortization charges included in general and administrative expenses for the years ending December 31, 2014 and 2013 amounted to $37,119 and $33,036, respectively.
Revenue Recognition
The Company recognizes revenue when: (1) persuasive evidence exists of an arrangement with the customer reflecting the terms and conditions under which products or services will be provided; (2) delivery has occurred or services have been provided; (3) the fee is fixed or determinable; and (4) collection is reasonably assured. For all revenue transactions, the Company considers payment to be persuasive evidence of an arrangement. Refunds are included in net revenues and no estimate was necessary for future returns as revenues are not refundable after the revenue recognition criterion has been satisfied. Net revenue represents the commission the Company receives on the gross bets made on its platform after paying out winnings.
Deferred Revenue consists of unrecognized revenue paid in advance of the delivery or completion of services. Deferred revenue is recognized as revenue when the services are provided and all other revenue recognition criteria have been met.
See accompanying Independent Auditor’s Report
-9-
| WAYBETTER, INC. |
| NOTES TO FINANCIAL STATEMENTS |
| For the years ended December 31, 2014 and 2013 |
Customer Deposits
Customer deposits include earnings from previous social motivation game winnings that are held in deposit and amounts from current social motivation games not estimated to be earned by the Company.
Stock-Based Compensation
The Company accounts for stock-based compensation in accordance with ASC 718,Compensation - Stock Compensation. Under the fair value recognition provisions of ASC 718, stock-based compensation cost is measured at the grant date based on the fair value of the award and is recognized as expense ratably over the requisite service period, which is generally the option vesting period. The Company uses the Black-Scholes option pricing model to determine the fair value of stock options. Stock-based awards issued to date are comprised of employee stock options.
Advertising Costs
Advertising costs are recorded as an expense in the period in which we incur the costs or the first time the advertising takes place. Advertising costs expensed were $180,844 and $96,579 for the years ended December 31, 2014 and 2013, respectively.
Income Taxes
The Company uses the liability method of accounting for income taxes as set forth in ASC 740,Income Taxes. Under the liability method, deferred taxes are determined based on the temporary differences between the financial statement and tax basis of assets and liabilities using tax rates expected to be in effect during the years in which the basis differences reverse. A valuation allowance is recorded when it is unlikely that the deferred tax assets will not be realized. We assess our income tax positions and record tax benefits for all years subject to examination based upon our evaluation of the facts, circumstances and information available at the reporting date. In accordance with ASC 740-10, for those tax positions where there is a greater than 50% likelihood that a tax benefit will be sustained, our policy will be to record the largest amount of tax benefit that is more likely than not to be realized upon ultimate settlement with a taxing authority that has full knowledge of all relevant information. For those income tax positions where there is less than 50% likelihood that a tax benefit will be sustained, no tax benefit will be recognized in the financial statements.
Net Earnings or Loss per Share
Net earnings or loss per share is computed by dividing net income or loss by the weighted-average number of common shares outstanding during the period, excluding shares subject to redemption or forfeiture. The Company presents basic and diluted net earnings or loss per share. Basic and diluted net earnings or loss per share reflect the actual weighted average of common shares issued and outstanding during the period. Potentially dilutive securities are excluded from the computation of the diluted net earnings or loss per share if their inclusion would be anti-dilutive, and consist of the following:
See accompanying Independent Auditor’s Report
-10-
| WAYBETTER, INC. |
| NOTES TO FINANCIAL STATEMENTS |
| For the years ended December 31, 2014 and 2013 |
| 2014 | 2013 | |||||
| Series Seed Preferred Stock (convertible to common stock) | 7,287,315 | 3,703,773 | ||||
| Series A Preferred Stock (convertible to common stock) | 5,830,306 | - | ||||
| Convertible notes payable (convertible to convertible Series Seed Preferred Stock) | - | 3,583,542 | ||||
| Warrants (2010) to purchase common stock | 100,000 | 100,000 | ||||
| Warrants (2013) to purchase common stock | 200,000 | 200,000 | ||||
| Stock options | 2,421,373 | 2,018,656 | ||||
| Total potentially dilutive shares | 15,838,994 | 9,605,971 |
As all potentially dilutive securities are anti-dilutive for the years ended December 31, 2014 and 2013, diluted net loss per share is the same as basic net loss per share for each year.
Offering Costs
The Company complies with the requirements of FASB ASC 340-10-S99-1 with regards to offering costs. Prior to the completion of an offering, offering costs will be capitalized as deferred offering costs on the balance sheet. The deferred offering costs will be charged to stockholders’ equity upon the completion of an offering or to expense if the offering is not completed. No offering costs remained capitalized as of December 31, 2014 or 2013.
NOTE 4: STOCKHOLDERS’ EQUITY
Common Stock
In July 2011, the Company amended its Certificate of Incorporation to increase its authorized common stock from 11,000,000 shares to 18,000,000. In August 2014, the Company amended its Certificate of Incorporation to increase its authorized common stock from 18,000,000 shares to 30,000,000 shares.
The Company is authorized to issue 30,000,000 and 18,000,000 shares of common stock at $0.001 par value, as of December 31, 2014 and 2013. Common stockholders are entitled to one vote for each share on all matters to be voted on by the stockholders, do not have cumulative voting rights, have no preemptive rights to purchase common stock, no conversion or redemption rights or sinking fund provisions with respect to the common stock, and are entitled to share ratably in dividends. In the event of liquidation, common stockholders are entitled to share pro rata all assets remaining after payment in full of all liabilities and preferences.
The Company has reserved 3,430,471 shares of its common stock for pursuant to the Equity Incentive Plan. 2,421,373 and 2,018,656 stock options are outstanding as of December 31, 2014 and 2013, respectively.
See accompanying Independent Auditor’s Report
-11-
| WAYBETTER, INC. |
| NOTES TO FINANCIAL STATEMENTS |
| For the years ended December 31, 2014 and 2013 |
Preferred Stock
In July 2011, the Company amended its Certificate of Incorporation to authorize 4,000,000 shares of $0.001 par preferred stock, of which 3,704,000 shares were designated as Series Seed Preferred Stock. In August 2014, the Company amended its Certificate of Incorporation to increase its authorized preferred stock from 4,000,000 shares to 15,894,209 shares, of which 7,287,315 shares were designed as Series Seed Preferred Stock and 8,606,894 shares were designated as Series A Preferred Stock. 13,117,621 and 3,703,773 shares of preferred stock were issued and outstanding as of December 31, 2014 and 2013, respectively. The preferred stock is subject to mandatory conversion provisions upon and initial public offering and are not redeemable.
Series Seed Preferred Stock - Convertible
As of December 31, 2014 and 2013, there were 7,287,315 and 3,703,773 shares of $0.001 par value Series Seed Preferred Stock were issued and outstanding, respectively. The Series Seed Preferred Stockholders are entitled to equal voting rights to common stockholders on an as-converted basis, contain certain dilution protections, have a dividend preference of $0.0216 per share (secondary to Series A Preferred Stock), and are convertible on a 1:1 basis to common stock. The Series Seed Preferred Stock have a liquidation preference of $0.27 per share, which is subordinate to the liquidation preference on Series A Preferred Stock.
Series A Preferred Stock – Convertible
As of December 31, 2014 and 2013, there were 5,830,306 and 0 shares of $0.001 par value Series A Preferred Stock were issued and outstanding, respectively. The Series A Preferred Stockholders are entitled to equal voting rights to common stockholders on an as-converted basis, contain certain dilution protections, have a dividend preference of $0.0384 per share, and are convertible on a 1:1 basis to common stock. The Series A Preferred Stock have a liquidation preference of $0.4758 per share.
Convertible Notes
As of December 31, 2013, the Company had issued $908,000 of convertible notes bearing interest at 10% per annum. The notes principal and accrued interest were convertible into Series Seed Preferred Stock at a conversion rate of $0.27 per share, subject to adjustment for stock splits and other dilution protections. Voluntary conversion was allowed and the notes contained an automatic conversion provision triggered by a qualified offering, as defined in the notes. The maturity date on the notes was July 31, 2013, when all principal and accrued interest came due. At the maturity date, the notes had not triggered automatic conversion, none of the notes had been voluntarily converted, and the principal and unpaid interest had not been paid off. Resultantly, the convertible notes entered default under the terms of the agreement. Subsequently, in August 2014, the Company entered into a waiver agreement with each convertible note holder whereby the convertible note terms were amended removing default status and changing the note terms to trigger automatic conversion effective as of July 31, 2013. Accordingly, the notes were converted on August 13, 2014 to 3,583,542 shares of Series Seed Preferred Stock at a price per share of $0.27 based on the $908,000 of principal outstanding and accrued interest through July 31, 2013. The convertible note holders were not credited for accrued interest from the July 31, 2013 maturity date through the actual conversion date under the terms of the waiver agreements. The balance due on the principal of the notes was $0 and $908,000, and accrued interest was $0 and $59,560, as of December 31, 2014 and 2013, both respectively.
See accompanying Independent Auditor’s Report
-12-
| WAYBETTER, INC. |
| NOTES TO FINANCIAL STATEMENTS |
| For the years ended December 31, 2014 and 2013 |
Warrants
In 2010, the Company issued 100,000 warrants to purchase shares of common stock in conjunction with a convertible note financing round. The stock purchase warrants issued expire five years after their date of issuance in September of 2015, or upon a qualified financing. The exercise price for the common stock warrants is $0.01 per share. The number of shares or exercise price will be adjusted in the event of any stock dividend, stock splits or recapitalization of the Company. The common stock warrants were valued by the Company at the grant date using Black-Scholes and were determined to have a trivial fair value.
In August 2013, the Company issued 200,000 warrants to purchase shares of common stock in conjunction with a financing arrangement. The financing arrangement provided that the Company could call upon the counter party to the arrangement to provide $125,000 should liquidity needs arise for a period of the sooner of December 31, 2014 or at such time which the Company had $2,000,000 of cash available. The guaranty expired effective December 31, 2014. The stock purchase warrants granted in this arrangement expire seven years after their date of issuance or upon the any reclassification, capital reorganization or change in the capital stock of the Company (other than as a result of a subdivision, combination or stock dividend). The exercise price for the common stock warrants is $0.27 per share and the warrants contain a net-settlement option the holder can elect which provides for a non-cash conversion calculation based on the fair value of the common stock at the exercise date. The number of shares or exercise price will be adjusted in the event of any stock dividend, stock splits or recapitalization of the Company. The common stock warrants were valued using a Black-Scholes model with the following assumptions: 30% volatility, seven year term, 0% dividends, 1.0% risk-free rate, $0.27 per share exercise price, $0.27 per share fair value. The estimated value of the common stock warrants at the issuance of $17,980 was been recorded as additional paid-in capital, capitalized to deferred financing costs on the balance sheet, and amortized to interest expense over the term of the guaranty, which was 16 months. A director of the Company has a financial interest in the counter party to this arrangement.
Additional terms apply to the Stockholder’s Equity as described in the Company’s formation documents and resolutions. These financial statements are not intended to fully describe all pertinent terms regarding the stockholders’ equity or the classes of stockholder’s equity, and should not be relied upon as current or complete disclosure of the terms of the classes of stockholder’s equity.
NOTE 5: INCOME TAXES
For the years ended December 31, 2014 and 2013, the Company did not record an income tax benefit because it has incurred taxable losses and has no history of generating taxable income and therefore the Company cannot presently anticipate the realization of a tax benefit on its Net Operating Loss carryforward. Therefore, the Company recorded a full valuation allowance against its deferred tax assets of $1,006,880 and $810,153 as of December 31, 2014 and 2013, respectively. Deferred tax assets and liabilities are as follows:
See accompanying Independent Auditor’s Report
-13-
| WAYBETTER, INC. |
| NOTES TO FINANCIAL STATEMENTS |
| For the years ended December 31, 2014 and 2013 |
| 2014 | 2013 | |||||
| Deferred tax assets: | ||||||
| Share-based compensation expense | $ | 28,917 | $ | 20,764 | ||
| Net operating loss carryforward | 984,475 | 799,218 | ||||
| Other | 4,499 | 1,403 | ||||
| Deferred tax liabilities: | ||||||
| Property and equipment | (11,011 | ) | (11,232 | ) | ||
| Deferred tax asset | 1,006,880 | 810,153 | ||||
| Valuation allowance | (1,006,880 | ) | (810,153 | ) | ||
| Net deferred tax asset | $ | - | $ | - |
As of December 31, 2014 and 2013, the Company has a Net Operating Loss carry forwards of $2,895,515 and $2,350,640, respectively, which will begin to expire in 2030.
| 2014 | 2013 | |||||
| Statutory U.S federal tax rate | 34.00% | 34.00% | ||||
| State and local income taxes - net of federal benefit | 10.37% | 10.37% | ||||
| Valuation Allowance | -44.37% | -44.37% | ||||
| Effective rate tax | 0.00% | 0.00% |
The Company has evaluated its income tax positions and has determined that it does not have any uncertain tax positions. The Company will recognize interest and penalties related to any uncertain tax positions through its income tax expense.
The Company may in the future become subject to federal, state and local income taxation though it has not been since its inception. The Company is not presently subject to any income tax audit in any taxing jurisdiction.
NOTE 6: SHARE-BASED PAYMENTS
Equity Incentive Plan
The 2010 Equity Incentive Plan (the "Plan") of the Company was approved by the written consent of the holder of a majority of the Company's outstanding common stock. The Plan provides the Company the ability to grant to any employee, director or consultants who provides services to the Company or any related entity, options, stock appreciation rights, restricted stock awards, restricted stock units, provided that only employees are entitled to receive incentive stock options in accordance with IRS guidelines. The Company reserved 3,430,471 and 2,673,753 shares of common stock for delivery under the Plan as of December 31, 2014 and 2013, respectively. Options available for issuance as of December 31, 2014 and 2013 were 1,009,098 and 655,097, respectively. Stock options expire ten years from the grant date and generally vest within two to four years, with occasional issuances with immediate or six month vesting schedules. Awards that are forfeited generally become available for grant under the plan. Pursuant to the Equity Incentive Plan and the employment agreements, between January 1, 2011 and December 31, 2014, the Compensation Committee of the Company's Board of Directors authorized the grants of stock options described below.
See accompanying Independent Auditor’s Report
-14-
| WAYBETTER, INC. |
| NOTES TO FINANCIAL STATEMENTS |
| For the years ended December 31, 2014 and 2013 |
Stock Options
The following table summarizes the Company's stock option activity:
| December 31, 2014 | December 31, 2013 | |||||||||||
| Weighted | Weighted | |||||||||||
| Average | Average | |||||||||||
| Options | Exercise Price | Options | Exercise Price | |||||||||
| Outstanding - beginning of year | 2,018,656 | $ | 0.2700 | 1,460,994 | $ | 0.2700 | ||||||
| Granted | 402,717 | $ | 0.2700 | 557,662 | $ | 0.2700 | ||||||
| Exercised | - | - | ||||||||||
| Forfeited | - | - | ||||||||||
| Outstanding - end of year | 2,421,373 | $ | 0.2700 | 2,018,656 | $ | 0.2700 | ||||||
| Exercisable at end of year | 1,539,786 | $ | 0.2700 | 1,079,334 | $ | 0.2700 | ||||||
| Weighted average grant date fair value of options granted during year | $ | 0.062 | $ | 0.062 | ||||||||
| Weighted average duration to expiration of outstanding options at year-end | 7.95 | 8.71 | ||||||||||
The Company measures employee stock-based awards at grant-date fair value and recognizes employee compensation expense on a straight-line basis over the vesting period of the award.
Determining the appropriate fair value of stock-based awards requires the input of subjective assumptions, including the fair value of the Company’s common stock, and for stock options, the expected life of the option, and expected stock price volatility. The Company used the Black-Scholes option pricing model to value its stock option awards. The assumptions used in calculating the fair value of stock-based awards represent management’s best estimates and involve inherent uncertainties and the application of management’s judgment. As a result, if factors change and management uses different assumptions, stock-based compensation expense could be materially different for future awards.
The expected life of stock options was estimated using the “simplified method,” as the Company has no historical information to develop reasonable expectations about future exercise patterns and employment duration for its stock options grants. The simplified method is based on the average of the vesting tranches and the contractual life of each grant. For stock price volatility, the Company uses comparable public companies as a basis for its expected volatility to calculate the fair value of options grants. The risk-free interest rate is based on U.S. Treasury notes with a term approximating the expected life of the option.
See accompanying Independent Auditor’s Report
-15-
| WAYBETTER, INC. |
| STATEMENTS OF CASH FLOWS |
| For the years ended December 31, 2014 and 2013 |
The estimation of the number of stock awards that will ultimately vest requires judgment, and to the extent actual results or updated estimates differ from the Company’s current estimates, such amounts are recognized as an adjustment in the period in which estimates are revised.
Stock-based compensation expense related to stock options included in compensation & benefits expenses for the years ending December 31, 2014 and 2013 was $23,979 and $18,308, respectively.
Grants to non-employees are expensed at the earlier of (i) the date at which a commitment for performance by the counter party to earn the equity instrument is reached and (ii) the date at which the counter party’s performance is complete. Performance is typically completed monthly. Non-employee awards were 92,717 and 17,662, respectively, for the years ended December 31, 2014 and 2013.
Total compensation cost related to nonvested awards not yet recognized as of December 31, 2014 was $126,487 and will be recognized over a weighted-average period of approximately 23 months. The amount of future stock option compensation expense could be affected by any future option grants or by any option holders leaving the Company before their grants are fully vested.
NOTE 7: RELATED PARTY TRANSACTIONS
Note Receivable to Related Party
In September 2014, the Company issued a $150,000 note to the founding shareholder and majority stockholder. The note bears interest of 1.89% per annum and matures in September 2021. No payments are required on the note until maturity when all principal and unpaid interest come due, though the note can be prepaid at any time without penalty. The note is collateralized by 1,351,108 shares of Common Stock held by the founding shareholder and majority stockholder.
Accrued Back Pay
From November 2012 through July 2014 three Officers of the Company elected to forego 25% of their salary until a future date. As of December 31, 2014 and 2013 $0 and $151,666 were due to these related parties related to this accrued back pay. In September 2014, the balances accrued in these arrangements totaling $227,500 was paid in full.
Stock Options Granted to Related Party
A motivational game host is a holder of 525,430 shares of Series A Preferred Stock. Additionally, payments issued to the same motivational game host were $40,000 and $10,000, respectively, for the years ended December 31, 2014 and 2013.
See accompanying Independent Auditor’s Report
-16-
| WAYBETTER, INC. |
| NOTES TO FINANCIAL STATEMENTS |
| For the years ended December 31, 2014 and 2013 |
NOTE 8: CONTINGENCIES
The Company may be subject to pending legal proceedings and regulatory actions in the ordinary course of business. The results of such proceedings cannot be predicted with certainty, but the Company does not anticipate that the final outcome, if any, arising out of any such matter will have a material adverse effect on its business, financial condition or results of operations.
NOTE 9: RECENT ACCOUNTING PRONOUNCEMENTS
In June 2014, the FASB issued Accounting Standards Update (ASU) 2014-10 which eliminated the requirements for development stage entities to (1) present inception-to-date information in the statements of income, cash flows, and stockholders’ equity, (2) label the financial statements as those of a development stage entity, (3) disclose a description of the development stage activities in which the entity is engaged, and (4) disclose in the first year in which the entity is no longer a development stage entity that in prior years it had been in the development stage. This ASU is effective for annual reporting periods beginning after December 15, 2014, and interim periods beginning after December 15, 2015. Early application is permitted for any annual reporting period or interim period for which the entity’s financial statements have not yet been issued. Upon adoption, entities will no longer present or disclose any information required by Topic 915. The Company has early adopted the new standard effective immediately.
In August 2014, the FASB issued ASU 2014-15 on “Presentation of Financial Statements Going Concern (Subtopic 205-40) – Disclosure of Uncertainties about an Entity’s Ability to Continue as a Going Concern”. Currently, there is no guidance in U.S. GAAP about management’s responsibility to evaluate whether there is substantial doubt about an entity’s ability to continue as a going concern or to provide related footnote disclosures. The amendments in this update provide such guidance. In doing so, the amendments are intended to reduce diversity in the timing and content of footnote disclosures. The amendments require management to assess an entity’s ability to continue as a going concern by incorporating and expanding upon certain principles that are currently in U.S. auditing standards. Specifically, the amendments (1) provide a definition of the termsubstantial doubt,(2) require an evaluation every reporting period including interim periods, (3) provide principles for considering the mitigating effect of management’s plans, (4) require certain disclosures when substantial doubt is alleviated as a result of consideration of management’s plans, (5) require an express statement and other disclosures when substantial doubt is not alleviated, and (6) require an assessment for a period of one year after the date that the financial statements are issued (or available to be issued). The amendments in this update are effective for public and nonpublic entities In April 2015, the FASB issued Accounting Standards Update No. 2015-05,Intangibles - Goodwill and Other - Internal-Use Software (Subtopic 350-40)("ASU 2015-05"). ASU 2015-05 provides guidance to customers about whether a cloud computing arrangement includes a software license. If a cloud computing arrangement includes a software license, then the customer should account for the software license element of the arrangement consistent with the acquisition of other software licenses. If a cloud computing arrangement does not include a software license, the customer should account for the arrangement as a service contract. ASU 2015-05 is effective for annual periods, including interim periods within those annual periods, beginning after December 15, 2015.
See accompanying Independent Auditor’s Report
-17-
| WAYBETTER, INC. |
| NOTES TO FINANCIAL STATEMENTS |
| For the years ended December 31, 2014 and 2013 |
Early adoption is permitted. The Company believes the adoption of ASU 2015-02 will not have a material effect on its financial statements.
Management does not believe that any recently issued, but not yet effective, accounting standards could have a material effect on the accompanying financial statements. As new accounting pronouncements are issued, we will adopt those that are applicable under the circumstances.
NOTE 10: SUBSEQUENT EVENTS
Note Receivable to Related Party
In September 2015, the Company issued a $100,000 note to the founding and majority stockholder. The note bears interest of 1.89% per annum and matures in September 2022. No payments are required on the note until maturity when all principal and unpaid interest come due, though the note can be prepaid at any time without penalty. The note is collateralized by 900,739 shares of Common Stock held by the founding and majority stockholder.
Authorized Shares
On September 29, 2015 the Company filed an Amended and Restated Certificate of Incorporation to authorize the following shares: 30,000,000 shares of Common Stock at $0.001 par value per share; 16,002,546 shares of Preferred Stock at $0.001 par value per share, which are designated as 7,287,315 shares of Series Seed Preferred Stock, 6,030,306 shares of Series A Preferred Stock, 2,684,925 shares of Series A-1 Preferred Stock.
Restricted Stock Shares
February 2015, the Company granted 10,000 shares of fully vested Common Stock to an advisor of the Company for consulting services performed for the company under a consulting services agreement dated January 1, 2015.
Series A-1 Preferred Stock
The Company is authorized to issue 2,684,925 shares of Series A-1 Preferred Stock at $0.001 par value. In October 2015 the Company issued 581,838 shares of the Series A-1 Preferred Stock at $0.7449 per share, providing gross proceeds of $433,411. Given the absence of quoted prices in active markets and the lack of previous sales of the Company’s preferred stock, the Company determined the fair value of the initial shares issued to be the consideration paid by the stockholder of $0.7449 per share. In making this determination, the Company considered that there had been no transactions or activity prior to or immediately subsequent to the stock sale.
Warrants
In September 2015, the 2010 warrants described in Note 4 were all exercised, resulting in the issuance of 100,000 shares of common stock for total proceeds of $1,000.
See accompanying Independent Auditor’s Report
-18-
| WAYBETTER, INC. |
| NOTES TO FINANCIAL STATEMENTS |
| For the years ended December 31, 2014 and 2013 |
Stock Options
Through October 2015, the Company has issued 815,500 stock options under the Equity Incentive Plan described in Note 6.
Management has evaluated subsequent events through October 22, 2015, the date the financial statements were available to be issued. Based on this evaluation, no additional material events were identified which require adjustment or disclosure in these consolidated financial statements.
-19-
Waybetter, Inc.
A Delaware Corporation
Unaudited Financial Statements
June 30, 2015
Balance Sheet (unaudited)
As of June 30, 2015
| June 30, 2015 | |||
| ASSETS | |||
| Current Assets: | |||
| Cash and cash equivalents | $ | 4,885,092 | |
| Other current assets | 15,421 | ||
| Total Current Assets | 4,900,513 | ||
| Non-Current Assets: | |||
| Property, equipment, and software, net | 25,099 | ||
| Due from related party | 150,000 | ||
| Total Non-Current Assets | 175,099 | ||
| TOTAL ASSETS | $ | 5,075,612 | |
| LIABILITIES AND STOCKHOLDERS' EQUITY (DEFICIENCY) | |||
| Liabilities: | |||
| Current Liabilities: | |||
| Accrued expenses and other liabilities | $ | 33,201 | |
| Customer deposits | 3,324,874 | ||
| Deferred revenue | 433,568 | ||
| Total Liabilities | 3,791,643 | ||
| Stockholders' Equity (Deficiency): | |||
| Convertible Preferred Stock, 15,894,209 shares authorized, $0.001 par | |||
| Series A Preferred Stock, 5,830,306 shares issued and outstanding, 8,606,894 shares designated, liquidation preference of $2,774,060 at June 30, 2015 | 5,830 | ||
| Series Seed Preferred Stock, 7,287,315 shares issued and outstanding, 7,287,315 shares designated, liquidation preference of $1,967,305 at June 30, 2015 | 7,288 | ||
| Common Stock, $0.001 par, 30,000,000 shares authorized, 10,010,000 shares issued and outstanding at June 30, 2015 | 10,000 | ||
| Additional paid-in capital | 4,868,045 | ||
| Accumulated deficit | (3,607,194 | ) | |
| Total Stockholders' Equity (Deficiency) | 1,283,969 | ||
| Total Liabilities and Stockholders' Equity (Deficency) | $ | 5,075,612 |
1
Statement of Operations (unaudited)
For the six months ended June 30, 2015
| Six Months Ended June | |||
| 30, 2015 | |||
| Net Revenues | $ | 1,560,979 | |
| Cost of Net Revenues | 735,870 | ||
| Gross Profit | 825,109 | ||
| Operating Expenses: | |||
| Compensation & benefits | 713,175 | ||
| Technology & analytics | 147,097 | ||
| Sales & marketing | 189,748 | ||
| General & administrative | 186,834 | ||
| Professional fees | 112,726 | ||
| Total Operating Expenses | 1,349,580 | ||
| Loss from operations | (524,471 | ) | |
| Other Income (Expense): | |||
| Interest income | 1,892 | ||
| Total Other Income | 1,892 | ||
| Provision for Income Taxes | - | ||
| Net Loss | $ | (522,579 | ) |
| Weighted-average common shares outstanding -Basic and Diluted | 10,007,500 | ||
| Net loss per common share -Basic and Diluted | $ | (0.05 | ) |
2
Statement of Changes in Stockholders’ Equity (unaudited)
For the six months ended June 30, 2015
| Preferred Stock | |||||||||||||||||||||||||||
| Series Seed Preferred Stock | Series A Preferred Stock | Common Stock | |||||||||||||||||||||||||
| Additional | Total | ||||||||||||||||||||||||||
| Number of | Number of | Number of | Paid-In | Accumulated | Stockholder's | ||||||||||||||||||||||
| Shares | Amount | Shares | Amount | Shares | Amount | Capital | Deficit | Equity | |||||||||||||||||||
| Balance at January 1, 2015 | 7,287,315 | $ | 7,288 | 5,830,306 | $ | 5,830 | 10,000,000 | $ | 10,000 | $ | 4,849,858 | $ | (3,084,615 | ) | $ | 1,788,361 | |||||||||||
| Stock-based compensation | - | - | - | - | - | - | 15,487 | - | 15,487 | ||||||||||||||||||
| Stock Grant | - | - | - | - | 10,000 | - | 2700 | - | 2700 | ||||||||||||||||||
| Net loss | - | - | - | - | - | - | - | (522,579 | ) | (522,579 | ) | ||||||||||||||||
| Balance at June 30, 2015 | 7,287,315 | $ | 7,288 | 5,830,306 | $ | 5,830 | 10,010,000 | $ | 10,000 | $ | 4,868,045 | $ | (3,607,194 | ) | $ | 1,283,969 | |||||||||||
3
Statement of Cash Flows (unaudited)
For the six months ended June 30, 2015
| Six Months Ended | |||
| June 30, 2015 | |||
| Cash Flows From Operating Activities | |||
| Net Loss | $ | (522,579 | ) |
| Adjustments to reconcile net loss to net cash provided by operating activities: | |||
| Depreciation and amortization | 6,468 | ||
| Stock-based compensation | 18,187 | ||
| Changes in operating assets and liabilities: | |||
| (Increase)/Decrease in other current assets | 2,542 | ||
| Increase/(Decrease) in accrued expenses and other liabilities | (57,414 | ) | |
| Increase/(Decrease) in customer deposits | 1,040,936 | ||
| Increase/(Decrease) in deferred revenue | 157,112 | ||
| Net Cash Provided by Operating Activities | 645,252 | ||
| Cash Flows From Investing Activities | |||
| Purchase of property and equipment | (9,832 | ) | |
| Net Cash Used In Investing Activities | (9,832 | ) | |
| Net Change In Cash | 635,420 | ||
| Cash at Beginning of Period | 4,249,672 | ||
| Cash at End of Period | $ | 4,885,092 |
4
Notes To Financial Statements (unaudited)
As of and for the six months ended June 30, 2015
NOTE 1: NATURE OF OPERATIONS
Waybetter, Inc. (the “Company”), is a corporation organized July 22, 2010 under the laws of Delaware. The Company was founded in 2010, as DietBet, Inc. in order to develop a social motivation platform that helps people lose weight. On August 13, 2014, the company filed an Amended and Restated Certificate of Incorporation changing its name from DietBet, Inc. to WayBetter, Inc., and expanded its mission to use a mix of competition, collaboration, and financial incentives to provide a social motivation platform that helps people adopt healthy behaviors, such as exercising more, quitting smoking, and managing stress.
NOTE 2: GOING CONCERN
The accompanying financial statements have been prepared on a going concern basis, which contemplates the realization of assets and the satisfaction of liabilities in the normal course of business. The Company has not generated profits since inception, and has sustained net losses of $(522,579) for the six month ended June 30, 2015. The Company’s ability to continue as a going concern for the next twelve months is dependent upon its ability to generate sufficient cash flows from operations to meet its obligations, which it has not been able to accomplish to date, and/or to obtain additional capital financing. No assurance can be given that the Company will be successful in these efforts.
NOTE 3: SUMMARY OF SIGNIFICANT ACCOUNTING POLICIES
Basis of Presentation
The accounting and reporting policies of the Company conform to accounting principles generally accepted in the United States of America (GAAP) and Article 8 of Regulation S-X of the rules and regulations of the Securities and Exchange Commission (SEC).
The Company has elected to adopt early application of Accounting Standards Update No. 2014-10, Development Stage Entities (Topic 915): Elimination of Certain Financial Reporting Requirements; the Company does not present or disclose inception-to-date information and other remaining disclosure requirements of Topic 915.
The Company adopted the calendar year as its basis of reporting.
Interim Financial Information
The accompanying unaudited consolidated financial statements and footnotes have been prepared in accordance with U.S. GAAP as contained in the Financial Accounting Standards Board (‘‘FASB’’) Accounting Standards Codification (“ASC”) for interim financial information. The results of operations for the six month ended June 30, 2015 are not necessarily indicative of the results for the full year or the results for any future periods. These unaudited consolidated financial statements should be read in conjunction with the audited consolidated financial statements and related footnotes for the year ended December 31, 2014 appearing elsewhere in this prospectus.
In the opinion of management, all adjustments necessary in order to make the unaudited June 30, not misleading have been included.
5
Notes To Financial Statements (unaudited)
As of and for the six months ended June 30, 2015
Use of Estimates
The preparation of financial statements in conformity with accounting principles generally accepted in the United States (“GAAP”) requires management to make estimates and assumptions that affect the reported amounts of assets and liabilities and disclosures of contingent assets and liabilities at the date of the financial statements and the reported amounts of revenues and expenses during the reporting period. Actual results could differ from those estimates.
Cash equivalents and concentration of cash balance
The Company considers all highly liquid securities with an original maturity of less than three months to be cash equivalents. The Company’s cash and cash equivalents in bank deposit accounts, at times, may exceed federally insured limits.
Fair Value of Financial Instruments
Financial Accounting Standards Board (“FASB”) guidance specifies a hierarchy of valuation techniques based on whether the inputs to those valuation techniques are observable or unobservable. Observable inputs reflect market data obtained from independent sources, while unobservable inputs reflect market assumptions. The hierarchy gives the highest priority to unadjusted quoted prices in active markets for identical assets or liabilities (Level 1 measurement) and the lowest priority to unobservable inputs (Level 3 measurement).The three levels of the fair value hierarchy are as follows:
Level 1 - Unadjusted quoted prices in active markets for identical assets or liabilities that the reporting entity has the ability to access at the measurement date. Level 1 primarily consists of financial instruments whose value is based on quoted market prices such as exchange-traded instruments and listed equities.
Level 2 - Inputs other than quoted prices included within Level 1 that are observable for the asset or liability, either directly or indirectly (e.g., quoted prices of similar assets or liabilities in active markets, or quoted prices for identical or similar assets or liabilities in markets that are not active).
Level 3 - Unobservable inputs for the asset or liability. Financial instruments are considered Level 3 when their fair values are determined using pricing models, discounted cash flows or similar techniques and at least one significant model assumption or input is unobservable.
The carrying amounts reported inthe balance sheets for other receivables, accounts payable, accrued expenses and debt approximate their fair value based on the short-term maturity of these instruments. The warrant liability is recorded at fair value with changes in fair value reflected in the statement of operations.
Property, Equipment, and Software
Property, equipment, and software are recorded at cost. Depreciation/amortization is recorded for property, equipment, and software using the straight-line method over the estimated useful lives of assets. The useful life of the Company’s capitalized assets as of June 30, 2015 is three years. The Company reviews the recoverability of all long-lived assets, including the related useful lives, whenever events or changes in circumstances indicate that the carrying amount of a long-lived asset might not be recoverable.
6
Notes To Financial Statements (unaudited)
As of and for the six months ended June 30, 2015
The Company accounts for software development costs in accordance with several accounting pronouncements, including FASB ASC 730, Research and Development, FASB ASC 350-40, Internal-Use Software, FASB 985-20, Costs of Computer Software to be Sold, Leased, or Marketed and FASB ASC 350-50, Website Development Costs.
Costs incurred during the period of planning and design, prior to the period determining technological feasibility, for all software developed for use internal and external, has been charged to operations in the period incurred as research and development costs. Additionally, costs incurred after determination of readiness for market have been expensed as research and development.
The Company capitalizes certain costs in the development of its proprietary software for the period after technological feasibility was determined and prior to marketing and initial sales. Website development costs have been capitalized, under the same criteria as marketed software.
Property, equipment, and software at June 30, 2015 consist of the following:
| 06.30.15 | |||
| Furniture and Equipment | $ | 22,786 | |
| Software | 99,108 | ||
| Web Domains | 10,111 | ||
| 132,005 | |||
| Accumulated Depreciation/Amortization | (106,906 | ) | |
| Property, Equipment, and Software, net | $ | 25,099 |
Depreciation and amortization charges included in general and administrative expenses for the six month ending June 30, 2015 amounted to $6,469.
Revenue Recognition
The Company recognizes revenue when: (1) persuasive evidence exists of an arrangement with the customer reflecting the terms and conditions under which products or services will be provided; (2) delivery has occurred or services have been provided; (3) the fee is fixed or determinable; and (4) collection is reasonably assured. For all revenue transactions, the Company considers payment to be persuasive evidence of an arrangement. Refunds are included in net revenues and no estimate was necessary for future returns as revenues are not refundable after the revenue recognition criterion has been satisfied. Net revenue represents the commission the Company receives on the gross bets made on its platform after paying out winnings.
Deferred Revenue consists of unrecognized revenue paid in advance of the delivery or completion of services. Deferred revenue is recognized as revenue when the services are provided and all other revenue recognition criteria have been met.
7
Notes To Financial Statements (unaudited)
As of and for the six months ended June 30, 2015
Customer Deposits
Customer deposits include earnings from previous social motivation game winnings that are held in deposit and amounts from current social motivation games not estimated to be earned by the Company.
Stock-Based Compensation
The Company accounts for stock-based compensation in accordance with ASC 718,Compensation - Stock Compensation. Under the fair value recognition provisions of ASC 718, stock-based compensation cost is measured at the grant date based on the fair value of the award and is recognized as expense ratably over the requisite service period, which is generally the option vesting period. The Company uses the Black-Scholes option pricing model to determine the fair value of stock options. Stock-based awards issued to date are comprised of employee stock options.
Advertising Costs
Advertising costs are recorded as an expense in the period in which we incur the costs or the first time the advertising takes place. Advertising costs expensed were $116,289for the six month ending June 30, 2015.
Income Taxes
The Company uses the liability method of accounting for income taxes as set forth in ASC 740,Income Taxes. Under the liability method, deferred taxes are determined based on the temporary differences between the financial statement and tax basis of assets and liabilities using tax rates expected to be in effect during the years in which the basis differences reverse. A valuation allowance is recorded when it is unlikely that the deferred tax assets will not be realized. We assess our income tax positions and record tax benefits for all years subject to examination based upon our evaluation of the facts, circumstances and information available at the reporting date. In accordance with ASC 740-10, for those tax positions where there is a greater than 50% likelihood that a tax benefit will be sustained, our policy will be to record the largest amount of tax benefit that is more likely than not to be realized upon ultimate settlement with a taxing authority that has full knowledge of all relevant information. For those income tax positions where there is less than 50% likelihood that a tax benefit will be sustained, no tax benefit will be recognized in the financial statements.
Net Earnings or Loss per Share
Net earnings or loss per share is computed by dividing net income or loss by the weighted-average number of common shares outstanding during the period, excluding shares subject to redemption or forfeiture. The Company presents basic and diluted net earnings or loss per share. Basic and diluted net earnings or loss per share reflect the actual weighted average of common shares issued and outstanding during the period. Potentially dilutive securities are excluded from the computation of the diluted net earnings or loss per share if their inclusion would be anti-dilutive, and consist of the following as of June 30, 2015
8
Statement of Cash Flows (unaudited)
As of and for the six months ended June 30, 2015
| 06.30.15 | |||
| Series Seed Preferred Stock (convertible to common stock) | 7,286,315 | ||
| Series A Preferred Stock (convertible to common stock) | 5,830,306 | ||
| Convertible notes payable (convertible to convertible Series Seed Preferred Stock) | - | ||
| Warrants (2010) to purchase common stock | 100,000 | ||
| Warrants (2013) to purchase common stock | 200,000 | ||
| Stock options | 3,236,873 | ||
| Total potentially dilutive shares | 16,653,494 |
As all potentially dilutive securities are anti-dilutive for the six months ended June 30, 2015, diluted net loss per share is the same as basic net loss per share.
Offering Costs
The Company complies with the requirements of FASB ASC 340-10-S99-1 with regards to offering costs. Prior to the completion of an offering, offering costs will be capitalized as deferred offering costs on the balance sheet. The deferred offering costs will be charged to stockholders’ equity upon the completion of an offering or to expense if the offering is not completed. No offering costs remained capitalized as of June 30, 2015.
NOTE 4: STOCKHOLDERS’ EQUITY
Common Stock
In July 2011, the Company amended its Certificate of Incorporation to increase its authorized common stock from 11,000,000 shares to 18,000,000. In August 2014, the Company amended its Certificate of Incorporation to increase its authorized common stock from 18,000,000 shares to 30,000,000 shares.
The Company is authorized to issue 30,000,000 and 18,000,000 shares of common stock at $.001 par value, as of December 31, 2014 and 2013. As of June 30, 2015, there were 10,010,000 shares issued and outstanding. Common stockholders are entitled to one vote for each share on all matters to be voted on by the stockholders, do not have cumulative voting rights, have no preemptive rights to purchase common stock, no conversion or redemption rights or sinking fund provisions with respect to the common stock, and are entitled to share ratably in dividends. In the event of liquidation, common stockholders are entitled to share pro rata all assets remaining after payment in full of all liabilities and preferences.
The Company has reserved 3,420,471 shares of its common stock for pursuant to the Equity Incentive Plan. 3,236,873 stock options are outstanding as of June 30, 2015.
9
Notes To Financial Statements (unaudited)
As of and for the six months ended June 30, 2015
Restricted Stock Shares
In February 2015, the Company granted 10,000 shares of fully vested Common Stock to an advisor of the Company for consulting services performed for the company under a consulting services agreement dated January 1, 2015.
Preferred Stock
In July 2011, the Company amended its Certificate of Incorporation to authorize 4,000,000 shares of $0.001 par preferred stock, of which 3,704,000 shares were designated as Series Seed Preferred Stock. In August 2014, the Company amended its Certificate of Incorporation to increase its authorized preferred stock from 4,000,000 shares to 15,894,209 shares, of which 7,287,315 shares were designed as Series Seed Preferred Stock and 8,606,894 shares were designated as Series A Preferred Stock. 13,117,621 shares of preferred stock were issued and outstanding as of June 30, 2015. The preferred stock is subject to mandatory conversion provisions upon and initial public offering and are not redeemable.
Series Seed Preferred Stock - Convertible
As of June 30, 2015, there were 7,287,315shares of $0.001 par value Series Seed Preferred Stock issued and outstanding. The Series Seed Preferred Stockholders are entitled to equal voting rights to common stockholders on an as-converted basis, contain certain dilution protections, have a dividend preference of $0.0216 per share (secondary to Series A Preferred Stock), and are convertible on a 1:1 basis to common stock. The Series Seed Preferred Stock have a liquidation preference of $0.27 per share, which is subordinate to the liquidation preference on Series A Preferred Stock.
Series A Preferred Stock – Convertible
As of June 30, 2015, there were 5,830,306 of $0.001 par value Series A Preferred Stock issued and outstanding. The Series A Preferred Stockholders are entitled to equal voting rights to common stockholders on an as-converted basis, contain certain dilution protections, have a dividend preference of $0.0384 per share, and are convertible on a 1:1 basis to common stock. The Series A Preferred Stock have a liquidation preference of $0.4758 per share.
NOTE 5: SHARE-BASED PAYMENTS
Equity Incentive Plan
The 2010 Equity Incentive Plan (the "Plan") of the Company was approved by the written consent of the holder of a majority of the Company's outstanding common stock. The Plan provides the Company the ability to grant to any employee, director or consultants who provides services to the Company or any related entity, options, stock appreciation rights, restricted stock awards, restricted stock units, provided that only employees are entitled to receive incentive stock options in accordance with IRS guidelines. The Company reserved 3,430,471 shares of common stock for delivery under the Plan. Pursuant to the Equity Incentive Plan and the employment agreements, between January 1, 2011 and June 30, 2015, the Compensation Committee of the Company's Board of Directors authorized the grants of stock options described below.
10
Notes To Financial Statements (unaudited)
As of and for the six months ended June 30, 2015
Stock Options
The following table summarizes the Company's stock option activity:
| Six Months Ended June 30, 2015 | ||||||
| Weighted Average | ||||||
| Options | Exercise Price | |||||
| Outstanding – January 1, 2015 | 2,421,373 | $ | 0.2700 | |||
| Granted | 815,500 | $ | 0.3865 | |||
| Exercised | - | $ | - | |||
| Forfeited | - | $ | - | |||
| Outstanding – June 30, 2015 | 3,236,873 | $ | 0.2994 | |||
| Exercisable at June 30, 2015 | 1,785,235 | $ | 0.2324 | |||
| Weighted-average fair value of options granted during the six months ending June 30, 2015: | $ | 0.0881 | ||||
The weighted average duration to expiration of outstanding options as of June 30, 2015 was 7.7 years for the $0.27 options and 10 years for the $.04758 options.
June 30, 2015
| Weighted Average | Weighted Average | ||||||||||||||
| Exercise Prices of | Exercise Prices of | ||||||||||||||
| Outstanding | Outstanding | Contractual | Exercisable | Exercisable | |||||||||||
| Exercise Prices | Options | Options | life | Options | Options | ||||||||||
| $ 0.27 | 2,784,373 | $ | 0.27 | 120 months | 1,784,610 | $ | 0.27 | ||||||||
| $ 0.48 | 452,500 | $ | 0.48 | 120 months | 625 | $ | 0.48 |
The Company measures employee stock-based awards at grant-date fair value and recognizes employee compensation expense on a straight-line basis over the vesting period of the award.
Determining the appropriate fair value of stock-based awards requires the input of subjective assumptions, including the fair value of the Company’s common stock, and for stock options, the expected life of the option, and expected stock price volatility. The Company used the Black-Scholes option pricing model to value its stock option awards. The assumptions used in calculating the fair value of stock-based awards represent management’s best estimates and involve inherent uncertainties and the application of management’s judgment. As a result, if factors change and management uses different assumptions, stock-based compensation expense could be materially different for future awards.
The expected life of stock options was estimated using the “simplified method,” as the Company has no historical information to develop reasonable expectations about future exercise patterns and employment duration for its stock options grants. The simplified method is based on the average of the vesting tranches and the contractual life of each grant. For stock price volatility, the Company uses comparable public companies as a basis for its expected volatility to calculate the fair value of options grants. The risk-free interest rate is based on U.S. Treasury notes with a term approximating the expected life of the option.
11
Notes To Financial Statements (unaudited)
As of and for the six months ended June 30, 2015
The estimation of the number of stock awards that will ultimately vest requires judgment, and to the extent actual results or updated estimates differ from the Company’s current estimates, such amounts are recognized as an adjustment in the period in which estimates are revised.
Stock-based compensation expense related to stock options included in compensation & benefits expenses for the six months ending June 30, 2015 was to $15,487.
Grants to non-employees are expensed at the earlier of (i) the date at which a commitment for performance by the counter party to earn the equity instrument is reached and (ii) the date at which the counter party’s performance is complete. Performance is typically completed monthly. No non-employee awards were issued for the six months ended June 30, 2015.
Total compensation cost related to nonvested awards not yet recognized as of June 30, 2015 was $111,519 and will be recognized over a weighted-average period of approximately 20 months.
NOTE 6: SUBSEQUENT EVENTS
Note Receivable to Related Party
In September 2015, the Company issued a $100,000 note to the founding and majority stockholder. The note bears interest of 1.89% per annum and matures on September 2022. No payments are required on the note until maturity when all principal and unpaid interest come due, though the note can be prepaid at any time without penalty. The note is collateralized by 900,739 shares of Common Stock held by the founding and majority stockholder.
Authorized Shares
On September 29, 2015 the Company filed an Amended and Restated Certificate of Incorporation to authorize the following shares: Common Stock: 30,000,000 shares at $0.001 par value per share, Preferred Stock: 16,002,546 shares at $0.001 par value per share, designated as follows: Series Seed Preferred Stock: 7,287,315 shares, Series A Preferred Stock: 6,030,306 shares, Series A-1 Preferred Stock: 2,684,925 shares
Series A-1 Preferred Stock
The Company is authorized to issue 2,684,925 shares of Series A-1 Preferred Stock at $.001 par value. In October 2015 the Company issued 581,838 shares of the Series A-1 Preferred Stock at $0.7449 per share, providing gross proceeds of $433,411. Given the absence of quoted prices in active markets and the lack of previous sales of the Company’s preferred stock, the Company determined the fair value of the initial shares issued to be the consideration paid by the stockholder of $0.7449 per share. In making this determination, the Company considered that there had been no transactions or activity prior to or immediately subsequent to the stock sale.
12
PART III
INDEX TO EXHIBITS
| Exhibit 1. Placement Agreement with North Capital Private Securities Corporation* |
| Exhibit 2.1 Second Amended and Restated Certificate of Incorporation* |
| Exhibit 2.2 Bylaws* |
| Exhibit 3.1 Amended and Restated Investors’ Rights Agreement* |
| Exhibit 3.2 Amended and Restated First Refusal and Co-sale Agreement* |
| Exhibit 4. Subscription Agreement* |
| Exhibit 5. Voting Agreement* |
| Exhibit 6.1 Employment Agreements* |
| Exhibit 8. Escrow Agreement* |
| Exhibit 11. Consent of Auditor |
| Exhibit 12. Attorney opinion on legality of the offering* |
| Exhibit 13. “Testing the waters” materials* |
*To be filed by amendment to this Offering Circular
SIGNATURES
Pursuant to the requirements of Regulation A, the issuer certifies that it has reasonable grounds to believe that it meets all of the requirements for filing on Form 1-A and has duly caused this Offering Statement to be signed on its behalf by the undersigned, thereunto duly authorized, in the City of New York, State of New York, on October 23, 2015.
WayBetter, Inc.
| By | /s/ James Rosen |
| James Rosen, Chief Executive Officer of | |
| WayBetter, Inc. |
This Offering Statement has been signed by the following persons in the capacities and on the dates indicated.
/s/ James Rosen
James Rosen, Chief Executive Officer and Chairman of the Board
Date: October 23, 2015
/s/ Matthew Daniel
Matthew Daniel, Chief Financial Officer
Date: October 23, 2015
/s/ Amy Prager-Taylor
Amy Prager-Taylor, Chief Accounting Officer
Date: October 23, 2015
/s/ Randy Nicolau
Randy Nicolau, Director
Date: October 23, 2015
/s/ Patrick George
Patrick George, Director
Date: October 23, 2015