Free Writing Prospectus
Filed Pursuant To Rule 433
Registration No. 333-206640
November 30, 2017
THE STRATEGIC CASE FOR THE SPDR® LONG DOLLAR GOLD TRUST (GLDW)
In a Global Multi-Asset Portfolio
By SPDR Gold Strategy and Research Team
The performance of the Solactive GLD® Long USD Gold Index for certain periods provided in this material is hypothetical and for informational purposes only. It was calculated with the benefit of hindsight and does not represent past performance.
Past performance, whether actual or hypothetical, is not a guarantee of future performance of any investment product.
STATE STREET GLOBAL ADVISORS SPDR WORLD GOLD COUNCIL
The purpose of this paper is to showcase that gold and the SPDR® Long Dollar Gold Trust (GLDW) are not mutually exclusive portfolio diversifiers. To complement gold’s historical ability to increase portfolio diversi?cation and enhance risk-adjusted returns1, GLDW is designed to offer investors the potential bene?ts of using gold as a strategic diversi?er while seeking to mitigate the performance drag on gold that a strong US dollar environment may create. Here, continuing the analysis we began in “The Strategic Role of Gold in Today’s Global Multi-Asset Portfolio,” we analyze the impact of adding gold and hypothetical backtested data of the Solactive GLD Long USD Index that GLDW seeks to track (the “Index”) to certain multi-asset class portfolios.
Key Takeaway
Investing in both gold and GLDW can potentially improve the risk-return pro?le in sample moderately conservative, balanced and aggressive portfolios.
An investment in GLDW entails a risk of loss and the diversi?cation offered by the fund does not ensure a pro?t or guarantee against a loss.
ASSET ALLOCATION CASE STUDY
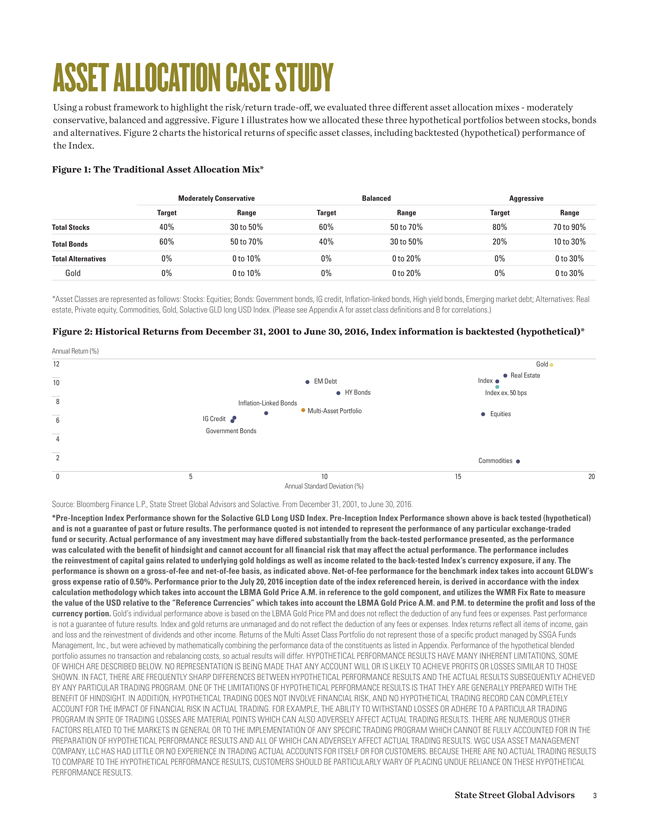
Using a robust framework to highlight the risk/return trade-off, we evaluated three different asset allocation mixes—moderately conservative, balanced and aggressive. Figure 1 illustrates how we allocated these three hypothetical portfolios between stocks, bonds and alternatives. Figure 2 charts the historical returns of speci?c asset classes, including backtested (hypothetical) performance of the Index.
Figure 1: The Traditional Asset Allocation Mix*
Moderately Conservative Balanced Aggressive Target Range Target Range Target Range Total Stocks 40% 30 to 50% 60% 50 to 70% 80% 70 to 90% Total Bonds 60% 50 to 70% 40% 30 to 50% 20% 10 to 30% Total Alternatives 0% 0 to 10% 0% 0 to 20% 0% 0 to 30% Gold 0% 0 to 10% 0% 0 to 20% 0% 0 to 30%
*Asset Classes are represented as follows: Stocks: Equities; Bonds: Government bonds, IG credit, Inflation-linked bonds, High yield bonds, Emerging market debt; Alternatives: Real estate, Private equity, Commodities, Gold, Solactive GLD long USD Index. (Please see Appendix A for asset class definitions and B for correlations.)
Figure 2: Historical Returns from December 31, 2001 to June 30, 2016, Index information is backtested (hypothetical)*
Annual Return (%)
12 Gold Real Estate
10 EM Debt Index
HY Bonds Index ex. 50 bps
| 8 | In?ation-Linked Bonds |
Multi-Asset Portfolio Equities
| 6 | IG Credit |
Government Bonds
| 4 |
| 2 | Commodities |
0 5 10 15 20
Annual Standard Deviation (%)
Source: Bloomberg Finance L.P., State Street Global Advisors and Solactive. From December 31, 2001, to June 30, 2016.
*Pre-Inception Index Performance shown for the Solactive GLD Long USD Index. Pre-Inception Index Performance shown above is back tested (hypothetical) and is not a guarantee of past or future results. The performance quoted is not intended to represent the performance of any particular exchange-traded fund or security. Actual performance of any investment may have differed substantially from the back-tested performance presented, as the performance was calculated with the benefit of hindsight and cannot account for all financial risk that may affect the actual performance. The performance includes the reinvestment of capital gains related to underlying gold holdings as well as income related to the back-tested Index’s currency exposure, if any. The performance is shown on a gross-of-fee and net-of-fee basis, as indicated above. Net-of-fee performance for the benchmark index takes into account GLDW’s gross expense ratio of 0.50%. Performance prior to the July 20, 2016 inception date of the index referenced herein, is derived in accordance with the index calculation methodology which takes into account the LBMA Gold Price A.M. in reference to the gold component, and utilizes the WMR Fix Rate to measure the value of the USD relative to the “Reference Currencies” which takes into account the LBMA Gold Price A.M. and P.M. to determine the profit and loss of the currency portion. Gold’s individual performance above is based on the LBMA Gold Price PM and does not reflect the deduction of any fund fees or expenses. Past performance is not a guarantee of future results. Index and gold returns are unmanaged and do not reflect the deduction of any fees or expenses. Index returns reflect all items of income, gain and loss and the reinvestment of dividends and other income. Returns of the Multi Asset Class Portfolio do not represent those of a specific product managed by SSGA Funds
Management, Inc., but were achieved by mathematically combining the performance data of the constituents as listed in Appendix. Performance of the hypothetical blended portfolio assumes no transaction and rebalancing costs, so actual results will differ. HYPOTHETICAL PERFORMANCE RESULTS HAVE MANY INHERENT LIMITATIONS, SOME OF WHICH ARE DESCRIBED BELOW. NO REPRESENTATION IS BEING MADE THAT ANY ACCOUNT WILL OR IS LIKELY TO ACHIEVE PROFITS OR LOSSES SIMILAR TO THOSE SHOWN. IN FACT, THERE ARE FREQUENTLY SHARP DIFFERENCES BETWEEN HYPOTHETICAL PERFORMANCE RESULTS AND THE ACTUAL RESULTS SUBSEQUENTLY ACHIEVED BY ANY PARTICULAR TRADING PROGRAM. ONE OF THE LIMITATIONS OF HYPOTHETICAL PERFORMANCE RESULTS IS THAT THEY ARE GENERALLY PREPARED WITH THE BENEFIT OF HINDSIGHT. IN ADDITION, HYPOTHETICAL TRADING DOES NOT INVOLVE FINANCIAL RISK, AND NO HYPOTHETICAL TRADING RECORD CAN COMPLETELY
ACCOUNT FOR THE IMPACT OF FINANCIAL RISK IN ACTUAL TRADING. FOR EXAMPLE, THE ABILITY TO WITHSTAND LOSSES OR ADHERE TO A PARTICULAR TRADING PROGRAM IN SPITE OF TRADING LOSSES ARE MATERIAL POINTS WHICH CAN ALSO ADVERSELY AFFECT ACTUAL TRADING RESULTS. THERE ARE NUMEROUS OTHER FACTORS RELATED TO THE MARKETS IN GENERAL OR TO THE IMPLEMENTATION OF ANY SPECIFIC TRADING PROGRAM WHICH CANNOT BE FULLY ACCOUNTED FOR IN THE PREPARATION OF HYPOTHETICAL PERFORMANCE RESULTS AND ALL OF WHICH CAN ADVERSELY AFFECT ACTUAL TRADING RESULTS. WGC USA ASSET MANAGEMENT COMPANY, LLC HAS HAD LITTLE OR NO EXPERIENCE IN TRADING ACTUAL ACCOUNTS FOR ITSELF OR FOR CUSTOMERS. BECAUSE THERE ARE NO ACTUAL TRADING RESULTS TO COMPARE TO THE HYPOTHETICAL PERFORMANCE RESULTS, CUSTOMERS SHOULD BE PARTICULARLY WARY OF PLACING UNDUE RELIANCE ON THESE HYPOTHETICAL PERFORMANCE RESULTS.
State Street Global Advisors 3
The Strategic Case for GLDW
Moderately Conservative Portfolios
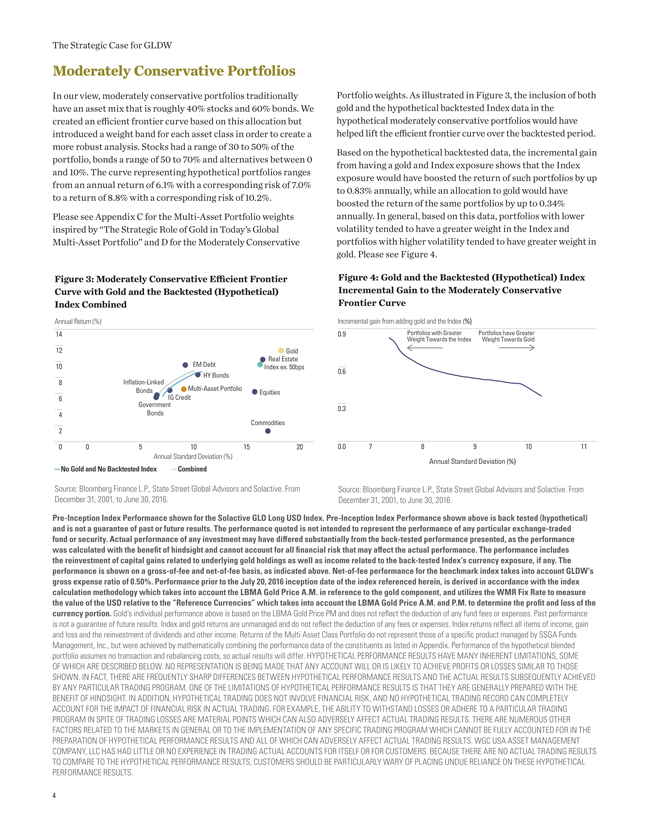
In our view, moderately conservative portfolios traditionally Portfolio weights. As illustrated in Figure 3, the inclusion of both have an asset mix that is roughly 40% stocks and 60% bonds. We gold and the hypothetical backtested Index data in the created an efficient frontier curve based on this allocation but hypothetical moderately conservative portfolios would have introduced a weight band for each asset class in order to create a helped lift the efficient frontier curve over the backtested period. more robust analysis. Stocks had a range of 30 to 50% of the Based on the hypothetical backtested data, the incremental gain portfolio, bonds a range of 50 to 70% and alternatives between 0 from having a gold and Index exposure shows that the Index and 10%. The curve representing hypothetical portfolios ranges exposure would have boosted the return of such portfolios by up from an annual return of 6.1% with a corresponding risk of 7.0% to 0.83% annually, while an allocation to gold would have to a return of 8.8% with a corresponding risk of 10.2%. boosted the return of the same portfolios by up to 0.34% Please see Appendix C for the Multi-Asset Portfolio weights annually. In general, based on this data, portfolios with lower inspired by “The Strategic Role of Gold in Today’s Global volatility tended to have a greater weight in the Index and Multi-Asset Portfolio” and D for the Moderately Conservative portfolios with higher volatility tended to have greater weight in gold. Please see Figure 4.
Figure 3: Moderately Conservative Efficient Frontier Figure 4: Gold and the Backtested (Hypothetical) Index Curve with Gold and the Backtested (Hypothetical) Incremental Gain to the Moderately Conservative Index Combined Frontier Curve
Annual Return (%) Incremental gain from adding gold and the Index (%)
14 0.9 Portfolios Weight Towards with Greater the Index Portfolios Weight Towards have Greater Gold
12 Gold Real Estate
10 EM Debt Index ex. 50bps 0.6
| 8 | In?ation-Linked HY Bonds Bonds Multi-Asset Portfolio |
Equities
| 6 | Government IG Credit |
0.3
| 4 | Bonds |
Commodities
| 2 |
0 0 5 10 15 20 0.0 7 8 9 10 11
Annual Standard Deviation (%)
Annual Standard Deviation (%)
— No Gold and No Backtested Inde — ombined
Source: Bloomberg Finance L.P., State Street Global Advisors and Solactive. From Source: Bloomberg Finance L.P., State Street Global Advisors and Solactive. From December 31, 2001, to June 30, 2016. December 31, 2001, to June 30, 2016.
Pre-Inception Index Performance shown for the Solactive GLD Long USD Index. Pre-Inception Index Performance shown above is back tested (hypothetical) and is not a guarantee of past or future results. The performance quoted is not intended to represent the performance of any particular exchange-traded fund or security. Actual performance of any investment may have differed substantially from the back-tested performance presented, as the performance was calculated with the benefit of hindsight and cannot account for all financial risk that may affect the actual performance. The performance includes the reinvestment of capital gains related to underlying gold holdings as well as income related to the back-tested Index’s currency exposure, if any. The performance is shown on a gross-of-fee and net-of-fee basis, as indicated above. Net-of-fee performance for the benchmark index takes into account GLDW’s gross expense ratio of 0.50%. Performance prior to the July 20, 2016 inception date of the index referenced herein, is derived in accordance with the index calculation methodology which takes into account the LBMA Gold Price A.M. in reference to the gold component, and utilizes the WMR Fix Rate to measure the value of the USD relative to the “Reference Currencies” which takes into account the LBMA Gold Price A.M. and P.M. to determine the profit and loss of the currency portion. Gold’s individual performance above is based on the LBMA Gold Price PM and does not reflect the deduction of any fund fees or expenses. Past performance is not a guarantee of future results. Index and gold returns are unmanaged and do not reflect the deduction of any fees or expenses. Index returns reflect all items of income, gain and loss and the reinvestment of dividends and other income. Returns of the Multi Asset Class Portfolio do not represent those of a specific product managed by SSGA Funds
Management, Inc., but were achieved by mathematically combining the performance data of the constituents as listed in Appendix. Performance of the hypothetical blended portfolio assumes no transaction and rebalancing costs, so actual results will differ. HYPOTHETICAL PERFORMANCE RESULTS HAVE MANY INHERENT LIMITATIONS, SOME OF WHICH ARE DESCRIBED BELOW. NO REPRESENTATION IS BEING MADE THAT ANY ACCOUNT WILL OR IS LIKELY TO ACHIEVE PROFITS OR LOSSES SIMILAR TO THOSE SHOWN. IN FACT, THERE ARE FREQUENTLY SHARP DIFFERENCES BETWEEN HYPOTHETICAL PERFORMANCE RESULTS AND THE ACTUAL RESULTS SUBSEQUENTLY ACHIEVED BY ANY PARTICULAR TRADING PROGRAM. ONE OF THE LIMITATIONS OF HYPOTHETICAL PERFORMANCE RESULTS IS THAT THEY ARE GENERALLY PREPARED WITH THE BENEFIT OF HINDSIGHT. IN ADDITION, HYPOTHETICAL TRADING DOES NOT INVOLVE FINANCIAL RISK, AND NO HYPOTHETICAL TRADING RECORD CAN COMPLETELY
ACCOUNT FOR THE IMPACT OF FINANCIAL RISK IN ACTUAL TRADING. FOR EXAMPLE, THE ABILITY TO WITHSTAND LOSSES OR ADHERE TO A PARTICULAR TRADING PROGRAM IN SPITE OF TRADING LOSSES ARE MATERIAL POINTS WHICH CAN ALSO ADVERSELY AFFECT ACTUAL TRADING RESULTS. THERE ARE NUMEROUS OTHER FACTORS RELATED TO THE MARKETS IN GENERAL OR TO THE IMPLEMENTATION OF ANY SPECIFIC TRADING PROGRAM WHICH CANNOT BE FULLY ACCOUNTED FOR IN THE PREPARATION OF HYPOTHETICAL PERFORMANCE RESULTS AND ALL OF WHICH CAN ADVERSELY AFFECT ACTUAL TRADING RESULTS. WGC USA ASSET MANAGEMENT COMPANY, LLC HAS HAD LITTLE OR NO EXPERIENCE IN TRADING ACTUAL ACCOUNTS FOR ITSELF OR FOR CUSTOMERS. BECAUSE THERE ARE NO ACTUAL TRADING RESULTS TO COMPARE TO THE HYPOTHETICAL PERFORMANCE RESULTS, CUSTOMERS SHOULD BE PARTICULARLY WARY OF PLACING UNDUE RELIANCE ON THESE HYPOTHETICAL PERFORMANCE RESULTS.
| 4 |
Balanced Portfolios
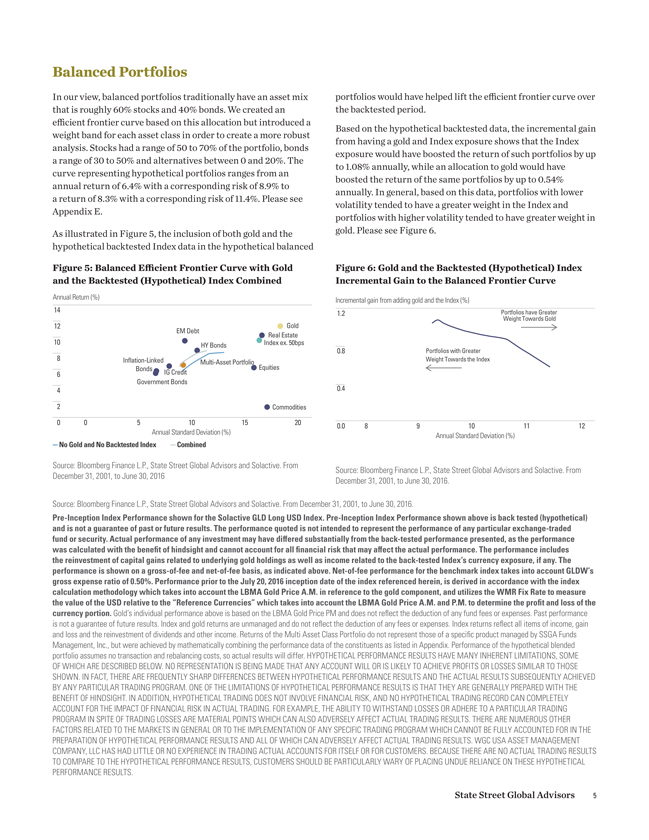
In our view, balanced portfolios traditionally have an asset mix portfolios would have helped lift the efficient frontier curve over that is roughly 60% stocks and 40% bonds. We created an the backtested period. efficient frontier curve based on this allocation but introduced a Based on the hypothetical backtested data, the incremental gain weight band for each asset class in order to create a more robust from having a gold and Index exposure shows that the Index analysis. Stocks had a range of 50 to 70% of the portfolio, bonds exposure would have boosted the return of such portfolios by up a range of 30 to 50% and alternatives between 0 and 20%. The to 1.08% annually, while an allocation to gold would have curve representing hypothetical portfolios ranges from an boosted the return of the same portfolios by up to 0.54% annual return of 6.4% with a corresponding risk of 8.9% to annually. In general, based on this data, portfolios with lower a return of 8.3% with a corresponding risk of 11.4%. Please see volatility tended to have a greater weight in the Index and Appendix E. portfolios with higher volatility tended to have greater weight in As illustrated in Figure 5, the inclusion of both gold and the gold. Please see Figure 6. hypothetical backtested Index data in the hypothetical balanced
Figure 5: Balanced Efficient Frontier Curve with Gold Figure 6: Gold and the Backtested (Hypothetical) Index and the Backtested (Hypothetical) Index Combined Incremental Gain to the Balanced Frontier Curve
Annual Return (%) Incremental gain from adding gold and the Index (%)
14 1.2 Portfolios have Greater
12 Gold Weight Towards Gold
EM Debt
10 Real Estate HY Bonds Index ex. 50bps
| 8 | 0.8 Portfolios with Greater |
In?ation-Linked Multi-Asset Portfolio Weight Towards the Index Bonds Equities
| 6 | IG Credit Government Bonds |
| 4 | 0.4 |
| 2 | Commodities |
0 0 5 10 15 20 0.0 8 9 10 11 12
Annual Standard Deviation (%) Annual Standard Deviation (%)
— No Gold and No Backtested Inde — ombined
Source: Bloomberg Finance L.P., State Street Global Advisors and Solactive. From
Source: Bloomberg Finance L.P., State Street Global Advisors and Solactive. From December 31, 2001, to June 30, 2016 December 31, 2001, to June 30, 2016.
Source: Bloomberg Finance L.P., State Street Global Advisors and Solactive. From December 31, 2001, to June 30, 2016.
Pre-Inception Index Performance shown for the Solactive GLD Long USD Index. Pre-Inception Index Performance shown above is back tested (hypothetical) and is not a guarantee of past or future results. The performance quoted is not intended to represent the performance of any particular exchange-traded fund or security. Actual performance of any investment may have differed substantially from the back-tested performance presented, as the performance was calculated with the benefit of hindsight and cannot account for all financial risk that may affect the actual performance. The performance includes the reinvestment of capital gains related to underlying gold holdings as well as income related to the back-tested Index’s currency exposure, if any. The performance is shown on a gross-of-fee and net-of-fee basis, as indicated above. Net-of-fee performance for the benchmark index takes into account GLDW’s gross expense ratio of 0.50%. Performance prior to the July 20, 2016 inception date of the index referenced herein, is derived in accordance with the index calculation methodology which takes into account the LBMA Gold Price A.M. in reference to the gold component, and utilizes the WMR Fix Rate to measure the value of the USD relative to the “Reference Currencies” which takes into account the LBMA Gold Price A.M. and P.M. to determine the profit and loss of the currency portion. Gold’s individual performance above is based on the LBMA Gold Price PM and does not reflect the deduction of any fund fees or expenses. Past performance is not a guarantee of future results. Index and gold returns are unmanaged and do not reflect the deduction of any fees or expenses. Index returns reflect all items of income, gain and loss and the reinvestment of dividends and other income. Returns of the Multi Asset Class Portfolio do not represent those of a specific product managed by SSGA Funds
Management, Inc., but were achieved by mathematically combining the performance data of the constituents as listed in Appendix. Performance of the hypothetical blended portfolio assumes no transaction and rebalancing costs, so actual results will differ. HYPOTHETICAL PERFORMANCE RESULTS HAVE MANY INHERENT LIMITATIONS, SOME OF WHICH ARE DESCRIBED BELOW. NO REPRESENTATION IS BEING MADE THAT ANY ACCOUNT WILL OR IS LIKELY TO ACHIEVE PROFITS OR LOSSES SIMILAR TO THOSE SHOWN. IN FACT, THERE ARE FREQUENTLY SHARP DIFFERENCES BETWEEN HYPOTHETICAL PERFORMANCE RESULTS AND THE ACTUAL RESULTS SUBSEQUENTLY ACHIEVED BY ANY PARTICULAR TRADING PROGRAM. ONE OF THE LIMITATIONS OF HYPOTHETICAL PERFORMANCE RESULTS IS THAT THEY ARE GENERALLY PREPARED WITH THE BENEFIT OF HINDSIGHT. IN ADDITION, HYPOTHETICAL TRADING DOES NOT INVOLVE FINANCIAL RISK, AND NO HYPOTHETICAL TRADING RECORD CAN COMPLETELY
ACCOUNT FOR THE IMPACT OF FINANCIAL RISK IN ACTUAL TRADING. FOR EXAMPLE, THE ABILITY TO WITHSTAND LOSSES OR ADHERE TO A PARTICULAR TRADING PROGRAM IN SPITE OF TRADING LOSSES ARE MATERIAL POINTS WHICH CAN ALSO ADVERSELY AFFECT ACTUAL TRADING RESULTS. THERE ARE NUMEROUS OTHER FACTORS RELATED TO THE MARKETS IN GENERAL OR TO THE IMPLEMENTATION OF ANY SPECIFIC TRADING PROGRAM WHICH CANNOT BE FULLY ACCOUNTED FOR IN THE PREPARATION OF HYPOTHETICAL PERFORMANCE RESULTS AND ALL OF WHICH CAN ADVERSELY AFFECT ACTUAL TRADING RESULTS. WGC USA ASSET MANAGEMENT COMPANY, LLC HAS HAD LITTLE OR NO EXPERIENCE IN TRADING ACTUAL ACCOUNTS FOR ITSELF OR FOR CUSTOMERS. BECAUSE THERE ARE NO ACTUAL TRADING RESULTS TO COMPARE TO THE HYPOTHETICAL PERFORMANCE RESULTS, CUSTOMERS SHOULD BE PARTICULARLY WARY OF PLACING UNDUE RELIANCE ON THESE HYPOTHETICAL PERFORMANCE RESULTS.
State Street Global Advisors 5
The Strategic Case for GLDW
Aggressive Portfolios
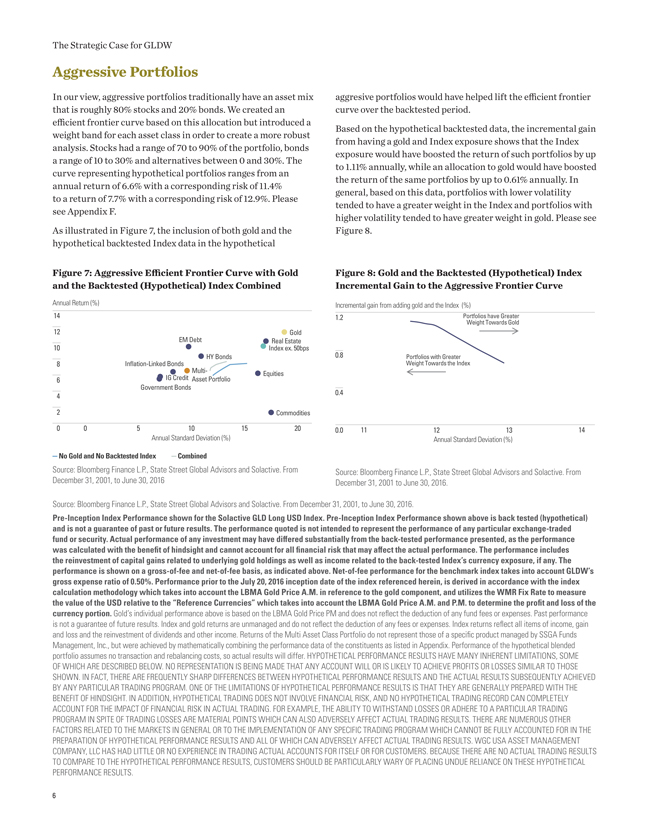
In our view, aggressive portfolios traditionally have an asset mix aggresive portfolios would have helped lift the efficient frontier that is roughly 80% stocks and 20% bonds. We created an curve over the backtested period. efficient frontier curve based on this allocation but introduced a Based on the hypothetical backtested data, the incremental gain weight band for each asset class in order to create a more robust from having a gold and Index exposure shows that the Index analysis. Stocks had a range of 70 to 90% of the portfolio, bonds exposure would have boosted the return of such portfolios by up a range of 10 to 30% and alternatives between 0 and 30%. The to 1.11% annually, while an allocation to gold would have boosted curve representing hypothetical portfolios ranges from an the return of the same portfolios by up to 0.61% annually. In annual return of 6.6% with a corresponding risk of 11.4% general, based on this data, portfolios with lower volatility to a return of 7.7% with a corresponding risk of 12.9%. Please tended to have a greater weight in the Index and portfolios with see Appendix F. higher volatility tended to have greater weight in gold. Please see As illustrated in Figure 7, the inclusion of both gold and the Figure 8. hypothetical backtested Index data in the hypothetical
Figure 7: Aggressive Efficient Frontier Curve with Gold Figure 8: Gold and the Backtested (Hypothetical) Index and the Backtested (Hypothetical) Index Combined Incremental Gain to the Aggressive Frontier Curve
Annual Return (%) Incremental gain from adding gold and the Index (%)
14 1.2 Portfolios Weight Towards have Greater Gold
12 Gold EM Debt Real Estate
10 Index ex. 50bps 0.8
| 8 | In?ation-Linked Bonds HY Bonds Weight Portfolios Towards with Greater the Index |
IG Credit Multi- Equities
| 6 | Asset Portfolio Government Bonds |
| 4 | 0.4 |
| 2 | Commodities |
0 0 5 10 15 20 0.0 11 12 13 14
Annual Standard Deviation (%) Annual Standard Deviation (%)
— No Gold and No Backtested Inde — ombined
Source: Bloomberg Finance L.P., State Street Global Advisors and Solactive. From Source: Bloomberg Finance L.P., State Street Global Advisors and Solactive. From December 31, 2001, to June 30, 2016 December 31, 2001 to June 30, 2016.
Source: Bloomberg Finance L.P., State Street Global Advisors and Solactive. From December 31, 2001, to June 30, 2016.
Pre-Inception Index Performance shown for the Solactive GLD Long USD Index. Pre-Inception Index Performance shown above is back tested (hypothetical) and is not a guarantee of past or future results. The performance quoted is not intended to represent the performance of any particular exchange-traded fund or security. Actual performance of any investment may have differed substantially from the back-tested performance presented, as the performance was calculated with the benefit of hindsight and cannot account for all financial risk that may affect the actual performance. The performance includes the reinvestment of capital gains related to underlying gold holdings as well as income related to the back-tested Index’s currency exposure, if any. The performance is shown on a gross-of-fee and net-of-fee basis, as indicated above. Net-of-fee performance for the benchmark index takes into account GLDW’s gross expense ratio of 0.50%. Performance prior to the July 20, 2016 inception date of the index referenced herein, is derived in accordance with the index calculation methodology which takes into account the LBMA Gold Price A.M. in reference to the gold component, and utilizes the WMR Fix Rate to measure the value of the USD relative to the “Reference Currencies” which takes into account the LBMA Gold Price A.M. and P.M. to determine the profit and loss of the currency portion. Gold’s individual performance above is based on the LBMA Gold Price PM and does not reflect the deduction of any fund fees or expenses. Past performance is not a guarantee of future results. Index and gold returns are unmanaged and do not reflect the deduction of any fees or expenses. Index returns reflect all items of income, gain and loss and the reinvestment of dividends and other income. Returns of the Multi Asset Class Portfolio do not represent those of a specific product managed by SSGA Funds
Management, Inc., but were achieved by mathematically combining the performance data of the constituents as listed in Appendix. Performance of the hypothetical blended portfolio assumes no transaction and rebalancing costs, so actual results will differ. HYPOTHETICAL PERFORMANCE RESULTS HAVE MANY INHERENT LIMITATIONS, SOME OF WHICH ARE DESCRIBED BELOW. NO REPRESENTATION IS BEING MADE THAT ANY ACCOUNT WILL OR IS LIKELY TO ACHIEVE PROFITS OR LOSSES SIMILAR TO THOSE SHOWN. IN FACT, THERE ARE FREQUENTLY SHARP DIFFERENCES BETWEEN HYPOTHETICAL PERFORMANCE RESULTS AND THE ACTUAL RESULTS SUBSEQUENTLY ACHIEVED BY ANY PARTICULAR TRADING PROGRAM. ONE OF THE LIMITATIONS OF HYPOTHETICAL PERFORMANCE RESULTS IS THAT THEY ARE GENERALLY PREPARED WITH THE BENEFIT OF HINDSIGHT. IN ADDITION, HYPOTHETICAL TRADING DOES NOT INVOLVE FINANCIAL RISK, AND NO HYPOTHETICAL TRADING RECORD CAN COMPLETELY
ACCOUNT FOR THE IMPACT OF FINANCIAL RISK IN ACTUAL TRADING. FOR EXAMPLE, THE ABILITY TO WITHSTAND LOSSES OR ADHERE TO A PARTICULAR TRADING PROGRAM IN SPITE OF TRADING LOSSES ARE MATERIAL POINTS WHICH CAN ALSO ADVERSELY AFFECT ACTUAL TRADING RESULTS. THERE ARE NUMEROUS OTHER FACTORS RELATED TO THE MARKETS IN GENERAL OR TO THE IMPLEMENTATION OF ANY SPECIFIC TRADING PROGRAM WHICH CANNOT BE FULLY ACCOUNTED FOR IN THE PREPARATION OF HYPOTHETICAL PERFORMANCE RESULTS AND ALL OF WHICH CAN ADVERSELY AFFECT ACTUAL TRADING RESULTS. WGC USA ASSET MANAGEMENT COMPANY, LLC HAS HAD LITTLE OR NO EXPERIENCE IN TRADING ACTUAL ACCOUNTS FOR ITSELF OR FOR CUSTOMERS. BECAUSE THERE ARE NO ACTUAL TRADING RESULTS TO COMPARE TO THE HYPOTHETICAL PERFORMANCE RESULTS, CUSTOMERS SHOULD BE PARTICULARLY WARY OF PLACING UNDUE RELIANCE ON THESE HYPOTHETICAL PERFORMANCE RESULTS.
| 6 |
Key Takeaway
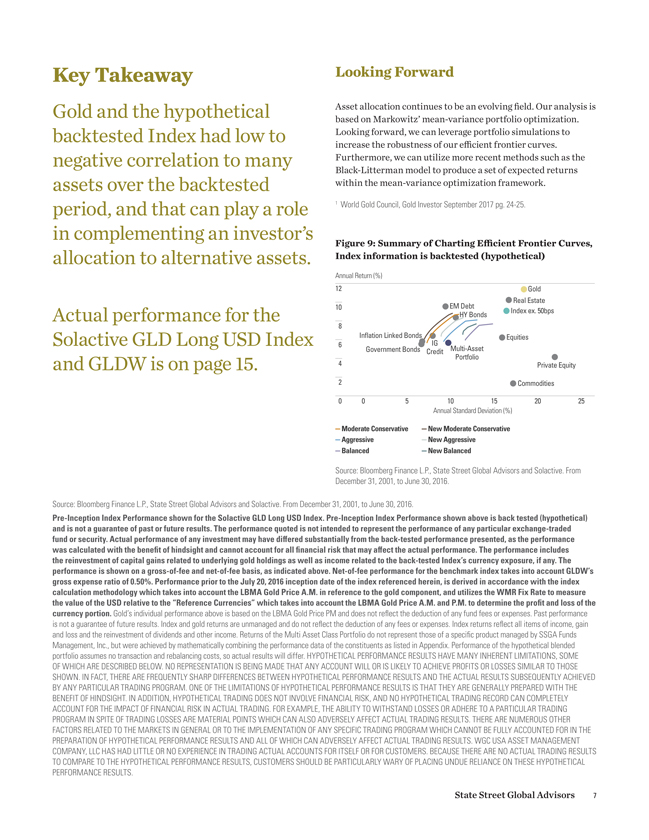
Gold and the hypothetical backtested Index had low to negative correlation to many assets over the backtested period, and that can play a role in complementing an investor’s allocation to alternative assets.
Actual performance for the Solactive GLD Long USD Index and GLDW is on page 15.
Looking Forward
Asset allocation continues to be an evolving field. Our analysis is based on Markowitz’ mean-variance portfolio optimization. Looking forward, we can leverage portfolio simulations to increase the robustness of our efficient frontier curves. Furthermore, we can utilize more recent methods such as the Black-Litterman model to produce a set of expected returns within the mean-variance optimization framework.
World Gold Council, Gold Investor September 2017 pg. 24-25.
Figure 9: Summary of Charting Efficient Frontier Curves, Index information is backtested (hypothetical)
CommoditiesEquitiesGovernment BondsGoldIndex ex. 50bpsIGCreditInflation Linked BondsHY BondsEM DebtReal EstatePrivate EquityMulti-AssetPortfolioAnnual Return (%)Annual Standard Deviation (%)0510152025810642012—New Moderate Conservative—Moderate Conservative—New Aggressive—Aggressive—New Balanced—BalancedSource: Bloomberg Finance L.P., State Street Global Advisors and Solactive. From December 31, 2001, to June 30, 2016.
Source: Bloomberg Finance L.P., State Street Global Advisors and Solactive. From December 31, 2001, to June 30, 2016.
Pre-Inception Index Performance shown for the Solactive GLD Long USD Index. Pre-Inception Index Performance shown above is back tested (hypothetical) and is not a guarantee of past or future results. The performance quoted is not intended to represent the performance of any particular exchange-traded fund or security. Actual performance of any investment may have differed substantially from the back-tested performance presented, as the performance was calculated with the benefit of hindsight and cannot account for all financial risk that may affect the actual performance. The performance includes the reinvestment of capital gains related to underlying gold holdings as well as income related to the back-tested Index’s currency exposure, if any. The performance is shown on a gross-of-fee and net-of-fee basis, as indicated above. Net-of-fee performance for the benchmark index takes into account GLDW’s gross expense ratio of 0.50%. Performance prior to the July 20, 2016 inception date of the index referenced herein, is derived in accordance with the index calculation methodology which takes into account the LBMA Gold Price A.M. in reference to the gold component, and utilizes the WMR Fix Rate to measure the value of the USD relative to the “Reference Currencies” which takes into account the LBMA Gold Price A.M. and P.M. to determine the profit and loss of the currency portion. Gold’s individual performance above is based on the LBMA Gold Price PM and does not reflect the deduction of any fund fees or expenses. Past performance is not a guarantee of future results. Index and gold returns are unmanaged and do not reflect the deduction of any fees or expenses. Index returns reflect all items of income, gain and loss and the reinvestment of dividends and other income. Returns of the Multi Asset Class Portfolio do not represent those of a specific product managed by SSGA Funds Management, Inc., but were achieved by mathematically combining the performance data of the constituents as listed in Appendix. Performance of the hypothetical blended portfolio assumes no transaction and rebalancing costs, so actual results will differ. HYPOTHETICAL PERFORMANCE RESULTS HAVE MANY INHERENT LIMITATIONS, SOME OF WHICH ARE DESCRIBED BELOW. NO REPRESENTATION IS BEING MADE THAT ANY ACCOUNT WILL OR IS LIKELY TO ACHIEVE PROFITS OR LOSSES SIMILAR TO THOSE SHOWN. IN FACT, THERE ARE FREQUENTLY SHARP DIFFERENCES BETWEEN HYPOTHETICAL PERFORMANCE RESULTS AND THE ACTUAL RESULTS SUBSEQUENTLY ACHIEVED BY ANY PARTICULAR TRADING PROGRAM. ONE OF THE LIMITATIONS OF HYPOTHETICAL PERFORMANCE RESULTS IS THAT THEY ARE GENERALLY PREPARED WITH THE BENEFIT OF HINDSIGHT. IN ADDITION, HYPOTHETICAL TRADING DOES NOT INVOLVE FINANCIAL RISK, AND NO HYPOTHETICAL TRADING RECORD CAN COMPLETELY ACCOUNT FOR THE IMPACT OF FINANCIAL RISK IN ACTUAL TRADING. FOR EXAMPLE, THE ABILITY TO WITHSTAND LOSSES OR ADHERE TO A PARTICULAR TRADING PROGRAM IN SPITE OF TRADING LOSSES ARE MATERIAL POINTS WHICH CAN ALSO ADVERSELY AFFECT ACTUAL TRADING RESULTS. THERE ARE NUMEROUS OTHER FACTORS RELATED TO THE MARKETS IN GENERAL OR TO THE IMPLEMENTATION OF ANY SPECIFIC TRADING PROGRAM WHICH CANNOT BE FULLY ACCOUNTED FOR IN THE PREPARATION OF HYPOTHETICAL PERFORMANCE RESULTS AND ALL OF WHICH CAN ADVERSELY AFFECT ACTUAL TRADING RESULTS. WGC USA ASSET MANAGEMENT COMPANY, LLC HAS HAD LITTLE OR NO EXPERIENCE IN TRADING ACTUAL ACCOUNTS FOR ITSELF OR FOR CUSTOMERS. BECAUSE THERE ARE NO ACTUAL TRADING RESULTS
TO COMPARE TO THE HYPOTHETICAL PERFORMANCE RESULTS, CUSTOMERS SHOULD BE PARTICULARLY WARY OF PLACING UNDUE RELIANCE ON THESE HYPOTHETICAL PERFORMANCE RESULTS. State Street Global Advisors 7
The Strategic Case for GLDW
APPENDIX
A. Indices
Equities MSCI AC World Daily TR Gross USD
Government Bonds Bloomberg Barclays Global Agg Government Total Return Index Value Unhedged USD Investment-Grade Bonds Bloomberg Barclays Global Agg Corporate Total Return Index Value Unhedged USD
Inflation-Linked Bonds Bloomberg Barclays World Inflation Linked Bonds Total Return Unhedged USD
High-Yield Bonds Bloomberg Barclays Global High Yield Corporate Total Return Index Unhedged USD Emerging-Market Debt Bloomberg Barclays EM USD Aggregate Total Return Index Value Unhedged USD Real Estate GPR General Index (Property Shares) World US Dollar Total Return Commodities Bloomberg Commodity Index Total Return Gold LBMA Gold Price PM USD
Index Solactive GLD Long USD Index
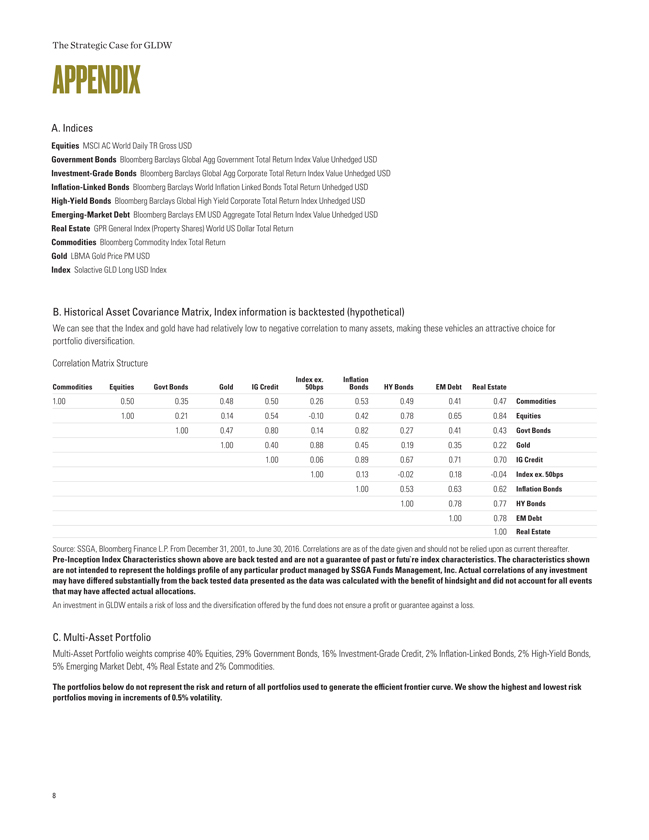
B. Historical Asset Covariance Matrix, Index information is backtested (hypothetical)
We can see that the Index and gold have had relatively low to negative correlation to many assets, making these vehicles an attractive choice for portfolio diversification.
Correlation Matrix Structure
Commodities Equities Govt Bonds Gold IG Credit Index 50bps ex. Inflation Bonds HY Bonds EM Debt Real Estate
1.00 0.50 0.35 0.48 0.50 0.26 0.53 0.49 0.41 0.47 Commodities 1.00 0.21 0.14 0.54 -0.10 0.42 0.78 0.65 0.84 Equities 1.00 0.47 0.80 0.14 0.82 0.27 0.41 0.43 Govt Bonds 1.00 0.40 0.88 0.45 0.19 0.35 0.22 Gold 1.00 0.06 0.89 0.67 0.71 0.70 IG Credit 1.00 0.13 -0.02 0.18 -0.04 Index ex. 50bps 1.00 0.53 0.63 0.62 Inflation Bonds 1.00 0.78 0.77 HY Bonds 1.00 0.78 EM Debt
1.00 Real Estate
Source: SSGA, Bloomberg Finance L.P. From December 31, 2001, to June 30, 2016. Correlations are as of the date given and should not be relied upon as current thereafter.
Pre-Inception Index Characteristics shown above are back tested and are not a guarantee of past or futu`re index characteristics. The characteristics shown are not intended to represent the holdings profile of any particular product managed by SSGA Funds Management, Inc. Actual correlations of any investment may have differed substantially from the back tested data presented as the data was calculated with the benefit of hindsight and did not account for all events that may have affected actual allocations.
An investment in GLDW entails a risk of loss and the diversification offered by the fund does not ensure a profit or guarantee against a loss.
C. Multi-Asset Portfolio
Multi-Asset Portfolio weights comprise 40% Equities, 29% Government Bonds, 16% Investment-Grade Credit, 2% Inflation-Linked Bonds, 2% High-Yield Bonds,
5% Emerging Market Debt, 4% Real Estate and 2% Commodities.
The portfolios below do not represent the risk and return of all portfolios used to generate the efficient frontier curve. We show the highest and lowest risk portfolios moving in increments of 0.5% volatility.
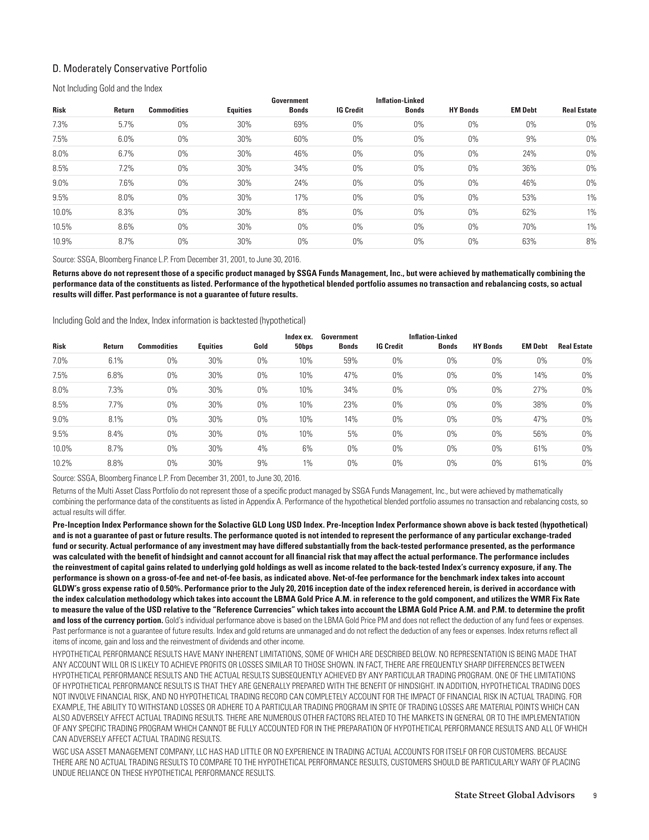
D. Moderately Conservative Portfolio
Not Including Gold and the Index
Government Inflation-Linked
Risk Return Commodities Equities Bonds IG Credit Bonds HY Bonds EM Debt Real Estate
7.3% 5.7% 0% 30% 69% 0% 0% 0% 0% 0% 7.5% 6.0% 0% 30% 60% 0% 0% 0% 9% 0% 8.0% 6.7% 0% 30% 46% 0% 0% 0% 24% 0% 8.5% 7.2% 0% 30% 34% 0% 0% 0% 36% 0% 9.0% 7.6% 0% 30% 24% 0% 0% 0% 46% 0% 9.5% 8.0% 0% 30% 17% 0% 0% 0% 53% 1% 10.0% 8.3% 0% 30% 8% 0% 0% 0% 62% 1% 10.5% 8.6% 0% 30% 0% 0% 0% 0% 70% 1% 10.9% 8.7% 0% 30% 0% 0% 0% 0% 63% 8% Source: SSGA, Bloomberg Finance L.P. From December 31, 2001, to June 30, 2016.
Returns above do not represent those of a specific product managed by SSGA Funds Management, Inc., but were achieved by mathematically combining the performance data of the constituents as listed. Performance of the hypothetical blended portfolio assumes no transaction and rebalancing costs, so actual results will differ. Past performance is not a guarantee of future results.
Including Gold and the Index, Index information is backtested (hypothetical)
Index ex. Government Inflation-Linked
Risk Return Commodities Equities Gold 50bps Bonds IG Credit Bonds HY Bonds EM Debt Real Estate
7.0% 6.1% 0% 30% 0% 10% 59% 0% 0% 0% 0% 0% 7.5% 6.8% 0% 30% 0% 10% 47% 0% 0% 0% 14% 0% 8.0% 7.3% 0% 30% 0% 10% 34% 0% 0% 0% 27% 0% 8.5% 7.7% 0% 30% 0% 10% 23% 0% 0% 0% 38% 0% 9.0% 8.1% 0% 30% 0% 10% 14% 0% 0% 0% 47% 0% 9.5% 8.4% 0% 30% 0% 10% 5% 0% 0% 0% 56% 0% 10.0% 8.7% 0% 30% 4% 6% 0% 0% 0% 0% 61% 0% 10.2% 8.8% 0% 30% 9% 1% 0% 0% 0% 0% 61% 0% Source: SSGA, Bloomberg Finance L.P. From December 31, 2001, to June 30, 2016.
Returns of the Multi Asset Class Portfolio do not represent those of a specific product managed by SSGA Funds Management, Inc., but were achieved by mathematically combining the performance data of the constituents as listed in Appendix A. Performance of the hypothetical blended portfolio assumes no transaction and rebalancing costs, so actual results will differ.
Pre-Inception Index Performance shown for the Solactive GLD Long USD Index. Pre-Inception Index Performance shown above is back tested (hypothetical) and is not a guarantee of past or future results. The performance quoted is not intended to represent the performance of any particular exchange-traded fund or security. Actual performance of any investment may have differed substantially from the back-tested performance presented, as the performance was calculated with the benefit of hindsight and cannot account for all financial risk that may affect the actual performance. The performance includes the reinvestment of capital gains related to underlying gold holdings as well as income related to the back-tested Index’s currency exposure, if any. The performance is shown on a gross-of-fee and net-of-fee basis, as indicated above. Net-of-fee performance for the benchmark index takes into account GLDW’s gross expense ratio of 0.50%. Performance prior to the July 20, 2016 inception date of the index referenced herein, is derived in accordance with the index calculation methodology which takes into account the LBMA Gold Price A.M. in reference to the gold component, and utilizes the WMR Fix Rate to measure the value of the USD relative to the “Reference Currencies” which takes into account the LBMA Gold Price A.M. and P.M. to determine the profit and loss of the currency portion. Gold’s individual performance above is based on the LBMA Gold Price PM and does not reflect the deduction of any fund fees or expenses. Past performance is not a guarantee of future results. Index and gold returns are unmanaged and do not reflect the deduction of any fees or expenses. Index returns reflect all items of income, gain and loss and the reinvestment of dividends and other income.
HYPOTHETICAL PERFORMANCE RESULTS HAVE MANY INHERENT LIMITATIONS, SOME OF WHICH ARE DESCRIBED BELOW. NO REPRESENTATION IS BEING MADE THAT ANY ACCOUNT WILL OR IS LIKELY TO ACHIEVE PROFITS OR LOSSES SIMILAR TO THOSE SHOWN. IN FACT, THERE ARE FREQUENTLY SHARP DIFFERENCES BETWEEN HYPOTHETICAL PERFORMANCE RESULTS AND THE ACTUAL RESULTS SUBSEQUENTLY ACHIEVED BY ANY PARTICULAR TRADING PROGRAM. ONE OF THE LIMITATIONS OF HYPOTHETICAL PERFORMANCE RESULTS IS THAT THEY ARE GENERALLY PREPARED WITH THE BENEFIT OF HINDSIGHT. IN ADDITION, HYPOTHETICAL TRADING DOES NOT INVOLVE FINANCIAL RISK, AND NO HYPOTHETICAL TRADING RECORD CAN COMPLETELY ACCOUNT FOR THE IMPACT OF FINANCIAL RISK IN ACTUAL TRADING. FOR EXAMPLE, THE ABILITY TO WITHSTAND LOSSES OR ADHERE TO A PARTICULAR TRADING PROGRAM IN SPITE OF TRADING LOSSES ARE MATERIAL POINTS WHICH CAN ALSO ADVERSELY AFFECT ACTUAL TRADING RESULTS. THERE ARE NUMEROUS OTHER FACTORS RELATED TO THE MARKETS IN GENERAL OR TO THE IMPLEMENTATION OF ANY SPECIFIC TRADING PROGRAM WHICH CANNOT BE FULLY ACCOUNTED FOR IN THE PREPARATION OF HYPOTHETICAL PERFORMANCE RESULTS AND ALL OF WHICH CAN ADVERSELY AFFECT ACTUAL TRADING RESULTS.
WGC USA ASSET MANAGEMENT COMPANY, LLC HAS HAD LITTLE OR NO EXPERIENCE IN TRADING ACTUAL ACCOUNTS FOR ITSELF OR FOR CUSTOMERS. BECAUSE THERE ARE NO ACTUAL TRADING RESULTS TO COMPARE TO THE HYPOTHETICAL PERFORMANCE RESULTS, CUSTOMERS SHOULD BE PARTICULARLY WARY OF PLACING UNDUE RELIANCE ON THESE HYPOTHETICAL PERFORMANCE RESULTS.
State Street Global Advisors 9
The Strategic Case for GLDW
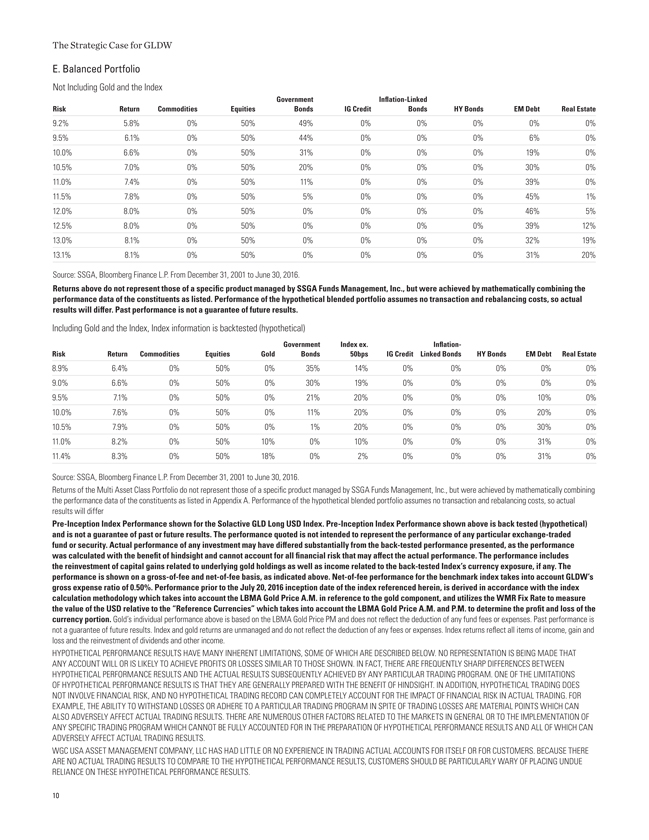
E. Balanced Portfolio
Not Including Gold and the Index
Government Inflation-Linked
Risk Return Commodities Equities Bonds IG Credit Bonds HY Bonds EM Debt Real Estate
9.2% 5.8% 0% 50% 49% 0% 0% 0% 0% 0% 9.5% 6.1% 0% 50% 44% 0% 0% 0% 6% 0% 10.0% 6.6% 0% 50% 31% 0% 0% 0% 19% 0% 10.5% 7.0% 0% 50% 20% 0% 0% 0% 30% 0% 11.0% 7.4% 0% 50% 11% 0% 0% 0% 39% 0% 11.5% 7.8% 0% 50% 5% 0% 0% 0% 45% 1% 12.0% 8.0% 0% 50% 0% 0% 0% 0% 46% 5% 12.5% 8.0% 0% 50% 0% 0% 0% 0% 39% 12% 13.0% 8.1% 0% 50% 0% 0% 0% 0% 32% 19% 13.1% 8.1% 0% 50% 0% 0% 0% 0% 31% 20%
Source: SSGA, Bloomberg Finance L.P. From December 31, 2001 to June 30, 2016.
Returns above do not represent those of a specific product managed by SSGA Funds Management, Inc., but were achieved by mathematically combining the performance data of the constituents as listed. Performance of the hypothetical blended portfolio assumes no transaction and rebalancing costs, so actual results will differ. Past performance is not a guarantee of future results.
Including Gold and the Index, Index information is backtested (hypothetical)
Government Index ex. Inflation-
Risk Return Commodities Equities Gold Bonds 50bps IG Credit Linked Bonds HY Bonds EM Debt Real Estate
8.9% 6.4% 0% 50% 0% 35% 14% 0% 0% 0% 0% 0% 9.0% 6.6% 0% 50% 0% 30% 19% 0% 0% 0% 0% 0% 9.5% 7.1% 0% 50% 0% 21% 20% 0% 0% 0% 10% 0% 10.0% 7.6% 0% 50% 0% 11% 20% 0% 0% 0% 20% 0% 10.5% 7.9% 0% 50% 0% 1% 20% 0% 0% 0% 30% 0% 11.0% 8.2% 0% 50% 10% 0% 10% 0% 0% 0% 31% 0% 11.4% 8.3% 0% 50% 18% 0% 2% 0% 0% 0% 31% 0%
Source: SSGA, Bloomberg Finance L.P. From December 31, 2001 to June 30, 2016.
Returns of the Multi Asset Class Portfolio do not represent those of a specific product managed by SSGA Funds Management, Inc., but were achieved by mathematically combining the performance data of the constituents as listed in Appendix A. Performance of the hypothetical blended portfolio assumes no transaction and rebalancing costs, so actual results will differ
Pre-Inception Index Performance shown for the Solactive GLD Long USD Index. Pre-Inception Index Performance shown above is back tested (hypothetical) and is not a guarantee of past or future results. The performance quoted is not intended to represent the performance of any particular exchange-traded fund or security. Actual performance of any investment may have differed substantially from the back-tested performance presented, as the performance was calculated with the benefit of hindsight and cannot account for all financial risk that may affect the actual performance. The performance includes the reinvestment of capital gains related to underlying gold holdings as well as income related to the back-tested Index’s currency exposure, if any. The performance is shown on a gross-of-fee and net-of-fee basis, as indicated above. Net-of-fee performance for the benchmark index takes into account GLDW’s gross expense ratio of 0.50%. Performance prior to the July 20, 2016 inception date of the index referenced herein, is derived in accordance with the index calculation methodology which takes into account the LBMA Gold Price A.M. in reference to the gold component, and utilizes the WMR Fix Rate to measure the value of the USD relative to the “Reference Currencies” which takes into account the LBMA Gold Price A.M. and P.M. to determine the profit and loss of the currency portion. Gold’s individual performance above is based on the LBMA Gold Price PM and does not reflect the deduction of any fund fees or expenses. Past performance is not a guarantee of future results. Index and gold returns are unmanaged and do not reflect the deduction of any fees or expenses. Index returns reflect all items of income, gain and loss and the reinvestment of dividends and other income.
HYPOTHETICAL PERFORMANCE RESULTS HAVE MANY INHERENT LIMITATIONS, SOME OF WHICH ARE DESCRIBED BELOW. NO REPRESENTATION IS BEING MADE THAT ANY ACCOUNT WILL OR IS LIKELY TO ACHIEVE PROFITS OR LOSSES SIMILAR TO THOSE SHOWN. IN FACT, THERE ARE FREQUENTLY SHARP DIFFERENCES BETWEEN HYPOTHETICAL PERFORMANCE RESULTS AND THE ACTUAL RESULTS SUBSEQUENTLY ACHIEVED BY ANY PARTICULAR TRADING PROGRAM. ONE OF THE LIMITATIONS OF HYPOTHETICAL PERFORMANCE RESULTS IS THAT THEY ARE GENERALLY PREPARED WITH THE BENEFIT OF HINDSIGHT. IN ADDITION, HYPOTHETICAL TRADING DOES NOT INVOLVE FINANCIAL RISK, AND NO HYPOTHETICAL TRADING RECORD CAN COMPLETELY ACCOUNT FOR THE IMPACT OF FINANCIAL RISK IN ACTUAL TRADING. FOR EXAMPLE, THE ABILITY TO WITHSTAND LOSSES OR ADHERE TO A PARTICULAR TRADING PROGRAM IN SPITE OF TRADING LOSSES ARE MATERIAL POINTS WHICH CAN ALSO ADVERSELY AFFECT ACTUAL TRADING RESULTS. THERE ARE NUMEROUS OTHER FACTORS RELATED TO THE MARKETS IN GENERAL OR TO THE IMPLEMENTATION OF ANY SPECIFIC TRADING PROGRAM WHICH CANNOT BE FULLY ACCOUNTED FOR IN THE PREPARATION OF HYPOTHETICAL PERFORMANCE RESULTS AND ALL OF WHICH CAN ADVERSELY AFFECT ACTUAL TRADING RESULTS.
WGC USA ASSET MANAGEMENT COMPANY, LLC HAS HAD LITTLE OR NO EXPERIENCE IN TRADING ACTUAL ACCOUNTS FOR ITSELF OR FOR CUSTOMERS. BECAUSE THERE ARE NO ACTUAL TRADING RESULTS TO COMPARE TO THE HYPOTHETICAL PERFORMANCE RESULTS, CUSTOMERS SHOULD BE PARTICULARLY WARY OF PLACING UNDUE RELIANCE ON THESE HYPOTHETICAL PERFORMANCE RESULTS.
10
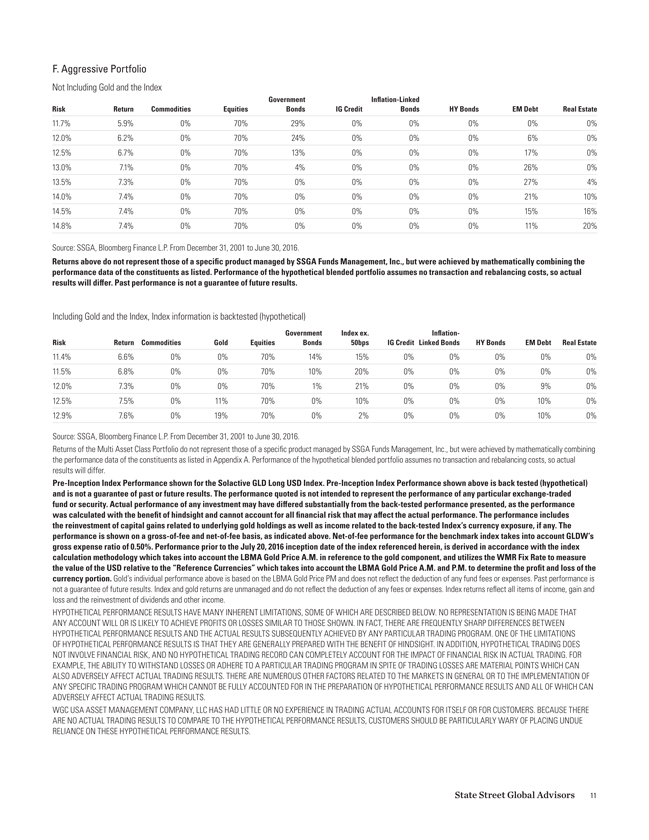
F. Aggressive Portfolio
Not Including Gold and the Index
Government Inflation-Linked
Risk Return Commodities Equities Bonds IG Credit Bonds HY Bonds EM Debt Real Estate
11.7% 5.9% 0% 70% 29% 0% 0% 0% 0% 0% 12.0% 6.2% 0% 70% 24% 0% 0% 0% 6% 0% 12.5% 6.7% 0% 70% 13% 0% 0% 0% 17% 0% 13.0% 7.1% 0% 70% 4% 0% 0% 0% 26% 0% 13.5% 7.3% 0% 70% 0% 0% 0% 0% 27% 4% 14.0% 7.4% 0% 70% 0% 0% 0% 0% 21% 10% 14.5% 7.4% 0% 70% 0% 0% 0% 0% 15% 16% 14.8% 7.4% 0% 70% 0% 0% 0% 0% 11% 20%
Source: SSGA, Bloomberg Finance L.P. From December 31, 2001 to June 30, 2016.
Returns above do not represent those of a specific product managed by SSGA Funds Management, Inc., but were achieved by mathematically combining the performance data of the constituents as listed. Performance of the hypothetical blended portfolio assumes no transaction and rebalancing costs, so actual results will differ. Past performance is not a guarantee of future results.
Including Gold and the Index, Index information is backtested (hypothetical)
Government Index ex. Inflation-
Risk Return Commodities Gold Equities Bonds 50bps IG Credit Linked Bonds HY Bonds EM Debt Real Estate
11.4% 6.6% 0% 0% 70% 14% 15% 0% 0% 0% 0% 0% 11.5% 6.8% 0% 0% 70% 10% 20% 0% 0% 0% 0% 0% 12.0% 7.3% 0% 0% 70% 1% 21% 0% 0% 0% 9% 0% 12.5% 7.5% 0% 11% 70% 0% 10% 0% 0% 0% 10% 0% 12.9% 7.6% 0% 19% 70% 0% 2% 0% 0% 0% 10% 0%
Source: SSGA, Bloomberg Finance L.P. From December 31, 2001 to June 30, 2016.
Returns of the Multi Asset Class Portfolio do not represent those of a specific product managed by SSGA Funds Management, Inc., but were achieved by mathematically combining the performance data of the constituents as listed in Appendix A. Performance of the hypothetical blended portfolio assumes no transaction and rebalancing costs, so actual results will differ.
Pre-Inception Index Performance shown for the Solactive GLD Long USD Index. Pre-Inception Index Performance shown above is back tested (hypothetical) and is not a guarantee of past or future results. The performance quoted is not intended to represent the performance of any particular exchange-traded fund or security. Actual performance of any investment may have differed substantially from the back-tested performance presented, as the performance was calculated with the benefit of hindsight and cannot account for all financial risk that may affect the actual performance. The performance includes the reinvestment of capital gains related to underlying gold holdings as well as income related to the back-tested Index’s currency exposure, if any. The performance is shown on a gross-of-fee and net-of-fee basis, as indicated above. Net-of-fee performance for the benchmark index takes into account GLDW’s gross expense ratio of 0.50%. Performance prior to the July 20, 2016 inception date of the index referenced herein, is derived in accordance with the index calculation methodology which takes into account the LBMA Gold Price A.M. in reference to the gold component, and utilizes the WMR Fix Rate to measure the value of the USD relative to the “Reference Currencies” which takes into account the LBMA Gold Price A.M. and P.M. to determine the profit and loss of the currency portion. Gold’s individual performance above is based on the LBMA Gold Price PM and does not reflect the deduction of any fund fees or expenses. Past performance is not a guarantee of future results. Index and gold returns are unmanaged and do not reflect the deduction of any fees or expenses. Index returns reflect all items of income, gain and loss and the reinvestment of dividends and other income.
HYPOTHETICAL PERFORMANCE RESULTS HAVE MANY INHERENT LIMITATIONS, SOME OF WHICH ARE DESCRIBED BELOW. NO REPRESENTATION IS BEING MADE THAT ANY ACCOUNT WILL OR IS LIKELY TO ACHIEVE PROFITS OR LOSSES SIMILAR TO THOSE SHOWN. IN FACT, THERE ARE FREQUENTLY SHARP DIFFERENCES BETWEEN HYPOTHETICAL PERFORMANCE RESULTS AND THE ACTUAL RESULTS SUBSEQUENTLY ACHIEVED BY ANY PARTICULAR TRADING PROGRAM. ONE OF THE LIMITATIONS OF HYPOTHETICAL PERFORMANCE RESULTS IS THAT THEY ARE GENERALLY PREPARED WITH THE BENEFIT OF HINDSIGHT. IN ADDITION, HYPOTHETICAL TRADING DOES NOT INVOLVE FINANCIAL RISK, AND NO HYPOTHETICAL TRADING RECORD CAN COMPLETELY ACCOUNT FOR THE IMPACT OF FINANCIAL RISK IN ACTUAL TRADING. FOR EXAMPLE, THE ABILITY TO WITHSTAND LOSSES OR ADHERE TO A PARTICULAR TRADING PROGRAM IN SPITE OF TRADING LOSSES ARE MATERIAL POINTS WHICH CAN ALSO ADVERSELY AFFECT ACTUAL TRADING RESULTS. THERE ARE NUMEROUS OTHER FACTORS RELATED TO THE MARKETS IN GENERAL OR TO THE IMPLEMENTATION OF ANY SPECIFIC TRADING PROGRAM WHICH CANNOT BE FULLY ACCOUNTED FOR IN THE PREPARATION OF HYPOTHETICAL PERFORMANCE RESULTS AND ALL OF WHICH CAN ADVERSELY AFFECT ACTUAL TRADING RESULTS.
WGC USA ASSET MANAGEMENT COMPANY, LLC HAS HAD LITTLE OR NO EXPERIENCE IN TRADING ACTUAL ACCOUNTS FOR ITSELF OR FOR CUSTOMERS. BECAUSE THERE ARE NO ACTUAL TRADING RESULTS TO COMPARE TO THE HYPOTHETICAL PERFORMANCE RESULTS, CUSTOMERS SHOULD BE PARTICULARLY WARY OF PLACING UNDUE RELIANCE ON THESE HYPOTHETICAL PERFORMANCE RESULTS.
State Street Global Advisors 11
The Strategic Case for GLDW
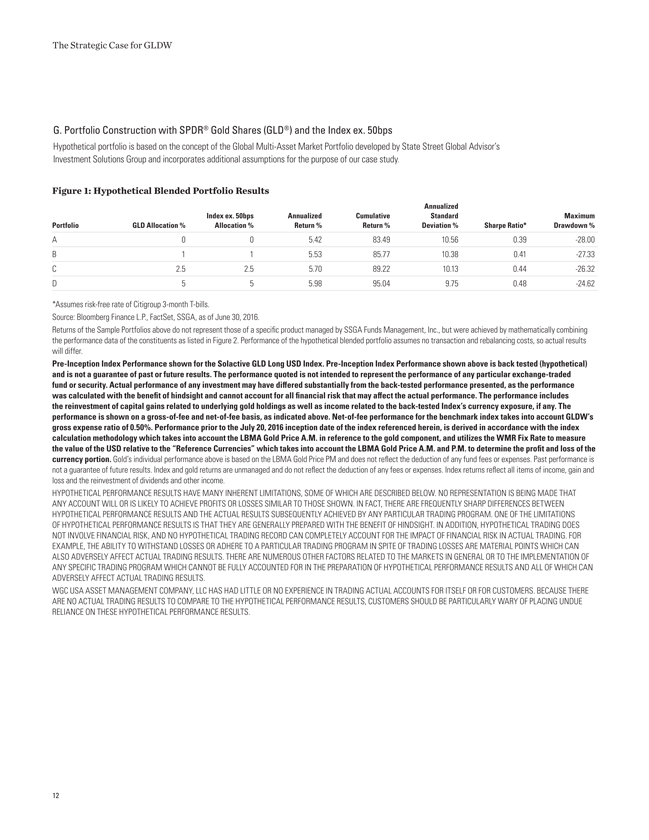
G. Portfolio Construction with SPDR® Gold Shares (GLD®) and the Index ex. 50bps
Hypothetical portfolio is based on the concept of the Global Multi-Asset Market Portfolio developed by State Street Global Advisor’s Investment Solutions Group and incorporates additional assumptions for the purpose of our case study.
Figure 1: Hypothetical Blended Portfolio Results
Annualized
Index ex. 50bps Annualized Cumulative Standard Maximum Portfolio GLD Allocation % Allocation % Return % Return % Deviation % Sharpe Ratio* Drawdown %
A 0 0 5.42 83.49 10.56 0.39 -28.00 B 1 1 5.53 85.77 10.38 0.41 -27.33 C 2.5 2.5 5.70 89.22 10.13 0.44 -26.32 D 5 5 5.98 95.04 9.75 0.48 -24.62
*Assumes risk-free rate of Citigroup 3-month T-bills.
Source: Bloomberg Finance L.P., FactSet, SSGA, as of June 30, 2016.
Returns of the Sample Portfolios above do not represent those of a specific product managed by SSGA Funds Management, Inc., but were achieved by mathematically combining the performance data of the constituents as listed in Figure 2. Performance of the hypothetical blended portfolio assumes no transaction and rebalancing costs, so actual results will differ.
Pre-Inception Index Performance shown for the Solactive GLD Long USD Index. Pre-Inception Index Performance shown above is back tested (hypothetical) and is not a guarantee of past or future results. The performance quoted is not intended to represent the performance of any particular exchange-traded fund or security. Actual performance of any investment may have differed substantially from the back-tested performance presented, as the performance was calculated with the benefit of hindsight and cannot account for all financial risk that may affect the actual performance. The performance includes the reinvestment of capital gains related to underlying gold holdings as well as income related to the back-tested Index’s currency exposure, if any. The performance is shown on a gross-of-fee and net-of-fee basis, as indicated above. Net-of-fee performance for the benchmark index takes into account GLDW’s gross expense ratio of 0.50%. Performance prior to the July 20, 2016 inception date of the index referenced herein, is derived in accordance with the index calculation methodology which takes into account the LBMA Gold Price A.M. in reference to the gold component, and utilizes the WMR Fix Rate to measure the value of the USD relative to the “Reference Currencies” which takes into account the LBMA Gold Price A.M. and P.M. to determine the profit and loss of the currency portion. Gold’s individual performance above is based on the LBMA Gold Price PM and does not reflect the deduction of any fund fees or expenses. Past performance is not a guarantee of future results. Index and gold returns are unmanaged and do not reflect the deduction of any fees or expenses. Index returns reflect all items of income, gain and loss and the reinvestment of dividends and other income.
HYPOTHETICAL PERFORMANCE RESULTS HAVE MANY INHERENT LIMITATIONS, SOME OF WHICH ARE DESCRIBED BELOW. NO REPRESENTATION IS BEING MADE THAT ANY ACCOUNT WILL OR IS LIKELY TO ACHIEVE PROFITS OR LOSSES SIMILAR TO THOSE SHOWN. IN FACT, THERE ARE FREQUENTLY SHARP DIFFERENCES BETWEEN HYPOTHETICAL PERFORMANCE RESULTS AND THE ACTUAL RESULTS SUBSEQUENTLY ACHIEVED BY ANY PARTICULAR TRADING PROGRAM. ONE OF THE LIMITATIONS OF HYPOTHETICAL PERFORMANCE RESULTS IS THAT THEY ARE GENERALLY PREPARED WITH THE BENEFIT OF HINDSIGHT. IN ADDITION, HYPOTHETICAL TRADING DOES NOT INVOLVE FINANCIAL RISK, AND NO HYPOTHETICAL TRADING RECORD CAN COMPLETELY ACCOUNT FOR THE IMPACT OF FINANCIAL RISK IN ACTUAL TRADING. FOR EXAMPLE, THE ABILITY TO WITHSTAND LOSSES OR ADHERE TO A PARTICULAR TRADING PROGRAM IN SPITE OF TRADING LOSSES ARE MATERIAL POINTS WHICH CAN ALSO ADVERSELY AFFECT ACTUAL TRADING RESULTS. THERE ARE NUMEROUS OTHER FACTORS RELATED TO THE MARKETS IN GENERAL OR TO THE IMPLEMENTATION OF ANY SPECIFIC TRADING PROGRAM WHICH CANNOT BE FULLY ACCOUNTED FOR IN THE PREPARATION OF HYPOTHETICAL PERFORMANCE RESULTS AND ALL OF WHICH CAN ADVERSELY AFFECT ACTUAL TRADING RESULTS.
WGC USA ASSET MANAGEMENT COMPANY, LLC HAS HAD LITTLE OR NO EXPERIENCE IN TRADING ACTUAL ACCOUNTS FOR ITSELF OR FOR CUSTOMERS. BECAUSE THERE ARE NO ACTUAL TRADING RESULTS TO COMPARE TO THE HYPOTHETICAL PERFORMANCE RESULTS, CUSTOMERS SHOULD BE PARTICULARLY WARY OF PLACING UNDUE RELIANCE ON THESE HYPOTHETICAL PERFORMANCE RESULTS.
12
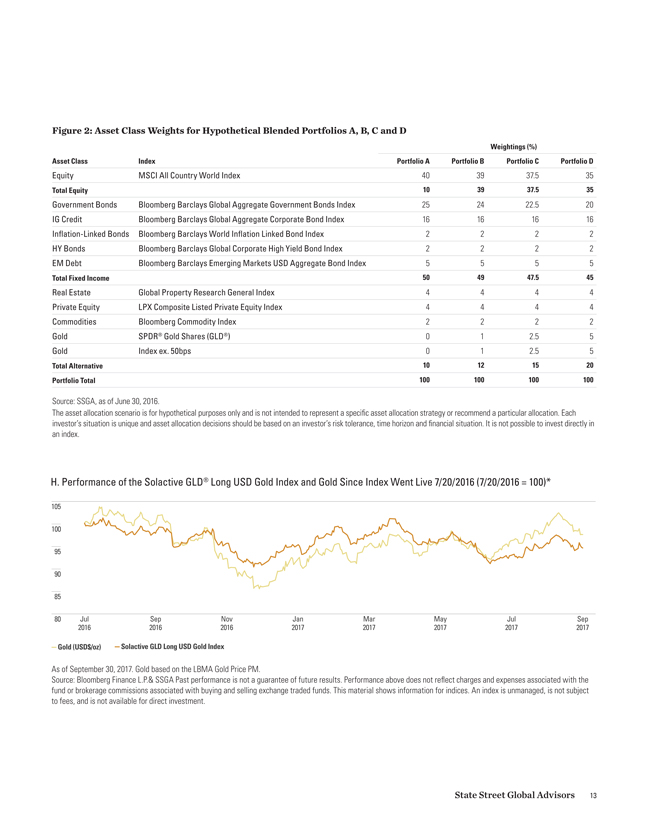
Figure 2: Asset Class Weights for Hypothetical Blended Portfolios A, B, C and D
Weightings (%)
Asset Class Index Portfolio A Portfolio B Portfolio C Portfolio D
Equity MSCI All Country World Index 40 39 37.5 35
Total Equity 10 39 37.5 35
Government Bonds Bloomberg Barclays Global Aggregate Government Bonds Index 25 24 22.5 20
IG Credit Bloomberg Barclays Global Aggregate Corporate Bond Index 16 16 16 16
Inflation-Linked Bonds Bloomberg Barclays World Inflation Linked Bond Index 2 2 2 2
HY Bonds Bloomberg Barclays Global Corporate High Yield Bond Index 2 2 2 2
EM Debt Bloomberg Barclays Emerging Markets USD Aggregate Bond Index 5 5 5 5
Total Fixed Income 50 49 47.5 45
Real Estate Global Property Research General Index 4 4 4 4
Private Equity LPX Composite Listed Private Equity Index 4 4 4 4
Commodities Bloomberg Commodity Index 2 2 2 2
Gold SPDR® Gold Shares (GLD®) 0 1 2.5 5
Gold Index ex. 50bps 0 1 2.5 5
Total Alternative 10 12 15 20
Portfolio Total 100 100 100 100
Source: SSGA, as of June 30, 2016.
The asset allocation scenario is for hypothetical purposes only and is not intended to represent a specific asset allocation strategy or recommend a particular allocation. Each investor’s situation is unique and asset allocation decisions should be based on an investor’s risk tolerance, time horizon and financial situation. It is not possible to invest directly in an index.
H. Performance of the Solactive GLD® Long USD Gold Index and Gold Since Index Went Live 7/20/2016 (7/20/2016 = 100)* Jul2016Sep2016Nov2016Jan2017Mar2017May2017Jul2017Sep201780859095100105—Solactive GLD Long USD Gold Index—Gold (USD$/oz)
As of September 30, 2017. Gold based on the LBMA Gold Price PM.Source: Bloomberg Finance L.P.& SSGA Past performance is not a guarantee of future results. Performance above does not reflect charges and expenses associated with the fund or brokerage commissions associated with buying and selling exchange traded funds. This material shows information for indices. An index is unmanaged, is not subject
to fees, and is not available for direct investment. State Street Global Advisors 13
The Strategic Case for GLDW
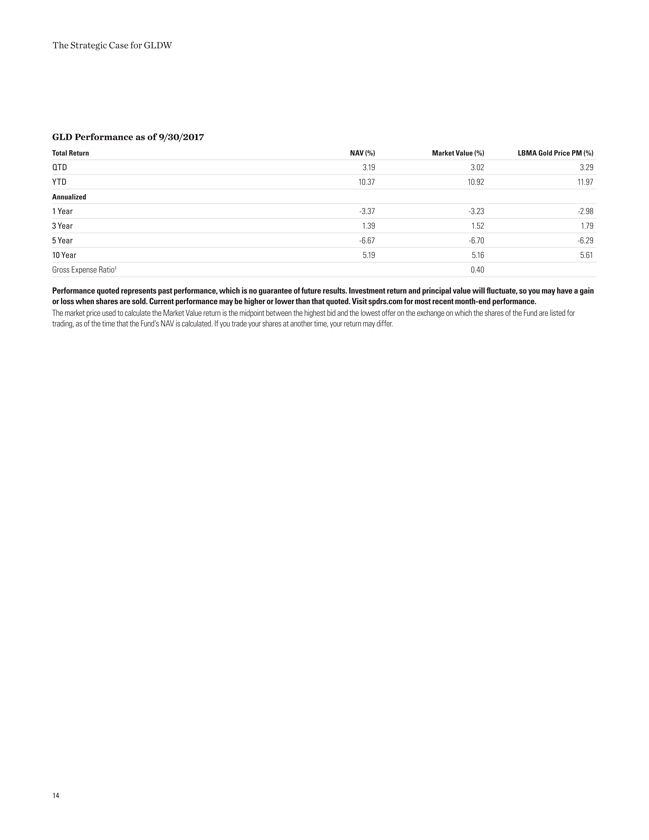
GLD Performance as of 9/30/2017
Total Return NAV (%) Market Value (%) LBMA Gold Price PM (%)
QTD 3.19 3.02 3.29 YTD 10.37 10.92 11.97
Annualized
| 1 | Year -3.37 -3.23 -2.98 |
| 3 | Year 1.39 1.52 1.79 |
| 5 | Year -6.67 -6.70 -6.29 |
10 Year 5.19 5.16 5.61 Gross Expense Ratio‡ 0.40
Performance quoted represents past performance, which is no guarantee of future results. Investment return and principal value will fluctuate, so you may have a gain or loss when shares are sold. Current performance may be higher or lower than that quoted. Visit spdrs.com for most recent month-end performance.
The market price used to calculate the Market Value return is the midpoint between the highest bid and the lowest offer on the exchange on which the shares of the Fund are listed for trading, as of the time that the Fund’s NAV is calculated. If you trade your shares at another time, your return may differ.
14
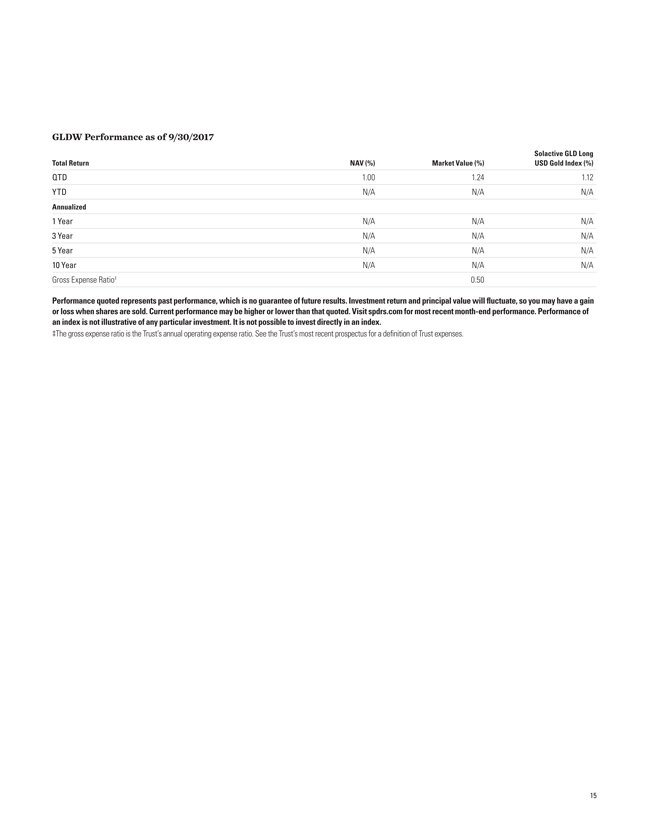
GLDW Performance as of 9/30/2017
Solactive GLD Long Total Return NAV (%) Market Value (%) USD Gold Index (%)
QTD 1.00 1.24 1.12 YTD N/A N/A N/A
Annualized
| 1 | Year N/A N/A N/A |
| 3 | Year N/A N/A N/A |
| 5 | Year N/A N/A N/A |
10 Year N/A N/A N/A
Gross Expense Ratio‡ 0.50
Performance quoted represents past performance, which is no guarantee of future results. Investment return and principal value will fluctuate, so you may have a gain or loss when shares are sold. Current performance may be higher or lower than that quoted. Visit spdrs.com for most recent month-end performance. Performance of an index is not illustrative of any particular investment. It is not possible to invest directly in an index.
‡The gross expense ratio is the Trust’s annual operating expense ratio. See the Trust’s most recent prospectus for a definition of Trust expenses. 15
ssga.com | spdrs.com
For institutional use only. Not for use with the public.
Important risk information
The views expressed in this material are the views of George Milling- Stanley, Howard Wen, Robin Tsui and Diego Andrade through the period ended January 31, 2018 and are subject to change based on market and other conditions.
The information provided does not constitute investment advice and it should not be relied on as such. It should not be considered a solicitation to buy or an offer to sell a security. It does not take into account any investor’s particular investment objectives, strategies, tax status or investment horizon. You should consult your tax and financial advisor. All asset allocation scenarios are for hypothetical purposes only and are not intended to represent a specific asset allocation strategy or recommend a particular allocation. Each investor’s situation is unique and asset allocation decisions should be based on an investor’s risk tolerance, time horizon and financial situation.
Investing involves risk, and you could lose money on an investment in each of SPDR® Gold Shares Trust (“GLD®”) and SPDR® Long Dollar Gold Trust (“GLDW”) (together, the “Funds”).
ETFs trade like stocks, are subject to investment risk, fluctuate in market value and may trade at prices above or below the ETFs’ net asset value. Brokerage commissions and ETF expenses will reduce returns.
Commodities and commodity-index linked securities may be affected by changes in overall market movements, changes in interest rates, and other factors such as weather, disease, embargoes, or political and regulatory developments, as well as trading activity of speculators and arbitrageurs in the underlying commodities. GLDW is subject to regulation under the Commodity Exchange Act of 1936 (the “CEA”). U.S. regulation of swap agreements is rapidly changing and is subject to further regulatory developments which could be adverse to GLDW. GLDW’s swap agreements will be subject to counterparty risk and liquidity risk.
Currency exchange rates between the U.S. dollar and non-U.S. currencies may fluctuate significantly over short periods of time and may cause the value of GLDW’s investments to decline.
GLDW is a passive investment vehicle that is designed to track the Index. GLDW’s performance may deviate from changes in the levels of its Index (i.e., create “tracking error” between GLDW and the Index) for a number of reasons, such as the fees and expenses of GLDW, which are not accounted for by the Index.
Frequent trading of ETFs could significantly increase commissions and other costs such that they may offset any savings from low fees or costs.
Diversification does not ensure a profit or guarantee against loss.
Investing in commodities entails significant risk and is not appropriate for all investors.
Important Information Relating to SPDR® Gold Shares Trust (“GLD ®“) and SPDR® Long Dollar Gold Trust (“GLDW”): The SPDR® Gold Shares Trust (“GLD®”) and the SPDR® Long Dollar Gold Trust (“GLDW”) have each filed a registration statement (including a prospectus) with the Securities and Exchange Commission (“SEC”) for the offerings to which this communication relates. GLDW has also filed the prospectus with the National Futures Association. Before you invest, you should read the prospectus in the registration statement and other documents each Fund has filed with the SEC for more complete information about each Fund and these offerings. Please see each Fund’s prospectus for a detailed discussion of the risks of investing in each Fund’s shares. The GLD prospectus is available by clicking here, and the GLDW prospectus is available by clicking here. You may get these documents for free by visiting EDGAR on the SEC website at sec.gov or by visiting spdrgoldshares.com. Alternatively, the Funds or any authorized participant will arrange to send you the prospectus if you request it by calling 866.320.4053.
Neither Fund is an investment company registered under the Investment Company Act of 1940 (the “1940 Act”). As a result, shareholders of each Fund do not have the protections associated with ownership of shares in an investment company registered under the 1940 Act. GLD is not subject to regulation under the CEA. As a result, shareholders of GLD do not have the protections afforded by the CEA.
Shares of each Fund trade like stocks, are subject to investment risk and will fluctuate in market value.
The value of GLD shares relates directly to the value of the gold held by GLD (less its expenses). Fluctuations in the price of gold could materially and adversely affect an investment in the shares. The price received upon the sale of the shares, which trade at market price, may be more or less than the value of the gold represented by them.
GLDW shares trade like stocks, are subject to investment risk and will fluctuate in market value. The value of GLDW shares relates directly to the value of the gold held by GLDW (less its expenses) and the value of a basket (“FX Basket”) comprising the euro, Japanese yen, British pound sterling, Canadian dollar, Swedish krona and Swiss franc (“Reference Currencies”) against the U.S. dollar. A decline in the price of gold and/or an increase in the value of the Reference Currencies comprising the FX basket against the U.S. dollar could materially and adversely affect an investment in the shares. The price received upon the sale of the shares, which trade at market price, may be more or less than the value of the gold and the price of each Reference Currency against the U.S. dollar represented by them.
Neither Fund generates any income, and as each Fund regularly sells gold to pay for its ongoing expenses, the amount of gold represented by each Fund share will decline over time to that extent.
The World Gold Council name and logo are a registered trademark and used with the permission of the World Gold Council pursuant to a license agreement. The World Gold Council in not responsible for the content of, and is not liable for the use of or reliance on, this material. World Gold Council is an affiliate of the Sponsor of each of
GLD and GLDW.
Standard & Poor’s®, S&P® and SPDR® are registered trademarks of Standard & Poor’s Financial Services LLC (S&P); Dow Jones is a registered trademark of Dow Jones Trademark Holdings LLC (Dow Jones); and these trademarks have been licensed for use by S&P Dow Jones Indices LLC (SPDJI) and sublicensed for certain purposes by State Street Corporation. State Street Corporation’s financial products are not sponsored, endorsed, sold or promoted by SPDJI, Dow Jones, S&P, their respective affiliates and third party licensors and nwone of such parties make any representation regarding the advisability of investing in such product(s) nor do they have any liability in relation thereto.
Important Information Relating to Solactive GLD® Long USD Gold Index:
GLDW is not sponsored, promoted, sold or supported in any other manner by Solactive AG nor does Solactive AG offer any express or implicit guarantee or assurance either with regard to the results of using the Index and/or Index trademark or the Index value at any time or in any other respect. The Index is calculated and published by Solactive AG. Solactive AG uses its best efforts to ensure that the Index is calculated correctly. Irrespective of its obligations towards GLDW, Solactive AG has no obligation to point out errors in the Index to third parties including but not limited to investors in and/or financial intermediaries transacting in or with GLDW. Neither publication of the Index by Solactive AG nor the licensing of the Index or Index trademark for the purpose of use in connection with GLDW constitutes a recommendation by Solactive AG to invest capital in GLDW nor does it in any way represent an assurance or opinion of Solactive AG with regard to any investment in GLDW.
For more information, please contact the Marketing Agent for GLD and GLDW: State Street Global Advisors Funds Distributors, LLC, One Lincoln Street, Boston, MA, 02111; T: +1 866 320 4053 spdrgoldshares.com
© 2017 State Street Corporation. All Rights Reserved.
© 2017 State Street Corporation. All Rights Reserved.
ID10100-IBG-24445 1017 Exp. Date: 01/31/2018
NOT FDIC INSURED – NO BANK GUARANTEE MAY LOSE VALUE
Disclaimer:
SPDR® Long Dollar Gold Trust (the “Fund”) has filed a registration statement (including a prospectus) with the Securities and Exchange Commission (“SEC”) for the offerings to which this communication relates. The Fund has also filed the prospectus with the National Futures Association. Before you invest, you should read the prospectus in the registration statement and other documents the Fund has filed with the SEC for more complete information about the Fund and these offerings. You may get these documents for free by visiting EDGAR on the SEC website at sec.gov or by visiting spdrgoldshares.com. Alternatively, the Fund or any authorized participant will arrange to send you the prospectus if you request it by calling 866.320.4053.