Free Writing Prospectus
Filed Pursuant To Rule 433
Registration Nos.333-217785
333-221842
333-206640
July 10, 2018

WHY CONSIDER INVESTING IN GOLD?
Gold is both an investment and a consumer good. Global economic growth, income growth, monetary policy and market volatility drive demand. A strategic allocation to this unique asset class may help an investor to pursue the following potential benefits of gold:
Long-term Returns
Since 1971, when President Nixon removed the US dollar from the Gold Standard, the price of gold has increased from $43.28/oz. to $1323.85/oz. at the end of March 2018, or a compounded annual growth rate of 7.79 percent per year.1
Gold’s prices are influenced by a diverse set of global drivers inpro-cyclical and counter-cyclical markets.
Greater Diversification
Gold’s historically low or negative correlation to other asset classes means the potential for greater diversification that could potentially lower portfolio volatility, enhance overall risk-adjusted returns and preserve purchasing power.
Improved Risk-Adjusted Returns
Because gold has historically tended to rise during stock market pullbacks, a strategic allocation to gold in a multi-asset class portfolio may help temper the impact of market volatility and reduce portfolio drawdown.
Deep Liquidity
The average daily turnover of gold is over $250 billion, equivalent to $62 trillion per year. That makes the gold market larger than that of many stocks and bonds.2
An investment in any combination of GLD, GLDW and GLDM entails a risk of loss and the diversification offered by the Funds does not ensure a profit or guarantee against loss.
| 1 | Bloomberg Finance L.P., State Street Global Advisors, August 13, 1971–March 31, 2018. |
| 2 | Source: A study carried out by London Bullion Market Association and overseen by the Bank of England and the Financial Conduct Authority; GFMS-Thomson Reuters, date as of December 31, 2017. |
7.79%
Compounded annual growth rate for
LBMA Gold Price PM since 19711
Gold’s Historically Relatively Low or Negative
Correlation with Equity and Bond Markets Since 2000
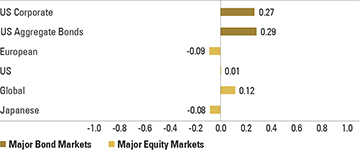
Source: Bloomberg Finance L.P., State Street Global Advisors, data from January 1, 2000 to March 31, 2018. Correlations are calculated from monthly returns in USD. Asset classes represented by the following indices — Japanese: MSCI Japan Index; Global: MSCI AC World Daily Index TR; US: S&P 500; European: MSCI Europe Index; US Aggregate Bonds: Bloomberg Barclays US Aggregate Bond Index TR; US Corporate: Bloomberg Barclays US Corporate Bond Index TR
Gold’s Historical Performance in Market Downturns

Source: Bloomberg Finance L.P., State Street Global Advisors, as of March 31, 2018. Notes: Global Financial Crisis: 11/30/2007–3/31/2009; Sovereign Debt Crisis I: 4/30/2010–8/31/2010; Sovereign Debt Crisis II: 2/28/2011–10/31/2011; Debt Ceiling Crisis: 7/22/2011–8/8/2011; Brexit: 6/22/2016–6/27/2016.Past performance is not a guarantee of future results. Performance above does not reflect charges and expenses associated with the fund or brokerage commissions associated with buying and selling exchange traded funds. Performance above is not meant to represent the performance of any investment product. Performance data above derived from total return indices.
2
3 SPDR ETFS MAKE IT EASY TO ACCESS GOLD
| GLD® | GLDW | GLDM | ||
The Largest Gold ETF that Democratized Access to Gold | Gold for a Strong Dollar Environment | Our Lowest Cost Gold ETF | ||
| When the SPDR® Gold Shares (GLD) launched in November 2004, it gathered $1 billion in assets under management in just three days. Today, as the largest gold-backed ETF in the world in terms of AUM,3 GLD is designed to offer all investors easy and relatively highly liquid access to the gold market. | Launched January 31, 2017, the SPDR® Long Dollar Gold Trust (GLDW) is designed to offer investors the potential benefits of using gold as a strategic portfolio diversifier while countering the historically negative correlation between a strengthening U.S. dollar and gold prices. | Launched June 26, 2018, the SPDR Gold MiniShares Trust (GLDM) is designed to offer the potential benefits an allocation to gold may bring to a properly balanced portfolio at the lowest total expense ratio (TER) of any gold ETF.4 | ||
An investment in any combination of GLD, GLDW and GLDM entails a risk of loss and
the diversification offered by the Funds does not ensure a profit or guarantee against loss.
Family of SPDR Gold ETFs
| ||||||
GLD
| GLDW
| GLDM
| ||||
| Strategy | Long Gold | Tracking the performance of the Solactive GLD®Long USD Gold Index (long gold, long USD versus basket of certainnon-US currencies) | Long Gold | |||
| Expense Ratio (%) | 0.40 | 0.50 | 0.18 | |||
| Physically Backed Gold | Yes | Yes | Yes | |||
| Fund Type | Grantor Trust | Grantor Trust | Grantor Trust | |||
| Price at Inception | 1/10th oz of gold in USD5 | 1/10th oz of gold in USD6 | 1/100th oz of gold in USD7 | |||
| Tracks | Price of gold in USD | Solactive GLD®Long USD Gold Index | Price of gold in USD | |||
| NAV Gold Benchmark | LBMA Gold Price PM | LBMA Gold Price AM | LBMA Gold Price PM | |||
| Currencies in Basket | N/A | EUR (57.6%), JPY (13.6%), GBP (11.9%), CAD (9.1%), SEK (4.2%) and CHF (3.6%) | N/A | |||
| Storage | HSBC Bank Plc, in London | HSBC Bank Plc, in London | ICBC Standard Bank Plc, in London | |||
| 3 | Source: Bloomberg Financial L.P. & State Street Global Advisors. Date as of April 30, 2018. |
| 4 | Based on GLDM’s total expense ratio compared with the total expense ratios included in Morningstar’s Global Exchange Traded Funds database for the 25 products with reported expense information and identified as having a primary prospectus benchmark to the LBMA Gold Price PM (USD) or the LBMA Gold Price AM (USD) as of June 20, 2018. |
| 5 | The amount of gold backing each share decreases over time based on the daily accrual of the sponsor fee. |
| 6 | The amount of gold backing each share will change over time. It will decrease based on the daily accrual of the sponsor fee, but it may increase (decrease) based on the daily outperformance (underperformance) of the USD versus the basket of currencies. |
| 7 | Figure provided is expected price at inception. The amount of gold backing each share decreases over time based on the daily accrual of the sponsor fee. |
State Street Global Advisors 3
SPDR® Gold Trust, SPDR® Long Dollar Gold Trust and SPDR® Gold MiniSharesSM Trust (each, a “Fund” and together, the “Funds”) have each filed a registration statement (including a prospectus) with the Securities and Exchange Commission (“SEC”) for the offerings to which this communication relates. SPDR® Long Dollar Gold Trust has also filed its prospectus with the National Futures Association. Before you invest, you should read the prospectus in the registration statement and other documents each Fund has filed with the SEC for more complete information about each Fund and these offerings. You may get these documents for free by visiting EDGAR on the SEC website at sec.gov or by visiting spdrgoldshares.com. Alternatively, the Funds or any authorized participant will arrange to send you a prospectus if you request it by calling 866.320.4053.