CAREY CREDIT INCOME FUND — I
FIRST QUARTER 2016 OVERVIEW
Details about Carey Credit Income Fund's ("CCIF") and Carey Credit Income Fund- I's ("CCIF-I" or the "Company") first quarter 2016 portfolio and operating results are contained in this overview. This overview should be read in conjunction with the CCIF Form 10-Q and the CCIF-I Form 10-Q, as filed with the U.S. Securities and Exchange Commission on May 11, 2016 and May 12, 2016, respectively.
CCIF - I First Quarter 2016 Highlights
| |
| • | During the first quarter ended March 31, 2016, CCIF - I paid fully covered distributions of $0.47 per share. |
| |
| • | For the period from December 31, 2015 to March 31, 2016, CCIF - I's total investment return was 0.004%.1 |
| |
| • | CCIF - I's net asset value per share was $23.95 as of March 31, 2016 compared to $24.42 as of December 31, 2015. |
| |
| • | CCIF's portfolio investments at fair value totaled $86.8 million as of March 31, 2016 and consisted of 48 debt investments and one attached equity investment in 39 portfolio companies. |
| |
| • | As of March 31, 2016, there were no assets in non-accrual status and the CCIF portfolio had 0% default rate. |
| |
| • | For the three months ended March 31, 2016, CCIF invested $16.7 million in senior secured investments, bringing the portfolio concentration in senior secured investments to 96%. |
| |
| • | CCIF's gross portfolio yield (excluding cash) as of March 31, 2016 was 8.2%. |
______________________________
(1) Total investment return is a measure of total return for shareholders, assuming the purchase of the Company’s common share at the beginning of the period and the reinvestment of all distributions declared during the period. More specifically, total investment return is based on (i) the purchase of one common share at the net offering price on the first day of the period, (ii) the sale at the net asset value per common share on the last day of the period, of (A) one common share plus (B) any fractional common shares issued in connection with the reinvestment of distributions, and (iii) distributions payable relating to one common share, if any, on the last day of the period. The total investment return calculation assumes that (i) cash distributions are reinvested in accordance with the company’s distribution reinvestment plan and (ii) the fractional common shares issued pursuant to the distribution reinvestment plan are issued at the then net offering price per common share on each distribution payment date. Since there is no public market for the company’s common shares, then the terminal sell price per common share is assumed to be equal to net asset value per common share on the last day of the period presented. Total investment return is not annualized. The company’s performance changes over time and currently may be different than that shown above. Past performance is no guarantee of future results.
1
Business Environment
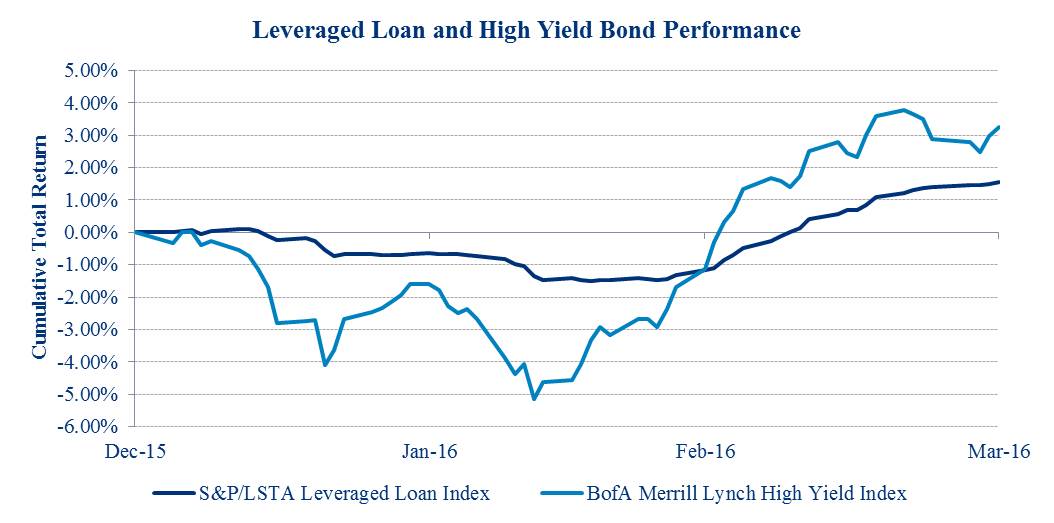
Credit markets rallied in the latter half of the first quarter of 2016 after facing a challenging 2nd half of 2015. This rebound was primarily led by a dovish pivot in Federal Reserve communication that helped spur a rally in crude oil and a reversal of recent dollar strength. This in turn snapped two consecutive quarterly losses in high-yield corporate bonds and bank loans. For the first quarter of 2016, the S&P/LSTA Leveraged Loan Index, a primary measure of senior debt covering the U.S. leveraged loan market, returned 1.55% while the Bank of America Merrill Lynch High Yield Index, a primary measure of subordinated debt, returned 3.25%.
Despite the recent rebound in the credit markets, many of the challenges originating in the latter half of 2015 remain intact. Outflows from mutual funds and exchange-traded funds (ETF) coupled with muted collateralized loan obligation (CLOs) issuance continues to contribute to increased volatility in the credit markets. CLOs have historically served as a stable source of demand for loans, but new CLO issuance totaled only $5.4 billion in Q1 2016, well behind the Q1 2015 total of $31 billion. Amid weak CLO issuance, mutual fund outflows totaled $7.8 billion for the quarter, bringing net visible flows to -$2.4 billion for Q1 2016. Slower loan supply growth has helped to offset softer demand from mutual funds and CLOs, with newly issued institutional loan volumes down 31 percent on a year-over-year basis through Q1 2016.
Declining oil prices earlier in the quarter weighed on the high-yield bond market, which continues to have significant exposure to the energy sector, but a rebound in oil prices helped drive positive high-yield bond market returns in the second half of the quarter.
The rebound in the credit markets, in conjunction with rising oil prices, supports our view that the volatility in leveraged credit has been largely tied to the commodity bear market and a sentiment-driven spillover into credits tied to other industries. Despite the lingering technical headwinds in the markets, fundamentally, the credit markets are performing well and our outlook for leveraged credit remains constructive.
This credit environment provides experienced credit managers, such as CCIF's Advisors, the opportunity to invest in new assets with attractive yields while remaining in senior positions of companies' capital structures. Specifically, we are seeing buying opportunities in sectors that are not commodity-sensitive where there has been a technical sell-off yet fundamentals remain strong and credit risk remains low. Given that CCIF commenced its capital raising efforts in the midst of this evolving credit cycle, we believe CCIF has a significant competitive advantage compared to investors who have large legacy portfolios.
Investment Activity, Investment Performance, and Portfolio Update
CCIF commenced investment operations on April 2, 2015. Within the three month period ended March 31, 2016, investment activity was predominantly concentrated in sourcing debt investments through primary issuance channels (58.9%) and the remainder was through secondary market channels. Investment activity for the three months ended March 31, 2016 is set forth below:
|
| | | |
Portfolio Highlights ($ in thousands) | For the Three Months Ended |
| | March 31, 2016 |
| Gross Commitments | $ | 16,725 |
|
| Investments Sold or Repaid | $ | 7,824 |
|
| Total Fair Value of Investments | $ | 86,785 |
|
| Gross Portfolio Yield | 8.2 | % |
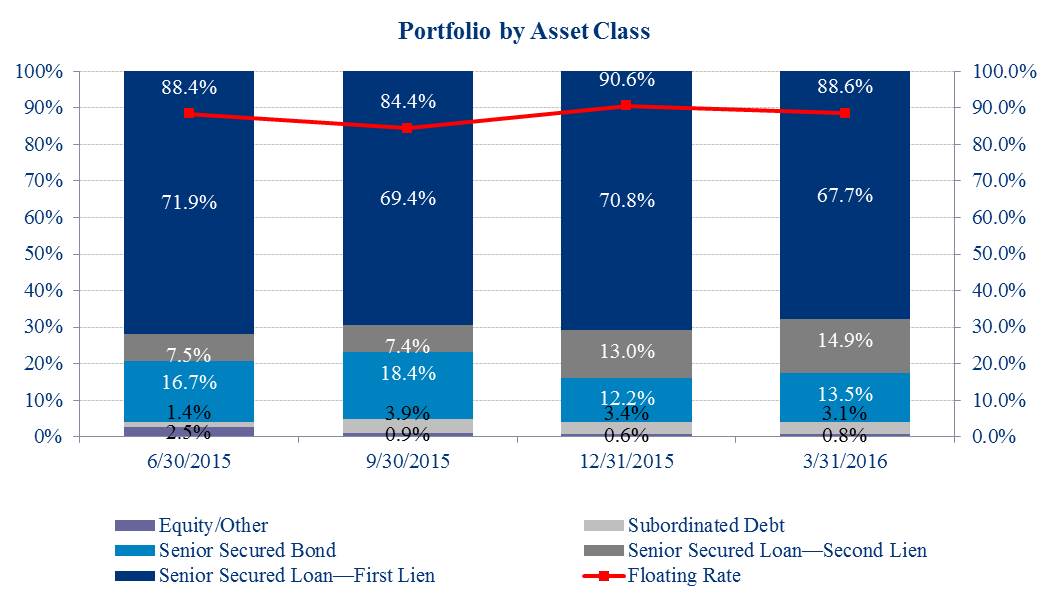
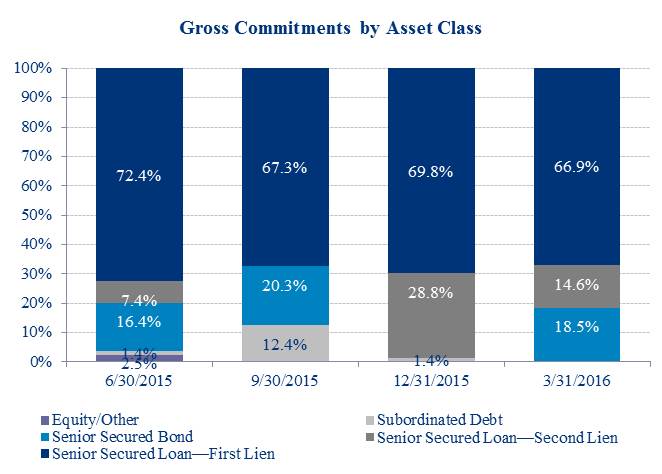
As of March 31, 2016, the portfolio consisted of $86.8 million of total investments at fair value, 96.1% of which consisted of investments in senior secured debt. We believe senior secured debt investments provide for downside protection that is particularly important given today's credit environment. Set forth below is the composition of the portfolio by asset class for each quarter end based on fair value:
During the first quarter of 2016, we were able to invest in new assets with attractive yields while remaining in senior positions of companies' capital structures. Specifically, we capitalized on buying opportunities identified in sectors outside of commodities where there has been a technical sell-off yet fundamentals remained strong and credit risk remained low. This is evidenced by our investment activity during the quarter, in which, 100% of commitments were to senior secured assets at a weighted average purchase price of 92.91% of par.
Investment activity by quarter and by asset class as of each of the last four quarters was as follows:
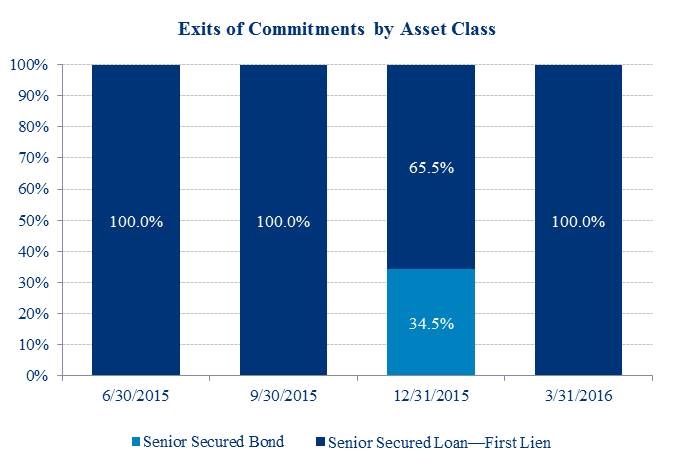
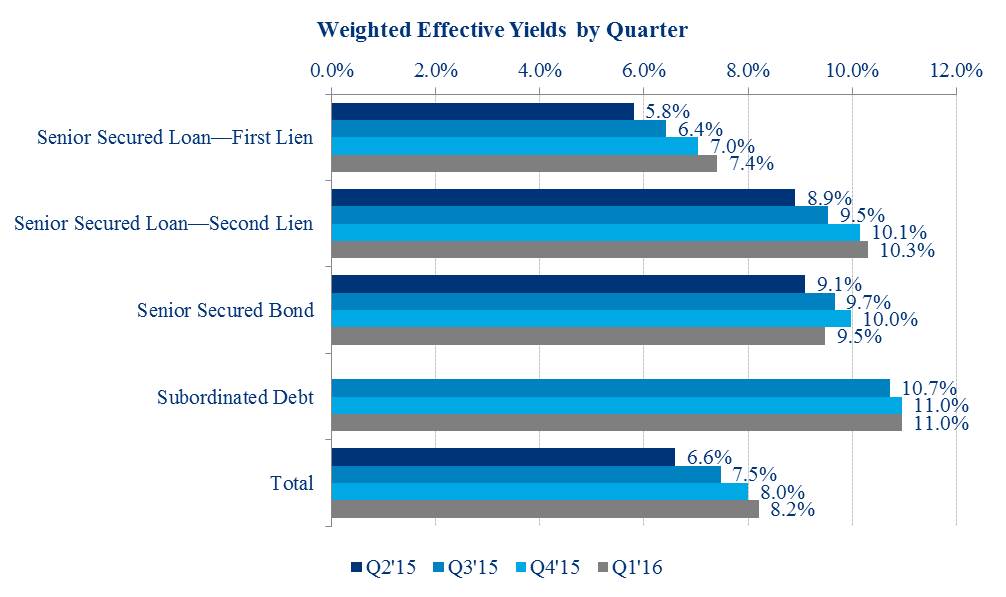
When commencing investment activity in April of 2015, we were focused on building a portfolio of high-quality, income-producing assets with favorable risk/reward characteristics. In order to efficiently ramp up the portfolio, initial investment activity in the period ending June 30, 2015 was geared towards sourcing broadly syndicated debt investments in the secondary market. By initially allocating capital to broadly syndicated loans that were more liquid in nature, we were then able to exit select lower yielding positions in the second half of 2015 and deploy that capital into assets with favorable spreads while maintaining high exposure to senior secured assets. As the selling pressure described above continued to weigh heavily on the credit markets, we began to see investment opportunities with similar risk profiles as those identified during the initial ramp up of the portfolio, but at lower costs and with higher returns. As seen in the chart below, CCIF's gross portfolio yield increased to 8.2% as of March 31, 2016 compared to 6.6% at the end of the second quarter of 2015. This demonstrates our ability to maintain our focus on senior positions in the capital structure of portfolio companies, and on participating in what we perceive to be the optimal risk-adjusted return profiles in the current market opportunity.
Set forth below are the weighted average effective yields as of each of the prior four quarters:
As of March 31, 2016, there were 39 portfolio companies in which CCIF held 48 debt investments and one attached equity investment. The weighted average portfolio company age was 36 years as of March 31, 2016. Furthermore, and aligned with our strategy of mitigating industry specific risk, the companies comprising the CCIF portfolio were diversified among 18 industries. Set forth below are the industry concentrations in CCIF's portfolio as of March 31, 2016 by fair value:
CCIF's exposure to energy and commodity-sensitive sectors collectively represented 6.1% of the portfolio's fair value as of March 31, 2016. Net unrealized depreciation totaling $1.0 million, or approximately 55.0% of the overall unrealized depreciation on investments for the three months ended March 31, 2016, was in part driven by recent volatility in global energy and commodity prices. CCIF had no instances of non-accruals or default in the portfolio as of March 31, 2016, and losses attributable to commodity-sensitive assets, were all unrealized as of quarter end. Given today's environment, we believe it is prudent to limit the exposure to these sectors, and as we continue to raise and deploy capital, the current exposure will continue to decline as a percentage of the total portfolio.
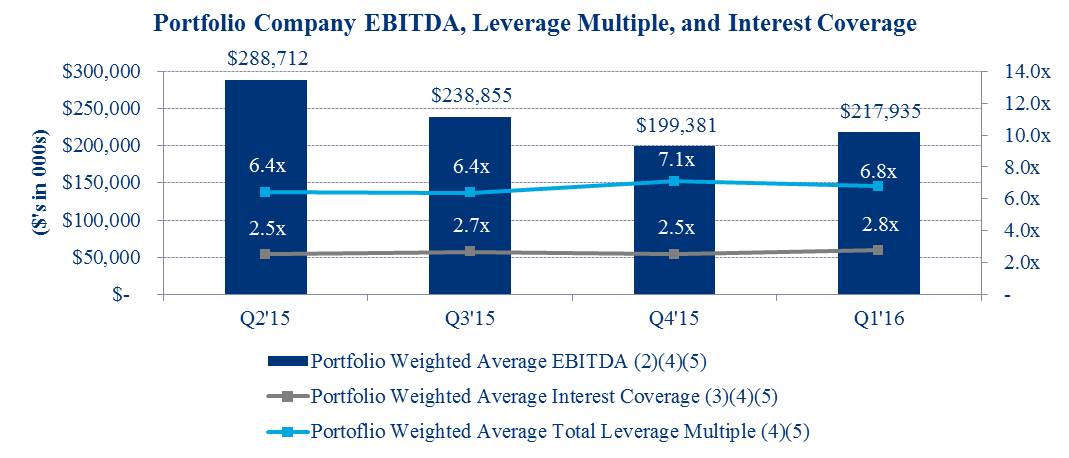
Set forth below are the weighted average EBITDA, weighted average total leverage multiple, and weighted average interest rate coverage of CCIF's portfolio companies. As noted in the chart, the overall portfolio metrics improved slightly quarter-over-quarter. This was primarily due to incremental investment activity during the quarter which added 10 new portfolio companies to CCIF's portfolio as well as improving financial metrics related to the companies that were in the portfolio as of December 31, 2015.
(2) Weighted average EBITDA amounts are weighted based on the amortized cost of the portfolio company investments. EBITDA amounts are estimated from the most recent portfolio company financial statements, have not been independently verified by CCIF or its advisors, and may reflect a normalized or adjusted amount. Accordingly, CCIF nor its advisors makes any representation or warranty in respect of this information.
(3) Weighted average interest coverage represents the portfolio company’s EBITDA as a multiple of interest expense. Portfolio company credit statistics are derived from the most recently available portfolio company financial statements, have not been independently verified by CCIF
or its advisors, and may reflect a normalized or adjusted amount. Accordingly, CCIF nor its advisors makes any representation or warranty in respect of this information.
(4) Portfolio weighted average EBITDA, weighted average total leverage multiple, and interest coverage ratio data includes information solely in respect of portfolio companies in which CCIF has a debt investment. Excluded from the data above is information with respect to discrete projects in the project finance/power generation sector which includes Moxie Liberty LLC, Moxie Patriot LLC, and Panda Hummel LLC as well as companies that are in the midst of a restructuring of their balance sheet.
(5) EBITDA is a non-GAAP financial measure. For a particular portfolio company, EBITDA is generally defined as net income before net interest expense, income tax expense, depreciation and amortization. EBITDA amounts are estimated from the most recent portfolio company's financial statements, have not been independently verified by CCIF or its advisors, and may reflect a normalized or adjusted amount. Accordingly, CCIF nor its advisors makes any representation or warranty in respect of this information.
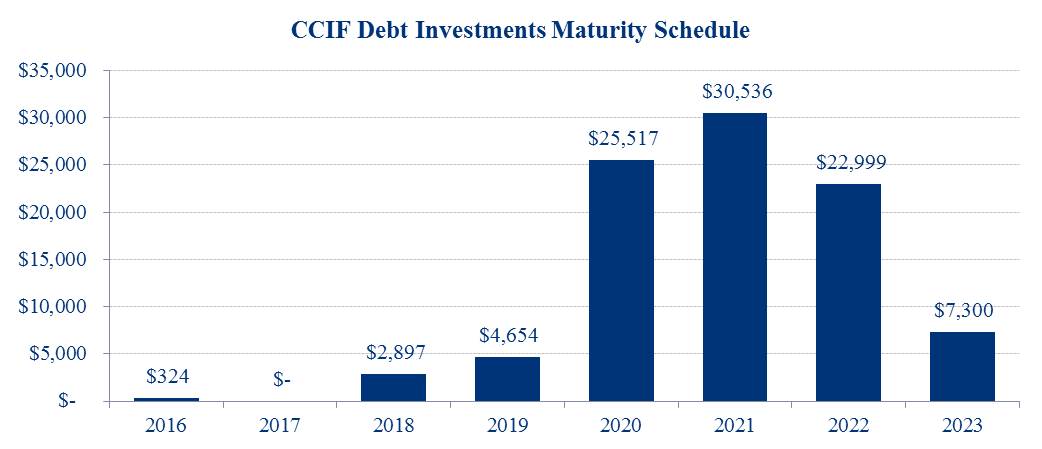
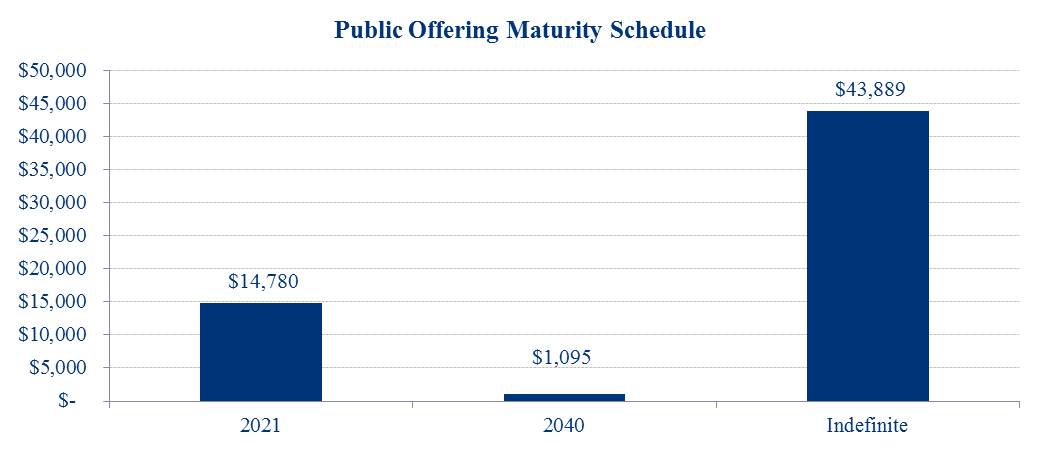
The following chart shows the maturity schedule of CCIF's debt investments based on principal amount as of March 31, 2016.
CCIF's public offerings, CCIF 2016 T and Carey Credit Income Fund — I, which have committed to seek liquidity events on or before December 31, 2021 and December 31, 2040, respectively, collectively represented less than 30% of CCIF's total ownership as of March 31, 2016. The following chart shows the liquidity schedule of CCIF's current public offerings as of March 31, 2016 based on net assets of CCIF.
About Carey Credit Income Fund
CCIF is a non-traded business development company (BDC) that invests primarily in large, privately negotiated loans to private middle market U.S. companies. CCIF is the master fund which pools investor capital raised through its feeder fund offerings, such as the current offering CCIF-I. CCIF and CCIF-I are managed by affiliates of W. P. Carey Inc. ("WPC") and Guggenheim Partners, LLC and are designed to provide investors with current income, capital preservation, and, to a lesser extent, capital appreciation. CCIF and CCIF-I share the same investment objectives and strategies, and all portfolio investments are made by CCIF, the master fund.
About W. P. Carey Inc.
Founded in 1973, WPC is a publicly-traded real estate investment trust (NYSE: WPC) that provides long-term sale-leaseback and build-to-suit financing for companies worldwide. WPC has expertise in credit and real estate underwriting, with more than 35 years of experience in evaluating credit and real estate investment opportunities. A capital provider to growing U.S. companies since its inception, WPC had an enterprise value of approximately $10.8 billion at March 31, 2016. In addition to its owned portfolio of diversified global real estate, WPC manages a series of non-traded publicly registered investment programs with assets under management of approximately $11.6 billion. WPC is subject to the information and reporting requirements of the Exchange Act. As a result, it files periodic reports and financial statements with the SEC, copies of which are available on the SEC's website at www.sec.gov.
For four decades, WPC has provided companies around the globe with capital to expand their businesses, make acquisitions, invest in research and development, or fund other corporate initiatives. Its corporate finance-focused credit and underwriting process is a constant that has been leveraged across a wide variety of companies and industries. WPC's investment process has largely focused on identifying companies with stable and improving credit profiles using a top-down and bottom-up approach, without relying on outside rating agencies. Credit-quality characteristics, capital structure, operating history, margin and ratio analysis, industry market share, and management team are all key considerations in evaluating and determining investment suitability of potential credits.
About Guggenheim Partners, LLC
Guggenheim Investments represents the investment management businesses of Guggenheim Partners and includes Guggenheim, an SEC-registered investment adviser. Guggenheim Partners is a privately-held, global financial services firm with over 2,500 employees and more than $240 billion in assets under management as of March 31, 2016. It produces customized solutions for its clients, which include institutions, governments and agencies, corporations, insurance companies, investment advisors, family offices, and individual investors.
Guggenheim Investments manages $199 billion in assets across fixed income, equity, and alternatives as of March 31, 2016. Its 250+ investment professionals perform research to understand market trends and identify undervalued opportunities in areas that are often complex and underfollowed. This approach to investment management has enabled Guggenheim to deliver long-term results to its clients.
Within Guggenheim Investments is the Guggenheim Corporate Credit Team, which is responsible for all corporate credit strategies and asset management of $66 billion. A unified credit platform is utilized for all strategies and is organized by industry as opposed to asset class, which increases its ability to uncover relative value opportunities and to identify and source opportunities. The scale of the platform, combined with the expertise across a wide range of industries and in-house legal resources, allows Guggenheim to be a solution provider to the market and maintain an active pipeline of investment opportunities.
Cautionary Statement Concerning Forward-Looking Statements
This document contains forward-looking statements within the meaning of the Federal securities laws. These statements are not guarantees of future performance and are subject to risks, uncertainties and other factors, some of which are beyond our control, are difficult to predict and could cause actual results to differ materially from those expressed or forecasted in the forward-looking statements. CCIF and CCIF-I undertake no obligation to update any forward-looking statements contained herein to conform the statements to actual results or changes in their expectations. A number of factors may cause CCIF’s and CCIF-I's actual results, performance or achievement to differ materially from those anticipated. For further information on factors that could impact CCIF and CCIF-I performance, please review CCIF’s and CCIF-I's respective filings at the SEC website at www.sec.gov.