Table of Contents
As filed with the Securities and Exchange Commission on November 25, 2014
Registration Statement No. 333-198955
UNITED STATES
SECURITIES AND EXCHANGE COMMISSION
Washington, D.C. 20549
Amendment No. 2
to
Form F-1
REGISTRATION STATEMENT
UNDER
THE SECURITIES ACT OF 1933
EVRAZ NORTH AMERICA LIMITED
(Exact name of registrant as specified in its charter)
| England and Wales | 3312 | 98-1086136 | ||
(State or other jurisdiction of incorporation or organization) | (Primary Standard Industrial Classification Code Number) | (I.R.S. Employer Identification No.) |
20-22 Bedford Row
London WC1R 4JS
United Kingdom
Telephone: +1 312 533 3555
Facsimile: +1 312 533 3611
(Address, including zip code, and telephone number, including area code, of registrant’s principal executive offices)
Copies to:
James A. McDonald Skadden, Arps, Slate, Meagher and Flom (UK) LLP 40 Bank Street London E14 5DS United Kingdom Telephone: +44 20 7519 7000 Facsimile: +44 20 7519 7070 | Michael J. Zeidel Skadden, Arps, Slate, Meagher and Flom LLP 4 Times Square New York, New York 10036 United States of America Telephone: +1 212 735 3000 Facsimile: +1 212 735 2000 | Marc D. Jaffe Senet S. Bischoff Latham & Watkins LLP 885 Third Avenue New York, New York 10022 United States of America Telephone: +1 212 906 1200 Facsimile: +1 212 751 4864 |
Approximate date of commencement of proposed sale to the public: As soon as practicable after the effective date of this Registration Statement.
If any of the securities being registered on this Form are to be offered on a delayed or continuous basis pursuant to Rule 415 under the Securities Act of 1933, or the Securities Act, check the following box. ¨
If this Form is filed to register additional securities for an offering pursuant to Rule 462(b) under the Securities Act, check the following box and list the Securities Act registration statement number of the earlier effective registration statement for the same offering. ¨
If this Form is a post-effective amendment filed pursuant to Rule 462(c) under the Securities Act, check the following box and list the Securities Act registration statement number of the earlier effective registration statement for the same offering. ¨
If this Form is a post-effective amendment filed pursuant to Rule 462(d) under the Securities Act, check the following box and list the Securities Act registration statement number of the earlier effective registration statement for the same offering. ¨
CALCULATION OF REGISTRATION FEE
| ||||
Title of each class of securities to be registered | Proposed maximum aggregate offering price(1)(2) | Amount of registration fee(3) | ||
Ordinary shares, nominal value $0.01 per share | $100,000,000 | $12,880 | ||
| ||||
| ||||
| (1) | Includes additional ordinary shares that may be sold upon exercise of a purchase option to be granted to the underwriters. |
| (2) | Estimated solely for the purposes of calculating the registration fee pursuant to Rule 457(o) of the Securities Act of 1933. |
| (3) | Previously paid. |
The Registrant hereby amends this Registration Statement on such date or dates as may be necessary to delay its effective date until the Registrant shall file a further amendment which specifically states that this Registration Statement shall thereafter become effective in accordance with Section 8(a) of the Securities Act or until the Registration Statement shall become effective on such date as the Securities and Exchange Commission, acting pursuant to said Section 8(a), may determine.
Table of Contents
The information in this prospectus is not complete and may be changed. We may not sell these securities until the registration statement filed with the Securities and Exchange Commission is effective. This prospectus is not an offer to sell these securities and is not soliciting an offer to buy these securities in any jurisdiction where the offer or sale is not permitted.
SUBJECT TO COMPLETION, DATED NOVEMBER 25, 2014
PRELIMINARY PROSPECTUS
Shares

EVRAZ NORTH AMERICA LIMITED
Ordinary Shares
$ per Share
This is the initial public offering of ordinary shares, nominal value $0.01 per share, of EVRAZ NORTH AMERICA LIMITED. We are offering ordinary shares in this offering.
We expect the public offering price to be between $ and $ per ordinary share. Prior to this offering, there has been no public market for our ordinary shares. We are in the process of applying to list our ordinary shares on the Nasdaq Global Select Market, or Nasdaq, under the symbol “ENA.”
Upon completion of this offering, Evraz Group S.A. and its affiliates will control approximately % of the aggregate voting power of our ordinary shares, or approximately % if the underwriters exercise their option to purchase up to additional ordinary shares in full. Accordingly, we will be a “controlled company” under the rules of Nasdaq.
Investing in our ordinary shares involves risks. See “Risk Factors” beginning on page 18.
| Per Share | Total | |||||||
Public offering price | $ | $ | ||||||
Underwriting discounts and commissions | $ | $ | ||||||
Proceeds to us, before expenses | $ | $ | ||||||
We refer you to “Underwriting” for additional information regarding underwriting compensation.
The underwriters have an option to purchase up to additional ordinary shares from us at the initial public offering price, less the underwriting discount, within 30 days from the date of this prospectus.
The underwriters expect to deliver the ordinary shares to purchasers on or about , 2014.
Neither the United States Securities and Exchange Commission, or SEC, nor any state securities commission has approved or disapproved of these securities or determined if this prospectus is truthful or complete. Any representation to the contrary is a criminal offense.
| Citigroup | Goldman, Sachs & Co. |
Prospectus dated , 2014
Table of Contents
| ii | ||||
| ii | ||||
| ii | ||||
| iii | ||||
| iii | ||||
| v | ||||
| 1 | ||||
| 10 | ||||
| 12 | ||||
| 18 | ||||
| 42 | ||||
| 44 | ||||
| 45 | ||||
| 46 | ||||
| 47 | ||||
| 48 | ||||
Management’s Discussion and Analysis of Financial Condition and Results of Operations | 49 | |||
| 84 | ||||
| 88 | ||||
| 110 | ||||
| 114 | ||||
| 115 | ||||
| 117 | ||||
| 119 | ||||
| 135 | ||||
| 136 | ||||
| 143 | ||||
| 149 | ||||
| 150 | ||||
| 151 | ||||
| 152 | ||||
| F-1 |
Neither we nor the underwriters (nor any of our or their respective affiliates) have authorized anyone to provide any information other than that contained in this prospectus or in any free writing prospectus prepared by or on behalf of us or to which we may have referred you. We take no responsibility for, and can provide no assurance as to the reliability of, any other information that others may give you. Neither we nor the underwriters (nor any of our or their respective affiliates) are making an offer to sell the ordinary shares in any jurisdiction where the offer or sale is not permitted. You should assume that the information appearing in this prospectus is accurate only as of the date on the front cover of this prospectus. Our business, financial position, results of operations and prospects may have changed since the date on the front cover of this prospectus.
Neither we nor any of the underwriters have taken any action to permit a public offering of the ordinary shares outside the United States or to permit the possession or distribution of this prospectus outside the United States. Persons outside the United States who come into possession of this prospectus must inform themselves about and observe any restrictions relating to the offering of the ordinary shares and the distribution of this prospectus outside the United States.
i
Table of Contents
Until , 2014 (the 25th day after the date of this prospectus), all dealers that buy, sell or trade in our ordinary shares, whether or not participating in this offering, may be required to deliver a prospectus. This is in addition to the dealer’s obligation to deliver a prospectus when acting as underwriter and with respect to their unsold allotment or subscription.
PRESENTATION OF FINANCIAL DATA
We present our consolidated financial statements in accordance with United States Generally Accepted Accounting Principles, or GAAP. All references in this prospectus to “USD”, “U.S. dollars” or “$” are to the legal currency of the United States of America unless otherwise noted. All references in this prospectus to “CAD” or “Canadian dollars” are to the legal currency of Canada unless otherwise noted. When used in percentage columns in tables in this prospectus, the abbreviation “N/M” means “not meaningful”.
Certain information relating to our industry and market position used or referenced in this prospectus was obtained from internal analysis, surveys, market research, publicly available information and industry publications. Unless otherwise indicated, all sources for industry data and statistics are estimates or forecasts contained in or derived from internal or industry sources we believe to be reliable. Market data used throughout this prospectus was obtained from independent industry publications and other publicly available information. Such data, as well as internal surveys, industry forecasts and market research, while believed to be reliable, have not been independently verified. In addition, in certain cases we have made statements in this prospectus regarding our industry and position in the industry based on our experience and our own investigation of market conditions. We cannot assure you that any of these assumptions are accurate or correctly reflect our position in the industry, and none of our internal surveys or information has been verified by independent sources.
Market data and statistics are inherently predictive and speculative and are not necessarily reflective of actual market conditions. Such statistics are based on market research, which itself is based on sampling and subjective judgments by both the researchers and the respondents, including judgments about what types of products and transactions should be included in the relevant market. In addition, the value of comparisons of statistics for different markets is limited by many factors, including that (i) the markets are defined differently, (ii) the underlying information was gathered by different methods and (iii) different assumptions were applied in compiling the data. Accordingly, the market statistics included in this prospectus should be viewed with caution.
ENFORCEMENT OF CIVIL LIABILITIES
We are incorporated under the laws of England and Wales. Several of our directors may reside outside the United States and all or a substantial portion of the assets of such persons may be located outside the United States. As a result, it may be difficult for you to serve legal process on us or our directors or have any of them appear in a U.S. court. The United States and the United Kingdom do not currently have a treaty providing for the recognition and enforcement of judgments, other than arbitration awards, in civil and commercial matters. The enforceability of any judgment of a U.S. federal or state court in the United Kingdom will depend on the laws and any treaties in effect at the time, including conflicts of laws principles (such as those bearing on the question of whether a U.K. court would recognize the basis on which a U.S. court had purported to exercise jurisdiction over a defendant). In this context, there is doubt as to the enforceability in the United Kingdom of civil liabilities based solely on the federal securities laws of the United States. In addition, awards for punitive damages in actions brought in the United States or elsewhere may be unenforceable in the United Kingdom. An award for monetary damages under the U.S. securities laws would likely be considered punitive if it did not seek to compensate the claimant for loss or damage suffered and was intended to punish the defendant.
ii
Table of Contents
SPECIAL NOTE REGARDING FORWARD-LOOKING STATEMENTS
This prospectus contains forward-looking statements that reflect our current expectations and views of future events. Forward-looking statements are contained principally in the sections titled “Summary,” “Risk Factors,” “Management’s Discussion and Analysis of Financial Condition and Results of Operations”, “Industry” and “Business.” Some of these forward-looking statements can be identified by terms and phrases such as “anticipate,” “aim,” “should,” “likely,” “foresee,” “believe,” “estimate,” “expect,” “intend,” “continue,” “could,” “may,” “plan,” “project,” “predict,” “will,” “shall” and similar expressions. These forward-looking statements include, but are not limited to, statements relating to:
| • | our goals and strategies; |
| • | expected trends in the steel industry; |
| • | expected trends in the industries served by our products, including the development of the railroad market and energy development and transportation; |
| • | our expected capital expenditures and commitments; |
| • | our future business development, results of operations and financial position; |
| • | developments in, or changes to, the laws, regulation and governmental policies governing our business and industry, including environmental regulations, “Buy America” policies, “Made in Canada” preferences, import regulations, trade tariffs and quotas, and the business and industry of our customers, suppliers and major shareholders; |
| • | expected trends in pricing and availability of our raw materials and energy used in our production operations; |
| • | expected global and regional economic development; and |
| • | our expectations with respect to our future pension obligations. |
While we always intend to express our best judgment when we make statements about what we believe will occur in the future, and although we base these statements on assumptions that we believe to be reasonable when made, these forward looking statements are not a guarantee of performance, and you should not place undue reliance on such statements. These statements are only predictions based upon our current expectations and projections about future events. Forward looking statements are subject to many uncertainties and other variable circumstances, many of which are outside of our control, that could cause our actual results and experience to differ materially from those we thought would occur.
These forward-looking statements speak only as of the date of this prospectus. Except as required by law, we undertake no obligation to publicly update or revise any forward-looking statements, whether as a result of new information, future events or otherwise. You should read this prospectus and the documents filed as exhibits to the registration statement, of which this prospectus is a part, completely and with the understanding that our actual future results may be materially different from what we expect.
There are important factors that could cause our actual results, level of activity, performance or achievements to differ materially from the results, level of activity, performance or achievements expressed or implied by the forward-looking statements. In particular, you should consider the numerous risks provided under “Risk Factors” in this prospectus.
CERTAIN TERMS USED IN THIS PROSPECTUS
In this prospectus, except as otherwise indicated or the context otherwise requires:
| • | “ABL Credit Facility” refers to the Credit Agreement, by and between EVRAZ Inc. NA, EVRAZ Inc. NA Canada, Canadian National Steel Corporation, EVRAZ Claymont Steel, Inc., Colorado and |
iii
Table of Contents
Wyoming Railway Company, CF&I Steel, L.P. Camrose Pipe Corporation, OSM Distribution, Inc., Oregon Steel Mills Processing Inc. and New CF&I, Inc., as the Borrowers, and General Electric Capital Corporation, Bank of America, N.A., UBS Securities LLC, and the other financial institutions party hereto, as lenders, dated as of December 23, 2011, as amended on December 21, 2012, and as further amended on November 7, 2014; |
| • | “API” refers to the American Petroleum Institute; |
| • | “apparent demand” is calculated as domestic shipments plus imports minus exports; |
| • | “Bakken” refers to the oil and gas producing region in North Dakota; |
| • | “CAGR” refers to compound annual growth rate; |
| • | “Class I railroad” refers to the United States railroad classification by the Interstate Commerce Commission, which defines railroads as Class I if they have annual carrier operating revenues of $250 million or more after adjusting for inflation; |
| • | “Code” refers to the Internal Revenue Code of 1986, as amended; |
| • | “EAF” refers to an electric arc furnace, a furnace that melts scrap steel and alloys by means of an electric arc; |
| • | “effective capacity” refers to capacity of production assets taking into account the effect of the product mix; |
| • | “EGSA” refers to Evraz Group S.A. a Luxembourg société anonyme wholly owned by EVRAZ plc, having its registered office at 46A, avenue J.F. Kennedy, L-1855 Luxembourg and being registered with the Luxembourg Trade and Companies Register under number B 105615; |
| • | “EICA” refers to EVRAZ Inc. NA Canada, a corporation incorporated pursuant to the Canada Business Corporations Act and, immediately after completion of this offering, a wholly owned subsidiary of the Company, together with its subsidiaries; |
| • | “EINA” refers to EVRAZ Inc. NA, a Delaware corporation and wholly owned subsidiary of the Company, together with its subsidiaries; |
| • | “ERW” refers to the electric resistance welding process where heat to form the weld is generated by the electrical resistance of material combined with the time and the force used to hold the materials together during welding; |
| • | “EVRAZ Camrose” refers to Camrose Pipe Corporation, a Delaware corporation and a wholly owned subsidiary of EINA; |
| • | “EVRAZ Group” refers to EVRAZ plc, a public company limited by shares organized under the laws of England and Wales, together with its direct and indirect subsidiaries; |
| • | “EVRAZ KGOK” refers to Joint Stock Company “EVRAZ Kachkanarsky Ore Mining and Processing Plant”, an EVRAZ plc subsidiary; |
| • | “EVRAZ NORTH AMERICA,” “ENA”, the “Company” and “we,” “us,” “our” and other similar terms refer to the consolidated business of EVRAZ NORTH AMERICA LIMITED and all of its consolidated subsidiaries post-Reorganization; |
| • | “HSAW” refers to helical submerged arc welding, a technology commonly used in the production of large diameter spiral pipe; |
| • | “HSR” refers to High Speed Rail defined typically as dedicated rail lines supporting a range of speeds over 110 miles per hour; |
iv
Table of Contents
| • | “Kt” refers to a unit of weight or capacity equal to 1,000 (one thousand) short tons; |
| • | “LD Pipe” refers to large diameter pipe with an outside diameter of above 24”; |
| • | “Lean Manufacturing” refers to a set of methodologies that aim to maximize value and minimize waste in the manufacturing process; |
| • | “LSAW” refers to longitudinal submerged arc welding, a technology commonly used in the production of large diameter pipe; |
| • | “Midwest” refers to the geography recognized by the United States Census Bureau as the region consisting of 12 states in the north central United States: Illinois, Indiana, Iowa, Kansas, Michigan, Minnesota, Missouri, Nebraska, North Dakota, Ohio, South Dakota, and Wisconsin; |
| • | “MMBTU” refers to a million British thermal units. One British thermal unit energy is equal to about 1055 joules; |
| • | “North America” refers to the United States, Canada, and Mexico; |
| • | “NTMK” refers to EVRAZ Nizhniy Tagil Iron and Steel Works, a wholly-owned subsidiary of EGSA. NTMK products are sold by East Metals AG, a wholly-owned subsidiary of EGSA, acting as agent for NTMK; |
| • | “OCTG” refers to oil country tubular goods, which include pipe and tube products used in the oil and gas exploration and production, such as drill pipe, casing and tubing; |
| • | “operating subsidiaries” refers to EICA and EINA and their respective subsidiaries; |
| • | “Pacific Northwest” refers to the region in western North America that consists of the United States states of Oregon, Washington, and the Canadian province of British Columbia; |
| • | “PFIC” refers to passive foreign investment company within the meaning of section 1297(a) of the Code; |
| • | “Rockies” refers to the oil and gas producing region comprising of the United States states of Colorado, Wyoming, Utah, and Montana; |
| • | “SD Pipe” refers to small diameter line pipe with an outside diameter of 24” and below; |
| • | “tons” refers to short tons, a unit of weight equivalent to 2,000 pounds; |
| • | “West Coast” refers to the United States states and Canadian provinces that border the Pacific Ocean; |
| • | “Western Canada” refers to the provinces of Alberta, British Columbia and Saskatchewan; |
| • | “Western North America” refers to Western Canada and Western United States; |
| • | “Western Plate Market” refers to the region comprised of the United States states of Arizona, California, Colorado, Idaho, Montana, Nevada, North Dakota, Oregon, Utah, Washington, and Wyoming; as well as the Canadian provinces of British Columbia and Alberta; |
| • | “Western rail demand” refers to rail demand from the Western railroads and short line and distribution volumes sold in Western North America and Mexico; |
| • | “Western railroads” refers to Burlington Northern Santa Fe, Union Pacific, Canadian Pacific and Ferromex; and |
| • | “Western United States” and “West” refer to states west of the Mississippi River. |
PRESENTATION OF INFORMATION IN THIS PROSPECTUS
Unless otherwise indicated, the information in this prospectus assumes:
| • | that we own a majority interest, 51%, in EICA, and 100% of EINA; |
| • | no exercise of the underwriters’ option to purchase up to additional ordinary shares from us; and |
| • | an initial public offering price of $ per ordinary share, which is the midpoint of the estimated initial public offering price range set forth on the cover page of this prospectus. |
v
Table of Contents
This summary highlights information contained elsewhere in this prospectus and does not contain all of the information that you should consider in making your investment decision. Before deciding whether to invest in our ordinary shares, you should carefully read this entire prospectus, especially the risks of investing in our ordinary shares discussed under the heading “Risk Factors.”
Overview
We are a leading North American producer of engineered steel products for the rail, energy, and industrial end markets. We are the largest producer by volume in the North American rail market and in the North American LD Pipe market, with estimated market shares of 39% and 47%, respectively, in 2013. We also held leading positions in the Western Canada OCTG, SD Pipe, and West Coast plate markets in 2013.
We operate six production sites strategically located close to key markets demonstrating favorable growth dynamics, including the Western North American LD Pipe, OCTG, and rail markets. Rail and energy (exploration, production, and transmission) products, collectively, represented approximately 66% of our shipments by volume in 2013. Collectively, our facilities have an effective annual capacity of approximately 3.5 million tons of finished steel products. In addition to our rail, LD Pipe and OCTG mills, we operate the only plate mill on the West Coast, a wire rod mill in Pueblo, Colorado, and we process scrap in several Canadian provinces and in Colorado and North Dakota, which, collectively, provide approximately a third of the scrap used in our steel making operations.
Our focus on engineered products and our strong customer relations favorably positions us to benefit from volume and margin growth in our key markets. The close proximity of our production sites to our customers provides us with freight and other logistical benefits that support our position as a low cost producer on a delivered basis. We serve a diversified and high quality customer base, much of which is comprised of well-known industry leaders. We have longstanding relationships and technical partnerships with many of our key customers, and believe we are the preferred supplier for many of our key customers’ critical applications. Taken together, these factors constitute competitive advantages that support our leadership positions in the markets we serve.
We organize our operations into three segments: Long Division, Tubular Division, and Flat Division.
| • | Long Division:Our Long Division, based in Pueblo, Colorado, is the largest domestic United States producer of premium rail and the only rail producer in Western North America, a region that we believe accounted for a majority of North American rail demand in 2013. We operate an EAF furnace, round billet caster, and hot-rolling mills that produce rail, seamless pipe, and wire rod. As the only large consumer of scrap in Colorado, we believe that we enjoy a cost advantage on shredded scrap (our largest raw material by volume) compared to the industry benchmark for Midwest shredded scrap prices. In 2013, total sales volume for our Long Division was 983Kt. |
| • | Tubular Division: Our Tubular Division is the largest North American producer of LD Pipe, which is used in oil and gas transmission, and the only supplier of fully “Made in Canada” LD Pipe. We expect that development of oil sands and shale formations in Western Canada and the United States will lead to significant near term investments in infrastructure, including new pipelines, in order to access key energy markets. We are also the largest OCTG producer in Western Canada, where we operate the only OCTG heat treat line in the region. This gives us the ability to produce heat treated pipe typically required in the demanding non-conventional drilling applications used in shale and oil sands exploration. Our Tubular Division has sites in three regions: Saskatchewan, Alberta, and Oregon. In Regina, Saskatchewan, our site consists of two EAFs and a slab caster that feeds a mill that primarily |
1
Table of Contents
rolls slab into coiled plate used in our pipe facilities. At this site we also operate four HSAW LD Pipe mills and two straight seam ERW mills. In Alberta, we operate sites in Calgary, Red Deer, and Camrose with a total of three straight seam ERW pipe mills, three API and two premium threading lines, a heat treat facility, and one LSAW LD Pipe mill. In Portland, Oregon, we operate two HSAW LD Pipe mills. In 2013, total sales volume for our Tubular Division was 1,023Kt. |
| • | Flat Division:Our Flat Division, based in Portland, Oregon, operates the only plate mill on the West Coast. Our proximity to deep water ports allows us to cost effectively source slabs from foreign suppliers. At this site we also operate a structural tube mill, a slitting line, and a quench and tempering facility for plate. In 2013, total sales volume for our Flat Division was 798Kt. |
We have a high degree of vertical integration across our operations that enhances operational efficiency, reduces logistics costs, and makes us less reliant on outside suppliers. Our recycling operations supply us with approximately a third of our scrap needs. We produce substantially all of the billets used in our rail, seamless, and wire rod mills. In 2013, we produced substantially all the slab consumed at our Regina site and the coil and plate consumed by our tubular mills.
For the nine months ended September 30, 2014, we sold 2.1 million tons of steel products which generated total sales of $2,358.8 million, Adjusted EBITDA of $234.9 million, net income attributable to EVRAZ NORTH AMERICA LIMITED of $55.3 million, and net cash used in continuing operating activities of $127.5 million.
For the nine months ended September 30, 2013, we sold 1.9 million tons of steel products which generated total sales of $2,010.1 million, Adjusted EBITDA of $127.1 million, net loss attributable to EVRAZ NORTH AMERICA LIMITED of $6.6 million, and net cash provided by continuing operating activities of $60.6 million.
In 2013, we sold 2.5 million tons of steel products which generated total sales of $2,748.9 million, Adjusted EBITDA of $176.0 million, net loss attributable to EVRAZ NORTH AMERICA LIMITED of $709.3 million, and net cash provided by continuing operating activities of $116.1 million. Adjusted EBITDA is a non-GAAP financial measure. See “Summary Consolidated Financial Information and Other Data—Adjusted EBITDA” for a description of how we define and calculate Adjusted EBITDA and for a reconciliation of Adjusted EBITDA to net income (loss) attributable to EVRAZ NORTH AMERICA LIMITED.
Competitive Strengths
Leading positions across the markets we serve
We currently have the number one positions in North American rail, North American LD Pipe, Western Canada OCTG, and Western North American plate markets.
Rail—We are the largest producer of rail in North America based on volume with approximately 39% share of the North American market in 2013 and approximately 55% share of the Western North America market in 2013, where we are the only rail producer. We believe that our customers, Class I railroads, regard us as the preferred domestic source of highly engineered premium rail, which reduces our customers’ lifecycle cost and improves rail safety. We believe that our technical and product development capabilities and our next generation of premium rail products, that are in the process of being launched, provide us with a strong and defensible position. Our leading position in the North American rail market has allowed us to achieve consistently high utilization rates at our rail-producing facilities.
LD Pipe—We are the largest producer of LD Pipe in North America, with an estimated market share of approximately 47% in 2013 based on volume. We are also the only producer of LD Pipe in Canada and the only source of fully “Made in Canada” LD Pipe, which we believe is a significant advantage in Canada as we believe
2
Table of Contents
our customers value locally produced LD Pipe.We also believe that our customers value the high quality of our products and our strong technical capabilities.Furthermore, operating LD Pipe mills in three locations (Regina, Saskatchewan; Camrose,Alberta; and Portland, Oregon), gives us the unique ability to produce the specific type of LD Pipe our customers require in an optimal location.
OCTG—We are the largest OCTG producer in Western Canada, where in 2013 our facilities accounted for approximately 72% of the total finished OCTG production capacity in the region. We produce a range of casing and tubing products used by our customers in many of their oil and gas exploration and production applications. We believe that we are regarded as a high quality supplier. We are also the only OCTG producer in Western Canada with a heat treat facility to supply the heat-treated pipe and premium connections required in that market. We have a wide range of products, including our own proprietary premium connections, and have over 20 years of experience with premium connections required by the thermal wells drilled in the oil sands of Alberta.
Plate—We are the only plate producer in the West Coast and have consistently operated at nearly full effective capacity since 2010. We believe our ability to roll custom sizes within short lead times is a competitive advantage compared to other domestic producers and to imports. We believe we held the leading position in the West Coast market and that we were the largest supplier of plate for most of our customers’ purchases in the region in 2013.
Operations strategically located to benefit from growth in the energy and rail markets
We forecast strong growth of LD Pipe demand to support increased oil and gas production in Canada and the United States. We estimate that in 2013, LD Pipe demand in the United States and Canada was 930Kt. We estimate that the announced projects that pipeline operators expect to put in service between 2016 and 2018 will require approximately 4.9 million tons of LD Pipe. Projects announced in Western Canada alone are expected to require 2.3 million tons of LD Pipe. We believe that our close relationships with key customers, track record of product performance, lower transportation costs as compared to those of our competitors (due to the location of our facilities), and expertise in meeting low temperature impact requirements will enable us to capture a significant share of these volumes.
Growth of unconventional drilling in Western Canada and the United States is expected to result in higher OCTG use. Metal Bulletin Research estimates United States and Canadian OCTG demand will grow at a 5% CAGR between 2014 and 2020. Our OCTG mills are optimally located to supply three large oil and gas producing regions in North America: Western Canada, the Bakken, and the Rockies, which collectively consumed approximately 2.0 million tons of OCTG in 2013 (approximately 29% of the overall United States and Canada OCTG demand). We estimate that the location of our OCTG mills provided us with a freight advantage to serve Western Canada of approximately $100 per ton in 2013 compared to OCTG mills located in Texas, as well as a freight advantage compared to Asian imports.
We believe that North American rail demand growth will be in the range of 3% to 4% annually between 2014 and 2018, primarily due to increased annual investments by Class I railroads. Class I railroads’ investments in infrastructure and equipment increased from $6.0 billion in 2000 to $15.5 billion in 2013, underpinning growth in rail demand. We also expect that the North American market will continue shifting towards premium rail, as railroads seek to alleviate rail corridor congestion, operate with increased axle loads, and support increased shipments volumes related to the energy market and intermodal freight.
Western rail demand accounted for approximately 58% of the overall North American rail demand in 2013. Our recently upgraded rail mill in Pueblo, Colorado is the only North American rail producer located west of the Mississippi River and has direct access to the Burlington Northern Santa Fe and the Union Pacific railroads, our two largest customers, resulting in low delivery costs to these customers.
3
Table of Contents
Engineered products portfolio
A significant proportion of our product mix is comprised of engineered products such as rail, LD Pipe, heat treated OCTG pipe, premium connections, high-carbon wire rod, and armor and wear resistant plate. In these markets, our customers value quality and performance and pay a price premium for products that reduce risk and lifecycle costs. Many of our customers face significant costs of failure, particularly in the LD Pipe and rail markets. As a result, our customers are highly conscious of the value of supplier reliability and of the risks associated with switching suppliers and typically require suppliers to undergo qualification periods that may span several years.
We continue to shift our product mix further towards engineered products and are investing in incrementally expanding our capacity and capabilities. Our three technology centers support product and process design, full-scale testing, and work closely with our customers to build upon our position as their technical partner. This allows us to gain important insights into the dynamics of our end markets and proactively adjust our product portfolio to meet changing demands.
In rail, demand continues to shift towards premium products that extend track life and reduce failure risks. As a result, premium rail in North America represented approximately 66% of rail demand in 2012 compared to 60% in 2010. Premium rail is typically priced at a premium to standard rail, reflecting the value customers ascribe to lifecycle cost and risk reduction associated with premium rail. We believe that our customers perceive us as a high quality domestic producer of premium rail, particularly deep head-hardened rail. Since we introduced head hardened rail 20 years ago, we have developed strong technical partnerships (engineering, maintenance, and research and development) with our customers. Currently, we are in the testing stages of our sixth generation of premium rail, which offers enhanced wear resistance and fracture toughness.
In OCTG, the increase in unconventional drilling for oil and gas requires high performance pipe products to withstand significant thermal and mechanical stresses and highly corrosive conditions. To meet these challenges, drilling companies use heat treated pipe to provide higher yield strength and utilize premium connections to provide seal integrity under the most demanding conditions. We operate the only OCTG heat treating line in Western Canada and have a portfolio of proprietary premium connections that are designed for applications in the Alberta oil sands and for other non-conventional drilling.
In LD Pipe, our customers continue to seek to improve weldability and enhance the safety of their pipelines. We leverage our research and development capabilities and work closely with customers to develop new steel chemistries and manufacturing processes to achieve higher levels of product performance, and to reduce the risk of pipeline incidents.
Defensible market positions and operations with low delivered costs
We believe that our leading market positions are highly defensible as a result of our engineered product know-how and design capabilities, existing product qualifications and track record of quality and reliability, established customer relationships with industry leaders, as well as the proximity of our facilities to customer demand and the significant investment required to replicate our asset base.
We believe that we are a low cost North American producer on a delivered basis for our key products in our key markets. Our operations are located in close proximity to our customers, giving us freight and other logistical advantages. We also believe that our high levels of utilization and productivity reduce our overall labor and fixed costs per ton.
Our recently upgraded rail mill in Pueblo, Colorado, is the only North American rail mill located in the Western United States. It also benefits from direct access to our largest rail customers. As a result, we incur minimal delivery costs for rail delivered to these railroads.
4
Table of Contents
We utilize EAF technology at our melt shops in Regina and Pueblo, where we have cost-advantaged sources of local scrap that provide us with a significant portion of our raw material needs. Our recycling facilities supplied 46% of our Regina and 25% of our Pueblo scrap requirements in 2013. In addition, our recycling operations provide us with insight into the scrap market pricing dynamics. Our plate mill in Portland benefits from close proximity to a deep water port and access to the overseas slab market.
New market entrants face significant challenges and significant capital investments in order to establish themselves. For example, entering the rail market requires significant scale of operations, long qualification periods, and slow adoption rates by railroad customers. The LD Pipe market is primarily project-based, making it challenging for new entrants to secure sufficient production volumes to establish themselves. Additionally, LD Pipe customers favor producers with an established track record of quality and reliability.
Financial strength with volume growth and continued margin enhancement
Between 2011 and 2013 we achieved annual average Adjusted EBITDA of $320.3 million, annual average net cash provided by continuing operating activities of $298.3 million, annual average net loss of $184.1 million and annual average Adjusted EBITDA per ton of $128.
Our diversified product portfolio allows us to adjust our product mix to respond to changes in market dynamics, resulting in our melt shops in Regina and Pueblo historically operating at high utilization rates. Our Long Division can flex volume allocation across rail, wire rod and seamless pipe to maximize profitability based on market dynamics. Similarly, our Tubular Division’s Regina site can flex volumes across OCTG, SD Pipe, LD Pipe, plate and coil. Our steelmaking capacity can be supplemented with coil, plate, or billet purchases.
We have a track record of growth through organic investments focused on our existing customers and markets. For example, in 2013, we completed the upgrade and expansion of our Pueblo rail mill and steelmaking facilities, increasing our rail annual capacity to 580Kt. In addition, we upgraded our OCTG premium product capabilities with the addition of premium threading lines. We are currently also in the process of expanding our OCTG heat treat capacity at our Calgary site, and considering a number of other investments that will enable us to continue shifting our mix towards engineered products. In addition, in LD Pipe, we have 310Kt of unused capacity that we expect to utilize as demand in that market continues to grow.
Experienced operating team, supportive shareholder and commitment to strong corporate governance
Our senior management team brings significant experience in strategy and industrial manufacturing. We repositioned our leadership team in 2013 with a number of internal promotions including Conrad Winkler, our Chief Executive Officer and former Executive Vice President of the Long Division. Under Mr. Winkler’s leadership, the management team has sharpened its focus on our core operations and developed a strategy to increase profitability across all of our segments.
EVRAZ Group is a committed and supportive shareholder and will continue to hold a controlling interest in us following the completion of this offering. We believe we will continue to benefit from our relationship with EVRAZ Group, through EVRAZ Group’s global perspective, industry experience and operational execution. Our cooperation with EVRAZ Group is also demonstrated by our slab supply arrangement with EVRAZ Group.
We and EVRAZ Group are committed to strong corporate governance consistent with United States corporate standards, and following the offering will have a Board of Directors comprised of a majority of independent Directors as defined under the Nasdaq rules.
5
Table of Contents
Business Strategy
Grow in the markets we lead
We intend to fully utilize the production capacity of our Portland and Camrose LD Pipe facilities to meet market demand, while investing in further improving quality across our steel value chain. In addition to fully utilizing our current capacity at Portland and Camrose, we intend to make incremental investments in our LD Pipe mills and steelmaking facilities to further improve our capabilities and quality to meet the growing demand.
We are increasing OCTG heat treat capacity in Western Canada and expanding the production of high-value premium connections. We are currently expanding our heat treat capacity at Calgary, and evaluating installing heat treat capacity in Red Deer to increase output. In addition, we are expanding our premium connections portfolio to fully utilize the capacity of our threading lines in Red Deer.
We are leveraging our recent rail technology center and rail mill investments to increase our profitability. We are utilizing the capabilities of our recently upgraded rail mill and steel making assets to achieve 580Kt annual shipments and to continue increasing the proportion of premium rail in our sales mix. We aim to continue investing in improving the performance of our rail through development of next generation products and improved processing methods.
Expand our portfolio of engineered products and technical partnerships
We will continue to leverage our technology centers to deepen technical relationships with our customers and continue developing cost-effective engineered products that meet their demanding requirements.
We intend to deepen our technical relations with our rail and LD Pipe customers to develop products that deliver superior reliability and lifecycle cost.
We are expanding our premium OCTG connections portfolio in order to develop a more complete coverage of sizes and applications.
We plan to commercialize our sixth generation of premium rail, which offers superior wear resistance and fracture toughness. We expect to complete testing and work with our Class I railroad customers to fully achieve the lifecycle benefits of the higher wear resistance and fracture toughness in our next generation rail products.
Continuously improve our safety, quality and cost
We intend to become an industry leader in safety practices and relentlessly pursue an injury free workplace. We have reduced our lost time incident rate by more than 80% since 2010 and aim to continue improving on this position through close employee engagement.
We aim to extend our lead in quality across our operations through the application of our quality system, new process technology, and an expanded quality organization. We intend to continue working closely with our customers to continue offering a highly reliable supply chain.
We are focusing our resources on continuously improving yield and throughput to maintain our low cost position in the markets we serve. We believe that our ability to improve operations through Lean Manufacturing and other techniques will continue to allow us to make significant strides across our businesses in the coming years.
We continue to capitalize on the cost advantages of our vertical integration. We intend to improve upon our already favorable raw material costs by optimizing our rolling schedules, scrap recipes, and sourcing among our recycling business, local third party scrap purchases, and scrap substitutes.
6
Table of Contents
Risk Factors
Investing in our ordinary shares involves risks. You should carefully consider the risks described in “Risk Factors” before making a decision to invest in our ordinary shares. If any of these risks actually occurs, our business, financial position or results of operations would likely be materially adversely affected. In such case, the trading price of our ordinary shares would likely decline, and you may lose all or part of your investment. The following is a summary of some of the principal risks we face:
| • | cyclical changes in market supply and demand for steel and conditions affecting steel consumption; |
| • | increased competition brought about by excess North American and global steelmaking capacity; |
| • | increased imports of steel into North America, including as a result of United States, Canadian or foreign trade policy affecting the amount of foreign imported steel, or adverse outcomes of pending and future trade cases alleging unlawful practices in connection with steel imports; |
| • | adverse conditions in the industries served by our products, including as a result of economic conditions, government regulations or other factors; |
| • | competition from other companies serving our end markets; |
| • | changes in the availability or cost of raw materials, including slabs, pig iron, iron concentrate, or other raw materials or supplies, which we use in our production processes; |
| • | periodic fluctuations in the availability and cost of electricity, natural gas, or other utilities; |
| • | the occurrence of planned or unanticipated equipment failures and plant outages; |
| • | margin compression resulting from our inability to pass increases in costs of raw materials and supplies to our customers; |
| • | loss of one or more of our major customers or key suppliers; |
| • | the impact of, or changes in, environmental law or in the application of other legal or regulatory requirements upon our production processes or costs of production or upon those of our suppliers or customers, including actions by government agencies, such as the United States Environmental Protection Agency, Environment Canada or related state, provincial, and local agencies, on pending or future environmentally related construction or operating permits; |
| • | increased governmental regulation of our business, industry or our products or the business and industry of our customers, suppliers or major shareholders; |
| • | future changes in tax laws or the Company not being treated as a foreign corporation for United States federal income tax purposes; and |
| • | labor unrest, work stoppages and/or strikes involving our own workforce, those of our important suppliers or customers, or those affecting the steel industry in general. |
Company Information
The Company was incorporated in England on November 28, 2012 under the name Viscaria Limited, pursuant to the laws of England and Wales. On August 19, 2014, the Company was renamed EVRAZ NORTH AMERICA LIMITED. Prior to the consummation of this offering, EVRAZ NORTH AMERICA LIMITED will be converted into an English public company limited by shares and renamed EVRAZ NORTH AMERICA PLC, as more fully described in “Our Structure and Reorganization.”
Our principal executive offices are located at 200 East Randolph Street, Suite 7800, Chicago, IL 60601. Our telephone number at this address is +1 (312) 533 3555. The Company’s registered address is at 20-22 Bedford Row, London WC1R 4JS, United Kingdom. The Company’s agent in the United States is Evraz Inc. NA, c/o Corporation Services Company, and its address is at 2711 Centerville Rd, Suite 400, Wilmington, DE 19808.
7
Table of Contents
Reorganization and Corporate Structure Following the Completion of this Offering
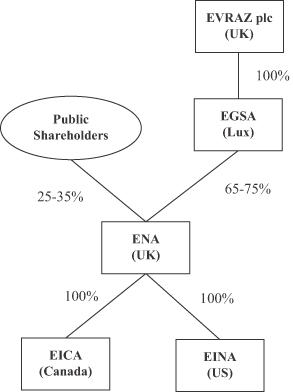
The Company and EICA have each historically been direct or indirect wholly owned subsidiaries of EGSA, which in turn is wholly owned by EVRAZ plc. Prior to the Reorganization, EINA was 36.5% owned by ENA and 63.5% owned by Mastercroft S.à r.l., a Luxembourgsociété anonyme a responsabilité limitée, having its registered office at 46A, avenue J.F. Kennedy, L-1855 Luxembourg and being registered with the Luxembourg Trade and Companies Register under number B 186304, or Mastercroft, a direct wholly owned subsidiary of EGSA. Following the completion of the Reorganization and our acquisition of the remaining EICA stake using the proceeds of this offering, EICA and EINA will each be wholly owned subsidiaries of the Company. See “Our Structure and Reorganization” for a detailed summary of the steps that will be taken in the Reorganization and “Summary Consolidated Financial Information and Other Data” for an illustration of the pro forma effect of the acquisition of the remaining EICA stake.
Following the completion of the Reorganization, we will be a holding company and will conduct our operations through EICA, EINA and their subsidiaries.
Following completion of this offering, EGSA will hold approximately % of our issued and outstanding ordinary shares.
8
Table of Contents
Following completion of the Reorganization and the application of the use of proceeds from this offering, our structure and ownership will be as summarized in the following condensed structure chart:
9
Table of Contents
Issuer | EVRAZ NORTH AMERICA LIMITED (to be renamed EVRAZ NORTH AMERICA PLC prior to the completion of this offering). |
Public offering price | We currently expect that the initial public offering price will be between $ and $ per ordinary share. |
Ordinary shares being offered | ordinary shares. |
Ordinary shares outstanding before this offering | ordinary shares. |
Ordinary shares outstanding immediately after this offering | ordinary shares. |
Underwriters’ purchase option | We have granted the underwriters the right to purchase up to additional ordinary shares within 30 days from the date of this prospectus. |
Use of proceeds | We estimate that our net proceeds from this offering, after deducting the underwriting discount and estimated offering expenses, will be approximately $ million (or approximately $ million if the underwriters exercise their option to purchase additional ordinary shares in full) assuming the ordinary shares are offered at $ per share, the mid-point of the estimated offering price range set forth on the cover page of this prospectus. A $ increase/(decrease) in the assumed initial public offering price of $ per share would increase/(decrease) the net proceeds to us from this offering by approximately $ million, assuming the number of ordinary shares offered by us as set forth on the cover page of this prospectus remains the same and after deducting the underwriting discounts and commissions. |
| We intend to use the first $ million of the net proceeds from this offering, excluding the net proceeds from any exercise of the underwriters’ option to purchase additional ordinary shares, to complete the acquisition of EICA. |
| To the extent we raise any additional net proceeds in this offering, excluding any net proceeds received by us from the exercise by underwriters of their option to purchase additional ordinary shares, we intend to use such additional net proceeds to make equity contributions to EICA, which EICA will use to repay amounts outstanding under Loan Contract No. KGOK-EICA-03, or Note 3, or for general corporate purposes. Note 3 is due June 30, 2020 and carries a fixed interest rate of 8.25%, and had a balance of CAD 431.6 million outstanding as of November 14, 2014. We used the proceeds from Note 3 to repay Note 1 and Note 2. We used the proceeds from Note 1 and Note 2 to finance the business acquisition of EVRAZ Inc. NA Canada assets. See “Related Party Transactions.” |
10
Table of Contents
| We also intend to use the net proceeds received by us from the exercise of the underwriters’ option to purchase additional ordinary shares either to make an equity contribution to EICA, which EICA will use to repay additional amounts outstanding under its loans from EVRAZ KGOK, or for general corporate purposes. |
Payment and settlement | Our ordinary shares are expected to be delivered against payment on , 2014. |
Dividend policy | We currently intend to pay dividends on our ordinary shares at a dividend yield and schedule comparable with that of our North American peers. However, any future determination as to the declaration and payment of dividends, if any, will be made at the discretion of our Board of Directors and will depend on then existing conditions, including our results of operations, financial position, contractual restrictions, capital requirements, business prospects and other factors our Board of Directors may deem relevant. Under English law, we may pay dividends only out of our accumulated, realized profits, so far as not previously utilized by distribution or capitalization, less our accumulated, realized losses, so far as not previously written off in a reduction or reorganization of capital duly made. Because we are a holding company and have no direct operations, we will only be able to pay dividends from our available cash on hand and any funds we receive from our operating subsidiaries. |
Risk factors | See “Risk Factors” included elsewhere in this prospectus for a discussion of factors you should carefully consider before deciding to invest in our ordinary shares. |
Listing | We are in the process of applying for the listing of our ordinary shares on Nasdaq under the symbol “ENA.” |
We base the number of ordinary shares outstanding following the completion of this offering on the number of ordinary shares outstanding as of the date of this prospectus.
11
Table of Contents
SUMMARY CONSOLIDATED FINANCIAL INFORMATION AND OTHER DATA
The summary consolidated historical financial and operating data as of December 31, 2012 and 2013 and for the years ended December 31, 2011, 2012 and 2013 presented below (except for the unaudited pro forma financial information on the statement of operations for the year ended December 31, 2013 prepared under Article 11 of Regulation S-X) have been derived from our audited consolidated financial statements included elsewhere in this prospectus. The summary consolidated historical unaudited financial and operating data for the nine months ended September 30, 2013 and as of and for the nine months ended September 30, 2014 (except for the unaudited pro forma financial information for the nine months ended September 30, 2014 prepared under Article 11 of Regulation S-X) has been derived from our unaudited consolidated financial statements included elsewhere in this prospectus and includes all adjustments (consisting of normal recurring adjustments) that we consider necessary for a fair presentation of the financial position and the results of operations for these periods. Our historical results for any prior period are not necessarily indicative of results expected in any future period. Additionally, the summary historical unaudited consolidated financial and operating data at and for the nine months ended September 30, 2014 are not necessarily indicative of the results expected at and for the year ending December 31, 2014 or for any future period.
You should read the summary consolidated historical financial and operating data set forth below in conjunction with the sections entitled “Capitalization” and “Management’s Discussion and Analysis of Financial Condition and Results of Operations” and our consolidated financial statements and notes thereto included elsewhere in this prospectus.
| Nine Months ended September 30, | Year ended December 31, | |||||||||||||||||||
| 2013 | 2014 | 2011 | 2012 | 2013 | ||||||||||||||||
| ($ in millions, except per share amounts, tons in thousands) | ||||||||||||||||||||
Sales: | ||||||||||||||||||||
Product sales | $ | 1,896.5 | $ | 2,235.6 | $ | 2,896.6 | $ | 2,768.5 | $ | 2,584.9 | ||||||||||
Freight | 113.6 | 123.2 | 150.5 | 135.9 | 164.0 | |||||||||||||||
|
|
|
|
|
|
|
|
|
| |||||||||||
| 2,010.1 | 2,358.8 | 3,047.1 | 2,904.4 | 2,748.9 | ||||||||||||||||
|
|
|
|
|
|
|
|
|
| |||||||||||
Costs and Expenses: | ||||||||||||||||||||
Cost of sales | 1,841.3 | 2,060.5 | 2,576.7 | 2,505.2 | 2,513.0 | |||||||||||||||
Selling, general and administrative expenses | 174.0 | 186.0 | 230.2 | 232.3 | 235.5 | |||||||||||||||
Impairment of assets | — | — | - | - | 468.6 | |||||||||||||||
Loss (gain) on disposal of assets | 0.6 | (0.2 | ) | (0.5 | ) | 2.3 | 1.6 | |||||||||||||
|
|
|
|
|
|
|
|
|
| |||||||||||
| 2,015.9 | 2,246.3 | 2,806.4 | 2,739.8 | 3,218.7 | ||||||||||||||||
|
|
|
|
|
|
|
|
|
| |||||||||||
Operating (loss) income | (5.8 | ) | 112.5 | 240.7 | 164.6 | (469.8 | ) | |||||||||||||
Other (expense) income: | ||||||||||||||||||||
Interest expense | (53.1 | ) | (47.5 | ) | (96.5 | ) | (62.0 | ) | (70.6 | ) | ||||||||||
Dividend and interest income | 0.2 | 0.1 | 0.2 | 0.2 | 0.1 | |||||||||||||||
Foreign exchange gains (losses) | 0.2 | (9.3 | ) | (12.3 | ) | 15.7 | (4.0 | ) | ||||||||||||
Loss on extinguishment of debt | — | — | (6.3 | ) | - | - | ||||||||||||||
Other income, net | 1.2 | 3.4 | 5.0 | 2.8 | 2.2 | |||||||||||||||
|
|
|
|
|
|
|
|
|
| |||||||||||
(Loss) income from continuing operations before income taxes | (57.3 | ) | 59.2 | 130.8 | 121.3 | (542.1 | ) | |||||||||||||
Income tax benefit | 52.2 | 6.4 | 5.5 | 13.6 | 52.8 | |||||||||||||||
|
|
|
|
|
|
|
|
|
| |||||||||||
(Loss) income from continuing operations | (5.1 | ) | 65.6 | 136.3 | 134.9 | (489.3 | ) | |||||||||||||
Loss from discontinued operations before income taxes | (44.9 | ) | (16.0 | ) | (1.3 | ) | (123.8 | ) | (391.4 | ) | ||||||||||
Income tax benefit | 22.2 | 5.8 | 11.0 | 22.7 | 121.2 | |||||||||||||||
|
|
|
|
|
|
|
|
|
| |||||||||||
Net (loss) income from discontinued operations(1) | (22.7 | ) | (10.2 | ) | 9.7 | (101.1 | ) | (270.2 | ) | |||||||||||
Less net loss (income) attributable to non-controlling interest(1) | 21.2 | (0.1 | ) | (3.6 | ) | (19.2 | ) | 50.2 | ||||||||||||
|
|
|
|
|
|
|
|
|
| |||||||||||
Net (loss) income attributable to EVRAZ NORTH AMERICA LIMITED(1) | $ | (6.6 | ) | $ | 55.3 | $ | 142.4 | $ | 14.6 | $ | (709.3 | ) | ||||||||
|
|
|
|
|
|
|
|
|
| |||||||||||
Basic and diluted earnings per share from continuing operations(1) | 16,047 | 11,634 | 132,648 | 115,726 | (438,660 | ) | ||||||||||||||
Basic and diluted (loss) earnings per share from discontinued operations(1) | (22,676 | ) | (1,809 | ) | 9,779 | (101,078 | ) | (269,941 | ) | |||||||||||
Basic and diluted earnings (loss) per share attributable to EVRAZ NORTH AMERICA LIMITED shareholders(1) | (6,629 | ) | 9,825 | 142,427 | 14,648 | (708,601 | ) | |||||||||||||
Other Financial Data: | ||||||||||||||||||||
Adjusted EBITDA(2) | $ | 127.1 | $ | 234.9 | $ | 437.9 | $ | 347.0 | $ | 176.0 | ||||||||||
Capital expenditures(3) | $ | 66.6 | $ | 46.5 | $ | 59.1 | $ | 67.3 | $ | 84.2 | ||||||||||
Operating Data: | ||||||||||||||||||||
Total tons sold | 1,851 | 2,076 | 2,500 | 2,503 | 2,518 | |||||||||||||||
Product sales per ton | $ | 1,025 | $ | 1,077 | $ | 1,159 | $ | 1,106 | $ | 1,027 | ||||||||||
Adjusted EBITDA per ton(2) | $ | 69 | $ | 113 | $ | 175 | $ | 139 | $ | 70 | ||||||||||
12
Table of Contents
| (1) | The table below represents the anticipated impact of the acquisition of the remaining 49% in EICA on our consolidated statements of operations, retroactively reflecting the acquisition as if the acquisition was completed at the beginning of each period presented (See “Our Structure and Reorganization”): |
| Pro forma Information: | ||||||||||||
| Nine months ended September 30, 2014 | ||||||||||||
| Actual | Pro forma Adjustments | Pro forma | ||||||||||
Net income | 55.4 | — | 55.4 | |||||||||
Less net income attributable to noncontrolling interest | (0.1 | ) | (6.9 | ) | (7.0 | ) | ||||||
|
|
|
|
|
| |||||||
Net income attributable to EVRAZ NORTH AMERICA LIMITED | 55.3 | (6.9 | ) | 48.4 | ||||||||
|
|
|
|
|
| |||||||
Earnings (loss) per share: | ||||||||||||
Basic and diluted earnings per share from continuing operations | 11,634 | 10,396 | ||||||||||
Basic and diluted loss per share from discontinued operations | (1,809 | ) | (1,809 | ) | ||||||||
Basic and diluted earnings per share attributable to EVRAZ NORTH AMERICA LIMITED shareholders | 9,825 | 8,587 | ||||||||||
| Year Ended December 31, 2013 | ||||||||||||
| Actual | Pro forma Adjustments | Pro forma | ||||||||||
Net loss | (759.5 | ) | — | (759.5 | ) | |||||||
Less net loss (income) attributable to noncontrolling interest | 50.2 | (50.5 | ) | (0.3 | ) | |||||||
|
|
|
|
|
| |||||||
Net loss attributable to EVRAZ NORTH AMERICA LIMITED | (709.3 | ) | (50.5 | ) | (759.8 | ) | ||||||
|
|
|
|
|
| |||||||
Earnings (loss) per share: | ||||||||||||
Basic and diluted loss per share from continuing operations | (438,660 | ) | (489,055 | ) | ||||||||
Basic and diluted loss per share from discontinued operations | (269,941 | ) | (269,941 | ) | ||||||||
Basic and diluted loss per share attributable to EVRAZ NORTH AMERICA LIMITED shareholders | (708,601 | ) | (758,996 | ) | ||||||||
| (2) | Adjusted EBITDA and Adjusted EBITDA per ton are non-GAAP financial measures. See “—Adjusted EBITDA” for the definition of these measures and for the reconciliation of Adjusted EBITDA to our net income (loss) attributable to EVRAZ NORTH AMERICA LIMITED. |
| (3) | Capital expenditures are measured on a cash basis and represent expenditures on fixed assets that are capitalized rather than expensed at the time of incurrence. |
| December 31, | September 30, 2014 | |||||||||||
| 2012 | 2013 | |||||||||||
| ($ in millions) | ||||||||||||
Balance Sheets Data: | ||||||||||||
Assets | ||||||||||||
Other current assets | $ | 1,060.1 | $ | 996.9 | $ | 1,074.5 | ||||||
Property, plant, and equipment, net | 1,301.6 | 1,224.2 | 1,149.9 | |||||||||
Goodwill | 1,596.3 | 1,082.1 | 1,047.3 | |||||||||
Intangibles, net | 522.2 | 444.8 | 392.7 | |||||||||
Assets held for sale | 430.0 | 18.2 | 3.2 | |||||||||
Other assets | 19.9 | 16.4 | 13.6 | |||||||||
|
|
|
|
|
| |||||||
Total assets | $ | 4,930.1 | $ | 3,782.6 | $ | 3,681.2 | ||||||
|
|
|
|
|
| |||||||
Liabilities and equity | ||||||||||||
Total current liabilities | $ | 443.0 | $ | 443.5 | $ | 393.9 | ||||||
Long-term debt (including related-party loans) | 1,130.9 | 874.4 | 913.4 | |||||||||
Deferred income taxes | 400.3 | 265.9 | 242.5 | |||||||||
Deferred employee benefits | 226.7 | 140.9 | 128.2 | |||||||||
Environmental liability, net of current portion | 28.9 | 28.7 | 26.0 | |||||||||
Other long-term liabilities | 28.3 | 18.9 | 12.5 | |||||||||
|
|
|
|
|
| |||||||
Total liabilities | 2,258.1 | 1,772.3 | 1,716.5 | |||||||||
|
|
|
|
|
| |||||||
Total equity(4) | $ | 2,672.0 | $ | 2,010.3 | $ | 1,964.7 | ||||||
|
|
|
|
|
| |||||||
Total liabilities and equity(4) | $ | 4,930.1 | $ | 3,782.6 | $ | 3,681.2 | ||||||
|
|
|
|
|
| |||||||
13
Table of Contents
| (4) | The table below represents the anticipated impact of the acquisition of the remaining 49% in EICA on our consolidated balance sheets, retroactively reflecting the acquisition as if the acquisition was completed at the beginning of the period presented (See “Our Structure and Reorganization”): |
ProForma Information:
| September 30, 2014 | ||||||||||||
| Actual | Pro forma Adjustments | Pro forma | ||||||||||
| ($ in millions) | ||||||||||||
EQUITY: | ||||||||||||
Common stock | — | — | — | |||||||||
Additional paid-in capital | 3,036.5 | 400.0 | 3,436.5 | |||||||||
Accumulated deficit | (1,354.2 | ) | (99.8 | ) | (1,454.0 | ) | ||||||
Accumulated other comprehensive income (loss): | ||||||||||||
Cumulative foreign currency translation adjustment | 5.8 | — | 5.8 | |||||||||
Pension and post retirement benefit plans, net of tax | (67.1 | ) | (29.2 | ) | (96.3 | ) | ||||||
|
|
|
|
|
| |||||||
Total EVRAZ NORTH AMERICA LIMITED Equity | 1,621.0 | 271.0 | 1,892.0 | |||||||||
Noncontrolling interest | 343.7 | (271.0 | ) | 72.7 | ||||||||
|
|
|
|
|
| |||||||
Total equity | 1,964.7 | — | 1,964.7 | |||||||||
|
|
|
|
|
| |||||||
Total liabilities and equity | 3,681.2 | — | 3,681.2 | |||||||||
|
|
|
|
|
| |||||||
Adjusted EBITDA
We use Adjusted Earnings Before Interest, Taxes, Depreciation and Amortization, or Adjusted EBITDA, and Adjusted EBITDA per ton ratios presented in this prospectus to evaluate our operating performance and to enhance comparability between periods. These measures are not required by, nor are they presented in accordance with GAAP. Neither Adjusted EBITDA nor Adjusted EBITDA per ton are measurements of financial performance under GAAP and should not be considered as an alternative to net income, operating income or any other performance measures derived in accordance with GAAP or as an alternative to cash flows from operating activities as a measure of liquidity.
We present Adjusted EBITDA and Adjusted EBITDA per ton because we consider them important supplemental measures of our performance and believe them to be frequently used by securities analysts, investors and other interested parties in the evaluation of companies in our industry. We define Adjusted EBITDA as net income (loss) attributable to EVRAZ NORTH AMERICA LIMITED plus interest expense, income tax benefit, depreciation and amortization, other income (net), foreign exchange (losses) gains, dividend and interest income, loss on extinguishment of debt, loss (gain) on disposal of assets, impairment of assets, net loss (income) from discontinued operations and net loss (income) attributable to noncontrolling interest. We calculate Adjusted EBITDA per ton by dividing Adjusted EBITDA by tons sold. You should not infer from our presentation of Adjusted EBITDA or Adjusted EBITDA per ton that our future results will be unaffected by unusual or nonrecurring items.
Adjusted EBITDA and Adjusted EBITDA per ton have limitations as an analytical tool and should not be considered in isolation or as a substitute for analysis of our operating results as reported under GAAP. Some of these limitations are:
| • | although depreciation and amortization are non-cash charges, the assets being depreciated and amortized will often have to be replaced in the future, and Adjusted EBITDA does not reflect any cash requirements for such replacements; |
14
Table of Contents
| • | Adjusted EBITDA is not adjusted for all non-cash income or expense items that are reflected in our statements of operations; and |
| • | other companies in our industry may calculate these measures differently than we do, limiting their usefulness as comparative measures. |
Because of these limitations, Adjusted EBITDA and Adjusted EBITDA per ton should not be considered as measures of discretionary cash available to us to invest in the growth of our business. We compensate for these limitations by relying primarily on our GAAP results and secondarily using Adjusted EBITDA.
The following table reconciles our net income (loss) attributable to EVRAZ NORTH AMERICA LIMITED to Adjusted EBITDA for the nine months ended September 30, 2013 and 2014 and years ended December 31, 2011, 2012 and 2013:
| Nine months ended September 30, | Year ended December 31, | |||||||||||||||||||
| 2013 | 2014 | 2011 | 2012 | 2013 | ||||||||||||||||
| ($ in millions) | ||||||||||||||||||||
Net (loss) income attributable to EVRAZ NORTH AMERICA LIMITED | $ | (6.6 | ) | $ | 55.3 | $ | 142.4 | $ | 14.6 | $ | (709.3 | ) | ||||||||
Plus: | ||||||||||||||||||||
Interest expense | 53.1 | 47.5 | 96.5 | 62.0 | 70.6 | |||||||||||||||
Income tax benefit | (52.2 | ) | (6.4 | ) | (5.5 | ) | (13.6 | ) | (52.8 | ) | ||||||||||
Depreciation and amortization expense | 132.3 | 122.6 | 197.7 | 180.1 | 175.6 | |||||||||||||||
Other income, net | (1.2 | ) | (3.4 | ) | (5.0 | ) | (2.8 | ) | (2.2 | ) | ||||||||||
Foreign exchange (gains) losses | (0.2 | ) | 9.3 | 12.3 | (15.7 | ) | 4.0 | |||||||||||||
Dividend and interest income | (0.2 | ) | (0.1 | ) | (0.2 | ) | (0.2 | ) | (0.1 | ) | ||||||||||
Loss on extinguishment of debt | — | — | 6.3 | — | — | |||||||||||||||
Loss (gain) on disposal of assets | 0.6 | (0.2 | ) | (0.5 | ) | 2.3 | 1.6 | |||||||||||||
Impairment of assets | — | — | — | — | 468.6 | |||||||||||||||
Net loss (income) from discontinued operations | 22.7 | 10.2 | (9.7 | ) | 101.1 | 270.2 | ||||||||||||||
Net (loss) income attributable to noncontrolling interest | (21.2 | ) | 0.1 | 3.6 | 19.2 | (50.2 | ) | |||||||||||||
|
|
|
|
|
|
|
|
|
| |||||||||||
Adjusted EBITDA | $ | 127.1 | $ | 234.9 | $ | 437.9 | $ | 347.0 | $ | 176.0 | ||||||||||
|
|
|
|
|
|
|
|
|
| |||||||||||
The following table presents our Adjusted EBITDA per ton calculation for the nine months ended September 30, 2013 and 2014 and years ended December 31, 2011, 2012 and 2013:
| Nine months ended September 30, | Year ended December 31, | |||||||||||||||||||
| 2013 | 2014 | 2011 | 2012 | 2013 | ||||||||||||||||
Adjusted EBITDA (millions) | $ | 127.1 | $ | 234.9 | $ | 437.9 | $ | 347.0 | $ | 176.0 | ||||||||||
Total tons sold (thousands) | 1,851 | 2,076 | 2,500 | 2,503 | 2,518 | |||||||||||||||
|
|
|
|
|
|
|
|
|
| |||||||||||
Adjusted EBITDA dollars per ton | $ | 69 | $ | 113 | $ | 175 | $ | 139 | $ | 70 | ||||||||||
|
|
|
|
|
|
|
|
|
| |||||||||||
Adjusted operating income (loss)
We use Adjusted operating income (loss) at a segment level to evaluate the operating performance of our segments and to enhance segment comparability between periods. This measure is not required by, nor is it presented in accordance with GAAP. Adjusted operating income (loss) is not a measurement of financial performance under GAAP and should not be considered as an alternative to net income, operating income or any
15
Table of Contents
other performance measures derived in accordance with GAAP or as an alternative to cash flow from operating activities as a measure of liquidity.
We present Adjusted operating income (loss) because we consider it an important supplemental measure of our performance. We define Adjusted operating income (loss) as operating income (loss) plus depreciation and amortization, impairment of assets and loss (gain) on disposal of assets. You should not infer from our presentation of Adjusted operating income (loss) that our future results will be unaffected by unusual or nonrecurring items. We use Adjusted operating income (loss) at segment level instead of Adjusted EBITDA used at a consolidated level as certain items used to calculated our Adjusted EBITDA are not allocated to our segments.
Adjusted operating income (loss) has limitations as an analytical tool and should not be considered in isolation or as a substitute for analysis of our operating results or cash flows as reported under GAAP. Some of these limitations are:
| • | although depreciation and amortization are non-cash charges, the assets being depreciated and amortized will often have to be replaced in the future and Adjusted operating income (loss) does not reflect any cash requirements for such replacements; |
| • | Adjusted operating income (loss) is not adjusted for all non-cash income or expense items that are reflected in our statements of operations; and |
| • | other companies in our industry may calculate this measure differently than we do, limiting its usefulness as a comparative measure. |
Because of these limitations, Adjusted operating income (loss) should not be considered as a measure of discretionary cash available to us to invest in the growth of our business. We compensate for these limitations by relying primarily on our GAAP results and secondarily using Adjusted operating income (loss).
The following table reconciles our operating income (loss) to Adjusted operating income for our Long Division for the nine months ended September 30, 2013 and 2014 and the years ended December 31, 2011, 2012, and 2013:
| Nine months ended September 30, | Year ended December 31, | |||||||||||||||||||
| 2013 | 2014 | 2011 | 2012 | 2013 | ||||||||||||||||
| ($ in millions) | ||||||||||||||||||||
Operating income (loss) | $ | 48.2 | $ | 69.8 | $ | 128.6 | $ | 119.4 | $ | (12.1 | ) | |||||||||
Plus: | ||||||||||||||||||||
Depreciation and amortization expense | 30.3 | 31.9 | 46.3 | 41.8 | 42.1 | |||||||||||||||
Impairment of assets | — | — | — | — | 77.5 | |||||||||||||||
Loss (gain) on disposal of assets | 0.3 | 0.4 | (0.2 | ) | 0.4 | 1.0 | ||||||||||||||
|
|
|
|
|
|
|
|
|
| |||||||||||
Adjusted operating income | $ | 78.8 | $ | 102.1 | $ | 174.7 | $ | 161.6 | $ | 108.5 | ||||||||||
|
|
|
|
|
|
|
|
|
| |||||||||||
16
Table of Contents
The following table reconciles our operating income (loss) to Adjusted operating income for our Tubular Division for the nine months ended September 30, 2013 and 2014 and for the years ended December 31, 2011, 2012 and 2013:
| Nine months ended September 30, | Year ended December 31, | |||||||||||||||||||
| 2013 | 2014 | 2011 | 2012 | 2013 | ||||||||||||||||
| ($ in millions) | ||||||||||||||||||||
Operating (loss) income | $ | (50.2 | ) | $ | 5.5 | $ | 83.9 | $ | 53.5 | $ | (105.0 | ) | ||||||||
Plus: | ||||||||||||||||||||
Depreciation and amortization expense | 66.8 | 62.6 | 99.5 | 90.7 | 88.3 | |||||||||||||||
Impairment of assets | — | — | — | — | 55.0 | |||||||||||||||
Loss (gain) on disposal of assets | 0.4 | 0.1 | (0.2 | ) | 0.4 | 0.6 | ||||||||||||||
|
|
|
|
|
|
|
|
|
| |||||||||||
Adjusted operating income | $ | 17.0 | $ | 68.2 | $ | 183.2 | $ | 144.6 | $ | 38.9 | ||||||||||
|
|
|
|
|
|
|
|
|
| |||||||||||
The following table reconciles our operating income (loss) to Adjusted operating income for our Flat Division for the nine months ended September 30, 2013 and 2014 and for the years ended December 31, 2011, 2012 and 2013:
| Nine months ended September 30, | Year ended December 31, | |||||||||||||||||||
| 2013 | 2014 | 2011 | 2012 | 2013 | ||||||||||||||||
| ($ in millions) | ||||||||||||||||||||
Operating (loss) income | $ | (7.2 | ) | $ | 38.8 | $ | 36.7 | $ | (8.7 | ) | $ | (345.6 | ) | |||||||
Plus: | ||||||||||||||||||||
Depreciation and amortization expense | 33.1 | 25.9 | 49.7 | 44.8 | 42.4 | |||||||||||||||
Impairment of assets | — | — | — | — | 336.1 | |||||||||||||||
Loss (gain) on disposal of assets | 0.1 | (0.7 | ) | — | 1.9 | 0.2 | ||||||||||||||
|
|
|
|
|
|
|
|
|
| |||||||||||
Adjusted operating income | $ | 26.0 | $ | 64.0 | $ | 86.4 | $ | 38.0 | $ | 33.1 | ||||||||||
|
|
|
|
|
|
|
|
|
| |||||||||||
17
Table of Contents
You should carefully consider the risks described below with all of the other information included in this prospectus. If any of the following risks actually occurs, it may materially harm our business, results of operations, or financial position. This prospectus also contains forward-looking statements that involve risks and uncertainties. Our actual results could differ materially from those anticipated in these forward-looking statements as a result of certain factors, including the risks faced by us described below and elsewhere in this prospectus.
Risks Relating to Our Industry
Our industry is cyclical and demand is sensitive to United States, Canadian and global economic conditions and can be volatile.
The steel industry is cyclical because the industries in which the majority of steel customers operate, including oil and gas, railway, industrial and construction end markets, are themselves cyclical and sensitive to changes in economic conditions. For example, the oil and gas industry is highly cyclical as industry producers adjust their operations in line with the then current and expected energy demand and prices. The railway industry is driven by volume of rail shipments, which depends on the condition of the overall economy, including demand for tangible goods. Industrial and construction end markets react strongly to economic cycles. For example, new construction is normally significantly reduced during economic slowdowns. The cyclical nature of these industries may or may not correspond with economic cycles and macroeconomic conditions.
Demand for our products is driven by economic conditions in North America. The moderate pace of the recovery from the deep global recession that began in the United States in 2008 has had an adverse effect on demand for our products and margins and therefore affected profitability across all of our segments and major markets. Prolongation of the recovery from the recession could adversely affect demand for our products and further adversely affect our business.
Reduced production volumes may result in operating inefficiencies because steel producers generally have high fixed costs, and the machines used in steel production operate more efficiently when operated constantly and at higher utilization rates. Future economic downturns or reduced rates of economic growth could harm our customers’ business (and customer confidence generally), reduce our production volumes, and adversely affect prices and demand for our products.
Any of the foregoing events could have a material adverse effect on demand for and pricing of our products and our operating margins, materially affecting our business, financial position, and results of operations.
Overcapacity in the global steel industry could increase the supply of steel in the United States and Canada, which may negatively affect the price of steel and steel products and our business, financial position, and results of operations.
The steel industry has historically been characterized by excess global capacity and supply, which has led to substantial price decreases during periods of lower demand for steel. Demand for steel is often lower during economic recessions. There has also been a pattern of worldwide capacity increases, which have been in excess of the growth in demand for steel products during periods when steel markets are stronger.
Many North American steel producers have excess capacity that has either been idled or continues to operate at lower utilization rates despite reduced margins. Products produced by these steel producers may significantly depress market prices, negatively affecting our revenues and profitability. If the North American steel market continues to recover, we may not fully benefit from such recovery as some of the currently idled facilities of such North American steel producers may be restarted.
18
Table of Contents
In addition, the worldwide excess capacity results in manufacturers in certain countries, particularly China, exporting significant amounts of steel and steel products into the United States and Canada at prices below their cost of production (often with local government assistance or subsidies in various forms). The economics of these imports improve when ocean transportation costs decline due to cheaper fuel or other factors. Significant imports of steel into the United States and Canada, as a result of excess world supply, have in the past exerted, and may in the future exert, downward pressure on the United States and Canadian steel prices. This occurrence may negatively affect our sales, margins, and profitability, which could have a material adverse effect on our business, financial position, and results of operations.
The significant growth in steel consumption in China and other developing economies in the early 2000s resulted in steel companies rapidly increasing steel production capability in those countries. The reduction in China’s economic growth rate, with the resulting reduction of steel consumption, coupled with China’s own expansion of steel-making capacity, has had and could continue to have the effect of substantially weakening domestic and global steel demand and pricing. Since China is now the largest worldwide steel producer by a significant margin (some published sources estimate that steel capacity in China is at or nearing one billion metric tons per year), any excess Chinese supply could have a major impact on world steel trade and prices if China’s excess, subsidized production is exported to other markets. Also, since the Chinese steel industry is largely government owned, it can make production and sales decisions for non-market reasons. In addition, the lagging demand for steel behind supply in China has resulted in many Asian and European steel producers, whose steel output had filled China’s steel import needs, shipping steel products into the North American market. The continuation of these imports may result in further erosion of U.S. domestic margins through a reduction in pricing.
Increased imports of steel products into North America could negatively affect steel prices and demand levels and reduce our profitability.
Steel imports into the United States totaled an estimated 30.3 million metric tons in 2012, or an estimated 31% of total United States steel demand. Imports into the United States were 29.1 million metric tons in 2013, or an estimated 30% of total United States steel demand. Steel imports into Canada totaled an estimated 7.1 million metric tons in 2012, or 46% of total Canadian steel demand. Imports into Canada were an estimated 6.6 million metric tons in 2013, or 44% of total Canadian steel demand. Foreign competitors may have lower labor costs, and some are owned, controlled or subsidized by their governments, which may add political and economic policy considerations as factors in their economic decision-making. Greater steel exports to the United States and Canada tend to occur when steel exporting countries experience periods of economic difficulty, decreased demand for steel products in their home markets, and excess capacity, which may result in depressed pricing. Increases in future levels of imported steel into North America could reduce future market prices and demand for steel products produced in North America, which could materially adversely affect our business, financial position, and results of operations.
In addition, we believe the downward pressure on, and periodically depressed levels of, North American steel prices in some recent years has been further exacerbated by imports of steel involving dumping abuses by foreign steel producers and heavy subsidies by foreign governments. Tariffs, duties, and quotas are periodically put into effect for certain steel products imported from a number of countries that have been found to have been unfairly pricing steel imports into North America. Nevertheless, there is no assurance that tariffs and quotas will always be levied, even if otherwise justified. Even when duties are imposed, they may not adequately remedy the imbalance. When such tariffs or duties expire, or if others are further relaxed or repealed, or if relatively higher North American steel prices make it attractive for foreign steelmakers to export their steel products to the United States and Canada, despite the presence of duties or tariffs, substantial imports of foreign steel could create downward pressure on United States and Canadian steel prices.
19
Table of Contents
If tariffs and duties on imports into Canada of OCTG and certain other products that we sell are lifted, the importation of such products into Canada may increase, adversely affecting our sales.
Imports into Canada of OCTG and certain other goods that we sell are not subject to regular customs and duties but are currently subject to anti-dumping and countervailing duties for certain countries. These duties implemented in Canada are generally effective for five-year periods, and are subject to review upon expiry by relevant governmental agencies and tribunals. A review of certain OCTG products imported from China initiated in June 2014 is expected to be completed in early 2015. In July 2014, the Canada Border Services Agency, or CBSA, initiated an antidumping review of certain OCTG products from Taiwan, India, Indonesia, the Philippines, South Korea, Thailand, Turkey, Ukraine and Vietnam. The CBSA is also currently investigating OCTG subsidization that may be injurious to the market from all these countries except for Taiwan. Other reviews will occur as current trade regulations come due for review, and new antidumping or subsidization complaints may be brought by domestic producers. If, as a result of these reviews or otherwise, trade decisions are made that reduce Canadian import restrictions, this could adversely affect our business, financial position, and results of operations.
If tariffs, duties, or suspension agreements on imports into the United States of OCTG and certain other products that we sell are lifted, the importation of such products into the United States may increase, adversely affecting our sales.
The U.S. Department of Commerce currently imposes tariffs, duties and authorizes suspension agreements on imports from certain foreign countries of OCTG and, to a lesser extent, of certain other products that we sell. If these tariffs, duties, or suspension agreements are lifted or reduced, it could have a material adverse effect on the prices of such products and the volume of our sales. If prices of these products were to decrease significantly, we might not be able to profitably sell these products, and the value of our inventory would decline. In addition, significant price decreases could result in a significantly longer holding period for some of our inventory.
Hydraulic fracturing could be the subject of further regulation that could indirectly impact the production costs and demand for our products, in particular, OCTG.
Hydraulic fracturing, the process used for extracting oil and gas from shale and other formations, and other subsurface injections, have come under increased scrutiny and could be the subject of further regulation. Many of our tubular goods, in particular, OCTG, are sold to customers who engage in hydraulic fracturing. Depending on legislation that may ultimately be enacted or regulations that may be adopted at the federal, provincial, state and local levels, exploration, exploitation, and production activities that entail hydraulic fracturing or other subsurface injection could be subject to additional regulation and permitting requirements. Such regulations or permitting requirements may negatively affect our customers’ business and their exploration projects, which may negatively affect our customers’ demand for our products. In addition, such regulations may result in our customers increasing their standards, specifications, and requirements for our OCTG products, which may in turn increase our production costs. Failure of our products to meet relevant standards or requirements may expose us to liability.
Failure by our LD Pipe customers to receive regulatory approval for their pipeline projects may adversely affect our sales.
A significant portion of our LD Pipe products are used in new oil and gas pipeline projects. Commencing construction by LD Pipe customers of announced and future projects customarily requires approvals from applicable provincial, state and federal agencies. If customers fail to receive such regulatory approvals, this may adversely affect demand for our LD Pipe products and our profitability, which could have a material adverse effect on our business, financial position and, results of operations.
20
Table of Contents
The principal markets we serve are competitive.
The steel market is very dynamic. Competition is based on a number of factors, such as price, product differentiation and quality, geographic location, and customer service. Some of our competitors may be able to drive down prices for our products because the competitors’ costs could be lower than our costs. In addition, some of our competitors’ financial, technological and other resources may be greater than our resources, and such competitors may be better able to withstand negative changes in market conditions. Our competitors may be able to respond more quickly than we can to new or emerging technologies and changes in customer requirements. Further, consolidation of our competitors or customers may result in reduced demand for our products. Also, some of our products that currently enjoy higher margins may experience margin compression as new producers enter the market. The occurrence of any of these events could materially adversely affect our business, financial position, and results of operations.
Competition from producers of other materials may adversely affect our business.
In many applications, steel competes with other materials, such as aluminum, cement, composites, glass, plastic, and wood. Generally, this applies to our plate and tube products. Increased use of alternate materials as a substitute for steel products could have a material adverse effect on prices and demand for our steel products, which could have a material adverse effect on our business, financial position, and results of operations.
Fluctuations in inventory levels of steel products could adversely affect our sales.
Industry wide, inventory levels of steel products can vary significantly from period to period, depending on industry cycles. These changes can have a direct adverse effect on the demand for new production goods when customers draw from existing inventory rather than purchase new products. As a result, our sales and results of operations may vary significantly from period to period. Excess inventories could have a material adverse effect on price levels and quantities sold by us.
Increased electricity or other energy prices, or disruption of the supply of electricity or other energy sources, could adversely affect our business.
For steel companies, energy costs, particularly the cost of electricity and natural gas, comprise a significant portion of the variable cost of production. We rely on third parties for the supply of energy resources we consume in our steelmaking activities. In 2013, our energy costs represented 6% of our cost of sales. The prices for and availability of electricity, natural gas, oil and other energy resources are subject to volatile market conditions often affected by weather and political and economic factors beyond our control. Most of our energy supply agreements are short-term in duration. These arrangements do not include fixed pricing and instead peg our energy prices to market rates. In addition, disruptions in the supply of our energy resources could temporarily impair our ability to manufacture our products for our customers. Increases in our energy costs, including through changes in pricing structure in our energy agreements, could materially adversely affect our business, financial position and results of operations.
The worldwide economic downturn that began in 2008 and the difficult conditions in the capital and credit markets that have adversely affected and may continue to adversely affect our customers and suppliers and harm our business.
A decline in consumer and business confidence and spending, together with reductions in the availability of credit or increased cost of credit, as well as volatility in the capital and credit markets, could adversely affect the business and economic environment in which we operate and the profitability of our business. We are also exposed to risks associated with the creditworthiness of our suppliers and customers. If the availability of credit to fund or support the continuation and expansion of our customers’ business operations is curtailed or if the cost of that credit is increased, the resulting inability of our customers, or of their customers, to either access credit or
21
Table of Contents
absorb the increased cost of that credit could adversely affect our business by reducing our sales or by increasing our exposure to losses from uncollectible customer accounts. A renewed disruption of the credit markets could also result in financial instability of some of our suppliers and customers. The consequences of such adverse effects could include the interruption of production at our customers’ facilities, the reduction, delay, or cancellation of customer orders, delays or interruptions of the supply of raw materials we purchase, and bankruptcy of customers, suppliers, or other creditors. Any of these events may adversely affect our business, financial position, and results of operations.
Risks Relating to Our Business
We may not be able to pass through increases in our costs, and increases in our costs or decreases in product prices could adversely affect our business, financial position, or results of operations.
Our earnings are sensitive to price changes in steel and steel products. Fluctuations in steel and steel product prices historically have had a direct effect on our net income (loss) and Adjusted EBITDA for several reasons:
| • | Market prices for steel and steel products are a function of supply and demand, factors over which we have limited control. We therefore have limited ability to control the pricing of our products. Market prices of scrap steel, which is an industry benchmark for steel pricing, fluctuated significantly during 2013. Since market conditions determine the price for our steel products, the price for our products could fall below our cash production costs. |
| • | Market prices for steel and steel products may not be directly affected by raw material or energy costs or other costs of sales, and consequently we may have limited ability to pass through increases in our costs to our customers absent increases in the market price. Thus, even though our costs may increase, our customers may not accept price increases for our products, and the prices for our products may decline. |
| • | The manufacturing of steel products is highly capital-intensive and a large portion of our and our competitors’ operating costs are fixed. Additionally, steel production requires large, complex machines that operate more efficiently when operated continuously. Consequently, both we and our competitors typically continue to run our machines whenever marginal sales exceed the marginal costs. |
Therefore, our ability to achieve acceptable margins is principally dependent on managing our cost structure and on changes in raw materials prices and energy costs. If the prices of our products decline, or if our raw material or energy costs increase, it could have a material adverse effect on our business, financial position, and results of operations.
Our revenues are highly dependent on a limited number of customers and the loss of any one of our major customers could materially and adversely affect our business, financial position, and results of operations.
During the years ended December 31, 2011, 2012, and 2013, sales invoiced to our 10 largest customers contributed over 37%, 42% and 49% of our total invoiced sales, respectively. Sales volume to specific customers varies from year to year, especially since we are not the exclusive provider for any customer. In addition, there are a number of factors, other than our performance, that could cause the loss of a customer or a substantial reduction in the products that we provide to any customer and that may not be predictable. For example, our customers may decide to reduce spending on our products or a customer may no longer need our products following the completion of a project. As a result of our customer concentration, the loss of any one of our major customers, a decrease in our volume of sales or a decrease in the price at which we sell our products to them could materially adversely affect our business, financial position, and results of operations.
22
Table of Contents
Our raw materials and energy costs can fluctuate significantly.
The price we pay for energy (such as electricity and natural gas) and key raw materials, including scrap, slabs, billets, coil, pig iron, and ferroalloys, can fluctuate significantly based on market factors. The prices at which we sell steel will not necessarily change in tandem with changes in our raw material and energy costs. For example, our slab supply chain exposes us to a two month gap between the time we settle on the price we pay for slabs and the time at which we can sell our products. Some of our shipments are in the spot market, and pricing for these products fluctuates based on prevailing market conditions. The remainder of our shipments are pursuant to contracts typically having durations of one year or less. A portion of those contracts contain fixed prices that do not allow us to pass through changes in the event of increases or decreases in raw material and energy costs. However, a significant majority of our shipments to contract customers are pursuant to contracts with variable-pricing mechanisms that allow us to adjust the price or to impose a surcharge based upon changes in certain raw material and energy costs. Those adjustments, however, do not always reflect all of our underlying raw material and energy cost changes, and their impact is limited to the term of these contracts. The scope of the adjustment may be limited by the terms of the negotiated language or by the timing of when the adjustment is effective relative to a cost increase.
As a result of the factors set forth above with respect to spot market sales and contract sales, we are not always able to recover through the price of our steel products the full amount of cost increases associated with our purchase of energy or key raw materials. In such circumstances a significant increase in raw material or energy costs likely would adversely impact our financial results and cash flows. Conversely, in certain circumstances, our financial results and cash flows also can be adversely affected when raw material prices for such scrap and slab raw materials decline. This may occur if we locked-in the price of a raw material over a period of time and the spot market price for the material declines during that period. Because there is often a correlation (which may not be direct or proportionate) between the price of finished steel and the raw materials used in its production, a decline in raw material prices or energy costs may coincide with lower steel prices, compressing our margins.
Raw material and energy prices are sensitive to global demand and have been volatile in recent years. Future cost increases could be significant again with respect to scrap, slabs, and energy. Any increase in the prices for raw materials or energy costs could materially increase our costs and reduce our earnings. In addition, changes in certain environmental regulations in the United States and Canada, including those that may impose output limitations or higher costs associated with mercury emissions, climate change, and greenhouse gas emissions legislation could substantially increase the cost of manufacturing and raw materials such as energy.
Any change in the operation of a raw material market index could materially affect our revenues and earnings.
We require substantial amounts of raw materials, including scrap metal, alloys, and natural gas to operate our business. Many of our customer contracts contain indexed pricing provisions. The indexed prices are generally tied to a widely-available market index for that specific raw material. Recently many of the widely-available raw material market indices have experienced wide fluctuations. Any change in a raw material market index could materially affect our revenues. Any change in the relationship between the market indices and our underlying costs could materially affect our earnings. Any change in our projected year-end input costs could materially affect inventory valuation method and earnings.
An increase in the cost of raw materials and energy resources could materially affect our revenues and earnings.
Future disruptions in the supply of our raw materials or energy resources could impair our ability to manufacture our products or require us to pay higher prices in order to obtain these raw materials or energy resources from other sources, and could thereby affect our sales and profitability. Any increase in the prices for such raw materials or energy resources could materially affect our costs, and therefore, our earnings.
23
Table of Contents
Unplanned and planned equipment outages may adversely affect our results of operations.
Our steel production depends on the operation of critical pieces of equipment, such as EAFs, continuous casters, and rolling mills. It is possible that we could experience prolonged periods of reduced production due to equipment failures (including as a result of such events as fires, accidents, or violent weather conditions) or planned outages for required business purposes at our facilities or those of our key suppliers. Furthermore, a significant portion of our equipment has been in operation for an extended period of time, and investments in equipment upgrades and technology may be needed to remain competitive. As a result, we may experience interruptions in our processing and production capabilities, which could have a material adverse effect on our business, financial position, and results of operations. For example, in 2013, our business was impacted by significant unplanned outages in our Pueblo, Colorado (Long Division) and Regina, Saskatchewan (Tubular Division) steelmaking facilities. These unplanned outages resulted in $3.2 million and $4.5 million of incremental cost, respectively.
We rely on a limited number of key suppliers that are critical to our manufacturing process.
We rely on a limited number of outside vendors and affiliates to supply us with raw materials, including ferrous scrap, slabs, electrodes, industrial gasses, and ferroalloys, which are critical to the manufacture of our products. For example, we currently acquire a significant portion of our slabs (approximately 65% of our Flat Division purchases in 2013) from NTMK.
In addition, some of our production facilities are physically connected to our industrial gas suppliers. In order for us to change these suppliers, we would have to incur significant infrastructure investment costs and the process would take significant time to implement, which exacerbates our reliance on these suppliers.
If our suppliers increase the prices of our critical raw materials (or otherwise make such raw materials not available to us), we may not have alternative sources of supply. Also, if we are unable to obtain adequate and timely deliveries of our required raw materials, we may be unable to timely manufacture sufficient quantities of our products. This could cause us to lose sales, incur additional costs, and suffer harm to our reputation, which could have a material adverse effect on our business, financial position, and results of operations.
Our ability to deliver products to customers, to receive raw materials, and the cost of shipping and handling may be affected by circumstances over which we have no control.
We rely on third parties to handle and transport raw materials to our facilities and finished products to our customers. Due to factors beyond our control, including changes in fuel prices, political events, governmental regulation of transportation, changes in market rates, carrier availability, and disruptions in transportation infrastructure, we may not be able to transport raw materials into our facilities or transport our products to our customers in each case in a timely and cost-effective manner (if at all). In particular, due to their size, transportation of our LD Pipe products is complex, requires specialized equipment and is mostly transported by railcars. Such transportation process is susceptible to interruptions caused by extreme weather conditions, including snow storms, floods, excessive rain, wind and ice. Transportation is also affected by railroad capacity and railcar availability. For example, during the 2013-2014 winter season, geographical areas where we operate experienced extreme winter weather, including heavy snow, ice, and rainstorms, all of which contributed to shipping delays. Any of the foregoing factors could have a material adverse effect on our business, financial position, and results of operations.
Our facilities require capital investments, which we may not be able to consummate or sustain.
The production of steel is capital intensive and we must make regular capital investments in our facilities to remain competitive. In 2013, our total capital expenditures were $84.2 million, including capital expenditures for investment activities and maintenance and other activities. Our capital expenditures are expected to be funded primarily from cash flows from operating activities. If we do not generate sufficient cash flows from operations to fund capital expenditures, and are not able to obtain external financing for such expenditures at an attractive cost or at all, our business, financial position, and results of operations may be adversely affected.
24
Table of Contents
We face risks associated with innovation, new technologies, new products and increasing customer requirements.
Our customers are continuously demanding improvements in the quality of our products. If our products are unable to meet the quality standards of our customers, or if we are unable to improve quality of our products, it may adversely affect our ability to retain existing customers or gain new customers. Increasing the quality of our products may require technological improvements in our production process. We may not have sufficient capital to invest into new steel production technologies and may, from time to time, incur cost over-runs and difficulties adapting and fully integrating these technologies into our existing operations. We may also encounter control or production restrictions, or not realize the cost benefit from capital intensive technology adaptations to our current production processes. In addition, our Tubular Division customers are increasingly requesting pipe producers to supply premium connections and other ancillary parts as well as providing and other services. We may not be successful in meeting these technological challenges and there may be increased liability exposure relating to the supply of additional products and services.
Product liability claims could have an adverse effect on our financial position, results of operations, and cash flows.
Events such as rail track failures, well failures, line pipe leaks, blowouts, bursts, fires, and product recalls could result in claims that our products or services were defective and caused death, personal injury, property damage, or environmental pollution. Some of our contracts contain provisions that could require us to indemnify purchasers and third parties for such claims. The insurance we maintain may not be adequate, available to protect us in the event of a claim, or its coverage may be limited, canceled or otherwise terminated, or the amount of our insurance may be less than the related impact on our enterprise value after a loss.
Our intellectual property rights may be inadequate to protect our business.
We attempt to protect our intellectual property rights, both in the United States and in Canada, through a combination of patent, trademark, copyright, and trade secret laws, as well as licensing agreements and third-party nondisclosure and assignment agreements. Our intellectual property rights may not adequately protect us. Our failure to obtain, maintain or adequately enforce protection of our intellectual property rights for any reason could have a material adverse effect on our business, results of operations, and financial position. In addition, some of our trademarks and trade names are owned by EGSA members (other than us) and we depend on EGSA’s consent to allow us to use these trademarks and trade names.
In addition, we rely on our trademarks, trade names, and brand names to distinguish our products from the products of our competitors, and have registered or applied to register many of these trademarks. We cannot assure you that our trademark applications will be approved. Third parties may also oppose our trademark applications, or otherwise challenge our use of the trademarks. In the event that our trademarks are successfully challenged, we could be forced to rebrand our products, which could result in loss of brand recognition, and could require us to devote resources advertising and marketing new brands. We also license third parties to use our trademarks under license agreements, which require our licensees to abide by quality control standards with respect to the products that they provide under our trademarks. We cannot assure you that competitors will not infringe our trademarks, that we will have adequate resources to enforce our trademarks or that we will be able to enforce compliance with our license agreements.
We rely on certain unpatented proprietary technology.
We depend on a proprietary manufacturing process for the production of our head-hardened rail. We may not be able to effectively protect our trade secrets and know-how regarding this process.
We rely on this proprietary information as well as continuing technological advancement to maintain our competitive position, but we do not have any patents protecting this process. To protect our proprietary information and trade secrets, we require employees, consultants, advisors, and collaborators to enter into
25
Table of Contents
confidentiality agreements. We cannot assure you that these agreements will provide meaningful protection for our proprietary information, trade secrets, or know-how in the event of any unauthorized use, misappropriation or disclosure of such proprietary information, trade secrets, or know-how. We are subject to a risk that if we are not able to adequately protect this information, our competitors may acquire this knowledge. It is also possible that others have independently developed, or will develop, the same or similar technology. If we are unable to maintain the proprietary nature of our technologies, it may adversely affect our business, financial position, and results of operations.
If third parties claim that we infringe upon their intellectual property rights, our operating profits could be adversely affected.
We face the risk of claims that we have infringed third parties’ intellectual property rights. Any claims of patent or other intellectual property infringement, even those without merit, could:
| • | be expensive and time consuming to defend; |
| • | cause us to cease making, licensing or using products that incorporate the challenged intellectual property; |
| • | require us to redesign, reengineer, or rebrand our products or packaging, if feasible; |
| • | divert management’s attention and resources; and |
| • | require us to enter into royalty or licensing agreements in order to obtain the right to use a third party’s intellectual property. |
Any royalty or licensing agreements, if required, may not be available to us on acceptable terms or at all. A successful claim of infringement against us could result in our being required to pay significant damages, enter into costly license or royalty agreements, or stop the sale of certain products, any of which could have a negative impact on our business, financial position, and results of operations.
If our products infringe on the intellectual property rights of others, we may be required to indemnify our customers for any damages they suffer.
We generally indemnify our customers against liability for our products’ infringement on third party intellectual property rights. Third parties may assert infringement claims against our customers. These claims may require us to initiate or defend protracted and costly litigation on behalf of our customers, regardless of the merits of these claims. If any of these claims succeed, we may be forced to pay damages on behalf of our customers or may be required to obtain licenses for the products they use. If we cannot obtain all necessary licenses on commercially reasonable terms, our customers may be forced to stop using our products.
The failure of our information systems could have a material adverse effect on our business.
Our business operations could be disrupted if our information technology systems fail to perform adequately. The efficient operation of our business depends on our information technology systems, some of which are managed by third-party service providers. We rely on our information technology systems to effectively manage our business data, communications, supply chain, order entry and fulfillment, and other business processes. The failure of our information technology systems to perform as we anticipate could disrupt our business and could result in transaction errors, processing inefficiencies, and the loss of sales and customers, causing our business and results of operations to suffer. In addition, our information technology systems may be vulnerable to damage or interruption from circumstances beyond our control, including fire, natural disasters, power outages, systems failures, security breaches, cyber-attacks, and viruses. Any such damage or interruption could have a material adverse effect on our business.
26
Table of Contents
We may be subject to risks relating to breach of security of our information technology systems.
We rely on information technology systems to process, transmit and store electronic information and manage and operate our business. A breach in security could expose us and our customers and suppliers to risks of misuse of confidential information, manipulation and destruction of data, production downtimes, and operations disruptions, which in turn could adversely affect our reputation, competitive position, business, or results of operations. Our policies and procedures designed to prevent or limit the impact of systems failures, interruptions, and security breaches, may not prevent such events from occurring or adequately address them if they do. Although we rely on commonly used security and processing systems to provide the security and authentication to effect the secure transmission of data, these precautions may not protect our systems from all potential compromises or breaches of security.
Our business is dependent on our senior management team and skilled trade workers.
Our business is dependent to a significant extent on the efforts and abilities of our senior management team and other key employees and our ability to continue to attract, motivate, and retain qualified trade workers. We depend on our current senior management for the implementation of our strategy and the operation of our day-to-day activities, and personal connections and relationships of members of senior management are important to the conduct of our business. However, there can be no assurance that these individuals will continue to make their services available to us in the future. Other than our CEO and CFO, none of our senior managers has an employment agreement with us. We also depend on skilled trade workers who are also recruited in the oil and gas and other industries and we may need to increase our employee compensation in order to attract and retain such skilled workers. The loss of skilled trade workers or our failure to attract such personnel could have a material and adverse effect on our business, financial position, or results of operations.
We are at risk of labor interruptions.
As of September 30, 2014, approximately 65% of our employees were members of trade unions. Our facilities have in the past, and may in the future, experience work slowdowns, stoppages or strikes, lockouts and any such work slowdown, stoppage or strike could adversely affect our production levels and ability to meet our obligations to customers and could adversely affect our reputation. Significant work slowdowns, stoppages or other labor-related developments could have an adverse effect on our business, financial position and results of operations. For example, we had a nineteen day lockout at our EVRAZ Camrose site in 2012, and were forced to operate the site using alternate labor resources, resulting in increased labor costs.
Our collective bargaining agreements with the United Steelworkers union at our Regina and Calgary sites expired on July 31, 2014. We are negotiating a new collective bargaining agreement to replace the expired contracts, and our operations currently continue normally during the course of this negotiation. Our collective bargaining agreement with Unifor union (formerly Canadian Auto Workers union) at our Camrose site expires on January 31, 2016, our collective bargaining agreement with the International Association of Bridge, Structural, Ornamental and Reinforcing Iron Workers, or the International Association of Iron Workers, union at our Red Deer site expires on December 31, 2017, and our collective bargaining agreement with the United Steelworkers at our Pueblo site expires on September 10, 2017. There can be no assurance that we will reach an agreement with any one of these or other unions on terms acceptable to us or at all. Failure to negotiate a new collective bargaining agreement may result in work slowdowns or stoppages and could have an adverse effect on our business, financial position, and results of operations.
Furthermore, trade or labor unions could seek to organize some or all of our non-unionized workforce. If a higher percentage of our workforce were to become represented by a union, future negotiations with additional certified bargaining representatives would utilize management resources and could create inefficient work rules for our employees, which may result in increased operating expenses and lower net income. Additionally, if we are unable to reach labor agreements with any future additional unionized work groups, our risk of work
27
Table of Contents
interruptions or stoppages may increase, which may adversely affect our ability to conduct our operations. Moreover, future agreements with unionized and non-unionized employees may be on terms that are not as attractive to us as our current arrangements or comparable to agreements entered into by our competitors.
We may incur significant costs associated with our pension obligations.
Our pension obligations currently exceed our pension assets, and, accordingly, a portion of our pension plans is unfunded. As of December 31, 2013, the benefit obligation (using a 2013 discount rate of 4.7% for the United States and 4.9% for Canada) under our defined benefit plans was $635.0 million (representing $268.3 million and $366.7 million of obligations under our United States and Canadian plans, respectively) and the fair value of our pension plan assets was $543.8 million (representing $213.2 million and $330.6 million of assets in our United States and Canadian plans, respectively), resulting in our pension plans being underfunded by $91.2 million ($55.0 million and $36.2 million for our United States and Canadian plans, respectively) or underfunding of 14%. As of December 31, 2012, our benefit obligation under our pension plans was $686.3 million (representing $296.5 million and $389.8 million of obligations under our United States and Canadian plans, respectively) and the fair value of our pension plan assets was $515.8 million (representing $192.4 million and $323.4 million of assets in our United States and Canadian plans, respectively), resulting in our pension plans being underfunded by $170.5 million ($104.1 million and $66.4 million respectively for the United States and Canada) or underfunding of 25%. We contributed $33.7 million ($9.8 million towards our United States plans and $23.9 million towards our Canadian plan) in 2013 and $48.9 million ($18.1 million towards our United States plans and $30.8 million towards our Canadian plan) in 2012 (see our consolidated financial statements included elsewhere in this prospectus for further information). The extent to which a portion of our pension plans is unfunded is directly affected by changes in interest rates and asset returns in the securities markets. It is also affected by the rate and age of employee retirements, along with other actuarial experiences compared to projections. These items affect pension plan assets and the calculation of pension and other postretirement benefit obligations and expenses. Such changes could increase the cost of those obligations to us, which could have a material adverse effect on our results and our ability to meet those obligations. Some of our defined benefit pension plans remain open to new participants. In addition, changes in the law, rules or governmental regulations with respect to pension funding also could materially and adversely affect our cash flows and our ability to meet our pension and other benefit obligations.
Our U.S. and Canadian pension plans are invested in a variety of investment funds, including debt and equity investments. For example, as of December 31, 2013, 27%, 26%, and 38% of our U.S. plan assets were invested in U.S. equity funds, international equity funds, and fixed-income securities, respectively, and 49%, 40%, and 8% of our Canadian plan assets were invested in Canadian and foreign equity funds, fixed-income securities, and hedge funds, respectively. If these investments perform poorly we would be adversely affected.
We may incur significant costs associated with our healthcare obligations.
In the United States, we offer healthcare coverage to our employees, as well as to their eligible dependents. The majority of our healthcare plans are self-insured except for the following plans: Kaiser medical (approximately 50% of the Oregon employees are covered by this option), and Blue Cross Blue Shield of North Dakota (approximately 57% of the North Dakota employees are enrolled). We may incur significant costs associated with these obligations. In Canada, we also offer benefits to employees and dependents above coverage required under applicable provincial regulations. In both the United States and Canada, we maintain free healthcare and life insurance for certain former employees. These benefits may result in significant costs for us.
We face potential conflicts of interest with EGSA and other affiliated companies that also produce steel products and act as our creditors.
EGSA, our major shareholder, and certain of EGSA’s affiliates also produce steel products in Russia, Ukraine, other European locations and South Africa, thus competing directly or indirectly with us, which could
28
Table of Contents
harm our business. EGSA and its affiliates (other than us) currently sell their products primarily outside of North America but we cannot prevent them from entering the North American market. In addition, EGSA may acquire, construct or dispose of additional assets related to our business, without any obligation to offer us the opportunity to purchase or construct any of these assets.
We currently acquire a portion (approximately 65% of our Flat Division slab purchases in 2013) of our slabs from NTMK, a wholly owned subsidiary of EGSA. In 2014, we entered into two contracts, pursuant to which we purchase slabs from NTMK at market rates. In 2012 and 2013, our total purchases of slabs from NTMK amounted to $387.4 million and $267.3 million, respectively.
Certain of our directors and officers are also directors and officers of EGSA or other affiliated companies. These relationships may create conflicts of interest, including regarding the purchasing or supply of raw materials or allocation of sales among affiliated companies that also manufacture steel products. The resolution of any such conflicts may not always be in our best interests.
In order to finance prior business acquisitions, EICA entered into a series of related-party loans. Our related-party loans are subordinated to our third-party ABL Credit Facility and will be subordinated to the notes issued by EICA (refer to “Description of Certain Indebtedness”). On December 27, 2012, EICA repaid the remaining principal balance of its related-party notes to EGSA in exchange for two new Canadian dollar-denominated subordinated loans from EVRAZ KGOK, an EVRAZ Group member. One of these notes was repaid in full in October 2014 with the proceeds of our new EVRAZ KGOK subordinated loan and the other note is expected to be partially repaid with the proceeds from the notes issued by EICA. All terms of the related-party loans that remain outstanding remained substantially the same. These loans may create conflicts of interest especially if we are unable to repay the outstanding amounts which could have a material adverse effect on our business, financial position, and results of operations.
Our indebtedness and other contractual commitments will require a substantial portion of our cash flows from operations and may adversely affect our ability to raise additional capital to fund our operations, limit our ability to react to changes in the economy or our industry and otherwise adversely affect our, business, financial position, and results of operations.
We have current indebtedness and may, from time to time, issue additional debt in the future (subject to contractual restrictions). As of September 30, 2014, after giving effect to this offering assuming an initial public offering price at the mid-point of the ranges and no exercise of the underwriters’ option to purchase additional ordinary shares and the issuance of the subordinated notes by EICA together with the use of proceeds therefrom, we would have had $919.4 million of outstanding debt (excluding intercompany debt), including debt of our subsidiary EICA owed to EVRAZ KGOK. This indebtedness could have negative consequences to us, such as:
| • | requiring us to dedicate a substantial portion of our cash flows from operating activities to payments on our indebtedness, thereby reducing the availability of our cash flows to fund working capital, capital expenditures and other general corporate purposes; |
| • | limiting our ability to obtain additional financing to fund growth, working capital or capital expenditures, or to fulfill debt service requirements or other cash requirements; |
| • | increasing our vulnerability to economic downturns and changing market conditions; and |
| • | limiting our operational flexibility due to the covenants contained in our debt agreements. |
We also have a number of contractual commitments, including purchase and supply commitments and unfunded pension and post-retirement health benefit obligations. See “Management’s Discussion and Analysis of Financial Condition and Results of Operations—Contractual Obligations.” Our ability to pay our expenses and satisfy our contractual commitments and debt service obligations will depend on our future performance, which will be affected by financial, business, economic, and other factors. If we are unable to satisfy our contractual commitments and meet our debt service obligations, we may be required to refinance all or part of our existing debt (potentially on unfavorable terms), sell important strategic assets at unfavorable prices, or borrow more
29
Table of Contents
money. We may not be able to, at any given time, refinance our debt, sell assets, or borrow more money on terms acceptable to us or at all.
In addition, credit rating agencies could downgrade our ratings either due to factors specific to us, a prolonged cyclical downturn in the steel industry, macroeconomic trends (such as global or regional recessions), or trends in credit and capital markets more generally.
Furthermore, financing agreements relating to debt of other entities of the EVRAZ Group (other than us) contain various restrictive covenants related to the disposition of certain assets, the use of funds, and other nonfinancial covenants. These restrictive covenants may effectively limit our ability to incur additional debt, incur liens, and sell assets, even if the terms of our other indebtedness would permit such transactions. Therefore, EVRAZ Group’s and our financing agreements could limit our ability to raise necessary financing to make capital investments or other expenditures which could have a material adverse effect on our business, financial position, and results of operations.
Our operations expose us to uncertainties and risks in the countries in which we operate, which could negatively affect our business, financial position, and results of operations.
Our United States operations are subject to economic conditions and political factors in the United States and Canada and, to a lesser extent, Mexico, which, if changed, could negatively affect our results of operations and cash flows. Political and economic factors include taxation, inflation, and increased regulation, including regulatory approval of pipelines at the local, state, and federal level. Actions taken by the United States government could affect our results of operations and cash flows. For example, under the United States federal contracting agencies’ binding interpretation of the “Buy America” provision contained in the American Recovery and Reinvestment Act, or ARRA, of 2009, non-United States made slab manufactured into a finished product in the United States is barred from stimulus funded projects. As a significant portion of our slabs are sourced from outside the United States, if we were to depend on a significant portion of our products qualifying for use in stimulus funded projects under the ARRA, and our steel products did not qualify by virtue of our having sourced slabs from outside of the United States, it would adversely affect our business, financial position, and results of operations. Further, should the United States Congress determine that steel products furnished to the Department of Defense are required to be manufactured from United States made slabs, this could also adversely impact our armor or plate business.
Our Canadian operations are subject to economic conditions and political factors in Canada and the United States, which if changed could negatively affect our business, financial position, and results of operations. In particular, governmental regulation of hydraulic fracturing and horizontal drilling and approval of energy pipeline projects has a significant effect on our customers and by extension, on us. Political and economic factors include taxation, inflation, increased regulation, limitations on exports of raw materials, regulatory approval for pipelines, oil and gas exploration and production, and trade remedies.
Sanctions by the United States, Canada and European Union governments against certain companies and individuals in Russia and Ukraine and possible counter sanctions by the Russian government may hinder our ability to conduct business with potential or existing vendors of slabs in these countries and may otherwise have an adverse effect on us.
We currently acquire a portion of our slabs from NTMK. NTMK, EGSA and other EGSA affiliates have substantial operations in Russia.
Recently the United States, Canada and the European Union have ordered sanctions against certain prominent Russian and Ukrainian officials, businessmen, Russian private banks, and certain Russian companies in response to the situation in Ukraine and Crimea. While we believe that these sanctions currently do not preclude us from conducting business with NTMK or EGSA’s other affiliates, the sanctions imposed by the United States, Canada or the European Union governments may be expanded in the future to restrict us from engaging with NTMK or EGSA’s other affiliates.
30
Table of Contents
In addition, it has been reported that the Russian government is considering implementing counter sanctions in response to the sanctions implemented by the United States, Canada and the European Union. Although the scope of any such sanctions is uncertain and is subject to finalization and approval by the Russian government, it has been reported that such sanctions may restrict the ability of United States and Canadian companies and individuals to do business in Russia or with Russian companies. If such sanctions are adopted, they may have an adverse effect on our ability to purchase slabs from NTMK and may otherwise affect our ability to conduct business.
If we are unable to conduct business with existing vendors of slabs (including our affiliates) our business could be adversely affected. Meanwhile we further note that despite potential negative impact from such slab supply interruptions, we do not expect them to have long term effects on our business as relevant slabs supplies can be replaced in full from other sources.
Fluctuations in the value of the United States dollar or the Canadian dollar relative to each other or to other currencies may adversely affect our business.
Fluctuations in the value of the United States dollar or the Canadian dollar can be expected to affect our business. A strong Canadian dollar relative to the United States dollar makes exports from our Canadian facilities into the United States less competitive (and imports into Canada from the United States more competitive). Additionally, a strong United States or Canadian dollar makes metal products imported into the United States or Canada, respectively, more competitive, potentially resulting in more imports of steel products by our foreign competitors. Furthermore, since most of the raw materials used in our United States and Canadian operations are purchased in United States dollars, strengthening of the United States dollar can make our operations less competitive compared to producers that purchase raw materials in weaker currency jurisdictions. Accordingly, currency fluctuations may adversely affect our business, financial position, and results of operations.
We may be subject to litigation which could adversely affect our results of operations.
We are from time to time involved in various routine litigation matters, including administrative proceedings, regulatory proceedings, governmental investigations, environmental matters, and commercial and construction contract disputes. Due to the uncertain nature of litigation, we cannot predict the outcome of these matters. Litigation is very costly, and the costs associated with prosecuting and defending litigation matters could have a material adverse effect on our financial position and profitability. Although we are unable to estimate the dollar amount of exposure to loss, if any, in connection with many litigation matters, we make accruals as warranted. We have also asserted insurance claims where appropriate. However, the amounts that we may accrue from time to time could vary significantly from the amounts we actually pay, due to inherent uncertainties and the inherent shortcomings of the estimation process, the uncertainties involved in litigation, and other factors. In addition, our insurers may fail to pay our claim or settle the full amount of a claim which may have a material adverse effect on our financial position, and results of operations.
Our operations present significant risk of injury or death.
The industrial activities conducted at our facilities present significant risk of serious injury or death to our employees, customers, and other visitors to our operations. We may be unable to avoid material liabilities for an injury or death. There can be no assurance that our workers compensation and other insurance coverage will be adequate or will continue to be available on the terms acceptable to us, or at all, which could result in material liabilities for an injury or death.
We may in the future record goodwill and other long-lived assets impairment charges, which would reduce our earnings.
We test, at least annually and more frequently if needed, our goodwill and other long-lived assets to determine whether their estimated fair value is less than their value carrying recorded on our balance sheet. The
31
Table of Contents
results of this testing for potential impairment may be adversely affected by the continuing uncertain market conditions for the steel industry, as well as changes in interest rates and general economic conditions. If we determine that the fair value of any of these long-lived assets is less than the carrying value recorded on our balance sheet, we would likely incur a non-cash impairment loss that would negatively impact our results of operations. We recorded asset impairment charges in continuing operations of $468.6 million in 2013.
We face risks associated with future acquisitions.
We regularly evaluate expansion opportunities such as acquiring other businesses or assets. Significant expansion involves risks such as additional debt incurred to finance the acquisition or expansion, liabilities, including environmental or pension liabilities of the acquired business or assets, and risks relating to integrating the acquired business or new facility into our operations and attracting and retaining customers. If we are unable to integrate acquired businesses or newly formed operations, expansion may have a material adverse effect on our business, financial position, and results of operations. Additionally, in many jurisdictions there are consents or other regulatory requirements to be met when there is a change in ownership of a steel business, which could increase the costs of or require dispositions in connection with acquisitions. When making acquisitions, we must obtain licenses, permits, and approvals from state and local governments, and we run the risk of being denied the necessary consents from governmental bodies.
Risks Relating to Government Regulations
We are subject to environmental requirements and risks which could result in significant costs, liabilities, and obligations.
Compliance with environmental laws and regulations is a significant factor in our business. We are subject to federal, state, provincial, foreign, and, in some instances, international environmental laws relating to, among other things, air emissions (including potential effects from air emissions relating to climate change), water discharge management and treatment, soil and groundwater contamination, the storage, handling, transportation, and disposal of hazardous materials, and employee and public health and safety. We are also required to obtain environmental permits from governmental authorities for our manufacturing operations, and provide appropriate financial assurances, where required, for remedial and closure related obligations pursuant to environmental laws and permits.
Violation of environmental laws or failure to obtain, maintain, or comply with environmental permits could result in us being fined or subject to criminal, civil, or administrative sanctions, or becoming subject to litigation by governmental authorities or third parties. These environmental laws and permits, and the enforcement and interpretation thereof, have tended to become more stringent over time. As a consequence, it is likely that we will be required to make additional expenditures, which could be significant, relating to environmental matters on an ongoing basis. Future environmental compliance costs, including potential future pollution control requirements to address climate change, future costs of pollution control technology, and asset retirement obligations may result in a material adverse effect on our financial position, results of operations, cash flows, or business.
Compliance with environmental remediation requirements could result in substantially increased capital requirements and operating costs.
Under certain environmental laws, we could be held responsible for liabilities and obligations arising out of releases of hazardous materials, human exposure to such substances and impacts on natural resources and the environment, including contamination of waterways, soil, or groundwater. Such laws can impose liability in connection with contamination at or from our current or former properties, or at third party sites, including waste disposal sites, even if we neither were aware of nor caused the contamination, and regardless of whether our operations at the time of disposal were in compliance with then-applicable law. In addition to investigation and remediation costs, we are, and could be in the future, subject to claims for exposure to hazardous materials from
32
Table of Contents
our operations or other claims for environmental damage. Our costs, liabilities and obligations relating to the investigation and remediation of contaminated sites and hazardous material exposure could have a material adverse effect on our financial position, results of operations, cash flows, or business.
For example, the Comprehensive Environmental Response, Compensation and Liability Act or, CERCLA or Superfund, and analogous state laws empower the United States Environmental Protection Agency or EPA, state environmental agencies, and certain other third-party claimants to recover the cost of investigation and cleanup of contaminated sites from (1) current and former owners and operators of a site, (2) any person who generated or arranged for the disposal, treatment or transportation of hazardous substances to a site, and (3) any person who transported hazardous substances to a site. Liability under CERCLA is strict, retroactive, and in some cases joint and several. Liability can also be imposed for damages to natural resources, which can be substantial. Other federal and state laws, including the Resource Conservation and Recovery Act, or RCRA, impose obligations and liability for the management and cleanup of hazardous wastes and other waste materials at and from our current sites, including contamination that may have been caused by former owners or operators of the sites. Pursuant to these laws, we are currently conducting or funding investigation and remediation activities at several sites, including third-party Superfund sites and sites that we currently own and operate. Based upon information currently available to us, we do not believe that our obligations associated with these sites will have a material effect on our business. However, we can provide no assurance that we will not become liable in the future for significant costs at these sites or at other cleanup sites under federal or state environmental laws, which could have a material effect on our business or results of operations. For a more detailed description of our current environmental remediation activities, see “Business—Environmental Matters.”
Increased regulation associated with climate change and greenhouse gas, or GHG, emission limitations could impose significant costs and obligations.
Various federal and state, as well as foreign and international laws and initiatives to regulate GHG emissions have been implemented or are under consideration. Under a rule promulgated by the EPA, we, and others in our industry, commenced reporting our annual GHG emissions from certain of our United States facilities beginning in 2011. Such reports may result in increased scrutiny of our industry and operations. In addition to our obligations to report GHG emissions, it appears likely that additional federal and state regulation, as well as foreign and international regulation, of actual GHG emissions may be enacted in the future and could apply to our operations or products. In that regard, Canada has published details of a regulatory framework for GHG emissions, and four provinces in Canada have joined with seven Western states in the United States in the Western Climate Initiative in a coordinated effort to control and establish a regional GHG cap-and-trade program for GHG emissions. Other initiatives to control GHG emissions in the United States, such as the Regional Greenhouse Gas Initiative, have been created and certain of those programs also may apply to our operations in the future. Further, legislation has been considered in the United States Congress that could, among other things, create a cap-and-trade system for GHG emissions throughout the United States. If such legislation is enacted in the future, our GHG emissions could be capped, and we might be required to curtail our operations to reduce emissions, or otherwise purchase allowances, offsets or credits for any emissions that exceed our permitted emissions limits, any of which could have an adverse effect on our business or results of operations.
In the absence of such federal legislation, the Obama Administration has undertaken efforts to regulate GHG emissions under the Clean Air Act. In May 2010, the EPA issued a final regulation, or the Tailoring Rule, that sought to establish when permits governing GHG emissions are required under two federal Clean Air Act programs: Prevention of Significant Deterioration, or PSD, and Title V. In June 2014, the United States Supreme Court struck down certain key provisions of the Tailoring Rule, ruling that GHG emissions alone cannot provide the basis for determining whether a facility may be subject to emissions limits under the PSD or Title V programs. However, the Court stated that the EPA could impose GHG emissions limits on a facility that is otherwise subject to the PSD program due to its emissions of conventional pollutants (i.e., pollutants that are explicitly regulated under the Clean Air Act). As a consequence, future regulation of GHG emissions under the federal program is uncertain. At present, it is not clear how the EPA will respond to the Court’s decision. Should
33
Table of Contents
the EPA proceed with a rulemaking intended to limit GHG emissions from facilities otherwise subject to the PSD and Title V programs, one or more of our facilities in the United States may be covered under the scope of such a regulation. If so, we may be required to make additional capital expenditures to implement pollution control technology or fuel switching measures, become subject to operational restrictions, incur higher operating expenses, or be forced to delay or curtail planned expansions, capacity increases or operational changes.
Various Canadian Provinces have adopted or in the process of adopting GHG reduction regimes. For example, Alberta’s Climate Change and Emissions Management Act established reporting requirements, intensity-based reduction targets, and credit and offset systems. Further, while we cannot predict what additional requirements may be adopted in the United States and Canada, or otherwise on a regional or international basis, any additional initiatives to regulate GHG emissions, including through a cap-and-trade system, technology-based mandate, emissions tax, reporting requirement or other regime, could restrict our operations and/or impose significant costs or obligations on us and our customers and suppliers, including costs related to requirements to purchase allowances, credits or offsets for GHG emissions, increased costs for energy, capital equipment, transportation, raw materials, environmental monitoring, and reporting and decreased demand for products. Such costs and impacts could have a material adverse effect on our business.
Governmental agencies may refuse to grant or renew our licenses and permits.
We must obtain licenses, permits and approvals from state and local governments to conduct certain of our operations, develop new facilities, or expand existing facilities. Governmental entities and private citizens groups often resist the establishment of certain types of facilities in their communities, including scrap metal collection and processing facilities.
In addition to securing licenses, permits and approvals for our operations, from time to time the United States, Canada and foreign governments impose regulations and restrictions on trade in the markets in which we operate. In some countries, governments can require us to apply for certificates or registration before allowing shipment of metal to customers in those countries. There can be no assurance that future approvals, licenses and permits will be granted or that we will be able to maintain and renew the approvals, licenses and permits we currently hold, and failure to do so could have a material adverse effect on our results of operations and financial position.
Risks Relating to Our Corporate Structure
We are a holding company and our only material assets after completion of this offering will be our interest in our operating subsidiaries, upon whom we are dependent for distributions to pay dividends, taxes and other expenses.
We are a holding company whose sole material assets are investments in EICA and EINA, our operating subsidiaries, and their respective subsidiaries. We do not have any independent means of generating revenue. We intend to cause EICA and EINA to make distributions to us in an amount sufficient to pay applicable taxes payable and dividends, if any, declared by us, and to service debt. To the extent that we need funds for a cash dividend to holders of our ordinary shares or otherwise, and one or more of our operating subsidiaries is restricted from making such distributions under the terms of its financing or other agreements or applicable law and regulations or is otherwise unable to provide such funds, it could materially adversely affect our liquidity and financial position and limit our ability to pay dividends to shareholders.
As a foreign private issuer, we may follow home country corporate governance practices instead of otherwise applicable SEC and Nasdaq corporate governance requirements, and this may result in less investor protection than that accorded to investors under rules applicable to domestic United States issuers.
As a foreign private issuer, we are permitted to follow home country corporate governance practices instead of those otherwise required under the Nasdaq rules for domestic United States issuers, provided that we disclose
34
Table of Contents
which requirements we are not following and describe the equivalent home country requirement. For example, foreign private issuers are permitted to follow home country practice with regard to director nomination procedures and the approval of compensation of officers. Additionally, we are not required to a maintain a board comprised of a majority of independent directors.
We may rely on the foreign private issuer exemptions provided by Nasdaq and follow home country corporate governance practices in lieu of complying with some or all of the Nasdaq requirements.
Following our home country governance practices, as opposed to complying with the requirements that are applicable to a non-controlled U.S. domestic registrant, may provide less protection to you than is accorded to investors under the Nasdaq corporate governance rules. Therefore, any foreign private exemptions we avail ourselves of may reduce the scope of information and protection to which you are otherwise entitled as an investor.
Shareholders in certain jurisdictions may not be able to exercise their pre-emptive rights if we increase our share capital.
Under the UK Companies Act 2006, or the Companies Act, holders of our shares generally have the right to subscribe and pay for a sufficient number of our shares to maintain their relative ownership percentages prior to the issuance of any new shares in exchange for cash consideration. Holders of shares in certain jurisdictions may not be able to exercise their pre-emptive rights unless securities laws have been complied with in such jurisdictions with respect to such rights and the related shares, or an exemption from the requirements of the securities laws of these jurisdictions is available. We currently do not intend to register the shares under the laws of any jurisdiction other than the United States, and no assurance can be given that an exemption from the securities laws requirements of other jurisdictions will be available to shareholders in these jurisdictions. To the extent that such shareholders are not able to exercise their pre-emptive rights, the pre-emptive rights would lapse and the proportional interests of such holders would be reduced.
The rights of our shareholders may differ from the rights typically offered to shareholders of a United States corporation organized in Delaware.
We are incorporated under the laws of England and Wales. The rights of holders of our shares are governed by English law, including the provisions of the Companies Act, and by our articles of association. These rights differ in certain respects from the rights of shareholders in typical United States corporations organized in Delaware. The principal differences are set forth in “Description of Share Capital—Differences in Corporate Law.”
The U.K. City Code on Takeovers and Mergers does not currently apply to us, but that position may change in the future depending on the “residency test”.
The U.K. City Code on Takeovers and Mergers, or the Takeover Code, applies, among other things, to an offer for a public company whose registered office is in the United Kingdom, even if securities of that company are not admitted to trading on a regulated market or multilateral trading facility in the United Kingdom if the company is considered by the Panel on Takeovers and Mergers, or the Takeover Panel, to have its place of central management and control in the United Kingdom. This is known as the “residency test.” The test for central management and control under the Takeover Code is different from that used by the U.K. tax authorities. Under the Takeover Code, the Takeover Panel will determine whether we have our place of central management and control in the United Kingdom by looking at various factors, including the structure of our Board of Directors, the functions of the directors, and where they are resident.
If, at the time of a takeover offer, the Takeover Panel determines that we have our place of central management and control in the United Kingdom, we would be subject to a number of rules and restrictions,
35
Table of Contents
including but not limited to the following: (1) our ability to enter into deal protection arrangements with a bidder would be extremely limited; (2) we may not, without the approval of our shareholders, be able to perform certain actions that could have the effect of frustrating an offer, such as issuing shares or carrying out material acquisitions or disposals; and (3) we would be obliged to provide equality of information to all bona fide competing bidders.
Assuming that the Takeover Code does not apply, then shareholders will not have protections available to shareholders of other companies governed by the Takeover Code, including the Takeover Code requirements: that (1) an offer be made on no less favorable terms than those on which a bidder has acquired interests in our shares in the relevant period preceding, or during, the offer; and (2) a person who, together with persons acting in concert with him, acquires an interest in shares carrying 30% or more of the voting rights in the Company (or who already holds between 30% and 50% and acquires any further interests) must make a cash offer to all other shareholders at the highest price paid in the 12 months before the offer was announced.
There are limitations on enforceability of civil liabilities under United States federal securities laws.
We are incorporated under the laws of England and Wales. In addition, a significant portion of our assets are located outside the United States. As a result it may be difficult or impossible to serve legal process on persons located outside the United States and to force them to appear in a United States court. It may also be difficult or impossible to enforce a judgment of a United States court against persons or assets outside the United States, or to enforce a judgment of a foreign court against such persons in the United States. We believe that there may be doubt as to the enforceability against persons in England and Wales, whether in original actions or in actions for the enforcement of judgments of United States courts, of civil liabilities predicated solely upon the laws of the United States, including its federal securities laws. In addition, we are a foreign private issuer, and our directors and officers will not be subject to rules under the Securities Exchange Act of 1934, or the Exchange Act, that under certain circumstances would require directors and officers to forfeit to us any “short-swing” profits realized from purchases and sales, as determined under the Exchange Act and the rules thereunder, of our equity securities. In addition, punitive damages awarded in actions brought in the United States or elsewhere may be unenforceable in England and Wales.
If EGSA sells a controlling interest in us to a third party in a private transaction, you may not realize any change-of-control premium on our ordinary shares and we may become subject to the control of a presently unknown third party.
Following the completion of this offering, EGSA will beneficially own a substantial majority of our ordinary shares. EGSA will have the ability, should it choose to do so, to sell some or all of our ordinary shares in a privately negotiated transaction, which, if sufficient in size, could result in our change of control. The ability of EGSA to privately sell such shares may not be subject to any requirement for a concurrent offer to be made to acquire all of our ordinary shares that will be publicly traded hereafter, which could prevent you from realizing any change-of-control premium on your ordinary shares that may otherwise accrue to EGSA upon its private sale of our ordinary shares. Additionally, if EGSA privately sells a significant equity interest in us, we may become subject to the control of a presently unknown third party. Such third party may have interests that conflict with the interests of our other shareholders.
Risks Relating to Our Ordinary Shares and this Offering
There may be circumstances in which the interests of our major shareholder could be in conflict with your interests as a shareholder.
EGSA owns 100% of our ordinary shares. Upon completion of this offering, EGSA will beneficially own % of our ordinary shares, or % of our ordinary shares, if the underwriters exercise their option to purchase additional ordinary shares in full. As a result of this ownership, EGSA will have a controlling influence on our
36
Table of Contents
affairs and its voting power will constitute a quorum of our shareholders voting on any matter requiring the approval of our shareholders. Such matters include the nomination and election of directors, the issuance of additional shares of our capital stock or payment of dividends, the adoption of amendments to our articles of association and organizational regulations and approval of mergers or sales of substantially all of our assets.
Accordingly, this concentration of ownership may harm the market price of our ordinary shares by, among other things:
| • | delaying, defending, or preventing a change of control, even at a per share price that is in excess of the then current price of our ordinary shares; |
| • | impeding a merger, consolidation, takeover, or other business combination involving us, even at a per share price that is in excess of the then current price of our ordinary shares; or |
| • | discouraging a potential acquirer from making a tender offer or otherwise attempting to obtain control of us, even at a per share price that is in excess of the then current price of our ordinary shares. |
EGSA may also cause corporate actions to be taken that conflict with the interests of our other shareholders.
If we fail to develop or maintain an effective system of disclosure controls and internal control over financial reporting, our ability to produce timely and accurate consolidated financial statements or comply with applicable regulations could be impaired.
As a public company, we will be subject to the reporting requirements of the Exchange Act, the Sarbanes-Oxley Act of 2002 and the listing standards of Nasdaq. Prior to consummation of this offering, we have not been required to do so. We expect that the requirements of these rules and regulations will increase our legal, accounting, and financial compliance costs, make some activities more difficult, time consuming and costly, and place significant strain on our personnel, systems and resources.
The Sarbanes-Oxley Act of 2002 requires, among other things, that, as a public company, our principal executive officer and principal financial officer certify the effectiveness of our disclosure controls and procedures and, beginning with our second annual report as a public company, our internal controls over financial reporting. We continue to develop and refine our disclosure controls and procedures and our internal control over financial reporting; however, we have not yet assessed our internal control over financial reporting. Material weaknesses in our disclosure controls or our internal control over financial reporting may be discovered in the future. Any failure to develop or maintain effective controls, or any difficulties encountered in their implementation or improvement, could harm our operating results or cause us to fail to meet our reporting obligations and may result in a restatement of our consolidated financial statements for prior periods. Any failure to implement and maintain effective internal control over financial reporting also could adversely affect the results of management evaluations and independent registered public accounting firm audits of our internal control over financial reporting. Ineffective disclosure controls and procedures or ineffective internal control over financial reporting could also cause investors to lose confidence in our reported financial information, which may have a negative effect on the trading price of our ordinary shares.
Because there is no existing market for our ordinary shares, our initial public offering price may not be indicative of the market price of our ordinary shares after this offering, an active trading market in our ordinary shares may not develop or be sustained and the market price of our ordinary shares could fluctuate significantly, and you could lose all or part of your investment.
There is currently no public market for our ordinary shares, and an active trading market may not develop or be sustained after this offering. Our initial public offering price has been determined through negotiation between us and the underwriters and may not be indicative of the market price for our ordinary shares after this offering. We cannot predict the extent to which investor interest in us will lead to the development of an active trading
37
Table of Contents
market on Nasdaq. The lack of an active market may reduce the value of your shares and impair your ability to sell your shares at the time or price at which you wish to sell them. An inactive market may also impair our ability to raise capital by selling our ordinary shares and may impair our ability to acquire or invest in other companies, products or technologies by using our ordinary shares as consideration.
The lack of a trading market in the United States may result in the loss of research coverage by any securities analysts that may cover us in the future. Moreover, we cannot assure you that any securities analysts will initiate or maintain research coverage of us and our ordinary shares in the United States.
In addition, the market price of our ordinary shares could fluctuate significantly as a result of a number of factors, including:
| • | fluctuations in our financial performance; |
| • | economic and stock market conditions generally and specifically as they may impact us, participants in our industry or comparable companies; |
| • | changes in financial estimates and recommendations by securities analysts following our ordinary shares or comparable companies; |
| • | earnings and other announcements by, and changes in market evaluations of, us, participants in our industry or comparable companies; |
| • | our ability to meet or exceed any future earnings guidance we may issue; |
| • | changes in business or regulatory conditions affecting us, participants in our industry or comparable companies; |
| • | changes in accounting standards, policies, guidance, interpretations or principles; |
| • | announcements or implementation by our competitors or us of acquisitions, technological innovations or new products, or other strategic actions by our competitors; or |
| • | trading volume of our ordinary shares or the sale of stock by our management team, directors or principal shareholders. |
These and other factors could limit or prevent investors from readily selling their ordinary shares or otherwise negatively affect the liquidity of our ordinary shares, and you could lose all or part of your investment.
We will incur increased costs as a result of becoming a public company.
As a public company, we will incur legal, accounting, insurance and other expenses that we have not incurred as a private company, including costs associated with public company reporting requirements. We also have incurred and will incur costs associated with the Sarbanes-Oxley Act of 2002 and related rules implemented by the SEC. We expect these rules and regulations to increase our legal and financial compliance costs and to make some activities more time-consuming and costly, although we are currently unable to estimate these costs with any degree of certainty. These and other laws and regulations could also make it more difficult or costly for us to obtain certain types of insurance, including director and officer liability insurance, and we may be forced to accept reduced policy limits and coverage or incur substantially higher costs to obtain the same or similar coverage. These and other laws and regulations could also make it more difficult for us to attract and retain qualified persons to serve on our Board of Directors, our board committees, or as our senior management. Furthermore, if we are unable to satisfy our obligations as a public company, we could be subject to delisting of our ordinary shares, fines, sanctions, and other regulatory action and potentially civil litigation.
38
Table of Contents
Investors in our ordinary shares will experience immediate and substantial book value dilution after this offering.
The initial public offering price of our ordinary shares will be higher than the net tangible book value per ordinary share as of December 31, 2013. Based on our net tangible book value as of December 31, 2013, if you purchase our ordinary shares in this offering, you will suffer immediate dilution of approximately $ per ordinary share, calculated by subtracting the net tangible book value per ordinary share immediately upon the completion of this offering from the assumed initial offering price per ordinary share.
The market price of our ordinary shares could be adversely affected by future sales of our ordinary shares.
Sales of a substantial number of our ordinary shares following this offering or the perception that such sales might occur, could cause a decline in the market price of our ordinary shares or could impair our ability to obtain capital through a subsequent offering of our equity securities or securities convertible into equity securities. Under our articles of association that will be in effect upon closing of our initial public offering, we are authorized to issue up to ordinary shares, of which ordinary shares will be outstanding upon the closing of this offering (or ordinary shares if the underwriters’ option to purchase additional ordinary shares is exercised in full). Accordingly, we are authorized to issue up to ordinary shares upon the expiration of the 180-day lock-up period under the lock-up agreements described below (assuming no exercise of the underwriters’ option to purchase additional shares). In addition, upon completion of this offering, EGSA will hold the substantial majority of our shares, and following the expiration of the lock-up period applicable to EGSA there will be no contractual restrictions on EGSA selling its shares.
We, EGSA and our directors and executive officers have agreed, subject to certain exceptions, not to dispose of or hedge any shares or any securities convertible into or exchangeable for our ordinary shares during the period from the date of this prospectus continuing through the date 180 days after the date of this prospectus, except with the prior written consent of the representatives.
Risks Relating to Tax Matters
The Internal Revenue Service, or the IRS, may not agree with the conclusion that the Company should be treated as a foreign corporation for United States federal income tax purposes, which could result in substantially greater United States income tax liability.
Although the Company is incorporated in England, it is possible that the IRS may assert that it should be treated as a United States corporation (and, therefore, a United States tax resident) for United States federal income tax purposes pursuant to section 7874 of the Code. For United States federal income tax purposes, a corporation is generally considered a tax resident in the jurisdiction of its organization or incorporation. Because the Company is incorporated in England, it would generally be classified as a foreign corporation (and, therefore, a non-United States tax resident) for United States federal income tax purposes. Section 7874 of the Code, however, provides an exception pursuant to which a foreign incorporated entity may, in certain circumstances, be treated as a United States corporation for United States federal income tax purposes. If the Company were to be treated as a United States corporation for United States federal income tax purposes, it could be subject to substantially greater United States income tax liability than is currently contemplated as a non-United States corporation.
If the Company were to be treated as a United States corporation for United States federal income tax purposes, it would be subject to United States corporate income tax on its worldwide income, and the income of its foreign subsidiaries would be subject to United States tax when repatriated or when deemed repatriated under the United States tax rules for controlled foreign corporations, including as a result of such subsidiaries having any investments in United States property (within the meaning of section 956 of the Code) such as stock or debt obligations of United States affiliates. Additionally, any restructurings of EVRAZ Group that may be undertaken to modify the overall structure of the Company may give rise to United States taxable gain. Moreover, in such case, a
39
Table of Contents
non-United States shareholder of the Company would generally be subject to United States withholding tax on the gross amount of any dividends paid by the Company to such shareholder.
Section 7874 provides an ownership test, applied through complex rules, to determine whether section 7874 applies to treat a foreign corporation as a United States corporation. Based on these rules and certain factual assumptions, we expect that, under current law, the Company should continue to be treated as a foreign corporation for United States federal income tax purposes, although no assurances can be given in this regard.
The IRS may not agree with our position that section 7874 should not apply to the Company. There is limited guidance regarding the application of section 7874 of the Code, including with respect to the provisions regarding the application of the ownership test in a situation similar to the Company’s. In addition, as described in more detail below, new statutory or regulatory provisions under section 7874 or otherwise could be enacted or promulgated that could adversely affect the Company’s status as a non-United States corporation for United States federal income tax purposes, and any such provisions could have retroactive application.
For further discussion of the application of section 7874 of the Code, see “Taxation—United States Federal Income Tax Considerations—Tax Consequences of the Reorganization.”
Future changes to United States and non-United States tax laws could materially adversely affect the Company.
Under current law, as described above, we expect the Company to be treated as a foreign corporation for United States federal income tax purposes. Changes to section 7874 of the Code or the regulations promulgated thereunder or other guidance issued by the United States Treasury or the IRS could, however, adversely affect the Company’s status as a foreign corporation for United States federal income tax purposes, and it is possible that any such changes could have retroactive application. In addition, recent legislative proposals have aimed to expand the scope of United States corporate tax residence, and such legislation, if enacted, could also affect the Company’s status as a foreign corporation for United States federal income tax purposes. Any of these changes to such laws or regulations could adversely affect us.
In addition, the United States Congress, government agencies in non-United States jurisdictions where we and our affiliates do business, and the Organization for Economic Co-Operation and Development have recently focused on issues related to the taxation of multinational corporations. One example is in the area of “base erosion and profit sharing,” where payments are made between affiliates from a jurisdiction with high tax rates to a jurisdiction with lower tax rates. As a result, the tax laws in the United States and other countries in which the Company and its affiliates do business could change on a prospective or retroactive basis, and any such changes could materially adversely affect the Company.
The Company and its United States affiliates may face potential limitations on the utilization of United States tax attributes following the Reorganization and this offering.
Following the acquisition of a United States corporation by a foreign corporation, section 7874 of the Code can limit the ability of the acquired United States corporation and its United States affiliates to utilize certain United States tax attributes (such as net operating losses and certain tax credits) to offset United States taxable income resulting from certain transactions.
Based on the rules for establishing share ownership under section 7874, we expect that, under current law, such restrictions should not apply to EINA, although no assurances can be given in this regard.
For further discussion of the application of section 7874 of the Code, see “Taxation—United States Federal Income Tax Considerations—Tax Consequences of the Reorganization.”
40
Table of Contents
HMRC may disagree with the conclusions on the U.K. tax treatment of the issue of shares into the Depository Trust Company, or relevant U.K. legislation or practice may be subject to change.
Based on current U.K. tax law and HMRC published practice, we anticipate that the Company will incur no liability to U.K. corporation tax, U.K. stamp duty or U.K. stamp duty reserve tax in respect of the implementation of this offering and the issue of ordinary shares into the Depository Trust Company. However, the case law and practice on U.K. stamp duty and U.K. stamp duty reserve tax analysis on the issue of shares into a depositary or clearance system is relatively new and could be subject to change. See “Taxation-Material U.K. Tax Considerations” for further information on U.K. stamp duty and U.K. stamp duty reserve tax.
Dividends, distributions and other intra-group payments from EINA or EICA to the Company or to each other may be subject to withholding taxes.
Dividends, distributions, and other intra-group payments from EINA, EICA, or our other subsidiaries to ENA or to each other may be subject to withholding taxes imposed by the jurisdiction in which the entity making the payment is organized or tax resident. Unless (i) the entity receiving such payments can demonstrate that it qualifies for reduction or elimination of the withholding tax under an applicable income tax treaty, or (ii) these withholding taxes are fully credited against the income tax liability of the entity receiving the payment or fully refunded, these dividends, distributions and other intra-group payments may increase our aggregate tax burden.
Although we intend to arrange the ownership of our subsidiaries and intercompany payments with a view to minimizing the incurrence of such withholding taxes and, where appropriate, to seek tax rulings to confirm that exemptions from withholding taxes (or reductions in the applicable withholding tax rates) will be available, there can be no assurance that such arrangements will have the intended result or that such rulings will be obtained.
41
Table of Contents
OUR STRUCTURE AND REORGANIZATION
In connection with this offering, EGSA will affect the transactions described below, which we collectively refer to as the Reorganization.
Prior to Reorganization
The Company, EINA and EICA have each historically been direct or indirect wholly owned subsidiaries of EGSA, which in turn is wholly owned by EVRAZ plc. Prior to the Reorganization, (i) EINA was 36.5% owned by the Company and 63.5% owned by Mastercroft, a direct wholly owned subsidiary of EGSA and (ii) EICA was 100% directly owned by EGSA.
Set forth below is our condensed structure and ownership chart immediately prior to the Reorganization:
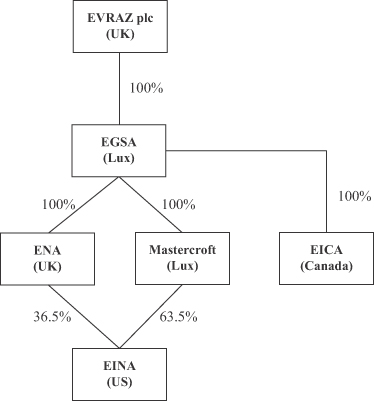
Reorganization and the Offering
EGSA has undertaken, and will undertake, certain steps to reorganize the ownership of our business in preparation for this offering, including the steps described below.
In the Reorganization, the Company will be converted from an English private company limited by shares into an English public company limited by shares and its name will be changed to EVRAZ NORTH AMERICA PLC. Ordinary shares offered in this offering will be shares issued by EVRAZ NORTH AMERICA PLC. In addition, the Company will conduct a 100 for 1 share split and will reduce the nominal value of its ordinary shares from $1 per share to $0.01 per share. Also, the Company will conduct a bonus share issuance, pursuant to which it will issue additional ordinary shares to EGSA.
42
Table of Contents
In the Reorganization, Mastercroft distributed all of the shares of EINA held by Mastercroft, representing 63.5% of EINA, to EGSA, and EGSA contributed these shares to the Company, such that the Company has become the owner of 100% of EINA.
Additionally, in the Reorganization, EGSA contributed a portion of the shares it owned in EICA, representing 51% of EICA, to the Company in exchange for additional shares of the Company. As a result of this contribution, the Company has become the owner of 51% of EICA. We will use the first $ million of the net proceeds from this offering to acquire from EGSA the 49% interest in EICA that the Company does not own immediately prior to this offering. As a result, following completion of this acquisition the Company will own 100% of EICA (as well as a 100% stake in EINA). See “Summary Consolidated Financial Information and Other Data” for an illustration of the pro forma effect of the acquisition of the remaining EICA stake.
After the Reorganization and the Completion of this Offering
Following the transactional steps identified above, and immediately following the consummation of this offering and the application of the proceeds from this offering, our structure and ownership will be as summarized in the following condensed structure chart:
43
Table of Contents
We estimate that our net proceeds from this offering, after deducting the underwriting discount and estimated offering expenses, will be approximately $ million (or approximately $ million if the underwriters exercise their option to purchase additional ordinary shares in full). This assumes the ordinary shares are offered at $ per share, the mid-point of the estimated offering price range set forth on the cover page of this prospectus. A $ increase/(decrease) in the assumed initial public offering price of $ per share would increase/(decrease) the net proceeds to us from this offering by approximately $ million, assuming the number of ordinary shares offered by us as set forth on the cover page of this prospectus remains the same and after deducting the underwriting discounts and commissions.
We intend to use the first $ million of the net proceeds from this offering, excluding the net proceeds from any exercise of the underwriters’ option to purchase additional ordinary shares, to acquire the remaining stake in EICA.
To the extent we raise any additional net proceeds in this offering, excluding any net proceeds received by us from the exercise by underwriters of their option to purchase additional ordinary shares, we intend to use such additional net proceeds to make equity contributions to EICA, which EICA will use to repay amounts outstanding under Loan Contract No. KGOK-EICA-03, or Note 3, or for general corporate purposes. Note 3, is due June 30, 2020, and carries a fixed interest rate of 8.25%, and had a balance of CAD 431.6 million outstanding as of November 14, 2014. See “Related Party Transactions.”
We intend to use the net proceeds received by us from the exercise of the underwriters’ option to purchase additional ordinary shares either to make an equity contribution to EICA, which EICA will use to repay additional amounts outstanding under its loans from EVRAZ KGOK or for general corporate purposes.
44
Table of Contents
We currently intend to pay dividends on our ordinary shares at a dividend yield and on a schedule comparable to our North American peers. However, any future determination as to the declaration and payment of dividends, if any, will be made at the discretion of our Board of Directors and will depend on then existing conditions, including our results of operations, financial position, contractual restrictions, capital requirements, business prospects, and other factors our Board of Directors may deem relevant. Under English law, we may pay dividends only out of our accumulated, realized profits, so far as not previously utilized by distribution or capitalization, less our accumulated, realized losses, so far as not previously written off in a reduction or reorganization of capital duly made. Because we are a holding company and have no direct operations, we will only be able to pay dividends from our available cash on hand and any funds we receive from our operating subsidiaries.
45
Table of Contents
The following table sets forth our cash and cash equivalents and capitalization as of September 30, 2014 on an actual basis and adjusted to give effect to this offering and use of proceeds, assuming (i) no exercise of the underwriters’ option to purchase additional ordinary shares from us, (ii) an initial public offering price of $ per ordinary share and after deducting estimated underwriting discounts and estimated offering expenses payable by us, which is the midpoint of the estimated initial public offering price range set forth on the cover page of this prospectus and (iii) the offering of the Senior Notes due 2019, described further in “Related Party Transactions.”
You should read this table together with our consolidated financial statements and the related notes thereto and information contained elsewhere in this prospectus, including information in “Management’s Discussion and Analysis of Financial Condition and Results of Operations.”
| As of September 30, 2014 | As adjusted, as of September 30, 2014 | |||||||
| ($ in millions) | ||||||||
Cash and cash equivalents | $ | 27.3 | $ | |||||
|
|
|
| |||||
Liabilities: | ||||||||
Interest bearing debt (current and non-current) (secured and guaranteed)(1) | [178.0 | ] | ||||||
Related-party interest bearing debt (non-current) (unsecured and not guaranteed)(1) | [735.4 | ] | ||||||
Other liabilities (current and non-current) | 803.1 | 803.1 | ||||||
|
|
|
| |||||
| $ | 1,716.5 | $ | ||||||
|
|
|
| |||||
Equity: | ||||||||
Share capital | 0.1 | |||||||
Additional paid-in capital | 3,036.6 | |||||||
Accumulated deficit | (1,354.2 | ) | (1,354.2 | ) | ||||
Cumulative foreign currency translation adjustment | 5.8 | 5.8 | ||||||
Pension and post-retirement benefit plans, net of tax | (67.2 | ) | (67.2 | ) | ||||
|
|
|
| |||||
Total EVRAZ NORTH AMERICA LIMITED equity | 1,621.1 | |||||||
Non-controlling interest | 343.6 | |||||||
Total equity | 1,964.7 | |||||||
|
|
|
| |||||
Total capitalization | $ | 3,681.2 | $ | |||||
|
|
|
| |||||
| (1) | On November 7, 2014, our subsidiary, EICA, completed a private offering, exempt from the registration requirements of the Securities Act, of $350 million aggregate principal amount of 7.5% senior notes due 2019. EICA used the net proceeds from the offering of the notes to repay part of Note 2 due to EVRAZ KGOK. See “Related Party Transactions.” |
46
Table of Contents
If you invest in the ordinary shares, your interest will be diluted to the extent of the difference between the initial public offering price per ordinary share and our net tangible book value per ordinary share after this offering. Dilution results from the fact that the initial public offering price per ordinary share is substantially in excess of the net tangible book value per ordinary share. Our net tangible book value as of December 31, 2013 was $ million or $ per ordinary share. Net tangible book value per ordinary share represents the amount of total assets, excluding intangible assets and goodwill, minus the amount of total liabilities, divided by the total number of ordinary shares outstanding at the end of the period.
Without taking into account any other changes in such net tangible book value after December 31, 2013, other than to give effect to our issuance and sale of ordinary shares in this offering, based upon an assumed initial public offering price of $ per ordinary share, which is the midpoint of the range set forth on the cover page of this prospectus, and after deduction of underwriting discounts and commissions and estimated offering expenses payable by us, our pro forma as adjusted net tangible book value as of December 31, 2013 would have been $ per outstanding ordinary share, or $ per ordinary share. This represents an immediate increase in net tangible book value of $ or % per ordinary share to our existing shareholders and an immediate dilution in net tangible book value of $ or % per ordinary share, or $ or % per ordinary share, to new investors of ordinary shares in this offering. Dilution is determined by subtracting net tangible book value per ordinary share immediately upon the completion of this offering from the assumed initial public offering price per ordinary share.
The following table illustrates such dilution, assuming no exercise of the underwriters’ option to purchase additional ordinary shares:
Assumed initial public offering price per ordinary share | $ | |||
|
| |||
Net tangible book value per ordinary share as of December 31, 2013 | ||||
Amount of dilution in net tangible book value per ordinary share immediately after this offering | ||||
Amount of dilution in net tangible book value per ordinary share to new investors in the offering |
A $1.00 change in the assumed initial public offering price of $ per ordinary share would, in the case of an increase, and, in the case of a decrease, decrease the dilution per ordinary share to new investors in this offering by $ per ordinary share, after deducting underwriting discounts and commissions and estimated offering expenses. The pro forma information discussed above is illustrative only. Our net tangible book value following the completion of this offering is subject to adjustment based on the actual initial public offering price of our ordinary shares.
47
Table of Contents
SELECTED CONSOLIDATED FINANCIAL INFORMATION AND OTHER DATA
The following selected consolidated financial and other data should be read together with “Management’s Discussion and Analysis of Financial Condition and Results of Operations” and the historical consolidated financial statements and related notes included elsewhere in this prospectus. We derived the selected historical consolidated financial data as of December 31, 2012 and 2013, and for the years ended December 31, 2011, 2012, and 2013 from our audited consolidated financial statements which are included elsewhere in this prospectus. The selected historical consolidated financial information for the nine months ended September 30, 2013 and as of and for the nine months ended September 30, 2014 has been derived from our unaudited consolidated financial statements included elsewhere in this prospectus. Interim financial information includes all adjustments (consisting of normal recurring adjustments) that we consider necessary for a fair presentation of the consolidated financial positions and the results of operations for these periods. The historical results presented below are not necessarily indicative of the results to be expected for any future period. Also, the results for the nine months ended September 30, 2014 are not necessarily indicative of the results that may be expected for the year ending December 31, 2014.
| Nine months ended September 30, | Year ended December 31, | |||||||||||||||||||||||||||
| 2013 | 2014 | 2009 | 2010 | 2011 | 2012 | 2013 | ||||||||||||||||||||||
($ in millions, except per share data) | ||||||||||||||||||||||||||||
Consolidated Statement of Operations Data: | ||||||||||||||||||||||||||||
Total sales | $ | 2,010.1 | $ | 2,358.8 | $ | 2,162.0 | $ | 2,672.8 | $ | 3,047.1 | $ | 2,904.4 | $ | 2,748.9 | ||||||||||||||
Cost of sales | 1,841.3 | 2,060.5 | 1,996.9 | 2,246.3 | 2,576.7 | 2,505.2 | 2,513.0 | |||||||||||||||||||||
Operating (loss) income | (5.8 | ) | 112.5 | (311.1 | ) | 221.4 | 240.7 | 164.6 | (469.8 | ) | ||||||||||||||||||
(Loss) income from continuing operations before income taxes | (57.3 | ) | 59.2 | (340.5 | ) | 148.9 | 130.8 | 121.3 | (542.1 | ) | ||||||||||||||||||
Income tax benefit | 52.2 | 6.4 | 118.2 | 15.2 | 5.5 | 13.6 | 52.8 | |||||||||||||||||||||
Net (loss) income from continuing operations | (5.1 | ) | 65.6 | (222.3 | ) | 164.1 | 136.3 | 134.9 | (489.3 | ) | ||||||||||||||||||
Net (loss) income from discontinued operations | (22.7 | ) | (10.2 | ) | (206.6 | ) | (11.7 | ) | 9.7 | (101.1 | ) | (270.2 | ) | |||||||||||||||
Less net loss (income) attributable to non-controlling interest | 21.2 | (0.1 | ) | 28.8 | (35.3 | ) | (3.6 | ) | (19.2 | ) | 50.2 | |||||||||||||||||
Net (loss) income attributable to EVRAZ NORTH AMERICA LIMITED | $ | (6.6 | ) | $ | 55.3 | $ | (400.1 | ) | $ | 117.1 | $ | 142.4 | $ | 14.6 | $ | (709.3 | ) | |||||||||||
Earnings (loss) per share from continuing operations | $ | 16,047 | $ | 11,634 | $ | (193,500 | ) | $ | 128,800 | $ | 132,648 | $ | 115,726 | $ | (438,660 | ) | ||||||||||||
Dividends declared per share | $ | 137,298 | $ | 12,849 | $ | 156,271 | $ | 153,292 | $ | 151,478 | $ | 68,237 | $ | 172,180 | ||||||||||||||
| September 30, | December 31, | |||||||||||||||||||||||
| 2014 | 2009 | 2010 | 2011 | 2012 | 2013 | |||||||||||||||||||
| ($ in millions) | ||||||||||||||||||||||||
Balance Sheets Data: | ||||||||||||||||||||||||
Cash and cash equivalents | $ | 27.3 | $ | 81.9 | $ | 194.6 | $ | 77.3 | $ | 254.6 | $ | 193.3 | ||||||||||||
Total current assets | 1,077.7 | 1,009.6 | 1,160.6 | 937.5 | 1,174.3 | 1,015.1 | ||||||||||||||||||
Property, plant, and equipment, net | 1,149.9 | 1,474.9 | 1,398.7 | 1,326.5 | 1,301.6 | 1,224.2 | ||||||||||||||||||
Total assets | $ | 3,681.2 | $ | 5,175.2 | $ | 5,243.2 | $ | 4,857.2 | 4,930.1 | 3,782.6 | ||||||||||||||
|
|
|
|
|
|
|
|
|
|
|
| |||||||||||||
Total current liabilities | $ | 393.9 | $ | 349.1 | $ | 304.3 | $ | 351.4 | $ | 443.0 | $ | 443.5 | ||||||||||||
Long-term debt | 913.4 | 1,408.3 | 1,418.8 | 1,061.9 | 1,130.9 | 874.4 | ||||||||||||||||||
Total liabilities | 1,716.5 | 2,412.7 | 2,444.3 | 2,140.7 | 2,258.1 | 1,772.3 | ||||||||||||||||||
Total equity | 1,964.7 | 2,762.5 | 2,798.9 | 2,716.5 | 2,672.0 | 2,010.3 | ||||||||||||||||||
|
|
|
|
|
|
|
|
|
|
|
| |||||||||||||
Total liabilities and equity | $ | 3,681.2 | $ | 5,175.2 | $ | 5,243.2 | $ | 4,857.2 | $ | 4,930.1 | $ | 3,782.6 | ||||||||||||
|
|
|
|
|
|
|
|
|
|
|
| |||||||||||||
Shares outstanding | 51,959 | 1,000 | 1,000 | 1,000 | 1,001 | 1,001 | ||||||||||||||||||
48
Table of Contents
MANAGEMENT’S DISCUSSION AND ANALYSIS OF FINANCIAL CONDITION AND RESULTS OF OPERATIONS
You should read the following Management’s Discussion and Analysis of Financial Condition and Results of Operations together with our consolidated financial statements and related notes included elsewhere in this prospectus. Certain statements in this section are “forward-looking statements” and are subject to risks and uncertainties, which may cause actual results to differ materially from those expressed or implied by such forward-looking statements. Please see “Special Note Regarding Forward-Looking Statements” and “Risk Factors” for more information.
Overview
We are a leading North American producer of engineered steel products for the rail, energy, and industrial end markets. We are the largest producer by volume in the North American rail market and in the North American LD Pipe market, with estimated market shares of 39% and 47%, respectively, in 2013. We also held leading positions in the Western Canada OCTG, SD Pipe, and West Coast plate markets in 2013.
We operate six production sites strategically located close to key markets demonstrating favorable growth dynamics, including the Western North American LD Pipe, OCTG, and rail markets. Rail and energy (exploration, production, and transmission) products, collectively, represented approximately 66% of our shipments by volume in 2013. Collectively, our facilities have an effective annual capacity of approximately 3.5 million tons of finished steel products. In addition to our rail, LD Pipe and OCTG mills, we operate the only plate mill on the West Coast, a wire rod mill in Pueblo, Colorado, and we process scrap in several Canadian provinces and in Colorado and North Dakota, which, collectively, provide approximately a third of the scrap used in our steel making operations.
Our focus on engineered products and our strong customer relations favorably positions us to benefit from volume and margin growth in our key markets. The close proximity of our production sites to our customers provides us with freight and other logistical benefits that support our position as a low cost producer on a delivered basis. We serve a diversified and high quality customer base, much of which is comprised of well-known industry leaders. We have longstanding relationships and technical partnerships with many of our key customers, and believe we are the preferred supplier for many of our key customers’ critical applications. Taken together, these factors constitute competitive advantages that support our leadership positions in the markets we serve.
We organize our operations into three segments: Long Division, Tubular Division, and Flat Division.
| • | Long Division:Our Long Division, based in Pueblo, Colorado, is the largest domestic United States producer of premium rail and the only rail producer in Western North America, a region that we believe accounted for a majority of North American rail demand in 2013. We operate an EAF furnace, round billet caster, and hot-rolling mills that produce rail, seamless pipe, and wire rod. As the only large consumer of scrap in Colorado, we believe that we enjoy a cost advantage on shredded scrap (our largest raw material by volume) compared to the industry benchmark for Midwest shredded scrap prices. In 2013, total sales volume for our Long Division was 983Kt. |
| • | Tubular Division: Our Tubular Division is the largest North American producer of LD Pipe, which is used in oil and gas transmission, and the only supplier of fully “Made in Canada” LD Pipe. We expect that development of oil sands and shale formations in Western Canada and the United States will lead to significant near term investments in infrastructure, including new pipelines, in order to access key energy markets. We are also the largest OCTG producer in Western Canada, where we operate the only OCTG heat treat line in the region. This gives us the ability to produce heat treated pipe typically required in the demanding non-conventional drilling applications used in shale and oil sands exploration. Our Tubular Division has sites in three regions: Saskatchewan, Alberta, and Oregon. In |
49
Table of Contents
Regina, Saskatchewan, our site consists of two EAFs and a slab caster that feeds a mill that primarily rolls slabs into coiled plate used in our pipe facilities. At this site we also operate four HSAW LD Pipe mills and two straight seam ERW mills. In Alberta, we operate sites in Calgary, Red Deer, and Camrose with a total of three straight seam ERW pipe mills, three API and two premium threading lines, a heat treat facility, and one LSAW LD Pipe mill. In Portland, Oregon, we operate two HSAW LD Pipe mills. In 2013, total sales volume for our Tubular Division was 1,023Kt. |
| • | Flat Division:Our Flat Division, based in Portland, Oregon, operates the only plate mill on the West Coast. Our proximity to deep water ports allows us to cost effectively source slabs from foreign suppliers. At this site we also operate a structural tube mill, a slitting line, and a quench and tempering facility for plate. In 2013, total sales volume for our Flat Division was 798Kt. |
We have a high degree of vertical integration across our operations that enhances operational efficiency, reduces logistics costs, and makes us less reliant on outside suppliers. Our recycling operations supply us with approximately a third of our scrap needs. We produce substantially all of the billets used in our rail, seamless, and wire rod mills. In 2013, we produced substantially all of the slab consumed at our Regina site and the coil and plate consumed by our tubular mills.
Summary of Financial Results
Unless otherwise indicated, any reference to income statement items in this Management’s Discussion and Analysis of Financial Condition and Results of Operations refers to results from continuing operations.
The following table summarizes selected financial and operating results for the nine months ended September 30, 2013 and 2014 and years ended December 31, 2011, 2012, and 2013.
| Nine Months Ended September 30, 2013 | Nine Months Ended September 30, 2014 | |||||||||||||||||||||||||||||||
| Total Tons Sold | Product Sales | Operating Income (loss) | Adjusted Operating Income(1) | Total Tons Sold | Product Sales | Operating Income | Adjusted Operating Income(1) | |||||||||||||||||||||||||
| ($ in millions, tons in thousands) | ||||||||||||||||||||||||||||||||
Long Division | 729 | $ | 648.3 | $ | 48.2 | $ | 78.8 | 765 | $ | 746.6 | $ | 69.8 | $ | 102.1 | ||||||||||||||||||
Tubular Division | 748 | 920.3 | (50.2 | ) | 17.0 | 850 | 1,063.3 | 5.5 | 68.2 | |||||||||||||||||||||||
Flat Division(2) | 580 | 501.6 | (7.2 | ) | 26.0 | 656 | 581.6 | 38.8 | 64.0 | |||||||||||||||||||||||
Intercompany eliminations | (206 | ) | (173.7 | ) | 3.4 | 5.3 | (195 | ) | (155.9 | ) | (1.6 | ) | 0.6 | |||||||||||||||||||
|
|
|
|
|
|
|
|
|
|
|
|
|
|
|
| |||||||||||||||||
Total | 1,851 | $ | 1,896.5 | $ | (5.8 | ) | $ | 127.1 | 2,076 | $ | 2,235.6 | $ | 112.5 | $ | 234.9 | |||||||||||||||||
|
|
|
|
|
|
|
|
|
|
|
|
|
|
|
| |||||||||||||||||
| Year Ended December 31, 2011 | Year Ended December 31, 2012 | |||||||||||||||||||||||||||||||
| Total Tons Sold | Product Sales | Operating Income (loss) | Adjusted Operating Income (loss)(1) | Total Tons Sold | Product Sales | Operating Income (loss) | Adjusted Operating Income(1) | |||||||||||||||||||||||||
| ($ in millions, tons in thousands) | ||||||||||||||||||||||||||||||||
Long Division | 946 | $ | 906.9 | $ | 128.6 | $ | 174.7 | 987 | $ | 907.0 | $ | 119.4 | $ | 161.6 | ||||||||||||||||||
Tubular Division | 1,021 | 1,376.5 | 83.9 | 183.2 | 1,018 | 1,342.0 | 53.5 | 144.6 | ||||||||||||||||||||||||
Flat Division(2) | 839 | 854.0 | 36.7 | 86.4 | 802 | 756.7 | (8.7 | ) | 38.0 | |||||||||||||||||||||||
Intercompany eliminations | (306 | ) | (240.8 | ) | (8.5 | ) | (6.4 | ) | (304 | ) | (237.2 | ) | 0.4 | 2.8 | ||||||||||||||||||
|
|
|
|
|
|
|
|
|
|
|
|
|
|
|
| |||||||||||||||||
Total | 2,500 | $ | 2,896.6 | $ | 240.7 | $ | 437.9 | 2,503 | $ | 2,768.5 | $ | 164.6 | $ | 347.0 | ||||||||||||||||||
|
|
|
|
|
|
|
|
|
|
|
|
|
|
|
| |||||||||||||||||
50
Table of Contents
| Year Ended December 31, 2013 | ||||||||||||||||
| Total Tons Sold | Product Sales | Operating Loss | Adjusted Operating Income (loss)(1) | |||||||||||||
| ($in millions, tons in thousands) | ||||||||||||||||
Long Division | 983 | $ | 870.1 | $ | (12.1 | ) | $ | 108.5 | ||||||||
Tubular Division | 1,023 | 1,276.6 | (105.0 | ) | 38.9 | |||||||||||
Flat Division(2) | 798 | 684.9 | (345.6 | ) | 33.1 | |||||||||||
Intercompany eliminations | (286 | ) | (246.7 | ) | (7.1 | ) | (4.5 | ) | ||||||||
|
|
|
|
|
|
|
| |||||||||
Total | 2,518 | $ | 2,584.9 | $ | (469.8 | ) | $ | 176.0 | ||||||||
|
|
|
|
|
|
|
| |||||||||
| (1) | Adjusted operating income (loss) is a non-GAAP financial measure. Refer to “Summary Consolidated Financial Information and Other Data—Adjusted operating income (loss)” for how we define and calculate Adjusted operating income (loss) and a reconciliation of operating income (loss) to Adjusted operating income (loss). |
| (2) | The results of our EVRAZ Claymont and EVRAZ Surrey operations, which were previously reported as part of the Flat Division, are being presented as discontinued operations in the consolidated statements of operations for all periods presented. See the notes to our consolidated financial statements included elsewhere in this prospectus for additional information regarding these discontinued operations. |
From 2011 through 2013, our average selling prices decreased by more than 11% while total tons sold increased by less than 1%. In 2013, we also experienced several operational events that decreased productivity and increased costs, as described further in “—Notable Events from January 1, 2011 through September 30, 2014.” In the nine months ended September 30, 2013, in part in response to these events, we launched a set of initiatives resulting in improved productivity and decreased costs in the same period of 2014.
Total product sales in the nine months ended September 30, 2014 increased by 18% compared to the same period in 2013. The primary driver of this improvement was a 12% increase in total tons sold due mainly to improved productivity in our Long and Tubular Divisions and recovering demand in our Flat Division. In our Long Division, we implemented investment projects in our rail and steelmaking facilities which resulted in higher rail production. In our Tubular Division, operational improvements in our OCTG and SD Pipe production facilities improved productivity resulting in improved mill availability, reduced costs, and reduced inventory write-downs. In our Flat Division, demand for coil used by our Tubular Division increased, which drove the increase in total tons sold (with intercompany sales being eliminated in consolidation). In addition, we experienced an overall average selling price improvement of 5% in the nine months ended September 30, 2014 compared to the same period in 2013.
Notable Events from January 1, 2011 through September 30, 2014
Operational
| • | In 2013, our operations experienced several events that we estimate decreased our operating income by approximately $63 million in that period. Of this $63 million, we estimate that approximately $45 million occurred in the nine months ended September 30, 2013. The decrease in operating income was primarily due to (1) a decline in OCTG productivity in our seamless pipe facility, (2) low priced imports forcing inventory liquidations of ERW OCTG pipe, (3) costs associated with the restart of our LD Pipe facilities in Portland and Camrose to service increasing demand, (4) a complex rail order for export, and (5) unplanned outages in steelmaking at Regina, Saskatchewan and Pueblo, Colorado. We did not experience events of a similar magnitude in other periods presented. |
Acquisitions and Divestitures
| • | On June 26, 2014, we sold the machinery and equipment, spare parts, and customer lists associated with our cut-to-length facility in Regina, Saskatchewan for total cash consideration of $7.4 million. |
51
Table of Contents
| • | On December 13, 2013, we sold our EVRAZ Surrey cut-to-length facility for total cash consideration of $12.7 million. As of December 31, 2013, EVRAZ Surrey cut-to-length facility is treated as discontinued operations and the related assets and liabilities are classified as held for sale for all periods presented up to December 31, 2012. |
| • | In September 2012, we acquired assets of a business consisting of two scrap yards in Colorado for $11.8 million, which enabled our recycling operations to supply a third of our scrap needs in 2013. |
Assets Impairment
| • | In 2013, we recognized a goodwill impairment loss of $336.1 million, $32.8 million, $77.5 million, and $22.2 million for the EVRAZ Portland, EVRAZ Portland Tubular, EVRAZ Pueblo Seamless, and EVRAZ Calgary reporting units, respectively. |
| • | As of December 31, 2013, we idled the EVRAZ Claymont reporting unit, which resulted in an assets impairment charge of $296.9 million. As of June 30, 2014, EVRAZ Claymont is treated as discontinued operations and the related assets and liabilities are classified as held for sale for all periods presented. |
| • | In December 2012, we recorded a goodwill impairment charge for EVRAZ Claymont of $90.9 million. |
Recent Developments
Mastercroft’s Contribution of EINA’s shares
On September 30, 2014, Mastercroft S.à r.l. distributed all of the shares of EINA held by Mastercroft S.à r.l., representing 63.5% of total outstanding shares of EINA, to EGSA. EGSA contributed these shares to us, such that we became the owner of 100% of the outstanding shares of EINA, in exchange for 656 of our ordinary shares. EGSA also contributed a portion of the shares it owned in EICA to us, such that we became the owner of 51% of EICA, in exchange for 302 of our ordinary shares.
NTMK contract
On August 21, 2014, we entered into two approximately 5-year contracts, pursuant to which we purchase slabs from NTMK at market rates. We do not have minimum purchase obligations under these contracts and may acquire slabs from third parties, which we consider to be readily available. See “Related Party Transactions.”
EVRAZ KGOK Subordinated Loans
In order to finance prior business acquisitions, we entered into a series of related party loans pursuant to which we borrowed amounts from certain EVRAZ Group members. On December 27, 2012, we repaid the remaining principal balance of our related-party notes to EVRAZ Group with the proceeds from two new Canadian dollar-denominated notes with EVRAZ KGOK, an EVRAZ Group subsidiary, Note 1 and Note 2. All terms of the related party loans remained substantially the same.
Loan Contract No. KGOK-EICA-01, dated December 27, 2012, between EVRAZ Inc. NA Canada and JSC EVRAZ Kachkanarsky Ore Mining and Processing Plant, or Note 1, was repaid in full in October 2014 with the proceeds of our new EVRAZ KGOK subordinated loan, Note 3.
Loan Contract No. KGOK-EICA-02, dated December 27, 2012, between EVRAZ Inc. NA Canada and JSC EVRAZ Kachkanarsky Ore Mining and Processing Plant, or Note 2, was repaid in November 2014 with the proceeds of the senior notes offered by our subsidiary EICA and with the proceeds of our new EVRAZ KGOK subordinated loan, Note 3.
52
Table of Contents
Loan Contract No. KGOK-EICA-03, dated October 13, 2014, as amended on November 5, 2014 by Addendum No. 1, between EVRAZ Inc. NA Canada and JSC EVRAZ Kachkanarsky Ore Mining and Processing Plant, or Note 3, is due June 30, 2020, and carries a fixed interest rate of 8.25%, and had a balance of CAD 500 million outstanding as of November 14, 2014.
Interest on the related-party loans is payable quarterly.
See “Related Party Transactions.”
7.5% $350 Million Senior Secured Notes due 2019
On November 7, 2014, our subsidiary, EICA, completed a private offering exempt from the registration requirements of the Securities Act of $350 million aggregate principal amount of 7.5% Senior Notes due 2019.
The notes are guaranteed on secured, senior basis by ENA, EINA and each of EINA’s and EICA’s respective subsidiaries that is a guarantor under the ABL Credit Facility subject to certain exceptions.
EICA used the net proceeds from the offering of the notes to repay a part of Note 2. See “Related Party Transactions.”
Acquisitions and Divestitures
On October 23, 2014, we sold the majority of above ground assets disclosed in our discontinued operations in EVRAZ Claymont, Delaware for a total cash consideration of $11.0 million.
Recent Trends and Outlook
Management believes the pricing increases experienced in the first nine months of 2014 will be sustained in the fourth quarter of the year and into 2015, supported by the continued improvement in the global and North American macroeconomic environment and recent and anticipated North American trade case rulings.
We expect that the continued exploration of the Canadian oil sands and shale formations will drive demand for our products. We expect that increased demand will result in an improved pricing environment. We also believe that Canadian pipeline projects will favor “Made in Canada” LD Pipe as we believe our customers value locally produced LD Pipe.
We also believe that the cost of scrap, a key raw material input to our steelmaking operations, will decrease in the future as a result of decreases in iron ore and coking coal prices.
Key Factors Affecting Results of Operations
Global and North American Economy
The global and North American economies have a significant impact on the business of our customers and thus impact all aspects of our business, including demand and pricing for our products. Although we supply our products mostly into the North American market, steel is a globally traded commodity and economic conditions outside of North America may impact our customers and the prices and availability of steel products in North America.
More than four years after the 2008-2009 global recession, the United States, Canada and the global markets are still recovering. The International Monetary Fund, or the IMF, projects global growth to be 3.3% in 2014 unchanged from 3.3% in 2013. The IMF projections indicate that the United States will deviate from this trend with an expected growth of 2.2% in 2014, unchanged from 2.2% in 2013. Canada is expected to grow 2.3% in 2014, compared to a growth rate of 2.0% in 2013. Also, the IMF projects that 2015 global, United States and Canadian growth rates will be 3.8%, 3.1% and 2.4%, respectively.
53
Table of Contents
Key Factors Affecting our Total Sales
Overview
Our total sales is a function of the volume of products that we sell and the price that we are able to achieve on our sales. Both are driven by the supply and demand balance for the types of products that we produce and also by the quality of our products.
Our ability to sell our products is affected by the global supply of steel and, in particular, supply of steel into the North American market from both domestic production and imports. The steel industry has at times been characterized by excess global capacity and supply. However, we believe that North American supply and demand of steel is better balanced than other parts of the world. Production capacity expansion is driven by growth, whether actual or perceived, in customer demand. In addition, steel freight costs can have a significant effect on steel producers’ revenues. Customers typically pay freight costs, making them a component of total product price, therefore affecting the price customers are willing to pay for the product itself.
We describe below factors affecting customer demand and industry supply for the different products that we produce and factors affecting the quality of our products as we consider these to be key drivers of our revenue.
Seasonality
Generally, our total sales are lower in the fourth quarter of our fiscal year than in the other three quarters, driven by fewer working days in November and December (as a result of holidays), more challenging shipping conditions due to winter weather, and year end inventory management by our customers.
Long Division
Customer Demand
Our Long Division produces rail, seamless OCTG, wire rod, and coiled rebar.
The marketplace for steel rails in North America is specialized and concentrated on a limited customer base, with nine Class I railroads served directly by rail producers and a larger number of customers in the transit and short line segment that are served largely through distributors. Railroads purchase rails in connection with maintaining existing track or track expansion.
Track maintenance is a crucial activity for railroads due to its impact on safety and track availability. Track maintenance accounts for most of the rail demand in the North American market and generally results in a stable demand for rail. The rate of rail repair and replacement depends on, among other factors, railcar axle load, frequency of use, the quality of the rail that is used by a railroad (premium rails generally last longer than standard rails), and performance of regular maintenance. North American railroads have been investing at record levels to address congested corridors with the railroads in Western North America typically having more traffic and greater congestion than the rest of the region. We believe that the anticipated improvement of general economic conditions and the expected growth of oil and gas production in North America will continue to underpin high levels of spending on track maintenance. We also believe that industry dynamics are accelerating the adoption of premium rail by our customers as premium rail provides better safety and longer life, particularly on demanding track sections. We expect that these trends will benefit us, as we are one of only three North American producers of premium deep head-hardened rails.
Congestion of existing corridors and new rail projects such as the HSR program in California (a part of the United States $10.1 billion stimulus funds for high-speed passenger rail) drive new track construction and upgrades to existing track. We believe that railroad congestion may drive construction of new double-track segments (where railroad tracks are built next to each other), in addition to increasing rail maintenance
54
Table of Contents
expenditures (as discussed above). In addition, we expect that the “Buy America” requirements of the HSR stimulus program will direct this demand towards domestic suppliers, such as us.
Our seamless OCTG is manufactured from billets that we produce exclusively at our Long Division’s facility in Colorado and is primarily sold in the United States to the oil and gas industry for use in exploration and production though various extraction techniques. Demand for these products follows energy exploration and production factors typical to the United States oil and gas industry.
Demand for wire rod and coiled rebar follows trends in the industrial, automotive, infrastructure, and construction industries. These industries are cyclical and follow overall economic conditions. We expect demand for wire rod to continue gaining strength as the economic recoveries in the United States and Canada continue and increased funding becomes available for projects to replace aging North American infrastructure.
Steel Supply
The North American rail market is served by both domestic producers and imports. Based on data from the American Iron and Steel Institute, or AISI, and trade statistics we estimate that domestic manufacturers supplied approximately 70% of North American apparent demand in 2013 with the balance being covered by imports.
The location of our facilities next to rail interchanges for Burlington Northern Santa Fe and Union Pacific railroads affords us freight and other logistical advantages that coupled with our premium rail makes our position in the market highly defensible. According to Trade Statistics of Japan Data, there was an increase of exports of Japanese rails to North America in 2013. We believe that lower iron ore prices and favorable exchange rates led to this increase. In addition Nippon Steel, a major Japanese producer of rails, has commissioned a new receiving port in Stockton, California, which once operational will provide it with a greater import capacity into North America.
In 2013, we faced increased competition from foreign-based manufacturers exporting OCTG into the United States with the consequence of downward pricing pressure and growth in industry inventory balances. On August 22, 2014, the U.S. International Trade Commission announced an affirmative injury determination in an OCTG case against six countries, including South Korea, imposing immediate duties for these countries (excluding Ukraine, where duties were suspended). We expect the imposition of duties will have a positive effect on North American OCTG pricing in the near term. A similar investigation has been initiated by the Canada Border Services Agency, or CBSA, into dumping and subsidization of OCTG in Canada from nine countries. A preliminary ruling is expected in December 2014.
In 2013 and the first half of 2014, North American supply of wire rod was characterized by high levels of imports from China. On September 2, 2014, the U.S. Commerce Department issued preliminary duties in an antidumping investigation of wire rod imports from China, ranging from 106.19% to 110.25% of the import price less insurance and freight. A final decision on the case is expected in December 2014.
Tubular Division
Customer Demand
Our Tubular Division produces welded LD Pipe, SD Pipe, and OCTG casing and tubing, all of which are used in the energy sector. The main customers of this division participate in the North American oil and gas industry. Our LD Pipe and SD Pipe products are used for oil and natural gas transmission, and our OCTG products are used in oil and natural gas exploration and production.
Demand for energy related Tubular products depends on several factors, most notably, the number of oil and natural gas wells being drilled, completed and re-worked, the depth and drilling conditions of these wells, and the drilling techniques utilized. The level of these activities depends primarily on the demand for natural gas and oil, and expectations about future prices for these energy sources.
55
Table of Contents
In recent years, the United States and Canada experienced rapid growth in oil and gas production as a result of extensive use of unconventional drilling technologies in shale formations and oil sands. As a result, North America is now the largest worldwide market for OCTG products, and is expected to continue to grow at approximately 5% CAGR between 2013 and 2020.
Many of the new oil and gas formations being exploited are in Western Canada where a lack of pipeline infrastructure increases transportation costs and limits oil and gas producers’ access to the more profitable markets. As a result, we expect an increase in new pipeline projects, which use both LD Pipe and SD Pipe. Oil and gas exploration and transmission is a politically sensitive and highly regulated industry. Each new drilling or transmission pipeline project typically requires governmental approval at the federal, state or provincial, and/or local levels which may be subject to many conditions.
The LD Pipe market has traditionally been characterized by long lead-times. We believe that such contracts provide us with an established volume of orders and pricing structure as well as a steady customer base.
Steel Supply
In the last eight years, new LD Pipe production capacity has been added in Texas, Mississippi, Arkansas, Alabama, and California in anticipation of future growth, creating significant current market overcapacity in North America. Our Tubular Division operated its LD Pipe facilities at approximately 61% utilization in 2013, and we estimate that other LD Pipe producers operated at approximately 26% utilization in 2013. We expect that the industry utilization rate will increase to 75% by 2017.
In 2012, global oversupply and high imports resulted in low domestic capacity utilization, which put downward pressure on the price of our products. US capacity utilization for OCTG was approximately 69% for 2013 and 67% in first quarter of 2014, according to the US International Trade Commission. Our capacity utilization in 2013 was 71%. Imported steel pipe represents a growing percentage of the OCTG market and may continue to impact OCTG pricing and competition for customer orders. For the past several years, we faced increased competition from foreign-based manufacturers that export OCTG pipe into the United States and Canada, resulting in downward pricing pressure and a growth in industry inventory balances. In July 2014, the Canada Border Services Agency, or CBSA, initiated an investigation into dumping and subsidization of OCTG in Canada from nine countries. A preliminary ruling is expected in December 2014. We also expect the US International Trade Commission’s August 22, 2014 OCTG ruling discussed in “—Long Division-Steel Supply” to similarly affect our Tubular Division’s OCTG products.
On October 16, 2014, eight producers of line pipe in the United States filed a petition with the U.S. Department of Commerce for the imposition of Antidumping and Countervailing Duties for Welded API Line Pipe from South Korea and Turkey, for products of 24” outside diameter and under. A preliminary determination of injury is expected in December 2014.
Flat Division
Customer Demand
Plate products are sold to a number of customers across heavy equipment, industrial, non-residential construction, infrastructure, rail rolling stock, marine and barge, and oil and gas end markets. Demand is affected by the overall trends in these industries along with regional factors.
The largest customers of our Flat Division are manufacturers of heavy equipment, railway rolling stock, heavy fabrications, as well as steel service centers.
We expect that the build-out of infrastructure, in particular, liquefied natural gas export terminals in the Pacific Northwest, will create additional upside for our Flat Division.
56
Table of Contents
Steel Supply
We are one of twelve plate manufacturers in the United States and the only mill located west of the Rocky Mountains. Net imports of plate (discrete and coiled) into the United States can account for up to 15% of the apparent demand in boom years according to AISI steel products monitor data, and drop rapidly when domestic capacity utilization falls.
Key Factors Affecting Costs
Set forth below is a discussion of factors affecting our costs, namely, procurement of slabs, scrap, pig iron, ferroalloys, and flux, which are the main raw materials that are used in our steelmaking operations.
Slabs
We typically purchase slabs at spot prices, although prices are sometimes set for periods of up to three months. Generally, spot prices of slabs follow the global supply and demand for plate and coil. In 2013, 65%, 32%, and 3% of our Flat Division purchases came from NTMK (related party), third parties and EVRAZ Regina (a subsidiary of the Company), respectively.
Scrap
As an EAF producer, steel scrap is among the most important components for our steel production and accounted for 28% of our cost of sales in 2013. Scrap is principally generated by end of life vehicles, demolition activity, and as a by-product of industrial production. The market for scrap is influenced by availability, freight costs, speculation by scrap brokers, and other conditions that are largely beyond our control. We obtain scrap from multiple external suppliers and from our recycling operations. Scrap processed by our recycling operations accounted for 35% of our total scrap needs in 2013.
Our recycling operations include scrap collection and processing facilities in several Canadian provinces and in Colorado and North Dakota. We acquire scrap from manufacturers of products made from steel, industrial plants, scrap dealers, peddlers, auto wreckers, and demolition firms and internally from scrap created by our mills in our production facilities. We purchase scrap at spot prices.
Due to our Pueblo and Regina mill locations, we are the only significant local buyer of scrap in these locations, which puts us in an advantageous bargaining position. In addition, our ownership of scrap yards allows us to better understand the scrap market and its pricing and to be a more informed buyer of scrap when we purchase it from third parties.
Pig Iron, Ferroalloys and Flux
Pig iron, ferroalloys, and flux accounted for 17% of the cost of raw material we consumed in our EAF in Pueblo, Colorado and Regina, Saskatchewan in 2013. We acquire pig iron and ferroalloys and flux at spot prices in the open market from a variety of suppliers. The cost of these materials is primarily driven by the worldwide supply and demand balance.
Other Operating Costs
Electricity
Electricity is a significant input required in our steelmaking operations and represented 3.5% of our cost of sales, excluding freight and other costs, in 2013. We do not have any long term obligations under our electricity supply agreements. In 2013, we consumed approximately 1.76 billion kilowatt hours of electricity across all of our facilities in North America.
57
Table of Contents
Natural Gas
Natural gas is used in all of our operating facilities and represented 1.3% of our cost of sales, excluding freight and other costs, in 2013. We do not have any long term obligations under our natural gas supply agreement. In 2013, we consumed approximately 8.6 million MMBTUs of natural gas.
Labor
Our labor costs directly impact our results of operations and are reflected in both our cost of sales and our selling, general, and administrative expenses. Labor costs represented 12% of our cost of sales, excluding freight and other costs, in 2013. Our labor costs primarily represent employee compensation costs paid to our personnel in the form of salary and wages and costs associated with our employee benefit plans. Salary and wages are driven by the size of our labor force and the labor market conditions in the jurisdictions in which we operate. Our labor costs for our unionized employees are in large part dependent on the relevant labor union agreements.
We maintain noncontributory defined benefit pension plans, post-retirement health care and life insurance benefit plans, and supplemental retirement plans that cover our eligible employees. Refer to the notes to our consolidated financial statements included elsewhere in this prospectus for further information.
Impact of Exchange Rate Movements
The reporting currency for our financial information is United States dollars. The functional currency of EVRAZ NORTH AMERICA LIMITED and our United States subsidiaries is the United States dollar. The functional currency of our Canadian subsidiaries is the Canadian dollar. Most of our assets, liabilities, sales, and results of operations are denominated in United States dollars or Canadian dollars. Accordingly, we have exposure to fluctuations in the values of the Canadian dollar relative to the United States dollar. The cash held for our Canadian subsidiaries was CAD 53.1 million as of December 31, 2013. During 2013, fluctuations in the average exchange rates of the United States dollar and Canadian dollar caused our profitability to decline by $4.0 million. We currently do not use hedging instruments to decrease our exposure to risks arising from foreign currency fluctuations.
Product Sales, Freight, and Total Sales
The cost of freight incurred to ship product to our customers is passed onto our customers and recorded as freight revenues (and included in our total sales line item) and freight cost of sales. Freight revenues are primarily influenced by the type of product shipped, cost of transportation, and the total volume shipped. We refer to our sales without freight as product sales. We refer to our product sales together with freight as total sales. Our average selling price is calculated based on product sales (excluding freight).
Capital Expenditures
We define our capital expenditures into two categories, capital expenditures associated with investment activity (Investment Projects) and capital expenditures associated with maintenance activity (Maintenance and Other). Investment projects aim to create value by increasing capacity, reducing production costs, or reducing risks related to health, safety, or environmental regulations. This may include building new operating facilities, spending capital on initiative to expand into new markets, or products to improve productivity and/or quality. Maintenance projects include the replacement and restoration of existing equipment, machinery, and/or components.
58
Table of Contents
Planned and Unplanned Facility Shutdowns
From time to time, we shut down a facility for planned engineering work to repair, replace, or perform maintenance work on our equipment. In addition, from time to time we experience unplanned equipment failures or outages. These shut downs may impact our results of operations as it is costly to shut down and restart our machinery. In addition, our production levels may be impacted by the related work stoppages.
In 2013, our business was impacted by unplanned outages, including significant outages in our Pueblo, Colorado (Long Division) and Regina, Saskatchewan (Tubular Division) steelmaking facilities. We estimate that these two unplanned outages resulted in approximately $3.2 million and $4.5 million of incremental cost, respectively.
Tax Impact of the Reorganization
We expect that the Reorganization will have no material impact on any of the periods under review.
Sanctions Related to Conflicts in Ukraine Imposed by the United States, Canada, and the European Union
To date, sanctions related to conflicts in Ukraine imposed by the United States, Canada, and the European Union have not had an impact on our business. Individual companies in the metals and mining industries in Russia have not been subject to sanctions in the United States or Canada. The nature of future sanctions, if any, related to conflicts in Ukraine are not known. In the future, additional sanctions that may be enacted by these or other governments could have an impact on our business.
59
Table of Contents
Analysis of Results of Operations
The following analysis is based on our consolidated historical financial statements for the periods indicated.
Nine Months Ended September 30, 2013 compared to the Nine Months Ended September 30, 2014
Consolidated Results
The following tables present our results of operations for the nine months ended September 30, 2013, as compared to the nine months ended September 30, 2014.
| For the nine months ended September 30, | ||||||||||||||||
| 2013 | 2014 | Change | Change | |||||||||||||
| ($ in millions, tons in thousands) | % | |||||||||||||||
Sales: | ||||||||||||||||
Product sales | $ | 1,896.5 | $ | 2,235.6 | $ | 339.1 | 18 | % | ||||||||
Freight | 113.6 | 123.2 | 9.6 | 8 | % | |||||||||||
|
|
|
|
|
|
|
| |||||||||
Total sales | 2,010.1 | 2,358.8 | 348.7 | 17 | % | |||||||||||
|
|
|
|
|
|
|
| |||||||||
Costs and expenses: | ||||||||||||||||
Cost of sales | 1,841.3 | 2,060.5 | 219.2 | 12 | % | |||||||||||
Selling, general and administrative expenses | 174.0 | 186.0 | 12.0 | 7 | % | |||||||||||
Loss (gain) on disposal of assets | 0.6 | (0.2 | ) | (0.8 | ) | (133 | %) | |||||||||
|
|
|
|
|
|
|
| |||||||||
Operating (loss) income | (5.8 | ) | 112.5 | 118.3 | N/M | |||||||||||
Other income (expense): | ||||||||||||||||
Interest expense | (9.9 | ) | (7.1 | ) | 2.8 | 28 | % | |||||||||
Related party interest expense | (43.2 | ) | (40.4 | ) | 2.8 | 6 | % | |||||||||
Dividend and interest income | 0.2 | 0.1 | (0.1 | ) | 50 | % | ||||||||||
Foreign exchange gain (loss) | 0.2 | (9.3 | ) | (9.5 | ) | N/M | ||||||||||
Other income, net | 1.2 | 3.4 | 2.2 | 183 | % | |||||||||||
|
|
|
|
|
|
|
| |||||||||
(Loss) income from continuing operations before income taxes | (57.3 | ) | 59.2 | 116.5 | 203 | % | ||||||||||
Income tax benefit | 52.2 | 6.4 | (45.8 | ) | (88 | %) | ||||||||||
|
|
|
|
|
|
|
| |||||||||
Net (Loss) income from continuing operations | (5.1 | ) | 65.6 | 70.7 | N/M | |||||||||||
Net loss from discontinued operations(1) | (22.7 | ) | (10.2 | ) | 12.5 | 55 | % | |||||||||
Less net loss (income) attributable to noncontrolling interest | 21.2 | (0.1 | ) | (21.1 | ) | (100 | %) | |||||||||
|
|
|
|
|
|
|
| |||||||||
Net (Loss) income attributable to EVRAZ NORTH AMERICA LIMITED | $ | (6.6 | ) | $ | 55.3 | $ | 61.9 | (938 | %) | |||||||
|
|
|
|
|
|
|
| |||||||||
Operating and Other Financial Data: | ||||||||||||||||
Tons sold | 1,851 | 2,076 | 225 | 12 | % | |||||||||||
Adjusted EBITDA(2) | $ | 127.1 | $ | 234.9 | $ | 107.8 | 85 | % | ||||||||
Capital Expenditures | $ | 66.6 | $ | 46.5 | $ | (20.1 | ) | (30 | %) | |||||||
Investment | $ | 29.0 | $ | 10.7 | $ | (18.3 | ) | (63 | %) | |||||||
Maintenance & other | $ | 37.6 | $ | 35.8 | $ | (1.8 | ) | (5 | %) | |||||||
| (1) | Discontinued operations consist of our EVRAZ Claymont and EVRAZ Surrey reporting units. |
| (2) | Adjusted EBITDA is a non-GAAP financial measure. Refer to “Summary Consolidated Financial Information and Other Data—Adjusted EBITDA” for information on how we define and calculate Adjusted EBITDA and a reconciliation of net income (loss) attributable to EVRAZ NORTH AMERICA LIMITED to Adjusted EBITDA. |
60
Table of Contents
Total sales
Total sales increased by 17%, from $2,010.1 million for the nine months ended September 30, 2013 to $2,358.8 million for the same period in 2014. This increase was due to a 12% increase in tons sold and a 5% increase in average selling price. The increase in product sales was driven by increases at our Long Division, Tubular Division and Flat Division of $98.3 million, $143.0 million, and $80.0 million, respectively (before total intercompany eliminations that increased by $17.8 million and an increase in freight of $9.6 million, period-over-period).
Total tons sold increased by approximately 12% from 1,851Kt for the nine months ended September 30, 2013 to 2,076Kt for the same period in 2014. The Long Division increased 36Kt, the Tubular Division 102Kt, and the Flat Division 76Kt, each primarily driven by the improved overall steel market conditions (before total intercompany eliminations that decreased by approximately 11Kt period-over-period).
The average sales price increased by 5%. On a period-over-period basis, Flat Division prices increased by 2%, Tubular Division prices increased by 2%, and Long Division prices increased by 10%. The increase in Long Division prices was primarily due to a favorable shift in our sales mix towards higher priced products.
Cost of sales
Cost of sales increased by 12%, from $1,841.3 million for the nine months ended September 30, 2013 to $2,060.5 million for the same period in 2014. The increase in the cost of sales was driven by increased sales volumes. The average cost per ton remained flat over the same period in 2013.
Operating income (loss)
Operating loss was $5.8 million in the nine months ended September 30, 2013 compared to operating income of $112.5 million in the nine months ended September 30, 2014. This change was the result of increased tons sold across all divisions as well as the operational improvements described in “—Notable Events from January 1, 2011 through September 30, 2014” that, according to management estimates increased our operating income by approximately $45 million period-over-period.
Interest expense & related party interest expense
Interest expense declined from $9.9 million for the nine months ended September 30, 2013 to $7.1 million for the same period in 2014, primarily due to lower average principal balances on our ABL Credit Facility.
Related party interest expense declined from $43.2 million for the nine months ended September 30, 2013 to $40.4 million for the same period in 2014, primarily due to the fluctuation in exchange rates between Canadian and United States dollars, affecting interest payments made under our then existing EVRAZ KGOK subordinated loans, which are denominated in Canadian dollars.
Income tax benefit from continuing operations
We had an income tax benefit from continuing operations for the nine months ended September 30, 2013 of $52.2 million, compared to an income tax benefit of $6.4 million for the same period in 2014. The decrease in income tax benefit resulted primarily from our operations generating a loss from continuing operations before income taxes of $57.3 million for the first nine months of 2013, compared to income from continuing operations before income taxes of $59.2 million for the first nine months of 2014.
Net loss from discontinued operations
From the first nine months of 2013 to the first nine months of 2014, the net loss from discontinued operations decreased by $12.5 million primarily driven by the idling of EVRAZ Claymont facility in December 2013.
61
Table of Contents
Net (loss) income attributable to EVRAZ NORTH AMERICA LIMITED
We reported a net loss attributable to EVRAZ NORTH AMERICA LIMITED of $6.6 million for the nine months ended September 30, 2013 compared to net income of $55.3 million for the same period in 2014, as a result of the factors discussed above.
Adjusted EBITDA
Our Adjusted EBITDA increased from $127.1 million for the nine months ended September 30, 2013 to $234.9 million for the same period in 2014 primarily due to increased tons sold and the operational improvements described above. Adjusted EBITDA is a non-GAAP financial measure. See “Summary Consolidated Financial Information and Other Data—Adjusted EBITDA” for information on how we define and calculate Adjusted EBITDA and for a reconciliation of net income (loss) attributable to the shareholders EVRAZ NORTH AMERICA LIMITED to Adjusted EBITDA.
Capital expenditures
Capital expenditures decreased by 30%, from $66.6 million for the nine months ended September 30, 2013 to $46.5 million for the same period in 2014. The decrease was related to investment projects that were either completed or had a majority of their spending take place during 2013 and the overall timing of spending on maintenance. With respect to investment projects, first nine months 2013 spending was driven by the purchase of double jointing equipment to improve productivity of our Portland spiral LD Pipe facility, the second Red Deer premium threading project for the Tubular Division to increase threading capacity for premium connections, and the rail mill investment project for the Long Division, which focused on quality improvements, increasing capacity, and expanding customer technical support and product development.
Segment Reporting
The following table presents product sales, operating income (loss), and Adjusted operating income as well as total tons sold for the nine months ended September 30, 2013 and 2014 for each of our segments.
| Nine Months Ended September 30, 2013 | Nine Months Ended September 30, 2014 | |||||||||||||||||||||||||||||||
| Total Tons Sold | Product Sales | Operating Income (loss) | Adjusted Operating Income(1) | Total Tons Sold | Product Sales | Operating Income | Adjusted Operating Income(1) | |||||||||||||||||||||||||
| ($ in millions, tons in thousands) | ||||||||||||||||||||||||||||||||
Long Division | 729 | $ | 648.3 | $ | 48.2 | $ | 78.8 | 765 | $ | 746.6 | $ | 69.8 | $ | 102.1 | ||||||||||||||||||
Tubular Division | 748 | 920.3 | (50.2 | ) | 17.0 | 850 | 1,063.3 | 5.5 | 68.2 | |||||||||||||||||||||||
Flat Division(2) | 580 | 501.6 | (7.2 | ) | 26.0 | 656 | 581.6 | 38.8 | 64.0 | |||||||||||||||||||||||
Intercompany eliminations | (206 | ) | (173.7 | ) | 3.4 | 5.3 | (195 | ) | (155.9 | ) | (1.6 | ) | 0.6 | |||||||||||||||||||
|
|
|
|
|
|
|
|
|
|
|
|
|
|
|
| |||||||||||||||||
Total | 1,851 | $ | 1,896.5 | $ | (5.8 | ) | $ | 127.1 | 2,076 | $ | 2,235.6 | $ | 112.5 | $ | 234.9 | |||||||||||||||||
|
|
|
|
|
|
|
|
|
|
|
|
|
|
|
| |||||||||||||||||
| (1) | Adjusted operating income (loss) is a non-GAAP financial measure. See “Summary Consolidated Financial Information and Other Data—Adjusted operating income (loss)” for information on how we define and calculate Adjusted operating income and a reconciliation of operating income (loss) to Adjusted operating income. |
| (2) | The results of our EVRAZ Claymont and EVRAZ Surrey operations, which were previously reported as part of the Flat Division, are being presented as discontinued operations in the consolidated statements of operations for all periods presented. See the notes to our consolidated financial statements included elsewhere in this prospectus for additional information regarding these discontinued operations. |
62
Table of Contents
The following table presents our total capital expenditures separated into two categories: investment activities and maintenance and other activities, for the nine months ended September 30, 2013 and 2014 for each of our segments.
| Nine Months Ended September 30, | ||||||||||||||||||||||||
| 2013 | 2014 | 2013 | 2014 | 2013 | 2014 | |||||||||||||||||||
| Total Capital Expenditures | Investment | Maintenance & Other | ||||||||||||||||||||||
| ($ in millions) | ||||||||||||||||||||||||
Long Division | $ | 28.0 | $ | 21.2 | $ | 15.3 | $ | 7.6 | $ | 12.7 | $ | 13.6 | ||||||||||||
Tubular Division | 28.9 | 18.4 | 13.5 | 3.1 | 15.4 | 15.3 | ||||||||||||||||||
Flat Division(1) | 8.1 | 4.3 | — | — | 8.1 | 4.3 | ||||||||||||||||||
Corporate(2) | 1.6 | 2.6 | 0.2 | — | 1.4 | 2.6 | ||||||||||||||||||
|
|
|
|
|
|
|
|
|
|
|
| |||||||||||||
Total | $ | 66.6 | $ | 46.5 | $ | 29.0 | $ | 10.7 | $ | 37.6 | $ | 35.8 | ||||||||||||
|
|
|
|
|
|
|
|
|
|
|
| |||||||||||||
| (1) | The results of our EVRAZ Claymont and EVRAZ Surrey operations, which were previously reported as part of the Flat Division, are being presented as discontinued operations in the consolidated statements of operations for all periods presented. See the notes to our consolidated financial statements included elsewhere in this prospectus for additional information regarding these discontinued operations. |
| (2) | Corporate refers to centralized information technology functions, safety, finance, and similar activities which we do not allocate to any of our operating segments. |
Long Division
Product sales of our Long Division increased by 15%, from $648.3 million for the nine months ended September 30, 2013 to $746.6 million for the same period in 2014. The increase was due to a 5% increase in tons sold and a 10% increase in average selling price.
Total tons sold increased from 729Kt to 765Kt, or by 5%, period-over-period due to a capacity increase in 2014 resulting from the implementation of the rail mill and steelmaking investment projects. The rail mill investment project focused on quality improvements, increasing capacity, and expanding customer technical support and product development. The steelmaking investment project focused on increasing billet production and improving billet quality. Additionally, volumes in 2013 were lower due to disruptions caused by a complex rail order for export.
The average selling price per ton increased from $889 for the nine months ended September 30, 2013 to $977 for the same period in 2014, an increase of 10%, due to a more favorable product mix (in particular, a shift towards premium rail instead of standard rail) and pricing increases for wire rod and seamless products driven by improved market conditions.
Operating income and Adjusted operating income increased from $48.2 million and $78.8 million, respectively, for the nine months ended September 30, 2013 to $69.8 million and $102.1 million, respectively, for the same period in 2014. The improved results of our Long Division in the nine months ended September 30, 2014 were due to higher average selling price and tons sold. Volumes in the nine months ended September 30, 2013 were negatively affected by unplanned outages and a complex rail order for export. In addition, our operating income in the nine months ended September 30, 2014 benefited from the increase in OCTG production as a result of operational improvements.
Capital expenditures decreased from $28.0 million for the nine months ended September 30, 2013 to $21.2 million for the same period in 2014 due to the timing of maintenance spending as well as decreases in spending on the EVRAZ Pueblo, Colorado rail mill investment project the majority of which occurred in 2013.
63
Table of Contents
Tubular Division
Product sales for the Tubular Division increased by 16% from $920.3 million for the nine months ended September 30, 2013 to $1,063.3 million for the same period in 2014. This increase was mainly due to a 14% increase in tons sold and approximately a 2% increase in average selling price.
Total tons sold increased from 748Kt to 850Kt, or by 14%, period-over-period driven by increased sales of OCTG and SD Pipe products.
The average selling price per ton increased from $1,231 for the nine months ended September 30, 2013 to $1,252 for the same period in 2014, an increase of 2%, primarily due to increased LD Pipe selling prices, up 5%, partially offset by lower pricing for OCTG and SD Pipe, down 6% and 4%, respectively.
Operating loss for the nine months ended September 30, 2013 was $50.2 million compared to an operating income of $5.5 million for the same period in 2014. Adjusted operating income increased from $17.0 million for the nine months ended September 30, 2013 to $68.2 million for the same period in 2014. These changes were due to higher total sales and operational improvements, primarily in our OCTG and LD Pipe production facilities. The results of our Tubular Division were affected by inventory liquidations, re-start costs at our LD Pipe facilities in Portland and Camrose, and an unplanned outage at our EVRAZ Regina steelmaking facility, experienced in the nine months ended September 30, 2013 and not repeated in the same period in 2014; and the improved operational efficiencies in 2014.
Capital expenditures decreased from $28.9 million for the nine months ended September 30, 2013 to $18.4 million for the same period in 2014 due to timing of spending for maintenance capital expenditures as well as investment projects that were either completed (Portland Spiral Double Jointer project), or had a majority of their spending take place in 2013 (Red Deer Premium Threading project).
Flat Division
Product sales for the Flat Division increased by 16%, from $501.6 million for the nine months ended September 30, 2013 to $581.6 million for the same period in 2014. This increase was due to a 13% increase in tons sold and approximately a 3% increase in average selling prices.
Total tons sold increased by 13% from 580Kt to 656Kt period-over-period due to increased demand for coil from our Tubular Division (with these sales being eliminated at the consolidated level).
The average selling price per ton increased by approximately a 3%, from $866 per ton for the nine months ended September 30, 2013 to $887 per ton for the nine months ended September 30, 2014. Increased coil tons sold to our Tubular Division partially offset the 6% increase in average selling price of plate period-over-period.
Operating loss for the nine months ended September 30, 2013 was $7.2 million compared to an operating income of $38.8 million for the same period in 2014. Adjusted operating income increased from $26.0 million for the nine months ended September 30, 2013 to $64.0 million for the same period in 2014. The increases in operating income and Adjusted operating income were primarily due to higher sales volumes and lower raw material costs.
Capital expenditures decreased from $8.1 million in the nine months ended September 30, 2013 to $4.3 million for the same period in 2014 due to timing on spending for maintenance capital expenditures.
64
Table of Contents
Year Ended December 31, 2012 compared to Year Ended December 31, 2013
Consolidated Results
The following table presents our results of operations for the year ended December 31, 2012, as compared to the year ended December 31, 2013.
| Year ended December 31, | ||||||||||||||||
| 2012 | 2013 | Change | Change | |||||||||||||
| ($ in millions, tons in thousands) | % | |||||||||||||||
Sales: | ||||||||||||||||
Product sales | $ | 2,768.5 | $ | 2,584.9 | $ | (183.6 | ) | (7 | %) | |||||||
Freight | 135.9 | 164.0 | 28.1 | 21 | % | |||||||||||
|
|
|
|
|
|
|
| |||||||||
Total sales | 2,904.4 | 2,748.9 | (155.5 | ) | (5 | %) | ||||||||||
|
|
|
|
|
|
|
| |||||||||
Costs and expenses: | ||||||||||||||||
Cost of sales | 2,505.2 | 2,513.0 | 7.8 | 0 | % | |||||||||||
Selling, general and administrative expenses | 232.3 | 235.5 | 3.2 | 1 | % | |||||||||||
Impairment of assets | — | 468.6 | 468.6 | 100 | % | |||||||||||
Loss on disposal of assets | 2.3 | 1.6 | (0.7 | ) | (30 | %) | ||||||||||
|
|
|
|
|
|
|
| |||||||||
Operating income (loss) | 164.6 | (469.8 | ) | (634.4 | ) | (385 | %) | |||||||||
Other income (expense): | ||||||||||||||||
Interest expense | (9.9 | ) | (13.2 | ) | (3.3 | ) | (33 | %) | ||||||||
Related party interest expense | (52.1 | ) | (57.4 | ) | (5.3 | ) | (10 | %) | ||||||||
Dividend and interest income | 0.2 | 0.1 | (0.1 | ) | (50 | %) | ||||||||||
Foreign exchange gain (loss) | 15.7 | (4.0 | ) | (19.7 | ) | (125 | %) | |||||||||
Other income, net | 2.8 | 2.2 | (0.6 | ) | (21 | %) | ||||||||||
|
|
|
|
|
|
|
| |||||||||
Income (loss) from continuing operations before income taxes | 121.3 | (542.1 | ) | (663.4 | ) | (547 | %) | |||||||||
Income tax benefit | 13.6 | 52.8 | 39.2 | 288 | % | |||||||||||
|
|
|
|
|
|
|
| |||||||||
Net income (loss) from continuing operations | 134.9 | (489.3 | ) | (624.2 | ) | (463 | %) | |||||||||
Net loss from discontinued operations(1) | (101.1 | ) | (270.2 | ) | (169.1 | ) | (167 | %) | ||||||||
Less net (income) loss attributable to non-controlling interest | (19.2 | ) | 50.2 | 69.4 | 361 | % | ||||||||||
|
|
|
|
|
|
|
| |||||||||
Net income (loss) attributable to EVRAZ NORTH AMERICA LIMITED | $ | 14.6 | $ | (709.3 | ) | $ | (723.9 | ) | N/M | |||||||
|
|
|
|
|
|
|
| |||||||||
Operating and Other Financial Data: | ||||||||||||||||
Tons sold | 2,503 | 2,518 | 15 | 1 | % | |||||||||||
Adjusted EBITDA(2) | $ | 347.0 | $ | 176.0 | $ | (171.0 | ) | (49 | %) | |||||||
Capital Expenditures | $ | 67.3 | $ | 84.2 | $ | 16.9 | 25 | % | ||||||||
Investment | $ | 18.2 | $ | 37.4 | $ | 19.2 | 106 | % | ||||||||
Maintenance & other | $ | 49.1 | $ | 46.8 | $ | (2.3 | ) | (5 | %) | |||||||
| (1) | Discontinued operations consist of our EVRAZ Claymont and EVRAZ Surrey reporting units. |
| (2) | Adjusted EBITDA is a non-GAAP financial measure. Refer to “Summary Consolidated Financial Information and Other Data—Adjusted EBITDA” for how we define and calculate Adjusted EBITDA and a reconciliation of Adjusted EBITDA to net income (loss) attributable to EVRAZ NORTH AMERICA LIMITED. |
Total sales
Total sales declined by 5% from $2,904.4 million in 2012 to $2,748.9 million in 2013. The decline was due to a 7% decrease in average selling price which was partially offset by less than a 1% increase in tons sold. The decline in total sales was driven by a decline in product sales at Long, Tubular, and Flat Divisions of $36.9 million, $65.4 million, and $71.8 million, respectively (before total intercompany eliminations that increased by $9.5 million and by an increase in freight revenues of $28.1 million). Total tons sold increased from 2,503Kt in 2012 to 2,518Kt in 2013, or less than 1%.
65
Table of Contents
The average selling price per ton declined from $1,106 to $1,027, or by 7%, on a year-over-year basis. The decline in average selling price per ton was experienced across all divisions and driven by pricing pressure from increased imported steel products as well as shifts in our product sales mix.
Cost of sales
Cost of sales remained relatively constant on a year-over-year basis, increasing by less than 1%, from $2,505.2 million in 2012 to $2,513.0 million in 2013.
Impairment of assets
In 2013, we recognized a goodwill impairment charge of $336.1 million, $32.8 million, $77.5 million, and $22.2 million for the EVRAZ Portland Steel, EVRAZ Portland Tubular, EVRAZ Pueblo Seamless, and EVRAZ Calgary units, respectively. We did not recognize any impairment charges from continuing operations in 2012.
Operating income (loss)
Operating income decreased from $164.6 million in 2012 to an operating loss of $469.8 million in 2013 primarily due to the recognition of goodwill impairment charges of $468.6 million and the decline in selling price across all divisions. In 2013, our operations experienced several events described in “—Notable Events from January 1, 2011 through September 30, 2014,” which, according to management estimates, decreased our operating income by approximately $63 million.
Interest expense & related party interest expense
Interest expense in 2012 was $9.9 million compared to $13.2 million in 2013. During 2013, interest expense increased by $3.3 million primarily due to higher average principal balances on our ABL Credit Facility.
Related party interest expense in 2012 was $52.1 million compared to $57.4 million in 2013. Total related party interest expense increased by $5.3 million from 2012 to 2013 primarily due to higher average interest rates and average principal balances on loans from EVRAZ KGOK. This increase was partially offset by a depreciation of the Canadian dollar.
Foreign exchange gain (loss)
We experienced a foreign exchange gain of $15.7 million in 2012 compared to a foreign exchange loss of $4.0 million in 2013. In December 2012, our $560 million debt from EGSA (which was denominated in United States dollars) was replaced with two notes (Note 1 and Note 2, representing loans to EVRAZ KGOK) which are denominated in Canadian dollars. As a result, our foreign exchange gain (loss) was significantly impacted on a year-over-year basis due to this reduced exposure to United States dollars by EICA (with EICA’s functional currency being Canadian dollars).
Income tax benefit
The income tax benefit in 2012 was $13.6 million compared to $52.8 million in 2013 primarily due to changes in our income (loss) before income taxes.
Net loss from discontinued operations
From 2012 to 2013, the loss from discontinued operations increased by $169.1 million (from $101.1 million in 2012 to $270.2 million in 2013) primarily due to lower total sales by our EVRAZ Claymont site, driven by lower prices as a result of increased competition. We recorded a goodwill impairment charge of $90.9 million in
66
Table of Contents
2012 and an assets impairment charge of $296.9 million in 2013 for the EVRAZ Claymont site. The impairment charge in 2013 for EVRAZ Claymont followed our decision to indefinitely idle the mill. In addition, in 2013 we recorded an asset impairment charge of $24.6 million for our EVRAZ Surrey site that was sold in December 2013. Decreases in sales and increases in impairment charges period-over-period were partially offset by income tax benefit.
Net income (loss) attributable to EVRAZ NORTH AMERICA LIMITED
We reported a net income attributable to EVRAZ NORTH AMERICA LIMITED of $14.6 million in 2012 and a net loss attributable to EVRAZ NORTH AMERICA LIMITED of $709.3 million in 2013, as a result of the factors discussed above.
Adjusted EBITDA
Our Adjusted EBITDA decreased from $347.0 million in 2012 to $176.0 million in 2013, primarily driven by lower sales due to decline in average selling prices across all divisions. Adjusted EBITDA is a non-GAAP financial measure. Refer to “Summary Consolidated Financial Information and Other Data—Adjusted EBITDA” for information on how we define and calculate Adjusted EBITDA and for a reconciliation of Adjusted EBITDA to net income (loss) from continuing operations. In 2013, our operations experienced several events described in “—Notable Events from January 1, 2011 through September 30, 2014.”
Capital expenditures
Capital expenditures increased from $67.3 million in 2012 to $84.2 million in 2013 as a result of increased spending on investment projects for the rail mill (focused on quality improvements, increasing capacity, and expanding customer technical support and product development) and steel making (focused on increasing billet production and improving billet quality) in the Long Division as well as premium threading (the addition of a second premium threading line at our Red Deer site) and the installation of double jointer equipment at our LD Pipe mill in Portland (resulting in yield improvement) in the Tubular Division.
Segment Reporting
The following table presents our product sales, operating income (loss), and Adjusted operating income (loss), as well as total tons sold for the years ended December 31, 2012 and 2013 for each of our segments.
| Year Ended December 31, 2012 | Year Ended December 31, 2013 | |||||||||||||||||||||||||||||||
| Total Tons Sold | Product Sales | Operating Income (loss) | Adjusted Operating Income(1) | Total Tons Sold | Product Sales | Operating Loss | Adjusted Operating Income (loss)(1) | |||||||||||||||||||||||||
| ($ in millions, tons in thousands) | ||||||||||||||||||||||||||||||||
Long Division | 987 | $ | 907.0 | $ | 119.4 | $ | 161.6 | 983 | $ | 870.1 | $ | (12.1 | ) | $ | 108.5 | |||||||||||||||||
Tubular Division | 1,018 | 1,342.0 | 53.5 | 144.6 | 1,023 | 1,276.6 | (105.0 | ) | 38.9 | |||||||||||||||||||||||
Flat Division(2) | 802 | 756.7 | (8.7 | ) | 38.0 | 798 | 684.9 | (345.6 | ) | 33.1 | ||||||||||||||||||||||
Intercompany Eliminations/Other | (304 | ) | (237.2 | ) | 0.4 | 2.8 | (286 | ) | (246.7 | ) | (7.1 | ) | (4.5 | ) | ||||||||||||||||||
|
|
|
|
|
|
|
|
|
|
|
|
|
|
|
| |||||||||||||||||
Total | 2,503 | $ | 2,768.5 | $ | 164.6 | $ | 347.0 | 2,518 | $ | 2,584.9 | $ | (469.8 | ) | $ | 176.0 | |||||||||||||||||
|
|
|
|
|
|
|
|
|
|
|
|
|
|
|
| |||||||||||||||||
| (1) | Adjusted operating income (loss) is a non-GAAP financial measure. Refer to “Summary Consolidated Financial Information and Other Data – Adjusted operating income (loss)” for information on how we define and calculate Adjusted operating income (loss) and a reconciliation of Adjusted operating income (loss) to operating income (loss). |
| (2) | The results of our EVRAZ Claymont and EVRAZ Surrey operations, which were previously reported as part of the Flat Division, are being presented as discontinued operations in the consolidated statements of operations for all periods presented. See the notes to our consolidated financial statements included elsewhere in this prospectus for additional information regarding these discontinued operations. |
67
Table of Contents
The following table presents our total capital expenditures, separated into two categories: investment activities and maintenance and other activities, for the years ended December 31, 2012 and 2013 for each of our segments.
| Year Ended December 31, | ||||||||||||||||||||||||
| 2012 | 2013 | 2012 | 2013 | 2012 | 2013 | |||||||||||||||||||
| Total Capital Expenditures | Investment | Maintenance & Other | ||||||||||||||||||||||
| ($ in millions) | ||||||||||||||||||||||||
Long Division | $ | 31.8 | $ | 37.4 | $ | 15.7 | $ | 20.1 | $ | 16.1 | $ | 17.3 | ||||||||||||
Tubular Division | 23.0 | 35.8 | 2.2 | 16.9 | 20.8 | 18.9 | ||||||||||||||||||
Flat Division(1) | 11.0 | 9.3 | 0.2 | 0.1 | 10.8 | 9.2 | ||||||||||||||||||
Corporate(2) | 1.5 | 1.7 | 0.1 | 0.3 | 1.4 | 1.4 | ||||||||||||||||||
|
|
|
|
|
|
|
|
|
|
|
| |||||||||||||
Total | $ | 67.3 | $ | 84.2 | $ | 18.2 | $ | 37.4 | $ | 49.1 | $ | 46.8 | ||||||||||||
|
|
|
|
|
|
|
|
|
|
|
| |||||||||||||
| (1) | The results of our EVRAZ Claymont and EVRAZ Surrey operations, which were previously reported as part of the Flat Division, are being presented as discontinued operations in the consolidated statements of operations for all periods presented. See the notes to our consolidated financial statements included elsewhere in this prospectus for additional information regarding these discontinued operations. |
| (2) | Corporate refers to centralized information technology functions, safety, finance, and similar activities which we do not allocate to any of our operating segments. |
Long Division
Product sales of our Long Division declined by 4% from $907.0 million in 2012 to $870.1 million in 2013. The decrease was mainly due to a 4% decrease in average selling price. Total tons sold remained relatively stable between periods decreasing less than 1%, from 987Kt in 2012 to 983Kt in 2013.
The average selling price per ton declined from $919 to $885, or by 4%, on a year-over-year basis. The decline in average selling price per ton was a result of a less favorable product mix and increased competition from imports of wire rod and seamless pipe resulting in selling price decreases for those products of 9% in each period.
Operating income decreased from $119.4 million in 2012 to an operating loss of $12.1 million in 2013 due to the pricing factors discussed above as well as the recognition of a goodwill impairment charge of $77.5 million in 2013 related to our seamless facility. We did not record any impairment charge at our Long Division in 2012. Our Adjusted operating income decreased from $161.6 million in 2012 to $108.5 million in 2013. The decline in results of our Long Division in 2013 was due to lower average selling price and tons sold; both of which were attributed, in part, to unplanned outages, a complex rail order for export in 2013 and operational issues in our seamless mill, that were not present in 2012.
Capital expenditures increased from $31.8 million in 2012 to $37.4 million in 2013 primarily due to spending in 2013 on the steelmaking investment project which focused on increasing billet production and improving billet quality.
Tubular Division
Product sales of our Tubular Division declined by 5%, from $1,342.0 million in 2012 to $1,276.6 million in 2013. The decrease was mainly due to a 5% decrease in average selling prices. Total tons sold over the periods stayed relatively constant, increasing less than 1%, from 1,018Kt in 2012 to 1,023Kt in 2013. OCTG, SD Pipe, and other volumes declined 208Kt due to market pressures from imports, offset by increased LD Pipe volume of 213Kt.
The average selling price per ton declined from $1,318 to $1,248 period-over-period, or by 5%, primarily due to pricing pressures on our SD Pipe (down 14%) and OCTG products (down 13%), driven by increased imports of these products from Asia and, in particular, South Korea.
68
Table of Contents
Operating income decreased from $53.5 million in 2012 to an operating loss of $105.0 million in 2013 due primarily to reduced sales (driven by lower prices) as well as goodwill impairment charges for EVRAZ Portland Tubular and EVRAZ Calgary sites of $32.8 million and $22.2 million, respectively. We did not record any impairments in the Tubular Division in 2012. The results of our Tubular Division were affected by inventory liquidations and re-start costs at our LD Pipe facilities in Portland and Camrose and unplanned outages at our Regina steelmaking facility, which were experienced in 2013 and not in 2012.
Adjusted operating income decreased from $144.6 million in 2012 to $38.9 million in 2013 due primarily to the factors described above.
Capital expenditures increased from $23.0 million in 2012 to $35.8 million in 2013 primarily due to increased spending attributable to the addition of a second premium thread line at our Red Deer site and the installation of double jointer equipment in the LD Pipe facility in Portland.
Flat Division
Product sales of our Flat Division declined by 10% from $756.7 million in 2012 to $684.9 million in 2013. The decrease was mainly due to a 9% decrease in average selling price. Tons sold remained relatively stable over the same period, decreasing by approximately 1%, from 802Kt in 2012 to 798Kt in 2013.
The average sales price per ton declined from $944 per ton to $858, or by 9% due to import pressures and market softening.
Operating losses increased from $8.7 million in 2012 to $345.6 million in 2013 primarily due to the recognition of $336.1 million of goodwill impairment charges in 2013 for the EVRAZ Portland reporting unit. Additionally, product sales declined, which was partially offset by decreased raw material costs and operational improvements. We did not record any impairment charges at our Flat Division in 2012.
Adjusted operating income decreased from $38.0 million in 2012 to $33.1 million in 2013 due to lower product sales, partially offset by decreased raw material and costs and operational improvements.
Capital expenditures decreased from $11.0 million in 2012 to $9.3 million in 2013 primarily due to decreased maintenance spending.
69
Table of Contents
Year Ended December 31, 2011 compared to Year Ended December 31, 2012
Consolidated Results
The following table presents our results of operations for the year ended December 31, 2011, as compared to the year ended December 31, 2012.
| Year ended December 31, | ||||||||||||||||
| 2011 | 2012 | Change | Change | |||||||||||||
| ($ in millions, tons in thousands) | % | |||||||||||||||
Sales: | ||||||||||||||||
Product sales | $ | 2,896.6 | $ | 2,768.5 | $ | (128.1 | ) | (4 | %) | |||||||
Freight | 150.5 | 135.9 | (14.6 | ) | (10 | %) | ||||||||||
|
|
|
|
|
|
|
| |||||||||
Total sales | 3,047.1 | 2,904.4 | (142.7 | ) | (5 | %) | ||||||||||
|
|
|
|
|
|
|
| |||||||||
Costs and expenses: | ||||||||||||||||
Cost of sales | 2,576.7 | 2,505.2 | (71.5 | ) | (3 | %) | ||||||||||
Selling, general and administrative expenses | 230.2 | 232.3 | 2.1 | 1 | % | |||||||||||
(Gain)/Loss on disposal of assets | (0.5 | ) | 2.3 | 2.8 | 560 | % | ||||||||||
|
|
|
|
|
|
|
| |||||||||
Operating income | 240.7 | 164.6 | (76.1 | ) | (32 | %) | ||||||||||
Other income (expense): | ||||||||||||||||
Interest expense | (15.9 | ) | (9.9 | ) | 6.0 | 38 | % | |||||||||
Related party interest expense | (80.6 | ) | (52.1 | ) | 28.5 | 35 | % | |||||||||
Dividend and interest income | 0.2 | 0.2 | 0.0 | 0 | % | |||||||||||
Foreign exchange (loss) gain | (12.3 | ) | 15.7 | 28.0 | 228 | % | ||||||||||
Loss on extinguishment of debt | (6.3 | ) | — | 6.3 | 100 | % | ||||||||||
Other income, net | 5.0 | 2.8 | (2.2 | ) | (44 | %) | ||||||||||
|
|
|
|
|
|
|
| |||||||||
Income from continuing operations before income taxes | 130.8 | 121.3 | (9.5 | ) | (7 | %) | ||||||||||
Income tax benefit | 5.5 | 13.6 | 8.1 | 147 | % | |||||||||||
|
|
|
|
|
|
|
| |||||||||
Income from continuing operations | 136.3 | 134.9 | (1.4 | ) | (1 | %) | ||||||||||
Net income (loss) from discontinued operations(1) | 9.7 | (101.1 | ) | (110.8 | ) | N/M | ||||||||||
Less net income attributable to non-controlling interest | (3.6 | ) | (19.2 | ) | (15.6 | ) | (433 | %) | ||||||||
|
|
|
|
|
|
|
| |||||||||
Net income attributable to EVRAZ NORTH AMERICA LIMITED | $ | 142.4 | $ | 14.6 | $ | (127.8 | ) | $ | (90 | %) | ||||||
|
|
|
|
|
|
|
| |||||||||
Operating and Other Financial Data: | ||||||||||||||||
Tons sold | 2,500 | 2,503 | 3 | 0 | % | |||||||||||
Adjusted EBITDA(2) | $ | 437.9 | $ | 347.0 | $ | (90.9 | ) | (21 | %) | |||||||
Capital Expenditures | $ | 59.1 | $ | 67.3 | $ | 8.2 | 14 | % | ||||||||
Investment | $ | 10.6 | $ | 18.2 | $ | 7.6 | 72 | % | ||||||||
Maintenance & other | $ | 48.5 | $ | 49.1 | $ | 0.6 | 1 | % | ||||||||
| (1) | Discontinued operations consist of our EVRAZ Claymont and EVRAZ Surrey reporting units. |
| (2) | Adjusted EBITDA is a non-GAAP financial measure. See “Summary Consolidated Financial Information and Other Data—Adjusted EBITDA” for information on how we define and calculate Adjusted EBITDA and a reconciliation of Adjusted EBITDA to net income (loss) attributable to EVRAZ NORTH AMERICA LIMITED. |
Total sales
Total sales declined by 5% from $3,047.1 million in 2011 to $2,904.4 million in 2012. The decrease was primarily due to a 4% decrease in average selling price. The decline in total sales was primarily driven by a decline in product sales of our Tubular Division and Flat Division of $34.5 million and $97.3 million, respectively, partially offset by an increase in product sales of our Long Division of $0.1 million (before total intercompany eliminations that decreased by $3.6 million in addition to the decrease in freight revenues of $14.6 million). Total tons sold remained relatively unchanged on a year-over-year basis, increasing less than 1% from 2,500Kt in 2011 to 2,503Kt in 2012.
70
Table of Contents
The average selling price per ton declined 4%, from $1,159 in 2011 to $1,106 in 2012. The decrease was driven by lower prices of our carbon and specialty plate, carbon OCTG, wire rod, and rail products due to market pressure from imports.
Cost of sales
Cost of sales decreased from $2,576.7 million in 2011 to $2,505.2 million in 2012 due to lower costs of scrap (a decline of 4%) and slabs (a decline of 10%).
Operating income
Operating income decreased from $240.7 million in 2011 to $164.6 million in 2012 due to the decrease in selling price across all divisions partially offset by lower scrap and slab costs.
Interest expense and related party interest expense
Interest expense in 2011 was $15.9 million compared to $9.9 million in 2012. Interest expense decreased by $6.0 million primarily due to lower average principal balances and lower average interest rates on our ABL Credit Facility.
Related party interest expense in 2011 was $80.6 million compared to $52.1 million in 2012. Related party interest expense decreased by $28.5 million primarily due to lower average principal balances on related-party loans from EVRAZ KGOK.
Foreign exchange gain (loss)
We recorded a foreign exchange loss in 2011 of $12.3 million compared to a $15.7 million gain in 2012. EICA’s exposure to United States dollars under its debt to EVRAZ KGOK and the strengthening of the Canadian dollar against the United States dollar in 2012 impacted this fluctuation.
Income tax benefit
The income tax benefit in 2011 was $5.5 million, compared to $13.6 million in 2012, primarily due to changes in our income before income taxes.
Net income (loss) from discontinued operations
Income from discontinued operations decreased from $9.7 million in 2011 to loss from discontinued operations of $101.1 million in 2012. This change was driven by increased competition which decreased selling prices and a goodwill impairment charge of $90.9 million recorded in 2012 for our EVRAZ Claymont site. We did not record any impairment charges in income from discontinued operations in 2011.
Net income attributable to EVRAZ NORTH AMERICA LIMITED
We recognized a net income attributable to EVRAZ NORTH AMERICA LIMITED of $142.4 million in 2011 compared to $14.6 million in 2012, as a result of the factors discussed above.
Adjusted EBITDA
Adjusted EBITDA decreased from $437.9 million in 2011 to $347.0 million in 2012 as a result of decreased average selling prices across all divisions, partially offset by a decrease in scrap and slab costs. Adjusted
71
Table of Contents
EBITDA is a non-GAAP financial measure. Refer to “Summary Consolidated Financial Information and Other Data—Adjusted EBITDA” for information on how we define and calculate Adjusted EBITDA and a reconciliation of Adjusted EBITDA to net income (loss) attributable to EVRAZ NORTH AMERICA LIMITED.
Capital expenditures
Capital expenditures increased from $59.1 million in 2011 to $67.3 million in 2012 as a result of increased spending on the investment project for the rail mill. The rail mill investment project focused on quality improvements, increasing capacity and expanding customer technical support and product development.
Segment Reporting
The following table presents our product sales, operating income (loss), and Adjusted operating income (loss), as well as total tons sold for the years ended December 31, 2011 and 2012 for each of our segments.
| Year Ended December 31, 2011 | Year Ended December 31, 2012 | |||||||||||||||||||||||||||||||
| Total Tons Sold | Product Sales | Operating Income (loss) | Adjusted Operating Income (loss)(1) | Total Tons Sold | Product Sales | Operating Income (loss) | Adjusted Operating Income(1) | |||||||||||||||||||||||||
| ($ in millions, tons in thousands) | ||||||||||||||||||||||||||||||||
Long Division | 946 | $ | 906.9 | $ | 128.6 | $ | 174.7 | 987 | $ | 907.0 | $ | 119.4 | $ | 161.6 | ||||||||||||||||||
Tubular Division | 1,021 | 1,376.5 | 83.9 | 183.2 | 1,018 | 1,342.0 | 53.5 | 144.6 | ||||||||||||||||||||||||
Flat Division(2) | 839 | 854.0 | 36.7 | 86.4 | 802 | 756.7 | (8.7 | ) | 38.0 | |||||||||||||||||||||||
Intercompany Eliminations/ Other | (306 | ) | (240.8 | ) | (8.5 | ) | (6.4 | ) | (304 | ) | (237.2 | ) | 0.4 | 2.8 | ||||||||||||||||||
|
|
|
|
|
|
|
|
|
|
|
|
|
|
|
| |||||||||||||||||
Total | 2,500 | $ | 2,896.6 | $ | 240.7 | $ | 437.9 | 2,503 | $ | 2,768.5 | $ | 164.6 | $ | 347.0 | ||||||||||||||||||
|
|
|
|
|
|
|
|
|
|
|
|
|
|
|
| |||||||||||||||||
| (1) | Adjusted operating income (loss) is a non-GAAP financial measure. Refer to “Summary Consolidated Financial Information and Other Data—Adjusted operating income (loss)” for information on how we define and calculated Adjusted operating income (loss) and a reconciliation of Adjusted operating income (loss) to operating income (loss). |
| (2) | The results of our EVRAZ Claymont and EVRAZ Surrey operations, which were previously reported as part of the Flat Division, are being presented as discontinued operations in the consolidated statements of operations for all periods presented. See the notes to our consolidated financial statements included elsewhere in this prospectus for additional information regarding these discontinued operations. |
The following table presents our total capital expenditures, separated into two categories: investment activities and maintenance and other activities, for the years ended December 31, 2011 and 2012 for each of our segments.
| Year Ended December 31, | ||||||||||||||||||||||||
| 2011 | 2012 | 2011 | 2012 | 2011 | 2012 | |||||||||||||||||||
| Total Capital Expenditures | Investment | Maintenance & Other | ||||||||||||||||||||||
| ($ in millions) | ||||||||||||||||||||||||
Long Division | $ | 15.5 | $ | 31.8 | $ | 0.1 | $ | 15.7 | $ | 15.4 | $ | 16.1 | ||||||||||||
Tubular Division | 24.9 | 23.0 | 5.1 | 2.2 | 19.8 | 20.8 | ||||||||||||||||||
Flat Division(1) | 12.4 | 11.0 | 0.0 | 0.2 | 12.4 | 10.8 | ||||||||||||||||||
Corporate(2) | 6.3 | 1.5 | 5.4 | 0.1 | 0.9 | 1.4 | ||||||||||||||||||
|
|
|
|
|
|
|
|
|
|
|
| |||||||||||||
Total | $ | 59.1 | $ | 67.3 | $ | 10.6 | $ | 18.2 | $ | 48.5 | $ | 49.1 | ||||||||||||
|
|
|
|
|
|
|
|
|
|
|
| |||||||||||||
| (1) | The results of our EVRAZ Claymont and EVRAZ Surrey operations, which were previously reported as part of the Flat Division, are being presented as discontinued operations in the consolidated statements of operations for all periods presented. See the notes to our consolidated financial statements included elsewhere in this prospectus for additional information regarding these discontinued operations. |
| (2) | Corporate refers to centralized information technology functions, safety, finance, and similar activities which we do not allocate to any of our operating segments. |
72
Table of Contents
Long Division
Product sales of our Long Division remained relatively unchanged year-over-year at $906.9 million in 2011 and $907.0 million in 2012 due to an average selling price decline of 4% which was offset by an increase in tons sold of 4%.
Total tons sold increased from 946Kt in 2011 to 987Kt in 2012 driven primarily by the increase in rail and wire rod volumes of 18Kt and 15 Kt, respectively. Increased demand for our rail products was attributable to sales into Latin American markets. The increase in wire rod volumes was driven by the improved demand from the construction industry as industrial construction volumes across North America generally increased in 2012 compared to 2011.
The average selling price per ton decreased from $958 in 2011 to $919 in 2012 due to lower pricing of our wire rod and rail products due to import pressures.
Operating income and Adjusted operating income decreased from $128.6 million and $174.7 million, respectively, in 2011 to $119.4 million and $161.6 million, respectively, in 2012 due primarily to lower selling prices partially offset by higher volumes.
Capital expenditures increased from $15.5 million in 2011 to $31.8 million in 2012, as a result of increased spending on the investment project for the rail mill. The rail mill investment project focused on quality improvements, increasing capacity and expanding customer technical support and product development.
Tubular Division
Product sales of our Tubular Division declined by 3% from $1,376.5 million in 2011 to $1,342.0 million 2012. The decrease was due to a 2% decrease in average selling price and a 1% decrease in tons sold. Total tons sold remained relatively unchanged decreasing from 1,021Kt in 2011 to 1,018Kt in 2012.
The average sales price per ton decreased from $1,348 in 2011 to $1,318 in 2012 due to high levels of imports, in 2012 of both carbon OCTG (with the price decrease of 4% period-over-period) and SD Pipe (with the price decrease of 2% period-over-period) from Asia, in particular, South Korea into North America.
Operating income and Adjusted operating income decreased from $83.9 million and $183.2 million, respectively, in 2011 to $53.5 million and $144.6 million, respectively, in 2012 primarily due to lower selling prices.
Capital expenditures decreased from $24.9 million in 2011 to $23.0 million in 2012 as increased maintenance spending was offset by lower spending on capital investments, as the construction of the first Red Deer premium thread line was completed in 2011.
Flat Division
Product sales of our Flat Division declined by 11% from $854.0 million in 2011 to $756.7 million in 2012. The decrease was due to a 7% decrease in average selling price and a 4% decrease in tons sold. Total tons sold decreased by 4%, from 839Kt in 2011 to 802Kt in 2012. The decrease in tons sold was due to a shift in our product mix from coil towards plate, as plate production requires more time per ton to produce than coil.
The average sales price per ton decreased from $1,018 in 2011 to $943 in 2012 as both plate and coil selling prices were impacted by imports.
Operating income and Adjusted operating income decreased from $36.7 million and $86.4 million, respectively, in 2011 to an operating loss of $8.7 million and Adjusted operating income of $38.0 million in 2012 due to lower selling prices and total tons sold.
73
Table of Contents
Capital expenditures decreased from $12.4 million in 2011 to $11.0 million in 2012 primarily due to decreased maintenance spending.
Liquidity and Capital Resources
Our sources of liquidity are cash generated from operations and our ABL Credit Facility. Cash generated from operations continues to be our primary source of funds to finance our operating needs, capital expenditures, and debt service. Accordingly, during the nine-month period ended September 30, 2014, we incurred incremental debt to partially fund working capital needs associated with sales growth experienced during this timeframe. We believe that our liquidity is sufficient to cover our working capital needs in the ordinary course of our business.
Our cash and cash equivalents as of September 30, 2014 were $27.3 million, compared to $193.3 million, $254.6 million, and $77.3 million as of December 31, 2013, December 31, 2012, and December 31, 2011, respectively. Highly liquid investments with original maturities of three months or less at the date of purchase are considered cash equivalents.
Cash Flows
The following table summarizes our cash flows for the nine months ended September 30, 2013 and 2014 and years ended December 31, 2011, 2012, and 2013.
| Nine months ended September 30, | Year ended December 31, | |||||||||||||||||||
| 2013 | 2014 | 2011 | 2012 | 2013 | ||||||||||||||||
| ($ millions) | ||||||||||||||||||||
Net cash provided by (used in) continuing operating activities | $ | 60.6 | $ | (127.5 | ) | $ | 479.6 | $ | 299.2 | $ | 116.1 | |||||||||
Net cash provided by (used in) discontinued operating activities | 41.1 | (6.3 | ) | (12.9 | ) | (40.7 | ) | 5.6 | ||||||||||||
Net cash used in investing activities | (73.1 | ) | (38.7 | ) | (79.8 | ) | (96.6 | ) | (78.9 | ) | ||||||||||
Net cash (used in) provided by financing activities | (214.8 | ) | 8.2 | (497.1 | ) | 7.2 | (104.0 | ) | ||||||||||||
Effect of foreign currency exchange rate on cash | (4.7 | ) | (1.7 | ) | (7.1 | ) | 8.2 | (0.1 | ) | |||||||||||
|
|
|
|
|
|
|
|
|
| |||||||||||
Net (decrease) increase in cash and cash equivalents | (190.9 | ) | (166.0 | ) | (117.3 | ) | 177.3 | (61.3 | ) | |||||||||||
|
|
|
|
|
|
|
|
|
| |||||||||||
Cash and cash equivalents at the beginning of period | 254.6 | 193.3 | 194.6 | 77.3 | 254.6 | |||||||||||||||
|
|
|
|
|
|
|
|
|
| |||||||||||
Cash and cash equivalents at the end of period | $ | 63.7 | $ | 27.3 | $ | 77.3 | $ | 254.6 | $ | 193.3 | ||||||||||
|
|
|
|
|
|
|
|
|
| |||||||||||
Net cash provided by (used in) continuing operating activities
Net cash provided by continuing operating activities was $60.6 million in the nine months ended September 30, 2013, compared to net cash used in continuing operating activities of $127.5 million in the same period in 2014. This decrease from the nine months ended September 30, 2013 to the same period in 2014 was primarily driven by higher inventory and higher accounts receivable balances due to increased sales, partially offset by increased operating income due to improved pricing across all divisions. This cash use was partially funded by borrowing under our ABL Credit Facility.
During the nine months ended September 30, 2014, our cash conversion cycle increased by 28 days compared to the three year average from 2011 to 2013. This increase was due to larger accounts receivable and inventory balances and a lower accounts payable balance relative to sales volumes for the first half of 2014. During this period, our business ramped up our production capacities to support increased demand for our products across all divisions. Growth in sales caused the above increase in the cash conversion cycle, which we expect will return to historical levels once production and sales volumes stabilize at the new demand levels.
74
Table of Contents
| Year ended December 31, | 2011-2013 Average | Nine Months Ended September 30, 2014 | Change vs. Three Year Average | |||||||||||||||||||||
| 2011 | 2012 | 2013 | ||||||||||||||||||||||
Days Sales Outstanding (DSO) | 29 | 27 | 34 | 30 | 39 | 9 | ||||||||||||||||||
Days Inventory On-hand (DIO) | 65 | 82 | 73 | 74 | 88 | 14 | ||||||||||||||||||
Days Payables Outstanding (DPO) | 35 | 47 | 48 | 44 | 39 | (5 | ) | |||||||||||||||||
|
|
|
|
|
|
|
|
|
|
|
| |||||||||||||
Cash Conversion Cycle (DSO+DIO-DPO) | 59 | 62 | 59 | 60 | 88 | 28 | ||||||||||||||||||
Net cash provided by continuing operating activities was $299.2 million in 2012, compared to $116.1 million in 2013. The reduction from 2012 to 2013 was primarily driven by the decline in operating income in the Tubular Division.
Net cash provided by continuing operating activities was $479.6 million in 2011, compared to $299.2 million in 2012. The reduction from 2011 to 2012 was primarily driven by the decline in operating income in the Tubular Division and changes in net working capital.
Net cash provided by (used in) discontinued operating activities
Net cash used provided by discontinued operating activities decreased from $41.1 million in the nine months ended September 30, 2013 to net cash used in discontinued operating activities of $6.3 million in the same period in 2014. Net cash used in discontinued operations was $12.9 million in 2011 and $40.7 million in 2012. Net cash provided by discontinued operations was $5.6 million in 2013. The change in net cash provided by (used in) discontinued operating activities between periods was driven primarily by changes in operating loss from discontinued operations partially offset by asset impairment charges, which are non-cash items, recorded for EVRAZ Claymont and EVRAZ Surrey in 2012 and 2013.
Net cash used in investing activities
Net cash used in investing activities was $73.1 million in the nine months ended September 30, 2013, compared to $38.7 million in the same period in 2014. The change was primarily driven by the timing of maintenance capital expenditures in 2014 and spending on key investment projects in 2013.
Net cash used in investing activities was $96.6 million in 2012, compared to $78.9 million in 2013. The difference was primarily due to the purchase of a scrap yard business in Colorado in 2012 for $11.8 million and the sale of our EVRAZ Surrey business in 2013 for $12.7 million.
Net cash used in investing activities was $79.8 million in 2011, compared to $96.6 million in 2012. The difference was primarily due to the purchase of a scrap yard business in Colorado in 2012 for $11.8 million.
Net cash provided by (used in) financing activities
Net cash used in financing activities was $214.8 million in the nine months ended September 30, 2013, compared to net cash provided by financing activities of $8.2 million in the same period in 2014. The difference was primarily driven by a reduction in dividends paid to EVRAZ Group partially offset by funds drawn on the ABL Credit Facility to finance working capital needs. We constantly evaluate new sources of financing with the goal of reducing interest expense and maintaining alternative sources of liquidity.
Net cash provided by financing activities was $7.2 million in 2012, compared to net cash used by financing activities of $104.0 million in 2013. The difference was primarily driven by repayments of third party debt (in 2012, we increased our third party debt by $236.5 million and in 2013, decreased it by $194.9 million) mitigated by the repayment of related party debt in 2012 of $177.9 million and an increase of dividends paid to the EVRAZ Group of $172.3 million, partially offset by a $270 million capital cash contribution from EVRAZ Group in 2013.
75
Table of Contents
Net cash used in financing activities was $497.1 million in 2011, compared to net cash provided by financing activities of $7.2 million in 2012. The difference was primarily due to a net repayment of third party and related party debts in 2011 compared to net borrowings in 2012.
Description of Indebtedness
Our debt facilities are comprised of our ABL Credit Facility and subordinated loans of EICA owed to EVRAZ KGOK, a subsidiary of EVRAZ plc. Our ABL Credit Facility includes customary restrictive covenants, including a restriction on dividend payments to our parent company. See “Description of Certain Indebtedness.”
On October 31, 2014, our subsidiary, EICA, priced $350 million aggregate principal amount of 7.5% Senior Notes due 2019, in connection with its private offering exempt from the registration requirements of the Securities Act. The closing of the offering of the notes is expected to occur on November 7, 2014, subject to customary closing conditions.
The notes will be guaranteed on secured, senior basis by ENA, EINA and each of EINA’s and EICA’s respective subsidiaries that is a guarantor under the ABL Credit Facility subject to certain exceptions. EICA intends to use the net proceeds from the offering of the notes to repay a part of Loan Contract No. KGOK-EICA-02, dated December 27, 2012, between EVRAZ Inc. NA Canada and JSC EVRAZ Kachkanarsky Ore Mining and Processing Plant, or Note 2. Note 2 is due December 27, 2017, and carries a fixed interest rate of 7.15% and had a balance of CAD 487.7 million outstanding as of October 24, 2014. See “Related Party Transactions.”
Off Balance-Sheet Arrangements
Historically, we have not used special-purpose vehicles or similar financing arrangements. In addition, we do not have any off-balance sheet arrangements with any of our affiliates.
Contractual Obligations
As of December 31, 2013, our contractual cash obligations were as follows:
| Payment Due | ||||||||||||||||||||
| Less than 1 year | 1-3 Years | 3-5 Years | After 5 Years | Total | ||||||||||||||||
| ($ in millions) | ||||||||||||||||||||
Long-Term Debt Obligations(1)(2) | $ | — | $ | 100.0 | $ | 774.4 | $ | — | $ | 874.4 | ||||||||||
Interest Expense(3) | 59.0 | 117.9 | 73.4 | — | 250.3 | |||||||||||||||
Operating Lease Payments | 9.3 | 17.0 | 12.4 | 25.7 | 64.4 | |||||||||||||||
Pension Obligations(4) | 33.3 | 71.3 | 77.3 | 215.1 | 397.0 | |||||||||||||||
Unconditional Purchase Commitments(5) | 2.0 | 4.0 | 4.0 | 10.0 | 20.0 | |||||||||||||||
|
|
|
|
|
|
|
|
|
| |||||||||||
Total | $ | 103.6 | $ | 310.2 | $ | 941.5 | $ | 250.8 | $ | 1,606.1 | ||||||||||
|
|
|
|
|
|
|
|
|
| |||||||||||
| (1) | Excludes interest expense. |
| (2) | On October 31, 2014, our subsidiary, EICA, priced $350 million aggregate principal amount of 7.5% senior notes due 2019, in connection with its private offering exempt from the registration requirements of the Securities Act. The closing of the offering of the notes is expected to occur on November 7, 2014, subject to customary closing conditions. The notes will be guaranteed on secured, senior basis by ENA, EINA and each of EINA’s and EICA’s respective subsidiaries that is a guarantor under the ABL Credit Facility subject to certain exceptions. EICA intends to use the net proceeds from the offering of the notes to repay a part of Note 2. Note 2 is due December 27, 2017, and carries a fixed interest rate of 7.15% and had a balance of CAD 487.7 million outstanding as of October 24, 2014. See “Related Party Transactions.” Issuance of the senior notes and the use of the proceeds therefrom are not reflected in this table. |
| (3) | Interest payments on debt are calculated for future periods using interest rates in effect as at December 31, 2013. Certain of these projected interest payments may differ in the future based on changes in floating interest rates, foreign currency fluctuations, or other factors or events. The projected interest payments only pertain to obligations and agreements outstanding as at December 31, 2013. See notes to our audited consolidated financial statements included elsewhere in this prospectus for further discussion regarding our debt instruments and related interest rates. The effective interest rate for our ABL Credit Facility as of December 31, 2013 was 3.4%. |
| (4) | Pension obligations are expected future benefit payments. These benefit payments will be paid out of plan assets and company contributions. |
76
Table of Contents
| (5) | Total unconditional purchase commitments are defined as an agreement to purchase goods or services that are enforceable and legally binding on us. Included in unconditional purchase commitments above are certain obligations related to our oxygen purchase agreements that include minimum volume purchase obligations. These purchase commitments do not represent our entire anticipated purchases in the future, but represent only those items for which we are contractually obligated. The majority of our products and services are purchased as needed, with no commitment. |
Except as described above, we have not repaid any material long-term debt subsequent to December 31, 2013.
Additional details of our existing debt obligations can be found in the “Description of Certain Indebtedness” section of this document.
Contingent Liabilities
We are a party to indemnities, legal proceedings and claims that arise in the ordinary course of business. While the outcome of such pending legal proceedings and claims cannot be readily foreseen, management believes that they will be resolved without material effect on our results, financial position, or liquidity. We generally do not enter into purchase obligations.
Inflation
We believe that inflation has not had a material effect on our results of operations to date.
Quantitative and Qualitative Disclosure about Market Risk
We are exposed to market risks, such as changes in commodity pricing, currency exchange rates, and interest rates. We perform the following in order to manage the volatility related to these exposures.
Commodity Prices
A substantial portion of our products and raw materials are commodities whose prices fluctuate as market supply and demand fundamentals change. Accordingly, product margins and the level of our profitability tend to fluctuate with changes in the business cycle. We try to protect against such instability by refraining from entering into long-term fixed price purchase contracts or set pricing for sustained periods of time. As a result, we are able to adapt our pricing to changes in raw material and commodity costs.
Foreign Currency Exchange Rates
We enter into transactions denominated in other than our functional currency and are, therefore, exposed to foreign currency risk on receivables and payables. For example, the strengthening of the Canadian dollar by 5% against the United States dollar in 2013 would have resulted in a decrease in profitability of $6.5 million. We assess foreign currency risk by identifying and monitoring changes in exchange rate exposures that may have an adverse impact on earnings. We have not, however, historically entered into transactions with derivative instruments in order to hedge the risk of foreign currency fluctuations.
Interest Rates
As of December 31, 2013, we were exposed to variable interest rate debt in the amount of $100.0 million. An increase of 100 basis points, or one percentage point, in the interest rates would increase annual interest expense by $1.0 million. We have not historically entered into transactions with derivative instruments to hedge the risk of variable interest rate debt.
Application of Critical Accounting Policies, Estimates and Judgments
Significant accounting policies are described in the notes to our consolidated financial statements. The preparation of consolidated financial statements requires management to make judgments, estimates and assumptions about the carrying amounts of assets and liabilities that are not readily apparent from other sources.
77
Table of Contents
The estimates and associated assumptions are based on historical experience and on various other assumptions that management believes to be reasonable under the circumstances. Actual results may differ from these estimates under different assumptions or conditions. The estimates and underlying assumptions are reviewed on an ongoing basis. Revisions to accounting estimates are recognized in the period in which the estimate is revised if the revision affects only that period or in the period of revision and future periods if the revision affects both current and future periods.
Management has identified the following policies as critical because they may involve a high degree of judgment and complexity.
Inventory Valuation
Inventories are stated at the lower of average cost or market value, which is determined by reference to a net realizable selling price, taking into consideration assumptions about future demand and market conditions. Stores and operating supplies inventory, which includes spare parts, are expensed to cost of sales as the parts are utilized and consumed. Management periodically evaluates the need to record adjustments for impairment for all inventories, including raw materials, semi-finished products, finished goods, and stores and operating supplies inventory. Obsolete or excess inventory is written down to its estimated market value, if less than its average cost. Historically, losses due to obsolescence and scrapping of inventory have been within expectations and the allowances established. Factors considered in our estimates of impairment and market value include management’s estimates related to future manufacturing schedules, customer demand, possible alternative uses, and ultimate realization of excess inventory. If however, factors considered above were to materially change, our estimates of the recoverability of the value of inventories could be materially affected. In this case, our results of operations, financial condition, and net worth could be materially and adversely affected.
Impairment of Long-Lived Assets
Property, plant, and equipment are stated at cost less accumulated depreciation. Depreciation is determined using the straight-line method over the estimated useful lives of the assets. When events or circumstances indicate the carrying value of property, plant and equipment held for use may be impaired, we assess whether or not the asset is recoverable. When it is determined that impairment exists, the related assets are written down to estimated fair market value. The estimated fair value for assets that we currently use in our operations utilize judgments and assumptions of future cash flows that the assets will produce. If our projected cash flows are not realized, either because of an extended recessionary period or other unforeseen events, impairment charges may be required in future periods.
Goodwill and Other Intangible Assets
Certain business acquisitions have resulted in the recording of goodwill and trademark assets. Upon acquisition, the purchase price is first allocated to identifiable assets and liabilities, including trademark assets, based on estimated fair value, with any remaining purchase price recorded as goodwill. Goodwill and water rights and a natural gas pipeline supply agreement are considered indefinite lived intangible assets and as such are not amortized. At December 31, 2013, we have goodwill of $1,082 million, which is recorded within our cash generating reporting units. There have been no changes to our reporting units or allocations of goodwill by reporting units. We perform our annual impairment assessment for goodwill and other indefinite-lived intangible assets as of December 1 and more frequently if indicators of impairment exist.
Goodwill Valuations
We use a quantitative model to test goodwill for impairment which includes a two-step impairment test. We first compare the carrying value of a reporting unit, including goodwill, with its fair value. The fair value is estimated based on a market approach and a discounted cash flow analysis, also known as the income approach. If the carrying value of a reporting unit exceeds its fair value, we perform the second step to estimate an implied
78
Table of Contents
fair value of the reporting unit’s goodwill by allocating the fair value of the reporting unit to all of the assets and liabilities other than goodwill. The amount of impairment loss is equal to the excess of the carrying value of the goodwill over the implied fair value of that goodwill.
Although we believe our estimates and projections are appropriate based on currently available information, our estimates could be materially impacted by factors such as changes in growth trends and specific industry conditions, with the potential for a corresponding adverse effect on the consolidated financial statements potentially resulting from an impairment of goodwill.
Evaluating Goodwill—Results and Significant Assumptions
In 2013, we recognized goodwill impairment losses of $336.1 million, $32.8 million, $77.5 million and $22.2 million for the EVRAZ Portland, EVRAZ Portland Tubular, EVRAZ Pueblo Seamless and EVRAZ Calgary reporting units, respectively. These impairment charges are included in income from continuing operations. In 2011 and 2012, there were no impairment charges in income from continuing operations.
At the end of 2013 our view of the future performance of our EVRAZ Portland reporting unit was lowered due to pricing pressures from domestic competitors for heat treated plate and imported steel. This resulted in an impairment of goodwill of $336.1 million. After the impairment, at December 31, 2013 there was $66.0 million of goodwill for the EVRAZ Portland reporting unit remaining. As of the last measurement date on December 1, 2013, the estimated fair market value of the EVRAZ Portland reporting unit exceeded its carrying value by 70%. For the nine months ended September 30, 2014, this reporting unit has exceeded the expected Adjusted EBITDA assumed in the December 1, 2013 impairment test.
At our EVRAZ Portland Tubular reporting unit, the outlook for LD Pipe demand, while positive, together with re-start costs, did not allow us to ramp up production and sales at this facility in the short term to justify the carrying value of goodwill at the end of 2013. This resulted in goodwill impairment charge of $32.8 million, removing all goodwill associated with that reporting unit.
We experienced operational issues in 2013 at our EVRAZ Pueblo Seamless reporting unit which led to decreased productivity and yield and increased costs. The facility’s 2013 financial performance was further negatively impacted due to a depressed pricing environment as the level of imports increased in the market. We recorded a goodwill impairment of $77.5 million for EVRAZ Pueblo Seamless reporting unit at December 31, 2013. After the impairment, $33.0 million of goodwill remains related to EVRAZ Pueblo Seamless reporting unit. As of the last measurement date on December 1, 2013, the estimated fair market value of the EVRAZ Pueblo Seamless reporting unit exceeded its carrying value by 79%. For the nine months ended September 30, 2014 the EVRAZ Pueblo Seamless reporting unit exceeded the expected Adjusted EBITDA assumed in the December 1, 2013 impairment test.
Our EVRAZ Calgary reporting unit did not maintain the necessary level of projected profitability to justify the carrying value of goodwill during 2013. Productivity issues that led to increased costs as well as a depressed pricing environment both impacted the profitability of this reporting unit. As a result, the estimated fair value of this reporting unit was reduced and resulted in a goodwill impairment charge of $22.2 million in 2013. After impairment charges, there remained $175.0 million of goodwill for EVRAZ Calgary. As of the last measurement date on December 1, 2013, the estimated fair market value of the EVRAZ Calgary reporting unit exceeded its carrying value by 5%. For the nine months ended September 30, 2014, the EVRAZ Calgary reporting unit exceeded its Adjusted EBITDA assumed for the December 1, 2013 impairment test.
Our EVRAZ Pueblo Long reporting unit passed the impairment test performed on December 1, 2013. The value of goodwill on our consolidated balance sheet at December 31, 2013 related to EVRAZ Pueblo Long reporting unit is $270.9 million. As of the last measurement date on December 1, 2013, the estimated fair market value of the EVRAZ Pueblo Long reporting unit exceeded its carrying value by 10%. For the nine months ended
79
Table of Contents
September 30, 2014, the EVRAZ Pueblo Long reporting unit fell short of the Adjusted EBITDA assumed for the December 1, 2013 impairment test. However, this shortfall was driven by one-time events and we expect that this reporting unit will continue to perform as projected.
Our EVRAZ Regina Tubular reporting unit passed the impairment test performed on December 1, 2013. The value of goodwill on our consolidated balance sheet related to EVRAZ Regina Tubular reporting unit is $33.6 million. The estimated market fair value as of the impairment test on December 1, 2013 indicated no headroom for this reporting unit which could result in an impairment of goodwill in the future if business conditions change. However, for the nine months ended September 30, 2014, the EVRAZ Regina Tubular reporting unit exceeded its expected Adjusted EBITDA assumed for the December 1, 2013 impairment test.
We recorded asset impairments at our EVRAZ Claymont reporting unit of $90.9 million and $296.9 million in 2012 and 2013, respectively. These impairment losses are included in losses from discontinued operations. No impairment charge was made in income from discontinued operations in 2011. In 2012, the main driver of the $90.9 million impairment charge to goodwill was related to falling prices for plate which decreased projected profitability. At that time, the outlook was for the market to begin recovering in 2013. However, in 2013, the market did not recover as planned and the site also experienced a series of operational issues that increased losses and the use of cash. For these reasons, the decision was made to permanently idle the facility. Based on our assessment of the fair market value of this reporting unit as compared to the carrying value, we recorded an impairment charge of $296.9 million in 2013 and wrote the value of the remaining goodwill to zero.
For the nine months ended September 30, 2014, we performed a review of all reporting units and the underlying assumptions utilized in the impairment analysis as of December 1, 2013. This review indicated that there were no indicators of potential impairment of goodwill.
The table below provides a roll forward of goodwill by reporting units for continuing operations from 2011 to 2013 and provides the headroom available as of December 1, 2013.
$ Millions
Reporting Unit name | Remaining goodwill as of 12/1/11 | FX and Acquisition impact in 2012** | Remaining goodwill as of 12/1/12 | Impairment charges in 2013 | FX impact in 2013 | Remaining goodwill as of 12/1/13 | Headroom in Step 1 analysis | |||||||||||||||||||||
Regina Steel | $ | 370.7 | $ | 8.2 | $ | 378.9 | $ | — | $ | (24.5 | ) | $ | 354.4 | 32 | % | |||||||||||||
Regina Tubular * | 35.1 | 0.8 | 35.9 | — | (2.4 | ) | 33.5 | -2 | % | |||||||||||||||||||
Calgary | 206.2 | 4.5 | 210.7 | (22.2 | ) | (13.6 | ) | 174.9 | 5 | % | ||||||||||||||||||
Red Deer | 55.2 | 1.3 | 56.5 | — | (3.7 | ) | 52.8 | 41 | % | |||||||||||||||||||
Camrose | 70.3 | — | 70.3 | — | — | 70.3 | 176 | % | ||||||||||||||||||||
Oregon Steel | 402.1 | — | 402.1 | (336.1 | ) | — | 66.0 | 70 | % | |||||||||||||||||||
Pueblo Long | 270.9 | — | 270.9 | — | — | 270.9 | 10 | % | ||||||||||||||||||||
CST | — | — | — | — | — | — | n/a | |||||||||||||||||||||
Portland Spiral | 32.8 | — | 32.8 | (32.8 | ) | — | — | n/a | ||||||||||||||||||||
Pueblo Seamless | 110.6 | — | 110.6 | (77.5 | ) | — | 33.1 | 79 | % | |||||||||||||||||||
GSI | 4.7 | 0.5 | 5.2 | — | — | 5.2 | 40 | % | ||||||||||||||||||||
General Scrap | 21.9 | 0.5 | 22.4 | — | (1.4 | ) | 21.0 | 41 | % | |||||||||||||||||||
Total | $ | 1,580.5 | $ | 15.8 | $ | 1,596.3 | $ | (468.6 | ) | $ | (45.6 | ) | $ | 1,082.1 | 31 | % | ||||||||||||
|
|
|
|
|
|
|
|
|
|
|
|
|
| |||||||||||||||
| * | The result of the Step 2 analysis determined no impairment charge should be made to this reporting unit in 2013. |
| ** | Includes $0.5 increase related to an acquisition in the GSI reporting unit. |
Environmental Liabilities
All material environmental remediation liabilities for non-capital expenditures, which are probable and estimable, are recorded in the consolidated financial statements based on current technologies and current environmental standards at the time of evaluation. The best estimate of the probable cost within a range is recorded.
80
Table of Contents
If there is no best estimate, the low end of the range is recorded and the range is disclosed. Adjustments are made when additional information is available that suggests different remediation methods or periods may be required and affect the total cost. The amounts of any such adjustments could have a material adverse effect on our results of operations in a given period, but any such amounts, and the possible range of any amounts in excess of those already accrued, are not reasonably estimable at this time. Total accrued environmental costs were $33.9 million at December 31, 2013 and $28.7 million of the accrued environmental costs were considered long-term liabilities at December 31, 2013. Environmental costs are discounted to present value when the cash outflows are fixed and reliably determinable. Refer to “Hazardous Substances” within “Business” for a discussion over potential environmental liabilities and Note 10—“Commitments and Contingencies” to our consolidated financial statements.
Income Taxes
The Company is subject to taxes in the United Kingdom, the United States and Canada, and its earnings are taxed at the applicable income tax rate in each of those countries. The Company provides for income taxes utilizing the asset and liability method of accounting for income taxes. Under this method, deferred income taxes are recorded to reflect the tax consequences in future years of differences between the tax basis of assets and liabilities and their financial reporting amounts at each balance sheet date, based on enacted tax laws and statutory tax rates applicable to the periods in which the differences are expected to affect taxable income. If it is determined that it is more likely than not that future tax benefits associated with a deferred tax asset will not be realized, a valuation allowance is provided. In the future, if the Company determines it is able to realize its deferred tax assets previously subject to a valuation allowance, an adjustment to the valuation allowance would be recorded in the period so determined. Likewise, should the Company determine that it would not be able to realize all or part of its net deferred tax asset in the future, an adjustment to the valuation allowance would be charged to income in the period such determination was made. The effect on deferred tax assets and liabilities of a change in the tax legislation is recognized in the period that the tax legislation is enacted. We are not aware of any such changes that would have a material effect on our results of operations, cash flows or financial position.
The Company utilizes a two-step approach to recognize and measure uncertain tax positions. The first step is to evaluate the tax position for recognition by determining if the weight of available evidence indicates it is more likely than not that the position will be sustained on audit, including resolution of related appeals or litigation processes. The second step is to measure the tax benefit as the largest amount which is more than 50% likely of being realized upon ultimate settlement. The Company considers many factors when evaluating and estimating its tax positions and tax benefits, which may require periodic adjustments and which may not accurately forecast actual outcomes. The Company includes interest and penalties related to uncertain tax positions within “Provision (benefit) for income taxes” on the consolidated statements of operations.
Employee Benefit Plans
The Company’s significant employee benefit plans are a noncontributory single-employer defined benefit pension plan, or Defined Benefit Plan, and postretirement health care and life insurance plans, or OPEBs, that cover its eligible employees in the United States and Canada.
For all the other plans, the Company recognizes the funded status in its consolidated financial statements. The measurement date of plan assets and obligations is December 31 for all plans. The Company also recognizes as a component of accumulated other comprehensive income (loss) and reported in the accompanying consolidated statements of comprehensive loss, net of tax, the gains or losses and prior service costs or credits that arise during the period but are not recognized as components of net periodic benefit costs. The following tables summarize changes in the assumptions related to the benefit obligation for 2011-2013.
81
Table of Contents
| Defined Benefit Plans | �� | Defined Benefit Plans | Defined Benefit Plans | |||||||||||||||||||||
| 2011 | 2012 | 2013 | ||||||||||||||||||||||
| Weighted average assumptions to determine net cost | United States Plans | Canadian Plans | United States Plans | Canadian Plans | United States Plans | Canadian Plans | ||||||||||||||||||
Discount rate | 5.3 | % | 5.6 | % | 4.2 | % | 5.2 | % | 3.8 | % | 4.4 | % | ||||||||||||
Rate of increase in future compensation levels | 3.0 | % | 3.0 | % | 3.0 | % | 3.5 | % | 3.0 | % | 3.3 | % | ||||||||||||
Expected long-term rate of return on plan assets | 7.2 | % | 6.5 | % | 6.9 | % | 6.5 | % | 6.7 | % | 6.8 | % | ||||||||||||
| Defined Benefit Plans | Defined Benefit Plans | |||||||||||||||
| 2012 | 2013 | |||||||||||||||
| Weighted average assumptions to determine benefit obligations | United States Plans | Canadian Plans | United States Plans | Canadian Plans | ||||||||||||
Discount rate | 3.8 | % | 4.4 | % | 4.7 | % | 4.9 | % | ||||||||
Rate of increase in future compensation levels | 3.0 | % | 3.5 | % | 3.0 | % | 3.3 | % | ||||||||
| OPEBs | OPEBs | OPEBs | ||||||||||||||||||||||
| 2011 | 2012 | 2013 | ||||||||||||||||||||||
| Weighted average assumptions to determine net cost | United States Plans | Canadian Plans | United States Plans | Canadian Plans | United States Plans | Canadian Plans | ||||||||||||||||||
Discount rate | 5.1 | % | 5.3 | % | 4.0 | % | 5.3 | % | 3.5 | % | 4.4 | % | ||||||||||||
Health care cost trend rate | 7.5 | % | 6.8 | % | 8.0 | % | 4.5 | % | 7.5 | % | 4.5 | % | ||||||||||||
Prescription drug cost trend rate | N/A | 10.0 | % | N/A | 10.0 | % | N/A | 10.0 | % | |||||||||||||||
Rate to which the prescription cost trend rate is assumed to decline | N/A | 4.5 | % | N/A | 4.5 | % | N/A | 4.5 | % | |||||||||||||||
Year the rate reaches the ultimate trend rate | N/A | 2024 | N/A | 2024 | N/A | 2024 | ||||||||||||||||||
| OPEBs | OPEBs | |||||||||||||||
| 2012 | 2013 | |||||||||||||||
| Weighted average assumptions to determine benefit obligations | United States Plans | Canadian Plans | United States Plans | Canadian Plans | ||||||||||||
Discount rate | 3.5 | % | 4.4 | % | 4.4 | % | 4.9 | % | ||||||||
Health care cost trend rate | 8.0 | % | 4.5 | % | 8.0 | % | 4.5 | % | ||||||||
Prescription drug cost trend rate | N/A | 10.0 | % | N/A | 10.0 | % | ||||||||||
Rate to which the prescription cost trend rate is assumed to decline | N/A | 4.5 | % | N/A | 4.5 | % | ||||||||||
Year the rate reaches the ultimate trend rate | N/A | 2024 | N/A | 2024 | ||||||||||||
We do not expect a significant change in the above mentioned assumptions in the future. As of December 31, 2013, we were exposed to assumed health care cost trend rates. A one-percentage-point change in assumed health care cost trend rates would have the following effects:
| United States Plans | Canadian Plans | United States Plans | Canadian Plans | |||||||||||||||||||||||||||||
| Year Ended December 31, 2012 | Year Ended December 31, 2012 | Year Ended December 31, 2013 | Year Ended December 31, 2013 | |||||||||||||||||||||||||||||
| 1% Increase | 1% Decrease | 1% Increase | 1% Decrease | 1% Increase | 1% Decrease | 1% Increase | 1% Decrease | |||||||||||||||||||||||||
Effect on accumulated post-retirement benefit obligation | $ | 315 | $ | (285 | ) | $ | 2,425 | $ | (1,928 | ) | $ | 243 | $ | (221 | ) | $ | 891 | $ | (943 | ) | ||||||||||||
Effect on total service and interest cost components | 14 | (13 | ) | 132 | (106 | ) | 14 | (13 | ) | 154 | (122 | ) | ||||||||||||||||||||
82
Table of Contents
Recent accounting pronouncements
The following accounting pronouncements were issued in 2013 and 2014 which the Company has not yet adopted.
In July 2013, an accounting standard update was issued which requires the netting of unrecognized tax benefits (UTBs) against a deferred tax asset for a loss or other carryforward that would apply in settlement of the uncertain tax positions. UTBs are required to be netted against all available same-jurisdiction losses or other tax carryforwards that would be utilized, rather than only against carryforwards that are created by the UTBs. The revised standard becomes effective and will be adopted by the Company for the year ending December 31, 2014. The adoption of this standard is not expected to have a material impact on the Company’s consolidated financial position, results of operations or cash flows.
In May 2014, an accounting standard update was issued which provides a comprehensive new revenue recognition model that requires a company to recognize revenue to depict the transfer of goods or services to a customer at an amount that reflects the consideration it expects to receive in exchange for those goods or services. The guidance also requires additional disclosure about the nature, amount, timing and uncertainty of revenue and cash flows arising from customer contracts. This update is effective for annual and interim periods beginning after December 15, 2017. Early application is not permitted. This update permits the use of either the retrospective or cumulative effect transition method. The revised standard becomes effective and will be adopted by the Company for the year ending December 31, 2017. The Company is currently analyzing the potential impact of adoption of this standard on the Company’s consolidated financial position, results of operations, and cash flows.
In April 2014, an accounting standard update was issued which modifies the requirements for reporting discontinued operations. Under the standard update, the definition of discontinued operations has been modified to only include those disposals of an entity that represent a strategic shift that has (or will have) a major effect on an entity’s operations and financial results. This update also expands the disclosure requirements for disposals that meet the definition of discontinued operations and requires entities to disclose information about disposals of individually significant components that do not meet the definition of discontinued operations. This update is effective for annual and interim periods beginning after December 15, 2014. Early application is permitted. The revised standard becomes effective and will be adopted by the Company for the year ending December 31, 2014. The adoption of this standard is not expected to have a material impact on the Company’s consolidated financial position, results of operations or cash flows.
In June 2014, an accounting standard update was issued which modifies the accounting for stock-based compensation. The new standard requires a performance target that affects vesting and that could be achieved after the requisite service period to be treated as a performance condition. The current accounting standard for stock-based compensation as it applies to awards with performance conditions should continue to be applied. The guidance is effective for annual and interim periods beginning after December 15, 2015. The revised standard becomes effective and will be adopted by the Company for the year ending January 1, 2016. The adoption of this standard is not expected to have a material impact on the Company’s consolidated financial position, results of operations, or cash flows.
83
Table of Contents
Industry Overview
North America is among the largest steel markets globally with finished steel product demand exceeding 140 million tons in 2013 according to the World Steel Association, representing nearly 9% of total global demand and approaching 2008 pre-recession levels. Steel production is an important component of the manufacturing economy in North America and steel is used in a broad variety of applications including rail, construction, automotive, energy, machinery and equipment, container, appliances, defense, and other end markets. Generally, steel demand in North America follows overall economic activity. Crude steel production in North America in 2013 exceeded 129 million tons, with approximately 109 million tons consumed in North America, representing approximately 77% of North American steel demand and approximately 20 million tons exported. The vast majority of steel is produced locally as local steel producers benefit from lower freight costs and shorter lead times compared to imported products.
Within the North American steel industry, we focus on a select group of attractive end markets with demanding applications requiring engineered products. Rail and energy (exploration, production, and transmission) products, collectively, represented approximately 66% of our shipments by volume in 2013.
End Market Overview
Rail
North American rail demand was approximately 1.0 million tons in 2010, 1.2 million tons in 2011, and 1.2 million tons in 2012 based on the American Railway Engineering and Maintenance-of-Way Association (AREMA) data and the NAFTA Steel Trade Monitor data. Pending confirmation by AREMA, our internal analysis estimates rail demand of approximately 1.3 million tons in 2013.
Historically, rail demand exhibits high correlation with Class I railroads capital expenditures. Total capital expenditures by Class I railroads reached $15.5 billion in 2013, up from $6.0 billion in 2000. We believe the improving economic environment in North America, increases in overall transport volumes, and increases in carloads originations related to oil by rail are favorable to the rail market and will continue to drive high levels of capital expenditures.
We expect replacement of existing track, as well as development of new tracks, to alleviate anticipated congestion on existing tracks and to be primary growth drivers of volume. We also expect that these factors will continue to drive the adoption of premium rail to increase track life, extend maintenance intervals, and support greater axle loads. Class I railroads maintenance and replacement requirements have historically resulted in steady rail demand, and we believe this trend will continue.
We estimate the factors discussed above will drive North American rail demand growth of approximately 3% to 4% annually from 2014 to 2018. In addition, the United States HSR program’s $10.1 billion funding for projects provides an incremental growth platform for the United States rail industry.
Wire Rod
Our wire rod and coiled rebar products primarily serve construction, infrastructure and manufacturing sectors. According to Metal Bulletin Research, demand for wire rod and rebar in the United States and Canada totaled 8.8 million, 8.7 million, and 10.1 million tons for years 2011, 2012, and 2013, respectively. Metal Bulletin Research data indicates that the combined United States wire rod and rebar market is expected to grow at approximately 2.7% annually through 2020.
84
Table of Contents
In the United States, readings of the leading indicators of demand for wire rod appear to support improving trends in demand. The Institute for Supply Management Purchasing Managers Index, a leading indicator of United States manufacturing growth, reached 56.6% in September 2014, indicating manufacturing industry expansion. Additionally, the Architectural Billings Index, a leading indicator of the construction sector, reached 53.0 in August 2014, also indicating growth. Additionally, private non-residential construction spending is currently exceeding the 10-year average.
The rebar market has experienced increased imports since the fourth quarter of 2012 as a result of global excess capacity. Several United States rebar producers have responded by submitting an anti-dumping petition against imports from Turkey and Mexico.
On September 9, 2014 the U.S. Department of Commerce announced an affirmative final determination in the antidumping duty investigation of imports of rebar from Mexico, an affirmative final determination in the countervailing duty investigation of imports of rebar from Turkey, and a negative final determination in an antidumping investigation of imports of rebar from Turkey. On October 14, 2014, the U.S. International Trade Commission voted affirmatively that the U.S. industry is materially injured by reason of imports of rebar from Mexico and from Turkey that are subsidized by the government of Turkey. This ruling in favor of U.S producers would improve the supply environment for these products.
Large Diameter Pipe (LD Pipe)
Our LD Pipe products are primarily used in construction of oil and gas transmission pipelines. We believe that approximately 930Kt of LD Pipe was sold in the United States and Canada in 2013. In response to rising oil and gas production in the United States and Canada, pipeline operators have announced transmission pipeline projects (see table below). Projects that pipeline operators expect to put in service between 2016 and 2018 are expected to require approximately 4.9 million tons of LD Pipe. Western Canada is expected to account for approximately 2.3 million tons of this demand.
Although pipeline approvals timing is difficult to predict, we believe these projects have a strong set of fundamentals that make approval likely. Canada has the third largest oil reserves of any country in the world, and the Canadian oil sands contain approximately 55% of all privately investable oil reserves, according to the Canadian Association of Petroleum Producers, or CAPP. These reserves are generally land-locked and industry sources estimate existing pipelines in Western Canada are already operating at approximately 88% of their total capacity. Additionally, most Western Canadian pipelines transport oil to the Midwest resulting in oversupply of oil in that region and discounts on Canadian oil versus world prices. In 2013, CIBC estimated that lack of pipeline capacity will cost Canada about $15 billion a year in lost revenues.
85
Table of Contents
The following table lists the announced LD Pipe projects in the United States and Canada.
Primary Pipeline Region | Operator | Project | Announced in- service dates | Pipeline length (miles) | Estimated LD Pipe use (Kt) | |||||||||
Western Canada | Enbridge | Line 3 | 2H 2017 | 1,031 | 620 | |||||||||
TransCanada | Pacific Northwest LNG (Prince Rupert) | Late 2018 | 559 | 560 | ||||||||||
Spectra | Spectra / BG Group Natural Gas Transportation System | 2019 | 525 | 540 | ||||||||||
Chevron | Northern Gateway | 2018 | 731 | 440 | ||||||||||
Kinder Morgan | Trans Mountain Expansion | Late 2017 | 618 | 330 | ||||||||||
Chevron | Pacific Trail Pipeline | Late 2016 | 298 | 230 | ||||||||||
TransCanada | Energy East (to New Brunswick) | 2018 | 2,858 | 140 | * | |||||||||
TransCanada | Coastal Gas Link LNG | By 2020 | 404 | 190 | ||||||||||
TransCanada | Merrick Mainline | Q1 2020 | 162 | 170 | ||||||||||
|
|
|
|
|
|
|
| |||||||
Eastern Canada | TransCanada | Energy East (to New Brunswick) | 2018 | 2,858 | 602 | * | ||||||||
TransCanada | Eastern Mainline | 2016 | 155 | 130 | ||||||||||
|
|
|
|
|
|
|
| |||||||
Midwest U.S. | Energy Transfer | Dakota Access | End of 2016 | 1,100 | 470 | |||||||||
Dominion | Atlantic Coast Pipeline | Late 2018 | 550 | 350 | ||||||||||
Spectra | NEXUS Gas | 2017 | 250 | 150 | ||||||||||
Enbridge | Sandpiper | Q2 2016 | 616 | 100 | ||||||||||
|
|
|
|
|
|
|
| |||||||
Eastern U.S. | Energy Transfer | Rover | 4Q 2016 / 2Q 2017 | ~800 | 400 | |||||||||
|
|
|
|
|
|
|
| |||||||
Southern U.S. | Spectra | Sabal Trail | May 2017 | 476 | 280 | |||||||||
|
|
|
|
|
|
|
| |||||||
Oregon | Williams | Pacific Connector | Q4 2017 | 230 | 140 | |||||||||
|
|
|
|
|
|
|
| |||||||
* Energy East project has West and East components totaling 742 Kt | Totals | ~11,363 | 5,842 | |||||||||||
Sources: Simdex and press releases
The LD Pipe market remains competitive. We estimate that average capacity utilization for other LD Pipe producers in the United States was approximately 26% in 2013, and a number of LD Pipe mills have been idled recently due to failure to meet stringent quality requirements of pipeline operators and disadvantaged geographical locations.
Oil Country Tubular Goods (OCTG)
The North American OCTG market consists of pipe used in oil and gas exploration and production, including casing, tubing, and drilling pipe. We believe growth in horizontal and unconventional drilling in Western Canada and the United States will continue driving OCTG demand. In Western Canada, the projected growth is supported by development of oil sand reserves that are expected to more than double oil production in the country by 2030. Within the broader North America OCTG market, demand is underpinned by unconventional drilling of shale oil and gas. According to Metal Bulletin Research, the combined United States and Canadian OCTG market is expected to grow at a 5% annual compounded growth rate from 2014 – 2020.
Our OCTG mills are located in close proximity to three large oil and gas producing regions in North America: Western Canada, Bakken, and Rockies. According to Preston Pipe 2013 data, OCTG use in the Bakken and Rockies was 0.5 million tons and 0.4 million tons, respectively. According to a recent Canada Border
86
Table of Contents
Services Agency OCTG trade complaint, total Canadian OCTG demand was 1.1 million tons in 2013. Collectively these regions represented approximately 2.0 million tons of OCTG demand, or approximately 29% of the overall United States and Canadian OCTG demand in 2013.
Unconventional drilling techniques (requiring deeper-longer wells) and horizontal drilling are expected to drive an increase in demand for engineered products, such as premium heat-treated pipe and premium connections, and decrease the share of commodity carbon steel pipe. In Canada, for example, premium connections are required for wells in the oil sands utilizing steam assisted gravity drainage technology given the high mechanical and thermal stress requirements.
For the past several years, we faced increased competition from foreign-based manufacturers that export OCTG pipe into the United States and Canada, resulting in downward pricing pressure and a growth in industry inventory balances. On August 22, 2014, the US International Trade commission announced an affirmative injury determination in an OCTG case against six countries, including South Korea, imposing immediate duties for these countries (excluding Ukraine, where duties were suspended). We expect that the imposition of the duties would have a positive effect on North American OCTG pricing in the near term. In July 2014, the Canada Border Services Agency, or CBSA, initiated an investigation into dumping and subsidization of OCTG in Canada from nine countries. A preliminary ruling is expected by December 2014. We also expect the US Commerce Department August 22, 2014 OCTG ruling discussed in “—Long Division-Steel Supply” to similarly affect our Tubular Division’s OCTG products.
Plate
The North American plate market consists of carbon and alloy plate rolled as discrete or coiled plate. According to CRU, discrete and coiled plate demand in North America was approximately 15.9 million tons in 2013 and is expected to grow at 4% annually between 2013 and 2016 with steady growth across most of the end markets. We believe the Western Northern America plate market that we serve was approximately 9% of the overall North American plate market in 2013 and that we held approximately 54% share in that market. We expect that in 2014 overall plate demand will be approximately equal to the pre-crisis volume of 2008.
Our key end markets include transportation, rail cars, heavy equipment, engineering, construction, line pipe and OCTG, wind farms, armor, and ship building. During 2014, we have seen strong growth across railcar and power transmission as well as improvements in non-residential construction activity.
87
Table of Contents
Overview
We are a leading North American producer of engineered steel products for the rail, energy, and industrial end markets. We are the largest producer by volume in the North American rail market and in the North American LD Pipe market, with estimated market shares of 39% and 47%, respectively, in 2013. We also held leading positions in the Western Canada OCTG, SD Pipe, and West Coast plate markets in 2013.
We operate six production sites strategically located close to key markets demonstrating favorable growth dynamics, including the Western North American LD Pipe, OCTG, and rail markets. Rail and energy (exploration, production, and transmission) products, collectively, represented approximately 66% of our shipments by volume in 2013. Collectively, our facilities have an effective annual capacity of approximately 3.5 million tons of finished steel products. In addition to our rail, LD Pipe and OCTG mills, we operate the only plate mill on the West Coast, a wire rod mill in Pueblo, Colorado, and we process scrap in several Canadian provinces and in Colorado and North Dakota, which, collectively, provide approximately a third of the scrap used in our steel making operations.
Our focus on engineered products and our strong customer relations favorably positions us to benefit from volume and margin growth in our key markets. The close proximity of our production sites to our customers provides us with freight and other logistical benefits that support our position as a low cost producer on a delivered basis. We serve a diversified and high quality customer base, much of which is comprised of well-known industry leaders. We have longstanding relationships and technical partnerships with many of our key customers, and believe we are the preferred supplier for many of our key customers’ critical applications. Taken together, these factors constitute competitive advantages that support our leadership positions in the markets we serve.
We organize our operations into three segments: Long Division, Tubular Division, and Flat Division.
| • | Long Division:Our Long Division, based in Pueblo, Colorado, is the largest domestic United States producer of premium rail and the only rail producer in the Western United States, a region that we believe accounted for a majority of North American rail demand in 2013. We operate an EAF furnace, round billet caster, and hot-rolling mills that produce rail, seamless pipe, and wire rod. As the only large consumer of scrap in Colorado, we believe that we enjoy a cost advantage on shredded scrap (our largest raw material by volume) compared to the industry benchmark for Midwest shredded scrap prices. In 2013, total sales volume for our Long Division was 983Kt. |
| • | Tubular Division: Our Tubular Division is the largest North American producer of LD Pipe, which is used in oil and gas transmission, and the only supplier of fully “Made in Canada” LD Pipe. We expect that development of oil sands and shale formations in Western Canada and the United States will lead to significant near term investments in infrastructure, including new pipelines, in order to access key energy markets. We are also the largest OCTG producer in Western Canada, where we operate the only OCTG heat treat line in the region. This gives us the ability to produce heat treated pipe typically required in the demanding non-conventional drilling applications used in shale and oil sands exploration. Our Tubular Division has sites in three regions: Saskatchewan, Alberta, and Oregon. In Regina, Saskatchewan, our site consists of two EAFs and a slab caster that feeds a mill that primarily rolls slab into coiled plate used in our pipe facilities. At this site we also operate four HSAW LD Pipe mills and two straight seam ERW mills. In Alberta, we operate sites in Calgary, Red Deer, and Camrose with a total of three straight seam ERW pipe mills, three API and two premium threading lines, a heat treat facility, and one LSAW LD Pipe mill. In Portland, Oregon, we operate two HSAW LD Pipe mills. In 2013, total sales volume for our Tubular Division was 1,023Kt. |
88
Table of Contents
| • | Flat Division:Our Flat Division, based in Portland, Oregon, operates the only plate mill on the West Coast. Our proximity to deep water ports allows us to cost effectively source slabs from foreign suppliers. At this site we also operate a structural tube mill, a slitting line, and a quench and tempering facility for plate. In 2013, total sales volume for our Flat Division was 798Kt. |
We have a high degree of vertical integration across our operations that enhances operational efficiency, reduces logistics costs, and makes us less reliant on outside suppliers. Our recycling operations supply us with approximately a third of our scrap needs. We produce substantially all of the billets used in our rail, seamless, and wire rod mills. In 2013, we produced substantially all the slab consumed at our Regina site and the coil and plate consumed by our tubular mills.
For the nine months ended September 30, 2014, we sold 2.1 million tons of steel products which generated total sales of $2,358.8 million, Adjusted EBITDA of $234.9 million, net income attributable to EVRAZ NORTH AMERICA LIMITED of $55.3 million, and net cash used in continuing operating activities of $127.5 million.
For the nine months ended September 30, 2013, we sold 1.9 million tons of steel products which generated total sales of $2,010.1 million, Adjusted EBITDA of $127.1 million, net loss attributable to EVRAZ NORTH AMERICA LIMITED of $6.6 million, and net cash provided by continuing operating activities of $60.6 million.
In 2013, we sold 2.5 million tons of steel products which generated total sales of $2,748.9 million, Adjusted EBITDA of $176.0 million, net loss attributable to EVRAZ NORTH AMERICA LIMITED of $709.3 million, and net cash provided by continuing operating activities of $116.1 million. Adjusted EBITDA is a non-GAAP financial measure. See “Summary Consolidated Financial Information and Other Data—Adjusted EBITDA” for a description of how we define and calculate Adjusted EBITDA and for a reconciliation of Adjusted EBITDA to net income (loss) attributable to EVRAZ NORTH AMERICA LIMITED.
Competitive Strengths
Leading positions across the markets we serve
We currently have the number one position in North American rail, North American LD Pipe, Western Canada OCTG, and Western North American plate markets.
Rail—We are the largest producer of rail in North America based on volume with approximately 39% share of the North American market in 2013 and approximately 55% share of the Western North America market in 2013, where we are the only rail producer. We believe that our customers, Class I railroads, regard us as the preferred domestic source of highly engineered premium rail, which reduces our customers’ lifecycle cost and improves rail safety. We believe that our technical and product development capabilities and our next generation of premium rail products, that are in the process of being launched, provide us with a strong and defensible position. Our leading position in the North American rail market has allowed us to achieve consistently high utilization rates at our rail-producing facilities.
LD Pipe—We are the largest producer of LD Pipe in North America, with an estimated market share of approximately 47% in 2013 based on volume. We are also the only producer of LD Pipe in Canada and the only source of fully “Made in Canada” LD Pipe, which we believe is a significant advantage in Canada as we believe our customers value locally produced LD Pipe. We also believe that our customers value the high quality of our products and our strong technical capabilities. Furthermore, operating LD Pipe mills in three locations (Regina, Saskatchewan; Camrose, Alberta; and Portland, Oregon), gives us the unique ability to produce the specific type of LD Pipe our customers require in an optimal location.
OCTG—We are the largest OCTG producer in Western Canada, where in 2013 our facilities accounted for approximately 72% of the total finished OCTG production capacity in the region. We produce a range of casing and tubing products used by our customers in many of their oil and gas exploration and production applications.
89
Table of Contents
We believe that we are regarded as a high quality supplier. We are also the only OCTG producer in Western Canada with a heat treat facility to supply the heat-treated pipe and premium connections required in that market. We have a wide range of products, including our own proprietary premium connections, and have over 20 years of experience with premium connections required by the thermal wells drilled in the oil sands of Alberta.
Plate—We are the only plate producer in the West Coast and have consistently operated at nearly full effective capacity since 2010. We believe our ability to roll custom sizes within short lead times is a competitive advantage compared to other domestic producers and to imports. We believe we held the leading position in the West Coast market and that we were the largest supplier of plate for most of our customers’ purchases in the region in 2013.
Operations strategically located to benefit from growth in the energy and rail markets
We forecast strong growth of LD Pipe demand to support increased oil and gas production in Canada and the United States. We estimate that in 2013, LD Pipe demand in the United States and Canada was 930Kt. We estimate that the announced projects that pipeline operators expect to put in service between 2016 and 2018 will require approximately 4.9 million tons of LD Pipe. Projects announced in Western Canada alone are expected to require 2.3 million tons of LD Pipe. We believe that our close relationships with key customers, track record of product performance, lower transportation costs as compared to those of our competitors (due to the location of our facilities), and expertise in meeting low temperature impact requirements will enable us to capture a significant share of these volumes.
Growth of unconventional drilling in Western Canada and the United States is expected to result in higher OCTG use. Metal Bulletin Research estimates United States and Canadian OCTG demand will grow at a 5% CAGR between 2014 and 2020. Our OCTG mills are optimally located to supply three large oil and gas producing regions in North America: Western Canada, the Bakken, and the Rockies, which collectively consumed approximately 2.0 million tons of OCTG in 2013 (approximately 29% of the overall United States and Canada OCTG demand). We estimate that the location of our OCTG mills provided us with a freight advantage to serve Western Canada of approximately $100 per ton in 2013 compared to OCTG mills located in Texas, as well as a freight advantage compared to Asian imports.
We believe that North American rail demand growth will be in the range of 3% to 4% annually between 2014 and 2018, primarily due to increased annual investments by Class I railroads. Class I railroads’ investments in infrastructure and equipment increased from $6.0 billion in 2000 to $15.5 billion in 2013, underpinning growth in rail demand. We also expect that the North American market will continue shifting towards premium rail, as railroads seek to alleviate rail corridor congestion, operate with increased axle loads, and support increased shipments volumes related to the energy market and intermodal freight.
Western rail demand accounted for approximately 58% of the overall North American rail demand in 2013. Our recently upgraded rail mill in Pueblo, Colorado is the only North American rail producer located west of the Mississippi River and has direct access to the Burlington Northern Santa Fe and the Union Pacific railroads, our two largest customers, resulting in low delivery costs to these customers.
Engineered products portfolio
A significant proportion of our product mix is comprised of engineered products such as rail, LD Pipe, heat treated OCTG pipe, premium connections, high-carbon wire rod, and armor and wear resistant plate. In these markets, our customers value quality and performance and pay a price premium for products that reduce risk and lifecycle costs. Many of our customers face significant costs of failure, particularly in the LD Pipe and rail markets. As a result, our customers are highly conscious of the value of supplier reliability and of the risks associated with switching suppliers and typically require suppliers to undergo qualification periods that may span several years.
90
Table of Contents
We continue to shift our product mix further towards engineered products and are investing in incrementally expanding our capacity and capabilities. Our three technology centers support product and process design, full-scale testing, and work closely with our customers to build upon our position as their technical partner. This allows us to gain important insights into the dynamics of our end markets and proactively adjust our product portfolio to meet changing demands.
In rail, demand continues to shift towards premium products that extend track life and reduce failure risks. As a result, premium rail in North America represented approximately 66% of rail demand in 2012 compared to 60% in 2010. Premium rail is typically priced at a premium to standard rail, reflecting the value customers ascribe to lifecycle cost and risk reduction associated with premium rail. We believe that our customers perceive us as a high quality domestic producer of premium rail, particularly deep head-hardened rail. Since we introduced head hardened rail 20 years ago, we have developed strong technical partnerships (engineering, maintenance, and research and development) with our customers. Currently, we are in the testing stages of our sixth generation of premium rail, which offers enhanced wear resistance and fracture toughness.
In OCTG, the increase in unconventional drilling for oil and gas requires high performance pipe products to withstand significant thermal and mechanical stresses and highly corrosive conditions. To meet these challenges, drilling companies use heat treated pipe to provide higher yield strength and utilize premium connections to provide seal integrity under the most demanding conditions. We operate the only OCTG heat treating line in Western Canada and have a portfolio of proprietary premium connections that are designed for applications in the Alberta oil sands and for other non-conventional drilling.
In LD Pipe, our customers continue to seek to improve weldability and enhance the safety of their pipelines. We leverage our research and development capabilities and work closely with customers to develop new steel chemistries and manufacturing processes to achieve higher levels of product performance, and to reduce the risk of pipeline incidents.
Defensible market positions and operations with low delivered costs
We believe that our leading market positions are highly defensible as a result of our engineered product know-how and design capabilities, existing product qualifications and track record of quality and reliability, established customer relationships with industry leaders, as well as the proximity of our facilities to customer demand and the significant investment required to replicate our asset base.
We believe that we are a low cost North American producer on a delivered basis for our key products in our key markets. Our operations are located in close proximity to our customers, giving us freight and other logistical advantages. We also believe that our high levels of utilization and productivity reduce our overall labor and fixed costs per ton.
Our recently upgraded rail mill in Pueblo, Colorado, is the only North American rail mill located in the Western United States. It also benefits from direct access to our largest rail customers. As a result, we incur minimal delivery costs for rail delivered to these railroads.
We utilize EAF technology at our melt shops in Regina and Pueblo, where we have cost-advantaged sources of local scrap that provide us with a significant portion of our raw material needs. Our recycling facilities supplied 46% of our Regina and 25% of our Pueblo scrap requirements in 2013. In addition, our recycling operations provide us with insight into the scrap market pricing dynamics. Our plate mill in Portland benefits from close proximity to a deep water port and access to the overseas slab market.
New market entrants face significant challenges and significant capital investments in order to establish themselves. For example, entering the rail market requires significant scale of operations, long qualification periods, and slow adoption rates by railroad customers. The LD Pipe market is primarily project-based, making it
91
Table of Contents
challenging for new entrants to secure sufficient production volumes to establish themselves. Additionally, LD Pipe customers favor producers with an established track record of quality and reliability.
Financial strength with volume growth and continued margin enhancement
Between 2011 and 2013 we achieved annual average Adjusted EBITDA of $320.3 million, annual average net cash provided by continuing operating activities of $298.3 million, annual average net loss of $184.1 million and annual average Adjusted EBITDA per ton of $128.
Our diversified product portfolio allows us to adjust our product mix to respond to changes in market dynamics, resulting in our melt shops in Regina and Pueblo historically operating at high utilization rates. Our Long Division can flex volume allocation across rail, wire rod and seamless pipe to maximize profitability based on market dynamics. Similarly, our Tubular Division’s Regina site can flex volumes across OCTG, SD Pipe, LD Pipe, plate and coil. Our steelmaking capacity can be supplemented with coil, plate, or billet purchases.
We have a track record of growth through organic investments focused on our existing customers and markets. For example, in 2013, we completed the upgrade and expansion of our Pueblo rail mill and steelmaking facilities, increasing our rail annual capacity to 580Kt. In addition, we upgraded our OCTG premium product capabilities with the addition of premium threading lines. We are currently also in the process of expanding our OCTG heat treat capacity at our Calgary site, and considering a number of other investments that will enable us to continue shifting our mix towards engineered products. In addition, in LD Pipe, we have 310Kt of unused capacity that we expect to utilize as demand in that market continues to grow.
Experienced operating team, supportive shareholder and commitment to strong corporate governance
Our senior management team brings significant experience in strategy and industrial manufacturing. We repositioned our leadership team in 2013 with a number of internal promotions including Conrad Winkler, our Chief Executive Officer and former Executive Vice President of the Long Division. Under Mr. Winkler’s leadership, the management team has sharpened its focus on our core operations and developed a strategy to increase profitability across all of our segments.
EVRAZ Group is a committed and supportive shareholder and will continue to hold a controlling interest in us following the completion of this offering. We believe we will continue to benefit from our relationship with EVRAZ Group, through EVRAZ Group’s global perspective, industry experience and operational execution. Our cooperation with EVRAZ Group is also demonstrated by our slab supply arrangement with EVRAZ Group.
We and EVRAZ Group are committed to strong corporate governance consistent with United States corporate standards, and following the offering will have a Board of Directors comprised of a majority of independent Directors as defined under the Nasdaq rules.
Business Strategy
Grow in the markets we lead
We intend to fully utilize the production capacity of our Portland and Camrose LD Pipe facilities to meet market demand, while investing in further improving quality across our steel value chain. In addition to fully utilizing our current capacity at Portland and Camrose, we intend to make incremental investments in our LD Pipe mills and steelmaking facilities to further improve our capabilities and quality to meet the growing demand.
We are increasing OCTG heat treat capacity in Western Canada and expanding the production of high-value premium connections. We are currently expanding our heat treat capacity at EVRAZ Calgary, and evaluating installing heat treat capacity in Red Deer to increase output. In addition, we are expanding our premium connections portfolio to fully utilize the capacity of our threading lines in Red Deer.
92
Table of Contents
We are leveraging our recent rail technology center and rail mill investments to increase our profitability. We are utilizing the capabilities of our recently upgraded rail mill and steel making assets to achieve 580Kt annual shipments and to continue increasing the proportion of premium rail in our sales mix. We aim to continue investing in improving the performance of our rail through development of next generation products and improved processing methods.
Expand our portfolio of engineered products and technical partnerships
We will continue to leverage our technology centers to deepen technical relationships with our customers and continue developing cost-effective engineered products that meet their demanding requirements.
We intend to deepen our technical relations with our rail and LD Pipe customers to develop products that deliver superior reliability and lifecycle cost.
We are expanding our premium OCTG connections portfolio in order to develop a more complete coverage of sizes and applications.
We plan to commercialize our sixth generation of premium rail, which offers superior wear resistance and fracture toughness. We expect to complete testing and work with our Class I railroad customers to fully achieve the lifecycle benefits of the higher wear resistance and fracture toughness in our next generation rail products.
Continuously improve our safety, quality and cost
We intend to become an industry leader in safety practices and relentlessly pursue an injury free workplace. We have reduced our lost time incident rate by more than 80% since 2010 and aim to continue improving on this position through close employee engagement.
We aim to extend our lead in quality across our operations through the application of our quality system, new process technology, and an expanded quality organization. We intend to continue working closely with our customers to continue offering a highly reliable supply chain.
We are focusing our resources on continuously improving yield and throughput to maintain our low cost position in the markets we serve. We believe that our ability to improve operations through Lean Manufacturing and other techniques will continue to allow us to make significant strides across our businesses in the coming years.
We continue to capitalize on the cost advantages of our vertical integration. We intend to improve upon our already favorable raw material costs by optimizing our rolling schedules, scrap recipes, and sourcing among our recycling business, local third party scrap purchases, and scrap substitutes.
History and Development
We have developed our current business through the following strategic acquisitions:
| • | In January 2007, Evraz Group S.A. acquired Oregon Steel Mills, Inc., a United States-based producer of specialty and commodity steel products, including rail, plate, coil, large-diameter, and small-diameter line pipe for oil and gas transmission, seamless pipe, structural tubing, wire rod, and bar. |
| • | In January 2008, Evraz Group S.A. acquired Claymont Steel, a United States mini-mill producer of steel plate and an operator of finishing facilities. We idled the EVRAZ Claymont site on December 1, 2013. Currently, we do not have any plans to restart production at this site. As of June 30, 2014, EVRAZ Claymont is reflected in our consolidated financial statements as a discontinued operation and assets and liabilities held for sale. |
93
Table of Contents
| • | In June 2008, Evraz Group S.A. acquired the Canadian steel and pipe business of IPSCO, Inc., which comprised a mini-mill producer of coiled and discrete plate and three tube mills producing large-diameter and small-diameter line pipe and OCTG. This transaction included the subsidiaries of IPSCO, Inc., including General Scrap Inc., and General Scrap Partnership, two companies that collect, process, recycle, trade, and broker metal. |
Divisions
We organize our business in three segments—Long Division, Tubular Division, and Flat Division. The tables below show tons sold by division for the periods indicated.
| Nine Months Ended September 30, | ||||||||||||
Division | 2013 | 2014 | Change (%) | |||||||||
| (tons in thousands) | ||||||||||||
Long | 729 | 765 | 5 | % | ||||||||
Tubular | 748 | 850 | 14 | % | ||||||||
Flat | 580 | 656 | 13 | % | ||||||||
Intercompany eliminations | (206 | ) | (195 | ) | (5 | )% | ||||||
|
|
|
|
|
| |||||||
Total | 1,851 | 2,076 | 12 | % | ||||||||
|
|
|
|
|
| |||||||
Total sales volumes increased from 1,851Kt sold in the nine months ended September 30, 2013 to 2,076Kt sold in the nine months ended September 30, 2014.
| Year Ended December 31, | 2011 vs. 2012 Change (%) | 2012 vs. 2013 Change (%) | ||||||||||||||||||
Division | 2011 | 2012 | 2013 | |||||||||||||||||
| (tons in thousands) | ||||||||||||||||||||
Long | 946 | 987 | 983 | 4 | % | 0 | % | |||||||||||||
Tubular | 1,021 | 1,018 | 1,023 | 0 | % | 0 | % | |||||||||||||
Flat | 839 | 802 | 798 | (4 | %) | 0 | % | |||||||||||||
Intercompany eliminations | (306 | ) | (304 | ) | (286 | ) | (1 | %) | (6 | %) | ||||||||||
|
|
|
|
|
|
|
|
|
| |||||||||||
Total | 2,500 | 2,503 | 2,518 | 0 | % | 1 | % | |||||||||||||
|
|
|
|
|
|
|
|
|
| |||||||||||
Total sales volumes increased slightly from 2,500Kt sold in 2011 to 2,503Kt sold in 2012 and further increased slightly to 2,518Kt sold in 2013.
The following tables provide a breakdown of our sales by geographic market and by business activity for each of the last three financial years.
| Year ended December 31, | ||||||||||||
| 2013 | 2012 | 2011 | ||||||||||
| ($ in millions) | ||||||||||||
External product sales based on sales destination: | ||||||||||||
United States | $ | 1,426.5 | $ | 1,655.9 | $ | 1,503.7 | ||||||
Canada | 1,134.5 | 1,086.7 | 1,345.1 | |||||||||
Other | 23.9 | 25.9 | 47.8 | |||||||||
|
|
|
|
|
| |||||||
Total External Product Sales | 2,584.9 | 2,768.5 | 2,896.6 | |||||||||
Total freight sales | 164.0 | 135.9 | 150.5 | |||||||||
|
|
|
|
|
| |||||||
Total Consolidated Sales | $ | 2,748.9 | $ | 2,904.4 | $ | 3,047.1 | ||||||
|
|
|
|
|
| |||||||
94
Table of Contents
| Year ended December 31, | ||||||||||||
| 2013 | 2012 | 2011 | ||||||||||
External product sales by product type: | ||||||||||||
Rail and wire rod | $ | 683.2 | $ | 724.4 | $ | 702.3 | ||||||
Line pipe | 777.5 | 687.7 | 692.7 | |||||||||
OCTG | 468.4 | 607.7 | 619.8 | |||||||||
Flat-rolled | 549.6 | 674.2 | 809.2 | |||||||||
Other | 106.2 | 74.5 | 72.6 | |||||||||
|
|
|
|
|
| |||||||
Total External Product Sales | 2,584.9 | 2,768.5 | 2,896.6 | |||||||||
Total freight sales | 164.0 | 135.9 | 150.5 | |||||||||
|
|
|
|
|
| |||||||
Total Consolidated Sales | $ | 2,748.9 | $ | 2,904.4 | $ | 3,047.1 | ||||||
|
|
|
|
|
| |||||||
Long Division
Overview
The Long Division produces railroad rails, small diameter API grade seamless pipe, and wire rod at our Pueblo, Colorado site. Our Long Division includes General Scrap, Inc., or GSI, and the Colorado and Wyoming railroad, or C&W. GSI is our wholly owned subsidiary that operates scrap collection and processing facilities in Colorado and North Dakota and supplies the EAF of our Long Division. The C&W is a short line railroad that moves railcars within our site and provides switching, for the Pueblo mill and other customers, to the Burlington Northern Santa Fe and Union Pacific railroads.
Our Long division sold 983Kt of steel products in 2013. The following chart identifies our principal Long Division products and the primary markets for those products:
Products | Markets | |
Rail | Rail and transportation | |
Seamless pipe | Oil and gas exploration and production | |
Wire rod | Industrial production and specialty rod markets Tire manufacture | |
Power transmission Construction |
The following table sets forth the total tonnage of Long Division products sold and tons sold for key products for the periods indicated:
| Year ended December 31, | Nine months ended September 30, | |||||||||||||||||||
| 2011 | 2012 | 2013 | 2013 | 2014 | ||||||||||||||||
| (tons in thousands) | ||||||||||||||||||||
Total | 946 | 987 | 983 | 729 | 765 | |||||||||||||||
(out of which) | ||||||||||||||||||||
Rail | 528 | 546 | 541 | 391 | 441 | |||||||||||||||
Wire rod | 277 | 292 | 316 | 243 | 220 | |||||||||||||||
Seamless pipe | 128 | 110 | 98 | 74 | 90 | |||||||||||||||
Other | 13 | 39 | 28 | 21 | 14 | |||||||||||||||
Rail
According to our estimates, we sold approximately 39% of the total rail volume sold in North America in 2013.
The North American rail market is an attractive, stable market with strong fundamentals. Track maintenance by Class I freight railroads accounts for the majority of demand. Rail maintenance requires Class I railways, such
95
Table of Contents
as Burlington Northern Santa Fe and Union Pacific, to regularly order new rail. Record levels of load originations and increased axle loads drive more frequent track replacement and track expansions, which has resulted in record investment levels by the railroads. According to our estimates, the North American rail market is expected to grow on average at approximately 3% to 4% per annum through 2020. Class I railroads depend on operating safely and with high levels of track availability. For over 20 years, these railroads have invested in premium products that extend rail life. The current high-levels of track utilization are accelerating this trend. We developed premium rail product capabilities 20 years ago, and since that time we have continued to improve performance.
Developing premium rail with the correct wear resistance, hardness at depth, fracture toughness, and weldability is a complex engineering endeavor. We have developed our knowledge base and engineering capabilities over the past 20 years and are now in process of introducing our sixth generation of premium rail. We believe that our investments in establishing a top class rail development site in Pueblo and a technical team with deep rail industry experience and close customers relationships strengthens our rail-technology leadership position.
We produce a comprehensive portfolio of premium rails to optimize life-cycle costs across different track conditions. We are the only North American rail manufacturer in the Western United States, and one of only three rail manufacturers in North America. Our rails are manufactured predominantly in six AREMA section sizes (ranging from 115 lb. per yard through 141 lb. per yard), primarily in 80-foot lengths.
The largest customers for our rail in 2013 were Burlington Northern Santa Fe and Union Pacific railroads. We also have an established presence in the Canadian, Mexican, and Brazilian rail markets and also sold to distributors such as Progress Rail and L.B. Foster Company. Rail is also sold directly to rail contractors, transit districts, distributors, and short-line railroads.
Our primary competitors in the rail products market include ArcelorMittal, Steel Dynamics, Nippon Steel, and other import suppliers.
Seamless pipe
We roll round billets, produced in our Pueblo steelmaking mill, into seamless casing with an outside diameter ranging from 7” to 9 5/8”. The primary use of these products is in oil and gas exploration and production though various extraction techniques.
We sell our seamless pipe primarily through distributors in the United States, such as Colorado Tubulars and Pyramid Tubulars. Our primary competitors in the seamless pipe market include US Steel, Tenaris, TMK, Vallourec, and import suppliers.
Wire rod
We manufacture wire rods, with diameters up to 0.75”, in a variety of low-carbon and high-carbon grades such as those used for tire cord, tire bead, wire rope, and spring wire. We also produce coiled rebar in #3 to #7 sizes for the reinforcement of concrete products.
We sell our wire rod products directly to end users and through distributors. Customers of our wire rod products include Davis Wire and WireCo World group. Our primary competitors in the wire rod products market include Gerdau, ArcelorMittal, Republic Steel, Charter Steel, Ivaco, and import suppliers.
Tubular Division
Overview
Our Tubular Division produces steel pipe used primarily in energy applications: API grade large diameter and small diameter line pipe (LD Pipe and SD Pipe) used for oil and gas transmission and small diameter API
96
Table of Contents
grade welded OCTG pipe for use in oil and gas exploration and production. Our tubular products are manufactured at our Portland, Regina, Red Deer, Camrose, and Calgary sites. In 2013, our Tubular Division sold 1,023Kt of steel products. In addition, our Tubular Division includes General Scrap Partnership, or GSP, our wholly owned subsidiary that operates scrap collection and processing facilities across Canada and supplies our Regina EAF.
The following chart identifies our principal Tubular Division products and the primary markets for those products:
Products | Markets | |
LD Pipe | Oil and gas transmission | |
SD Pipe | Oil and gas transmission | |
OCTG casing and tubing | Oil and gas exploration and production | |
Premium connections | Oil and gas exploration and production |
The following table sets forth total tonnage of our Tubular Division products sold and tons sold for key products for the periods indicated:
| Year ended December 31, | Nine months ended September 30, | |||||||||||||||||||
| 2011 | 2012 | 2013 | 2013 | 2014 | ||||||||||||||||
| (tons in thousands) | ||||||||||||||||||||
Total | 1,021 | 1,018 | 1,023 | 748 | 850 | |||||||||||||||
(out of which) | ||||||||||||||||||||
Line Pipe (LD Pipe & SD Pipe) | 441 | 444 | 584 | 398 | 482 | |||||||||||||||
OCTG casing and tubing | 321 | 297 | 223 | 163 | 224 | |||||||||||||||
Other | 259 | 277 | 216 | 187 | 144 | |||||||||||||||
Large Diameter Pipe (LD Pipe)
We are the largest producer of LD Pipe in North America and the only producer of LD Pipe in Canada. We believe that we held an estimated market share of approximately 47% based on volumes sold in 2013. Our LD Pipe capacity utilization of 61% in 2013 was well above the estimated capacity utilization of 26% for the other major North American producers.
We believe that our industry leading position and utilization rate are largely attributable to our track record of reliable performance, our position as the only supplier capable of producing fully “Made in Canada” LD Pipe, favorable Western North America locations, robust line pipe product offering, strong customer relationships, and leading research and development capabilities. We are one of only two North American producers to operate multiple LD Pipe mills, and we had the largest capacity of any LD Pipe producer in North America in 2013. Our seven LD Pipe mills allow us to offer a line of spiral and straight seam products, provide us flexibility to optimize our operating and freight costs, and provide our customers with industry leading reliability and quality. We also believe that our expertise in steel chemistries that fulfill Canadian low temperature impact toughness requirements gives us a competitive advantage.
We manufacture LD Pipe to a variety of specifications and in sizes ranging from 26” to 60” in outside diameter and in lengths of up to 80 feet. We also offer customers several options, which include internal linings and external coatings. The LD Pipe we produce is used primarily in pressurized underground or underwater oil and gas transmission pipelines.
We sell our LD Pipe products directly to end users. Customers of our LD Pipe products include Enbridge, TransCanada, and Kinder Morgan. Our primary competitors in the LD Pipe market include Berg and Welspun Corp.
97
Table of Contents
In response to rising oil and gas productions in the United States and Canada, pipeline operators have announced transmission pipeline projects that pipeline operators expect to put in service between 2016 and 2018 will require approximately 4.9 million tons of LD Pipe. Approximately 2.3 million tons of this volume are projects in Western Canada. We believe that these projects will result in an average annual LD Pipe demand of 1.6 million tons per year in 2016 through 2018. We believe that our locations, our advantage as the only producer of fully “Made in Canada” LD Pipe, our favorable track record of producing quality products, our expertise in meeting low temperature impact requirements, and close relationships with major customers, will enable us to capture a significant share of LD Pipe demand.
Small Diameter Line Pipe (SD Pipe)
We produce SD Pipe to be used as line pipe in oil and gas transmission. SD Pipe is produced in sizes ranging from approximately 2 3/8” to 24” in outside diameter.
Sales of our SD Pipe products in 2013 were 58% to end users and 42% to distributors. The principal customers for these products are oil & gas companies that use such products to feed larger pipeline systems. Customers of our SD Pipe products include Enbridge and TransCanada. Our primary competitors in the SD Pipe market include US Steel, Tenaris, TMK, and import suppliers.
OCTG Casing and Tubing
We are the largest OCTG supplier in Western Canada where our facilities accounted for approximately 72% of the total threaded and coupled OCTG production capacity in 2013. We produce a range of OCTG products that includes casing, tubing, and connections, with a focus on premium heat treat products and a growing portfolio of premium connections. In a recent customer survey, we were recognized by our OCTG customers as a high quality producer of OCTG products. In addition, as the only OCTG producer in Western Canada with a heat treat facility, we are uniquely positioned to take advantage of the increasing shift to heat treat pipe and premium threading and connections required by the more demanding horizontal and unconventional drilling applications.
OCTG demand in Canada and the United States was approximately 7.0 million tons in 2013 making this region the largest global market for OCTG. Horizontal and unconventional drilling in Western Canada and the United States is expected to continue driving OCTG demand growth. Metal Bulletin Research expects demand to grow at 5% annually between 2014 and 2020. Within the broader North America OCTG market, our mills are ideally located to supply three large oil and gas producing regions: Western Canada, the Bakken, and the Rockies, which collectively consumed approximately 2.0 million tons, or approximately 29% of the overall United States and Canada OCTG market in 2013. The continued development of oil sands and natural gas fields in Western Canada is expected to support OCTG growth within the Canadian market once new pipelines are built. We estimate that the location of our OCTG mills provides us with a freight advantage to Western Canada of approximately $100 per ton compared to OCTG mills located in Texas, and also an advantage when compared to Asian imports.
In 2013, substantially all of our OCTG products were sold to distributors who re-sell these products for use in oil and gas exploration and production. Distributors of OCTG products include Hallmark Tubulars, Alberta Tubular Products, and SB Navitas. Our primary competitors in the OCTG market include Tenaris, Vallourec, US Steel, and import suppliers.
Flat Division
Overview
Our Flat Division manufactures steel plate, coil, and structural tubing and cut-to-length steel products used in the construction of liquid storage tanks, vessels, bridges, rail cars, armor, and coil used in various applications. These products are manufactured at our Portland facilities and, until December 1, 2013, were also manufactured at our EVRAZ Claymont site.
98
Table of Contents
In 2013, our Flat Division sold 798Kt of steel products, including 203Kt sold to our Tubular Division. The following chart identifies our principal flat products and the primary markets for those products:
Products | Markets | |
Plate (specialty and commodity) | Steel service centers Heavy equipment manufacturers | |
| Railcar, ship and barge manufacturers | ||
| Pressure vessel and machinery manufacturers | ||
| Welded pipe mills | ||
| Infrastructure (e.g. bridges and power transmission towers) | ||
Coiled plate | Steel service centers Welded pipe mills | |
Structural Tubing | Non-residential construction Infrastructure | |
| Ship and barge manufacturers | ||
| Heavy equipment manufacturers | ||
The following table sets forth total tonnage of Flat Division products sold and tons sold for key products for the periods indicated:
| Year ended December 31, | Nine months ended September 30, | |||||||||||||||||||
| 2011 | 2012 | 2013 | 2013 | 2014 | ||||||||||||||||
| (tons in thousands) | ||||||||||||||||||||
Total | 839 | 802 | 798 | 580 | 656 | |||||||||||||||
(out of which) | ||||||||||||||||||||
Plate | 547 | 528 | 552 | 412 | 435 | |||||||||||||||
Coil | 190 | 179 | 166 | 106 | 151 | |||||||||||||||
Structural Tubing | 65 | 62 | 66 | 50 | 51 | |||||||||||||||
Other | 37 | 33 | 14 | 12 | 19 | |||||||||||||||
Plate
We produce discrete steel plate in widths from 48” to 135” and in thicknesses from 3/16” to 8”. Commodity plate is typically produced in standard widths and lengths. Specialty steel plate consists of hot-rolled carbon, high-strength-low-alloy, and heat-treat steel plate and alloy grades typically produced in custom sizes. Specialty steel plate has superior strength and performance characteristics compared to commodity steel plate. Specialty steel plate is typically made to order for customers seeking specific properties, such as improved malleability, hardness or abrasion resistance, impact resistance or toughness, higher strength and improved machineability and weldability. Specialty steel plate is used to manufacture railroad cars, mobile equipment, bridges and buildings, pressure vessels, machinery components, and LD Pipe. Commodity steel plate is used in a variety of applications such as the manufacture of liquid storage tanks, machinery parts, ships and barges, armor, and general load bearing structures.
We operate the only plate mill on the West Coast including a plate quench and tempering line. We have strong customer relationships, and we believe that we are the largest plate supplier to most of our major customers on the West Coast. In addition to our favorable location, we believe that our ability to roll custom sizes within short lead times gives us a competitive advantage compared to other domestic producers and to import suppliers.
We sell our plate products directly to end users and through distributors. Customers of our plate products include Farwest Steel, The Greenbrier Companies, Reliance Steel and Aluminum Companies, Kloeckner Metals, and Genie (a Terex brand). Our primary competitors in the plate market include ArcelorMittal, Nucor, SSAB, and import suppliers.
99
Table of Contents
We estimate that the Western Plate Market comprises approximately 9% of the overall Northern American plate market. In Portland, we benefit from nearby deep water port access allowing us to import competitively priced slabs. Since 2010 the mill has operated at high utilization rates. Our key end markets for plate include transportation, engineering, construction, line pipe and OCTG, wind farms and ships/offshore. According to CRU, the plate and coiled plate market in the United States and Canada is expected to grow at a CAGR of 4% from 2013 to 2016, with steady growth across most of the end markets. In 2014, we expect overall plate demand to exceed the pre-crisis volume of 2008, despite the lack of meaningful non-residential construction recovery. The development of LNG export infrastructure on the Canadian West Coast is expected to offer additional upside in volume and margins for our Portland site.
Coiled plate and structural tubing
We produce coil in widths of 48” to 96” and in thicknesses that range from 0.09” to 0.75”. Coil is the feed stock for leveling lines (also known as Cut-To-Length), SD Pipe ERW mills, structural tubing mills, and LD Pipe HSAW mills.
We formed Oregon Feralloy Partners, or OFP, together with Feralloy Corporation in 1999. OFP produces certain lighter gauges of plate by leveling coil and tempering it to eliminate stresses; the plates are then cut to custom lengths. In 2013, OFP produced 180Kt of leveled plate (compared to 146Kt in 2012 and 151Kt in 2011). EINA holds a 60% ownership interest in OFP.
We sell our coil products directly to end users and through distributors. Customers of our coil products include Farwest Steel, Reliance Steel and Aluminum Companies, and Wilkinson Steel. Our primary domestic competitors in the coil market include ArcelorMittal, Nucor and SSAB.
The Portland structural tubing mill operates a slitter and a tube mill to produce rectangular hollow structural sections in sizes ranging from 2 1/2” to 10” and 3“x 2” to 12“x 8”. These products have a wide variety of uses, including construction applications, structural support, safety and ornamental tubing for buildings, bridges and highways and are also used for an extensive range of applications in industrial, transportation, and agricultural equipment.
Structural tubing is sold almost exclusively through distribution centers. Our primary competitors in structural tubing include Atlas Tube, Independence Tube Corporation, Maruichi American Corp, and others.
Manufacturing Process
Steelmaking
We produce steel using EAFs at our EVRAZ Pueblo, Colorado and EVRAZ Regina, Saskatchewan facilities. In the EAF production process, ferrous scrap, pig iron, and other iron units are charged into the furnace and heated via electric arc. Additional heating energy is provided through natural gas burners and oxygen injection. After the steel reaches appropriate temperature, bulk alloying elements are added and the steel is tapped into a ladle.
The ladle, full of molten steel, is transported to the Ladle Refining Furnace for final alloying and thermal and chemical homogenization. At our EVRAZ Pueblo facility, where we operate a six-strand continuous caster, the molten steel is also vacuum tank degassed when necessary prior to casting into billets; at our EVRAZ Regina facility, where we operate a variable width slab caster, the molten steel is cast into slabs. After casting, billets and slabs are transported to the appropriate mill for further processing.
Rail Rolling
At our rail rolling facility in Pueblo, Colorado, billets produced by our steelmaking operations are uniformly reheated in a multi-zone, reducing, walking-beam furnace. After achieving desired rolling temperature, the round
100
Table of Contents
billet is rolled into a finished rail profile using 13 rolling passes in 5 work-roll stands. After rolling, rail is quenched (cooled) using proprietary processes to achieve desired final product mechanical properties. After quenching, rail is straightened and inspected for defects visually and through computer controlled non-destructive testing. Finally, rail ends are cropped prior to final inspection and shipping.
Wire Rod Rolling
Similar to rail rolling, billets from steelmaking are uniformly reheated in a multi-zone, reducing, walking-beam furnace. After achieving desired rolling temperature, the billets are rolled to the desired diameter using 32 rolling stands. After rolling, wire rod products are coiled on to a conveyor cooling bed for controlled cooling and inspected for mechanical properties and defects prior to shipment.
Seamless Pipe
In the seamless pipe mill, billets from steelmaking are cut to proper length before being charged into a rotary hearth furnace for reheating. After achieving desired rolling temperature, the pipe is formed by processing in two piercing mills, a plug mill, a reeling mill, and a seven stand sizing mill. The pipe is then cooled, inspected, and straightened prior to heat treatment. After heat treatment quenching and tempering, the pipe is tested and inspected, cropped, marked, and coated. In addition to internal inspection practices, all pipe is third party inspected prior to shipment. Some seamless pipe is sold threaded and coupled by a third party.
Plate and Coil Rolling
Slabs are cut to the correct size for plate and coil widths and lengths that will be produced and loaded into a re-heat furnace. Upon achieving the desired rolling temperature, the slabs are moved to the rolling mill where they undergo de-scaling and a set of passes back and forth in-between two rolls that compress the slab thickness and thus increase the length until the target dimensions are achieved. When necessary, slabs may be initially rotated ninety degrees and broadsided to achieve widths that exceed the original slab width. To achieve longer and thinner rollings, our rolling mills are equipped with Steckel furnaces on both ends of the rolling mill. Upon achieving a pre-determined thickness, the material is coiled onto the Steckel furnace where heat is added so further reduction passes can be executed.
OCTG and Small Diameter Pipe
API coil from our operations or from third parties is uncoiled and continuously cold-formed into a round pipe. After forming, the pipe seam is welded using the ERW process to close the seam without the use of filler materials. After welding, the weld seam is induction heated to eliminate welding stresses and then the pipe is cut to the desired length. The pipe is then straightened and the integrity of the weld is inspected through advanced ultrasonic inspection stations.
OCTG pipe is then heat treated and subjected to magnetic particle inspection (when required), and subjected to a burst test under high pressure. After testing, the OCTG pipe is threaded and mated to a coupling.
All SD Pipe is visually inspected after welding, marked, and shipped. SD Pipe often requires coating on the inside and/or outside of the pipe before final use. Through an innovative process, fusion bonded epoxy and abrasion resistant coatings are applied to pipe exteriors for maximum durability, and pipe interiors are coated with epoxy paint for maximum flow efficiency.
Large Diameter Spiral (HSAW) Pipe
API coil is uncoiled and continuously cold-formed into a helix. Adjusting the angle of the helix permits the production of pipes of different diameters. After forming, the pipe seam is welded on the inside diameter and on the outside diameter in a submerged arc where a weld wire provides filler material and the molten weld and arc
101
Table of Contents
zone are submerged under a blanket of flux. Once the desired length of pipe is achieved, a fling cut-off separates the pipe. Next the pipe body undergoes a full length ultrasonic scanning and inspection of surfaces, and the pipe ends are beveled. After testing and inspection, the pipe is weighed, measured, and stenciled, coated on the inside and/or outside of the pipe before final use. Through an innovative process, fusion bonded epoxy and abrasion resistant coatings are applied to pipe exteriors for maximum durability, and pipe interiors are coated with epoxy paint for maximum flow efficiency.
Straight Seam Pipe (LSAW)
API plate is passed through a hydraulic press that forms the plate into a “U” shape, then through a second press that bends the edges to form an “O.” The edges of the pipe are tack welded to align the seam. The seam is then sealed through a longitudinal submerged arc weld (LSAW) on both the inside and the outside of the pipe. The pipe then enters an expander, where it is sealed, filled with water, pressurized, and expanded to the necessary size per customer specification. Following that process, the pipe body undergoes a full length ultrasonic scanning and inspection of surfaces and then the pipe ends are beveled to prepare them for welding. After testing and inspection, the pipe is weighed, measured, and stenciled, coated on the inside and/or outside and shipped to the customer. Through an innovative process, fusion bonded epoxy and abrasion resistant coatings are applied to pipe exteriors for maximum durability, and pipe interiors are coated with epoxy paint for maximum flow efficiency.
102
Table of Contents
Production Sites
We manufacture our products at sites in six locations (all of which are owned by us): Pueblo, Colorado; Regina, Saskatchewan; Calgary, Alberta; Camrose, Alberta; Red Deer, Alberta; and Portland, Oregon. Our principal assets as of the date of this document comprise our production sites, which are described in detail in the following chart:
| Utilization Rate(2) | ||||||||||||||||||||||||||
Division | Location(1) | Asset | Products | Name Plate Capacity (Kt) | Effective Capacity (Kt) | Year ended December 31, 2011 | Year ended December 31, 2012 | Year ended December 31, 2013 | ||||||||||||||||||
Long | ||||||||||||||||||||||||||
| Pueblo, Colorado | Melt shop and billet caster | Round billets | 1,100 | 1,200 | 97 | % | 93 | % | 85 | % | ||||||||||||||||
| Rail mill | Rail /DHH rail | 545 | 580 | 97 | % | 100 | % | 99 | % | |||||||||||||||||
| Rod and bar mill | Wire rod and coiled reinforcing bar | 500 | 400 | 69 | % | 73 | % | 78 | % | |||||||||||||||||
| Seamless pipe mill | Seamless OCTG casing | 200 | 150 | 94 | % | 99 | % | 84 | % | |||||||||||||||||
Tubular | ||||||||||||||||||||||||||
| Regina, Saskatchewan | Melt shop and slab caster | Slabs for plate mill | 1,000 | 1,050 | 95 | % | 100 | % | 98 | % | ||||||||||||||||
| Plate mill | Plate and coil | 1,100 | 1,100 | 87 | % | 89 | % | 89 | % | |||||||||||||||||
| Slitter | Slit coils | 550 | 550 | 91 | % | 93 | % | 73 | % | |||||||||||||||||
| 24” ERW mill | Small-diameter pipe | 150 | 150 | 73 | % | 70 | % | 43 | % | |||||||||||||||||
| 2” ERW mill | Small-diameter pipe | 70 | 70 | 64 | % | 51 | % | 50 | % | |||||||||||||||||
Four LD Pipe HSAW mills | Large-diameter pipe | 360 | 360 | 53 | % | 56 | % | 88 | % | |||||||||||||||||
| Portland, Oregon(3) | Two LD Pipe HSAW mills | Large-diameter pipe | 180 | 180 | 0 | % | 1 | % | 20 | % | ||||||||||||||||
| Camrose, Alberta | LD Pipe LSAW mill | Large-diameter pipe | 250 | 250 | 4 | % | 1 | % | 33 | % | ||||||||||||||||
| ERW mill | Small-diameter pipe | 160 | 160 | 48 | % | 56 | % | 43 | % | |||||||||||||||||
| Calgary, Alberta | ERW mill | Small-diameter pipe | 300 | 200 | 82 | % | 82 | % | 58 | % | ||||||||||||||||
| Upsetting | Tubing | 75 | 75 | 61 | % | 55 | % | 51 | % | |||||||||||||||||
| Heat treating | OCTG | 80 | 80 | 81 | % | 100 | % | 74 | % | |||||||||||||||||
| API Threading | OCTG | 150 | 150 | 99 | % | 95 | % | 75 | % | |||||||||||||||||
| Red Deer, Alberta | ERW mill | Small-diameter pipe | 170 | 170 | 101 | % | 98 | % | 73 | % | ||||||||||||||||
| API Threading | OCTG | 100 | 100 | 91 | % | 90 | % | 51 | % | |||||||||||||||||
| Premium Threading | OCTG | 50 | 50 | — | 32 | % | 44 | % | ||||||||||||||||||
Flat | ||||||||||||||||||||||||||
| Portland, Oregon | Steckel rolling mill | Plate and coil | 1,100 | 800 | 100 | % | 94 | % | 100 | % | ||||||||||||||||
| Heat treating | Specialty plate | 125 | 125 | 82 | % | 78 | % | 58 | % | |||||||||||||||||
| Structural tubing mill | Hollow structural shapes | 195 | 195 | 33 | % | 33 | % | 34 | % | |||||||||||||||||
| (1) | The table does not include (i) the EVRAZ Claymont site that was idled on December 1, 2013; as of June 30, 2014, EVRAZ Claymont is reflected in our consolidated financial statements as a discontinued operation and assets and liabilities held for sale, (ii) the Surrey cut-to-length site, the assets of which were sold on December 13, 2013 and (iii) EVRAZ Regina cut-to-length site which was sold in June 2014. |
| (2) | Unless otherwise noted, utilization rate has been calculated by dividing the production level by the annual effective capacity for the asset by for the period specified. |
| (3) | The Portland tubular mills were temporarily idled on December 31, 2013. Production resumed in the second quarter of 2014. |
103
Table of Contents
Long Division
Our Pueblo, Colorado site comprises three rolling mills: a rail mill; a seamless pipe mill; and a rod and coiled reinforcing bar mill. We also operate one EAF and a billet caster that supplies round billets to the hot rolling mills. The site also owns and operates the C&W railway, a short-line railway that services our mills and connects our site to both the Burlington Northern Santa Fe and the Union Pacific rail lines, which results in minimal delivery costs to these customers.
The Pueblo rail mill produces head hardened premium rail, using an in-line air quenching process, and standard rail in AREMA sections.
The Pueblo wire rod mill produces high carbon rod for specialty applications such as tire cord, tire bead, and wire rope and can also produce low carbon grades and coiled reinforcing bar products in a variety of sizes, grades and coil weights.
The Pueblo seamless pipe mill produces OCTG products for use in oil and gas exploration and production.
Tubular Division
Regina, Saskatchewan
Our Regina, Saskatchewan site, which is the largest steel making operation in Western Canada, comprises two EAFs, a ladle furnace, a continuous variable width slab caster, and a Steckel mill capable of rolling coil and plate up to 72” wide. The Regina site produced substantially all the coil consumed by our Regina pipe mills in 2013. The Regina site produces carbon steel slabs, flat rolled discrete plate and coil, SD Pipe and LD Pipe.
Our pipe mill operations comprise a 24” rolling ERW mill, a 2” ERW mill, and four LD Pipe helical double submerged arc weld, or HSAW mills. The Regina tubular mills are important suppliers to the energy markets in both Canada and the United States. We believe that our western Canadian location provides us with a freight advantage in the Western Canadian line pipe and OCTG markets.
The Regina tubular mills have the capacity to produce LD Pipe, in outside diameters 26” through 60” using four HSAW spiral mills, and SD Pipe of 9.625”-24” ERW SD Pipe at the 24” mill, and 2.375”-2.875” ERW tubing or line pipe at the 2” mill.
Portland, Oregon
Conveniently located adjacent to the Portland hot rolling mill, the Portland LD Pipe spiral mills converts steel coils into high strength, large-diameter API grade spiral weld line pipe primarily for natural gas and oil transmission lines as well as for structural applications. The site also houses an external and internal coating facility.
Camrose, Alberta
We operate two pipe mills in Camrose, an ERW mill and a longitudinal submerged arc-weld, or LSAW LD Pipe mill. The ERW mill converts coils into line pipe up to 16” in outside diameter, primarily used in transportation of oil and gas from the well head to larger transmission lines. The LSAW mill converts plate into LD Pipe used for transmission lines.
Calgary, Alberta
The Calgary site comprises an ERW pipe mill specializing in OCTG Pipe, including heat treat casing. At this site we also operate tubing finishing facilities comprising upsetting, testing and threading, as well as small
104
Table of Contents
diameter casing testing and threading. We are currently expanding our heat treat capacity at Calgary. Our investment is expected to be $13 million and is expected to be completed by the middle of 2015. The investment is expected to be financed with cash from operating activities.
Red Deer, Alberta
Our Red Deer, Alberta site comprises an ERW pipe mill producing OCTG and SD Pipe and threading facilities for both API and premium connections.
Flat Division
Portland, Oregon
Our Portland site comprises a Steckel rolling mill, a plate quench and tempering facility, a structural tubing mill, and two HSAW mills for LD Pipe. The Portland rolling mill is the only plate mill on the West Coast. Its location near the confluence of the Willamette and Columbia rivers gives deep-water access to the Pacific Ocean and access to Class I railroads and trucking routes serving North America. The Portland rolling mill produces a wide range of products including armor plate. The Portland plate quench and tempering facility includes austenitizing and tempering furnaces, a quench unit, and three levelers. This facility provides both normalized and quench and tempered products with added strength and hardness. Our quench and tempered plate is used in a variety of specialized applications, including structural, shipbuilding, mining, and armor.
The Portland structural tubing mill produces a wide variety of sizes ranging from 2 1/2” to 10” square and 3” x 2” to 12” x 8” rectangular. The facility has a slitting line capable of slitting steel up to .625” thick and 110” wide. Our Portland location is well positioned to serve structural steel tubing demand in a broad regional market, including the Pacific Northwest.
Claymont, Delaware
The EVRAZ Claymont site was idled on December 1, 2013. As of June 30, 2014, and for all periods presented EVRAZ Claymont is reflected in our consolidated financial statements as a discontinued operation and assets and liabilities held for sale. On September 17, 2014 we entered into a definitive agreement to sell our EVRAZ Claymont site. The completion of the transaction is subject to customary conditions precedent.
Transportation
Our products are shipped by rail and by truck, and we generally coordinate the transportation of our products with our customers. Transportation costs for delivery of finished goods are generally passed on to the customer at break-even or very small margins. Transportation costs impact our profitability as a component of raw material costs and as a component of the maximum price before freight we can charge for our products.
Raw materials
The principal materials used by us in steel production include slabs, scrap, billets, coil, pig iron, and ferroalloys. We produce slab and billets for use in our plate, coil, rail, and wire rod and tube mills and obtain scrap used in the production of slab and billets. This partial integration of our facilities enhances the efficiency of our operations and makes us less reliant on outside suppliers.
| • | Slabs are obtained from NTMK (a wholly owned subsidiary of EVRAZ Group) or from unrelated suppliers or are produced internally at our Regina site. Regina produced 100% of the slabs rolled at that site in 2013. We typically purchase slabs at market prices. In 2013, approximately 65% of the slabs purchased by our Flat Division were purchased from NTMK and approximately 3% were acquired from the Tubular Division. |
105
Table of Contents
| • | Scrap is obtained from multiple suppliers: our own recycling operations, by re-processing scrap created by our mills from our production facilities, and by purchasing from third parties. Our internal supply accounted for approximately 35% of our total scrap needs in 2013. We typically purchase scrap at spot prices. |
| • | Billets are produced at our Pueblo site through an EAF and billet caster or purchased from third parties. Billets are used in the rail, wire rod, and seamless mills at this site; we produced substantially all of the billets used at our Pueblo site in 2013. |
| • | Coil for our tubular operations historically has been primarily obtained internally, accounting for substantially all of our total coil needs in 2013, and externally from companies including Blue Scope, Nucor, and Essar, each of whom we consider to be a competitor. |
| • | Pig iron andferroalloys are obtained from a variety of external suppliers. |
We rely on third parties for the supply of energy resources we consume in our steelmaking activities. In 2013, our energy costs represented 6% of our cost of sales. We do not have any long-term obligations under any electricity supply agreements.
Intellectual Property
We have patents for some of our products. Our research and development teams are continuously working on improvements and new products, processes, and technology, some of which are currently in the patent process. In addition, we rely on certain trademarks, trade names, and brand names to distinguish our products from the products of our competitors. We utilize a head hardening process for a significant portion of our premium rail products, which we believe provides us with a significant competitive advantage in this market. Our expertise in this area consists of know-how and trade secrets relating to this process, and we consider it particularly important and valuable.
Research and Development
We have a dedicated research and development center in Regina, Saskatchewan that conducts research related to tubular products, premium connections, and plate. The Regina Research and Development center is a comprehensive development site with 10 staff engineers and other support personnel. Their primary focus is on the development of solutions for the oil and gas and plate markets, enabling us to stay ahead of evolving customer needs. We also have a state-of-the-art Product Technology Center in Pueblo, Colorado that focuses on development of the next generation of rail products. Our expanded team of engineers, scientists, and metallurgists use advanced equipment to perform on-site testing, conduct complex analytical procedures, provide customer support (for example, helping rail customers make informed decisions regarding rail infrastructure life-cycle management) and develop new products.
Employees
Our work force consisted of 4,186 employees as of September 30, 2014, of which 65% were represented by collective bargaining agreements.
We continue to enjoy collaborative labor relations and we are committed to maintaining these relationships. Each of our unionized production facilities enters into collective bargaining arrangements generally every three to five years. There have been no strikes at any of our production facilities since EGSA acquired these facilities although a nineteen day lockout at EVRAZ Camrose’s site occurred in May 2012 in connection with bargaining agreement negotiations.
| • | In 2011, we renewed the separate collective bargaining agreements with the United Steelworkers, or USW, which represents unionized employees in Regina and Calgary, for the period August 1, 2011 to July 31, 2014. |
106
Table of Contents
| • | In 2012, we renewed the collective bargaining agreement with the Canadian Auto Workers, (now Unifor), which represents unionized employees in Camrose, for the period February 1, 2012 to January 31, 2016. |
| • | In 2013, we renewed the separate collective bargaining agreement with the International Association of Bridge, Structural, Ornamental, and Reinforcing Iron Workers, or the Iron Workers Union, which represents unionized employees in Red Deer, for the period January 1, 2013 to December 31, 2017. |
| • | In September 2013, we extended the collective bargaining agreement with the USW, representing unionized employees in Pueblo, Colorado until September 2017. |
The total amount contributed to retirement plans in 2011, 2012, and 2013 to provide pension, retirement, and similar benefits to our employees was $53 million, $57 million, and $45 million, respectively. The following is a summary of our defined benefit obligations as of the dates indicated below:
| December 31, | ||||||||
| 2012 | 2013 | |||||||
| ($ in thousands) | ||||||||
United States pension plans | $ | 104,105 | $ | 55,006 | ||||
Canadian pension plans | 66,391 | 36,146 | ||||||
OPEB (post retirement employee benefit plans) | 46,335 | 42,293 | ||||||
SERP | 9,885 | 7,452 | ||||||
Other | 9 | 26 | ||||||
|
|
|
| |||||
Total noncurrent deferred employee benefits | 226,725 | 140,923 | ||||||
Current portion | 2,757 | 3,318 | ||||||
|
|
|
| |||||
Total deferred employee benefits | $ | 229,482 | $ | 144,241 | ||||
|
|
|
| |||||
Insurance
We have obtained insurance for our steel production facilities that we believe covers property risks at industry standard levels. We also maintain obligatory insurance policies required by relevant law and employees’ insurance policies required by the terms of collective bargaining agreements at all of our facilities.
Legal Proceedings
Litigation
From time to time, we are a defendant in routine litigation incidental to our business. We believe that such current proceedings, if taken in the aggregate, would not have a materially adverse effect on our results of operations or financial position.
Environmental Matters
Overview
Our businesses in the United States are subject to numerous federal and state laws and regulations relating to the protection of human health and the environment. Federal and analogous state environmental laws most relevant to our operations include the Clean Air Act, or CAA, with respect to air emissions; the Clean Water Act, or CWA, with respect to discharges to water; RCRA with respect to solid and hazardous waste management and disposal; and CERCLA with respect to the investigation and remediation of hazardous substances. These laws are evolving and generally becoming increasingly stringent. The ultimate impact of complying with existing laws and regulations is not always clearly known or determinable since certain implementing regulations for these environmental laws have not yet been promulgated and in certain instances are undergoing revision, and because
107
Table of Contents
the interpretation of existing regulations by the governmental agencies charged with enforcing them may change over time. These evolving environmental laws and regulations could result in substantially increased capital, operating, and compliance costs.
We also are subject to the environmental laws and regulations of Canada, which are in many respects comparable to environmental laws in the United States. Environmental regulation in Canada is an area of shared responsibility between the federal government and the provincial governments, which in turn may delegate certain matters to municipal governments. Federal environmental statutes include the Canadian Environmental Protection Act, 1999, or CEPA, and the Fisheries Act. Various provincial statutes regulate environmental matters such as the release and remediation of hazardous substances; waste storage, treatment and disposal; protection of water resources; and air emissions. As in the United States, Canadian environmental laws (federal, provincial, and local) are constantly evolving and generally becoming more stringent.
Air Emissions, Climate Change and Greenhouse Gas (GHG) Matters
Federal, regional, and state, as well as foreign and international, laws and initiatives regulating GHG emissions have been implemented or are under consideration. These efforts to regulate GHG emissions may have a significant impact on our operations. In the United States, various bills have been introduced in the United States Senate and House of Representatives that would, among other things, establish a national cap-and-trade program that would increasingly limit GHG emissions by producers or emitters of GHG. To date, no such federal legislation has been enacted in the United States. Efforts to regulate GHG emissions have been undertaken by the EPA under the CAA. The EPA has implemented a new GHG emission inventory and reporting requirement for all facilities emitting 25,000 metric tons or more per year of GHGs. We, and others in our industry, commenced reporting our annual GHG emissions from certain of our United States facilities beginning in 2011.
In May 2010, the EPA issued a final regulation, known as the Tailoring Rule, that establishes when permits governing GHG emissions are required. Under the Tailoring Rule, the EPA sought to phase in these permitting requirements through successive steps that expand the scope of subject sources over time. In June 2014, the United States Supreme Court struck down certain key provisions of the Tailoring Rule. However, the Court stated that the EPA could impose GHG emissions limits on a facility that is otherwise subject to the PSD program due to its emissions of conventional pollutants (i.e., pollutants that are explicitly regulated under the CAA). As a consequence, future regulation of GHG emissions under this federal program is uncertain. At present, it is not clear how the EPA will respond to the Court’s decision. In the mean time, certain states, provinces, and regions, including areas where our facilities are located, have adopted initiatives requiring reductions in GHG emissions. We believe that our United States facilities are well positioned to comply with a rulemaking limiting GHG emissions under the CAA and that the costs of such compliance would not have a material impact our business.
In Canada, there has been pressure on the federal government to regulate GHG emissions. Canada’s federal GHG strategy continues to evolve and could result in changes material to our business. Various Canadian Provinces have adopted or are in the process of adopting GHG reduction regimes. For example, Alberta’s Climate Change and Emissions Management Act establishes reporting requirements, intensity based reduction targets, and credit offset systems. Canada and several provinces have also promulgated GHG reporting requirements.
The CAA imposes stringent limits on air emissions, many of which are applicable to steel manufacturing facilities, including implementation of Maximum Achievable Control Technology Standards for hazardous air pollutants and National Ambient Air Quality Standards for lead, particulate matter, sulfur dioxide, nitrogen dioxide, ozone, and carbon monoxide. In a number of cases, regulations under the CAA applicable to our United States facilities have only been recently finalized or have yet to be finally promulgated. As a result, we are not yet able to determine what effect any such regulations will have on our business or results of operations. We believe that our major American and Canadian integrated steel competitors are confronted by substantially similar conditions and thus we do not believe that our relative position with regard to such competitors is materially affected by the impact of environmental laws and regulations. However, the costs and operating restrictions necessary for compliance with environmental laws and regulations may have an adverse effect on our competitive position with regard to some
108
Table of Contents
foreign steel producers (particularly in developing economies such as China), and with regard to producers of materials which compete with steel, all of which may not be required to undertake equivalent costs in their operations. In addition, the specific impact on each competitor may vary depending on a number of factors, including the age and location of its operating facilities and its production methods.
Certain residents in the vicinity of our EVRAZ Claymont site have initiated a lawsuit against us in state court in Delaware. All but seven plaintiffs have been dropped from the suit and we do not consider the outcome to have a material effect on our business.
Hazardous Substances
Under certain environmental laws, including CERCLA, RCRA, and their state analogs, we are, and could be in the future, responsible for liabilities and obligations arising out of releases of hazardous materials for human exposures to such substances and for impacts on natural resources and the environment, including contamination of waterways, soil, or groundwater. Such laws can impose liability in connection with contamination at or from our current or former properties, or at third party sites, including waste disposal sites, even if we neither were aware of nor caused the contamination, and regardless of whether our operations at the time of disposal were in compliance with then-applicable law. In addition to investigation and remediation costs, we are, and could be in the future, subject to claims for exposure to hazardous materials from our operations or other claims for environmental damage. See “Risk Factors—Risks Relating to Government Regulations—Compliance with environmental remediation requirements could result in substantially increased capital requirements and operating costs.”
For example, we are currently engaged in investigation and remedial activities at our Portland steel mill. In May 2000, pursuant to a request from the Oregon Department of Environmental Quality, or DEQ, we began an investigation of whether, and to what extent, past or present operations at the site might have contaminated sediments in the Willamette River. Pursuant to the findings of that investigation we have agreed to implement stormwater control measures and to stabilize the riverbank to reduce erosion of soil into the river. Some stormwater controls have been implemented and the riverbank stabilization is not yet complete. It is also possible that further investigation and remediation activities may be required by the DEQ in connection with this matter.
Also in connection with our Portland site, we have been identified as a potentially responsible party under CERCLA for the cost of investigation and cleanup, as well as natural resource damages, with respect to the Portland Harbor Superfund site in Oregon. Many other parties are also named as potentially responsible parties for this site. Based upon information currently available to us and potential insurance coverage, we do not believe the potential remedial costs will have a material effect on our business, but until EPA issues its Record of Decision, the full extent of the remedial actions that will be required is unknown.
In June 2014, we were named a potentially responsible party under Delaware’s Hazardous Substance Cleanup Act, with respect to the alleged presence of hazardous substances, including polychlorinated biphenyls, mercury, and other metals, at our EVRAZ Claymont site. In relation to this matter, we have recorded an asset retirement obligation liability.
At our Pueblo site, we are in the process of investigating and conducting remediation of certain solid waste management units, or SWMUs. We have completed remediation, and received regulatory approvals for closure, for more than half of the SWMUs subject to remediation, and we believe that we have adequate reserves for completing the cleanup and closure of the remaining SWMUs based on currently available information.
Air Emissions Compliance
We received notice from the State of Colorado Department of Public Health and Environment, or CDPHE, on October 15, 2013 that the Pueblo Colorado mill may have violated provisions of its Title V air permit. Specifically, CDPHE alleged that EVRAZ Pueblo violated certain record keeping and visual emission provisions of the permit concerning EPA Method 9 observations and its 30-day rolling CO emissions limit.
109
Table of Contents
Directors and Executive Officers
The following table sets forth information regarding our directors as of the date of this prospectus. We intend to appoint additional directors, including a chairman of our Board of Directors, in connection with this offering.
Name | Age | Position | Date Elected | Term Expires | ||||||||
Conrad Winkler | 48 | Director, President & Chief Executive Officer | 2014 | |||||||||
The following table sets forth information regarding our senior management as of the date of this prospectus:
Name | Age | Position | ||||
Conrad Winkler | 48 | President & Chief Executive Officer | ||||
Glenda Minor | 58 | Senior Vice President & Chief Financial Officer | ||||
John Zanieski | 51 | Executive Vice President, Flat Division and Recycling | ||||
Jerry Reed | 51 | Executive Vice President, Long Division | ||||
Jacob Lubbe | 44 | Senior Vice President, Manufacturing and Supply Chain | ||||
The business address of all directors and senior management is the business address of the Company.
Biographies of our Directors and Executive Officers
Conrad Winkler. Mr. Winkler joined ENA in 2011 as Executive Vice President of the Long Division. During his tenure, he championed and successfully completed strategic upgrades to the rail mill and steel-making operations. His prior experience includes over 15 years at Booz & Company, where he led the North American Manufacturing Practice specializing in strategy and operational improvements in heavy manufacturing industries. He previously served in the United States Navy for five years on nuclear submarines as a nuclear trained officer. Mr. Winkler is an MIT graduate with a BS in Mechanical Engineering and holds an MBA/MMM from the J.L. Kellogg School of Business.
Glenda Minor. Ms. Minor joined ENA in 2010 as Chief Financial Officer. During her career, she has built and led responsive financial and operational organizations through strategic alignment of business goals with substantial improvement in service delivery, global standardization, and business performance. Ms. Minor has over 30 years’ experience in both domestic and international executive finance roles at Visteon Corporation and DaimlerChrysler as well as management roles at General Motors and General Dynamics Corporation. Ms. Minor received a bachelor’s degree in Accounting from Southern University in Louisiana and a MBA from Michigan State University.
John Zanieski. Mr. Zanieski joined ENA in 2011 as President of Recycling. Mr. Zanieski was promoted to Executive Vice President, Flat Division and Recycling in 2013. Prior to joining the Company, he served as VP of Global Operations for Tyco International’s Electrical and Metal Products and held an executive role at Precision Castparts. Mr. Zanieski holds a bachelor’s degree in economics and political science from Yale University and a MBA from the University of Pennsylvania Wharton School.
Jerry Reed. Mr. Reed joined ENA in 2011 as Senior Vice President Business Development. After a year-long assignment as Chief Commercial and Business Development Officer with EVRAZ Highveld in South Africa, Reed rejoined the North America team in 2013 as Executive Vice President, Long Division. Prior to joining the Company, he served in executive roles at Century Aluminum Co. and Alcoa. Mr. Reed has over 20 years of international and domestic financial, sales, manufacturing, and operational experience in the aluminum, steel, paper, and textiles industries. Mr. Reed has a bachelor’s degree from Emory and Henry College and a MBA from the University of Pennsylvania’s Wharton School. Mr. Reed is a Certified Public Accountant.
110
Table of Contents
Jacob Lubbe. Mr. Lubbe joined ENA in 2010 as Manufacturing Director. Mr. Lubbe was promoted to Senior Vice President, Manufacturing and Supply Chain in 2011. Prior to joining the Company, he served in technical and management roles at Gerdau Ameristeel and leadership positions at Charter Steel. Mr. Lubbe has over 20 years of steelmaking experience. Mr. Lubbe received a bachelor’s degree in metallurgical engineering from the University of Potchefstroom in South Africa, and a mini-master’s degree in business administration from Rutgers University.
Service Contracts and Letters of Appointment
Currently, the only members of our management team with service contracts are Conrad Winkler and Glenda Minor. Other than the service contract for one of the directors of EINA that provides for benefits upon termination and whose service will terminate at December 31, 2014, we have not entered into any service contracts that provide for benefits upon termination.
Composition of Our Board of Directors and Director Independence
Our business and affairs are managed under the direction of our Board of Directors. Following this offering, our Board of Directors will be composed of directors, of which will be considered independent, and will have an Audit Committee, Compensation Committee and Nominating and Corporate Governance Committee.
The Nasdaq Listing Rules, or the Listing Rules, require that, subject to specified exceptions, each member of a listed company’s Audit Committee, Compensation Committee, and Nominating and Corporate Governance Committee be “independent.” However, because EGSA will continue to own a majority of our ordinary shares following this offering, we will be a “controlled company” and a foreign private issuer for purposes of the Listing Rules. Accordingly, our Board of Directors will not be required to have a majority of independent directors, and our Compensation Committee and Nominating and Corporate Governance Committee will not be required to meet the director independence requirements to which we would otherwise be subject until such time as we cease to be a “controlled company.” We do not intend to utilize these exemptions from the requirements of the Listing Rules for our Board of Directors Compensation Committee and Nominating and Corporate Governance Committee.
Our Board of Directors has determined that , , , and , each of whom will be a director upon or immediately following the closing of this offering, are independent under the Listing Rules. In considering their independence, the Board of Directors considered the relationships between each of Messrs. , , and , on the one hand, and the Company and EVRAZ Group, on the other hand.
Audit Committee
Our Audit Committee will be composed of Messrs. and immediately following the consummation of this offering, and Mr. will be the chair. Our Board of Directors has determined that each member of the Audit Committee meets the independence requirements of Rule 10A-3 under the Exchange Act and the Listing Rules and is “financially sophisticated” in accordance with the Listing Rules. Our Board of Directors has determined that Mr. is an “audit committee financial expert” within the meaning of SEC regulations and the Listing Rules.
The Audit Committee will have a charter that sets forth the Audit Committee’s purpose and responsibilities, which include (i) assisting the Board of Directors in fulfilling its oversight responsibilities of the financial reports and other financial information filed with the SEC, (ii) recommending to the Board of Directors the appointment of our independent auditors and evaluating their independence, (iii) reviewing our audit procedures and controls, and (iv) overseeing our internal audit function.
111
Table of Contents
Compensation Committee
The Compensation Committee will be composed of Messrs. and immediately following the consummation of this offering and Mr. will be the chair. Our Board of Directors has determined that Messrs. and are independent under the Listing Rules.
The Compensation Committee will have a charter that sets forth the Compensation Committee’s purpose and responsibilities, which include annually reviewing and approving the corporate goals and objectives relevant to the compensation of the Chief Executive Officer and evaluating his or her performance in light of these goals, determining the compensation of our executive officers and administering equity and incentive plans.
Nominating and Corporate Governance Committee
The Nominating and Corporate Governance Committee will be composed of Messrs. and immediately following the consummation of this offering, and Mr. will be the chairman. Our Board of Directors has determined that Messrs. and are independent under the Listing Rules.
The Nominating and Corporate Governance Committee will have a charter that sets forth the Committee’s purpose and responsibilities, which include reviewing and recommending nominees for election as directors, assessing the performance of our directors and developing corporate governance guidelines for the Company.
Compensation Committee Interlocks and Insider Participation
We do not anticipate any interlocking relationships between any member of our Compensation Committee and any of our executive officers that would require disclosure under the applicable rules promulgated under the federal securities laws.
Directors’ Remuneration Reports
Under Section 420 of the Companies Act, we will be required to produce a directors’ remuneration report for each fiscal year. Directors’ remuneration reports must include (i) a directors’ remuneration policy, which is subject to a binding shareholder vote at least once every three years and (ii) an annual report on remuneration in the financial year being reported on, and on how the current policy will be implemented in the next financial year, which is subject to an annual advisory shareholder vote. The Companies Act requires that remuneration payments to directors of the Company and payments to them for loss of office must be consistent with the approved directors’ remuneration policy or, if not, must be specifically approved by the shareholders at a general meeting.
Code of Business Conduct and Ethics
We have a written code of business conduct and ethics that applies to our directors, officers and employees, including our principal executive officer and principal financial officer. Following this offering, a current copy of the code will be posted on the investor section of our website, www.evrazna.com. We intend to disclose any amendment to the code, or any waiver of its requirements, on our website.
Limitation on Liability and Indemnification of Directors and Officers
Each member of our Board of Directors will be indemnified for his actions associated with being a director to the extent permitted by law.
112
Table of Contents
Compensation of Directors
Our independent directors will receive compensation as “non-employee directors” as set by our Board of Directors.
Effective as of the consummation of this offering, each independent director will receive a total annual compensation of $ . As Chairman of the Board, Mr. will receive an additional $ per year and as Chairman of the Audit Committee, Mr. will receive an additional $ per year.
We have not incurred any cost or liability with respect to compensation of our directors prior to the date of this prospectus.
Compensation of Executive Officers
Our Compensation Committee determines the principles applicable to our Chief Executive Officer compensation. Our Chief Executive Officer, in consultation with our Compensation Committee, determines compensation payable to our other executive officers.
The remuneration paid to our top five senior executives in the year ended December 31, 2013 totaled $3.6 million. Compensation primarily consists of fixed salaries, annual incentive plan, long term incentive compensation, 401K contributions, and supplemental executive retirement plan contributions.
All of our executive officers listed in this “Management” section participate in our 401(k) plan and as a result, we did not accrue any provisions for pension, retirement or similar benefits for them.
113
Table of Contents
The following table sets forth information with respect to the beneficial ownership of our shares outstanding (i) immediately prior to this offering, (ii) immediately following the offering, assuming no exercise of the underwriters’ option to purchase additional ordinary shares, and (iii) immediately following the offering, assuming the underwriters’ option to purchase additional ordinary shares is exercised in full by:
| • | each of our directors, director nominees, and executive officers individually and as a group; and |
| • | each person known to us to own beneficially more than 5% of our issued ordinary shares. |
The calculations in the table below are based on shares outstanding as of , which comprise our entire issued and outstanding share capital as of that date.
Beneficial ownership is determined in accordance with the rules and regulations of the SEC. In computing the number of shares beneficially owned by a person and the percentage ownership of that person, we have included shares that the person has the right to acquire within 60 days, including through the exercise of any option, warrant or other right or the conversion of any other security. These shares, however, are not included in the computation of the percentage ownership of any other person.
| Prior to this Offering | After this Offering (Assuming no Exercise of the Underwriters’ Option) | After this Offering (Assuming the Option is Exercised in Full) | ||||||||||||||
| Total Ordinary Shares | Total % of Issued Share Capital | Total Ordinary Shares | Total % of Issued Share Capital | Total Ordinary Shares | Total % of Issued Share Capital | |||||||||||
All directors and executive officers as a group | 0 | 0 | % | |||||||||||||
Principal Shareholders: | ||||||||||||||||
Evraz Group S.A.(1) | 51,959 | 100 | % | |||||||||||||
| (1) | Evraz Group S.A., a company organized as a société anonyme under the laws of the Grand Duchy of Luxembourg and wholly owned subsidiary of EVRAZ plc. Evraz Group S.A. does not have different voting rights. EVRAZ plc is a public company in the United Kingdom and traded on the London Stock Exchange. Based solely on EVRAZ plc’s 2013 annual report, Lanebrook Ltd., is the majority shareholder of EVRAZ plc and holds a direct beneficial ownership interest of 63.46% in EVRAZ plc. According to publicly available information, Lanebrook Ltd. is owned by (i) Roman Abramovich, who holds an indirect beneficial interest of 30.99% in EVRAZ plc, (ii) Alexander Abramov, who holds an indirect beneficial interest of 21.55% in EVRAZ plc, (iii) Alexander Frolov, who holds an indirect beneficial interest of 10.76% in EVRAZ plc, and (iv) Eugene Shvidler, who holds an indirect beneficial interest of 3.07% in EVRAZ plc. Kadre Enterprises Ltd. is a minority shareholder and holds a direct beneficial ownership interest of 5.69% in EVRAZ plc. According to publicly available information, Kadre Enterprises Ltd. is owned by Gennady Kozovoy who holds an indirect beneficial interest of 5.69% in EVRAZ plc. Verocchi Ltd. is a minority shareholder and holds a direct beneficial ownership interest of 5.63% in EVRAZ plc. According to publicly available information, Verocchi Enterprises Ltd. is owned by Alexander Vagin who holds an indirect beneficial interest of 5.63% in EVRAZ plc. |
114
Table of Contents
Raw Materials Supply
We purchase raw materials, such as slabs and vanadium, from certain other members of the EVRAZ Group, including NTMK. Total related-party purchases of raw materials were $392.8 million, $408.9 million, and $288.1 million for the years ended December 31, 2011, 2012, and 2013, respectively, representing primarily our purchases of slabs from NTMK. All transactions with affiliates are at negotiated market prices.
We purchased approximately 68% of our Flat Division’s 2013 slab needs (representing approximately 65% of our overall 2013 slab purchases) from NTMK. We are party to two approximately 5-year contracts, executed in August 2014 pursuant to which we purchase slabs from NTMK at market rates. We do not have minimum purchase obligations under this contract and may acquire slabs from third parties, which we consider to be readily available. Refer to Exhibit 10.6 and Exhibit 10.7 for a complete copy of these contracts.
We had ordinary course related-party accounts payables balances of $34.2 million, $52.0 million, and $84.9 million, as of December 31, 2012, December 31, 2013, and September 30, 2014, respectively.
Mastercroft Capital Contribution
On December 23, 2013, Mastercroft S.a.r.l., a Luxembourgsociété anonymeà responsabilité limitée, made a cash capital contribution of $270.0 million to EINA.This cash contribution was part of a recapitalization of EINA to deleverage this entity. The $270.0 million contribution was used to assist in financing certain investment projects, such as Rail Mill upgrade, EVRAZ Pueblo Steelmaking upgrade, Red Deer premium threading line, EVRAZ Claymont bag house installation, Calgary Heat Treat, Colorado scrap yard acquisitions, EVRAZ Claymont idling expenses, as well as for other general corporate purposes.
EVRAZ KGOK Loans
In order to finance prior business acquisitions, EICA entered into a series of related-party loans pursuant to which it borrowed amounts from certain of EVRAZ Group members. Our related-party loans are subordinated to our ABL Credit Facility and will be subordinated to the notes issued by our subsidiary EICA (see “Description of Certain Indebtedness—7.5% $350 million Senior Secured Notes due 2019”). On December 27, 2012, EICA repaid the remaining principal balance of its related-party notes to EVRAZ Group in exchange for two new Canadian dollar-denominated notes with EVRAZ KGOK, an EVRAZ Group subsidiary. All terms of the related-party loans remained substantially the same.
Loan Contract No. KGOK-EICA-01, dated December 27, 2012, between EVRAZ Inc. NA Canada and JSC EVRAZ Kachkanarsky Ore Mining and Processing Plant, or Note 1, was repaid in full in October 2014 with the proceeds of our new EVRAZ KGOK subordinated loan (Note 3).
Loan Contract No. KGOK-EICA-02, dated December 27, 2012, between EVRAZ Inc. NA Canada and JSC EVRAZ Kachkanarsky Ore Mining and Processing Plant, or Note 2, was due December 27, 2017, and carried a fixed interest rate of 7.15%. Note 2 was repaid with the proceeds of the senior notes offered by our subsidiary EICA and with the proceeds of new Note 3 (amended on November 5, 2014 by Addendum No. 1).
Loan Contract No. KGOK-EICA-03, dated October 13, 2014, as amended on November 5, 2014 by Addendum No. 1, between EVRAZ Inc. NA Canada and JSC EVRAZ Kachkanarsky Ore Mining and Processing Plant, or Note 3, is due June 30, 2020, and carries a fixed interest rate of 8.25%, and had a balance of CAD 431.6 million outstanding as of November 14, 2014.
Interest on the related party loan is payable quarterly.
Our subsidiary EICA used the net proceeds from the offering of the senior secured notes to repay a part of Note 2. See “Description of Certain Indebtedness.”
115
Table of Contents
Registration Rights Agreement
We expect to enter into registration rights agreements with regard to the shares that will be owned by our significant shareholder as well as any shares they purchase in the future (all such shares, “Registerable Securities”). Under the registration rights agreements, these significant shareholders will have the right to cause us to register under the Securities Act and applicable state securities laws the offer and sale of the Registerable Securities. Subject to the terms and conditions of our registration rights agreements, these registration rights allow these significant shareholders or certain qualified assignees holding any Registerable Securities to require registration of such Registerable Securities and to include any such Registerable Securities in a registration by us of common shares, including common shares offered by us or by any shareholder. In connection with any registration of common shares held by these significant shareholders or certain qualified assignees, we will indemnify each shareholder participating in the registration and its officers, directors and controlling persons from and against any liabilities under the Securities Act or any applicable state securities laws arising from the registration statement or prospectus.
116
Table of Contents
DESCRIPTION OF CERTAIN INDEBTEDNESS
The summaries of our related-party loans and ABL Credit Facility set forth below are qualified in their entirety by the actual text of the applicable agreements and indentures, each of which has been filed with the SEC as an exhibit to the registration statement of which this prospectus constitutes a part and which may be obtained on publicly available websites at the addresses set forth under “Where You Can Find More Information.”
Related-party loans
Refer to “Related Party Transactions” for a description of our EVRAZ KGOK loans.
ABL Credit Facility
In December 2011, we entered into a five-year asset-based credit facility, or ABL Credit Facility, arranged by GE Capital and a syndicate of other lenders. The ABL Credit Facility is divided among three borrowing groups, EINA (excluding Canadian National Steel Corp., or CNSC), EICA, and CNSC. Of the $610.0 million of commitments available under the ABL Credit Facility, the maximum borrowing limit for each borrower group is calculated as the least of (i) the borrowing base, calculated based on the Company’s consolidated eligible accounts receivable and inventory balances, less the sum of outstanding letter of credit obligations and swing loans of such borrower group and, in the case of the EINA (excluding CNSC) borrowers and the EICA borrowers, an availability block of the greater of 10% of the aggregate borrowing base or $25.0 million, (ii) the aggregate revolving loan commitment then in effect, less reserves, outstanding revolving loans of the other borrower groups, all outstanding letter of credit obligations and swing loans of the other borrower groups, and an availability block of the greater of 10% of the aggregate borrowing base of $25.0 million, or (iii) the commitment cap applicable to such borrower group then in effect, less the sum of outstanding letter of credit obligations and swing loans of such borrower group. As of September 30, 2014, EINA (excluding CNSC) borrowers had a commitment cap of $300.0 million, EICA borrowers had a commitment cap of $255.0 million and CNSC had a commitment cap of $55.0 million.
The ABL Credit Facility provides for borrowings in United States dollars or Canadian dollars and is secured by our accounts receivable and inventory balances. Borrowings outstanding under the ABL Credit Facility bear interest based on either (1) the Canadian index rate or the banker’s acceptance rate plus an applicable margin for loans made in Canadian dollars or (2) the LIBOR or the United States Prime rate plus an applicable margin for loans made in U.S. dollars.
In addition, the ABL Credit Facility allows for letters of credit up to $120 million. At September 30, 2014, $12.4 million was restricted under outstanding letters of credit, and total outstanding borrowings equaled $178.0 million. After outstanding borrowings and letters of credit, $229.7 million was available for borrowing under the ABL Credit Facility at September 30, 2014.
The ABL Credit Facility contains various restrictive covenants related to the disposition of certain assets, payment of dividends, the incurrence of debt and liens, our ability to enter into certain corporate transactions, the use of funds and other nonfinancial covenants. The ABL Credit Facility also contains certain events of default, including relating to defaults under our other material agreements and certain bankruptcy events.
Debt issuance fees of $7.1 million were incurred in connection with the ABL Credit Facility, $4.0 million of which were amortized as of September 30, 2014.
On November 7, 2014, we entered into the Second Amendment to the ABL Credit Facility, which, among other things (i) added the Company as a guarantor, (ii) provided additional flexibility under the indebtedness covenants to permit the offering of the $350 million senior secured notes due 2019 issued by EICA and the refinancing of the EVRAZ KGOK subordinated loans, and (iii) permit, in respect of Note 3, (x) regular payments of interest and (y) payments of principal in an amount not to exceed $25 million in the aggregate.
117
Table of Contents
7.5% $350 Million Senior Secured Notes due 2019
On November 7, 2014, our subsidiary, EICA, issued $350 million aggregate principal amount of 7.5% senior secured notes due 2019, in a private offering exempt from the registration requirements of the Securities Act.
EICA has the option to redeem all or a portion of the notes at any time on or after May 15, 2017 at the redemption prices set forth in the indenture governing the notes. At any time prior to May 15, 2017, EICA may redeem some or all of the notes at a redemption price equal to 100% of the principal amount of the notes, plus a make-whole premium and accrued and unpaid interest. EICA may also, at any time prior to May 15, 2017, redeem up to 35% of the aggregate principal amount of the notes with an amount equal to the net proceeds of certain equity offerings, at the redemption price set forth in the indenture governing the notes. If EICA sells certain assets without applying the proceeds in a specified manner, or if EICA or ENA undergo certain changes of control, each holder of the notes may require EICA to repurchase all or a part of such holder’s notes pursuant to the terms of the indenture governing the notes.
The notes and the guarantees are secured by (1) a first lien on substantially all of the tangible and intangible assets (including the capital stock of EICA and EINA that is owned by ENA), other than the assets that secure the ABL Credit Facility on a first lien basis, of EICA, ENA, EINA and each of EINA’s and EICA’s respective subsidiaries that is a guarantor under the ABL Credit Facility, subject to certain exceptions, and (2) a second lien on the assets of EICA, ENA, EINA and each of EINA’s and EICA’s respective subsidiaries that is a guarantor under the ABL Credit Facility that secure the ABL Credit Facility on a first lien basis, in each case subject to certain permitted liens and excluded assets.
The covenants in the indenture governing the notes limit our ability to, among other things: (i) incur additional indebtedness; (ii) issue certain preferred stock or disqualified capital stock; (iii) create liens; (iv) pay dividends or make other restricted payments; (v) make certain payments on debt that is subordinated; (vi) make investments; (vii) sell assets; (viii) create restrictions on the payment of dividends or other amounts to the Company from restricted subsidiaries; (ix) consolidate, merge, sell or otherwise dispose of all or substantially all of the Company’s assets; (x) enter into transactions with affiliates of the Company; and (xi) designate subsidiaries of the Company as unrestricted subsidiaries. These covenants are subject to important exceptions and qualifications as further described in the indenture governing the notes.
118
Table of Contents
Issued capital
We were incorporated on November 28, 2012 under the laws of England and Wales under the name Viscaria Limited, with an issued, fully paid up, share capital of 1,000 ordinary shares with a nominal value of $1 per share. Since its incorporation, the Company has been a direct wholly owned subsidiary of EGSA. On November 30, 2012, the Company issued one additional share to EGSA at a share premium of $1,628,540,000, bringing our share capital to 1,001 ordinary shares with a nominal value of $1 per share. On January 28, 2013, the Company reduced its share premium by $58,500,000.
On August 19, 2014, Viscaria Limited changed its name to EVRAZ NORTH AMERICA LIMITED.
On September 5, 2014, ENA issued 50,000 ordinary shares with a nominal value of £1 per share to EGSA and reduced its share premium by $1,000,000,000.
Pursuant to a re-organization on September 30, 2014, EVRAZ NORTH AMERICA LIMITED allotted and issued 958 ordinary shares with a nominal value of $1.00 each to EGSA in exchange for 120 shares of EINA (representing 63.5% of EINA) and 454,126,701 shares of EICA (representing 51% of EICA). See “Our Structure and Reorganization”.
On , 2014, ENA (i) effected a share split, pursuant to which 1,959 of its ordinary shares with a nominal value of $1.00 per share were subdivided into 195,900 ordinary shares with a nominal value of $0.01 per share; and (ii) conducted a bonus share issuance, pursuant to which it capitalized part of the amount standing to the credit of its distributable reserves in the amount of $ and applied such sums to pay up in full ordinary shares of $0.01 each in the capital of ENA and allotted and distributed such new ordinary shares credited as fully paid to EGSA.
On , 2014, ENA re-registered as a public limited company under the laws of England and Wales under the name EVRAZ NORTH AMERICA PLC.
On , 2014, ENA redeemed and cancelled its entire 50,000 ordinary shares with a nominal value of £1 per share from EGSA, leaving ENA with an issued share capital of ordinary shares with a nominal value of $0.01 per share.
As of , 2014, ENA had ordinary shares outstanding.
On , 2014, our shareholders resolved that the directors are authorized to allot and issue equity securities. Such power shall expire on the fifth anniversary of the date of passing this resolution.
Upon completion of this offering, our capital stock will consist of ordinary shares authorized with a nominal value of $0.01 per share with of such ordinary shares issued, outstanding and fully paid.
Refer to “Our Structure and Reorganization” for a discussion of the Reorganization in connection with this offering.
Shares not representing capital
None.
Shares held by the Company
We are not permitted under English law to hold our own shares unless they are repurchased by us and held in treasury.
119
Table of Contents
Memorandum and Articles of Association
Objects and Purposes
We were incorporated in England and Wales as a private limited company on November 28, 2012 under the name Viscaria Limited, registered number 08311287. On August 19, 2014, we changed our name to EVRAZ NORTH AMERICA LIMITED and on , 2014, we re-registered as a public limited company, under the name EVRAZ NORTH AMERICA PLC.
The description of the Company’s articles of association, or the Articles, in this section is based on the form of articles of association that will be adopted by the Company prior to the consummation of this offering.
The Companies Act abolishes the need for an objects clause and, as such, our objects will be unrestricted.
Disclosure of Personal Interests of an Office Holder
The Companies Act requires that an office holder disclose to the Company any personal interest that he or she may have, and all related material information and documents known to him or her, in connection with any existing or proposed transaction by the Company. The disclosure is required to be made promptly and in any event, no later than at the Board of Directors meeting in which the transaction is first discussed.
Directors
The directors may meet for the dispatch of business and adjourn and otherwise regulate its proceedings as they think fit. Unless and until in a general meeting the shareholders of the Company determine otherwise, the number of directors of the Company shall not be less than two nor more than 15.
The quorum necessary for the transaction of business of the directors may be fixed from time to time by the directors and unless so fixed at any other number shall be a number equal to at least greater than one-half of the directors appointed from time to time, provided that in all cases the quorum shall include at least one director appointed by a shareholder who holds at least 50% of the Company’s outstanding shares. A meeting of the directors at which a quorum is present shall be competent to exercise all powers and discretions for the time being exercisable by the directors. A director is not counted in the quorum at a meeting in relation to any resolution on which he is debarred from voting.
A director may not vote at a meeting of the board or of a committee of the board on any resolution in respect of any contract, transaction, or arrangement, or any other proposal in which he has (either alone or together with any person connected with him, as provided in the Companies Act) an interest other than in the circumstances set out below. A director shall not be counted in the quorum at a meeting of the directors in relation to any resolution in which the director is not entitled to vote.
A director is entitled to vote and be counted in the quorum in respect of any resolution concerning any contract, transaction, or arrangement or any other proposal (inter alia):
| 1. | in which he has an interest of which he is not aware or which cannot reasonably be regarded as likely to give rise to a conflict of interest; |
| 2. | in which he has an interest only by virtue of interests in the Company’s shares, debentures or other securities or otherwise in or through the Company; |
| 3. | which involves the giving of any security, guarantee or indemnity to the director or any other person in respect of money lent or obligations incurred by him or any other person at the request of or for the benefit of the Company or any of its subsidiary undertakings or any other person for the benefit of the company or a debt or other obligation of the Company for which the director has assumed responsibility in whole or in part under a guarantee or indemnity or by the giving of security; |
120
Table of Contents
| 4. | concerning an offer of securities of or by the Company or any of its subsidiary undertakings in which he is or may be entitled to participate as a holder of securities or as an underwriter or sub-underwriter; |
| 5. | concerning any other corporate, provided that he and any connected persons do not own or have a beneficial interest in one percent or more of any class of share capital of such body corporate, or of the voting rights available to the members of such body corporate; |
| 6. | relating to an arrangement for the benefit of employees or former employees of the Company or any of its subsidiary undertakings which does not award him any privilege or benefit not generally awarded to the employees or former employees to whom such arrangement relates; |
| 7. | concerning the purchase or maintenance of insurance for any liability for the benefit of directors; |
| 8. | concerning the giving of indemnities in favor of the directors; or |
| 9. | concerning the funding of expenditure by any director or directors (i) on defending criminal, civil or regulatory proceedings or actions against him or them, (ii) in connection with an application to the court for relief, (iii) on defending him or them in any regulator investigations, or (iv) incurred doing anything to enable him to avoid incurring such expenditure. |
The directors of the Company may in accordance with the Articles, and the provisions of the Companies Act, authorize a matter proposed to the Company that would, if not authorized, involve a breach by a director of his duty under section 175 of the Companies Act to avoid a situation in which he or she has, or can have, a direct or indirect interest that conflicts, or possibly may conflict with the interests of the Company. A director is not required, by reason of being a director (save as otherwise agreed by such director), to account to the Company for any benefit which the director (or a person connected with the director) derives from any such matter authorized by the directors. Any contract, transaction or arrangement relating to such matter shall not be liable to be avoided on the grounds of any such benefit.
Sections 177 and 182 of the Companies Act require any interest that a director has (whether proposed or existing) in any transaction or arrangement with the Company to be declared, and not only those that are extraordinary transactions or arrangements.
Any director (including the director that has the conflict) may propose that such conflicted director be authorized in relation to any matter which is the subject of such a conflict. The director with the conflict will not count towards the quorum at the meeting at which the conflict is considered and may not vote on any resolution authorizing the conflict. Where the board gives authority in relation to such a conflict, the board may impose such terms on the relevant director as it deems appropriate.
Each of our directors and other officers may be indemnified by us against all costs, charges, losses, expenses, and liabilities incurred by such director or officer in the execution or discharge of his or her duties or in relation to those duties. The Companies Act renders void an indemnity for a director against any liability attaching to him in connection with any negligence, default, breach of duty or breach of trust in relation to the Company of which he or she is a director, as described in “—Differences in Corporate Law—Liability of Directors and Officers.” We plan to purchase insurance for our directors regarding negligence, default, breach of trust, and breach of duty under the terms allowed under the Companies Act.
Appointment of Directors
The Companies Act requires that a resolution approving a director’s service contract that is more than two years in length must not be passed unless a memorandum setting out the proposed contract incorporating the provision is made available to members: in the case of a resolution at a meeting, by being made available for inspection by members of the Company both (i) at the Company’s registered office for not less than 15 days ending with the date of the meeting, and (ii) at the meeting itself.
121
Table of Contents
In accordance with the Articles, a shareholder who holds at least 50% of the company’s issued shares, or an Appointing Shareholder, has the right to appoint a majority of directors to the board. We expect to have a majority independent board.
The Companies Act requires quoted companies, such as the Company to obtain a binding vote of shareholders on remuneration policy at least once every three years and an advisory (non-binding) shareholders’ vote on an implementation report on how the remuneration policy was implemented in the relevant financial year. Remuneration shall be paid to the directors of the Company in accordance with the remuneration policy approved by the shareholders of the Company.
Directors’ Borrowing Powers
The directors may exercise all the powers of the Company to borrow money, mortgage or charge all or any part or parts of its undertaking, property and uncalled capital, and issue debentures and other securities whether outright or as collateral security for any debt, liability, or obligation of the Company or of any third party.
Removal of Directors
The Company may, by ordinary resolution of which special notice has been given, remove any director and elect another person in place of such director.
Retirement of Directors
Each director shall retire at each annual general meeting and shall be eligible for re-election unless the directors resolve otherwise not later than the date of the notice of such annual general meeting.
When a director retires at an annual general meeting in accordance with the Articles, the Company may, by ordinary resolution at the meeting, fill the office being vacated by re-electing the retiring director providing he is eligible for re-election. In the absence of such a resolution, the retiring director shall nevertheless be deemed to have been re-elected, except in the cases identified by the Articles. There is no requirement for directors to resign upon reaching a maximum age.
Termination of Office
The office of a director of the Company shall be terminated if:
| 1. | the Appointing Shareholder who appointed the relevant director of the Company elects to terminate the office of such director; |
| 2. | the director of the Company becomes prohibited by law or (if applicable) the Listing Rules from acting as a director or ceases to be a director by virtue of any provision of the Companies Act; |
| 3. | the Company has received notice of the director’s resignation or retirement from office and such resignation or retirement from office has taken effect in accordance with its terms; |
| 4. | the director has retired at an annual general meeting in accordance with the Articles; |
| 5. | the director has a bankruptcy order made against him/her, compounds with his/her creditors generally or applies to the court for an interim order under the UK Insolvency Act 1986 in connection with a voluntary arrangement under that Act or any analogous event occurs in relation to the director in another country; |
| 6. | an order is made by any court claiming jurisdiction in that behalf on the ground (however formulated) of mental disorder for the director’s detention or for the appointment of another person (by whatever name called) to exercise powers with respect to the director’s property or affairs; |
| 7. | the director is absent from meetings of the directors for six months without permission and the directors have resolved that the director’s office be vacated; or |
122
Table of Contents
| 8. | notice of termination is served or deemed served on the director and that notice is given by a majority of directors for the time being. |
Share Qualification of Directors
A director shall not be required to hold any shares of the Company by way of qualification. A director who is not a member of the Company shall nevertheless be entitled to attend and speak at general meetings.
Rights Attached to Our Shares
The shares have attached to them full voting, dividend, and capital distribution (including winding up) rights. However, the shares do not confer any rights of redemption.
Without prejudice to any rights attached to any existing shares, the Company may issue shares with such rights or restrictions as determined either by the Company by ordinary resolution or, if the Company passes a resolution to authorize them, the directors. The Company may also issue shares which are, or are liable to be, redeemed at the option of the Company or the holder.
Dividend Rights. Our Articles provide that the Company may, by ordinary resolution, declare final dividends to be paid to its shareholders in accordance with their respective rights. However, no dividend shall be declared unless it has been recommended by the directors and does not exceed the amount recommended by the directors.
If the directors believe that the profits of the Company justify such payment, they may pay fixed dividends on any class of shares where the fixed dividend is payable on fixed dates. They may also pay interim dividends on shares of any class in amounts and on dates and periods as they think fit. Provided the directors act in good faith, they shall not incur any liability to the holders of any shares for any loss they may suffer by the lawful payment of dividends on any other class of shares having rights ranking equally with or behind those shares.
Unless the share rights otherwise provide, all dividends shall be declared and paid according to the amounts paid up on the shares on which the dividend is paid, and apportioned and paid pro rata according to the amounts paid on the shares during any portion or portions of the period in respect of which the dividend is paid.
Any unclaimed dividends may be invested or otherwise applied for the benefit of the Company until they are claimed. If any dividend is unclaimed for 12 years from the date on which it was declared or became due for payment, the person who was otherwise entitled to it shall cease to be entitled and the Company may keep that sum. In addition, the Company will not be considered a trustee with respect to the amount of any payment into a separate account by the directors of any unclaimed dividend or other sum payable on or in respect of a share of the Company.
The Company may cease to send any check or other means of payment by post for any dividend on any shares which is normally paid in that manner if in respect of at least two consecutive dividends payable on those shares, the check, warrant or order has been returned undelivered or remains uncashed but shall recommence sending checks, warrants or orders in respect of the dividends payable on those shares if the holder of or person entitled to them claims the arrears of dividend and does not instruct the Company to pay future dividends in some other way.
The directors may, if authorized by ordinary resolution, offer to shareholders the right to elect to receive, in lieu of a dividend, an allotment of new shares credited as fully paid.
Voting Rights. Subject to any special rights or restrictions as to voting attached to any shares or class of shares of the Company, at a general meeting, voting on each and every resolution shall be taken by way of a poll.
As such, every member present in person or by proxy has one vote for every share held by him, as per the Articles.
123
Table of Contents
A proxy shall not be entitled to vote where the member appointing the proxy would not have been entitled to vote on the resolution had he been present in person.
In the case of joint holders of a share, the vote of the senior who tenders a vote, whether in person or by proxy, shall be accepted to the exclusion of the votes of the other joint holders and for this purpose seniority shall be determined by the order in which the names appear in the register of the Company in respect of the joint holding.
The actions necessary to change the rights of holders of the shares are as follows: the rights of the shareholders would need to be altered by way of a special resolution requiring 75% vote of the shareholders who are present and voting in person or by proxy. In order to change the rights of a separate class of shares, it will require such a vote by shareholders of that class of shares.
Liquidation Rights. In the event of our liquidation, subject to applicable law, after satisfaction of liabilities to creditors, our assets will be distributed to the holders of shares in proportion to their respective holdings. This liquidation right may be affected by the grant of preferential dividends or distribution rights to the holders of a class of shares with preferential rights that may be authorized in the future.
Redemption Provisions. We may, subject to applicable law and in accordance with our Articles, issue redeemable preference shares and redeem the same.
Capital Calls. Under our Articles and the Companies Act, the liability of our shareholders is limited to the nominal (par) value of the shares held by them.
Subject to the terms of allotment of the shares of the Company, the directors of the Company may make a call on our shareholders to pay up any nominal value or share premium outstanding by giving them notices of such call. A shareholder must pay to the Company the amount called on his shares but is not required to do so until 14 days have passed since the notice of call was sent. If a shareholder fails to pay any part of a call, the directors may serve further notice naming another day not being less than seven days from the date of the further notice requiring payment and stating that in the event of non-payment the shares on which the call has been made will be liable to be forfeited. Subsequent forfeiture requires a resolution by the directors. As part of the initial public offering, the nominal value and share premium of all shares will be fully paid.
Transfer of Shares. Fully-paid shares are issued in registered form and may be transferred pursuant to our Articles, unless such transfer is restricted or prohibited by another instrument and subject to applicable securities laws.
Transfers of uncertificated shares may be effected by means of a relevant system (i.e., Nasdaq) unless the Nasdaq rules provide otherwise.
Preemptive Rights. In certain circumstances, our shareholders have preemptive rights under the Companies Act with respect to new issuances of equity securities. These rights are summarized in “—Differences in Corporate Law—Preemptive Rights.” We plan to convene a shareholders’ meeting prior to the effectiveness of this Form F-1 to obtain a waiver of such rights for a period of five years in accordance with the provisions of the Companies Act.
Share Register.Under the Companies Act, a company is required to keep a register of its members, or share register. The share register is prima facie evidence of the information required to be contained in it, meaning that it is determinative of who the shareholders of the company are, and the number of shares they hold. A company is required to enter in its share register the name and address of the shareholder, the date on which a person was registered as a shareholder and the number of shares allotted or transferred to such shareholder.
Our share register is maintained by our transfer agent, Computershare Trust Company, N.A. Registration in this share register is determinative of share ownership. A shareholder who holds book-entry interests in our
124
Table of Contents
shares through The Depository Trust Company, or DTC, is not the holder of record of the shares themselves. Instead, DTC’s nominee Cede & Co is the holder of record of such shares. The ordinary shares that are being offered under this offering will be registered in the name of Cede & Co and we will take all necessary steps to register Cede & Co in our share register before the closing of this offering. As Cede & Co will be the holder of record, a transfer of shares from a person who holds our shares through DTC to a person who also holds our shares through DTC will not be registered in our share register.
Modification of Rights
Whenever the share capital of the Company is divided into different classes of shares, the special rights attached to any class may be varied or abrogated either with the written consent of the holders of three-quarters in nominal value of the issued shares of the class (excluding shares held as treasury shares) or with the sanction of a special resolution passed at a separate meeting of the holders of the Company’s shares of the class (but not otherwise), and may be so varied or abrogated either while the Company is a going concern or during or in contemplation of a winding-up.
The special rights attached to any class of shares will not, unless otherwise expressly provided by the terms of issue, be deemed to be varied by (i) the creation or issue of further shares ranking, as regards participation in the profits or assets of the Company, in some or all respects equally with them but in no respect in priority to them, or (ii) the purchase or redemption by the Company of any of its own shares.
Shareholders’ Meetings and Resolutions
An annual general meeting shall be held in each period of six months beginning with the day following the Company’s accounting reference date, at such place or places, date and time as may be decided by the directors.
The directors may, whenever they think fit, call a general meeting. The directors are required to call a general meeting once the Company has received a request from members representing 5% of the share capital of the Company to do so in accordance with the Companies Act.
Notice of general meetings shall include all information required to be included by the Companies Act and shall be given to all members other than those members who are not entitled to receive such notices from the Company under the provisions of the Articles. The Company may determine that only those persons entered on the Register at the close of business on a day decided by the Company, such day being no more than 21 days before the day that notice of the meeting is sent, shall be entitled to receive such a notice.
For the purposes of determining which persons are entitled to attend or vote at a meeting, and how many votes such persons may cast, the Company must specify in the notice of the meeting a time, not more than 48 hours before the time fixed for the meeting, by which a person must be entered on the Register in order to have the right to attend or vote at the meeting. The directors may in their discretion resolve that, in calculating such period, no account shall be taken of any part of any day that is not a working day in the United Kingdom and/or the United States.
No business other than the appointment of a chairman shall be transacted at any general meeting unless a quorum is present at the time when the meeting proceeds to business. Two members present in person or by proxy and representing in total at least one-third in nominal value of the issued shares will be a quorum.
The directors may require attendees to submit to searches or put in place such arrangements or restrictions as they think fit to ensure the safety and security of attendees at a general meeting. Any member, proxy or other person who fails to comply with such arrangements or restrictions may be refused entry to, or removed from, the general meeting.
The directors may decide that a general meeting shall be held at two or more locations to facilitate the organization and administration of such meeting. A member present in person or by proxy at the designated
125
Table of Contents
“satellite” meeting place may be counted in the quorum and may exercise all rights that they would have been able to exercise if they had been present at the principal meeting place. The directors may make and change from time to time such arrangements as they shall in their absolute discretion consider appropriate to:
| • | ensure that all members and proxies for members wishing to attend the meeting can do so; |
| • | ensure that all persons attending the meeting are able to participate in the business of the meeting and to see and hear anyone else addressing the meeting; |
| • | ensure the safety of persons attending the meeting and the orderly conduct of the meeting; and |
| • | restrict the numbers of members and proxies at any one location to such number as can safely and conveniently be accommodated there. |
Limitation on Owning Securities
Our Articles do not restrict in any way the ownership or voting of our shares by non-residents. Furthermore, there is no longer an obligation on a shareholder of a U.K. company which is a non-listed (in the U.K. or EU) company to voluntarily disclose his shareholding unless required to do so by the Company. If the Company serves a demand on a person under section 793 of the Companies Act, that person will be required to disclose any interest he has in the shares of the Company.
Takeover Code
The Takeover Code only applies to an offer for a public company that is registered in the U.K. (or the Channel Islands or the Isle of Man), even if securities of that company are not admitted to trading on a regulated market in the U.K. (or the Channel Islands or the Isle of Man), if the company is considered by the Takeover Panel to have its place of central management and control in the U.K. (or the Channel Islands or the Isle of Man). This is known as the “residency test.” The test for central management and control under the Takeover Code is different from that used by the U.K. tax authorities. Under the Takeover Code, the Panel will look to where the majority of the directors of the company are themselves resident for the purposes of determining where the company has its place of central management and control. Accordingly, the Takeover Code does not currently apply to us and the Company and its shareholders therefore do not have the benefit of the protections the Takeover Code affords, including the requirement that a person who acquires an interest in shares carrying 30% or more of the voting rights in the Company must make a cash offer to all other shareholders at the highest price paid in the 12 months before the offer was announced.
Other UK Law Considerations
Squeeze-out
Under the Companies Act, if a takeover offer (as defined in section 974 of the Companies Act) is made for the shares of a company and the offeror were to acquire, or unconditionally contract to acquire, not less than 90% in value of the shares to which the takeover offer relates, or the Takeover Offer Shares, and not less than 90% of the voting rights attached to the Takeover Offer Shares within three months of the last day on which its offer can be accepted, it could acquire compulsorily the remaining 10%. It would do so by sending a notice to outstanding shareholders telling them that it will acquire compulsorily their Takeover Offer Shares and then, six weeks later, it would execute a transfer of the outstanding Takeover Offer Shares in its favor and pay the consideration to the Company, which would hold the consideration on trust for outstanding shareholders. The consideration offered to the shareholders whose Takeover Offer Shares are acquired compulsorily under the Companies Act must, in general, be the same as the consideration that was available under the takeover offer.
Sell-out
The Companies Act also gives minority shareholders a right to be bought out in certain circumstances by an offeror who has made a takeover offer (as defined in Section 974 of the Companies Act). If a takeover offer
126
Table of Contents
related to all our shares and, at any time before the end of the period within which the offer could be accepted, the offeror held or had agreed to acquire not less than 90% of our shares to which the offer relates, any holder of our shares to which the offer related who had not accepted the offer could by a written communication to the offeror require it to acquire those shares. The offeror is required to give any shareholder notice of his or her right to be bought out within one month of that right arising. The offeror may impose a time limit on the rights of the minority shareholders to be bought out, but that period cannot end less than three months after the end of the acceptance period. If a shareholder exercises his or her rights, the offeror is bound to acquire those shares on the terms of the offer or on such other terms as may be agreed.
Disclosure of Interest in Shares
Pursuant to Part 22 of the Companies Act, the Company is empowered by notice in writing to require any person whom the Company knows to be, or has reasonable cause to believe to be, interested in the Company’s shares or at any time during the three years immediately preceding the date on which the notice is issued to have been so interested, within a reasonable time to disclose to the Company details of that person’s interest and (so far as is within such person’s knowledge) details of any other interest that subsists or subsisted in those shares. Under the Articles, if a member defaults in supplying the Company with the required details in relation to the shares in question, or the Default Shares, then, in respect of such shares, the directors shall be entitled by notice to the member to require that the member shall not be entitled to vote or exercise any other right conferred by membership in relation to general meetings. Where the Default Shares represent 0.25% or more of the issued shares of the class in question, the directors may direct that (i) any dividend or other money payable in respect of the Default Shares shall be retained by the Company without any liability to pay interest on it when such dividend or other money is finally paid to the member and/or (ii) no transfer by the relevant member of shares (other than transfer approved in accordance with the provisions of the Articles) may be registered (unless such member is not in default and the transfer does not relate to Default Shares).
Purchase of Own Shares
Under English law, a public limited company may purchase its own shares only out of the distributable profits of the Company or the proceeds of a new issue of shares made for the purpose of financing the purchase. A public limited company may not purchase its own shares if as a result of the purchase there would no longer be any issued shares of the Company other than redeemable shares or shares held as treasury shares. Subject to the foregoing, because Nasdaq is not a “recognized investment exchange” under the Companies Act, the Company may purchase its own fully paid shares only pursuant to a purchase contract authorized by ordinary resolution of the holders of its ordinary shares before the purchase takes place. Any authority will not be effective if any shareholder from whom we propose to purchase shares votes on the resolution and the resolution would not have been passed if such shareholder had not done so. The resolution authorizing the purchase must specify a date, not being later than five years after the passing of the resolution, on which the authority to purchase is to expire.
A share buy-back by the Company of its ordinary shares will give rise to UK stamp duty at the rate of 0.5% of the amount or value of the consideration payable by the Company, and such stamp duty will be paid by the Company.
Our Articles do not have conditions governing changes in our capital which are more stringent than those required by law.
Distributions
Under the Companies Act, before a public company incorporated in England and Wales can lawfully make a distribution, it must ensure that it has sufficient distributable reserves (accumulated, realized profits, so far as not previously utilized by distribution or capitalization, less accumulated, realized losses, so far as not previously written off in a reduction or reorganization of capital duly made).
127
Table of Contents
Differences in Corporate Law
The applicable provisions of the Companies Act differ from laws applicable to United States corporations and their shareholders. Set forth below is a summary of certain differences between the provisions of the Companies Act applicable to us and the Delaware General Corporation Law relating to shareholders’ rights and protections. This summary is not intended to be a complete discussion of the respective rights and it is qualified in its entirety by reference to English law and Delaware law.
England and Wales | Delaware | |||
Number of Directors | Under the Companies Act, a public limited company must have at least two directors and the number of directors may be fixed by or in the manner provided in a company’s articles of association. | Under Delaware law, a corporation must have at least one director and the number of directors shall be fixed by or in the manner provided in the bylaws. | ||
Removal of Directors | Under the Companies Act, shareholders may remove a director without cause by an ordinary resolution (which is passed by a simple majority of those voting in person or by proxy at a general meeting) irrespective of any provisions of any service contract the director has with the company, provided that 28 clear days’ notice of the resolution is given to the company and its shareholders and certain other procedural requirements under the Companies Act are followed (such as allowing the director to make representations against his or her removal either at the meeting or in writing). | Under Delaware law, unless otherwise provided in the certificate of incorporation, directors may be removed from office, with or without cause, by a majority stockholder vote, though in the case of a corporation whose board is classified, stockholders may affect such removal only for cause. | ||
Vacancies on the Board of Directors | Under English law, the procedure by which directors (other than a company’s initial directors) are appointed is generally set out in a company’s articles of association, provided that where two or more persons are appointed as directors of a public limited company by resolution of the shareholders, resolutions appointing each director must be voted on individually unless a resolution of the shareholders that such resolutions do not have to be voted on individually is first agreed to by the meeting without any vote being given against it. | Under Delaware law, vacancies on a corporation’s Board of Directors, including those caused by an increase in the number of directors, may be filled by a majority of the remaining directors. | ||
128
Table of Contents
England and Wales | Delaware | |||
Annual General Meeting | Under the Companies Act, a public limited company must hold an annual general meeting in each six-month period following the company’s annual accounting reference date. | Under Delaware law, the annual meeting of stockholders shall be held at such place, on such date and at such time as may be designated from time to time by the Board of Directors or as provided in the certificate of incorporation or by the bylaws. | ||
General Meeting | Under the Companies Act, a general meeting of the shareholders of a public limited company may be called by the directors.
Shareholders holding at least 5% of the paid-up capital of the company carrying voting rights at general meetings can require the directors to call a general meeting. | Under Delaware law, special meetings of the stockholders may be called by the Board of Directors or by such person or persons as may be authorized by the certificate of incorporation or by the bylaws. | ||
Notice of General Meetings | Under the Companies Act, 21 clear days’ notice must be given for an annual general meeting and any resolutions to be proposed at the meeting. Subject to a company’s articles of association providing for a longer period, at least 14 clear days’ notice is required for any other general meeting. In addition, certain matters (such as the removal of directors or auditors) require special notice, which is 28 clear days’ notice. The shareholders of a company may in all cases consent to a shorter notice period, the proportion of shareholders’ consent required being 100% of those entitled to attend and vote in the case of an annual general meeting and, in the case of any other general meeting, a majority in number of the members having a right to attend and vote at the meeting, being a majority who together hold not less than 95% in nominal value of the shares giving a right to attend and vote at the meeting. Neither of these thresholds can be changed by a company’s articles of association. | Under Delaware law, unless otherwise provided in the certificate of incorporation or bylaws, written notice of any meeting of the stockholders must be given to each stockholder entitled to vote at the meeting not less than ten nor more than 60 days before the date of the meeting and shall specify the place, date, hour, and purpose or purposes of the meeting. | ||
129
Table of Contents
England and Wales | Delaware | |||
Proxy | Under the Companies Act, at any meeting of shareholders, a shareholder may designate another person to attend, speak and vote at the meeting on their behalf by proxy. | Under Delaware law, at any meeting of stockholders, a stockholder may designate another person to act for such stockholder by proxy, but no such proxy shall be voted or acted upon after three years from its date, unless the proxy provides for a longer period. | ||
Preemptive Rights | Under the Companies Act, “equity securities” (being (i) shares in the company other than shares that, with respect to dividends and capital, carry a right to participate only up to a specified amount in a distribution (“ordinary shares”) or (ii) rights to subscribe for, or to convert securities into, ordinary shares) proposed to be allotted for cash must be offered first to the existing equity shareholders in the company in proportion to the respective nominal value of their holdings, unless an exception applies or a special resolution to the contrary has been passed by shareholders in a general meeting or the articles of association provide otherwise in each case in accordance with the provisions of the Companies Act. | Under Delaware law, unless otherwise provided in a corporation’s certificate of incorporation, a stockholder does not, by operation of law, possess preemptive rights to subscribe to additional issuances of the corporation’s stock. | ||
Liability of Directors and Officers | Under the Companies Act, any provision (whether contained in a company’s articles of association or any contract or otherwise) that purports to exempt a director of a company (to any extent) from any liability that would otherwise attach to him in connection with any negligence, default, breach of duty or breach of trust in relation to the company is void.
Any provision by which a company directly or indirectly provides an indemnity (to any extent) for a director of the company or of an associated company against any liability attaching to him in connection with any negligence, default, breach of duty or breach of trust in relation to the company of which he is a director is also void except as permitted by the Companies | Under Delaware law, a corporation’s certificate of incorporation may include a provision eliminating or limiting the personal liability of a director to the corporation and its stockholders for damages arising from a breach of fiduciary duty as a director. However, no provision can limit the liability of a director for:
• any breach of the director’s duty of loyalty to the corporation or its stockholders;
• acts or omissions not in good faith or that involve intentional misconduct or a knowing violation of law;
• intentional or negligent payment of unlawful dividends or stock purchases or redemptions; or | ||
130
Table of Contents
England and Wales | Delaware | |||
| Act, which provides exceptions for the company to: (i) purchase and maintain insurance against such liability; (ii) provide a “qualifying third party indemnity” (being an indemnity against liability incurred by the director to a person other than the company or an associated company). Such indemnity must not cover criminal fines, penalties imposed by regulatory bodies, the defense costs of criminal proceedings where the director is found guilty, the defense costs of civil proceedings successfully brought against the director by the company or an associated company, and the costs of unsuccessful applications by the director for relief; and (iii) provide a “qualifying pension scheme indemnity” (being an indemnity against liability incurred in connection with the company’s activities as trustee of an occupational pension plan). Such indemnity must not cover a fine imposed in criminal proceedings, or sum payable to a regulatory authority by way of a penalty in respect of non-compliance with any requirement of a regulatory nature (however arising), or any liability incurred by the director in defending criminal proceedings in which he is convicted. |
• any transaction from which the director derives an improper personal benefit. | |||
Voting Rights | Under English law, unless a poll is demanded by the shareholders of a company or is required by the chairman of the meeting or the company’s articles of association, shareholders shall vote on all resolutions on a show of hands. Under the Companies Act, a poll may be demanded by: (i) not fewer than five shareholders having the right to vote on the resolution; (ii) any shareholder(s) representing at least 10% of the total voting rights of all the shareholders having the right to vote on the resolution (excluding any voting rights | Delaware law provides that, unless otherwise provided in the certificate of incorporation, each stockholder is entitled to one vote for each share of capital stock held by such stockholder. | ||
131
Table of Contents
England and Wales | Delaware | |||
attached to treasury shares); or (iii) any shareholder(s) holding shares in the company conferring a right to vote on the resolution being shares on which an aggregate sum has been paid up equal to not less than 10% of the total sum paid up on all the shares conferring that right. A company’s articles of association may provide more extensive rights for shareholders to call a poll.
Under English law, an ordinary resolution is passed on a show of hands if it is approved by a simple majority (more than 50%) of the votes cast by shareholders present (in person or by proxy) and entitled to vote. If a poll is demanded, an ordinary resolution is passed if it is approved by holders representing a simple majority of the total voting rights of shareholders present (in person or by proxy) who (being entitled to vote) vote on the resolution. Special resolutions require the affirmative vote of not less than 75% of the votes cast by shareholders present (in person or by proxy) at the meeting. | ||||
Shareholder Vote on Certain Transactions | The Companies Act provides for schemes of arrangement, which are arrangements or compromises between a company and any class of shareholders or creditors and used in certain types of reconstructions, amalgamations, capital reorganizations or takeovers. These arrangements require:
• the approval at a shareholders’ or creditors’ meeting convened by order of the court, of a majority in number of shareholders or creditors representing 75% in value of the capital held by, or debt owed to, the class of shareholders or creditors, or class thereof present and voting, either in person or by proxy; and
• the approval of the court. | Generally, under Delaware law, unless the certificate of incorporation provides for the vote of a larger portion of the stock, completion of a merger, consolidation, sale, lease or exchange of all or substantially all of a corporation’s assets or dissolution requires:
• the approval of the Board of Directors; and
• approval by the vote of the holders of a majority of the outstanding stock or, if the certificate of incorporation provides for more or less than one vote per share, a majority of the votes of the outstanding stock of a corporation entitled to vote on the matter. | ||
132
Table of Contents
England and Wales | Delaware | |||
Standard of Conduct for Directors | Under English law, a director owes various statutory and fiduciary duties to the company, including:
• to act in the way he considers, in good faith, would be most likely to promote the success of the company for the benefit of its members as a whole;
• to avoid a situation in which he has, or can have, a direct or indirect interest that conflicts, or possibly conflicts, with the interests of the company;
• to act in accordance with the company’s constitution and only exercise his powers for the purposes for which they are conferred;
• to exercise independent judgment;
• to exercise reasonable care, skill and diligence; | Delaware law does not contain specific provisions setting forth the standard of conduct of a director. The scope of the fiduciary duties of directors is generally determined by the courts of the State of Delaware. In general, directors have a duty to act without self-interest, on a well-informed basis and in a manner they reasonably believe to be in the best interest of the stockholders. | ||
• not to accept benefits from a third party conferred by reason of his being a director or doing (or not doing) anything as a director; and
• a duty to declare any interest that he has, whether directly or indirectly, in a proposed or existing transaction or arrangement with the company. | ||||
Stockholder Suits | Under English law, generally, the company, rather than its shareholders, is the proper claimant in an action in respect of a wrong done to the company or where there is an irregularity in the company’s internal management. Notwithstanding this general position, the Companies Act provides that (i) a court may allow a shareholder to bring a derivative claim (that is, an action | Under Delaware law, a stockholder may initiate a derivative action to enforce a right of a corporation if the corporation fails to enforce the right itself. The complaint must:
• state that the plaintiff was a stockholder at the time of the transaction of which the plaintiff complains or that the plaintiffs shares thereafter | ||
133
Table of Contents
England and Wales | Delaware | |||
| in respect of and on behalf of the company) in respect of a cause of action arising from a director’s negligence, default, breach of duty or breach of trust and (ii) a shareholder may bring a claim for a court order where the company’s affairs have been or are being conducted in a manner that is unfairly prejudicial to some of its shareholders. | devolved on the plaintiff by operation of law; and
• allege with particularity the efforts made by the plaintiff to obtain the action the plaintiff desires from the directors and the reasons for the plaintiff’s failure to obtain the action; or
• state the reasons for not making the effort.
Additionally, the plaintiff must remain a stockholder through the duration of the derivative suit. The action will not be dismissed or compromised without the approval of the Delaware Court of Chancery. | |||
Exchange Listing
We are in process of applying to have our ordinary shares listed on Nasdaq under the symbol “ENA”.
Transfer Agent and Registrar
The transfer agent and registrar for our ordinary shares is Computershare Trust Company, N.A.
134
Table of Contents
SHARES ELIGIBLE FOR FUTURE SALE
We are issuing ordinary shares in this offering, assuming no exercise of the underwriters’ option to purchase additional shares, representing approximately % of our total outstanding ordinary shares (after giving effect to this offering). All of the ordinary shares sold in this offering will be freely transferable by persons other than our “affiliates” without restriction or further registration under the Securities Act of 1933, or the Securities Act. Sales of substantial amounts of our ordinary shares in the public market could adversely affect prevailing market prices of our ordinary shares. Prior to this offering, there has been no public market for our ordinary shares, and although we are in process of applying to list our ordinary shares on Nasdaq, we cannot assure you that a regular trading market will develop in the ordinary shares.
Lock-up Agreements
We and our executive officers, directors at the time of our initial public offering and EGSA have agreed with the underwriters, that subject to certain exceptions, from the date of this prospectus continuing through the date 180 days after the date of this prospectus, they will not offer, pledge, sell, agree to sell, directly or indirectly, or otherwise dispose of any ordinary shares or any securities convertible or exchangeable for our ordinary shares, without the prior written consent of the representatives.
Rule 144
All of our ordinary shares outstanding prior to this offering may be sold publicly in the United States only if they are subject to an effective registration statement under the Securities Act or pursuant to an exemption from the registration requirement such as those provided by Rule 144 and Rule 701 promulgated under the Securities Act. In general, under Rule 144 as currently in effect, beginning 90 days after the date of this prospectus, a person (or persons whose shares are aggregated) who at the time of a sale is not, and has not been during the three months preceding the sale, an affiliate of us and, in the case of our shares that are restricted securities, has beneficially owned our restricted securities for at least six months will be entitled to sell the restricted securities without registration under the Securities Act, subject only to the availability of current public information about us, and will be entitled to sell restricted securities beneficially owned for at least one year without restriction. Persons who are our affiliates and have beneficially owned our restricted securities for at least six months may sell within any three-month period a number of restricted securities that does not exceed the greater of the following:
| • | 1% of the number of our ordinary shares then outstanding which will equal approximately shares immediately after this offering, assuming the underwriters do not exercise their option to purchase additional ordinary shares; and |
| • | the average weekly trading volume of our ordinary shares on Nasdaq during the four calendar weeks preceding the date on which notice of the sale is filed with the SEC. |
Sales by our affiliates under Rule 144 are also subject to certain requirements relating to manner of sale, notice and the availability of current public information about us.
Rule 701
In general, under Rule 701 under the Securities Act as currently in effect, each of our employees, consultants or advisors who purchases our ordinary shares from us in connection with a compensatory stock plan or other written agreement executed prior to the completion of this offering is eligible to resell such ordinary shares in reliance on Rule 144 under the Securities Act, but without compliance with some of the restrictions, including the holding period, contained in Rule 144 under the Securities Act.
135
Table of Contents
United States Federal Income Tax Considerations
The following discussion is a summary of the United States federal income tax considerations relating to the ownership and disposition of our ordinary shares by a United States Holder, as defined below. This description addresses only the United States federal income tax considerations relating to holders that are initial purchasers of our ordinary shares pursuant to the offering and that will hold such ordinary shares as capital assets. This description does not address tax considerations that may be relevant to particular holders in light of their individual circumstances, including: (i) banks, financial institutions, or insurance companies; (ii) real estate investment trusts, regulated investment companies, or grantor trusts; (iii) dealers in securities, commodities or currencies; (iv) tax-exempt entities (including private foundations); (v) investors who are not U.S. Holders; (vi) certain former citizens or long-term residents of the United States; (vii) persons that received our shares as compensation for the performance of services; (viii) persons that own (directly, indirectly, or through attribution) 10% or more of the voting power of our shares; (ix) persons that will hold our ordinary shares as part of a “hedging,” “integrated” or “conversion” transaction or as a position in a “straddle” for United States federal income tax purposes; (x) partnerships (including entities classified as partnerships for United States federal income tax purposes) or other pass-through entities, or holders that will hold our shares through such an entity; (xi) S-corporations; and (xiii) investors that have a functional currency other than the United States dollar.
This discussion, moreover, does not address the United States federal estate, gift, alternative minimum or Medicare contribution tax considerations, or any state, local or non-United States tax considerations, relating to the ownership and disposition of our ordinary shares.
This description is based on the Internal Revenue Code of 1986, as amended, or the Code, existing, proposed and temporary United States Treasury Regulations and judicial and administrative interpretations thereof, in each case as in effect and available on the date hereof. All of the foregoing are subject to change, which change could apply retroactively and could affect the tax consequences described below. There can be no assurances that the IRS will not take a different position concerning the tax consequences of the ownership and disposition of our ordinary shares or that such a position could not be sustained.
For purposes of this discussion, a “U.S. Holder” is a beneficial owner of our ordinary shares that, for United States federal income tax purposes, is: (i) an individual who is a citizen or resident of the United States; (ii) a corporation (or other entity treated as a corporation for United States federal income tax purposes) created in, or organized under the law of, the United States, any state thereof or the District of Columbia; (iii) an estate the income of which is includible in gross income for United States federal income tax purposes regardless of its source; or (iv) a trust (A) the administration of which is subject to the primary supervision of a United States court and which has one or more United States persons who have the authority to control all substantial decisions of the trust or (B) that has otherwise elected to be treated as a United States person under the Code.
If an entity treated as a partnership for United States federal income tax purposes owns our ordinary shares, the tax treatment of a partner in the partnership will generally depend upon the status of the partner and the activities of the partnership. Partnerships holding our ordinary shares and their partners are urged to consult their tax advisors regarding an investment in our ordinary shares.
You should consult your tax advisor with respect to the United States federal, state, local andnon-United States tax consequences of acquiring, owning and disposing of our ordinary shares.
Tax Consequences of the Reorganization
Tax Residence of the Company for United States Federal Income Tax Purposes
Under current United States federal income tax law, a corporation will generally be considered to be resident for United States federal income tax purposes in its place of organization or incorporation. Accordingly,
136
Table of Contents
under the generally applicable United States federal income tax rules, the Company, which is incorporated in England, would generally be classified as a non-United States corporation (and, therefore, not a United States tax resident).
Section 7874 of the Code and the regulations promulgated thereunder, however, contain specific rules (more fully discussed below) that may cause a non-United States corporation to be treated as a United States corporation for United States federal income tax purposes. These rules are relatively new, their application is complex, and there is little or no guidance as to their application. If these rules applied to treat the Company as a United States corporation for United States federal income tax purposes, the Company could be subject to substantially greater United States income tax liability than currently contemplated as a non-United States corporation.
Under section 7874, a corporation created or organized outside the United States (i.e., a non-United States corporation) will nevertheless be treated as a United States corporation for United States federal income tax purposes (and, therefore, a United States tax resident subject to United States federal income tax on its worldwide income) if each of the following three conditions are met: (1) the non-United States corporation directly or indirectly acquires substantially all of the assets held directly or indirectly by a United States corporation (including through the acquisition of all of the outstanding shares of the United States corporation), (2) the non-United States corporation’s expanded affiliated group does not have substantial business activities in the non-United States corporation’s country of organization or incorporation relative to the expanded affiliated group’s worldwide activities, and (3) the former shareholders of the acquired United States corporation hold at least 80% (by either vote or value) of the shares of the non-United States acquiring corporation after the acquisition by reason of holding shares in the United States acquired corporation (the “ownership test”).
Based on the rules for determining share ownership under section 7874 and certain factual assumptions, we believe that the ownership test should not be satisfied, and, as a result, section 7874 should not apply and the Company should continue to be treated as a foreign corporation for United States federal income tax purposes. We cannot, however, provide any assurances that the IRS will agree with the analysis set forth above. In addition, there have been legislative proposals to expand the scope of United States corporate tax residence, and there could be retroactive changes to section 7874 that could result in the Company being treated as a United States corporation.
If the Company were to be treated as a United States corporation for United States federal income tax purposes, the Company would be subject to United States corporate income tax on its worldwide income, and the income of its foreign subsidiaries would be subject to United States tax when repatriated or when deemed repatriated under the United States tax rules for controlled foreign corporations, including as a result of such subsidiaries having any investments in United States property (within the meaning of section 956 of the Code), such as stock or debt obligations of United States affiliates. Additionally, any restructurings of the Company and its subsidiaries that may be undertaken to modify the overall structure of the Company may give rise to United States taxable gain. Moreover, in such case, a non-United States shareholder of the Company would generally be subject to United States withholding tax on the gross amount of any dividends paid by the Company to such shareholder.
The remaining discussion assumes that the Company will not be treated as a United States corporation for United States federal income tax purposes under section 7874 of the Code.
Potential Limitation on Utilization of Tax Attributes
Following the acquisition of a United States corporation by a non-United States corporation, section 7874 may limit the ability of the acquired United States corporation and its United States affiliates to utilize certain United States tax attributes (including net operating losses and certain tax credits) to offset United States taxable income resulting from certain transactions. Based on the rules for determining share ownership under section
137
Table of Contents
7874 of the Code, however, we do not believe that EINA should be subject to such limitations. We cannot, however, provide any assurances that the IRS will agree with this analysis. In addition, there have been legislative proposals to expand the scope of United States corporate tax residence and there could be retroactive changes to section 7874 that could result in limitations on EINA’s ability to utilize its tax attributes.
Tax Consequences to U.S. Holders of our Ordinary Shares
Distributions
The gross amount of any cash distribution made to you with respect to your ordinary shares will be includible in your income as dividend income on the day actually or constructively received by you to the extent such distribution is paid out of our current or accumulated earnings and profits as determined under United States federal income tax principles. Any such distribution that is in excess of our current and accumulated earnings and profits will generally be treated as a return of capital which reduces your tax basis in your ordinary shares, and to the extent such distribution exceeds your tax basis, the excess will be taxed as capital gain. Because we do not intend to determine our earnings and profits on the basis of United States federal income tax principles, any distribution we pay will generally be treated as a “dividend” for United States federal income tax purposes.
With respect to non-corporate U.S. Holders, certain dividends received from a “qualified foreign corporation” may be subject to tax at the lower capital gains tax rate, provided that certain conditions are met, including certain holding period requirements and the absence of certain risk reduction transactions. A foreign corporation (other than a corporation that is classified as a passive foreign investment company for the taxable year in which the dividend is paid or the preceding taxable year, as discussed below under “Passive Foreign Investment Company Rules”) is treated as a qualified foreign corporation with respect to dividends paid by that corporation on shares that are readily tradable on an established securities market in the United States. We are in process of applying for the listing of our ordinary shares on Nasdaq, which is an established securities market in the United States. Accordingly, we believe that we will constitute a “qualified foreign corporation” for United States federal income tax purposes with respect to dividends on our ordinary shares. Dividends received on our ordinary shares will not be eligible for the dividends received deduction allowed to corporations under the Code. For United States foreign tax credit purposes, dividends will generally be treated as income from foreign sources and will generally constitute passive category income.
Sale or Other Disposition of Ordinary Shares
A U.S. Holder will generally recognize capital gain or loss upon the sale or other taxable disposition of our ordinary shares in an amount equal to the difference between the amount realized upon the sale or other disposition and the holder’s adjusted tax basis in such ordinary shares. Any capital gain or loss will be long-term if the ordinary shares have been held for more than one year and will generally be United States-source gain or loss for United States foreign tax credit purposes. Long term capital gains of non-corporate U.S. Holders (including individuals) are generally eligible for reduced rates of taxation. The deductibility of capital losses for United States federal income tax purposes is subject to limitations under the Code. U.S. Holders are urged to consult their tax advisors regarding the tax consequences if a foreign tax is imposed on a disposition of our ordinary shares, including the availability of the foreign tax credit under their particular circumstances.
Passive Foreign Investment Company Rules
Certain adverse tax consequences could apply to a U.S. Holder if the Company were treated as a passive foreign investment company, or a PFIC, for any taxable year during which the U.S. Holder holds ordinary shares. A non-United States corporation, such as the Company, will be classified as a PFIC for United States federal income tax purposes for any taxable year in which, after applying certain look-through rules, either (i) 75% or more of its gross income for such year consists of certain types of ‘‘passive’’ income, or (ii) 50% or more of the value of its assets (determined on the basis of a quarterly average) during such year produce or are held for the production of passive income.
138
Table of Contents
Based on our financial reports, we do not believe that the Company is a PFIC, and we expect to operate in such a manner so as not to cause the Company to become a PFIC. Because the determination of whether we are a PFIC is a factual determination made annually and because there are uncertainties in the application of the relevant rules, there can be no assurance the Company will not be considered a PFIC for the current taxable year or any future taxable year. If the Company is or becomes a PFIC, you could be subject to additional United States federal income taxes on gain recognized with respect to our ordinary shares and on certain distributions, plus an additional tax equal to interest on certain taxes treated as having been deferred under the PFIC rules, and you will generally be subject to certain IRS reporting requirements. Non-corporate U.S. Holders will not be eligible for reduced rates of taxation on any dividends received from the Company if the Company is a PFIC in the taxable year in which such dividends are paid or in the preceding taxable year.
Certain Information Reporting Requirements
Individual U.S. Holders and certain domestic entities may be required to submit certain information to the IRS with respect to his, her or its beneficial ownership of our ordinary shares, if such ordinary shares are not held on his, her or its behalf by a financial institution, as such shares are considered “specified foreign financial assets.” This law also imposes penalties and potential other adverse tax consequences if a U.S. Holder is required to submit such information to the IRS and fails to do so. You are urged to consult your tax advisors regarding the potential reporting requirements that may be imposed with respect to ownership and disposition of our ordinary shares.
THE ABOVE DESCRIPTION IS NOT INTENDED TO CONSTITUTE A COMPLETE ANALYSIS OF ALL UNITED STATES FEDERAL INCOME TAX CONSEQUENCES RELATING TO THE ACQUISITION, OWNERSHIP AND DISPOSITION OF OUR ORDINARY SHARES. YOU SHOULD CONSULT YOUR TAX ADVISOR CONCERNING THE TAX CONSEQUENCES OF YOUR PARTICULAR SITUATION
Material U.K. Tax Considerations
The following paragraphs are intended as a general guide to current U.K. tax law and HMRC published practice applying as at the date of this document (both of which are subject to change at any time, possibly with retrospective effect) relating to the material consequences of making an investment in our ordinary shares They do not constitute legal or tax advice and do not purport to be a complete analysis of all U.K. tax considerations relating to the Reorganization and the Company ordinary shares. They relate only to persons who are absolute beneficial owners of our ordinary shares and may not relate to certain classes of holders of such ordinary shares, such as persons who are connected with the Company, insurance companies, charities, collective investment schemes, pension schemes, brokers or dealers in securities or persons who hold our ordinary shares otherwise than as an investment, persons who have (or are deemed to have) acquired their ordinary shares in the Company by virtue of an office or employment or who are or have been officers or employees of the Company or any of its affiliates and individuals who are subject to U.K. taxation on the remittance basis. These paragraphs do not describe all of the circumstances in which holders of the Company ordinary shares may benefit from an exemption or relief from U.K. taxation.
Any person who is in doubt as to his tax position is strongly recommended to consult his own professional tax adviser. In particular, non-U.K. resident or domiciled persons are advised to consider the potential impact of any relevant double tax agreements.
139
Table of Contents
Material U.K. Tax Consequences of Holding our Ordinary Shares
Taxation of Dividends
Withholding Tax
Dividends paid by the Company will not be subject to any withholding or deduction for or on account of U.K. tax, irrespective of the residence or particular circumstances of the shareholders.
Income Tax
An individual holder of our ordinary shares who is resident in the U.K. may, depending on his or her particular circumstances, be subject to U.K. income tax on dividends received from the Company. An individual holder of our ordinary shares who is not resident in the U.K. should not be chargeable to U.K. income tax on dividends received from the Company, unless he or she carries on (whether solely or in partnership) any trade, profession or vocation in the U.K. through a branch or agency to which the Company ordinary shares are attributable. Subject to certain conditions, an individual holder of our ordinary shares who is resident in the U.K. will be entitled to a tax credit equal to one-ninth of the amount of dividend received from the Company.
Dividends will be subject to U.K. income tax at the rate of 10% on the amount of the dividend and any associated one-ninth tax credit in the hands of an individual holder of our ordinary shares who is liable to U.K. income tax at the basic rate. This means that the tax credit will generally satisfy in full the U.K. income tax liability of such a U.K. resident individual shareholder with respect to such a dividend.
An individual holder of our ordinary shares who is liable to U.K. income tax at the higher rate will generally be subject to U.K. income tax at the rate of 32.5% on the amount of the dividend and any associated one-ninth tax credit. The tax credit will only partially satisfy that U.K. resident individual shareholder’s U.K. income tax liability with respect to such a dividend and, accordingly, such shareholders will generally be liable for additional tax of 22.5% of the amount of the dividend and any associated one-ninth tax credit equivalent to 25% of the cash dividend received.
An individual holder of our ordinary shares who is liable to U.K. income tax at the additional rate will generally be subject to U.K. income tax at the rate of 37.5% on the amount of the dividend and any associated one-ninth tax credit equivalent to 30.55% of the cash dividend received.
Dividend income is treated as the top slice of the total income chargeable to U.K. income tax. Whether an individual holder of our ordinary shares who is liable to U.K. income tax in respect of a dividend is liable to that tax at the higher or additional rate or not will depend on the particular circumstances of that shareholder.
There will be no repayment of the tax credit (or any part of it) associated with dividends paid by the Company to an individual who is resident in the U.K.
Corporation Tax
On the basis that such dividends would normally be expected to fall within an exempt class and meet certain other conditions, a corporate holder of the Company shares that is either resident in the U.K., or that carries on a trade in the U.K. through a permanent establishment to which the Company ordinary shares are attributable, will not normally be liable to U.K. corporation tax on any dividends received in respect of those ordinary shares.
Taxation of Capital Gains
Capital Gains Tax
A disposal of our ordinary shares by an individual holder who is resident in the U.K. may, depending on his or her particular circumstances (including the tax base cost of the Company ordinary shares and any available
140
Table of Contents
exemptions or reliefs), give rise to a chargeable gain or allowable loss for the purposes of U.K. capital gains tax. An individual holder of the Company ordinary shares who ceases to be resident in the U.K. and disposes of his or her ordinary shares in the Company during the period of non-residence may be liable to U.K. capital gains tax on his or her return to the U.K. in respect of a chargeable gain accruing on the disposal under certain anti-avoidance rules. An individual holder of the Company ordinary shares who is not resident in the U.K. should otherwise not be chargeable to U.K. capital gains tax on chargeable gains arising on the disposal of his or her ordinary shares in the Company unless the shareholder carries on (whether solely or in partnership) a trade, profession or vocation in the U.K. through a branch or agency to which the Company ordinary shares are attributable.
The rates of U.K. capital gains tax for the tax year 2014/15 (which began on April 6, 2014) are 18% (for basic rate taxpayers) and 28% (for higher and additional rate taxpayers). Certain reliefs may, depending on an individual holder’s particular circumstances, be available to reduce or eliminate any U.K. capital gains tax liability, such as the annual exemption and certain tax losses.
Corporation Tax
A disposal of the Company ordinary shares by a corporate shareholder that is resident in the U.K. may, depending on its particular circumstances (including the tax base cost of the Company ordinary shares and any available exemptions or reliefs), give rise to a chargeable gain or an allowable loss for the purposes of U.K. corporation tax. A corporate holder of the Company ordinary shares that is not resident in the U.K. should not be liable to U.K. corporation tax on chargeable gains accruing on the disposal of its ordinary shares in the Company unless it carries on (whether solely or in partnership) a trade in the U.K. through a permanent establishment to which the Company ordinary shares are attributable.
A corporate holder of the Company ordinary shares will be entitled to an indexation allowance in computing the amount of chargeable gain accruing on the disposal of such shares, which provides relief for the effects of inflation by reference to movements in the U.K. retail prices index.
If the conditions of the substantial shareholding exemption set out in Section 192A and Schedule 7AC of the TCGA are satisfied in relation to a chargeable gain accruing to a corporate holder of the Company ordinary shares, the chargeable gain will be exempt from U.K. corporation tax. Whether the conditions of the substantial shareholding exemption will be satisfied will depend, amongst other things, on the particular circumstances of the corporate holder of the Company ordinary shares. One of the conditions of the substantial shareholding exemption that must be satisfied is that the corporate holder must have held a substantial shareholding in the Company throughout a twelve-month period beginning not more than two years before the day on which the disposal takes place. Ordinarily, a corporate holder will not be regarded as holding a substantial shareholding in the Company unless it (whether alone or together with its other group companies) directly holds not less than 10% of the Company’s ordinary share capital.
Stamp Duty and Stamp Duty Reserve Tax
The discussion below relates to holders of the Company ordinary shares wherever resident (but not to holders such as market makers, brokers, dealers and intermediaries, to whom special rules apply).
We anticipate that no liability in respect of U.K. stamp duty or U.K. stamp duty reserve tax will be applied in respect of the initial public offering of our shares.
An agreement to transfer an interest in the Company ordinary shares through a clearance service or depositary receipt system should not give rise to a liability to U.K. stamp duty reserve tax. We expect that the Depository Trust Company would be treated as a clearance service for these purposes. In addition, no U.K. stamp duty should, in practice, need be paid in respect of a paperless transfer of an interest in the Company ordinary shares through the Depository Trust Company.
141
Table of Contents
The transfer on sale of an interest in the Company ordinary shares by means of a written instrument will generally be liable to U.K. stamp duty at a rate of 0.5% of the consideration paid (rounded up to the nearest multiple of £5) unless the instrument is not executed in the U.K. and remains at all times outside the U.K. and the transfer does not relate to any matter or thing done or to be done in the U.K. An exemption from U.K. stamp duty is available for a written instrument transferring an interest in the Company ordinary shares where the amount or value of the consideration is £1,000 or less, and it is certified on the instrument that the transaction effected by the instrument does not form part of a larger transaction or series of transactions for which the aggregate consideration exceeds £1,000. A charge to U.K. stamp duty reserve tax will also arise (at the rate of 0.5% of the consideration paid) on an agreement to transfer an interest in the Company ordinary shares otherwise than through a clearance service or depositary receipt system, although the liability will be cancelled and a claim for repayment of any U.K. stamp duty reserve tax already paid, generally with interest, may be made provided that an instrument transferring the interest in the Company ordinary shares is executed in pursuance of the agreement and that instrument is duly stamped within six years of the date on which the agreement was made or, if the agreement was conditional, the date on which the agreement became unconditional.
An issue or transfer of the Company ordinary shares to a person whose business is or includes the provision of clearance services (or its nominee) or issuing depositary receipts (or its nominee or agent) may give rise to a charge to U.K. stamp duty or U.K. stamp duty reserve tax at the rate of 1.5% of the amount or value of the consideration payable or, in certain circumstances, the value of the Company ordinary shares. This liability for U.K. stamp duty or U.K. stamp duty reserve tax will strictly be accountable by the depositary or clearance service operator or its nominee or agent, as the case may be, but will, in practice, generally be reimbursed by participants in the clearance service or depositary receipt system.
Pursuant to the case law and HMRC guidance, HMRC has confirmed that it will no longer seek to apply the 1.5% U.K. stamp duty reserve tax charge to issues of U.K. shares to clearance services (or their nominee) or depositary receipt issuers (or their nominee or agent) or to transfers of U.K. shares to such entities that are an integral part of an issue of share capital. Accordingly, we consider that HMRC should not seek to charge U.K. stamp duty or U.K. stamp duty reserve tax in relation to the provision of the Company ordinary shares to the Depository Trust Company or its nominee pursuant to the initial public offering. However, this does not have any impact on a transfer of the Company ordinary shares to such entities where such transfer is not an integral part of an issue of share capital and, accordingly, the 1.5% charges discussed in this paragraph will continue to apply to transfers of the Company ordinary shares to such entities which are not an integral part of an issue of share capital.
Therefore, a transfer of title in the Company ordinary shares or an agreement to transfer such shares from within the Depository Trust Company system out of the Depository Trust Company system, and any subsequent transfers or agreements to transfer outside the Depository Trust Company system, will generally attract a charge to U.K. stamp duty and/or U.K. stamp duty reserve tax at a rate of 0.5% of any consideration. Any such duty must be paid (and the relevant transfer document stamped by HMRC) before the transfer can be registered in the books of the Company. Holders of the Company ordinary shares should note in particular that a redeposit of the Company ordinary shares into the Depository Trust Company system, including by means of an initial transfer into a depositary receipt system, will generally attract U.K. stamp duty and/or U.K. stamp duty reserve tax at the higher rate of 1.5%.
We anticipate that no liability in respect of U.K. stamp duty or U.K. stamp duty reserve tax will be applied in respect of the implementation of the Reorganization.
142
Table of Contents
Citigroup Global Markets Inc. and Goldman, Sachs & Co. are acting as joint book-running managers of the offering and as representatives of the underwriters named below. Citigroup Global Markets Inc.’s address is 388 Greenwich Street, New York, New York, 10013, and Goldman, Sachs & Co.’s address is 200 West Street, New York, New York 10282. Subject to certain conditions, each underwriter has severally agreed to purchase, and we have agreed to sell to that underwriter, the number of shares set forth opposite the underwriter’s name in the following table.
Underwriter | Number of Shares | |
Citigroup Global Markets Inc. | ||
Goldman, Sachs & Co. | ||
| ||
Total | ||
|
The underwriters are committed to purchase all of the shares being offered, other than the shares covered by the option described below unless and until such option is exercised, if the underwriters purchase any of the shares being offered.
We have granted the underwriters an option to purchase up to an additional shares to cover any sales by the underwriters of a greater number of shares than the total number set forth in the table above. The underwriters exercise this option for 30 days after the date of this prospectus. If any shares are purchased pursuant to this option, the underwriters will severally purchase shares in approximately the same proportion as set forth in the table above.
The following table shows the per share and total underwriting discounts and commissions that we are to pay the underwriters in connection with this offering. Such amounts are shown assuming both no exercise and full exercise of the underwriters’ option to purchase additional shares.
Paid by the Company | No Exercise | Full Exercise | ||||||
Per Share | $ | $ | ||||||
Total | $ | $ | ||||||
Shares sold by the underwriters to the public will initially be offered at the initial public offering price set forth on the cover of this prospectus. Any shares sold by the underwriters to securities dealers may be sold at a discount of up to $ per share from the initial public offering price. If all the shares are not sold at the initial public offering price, the underwriters may change the initial public offering price and the other selling terms. The offering of the shares by the underwriters is subject to receipt and acceptance and subject to the underwriters’ right to reject any order in whole or in part. The representatives have advised us that the underwriters do not intend to make sales to discretionary accounts.
We and our executive officers, directors and holders of all of our ordinary shares have agreed with the underwriters, subject to certain exceptions, not to dispose of or hedge any shares or any securities convertible into or exchangeable for our ordinary shares during the period from the date of this prospectus continuing through the date 180 days after the date of this prospectus, except with the prior written consent of the representatives. The representatives in their sole discretion may release any of the securities subject to these lock-up agreements at any time, which, in the case of officers and directors, shall be with notice. See “Shares Eligible for Future Sale” for a discussion of certain transfer restrictions.
Notwithstanding the foregoing, if (1) during the last 17 days of the 180-day restricted period described in the preceding paragraph, we issue an earnings release or material news or a material event relating to our
143
Table of Contents
Company occurs; or (2) prior to the expiration of the 180-day restricted period, we announce that we will release earnings results during the 16-day period beginning on the last day of the 180-day restricted period, the restrictions described above shall continue to apply until the expiration of the 18-day period beginning on the issuance of the earnings release or the occurrence of the material news or material event.
Citigroup Global Markets Inc. and Goldman, Sachs & Co., or the Representatives, have advised us that they have no current intent or arrangement to release any of the shares subject to the lock-up agreements described above prior to the expiration of the lock-up period. There are no contractually specified conditions for the waiver of lock-up restrictions and any waiver is at the discretion of the Representatives. The Representatives have advised us that when determining whether or not to release shares from lock-up agreements, the Representatives will consider, among other factors, the shareholder’s reasons for requesting the release, the number of shares for which the release is being requested and market conditions at such time.
Prior to this offering, there has been no public market for our ordinary shares. The initial public offering price has been negotiated between us and the representatives. Among the factors to be considered in determining the initial public offering price of the ordinary shares, in addition to prevailing market conditions, will be the Company’s historical performance, estimates of the business potential and earnings prospects of the Company, an assessment of the Company’s management and the consideration of the above factors in relation to market valuation of other companies in related businesses. We cannot assure you, however, that the price at which the ordinary shares will sell in the public market after this offering will not be lower than the initial public offering price or that an active trading market in our ordinary shares will develop and continue after this offering.
We are in process of applying to have our ordinary shares listed on Nasdaq under the symbol “ENA.” In order to meet one of the requirements for listing the ordinary shares on Nasdaq, the underwriters have undertaken to sell lots of 100 or more shares to a minimum of 400 beneficial holders.
We estimate that our portion of the total expenses of this offering, excluding underwriting discounts and commissions, will be approximately $ .
In connection with this offering, the underwriters may purchase and sell ordinary shares in the open market. These transactions may include short sales, stabilizing transactions and purchases to cover positions created by short sales. Short sales involve the sale by the underwriters of a greater number of ordinary shares than they are required to purchase in the offering, and a short position represents the amount of such sales that have not been covered by subsequent purchases. A “covered short position” is a short position that is not greater than the amount of additional shares for which the underwriters’ option described above may be exercised. The underwriters may cover any covered short position by either exercising their option to purchase additional ordinary shares or purchasing shares in the open market. In determining the source of shares to cover the covered short position, the underwriters will consider, among other things, the price of shares available for purchase in the open market as compared to the price at which they may purchase additional ordinary shares pursuant to the option described above. “Naked” short sales are any short sales that create a short position greater than the amount of additional shares for which the option described above may be exercised. The underwriters must cover any such naked short position by purchasing shares in the open market. A naked short position is more likely to be created if the underwriters are concerned that there may be downward pressure on the price of the shares in the open market after pricing that could adversely affect investors who purchase in the offering. Stabilizing transactions consist of various bids for or purchases of shares made by the underwriters in the open market prior to the completion of the offering.
The underwriters may also impose a penalty bid. This occurs when a particular underwriter repays to the underwriters a portion of the underwriting discount received by it because the representatives, in covering short positions or making stabilizing purchases, have repurchased shares sold by or for the account of such underwriter.
144
Table of Contents
Purchases to cover a short position and stabilizing transactions, as well as other purchases by the underwriters for their own accounts may have the effect of preventing or retarding a decline in the market price of the shares, and together with the imposition of the penalty bid, may stabilize, maintain or otherwise affect the market price of the shares. As a result, the price of the shares may be higher than the price that otherwise might exist in the open market. The underwriters are not required to engage in these activities and may end any of these activities at any time. These transactions may be effected on Nasdaq, in the over-the-counter market or otherwise.
Conflicts of Interest
The underwriters are full service financial institutions engaged in various activities, which may include securities trading, commercial and investment banking, financial advisory, investment management, principal investment, hedging, financing, and brokerage activities. The underwriters and their respective affiliates have in the past performed commercial banking, investment banking and advisory services for us from time to time for which they have received customary fees and reimbursement of expenses and may, from time to time, engage in transactions with and perform services for us in the ordinary course of their business for which they may receive customary fees and reimbursement of expenses. In the ordinary course of their various business activities, the underwriters and their respective affiliates may make or hold a broad array of investments and actively trade debt and equity securities (or related derivative securities) and financial instruments (which may include bank loans and/or credit default swaps) for their own account and for the accounts of their customers and may at any time hold long and short positions in such securities and instruments. Such investments and securities activities have involved and may in the future involve securities and/or instruments of ours or our affiliates. The underwriters and their affiliates may also make investment recommendations and/or publish or express independent research views in respect of such securities or financial instruments and may hold, or recommend to clients that they acquire, long and/or short positions in such securities and instruments. In addition, affiliates of Citigroup Global Markets Inc., an underwriter for this offering, are lenders under our ABL Credit Facility.
We have agreed to indemnify the several underwriters against certain liabilities, including liabilities under the Securities Act, or to contribute to payments the underwriters may be required to make because of any of those liabilities.
Notice to Prospective Investors in the European Economic Area
In relation to each member state of the European Economic Area that has implemented the Prospectus Directive (each, a relevant member state), with effect from and including the date on which the Prospectus Directive is implemented in that relevant member state (the relevant implementation date), an offer of shares described in this prospectus may not be made to the public in that relevant member state other than:
| • | to any legal entity which is a qualified investor as defined in the Prospectus Directive; |
| • | to fewer than 100 or, if the relevant member state has implemented the relevant provision of the 2010 PD Amending Directive, 150 natural or legal persons (other than qualified investors as defined in the Prospectus Directive), as permitted under the Prospectus Directive, subject to obtaining the prior consent of the relevant Dealer or Dealers nominated by us for any such offer; or |
| • | in any other circumstances falling within Article 3(2) of the Prospectus Directive, |
provided that no such offer of shares shall require us or any underwriter to publish a prospectus pursuant to Article 3 of the Prospectus Directive and each person who initially acquires shares or to whom any offer is made will be deemed to have represented, warranted, and agreed to and with the underwriters and the Company that it is a qualified investor within the meaning of the law of that relevant member state implementing Article 2(1)(c) of the Prospectus Directive.
For purposes of this provision, the expression an “offer of securities to the public” in any relevant member state means the communication in any form and by any means of sufficient information on the terms of the offer and the shares to be offered so as to enable an investor to decide to purchase or subscribe for the shares, as the
145
Table of Contents
expression may be varied in that member state by any measure implementing the Prospectus Directive in that member state, and the expression “Prospectus Directive” means Directive 2003/71/EC (and amendments thereto, including the 2010 PD Amending Directive, to the extent implemented in the relevant member state) and includes any relevant implementing measure in the relevant member state. The expression 2010 PD Amending Directive means Directive 2010/73/EU.
The sellers of the shares have not authorized and do not authorize the making of any offer of shares through any financial intermediary on their behalf, other than offers made by the underwriters with a view to the final placement of the shares as contemplated in this prospectus. Accordingly, no purchaser of the shares, other than the underwriters, is authorized to make any further offer of the shares on behalf of the sellers or the underwriters.
Notice to Prospective Investors in the United Kingdom
This prospectus is only being distributed to, and is only directed at, persons in the United Kingdom that are qualified investors within the meaning of Article 2(1)(e) of the Prospectus Directive that are also (i) investment professionals falling within Article 19(5) of the Financial Services and Markets Act 2000 (Financial Promotion) Order 2005, as amended (the “Order”) or (ii) high net worth entities, and other persons to whom it may lawfully be communicated, falling within Article 49(2)(a) to (d) of the Order (each such person being referred to as a “relevant person”). The shares being offered in this offering are only available to, and any invitation, offer or agreement to subscribe, purchase or otherwise acquire such shares will be engaged in only with relevant persons. This prospectus and its contents are confidential and should not be distributed, published or reproduced (in whole or in part) or disclosed by recipients to any other persons in the United Kingdom. Any person in the United Kingdom that is not a relevant person should not act or rely on this document or any of its contents.
Notice to Prospective Investors in France
Neither this prospectus nor any other offering material relating to the shares described in this prospectus has been submitted to the clearance procedures of the Autorité des Marchés Financiers or of the competent authority of another member state of the European Economic Area and notified to the Autorité des Marchés Financiers. The shares have not been offered or sold and will not be offered or sold, directly or indirectly, to the public in France. Neither this prospectus nor any other offering material relating to the shares has been or will be:
| • | released, issued, distributed, or caused to be released, issued, or distributed to the public in France; or |
| • | used in connection with any offer for subscription or sale of the shares to the public in France. |
Such offers, sales and distributions will be made in France only:
| • | to qualified investors (investisseurs qualifiés) and/or to a restricted circle of investors (cercle restreint d’investisseurs), in each case investing for their own account, all as defined in, and in accordance with articles L.411-2, D.411-1, D.411-2, D.734-1, D.744-1, D.754-1 and D.764-1 of the French Code monétaire et financier; |
| • | to investment services providers authorized to engage in portfolio management on behalf of third parties; or |
| • | in a transaction that, in accordance with article L.411-2-II-1°-or-2°-or 3° of the French Code monétaire et financier and article 211-2 of the General Regulations (Règlement Général) of the Autorité des Marchés Financiers, does not constitute a public offer (appel public à l’épargne). |
The shares may be resold directly or indirectly, only in compliance with articles L.411-1, L.411-2, L.412-1 and L.621-8 through L.621-8-3 of the French Code monétaire et financier.
Notice to Prospective Investors in Hong Kong
The shares may not be offered or sold in Hong Kong by means of any document other than (i) in circumstances which do not constitute an offer to the public within the meaning of the Companies Ordinance (Cap. 32, Laws of Hong Kong), or (ii) to “professional investors” within the meaning of the Securities and
146
Table of Contents
Futures Ordinance (Cap. 571, Laws of Hong Kong) and any rules made thereunder, or (iii) in other circumstances which do not result in the document being a “prospectus” within the meaning of the Companies Ordinance (Cap. 32, Laws of Hong Kong) and no advertisement, invitation or document relating to the shares may be issued or may be in the possession of any person for the purpose of issue (in each case whether in Hong Kong or elsewhere), which is directed at, or the contents of which are likely to be accessed or read by, the public in Hong Kong (except if permitted to do so under the laws of Hong Kong) other than with respect to shares which are or are intended to be disposed of only to persons outside Hong Kong or only to “professional investors” within the meaning of the Securities and Futures Ordinance (Cap. 571, Laws of Hong Kong) and any rules made thereunder.
Notice to Prospective Investors in Japan
The shares offered in this prospectus have not been and will not be registered under the Financial Instruments and Exchange Law of Japan. The shares have not been offered or sold and will not be offered or sold, directly or indirectly, in Japan or to or for the account of any resident of Japan (including any corporation or other entity organized under the laws of Japan), except (i) pursuant to an exemption from the registration requirements of the Financial Instruments and Exchange Law and (ii) in compliance with any other applicable requirements of Japanese law.
Notice to Prospective Investors in Singapore
This prospectus has not been registered as a prospectus with the Monetary Authority of Singapore. Accordingly, this prospectus and any other document or material in connection with the offer or sale, or invitation for subscription or purchase, of the shares may not be circulated or distributed, nor may the shares be offered or sold, or be made the subject of an invitation for subscription or purchase, whether directly or indirectly, to persons in Singapore other than (i) to an institutional investor under Section 274 of the Securities and Futures Act, Chapter 289 of Singapore (the “SFA”), (ii) to a relevant person pursuant to Section 275(1), or any person pursuant to Section 275(1A), and in accordance with the conditions specified in Section 275 of the SFA or (iii) otherwise pursuant to, and in accordance with the conditions of, any other applicable provision of the SFA, in each case subject to compliance with conditions set forth in the SFA.
Where the shares are subscribed or purchased under Section 275 of the SFA by a relevant person which is:
| • | a corporation (which is not an accredited investor (as defined in Section 4A of the SFA)) the sole business of which is to hold investments and the entire share capital of which is owned by one or more individuals, each of whom is an accredited investor; or |
| • | a trust (where the trustee is not an accredited investor) whose sole purpose is to hold investments and each beneficiary of the trust is an individual who is an accredited investor, |
shares, debentures and units of shares and debentures of that corporation or the beneficiaries’ rights and interest (howsoever described) in that trust shall not be transferred within six months after that corporation or that trust has acquired the shares pursuant to an offer made under Section 275 of the SFA except:
| • | to an institutional investor (for corporations, under Section 274 of the SFA) or to a relevant person defined in Section 275(2) of the SFA, or to any person pursuant to an offer that is made on terms that such shares, debentures, and units of shares and debentures of that corporation or such rights and interest in that trust are acquired at a consideration of not less than $200,000 (or its equivalent in a foreign currency) for each transaction, whether such amount is to be paid for in cash or by exchange of securities or other assets, and further for corporations, in accordance with the conditions specified in Section 275 of the SFA; |
| • | where no consideration is or will be given for the transfer; or |
| • | where the transfer is by operation of law. |
147
Table of Contents
Notice to Prospective Investors in Switzerland
The shares may not be publicly offered in Switzerland and will not be listed on the SIX Swiss Exchange (“SIX”) or on any other stock exchange or regulated trading facility in Switzerland. This document has been prepared without regard to the disclosure standards for issuance prospectuses under art. 652a or art. 1156 of the Swiss Code of Obligations or the disclosure standards for listing prospectuses under art. 27 ff. of the SIX Listing Rules or the listing rules of any other stock exchange or regulated trading facility in Switzerland. Neither this document nor any other offering or marketing material relating to the shares or the offering may be publicly distributed or otherwise made publicly available in Switzerland.
Neither this document nor any other offering or marketing material relating to the offering, the Company, the shares have been or will be filed with or approved by any Swiss regulatory authority. In particular, this document will not be filed with, and the offer of shares will not be supervised by, the Swiss Financial Market Supervisory Authority FINMA (FINMA), and the offer of shares has not been and will not be authorized under the Swiss Federal Act on Collective Investment Schemes (“CISA”). The investor protection afforded to acquirers of interests in collective investment schemes under the CISA does not extend to acquirers of shares.
Notice to Prospective Investors in the Dubai International Financial Centre
This prospectus relates to an Exempt Offer in accordance with the Offered Securities Rules of the Dubai Financial Services Authority (“DFSA”). This prospectus is intended for distribution only to persons of a type specified in the Offered Securities Rules of the DFSA. It must not be delivered to, or relied on by, any other person. The DFSA has no responsibility for reviewing or verifying any documents in connection with Exempt Offers. The DFSA has not approved this prospectus nor taken steps to verify the information set forth herein and has no responsibility for the prospectus. The shares to which this prospectus relates may be illiquid and/or subject to restrictions on their resale. Prospective purchasers of the shares offered should conduct their own due diligence on the shares. If you do not understand the contents of this prospectus you should consult an authorized financial advisor.
Notice to Prospective Investors in Australia
No placement document, prospectus, product disclosure statement or other disclosure document has been lodged with the Australian Securities and Investments Commission (“ASIC”), in relation to the offering. This prospectus does not constitute a prospectus, product disclosure statement or other disclosure document under the Corporations Act 2001 (the “Corporations Act”), and does not purport to include the information required for a prospectus, product disclosure statement or other disclosure document under the Corporations Act.
Any offer in Australia of the shares may only be made to persons (the “Exempt Investors”) who are “sophisticated investors” (within the meaning of section 708(8) of the Corporations Act), “professional investors” (within the meaning of section 708(11) of the Corporations Act) or otherwise pursuant to one or more exemptions contained in section 708 of the Corporations Act so that it is lawful to offer the shares without disclosure to investors under Chapter 6D of the Corporations Act.
The shares applied for by Exempt Investors in Australia must not be offered for sale in Australia in the period of 12 months after the date of allotment under the offering, except in circumstances where disclosure to investors under Chapter 6D of the Corporations Act would not be required pursuant to an exemption under section 708 of the Corporations Act or otherwise or where the offer is pursuant to a disclosure document which complies with Chapter 6D of the Corporations Act. Any person acquiring shares must observe such Australian on-sale restrictions.
This prospectus contains general information only and does not take account of the investment objectives, financial situation or particular needs of any particular person. It does not contain any securities recommendations or financial product advice. Before making an investment decision, investors need to consider whether the information in this prospectus is appropriate to their needs, objectives and circumstances, and, if necessary, seek expert advice on those matters.
148
Table of Contents
We estimate the expenses in connection with the issuance and distribution of our ordinary shares in this offering, other than underwriting discounts and commissions, as follows:
SEC registration fee | $ | |||
Listing fee | ||||
Printing expenses | ||||
Legal fees and expenses | ||||
Accountants’ fees and expenses | ||||
FINRA filing fee | ||||
Depositary’s fees and expenses | ||||
Miscellaneous costs | ||||
|
| |||
Total | $ | |||
|
|
We anticipate that the total underwriting discounts and commissions on shares sold by us will be approximately $ , or % of the gross proceeds of the offering. We will be responsible for the underwriting discounts and commissions related to this offering and for the expenses of the offering listed above.
All amounts in the table are estimates except the SEC registration fee, the Nasdaq listing fee and the FINRA filing fee.
149
Table of Contents
Certain legal matters in connection with this offering relating to United States federal securities law will be passed upon for us by Skadden, Arps, Slate, Meagher & Flom (UK) LLP, London, United Kingdom. The validity of our ordinary shares under English law will be passed upon for us by Skadden, Arps, Slate, Meagher & Flom (UK) LLP, London, United Kingdom. Certain legal matters concerning this offering will be passed upon for the underwriters by Latham & Watkins LLP, New York, US and Latham & Watkins (London) LLP, United Kingdom.
150
Table of Contents
The consolidated financial statements of EVRAZ NORTH AMERICA LIMITED and subsidiaries at December 31, 2013 and 2012 and for each of the three years in the period ended December 31, 2013 appearing in this Prospectus and Registration statement have been audited by Ernst & Young LLP (“EY”), an independent registered public accounting firm in the United States, as set forth in their report thereon appearing elsewhere herein, and are included in reliance upon such report given on the authority of such firm as experts in accounting and auditing.
EY is independent of the Company under the UK home country independence rules for each of the years in the period ended December 31, 2013.
Below is a summary of two matters identified by EY in connection with its independence review under SEC and PCAOB standards.
Prior to the engagement of EY as our independent registered public accounting firm under the PCAOB standards, the EY UK member firm provided expert services to an upstream affiliate of the Company from 2011 through February 2013. These services, which are permissible under the UK home country independence rules, are prohibited under SEC independence rules with respect to EY’s audit of the Company’s December 31, 2013 consolidated financial statements. The expert services were conducted primarily in 2011 and 2012 and did not have any impact with respect to the Company’s consolidated financial statements or EY’s audit. None of the professionals who provided the expert services were involved with the audit of the Company.
A former director of the Company and one of its subsidiaries since incorporation of the Company in November 2012 is a former employee of EY UK and participates in EY UK’s pension plan that is not fully funded. This former director also began serving as a trustee to certain EY UK pension plans in April 2014. The former director’s role was to satisfy UK statutory requirements and did not result in him being able to exercise influence over the consolidated financial statements. The unfunded pension and trustee relationship held by the former director is not prohibited under the UK home country independence rules, however, such relationships are inconsistent with the SEC’s independence rules. Upon identifying this matter, the director resigned on September 3, 2014.
Notwithstanding the inconsistencies noted above with respect to the SEC and PCAOB auditor independence rules, EY informed us that, after considering all the facts and circumstances and that the impact that these matters may have had on its independence with respect to us, it believes it was and is capable of exercising objective and impartial judgment on all issues encompassed within the conduct of its audits of our consolidated financial statements.
The Company also reviewed and considered the impact that these matters may have had on EY’s independence with respect to it under the applicable SEC and PCAOB independence rules. After considering all the facts and circumstances, the Company, through its governing body, determined that a reasonable investor with knowledge of all relevant facts and circumstances would conclude that EY was and is capable of exercising objective and impartial judgment on all issues encompassed within their audit engagement.
151
Table of Contents
WHERE YOU CAN FIND MORE INFORMATION
We have filed with the SEC a registration statement on Form F-1 (including amendments and relevant exhibits and schedules) under the Securities Act covering the ordinary shares to be sold in this offering. This prospectus, which is part of the registration statement, does not contain all of the information set forth in the registration statement and the exhibits and schedules to the registration statement. For further information, we refer you to the registration statement and the exhibits and schedules filed as part of the registration statement. If a document has been filed as an exhibit to the registration statement, we refer you to the copy of the document that has been filed. Each summary or outline in this prospectus of a document filed as an exhibit to the registration statement incorporating by reference particular items, sections or paragraphs of such exhibit is qualified in its entirety by the full contents of such exhibit.
We make available free of charge on or through our Internet website, www.evrazna.com, all of our annual and quarterly reports and all amendments to those reports as soon as reasonably practicable after such material is filed electronically with, or furnished to, the SEC. Copies of our investor information is also available on our Internet website. We will provide electronic or paper copies of these documents free of charge upon request. The SEC also maintains a website at www.sec.gov that contains reports, proxy and information statements and other information regarding issuers that file electronically with the SEC.
We are not currently subject to the informational requirements of the Securities Exchange Act of 1934, of the Exchange Act. Immediately upon completion of this offering, we will become subject to periodic reporting and other informational requirements of the Exchange Act as applicable to foreign private issuers. As a foreign private issuer, we will be exempt from the rules under the Exchange Act relating to the furnishing and content of proxy statements, and our officers, directors and principal stockholders will be exempt from the reporting and short-swing profit recovery provisions contained in Section 16 of the Exchange Act. In addition, we will not be required under the Exchange Act to file periodic reports and financial statements with the SEC as frequently or as promptly as United States companies whose securities are registered under the Exchange Act. However, we intend to file with the SEC, within 120 days after the end of our fiscal year ended December 31, 2014 and each subsequent fiscal year, an annual report on Form 20-F containing consolidated financial statements which will be examined and reported on, with an opinion expressed, by an independent registered public accounting firm. You can inspect and copy the registration statements, reports and other information filed with the SEC at the public reference facility maintained by the SEC at 100 F. Street, N.E., Washington, DC 20549. You can request copies of these documents upon payment of a duplicating fee by writing to the SEC. Please call the SEC at 1-800-SEC-0330 for further information on the operation of the public reference facility. Our SEC filings will also be available to the public on the SEC’s internet website at http://www.sec.gov.
152
Table of Contents
INDEX TO THE CONSOLIDATED FINANCIAL STATEMENTS
EVRAZ NORTH AMERICA LIMITED AND SUBSIDIARIES
Consolidated Balance Sheets as of September 30, 2014 (unaudited) and December 31, 2013 | F-2 | |
| F-3 | ||
| F-4 | ||
| F-5 | ||
| F-6 | ||
| F-21 | ||
Consolidated Balance Sheets as of December 31, 2013 and December 31, 2012 | F-22 | |
| F-23 | ||
| F-24 | ||
| F-25 | ||
| F-26 | ||
| F-27 |
F-1
Table of Contents
EVRAZ NORTH AMERICA LIMITED and Subsidiaries (Wholly Owned Subsidiary of EVRAZ plc)
Consolidated Balance Sheets (unaudited)
(In Thousands, Except Share Amounts)
| September 30, 2014 | December 31, 2013 | |||||||
Assets | ||||||||
Current assets: | ||||||||
Cash and cash equivalents | $ | 27,319 | $ | 193,321 | ||||
Trade accounts receivable, less allowance for doubtful accounts of$626and $460 at September 30, 2014 and December 31, 2013, respectively | 333,349 | 253,882 | ||||||
Inventories | 668,761 | 502,224 | ||||||
Deferred income taxes | 26,909 | 18,050 | ||||||
Prepaid expenses | 10,055 | 7,646 | ||||||
Other | 8,149 | 21,790 | ||||||
Assets held for sale | 3,176 | 18,168 | ||||||
|
|
|
| |||||
Total current assets | 1,077,718 | 1,015,081 | ||||||
Property, plant, and equipment, net | 1,149,930 | 1,224,207 | ||||||
Goodwill | 1,047,331 | 1,082,139 | ||||||
Intangibles, net | 392,673 | 444,843 | ||||||
Other assets | 13,593 | 16,377 | ||||||
|
|
|
| |||||
Total assets | $ | 3,681,245 | $ | 3,782,647 | ||||
|
|
|
| |||||
Liabilities and equity | ||||||||
Current liabilities: | ||||||||
Accounts payable | $ | 213,781 | $ | 281,868 | ||||
Related-party payables | 84,854 | 51,971 | ||||||
Accrued expenses | 17,902 | 21,877 | ||||||
Accrued compensation and related benefits | 54,806 | 50,137 | ||||||
Accrued interest and dividends | 634 | 1,247 | ||||||
Taxes payable | 4,673 | 12,745 | ||||||
Liabilities held for sale | 17,269 | 23,690 | ||||||
|
|
|
| |||||
Total current liabilities | 393,919 | 443,535 | ||||||
Long-term debt | 178,020 | 99,984 | ||||||
Related-party loans | 735,385 | 774,381 | ||||||
Deferred income taxes | 242,453 | 265,943 | ||||||
Deferred employee benefits | 128,212 | 140,923 | ||||||
Environmental liabilities, net of current portion | 25,998 | 28,690 | ||||||
Other long-term liabilities | 12,510 | 18,931 | ||||||
|
|
|
| |||||
Total liabilities | 1,716,497 | 1,772,387 | ||||||
|
|
|
| |||||
Commitments and contingencies | ||||||||
Equity: | ||||||||
Common stock, 51,959 and 1,001 shares outstanding at September 30, 2014 and December 31, 2013, respectively | 83 | 1 | ||||||
Additional paid-in capital | 3,036,516 | 3,033,364 | ||||||
Accumulated deficit | (1,354,226 | ) | (1,337,195 | ) | ||||
Accumulated other comprehensive income (loss): | ||||||||
Cumulative foreign currency translation adjustment | 5,831 | 26,142 | ||||||
Pension and postretirement benefit plans, net of tax | (67,151 | ) | (69,885 | ) | ||||
|
|
|
| |||||
Total EVRAZ NORTH AMERICA LIMITED equity | 1,621,053 | 1,652,427 | ||||||
Noncontrolling interest | 343,695 | 357,833 | ||||||
|
|
|
| |||||
Total equity | 1,964,748 | 2,010,260 | ||||||
|
|
|
| |||||
Total liabilities and equity | $ | 3,681,245 | $ | 3,782,647 | ||||
|
|
|
| |||||
See accompanying notes to the unaudited consolidated financial statements.
F-2
Table of Contents
EVRAZ NORTH AMERICA LIMITED and Subsidiaries (Wholly Owned Subsidiary of EVRAZ plc)
Consolidated Statements of Operations (unaudited)
(In Thousands, Except Per Share Amounts)
| For The Nine Months Ended September 30, | ||||||||
| 2014 | 2013 | |||||||
Sales: | ||||||||
Product sales | $ | 2,235,565 | $ | 1,896,515 | ||||
Freight | 123,211 | 113,598 | ||||||
|
|
|
| |||||
| 2,358,776 | 2,010,113 | |||||||
|
|
|
| |||||
Costs and expenses: | ||||||||
Cost of sales | 2,060,547 | 1,841,279 | ||||||
Selling, general, and administrative expenses | 185,912 | 174,127 | ||||||
(Gain) loss on disposal of assets | (154 | ) | 549 | |||||
|
|
|
| |||||
| 2,246,305 | 2,015,955 | |||||||
|
|
|
| |||||
Operating income (loss) | 112,471 | (5,842 | ) | |||||
Other (expense) income: | ||||||||
Interest expense | (7,067 | ) | (9,846 | ) | ||||
Related party interest expense | (40,432 | ) | (43,228 | ) | ||||
Dividend and interest income | 82 | 181 | ||||||
Foreign exchange (losses) gains | (9,251 | ) | 160 | |||||
Other income, net | 3,382 | 1,237 | ||||||
|
|
|
| |||||
Income (loss) from continuing operations before income taxes | 59,185 | (57,338 | ) | |||||
Income tax benefit | 6,376 | 52,201 | ||||||
|
|
|
| |||||
Net income (loss) from continuing operations | 65,561 | (5,137 | ) | |||||
|
|
|
| |||||
Discontinued operations: | ||||||||
Loss from discontinued operations before income taxes | (15,957 | ) | (44,866 | ) | ||||
Income tax benefit | 5,771 | 22,167 | ||||||
|
|
|
| |||||
Net loss from discontinued operations | (10,186 | ) | (22,699 | ) | ||||
|
|
|
| |||||
Net income (loss) | 55,375 | (27,836 | ) | |||||
Less net (income) loss attributable to noncontrolling interest | (56 | ) | 21,200 | |||||
|
|
|
| |||||
Net income (loss) attributable to EVRAZ NORTH AMERICA LIMITED | $ | 55,319 | $ | (6,636 | ) | |||
|
|
|
| |||||
Earnings (loss) per share: | ||||||||
Basic and diluted earnings per share from continuing operations | $ | 11,634 | $ | 16,047 | ||||
Basic and diluted loss per share from discontinued operations | (1,809 | ) | (22,676 | ) | ||||
|
|
|
| |||||
Basic and diluted earnings (loss) per share attributable to EVRAZ NORTH AMERICA LIMITED shareholders | $ | 9,825 | $ | (6,629 | ) | |||
|
|
|
| |||||
See accompanying notes to the unaudited consolidated financial statements.
F-3
Table of Contents
EVRAZ NORTH AMERICA LIMITED and Subsidiaries
(Wholly Owned Subsidiary of EVRAZ plc)
Consolidated Statements of Comprehensive Income (Loss) (unaudited)
(In Thousands)
| For The Nine Months Ended September 30, | ||||||||
| 2014 | 2013 | �� | ||||||
Net income (loss) | $ | 55,375 | $ | (27,836 | ) | |||
|
|
|
| |||||
Other comprehensive (loss) income, net of tax: | ||||||||
Foreign currency translation adjustments | (34,855 | ) | (18,823 | ) | ||||
Changes in pension and postretirement benefit plans, net of tax of $(1,173) and $(2,343) at September 30, 2014 and 2013, respectively | 3,964 | 3,672 | ||||||
|
|
|
| |||||
Total other comprehensive loss | (30,891 | ) | (15,151 | ) | ||||
|
|
|
| |||||
Comprehensive income (loss) | 24,484 | (42,987 | ) | |||||
Less comprehensive loss attributable to noncontrolling interest | 13,258 | 31,638 | ||||||
|
|
|
| |||||
Comprehensive income (loss) attributable to EVRAZ NORTH AMERICA LIMITED | $ | 37,742 | $ | (11,349 | ) | |||
|
|
|
| |||||
See accompanying notes to the unaudited consolidated financial statements.
F-4
Table of Contents
EVRAZ NORTH AMERICA LIMITED and Subsidiaries
(Wholly Owned Subsidiary of EVRAZ plc)
Consolidated Statements of Cash Flows (unaudited)
(In Thousands)
| For The Nine Months Ended September 30, | ||||||||
| 2014 | 2013 | |||||||
Operating activities | ||||||||
Net income (loss) | $ | 55,375 | $ | (27,836 | ) | |||
Loss from discontinued operations | (10,186 | ) | (22,699 | ) | ||||
|
|
|
| |||||
Income (loss) from continuing operations | 65,561 | (5,137 | ) | |||||
Adjustments to reconcile net income (loss) from continuing operations to net cash (used in) provided by continuing operating activities: | ||||||||
Depreciation and amortization | 122,592 | 132,408 | ||||||
Share-based compensation | 3,152 | 2,161 | ||||||
Deferred income taxes | (15,249 | ) | (59,504 | ) | ||||
(Gain) loss on disposal of assets | (154 | ) | 549 | |||||
Inventory lower of cost or market adjustments | 3,991 | 5,469 | ||||||
Foreign exchange losses (gains) | 9,251 | (160 | ) | |||||
Employee benefit plans | (5,306 | ) | (4,730 | ) | ||||
Other, net | (8,914 | ) | (2,788 | ) | ||||
Changes in current assets and liabilities: | ||||||||
Trade accounts receivable | (72,758 | ) | (29,517 | ) | ||||
Operating liabilities | (76,097 | ) | (55,136 | ) | ||||
Related-party payables | 32,883 | 127,941 | ||||||
Inventories | (186,188 | ) | (12,220 | ) | ||||
Income taxes | (11,035 | ) | (33,239 | ) | ||||
Other, net | 10,775 | (5,510 | ) | |||||
|
|
|
| |||||
Net cash (used in) provided by continuing operating activities | (127,496 | ) | 60,587 | |||||
Net cash (used in) provided by discontinued operating activities | (6,334 | ) | 41,053 | |||||
|
|
|
| |||||
Net cash (used in) provided by operating activities | (133,830 | ) | 101,640 | |||||
|
|
|
| |||||
Investing activities | ||||||||
Purchases of property, plant, and equipment | (46,507 | ) | (66,629 | ) | ||||
Proceeds from the sale of business | 7,400 | — | ||||||
Proceeds from the disposal of property, plant and equipment | 331 | 1,265 | ||||||
Dividends received | 55 | 819 | ||||||
|
|
|
| |||||
Net cash used in investing activities by continuing operations | (38,721 | ) | (64,545 | ) | ||||
Net cash used in discontinued investing activities | — | (8,511 | ) | |||||
|
|
|
| |||||
Net cash used in investing activities | (38,721 | ) | (73,056 | ) | ||||
|
|
|
| |||||
Financing activities | ||||||||
Borrowings under Credit Facility | 1,170,060 | 277,823 | ||||||
Repayments under Credit Facility | (1,089,459 | ) | (348,400 | ) | ||||
Restricted deposits at banks relating to financing | — | 54 | ||||||
Payments under capital leases | — | (6,822 | ) | |||||
Dividend to EGSA | (72,350 | ) | (137,435 | ) | ||||
|
|
|
| |||||
Net cash provided by (used in) financing activities by continuing operations | 8,251 | (214,780 | ) | |||||
Effects of foreign currency exchange rate on cash | (1,702 | ) | (4,718 | ) | ||||
|
|
|
| |||||
Net decrease in cash and cash equivalents | (166,002 | ) | (190,914 | ) | ||||
Cash and cash equivalents at the beginning of period | 193,321 | 254,593 | ||||||
|
|
|
| |||||
Cash and cash equivalents at the end of period | $ | 27,319 | $ | 63,679 | ||||
|
|
|
| |||||
See accompanying notes to the unaudited consolidated financial statements.
F-5
Table of Contents
EVRAZ NORTH AMERICA LIMITED and Subsidiaries
(Wholly Owned Subsidiary of EVRAZ plc)
Notes to Consolidated Financial Statements (unaudited)
Nine Months Ended September 30, 2014 and 2013
1. Basis of Presentation, Nature of Operations and Significant Accounting Policies
Basis of Presentation and Nature of Operations
EVRAZ NORTH AMERICA LIMITED (“ENA” or the “Company”), is a company domiciled in England under the Company Law of England and Wales. ENA is a wholly owned subsidiary of Evraz Group S.A. (“EGSA”), which in turn is a wholly owned subsidiary of EVRAZ plc, based in London, UK.
On September 30, 2014, and in contemplation of an initial public offering of the Company, 100% of the outstanding voting shares of EVRAZ Inc., N.A. (“EINA”) and 51% of the outstanding voting shares of EVRAZ Inc., N.A. Canada (“EICA”) were transferred to ENA from EGSA. EGSA retained a 49% ownership interest in EICA which results in the presentation of non-controlling interest associated with the remaining 49% ownership held be EGSA. Prior to the transfer, the Company had no substantive operations of its own. The transfer represents a transfer between entities under common control, and accordingly, the Company recognized EINA and EICA’s net assets at their historical carrying amounts. No cash was exchanged as part of the transfer. The transfer also represents a reorganization of entities under common control and as such, the Company’s consolidated financial statements have been presented as if ENA had owned 100% of the shares of EINA and 51% of the shares of EICA for the periods presented, including the periods prior to the Company’s formation. Upon completion of the effective public offering, EGSA intends to transfer its 49% interest in EICA to the Company in exchange for proceeds from the initial public offering.
On September 5, 2014, the Company issued 50,000 shares of common stock to EGSA in exchange for approximately eighty two thousand dollars.
On September 30, 2014, as part of the reorganization, the Company issued 958 shares of common stock to EGSA.
The Company, through its controlled operating subsidiaries EINA and EICA, is a diversified steelmaker that manufactures and markets engineered steel products for rail, energy and industrial end markets in the United States and Canada. The Company has six manufacturing locations in the Western U.S. and Canada.
The Company organizes its business into three operating segments: Long Division, Tubular Division, and Flat Division.
Principles of Consolidation
In the opinion of management, all adjustments (consisting of normal recurring accruals) considered necessary for a fair presentation have been included. Operating results for the nine-months ended September 30, 2014 are not necessarily indicative of the results that may be expected for the year ending December 31, 2014.
The Company prepares the consolidated financial statements in accordance with U.S. generally accepted accounting principles (“U.S. GAAP”).
The consolidated balance sheet at December 31, 2013 has been derived from the audited consolidated financial statements at that date. Additional information is contained in EVRAZ NORTH AMERICA LIMITED’s audited consolidated financial statements for the years ended December 31, 2013, 2012 and 2011, which should be read in conjunction with these interim consolidated financial statements.
F-6
Table of Contents
EVRAZ NORTH AMERICA LIMITED and Subsidiaries
(Wholly Owned Subsidiary of EVRAZ plc)
Notes to Consolidated Financial Statements (unaudited) (continued)
Nine Months Ended September 30, 2014 and 2013
1. Basis of Presentation, Nature of Operations and Significant Accounting Policies (continued)
The consolidated financial statements include the accounts of ENA and its majority owned subsidiaries. All intercompany balances and transactions have been eliminated. The Company is not the beneficiary of any variable interest entities.
For comparative purposes, the consolidated financial statements and related disclosures reflect the results of the Company’s Claymont, Delaware steel mill (“EVRAZ Claymont”) reporting unit and the Surrey, British Columbia mill (“EVRAZ Surrey”) reporting unit as discontinued operations, net of applicable income taxes, for all reporting periods presented. EVRAZ Claymont and EVRAZ Surrey were previously included in the Flat Division segment. All related disclosures have also been adjusted to reflect the discontinued operations. See Note 10—Discontinued Operations and Held for Sale Assets and Liabilities for further discussion.
All amounts in the consolidated financial statements and notes are specified in thousands of U.S. dollars, unless specifically stated otherwise.
Use of Estimates
The preparation of consolidated financial statements in conformity with U.S. GAAP requires management to make estimates and assumptions that affect the reported amounts in the consolidated financial statements, and the related disclosures. The Company evaluates its estimates on an ongoing basis, and actual results could differ from those estimates.
Change in Accounting Policies
As of January 1, 2014, the Company changed its annual impairment test date for goodwill and indefinite-lived intangible assets to October 1.
Fair Value Measurements
The Company measures fair value using inputs from the three levels of the fair value hierarchy. The hierarchy gives the highest priority to unadjusted quoted prices in active markets for identical assets or liabilities (Level 1 measurements) and the lowest priority to unobservable inputs (Level 3 measurements). The three levels of the fair value hierarchy are described below:
Level 1 – Unadjusted quoted prices in active markets for identical assets and liabilities.
Level 2 – Inputs other than quoted prices included within Level 1 that are observable for the determination of the fair value of the asset or liability, either directly or indirectly.
Level 3 – Unobservable inputs that are significant to the determination of the fair value of the asset or liability.
At September 30, 2014 and December 31, 2013, the Company had no financial assets or liabilities measured at fair value on a recurring basis.
There were no other material fair value measurements at September 30, 2014.
F-7
Table of Contents
EVRAZ NORTH AMERICA LIMITED and Subsidiaries
(Wholly Owned Subsidiary of EVRAZ plc)
Notes to Consolidated Financial Statements (unaudited) (continued)
Nine Months Ended September 30, 2014 and 2013
2. Inventories
The components of inventories were as follows:
| September 30 2014 | December 31 2013 | |||||||
Raw materials | $ | 114,440 | $ | 74,922 | ||||
Semi-finished products | 248,513 | 144,136 | ||||||
Finished products | 181,822 | 152,258 | ||||||
Stores and operating supplies | 123,986 | 130,908 | ||||||
|
|
|
| |||||
Total inventories | $ | 668,761 | $ | 502,224 | ||||
|
|
|
| |||||
3. Debt and Related-Party Loans
Debt and related-party loan balances were as follows:
| September 30 2014 | December 31 2013 | |||||||
Related-party loans | $ | 735,385 | $ | 774,381 | ||||
|
|
|
| |||||
2011 ABL credit facility | $ | 178,020 | $ | 99,984 | ||||
|
|
|
| |||||
The related-party loans were refinanced subsequent to September 30, 2014. See Note 14 - Subsequent Events.
4. Business Disposal
On June 26, 2014, the Company sold its cut-to-length business in Regina, Saskatchewan, including the machinery and equipment, spare parts and customer lists for total cash consideration of $7.4 million. The Company recorded a $0.7 million gain upon disposal of the EVRAZ Regina cut-to-length business, which was formerly included within the Company’s Flat Division segment.
5. Income Taxes
The Company’s provision for income taxes in interim periods is computed by applying the appropriate estimated annual effective tax rates to income or loss before income taxes for the period. In addition, non-recurring or discrete items are recorded during the periods in which they occur.
The Company’s effective tax rate for the nine months ended September 30, 2014 was lower than the full year UK main Corporation Tax rate of 21.5% for the 2014 calendar year primarily due to the net impact of benefits recorded related to previously unrecognized tax benefits and tax credits generated by the Company. In addition, the Company recognized a benefit for losses generated in a jurisdiction with a higher tax rate than that of the UK. These factors were partially offset by various permanent differences that resulted in additional tax expense.
F-8
Table of Contents
EVRAZ NORTH AMERICA LIMITED and Subsidiaries
(Wholly Owned Subsidiary of EVRAZ plc)
Notes to Consolidated Financial Statements (unaudited) (continued)
Nine Months Ended September 30, 2014 and 2013
5. Income Taxes
The Company’s effective tax rate for the nine months ended September 30, 2013 was higher than the full year UK main Corporation Tax rate of 23.25% for the 2013 calendar year primarily due to the generation of losses in jurisdictions with a higher statutory rate than in the UK. In addition, the Company recognized tax benefits for tax credits generated by the Company.
During 2014, the Company’s total amount of unrecognized tax benefits decreased by $5.5 million as a result of a Canadian audit settlement.
6. Employee Benefit Plans
EINA and EICA maintain qualified defined benefit pension plans for some of the employees in both the U.S. and Canada. These plans generally provide benefits of stated amounts based on years of service or provide benefits based on the participant’s hourly wage rate and years of service. For these plans, the Company uses a measurement date for plan assets and obligations of December 31. In addition, the Company has 401(k) and other defined contribution plans available for eligible U.S. and Canadian-based employees which the Company matches a percentage of the participants’ contributions. The Company also has U.S. and Canadian supplemental retirement plans (SERP’s) which are unqualified plans designed to maintain benefits for eligible employees at the plan formula level. The Company provides other unfunded postretirement medical and life insurance plans (OPEB’s) for certain of its eligible employees upon retirement after completion of a specified number of years of service.
The components of net periodic benefit cost related to the defined benefit plan for the nine months ended September 30, 2014 and 2013 were as follows:
| Defined Benefit Plans | ||||||||||||||||
| U.S. Plans | Canadian Plans | |||||||||||||||
| Nine Months Ended September 30 | Nine Months Ended September 30 | |||||||||||||||
| 2014 | 2013 | 2014 | 2013 | |||||||||||||
Service cost | $ | 4,985 | $ | 6,728 | $ | 8,239 | $ | 9,021 | ||||||||
Interest cost | 9,194 | 8,219 | 12,992 | 12,338 | ||||||||||||
Expected return on plan assets | (10,065 | ) | (9,665 | ) | (16,379 | ) | (15,428 | ) | ||||||||
Curtailment / settlement expense | — | 45 | — | — | ||||||||||||
Prior service cost | — | 5 | 203 | 235 | ||||||||||||
Amortization of net loss | 1,699 | 5,541 | 3,947 | 5,205 | ||||||||||||
|
|
|
|
|
|
|
| |||||||||
Totals | $ | 5,813 | $ | 10,873 | $ | 9,002 | $ | 11,371 | ||||||||
|
|
|
|
|
|
|
| |||||||||
F-9
Table of Contents
EVRAZ NORTH AMERICA LIMITED and Subsidiaries
(Wholly Owned Subsidiary of EVRAZ plc)
Notes to Consolidated Financial Statements (unaudited) (continued)
Nine Months Ended September 30, 2014 and 2013
6. Employee Benefit Plans (continued)
The components of net periodic benefit cost related to the SERP’s for the nine months ended September 30, 2014 and 2013 were as follows:
| SERP’s | ||||||||||||||||
| U.S. Plans | Canadian Plans | |||||||||||||||
| Nine Months Ended September 30 | Nine Months Ended September 30 | |||||||||||||||
| 2014 | 2013 | 2014 | 2013 | |||||||||||||
Service cost | $ | 9 | $ | 501 | $ | 16 | $ | 17 | ||||||||
Interest cost | 128 | 182 | 212 | 207 | ||||||||||||
Expected return on plan assets | — | — | (15 | ) | — | |||||||||||
Prior service credit | — | — | — | (20 | ) | |||||||||||
Amortization of net loss | — | 260 | 3 | 2 | ||||||||||||
|
|
|
|
|
|
|
| |||||||||
Totals | $ | 137 | $ | 943 | $ | 216 | $ | 206 | ||||||||
|
|
|
|
|
|
|
| |||||||||
The components of net periodic benefit cost associated with the OPEB’s for the nine months ended September 30, 2014 and 2013 were as follows:
| OPEB’s | ||||||||||||||||
| U.S. Plans | Canadian Plans | |||||||||||||||
| Nine Months Ended September 30 | Nine Months Ended September 30 | |||||||||||||||
| 2014 | 2013 | 2014 | 2013 | |||||||||||||
Service cost | $ | 394 | $ | 442 | $ | 140 | $ | 215 | ||||||||
Interest cost | 1,113 | 920 | 364 | 411 | ||||||||||||
Prior service credit | — | — | (102 | ) | (108 | ) | ||||||||||
Amortization of net loss | 79 | 76 | (60 | ) | — | |||||||||||
|
|
|
|
|
|
|
| |||||||||
Totals | $ | 1,586 | $ | 1,438 | $ | 342 | $ | 518 | ||||||||
|
|
|
|
|
|
|
| |||||||||
The Company has 401(k) and other defined contribution plans available for eligible U.S.-based employees which the Company matches a percentage of the participants’ contributions. The Company’s matching contribution expense in the U.S. was $6.4 million and $7.1 million for the nine months ended September 30, 2014 and 2013, respectively.
The Company has defined contribution plans available for eligible Canadian-based employees which the Company matches a percentage of the participants’ contributions. The Company’s matching contribution expense in Canada was $0.6 million and $0.5 million for the nine months ended September 30, 2014 and 2013, respectively.
7. Commitments and Contingencies
Environmental
The Company is subject to environmental laws and regulations established by federal, state, Canadian provincial and local authorities and, accordingly, makes provisions for the estimated costs of compliance. All
F-10
Table of Contents
EVRAZ NORTH AMERICA LIMITED and Subsidiaries
(Wholly Owned Subsidiary of EVRAZ plc)
Notes to Consolidated Financial Statements (unaudited) (continued)
Nine Months Ended September 30, 2014 and 2013
7. Commitments and Contingencies (continued)
material environmental remediation liabilities for non-capital expenditures, which are probable and estimable, are recorded in the consolidated financial statements based on current technologies and current environmental standards at the time of evaluation. Adjustments are made when additional information is available that suggests different remediation methods or periods may be required that affect the total cost. The best estimate of the probable cost within a range is recorded; however, if there is no best estimate, the low end of the range is recorded and the range is disclosed. Total accrued environmental costs were $33.7 million and $33.9 million at September 30, 2014 and December 31, 2013, respectively. Approximately $26.0 million and $28.7 million of the accrued environmental costs were considered long-term liabilities at September 30, 2014 and December 31, 2013, respectively. Environmental costs are discounted to present value when the cash outflows are fixed and reliably determinable.
In June 2000, the Company entered into a voluntary agreement with the Oregon Department of Environmental Quality (“DEQ”) to investigate the possibility that historical contaminant sources at its EVRAZ Portland facility had contributed to, or continue to contribute to, contamination to the adjacent Willamette River in what has been designated as the Portland Harbor Superfund Site (the “Site”). Under the voluntary agreement with the DEQ, the Company has committed to remediate potential contaminant migration into the river from upland sources by stabilizing the riverbank to reduce erosion of soils into the river and by adding a stormwater treatment system that treats groundwater and surface soils that are captured in the storm sewer system. The Company’s best estimate of the costs to conduct this remedial action was $9.5 million at September 30, 2014. Of this amount $4.7 million is included with current accrued expenses and $4.8 million is included with long-term environmental liabilities on the consolidated balance sheet at September 30, 2014.
In a related matter, the Company has been notified by the U.S. Environmental Protection Agency (the “EPA”) under the Comprehensive Environmental Response, Compensation and Liability Act (“CERCLA”) that it is one of at least 100 potentially responsible parties (“PRPs”) that own or operate or formerly owned or operated sites adjacent to the Site. EPA is currently evaluating a draft feasibility study and will use it to formulate its Proposed Plan for public comment, after which it will issue a Record of Decision setting forth its chosen remedial action. The cost of remediation associated with the Site will not be fully known until the EPA issues its Record of Decision and design work is done for the implementation of that remedy. Also in a related matter, federal, state and tribal Portland Harbor Natural Resource Trustees have also notified the Company that it is also potentially liable under CERCLA and other federal and state laws for natural resource damages (“NRD”) that have occurred at the Site. The total amount of such NRD damages, and the amount that would be allocated to the Company are currently not known. The Company, however, has estimated the range of costs that may be incurred in connection with the Site, both with respect to remedial action and NRD, and has recorded a liability based on the best estimate, given the facts currently known. The Company’s estimated obligation ranges between $6.8 million and $97.3 million. The related liability, included in total long-term accrued environmental liabilities, was $6.8 million at September 30, 2014 and December 31, 2013.
The Company has insurance policies that it believes will provide reimbursement for the majority of the costs it incurs for defense, remediation and NRD in connection with the Site, including adjacent properties. In connection with these matters, the Company could incur additional costs associated with investigation and required remedial actions, and NRD, the costs of which may exceed available insurance or which may not be covered by insurance, which therefore could have a material adverse effect on the Company’s consolidated results of operations and cash flows.
F-11
Table of Contents
EVRAZ NORTH AMERICA LIMITED and Subsidiaries
(Wholly Owned Subsidiary of EVRAZ plc)
Notes to Consolidated Financial Statements (unaudited) (continued)
Nine Months Ended September 30, 2014 and 2013
7. Commitments and Contingencies (continued)
In October 1995, CF&I and the Colorado Department of Public Health and Environment (“CDPHE”) finalized a post-closure permit for hazardous waste units at the Company’s EVRAZ Pueblo facility. As part of the post-closure permit requirements, the Company must conduct a corrective action program for the 82 solid waste management units (“SWMU”) at the facility and continue to address projects on a prioritized corrective action schedule over 30 years. The State of Colorado mandated that the schedule for corrective action could be accelerated if new data indicated a greater threat existed to the environment than was currently believed to exist. At September 30, 2014, the total accrued liability for all remaining SWMU’s was $13.7 million. Of this amount, $1.8 million is included with current accrued expenses, and $11.9 million is included with long-term environmental liabilities on the consolidated balance sheet at September 30, 2014. The portion of the liability with estimable cash flows was discounted to present value using discount rates ranging from 2.69% to 5.25%.
During 2014, the Company received notice from the State of Colorado Department of Public Health and Environment (“CDPHE”) alleging that the Company’s Pueblo, Colorado mill may have violated provisions of its Title V air permit. The CDPHE has proposed a fine in response to the alleged violations and the Company is currently negotiating a resolution to the alleged permit violations and proposed fine. The Company has recorded a $0.3 million liability at September 30, 2014.
Inherent uncertainties exist in these estimates primarily due to unknown conditions, evolving remediation technology, and changing governmental regulations and legal standards.
Labor Matters
At September 30, 2014, approximately 2,723 people, or 65% of the Company’s workforce, are unionized personnel represented by the United Steelworkers (“USW”), UNIFOR, formerly the Canadian Auto Workers (“CAW”), and the International Association of Bridge, Structural, Ornamental, and Reinforcing Iron Workers. On December 10, 2011, the Company renewed the separate collective bargaining agreements with the USW, which represent unionized employees in Regina and Calgary, for the period July 31, 2011 to July 30, 2014. The unionized employees in Regina and Calgary that are covered by this agreement are continuing to work under the terms of the expired agreement while a new agreement is being negotiated. In 2012, the Company renewed the collective bargaining agreement with the CAW, which represents unionized employees in Camrose, for the period February 1, 2012 to January 31, 2016. In January 2013, the Company renewed the separate collective bargaining agreement with the Iron Workers Union, which represents unionized employees in Red Deer, for the period January 1, 2013 to December 31, 2017. In September 2013, the Company extended the collective bargaining agreement with the USW, representing unionized employees in Pueblo, Colorado until September 2017. Changes were only made to future wages.
Other Contingencies
The Company is party to various other claims, disputes, legal actions, and other proceedings involving contracts, employment, and various other matters. In the opinion of management, the outcome of these matters would not have a material adverse effect on the consolidated financial position of the Company, its results of operations, and liquidity.
F-12
Table of Contents
EVRAZ NORTH AMERICA LIMITED and Subsidiaries
(Wholly Owned Subsidiary of EVRAZ plc)
Notes to Consolidated Financial Statements (unaudited) (continued)
Nine Months Ended September 30, 2014 and 2013
8. Statement of Changes in Equity
The following table reflects the nine months ended September 30, 2014 reconciliation of the carrying amount of total equity, equity attributable to the Company and equity attributable to noncontrolling interest:
| Common Stock Amount | Additional Paid-In Capital | Accumulated Deficit | Accumulated Other Comprehensive Income (Loss) | Total EVRAZ NORTH AMERICA LIMITED Equity | Noncontrolling Interest | Total Equity | ||||||||||||||||||||||
Balance at January 1, 2014 | $ | 1 | $ | 3,033,364 | $ | (1,337,195 | ) | $ | (43,743 | ) | $ | 1,652,427 | $ | 357,833 | $ | 2,010,260 | ||||||||||||
Net income | — | — | 55,319 | — | 55,319 | 56 | 55,375 | |||||||||||||||||||||
Foreign currency translation adjustments | — | — | — | (20,311 | ) | (20,311 | ) | (14,544 | ) | (34,855 | ) | |||||||||||||||||
Actuarial changes in pension liability, net of tax | — | — | — | 2,734 | 2,734 | 1,230 | 3,964 | |||||||||||||||||||||
Dividend distribution | — | — | (72,350 | ) | — | (72,350 | ) | (880 | ) | (73,230 | ) | |||||||||||||||||
Contribution from EVRAZ plc for share-based compensation | — | 3,152 | — | — | 3,152 | — | 3,152 | |||||||||||||||||||||
Ordinary shares issued to EVRAZ plc and EGSA | 82 | — | — | — | 82 | — | 82 | |||||||||||||||||||||
|
|
|
|
|
|
|
|
|
|
|
|
|
| |||||||||||||||
Balance at September 30, 2014 | $ | 83 | $ | 3,036,516 | $ | (1,354,226 | ) | $ | (61,320 | ) | $ | 1,621,053 | $ | 343,695 | $ | 1,964,748 | ||||||||||||
|
|
|
|
|
|
|
|
|
|
|
|
|
| |||||||||||||||
9. Earnings (Loss) Per Share
Basic earnings (loss) per common share is based on the weighted average number of common shares outstanding during the period. The Company did not have any stock options, or other potentially dilutive securities outstanding during the periods presented.
The computation of basic earnings per share from continuing operations, net of tax, is summarized in the following table (in thousands, except per share data):
Nine Months Ended September 30 | ||||||||
| 2014 | 2013 | |||||||
Basic earnings per share from continuing operations: | ||||||||
Net earnings from continuing operations | $ | 65,505 | $ | 16,063 | ||||
Weighted average number of shares outstanding | 5,631 | 1,001 | ||||||
Basic earnings per share from continuing operations | $ | 11,634 | $ | 16,047 | ||||
F-13
Table of Contents
EVRAZ NORTH AMERICA LIMITED and Subsidiaries
(Wholly Owned Subsidiary of EVRAZ plc)
Notes to Consolidated Financial Statements (unaudited) (continued)
Nine Months Ended September 30, 2014 and 2013
9. Earnings (Loss) Per Share (continued)
The computation of basic loss per share from discontinued operations, net of tax, is summarized in the following table (in thousands, except per share data):
Nine Months Ended September 30 | ||||||||
| 2014 | 2013 | |||||||
Basic loss per share from discontinued operations: | ||||||||
Net loss from discontinued operations | $ | (10,186 | ) | $ | (22,699 | ) | ||
Weighted average number of shares outstanding | 5,631 | 1,001 | ||||||
Basic loss per share from discontinued operations | $ | (1,809 | ) | $ | (22,676 | ) | ||
10. Discontinued Operations and Held for Sale Assets and Liabilities
In October 2013, the Company announced it was idling EVRAZ Claymont due to reduced market demand and the high volume of imported steel. The idling of EVRAZ Claymont represented a significant indicator of impairment for the mill’s property, plant and equipment and goodwill and other intangible assets. As a result of performing an impairment analysis, the long-lived tangible assets were impaired at December 1, 2013, resulting in a $148.2 million impairment loss for property, plant and equipment, including impairment of asset retirement obligations of $15 million, a $104.6 million impairment loss for goodwill and a $19.5 million impairment loss for customer relationship-related intangible assets in the three months ended December 31, 2013. An asset retirement obligation of $15.0 million was triggered following the idling of the EVRAZ Claymont mill. The fair value of the asset retirement obligation has been recorded as liabilities held for sale within the Company’s consolidated balance sheet at September 30, 2014. The estimated cost of the asset retirement obligation was recorded as property, plant and equipment in the three months ended December 31, 2013. In addition, certain inventories of EVRAZ Claymont were adjusted to net realizable value, which was lower than cost, and the $24.6 million adjustment was treated as an impairment of assets in the three months ended December 31, 2013. Subsequently, in June 2014, the Company’s management made the decision to dispose of all the assets of EVRAZ Claymont. The Company determined that the future disposal of EVRAZ Claymont met the criteria for being classified as a component held for sale and a discontinued operation as of September 30, 2014. Prior to any disposal of EVRAZ Claymont, the Company will continue to incur expenses, primarily for payroll and utilities. Subsequent to any disposal, the Company does not expect to have continuing cash flows or involvement with the discontinued reporting unit.
The EVRAZ Surrey cut-to-length facility, representing a separate reporting unit, operated throughout 2013 until the Company sold its non-current tangible assets, including land, buildings and equipment, on December 13, 2013. The sale was for total cash consideration of $12.7 million, which approximated the recorded value of the net assets sold, thus there was no gain or loss on the sale. Indicators of impairment existed for EVRAZ Surrey’s property, plant and equipment and other intangible assets as of December 1, 2013. As a result of performing an impairment analysis, a $6.2 million impairment was recorded for property, plant and equipment and a $18.4 million impairment was recorded for the customer relationship intangible assets in the three months ended December 31, 2013. The Company determined that the sale of EVRAZ Surrey met the criteria for being classified as a discontinued operation. Subsequent to the sale, the Company did not have continuing cash flows or involvement with the discontinued operating unit.
F-14
Table of Contents
EVRAZ NORTH AMERICA LIMITED and Subsidiaries
(Wholly Owned Subsidiary of EVRAZ plc)
Notes to Consolidated Financial Statements (unaudited) (continued)
Nine Months Ended September 30, 2014 and 2013
10. Discontinued Operations and Held for Sale Assets and Liabilities (continued)
EVRAZ Claymont’s and EVRAZ Surrey’s results of operations have been removed from the Company’s results of continuing operations for all periods presented and are presented as discontinued operations. EVRAZ Claymont and EVRAZ Surrey were previously included in the Flat Division. All disclosures for the related periods have also been adjusted to reflect the discontinued operations.
The liabilities and related expenses for employee benefit plans, and the current and deferred income tax assets for the EVRAZ Claymont and EVRAZ Surrey reporting units were included in the consolidated balance sheets and statements of operations from continuing operations as they are not associated with the disposal groups assets and liabilities.
The EVRAZ Claymont mill entered into a 10-year non-cancellable purchase commitment for oxygen starting September 1, 2011. The contract required the Company to purchase a minimum volume of oxygen each quarter until the contract expires in August 2021. In 2014, the Company reached an agreement with the supplier to terminate the supply purchase commitment, and accordingly, the Company recorded a $7.0 million charge, which is included in the loss from discontinued operations before income taxes on the accompanying consolidated statement of operations for the nine months ended September 30, 2014.
The following table provides a reconciliation of the major classes of line items constituting the pretax loss of the discontinued operations to the after-tax loss of the discontinued operations presented on the face of the consolidated statement of operations for the nine months ended September 30, 2014 and 2013:
| Nine Months Ended September 30, | ||||||||
| 2014 | 2013 | |||||||
Sales | $ | 215 | $ | 247,039 | ||||
Cost of sales | (14,257 | ) | (271,834 | ) | ||||
Selling, general and administrative expenses | (1,915 | ) | (20,071 | ) | ||||
|
|
|
| |||||
Loss before income taxes | (15,957 | ) | (44,866 | ) | ||||
Income tax benefit | 5,771 | 22,167 | ||||||
|
|
|
| |||||
Net loss from discontinued operations | $ | (10,186 | ) | $ | (22,699 | ) | ||
|
|
|
| |||||
The following table summarizes the components of EVRAZ Claymont’s assets and liabilities held for sale presented separately on the consolidated balance sheets as of September 30, 2014 and December 31, 2013:
| September 30 2014 | December 31 2013 | |||||||
Assets: | ||||||||
Trade accounts receivable, net | $ | 173 | $ | 14,387 | ||||
Inventories | 2,534 | 2,528 | ||||||
Other assets | 469 | 1,253 | ||||||
|
|
|
| |||||
Total assets held for sale | 3,176 | 18,168 | ||||||
|
|
|
| |||||
Liabilities: | ||||||||
Accounts payable | 1,105 | 5,070 | ||||||
Accrued expenses | 1,164 | 3,620 | ||||||
Asset retirement obligation liabilities | 15,000 | 15,000 | ||||||
|
|
|
| |||||
Total liabilities held for sale | $ | 17,269 | $ | 23,690 | ||||
|
|
|
| |||||
F-15
Table of Contents
EVRAZ NORTH AMERICA LIMITED and Subsidiaries
(Wholly Owned Subsidiary of EVRAZ plc)
Notes to Consolidated Financial Statements (unaudited) (continued)
Nine Months Ended September 30, 2014 and 2013
10. Discontinued Operations and Held for Sale Assets and Liabilities (continued)
The depreciation, amortization, capital expenditures, and other significant noncash items of the discontinued operations for the nine months ended September 30, 2014 and 2013 are as follows:
| Nine Months Ended September 30 | ||||||||
| 2014 | 2013 | |||||||
Depreciation | $ | — | $ | 14,712 | ||||
Amortization | — | 3,344 | ||||||
Capital expenditures | — | 8,511 | ||||||
11. Segment Information
Generally accepted accounting principles for reporting information about operating segments define operating segments as components of an enterprise for which separate financial information is available that is evaluated regularly by the chief operating decision maker (“CODM”) in deciding how to allocate resources and in assessing performance. The Company’s CODM is the Chief Executive Officer. The Company is organized and managed based primarily upon the similarity of the types of products produced and sold by each of its operating segments.
While the CODM evaluates results in a number of different ways, the primary basis for allocating resources and assessing financial results is by the Company’s three operating and reportable segments: Long Division, Tubular Division and Flat Division.
The Long Division produces rail, wire rod used in infrastructure, and OCTG seamless product used in oil and gas applications. The Long Division also includes the GSI scrap collection and processing facilities, a steelmaking and finishing facility and the C&W railway, which operates a short-line railroad principally servicing the Long Division mills.
The Tubular Division produces large diameter pipe used for oil and natural gas pipelines, small diameter welded pipe, and casing and tubing for use in the collection of oil and gas, among other industrial applications. The Tubular Division consists of the EVRAZ Camrose, EVRAZ Portland Tubular, EVRAZ Regina, EVRAZ Regina Tubular, EVRAZ Calgary, and EVRAZ Red Deer facilities, in addition to the GSP scrap collection and processing facilities.
The Flat Division manufactures steel plate, coil and structural tubing used in various construction and industrial end markets. The Flat Division includes EVRAZ Portland, and EVRAZ Regina CTL. The Flat Division also produces hollow steel structural product at its facility in Portland, Oregon and operates a temper mill and cut-to-length facility at its 60%-owned OFP joint venture facility.
EVRAZ Surrey and EVRAZ Claymont have been reported as discontinued operations and, accordingly, their financial position and results of operations have been excluded from the segment disclosure for all periods presented. See Note 10 – Discontinued Operations and Held for Sale Assets and Liabilities for further discussion.
The CODM analyzes revenue at the product sales level, which does not include freight revenue. Intersegment product sales from one segment to another segment are made at rates that approximate market and are eliminated at the corporate consolidation level. These intersegment product sales produce intersegment profits which are not recognized until the finished products are ultimately sold to third parties.
F-16
Table of Contents
EVRAZ NORTH AMERICA LIMITED and Subsidiaries
(Wholly Owned Subsidiary of EVRAZ plc)
Notes to Consolidated Financial Statements (unaudited) (continued)
Nine Months Ended September 30, 2014 and 2013
11. Segment Information (continued)
The information provided below reflects internal information that is provided to the Company’s CODM for management purposes. The CODM primarily measures segment performance by adding back depreciation expense, amortization expense, impairment of assets, and loss (gain) on disposal of property, plant and equipment from segment operating income from continuing operations. This performance measure reflects fundamental earnings potential and measures the cash earnings that can be used to pay interest, repay principal balances on debt, and finance capital expenditures and dividends.
Certain assets are not allocated to the operating segments and are held at the corporate level, including cash and cash equivalents, restricted cash, refundable income taxes, and certain prepaid expenses and other assets. These corporate assets, in addition to intercompany notes receivable, are excluded from segment assets when the Company’s CODM assesses segment performance on the balance sheet.
The Company’s results by reporting segment for continuing operations for the nine months ended September 30, 2014 and 2013 were as follows:
| Nine Months Ended | ||||||||
| September 30 2014 | September 30 2013 | |||||||
Product sales to external customers: | ||||||||
Long | $ | 736,638 | $ | 633,612 | ||||
Tubular | 1,028,772 | 871,450 | ||||||
Flat | 470,155 | 391,453 | ||||||
|
|
|
| |||||
Total external product sales | 2,235,565 | 1,896,515 | ||||||
Freight sales | 123,211 | 113,598 | ||||||
|
|
|
| |||||
Total consolidated sales | $ | 2,358,776 | $ | 2,010,113 | ||||
|
|
|
| |||||
| Nine Months Ended | ||||||||
| September 30, 2014 | September 30, 2013 | |||||||
Intersegment product sales: | ||||||||
Long | $ | 9,946 | $ | 14,651 | ||||
Tubular | 34,540 | 48,880 | ||||||
Flat | 111,403 | 110,181 | ||||||
|
|
|
| |||||
Total intersegment product sales | 155,889 | 173,712 | ||||||
|
|
|
| |||||
Eliminations | (155,889 | ) | (173,712 | ) | ||||
|
|
|
| |||||
| $ | — | $ | — | |||||
|
|
|
| |||||
Intersegment product sales include $22.7 million to the EVRAZ Surrey discontinued reporting unit for the nine months ended September 30, 2013. There were no sales to EVRAZ Surrey for the nine months ended September 30, 2014.
F-17
Table of Contents
EVRAZ NORTH AMERICA LIMITED and Subsidiaries
(Wholly Owned Subsidiary of EVRAZ plc)
Notes to Consolidated Financial Statements (unaudited) (continued)
Nine Months Ended September 30, 2014 and 2013
11. Segment Information (continued)
The following measures are used by the CODM for purposes of allocating resources and assessing the performance of the operating segments:
| Nine Months Ended September 30, 2014 | ||||||||||||||||||||
| Long | Tubular | Flat | Eliminations/ Corporate | Total | ||||||||||||||||
Operating income (loss) | $ | 69,769 | $ | 5,536 | $ | 38,751 | $ | (1,585 | ) | $ | 112,471 | |||||||||
Depreciation and amortization expense | 31,811 | 62,634 | 25,912 | 2,235 | 122,592 | |||||||||||||||
Loss (gain) on disposal of property, plant and equipment | 477 | 56 | (687 | ) | — | (154 | ) | |||||||||||||
|
|
|
|
|
|
|
|
|
| |||||||||||
Adjusted operating income | $ | 102,057 | $ | 68,226 | $ | 63,976 | $ | 650 | $ | 234,909 | ||||||||||
|
|
|
|
|
|
|
|
|
| |||||||||||
| Nine Months Ended September 30, 2013 | ||||||||||||||||||||
| Long | Tubular | Flat | Eliminations/ Corporate | Total | ||||||||||||||||
Operating income (loss) | $ | 48,213 | $ | (50,122 | ) | $ | (7,161 | ) | $ | 3,228 | $ | (5,842 | ) | |||||||
Depreciation and amortization expense | 30,280 | 66,785 | 33,114 | 2,229 | 132,408 | |||||||||||||||
Loss (gain) on disposal of property, plant and equipment | 267 | 346 | 115 | (179 | ) | 549 | ||||||||||||||
|
|
|
|
|
|
|
|
|
| |||||||||||
Adjusted operating income | $ | 78,760 | $ | 17,009 | $ | 26,068 | $ | 5,278 | $ | 127,115 | ||||||||||
|
|
|
|
|
|
|
|
|
| |||||||||||
The following table shows a reconciliation of consolidated operating income (loss) to the Company’s income (loss) from continuing operations before income taxes:
| Nine Months Ended | ||||||||
| September 30 2014 | September 30 2013 | |||||||
Operating income (loss) | $ | 112,471 | $ | (5,842 | ) | |||
Interest expense | (47,499 | ) | (53,074 | ) | ||||
Dividend and interest income | 82 | 181 | ||||||
Foreign exchange (losses) gains | (9,251 | ) | 160 | |||||
Other income, net | 3,382 | 1,237 | ||||||
|
|
|
| |||||
Total income (loss) from continuing operations before income taxes | $ | 59,185 | $ | (57,338 | ) | |||
|
|
|
| |||||
12. Share-Based Compensation
EVRAZ plc, the Company’s indirect parent company, maintains share-based incentive compensation plans for certain select key employees of EICA and EINA. Share-based awards issued to employees consist of restricted stock awards (“RSAs”) of EVRAZ plc’s publically traded stock which are accounted for as equity-based compensation. Compensation costs resulting from share-based payment transactions are recognized primarily within selling, general and administrative expenses, at the grant date fair value over the requisite service period on a straight-line basis. The vesting period of the restricted stock awards is approximately 2 to 4 years. The calculated compensation cost is adjusted based on an estimate of awards ultimately expected to vest. The fair value of restricted stock awards is determined using the closing price of EVRAZ plc’s common stock on date of grant.
F-18
Table of Contents
EVRAZ NORTH AMERICA LIMITED and Subsidiaries
(Wholly Owned Subsidiary of EVRAZ plc)
Notes to Consolidated Financial Statements (unaudited) (continued)
Nine Months Ended September 30, 2014 and 2013
12. Share-Based Compensation (continued)
On August 8, 2014, EVRAZ plc granted a total of 4,110,000 RSAs to key employees of EINA and EICA. Each award vests over approximately 4 years and consists of the right to receive one share of EVRAZ plc common stock, subject to forfeiture, if the recipient is an employee on the vesting date. The fair value of each 2014 RSA granted was $1.68, the closing price of the EVRAZ plc stock on the date of grant.
13. Other Comprehensive Income
Reclassifications out of accumulated other comprehensive income (loss) for the nine months ended September 30, 2014(1):
Details about Accumulated Other Comprehensive Income Components | Amount Reclassified from Accumulated Other Comprehensive Income | Line Item in the Consolidated Statements of Operations | ||||
Amortization of defined benefit pension items: | ||||||
Prior service costs | $ | (108 | )(2) | |||
Actuarial gains (losses) | (5,935 | )(2) | ||||
|
| |||||
Total before tax | (6,043 | ) | ||||
Tax benefit | 1,736 | Income tax benefit | ||||
|
| |||||
Net of tax | (4,307 | ) | ||||
Noncontrolling interest | 1,573 | Noncontrolling interest | ||||
|
| |||||
Net of tax and noncontrolling interest | $ | (2,734 | ) | |||
|
| |||||
| (1) | Amounts in parentheses indicate debits in profit/loss. |
| (2) | These accumulated other comprehensive income components are included in the computation of net periodic pension cost. |
Changes in accumulated other comprehensive income by component for the nine months ended September 30, 2014:
Description | Foreign Currency Translation | Pension and Post Retirement Benefit Plans | Totals | |||||||||
Beginning balance | $ | 26,142 | $ | (69,885 | ) | $ | (43,743 | ) | ||||
|
|
|
|
|
| |||||||
Other comprehensive income before reclassifications | (20,311 | ) | — | (20,311 | ) | |||||||
Amounts reclassified from accumulated other comprehensive income | — | 2,734 | 2,734 | |||||||||
|
|
|
|
|
| |||||||
Net current period other comprehensive income | (20,311 | ) | 2,734 | (17,577 | ) | |||||||
|
|
|
|
|
| |||||||
Ending balance | $ | 5,831 | $ | (67,151 | ) | $ | (61,320 | ) | ||||
|
|
|
|
|
| |||||||
14. Subsequent Events
The Company has evaluated subsequent events through November 6, 2014, the date the interim consolidated financial statements were available for issuance.
F-19
Table of Contents
EVRAZ NORTH AMERICA LIMITED and Subsidiaries
(Wholly Owned Subsidiary of EVRAZ plc)
Notes to Consolidated Financial Statements (unaudited) (continued)
Nine Months Ended September 30, 2014 and 2013
14. Subsequent Events (continued)
On October 13, 2014, the Company entered into a new CAD 350 million related-party loan (“Note 3”). This note is due June 30, 2020, and carries a fixed interest rate of 7.50% per annum. The loan agreement for Note 3 includes a clause that resets the interest rate in the event of an external bond offering to the rate of that offering plus 0.75% with a cap of 8.25%. The Company had two related-party loans, Note 1 and Note 2, at September 30, 2014. The proceeds from Note 3 were used to pay in full related-party Note 1 ($241.2 million) and to partially pay related-party Note 2 ($65.8 million). Interest on the related-party loan is payable quarterly.
On October 31, 2014, EICA priced a $350 million debt offering. The closing of the debt offering is expected to occur on November 7, 2014, subject to customary closing conditions. The five year senior secured notes are due November 2019 and carry a fixed interest rate of 7.50% per annum. The notes will be guaranteed by EICA, EINA and certain of EICA and EINA’s subsidiaries. The net proceeds of the debt offering were used to partially pay related-party Note 2.
There have been no subsequent events, other than mentioned above, that occurred during such period that would require disclosure or recognition in the interim consolidated financial statements as of or for the nine months ended September 30, 2014.
F-20
Table of Contents
Report of Independent Registered Public Accounting Firm
The Board of Directors and Shareholders of EVRAZ NORTH AMERICA LIMITED and Subsidiaries
We have audited the accompanying consolidated balance sheets of EVRAZ NORTH AMERICA LIMITED and Subsidiaries as of December 31, 2013 and 2012, and the related consolidated statements of operations, comprehensive (loss) income, shareholders’ equity, and cash flows for each of the three years in the period ended December 31, 2013. Our audits also included the financial statement schedule listed on the page F-68. These financial statements and schedule are the responsibility of the Company’s management. Our responsibility is to express an opinion on these financial statements and schedule based on our audits.
We conducted our audits in accordance with the standards of the Public Company Accounting Oversight Board (United States). Those standards require that we plan and perform the audit to obtain reasonable assurance about whether the financial statements are free of material misstatement. We were not engaged to perform an audit of the Company’s internal control over financial reporting. Our audits included consideration of internal control over financial reporting as a basis for designing audit procedures that are appropriate in the circumstances, but not for the purpose of expressing an opinion on the effectiveness of the Company’s internal control over financial reporting. Accordingly, we express no such opinion. An audit also includes examining, on a test basis, evidence supporting the amounts and disclosures in the financial statements, assessing the accounting principles used and significant estimates made by management, and evaluating the overall financial statement presentation. We believe that our audits provide a reasonable basis for our opinion.
In our opinion, the financial statements referred to above present fairly, in all material respects, the consolidated financial position of EVRAZ NORTH AMERICA LIMITED and Subsidiaries at December 31, 2013 and 2012, and the consolidated results of their operations and their cash flows for each of the three years in the period ended December 31, 2013, in conformity with U.S. generally accepted accounting principles. Also, in our opinion, the related financial statement schedule, when considered in relation to the basic financial statements taken as a whole, presents fairly in all material respects the information set forth therein.
/s/ Ernst & Young LLP
| Chicago, Illinois |
November 6, 2014
F-21
Table of Contents
EVRAZ NORTH AMERICA LIMITED and Subsidiaries
(Wholly Owned Subsidiary of EVRAZ plc)
Consolidated Balance Sheets
(In Thousands, Except Per Share and Share Amounts)
| December 31, 2013 | December 31, 2012 | |||||||
Assets | ||||||||
Current assets: | ||||||||
Cash and cash equivalents | $ | 193,321 | $ | 254,593 | ||||
Restricted cash | — | 55 | ||||||
Trade accounts receivable, less allowance for doubtful accounts of$ 460and $225 at December 31, 2013 and 2012, respectively | 253,882 | 216,541 | ||||||
Inventories | 502,224 | 562,137 | ||||||
Refundable income taxes | — | 7,441 | ||||||
Deferred income taxes | 18,050 | 12 | ||||||
Prepaid expenses | 7,646 | 10,460 | ||||||
Other | 21,790 | 8,953 | ||||||
Assets held for sale | 18,168 | 114,098 | ||||||
|
|
|
| |||||
Total current assets | 1,015,081 | 1,174,290 | ||||||
Property, plant, and equipment, net | 1,224,207 | 1,301,554 | ||||||
Goodwill | 1,082,139 | 1,596,287 | ||||||
Intangibles, net | 444,843 | 522,153 | ||||||
Other assets | 16,377 | 19,942 | ||||||
Assets held for sale | — | 315,872 | ||||||
|
|
|
| |||||
Total assets | $ | 3,782,647 | $ | 4,930,098 | ||||
|
|
|
| |||||
Liabilities and equity | ||||||||
Current liabilities: | ||||||||
Current portion of long-term debt | $ | — | $ | 1,358 | ||||
Accounts payable | 281,868 | 289,457 | ||||||
Related-party payables | 51,971 | 34,227 | ||||||
Accrued expenses | 21,877 | 19,213 | ||||||
Accrued compensation and related benefits | 50,137 | 53,307 | ||||||
Accrued interest and dividends | 1,247 | 718 | ||||||
Taxes payable | 12,745 | — | ||||||
Liabilities held for sale | 23,690 | 44,673 | ||||||
|
|
|
| |||||
Total current liabilities | 443,535 | 442,953 | ||||||
Long-term debt | 99,984 | 303,011 | ||||||
Related-party loans | 774,381 | 827,854 | ||||||
Deferred income taxes | 265,943 | 400,314 | ||||||
Deferred employee benefits | 140,923 | 226,725 | ||||||
Environmental liabilities, net of current portion | 28,690 | 28,858 | ||||||
Other long-term liabilities | 18,931 | 28,348 | ||||||
|
|
|
| |||||
Total liabilities | 1,772,387 | 2,258,063 | ||||||
|
|
|
| |||||
Commitments and contingencies | ||||||||
Equity: | ||||||||
Common stock, $1.00 par value; 1,001 shares authorized, issued and outstanding at December 31, 2013 and 2012 | 1 | 1 | ||||||
Additional paid-in capital | 3,033,364 | 2,760,389 | ||||||
Accumulated deficit | (1,337,195 | ) | (455,533 | ) | ||||
Accumulated other comprehensive income (loss): | ||||||||
Cumulative foreign currency translation adjustment | 26,142 | 56,624 | ||||||
Pension and postretirement benefit plans, net of tax | (69,885 | ) | (113,737 | ) | ||||
|
|
|
| |||||
Total EVRAZ NORTH AMERICA LIMITED equity | 1,652,427 | 2,247,744 | ||||||
Noncontrolling interest | 357,833 | 424,291 | ||||||
|
|
|
| |||||
Total equity | 2,010,260 | 2,672,035 | ||||||
|
|
|
| |||||
Total liabilities and equity | $ | 3,782,647 | $ | 4,930,098 | ||||
|
|
|
| |||||
The accompanying notes are an integral part of the consolidated financial statements.
F-22
Table of Contents
EVRAZ NORTH AMERICA LIMITED and Subsidiaries
(Wholly Owned Subsidiary of EVRAZ plc)
Consolidated Statements of Operations
(In Thousands, Except Per Share Amounts)
| Year Ended December 31 | ||||||||||||
| 2013 | 2012 | 2011 | ||||||||||
Sales: | ||||||||||||
Product sales | $ | 2,584,871 | $ | 2,768,506 | $ | 2,896,563 | ||||||
Freight | 164,060 | 135,953 | 150,574 | |||||||||
|
|
|
|
|
| |||||||
| 2,748,931 | 2,904,459 | 3,047,137 | ||||||||||
|
|
|
|
|
| |||||||
Costs and expenses: | ||||||||||||
Cost of sales | 2,513,018 | 2,505,277 | 2,576,700 | |||||||||
Selling, general, and administrative expenses | 235,508 | 232,336 | 230,221 | |||||||||
Impairment of assets | 468,640 | — | — | |||||||||
Loss (gain) on disposal of assets | 1,583 | 2,253 | (541 | ) | ||||||||
|
|
|
|
|
| |||||||
| 3,218,749 | 2,739,866 | 2,806,380 | ||||||||||
|
|
|
|
|
| |||||||
Operating (loss) income | (469,818 | ) | 164,593 | 240,757 | ||||||||
Other (expense) income: | ||||||||||||
Interest expense | (13,211 | ) | (9,886 | ) | (15,921 | ) | ||||||
Related party interest expense | (57,431 | ) | (52,115 | ) | (80,616 | ) | ||||||
Dividend and interest income | 76 | 171 | 158 | |||||||||
Foreign exchange (losses) gains | (3,955 | ) | 15,738 | (12,326 | ) | |||||||
Loss on extinguishment of debt | — | — | (6,301 | ) | ||||||||
Other income, net | 2,195 | 2,811 | 4,952 | |||||||||
|
|
|
|
|
| |||||||
(Loss) income from continuing operations before income taxes | (542,144 | ) | 121,312 | 130,703 | ||||||||
Income tax benefit | 52,839 | 13,597 | 5,564 | |||||||||
|
|
|
|
|
| |||||||
Net (loss) income from continuing operations | (489,305 | ) | 134,909 | 136,267 | ||||||||
|
|
|
|
|
| |||||||
Discontinued operations: | ||||||||||||
Loss from discontinued operations before income taxes | (391,414 | ) | (123,766 | ) | (1,294 | ) | ||||||
Income tax benefit | 121,203 | 22,688 | 11,073 | |||||||||
|
|
|
|
|
| |||||||
Net (loss) income from discontinued operations | (270,211 | ) | (101,078 | ) | 9,779 | |||||||
|
|
|
|
|
| |||||||
Net (loss) income | (759,516 | ) | 33,831 | 146,046 | ||||||||
Less net loss (income) attributable to noncontrolling interest | 50,206 | (19,183 | ) | (3,619 | ) | |||||||
|
|
|
|
|
| |||||||
Net (loss) income attributable to EVRAZ NORTH AMERICA LIMITED | $ | (709,310 | ) | $ | 14,648 | $ | 142,427 | |||||
|
|
|
|
|
| |||||||
Earnings (loss) per share: | ||||||||||||
Basic and diluted (loss) earnings per share from continuing operations | $ | (438,660 | ) | $ | 115,726 | $ | 132,648 | |||||
Basic and diluted (loss) earnings per share from discontinued operations | (269,941 | ) | (101,078 | ) | 9,779 | |||||||
|
|
|
|
|
| |||||||
Basic and diluted (loss) earnings per share attributable to EVRAZ NORTH AMERICA LIMITED shareholders | $ | (708,601 | ) | $ | 14,648 | $ | 142,427 | |||||
|
|
|
|
|
| |||||||
The accompanying notes are an integral part of the consolidated financial statements.
F-23
Table of Contents
EVRAZ NORTH AMERICA LIMITED and Subsidiaries
(Wholly Owned Subsidiary of EVRAZ plc)
Consolidated Statements of Comprehensive (Loss) Income
(In Thousands)
| Year Ended December 31 | ||||||||||||
| 2013 | 2012 | 2011 | ||||||||||
Net (loss) income | $ | (759,516 | ) | $ | 33,831 | $ | 146,046 | |||||
|
|
|
|
|
| |||||||
Other comprehensive (loss) income, net of tax: | ||||||||||||
Foreign currency translation adjustments | (52,661 | ) | 19,039 | (19,485 | ) | |||||||
Changes in pension and postretirement benefit plans, net of tax of $(15,872), $10,471, and $26,442 at December 31, 2013, 2012 and 2011, respectively | 50,900 | (29,927 | ) | (58,565 | ) | |||||||
|
|
|
|
|
| |||||||
Total other comprehensive loss | (1,761 | ) | (10,888 | ) | (78,050 | ) | ||||||
|
|
|
|
|
| |||||||
Comprehensive (loss) income | (761,277 | ) | 22,943 | 67,996 | ||||||||
Less comprehensive loss (income) attributable to noncontrolling interest | 65,337 | (15,492 | ) | 15,331 | ||||||||
|
|
|
|
|
| |||||||
Comprehensive (loss) income attributable to EVRAZ NORTH AMERICA LIMITED | $ | (695,940 | ) | $ | 7,451 | $ | 83,327 | |||||
|
|
|
|
|
| |||||||
The accompanying notes are an integral part of the consolidated financial statements.
F-24
Table of Contents
EVRAZ NORTH AMERICA LIMITED and Subsidiaries
(Wholly Owned Subsidiary of EVRAZ plc)
Consolidated Statements of Changes in Equity
(In Thousands, Except Share Amounts)
Common Stock | Additional Paid-In Capital | Accumulated Deficit | Accumulated Other Comprehensive Income (Loss) | Total EVRAZ NORTH AMERICA LIMITED Equity | Noncontrolling Interest | Total Equity | ||||||||||||||||||||||||||
| Shares | Amount | |||||||||||||||||||||||||||||||
Balance at January 1, 2011 | 1,000 | $ | 1 | $ | 2,756,362 | $ | (392,893 | ) | $ | 9,184 | $ | 2,372,654 | $ | 426,210 | $ | 2,798,864 | ||||||||||||||||
Net income | — | — | — | 142,427 | — | 142,427 | 3,619 | 146,046 | ||||||||||||||||||||||||
Foreign currency translation adjustments | — | — | — | — | (11,177 | ) | (11,177 | ) | (8,308 | ) | (19,485 | ) | ||||||||||||||||||||
Actuarial changes in pension liability, net of tax | — | — | — | — | (47,923 | ) | (47,923 | ) | (10,642 | ) | (58,565 | ) | ||||||||||||||||||||
Dividend distribution | — | — | — | (151,478 | ) | — | (151,478 | ) | (800 | ) | (152,278 | ) | ||||||||||||||||||||
Contribution from EVRAZ plc for share-based compensation | — | — | 1,949 | — | — | 1,949 | — | 1,949 | ||||||||||||||||||||||||
|
|
|
|
|
|
|
|
|
|
|
|
|
|
|
| |||||||||||||||||
Balance at January 1, 2012 | 1,000 | 1 | 2,758,311 | (401,944 | ) | (49,916 | ) | 2,306,452 | 410,079 | 2,716,531 | ||||||||||||||||||||||
Net income | — | — | — | 14,648 | — | 14,648 | 19,183 | 33,831 | ||||||||||||||||||||||||
Foreign currency translation adjustments | — | — | — | — | 10,937 | 10,937 | 8,102 | 19,039 | ||||||||||||||||||||||||
Actuarial changes in pension liability, net of tax | — | — | — | — | (18,134 | ) | (18,134 | ) | (11,793 | ) | (29,927 | ) | ||||||||||||||||||||
Dividend distribution | — | — | — | (68,237 | ) | — | (68,237 | ) | (1,280 | ) | (69,517 | ) | ||||||||||||||||||||
Contribution from EVRAZ plc forshare-based compensation | 1 | — | 2,078 | — | — | 2,078 | — | 2,078 | ||||||||||||||||||||||||
|
|
|
|
|
|
|
|
|
|
|
|
|
|
|
| |||||||||||||||||
Balance at January 1, 2013 | 1,001 | 1 | 2,760,389 | (455,533 | ) | (57,113 | ) | 2,247,744 | 424,291 | 2,672,035 | ||||||||||||||||||||||
Net loss | — | — | — | (709,310 | ) | — | (709,310 | ) | (50,206 | ) | (759,516 | ) | ||||||||||||||||||||
Foreign currency translation adjustments | — | — | — | — | (30,482 | ) | (30,482 | ) | (22,179 | ) | (52,661 | ) | ||||||||||||||||||||
Actuarial changes in pension liability, net of tax | — | — | — | — | 43,852 | 43,852 | 7,048 | 50,900 | ||||||||||||||||||||||||
Dividend distribution | — | — | — | (172,352 | ) | — | (172,352 | ) | (1,121 | ) | (173,473 | ) | ||||||||||||||||||||
Contribution from Mastercroft Limited | — | — | 270,000 | — | — | 270,000 | — | 270,000 | ||||||||||||||||||||||||
Contribution from EVRAZ plc forshare-based compensation | — | — | 2,975 | — | — | 2,975 | — | 2,975 | ||||||||||||||||||||||||
|
|
|
|
|
|
|
|
|
|
|
|
|
|
|
| |||||||||||||||||
Balance at December 31, 2013 | 1,001 | $ | 1 | $ | 3,033,364 | $ | (1,337,195 | ) | $ | (43,743 | ) | $ | 1,652,427 | $ | 357,833 | $ | 2,010,260 | |||||||||||||||
|
|
|
|
|
|
|
|
|
|
|
|
|
|
|
| |||||||||||||||||
The accompanying notes are an integral part of the consolidated financial statements.
F-25
Table of Contents
EVRAZ NORTH AMERICA LIMITED and Subsidiaries
(Wholly Owned Subsidiary of EVRAZ plc)
Consolidated Statements of Cash Flows
(In Thousands)
| Year Ended December 31 | ||||||||||||
| 2013 | 2012 | 2011 | ||||||||||
Operating activities | ||||||||||||
Net (loss) income | $ | (759,516 | ) | $ | 33,831 | $ | 146,046 | |||||
(Loss) income from discontinued operations | (270,211 | ) | (101,078 | ) | 9,779 | |||||||
|
|
|
|
|
| |||||||
(Loss) income from continuing operations | (489,305 | ) | 134,909 | 136,267 | ||||||||
Adjustments to reconcile net (loss) income from continuing operations to net cash provided by continuing operating activities: | ||||||||||||
Depreciation and amortization | 175,589 | 180,109 | 197,714 | |||||||||
Share-based compensation | 2,975 | 2,078 | 1,949 | |||||||||
Deferred income taxes | (46,009 | ) | (30,724 | ) | 13,958 | |||||||
Loss (gain) on disposal of assets | 1,583 | 2,253 | (541 | ) | ||||||||
Inventory lower of cost or market adjustments | 10,899 | 2,086 | 2,691 | |||||||||
Foreign exchange losses (gains) | 3,955 | (15,738 | ) | 12,326 | ||||||||
Employee benefit plans | (4,066 | ) | (16,549 | ) | (6,374 | ) | ||||||
Impairment of assets | 468,640 | — | — | |||||||||
Loss on extinguishment of debt | — | — | 6,301 | |||||||||
Other, net | (8,619 | ) | (6,084 | ) | (12,338 | ) | ||||||
Changes in current assets and liabilities: | ||||||||||||
Trade accounts receivable | (47,699 | ) | 35,793 | 72,798 | ||||||||
Operating liabilities | 14,651 | 83,547 | 30,530 | |||||||||
Related-party payables | 17,743 | (19,665 | ) | 4,499 | ||||||||
Inventories | 29,320 | (98,146 | ) | 17,981 | ||||||||
Income taxes | (4,625 | ) | 44,681 | (10,285 | ) | |||||||
Other, net | (8,959 | ) | 621 | 12,154 | ||||||||
|
|
|
|
|
| |||||||
Net cash provided by continuing operating activities | 116,073 | 299,171 | 479,630 | |||||||||
Net cash provided by (used in) discontinued operating activities | 5,638 | (40,725 | ) | (12,897 | ) | |||||||
|
|
|
|
|
| |||||||
Net cash provided by operating activities | 121,711 | 258,446 | 466,733 | |||||||||
|
|
|
|
|
| |||||||
Investing activities | ||||||||||||
Purchases of property, plant, and equipment | (84,190 | ) | (67,321 | ) | (59,116 | ) | ||||||
Proceeds from the disposal of property, plant, and equipment | 1,448 | 1,633 | 976 | |||||||||
Dividends received | 813 | — | — | |||||||||
Acquisition of business | — | (11,750 | ) | — | ||||||||
|
|
|
|
|
| |||||||
Net cash used in investing activities by continuing operations | (81,929 | ) | (77,438 | ) | (58,140 | ) | ||||||
Net cash provided by (used in) discontinued investing activities | 3,075 | (19,206 | ) | (21,686 | ) | |||||||
|
|
|
|
|
| |||||||
Net cash used in investing activities | (78,854 | ) | (96,644 | ) | (79,826 | ) | ||||||
|
|
|
|
|
| |||||||
Financing activities | ||||||||||||
Borrowings under Credit Facility | 412,063 | 982,022 | 398,243 | |||||||||
Repayments under Credit Facility | (607,017 | ) | (745,517 | ) | (488,134 | ) | ||||||
Net borrowings under previous credit facility | — | — | 1,095 | |||||||||
Restricted deposits at banks relating to financing | 55 | 16,796 | 1,404 | |||||||||
Payments under capital leases | (6,822 | ) | — | — | ||||||||
Dividend to EGSA | (172,312 | ) | (68,237 | ) | (151,478 | ) | ||||||
Contribution from Mastercroft Limited | 270,000 | — | — | |||||||||
Net repayment of related party debt | — | (177,886 | ) | (251,170 | ) | |||||||
Debt issuance fees | — | — | (7,040 | ) | ||||||||
|
|
|
|
|
| |||||||
Net cash (used in) provided by financing activities by continuing operations | (104,033 | ) | 7,178 | (497,080 | ) | |||||||
Effects of foreign currency exchange rate on cash | (96 | ) | 8,299 | (7,073 | ) | |||||||
|
|
|
|
|
| |||||||
Net (decrease) increase in cash and cash equivalents | (61,272 | ) | 177,279 | (117,246 | ) | |||||||
Cash and cash equivalents at the beginning of year | 254,593 | 77,314 | 194,560 | |||||||||
|
|
|
|
|
| |||||||
Cash and cash equivalents at the end of year | $ | 193,321 | $ | 254,593 | $ | 77,314 | ||||||
|
|
|
|
|
| |||||||
The accompanying notes are an integral part of the consolidated financial statements.
F-26
Table of Contents
EVRAZ NORTH AMERICA LIMITED and Subsidiaries
(Wholly Owned Subsidiary of EVRAZ plc)
Notes to Consolidated Financial Statements
Years Ended December 31, 2013, 2012 and 2011
1. Nature of Operations and Significant Accounting Policies
Nature of Operations
EVRAZ NORTH AMERICA LIMITED (“ENA” or the “Company”), is a company domiciled in England under the Company Law of England and Wales. ENA is a wholly owned subsidiary of Evraz Group S.A. (“EGSA”), which in turn is a wholly owned subsidiary of EVRAZ plc, based in London, UK.
On September 30, 2014, and in contemplation of an initial public offering of the Company, 100% of the outstanding voting shares of EVRAZ Inc., N.A. (“EINA”) and 51% of the outstanding voting shares of EVRAZ Inc., N.A. Canada (“EICA”) were transferred to ENA from EGSA. EGSA retained a 49% ownership interest in EICA which results in the presentation of non-controlling interest associated with the remaining 49% ownership held by EGSA. Prior to the transfer, the Company had no substantive operations of its own. The transfer represents a transfer between entities under common control, and accordingly, the Company recognized EINA and EICA’s net assets at their historical carrying amounts. No cash was exchanged as part of the transfer. The transfer also represents a reorganization of entities under common control and as such, the Company’s consolidated financial statements have been presented as if ENA had owned 100% of the shares of EINA and 51% of the shares of EICA for the periods presented, including the periods prior to the Company’s formation. Upon completion of the effective public offering, EGSA intends to transfer its 49% interest in EICA to the Company in exchange for proceeds from the initial public offering.
The Company, through its controlled operating subsidiaries EINA and EICA, is a diversified steelmaker that manufactures and markets engineered steel products for rail, energy and industrial end markets in the United States and Canada. The Company has six manufacturing locations in the Western U.S. and Canada.
The Company organizes its business into three operating segments: Long Division, Tubular Division and Flat Division.
The Company prepares the consolidated financial statements in accordance with U.S. generally accepted accounting principles (“U.S. GAAP”). The consolidated financial statements include the accounts of ENA and its majority owned subsidiaries. All intercompany balances and transactions have been eliminated. The Company is not the primary beneficiary of any variable interest entities.
For comparative purposes, the consolidated financial statements and related disclosures reflect the results of the Company’s Claymont, Delaware steel mill (“EVRAZ Claymont”) reporting unit and the Surrey, British Columbia mill (“EVRAZ Surrey”) reporting unit as discontinued operations, net of applicable income taxes, for all reporting periods presented. EVRAZ Claymont and EVRAZ Surrey were previously included in the Flat Division segment. See Note 13—Discontinued Operations and Held for Sale Assets and Liabilities for further discussion.
All amounts in the consolidated financial statements and notes are specified in thousands of U.S. dollars, unless specifically stated otherwise.
Use of Estimates
The preparation of consolidated financial statements in conformity with U.S. GAAP requires management to make estimates and assumptions that affect the reported amounts in the consolidated financial statements, and the related disclosures. The Company evaluates its estimates on an ongoing basis, and actual results could differ from those estimates.
F-27
Table of Contents
EVRAZ NORTH AMERICA LIMITED and Subsidiaries
(Wholly Owned Subsidiary of EVRAZ plc)
Notes to Consolidated Financial Statements (continued)
Years Ended December 31, 2013, 2012 and 2011
1. Nature of Operations and Significant Accounting Policies (continued)
Fair Value Measurements
The Company measures fair value using inputs from the three levels of the fair value hierarchy. The hierarchy gives the highest priority to unadjusted quoted prices in active markets for identical assets or liabilities (Level 1 measurements) and the lowest priority to unobservable inputs (Level 3 measurements). The three levels of the fair value hierarchy are described below:
Level 1—Inputs to the valuation methodology are unadjusted quoted prices for identical assets or liabilities in active markets that the Company has the ability to access.
Level 2—Inputs to the valuation methodology include:
| • | Quoted prices for similar assets or liabilities in active markets |
| • | Quoted prices for identical or similar assets or liabilities in inactive markets |
| • | Inputs other than quoted prices that are observable for the asset or liability |
| • | Inputs that are derived principally from, or corroborated by, observable market data by correlation or other means |
If the asset or liability has a specified (contractual) term, the Level 2 input must be observable for substantially the full term of the asset or liability.
Level 3—Inputs to the valuation methodology are unobservable and significant to the fair value measurement.
At December 31, 2013 and 2012, the Company had no financial assets or liabilities measured at fair value on a recurring basis.
The carrying amounts reported in the consolidated balance sheets for restricted cash, accounts receivable, and accounts payable approximate their fair value. The carrying amounts of the Company’s borrowings under its third-party debt agreement approximate fair value. See Note 4—Debt and Related-Party Loans for the terms and carrying values of the Company’s various debt instruments.
Financial instruments that potentially subject the Company to concentrations of credit risk consist principally of cash and cash equivalents, restricted cash, and trade receivables. The Company places its cash and cash equivalents in high credit quality institutions.
The Company records trade accounts receivable at amounts billed to customers, net of an allowance for doubtful accounts. The allowance is determined based on historical collection experience and specific customer collection issues. Receivables are written off when they are considered uncollectible. The Company believes that risk of loss on its trade receivables is reduced by ongoing credit evaluation of its customers’ financial condition and requirements for collateral, such as letters of credit and bank guarantees.
Concentrations
The majority of the Company’s customers are located in North America. The Company had one customer that accounted for approximately 22.2%, 12.3% and 3.9% of total sales in 2013, 2012 and 2011, respectively. Amounts included in trade accounts receivable for this customer were $39.4 million and $18.4 million as of December 31, 2013 and 2012, respectively.
F-28
Table of Contents
EVRAZ NORTH AMERICA LIMITED and Subsidiaries
(Wholly Owned Subsidiary of EVRAZ plc)
Notes to Consolidated Financial Statements (continued)
Years Ended December 31, 2013, 2012 and 2011
1. Nature of Operations and Significant Accounting Policies (continued)
EVRAZ Portland purchases steel slab from a number of predominantly foreign producers. In 2013 and 2012, the Company had two primary suppliers of steel slab, one of which is an affiliate of EVRAZ plc.
Cash and Cash Equivalents and Restricted Cash
Highly liquid investments with original maturities of three months or less at the date of purchase are considered cash equivalents. At December 31, 2012, restricted cash consisted of cash held in an escrow account and cash collateralized letters of credit.
Inventories
Inventories are stated at the lower of average cost or net realizable value. Stores and operating supplies inventory, which includes spare parts, are expensed to cost of sales as the parts are utilized and consumed. Management periodically evaluates the need to record impairment charges to cost of sales for all inventories, including raw materials, semi-finished products, finished goods, and stores and operating supplies inventory. Obsolete or excess inventory is written down to its estimated net realizable value, if less than its average cost. Factors considered in the Company’s estimates of impairment and market value include management’s estimates related to future manufacturing schedules, customer demand, possible alternative uses, and ultimate realization of excess inventory.
Property, Plant, and Equipment, net
Property, plant, and equipment are stated at cost less accumulated depreciation. Depreciation expense is recognized using the straight-line method over the estimated useful lives of the assets, taking into account the estimated salvage value, if any. The estimated remaining useful lives of most of the Company’s operating machinery and equipment are generally from 8 to 28 years. The estimated remaining useful lives of the Company’s buildings and improvements are from 4 to 40 years. Expenditures for major additions and improvements are capitalized when they extend the useful life of the related asset. Routine maintenance and repairs are expensed as incurred. When assets are retired or sold, the related cost and accumulated depreciation are removed from the accounts, and the resulting gains or losses are recognized in operating results.
When events or circumstances indicate the carrying value of a long-lived asset held for use may be impaired, the Company assesses whether or not the asset is recoverable. When it is determined that impairment exists, the related assets are written down to estimated fair value.
Goodwill and Other Intangible Assets
Goodwill represents the excess of cost over fair value of acquired identifiable tangible and other intangible assets and liabilities assumed from businesses acquired. Goodwill and indefinite-lived intangibles, which include water rights and a natural gas pipeline supply agreement, are tested annually for impairment and on an interim basis whenever events or circumstances change that would make it more likely than not that an impairment may have occurred. The Company performs its annual impairment analysis of goodwill and indefinite-lived intangible assets other than goodwill as of December 1 each year. The evaluation of goodwill impairment involves comparing the current fair value of each reporting unit to the carrying value of the reporting unit (step one). If the fair value of the reporting unit exceeds the carrying value, then no impairment is recorded. If, however, the fair value of the reporting unit is less than the carrying value, then the Company performs the second step of the goodwill impairment test to measure the amount of the impairment loss, if any. At December 31, 2013, the Company had 11 reporting units.
F-29
Table of Contents
EVRAZ NORTH AMERICA LIMITED and Subsidiaries
(Wholly Owned Subsidiary of EVRAZ plc)
Notes to Consolidated Financial Statements (continued)
Years Ended December 31, 2013, 2012 and 2011
1. Nature of Operations and Significant Accounting Policies (continued)
The Company estimates the fair value of its reporting units using Level 3 inputs under the income and a market approach. The income approach calculates the present value of expected future cash flows, including the terminal value, utilizing a market-based weighted average cost of capital determined separately for each reporting unit. The market approach is based on financial multiples of EBITDA (earnings before interest, taxes, depreciation and amortization) of comparable companies and applies a control premium. The determination of fair value involves the use of significant estimates and assumptions, including revenue growth rates driven by future price and volume expectations, operating margins, capital needs, working capital requirements, tax rates, terminal growth rates, and appropriate discount rates.
The Company tests indefinite-lived intangible assets for impairment by comparing the carrying value of the indefinite-lived intangible asset to its fair value; whereby, fair value is determined using the projected discounted cash flows expected to be derived from the indefinite-lived intangible asset. If the carrying value exceeds estimated fair value, the carrying value is written down to its fair value.
Environmental Liabilities
All material environmental remediation liabilities, which are probable and estimable, are recorded in the consolidated financial statements based on current technologies and current environmental standards at the time of evaluation. Monetary costs related to these liabilities are discounted when the related cash payments are fixed and reliably determinable. Adjustments are made when additional information is available that suggests different remediation methods may be required and affect the total cost. The best estimate of the probable cost within a range is recorded; however, if there is no best estimate, the low end of the range is recorded and the range is disclosed.
Income Taxes
The Company is subject to taxes in the United Kingdom. Its subsidiaries are subject to taxes in the United States and Canada, and their earnings are taxed at the applicable income tax rate in each of those countries. The Company’s reorganization, as contemplated, will not have any material impact on the Company’s income tax provision. The Company provides for income taxes utilizing the asset and liability method of accounting for income taxes. Under this method, deferred income taxes are recorded to reflect the tax consequences in future years of differences between the tax basis of assets and liabilities and their financial reporting amounts at each balance sheet date, based on enacted tax laws and statutory tax rates applicable to the periods in which the differences are expected to affect taxable income. If it is determined that it is more likely than not that future tax benefits associated with a deferred tax asset will not be realized, a valuation allowance is provided. In the future, if the Company determines it is able to realize its deferred tax assets previously subject to a valuation allowance, an adjustment to the valuation allowance would be recorded in the period so determined. Likewise, should the Company determine that it would not be able to realize all or part of its net deferred tax asset in the future, an adjustment to the valuation allowance would be charged to income in the period such determination was made. The effect on deferred tax assets and liabilities of a change in the tax legislation is recognized in the period that the tax legislation is enacted.
The Company utilizes a two-step approach to recognize and measure uncertain tax positions. The first step is to evaluate the tax position for recognition by determining if the weight of available evidence indicates it is more likely than not that the position will be sustained on audit, including resolution of related appeals or litigation processes. The second step is to measure the tax benefit as the largest amount which is more than 50%
F-30
Table of Contents
EVRAZ NORTH AMERICA LIMITED and Subsidiaries
(Wholly Owned Subsidiary of EVRAZ plc)
Notes to Consolidated Financial Statements (continued)
Years Ended December 31, 2013, 2012 and 2011
1. Nature of Operations and Significant Accounting Policies (continued)
likely of being realized upon ultimate settlement. The Company considers many factors when evaluating and estimating its tax positions and tax benefits, which may require periodic adjustments and which may not accurately forecast actual outcomes. The Company includes interest and penalties related to uncertain tax positions within “Income tax benefit (expense)” on the consolidated statements of operations.
Foreign Currency
The Company’s reporting currency is U.S. dollars. The functional currency of EVRAZ NORTH AMERICA LIMITED and its United States subsidiaries is the U.S. dollar. The functional currency of its Canadian subsidiaries is the Canadian dollar. Assets and liabilities subject to foreign currency fluctuations are translated into U.S. dollars at the period-end exchange rate, and revenues and expenses are translated at average rates for the period. Foreign currency translation adjustments are included as a component of accumulated other comprehensive income (loss) and reported in the accompanying consolidated statements of comprehensive (loss) income. Gains or losses resulting from foreign currency transactions are recognized in the consolidated statements of operations as incurred.
Employee Benefit Plans
The Company has four different types of employee benefit plans which are as follows: defined contribution plans, noncontributory single-employer defined benefit pension plans, supplemental executive retirement plans, and postretirement health care and life insurance plans that cover its eligible employees.
For the defined contribution plans, the Company provides contributions primarily based upon the employees’ compensation levels and employee contributions.
For all the other plans, the Company recognizes the funded status in its consolidated financial statements. The measurement date of plan assets and obligations is December 31 for all plans. The Company also recognizes as a component of accumulated other comprehensive income (loss) the actuarial (gains) or losses and prior service costs or credits that arise during the period but are not recognized as components of net periodic benefit costs.
Research and Development Costs
Costs for research and development activities are expensed as incurred. Research and development costs were $7.1 million, $7.7 million and $5.8 million for the years ended December, 31, 2013, 2012 and 2011, respectively. Research and development expenses are presented as part of selling, general and administrative expenses in the accompanying consolidated statements of operations.
Revenue Recognition
The Company recognizes revenues when title passes, the earnings process is substantially complete, price is fixed or determinable, and the Company is reasonably assured of the collection of the proceeds from the exchange, all of which generally occur either upon shipment of the Company’s products or delivery of the product at the destination specified by the customer.
F-31
Table of Contents
EVRAZ NORTH AMERICA LIMITED and Subsidiaries
(Wholly Owned Subsidiary of EVRAZ plc)
Notes to Consolidated Financial Statements (continued)
Years Ended December 31, 2013, 2012 and 2011
1. Nature of Operations and Significant Accounting Policies (continued)
Shipping and Handling Costs
Shipping costs which relate to revenues are recorded as cost of sales. Internal handling costs incurred to store, move, or prepare goods for shipment to customers are classified as selling, general, and administrative expenses. For the years ended December 31, 2013, 2012 and 2011, internal handling costs were $50.4 million, $45.7 million, and $42.4 million, respectively.
Recent Accounting Pronouncements
The following accounting pronouncements were issued in 2013 and 2014 which the Company has not yet adopted.
In July 2013, an accounting standard update was issued which requires the netting of unrecognized tax benefits (UTBs) against a deferred tax asset for a loss or other carryforward that would apply in settlement of the uncertain tax positions. UTBs are required to be netted against all available same-jurisdiction losses or other tax carryforwards that would be utilized, rather than only against carryforwards that are created by the UTBs. The revised standard becomes effective and will be adopted by the Company for the year ending December 31, 2014. The adoption of this standard will not have a material impact on the Company’s consolidated financial position, results of operations or cash flows.
In May 2014, an accounting standard update was issued which provides a comprehensive new revenue recognition model that requires a company to recognize revenue to depict the transfer of goods or services to a customer at an amount that reflects the consideration it expects to receive in exchange for those goods or services. The guidance also requires additional disclosure about the nature, amount, timing and uncertainty of revenue and cash flows arising from customer contracts. This update is effective for annual and interim periods beginning after December 15, 2016. Early application is not permitted. This update permits the use of either the retrospective or cumulative effect transition method. The revised standard becomes effective and will be adopted by the Company for the year ending December 31, 2017. The Company is currently analyzing the potential impact of adoption of this standard on the Company’s consolidated financial position, results of operations or cash flows.
In April 2014, an accounting standard update was issued which modifies the requirements for reporting discontinued operations. Under the standard update, the definition of discontinued operations has been modified to only include those disposals of an entity that represent a strategic shift that has (or will have) a major effect on an entity’s operations and financial results. This update also expands the disclosure requirements for disposals that meet the definition of discontinued operations and requires entities to disclose information about disposals of individually significant components that do not meet the definition of discontinued operations. This update is effective for annual and interim periods beginning after December 15, 2014. Early application is permitted. The revised standard will be adopted by the Company on January 1, 2015. The adoption of this standard is not expected to have a material impact on the Company’s consolidated financial position, results of operations or cash flows.
In June 2014, an accounting standard update was issued which modifies the accounting for stock-based compensation. The new standard requires a performance target that affects vesting and that could be achieved after the requisite service period to be treated as a performance condition. The current accounting standard for stock-based compensation as it applies to awards with performance conditions should continue to be applied. The
F-32
Table of Contents
EVRAZ NORTH AMERICA LIMITED and Subsidiaries
(Wholly Owned Subsidiary of EVRAZ plc)
Notes to Consolidated Financial Statements (continued)
Years Ended December 31, 2013, 2012 and 2011
1. Nature of Operations and Significant Accounting Policies (continued)
guidance is effective for annual and interim periods beginning after December 15, 2015. The revised standard will be adopted by the Company on January 1, 2016. The adoption of this standard is not expected to have a material impact on the Company’s consolidated financial position, results of operations or cash flows.
2. Inventories
The components of inventories were as follows:
| December 31 | ||||||||
| 2013 | 2012 | |||||||
Raw materials | $ | 74,922 | $ | 71,383 | ||||
Semi-finished products | 144,136 | 198,385 | ||||||
Finished products | 152,258 | 150,689 | ||||||
Stores and operating supplies | 130,908 | 141,680 | ||||||
|
|
|
| |||||
Total inventories | $ | 502,224 | $ | 562,137 | ||||
|
|
|
| |||||
Semi-finished product includes purchased and Company-manufactured slabs, billets, steel plate, and coiled plate that will be converted into finished products by the Company.
3. Property, Plant, and Equipment, net
Property, plant, and equipment, net balances were as follows:
| December 31 | ||||||||
| 2013 | 2012 | |||||||
Land and improvements | $ | 159,971 | $ | 158,671 | ||||
Buildings | 306,652 | 311,315 | ||||||
Machinery and equipment | 1,522,245 | 1,488,755 | ||||||
Construction in progress | 68,620 | 80,171 | ||||||
|
|
|
| |||||
| 2,057,488 | 2,038,912 | |||||||
Accumulated depreciation | (833,281 | ) | (737,358 | ) | ||||
|
|
|
| |||||
Property, plant, and equipment, net | $ | 1,224,207 | $ | 1,301,554 | ||||
|
|
|
| |||||
Total depreciation expense for 2013, 2012 and 2011 was approximately $122.2 million, $120.3 million, and $126.1 million, respectively.
Repair and maintenance expense for 2013, 2012 and 2011 was $106.2 million, $117.9 million and $133.0 million, respectively.
F-33
Table of Contents
EVRAZ NORTH AMERICA LIMITED and Subsidiaries
(Wholly Owned Subsidiary of EVRAZ plc)
Notes to Consolidated Financial Statements (continued)
Years Ended December 31, 2013, 2012 and 2011
4. Debt and Related-Party Loans
Debt and related-party loans consist of the following at December 31, 2013 and 2012:
| December 31 | ||||||||
| 2013 | 2012 | |||||||
Related-party loans | $ | 774,381 | $ | 827,854 | ||||
|
|
|
| |||||
2011 ABL | $ | 99,984 | $ | 297,548 | ||||
Capital lease obligations | — | 6,821 | ||||||
|
|
|
| |||||
Total debt | 99,984 | 304,369 | ||||||
Less current portion | — | (1,358 | ) | |||||
|
|
|
| |||||
Long-term debt | $ | 99,984 | $ | 303,011 | ||||
|
|
|
| |||||
ABL Credit Facility
In December 2011, EINA and EICA entered into a five-year asset-based credit facility (“2011 ABL”) with a maturity as of December 2016, arranged by GE Capital and a syndicate of other lenders. The 2011 ABL credit facility provides for borrowings in U.S. dollars or Canadian dollars and is secured by the Company’s accounts receivable and inventory balances. Of the total $610.0 million available, the maximum borrowing limit equals the Company’s consolidated eligible accounts receivable and inventory balances, less reserves and plus an availability block of the greater of 10% of the aggregate borrowing base, or $50.0 million.
Borrowings outstanding under the 2011 ABL credit facility bear interest based on either (1) the Canadian index rate or the banker’s acceptance rate plus an applicable margin for loans made in Canadian dollars or (2) the LIBOR or the U.S. Prime rate plus an applicable margin for loans made in US dollars. The 2011 ABL credit facility contains various customary covenants which impact the Company’s ability to enter into transactions with EVRAZ plc and its direct and indirect subsidiaries and affiliated entities (other than transactions with other credit parties). These restrictions include prohibitions on paying dividends and making distributions to equity holders of the Company, and, subject to certain customary exceptions, prohibitions on making investments, disposing of assets, incurring and paying indebtedness or otherwise entering into transactions with affiliates.
EVRAZ NORTH AMERICA LIMITED is the parent company of its consolidated subsidiaries and is a holding company with no operations of its own. As a result, the Company is dependent on its subsidiaries for cash to fund its operations and expenses. As discussed above, the ABL credit facility contains provisions that generally restrict payment of dividends from EICA and EINA to the Company. As of December 31, 2013, the amount of net assets of EICA and EINA that were restricted from transfer to EVRAZ NORTH AMERICA LIMITED totaled $357.3 million. The following condensed financial information have been prepared on a parent-only basis. The Company’s investment in its subsidiaries and share of earnings/losses of such subsidiaries have been presented using the equity method of accounting.
F-34
Table of Contents
EVRAZ NORTH AMERICA LIMITED and Subsidiaries
(Wholly Owned Subsidiary of EVRAZ plc)
Notes to Consolidated Financial Statements (continued)
Years Ended December 31, 2013, 2012 and 2011
4. Debt and Related-Party Loans (continued)
Condensed Balance Sheets | December 31, 2013 | December 31, 2012 | ||||||
Assets | ||||||||
Cash and cash equivalents | $ | 35,353 | $ | 70,533 | ||||
Investment in subsidiaries | 1,617,643 | 2,178,949 | ||||||
|
|
|
| |||||
Total assets | $ | 1,652,996 | $ | 2,249,482 | ||||
|
|
|
| |||||
Liabilities and equity | ||||||||
Current liabilities: | ||||||||
Income taxes payable | $ | 569 | $ | 1,728 | ||||
Accrued expenses | — | 10 | ||||||
|
|
|
| |||||
Total liabilities | 569 | 1,738 | ||||||
|
|
|
| |||||
Equity: | ||||||||
Common stock | 1 | 1 | ||||||
Additional paid-in capital | 3,033,364 | 2,760,389 | ||||||
Accumulated other comprehensive income | (43,743 | ) | (57,113 | ) | ||||
Accumulated deficit | (1,337,195 | ) | (455,533 | ) | ||||
|
|
|
| |||||
Total equity | 1,652,427 | 2,247,744 | ||||||
|
|
|
| |||||
Total liabilities and equity | $ | 1,652,996 | $ | 2,249,482 | ||||
|
|
|
| |||||
Condensed Statements of Income | Year Ended December 31 | |||||||||||
| 2013 | 2012 | 2011 | ||||||||||
Equity in (loss) income of subsidiaries | $ | (709,180 | ) | $ | 16,386 | $ | 142,427 | |||||
|
|
|
|
|
| |||||||
Selling, general, and administrative expenses | (90 | ) | (5 | ) | — | |||||||
Foreign exchange losses, net | (40 | ) | — | — | ||||||||
|
|
|
|
|
| |||||||
(Loss) income before income taxes | (709,310 | ) | 16,381 | 142,427 | ||||||||
Income tax expense | — | (1,733 | ) | — | ||||||||
|
|
|
|
|
| �� | ||||||
Net (loss) income | (709,310 | ) | 14,648 | 142,427 | ||||||||
Other comprehensive income (loss) | 13,370 | (7,197 | ) | (59,100 | ) | |||||||
Total comprehensive (loss) income for the period | $ | (695,940 | ) | $ | 7,451 | $ | 83,327 | |||||
|
|
|
|
|
| |||||||
F-35
Table of Contents
EVRAZ NORTH AMERICA LIMITED and Subsidiaries
(Wholly Owned Subsidiary of EVRAZ plc)
Notes to Consolidated Financial Statements (continued)
Years Ended December 31, 2013, 2012 and 2011
4. Debt and Related-Party Loans (continued)
Condensed Statements of Cash Flows | Year Ended December 31 | |||||||||||
| 2013 | 2012 | 2011 | ||||||||||
Net cash flows used in operating activities | $ | (1,248 | ) | $ | 0 | $ | 0 | |||||
|
|
|
|
|
| |||||||
Cash flows from investing activities | ||||||||||||
Dividends received | 138,420 | 138,770 | 151,478 | |||||||||
|
|
|
|
|
| |||||||
Net cash flows from investing activities | 138,420 | 138,770 | 151,478 | |||||||||
|
|
|
|
|
| |||||||
Cash flows from financing activities | ||||||||||||
Distribution to shareholder | (58,500 | ) | — | — | ||||||||
Dividends paid | (113,852 | ) | (68,237 | ) | (151,478 | ) | ||||||
|
|
|
|
|
| |||||||
Net cash flows used in financing activities | (172,352 | ) | (68,327 | ) | (151,478 | ) | ||||||
|
|
|
|
|
| |||||||
Net (decrease) increase in cash and cash equivalents | (35,180 | ) | 70,533 | — | ||||||||
Cash and cash equivalents at the beginning of year | 70,533 | — | — | |||||||||
|
|
|
|
|
| |||||||
Cash and cash equivalents at the end of year | $ | 35,353 | $ | 70,533 | $ | — | ||||||
|
|
|
|
|
| |||||||
The 2011 ABL credit facility allows for letters of credit up to $120 million. At December 31, 2013, $10.8 million was restricted under outstanding letters of credit. After outstanding borrowings and letters of credit, $261.2 million was available for borrowing under the 2011 ABL credit facility at December 31, 2013.
Debt issuance fees of $7.1 million were incurred in connection with the 2011 ABL credit facility, $2.9 million of which were amortized as of December 31, 2013.
Related-Party Loans
The Company has two notes outstanding with related parties as of December 31, 2013 and 2012. The notes bear interest at fixed interest rates with interest due quarterly. The notes are payable in U.S. dollars. One related-party note with an outstanding principal balance of $254.0 million bears interest at 7.25% per annum and is due in December 2018. The second related-party note with an outstanding principal balance of $520.4 million bears interest at 7.15% per annum and is due in December 2017. The Company’s related-party loans are subordinated to 2011 ABL.
As of December 31, 2013, principal payments on debt are due as follows:
| Related-Party | Credit Facility | Total | ||||||||||
2016 | $ | — | $ | 99,984 | $ | 99,984 | ||||||
2017 | 520,354 | — | 520,354 | |||||||||
2018 | 254,027 | — | 254,027 | |||||||||
|
|
|
|
|
| |||||||
| $ | 774,381 | $ | 99,984 | $ | 874,365 | |||||||
|
|
|
|
|
| |||||||
Total interest paid was $67.0 million, $62.1 million and $95.1 million in 2013, 2012 and 2011, respectively.
F-36
Table of Contents
EVRAZ NORTH AMERICA LIMITED and Subsidiaries
(Wholly Owned Subsidiary of EVRAZ plc)
Notes to Consolidated Financial Statements (continued)
Years Ended December 31, 2013, 2012 and 2011
5. Goodwill and Other Intangible Assets
The Company performs its annual goodwill impairment test at the reporting unit level as of December 1st each year.
Based on the results of that evaluation, the Company recognized goodwill impairment losses of $336.1 million, $32.8 million, $77.5 million and $22.2 million for the EVRAZ Portland, EVRAZ Portland Tubular, EVRAZ Pueblo Seamless and EVRAZ Calgary reporting units, respectively. These impairment losses are included in impairment of assets in the consolidated statements of operations.
The impairments of goodwill for the operating reporting units occurred due to changes in expectations of long-term price and cost forecasts that reflect current and anticipated market conditions related to each mill’s product mix.
The changes in the carrying amount of goodwill by segment for the years ended December 31, 2013, 2012 and 2011 were as follows:
| Long Division | Tubular Division | Flat Division | Total | |||||||||||||
Balance as of January 1, 2011 | $ | 386,197 | $ | 807,723 | $ | 402,069 | $ | 1,595,989 | ||||||||
Translation adjustment | — | (15,520 | ) | — | (15,520 | ) | ||||||||||
|
|
|
|
|
|
|
| |||||||||
Balance as of December 31, 2011 | 386,197 | 792,203 | 402,069 | 1,580,469 | ||||||||||||
Acquisition | 510 | — | — | 510 | ||||||||||||
Translation adjustment | — | 15,308 | — | 15,308 | ||||||||||||
|
|
|
|
|
|
|
| |||||||||
Balance as of December 31, 2012 | 386,707 | 807,511 | 402,069 | 1,596,287 | ||||||||||||
Impairment loss | (77,461 | ) | (55,034 | ) | (336,145 | ) | (468,640 | ) | ||||||||
Translation adjustment | — | (45,508 | ) | — | (45,508 | ) | ||||||||||
|
|
|
|
|
|
|
| |||||||||
Balance as of December 31, 2013 | $ | 309,246 | $ | 706,969 | $ | 65,924 | $ | 1,082,139 | ||||||||
|
|
|
|
|
|
|
| |||||||||
The carrying amount of total goodwill and total accumulated impairment losses follows:
| Gross Amount | Accumulated Impairment Losses | Accumulated Translation Differences | Net Carrying Amount | |||||||||||||
Balance as of January 1, 2012 | $ | 1,873,098 | $ | (288,041 | ) | $ | (4,588 | ) | $ | 1,580,469 | ||||||
Acquisition | 510 | — | — | 510 | ||||||||||||
Translation difference | — | — | 15,308 | 15,308 | ||||||||||||
|
|
|
|
|
|
|
| |||||||||
Balance as of December 31, 2012 | 1,873,608 | (288,041 | ) | 10,720 | 1,596,287 | |||||||||||
Impairment loss | — | (468,640 | ) | — | (468,640 | ) | ||||||||||
Translation difference | — | — | (45,508 | ) | (45,508 | ) | ||||||||||
|
|
|
|
|
|
|
| |||||||||
Balance as of December 31, 2013 | $ | 1,873,608 | $ | (756,681 | ) | $ | (34,788 | ) | $ | 1,082,139 | ||||||
|
|
|
|
|
|
|
| |||||||||
F-37
Table of Contents
EVRAZ NORTH AMERICA LIMITED and Subsidiaries
(Wholly Owned Subsidiary of EVRAZ plc)
Notes to Consolidated Financial Statements (continued)
Years Ended December 31, 2013, 2012 and 2011
5. Goodwill and Other Intangible Assets (continued)
Amortizable intangible assets with definite lives are amortized on a straight-line basis over their estimated useful lives. The carrying amount of intangible assets follows:
| 2013 | 2012 | |||||||||||||||||||||||
| Gross Amount | Accumulated Amortization | Net Carrying Amount | Gross Amount | Accumulated Amortization | Net Carrying Amount | |||||||||||||||||||
Customer relationships | $ | 772,724 | $ | (388,403 | ) | $ | 384,321 | $ | 808,744 | $ | (347,792 | ) | $ | 460,952 | ||||||||||
Supplier relationships | 480 | (66 | ) | 414 | 480 | (13 | ) | 467 | ||||||||||||||||
Trade names | 21,187 | (21,187 | ) | — | 21,187 | (21,187 | ) | — | ||||||||||||||||
Natural gas supply agreement | 12,800 | — | 12,800 | 12,800 | — | 12,800 | ||||||||||||||||||
Water rights | 43,689 | — | 43,689 | 43,689 | — | 43,689 | ||||||||||||||||||
Internal use software | 15,567 | (11,948 | ) | 3,619 | 15,433 | (11,188 | ) | 4,245 | ||||||||||||||||
|
|
|
|
|
|
|
|
|
|
|
| |||||||||||||
| $ | 866,447 | $ | (421,604 | ) | $ | 444,843 | $ | 902,333 | $ | (380,180 | ) | $ | 522,153 | |||||||||||
|
|
|
|
|
|
|
|
|
|
|
| |||||||||||||
Customer relationships intangible asset is being amortized over 19 years based on their economic usage and estimated attrition rates and had a remaining weighted average useful life of 11.6 years at December 31, 2013. Supplier relationships intangible asset is being amortized on a straight-line basis over 10 years and had a remaining useful life of 9.1 years at December 31, 2013. Trade names intangible asset was amortized on a straight-line basis and became fully amortized at December 31, 2012. The natural gas pipeline supply agreement and water rights are assets with indefinite lives and are not amortized. Internal-use software is being amortized on a straight-line basis over the estimated remaining useful life of 3 to 7 years and had a remaining weighted average useful life of 4.1 years at December 31, 2013. The weighted average remaining useful life of all intangible assets is 10.0 years at December 31, 2013. The Company recorded amortization expense of $53.4 million, $59.8 million and $71.6 million for 2013, 2012 and 2011, respectively.
The estimated intangible asset amortization expense for the next five years subsequent to December 31, 2013, is as follows:
2014 | $ | 47,657 | ||
2015 | 43,610 | |||
2016 | 39,877 | |||
2017 | 36,789 | |||
2018 | 33,648 |
The Company completes its annual impairment tests of its indefinite-lived intangible assets as of December 1 and tests definite-lived intangible assets for impairment when events or circumstances indicate the carrying value of a definite-lived intangible asset held for use may be impaired. There was no impairment of indefinite-lived intangible assets in 2013, 2012 or 2011.
F-38
Table of Contents
EVRAZ NORTH AMERICA LIMITED and Subsidiaries
(Wholly Owned Subsidiary of EVRAZ plc)
Notes to Consolidated Financial Statements (continued)
Years Ended December 31, 2013, 2012 and 2011
5. Goodwill and Other Intangible Assets (continued)
The following table represents activity in total for other intangibles:
| Indefinite- Lived Intangibles | Definite- Lived Intangibles | Total Intangibles | ||||||||||
Net balance as of January 1, 2012 | $ | 56,489 | $ | 513,879 | $ | 570,368 | ||||||
Acquisition | — | 480 | 480 | |||||||||
Amortization expense | — | (59,791 | ) | (59,791 | ) | |||||||
Additions | — | 1,864 | 1,864 | |||||||||
Translation adjustment | — | 9,232 | 9,232 | |||||||||
|
|
|
|
|
| |||||||
Net balance as of December 31, 2012 | 56,489 | 465,664 | 522,153 | |||||||||
Amortization expense | — | (53,382 | ) | (53,382 | ) | |||||||
Additions | — | 465 | 465 | |||||||||
Translation adjustment | — | (24,393 | ) | (24,393 | ) | |||||||
|
|
|
|
|
| |||||||
Net balance as of December 31, 2013 | $ | 56,489 | $ | 388,354 | $ | 444,843 | ||||||
|
|
|
|
|
| |||||||
6. Income Taxes
Income (loss) from continuing operations before income taxes includes the following components:
| Year Ended December 31 | ||||||||||||
| 2013 | 2012 | 2011 | ||||||||||
Domestic (U.K.) | $ | — | $ | — | $ | — | ||||||
U.S. | (422,537 | ) | 90,373 | 137,378 | ||||||||
Canada | (119,607 | ) | 30,939 | (6,675 | ) | |||||||
|
|
|
|
|
| |||||||
(Loss) income from continuing operations before income taxes | $ | (542,144 | ) | $ | 121,312 | $ | 130,703 | |||||
|
|
|
|
|
| |||||||
F-39
Table of Contents
EVRAZ NORTH AMERICA LIMITED and Subsidiaries
(Wholly Owned Subsidiary of EVRAZ plc)
Notes to Consolidated Financial Statements (continued)
Years Ended December 31, 2013, 2012 and 2011
6. Income Taxes (continued)
The income tax benefit (expense) from continuing operations consists of the following:
| Year Ended December 31 | ||||||||||||
| 2013 | 2012 | 2011 | ||||||||||
Current: | ||||||||||||
Domestic (U.K.) | $ | 8 | $ | (1,733 | ) | $ | — | |||||
U.S. Federal | 4,941 | (17,856 | ) | 21,351 | ||||||||
U.S. State and Local | 203 | (2,450 | ) | (593 | ) | |||||||
Canada | 1,678 | 4,912 | (1,236 | ) | ||||||||
|
|
|
|
|
| |||||||
| 6,830 | (17,127 | ) | 19,522 | |||||||||
Deferred: | ||||||||||||
Domestic (U.K.) | — | — | — | |||||||||
U.S. Federal | 14,515 | 31,083 | (12,103 | ) | ||||||||
U.S. State and Local | 3,221 | 3,108 | 354 | |||||||||
Canada | 28,273 | (3,467 | ) | (2,209 | ) | |||||||
|
|
|
|
|
| |||||||
| 46,009 | 30,724 | (13,958 | ) | |||||||||
|
|
|
|
|
| |||||||
Income tax benefit | $ | 52,839 | $ | 13,597 | $ | 5,564 | ||||||
|
|
|
|
|
| |||||||
A reconciliation of the domestic (U.K.) statutory tax rate to the Company’s effective tax rate follows:
| December 31 | ||||||||||||
| 2013 | 2012 | 2011 | ||||||||||
Domestic (U.K.) statutory income tax rate | 23.3 | % | 24.5 | % | 26.5 | % | ||||||
Effect of foreign rate | 8.6 | 12.9 | 16.8 | |||||||||
Nontaxable income | 8.9 | (40.1 | ) | (41.5 | ) | |||||||
Valuation allowance | (2.3 | ) | (2.8 | ) | (3.3 | ) | ||||||
Permanent differences | — | (1.7 | ) | 1.7 | ||||||||
Goodwill impairment | (29.8 | ) | — | — | ||||||||
Uncertain tax positions | 1.0 | (2.6 | ) | (2.1 | ) | |||||||
Tax credits | 0.7 | — | (1.9 | ) | ||||||||
Foreign exchange | — | (2.0 | ) | — | ||||||||
Other | (0.7 | ) | 0.6 | (0.5 | ) | |||||||
|
|
|
|
|
| |||||||
| 9.7 | % | (11.2 | )% | (4.3 | )% | |||||||
|
|
|
|
|
| |||||||
The main rate of U.K. Corporation Tax beginning April 1, 2013, 2012, 2011 and 2010 is 23%, 24%, 26% and 28%, respectively. Calendar year taxpayers are required to apportion the main rates on a time basis (by reference to days). This time basis apportionment results in tax rates of 23.25%, 24.5%, and 26.5% for tax years ended December 31, 2013, 2012, and 2011, respectively.
F-40
Table of Contents
EVRAZ NORTH AMERICA LIMITED and Subsidiaries
(Wholly Owned Subsidiary of EVRAZ plc)
Notes to Consolidated Financial Statements (continued)
Years Ended December 31, 2013, 2012 and 2011
6. Income Taxes (continued)
The current and noncurrent components of the net deferred tax assets and liabilities are as follows:
| December 31 | ||||||||
| 2013 | 2012 | |||||||
Net current deferred tax assets: | ||||||||
Deferred tax assets: | ||||||||
Inventories | $ | 8,841 | $ | (7,400 | ) | |||
Accrued expenses | 4,590 | 6,926 | ||||||
Other | 7,413 | 486 | ||||||
Valuation Allowance | (2,794 | ) | — | |||||
|
|
|
| |||||
Net current deferred tax assets | $ | 18,050 | $ | 12 | ||||
|
|
|
| |||||
Net noncurrent deferred tax liabilities: | ||||||||
Deferred tax assets: | ||||||||
Postretirement benefits other than pensions | $ | 13,881 | $ | 13,065 | ||||
Tax credits | 1,812 | 419 | ||||||
Environmental liability | 12,215 | 12,253 | ||||||
Non-capital loss carryforward | 4,380 | — | ||||||
Net operating loss carryforward | 26,305 | 14,976 | ||||||
Interest prepayment | 893 | — | ||||||
Accrued liabilities | 219 | — | ||||||
Pension liabilities | 30,436 | 70,142 | ||||||
Limitation on interest deduction from related party loans | 58,436 | 15,779 | ||||||
Other | 4,044 | 3,351 | ||||||
|
|
|
| |||||
| 152,621 | 129,985 | |||||||
Valuation allowance | (21,442 | ) | — | |||||
|
|
|
| |||||
| 131,179 | 129,985 | |||||||
Deferred tax liabilities: | ||||||||
Property, plant, and equipment | 275,169 | 360,248 | ||||||
Partnership alternate year-end | 5,082 | 6,422 | ||||||
Intangibles | 114,901 | 149,854 | ||||||
Other | 1,970 | 13,775 | ||||||
|
|
|
| |||||
| 397,122 | 530,299 | |||||||
|
|
|
| |||||
Net noncurrent deferred income tax liabilities | $ | 265,943 | $ | 400,314 | ||||
|
|
|
| |||||
The Company’s net operating loss carryforwards of $637.4 million and $401.2 million at December 31, 2013 and 2012, respectively, represent U.S. state net operating loss carryforwards that, if unused, will expire in 2023 through 2033. At December 31, 2013, the Company recorded a valuation allowance of $24.2 million against certain state net operating loss carryforwards, income tax credits and other deferred tax assets that it believes will more likely than not expire before being utilized. The net operating losses are related to state tax losses generated by its EVRAZ Claymont facility.
No provision has been made for income taxes on undistributed earnings of foreign subsidiaries at December 31, 2013 as such amounts are considered permanently reinvested. It is not practicable to estimate the additional income taxes, net of applicable tax credits, that would be due upon repatriation of these earnings.
F-41
Table of Contents
EVRAZ NORTH AMERICA LIMITED and Subsidiaries
(Wholly Owned Subsidiary of EVRAZ plc)
Notes to Consolidated Financial Statements (continued)
Years Ended December 31, 2013, 2012 and 2011
6. Income Taxes (continued)
A reconciliation of the beginning and ending amount of unrecognized tax benefits, excluding interest and penalties, for 2013, 2012 and 2011 were as follows:
| 2013 | 2012 | 2011 | ||||||||||
Balance at January 1 | $ | 15,181 | $ | 25,476 | $ | 28,366 | ||||||
Additions for tax positions related to prior years | 1,075 | — | — | |||||||||
Reductions for tax positions related to prior years | — | (2,530 | ) | (3,413 | ) | |||||||
Additions based on tax positions related to current year | 1,106 | — | 523 | |||||||||
Reductions related to lapse in the statute of limitations | (6,587 | ) | — | — | ||||||||
Reductions related to audit settlements | — | (7,765 | ) | — | ||||||||
|
|
|
|
|
| |||||||
Balance at December 31 | $ | 10,775 | $ | 15,181 | $ | 25,476 | ||||||
|
|
|
|
|
| |||||||
Of the $10.8 million at December 31, 2013, $10.2 million represents the amount of unrecognized tax benefits that, if recognized, would affect the effective tax rate in future periods.
The Company accounts for interest and penalties related to income tax matters in income tax expense. The Company has accrued interest expense of $1.3 million and no penalties related to unrecognized tax benefits, and $2.5 million and no penalties as of December 31, 2013 and 2012, respectively. The $1.2 million reduction to accrued interest from 2012 to 2013 was the result of a lapse in the statute of limitations.
The Company received net income tax refunds of $10.8 million in 2013. The Company paid income taxes of $15.8 million and $11.3 million in 2012 and 2011, respectively.
The Company’s U.S. subsidiary is subject to U.S. federal and state income tax. The U.S. federal income tax returns are subject to audit for years 2008-2010. As of December 31, 2013, the Internal Revenue Service (IRS) has proposed certain adjustments to research credit claims for the 2008 year. In May 2014, the IRS audit was settled and the 2008 tax assessment was paid.
The Company’s Canadian subsidiaries are subject to Canadian federal and provincial income tax. The Canadian federal returns are subject to audit for the years 2009 through 2012. In 2013, the Canada Revenue Agency initiated an audit examination of the Canadian federal returns for the years 2010 and 2011.
The Company is not currently under audit examination in either the U.K. or in any U.S. states.
Management believes it has made adequate provision for all income tax uncertainties and there are no jurisdictions in which the outcome of unresolved issues or claims is likely to be material to the Company’s consolidated financial position, results of operations, or cash flows.
It is reasonably possible that the total amount of unrecognized tax benefits will decrease by about $5.5 million within the next twelve months after December 31, 2013 as a result of a Canadian audit settlement.
7. Employee Benefit Plans
EINA and EICA maintain qualified defined benefit pension plans for some of the employees in both the U.S. and Canada. These plans generally provide benefits of stated amounts based on years of service or provide benefits based on the participant’s hourly wage rate and years of service. For these plans, the Company uses a
F-42
Table of Contents
EVRAZ NORTH AMERICA LIMITED and Subsidiaries
(Wholly Owned Subsidiary of EVRAZ plc)
Notes to Consolidated Financial Statements (continued)
Years Ended December 31, 2013, 2012 and 2011
7. Employee Benefit Plans (continued)
measurement date for plan assets and obligations of December 31. In addition, the Company has 401(k) and other defined contribution plans available for eligible U.S. and Canadian-based employees which the Company matches a percentage of the participants’ contributions. The Company also has U.S. and Canadian supplemental retirement plans (SERP’s) which are unqualified plans designed to maintain benefits for eligible employees at the plan formula level. The Company provides other unfunded postretirement medical and life insurance plans for certain of its eligible employees upon retirement after completion of a specified number of years of service.
On September 1, 2005 the Company closed certain of its defined benefit pension plans to new entrants. Employees that were hired after this date are enrolled in defined contribution plans and receive a contribution funded by the Company equal to 3% of annual wages. Eligible employees that were hired prior to this date participate in defined benefit pension plans, postretirement health care or receive reimbursements to postretirement healthcare, and participate in life insurance benefit plans. These defined contribution plans are funded annually, and participants’ benefits vest after three years of service. Eligible employees that were hired prior to this date participate in defined benefit pension plans. On January 1, 2011, the Company closed certain of its Canada pension plans to new entrants. Those employees are enrolled in a defined contribution plan and receive a contribution funded by the Company equal to 7% of annual wages, including bonuses. The defined contribution plan is funded annually.
As of December 13, 2013, the Company recognized a curtailment for a reduction in force for the EVRAZ Claymont pension plan. The curtailment eliminated 92.4% of the total future working lifetime of the plan. The Company recorded a gain of $1.7 million related to the curtailment due to the reduction in force.
Summary Disclosures for All Defined Benefit Plans
The following is a summary of the Company’s defined benefit obligations included in liabilities:
| 2013 | 2012 | |||||||
U.S. plans | $ | 55,006 | $ | 104,105 | ||||
Canadian plans | 36,146 | 66,391 | ||||||
OPEB | 42,293 | 46,335 | ||||||
SERP | 7,452 | 9,885 | ||||||
Other | 26 | 9 | ||||||
|
|
|
| |||||
Total noncurrent deferred employee benefits | 140,923 | 226,725 | ||||||
Add current portion (included in accrued compensation and related benefits) | 3,318 | 2,757 | ||||||
|
|
|
| |||||
Total deferred employee benefits | $ | 144,241 | $ | 229,482 | ||||
|
|
|
| |||||
F-43
Table of Contents
EVRAZ NORTH AMERICA LIMITED and Subsidiaries
(Wholly Owned Subsidiary of EVRAZ plc)
Notes to Consolidated Financial Statements (continued)
Years Ended December 31, 2013, 2012 and 2011
7. Employee Benefit Plans (continued)
The expected future benefit payments for all the benefit plans are as follows:
| U.S. Plans | Canadian Plans | Total | ||||||||||
2014 | $ | 15,280 | $ | 18,060 | $ | 33,339 | ||||||
2015 | 16,157 | 18,718 | 34,875 | |||||||||
2016 | 17,016 | 19,401 | 36,417 | |||||||||
2017 | 17,692 | 20,536 | 38,229 | |||||||||
2018 | 18,055 | 20,992 | 39,047 | |||||||||
2019-2023 | 99,709 | 115,393 | 215,102 | |||||||||
|
|
|
|
|
| |||||||
| $ | 183,909 | $ | 213,100 | $ | 397,009 | |||||||
|
|
|
|
|
| |||||||
The expected contributions to be made in 2014 are $16.4 million for the U.S. plans and $21.9 million for the Canadian plans.
The amounts in accumulated other comprehensive income that are expected to be recognized as components of net periodic benefit cost during 2014 are as follows:
| SERP’s | Defined Benefit Plans | OPEB’s | ||||||||||
Actuarial loss | $ | — | $ | 7,543 | $ | 103 | ||||||
Prior service cost | — | 138 | — | |||||||||
|
|
|
|
|
| |||||||
Total | $ | — | $ | 7,681 | $ | 103 | ||||||
|
|
|
|
|
| |||||||
Defined Benefit Pension Plans
The following is a summary of the obligations and funding of the defined benefit pension plans:
| Defined Benefit Plans | Defined Benefit Plans | |||||||||||||||
| 2013 | 2012 | |||||||||||||||
| U.S. Plans | Canadian Plans | U.S. Plans | Canadian Plans | |||||||||||||
Change in Benefit Obligation: | ||||||||||||||||
Benefit obligation at beginning of year | $ | 296,480 | $ | 389,784 | $ | 266,586 | $ | 336,854 | ||||||||
Service cost | 8,971 | 12,029 | 7,702 | 10,270 | ||||||||||||
Interest cost | 10,959 | 16,451 | 11,013 | 17,691 | ||||||||||||
Benefits paid | (10,681 | ) | (25,281 | ) | (9,485 | ) | (29,265 | ) | ||||||||
Actuarial (gain) loss | (35,779 | ) | (1,391 | ) | 20,664 | 43,124 | ||||||||||
Plan amendments | — | — | — | 537 | ||||||||||||
Curtailment | (1,699 | ) | — | — | — | |||||||||||
Foreign currency adjustment | — | (24,868 | ) | — | 10,573 | |||||||||||
|
|
|
|
|
|
|
| |||||||||
Benefit obligation at end of year | $ | 268,251 | $ | 366,724 | $ | 296,480 | $ | 389,784 | ||||||||
|
|
|
|
|
|
|
| |||||||||
F-44
Table of Contents
EVRAZ NORTH AMERICA LIMITED and Subsidiaries
(Wholly Owned Subsidiary of EVRAZ plc)
Notes to Consolidated Financial Statements (continued)
Years Ended December 31, 2013, 2012 and 2011
7. Employee Benefit Plans (continued)
| Defined Benefit Plans | Defined Benefit Plans | |||||||||||||||
| 2013 | 2012 | |||||||||||||||
| U.S. Plans | Canadian Plans | U.S. Plans | Canadian Plans | |||||||||||||
Change in Plan Assets: | ||||||||||||||||
Fair value of plan assets at beginning of year | $ | 192,375 | $ | 323,393 | $ | 160,284 | $ | 290,895 | ||||||||
Actual return on plan assets | 21,751 | 29,942 | 23,496 | 22,255 | ||||||||||||
Benefits paid | (10,681 | ) | (25,281 | ) | (9,485 | ) | (29,265 | ) | ||||||||
Contributions | 9,800 | 23,946 | 18,080 | 30,824 | ||||||||||||
Foreign currency adjustment | — | (21,422 | ) | — | 8,684 | |||||||||||
|
|
|
|
|
|
|
| |||||||||
Fair value of plan assets at end of year | $ | 213,245 | $ | 330,578 | $ | 192,375 | $ | 323,393 | ||||||||
|
|
|
|
|
|
|
| |||||||||
Unfunded status at the end of the year | $ | (55,006 | ) | $ | (36,146 | ) | $ | (104,105 | ) | $ | (66,391 | ) | ||||
|
|
|
|
|
|
|
| |||||||||
Items not yet recognized as a component of net periodic pension expense:
| Defined Benefit Plans | Defined Benefit Plans | |||||||||||||||
| 2013 | 2012 | |||||||||||||||
| U.S. Plans | Canadian Plans | U.S. Plans | Canadian Plans | |||||||||||||
Unrecognized net actuarial losses | $ | 48,484 | $ | 95,807 | $ | 102,213 | $ | 121,076 | ||||||||
As of December 31, 2013 and 2012, the following amounts were recognized in the balance sheets:
| Defined Benefit Plans | Defined Benefit Plans | |||||||||||||||
| 2013 | 2012 | |||||||||||||||
| U.S. Plans | Canadian Plans | U.S. Plans | Canadian Plans | |||||||||||||
Noncurrent liabilities | $ | 55,006 | $ | 36,146 | $ | 104,105 | $ | 66,391 | ||||||||
Accumulated other comprehensive loss | (48,484 | ) | (95,807 | ) | (102,213 | ) | (121,076 | ) | ||||||||
The components of net periodic defined benefit pension cost were as follows:
| Defined Benefit Plans | Defined Benefit Plans | Defined Benefit Plans | ||||||||||||||||||||||
| 2013 | 2012 | 2011 | ||||||||||||||||||||||
| U.S. Plans | Canadian Plans | U.S. Plans | Canadian Plans | U.S. Plans | Canadian Plans | |||||||||||||||||||
Service cost | $ | 8,971 | $ | 12,029 | $ | 7,702 | $ | 10,270 | $ | 6,062 | $ | 8,309 | ||||||||||||
Interest cost | 10,959 | 16,451 | 11,013 | 17,691 | 11,507 | 17,634 | ||||||||||||||||||
Expected return on plan assets | (12,887 | ) | (20,545 | ) | (11,454 | ) | (19,523 | ) | (11,742 | ) | (18,841 | ) | ||||||||||||
Curtailment / settlement expense | 60 | — | — | — | — | — | ||||||||||||||||||
Prior service (credit) cost | 7 | 288 | 7 | 246 | 7 | 9 | ||||||||||||||||||
Amortization of net loss | 7,388 | 6,939 | 7,437 | 4,302 | 3,054 | 1,823 | ||||||||||||||||||
|
|
|
|
|
|
|
|
|
|
|
| |||||||||||||
Totals | $ | 14,498 | $ | 15,162 | $ | 14,705 | $ | 12,986 | $ | 8,888 | $ | 8,934 | ||||||||||||
|
|
|
|
|
|
|
|
|
|
|
| |||||||||||||
The expected long-term rate of return on defined benefit pension plan assets represents the weighted-average asset return for each forecasted asset class return over several market cycles.
F-45
Table of Contents
EVRAZ NORTH AMERICA LIMITED and Subsidiaries
(Wholly Owned Subsidiary of EVRAZ plc)
Notes to Consolidated Financial Statements (continued)
Years Ended December 31, 2013, 2012 and 2011
7. Employee Benefit Plans (continued)
Assumptions used to calculate the net periodic defined benefit pension costs and obligations are detailed below:
| Defined Benefit Plans | Defined Benefit Plans | Defined Benefit Plans | ||||||||||||||||||||||
| 2013 | 2012 | 2011 | ||||||||||||||||||||||
| Weighted average assumptions to determine net cost | U.S. Plans | Canadian Plans | U.S. Plans | Canadian Plans | U.S. Plans | Canadian Plans | ||||||||||||||||||
Discount rate | 3.8 | % | 4.4 | % | 4.2 | % | 5.2 | % | 5.3 | % | 5.6 | % | ||||||||||||
Rate of increase in future compensation levels | 3.0 | % | 3.3 | % | 3.0 | % | 3.5 | % | 3.0 | % | 3.0 | % | ||||||||||||
Expected long-term rate of return on plan assets | 6.7 | % | 6.8 | % | 6.9 | % | 6.5 | % | 7.2 | % | 6.5 | % | ||||||||||||
| Defined Benefit Plans | Defined Benefit Plans | |||||||||||||||
| 2013 | 2012 | |||||||||||||||
| Weighted average assumptions to determine benefit obligations | U.S. Plans | Canadian Plans | U.S. Plans | Canadian Plans | ||||||||||||
Discount rate | 4.7 | % | 4.9 | % | 3.8 | % | 4.4 | % | ||||||||
Rate of increase in future compensation levels | 3.0 | % | 3.3 | % | 3.0 | % | 3.5 | % | ||||||||
Plan Assets and Investment Policy
The investment objective of the defined benefit pension plans is to construct and manage a portfolio of assets that is adequate to support the liability associated with the plan’s obligation. This liability has a long-term duration and its characteristics are determined primarily by the plan’s benefit formula, inflation, participant demographics, and actuarial assumptions and factors. The long-term objective for the investment strategy is to generate investment returns that, in combination with funding contributions from EINA and EICA, provide adequate assets to meet all current and future obligations of the plan and reduce the plan’s funded status volatility as the funded status improves.
Over the long term, asset-liability management strategy will be the key determinant of the returns generated by the pension assets and the associated volatility of returns and funded status. In particular, the level of “return seeking” portfolios (i.e., generally, equities and other instruments with a similar risk profile) and the structure of the “liabilitydiversification” portfolio (i.e., generally, fixed income and other instruments with a similar risk profile) are the key elements of the asset-liability strategy for the Plans.
The Company has established targeted asset allocations for the portfolios. These targets do not represent strict requirements but are intended as general guidelines. The plans do not invest in securities of the Company.
F-46
Table of Contents
EVRAZ NORTH AMERICA LIMITED and Subsidiaries
(Wholly Owned Subsidiary of EVRAZ plc)
Notes to Consolidated Financial Statements (continued)
Years Ended December 31, 2013, 2012 and 2011
7. Employee Benefit Plans (continued)
The U.S. and Canadian plan assets are invested as follows as of December 31 (defined benefit pension plans’ measurement date):
| Target | 2013 | 2012 | ||||||||||
Information about U.S. plan assets: | ||||||||||||
Cash and short-term notes | 2.0 | % | 0.2 | % | 0.2 | % | ||||||
U.S. equity funds | 23.5 | % | 26.8 | % | 18.1 | % | ||||||
International equity funds | 23.5 | % | 26.0 | % | 48.6 | % | ||||||
Fixed-income securities | 39.3 | % | 38.4 | % | 0.0 | % | ||||||
Real estate funds | 0.0 | % | 6.4 | % | 6.3 | % | ||||||
Absolute return strategy funds | 11.7 | % | 2.2 | % | 3.9 | % | ||||||
Real return strategy funds | 0.0 | % | 0.0 | % | 22.9 | % | ||||||
|
|
|
|
|
| |||||||
Total plan assets | 100.0 | % | 100.0 | % | 100.0 | % | ||||||
|
|
|
|
|
| |||||||
| Target | 2013 | 2012 | ||||||||||
Information about Canadian plan assets: | ||||||||||||
Cash and short-term notes | 0.5 | % | 3.0 | % | 1.4 | % | ||||||
Canadian and foreign equity funds | 47.5 | % | 49.0 | % | 50.3 | % | ||||||
Fixed-income securities | 42.5 | % | 40.0 | % | 39.4 | % | ||||||
Hedge funds | 5.0 | % | 8.0 | % | 8.9 | % | ||||||
Infrastructure return strategy funds | 4.5 | % | 0.0 | % | 0.0 | % | ||||||
|
|
|
|
|
| |||||||
Total plan assets | 100.0 | % | 100.0 | % | 100.0 | % | ||||||
|
|
|
|
|
| |||||||
As indicated in the above tables, a significant portion of the defined benefit pension plans’ assets are invested in a variety of investment funds. The plan’s return requirements and risk tolerance will change over time as the plan’s funded status improves.
The fair value of the U.S. plans’ assets as of December 31, 2013 and 2012, by asset category follows:
| Total | Level 1 | Level 2 | Level 3 | |||||||||||||
2013 | ||||||||||||||||
Cash and cash equivalents(1) | $ | 1,369 | $ | 1,369 | $ | — | $ | — | ||||||||
Shares in registered investment companies(2) | 41,129 | 41,129 | — | — | ||||||||||||
Common collective trusts(3) | 152,765 | — | 152,765 | — | ||||||||||||
Real estate investment trusts(4) | 13,358 | — | — | 13,358 | ||||||||||||
Hedge funds(5) | 4,624 | — | — | 4,624 | ||||||||||||
|
|
|
|
|
|
|
| |||||||||
Total investments | $ | 213,245 | $ | 42,498 | $ | 152,765 | $ | 17,982 | ||||||||
|
|
|
|
|
|
|
| |||||||||
2012 | ||||||||||||||||
Money market fund(1) | $ | 279 | $ | 279 | $ | — | $ | — | ||||||||
Shares in registered investment companies(2) | 121,012 | 121,012 | — | — | ||||||||||||
Common collective trusts(3) | 21,217 | — | 21,217 | — | ||||||||||||
Real estate investment trusts(4) | 12,201 | — | — | 12,201 | ||||||||||||
Foreign investment funds(5) | 30,253 | — | — | 30,253 | ||||||||||||
Hedge funds(5) | 7,413 | — | — | 7,413 | ||||||||||||
|
|
|
|
|
|
|
| |||||||||
Total investments | $ | 192,375 | $ | 121,291 | $ | 21,217 | $ | 49,867 | ||||||||
|
|
|
|
|
|
|
| |||||||||
F-47
Table of Contents
EVRAZ NORTH AMERICA LIMITED and Subsidiaries
(Wholly Owned Subsidiary of EVRAZ plc)
Notes to Consolidated Financial Statements (continued)
Years Ended December 31, 2013, 2012 and 2011
7. Employee Benefit Plans (continued)
The fair value of the Canadian plans’ assets as of December 31, 2013 and 2012, by asset category follows:
| Total | Level 1 | Level 2 | Level 3 | |||||||||||||
2013 | ||||||||||||||||
Cash and cash equivalents(1) | $ | 8,498 | $ | 8,498 | $ | — | $ | — | ||||||||
Common collective trusts(3) | 322,080 | 179,904 | 130,843 | 11,333 | ||||||||||||
|
|
|
|
|
|
|
| |||||||||
Total investments | $ | 330,578 | $ | 188,402 | $ | 130,843 | $ | 11,333 | ||||||||
|
|
|
|
|
|
|
| |||||||||
2012 | ||||||||||||||||
Cash and cash equivalent(1) | $ | 20,541 | $ | 20,541 | $ | — | $ | — | ||||||||
Shares in registered investment companies(2) | 75,027 | 31,263 | 43,764 | — | ||||||||||||
Common collective trusts(3) | 227,825 | 145,139 | 82,686 | — | ||||||||||||
|
|
|
|
|
|
|
| |||||||||
Total investments | $ | 323,393 | $ | 196,943 | $ | 126,450 | $ | — | ||||||||
|
|
|
|
|
|
|
| |||||||||
The asset’s or liability’s fair value measurement level within the fair value hierarchy is based on the lowest level of any input that is significant to the fair value measurement. Valuation techniques used need to maximize the use of observable inputs and minimize the use of unobservable inputs.
| (1) | Cash, cash equivalents, and money market funds are valued at cost, which approximates fair value, and are considered Level 1 investments. |
| (2) | Shares in registered investment companies are valued at fair value based on quoted market prices and are considered Level 1 and Level 2 investments. |
| (3) | The Plan’s ownership in the common collective trust funds is carried at fair value based on the fair value of the underlying investments, which are considered Level 1, Level 2, and Level 3 investments. |
| (4) | The real estate investment trust invests in a managed real estate portfolio consisting of apartment, industrial, retail, and office properties and is carried at fair value as estimated by management of the Real Estate Investment Trust (REIT), based on appraisals of the underlying properties, and is considered a Level 3 investment. |
| (5) | The foreign investment funds and hedge funds are carried at fair value based on the fair value of the underlying private investment funds, which may include all types of securities, including commodities and derivative financial instruments, some of which have unobservable inputs, and accordingly, this investment is considered a Level 3 investment. |
The methods described above may produce a fair value calculation that may not be indicative of net realizable value or reflective of future fair values. Furthermore, while the Company believes its valuation methods are appropriate and consistent with other market participants, the use of different methodologies or assumptions to determine the fair value of certain financial instruments could result in a different fair value measurement at the reporting date.
F-48
Table of Contents
EVRAZ NORTH AMERICA LIMITED and Subsidiaries
(Wholly Owned Subsidiary of EVRAZ plc)
Notes to Consolidated Financial Statements (continued)
Years Ended December 31, 2013, 2012 and 2011
7. Employee Benefit Plans (continued)
The table below sets forth a summary of changes in the fair value of the plans’ Level 3 assets:
| Real Estate Investment Trust | Foreign Investments | Hedge Funds | Common Collective Trust | Total | ||||||||||||||||
Balance at January 1, 2012 | $ | 11,988 | $ | 29,188 | $ | 6,906 | $ | — | $ | 48,082 | ||||||||||
Total gains | 881 | 1,065 | 507 | — | 2,453 | |||||||||||||||
Purchases, sales, and settlements, net | (668 | ) | — | — | — | (668 | ) | |||||||||||||
|
|
|
|
|
|
|
|
|
| |||||||||||
Balance at December 31, 2012 | 12,201 | 30,253 | 7,413 | — | 49,867 | |||||||||||||||
Total gains included in earnings | 1,811 | 1,373 | 631 | 1,011 | 4,826 | |||||||||||||||
Purchases, sales, and settlements, net | (654 | ) | (31,626 | ) | (3,420 | ) | 10,322 | (25,378 | ) | |||||||||||
|
|
|
|
|
|
|
|
|
| |||||||||||
Balance at December 31, 2013 | $ | 13,358 | $ | — | $ | 4,624 | $ | 11,333 | $ | 29,315 | ||||||||||
|
|
|
|
|
|
|
|
|
| |||||||||||
Defined Contribution Plans
The Company has 401(k) and other defined contribution plans available for eligible U.S.-based employees which the Company matches a percentage of the participants’ contributions. The Company’s matching contribution expense in the U.S. was $7.8 million, $5.0 million and $4.0 million, in 2013, 2012 and 2011, respectively.
The Company has defined contribution plans available for eligible Canadian-based employees which the Company matches a percentage of the participants’ contributions. The Company’s matching contribution expense in Canada was $0.7 million, $0.5 million and $0.1 million, in 2013, 2012 and 2011, respectively.
Supplemental Executive Retirement Plans (SERP’s)
The Company has U.S. and Canadian supplemental executive retirement plans (SERP’s) which are unqualified pension plans designed to maintain benefits for eligible employees at the plan formula level. The following is a summary of the obligations and funding of the SERP’s:
| SERP’s | SERP’s | |||||||||||||||
| 2013 | 2012 | |||||||||||||||
| U.S. Plans | Canadian Plans | U.S. Plans | Canadian Plans | |||||||||||||
Change in Benefit Obligation: | ||||||||||||||||
Benefit obligation at beginning of year | $ | 6,741 | $ | 6,720 | $ | 6,930 | $ | 6,437 | ||||||||
Service cost | 668 | 23 | 645 | 45 | ||||||||||||
Interest cost | 243 | 277 | 289 | 326 | ||||||||||||
Benefits paid | (1,081 | ) | (383 | ) | (613 | ) | (392 | ) | ||||||||
Actuarial (gain) loss | (2,227 | ) | (65 | ) | (510 | ) | 161 | |||||||||
Foreign currency adjustment | — | (430 | ) | — | 143 | |||||||||||
|
|
|
|
|
|
|
| |||||||||
Benefit obligation at end of year | $ | 4,344 | $ | 6,142 | $ | 6,741 | $ | 6,720 | ||||||||
|
|
|
|
|
|
|
| |||||||||
F-49
Table of Contents
EVRAZ NORTH AMERICA LIMITED and Subsidiaries
(Wholly Owned Subsidiary of EVRAZ plc)
Notes to Consolidated Financial Statements (continued)
Years Ended December 31, 2013, 2012 and 2011
7. Employee Benefit Plans (continued)
| SERP’s | SERP’s | |||||||||||||||
| 2013 | 2012 | |||||||||||||||
| U.S. Plans | Canadian Plans | U.S. Plans | Canadian Plans | |||||||||||||
Change in Plan Assets: | ||||||||||||||||
Fair value of plan assets at beginning of year | $ | — | $ | 3,245 | $ | — | $ | 3,334 | ||||||||
Actual return on plan assets | — | (361 | ) | — | 117 | |||||||||||
Benefits paid | (1,081 | ) | (383 | ) | (613 | ) | (392 | ) | ||||||||
Contributions | 1,081 | 109 | 613 | 112 | ||||||||||||
Foreign currency adjustment | — | (191 | ) | — | 74 | |||||||||||
|
|
|
|
|
|
|
| |||||||||
Fair value of plan assets at end of year | $ | — | $ | 2,419 | $ | — | $ | 3,245 | ||||||||
|
|
|
|
|
|
|
| |||||||||
Unfunded status at the end of the year | $ | (4,344 | ) | $ | (3,723 | ) | $ | (6,741 | ) | $ | (3,475 | ) | ||||
|
|
|
|
|
|
|
| |||||||||
Items not yet recognized as a component of net periodic pension expense:
| SERP’s | SERP’s | |||||||||||||||
| 2013 | 2012 | |||||||||||||||
| U.S. Plans | Canadian Plans | U.S. Plans | Canadian Plans | |||||||||||||
Unrecognized net actuarial losses | $ | 225 | $ | 451 | $ | 2,798 | $ | 152 | ||||||||
As of December 31, 2013 and 2012, the following amounts were recognized in the balance sheet:
| SERP’s | SERP’s | |||||||||||||||
| 2013 | 2012 | |||||||||||||||
| U.S. Plans | Canadian Plans | U.S. Plans | Canadian Plans | |||||||||||||
Current liabilities | $ | 536 | $ | 79 | $ | 245 | $ | 86 | ||||||||
Noncurrent liabilities | 3,808 | 3,644 | 6,496 | 3,389 | ||||||||||||
Accumulated other comprehensive loss | (225 | ) | (451 | ) | (2,798 | ) | (152 | ) | ||||||||
The components of net periodic benefit cost related to the SERP’s were as follows:
| SERP’s | SERP’s | SERP’s | ||||||||||||||||||||||
| 2013 | 2012 | 2011 | ||||||||||||||||||||||
| U.S. Plans | Canadian Plans | U.S. Plans | Canadian Plans | U.S. Plans | Canadian Plans | |||||||||||||||||||
Service cost | $ | 668 | $ | 23 | $ | 645 | $ | 45 | $ | 506 | $ | 80 | ||||||||||||
Interest cost | 243 | 277 | 289 | 326 | 237 | 340 | ||||||||||||||||||
Expected return on plan assets | — | — | — | — | — | (33 | ) | |||||||||||||||||
Prior service (credit) cost | — | (26 | ) | — | (28 | ) | — | — | ||||||||||||||||
Amortization of net loss | 346 | 3 | 385 | — | 128 | — | ||||||||||||||||||
|
|
|
|
|
|
|
|
|
|
|
| |||||||||||||
Totals | $ | 1,257 | $ | 277 | $ | 1,319 | $ | 343 | $ | 871 | $ | 387 | ||||||||||||
|
|
|
|
|
|
|
|
|
|
|
| |||||||||||||
F-50
Table of Contents
EVRAZ NORTH AMERICA LIMITED and Subsidiaries
(Wholly Owned Subsidiary of EVRAZ plc)
Notes to Consolidated Financial Statements (continued)
Years Ended December 31, 2013, 2012 and 2011
7. Employee Benefit Plans (continued)
Assumptions used to calculate the net periodic benefit costs and benefit obligations are detailed below:
| SERP’s | SERP’s | SERP’s | ||||||||||||||||||||||
| 2013 | 2012 | 2011 | ||||||||||||||||||||||
| Weighted average assumptions to determine net cost | U.S. Plans | Canadian Plans | U.S. Plans | Canadian Plans | U.S. Plans | Canadian Plans | ||||||||||||||||||
Discount rate | 3.7 | % | 4.4 | % | 4.2 | % | 5.2 | % | 5.3 | % | 5.3 | % | ||||||||||||
Rate of increase in future compensation levels | 3.0 | % | 3.3 | % | 3.0 | % | 3.5 | % | 3.0 | % | 3.0 | % | ||||||||||||
Expected long-term rate of return on plan assets | N/A | 0.9 | % | N/A | 0.9 | % | N/A | 0.9 | % | |||||||||||||||
| SERP’s | SERP’s | |||||||||||||||
| 2013 | 2012 | |||||||||||||||
| Weighted average assumptions to determine benefit obligations | U.S. Plans | Canadian Plans | U.S. Plans | �� | Canadian Plans | |||||||||||
Discount rate | 4.2 | % | 4.9 | % | 3.7 | % | 4.4 | % | ||||||||
Rate of increase in future compensation levels | 3.0 | % | 3.3 | % | 3.0 | % | 3.5 | % | ||||||||
Expected long-term rate of return on plan assets | N/A | 0.9 | % | N/A | 0.9 | % | ||||||||||
Postretirement Medical and Life Insurance Plans (OPEB’s)
Nearly all medical benefits obligated under the Company’s U.S. postretirement medical plans are determined on a premium-reimbursement basis. The monthly reimbursements are capped at differing amounts based on the age of the retiree. The Company’s total obligation and annual expense associated with its U.S. plans are substantially unchanged by variations in health care cost trend rates. The assumed health care cost trend rates used in measuring the accumulated postretirement benefit obligation for the Company’s U.S. plans were 8.0% for 2013 and 2012. The assumed health care cost trend rates used in measuring the accumulated postretirement benefit obligation for the Company’s Canadian plans were 4.5% for 2013 and 2012. The assumed prescription drug rates used in measuring the accumulated postretirement benefit obligation for the Company’s Canadian plans were 10.0% for 2013 and 2012, which are assumed to decrease by approximately 0.4% per year until 4.5% in 2024.
The following is a summary of the obligations and funding of the various Postretirement Plans (OPEB’s):
| OPEB’s | OPEB’s | |||||||||||||||
| 2013 | 2012 | |||||||||||||||
| U.S. Plans | Canadian Plans | U.S. Plans | Canadian Plans | |||||||||||||
Change in Benefit Obligation: | ||||||||||||||||
Benefit obligation at beginning of year | $ | 36,069 | $ | 12,694 | $ | 34,587 | $ | 10,110 | ||||||||
Service cost | 589 | 287 | 538 | 227 | ||||||||||||
Interest cost | 1,227 | 548 | 1,344 | 549 | ||||||||||||
Benefits paid | (1,671 | ) | (304 | ) | (1,708 | ) | (288 | ) | ||||||||
Actuarial (gain) loss | (1,374 | ) | (2,360 | ) | 1,308 | 1,919 | ||||||||||
Foreign currency adjustment | — | (708 | ) | — | 177 | |||||||||||
|
|
|
|
|
|
|
| |||||||||
Benefit obligation at end of year | $ | 34,840 | $ | 10,157 | $ | 36,069 | $ | 12,694 | ||||||||
|
|
|
|
|
|
|
| |||||||||
F-51
Table of Contents
EVRAZ NORTH AMERICA LIMITED and Subsidiaries
(Wholly Owned Subsidiary of EVRAZ plc)
Notes to Consolidated Financial Statements (continued)
Years Ended December 31, 2013, 2012 and 2011
7. Employee Benefit Plans (continued)
| OPEB’s | OPEB’s | |||||||||||||||
| 2013 | 2012 | |||||||||||||||
| U.S. Plans | Canadian Plans | U.S. Plans | Canadian Plans | |||||||||||||
Change in Plan Assets: | ||||||||||||||||
Fair value of plan assets at beginning of year | $ | — | $ | — | $ | — | $ | — | ||||||||
Benefits paid | (1,671 | ) | (304 | ) | (1,708 | ) | (288 | ) | ||||||||
Contributions | 1,671 | 304 | 1,708 | 288 | ||||||||||||
|
|
|
|
|
|
|
| |||||||||
Fair value of plan assets at end of year | $ | — | $ | — | $ | — | $ | — | ||||||||
|
|
|
|
|
|
|
| |||||||||
Unfunded status at the end of the year | $ | (34,840 | ) | $ | (10,157 | ) | $ | (36,069 | ) | $ | (12,694 | ) | ||||
|
|
|
|
|
|
|
| |||||||||
Items not yet recognized as a component of net periodic pension expense:
| OPEB’s | OPEB’s | |||||||||||||||
| 2013 | 2012 | |||||||||||||||
| U.S. Plans | Canadian Plans | U.S. Plans | Canadian Plans | |||||||||||||
Unrecognized net actuarial gains (losses) | $ | 1,187 | $ | (2,669 | ) | $ | 2,663 | $ | (560 | ) | ||||||
As of December 31, 2013 and 2012, the following amounts were recognized in the balance sheet:
| OPEB’s | OPEB’s | |||||||||||||||
| 2013 | 2012 | |||||||||||||||
| U.S. Plans | Canadian Plans | U.S. Plans | Canadian Plans | |||||||||||||
Current liabilities | $ | 2,375 | $ | 329 | $ | 2,185 | $ | 243 | ||||||||
Noncurrent liabilities | 32,465 | 9,828 | 33,884 | 12,451 | ||||||||||||
Accumulated other comprehensive gain (loss) | (1,187 | ) | 2,669 | (2,663 | ) | 560 | ||||||||||
The components of net periodic benefit cost related to the OPEB’s were as follows:
| OPEB’s | OPEB’s | OPEB’s | ||||||||||||||||||||||
| 2013 | 2012 | 2011 | ||||||||||||||||||||||
| U.S. Plans | Canadian Plans | U.S. Plans | Canadian Plans | U.S. Plans | Canadian Plans | |||||||||||||||||||
Service cost | $ | 589 | $ | 287 | $ | 538 | $ | 227 | $ | 425 | $ | 200 | ||||||||||||
Interest cost | 1,227 | 548 | 1,344 | 549 | 1,521 | 535 | ||||||||||||||||||
Prior service (credit) cost | — | (146 | ) | — | (149 | ) | — | (150 | ) | |||||||||||||||
Amortization of net loss | 101 | — | 96 | (50 | ) | (21 | ) | (116 | ) | |||||||||||||||
|
|
|
|
|
|
|
|
|
|
|
| |||||||||||||
Totals | $ | 1,917 | $ | 689 | $ | 1,978 | $ | 577 | $ | 1,925 | $ | 469 | ||||||||||||
|
|
|
|
|
|
|
|
|
|
|
| |||||||||||||
F-52
Table of Contents
EVRAZ NORTH AMERICA LIMITED and Subsidiaries
(Wholly Owned Subsidiary of EVRAZ plc)
Notes to Consolidated Financial Statements (continued)
Years Ended December 31, 2013, 2012 and 2011
7. Employee Benefit Plans (continued)
Assumptions used to calculate the benefit obligation and net periodic benefit costs are detailed below:
| OPEB’s | OPEB’s | OPEB’s | ||||||||||||||||||||||
| 2013 | 2012 | 2011 | ||||||||||||||||||||||
| Weighted average assumptions to determine net cost | U.S. Plans | Canadian Plans | U.S. Plans | Canadian Plans | U.S. Plans | Canadian Plans | ||||||||||||||||||
Discount rate | 3.5 | % | 4.4 | % | 4.0 | % | 5.3 | % | 5.1 | % | 5.3 | % | ||||||||||||
Health care cost trend rate | 7.5 | % | 4.5 | % | 8.0 | % | 4.5 | % | 7.5 | % | 6.8 | % | ||||||||||||
Prescription drug cost trend rate | N/A | 10.0 | % | N/A | 10.0 | % | N/A | 10.0 | % | |||||||||||||||
Rate to which the prescription cost trend rate is assumed to decline | N/A | 4.5 | % | N/A | 4.5 | % | N/A | 4.5 | % | |||||||||||||||
Year the rate reaches the ultimate trend rate | N/A | 2024 | N/A | 2024 | N/A | 2024 | ||||||||||||||||||
| OPEB’s | OPEB’s | |||||||||||||||
| 2013 | 2012 | |||||||||||||||
| Weighted average assumptions to determine benefit obligations | U.S. Plans | Canadian Plans | U.S. Plans | Canadian Plans | ||||||||||||
Discount rate | 4.4 | % | 4.9 | % | 3.5 | % | 4.4 | % | ||||||||
Health care cost trend rate | 8.0 | % | 4.5 | % | 8.0 | % | 4.5 | % | ||||||||
Prescription drug cost trend rate | N/A | 10.0 | % | N/A | 10.0 | % | ||||||||||
Rate to which the prescription cost trend rate is assumed to decline | N/A | 4.5 | % | N/A | 4.5 | % | ||||||||||
Year the rate reaches the ultimate trend rate | N/A | 2024 | N/A | 2024 | ||||||||||||
A one-percentage-point change in assumed health care cost trend rates would have the following effects:
| U.S. Plans | Canadian Plans | U.S. Plans | Canadian Plans | |||||||||||||||||||||||||||||
| Year Ended December 31, 2013 | Year Ended December 31, 2013 | Year Ended December 31, 2012 | Year Ended December 31, 2012 | |||||||||||||||||||||||||||||
| 1% Increase | 1% Decrease | 1% Increase | 1% Decrease | 1% Increase | 1% Decrease | 1% Increase | 1% Decrease | |||||||||||||||||||||||||
Effect on accumulated postretirement benefit obligation | $ | 243 | $ | (221 | ) | $ | 891 | $ | (943 | ) | $ | 315 | $ | (285 | ) | $ | 2,425 | $ | (1,928 | ) | ||||||||||||
Effect on total service and interest cost components | 14 | (13 | ) | 154 | (122 | ) | 14 | (13 | ) | 132 | (106 | ) | ||||||||||||||||||||
The Company has profit participation, sales performance, annual incentive, and long-term cash-based incentive plans under which it distributes profits on a monthly, quarterly, and annual basis to eligible employees. The Company recorded incentive compensation expense under these plans of $25.1 million, $29.9 million and $41.4 for 2013, 2012 and 2011, respectively. Incentive compensation expense is included within cost of sales and selling, general, and administrative expenses.
8. Share-Based Compensation
EVRAZ plc, the Company’s indirect parent company, maintains share-based incentive compensation plans for certain select key employees of EICA and EINA. Share-based awards issued to employees consist of restricted stock awards of EVRAZ plc’s publically traded stock which are accounted for as equity-based compensation. Compensation costs resulting from share-based payment transactions are recognized primarily
F-53
Table of Contents
EVRAZ NORTH AMERICA LIMITED and Subsidiaries
(Wholly Owned Subsidiary of EVRAZ plc)
Notes to Consolidated Financial Statements (continued)
Years Ended December 31, 2013, 2012 and 2011
8. Share-Based Compensation (continued)
within selling, general and administrative expenses, at fair value over the requisite service period on a straight-line basis. The vesting period of the restricted stock awards is approximately 2 to 3 years. The calculated compensation cost is adjusted based on an estimate of awards ultimately expected to vest. The fair value of restricted stock awards is determined using the closing price of the EVRAZ plc’s (or EVRAZ Group S.A., the predecessor, shares for the 2010 and 2011 plans) common stock on date of grant. Total compensation costs recognized for 2013, 2012, and 2011 were $3.0 million, $2.1 million, and $1.9 million, respectively. These awards and related amounts are not necessarily indicative of awards and amounts that would have been granted if the Company was an independent, publically traded company for the periods presented.
The weighted average fair value of share-based awards granted in 2013, 2012 and 2011 was $2.13, $3.60 and $5.72, respectively.
The following inputs and assumptions were used in determining fair value of the awards:
| 2013 Awards | 2012 Awards | 2011 Awards | ||||||||||
Grant date price per share | $ | 2.13 | $ | 3.60 | $ | 5.72 | ||||||
The following table illustrates the number of, and movements in, EVRAZ plc share-based awards issued to EICA and EINA employees during the years 2013, 2012 and 2011 (in thousands, except for shares):
| Shares Awarded | Fair Value | |||||||
Outstanding at January 1, 2011 | 453,648 | $ | 5,268 | |||||
Granted | 782,034 | 4,471 | ||||||
Vested | (142,482 | ) | (1,655 | ) | ||||
Forfeited | (97,443 | ) | (1,132 | ) | ||||
|
|
|
| |||||
Outstanding at December 31, 2011 | 995,757 | 6,952 | ||||||
Granted | 2,545,210 | 9,163 | ||||||
Vested | (248,082 | ) | (1,876 | ) | ||||
Forfeited | (243,037 | ) | (1,855 | ) | ||||
|
|
|
| |||||
Outstanding at December 31, 2012 | 3,049,848 | 12,384 | ||||||
Granted | 4,443,438 | 9,465 | ||||||
Vested | (837,462 | ) | (3,792 | ) | ||||
Forfeited | (591,728 | ) | (2,355 | ) | ||||
|
|
|
| |||||
Outstanding at December 31, 2013 | 6,064,096 | $ | 15,702 | |||||
|
|
|
| |||||
Total nonvested, unrecognized share-based compensation expense was $9.0 million at December 31, 2013, which is expected to be recognized between 2014 and 2017. The Company has assumed that forfeitures for the 2013, 2012 and 2011 grants will approximate 30% over the remaining life of the awards.
Total share-based awards expected to vest is 4,244,867 shares. At December 31, 2013, there were 1,133,038 share-based awards that are fully vested. The weighted average fair value of awards issued between 2011 and 2013 and which remain outstanding at December 31, 2013, 2012 and 2011 is $2.59, $4.06 and $6.98 per share-based award, respectively. The weighted average remaining term for all awards is 35.2 months as at December 31, 2013.
F-54
Table of Contents
EVRAZ NORTH AMERICA LIMITED and Subsidiaries
(Wholly Owned Subsidiary of EVRAZ plc)
Notes to Consolidated Financial Statements (continued)
Years Ended December 31, 2013, 2012 and 2011
9. Related-Party Transactions
The Company partially purchases raw materials, such as slabs and vanadium, from affiliates. Total related-party purchases were $288.1 million, $408.9 million and $392.8 million for the years ended December 31, 2013, 2012 and 2011, respectively. Related party sales totaled $14.3 million in 2013. There were no related party sales in 2012 and 2011. Related-party trade payables totaled $52.0 million and $34.2 million at December 31, 2013 and 2012, respectively. Related-party trade receivables totaled $0.7 million and $1.3 million at December 31, 2013 and 2012, respectively. All transactions with affiliates are at negotiated market prices.
The Company has related-party loans payable. See Note 4—Debt and Related-Party Loans.
The Company paid dividends of $172.3 million, $68.2 million and $151.5 million to its parent company in 2013, 2012 and 2011, respectively.
10. Commitments and Contingencies
Operating Leases
At December 31, 2013, the future minimum lease payments under non-cancellable operating leases, primarily for real property, machinery, and equipment, are as follows:
2014 | $ | 9,250 | ||
2015 | 8,765 | |||
2016 | 8,187 | |||
2017 | 6,372 | |||
2018 | 6,068 | |||
Thereafter | 25,739 | |||
|
| |||
Total | $ | 64,381 | ||
|
|
The Company recorded total rent expense of $10.9 million, $10.1 million and $8.4 million for the years ended December 31, 2013, 2012 and 2011, respectively.
Environmental
The Company is subject to environmental laws and regulations established by federal, state, Canadian provincial, and local authorities and, accordingly makes provisions for the estimated costs of compliance. All material environmental remediation liabilities for non-capital expenditures, which are probable and estimable, are recorded in the consolidated financial statements based on current technologies and current environmental standards at the time of evaluation. Adjustments are made when additional information is available that suggests different remediation methods or periods may be required and affect the total cost. Total accrued environmental costs were $33.9 million and $34.2 million at December 31, 2013 and 2012, respectively. Approximately $28.7 million and $28.9 million of the accrued environmental costs were considered long-term liabilities at December 31, 2013 and 2012, respectively. Environmental costs are discounted to present value when the cash outflows are fixed and reliably determinable.
In June 2000, the Company entered into a voluntary agreement with the Oregon Department of Environmental Quality (“DEQ”) to investigate the possibility that historical contaminant sources at its EVRAZ
F-55
Table of Contents
EVRAZ NORTH AMERICA LIMITED and Subsidiaries
(Wholly Owned Subsidiary of EVRAZ plc)
Notes to Consolidated Financial Statements (continued)
Years Ended December 31, 2013, 2012 and 2011
10. Commitments and Contingencies (continued)
Portland facility had contributed to, or continue to contribute to, contamination to the adjacent Willamette River in what has been designated as the Portland Harbor Superfund Site (the “Site”). Under the voluntary agreement with the DEQ, the Company has committed to remediate potential contaminant migration into the river from upland sources by stabilizing the riverbank to reduce erosion of soils into the river and by adding a stormwater treatment system that treats groundwater and surface soils that are captured in the storm sewer system. The Company’s best estimate of the costs to conduct this remedial action was $9.1 million at December 31, 2013. $7.7 million of this amount is recorded as long term environmental liabilities on the consolidated balance sheet at December 31, 2013.
In a related matter, the Company has been notified by the U.S. Environmental Protection Agency (the “EPA”) under the Comprehensive Environmental Response, Compensation and Liability Act (“CERCLA”) that it is one of at least 100 potentially responsible parties (“PRPs”) that own or operate or formerly owned or operated sites adjacent to the Site. EPA is currently evaluating a draft feasibility study and will use it to formulate its Proposed Plan for public comment, after which it will issue a Record of Decision setting forth its chosen remedial action. The cost of remediation associated with the Site will not be fully known until the EPA issues its Record of Decision and design work is done for the implementation of that remedy. Also in a related matter, federal, state and tribal Portland Harbor Natural Resource Trustees have also notified the Company that it is also potentially liable under CERCLA and other federal and state laws for natural resource damages (“NRD”) that have occurred at the Site. The total amount of such NRD and the amount that would be allocated to the Company are currently not known. The Company, however, has estimated the range of costs that may be incurred in connection with the Site, both with respect to remedial action and NRD, and has recorded a liability based on the best estimate, given the facts currently known. The Company’s estimated obligation ranges between $6.8 million and $97.3 million. The related liability, included in total long-term accrued environmental liabilities, was $6.8 million at December 31, 2013.
The Company has insurance policies that it believes will provide reimbursement for the majority of the costs it incurs for defense, remediation and NRD in connection with the Site, including adjacent properties. In connection with these matters, the Company could incur additional costs associated with investigation and required remedial actions, and NRD, the costs of which may exceed available insurance or which may not be covered by insurance, which therefore could have a material adverse effect on the Company’s consolidated results of operations and cash flows.
In October 1995, CF&I and the Colorado Department of Public Health and Environment (“CDPHE”) finalized a post-closure permit for hazardous waste units at the Company’s EVRAZ Pueblo facility. As part of the post-closure permit requirements, the Company must conduct a corrective action program for the 82 solid waste management units (“SWMU”) at the facility and continue to address projects on a prioritized corrective action schedule over 30 years. The State of Colorado mandated that the schedule for corrective action could be accelerated if new data indicated a greater threat existed to the environment than was currently believed to exist. At December 31, 2013, the total accrued liability for all remaining SWMU’s was $14.4 million, of which $11.7 million was classified as non-current on the Company’s consolidated balance sheet. The portion of the liability with estimable cash flows was discounted to present value using discount rates ranging from 2.69% to 5.25%.
Inherent uncertainties exist in these estimates primarily due to unknown conditions, evolving remediation technology, and changing governmental regulations and legal standards.
F-56
Table of Contents
EVRAZ NORTH AMERICA LIMITED and Subsidiaries
(Wholly Owned Subsidiary of EVRAZ plc)
Notes to Consolidated Financial Statements (continued)
Years Ended December 31, 2013, 2012 and 2011
10. Commitments and Contingencies (continued)
Purchase and Supply Commitments
The EVRAZ Pueblo mill entered into a 10-year non-cancellable agreement to purchase oxygen commencing January 1, 2014. The contract requires the Company to purchase a minimum monthly volume of oxygen until the contract expires in December 2024.
At December 31, 2013, the future minimum payments under the EVRAZ Pueblo oxygen contracts are as follows:
2014 | $ | 1,997 | ||
2015 | 1,997 | |||
2016 | 1,997 | |||
2017 | 1,997 | |||
2018 | 1,997 | |||
Thereafter | 9,986 |
The Company has a contract to purchase a portion of the power for some of its Canadian facilities at a base rate through December 31, 2018. The base rate is adjusted annually during the term of the agreement according to statutory annually published increases. The Company incurred $39.8 million, $40.2 million and $39.2 million of expense for the years ended December 31, 2013, 2012 and 2011, respectively, related to this agreement.
Labor Matters
As at December 31, 2013, 2,623 people, or 65% of the Company’s workforce, is unionized personnel represented by the United Steelworkers (“USW”), UNIFOR, formerly the Canadian Auto Workers (“CAW”), and the International Association of Bridge, Structural, Ornamental, and Reinforcing Iron Workers. On December 10, 2011, the Company renewed the separate collective bargaining agreements with the USW, which represent unionized employees in Regina and Calgary, for the period July 31, 2011 to July 30, 2014. The unionized employees in Regina and Calgary that are covered by this agreement are continuing to work under the terms of the expired agreement while a new agreement is being negotiated. In 2012, the Company renewed the collective bargaining agreement with the CAW, which represents unionized employees in Camrose, for the period February 1, 2012 to January 31, 2016. In January 2013, the Company renewed the separate collective bargaining agreement with the Iron Workers Union, which represents unionized employees in Red Deer, for the period January 1, 2013 to December 31, 2017. In September 2013, the Company extended the collective bargaining agreement with the USW, representing unionized employees in Pueblo, Colorado until September 2017. Changes were only made to future wages.
Other Contingencies
The Company is party to various other claims, disputes, legal actions, and other proceedings involving contracts, employment, and various other matters. In the opinion of management, the outcome of these matters would not have a material adverse effect on the consolidated financial position of the Company, its results of operations, and liquidity.
F-57
Table of Contents
EVRAZ NORTH AMERICA LIMITED and Subsidiaries
(Wholly Owned Subsidiary of EVRAZ plc)
Notes to Consolidated Financial Statements (continued)
Years Ended December 31, 2013, 2012 and 2011
11. Acquisition
On September 28, 2012, EVRAZ NORTH AMERICA LIMITED acquired all of the assets of two steel scrap yards in Colorado for $11.8 million. The acquisition of the scrap yards did not have a material impact on the results of operations and was accounted for as a business combination, and the operating results subsequent to the acquisition date are included in the Company’s consolidated financial statements. The yards were acquired to secure the upstream scrap supply for the EVRAZ Pueblo facility and to develop a larger footprint for the Long Division in North America. At the date of acquisition, the Company expected to achieve synergies from the acquisition since the majority of the steel scrap processed at the yards is used by EVRAZ Pueblo. The fair values of the assets acquired and liabilities assumed as of the acquisition date are summarized in the following table.
Assets acquired: | ||||
Inventories | $ | 382 | ||
Property, plant, and equipment | 10,581 | |||
Intangible assets: | ||||
Supplier relationship | 480 | |||
Goodwill | 510 | |||
|
| |||
Total assets acquired | 11,953 | |||
Current liabilities | (203 | ) | ||
|
| |||
Acquisition cost | $ | 11,750 | ||
|
|
12. Earnings (Loss) Per Share
Basic earnings (loss) per common share is based on the weighted average number of common shares outstanding during the period. The Company did not have any stock options, or other potentially dilutive securities, outstanding during the periods presented.
The computation of basic earnings (loss) per share from continuing operations, net of tax, is summarized in the following table (in thousands, except per share data):
| For The Years Ended December 31, | ||||||||||||
| 2013 | 2012 | 2011 | ||||||||||
Basic earnings (loss) per share from continuing operations: | ||||||||||||
Net (loss) earnings from continuing operations | $ | (439,099 | ) | $ | 115,726 | $ | 132,648 | |||||
Weighted average number of shares outstanding | 1,001 | 1,000 | 1,000 | |||||||||
Basic (loss) earnings per share from continuing operations | $ | (438,660 | ) | $ | 115,726 | $ | 132,648 | |||||
The computation of basic earnings (loss) per share from discontinued operations, net of tax, is summarized in the following table (in thousands, except per share data):
| For The Years Ended December 31, | ||||||||||||
| 2013 | 2012 | 2011 | ||||||||||
Basic earnings (loss) per share from discontinued operations: | ||||||||||||
Net (loss) earnings from discontinued operations | $ | (270,211 | ) | $ | (101,078 | ) | $ | 9,779 | ||||
Weighted average number of shares outstanding | 1,001 | 1,000 | 1,000 | |||||||||
Basic (loss) earnings per share from discontinued operations | $ | (269,941 | ) | $ | (101,078 | ) | $ | 9,779 | ||||
F-58
Table of Contents
EVRAZ NORTH AMERICA LIMITED and Subsidiaries
(Wholly Owned Subsidiary of EVRAZ plc)
Notes to Consolidated Financial Statements (continued)
Years Ended December 31, 2013, 2012 and 2011
13. Discontinued Operations and Held for Sale Assets and Liabilities
In October 2013, the Company announced it was idling EVRAZ Claymont due to reduced market demand and the high volume of imported steel. The idling of EVRAZ Claymont represented a significant indicator of impairment for the mill’s property, plant and equipment and goodwill and other intangible assets. As a result of performing an impairment analysis, the long-lived tangible assets were impaired at December 1, 2013, resulting in a $148.2 million impairment loss for property, plant and equipment, a $104.6 million impairment loss for goodwill and a $19.5 million impairment loss for customer relationship-related intangible assets. In addition, certain inventories of EVRAZ Claymont were adjusted to net realizable value, which was lower than cost, and the $24.6 million adjustment was treated as an impairment of assets. Subsequently, in June 2014, the Company’s management made the decision to dispose of all the assets of EVRAZ Claymont. The Company determined that the future disposal of EVRAZ Claymont met the criteria for being classified as a component held for sale and a discontinued operation as of December 31, 2013. Prior to any disposal of EVRAZ Claymont, the Company will continue to incur expenses, primarily for payroll and utilities. Subsequent to any disposal, the Company does not expect to have continuing cash flows or involvement with the discontinued reporting unit.
The EVRAZ Surrey cut-to-length facility, representing a separate reporting unit, operated throughout 2013 until the Company sold its non-current tangible assets, including land, buildings and equipment, on December 13, 2013. The sale was for total cash consideration of $12.7 million, which approximated the recorded value of the net assets sold, thus there was no gain or loss on the sale. Indicators of impairment existed for EVRAZ Surrey’s property, plant and equipment and other intangible assets as of December 1, 2013. As a result of performing an impairment analysis, a $6.2 million impairment was recorded for property, plant and equipment and a $18.4 million impairment was recorded for the customer relationship intangible asset. The Company determined that the sale of EVRAZ Surrey met the criteria for being classified as a discontinued operation. Subsequent to the sale, the Company did not have continuing cash flows or involvement with the discontinued reporting unit.
EVRAZ Claymont’s and EVRAZ Surrey’s results of operations have been removed from the Company’s results of continuing operations for all periods presented and are presented as discontinued operations. EVRAZ Claymont and EVRAZ Surrey were previously included in the Flat Division. All disclosures for the related periods have also been adjusted to reflect the discontinued operations.
The liabilities and related expenses for employee benefit plans, and the current and deferred income tax assets for the EVRAZ Claymont and EVRAZ Surrey reporting units were included in the consolidated balance sheets and statements of operations from continuing operations as they are not associated with the disposal groups assets and liabilities.
The EVRAZ Claymont mill entered into a 10-year non-cancellable purchase commitment for oxygen starting September 1, 2011. The contract required the Company to purchase a minimum volume of oxygen each quarter until the contract expires in August 2021. The Company recorded $5.8 million, $6.3 million and $2.8 million of costs related to this agreement for the years ended December 31, 2013, 2012 and 2011, respectively. In 2014, management determined that the oxygen contract for its idle EVRAZ Claymont facility was onerous and would provide no future benefit to the Company. In 2014, the Company reached an agreement with the supplier to settle the remaining balance of the commitment, and subsequently recorded a $7.0 million charge, for the six month period ended June 2014.
The Company recognizes a liability for the fair value of a legally required conditional asset retirement obligation when incurred, if the liability’s fair value can be reasonably estimated. An asset retirement obligation
F-59
Table of Contents
EVRAZ NORTH AMERICA LIMITED and Subsidiaries
(Wholly Owned Subsidiary of EVRAZ plc)
Notes to Consolidated Financial Statements (continued)
Years Ended December 31, 2013, 2012 and 2011
13. Discontinued Operations and Held for Sale Assets and Liabilities (continued)
of $15.0 million was triggered following the idling of the EVRAZ Claymont mill in December 2013. The fair value of the asset retirement obligation has been recorded as liabilities held for sale within the Company’s consolidated balance sheet at December 31, 2013. The estimated cost of the asset retirement obligation was recorded as property, plant and equipment at December 31, 2013 and was subsequently impaired. The $15.0 million impairment loss is included in discontinued operations in the consolidated statement of operations for the year ended December 31, 2013.
The following table provides a reconciliation of the major classes of line items constituting the pretax loss of discontinued operations to the after-tax loss of the discontinued operations presented on the face of the consolidated statement of operations for the years ended December 31, 2013, 2012 and 2011:
| Year Ended December 31, 2013 | ||||||||||||
| EVRAZ Claymont | EVRAZ Surrey | Total | ||||||||||
Sales | $ | 260,601 | $ | 44,704 | $ | 305,305 | ||||||
Cost of sales | (308,594 | ) | (41,613 | ) | (350,207 | ) | ||||||
Selling, general and administrative expenses | (21,953 | ) | (3,008 | ) | (24,961 | ) | ||||||
Impairment of assets | (296,917 | ) | (24,639 | ) | (321,556 | ) | ||||||
|
|
|
|
|
| |||||||
Operating loss | (366,863 | ) | (24,556 | ) | (391,419 | ) | ||||||
Other income | 5 | — | 5 | |||||||||
|
|
|
|
|
| |||||||
Loss before income taxes | (366,858 | ) | (24,556 | ) | (391,414 | ) | ||||||
Income tax benefit | 115,019 | 6,184 | 121,203 | |||||||||
|
|
|
|
|
| |||||||
Net loss from discontinued operations | $ | (251,839 | ) | $ | (18,372 | ) | $ | (270,211 | ) | |||
|
|
|
|
|
| |||||||
| Year Ended December 31, 2012 | ||||||||||||
| EVRAZ Claymont | EVRAZ Surrey | Total | ||||||||||
Sales | $ | 359,833 | $ | 71,043 | $ | 430,876 | ||||||
Cost of sales | (360,583 | ) | (69,196 | ) | (429,779 | ) | ||||||
Selling, general and administrative expenses | (30,330 | ) | (3,624 | ) | (33,954 | ) | ||||||
Impairment of assets | (90,910 | ) | — | (90,910 | ) | |||||||
|
|
|
|
|
| |||||||
Operating loss | (121,990 | ) | (1,777 | ) | (123,767 | ) | ||||||
Other income | — | 1 | 1 | |||||||||
|
|
|
|
|
| |||||||
Loss before income taxes | (121,990 | ) | (1,776 | ) | (123,766 | ) | ||||||
Income tax benefit | 22,241 | 447 | 22,688 | |||||||||
|
|
|
|
|
| |||||||
Net loss from discontinued operations | $ | (99,749 | ) | $ | (1,329 | ) | $ | (101,078 | ) | |||
|
|
|
|
|
| |||||||
F-60
Table of Contents
EVRAZ NORTH AMERICA LIMITED and Subsidiaries
(Wholly Owned Subsidiary of EVRAZ plc)
Notes to Consolidated Financial Statements (continued)
Years Ended December 31, 2013, 2012 and 2011
13. Discontinued Operations and Held for Sale Assets and Liabilities (continued)
| Year Ended December 31, 2011 | ||||||||||||
| EVRAZ Claymont | EVRAZ Surrey | Total | ||||||||||
Sales | $ | 370,144 | $ | 88,126 | $ | 458,270 | ||||||
Cost of sales | (338,092 | ) | (88,174 | ) | (426,266 | ) | ||||||
Selling, general and administrative expenses | (29,333 | ) | (3,967 | ) | (33,300 | ) | ||||||
|
|
|
|
|
| |||||||
Operating income (loss) | 2,719 | (4,015 | ) | (1,296 | ) | |||||||
Other income | 1 | 1 | 2 | |||||||||
|
|
|
|
|
| |||||||
Income (loss) before income taxes | 2,720 | (4,014 | ) | (1,294 | ) | |||||||
Income tax benefit | 10,047 | 1,026 | 11,073 | |||||||||
|
|
|
|
|
| |||||||
Net income (loss) from discontinued operations | $ | 12,767 | $ | (2,988 | ) | $ | 9,779 | |||||
|
|
|
|
|
| |||||||
The following table summarizes the components of assets and liabilities held for sale presented separately on the consolidated balance sheets as of December 31, 2013 and 2012:
| 2013 | 2012 | |||||||||||||||||||||||
| EVRAZ Claymont | EVRAZ Surrey | Total 2013 | EVRAZ Claymont | EVRAZ Surrey | Total 2012 | |||||||||||||||||||
Assets: | ||||||||||||||||||||||||
Trade accounts receivable, net | $ | 14,387 | $ | — | $ | 14,387 | $ | 29,272 | $ | 4,714 | $ | 33,986 | ||||||||||||
Inventories | 2,528 | — | 2,528 | 69,484 | 9,058 | 78,542 | ||||||||||||||||||
Other current assets | 1,253 | — | 1,253 | 1,570 | — | 1,570 | ||||||||||||||||||
|
|
|
|
|
|
|
|
|
|
|
| |||||||||||||
Total current assets held for sale | $ | 18,168 | $ | — | $ | 18,168 | $ | 100,326 | $ | 13,772 | $ | 114,098 | ||||||||||||
|
|
|
|
|
|
|
|
|
|
|
| |||||||||||||
Property, plant and equipment, net | $ | — | $ | — | $ | — | $ | 146,527 | $ | 20,934 | $ | 167,461 | ||||||||||||
Goodwill | — | — | — | 104,575 | — | 104,575 | ||||||||||||||||||
Intangibles, net | — | — | — | 21,746 | 21,540 | 43,286 | ||||||||||||||||||
Other assets | — | — | — | 550 | — | 550 | ||||||||||||||||||
|
|
|
|
|
|
|
|
|
|
|
| |||||||||||||
Total long-term assets held for sale | $ | — | $ | — | $ | — | $ | 273,398 | $ | 42,474 | $ | 315,872 | ||||||||||||
|
|
|
|
|
|
|
|
|
|
|
| |||||||||||||
Liabilities: | ||||||||||||||||||||||||
Accounts payable | $ | 5,070 | $ | — | $ | 5,070 | $ | 39,360 | $ | 531 | $ | 39,891 | ||||||||||||
Accrued expenses | 3,620 | — | 3,620 | 4,656 | 126 | 4,782 | ||||||||||||||||||
Asset retirement obligation liabilities | 15,000 | — | 15,000 | — | — | |||||||||||||||||||
|
|
|
|
|
|
|
|
|
|
|
| |||||||||||||
Total current liabilities held for sale | $ | 23,690 | $ | — | $ | 23,690 | $ | 44,016 | $ | 657 | $ | 44,673 | ||||||||||||
|
|
|
|
|
|
|
|
|
|
|
| |||||||||||||
The depreciation, amortization, capital expenditures, and other significant noncash items of the discontinued operations for the years ended December 31, 2013, 2012 and 2011 are as follows:
| Year Ended December 31, 2013 | ||||||||||||
| EVRAZ Claymont | EVRAZ Surrey | Total | ||||||||||
Depreciation | $ | 17,797 | $ | 672 | $ | 18,469 | ||||||
Amortization | 2,283 | 1,818 | 4,101 | |||||||||
Impairment of assets | 296,917 | 24,639 | 321,556 | |||||||||
Capital expenditures | 9,595 | 30 | 9,625 | |||||||||
F-61
Table of Contents
EVRAZ NORTH AMERICA LIMITED and Subsidiaries
(Wholly Owned Subsidiary of EVRAZ plc)
Notes to Consolidated Financial Statements (continued)
Years Ended December 31, 2013, 2012 and 2011
13. Discontinued Operations and Held for Sale Assets and Liabilities (continued)
| Year Ended December 31, 2012 | ||||||||||||
| EVRAZ Claymont | EVRAZ Surrey | Total | ||||||||||
Depreciation | $ | 18,288 | $ | 732 | $ | 19,020 | ||||||
Amortization | 2,654 | 2,050 | 4,704 | |||||||||
Impairment of assets | 90,910 | — | 90,910 | |||||||||
Capital expenditures | 19,133 | 73 | 19,206 | |||||||||
| Year Ended December 31, 2011 | ||||||||||||
| EVRAZ Claymont | EVRAZ Surrey | Total | ||||||||||
Depreciation | $ | 16,798 | $ | 801 | $ | 17,599 | ||||||
Amortization | 2,829 | 2,151 | 4,980 | |||||||||
Capital expenditures | 21,515 | 171 | 21,686 | |||||||||
14. Segment Information
Accounting standards for reporting information about operating segments define operating segments as components of an enterprise for which separate financial information is available that is evaluated regularly by the chief operating decision maker (“CODM”) in deciding how to allocate resources and in assessing performance. The Company’s CODM is the Chief Executive Officer. The Company is organized and managed based primarily upon the similarity of the types of products produced and sold by each of its operating segments. While the CODM evaluates results in a number of different ways, the primary basis for allocating resources and assessing financial results is by its three operating and reporting segments: Long Division, Tubular Division and Flat Division.
The Long Division produces rail, wire rod used in infrastructure, and OCTG seamless product used in oil and gas applications. The Long Division also includes the GSI scrap collection and processing facilities, a steelmaking and finishing facility and the C&W railway, which operates a short-line railroad principally servicing the Long Division mills.
The Tubular Division produces large diameter pipe used for oil and natural gas pipelines, small diameter welded pipe, and casing and tubing for use in the collection of oil and gas, among other industrial applications. The Tubular Division consists of the EVRAZ Camrose, EVRAZ Portland Tubular, EVRAZ Regina, EVRAZ Regina Tubular, EVRAZ Calgary, and EVRAZ Red Deer facilities, in addition to the GSP scrap collection and processing facilities.
The Flat Division manufactures steel plate, coil and structural tubing used in various construction and industrial end markets. The Flat Division includes EVRAZ Portland, and EVRAZ Regina CTL. The Flat Division also produces hollow steel structural product at its facility in Portland, Oregon and operates a temper mill and cut-to-length facility at its 60%-owned OFP joint venture facility.
All of the non-current tangible assets for the EVRAZ Surrey reporting unit were sold in December 2013. EVRAZ Surrey and EVRAZ Claymont have been reported as discontinued operations and, accordingly, their financial positions and results of operations have been excluded from the segments disclosure. See Note 13—Discontinued Operations and Held for Sale Assets and Liabilities for further discussion.
The non-current tangible assets of EVRAZ Regina CTL were sold in June 2014. See Note 16—Subsequent Events for further discussion.
F-62
Table of Contents
EVRAZ NORTH AMERICA LIMITED and Subsidiaries
(Wholly Owned Subsidiary of EVRAZ plc)
Notes to Consolidated Financial Statements (continued)
Years Ended December 31, 2013, 2012 and 2011
14. Segment Information (continued)
The CODM analyzes revenue at the product sales level, which does not include freight revenue. Intersegment product sales from one segment to another segment are made at rates that approximate market and are eliminated at the corporate consolidation level. These intersegment product sales produce intersegment profits which are not recognized until the finished products are ultimately sold to third parties.
The information provided below reflects internal information that is provided to the Company’s CODM for management purposes. The CODM primarily measures segment performance by adding back depreciation expense, amortization expense, impairment of assets, and loss (gain) on disposal of property, plant and equipment from segment operating income from continuing operations. This performance measure reflects fundamental earnings potential and measures the cash earnings that can be used to pay interest, repay principal balances on debt, and finance capital expenditures and dividends.
Certain assets are not allocated to the operating segments and are held at the corporate level, including cash and cash equivalents, restricted cash, refundable income taxes, and certain prepaid expenses and other assets. These corporate assets, in addition to intercompany notes receivable, are excluded from segment assets when the Company’s CODM assesses segment performance on the balance sheet.
The Company’s results by reporting segment for continuing operations for the years ended December 31 were as follows:
| 2013 | 2012 | 2011 | ||||||||||
Product sales to external customers: | ||||||||||||
Long | $ | 853,899 | $ | 892,547 | $ | 901,562 | ||||||
Tubular | 1,217,979 | 1,223,534 | 1,251,969 | |||||||||
Flat | 512,993 | 652,425 | 743,032 | |||||||||
|
|
|
|
|
| |||||||
Total external product sales | 2,584,871 | 2,768,506 | 2,896,563 | |||||||||
Freight sales | 164,060 | 135,953 | 150,574 | |||||||||
|
|
|
|
|
| |||||||
Total consolidated sales | $ | 2,748,931 | $ | 2,904,459 | $ | 3,047,137 | ||||||
|
|
|
|
|
| |||||||
Intersegment product sales: | ||||||||||||
Long | $ | 16,217 | $ | 14,501 | $ | 5,300 | ||||||
Tubular | 58,629 | 118,499 | 124,566 | |||||||||
Flat | 171,887 | 104,322 | 110,970 | |||||||||
|
|
|
|
|
| |||||||
Total intersegment product sales | 246,733 | 237,322 | 240,836 | |||||||||
Eliminations | (246,733 | ) | (237,322 | ) | (240,836 | ) | ||||||
|
|
|
|
|
| |||||||
| $ | — | $ | — | $ | — | |||||||
|
|
|
|
|
| |||||||
F-63
Table of Contents
EVRAZ NORTH AMERICA LIMITED and Subsidiaries
(Wholly Owned Subsidiary of EVRAZ plc)
Notes to Consolidated Financial Statements (continued)
Years Ended December 31, 2013, 2012 and 2011
14. Segment Information (continued)
Intersegment product sales include $26.9 million, $85.0 million and $98.6 million to the EVRAZ Surrey discontinued reporting unit for the years ended December 31, 2013, 2012, and 2011, respectively.
| 2013 | 2012 | 2011 | ||||||||||
Capital expenditures: | ||||||||||||
Long | $ | 37,437 | $ | 31,816 | $ | 15,524 | ||||||
Tubular | 35,832 | 22,978 | 24,906 | |||||||||
Flat | 9,275 | 10,970 | 12,402 | |||||||||
|
|
|
|
|
| |||||||
Total segment capital expenditures | 82,544 | 65,764 | 52,832 | |||||||||
Corporate | 1,646 | 1,557 | 6,284 | |||||||||
|
|
|
|
|
| |||||||
Total consolidated capital expenditures | $ | 84,190 | $ | 67,321 | $ | 59,116 | ||||||
|
|
|
|
|
| |||||||
The Company’s capital expenditures listed above are provided on the cash basis, as this is the manner in which the information is provided to, and evaluated by, the CODM.
The following measures are used by the CODM for the purposes of allocating resources and assessing the performance of the operating segments:
| December 31, 2013 | ||||||||||||||||||||
| Long | Tubular | Flat | Eliminations/ Corporate | Total | ||||||||||||||||
Operating loss from continuing operations | $ | (12,113 | ) | $ | (105,036 | ) | $ | (345,579 | ) | $ | (7,090 | ) | $ | (469,818 | ) | |||||
Depreciation and amortization expense | 42,086 | 88,267 | 42,396 | 2,840 | 175,589 | |||||||||||||||
Impairment of assets | 77,461 | 55,034 | 336,145 | — | 468,640 | |||||||||||||||
Loss (gain) on disposal of property, plant and equipment | 1,040 | 604 | 117 | (178 | ) | 1,583 | ||||||||||||||
|
|
|
|
|
|
|
|
|
| |||||||||||
Adjusted operating income (loss) | $ | 108,474 | $ | 38,869 | $ | 33,079 | $ | (4,428 | ) | $ | 175,994 | |||||||||
|
|
|
|
|
|
|
|
|
| |||||||||||
| December 31, 2012 | ||||||||||||||||||||
| Long | Tubular | Flat | Eliminations/ Corporate | Total | ||||||||||||||||
Operating income (loss) from continuing operations | $ | 119,442 | $ | 53,528 | $ | (8,715 | ) | $ | 338 | $ | 164,593 | |||||||||
Depreciation and amortization expense | 41,841 | 90,708 | 44,807 | 2,753 | 180,109 | |||||||||||||||
Loss (gain) on disposal of property, plant and equipment | 296 | 371 | 1,881 | (295 | ) | 2,253 | ||||||||||||||
|
|
|
|
|
|
|
|
|
| |||||||||||
Adjusted operating income | $ | 161,579 | $ | 144,607 | $ | 37,973 | $ | 2,796 | $ | 346,955 | ||||||||||
|
|
|
|
|
|
|
|
|
| |||||||||||
| December 31, 2011 | ||||||||||||||||||||
| Long | Tubular | Flat | Eliminations/ Corporate | Total | ||||||||||||||||
Operating income (loss) from continuing operations | $ | 128,602 | $ | 83,921 | $ | 36,686 | $ | (8,452 | ) | $ | 240,757 | |||||||||
Depreciation and amortization expense | 46,326 | 99,544 | 49,694 | 2,150 | 197,714 | |||||||||||||||
Gain on disposal of property, plant and equipment | (244 | ) | (269 | ) | (3 | ) | (25 | ) | (541 | ) | ||||||||||
|
|
|
|
|
|
|
|
|
| |||||||||||
Adjusted operating income (loss) | $ | 174,684 | $ | 183,196 | $ | 86,377 | $ | (6,327 | ) | $ | 437,930 | |||||||||
|
|
|
|
|
|
|
|
|
| |||||||||||
F-64
Table of Contents
EVRAZ NORTH AMERICA LIMITED and Subsidiaries
(Wholly Owned Subsidiary of EVRAZ plc)
Notes to Consolidated Financial Statements (continued)
Years Ended December 31, 2013, 2012 and 2011
14. Segment Information (continued)
The following table shows a reconciliation of consolidated operating (loss) income to the Company’s (loss) income from continuing operations before income taxes:
| 2013 | 2012 | 2011 | ||||||||||
Operating (loss) income | $ | (469,818 | ) | $ | 164,593 | $ | 240,757 | |||||
Interest expense | (70,642 | ) | (62,001 | ) | (96,537 | ) | ||||||
Dividend and interest income | 76 | 171 | 158 | |||||||||
Foreign exchange (losses) gains | (3,955 | ) | 15,738 | (12,326 | ) | |||||||
Loss on extinguishment of debt | — | — | (6,301 | ) | ||||||||
Other income, net | 2,195 | 2,811 | 4,952 | |||||||||
|
|
|
|
|
| |||||||
Total (loss) income from continuing operations before income taxes | $ | (542,144 | ) | $ | 121,312 | $ | 130,703 | |||||
|
|
|
|
|
| |||||||
The Company has no assets in the U.K., the Company’s country of domicile. Total asset balances by segment at December 31 are summarized as follows:
| 2013 | 2012 | |||||||
Total asset balances by segment: | ||||||||
Long | $ | 836,982 | $ | 965,582 | ||||
Tubular | 2,165,212 | 2,336,527 | ||||||
Flat | 690,818 | 1,108,284 | ||||||
|
|
|
| |||||
Total segment asset balances | 3,693,012 | 4,410,393 | ||||||
Corporate/eliminations | 71,467 | 89,735 | ||||||
Assets held for sale | 18,168 | 429,970 | ||||||
|
|
|
| |||||
Total consolidated assets | $ | 3,782,647 | $ | 4,930,098 | ||||
|
|
|
| |||||
The majority of the Company’s customers are located in North America. The Company had one customer that accounted for $611.3 million, $356.1 million and $119.3 million of revenues in 2013, 2012, and 2011, respectively. These sales accounted for approximately 22.2%, 12.3% and 3.9% of total sales revenues in 2013, 2012 and 2011, respectively. These revenues are reported within the Tubular Division.
The Company has no revenues in the U.K., the Company’s country of domicile. The following revenues from external customers are presented based on the customer sales destination and by major product for the years ended December 31:
| 2013 | 2012 | 2011 | ||||||||||
External product sales based on sales destination: | ||||||||||||
United States | $ | 1,426,470 | $ | 1,655,887 | $ | 1,503,737 | ||||||
Canada | 1,134,546 | 1,086,676 | 1,345,083 | |||||||||
Other | 23,855 | 25,943 | 47,743 | |||||||||
|
|
|
|
|
| |||||||
Total external product sales | 2,584,871 | 2,768,506 | 2,896,563 | |||||||||
Total freight sales | 164,060 | 135,953 | 150,574 | |||||||||
|
|
|
|
|
| |||||||
Total consolidated sales | $ | 2,748,931 | $ | 2,904,459 | $ | 3,047,137 | ||||||
|
|
|
|
|
| |||||||
F-65
Table of Contents
EVRAZ NORTH AMERICA LIMITED and Subsidiaries
(Wholly Owned Subsidiary of EVRAZ plc)
Notes to Consolidated Financial Statements (continued)
Years Ended December 31, 2013, 2012 and 2011
14. Segment Information (continued)
| 2013 | 2012 | 2011 | ||||||||||
External product sales by product type: | ||||||||||||
Rail and wire rod | $ | 683,199 | $ | 724,364 | $ | 702,302 | ||||||
Line pipe | 777,452 | 687,714 | 692,687 | |||||||||
OCTG | 468,377 | 607,729 | 619,835 | |||||||||
Flat-rolled | 549,616 | 674,220 | 809,155 | |||||||||
Other | 106,227 | 74,479 | 72,584 | |||||||||
|
|
|
|
|
| |||||||
Total external product sales | 2,584,871 | 2,768,506 | 2,896,563 | |||||||||
Total freight sales | 164,060 | 135,953 | 150,574 | |||||||||
|
|
|
|
|
| |||||||
Total consolidated sales | $ | 2,748,931 | $ | 2,904,459 | $ | 3,047,137 | ||||||
|
|
|
|
|
| |||||||
The following long-lived assets are presented by the Company’s geographic regions as of December 31:
| 2013 | 2012 | |||||||
Long-lived assets by geographic region: | ||||||||
United States | $ | 677,713 | $ | 701,079 | ||||
Canada | 546,494 | 600,475 | ||||||
|
|
|
| |||||
Total consolidated long-lived assets | $ | 1,224,207 | $ | 1,301,554 | ||||
|
|
|
| |||||
15. Other Comprehensive Income
Reclassifications out of other comprehensive loss for the year ended December 31, 2013(1):
Details about accumulated other comprehensive (loss) income components | Amount reclassified from accumulated other comprehensive income (loss) | Affected line item in the consolidated statements of operations | ||||
Amortization of defined benefit pension items: | ||||||
Prior service costs | $ | (202 | ) | (2) | ||
Actuarial losses | (16,336 | ) | (2) | |||
|
| |||||
Total before tax | (16,538 | ) | ||||
Tax benefit | 5,273 | Income tax benefit | ||||
|
| |||||
Net of tax | (11,265 | ) | ||||
Noncontrolling interest | 6,423 | Noncontrolling interest | ||||
|
| |||||
Net of tax and noncontrolling interest | $ | (4,842 | ) | |||
|
| |||||
| (1) | Amounts in parentheses indicate debits in profit/loss. |
| (2) | These accumulated other comprehensive loss components are included in the computation of net periodic pension cost. |
F-66
Table of Contents
EVRAZ NORTH AMERICA LIMITED and Subsidiaries
(Wholly Owned Subsidiary of EVRAZ plc)
Notes to Consolidated Financial Statements (continued)
Years Ended December 31, 2013, 2012 and 2011
15. Other Comprehensive Income (continued)
Changes in other comprehensive income by component for the year ended December 31, 2013:
Description | Foreign Currency Translation | Pension and Post Retirement Benefit Plans | Totals | |||||||||
Beginning balance | $ | 56,624 | $ | (113,737 | ) | $ | (57,113 | ) | ||||
|
|
|
|
|
| |||||||
Other comprehensive income (loss) before reclassifications | (30,482 | ) | 39,010 | 8,528 | ||||||||
Amounts reclassified from accumulated other comprehensive income (loss) | — | 4,842 | 4,842 | |||||||||
|
|
|
|
|
| |||||||
Net current period other comprehensive income | (30,482 | ) | 43,852 | 13,370 | ||||||||
|
|
|
|
|
| |||||||
Ending balance | $ | 26,142 | $ | (69,885 | ) | $ | (43,743 | ) | ||||
|
|
|
|
|
| |||||||
16. Subsequent Events
The Company has evaluated subsequent events through November 6, 2014, the date the consolidated financial statements were available for issuance.
In June 2014, the Company’s management made the decision to dispose of the assets of EVRAZ Claymont. In June 2014, the Company reached an agreement with an oxygen supplier to settle the remaining balance on a 10-year contract at EVRAZ Claymont. See Note 13—Discontinued Operations and Held for Sale Assets and Liabilities for further discussion.
On June 26, 2014, the Company sold its cut-to-length business in Regina, Saskatchewan, including the machinery and equipment, spare parts and customer lists for total cash consideration of $7.4 million. The Company recorded a $0.7 million gain upon disposal of the EVRAZ Regina cut-to-length business, which was included within the Company’s Flat Division.
On October 13, 2014, the Company entered into a new CAD 350 million related-party loan (“Note 3”). This note is due June 30, 2020, and carries a fixed interest rate of 7.50% per annum. The loan agreement for Note 3 includes a clause that resets the interest rate in the event of an external bond offering to the rate of that offering plus 0.75% with a cap of 8.25%. The Company had two related-party loans, Note 1 and Note 2, at September 30, 2014. The proceeds from Note 3 were used to pay in full related-party Note 1 ($241.1 million) and to partially pay related-party Note 2 ($65.8 million). Interest on the related-party loan is payable quarterly.
On October 31, 2014, EICA priced a $350 million debt offering. The closing of the debt offering is expected to occur on November 7, 2014, subject to customary closing conditions. The five year senior secured notes are due November 2019 and carry a fixed interest rate of 7.50% per annum. The notes will be guaranteed by EICA, EINA and certain of EICA and EINA’s subsidiaries. The net proceeds of the debt offering were used to partially pay related-party Note 2.
There have been no subsequent events, other than mentioned above, that occurred during such period that would require disclosure or recognition in the consolidated financial statements as of or for the year ended December 31, 2013.
F-67
Table of Contents
Schedule II Valuation and Qualifying Accounts
For the Years Ended December 31, 2013, 2012 and 2011
| Balance at Beginning of Period | Additions Charged to Costs and Expenses | Deductions | Balance at End of Period | |||||||||||||
2011 | ||||||||||||||||
Allowance for doubtful accounts | $ | 667 | 211 | 448 | $ | 430 | ||||||||||
Deferred tax valuation allowance | $ | 4,230 | — | 4,230 | $ | — | ||||||||||
Environmental reserves | $ | 37,690 | 666 | 2,351 | $ | 36,005 | ||||||||||
2012 | ||||||||||||||||
Allowance for doubtful accounts | $ | 430 | 1 | 206 | $ | 225 | ||||||||||
Environmental reserves | $ | 36,005 | 1,650 | 3,466 | $ | 34,189 | ||||||||||
2013 | ||||||||||||||||
Allowance for doubtful accounts | $ | 225 | 235 | — | $ | 460 | ||||||||||
Deferred tax valuation allowance | $ | — | 24,236 | — | $ | 24,236 | ||||||||||
Environmental reserves | $ | 34,189 | 7,425 | 7,746 | $ | 33,868 | ||||||||||
F-68
Table of Contents
Ordinary Shares
PROSPECTUS
Citigroup
Goldman, Sachs & Co.
Prospectus dated , 2014
Through and including , 2014 (the 25th day after the date of this prospectus), all dealers effecting transactions in these securities, whether or not participating in this international offering, may be required to deliver a prospectus. This is in addition to the dealers’ obligation to deliver a prospectus when acting as underwriters and with respect to their unsold allotments or subscriptions.
Table of Contents
PART II
INFORMATION NOT REQUIRED IN PROSPECTUS
| Item 6. | Indemnification of Directors and Officers |
The registrant’s articles of association provide that, subject to the Companies Act, every person who is or was at any time a director or other officer (excluding an auditor) of the registrant may be indemnified out of the assets of the registrant against all costs, charges, expenses, losses, or liabilities incurred by him in performing his duties or the exercise of his powers or otherwise in relation to or in connection with his duties, powers or office.
The registrant plans to maintain insurance for its directors regarding negligence, fault, breach of trust, and breach of duty under the terms allowed by the Companies Act.
In the underwriting agreement, the underwriters will agree to indemnify, under certain conditions, the registrant, members of the registrant’s Board of Directors, members of the executive management board and persons who control the registrant within the meaning of the Securities Act, against certain liabilities. See “Item 9. Undertakings” for a description of the Commission’s position regarding such indemnification provisions.
| Item 7. | Recent Sales of Unregistered Securities |
As a part of our incorporation on November 28, 2012, we issued 1,000 ordinary shares with a nominal value of $1 per share to EGSA. On November 30, 2012, we issued one additional share to EGSA at a share premium of $1,628,540,000. On September 5, 2014, we issued 50,000 ordinary shares with a nominal value of £1 per share to EGSA in exchange for £50,000. In connection with the pre-offering reorganization, on September 30, 2014 we issued 958 ordinary shares to EGSA in exchange for 51% of EVRAZ Inc. NA Canada, a corporation incorporated pursuant to the Canada Business Corporations Act and 63.5% of EVRAZ Inc. NA, a Delaware corporation. These issuances were exempt from registration under Regulation S promulgated under the U.S. Securities Act of 1933.
| Item 8. | Exhibits and Financial Statement Schedules |
(a) Exhibits.
Incorporated by reference to the Exhibit Index following page II-4 hereof.
(b) Financial Statement Schedules.
All schedules have been omitted since they are not required or are not applicable or the required information is shown in the audited consolidated financial statements or notes thereto.
| Item 9. | Undertakings |
The undersigned registrant hereby undertakes to provide to the underwriters at the closing specified in the underwriting agreement certificates in such denominations and registered in such names as required by the underwriters to permit prompt delivery to each purchaser.
Insofar as indemnification for liabilities arising under the Securities Act may be permitted to directors, officers and controlling persons of the registrant pursuant to the foregoing provisions, or otherwise, the registrant has been advised that in the opinion of the SEC such indemnification is against public policy as expressed in the Securities Act and is, therefore, unenforceable. In the event that a claim for indemnification against such liabilities (other than the payment by the registrant of expenses incurred or paid by a director, officer, or controlling person of the registrant in the successful defense of any action, suit or proceeding) is asserted by such director, officer, or controlling person in connection with the securities being registered, the registrant will, unless in the opinion of its counsel the matter has been settled by controlling precedent, submit to a court of appropriate jurisdiction the question whether such indemnification by it is against public policy as expressed in the Securities Act and will be governed by the final adjudication of such issue.
II-1
Table of Contents
The registrant hereby undertakes that:
(1) For purposes of any liability under the Securities Act, the information omitted from the form of prospectus filed as part of this registration statement in reliance upon Rule 430A and contained in a form of prospectus filed by the registrant pursuant to Rule 424(b)(1) or (4) or 497(h) under the Securities Act shall be deemed to be part of this registration statement as of the time it was declared effective.
(2) For the purpose of determining any liability under the Securities Act, each post-effective amendment that contains a form of prospectus shall be deemed to be a new registration statement relating to the securities offered therein, and the offering of such securities at that time shall be deemed to be the initial bona fide offering thereof.
Each prospectus filed pursuant to Rule 424(b) as part of a registration statement relating to an offering, other than registration statements relying on Rule 430B or other than prospectuses filed in reliance on Rule 430A, shall be deemed to be part of and included in the registration statement as of the date it is first used after effectiveness. Provided, however, that no statement made in a registration statement or prospectus that is part of the registration statement or made in a document incorporated or deemed incorporated by reference into the registration statement or prospectus that is part of the registration statement will, as to a purchaser with a time of contract of sale prior to such first use, supersede or modify any statement that was made in the registration statement or prospectus that was part of the registration statement or made in any such document immediately prior to such date of first use.
II-2
Table of Contents
SIGNATURES
Pursuant to the requirements of the Securities Act of 1933, the registrant certifies that it has reasonable grounds to believe that it meets all of the requirements for filing this Registration Statement on Form F-1 and has duly caused this Registration Statement to be signed on its behalf by the undersigned, thereunto duly authorized on November 25, 2014.
| EVRAZ NORTH AMERICA LIMITED | ||
By: | /s/ Conrad Winkler | |
Name: | Conrad Winkler | |
Title: | Director, President & Chief Executive Officer | |
KNOW ALL PERSONS BY THESE PRESENTS, that each person whose signature appears below constitutes and appoints Glenda Minor and Conrad Winkler, and each of them, as his or her true and lawful attorneys-in-fact and agents, with full power of substitution and resubstitution, for him or her and in his or her name, place and stead, in any and all capacities, to sign any and all amendments (including post-effective amendments) to this registration statement, and to sign any registration statement for the same offering covered by the registration statement that is to be effective upon filing pursuant to Rule 462(b) promulgated under the Securities Act of 1933 and to file the same, with all exhibits thereto, and other documents in connection therewith, with the Securities and Exchange Commission, granting unto said attorneys-in-fact and agents, and each of them, full power and authority to do and perform each and every act and thing requisite and necessary to be done in connection therewith and about the premises, as fully to all intents and purposes as he might or could do in person, hereby ratifying and confirming all that said attorneys-in-fact and agents, or any of them, or their or his or her substitute or substitutes, may lawfully do or cause to be done by virtue hereof.
Pursuant to the requirements of the Securities Act of 1933, this registration statement has been signed by the following persons in the capacities and on the dates indicated:
| Dated November 25, 2014 | By: | /s/ Conrad Winkler | ||||
| Name: | Conrad Winkler | |||||
| Title: | Director, President & Chief Executive Officer |
| Dated November 25, 2014 | By: | /s/ Glenda Minor | ||||
| Name: | Glenda Minor | |||||
| Title: | Director, Senior Vice President & Chief Financial Officer | |||||
| Authorized representative in the United States of America | ||||||
| EVRAZ INC. NA | ||||||
| Dated November 25, 2014 | By: | /s/ Conrad Winkler | ||||
Name: | Conrad Winkler | |||||
Title: | Director, President, CEO | |||||
II-3
Table of Contents
EXHIBIT INDEX
Exhibit | Description of Document | |
| 1.1* | Form of Underwriting Agreement | |
| 3.1* | Articles of Association | |
| 4.1 | Form of Registration Rights Agreement | |
| 5.1† | Form of Opinion of Skadden, Arps, Slate, Meagher & Flom (UK) LLP | |
| 10.1 | Credit Agreement, dated as of December 23, 2011, by and among EVRAZ Inc. NA, EVRAZ Inc. NA Canada, Canadian National Steel Corporation, EVRAZ Claymont Steel, Inc., Colorado and Wyoming Railway Company, CF&I Steel, L.P., Camrose Pipe Corporation, OSM Distribution, Inc., Oregon Steel Mills Processing Inc. and New CF&I, Inc., as the Borrowers, and General Electric Capital Corporation, Bank of America, N.A., UBS Securities LLC, and the other financial institutions party hereto, as lenders | |
| 10.2† | Loan Contract No. KGOK—EICA-03, dated October 13, 2014, between EVRAZ Inc. NA Canada and JSC EVRAZ Kachkanarsky Ore Mining and Processing Plant | |
| 10.3† | Offtake Contract between East Metals AG and Evraz Inc., NA, dated August 21, 2014 | |
| 10.4† | Offtake Contract between East Metals AG and Evraz Trade NA LLC, dated August 21, 2014 | |
| 10.5 | First Amendment to Credit Agreement, by and among EVRAZ Inc. NA, the other Borrowers and Credit Partners signatory hereto, General Electric Capital Corporation, for itself as Lender, and as Agent for Lenders, and the other Lenders signatory hereto, dated December 21, 2012 | |
| 10.6 | Second Amendment to Credit Agreement, by and among EVRAZ Inc. NA, the other Borrowers and Credit Parties signatory hereto, General Electric Capital Corporation, for itself as a Lender, and as Agent for Lenders, and the other Lenders signatory hereto, dated as of November 7, 2014 | |
| 10.7 | Addendum No. 1, dated November 5, 2014, to Loan Contract No. KGOK/EICA-03, dated October 13, 2014, between EVRAZ Inc. NA Canada and JSC EVRAZ Kachkanarsky Ore Mining and Processing Plant | |
| 21.1† | Subsidiaries of the Registrant | |
| 23.1 | Consent of Ernst & Young LLP, independent registered public accounting firm | |
| 23.2† | Consent of Skadden, Arps, Slate, Meagher & Flom (UK) LLP (included in Exhibit 5.1) | |
| 24.1 | Powers of Attorney (included on the signature page in Part II of this registration statement) | |
| * | To be filed by amendment. |
| † | Previously filed |
II-4