WHATWEDO International Game Technology PLC is the global leader in gaming. We deliver entertaining and responsible gaming experiences for players across all channels and regulated segments, from Gaming Machines and Lotteries to Sports Betting and Digital. WHAT WEARE FOCUSED ON Leveraging a wealth of compelling content, substantial investment in innovation, player insights, operational expertise, and leading-edge technology, our solutions deliver unrivaled gaming experiences that engage players and drive growth. We have a well-established local presence and relationships with governments and regulators in more than 100 countries around the world and create value by adhering to the highest standards of service, integrity, and responsibility. Registered Address: Marble Arch House Second Floor 66 Seymour Street London W1H sBT Company No. 09127533 You can access the latest information and read this report on IGT's website www.IGT.com.
CONTENTS CEO STATEMENT 1. STRATEGIC REPORT 4 6 8 21 29 30 36 36 39 51 63 71 76 76 140 BUSINESS OVERVIEW KEY PERFORMANCE INDICATORS FUTURE STRATEGY PRINCIPAL RISKS AND UNCERTAINTIES 2. REMUNERATION REPORT ANNUAL STATEMENT BY THE COMPENSATION COMMITTEE CHAIRMAN REMUNERATION IMPLEMENTATION REPORT REMUNERATION POLICY 3. DIRECTORS' REPORT 4. INDEPENDENT AUDITORS' REPORT 5. FINANCIAL STATEMENTS INDEX TO CONSOLIDATED FINANCIAL STATEMENTS INDEX TO PARENT FINANCIAL STATEMENTS Annual Report and Accounts 2019 Page | 3
other potential opportunities as Brazil further opens regulated gaming. Additionally, we signed a new facilities management contract in Slovakia and extended our private management agreement with the Barbados Lottery license holders. IGT also won the International Gaming Awards’ Lottery Product of the Year for our GameTouch™ 20 self-service vending machine that was made specifically for big-box retailers. CEO STATEMENT In Italy, we launched Simbolotto, which in combination with the continued success of 10eLotto, contributed to increased wagers. IGT is leading the lottery industry through new retailer experiences, player convenience, and gameplay mechanics that attract new players, and we anticipate these trends to continue. Record Growth in Global Gaming Our global gaming business saw record level growth of more than 20% in gaming product sales. The growth was driven by a 29% increase in global unit shipments, including a 35% increase in replacement unit shipments. Dear Stakeholder, I am pleased to report that we had a strong finish to 2019 achieving $1.7 billion in adjusted EBITDA at the high end of our outlook and generating strong operating cash flow of $1.2 billion. These results were led by our North America Gaming and Italy segments. Additionally, global lottery same-store revenues and wagers also grew. We sustained our leadership in the global gaming industry by delivering gaming experiences that engage players and drive growth for customers. In North America, we achieved the highest average selling price in 12 years, based on the quality of our games and the broad acceptance of our Crystal series cabinets. Game titles including Fortune Coin™, Griffin’s Throne™, and Scarab™ fueled replacement unit shipments by 13% for its third consecutive year of growth. Lottery Expansion and Innovation Channel expansion and innovation were integral factors for driving same-store revenue growth for our Lottery operations in 2019. Outside of Italy, same-store revenue for instants and draw-games grew by 4.5%, marking the sixth consecutive year of at least mid-single digit growth. Our North America systems business also had a strong year with eight IGT Advantage® installations, including the highest-profile casino opening in 2019. We also replaced an incumbent provider in six of the other seven Advantage deployments. Internationally, replacement unit shipments rose 63% largely due to Sweden video lottery terminals and replacement sales to commercial gaming customers. Games such as Guardian of the Rose™ and Dragonsphere™ on the Crystal series cabinets drove much of this growth. In North America, we successfully launched a new state lottery in Mississippi less than 90 days after winning both the instant ticket and online lottery services contracts. We also signed key facilities management and product sale contracts in Oregon, as well as contract extensions in states such as Kentucky, Minnesota, Colorado, and Kansas. Our new Cobalt™ 27 cabinet was introduced in the third quarter and made good progress in Latin America and Eastern Europe. The cabinet represents the next evolution of IGT’s hardware solutions, appealing to customers who want to increase performance and diversify their gaming floors. In our International segment, we were awarded the significant 15-year Brazilian LOTEX license as part of a 50-50 joint venture. This is a greenfield opportunity that we expect to become one of the world’s largest instant games markets. It’s an important window into Annual Report and Accounts 2019 Italy’s gaming machine performance was resilient in 2019 considering the profit impact of higher gaming Page | 4
machine taxes that went into effect. Total operating income, excluding the impact of foreign currency translation, in Italy was higher than the prior year. Diversity & Inclusion In 2019, IGT’s Office of Diversity and Inclusion continued to broaden its efforts by establishing four regional advisory councils, tasked with implementing action plans reflecting the culture and business dynamics of each region. These councils are in Italy; Latin America and Caribbean; Europe, Middle East, and Africa; and Asia Pacific. New Diversity and Inclusion Groups (DIGs) were also launched, bringing the number of DIGs to five, with a total of 10 chapters. More than 750 employees now belong to one or more of the DIGs that support women, military veterans, people with disabilities, people over 50 years old, and the LGBTQ community. We expect to continue leveraging popular game themes with proven game mechanics, including multi-link progressives. Sports Betting Expansion in U.S. Our North America sports betting operations had a very good 2019. In the first full year of legalized sports betting in the U.S., we established ourselves as one of the leading B2B sports betting platform providers for land-based and online operators. IGT was also recognized within the gaming industry for our leadership in diversity and inclusion, having won the Pride of Gaming award from CasinoBeats and the Diverse and Inclusive Team of the Year at the 2019 Women in Gaming Diversity Awards. IGT’s PlaySports sports betting platform went live with customers in six new states, bringing our presence to 11 jurisdictions. We are currently powering retail sports betting in over two dozen land-based gaming venues across the U.S., as well as seven jurisdictions through online and mobile sports betting. In addition, the CrystalBetting Terminal made its debut in Mississippi, allowing for players to have a VIP sports betting experience and place pre-match and in-game wagers. Looking Ahead Our 2019 results confirm the vitality of IGT’s business and demonstrate the advantage of having a diverse mix of business across products and geographies. 2020 has seen a major shift in our attention as the coronavirus (COVID-19) emerged as a global pandemic in the first quarter. The evolution of the pandemic and correlated governmental restrictions to contain the virus have had a significant impact on the business trend since mid-March. We responded quickly with a focus on the safety and well-being of our people, our customers and communities all over the world. We implemented robust business continuity plans and took swift actions on our cost structure and other measures to preserve liquidity in the current environment. These actions, in addition to the resilient nature of many aspects of our business and innovative solutions we have in our portfolio today put us in a good position to emerge from the pandemic as a stronger, leaner and more competitive organization. I want to thank our people for the remarkable job they are doing in responding to the pandemic and our customers for their continued partnership as we work together during this difficult time. I wish you all continued health and well-being. We continue to build upon the strategic sports betting partnerships we have made thus far and look forward to adding new relationships as more states regulate sports betting. Our Commitment to Corporate Social Responsibility Our corporate social responsibility goal is to create value for all stakeholders. We are focused on supporting the global gaming industry, our community, and the world. In 2019, we strengthened our commitment to responsible gaming by successfully achieving responsible gaming accreditation for our PlayDigital operations from the Global Gambling Guidance Group (G4) for our PlayDigital operations. This accreditation made IGT the first gaming supplier to be certified by G4 for both digital and gaming segments. Additionally, we received an improved ESG rating of AA from MSCI Inc, affirming IGT as a leader among 19 listed casino and gaming companies. We strive to enrich and strengthen the communities in which we operate. We launched our first-ever Global Book Drive where employees donated gently used books that were then given to local non-profit youth organizations. Participation in our employee charitable programs also continued to increase. Marco Sala Chief Executive Officer Annual Report and Accounts 2019 Page | 5
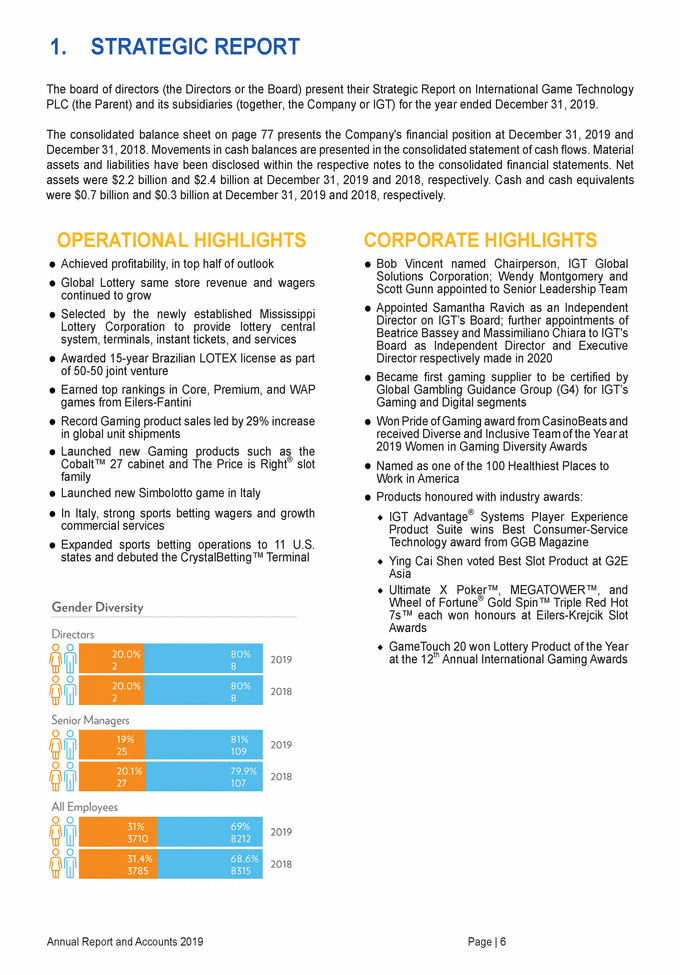
1. STRATEGIC REPORT The board of directors (the Directors or the Board) present their Strategic Report on International Game Technology PLC (the Parent) and its subsidiaries (together, the Company or IGT) for the year ended December 31, 2019. The consolidated balance sheet on page 77 presents the Company's financial position at December 31, 2019 and December 31, 2018. Movements in cash balances are presented in the consolidated statement of cash flows. Material assets and liabilities have been disclosed within the respective notes to the consolidated financial statements. Net assets were $2.2 billion and $2.4 billion at December 31, 2019 and 2018, respectively. Cash and cash equivalents were $0.7 billion and $0.3 billion at December 31, 2019 and 2018, respectively. OPERATIONAL HIGHLIGHTS Achieved profitability, in top half of outlook Global Lottery same store revenue and wagers continued to grow Selected by the newly established Mississippi Lottery Corporation to provide lottery central system, terminals, instant tickets, and services Awarded 15-year Brazilian LOTEX license as part of 50-50 joint venture Earned top rankings in Core, Premium, and WAP games from Eilers-Fantini Record Gaming product sales led by 29% increase in global unit shipments Launched new Gaming products such as the Cobalt™ 27 cabinet and The Price is Right® slot family Launched new Simbolotto game in Italy In Italy, strong sports betting wagers and growth commercial services Expanded sports betting operations to 11 U.S. states and debuted the CrystalBetting™ Terminal CORPORATE HIGHLIGHTS Bob Vincent named Chairperson, IGT Global Solutions Corporation; Wendy Montgomery and Scott Gunn appointed to Senior Leadership Team Appointed Samantha Ravich as an Independent Director on IGT’s Board; further appointments of Beatrice Bassey and Massimiliano Chiara to IGT's Board as Independent Director and Executive Director respectively made in 2020 Became first gaming supplier to be certified by Global Gambling Guidance Group (G4) for IGT’s Gaming and Digital segments Won Pride of Gaming award from CasinoBeats and received Diverse and Inclusive Team of the Year at 2019 Women in Gaming Diversity Awards Named as one of the 100 Healthiest Places to Work in America Products honoured with industry awards: IGT Advantage® Systems Player Experience Product Suite wins Best Consumer-Service Technology award from GGB Magazine Ying Cai Shen voted Best Slot Product at G2E Asia Ultimate X Poker™, MEGATOWER™, and Wheel of Fortune® Gold Spin™ Triple Red Hot 7s™ each won honours at Eilers-Krejcik Slot Awards GameTouch 20 won Lottery Product of the Year at the 12th Annual International Gaming Awards Annual Report and Accounts 2019 Page | 6
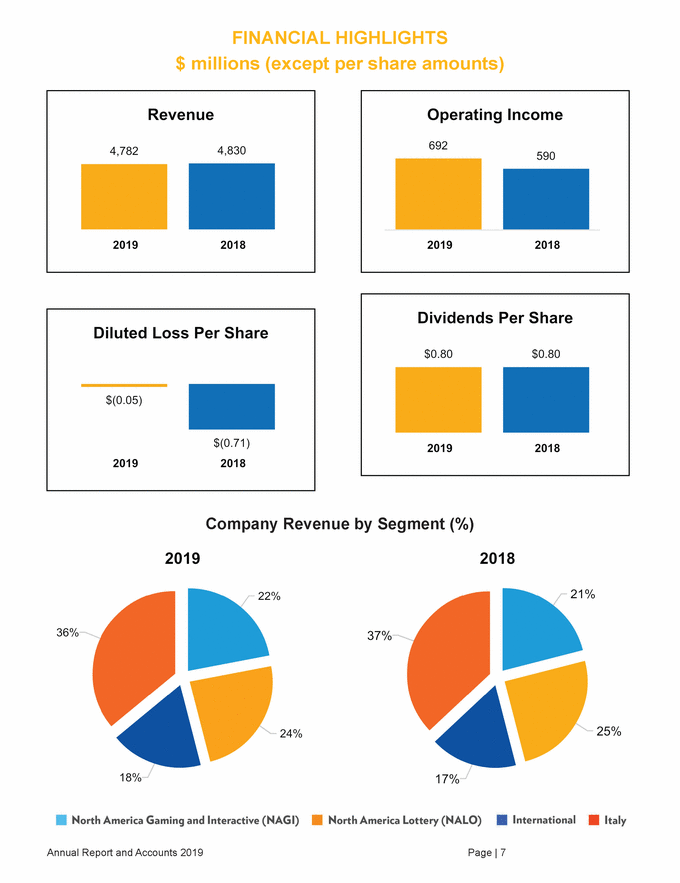
FINANCIAL HIGHLIGHTS $ millions (except per share amounts) Company Revenue by Segment (%) Annual Report and Accounts 2019 Page | 7
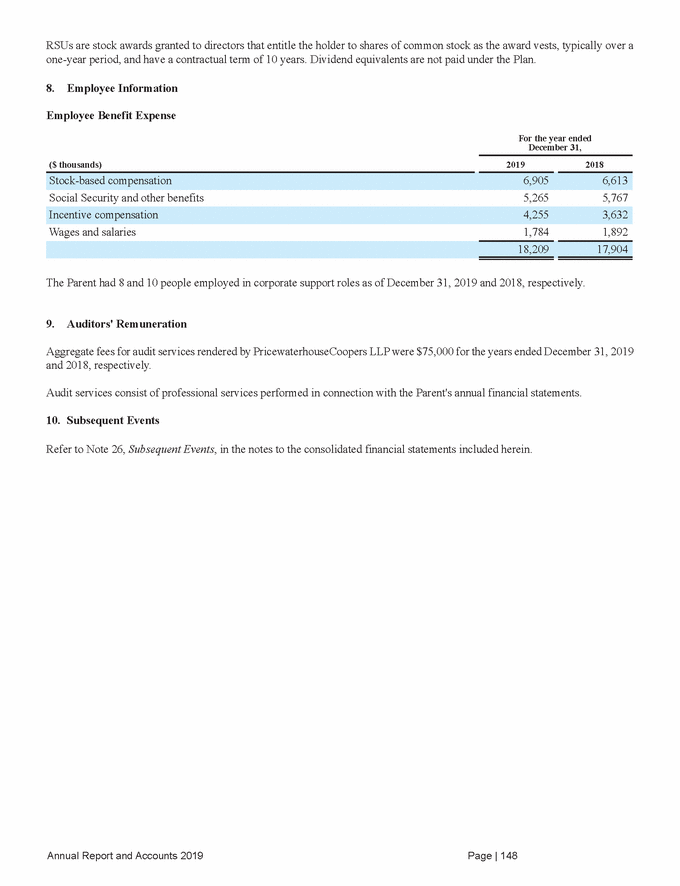
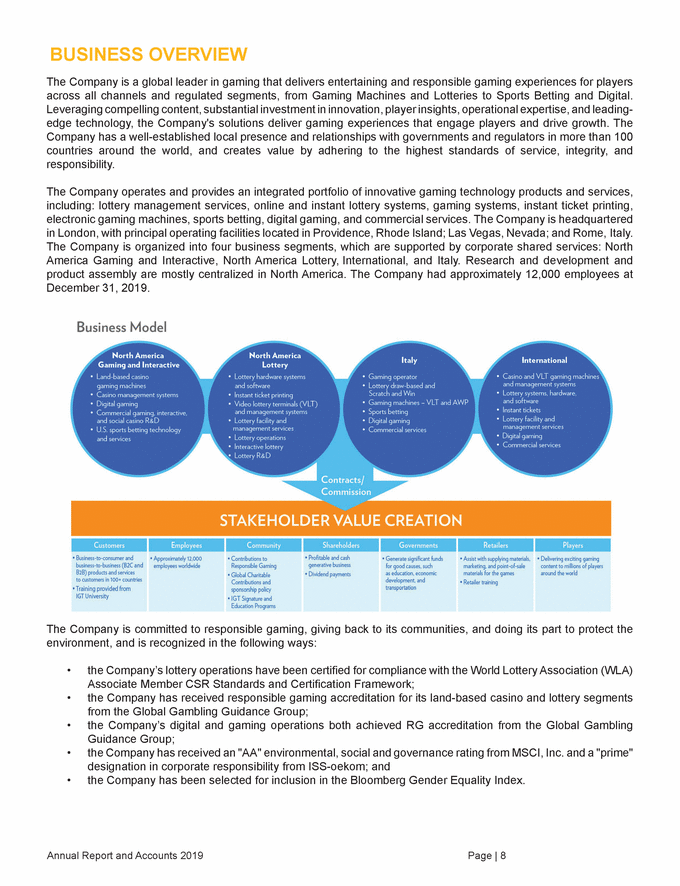
BUSINESS OVERVIEW The Company is a global leader in gaming that delivers entertaining and responsible gaming experiences for players across all channels and regulated segments, from Gaming Machines and Lotteries to Sports Betting and Digital. Leveraging compelling content, substantial investment in innovation, player insights, operational expertise, and leading-edge technology, the Company's solutions deliver gaming experiences that engage players and drive growth. The Company has a well-established local presence and relationships with governments and regulators in more than 100 countries around the world, and creates value by adhering to the highest standards of service, integrity, and responsibility. The Company operates and provides an integrated portfolio of innovative gaming technology products and services, including: lottery management services, online and instant lottery systems, gaming systems, instant ticket printing, electronic gaming machines, sports betting, digital gaming, and commercial services. The Company is headquartered in London, with principal operating facilities located in Providence, Rhode Island; Las Vegas, Nevada; and Rome, Italy. The Company is organized into four business segments, which are supported by corporate shared services: North America Gaming and Interactive, North America Lottery, International, and Italy. Research and development and product assembly are mostly centralized in North America. The Company had approximately 12,000 employees at December 31, 2019. The Company is committed to responsible gaming, giving back to its communities, and doing its part to protect the environment, and is recognized in the following ways: • the Company’s lottery operations have been certified for compliance with the World Lottery Association (WLA) Associate Member CSR Standards and Certification Framework; the Company has received responsible gaming accreditation for its land-based casino and lottery segments from the Global Gambling Guidance Group; the Company’s digital and gaming operations both achieved RG accreditation from the Global Gambling Guidance Group; the Company has received an "AA" environmental, social and governance rating from MSCI, Inc. and a "prime" designation in corporate responsibility from ISS-oekom; and the Company has been selected for inclusion in the Bloomberg Gender Equality Index. • • • • Annual Report and Accounts 2019 Page | 8
The Company has five broad categories of products and services: (1) Lottery, (2) Machine Gaming, (3) Sports Betting, (4) Digital, and (5) Commercial Services. LOTTERY The Company supplies a unique set of lottery solutions to more than 100 customers worldwide, including to 37 of the 46 U.S. lotteries through its NALO segment. Lottery customers frequently designate their revenues for particular purposes, such as education, economic development, conservation, transportation, programs for senior citizens and veterans, health care, sports facilities, capital construction projects, cultural activities, tax relief, and others. Many governments have become increasingly dependent on their lotteries as revenues from lottery ticket sales are often a significant source of funding for these programs. Lottery products and services are provided through the NALO, International, and Italy business segments. Lottery services are provided through operating contracts, facilities management contracts (FMCs), lottery management agreements (LMAs), and product sales contracts. In the majority of jurisdictions, lottery authorities award contracts through a competitive bidding process. Typical service contracts are five to 10 years in duration, often with multi-year extension options. After the expiration of the initial or extended contract term, a lottery authority generally may either seek to negotiate further extensions or commence a new competitive bidding process. Lottery authorities may require providers to pay an upfront fee for the right to manage their lotteries. The Company designs, sells, leases, and operates a complete suite of point-of-sale machines that are electronically linked with a centralized transaction processing system that reconciles lottery funds between the retailer and the lottery authority. The Company provides and operates highly secure, online lottery transaction processing systems that are capable of processing over 500,000 transactions per minute. The Company provides more than 450,000 point-of-sale devices to lottery customers and lotteries that it supports worldwide. The Company also produces high-quality instant ticket games and provides printing services such as instant ticket marketing plans and graphic design, programming, packaging, shipping, and delivery services. The Company has developed and continues to develop new lottery games, licenses new game brands from third parties, and installs a range of new lottery distribution devices, all of which are designed to drive responsible same-store sales growth for its customers. In connection with its delivery of lottery services, the Company actively advises its customers on growth strategies. Depending on the type of contract and the jurisdiction, the Company also provides marketing services, including retail optimization and lottery brand awareness campaigns. The Company works closely with its lottery customers and retailers to help retailers sell lottery games more effectively. These programs include product merchandising and display recommendations, a selection of appropriate lottery product mix for each location, and account reviews to plan lottery sales growth strategies. The Company leverages years of experience accumulated from being the exclusive licensee for the Italian Lotto, one of the world’s largest lotteries. This B2C expertise in Italy, which includes management of all the activities along the lottery value chain, allows the Company to better serve B2B customers in its NALO and International segments. The Company's primary competitors in the Lottery business include Camelot, Intralot, Pollard, SAZKA, Scientific Games, Sisal and Tattersalls. The primary types of lottery agreements are outlined below: Operating and Facilities Management Contracts (FMC) The majority of the Company's revenue in the Lottery business comes from operating contracts and FMCs. Since 1998, the Company has been the exclusive licensee for the Italian Lotto game (management of operations commenced in 1994). Beginning in November of 2016, the Company's exclusive license for the Italian Lotto includes partners as part of a joint venture. Lottoitalia s.r.l., a joint venture company among Lottomatica Holding S.r.l. (Lottomatica), Italian Gaming Holding a.s., Arianna 2001, and Novomatic Italia (Lottoitalia), is the exclusive manager of the Italian Lotto game. Lottoitalia is 61.5% owned by Lottomatica. The Company, through Lottoitalia, manages the activities along the lottery value chain, such as creating games, determining payouts, collecting wagers through its network, paying out prizes, managing all accounting and other back-office functions, running advertising and promotions, operating data transmission networks and processing centers, training staff, providing retailers with assistance, and supplying materials including play slips, tickets and receipts, and marketing and point-of-sale materials for the game. Since 2004, and for a term expiring in 2028, the Company also has been the exclusive licensee for the instant ticket lottery (Gratta e Vinci) through Lotterie Nazionali S.r.l., a joint venture 64.0% owned by the Parent's subsidiary Lottomatica, with the remainder directly and indirectly owned by Scientific Games Corporation and Arianna 2001. Annual Report and Accounts 2019 Page | 9
The Company’s FMCs typically require the Company to design, install, and operate the lottery system and retail terminal network for an initial term, which is typically five to 10 years. The Company’s FMCs usually contain extension options under the same or similar terms and conditions, generally ranging from one to five years. Under a typical FMC, the Company maintains ownership of the technology and equipment, and is responsible for capital investments throughout the duration of the contract, although the investments are generally concentrated during the early years. The Company provides a wide range of services to lottery customers related to the technology, equipment, and facilities such as hosting, maintenance, marketing, and other support services. The Company generally provides its lottery customers retailer terminal and communication network equipment through operating leases. In return, the Company typically receives fees based upon a percentage of the sales of draw based and/or instant ticket games. In limited instances, the Company provides instant tickets and online lottery systems and services under the same facilities management contract. As of February 24, 2020, the Company had FMCs with 24 U.S. states. As of December 31, 2019, the Company's largest FMCs in the U.S., by annual revenue, were Texas, California, New York, Florida and Michigan, and the revenue weighted-average remaining term of the Company's existing U.S. FMCs was 6.8 years (8.0 years including available extensions). Also, as of February 24, 2020, the Company operated under operating contracts or FMCs in 17 international jurisdictions, excluding Italy. Operating contracts and FMCs often require the Company to pay substantial monetary liquidated damages in the event of non-performance by the Company. The Company's revenues from operating contracts and FMCs are generally service fees paid to the Company directly from the lottery authority based on a percentage of such lottery’s wagers or ticket sales. The Company categorizes revenue from operating contracts and FMCs as service revenue from "Operating and Facilities Management Contracts" as described in Note 3, Revenue Recognition to the consolidated financial statements. Lottery Management Agreements (LMA) A portion of the Company’s revenues are derived from LMAs. Under an LMA, the Company manages, within parameters determined by the lottery customer, the core lottery functions, including the lottery systems and the majority of the day-to-day activities along the lottery value chain. This includes collecting wagers, managing accounting and other back-office functions, running advertising and promotions, operating data transmission networks and processing centers, training staff, providing retailers with assistance, and supplying materials for the games. LMAs also include a separate supply agreement, pursuant to which the Company leases certain hardware and equipment, and provides access to software and support services. The Company provides lottery management services in New Jersey as part of a joint venture and in Indiana through a wholly-owned subsidiary of the Parent. The Company's revenues from LMAs are based on achievement of contractual metrics and, with respect to the supply agreements, are based generally on a percentage of wagers. The Company categorizes revenue from LMAs as service revenue from "Lottery Management Agreements" as described in Note 3, Revenue Recognition to the consolidated financial statements. Instant Ticket Printing Contracts As an end-to-end provider of instant tickets and related services, the Company produces high-quality instant ticket games and provides ancillary printing services such as instant ticket marketing plans and graphic design, programming, packaging, shipping, and delivery services. Instant tickets are sold at numerous types of retail outlets but most successfully in grocery and convenience stores. Instant ticket contracts are priced based on a percentage of ticket sales revenues or on a price per unit basis and generally range from two to five years with extension opportunities. Government-sponsored lotteries grant printing contracts on both an exclusive and non-exclusive basis where there is typically one primary vendor and one or more secondary vendors. A primary contract permits the vendor to supply the majority of the lottery’s ticket printing needs and includes the complete production process from concept development through production and shipment. It also typically includes marketing and research support. A primary printing contract can include any or all of the following services: warehousing, distribution, telemarketing, and sales/field support. A secondary printing contract includes providing backup printing services and alternate product sources. It may or may not include a guarantee of a minimum or maximum number of games. As of February 24, 2020, the Company provided instant ticket printing products and services to 33 customers in North America and 26 customers in international jurisdictions. The Company categorizes revenue from instant ticket printing contracts, that are not part of an operator or LMA contract, as product revenue from “Systems and other Product sales” as described in Note 3, Revenue Recognition to the consolidated financial Annual Report and Accounts 2019 Page | 10
statements. The instant ticket production business is also highly competitive and subject to strong, price-based competition. Product Sales and Services Contracts Under product sales and services contracts, the Company assembles, sells, delivers, and installs turnkey lottery systems or lottery equipment, provides related services, and licenses related software. The lottery authority maintains, in most instances, responsibility for lottery operations. The Company sells additional machines and central computers to expand existing systems and/or replace existing equipment and provides ancillary maintenance and support services related to the systems, equipment sold, and software licensed. The Company categorizes revenue from product sales and services contracts on a case-by-case basis as either service or product revenue from "Other Services" or "Systems and other Product Sales", respectively," as described in Note 3, Revenue Recognition to the consolidated financial statements. MACHINE GAMING The Company designs, develops, assembles and provides cabinets, games, systems and software for customers in regulated gaming markets throughout the world under fixed fee, participation and product sales contracts. The Company holds more than 450 global gaming licenses and does business with commercial casino operators, tribal casino operators, and governmental organizations (primarily consisting of Lottery operators). Machine gaming products and services are provided through the NAGI, NALO, International, and Italy business segments. The Company’s primary global competitors in Machine Gaming are American Gaming Systems, Aristocrat, Everi, Euro Games Technology, Konami, Novomatic, and Scientific Games. Gaming Machines and Game Content The Company offers a diverse range of gaming machine cabinets from which land-based casino customers can choose to maximize functionality, flexibility, and player comfort. In addition to cabinets, the Company develops a wide range of casino games taking into account local jurisdictional requirements, market dynamics, and player preferences. The Company combines elements of maths, play mechanics, sound, art, and technological advancements with a library of entertainment licenses and a proprietary intellectual property portfolio to provide gaming products designed to provide a high degree of player appeal and entertainment. The Company offers a wide array of casino-style games in a variety of multi-line, multi-coin and multi-currency configurations. The Company's casino games typically fall into two categories: premium games and core games. Premium games include: • Wide Area Progressives - games that are linked across several casinos and/or jurisdictions and share a large common jackpot, including The Wheel of Fortune® franchise; and Multi-Level Progressives - games that are linked to a number of other games within the casino itself and offer players the opportunity to win different levels of jackpots, such as Fortune Coin™ Boost. • Core games, which include video reel, mechanical reel, and video poker, are typically sold and in some situations leased to customers. The Company produces other types of games including: • "Centrally Determined" games which are games connected to a central server that determines the game outcome; Class II games which are electronic video bingo machines that can be typically found in North American tribal casinos and certain other jurisdictions like South Africa; and Random-number-generated and live dealer electronic table games, including baccarat and roulette. • • Gaming service revenue is primarily generated through providing premium game content and cabinets on short duration leases to customers. The pricing of these arrangements is largely variable where the casino customer pays fees to Annual Report and Accounts 2019 Page | 11
the Company based on a percentage of amounts wagered, net win, or a daily fixed fee for use of the game content, cabinets, and related support services. Machine gaming product sales revenues are generated from the sales of land-based gaming machines (equipment and game content), systems, component parts (including game conversion sales), other equipment and services. The Company categorizes revenue from gaming machines as product revenue from "Gaming Machines" and revenue from game content as product revenue from "Systems and other Product Sales" as described in Note 3, Revenue Recognition to the consolidated financial statements. Video Lottery Terminals (VLT) and Amusement with Prize Machines (AWP) The Company provides VLTs, VLT central systems and VLT games worldwide. VLTs are usually connected to a central system. In addition, the Company provides AWPs and games to licensed operators in Italy and the rest of Europe. AWPs are typically low-denomination gaming machines installed in retail outlets. With respect to the Company's machine gaming licenses in Italy, the Company directly manages, and controls throughout the period of use, stand-alone AWPs, as well as VLTs that are installed in various retail outlets and linked to a central system. The Company also provides systems and machines to other machine gaming licensees, either as a product sale or with long-term, fee-based contracts where the service revenue earned is generally based on a percentage of wagers, net of applicable gaming taxes. Due to the nature of the transactions, North America Lottery and International generally categorize revenue from VLTs as product revenue from "Lottery product" or as service revenue from "Machine gaming" and Italy categorizes revenue from VLTs as service revenue from "Machine gaming" as described in Note 3, Revenue Recognition to the consolidated financial statements. Gaming Management Systems The Company offers a comprehensive range of system modules and applications for all areas of casino management. Gaming systems products include infrastructure and applications for casino management, customer relationship management, patron management, and server-based gaming. The Company's main casino management system offering is the Advantage® System, which offers solutions and modules for a wide-range of activities from accounting and payment processing to patron management and regulatory compliance. The Company's systems feature customized player messaging, tournament management, and integrated marketing and business intelligence modules that provide analytical, predictive, and management tools for maximizing casino operational effectiveness. The server-based solutions enable electronic game delivery and configuration for slot machines, as well as providing casino operators with opportunities to increase profits by enhancing the players’ experience, connecting with players interactively, and creating operational efficiencies. Service Window enables operators to market to customers more effectively by leveraging an additional piece of hardware onto existing machines for delivering in-screen messaging. The Company's systems portfolio also extends to encompass mobile solutions such as the Cardless Connect™ app, which offers a cardless, cashless loyalty solution for casino players. Mobile solutions that drive efficiencies and enable floor monitoring for operators while decreasing response time to player needs include Mobile Host, Mobile Responder, and Mobile Notifier. The Company categorizes revenue from gaming management systems as product revenue from "Systems and other Product sales" as described in Note 3, Revenue Recognition to the consolidated financial statements. SPORTS BETTING In Italy, the Company is a licensee for the operation of direct to consumer retail and internet-based sports betting. Specifically, the Company: • operates an expansive land-based B2C sports betting network through its “Better” brand on a fixed odds or pari-mutuel basis; establishes odds and assumes the risks related to fixed-odds sports contracts; collects the wagers; and makes the payouts. • • • Annual Report and Accounts 2019 Page | 12
The Company offers Italian consumers betting on sports events (including basketball, horse racing, soccer, cycling, downhill skiing, cross country skiing, tennis, sailing, and volleyball), motor sports (car and motorcycle racing), non-sports events connected with the world of entertainment, music, culture, and current affairs of primary national and international interest, as well as Virtual (computer generated) events. The Company also provides sports betting technology and management services to licensed sports betting operators in eleven states in the U.S. through both the NAGI and NALO business segments. The Company does not operate direct to consumer sports betting in the U.S. The Company offers a combination of technology and services to U.S. licensed sports book operators in each state where sports betting is legal. The offering may be different in each market in order to comply with local regulations and market conditions. The Company currently packages services in two ways: • “software as a service” solutions offering modular services hosted and maintained in each U.S. state or tribal jurisdiction where Sports Betting is legal. These solutions provide the technology requirement for companies wishing to operate for themselves land-based (retail), digital and mobile fixed odds and pari-mutuel sports wagering, including trading and risk management tools, point of sale, websites, mobile apps and player account management software; and, “turnkey” managed service solutions which combine the Company’s end-to-end sports betting management technology with a portfolio of value-added services including offer management, patron support, payments, fraud management, and other advisory functions to support operations by land-based, digital and omni-channel sports betting operators. • The Company also manufactures and sells a range of retail point of sale products for use by its sports betting customers in the U.S. which includes a variety of self-service kiosks and over the counter betting solutions. Sports betting operators who are customers of the Company in the U.S. include: FanDuel (Flutter plc), PointsBet, FoxBet (Stars Group), Delaware North and the Rhode Island Lottery. The Company’s primary competitors in the U.S. sports betting market include Scientific Games, Kambi and SBTech. The Company’s primary competitors in B2C Sports Betting in Italy are Bet365, Flutter Entertainment, Eurobet, Sisal, SNAITECH, and William Hill. The Company categorizes revenue from sports betting as service revenue from "Other services" as described in Note 3, Revenue Recognition to the consolidated financial statements. DIGITAL Digital gaming and lottery (or iGaming) enables game play via the internet for real money or for fun (social). The Company designs, assembles, and distributes a full suite of configurable products, systems, contents and services and holds more than 20 licenses that authorize the provision of digital gaming products and services worldwide. In Italy, the Company acts as both a complete internet gaming operator and mobile casino, sports betting and poker operator. The Company's digital products include poker, bingo, and online casino table and slot games with features such as single and multiplayer options with branded titles and select third-party content. The Company provides social casino content as part of a multi-year strategic partnership with DoubleU Games. The Company’s complete suite of PlayLottery solutions, services, and professional expertise allows lotteries to fully engage their players on any digital channel in regulated markets. Existing lottery game portfolios are extended to the digital channel to provide a spectrum of engaging content such as eInstant tickets. The Company’s iGaming systems and digital platforms offer customers an integrated system that provides player account management, advanced marketing and analytical capabilities, and a highly reliable and secure payment system. IGT Connect™ integrates third-party player account management systems, third-party game engines, and regulatory systems. The Company also offers a remote game server, which is a fast gateway to extensive casino and eInstant content, and digital and social gaming services that enhance player experiences and create marketing opportunities around either the Company's games or third-party games. The Company's diverse iGaming B2B customer base (more than 150 operators) includes Caesar's Entertainment, the Georgia Lottery, and William Hill, among others. Digital and social gaming products and services are provided through Annual Report and Accounts 2019 Page | 13
the NAGI, NALO, International, and Italy business segments. The Company faces competition from operators, such as 888 Holdings and bwin.party, and broad-based traditional B2B providers, such as Playtech plc and Microgaming. The Company also faces competition in the digital space from other machine gaming suppliers, such as Scientific Games. In sports betting, the Company faces competition from other specialist B2C providers such as Kambi PLC. The Company categorizes revenue from digital products as product revenue from "Systems and other Product sales" and categorizes revenue from digital services as service revenue from "Other services" as described in Note 3, Revenue Recognition to the consolidated financial statements. COMMERCIAL SERVICES The Company develops innovative technology to enable lotteries to offer commercial services over their existing lottery infrastructure or over standalone networks separate from the lottery. Leveraging its distribution network and secure transaction processing experience, the Company offers high-volume processing of commercial transactions including: prepaid cellular telephone recharges, bill payments, e-vouchers and retail-based programs, electronic tax payments, stamp duty services, prepaid card recharges, and money transfers. These services are primarily offered outside of North America. In Italy, the Company's commercial payment and eMoney services network comprises points-of-sale divided among the primary retailers of lottery products: tobacconists, bars, petrol stations, newspaper stands, and motorway restaurants. The Company categorizes revenue from commercial services as service revenue from "Other services" as described in Note 3, Revenue Recognition to the consolidated financial statements. CORPORATE SOCIAL RESPONSIBILITY APPROACH TO SUSTAINABILITY Perceptions and implications of Sustainability and Corporate Social Responsibility (CSR) have changed year after year, and they continue to evolve as social awareness and public concerns are heightened. Consequently, powerful forces of a social, political and economic nature have imposed a progressive extension of the scopes of sustainability and CSR, which are mirrored in the increasingly ambitious goals set forth worldwide by institutions and authorities. As a group operating on a global scale, IGT has embraced sustainability efforts since their introduction into the public debate. This is evident by how IGT has acknowledged the fundamental sustainability principles needed to guide its actions in the marketplace. From being a good corporate citizen to actively engaging at a local level, IGT contributes to international efforts aimed at operating in a more responsible world. IGT’s internal corporate culture is guided by a set of five values: being passionate, pioneering, responsible, authentic, and collaborative. When conducting business with local governments and organizations, IGT is committed to ensure strict adherence to the principles of lawful conduct in every jurisdiction it serves. Integrity, in terms of behaviour as well as business conduct, is the foremost prerequisite for creating value for all stakeholders. IGT has developed a solid approach to sustainability that includes key sustainability topics within the corporation’s scope of operations. IGT’s ongoing pledge to sustainable growth within the gaming industry has expanded to include the guiding principles set forth by the 2030 United Nations (UN) Agenda for Sustainable Development and its Sustainable Development Goals (SDGs). This 2030 Agenda and its 17 SDGs form an action program for people, the planet, and prosperity and was signed in September 2015 by the governments of the 193 UN member countries to meet three key objectives by 2030: end extreme poverty, fight inequality and injustice, and limit climate change. Based on its business activities and its sustainability priorities, IGT has identified the relevant SDGs with which it could contribute the most (e.g. including no poverty, good health and wellbeing, gender equality, decent work and economic growth, reduced inequalities, and climate action) and began an ongoing process to develop specific targets and initiatives that could effectively contribute to the achievement of the SDGs in the future. In addition, IGT has joined the United Nations Global Compact, the largest corporate responsibility initiative in the world for the development, implementation, and disclosure of responsible corporate policies and practices. Endorsed by chief executives, the UN Global Compact is a call to companies everywhere to voluntarily align their operations and Annual Report and Accounts 2019 Page | 14
strategies with ten universally accepted principles in the areas of human rights, labour, environment, and anti-corruption. IGT is committed to making the UN Global Compact principles part of the Company’s strategy, culture, and day-to-day operations. IGT is actively contributing to this global effort by refocusing its CSR initiatives to pursue the sustainable development goals within the Company’s scope of operations according to four strategic pillars: • • • • Valuing and protecting people; Advancing responsibility; Fostering sustainable operations; and Supporting communities. By committing to pursue the UN’s Sustainable Development Goals and voluntarily disclosing information through the annual Sustainability Report, IGT is leveraging the long-standing results of its CSR strategy to strengthen its reputation, improve customers’ confidence, and gain a competitive advantage. COMMUNITY AND RESPONSIBLE GAMING IGT is a global leader in one of the most regulated industries. With operations in more than 100 countries, there are recognizable differences related not only to laws and regulations, but also to cultural and social attitudes. Through a solid commitment to corporate social responsibility, IGT strives to be a responsible partner for local and international authorities, customers, and players in every single market and jurisdiction touched by the Company’s operations. IGT is determined to have a significant and positive impact on the communities in which the Company operates through community sponsorships and employee driven community programs. IGT has an online giving portal that allows any non-profit organisations to request funding or sponsorship. Community requests are reviewed by IGT’s Social Impact Committee (SIC) in quarterly meetings to ensure that the organization and its mission aligns with IGT’s giving priorities. IGT also created a Community Ambassador program that fosters community efforts on the local site level. It is through the Community Ambassador program that we celebrate the Pound for Pound Food Challenge, the Global Giving Week, and the Global Book Collection. With these local efforts, sites are donating or volunteering to causes within their local communities. IGT’s employee community driven programs provide employees the opportunity to give back to their local communities by giving their time, talent, or money. Being part of a community at large also means a focus on player protection and engaging with key stakeholders for a well-rounded responsible gaming program. IGT maintains close relationships with customers, gaming regulators, and researchers to further its support of player protection. IGT also works closely with advocacy groups who promote tools to prevent problem gambling, support responsible gaming organizations, and work to prevent underage gambling. IGT’s commitment to responsible gaming starts with its own people and is woven into the fabric of product development, services, programs, and policies. With nearly 12,000 employees serving customers in over 100 countries, IGT ensures that employees at all levels and responsibilities are trained to support and promote responsible gaming in their daily activities, with additional in-depth courses for employees in specific roles such as game designers and contact center associates. All products, games, systems, and portals include advanced responsible gaming tools that help safeguard players’ interests and address regulators’ concerns. The certifications awarded to IGT by the most important gaming industry associations worldwide are a testament to IGT’s commitment to responsible gaming. IGT has been the first lottery vendor to receive the World Lottery Association’s Responsible Gaming Standards for Associate Members, covering IGT’s lottery and digital operations. IGT has also been the first gaming vendor in the world to achieve responsible gaming accreditation from the Global Gambling Guidance Group (G4) for both its gaming and digital operations. These certifications require renewal on a regular basis. Therefore, IGT continuously improves its responsible gaming programming to fulfill recertification requirements and prevent what might hinder the recertification process. Annual Report and Accounts 2019 Page | 15
HUMAN RIGHTS As a global leader in the gaming industry, IGT is committed to supporting and cooperating with international institutions and authorities to promote corporate actions that advance societal goals. Joining the UN Global Compact network, IGT strengthens its commitment to human right principles, which derive from international conventions such as the International Bill of Human Rights including the United Nations Universal Declaration on Human Rights and the fundamental Conventions of the International Labor Organization (ILO). In line with Principle Three of the UN’s Global Compact, businesses should uphold the freedom of association and the effective recognition of the right to collective bargaining, IGT recognizes the value of using dialogue and negotiation to achieve positive outcomes in employment practices. The Company abides by non-discriminatory policies and procedures with respect to trade unions, union memberships, and their activities. IGT provides workers’ representatives with appropriate services to assist in the development of effective collective agreements. IGT is involved in collective bargaining in different countries and committed to accommodating specific local laws and regulations, and providing union representatives with every tool needed to perform their duties. As previously mentioned, in order to develop specific targets and initiatives to achieve the SDGs, IGT began an ongoing process that involved seven sub-working groups composed of different IGT departments. Among them were four sub-working groups focused on promoting measures to fight all forms of discrimination, guaranteeing fair and favorable working conditions, and supporting vulnerable groups’ rights. IGT has a zero-tolerance approach to modern slavery. The Company is committed to implementing and enforcing initiatives to reduce the risk of modern slavery and human rights violations in the Company businesses and its supply chain. IGT’s Code of Conduct serves as a guide to the moral, legal, and ethical standards expected of suppliers when doing business with IGT, and it sets parameters for acceptable behaviors of employees when liaising with suppliers. In 2019, IGT published also its Supplier Code of Conduct and defined criteria to distribute it to its suppliers. The Supplier Code of Conduct includes requirements related to business ethics and regulatory compliance, human rights and labor practices, environmental regulations and protection, responsible mineral sourcing, health and safety, and confidential and proprietary information. The suppliers who operate in countries characterized by weak legislation regarding the protection of human rights are required by IGT to sign a statement that they share the ethical commitments listed in the Code of Conduct. They are also subject to a screening of the compliance with human rights based on the principles expressed in the "United Nations International Bill of Rights". Responsibilities for health and safety are shared. IGT is committed to providing, maintaining and promoting a safe, healthy and productive work environment for all employees and ensuring compliance with all applicable environmental health and safety regulations. The Safe and Healthy Work Environment policy covers topics such as Workplace Violence, Illegal Drug and Alcohol Use, Tobacco Use, Fitness for Duty and also covers the actions that should be taken if someone needs to report a violation. Annual Report and Accounts 2019 Page | 16
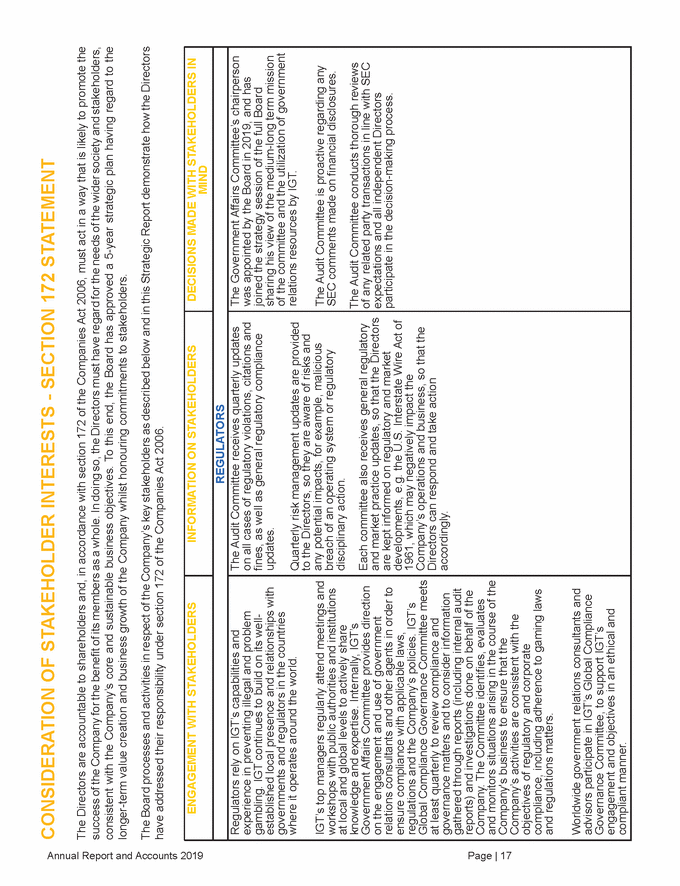
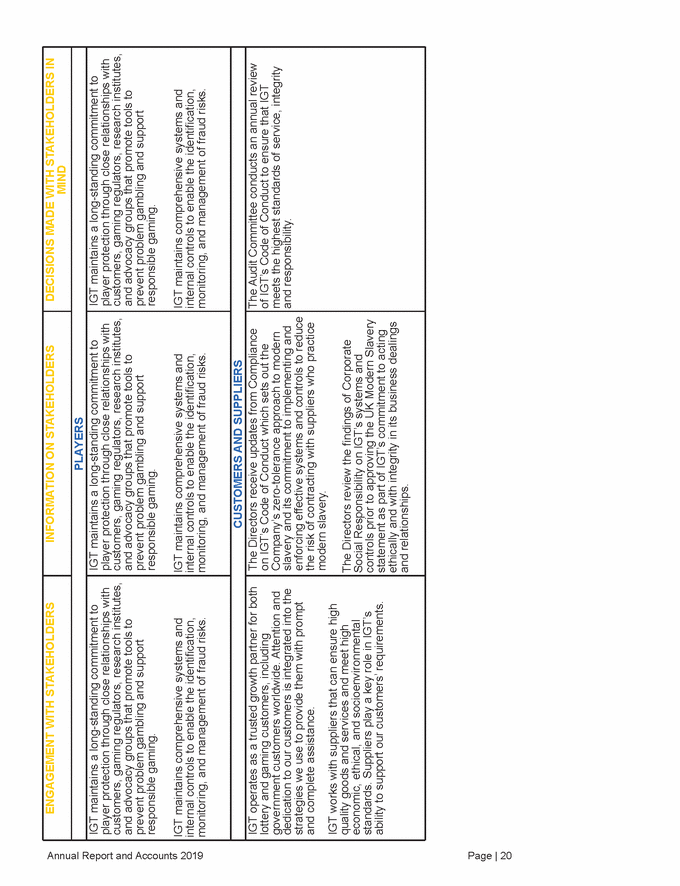
CONSIDERATION OF STAKEHOLDER INTERESTS - SECTION 172 STATEMENT The Directors are accountable to shareholders and, in accordance with section 172 of the Companies Act 2006, must act in a way that is likely to promote the success of the Company for the benefit of its members as a whole. In doing so, the Directors must have regard for the needs of the wider society and stakeholders, consistent with the Company’s core and sustainable business objectives. To this end, the Board has approved a 5-year strategic plan having regard to the longer-term value creation and business growth of the Company whilst honouring commitments to stakeholders. The Board processes and activities in respect of the Company’s key stakeholders as described below and in this Strategic Report demonstrate how the Directors have addressed their responsibility under section 172 of the Companies Act 2006. MIND was appointed by the Board in 2019, and has sharing his view of the medium-long term mission relations resources by IGT. to the Directors, so they are aware of risks and SEC comments made on financial disclosures. disciplinary action. of any related party transactions in line with SEC participate in the decision-making process. developments, e.g. the U.S. Interstate Wire Act of Company’s operations and business, so that the accordingly. Annual Report and Accounts 2019 Page | 17 ENGAGEMENT WITH STAKEHOLDERS INFORMATION ON STAKEHOLDERS DECISIONS MADE WITH STAKEHOLDERS IN REGULATORS Regulators rely on IGT’s capabilities and experience in preventing illegal and problem gambling. IGT continues to build on its well-established local presence and relationships with governments and regulators in the countries where it operates around the world. IGT’s top managers regularly attend meetings and workshops with public authorities and institutions at local and global levels to actively share knowledge and expertise. Internally, IGT’s Government Affairs Committee provides direction on the engagement and use of government relations consultants and other agents in order to ensure compliance with applicable laws, regulations and the Company’s policies. IGT’s Global Compliance Governance Committee meets at least quarterly to review compliance and governance matters and to consider information gathered through reports (including internal audit reports) and investigations done on behalf of the Company. The Committee identifies, evaluates and monitors situations arising in the course of the Company's business to ensure that the Company’s activities are consistent with the objectives of regulatory and corporate compliance, including adherence to gaming laws and regulations matters. Worldwide government relations consultants and advisors participate in IGT’s Global Compliance Governance Committee, to support IGT’s engagement and objectives in an ethical and compliant manner. The Audit Committee receives quarterly updates on all cases of regulatory violations, citations and fines, as well as general regulatory compliance updates. Quarterly risk management updates are provided any potential impacts, for example, malicious breach of an operating system or regulatory Each committee also receives general regulatory and market practice updates, so that the Directors are kept informed on regulatory and market 1961, which may negatively impact the Directors can respond and take action The Government Affairs Committee’s chairperson joined the strategy session of the full Board of the committee and the utilization of government The Audit Committee is proactive regarding any The Audit Committee conducts thorough reviews expectations and all independent Directors
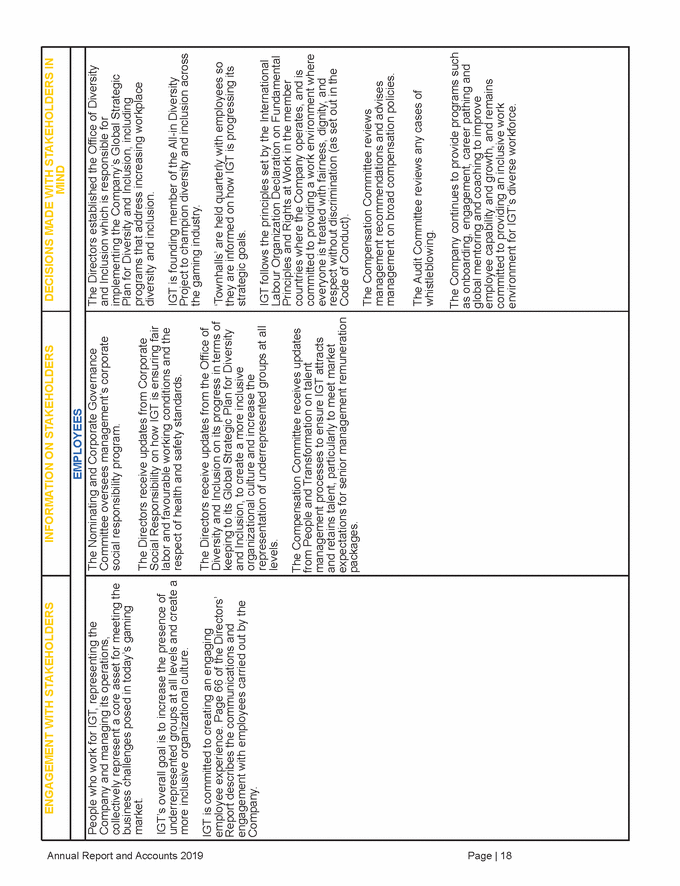
and Inclusion which is responsible for Plan for Diversity and Inclusion, including diversity and inclusion. Project to champion diversity and inclusion across they are informed on how IGT is progressing its organizational culture and increase the Labour Organization Declaration on Fundamental countries where the Company operates, and is everyone is treated with fairness, dignity, and Code of Conduct). packages. management recommendations and advises Annual Report and Accounts 2019 Page | 18 ENGAGEMENT WITH STAKEHOLDERS INFORMATION ON STAKEHOLDERS DECISIONS MADE WITH STAKEHOLDERS IN MIND EMPLOYEES People who work for IGT, representing the Company and managing its operations, collectively represent a core asset for meeting the business challenges posed in today’s gaming market. IGT’s overall goal is to increase the presence of underrepresented groups at all levels and create a more inclusive organizational culture. IGT is committed to creating an engaging employee experience. Page 66 of the Directors’ Report describes the communications and engagement with employees carried out by the Company. The Nominating and Corporate Governance Committee oversees management’s corporate social responsibility program. The Directors receive updates from Corporate Social Responsibility on how IGT is ensuring fair labor and favourable working conditions and the respect of health and safety standards. The Directors receive updates from the Office of Diversity and Inclusion on its progress in terms of keeping to its Global Strategic Plan for Diversity and Inclusion, to create a more inclusive representation of underrepresented groups at all levels. The Compensation Committee receives updates from People and Transformation on talent management processes to ensure IGT attracts and retains talent, particularly to meet market expectations for senior management remuneration The Directors established the Office of Diversity implementing the Company’s Global Strategic programs that address increasing workplace IGT is founding member of the All-in Diversity the gaming industry. ‘Townhalls’ are held quarterly with employees so strategic goals. IGT follows the principles set by the International Principles and Rights at Work in the member committed to providing a work environment where respect without discrimination (as set out in the The Compensation Committee reviews management on broad compensation policies. The Audit Committee reviews any cases of whistleblowing. The Company continues to provide programs such as onboarding, engagement, career pathing and global mentoring and coaching to improve employee capability and growth, and remains committed to providing an inclusive work environment for IGT’s diverse workforce.
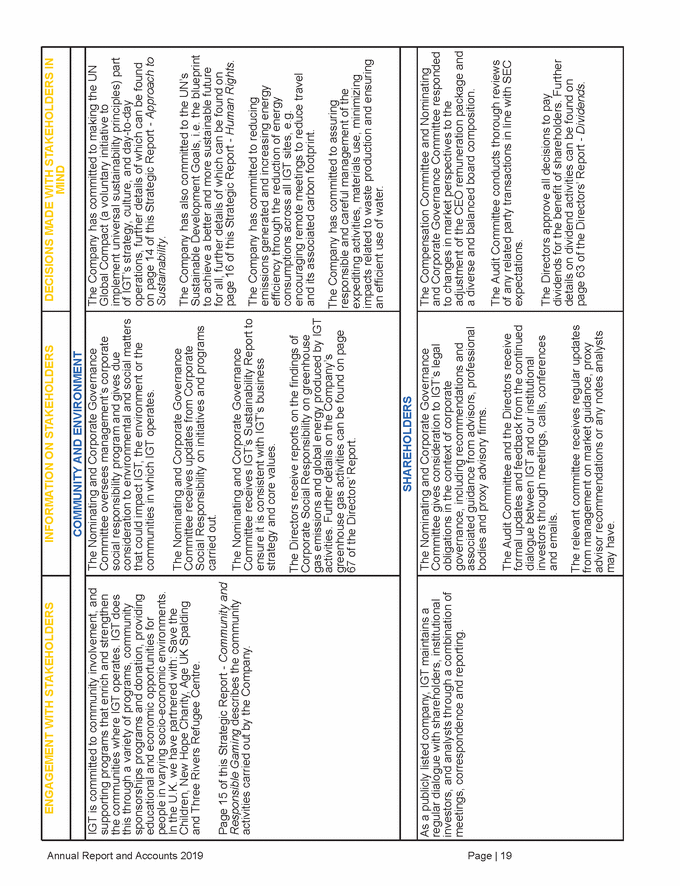
Global Compact (a voluntary initiative to of IGT’s strategy, culture, and day-to-day on page 14 of this Strategic Report - Approach to Sustainable Development Goals, i.e. the blueprint for all, further details of which can be found on The Company has committed to reducing efficiency through the reduction of energy encouraging remote meetings to reduce travel The Company has committed to assuring expediting activities, materials use, minimizing an efficient use of water. and Corporate Governance Committee responded adjustment of the CEO remuneration package and expectations. dividends for the benefit of shareholders. Further page 63 of the Directors’ Report - Dividends. Annual Report and Accounts 2019 Page | 19 ENGAGEMENT WITH STAKEHOLDERS INFORMATION ON STAKEHOLDERS DECISIONS MADE WITH STAKEHOLDERS IN MIND COMMUNITY AND ENVIRONMENT IGT is committed to community involvement, and supporting programs that enrich and strengthen the communities where IGT operates. IGT does this through a variety of programs, community sponsorships programs and donation, providing educational and economic opportunities for people in varying socio-economic environments. In the U.K. we have partnered with: Save the Children, New Hope Charity, Age UK Spalding and Three Rivers Refugee Centre. Page 15 of this Strategic Report - Community and Responsible Gaming describes the community activities carried out by the Company. The Nominating and Corporate Governance Committee oversees management’s corporate social responsibility program and gives due consideration to environmental and social matters that could impact IGT, the environment or the communities in which IGT operates. The Nominating and Corporate Governance Committee receives updates from Corporate Social Responsibility on initiatives and programs carried out. The Nominating and Corporate Governance Committee receives IGT’s Sustainability Report to ensure it is consistent with IGT’s business strategy and core values. The Directors receive reports on the findings of Corporate Social Responsibility on greenhouse gas emissions and global energy produced by IGT activities. Further details on the Company’s greenhouse gas activities can be found on page 67 of the Directors’ Report. The Company has committed to making the UN implement universal sustainability principles) part operations, further details of which can be found Sustainability. The Company has also committed to the UN’s to achieve a better and more sustainable future page 16 of this Strategic Report - Human Rights. emissions generated and increasing energy consumptions across all IGT sites, e.g. and its associated carbon footprint. responsible and careful management of the impacts related to waste production and ensuring SHAREHOLDERS As a publicly listed company, IGT maintains a regular dialogue with shareholders, institutional investors, and analysts through a combination of meetings, correspondence and reporting. The Nominating and Corporate Governance Committee gives consideration to IGT’s legal obligations in the context of corporate governance, including recommendations and associated guidance from advisors, professional bodies and proxy advisory firms. The Audit Committee and the Directors receive formal updates and feedback from the continued dialogue between IGT and our institutional investors through meetings, calls, conferences and emails. The relevant committee receives regular updates from management on market guidance, proxy advisor recommendations or any notes analysts may have. The Compensation Committee and Nominating to changes in market perspectives to the a diverse and balanced board composition. The Audit Committee conducts thorough reviews of any related party transactions in line with SEC The Directors approve all decisions to pay details on dividend activities can be found on
player protection through close relationships with and advocacy groups that promote tools to responsible gaming. internal controls to enable the identification, of IGT’s Code of Conduct to ensure that IGT and responsibility. enforcing effective systems and controls to reduce modern slavery. Social Responsibility on IGT’s systems and statement as part of IGT’s commitment to acting Annual Report and Accounts 2019 Page | 20 ENGAGEMENT WITH STAKEHOLDERS INFORMATION ON STAKEHOLDERS DECISIONS MADE WITH STAKEHOLDERS IN MIND PLAYERS IGT maintains a long-standing commitment to player protection through close relationships with customers, gaming regulators, research institutes, and advocacy groups that promote tools to prevent problem gambling and support responsible gaming. IGT maintains comprehensive systems and internal controls to enable the identification, monitoring, and management of fraud risks. IGT maintains a long-standing commitment to player protection through close relationships with customers, gaming regulators, research institutes, and advocacy groups that promote tools to prevent problem gambling and support responsible gaming. IGT maintains comprehensive systems and internal controls to enable the identification, monitoring, and management of fraud risks. IGT maintains a long-standing commitment to customers, gaming regulators, research institutes, prevent problem gambling and support IGT maintains comprehensive systems and monitoring, and management of fraud risks. CUSTOMERS AND SUPPLIERS IGT operates as a trusted growth partner for both lottery and gaming customers, including government customers worldwide. Attention and dedication to our customers is integrated into the strategies we use to provide them with prompt and complete assistance. IGT works with suppliers that can ensure high quality goods and services and meet high economic, ethical, and socioenvironmental standards. Suppliers play a key role in IGT’s ability to support our customers’ requirements. The Directors receive updates from Compliance on IGT’s Code of Conduct which sets out the Company’s zero-tolerance approach to modern slavery and its commitment to implementing and the risk of contracting with suppliers who practice The Directors review the findings of Corporate controls prior to approving the UK Modern Slavery ethically and with integrity in its business dealings and relationships. The Audit Committee conducts an annual review meets the highest standards of service, integrity
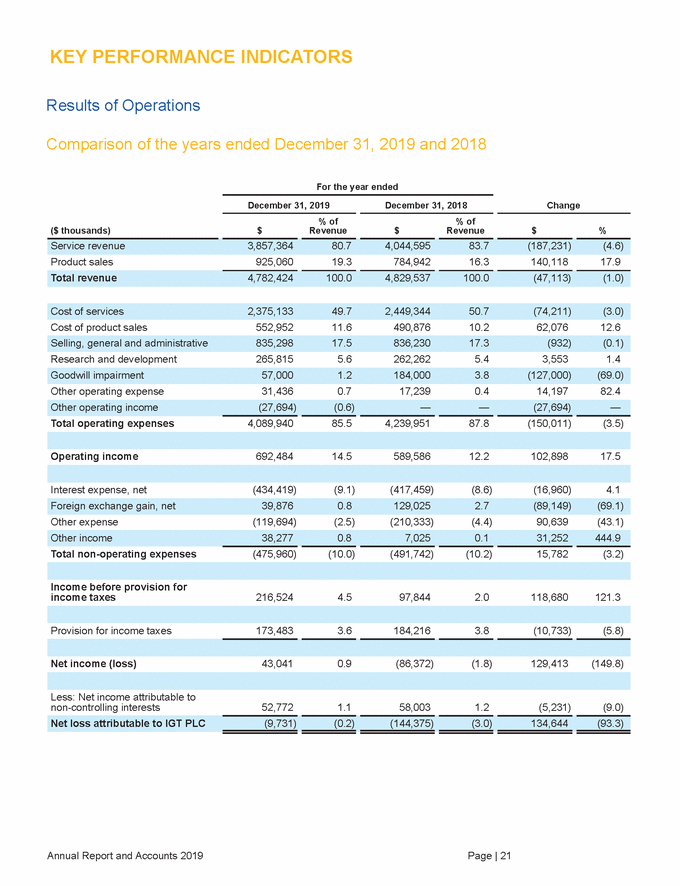
KEY PERFORMANCE INDICATORS Results of Operations Comparison of the years ended December 31, 2019 and 2018 For the year ended December 31, 2019 December 31, 2018 Change % of Revenue % of Revenue ($ thousands) $ $ $ % Product sales 925,060 19.3 784,942 16.3 140,118 17.9 Cost of product sales 552,952 11.6 490,876 10.2 62,076 12.6 Research and development 265,815 5.6 262,262 5.4 3,553 1.4 Other operating expense 31,436 0.7 17,239 0.4 14,197 82.4 Total operating expenses 4,089,940 85.5 4,239,951 87.8 (150,011) (3.5) Operating income 692,484 14.5 589,586 12.2 102,898 17.5 Interest expense, net (434,419) (9.1) (417,459) (8.6) (16,960) 4.1 Other expense (119,694) (2.5) (210,333) (4.4) 90,639 (43.1) Total non-operating expenses (475,960) (10.0) (491,742) (10.2) 15,782 (3.2) Income before provision for income taxes 216,524 4.5 97,844 2.0 118,680 121.3 Provision for income taxes 173,483 3.6 184,216 3.8 (10,733) (5.8) Net income (loss) 43,041 0.9 (86,372) (1.8) 129,413 (149.8) Less: Net income attributable to non-controlling interests 52,772 1.1 58,003 1.2 (5,231) (9.0) Annual Report and Accounts 2019 Page | 21 Net loss attributable to IGT PLC(9,731)(0.2)(144,375)(3.0)134,644(93.3) Other income38,2770.87,0250.131,252444.9 Foreign exchange gain, net39,8760.8129,0252.7(89,149)(69.1) Other operating income(27,694)(0.6)——(27,694)— Goodwill impairment57,0001.2184,0003.8(127,000)(69.0) Selling, general and administrative835,29817.5836,23017.3(932)(0.1) Cost of services2,375,13349.72,449,34450.7(74,211)(3.0) Total revenue4,782,424100.04,829,537100.0(47,113)(1.0) Service revenue3,857,36480.74,044,59583.7(187,231)(4.6)
Service revenue For the year ended December 31, Change ($ thousands) 2019 2018 $ % North America Lottery 1,072,383 1,111,069 (38,686) (3.5) Italy 1,704,687 1,812,830 (108,143) (6.0) Corporate Support — — — — 3,857,364 4,044,595 (187,231) (4.6) North America Gaming and Interactive The following table sets forth changes in service revenue in the North America Gaming and Interactive segment: For the year ended December 31, Change ($ thousands) 2019 2018 $ % Other services 212,592 204,029 8,563 4.2 The principal drivers of the decrease in service revenue for the year ended December 31, 2019 compared to the year ended December 31, 2018 were as follows: • A decrease of $13.8 million in Machine gaming, primarily driven by an 11% year-over-year reduction in the installed base units that includes the impact of a strategic agreement with a distributor in Oklahoma, partially offset by higher average yields; and An increase of $8.6 million in Other services, principally due to the expansion of the U.S. Sports Betting market and new iGaming contracts resulting in an increase of $16.2 million, partially offset by a $9.3 million decrease in social gaming. • North America Lottery The following table sets forth changes in service revenue in the North America Lottery segment: For the year ended December 31, Change ($ thousands) 2019 2018 $ % Lottery Management Agreements 108,032 129,104 (21,072) (16.3) Other services 59,984 53,645 6,339 11.8 Annual Report and Accounts 2019 Page | 22 1,072,3831,111,069(38,686)(3.5) Machine gaming97,01399,679(2,666)(2.7) Operating and Facilities Management Contracts807,354828,641(21,287)(2.6) 619,265624,476(5,211)(0.8) Machine gaming406,673420,447(13,774)(3.3) Purchase Accounting722723(1)(0.1) Operating Segments3,856,6424,043,872(187,230)(4.6) International460,307495,497(35,190)(7.1) North America Gaming and Interactive619,265624,476(5,211)(0.8)
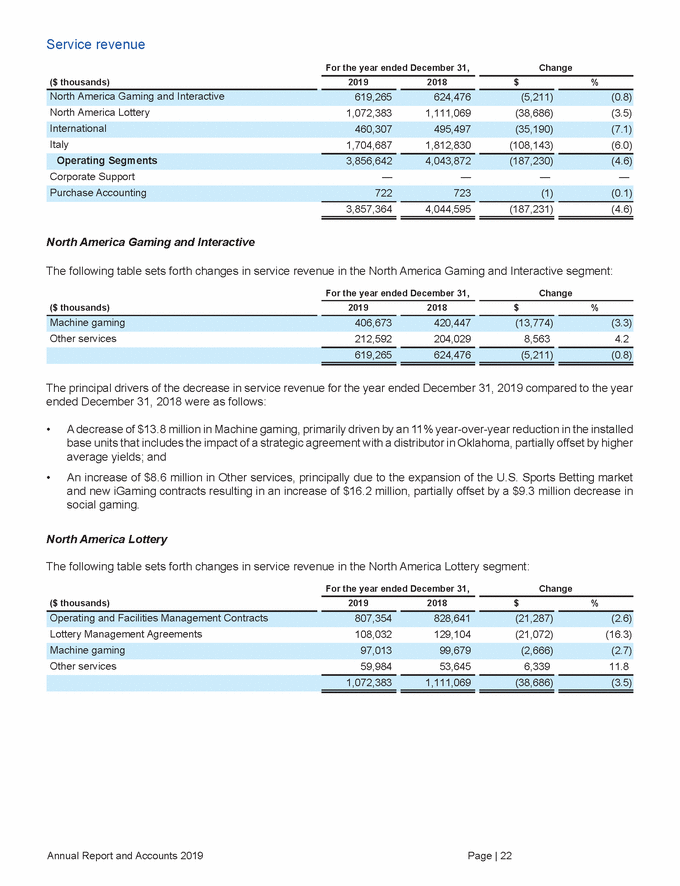
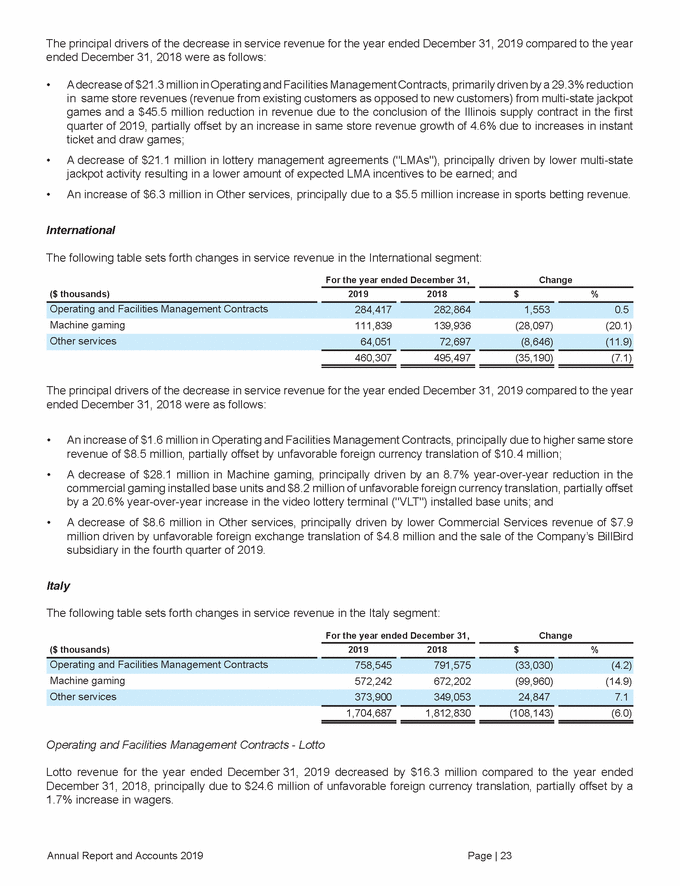
The principal drivers of the decrease in service revenue for the year ended December 31, 2019 compared to the year ended December 31, 2018 were as follows: • A decrease of $21.3 million in Operating and Facilities Management Contracts, primarily driven by a 29.3% reduction in same store revenues (revenue from existing customers as opposed to new customers) from multi-state jackpot games and a $45.5 million reduction in revenue due to the conclusion of the Illinois supply contract in the first quarter of 2019, partially offset by an increase in same store revenue growth of 4.6% due to increases in instant ticket and draw games; A decrease of $21.1 million in lottery management agreements ("LMAs"), principally driven by lower multi-state jackpot activity resulting in a lower amount of expected LMA incentives to be earned; and An increase of $6.3 million in Other services, principally due to a $5.5 million increase in sports betting revenue. • • International The following table sets forth changes in service revenue in the International segment: For the year ended December 31, Change ($ thousands) 2019 2018 $ % Machine gaming 111,839 139,936 (28,097) (20.1) 460,307 495,497 (35,190) (7.1) The principal drivers of the decrease in service revenue for the year ended December 31, 2019 compared to the year ended December 31, 2018 were as follows: • An increase of $1.6 million in Operating and Facilities Management Contracts, principally due to higher same store revenue of $8.5 million, partially offset by unfavorable foreign currency translation of $10.4 million; A decrease of $28.1 million in Machine gaming, principally driven by an 8.7% year-over-year reduction in the commercial gaming installed base units and $8.2 million of unfavorable foreign currency translation, partially offset by a 20.6% year-over-year increase in the video lottery terminal ("VLT") installed base units; and A decrease of $8.6 million in Other services, principally driven by lower Commercial Services revenue of $7.9 million driven by unfavorable foreign exchange translation of $4.8 million and the sale of the Company’s BillBird subsidiary in the fourth quarter of 2019. • • Italy The following table sets forth changes in service revenue in the Italy segment: For the year ended December 31, Change ($ thousands) 2019 2018 $ % Machine gaming 572,242 672,202 (99,960) (14.9) 1,704,687 1,812,830 (108,143) (6.0) Operating and Facilities Management Contracts - Lotto Lotto revenue for the year ended December 31, 2019 decreased by $16.3 million compared to the year ended December 31, 2018, principally due to $24.6 million of unfavorable foreign currency translation, partially offset by a 1.7% increase in wagers. Annual Report and Accounts 2019 Page | 23 Other services373,900349,05324,8477.1 Operating and Facilities Management Contracts758,545791,575(33,030)(4.2) Other services64,05172,697(8,646)(11.9) Operating and Facilities Management Contracts284,417282,8641,5530.5
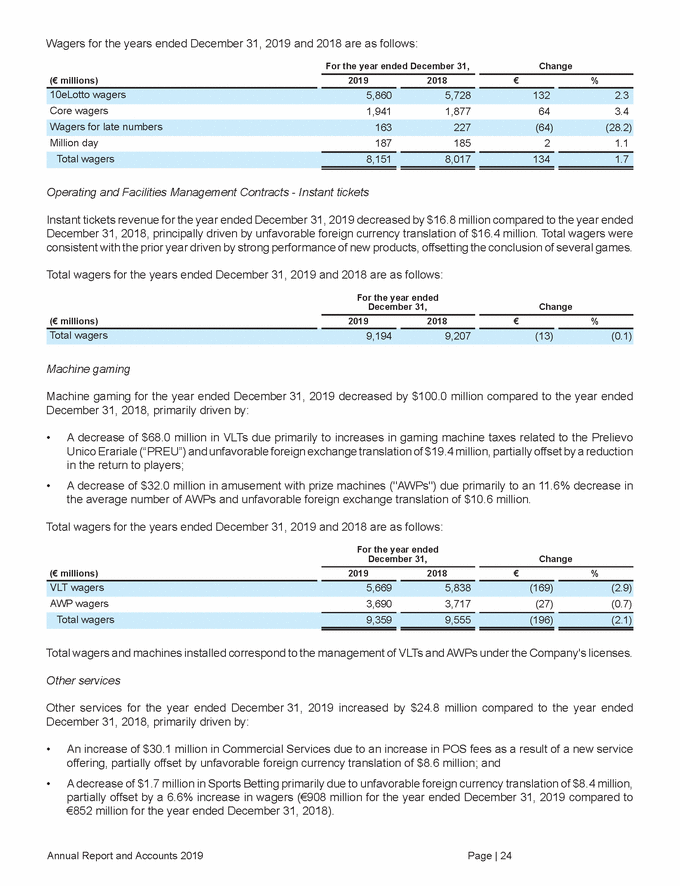
Wagers for the years ended December 31, 2019 and 2018 are as follows: For the year ended December 31, Change (€ millions) 2019 2018 € % Core wagers 1,941 1,877 64 3.4 Million day 187 185 2 1.1 Operating and Facilities Management Contracts - Instant tickets Instant tickets revenue for the year ended December 31, 2019 decreased by $16.8 million compared to the year ended December 31, 2018, principally driven by unfavorable foreign currency translation of $16.4 million. Total wagers were consistent with the prior year driven by strong performance of new products, offsetting the conclusion of several games. Total wagers for the years ended December 31, 2019 and 2018 are as follows: For the year ended December 31, Change (€ millions) 2019 2018 € % Machine gaming Machine gaming for the year ended December 31, 2019 decreased by $100.0 million compared to the year ended December 31, 2018, primarily driven by: • A decrease of $68.0 million in VLTs due primarily to increases in gaming machine taxes related to the Prelievo Unico Erariale (“PREU”) and unfavorable foreign exchange translation of $19.4 million, partially offset by a reduction in the return to players; A decrease of $32.0 million in amusement with prize machines ("AWPs") due primarily to an 11.6% decrease in the average number of AWPs and unfavorable foreign exchange translation of $10.6 million. • Total wagers for the years ended December 31, 2019 and 2018 are as follows: For the year ended December 31, Change (€ millions) 2019 2018 € % AWP wagers 3,690 3,717 (27) (0.7) Total wagers and machines installed correspond to the management of VLTs and AWPs under the Company's licenses. Other services Other services for the year ended December 31, 2019 increased by $24.8 million compared to the year ended December 31, 2018, primarily driven by: • An increase of $30.1 million in Commercial Services due to an increase in POS fees as a result of a new service offering, partially offset by unfavorable foreign currency translation of $8.6 million; and A decrease of $1.7 million in Sports Betting primarily due to unfavorable foreign currency translation of $8.4 million, partially offset by a 6.6% increase in wagers (€908 million for the year ended December 31, 2019 compared to €852 million for the year ended December 31, 2018). • Annual Report and Accounts 2019 Page | 24 Total wagers9,3599,555(196)(2.1) VLT wagers5,6695,838(169)(2.9) Total wagers9,1949,207(13)(0.1) Total wagers8,1518,0171341.7 Wagers for late numbers163227(64)(28.2) 10eLotto wagers5,8605,7281322.3
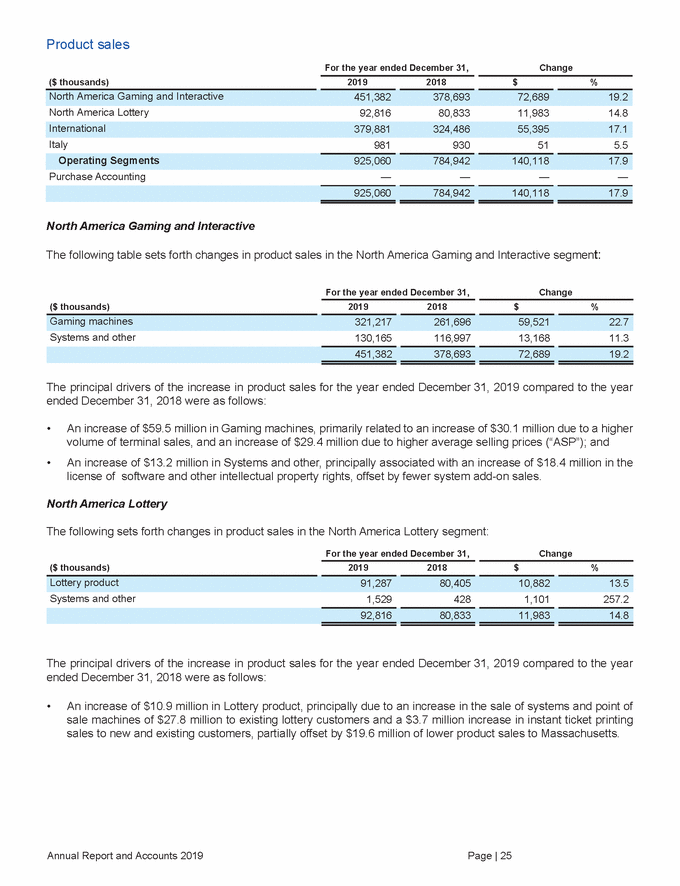
Product sales For the year ended December 31, Change ($ thousands) 2019 2018 $ % North America Lottery 92,816 80,833 11,983 14.8 Italy 981 930 51 5.5 Purchase Accounting — — — — North America Gaming and Interactive The following table sets forth changes in product sales in the North America Gaming and Interactive segment: For the year ended December 31, Change ($ thousands) 2019 2018 $ % Systems and other 130,165 116,997 13,168 11.3 The principal drivers of the increase in product sales for the year ended December 31, 2019 compared to the year ended December 31, 2018 were as follows: • An increase of $59.5 million in Gaming machines, primarily related to an increase of $30.1 million due to a higher volume of terminal sales, and an increase of $29.4 million due to higher average selling prices (“ASP”); and An increase of $13.2 million in Systems and other, principally associated with an increase of $18.4 million in the license of software and other intellectual property rights, offset by fewer system add-on sales. • North America Lottery The following sets forth changes in product sales in the North America Lottery segment: For the year ended December 31, Change ($ thousands) 2019 2018 $ % Systems and other 1,529 428 1,101 257.2 The principal drivers of the increase in product sales for the year ended December 31, 2019 compared to the year ended December 31, 2018 were as follows: • An increase of $10.9 million in Lottery product, principally due to an increase in the sale of systems and point of sale machines of $27.8 million to existing lottery customers and a $3.7 million increase in instant ticket printing sales to new and existing customers, partially offset by $19.6 million of lower product sales to Massachusetts. Annual Report and Accounts 2019 Page | 25 92,81680,83311,98314.8 Lottery product91,28780,40510,88213.5 451,382378,69372,68919.2 Gaming machines321,217261,69659,52122.7 925,060784,942140,11817.9 Operating Segments925,060784,942140,11817.9 International379,881324,48655,39517.1 North America Gaming and Interactive451,382378,69372,68919.2
International The following sets forth changes in product sales in the International segment: For the year ended December 31, Change ($ thousands) 2019 2018 $ % Gaming machines 259,424 193,092 66,332 34.4 379,881 324,486 55,395 17.1 The principal drivers of the increase in product sales for the year ended December 31, 2019 compared to the year ended December 31, 2018 were as follows: • A decrease of $27.8 million in Lottery product, primarily related to a large multi-year software license in the third quarter of 2018 that did not recur in 2019; An increase of $66.3 million in Gaming machines, principally due to approximately 4,800 additional VLTs sold, primarily in Sweden, and approximately 2,500 additional commercial gaming machines (an 18.3% increase from the year ended December 31, 2018), partially offset by higher incentives and $6.9 million of unfavorable foreign currency translation; and An increase of $16.9 million in Systems and other primarily due to $14.3 million higher gaming software licenses, partially offset by unfavorable foreign currency translation of $4.6 million. • • Operating income For the year ended December 31, Change ($ thousands) 2019 2018 $ % North America Lottery 258,528 297,836 (39,308) (13.2) Italy 519,341 540,187 (20,846) (3.9) Corporate support (235,360) (222,779) (12,581) 5.6 692,484 589,586 102,898 17.5 Operating margin for each of the Company's operating segments is as follows: For the year ended December 31, 2019 2018 North America Lottery 22.2% 25.0% Italy 30.4% 29.8% North America Gaming and Interactive Segment operating margin increased from 22.1% at year ended December 31, 2018 to 25.4% at year ended December 31, 2019, principally due to product sales margin mix and the strategic Oklahoma distributor sale, partially offset by lower operating margins derived from service revenue attributed to a reduction in the installed base. Annual Report and Accounts 2019 Page | 26 International15.2%17.5% North America Gaming and Interactive25.4%22.1% Purchase accounting(250,119)(390,708)140,589(36.0) Operating Segments1,177,9631,203,073(25,110)(2.1) International127,775143,182(15,407)(10.8) North America Gaming and Interactive272,319221,86850,45122.7 Systems and other101,95685,07116,88519.8 Lottery product18,50146,323(27,822)(60.1)
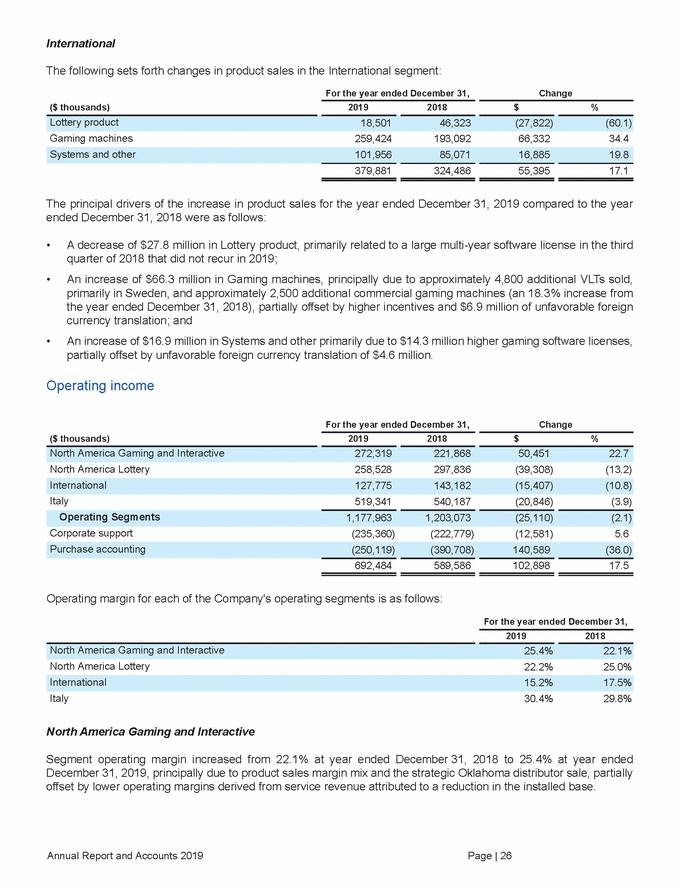
North America Lottery Segment operating margin decreased slightly from 25.0% at year ended December 31, 2018 to 22.2% at year ended December 31, 2019, principally due to a reduction in same-store revenues for the multi-state jackpot games and associated expected lower LMA incentives. International Segment operating margin decreased from 17.5% at year ended December 31, 2018 to 15.2% at year ended December 31, 2019, principally due to product sales mix and resolution of an ongoing matter in Colombia in 2019. Italy Segment operating margin increased from 29.8% at year ended December 31, 2018 to 30.4% at year ended December 31, 2019, principally due to overall business performance within Lotto, Instant Ticket, and Sports Betting. Purchase Accounting Goodwill impairments for the years ended December 31, 2019 and 2018 are recorded within Purchase accounting. In 2019, the Company incurred a $57.0 million impairment loss in the International segment as discussed in Note 12, Goodwill, to the consolidated financial statements. The Company determined that there was an impairment in the International reporting unit’s goodwill due to lower forecasted cash flows along with a higher weighted-average cost of capital. In 2018, the Company incurred a $184.0 million impairment loss in the International segment as discussed in Note 12, Goodwill, to the consolidated financial statements. The Company determined that there was an impairment in the International reporting unit’s goodwill due to the results of 2018 being lower than forecasted along with a higher weighted-average cost of capital. Liquidity The Company's total available liquidity was as follows: December 31, ($ thousands) 2019 2018 Cash and cash equivalents 662,934 250,669 The Revolving Credit Facilities due July 2024 are subject to customary covenants (including maintaining a minimum ratio of EBITDA to net interest costs and a maximum ratio of total net debt to EBITDA) and events of default, none of which are expected to impact the Company's liquidity or capital resources. At December 31, 2019, the Company was in compliance with the covenants. Cash Flow Summary The following table summarizes the statements of cash flows. For the year ended December 31, Change ($ thousands) 2019 2018 $ % Net cash used in investing activities (306,852) (515,550) 208,698 40.5 Net cash flows 430,276 (818,440) 1,248,716 (152.6) Annual Report and Accounts 2019 Page | 27 Net cash used in financing activities(433,112)(311,545)(121,567)(39.0) Net cash provided by operating activities1,170,2408,6551,161,585>200.0 Total Liquidity2,415,0591,852,637 Revolving Credit Facilities due July 20241,752,1251,601,968
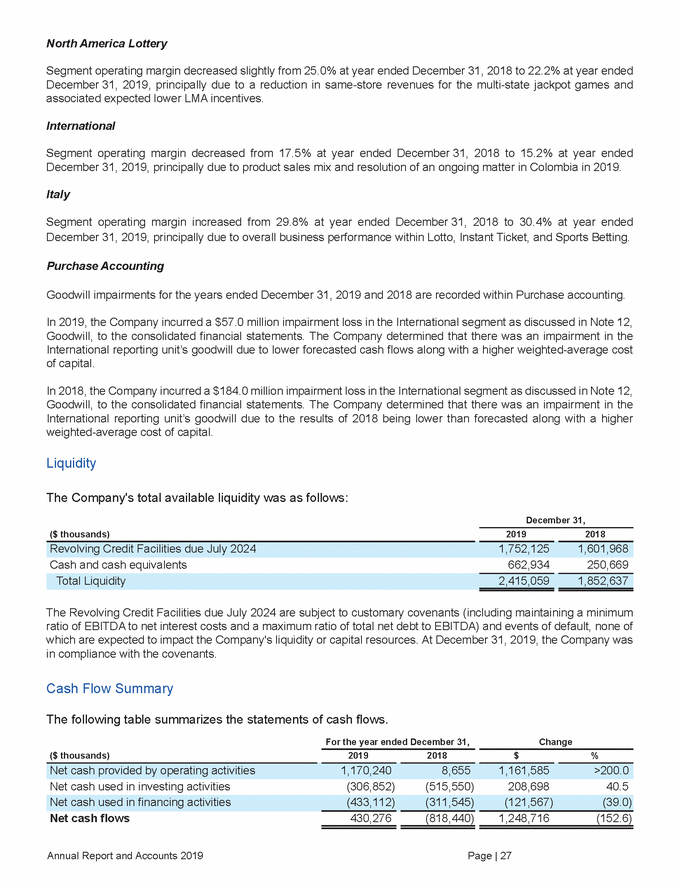
Analysis of Cash Flows Net Cash Provided by Operating Activities During the year ended December 31, 2019, the Company generated $1.170 billion of net cash from operating activities, an increase of $1.162 billion compared to the year ended December 31, 2018. The increase was principally attributed to: • • • A decrease in cash outflows of $878.1 million related to the upfront Italian license fee payments; A decrease in cash outflows of $36.7 million in accounts payable, primarily due to the timing of payments; A decrease in cash outflows of $71.9 million related to inventory, principally related to the strong product sales in the North America Gaming and Interactive and International segments during 2019 resulting in lower ending inventories; A decrease in cash outflows of $22.3 million related to interest paid; A decrease in cash outflows of $32.1 million related to contract assets and liabilities; and An increase in cash outflows of $37.5 million primarily related to non-income based taxes in the Italy segment. • • • Net Cash Used in Investing Activities During the year ended December 31, 2019, the Company used $306.9 million of net cash for investing activities, a decrease of $208.7 million compared to the year ended December 31, 2018. The decrease in net cash used in investing activities was principally attributed to: • • A reduction of $91.0 million in capital expenditures; and An increase in the proceeds from sale of assets of $104.8 million primarily related to the sale of the Company's investment in Yeonama, the sale of fixed assets as part of a strategic agreement with a distributor in Oklahoma, and the sale of the Company's BillBird subsidiary in the fourth quarter of 2019. Net Cash Used in Financing Activities Financing activities for 2019 • • • • • The Company made principal payments on long-term debt of $1.265 billion; The Company paid dividends of $163.5 million to shareholders; The Company paid $136.7 million of dividends and returned $98.8 million of capital to non-controlling shareholders; The Company received proceeds of $1.397 billion from long term debt; and The Company paid debt issuance costs of $25.9 million related to the 2019 debt issuances and certain amendments to the Euro Term Loan Facility due January 2023 and the Revolving Credit Facilities due July 2024. Financing activities for 2018 • • • The Company made principal payments on long-term debt of $1.900 billion; The Company paid dividends of $163.2 million to shareholders; The Company paid $126.9 million of dividends and returned $85.1 million of capital to non-controlling shareholders (including redeemable non-controlling shareholders); The Company received capital increases of $321.6 million from non-controlling interests related to the Scratch & Win license in Italy; and The Company received proceeds of $1.688 billion from long term debt. • • Annual Report and Accounts 2019 Page | 28
Non-financial measures Non-financial measures have a useful role alongside financial measures to inform decision making and to evaluate the Company's performance. Refer to the Directors' Report for further information on non-financial measures. FUTURE STRATEGY The Company's vision is to maintain our leading presence in the gaming industry through continued innovation, compelling product and service offerings, and excellent government and customer relationships. The Company has the resources, content, technologies, and market leading research and development capabilities to support this vision. The Company is focused on six broad strategic initiatives: • • • • • • Grow lottery worldwide; Gain gaming market share globally; Expand the PlayDigital segment and increase distribution of IGT’s content library; Protect the profitability of the Italy business segments; Fully participate in the U.S. sports betting market; and Grow profits and generate cash. North America Gaming and Interactive (NAGI) NAGI is focused on regaining its market leading position by supporting a continued turnaround in its premium recurring category, recapturing market share in the core business, and expanding into new gaming verticals and concepts. The Company will support these efforts through concentrated research and development investment, disciplined game and cabinet development, comprehensive customer engagement, and thorough exploration of player preferences. The Company is also well positioned to continue to increase its systems’ market share with the Company’s best-in-class systems agnostic software technology, and to pursue opportunities in under-served markets. North America Lottery (NALO) NALO is focused on continuing to drive same-store sales growth and to achieve growth in instant tickets by innovating game development, changing the distribution paradigm, modernising customer and retailer technology solutions, and driving customer engagement, loyalty and performance. International The International segment is focused on stabilizing its position in commercial gaming by growing its installed base, achieving market share expansion for shipped units, installing new systems, and continuing to turnaround the Australian business. The International lottery segment is focused on securing new contracts, rebids, and multiple contract extensions, thereby strengthening the business’s recurring revenue stream and further strengthening its competitive positioning for upcoming contract opportunities. Italy The Italy segment is focused on continuing to protect profitability by continuing to pursue operational efficiency and investing to reinforce long-term strategic positioning. In lottery, the segment will focus on sustaining long-term Scratch & Win growth and overall wager stability, leveraging digital, product innovation, and channel convergence, while gaming revenue and profitability will continue to be supported by new content development and a strengthened distribution network. In addition, the Italy segment will continue to see improvements in its betting and interactive performance through strengthened product offering, improved platform quality, and other enhancements. Annual Report and Accounts 2019 Page | 29
MARKET TRENDS Lottery A main driver behind lottery growth in maturing markets is same-store sales optimization, while new or under penetrated markets are more focused on driving growth in the player base. The Company anticipates that in North America, instant tickets will continue to outpace online growth through portfolio optimization and advancements in the procurement process. Digital lottery has increased current player engagement and reached new audiences, and it will continue to be a growth driver in existing regulated markets (many of which are in Europe) as well as a source of growth in newly regulated markets. Machine Gaming The North America casino market recovery is expected to continue, with Gross Gaming Revenue (GGR) forecasted to grow at a 2.2% Compound Annual Growth Rate (CAGR) over the next four years, according to H2 Gambling Capital. Machine replacement rates are expected to continue to experience low single digit growth in North America while new and expansionary opportunities are expected to achieve more stable short-term growth than in recent years. International markets are expected to benefit from ongoing appreciation in gaming replacements while new market expansion is expected to experience volatility over the next few years. Digital The expansion of the digital business is expected from new nationally regulated markets, ongoing adoption of mobile devices, and product innovation. Growth in existing regulated markets is expected to continue to come mainly from interactive betting, lottery, and casino with mobile adoption increasing engagement with existing and new players alike. PRINCIPAL RISKS AND UNCERTAINTIES The Company seeks to minimise, control, and monitor the impact of risks to profitability whilst maximizing the opportunities they present The Company acknowledges that it faces a number of risks which could impact the achievement of its strategy. While it is not possible to identify or anticipate every risk due to the changing business environment, the Company has an established risk management process to manage and mitigate risk. The Company’s process for identifying and managing risk is set by the Board, which avails of its Audit Committee. Risks are considered in terms of their impact and likelihood from both a financial and reputational perspective. Although not exhaustive, the principal risks facing the Company are essentially categorised into the following broad risk categories: • • • • Risks relating to the Company’s business and industry; Legal and compliance risks; Operational risks; and Financial and tax risks. Annual Report and Accounts 2019 Page | 30
The potential impact of these risks, and the mitigating controls in place to manage their impact, are as follows: experience. contracts. To date, we have not had to damages as a result of our non-individually or in the aggregate have a operations, our business, our financial liquidated damages in the At December 31, 2019, we bonds and letters of credit in approximately $1.173 billion. lottery industry to attract and retain new resources to developing innovative methods/systems. in a highly competitive Annual Report and Accounts 2019 Page | 31 RISK IMPACT MITIGATION Business and industry Termination of or failure to renew or extend contracts and early termination or non-renewal of government concessions. A significant portion of the Company’s business and profitability will continue to depend upon the portfolio of long-term contracts and the concessions awarded. Failure in the continued ability to retain and extend our existing contracts and win new contracts could have a materially adverse effect on the results of the Company’s operations, business, financial conditions or prospects. We maintain strong and open relationships with the regulators and operators, carefully monitoring, reviewing, and improving our customer base relationships. We have a strong history of renewing long-term important contracts, including the Italian Lotto and Scratch & Win licenses. Reductions in market discretionary consumer spending, due to general social, economic and political conditions. The global economic and political climate, and a decline in discretionary income over an extended period, may impact the Company and its operations, business, financial conditions or prospects. We constantly review our business strategy and remain closely aligned with governments and other policy makers across our markets. We also have a diverse portfolio across many regions. We implement pricing initiatives and prize payout strategies, and continue to improve our players Our Italian licenses, lottery contracts in the U.S. and in other jurisdictions, and other service contracts often require performance bonds or letters of credit to secure our performance under such contracts and require us to pay substantial monetary event of our non-performance. had outstanding performance an aggregate amount of These instruments present a potential for expense and divert financial resources from other uses. Claims on performance bonds, drawings on letters of credit, and payment of liquidated damages could material adverse effect on results of our condition, or our prospects. We strive to perform under each of our pay any substantial monetary liquidated performance. Slow growth and competition in the lottery and gaming industries, and lower cost of entry into the gaming industry due to developments in digital and internet gaming, resulting environment. Reduced demand for our products and services, increased pricing pressures on a number of our products and services, may impact the Company and its operations, business, financial conditions or prospects. We work with other participants in the players, and devote significant services, products, and distribution The U.K. exited the E.U. on January 31, 2020, which commenced a transition period through December 31, 2020, during which the trading relationship between the U.K. and the E.U. will remain the same. Ongoing uncertainty regarding the terms of trade and other arrangements between the U.K. and the E.U. following the conclusion of the transition period that may be approved, if any, and the possibility of the U.K. and the E.U. ending the transition period without any agreement in place remains. As we maintain significant operations in the E.U., Brexit could impact certain intercompany transactions and increase certain tax liabilities. Our ability to operate in Italy may be negatively impacted if Brexit does not maintain equal rights for U.K. and E.U. companies or the current Italian regulatory framework is modified as a result of Brexit. There could be further political and economic uncertainty in the U.K. and the E.U. that may impact our global operations. We continue to monitor Brexit and its potential impacts on our results of operations, business, financial condition, or prospects. Our flexibility as a global organization enables us to timely react with structural and operational changes as may be appropriate.
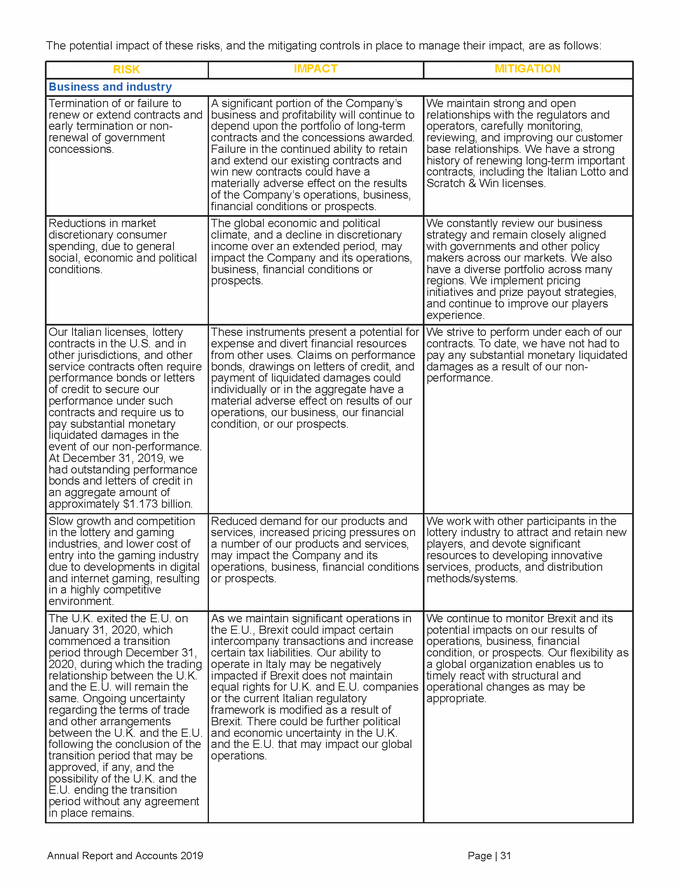
with customer and player demand. We coronavirus (COVID-19) global business, financial condition, liquidity, technology and intellectual property to such technology and intellectual trade secrets and proprietary know-how confidentiality agreements and other compete arrangements. Directors take actions that are Annual Report and Accounts 2019 Page | 32 RISK IMPACT MITIGATION The effect of the coronavirus (COVID-19) on our business, including our employees, customers, supply chain, financial markets and the markets and industries we serve. The extent, scope and duration of the coronavirus global pandemic (COVID-19) and related government actions has impacted, and may continue to impact many aspects of our business, including through workforce limitations, travel restrictions, supply chain disruptions, decreased customer demand for our products and services and decreased consumer demand for some of the products and services that we provide to our customers and, in some cases, directly to consumers. In addition, the coronavirus (COVID-19) global pandemic has resulted in a widespread health crisis that could adversely affect the economies and financial markets of many countries and regions in which we operate, resulting in an economic downturn that could affect demand for our products and services. These events could have a material adverse effect on the Company’s business, financial condition, liquidity, results of operations, or cash flows. We have implemented a cross-functional, company-wide COVID-19 response team focused on addressing the impact of the global pandemic on our employees, customers, liquidity, financial position and continuity of services. We have implemented travel restrictions, remote working and specific health and safety measures, including sanitization of workplaces for those who need to work from the office. We have also introduced a number of cost reduction initiatives, including temporary furloughs, salary reductions, other discretionary cost reductions and capital expenditure reductions; and actions to increase liquidity and flexibility with a focus on effective working capital management. Where appropriate, we have taken specific actions to bring our operations in line continue to monitor the extent of the pandemic and its impact on our results of operations, and cash flows. Intellectual property laws may afford differing and limited protection for our proprietary technology and intellectual property. Our competitors may duplicate our products, design around our patented products, or gain access to our proprietary technology and intellectual property. We vigorously protect our proprietary ensure that our competitors do not use property. We also prevent disclosure of through non-disclosure and contractual restrictions including non-At May 14, 2020, De Agostini S.p.A. (De Agostini) had an economic interest of approximately 50.51% in the Parent and, due to its election to exercise the special voting shares associated with its ordinary shares pursuant to the loyalty plan, a voting interest in the Parent of approximately 65.08% of the total voting rights. De Agostini may make decisions with which other shareholders may disagree, including, among other things, delaying, discouraging, or preventing a change of control or a potential merger, consolidation, tender offer, takeover, or other business combination and may also prevent or discourage shareholders’ initiatives aimed at changes in our management. The loyalty voting structure may limit the liquidity and adversely affect the trading prices of our ordinary shares. In line with its legal requirements, our beneficial for us and our shareholders taken as a whole and that are not prejudicial to any individual shareholder. We enforce our robust Related Persons Transactions Policy through ample of internal publicity and training, and rigorous controls implemented by our Internal Audit team. The Audit Committee conducts thorough reviews of key related party transactions, with all independent Directors participating in the decision making process and involvement from external legal and financial advisors, if necessary, the costs associated with such advisors being shared between the Company the related party in question.
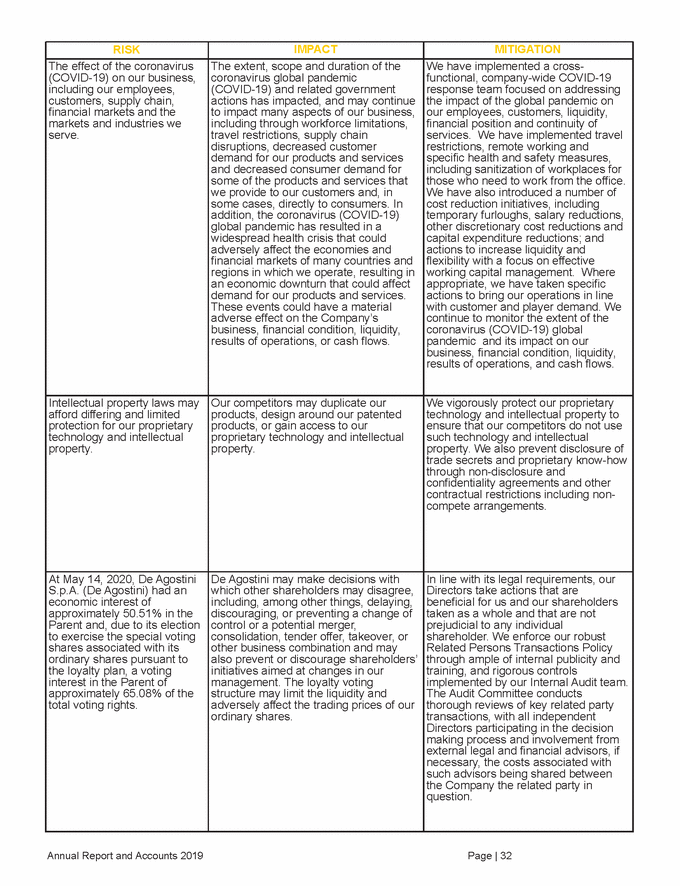
the 2019 Opinion, the development of Opinion and the DOJ's position on the us, our customers, and the industries in we conduct our business, any of which our results of operations, business, may require significant resources or sectors or locations. cross state lines, though the Opinion is unclear, the DOJ guidance on how it plans to the 2019 Opinion, and the legal challenge. succession plans for key roles. We Annual Report and Accounts 2019 Page | 33 RISK IMPACT MITIGATION Legal and Compliance The extensive and complex laws and regulations applicable to our operations. Responding to changes in or breaches of regulatory or legislative requirements. Lower than anticipated sales due to regulatory constraints could have a materially adverse effect on the results of the Company’s operations, business, financial conditions or prospects. In particular, the Italian government has recently banned gaming advertising and significantly raised gaming taxes. Any changes in the legal or regulatory framework or other changes, such as increases in the taxation of sports betting or gaming, changes in the compensation paid to licensees, or increases in the number of licenses, authorizations, or licenses awarded to the Company's competitors, could materially affect its profitability. We continuously evaluate our exposure to such types of risks for any changes in government regulations and their effect on our operations, business, financial conditions or prospects. We adjust our business strategy as necessary to remain compliant with laws and regulations and also remain profitable. On January 14, 2019, the U.S. Department of Justice (the DOJ) published an opinion reversing its previously-issued opinion that the Wire Act, which prohibits several types of wager-related communications over a "wire communications facility", was applicable only to sports betting (the 2019 Opinion). The 2019 Opinion interprets the Wire Act as applying to other forms of gambling that precise scope of the 2019 has not yet provided final enforce the Wire Act in light of 2019 Opinion is subject to If the Wire Act is broadly interpreted to prohibit activities in which we and our customers are engaged, we could be subject to investigations, criminal and civil penalties, sanctions and/or other remedial measures and/or we may be required to substantially change the way could have a material adverse effect on financial condition, or prospects, as they prevent us from operating in certain We continue to monitor and evaluate the legal challenge against the 2019 issues and the implications thereof to which we operate. Operational Failure to attract, retain, and motivate key management and employees. Our success relies on the continued service of our senior management and technical personnel, and on our ability to continue to attract, motivate, and retain highly qualified employees. We put in place and improve on our provide well-structured and competitive reward and benefit packages that ensure our ability to attract and retain the employees we need. We invest in training and career development opportunities for our people to support them in their careers.
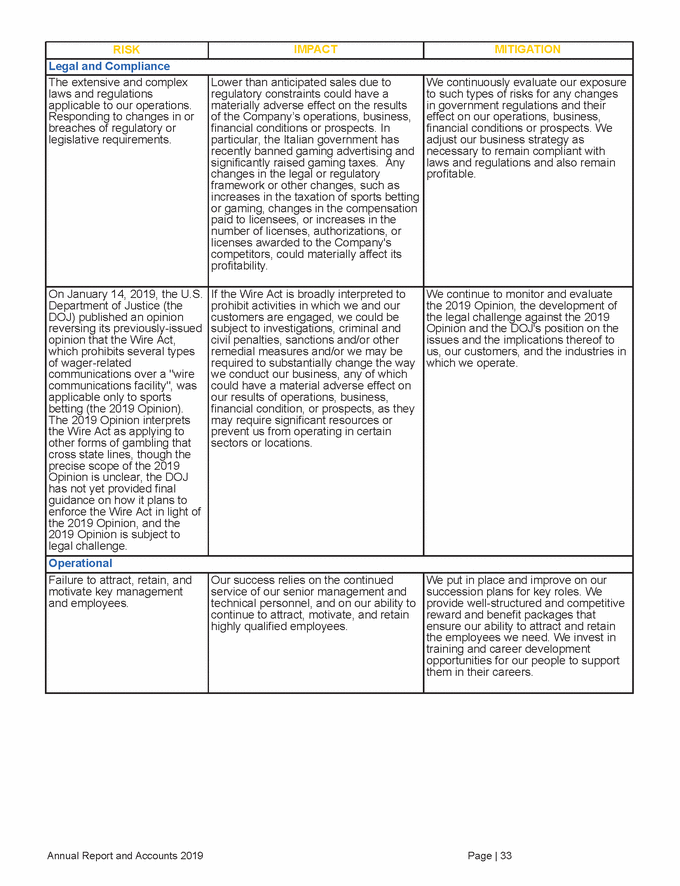
an actual or alleged defect in our customers may lose confidence in the Such a failure could have a material operations, business, financial condition attract new customers and retain existing improve network security measures and disaster recovery strategy for back policies that can mitigate losses reasonable net debt to EBITDA Annual Report and Accounts 2019 Page | 34 RISK IMPACT MITIGATION Lack of integrity of our employees, directors, and agents. The real and perceived integrity of our employees and directors is an important factor in our business dealings with lottery, gaming and other governmental agencies. An allegation or a finding of improper conduct on our part, or on the part of one or more of our current or former employees, directors or agents that is attributable to us could have a material adverse effect upon our results of operations, business, financial condition, or prospects, including its ability to retain or renew existing contracts or obtain new contracts. We strive to set exacting standards of personal integrity for our employees and directors as part of our process to maintain the highest levels of integrity in our operations and fulfil regulatory and licensing processes. We have a robust global compliance programme that requires employees to acknowledge that they understand and comply with company policies. The Audit Committee reviews the Company's procedures for its systems and controls for the prevention of corruption and bribery, including the Anti-Corruption Compliance and Ethics Policy, and receive periodic compliance reports. Lack of integrity of our products. The real and perceived integrity of our products is critical to our ability to attract customers and players. In the event of product, our existing and prospective integrity and security of our products. adverse effect upon our results of or prospects, including the ability to customers. We strive to set exacting standards of integrity and security for our products. Systems, network or telecommunications failures or cyber-attacks may disrupt the Company’s business and have an adverse effect on its results of operations. Any disruption in our network or telecommunications services, or those of third parties that we utilise in our operations, could affect the Company’s ability to operate our games or financial systems, which would result in reduced revenues and customer downtime. We continuously implement and data protection safeguards, including a office systems. We also hold insurance incurred due to cyber-attacks. Financial and Tax Covenants in the Company’s debt agreements may limit our ability to operate our business. The breach of such covenants could materially and adversely affect our business, financial conditions and results of operations as well as our ability to pay dividends. We maintain long debt maturities and leverage to help minimise our refinancing risk. We meticulously monitor and forecast the leverage ratio threshold and other financial covenant measures. Adverse changes in tax regulation and differing interpretations by authorities on taxation. Any increases in the levels of taxation or duties to which we are subject, or the implementation of any new taxes or levies to which we will be subject, could have a materially adverse effect on our business, financial conditions and results of operations. We maintain a well qualified tax department as well as good relationships with third party tax experts, helping to assess these risks and achieve compliance with the relevant tax legislation. We strive to maintain a consultative and collaborative relationship with the tax authorities.
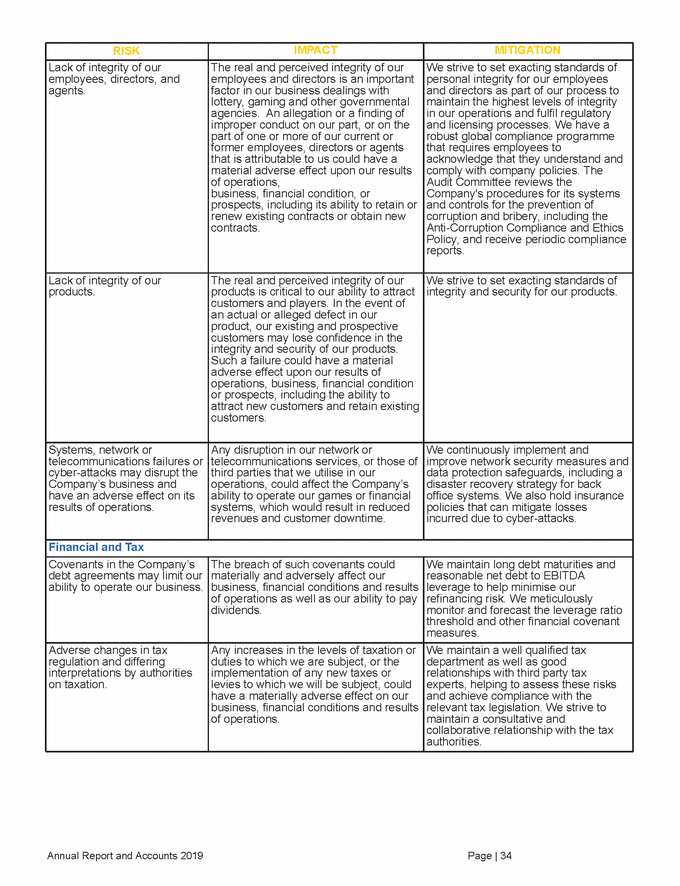
The impact of coronavirus (COVID-19) The Company is withdrawing its previous 2020 outlook due to COVID-19 uncertainty. IGT’s highest priority remains the safety and well-being of its employees, customers, and communities during this challenging time. The Company has identified about $500 million in cost savings / capital spending avoidance in 2020 to help mitigate the impact of COVID-19. These actions include temporary company-wide salary reductions, cancellation of 2020 salary increases and incentive compensation programs, furloughs, and hiring freeze, along with significant reductions in discretionary costs such as marketing, travel, and outside services. The cost savings includes over 40% reduction in planned capital expenditures for the balance of the year. Approval This Strategic Report has been approved by the Directors on May 12, 2020 and signed on its behalf on May 14, 2020. Signed on behalf of the Directors by: Marco Sala Chief Executive Officer Annual Report and Accounts 2019 Page | 35
2. REMUNERATION REPORT REMUNERATION REPORT: ANNUAL STATEMENT BY THE COMPENSATION COMMITTEE CHAIRMAN Dear Recipient, As the Chairman of the Compensation Committee (the Committee), I am pleased to present the Directors' Remuneration Report of the Parent for the financial year ended December 31, 2019 (the Remuneration Report) for which we seek your support at our forthcoming Annual General Meeting (AGM). The Remuneration Report is designed to demonstrate the link between the Company's strategy, its performance and the remuneration outcomes of our Directors and particularly those of our Executive Director and Chief Executive Officer (CEO), Marco Sala and our recently appointed Executive Director, and Executive Vice President and Chief Financial Officer (CFO), Massimiliano Chiara. We believe our current program is competitive and appropriate within the market where we primarily compete for directors and executive talent. However, we are sensitive to U.K. corporate governance practices and remuneration policies, and recognize that some aspects of our current remuneration arrangements may not be consistent with these practices and policies. One characteristic that differs from typical U.K. practice but is common and appropriately competitive within our market includes the use of non-performance based equity for compensating Non-Executive Directors; equity is a common component of Non-Executive Director remuneration within our remuneration and performance peer groups. Our remuneration arrangements also take into account the additional director responsibilities involved with service on the board of a public limited company incorporated under the laws of England and Wales, listed on the New York Stock Exchange and subject to the U.S. Securities and Exchange Commission reporting requirements, as compared with other companies that are listed and incorporated solely in the U.K. The Committee aims to balance any conflict between the two sets of guidelines. Noting the Company does not have to comply with the U.K. Corporate Governance Code, which we selectively apply to the extent consistent with the above said guidelines and reasonably expected from a company like us, the Remuneration Report has been prepared in accordance with all applicable U.K. legislation, capitalizing on corporate governance and proxy guidelines. The Committee continues to work on bringing our remuneration structures in-line with the latest proxy guidelines and with shareholder expectations, as much as possible. As a result of the global onset of coronavirus (COVID-19), we cannot be certain how broad its impact will be to our industry. The Committee continues to monitor business conditions as the situation develops, and it has become apparent that the remuneration programs for the year ending December 31, 2020 will need to be adjusted. As of March 27, 2020 the Committee has cancelled the performance-based 2020 Short-Term Incentive Plan (STIP) for all eligible employees, Annual Report and Accounts 2019 Page | 36
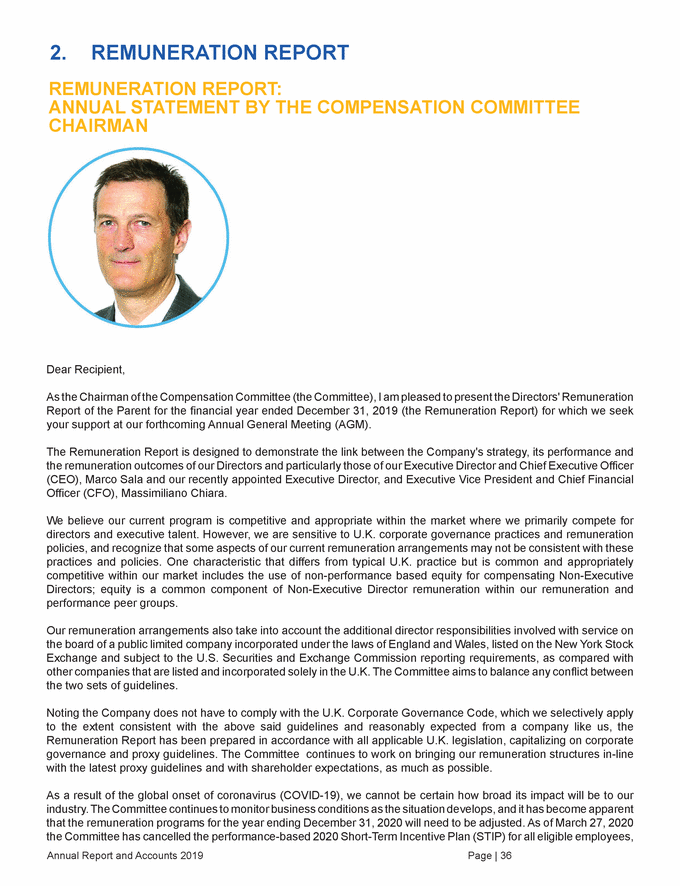
including the Executive Directors. In addition, Marco Sala and Massimiliano Chiara will receive a six-month salary reduction of 50% and 30%, respectively, effective April 1, 2020 through September 30, 2020. This salary reduction further impacts certain global leadership roles on a declining percentage of salary reduction scale for the same six-month period. Currently, the Committee has not yet determined if the 2020 Long-Term Incentive Plan (LTIP) will be offered. No remuneration changes have been implemented for Non-Executive Directors. The Remuneration Implementation Report As required by the Large and Medium-sized Companies and Groups (Accounts and Reports) (Amendment) Regulations 2013 (the Regulations), the Parent's Directors' Remuneration Implementation Report (the Remuneration Implementation Report) sets out the payments and awards made to Directors and details the link between the Parent’s performance and remuneration for the 2019 financial year and explains how the Remuneration Policy was implemented in the financial year under review. The Remuneration Implementation Report, together with this letter, is subject to an annual advisory shareholder vote at the AGM and does not affect the actual remuneration paid to an individual Director. The Remuneration Policy The Parent's Directors’ Remuneration Policy (the Remuneration Policy) was approved at last year’s AGM and took effect immediately after the end of the AGM, therefore the Parent is not seeking approval for a new policy in 2020. It is intended that the approved policy will remain in place for three years and, unless the Company wishes to change the policy, a remuneration policy will be put to shareholders for approval again no later than the Company’s annual general meeting in 2022. The full approved Remuneration Policy has been included in this Section 2 of the Annual Report and Accounts, pages 51 to 62, for ease of reference. 2019 Remuneration Highlights Below are the highlights of the remuneration-related circumstances that impacted our Directors during 2019: • Key Metrics: As set out in the Remuneration Implementation Report, the Parent performed well overall based on key metrics. Under our short-term incentive plan, the Parent exceeded its objectives for all three financial metrics, adjusted operating income, adjusted earnings before interest, income taxes, depreciation and amortization (Adjusted EBITDA) and adjusted net debt. Executive Director Remuneration: The Executive Director received a bonus, excluding tax equalization and foreign currency adjustments, equal to 247.8% of his base salary under the Parent's short-term incentive plan and 82.6% of the maximum amount of annual bonus for the financial year ended December 31, 2019. In addition, the performance metrics of the long-term performance based units were partially met and, therefore, the Executive Director’s award vested at 38.2% of the total awards granted (being 26.3% of the maximum opportunity) in accordance with its terms. • Substantial changes made to Non-Executive Directors’ Remuneration during the year There were no substantial changes to the Non-Executive Directors' remuneration during 2019 and the Compensation Committee did not exercise its discretion when awarding such remuneration. Changes to the Board Patti Hart did not stand for re-election to the Board at the 2019 AGM thus her term ended on May 17, 2019. Samantha Ravich and Beatrice Bassey were appointed to the Board on July 31, 2019 and March 20, 2020, respectively, and each received a prorated remuneration for service during the year. Further, Samantha Ravich and Beatrice Bassey received a pro-rated RSU award which is expected to vest on the date of the 2020 AGM. On April 14, 2020, Massimiliano Chiara joined the Board as an Executive Director, after having first joined the Company on April 6, 2020 as Executive Vice President and Chief Financial Officer. Annual Report and Accounts 2019 Page | 37
In conclusion The Remuneration Report, consisting of the Annual Statement by the Compensation Committee Chairman, the Remuneration Implementation Report and the Remuneration Policy, is compliant with its reporting requirements and forms part of the statutory annual report and accounts of the Parent for the year ended December 31, 2019. We welcome your feedback as we remain committed to open and transparent dialogue with shareholders and we hope to receive your support at the forthcoming AGM. Gianmario Tondato Da Ruos Chairman of the Compensation Committee Annual Report and Accounts 2019 Page | 38
REMUNERATION REPORT: REMUNERATION IMPLEMENTATION REPORT This part of the Remuneration Report has been prepared in accordance with the Regulations. The information in this section has been audited where required under the Regulations, which is indicated for the applicable sections. Executive Director's remuneration as a single figure - audited The remuneration of the Executive Director for the financial years ended December 31, 2019 and 2018 is set out below and relates to his performance of his role as the Executive Director of the Parent or in connection with the management of the affairs of any subsidiary of the Parent. The remuneration of the Non-Executive Directors is set out on page 46. Total Variable Pay Total Fixed Pay Annual Bonus(4) Salary(1) Benefits(2) Pension(3) LTIP(5) Total(6)(7) ($) 2018 1,158,372 2,152,193 1,566,661 4,877,226 3,480,191 11,129,956 14,610,147 19,487,373 (1) Marco Sala’s annual salary is $1,000,000 paid monthly, of which 70% is paid in GBP and 30% in Euros, both of which are converted using fiscal year-to-date exchange rates. In addition to base salary, the amount includes true-up payments related to foreign currency fluctuations and tax equalization, per his employment contract. In 2018, these amounts were reported on a cash basis in Benefits. Taxable benefits include the following: (2) Meals & Travel Allowances Total Taxable Benefits Housing(a) Tax(b) ($) Car Benefit Health Insurance 2018 968,804 19,290 7,530 4,425 1,152,144 2,152,193 (a) The 2018 housing benefit includes a $944,800 housing allowance payment, which is paid once every three years per Marco Sala's Italian employment agreement. (b) Represents tax equalization related to LTIP and allowances as well as tax preparation services. The $941,308 decrease in tax equalization in 2019 when compared to 2018 is primarily related to tax equalization on Marco Sala's 2018 LTIP performance and co-investment units' settlement. Pension includes base pension contributions, severance and employer social tax contributions in respect of Marco Sala's Italian service agreement. The 2018 amount has been adjusted to exclude his contributions as an offset to employer contributions, increased pension by $527,638. Marco Sala does not participate in any U.K. pension plan. Represents annual bonus earned for the annual performance periods ended 2019 and 2018, paid in 2020 and 2019, respectively. Also includes the estimated true-up payments related to foreign currency fluctuations and tax equalization, per Marco Sala's employment contract. In 2018, these amounts were reported on a cash basis in Benefits. Total LTIP is as follows: (3) (4) (5) Performance Units(a) Shares Co-Investment Units(b)(d) Co-Investment Options(c)(d) Total LTIP Shares ($) Shares ($) Shares ($) ($) 2018 89,656 921,656 250,000 7,045,400 250,000 3,162,900 589,656 11,129,956 (a) The 2019 amount represents 38.2% of target PSUs subject to the 2017 through 2019 performance period, 50% of which vested in April 2020 multiplied by $6.52, the statutory stock price on the date of vest, and 50% expected to vest in April 2021, multiplied by $14.25, the three-month average closing stock price ending December 31, 2019. The 2018 amount represents 40.2% of target PSUs subject to the 2016 through 2018 performance period, of which 50% vested in April 2019 and the remaining 50% of which vested in April 2020. The 2018 amount has been updated to reflect the number of units vested in April 2019 multiplied by $14.04, the statutory stock price on the settlement date; and updated to reflect the number of units vested in April 2020 multiplied by $6.52, the statutory stock price on the settlement date. (b) Represents units subject to the 2015 co-investment award, which were settled on May 18, 2018, multiplied by the statutory stock price on the settlement date of $28.18. (c) Represents options subject to the 2015 co-investment award, which were settled on May 18, 2018, multiplied by the difference between the vest date closing price of $28.18 and the option exercise price of $15.53. (d) Under the Co-Investment vesting rules, 50% of the award is reinvested in the plan, the amount in the single figure table above includes the value of the required reinvestment. The total adjustments to 2018 remuneration related to accrual basis and pension valuation resulted in less than $100,000 net increase in total remuneration. Total remuneration reflects all remuneration related to Marco Sala’s employment contract with the Parent, and for the avoidance of doubt, under his employment contract with Lottomatica S.p.A. which merged with and was absorbed by Lottomatica Holding S.r.l., effective December 1, 2018. (6) (7) Annual Report and Accounts 2019 Page | 39 201970,508732,226————70,508732,226 201918,62422,2079,3264,459210,836265,452 20191,277,768265,452500,3432,043,5633,797,237732,2264,529,4636,573,026
The remuneration of the Executive Director decreased $12.9 million in 2019 when compared to 2018, which is primarily due to a $10.4 million decrease in LTIP related to the settlement of the Co-Investment award, which is granted and settled once every three years, a $1.1 million decrease in employer pension contributions, a $1.0 million decrease in Marco Sala's housing allowance, which is paid once every three years, and a $0.9 million decrease in tax equalization related to LTIP awards. Performance against performance conditions for the STIP - audited Bonuses under the short term incentive plan (STIP) are earned by reference to the financial year and paid in March following the end of the financial year. The Committee reviews the performance measures and targets of the STIP annually to evaluate whether these measures remain appropriately aligned to the Parent's overall business strategy. Payment to the Executive Director under the 2019 STIP was based on both predetermined financial performance metrics, including Adjusted Consolidated Earnings Before Interest, Taxes, Depreciation and Amortization (EBITDA), Adjusted Consolidated Operating Income (OI) (excluding Purchase Price Accounting) and Adjusted Consolidated Net Debt, and individual Management by Objectives (MBOs). Target payments continue to be based on 150% of the Executive Director's salary with a maximum opportunity of 300% of base salary. The table below sets out the 2019 STIP financial metrics, actual performance and the bonuses accruing in 2019 to the Executive Director: 2019 Performance Weighting Threshold Target Maximum Payout % ($ in millions) Adjusted Consolidated OI 25% 817 898 988 160% 40.0% Adjusted Consolidated Net Debt 30% 8,004 7,809 7,614 200% 60.0% MBOs 20% 167% 33.4% Payout as % of Maximum 82.6% During financial year ended December 31, 2019, Marco Sala exceeded targets related to his individual MBOs which were weighted 37.5% on achieving specific organizational cost savings initiative targets and 37.5% achieving adjusted free cash flow targets; and met targets related to his individual MBO weighted 25.0% on achieving global succession planning for key positions, the financial targets of which the Company deems commercially sensitive. Annual Report and Accounts 2019 Page | 40 Payout as % of Target165.2% Personal Performance Measures Adjusted Consolidated EBITDA25%1,5561,7101,881127%31.8% Financial Performance Measures
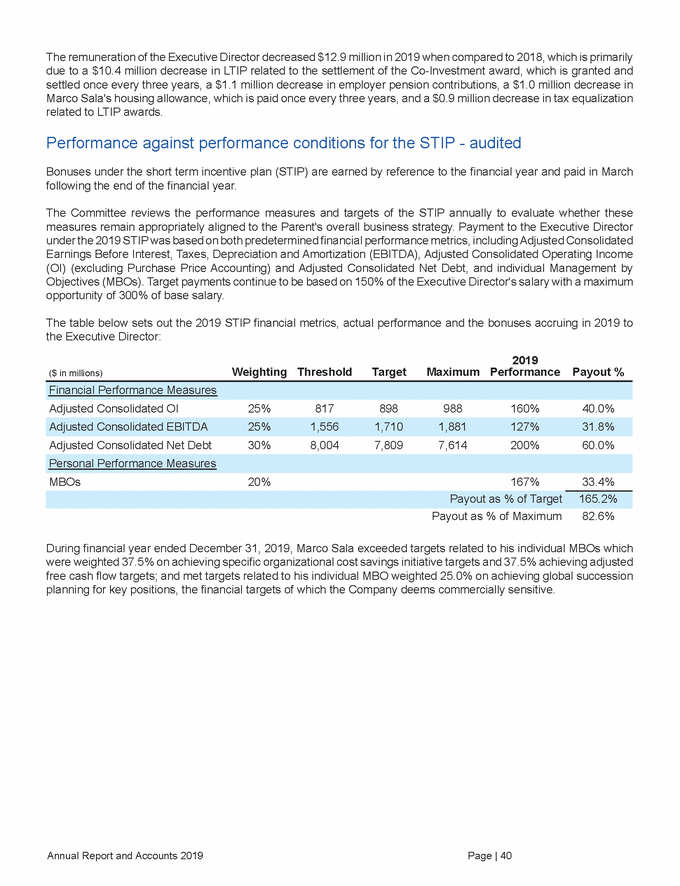
Performance against performance conditions for the LTIP vesting - audited The long term incentive plan (LTIP) amount included in the 2019 single total figure of remuneration reflects the performance share units (PSUs) granted in 2017. Vesting was dependent on performance over three financial years ending on December 31, 2019 and continued service until April 1, 2020 for 50% of the units earned and April 1, 2021 for the remaining 50% of units earned. The market price on the grant date exceeds the estimated settlement price, therefore no value has been realized related to stock price appreciation. Further, the Committee did not use discretion in determining the payout under the plan. The performance achieved against the performance targets is shown below. 2019 Performance Performance % of Target ($ in millions) Threshold Target Maximum Payout % 5,272 5,699 5,984 5,355 94% Adjusted Cumulative EBITDA 7,745 7,445 7,145 7,229 103% Adjusted Net Debt Relative TSR(1) Modifier <25th 60th >75th 38.0% 63% 75.0% Total units earned (% of maximum)(3) 26.3% (1) (2) (3) Total Shareholder Return (TSR). EBITDA/Net Debt Matrix Result payout (50.9%) multiplied by Relative TSR Percentile payout (75.0%). The maximum number of shares to be earned under the plan is 145% of target. Pensions - audited The Parent offers a group personal pension plan, under which the Parent may match the contributed percentage of base salary (between 2% and 6%) plus one percent up to a maximum of 7% for contributions at 6% or above. Marco Sala does not currently participate in the group personal pension plan. The figure in the single-figure table reflects Marco Sala's Italian pension under his service agreement with Lottomatica S.p.A. which merged with and was absorbed by Lottomatica Holding S.r.l. (Lottomatica), effective December 1, 2018. This pension fund is structured as a contribution scheme. The employee contributions rate is equal to 10.19% and the employer quota is approximately 27%. The estimated retirement date for Marco Sala is in January 2027, which, in accordance with Italian regulations, could be postponed to March 2027. As far as the contributions to the Italian integrative pension fund are concerned, Marco Sala’s contributions are levied at a rate of 3.45% on remuneration earned for his employment under the Lottomatica service agreement. Lottomatica contributes 8.55% of such remuneration. During the financial year ended December 31, 2019, there was no accrual for an Italian severance payment for Marco Sala. Interests awarded during the financial year - audited In 2019, 100% of the awards granted to the Executive Director under the Parent's LTIP were PSUs, the details of which are included in the table below: Face V Maximum Units/ Options Price on Grant Date ($) alue on Type of Award Vesting Grant Date(1) ($) (1) The face value on grant date is calculated as the maximum number of units which could be earned under the award times the Price on Grant Date. Annual Report and Accounts 2019 Page | 41 Based on 2019, 2020 and 2021 performance; PSUs under the LTIP308,744$13.864,279,19250% vesting in 2022 and remaining 50% vesting in 2023 Performance results (% of target)(2)38.2% EBITDA/Net Debt Matrix Result50.9% 2017 - 2019
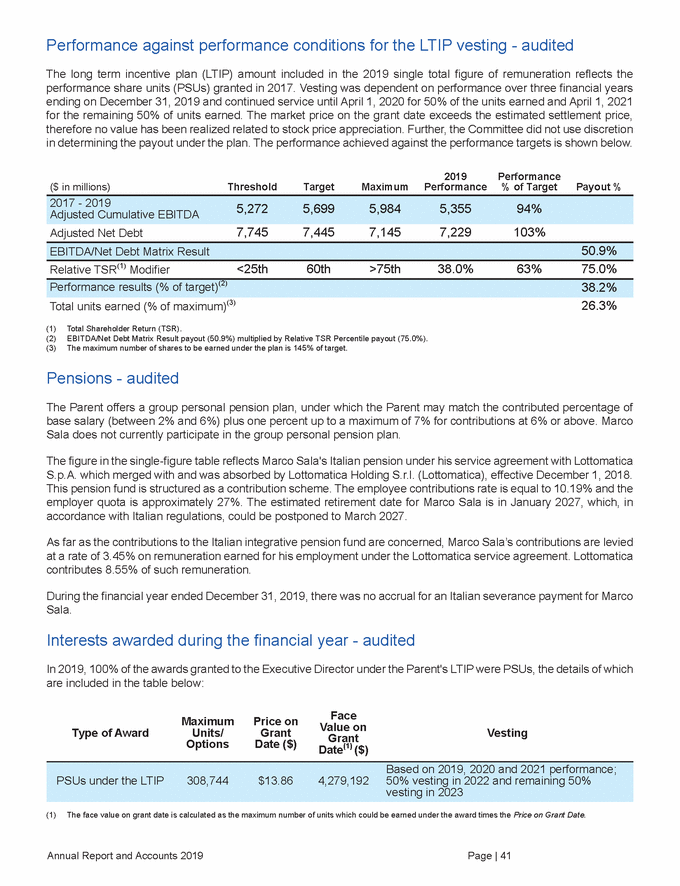
Vesting criteria of the 2019 PSUs - audited The vesting of the 2019 PSUs is tied to three performance metrics: Adjusted Net Debt Use of Cash Vesting criteria for the 2019 PSUs in 2022 and 2023 based on performance in 2019 - 2021 • • A three-year Cumulative Consolidated Adjusted EBITDA of at least 92.5% of the plan target; An Adjusted Net Debt Scoring Factor measured on an Adjusted EBITDA/Adjusted Net Debt Scoring Matrix that positively or negatively adjusts the EBITDA payout based on net debt results versus the plan target; and Relative TSR against the Russell Mid Cap Market Index. • Step 1: Adjusted EBITDA Adjusted EBITDA Target <92.5% 92.5% 100% >105% Linear interpolation will be used between the applicable Adjusted EBITDA targets set forth above. In no event will the Adjusted EBITDA Payment Factor exceed 110%. Target Adjusted EBITDA for the measurement period is adjusted for the following: foreign currency exchange differences (EUR only); U.S. GAAP accounting changes; acquisitions, divestitures and asset sales; restructuring cost in excess of the Parent’s strategic plan, from time to time, to be applied as negative adjustment to EBITDA. In addition, the Committee may make reasonable adjustments in order to preserve the incentives intent at the time of grant. Step 2: Adjusted Net Debt Scoring Factor The Adjusted Net Debt Scoring Factor is a secondary scoring criteria that positively or negatively adjusts the Adjusted EBITDA payout based upon Adjusted Net Debt results versus the plan. Adjusted Net Debt refers to net debt as reported by the Company for the relevant period and Target Net Debt for the measurement period is adjusted for the following: foreign currency exchange differences (EUR only); U.S. GAAP accounting changes; acquisitions, divestitures, asset sales, refinancing, minority capital and transaction costs; stock transactions (i.e., net settlement, buy back); timing of significant upfront contract payments; and dividends and factoring/securitization. In addition, the Committee may make reasonable adjustments in order to preserve the incentives intent at the time of grant. In no event will the Adjusted Net Debt Scoring Factor exceed 106%. Step 3: Adjusted EBITDA/Adjusted Net Debt Payment Matrix Adjusted EBITDA and Adjusted Net Debt performance are combined in a grid of outcomes: the Adjusted EBITDA and Adjusted Net Debt Payment Matrix. The Adjusted EBITDA and Adjusted Net Debt Payment Matrix is the net vesting percentage, prior to TSR adjustment, resulting from the combined Adjusted EBITDA and Adjusted Net Debt Performance, which is determined at the end of the performance period as follows: • Actual Adjusted EBITDA is divided by Target Adjusted EBITDA to determine the percent attainment versus Target; Actual Adjusted Net Debt is compared to the Target Net Debt; and These two metrics are combined in the Adjusted EBITDA and Adjusted Net Debt Payment Matrix to result in a single financial score that is used to determine the vesting percentage prior to the TSR adjustment. In no event will the Adjusted EBITDA and Adjusted Net Debt Payment factor exceed 116%. • • Annual Report and Accounts 2019 Page | 42 % Vesting-33.5%100%110% Relative TSRPerformance Against Peers Three-Year Cumulative Consolidated Adjusted EBITDAProfitability measure
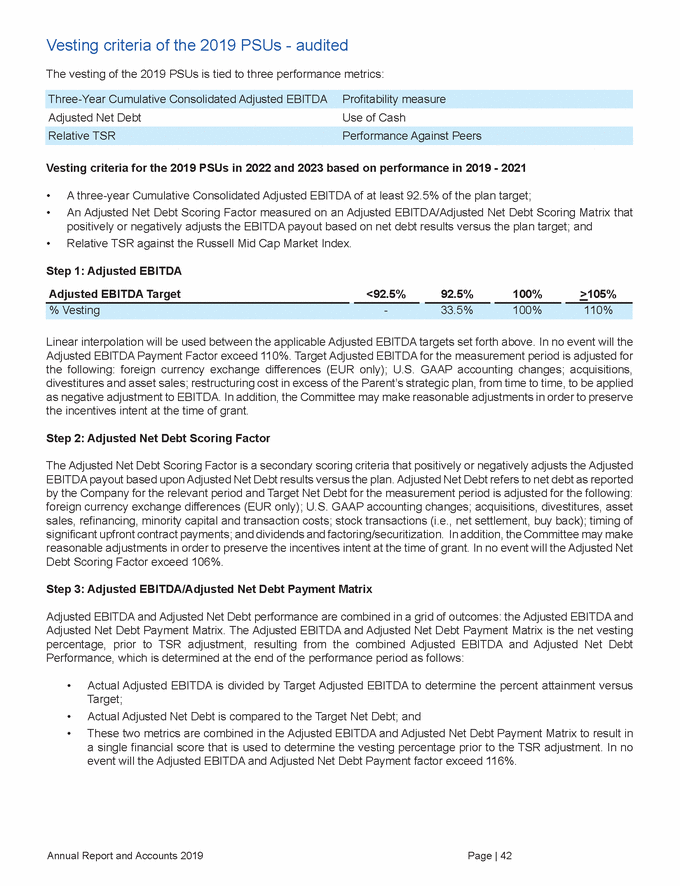
Step 4: Relative TSR Payment Factor <25th Percentile 60th Percentile >75th Percentile Relative TSR Payment Factor The Relative TSR Payment Factor is based on relative TSR for the companies included in the Russell MidCap Index as of the first day of the measurement period. After Adjusted EBITDA and Adjusted Net Debt are calculated, the TSR modifier is applied to the calculated vesting. Step 5: Performance Factor The Performance Factor is the product of the Adjusted EBITDA and Adjusted Net Debt Payment Matrix, multiplied by the Relative TSR Payment Factor. Actual vesting under the plan can range from 0% to 145% if all maximum targets are met. Statement of Executive Director's shareholding and share interests - audited Executive Director's interests in performance share awards - audited The table below sets out details of the interests of the Executive Director in performance share awards for the year ended December 31, 2019: Granted/ Performance Adjustments During the Year(1) Awards Held at January 1, 2019 Shares Vested During the Year Awards Held at December 31, 2019 Market Price at Grant Date End of Performance Period Date of Grant Vesting Date $20.63 2019 2020 & 2021 05/23/2017 184,576 (114,068) — 70,508 $30.12 2021 2021 05/15/2018 172,500 — — 172,500 (1) Prior year decreases relate to adjustments for actual performance achieved. Executive Director's interests in share options - audited The table below sets out details of the interests of the Executive Director in share options which are outstanding at December 31, 2019: Awards Awards Granted Exercised During the Year Expired End of Date of Grant Held at Held at Exercise Vesting Date Expires On During the Year During the Year Performance Period (1) January 1, 2019 December 31, 2019 Price 328,124 — — — 328,124 $20.29 2016 2017 2020 07/31/2014 172,500 — — — 172,500 $30.12 2021 2021 2024 05/15/2018 (1) The market price at grant date is equal to the exercise price of the stock option. Annual Report and Accounts 2019 Page | 43 11/30/2015250,000———250,000$15.53201720182022 07/30/2013251,329——(251,329)—$21.74201520162019 07/29/2019—212,927—212,927$13.8620212022 & 2023 05/15/2018157,084——157,084$30.1220202021 & 2022 07/26/201689,656—44,82744,829$21.1120182019 & 2020 % Vesting75%100%125%
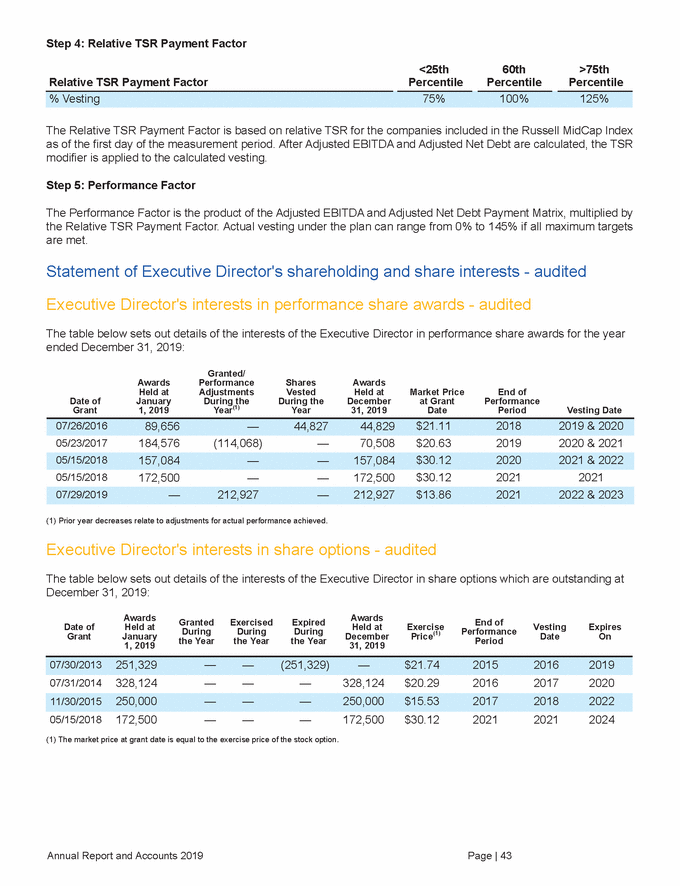
Executive Director's total share interests - audited The table below shows the Executive Director's share interests at December 31, 2019, including shares held by connected persons. Total of Outstanding Options and Shares Shares Beneficially Owned Outright(1) Performance Shares Share Option Grant (1) All shareholding ownership guideline requirements have been complied with to the extent applicable. Total remuneration of the Chief Executive Officer The table below sets out the total remuneration of the CEO for the financial years ended December 31, 2011 to 2019, inclusive. Please note that Marco Sala was CEO of the Parent from April 7, 2015 to the year ended December 31, 2019 and remains CEO as at the date of this Remuneration Report. Prior to this time, he was a director of the Parent's predecessor entities. 2018(1) ($) 2015(1) ($) 2019 ($) 2017 ($) 2016 ($) 2014 (€) 2013 (€) 2012 (€) 2011 (€) 2,043,563 4,877,226 4,861,587 2,598,463 3,139,008 1,768,256 1,727,901 1,710,893 1,626,110 Benefits STIP paid as % of maximum 83% 78% 61% 82% 75% 96% 93% 96% 85% (awards actually LTI (1) Salary and benefits include a housing allowance paid once every three years subject to his Lottomatica contract. Percentage change in the remuneration of the Chief Executive Officer The following table compares the percentage change, year over year, in Marco Sala's base salary, benefits and annual bonus, with the change in the average of those components for employees as a whole, in all jurisdictions. Category Executive Director Company Benefits(2) (88)% 11% (1) In effect, there has been no percentage change in the CEO's Salary for 2019. The 10% difference is due to foreign exchange rate fluctuations between pounds sterling, Euro and dollar figures for 2018 and 2019, payments related to foreign currency fluctuations and tax equalization. (2) The percentage change for the CEO's benefits is primarily related to $944,800 housing allowance payment in 2018, which is paid once every three years, as well as LTIP tax equalization differences. CEO Pay Ratios The average number of U.K. employees for the financial year ended December 31, 2019 was no more than 250 therefore the Company was exempt from reporting pay ratios in relation to the total remuneration of the CEO. Annual Report and Accounts 2019 Page | 44 Annual Bonus9%14% Salary(1) 10%(7)% LTIP vested as a % of maximum26%37%86%72%78%100%92%66%0% - 2008 vested in year) Salary and 657,848750,6241,408,4721,109,289
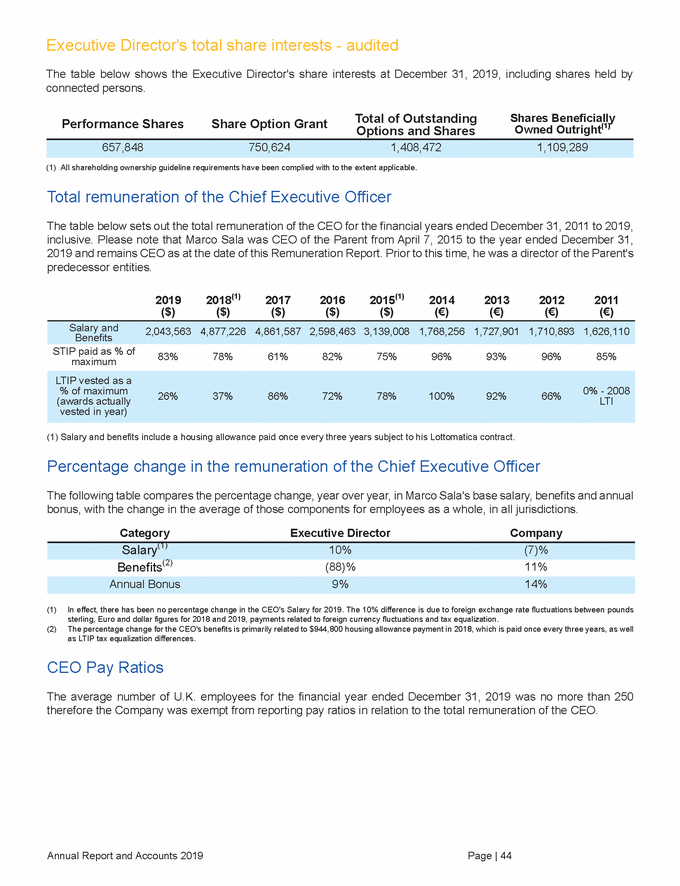
Relative importance of spend on pay The following table shows the year-on-year movement in total remuneration of all employees, compared to the level of dividends paid and declared on ordinary shares in respect of the financial years ended December 31, 2018 and 2019: (1) The total pay increased 0.5% in 2019 when compared to 2018, based on constant 2018 foreign currency rates. The Parent is not aware of any other extraordinary payments utilising cash flow or profit. Total Pay includes wages, benefits, STIP, LTIP, and training and other personnel costs. Total Pay in 2019 is calculated at the prior year's foreign exchange rate to 2018 actual Total Pay. Dividends increased 0.2% in 2019 when compared to 2018. There were no share buy-backs for the financial years ended December 31, 2019 and 2018. (2) (3) Total shareholder return performance graph The chart below shows the TSR index for the Company as against the Russell Mid-Cap Index. The Company considers it appropriate to benchmark its performance to the Russell Mid-Cap Index due to the Company's nature and size. Annual Report and Accounts 2019 Page | 45
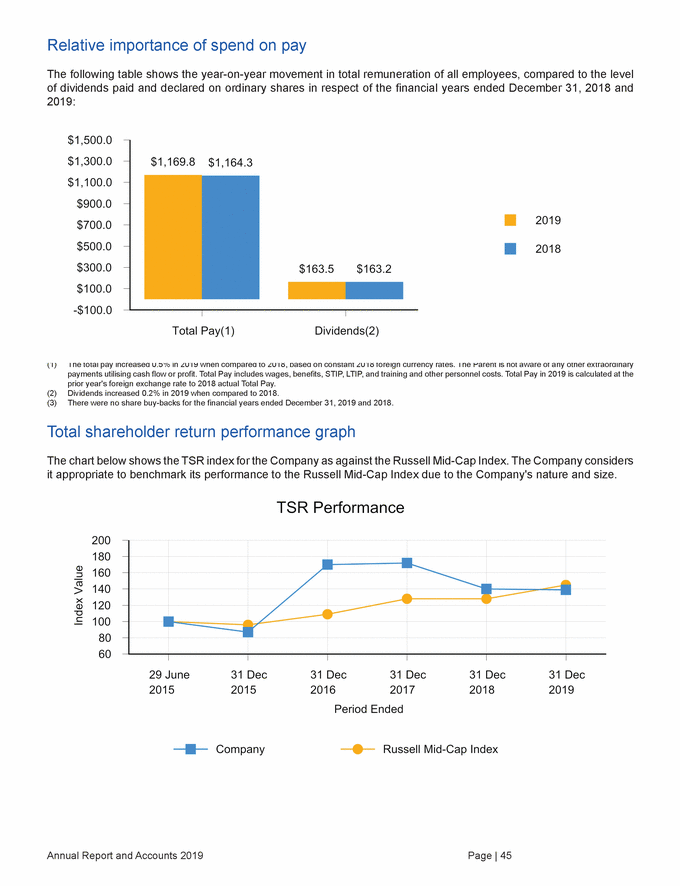
Non-Executive Directors' remuneration as a single figure - audited The remuneration of the Non-Executive Directors for the financial years ended December 31, 2019 and 2018 is set out below and relates to his or her performance of his or her role as a Non-Executive Director of the Parent. Taxable Benefits(1) RSU(2) Total(3) ($) Fees 2019 150,000 — 116,160 266,160 James McCann (Vice Chairman and Lead Independent Director)(5) 2018 122,651 54,785 286,848 464,284 2019 100,000 26,993 92,689 219,682 Paolo Ceretti(7) 2018 50,000 1,514 286,848 338,362 2019 106,722 — 92,689 199,411 Marco Drago 2018 100,000 63,868 286,848 450,716 2019 75,000 5,969 92,689 173,658 Heather McGregor(6) 2018 107,500 — 286,848 394,348 2019 42,436 — — 42,436 Vincent Sadusky(10) 2018 154,000 25,714 286,848 466,562 2019 — — — — Gianmario Tondato Da Ruos 2018 130,000 — 286,848 416,848 (1) (2) Primarily relates to reimbursable meal and travel expenses for attending Board meetings in the U.K.. The 2019 RSU($) represents the number of shares vested on May 17, 2019 times the closing stock price of $14.08. The 2018 amount reflects the number of shares vested on May 18, 2018 times the closing stock price of $30.38. Non-Executive Directors are not eligible to receive variable remuneration, therefore Total remuneration equals fixed remuneration. Lorenzo Pellicioli was appointed Chairperson effective November 19, 2018. James McCann was appointed Lead Independent Director effective November 19, 2018 and received a prorated amount of additional compensation. Fees in 2018 include payment of $7,500 for participating in (i) dedicated meetings on certain extraordinary transactions of the Parent and additional work required for those meetings, and (ii) the significant time commitment and effort connected to monitoring and evaluating complex technical cybersecurity risks. The additional payments are aligned with the Remuneration Policy as the maximum opportunity for an increase in fees on an annual basis is 10% of that year’s annual fees rising to a maximum of 20% in exceptional circumstances. Paolo Ceretti retired from the Board effective May 16, 2018, therefore his 2018 fee has been pro-rated from January 1 through his retirement date. Alberto Dessy's fees include 4% stipend related to Italian regulatory requirements. Patti Hart did not stand for re-election at the 2019 AGM and her term ended on May 17, 2019. She received compensation for her services during the year. Fees in 2018 include payment of $14,000 for participating in (i) dedicated meetings on certain extraordinary transactions of the Parent and additional work required for those meetings, and (ii) the significant time commitment and effort connected to monitoring and evaluating complex technical cybersecurity risks. The additional payments are aligned with the Remuneration Policy as the maximum opportunity for an increase in fees on an annual basis is 10% of that year’s annual fees rising to a maximum of 20% in exceptional circumstances. Philip Satre retired from the Board effective August 6, 2018, therefore his 2018 fee has been pro-rated from January 1 through his retirement date. Furthermore, (3) (4) (5) (6) (7) (8) (9) (10) (11) Annual Report and Accounts 2019 Page | 46 2019130,000—92,689222,689 201861,33112,972512,128586,431 Philip Satre(11) 2019140,00013,72092,689246,409 2018———— Samantha Ravich 2019100,000—92,689192,689 2018100,00017,224286,848404,072 Patti Hart(9) 2019100,000—92,689192,689 2018110,730—286,848397,578 Alberto Dessy(8) 2019———— 2018107,50011,679286,848406,027 Paget Alves(6) 2019140,00054,053102,066296,119 2018100,00016,247286,848403,095 Lorenzo Pellicioli (Chairman)(4)
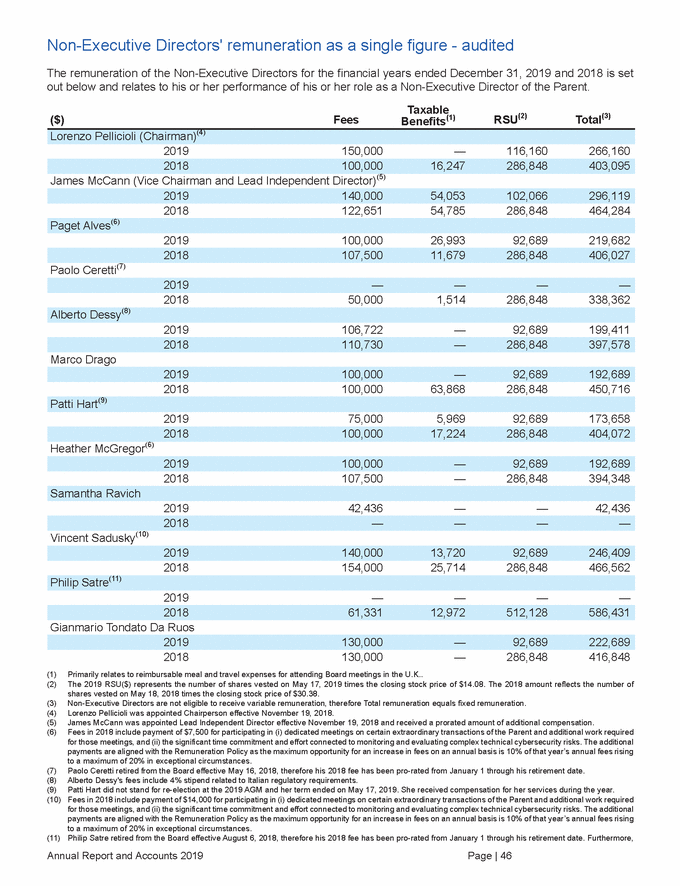
his 2018 RSUs includes $358,575 for services performed through May 17, 2018 and $153,553 for services performed from May 17, 2018 through his retirement date, which vested on September 14, 2018 at a closing stock price of $18.66. Non-Executive Directors’ share interests - audited The table below shows the Non-Executive Directors’ share interests at December 31, 2019, unless otherwise noted, including shares held by connected persons. Shares Beneficially Owned Outright(2) Restricted Shares(1) Name James McCann 15,625 99,770 Alberto Dessy 14,205 29,176 Patti Hart(3) — 63,390 Samantha Ravich 11,398 — Gianmario Tondato Da Ruos 14,205 27,058 (1) (2) (3) Non-Executive Directors do not have options outstanding. All shareholding ownership guideline requirements have been complied with to the extent applicable. Patti Hart's Board service ended on May 17, 2019 and does not have any outstanding equity subject to the Parent's incentive plans. Her beneficial ownership is as of her service end date. Payments to past Non-Executive Directors and payments for loss of office - audited Paolo Ceretti, Philip Satre and Patti Hart retired as a member of the Board of the Parent on May 17, 2018, August 6, 2018 and May 17, 2019, respectively. Their fees and RSU awards have been included in the Non-Executive Directors' remuneration as a single figure table and share interests table of this report. There have been no other payments of money or other assets to any director of the Parent who was not a director of the Parent or for loss of office, in each case, at any time during the financial year ended December 31, 2019. Share Ownership Guidelines Following the date of their appointment to the Board, Executive Directors are required to acquire and maintain shares with a fair market value equal to at least two times base salary (or such lower limit as specified in institutional investor guidelines from time to time) (the Minimum) and a maximum of up to at least five times base salary (which is the case of the current CEO). Shares included in the ownership criteria include shares which are beneficially owned regardless of whether the shares were issued under a Company plan or purchased on the market, and vested shares held in trust to benefit the Executive Director or his family members. Unearned performance shares do not count towards the ownership criteria until such shares have been earned. Unvested RSUs and unexercised share options are not taken into account for purposes of the guidelines. If the Director has a co-investment agreement, up to 50% of shares committed to the co-investment may be taken into account. If an Executive Director is at any time not in compliance with the share ownership guidelines, there is an additional holding requirement to hold a minimum of 50% of the after tax value of shares acquired upon the vesting of units or exercise of options after the effective date of the share ownership guidelines until the target share ownership is met. Annual Report and Accounts 2019 Page | 47 Vincent Sadusky14,20540,188 Heather McGregor14,2059,570 Marco Drago14,20532,649 Paget Alves14,20520,510 Lorenzo Pellicioli17,756102,435
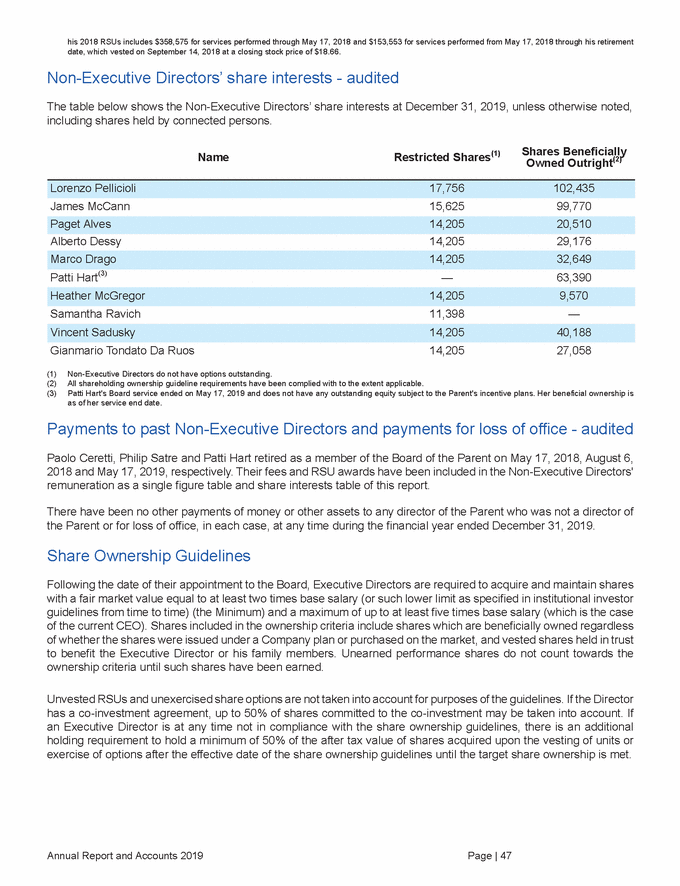
If an Executive Director is in compliance with the share ownership guidelines, there is an additional requirement to hold a minimum of 20% of the number of shares acquired through the vesting and/or exercise of an award for a period of up to 3 years following the date those shares were acquired or for as long as the Executive Director is in office. The Committee has the discretion to amend the shareholding guidelines at any time, but not so as to reduce the required holding to below the Minimum nor count unearned performance shares, unvested RSUs or unexercised share options against the Minimum. Beginning November 10, 2020 (or five years after joining the Board if such date is subsequent to November 10, 2020), a Non-Executive Director is expected to hold, for as long as they remain on the Board, ordinary shares of the Parent that have a fair market value equal to up to at least three times the base annual retainer amount then in effect for that Non-Executive Director. Unvested RSUs and unexercised share options are not taken into account for the purposes of the guidelines. Each of the Directors are on track to meet the requirements of the share ownership guidelines and their respective share interests at December 31, 2019 (including shares held by connected persons) are as disclosed in this Remuneration Report. Compensation Committee meetings and consideration of matters relating to Directors' Remuneration The Committee is responsible for recommending to the Board the remuneration policy for Directors and for setting the remuneration packages for the Chairman, the Executive Director and each Non-Executive Director. The Committee also has oversight of the remuneration policy and packages for other senior members of staff. The Committee currently comprises three independent Non-Executive Directors. As at the date of this Remuneration Report, the Committee is chaired by Gianmario Tondato Da Ruos, and its other members are Paget Alves and Alberto Dessy. All members served on the Committee since its establishment on April 7, 2015 up to the date of this Remuneration Report. The Committee held five meetings during the year. Attendance at the meetings is shown in the table below. Director Attendance Percentage Paget Alves 100% The CEO does not usually attend the meetings of the Committee, however, certain officers and employees, such as the Executive Vice President of People and Transformation, the Chief Financial Officer, the General Counsel and the Company Secretary of the Parent, usually attend meetings of the Committee, save in circumstances in which that person is the subject of the meeting. The principal activities undertaken by the Committee for the year ended December 31, 2019 consisted of: • Reviewing and benchmarking the remuneration of the Executive Director and Non-Executive Directors, and recommending changes to the CEO's severance arrangements to be more in line with market practice; Monitoring compliance with guidelines on share ownership by the Directors in the Parent; Reviewing legal and market practice updates in the U.K. and the U.S.; Reviewing and approving LTI/STI scoring projections and results, LTI/STI awards, LTI/STI plan design, employee historical payment trends; and Reviewing the Compensation Committee charter, clawback policy, expense reimbursement policy and any other compensation related policies. • • • • During its meetings, the Committee may also receive assistance and advice from third parties. The Committee has been advised by Mercer for the financial year ended December 31, 2019. Mercer is part of the Marsh & McLennan Companies, Inc., a global professional services firm, a third party unconnected with the Parent. The Committee has Annual Report and Accounts 2019 Page | 48 Alberto Dessy100% Gianmario Tondato Da Ruos (Chairman)100%
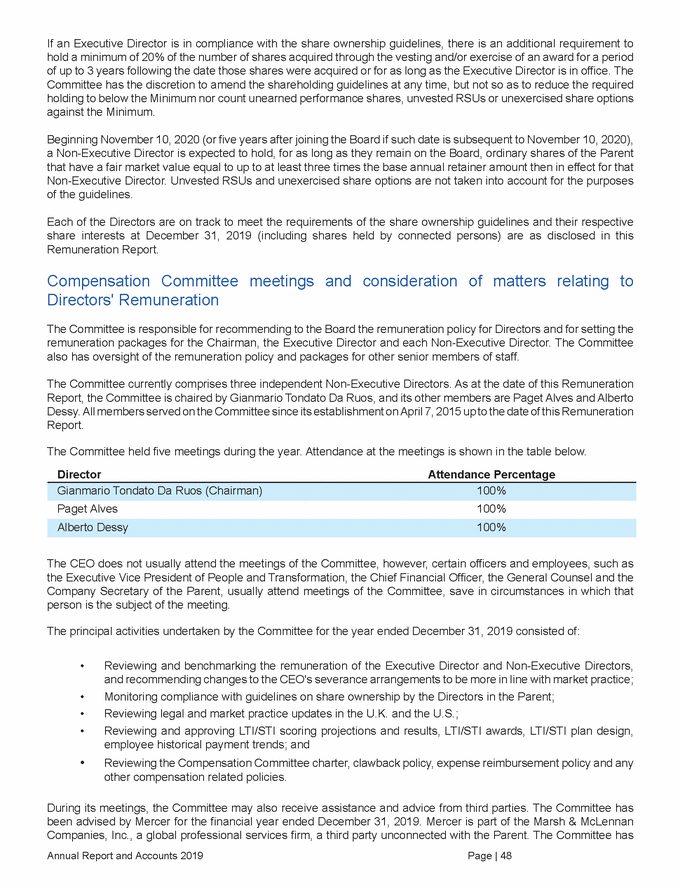
therefore satisfied itself that the advice received from Mercer was objective and independent. The total fees in relation to the advice provided to the Committee and the Board during the year were $200,338. Mercer also assists the Company in providing general consulting services, salary surveys, and advice on its 401(k) plans in the U.S.. While the Remuneration Policy provides the framework for Directors’ remuneration, it is intended that the Committee be entitled to exercise a level of discretion in certain circumstances, when it deems appropriate. The Committee may not use any discretion outside the Remuneration Policy without first seeking shareholder approval. External directorships The Directors are required to inform the Nominating and Corporate Governance Committee in the event an external commitment (e.g. employment or directorship) is taken up in a publicly held company. Salary and fees for such external commitments may be retained by the Director in question. Statement of voting At the 2019 AGM, 80.55% shareholders voted in favour of the 2018 Remuneration Implementation Report, with 9.35% voting against the resolution and 0.23% abstaining from voting. The remaining 9.87% did not cast a vote. On the 2019-2021 Remuneration Policy, 80.42% of shareholders voted in favour of the resolution, with 9.65% voting against the resolution and 0.06% abstaining from voting. The remaining 9.87% did not cast a vote. Implementation of the Remuneration Policy for the year ending December 31, 2020 This section sets out how the Company intends to implement the approved Remuneration Policy (see the approved Remuneration Policy from pages 51 to 62 of this Remuneration Report) for the financial year ending December 31, 2020. Executive Director's Salary For the financial year ending December 31, 2020, the Committee has determined not to increase the salary of the Executive Director, Marco Sala. The results of the salary review are set out in the table below: Salary 2019 Salary 2020 Percentage Change Annual salary is equal to $1,000,000, which is paid 70% in the U.K. in pounds sterling (£450,220) and 30% in Italy in Euros (€272,430). This payment arrangement requires periodic true-ups for currency fluctuations to ensure he is paid $1,000,000 annually. Salary amounts disclosed in the single-figure table include the impact of foreign exchange rate fluctuations and tax equalization which will therefore vary from the annual salary above. Massimiliano Chiara, who was appointed Executive Vice President and Chief Financial Officer effective April 6, 2020, and as Executive Director effective April 14, 2020, will receive an annual salary of $800,000. In light of the impact of the ongoing coronavirus (COVID-19) outbreak on the operations of the Company, Marco Sala and Massimiliano Chiara have agreed to base salary reductions of 50% and 30%, respectively, for two quarters beginning April 1, 2020 and April 6, 2020, respectively. Executive Director's Benefits An Executive Director will continue to be eligible to receive selected benefits including housing allowance, life insurance, private medical care, income protection, and critical illness insurance. Executive Director's Pension Marco Sala's Italian pension fund is structured as a contribution scheme whereby the employee contributions rate is equal to 10.19% and the employer quota is approximately 27%. As far as the contributions to the Italian integrative Annual Report and Accounts 2019 Page | 49 $1,000,000$1,000,0000%
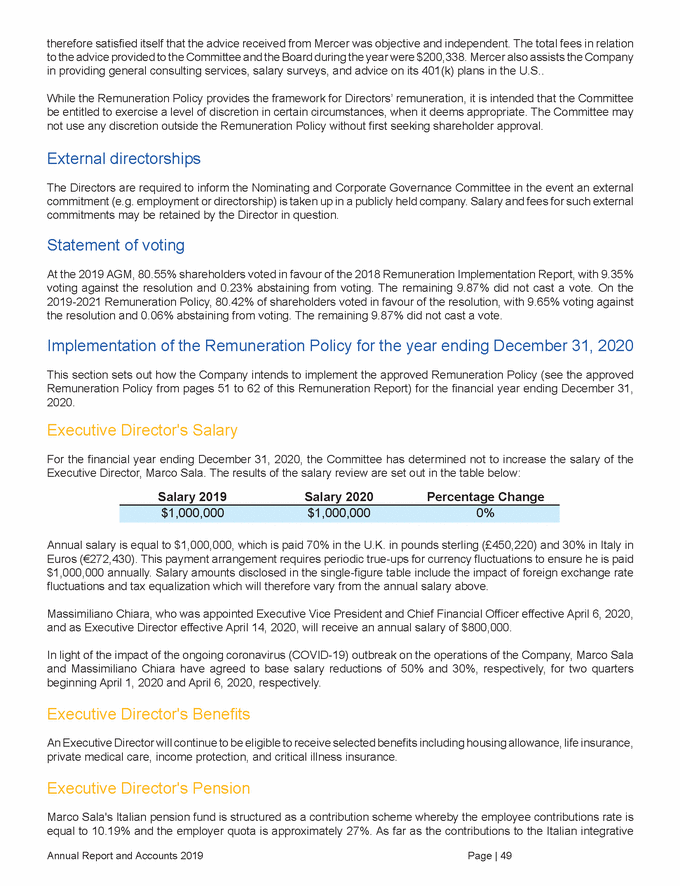
pension fund are concerned, Marco Sala’s contributions are levied at a rate of 3.45% on remuneration earned for his employment under the Lottomatica service agreement. Lottomatica contributes 8.55% of such remuneration. Massimiliano Chiara is eligible for the same defined contribution 401(k) plan IGT offers to all U.S. employees. IGT provides a 3.5% company match on the first 6% of employee contributions as follows: 100% match on the first 1% of employee contributions and 50% match on the next 5% of employee contributions, subject to the U.S. Internal Revenue Services (IRS) limits then in effect, which is $19,500 in 2020 with an additional "catch-up" contribution of $6,500 for employees age 50 or older as of December 31, 2020. Executive Director's STIP In light of the impact of the coronovirus (COVID-19) outbreak, the Committee cancelled the 2020 STIP program for all eligible employees, including the Executive Directors. Executive Director's LTIP The Committee continues to evaluate the business impact of coronavirus (COVID-19) and has yet to approve if and how the LTIP shall be operated for the performance period beginning January 1, 2020. If an award is granted under the 2020 LTIP, it is expected that awards shall be subject to long-term financial and TSR performance measures over a three-year period and continue to require additional service over a longer vesting period. Non-Executive Directors' fees As at the date of this Remuneration Report, the Chairman fees and the fees of the other Non-Executive Directors remain unchanged from the year ended December 31, 2019. The Committee retains discretion to review the fees of the Non-Executive Directors for the remainder of this financial year ending December 31, 2020, and any changes to fees will be in line with the Remuneration Policy. The fees of Non-Executive Directors are therefore as follows: Additional fees related to service for: Chair of Lead Independent Director ($) Chair of Nominating Non-Executive Director ($) Chair of Audit Committee ($) Chairman ($) Compensation and Corporate CommitteeGovernance 2020 ($) Committee ($) Non-Executive Directors' contractual arrangements and loss of office payments The Non-Executive Directors' contractual arrangements with the Parent and the way the Committee reviews the circumstances of any Non-Executive Director's departure remain the same as detailed in the Remuneration Policy. Non-Executive Directors' RSU The Committee has reviewed the terms of the Non-Executive Directors’ RSU agreements and has determined that RSU agreements will operate in a broadly similar manner to the year ended December 31, 2019. Additional RSU related to service for: Non-Executive Director ($) Chairperson ($) Lead Independent Director ($) 2020 Annual Report and Accounts 2019 Page | 50 RSU200,00050,00020,000 Fees100,00050,00020,00040,00030,00020,000
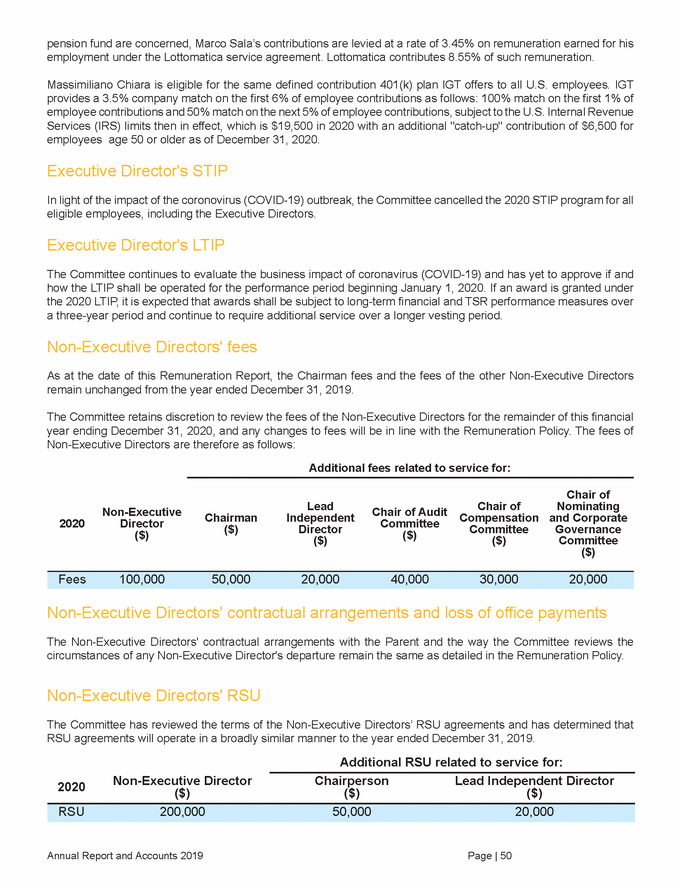
REMUNERATION REPORT: REMUNERATION POLICY Policy overview This part of the Remuneration Report is the Remuneration Policy that was approved at last year’s AGM on May 17, 2019 and took effect immediately thereafter. The full policy has been included in this Remuneration Report for ease of reference and it is intended that the approved policy will remain in place for three years unless the Company wishes to change the policy before the Company’s annual general meeting in 2022. The Remuneration Policy begins with the Executive Director and Non-Executive Director remuneration policy tables and narrative, and is followed by an outline of remuneration structures. The aim of the Remuneration Policy is to: • • • • Attract, retain, and motivate high calibre directors; Focus those directors on the delivery of the Company’s strategic and business objectives; Promote a strong and sustainable performance culture; and Align the interests of directors with those of the shareholders. Annual Report and Accounts 2019 Page | 51
The Remuneration Policy The table on the following pages sets out the Remuneration Policy for Executive Directors and Non-Executive Directors which shareholders have approved at last year’s AGM. Withholding recovery. year’s annual base salary that base salary in exceptional by the Committee in its sole appropriate and necessary, recovery. cost of providing individual circumstances. repay any reasonable travelling, hotel and other expenses, which a director properly attendance at directors' meetings, committee meetings, general meetings or separate otherwise in connection with the exercise of their powers and the discharge of his or her director with funds to meet expenditure incurred (or to be incurred) by him or her for the an officer of the company; or enabling him or her to avoid incurring any such expenses of individuals accompanying a director in connection with the performance of Annual Report and Accounts 2019 Page | 52 Executive Directors Element, Purpose and Link to Strategy Operation and Performance Conditions Maximum Opportunity Recovery or Fixed Pay Base salary: to pay a salary that reflects the role, responsibilities, experience and knowledge of the individual, provide a salary intended to be competitive with other employers in our industry, in addition to attracting and retaining appropriate executive directors to support the long-term interests of the Company. Salaries are reviewed annually by the Committee. Annual reviews take into account increases to the salaries of the workforce as a whole, performance of the Company and the individual, skill set and experience of the individual and external factors such as inflation, and an assessment of the competitive market. There are no performance conditions other than a qualitative assessment of individual performance. The maximum opportunity for an increase in base salary on an annual basis is 10% of that rising to a maximum of 20% of circumstances as determined discretion. Therefore, where larger increases may be awarded (for example, where a role has increased in scope). There is no provision for Benefits: to provide market competitive benefits to enable executive directors to undertake their role through ensuring well-being and security. Executive directors receive a range of benefits which may include, but are not limited to, private medical insurance, private dental insurance, life insurance, tax preparation benefits, and housing and car allowances. Benefits are reviewed regularly but not on a pre-determined schedule. The Company has in place an expense reimbursement policy. The Committee may incurs in performing his or her duties as director in connection with his or her meetings of the holders of any class of shares or of debentures of the Company, or responsibilities in relation to the Company. Subject to the Companies Act 2006, the directors may make arrangements to provide a purposes of the company, enabling him or her to properly perform his or her duties as expenditure. The expense reimbursement policy also permits the reimbursement of his or her duties as a director. There are no performance conditions. There is no maximum level of benefit; the overall level of benefits will depend on the items based on the individual’s There is no provision for
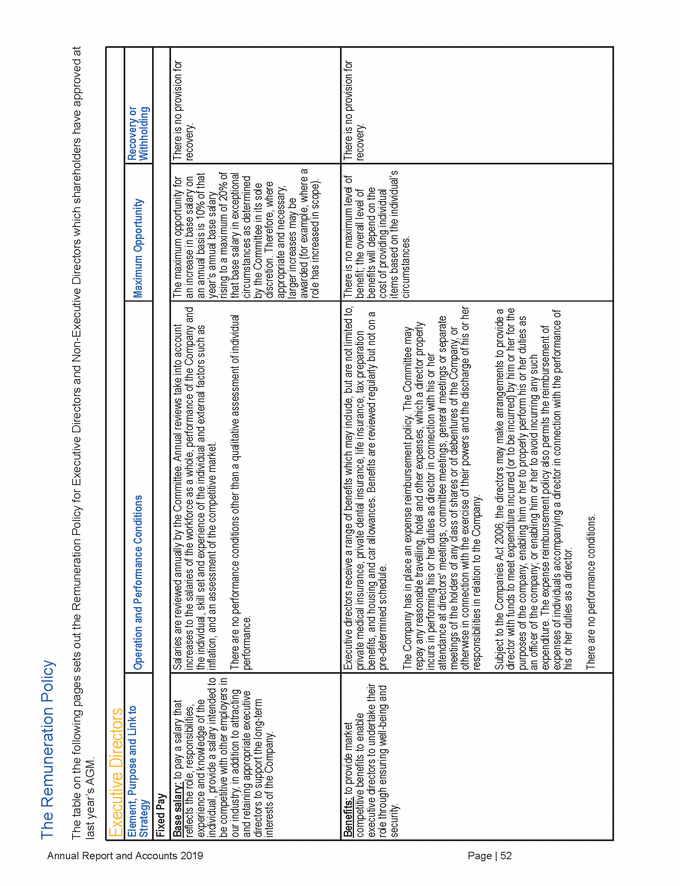
Withholding recoupment policy incentive compensation recouped in certain material restatement of statements or fraud, and generally subject to any forfeiture provisions applicable to the subsidiaries or affiliates. compensation amended from time to Annual Report and Accounts 2019 Page | 53 Executive Directors Element, Purpose and Link to Strategy Operation and Performance Conditions Maximum Opportunity Recovery or Pension: to attract and retain appropriate executive directors to support the long-term interests of the Company. Under the U.K. Government’s Workplace Pension Scheme, executive directors are entitled to a U.K. pension. The Company offers a company personal pension plan, or any other pension scheme as required by law, to current and new executive directors. If an executive director’s pension contributions are between 2% and 6% of base salary, the Company may match the contributed percentage of base salary plus one percent up to a maximum of 7% for contributions at 6% or above. A pension is provided for any executive director located in other jurisdictions. There are no performance conditions. The maximum company contribution is a matching of an executive director's contributed percentage of base salary between 2% and 6%, plus one percent up to a maximum of 7% for contributions at 6% or above. There is no provision for recovery. Variable Pay Annual bonus: to encourage executive directors to achieve both short-term financial results and individual targets. The STIP is performance-based, measured against a combination of financial and non-financial targets determined by the Committee, by reference to the then current business strategy. Non-financial targets shall only be used in combination with financial targets, with financial targets constituting a majority of the payout. Non-financial targets shall only be used if they are material to the business and quantifiable. Payments may be based on financial and non-financial targets which may include, but are not limited to, EBITDA, consolidated operating income, net debt, and individual performance, at the discretion of the Committee. Where non-financial targets are used, the majority of the bonus opportunity will be subject to financial targets. The metrics underlying the financial and non-financial targets may be adjusted or amended at the discretion of the Committee. Payments may be adjusted upwards or downwards at the discretion of the Committee to account for certain events, which may include, but are not limited to, currency fluctuations, securitizations, unbudgeted acquisitions, refinancings, and unusually negative or positive financial results due to events outside the control of an executive director, subject always to the limit in the adjacent column and to ensure that the rewards properly reflect business performance. The annual bonus does not have any additional vesting or deferral period and is generally paid in the first quarter of the year following the performance period. The maximum pay out is 300% of base salary. The Company has implemented an executive compensation pursuant to which made to executive directors may be instances, such as a the Company’s financial incentive compensation is clawback, recoupment, or required by laws Company or its The executive recoupment policy may be time by the Board or a committee thereof.
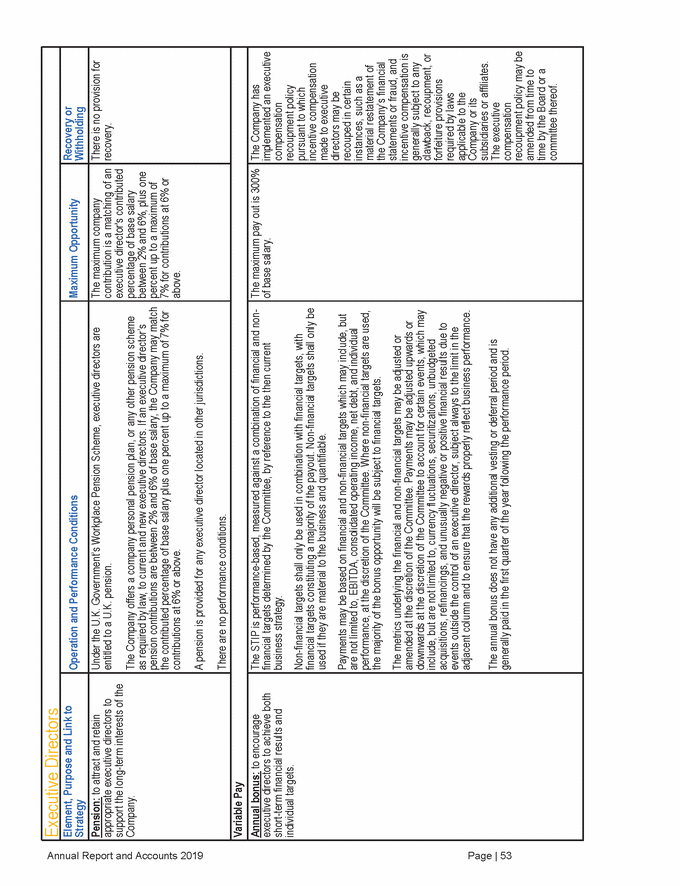
Withholding forfeiture provisions applicable to the The executive recoupment policy may be committee thereof. performance shares, restricted shares, other share-based awards or any combination subsidiaries as permitted by, and in accordance with, the terms of the LTIP. which an award can be granted and to approve the terms and form of award the vesting date of any grant, award of shares relating thereto from time to time. conditions performance, at the discretion of the Committee. The metrics underlying the Annual Report and Accounts 2019 Page | 54 Executive Directors Element, Purpose and Link to Strategy Operation and Performance Conditions Maximum Opportunity Recovery or Long-term share incentive plan (the 2015 Equity Incentive Plan): to encourage executive directors to achieve long-term performance targets. The LTIP is performance-based, measured against a combination of financial and non-financial targets determined by the Committee by reference to the then current business strategy. Non-financial targets shall only be used in combination with financial targets, with financial targets constituting a majority of the payout. Non-financial targets shall only be used if they are material to the business and quantifiable. Payments may be based on financial and non-financial targets which may include, but are not limited to, EBITDA, consolidated operating income, net debt, relative total shareholder return, and individual performance, at the discretion of the Committee. The metrics underlying the financial and non-financial targets may be adjusted or amended at the discretion of the Committee acting in accordance with the terms of the LTIP. Payments may be adjusted upwards or downwards at the discretion of the Committee acting in accordance with the terms of the LTIP, to account for certain events, which may include, but are not limited to, currency fluctuations, securitizations, unbudgeted acquisitions, refinancings, and unusually negative or positive financial results due to events outside the control of an executive director, subject always to the limits in the adjacent column and to ensure that the rewards properly reflect business performance. Awards currently outstanding under the LTIP program vest in two tranches, 50% in the first fiscal quarter following the performance period end date and 50% in the first fiscal quarter two years after the performance period end date. The awards do not have additional post-vest holding or deferral requirements. The Committee may grant share options, share appreciation rights, performance units, thereof to current or prospective directors and employees of the Parent or any of its The Committee has the discretion to determine the number of shares in respect of agreement, which may include, but are not limited to, the exercise price (if any), prior to The Committee also has the discretion to modify, amend or adjust the terms and financial and non-financial targets may be adjusted or amended at the discretion of the Committee acting in accordance with the terms of the LTIP. The Committee also has the discretion to adopt, alter and repeal the administrative rules, guidelines and practice governing the LTIP. The maximum target is 600% of base salary. The Company has implemented an executive compensation recoupment policy pursuant to which incentive compensation made to executive directors may be recouped in certain instances, such as a material restatement of the Company’s financial statements or fraud, and incentive compensation is generally subject to any clawback, recoupment, or required by laws Company or its subsidiaries or affiliates. compensation amended from time to time by the Board or a
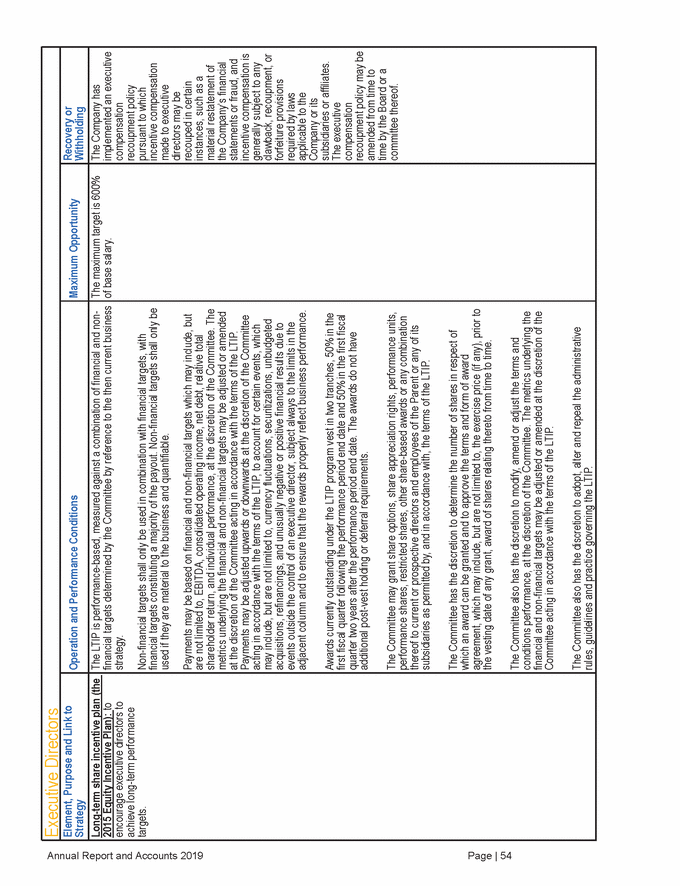
Withholding forfeiture provisions Company or its The executive recoupment policy may be time by the Board or a into subsequent co-investment arrangements following vesting, as well as discretion to shares, other property or a combination of the foregoing, as well as terminate the co-co-investment agreement, the Committee shall take into consideration corporate Annual Report and Accounts 2019 Page | 55 Executive Directors Element, Purpose and Link to Strategy Operation and Performance Conditions Maximum Opportunity Recovery or Co-investment plan: to encourage executive directors to commit to the short-to-medium term interests of the Company. The Committee has the discretion to require that an executive director enter into a co-investment agreement with the Company, subject to any contractual obligations. Any such co-investment agreement shall only be entered into once over up to a three-year period. Under a co-investment agreement the Company may issue and/or grant options over shares, share appreciation rights, units or restricted shares or other share-based awards or any combination thereof (in each case being "awarded shares") to an executive director resulting in a shareholding of up to 500,000 awarded shares held by the executive director. Vesting of the awarded shares generally has been over a three-year period and will be subject to continued service of the executive director and the executive director continuing to hold up to 500,000 shares in the Parent (the "committed shares") as the Committee may deem appropriate, and may be subject to certain further conditions, if the Committee determines it necessary in its sole discretion, which may include, but are not limited to, performance targets and associated metrics and the executive director agreeing to re-invest up to a given amount of the total committed and awarded shares into a subsequent co-investment agreement following vesting of any previous co-investment agreement. If an executive director ceases to be a director or CEO, as appropriate, of the Company options over awarded shares lapse and any matching awarded shares are forfeited. Within the above limits on terms of the agreement and on the number of matching awarded shares issued or shares over which an option is granted (or over which another share based award subsists), the Committee has the discretion to set, and amend, the terms and conditions of any co-investment agreement, including, but not limited to, the number of shares under option, shares issued, the quantity of any matched shareholding as well as the percentage of shares which are required to be reinvested, and, whether or not such executive director would be required to reinvest include or amend performance targets and metrics, and determine settlement in cash, investment agreement where appropriate. In determining the terms and conditions of a governance and institutional investor guidelines. 500,000 share awards. The Company has implemented an executive compensation recoupment policy pursuant to which incentive compensation made to executive directors may be recouped in certain instances, such as a material restatement of the Company’s financial statements or fraud, and incentive compensation is generally subject to any clawback, recoupment, or required by laws applicable to the subsidiaries or affiliates. compensation amended from time to committee thereof.
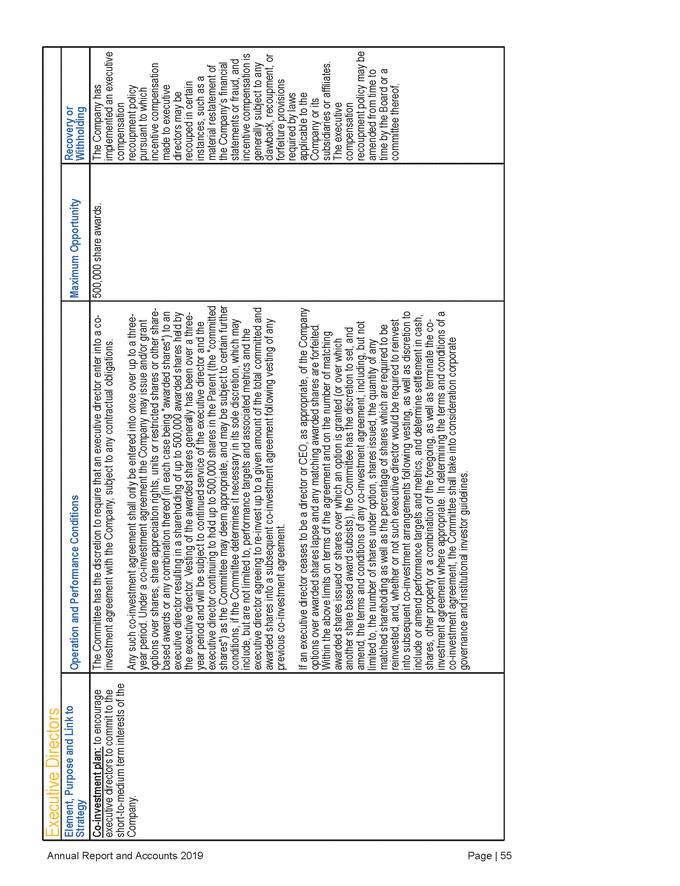
circumstances, as determined by the executive directors may be instances, such as a material Company’s financial RSUs are generally subject recoupment, or forfeiture applicable to the Company affiliates. Such recoupment time to time by the Board or that occurs in the Company’s financial year after the financial year in Annual Report and Accounts 2019 Page | 56 Non-Executive Directors Element, Purpose and Link to Strategy Operation and Performance Conditions Maximum Opportunity Recovery or Withholding Fixed Pay Fees: to attract and retain high-calibre individuals, with appropriate experience or industry-related skills, by offering market competitive fee levels A non-executive director is provided an annual fee, payable in quarterly tranches. When recruiting a new non-executive director, fees will be in line with the prevailing fee schedule applicable to other non-executive directors at that time. Higher cash retainers are provided for non-executive directors serving as a Chairperson of the Board, the Audit Committee, Compensation Committee and Nominating and Corporate Governance Committee. The Committee reviews the annual cash retainer for the non-executive directors periodically, taking into account an assessment of the competitive market. The non-executive directors do not participate in any annual bonus. The maximum opportunity for an increase in fees on an annual basis is 10% of that year’s annual fees rising to a maximum of 20% of those fees in exceptional Committee in its sole discretion. There is no provision for recovery. RSU - Annual Equity Awards for continuing non-executive directors On the date of each AGM of the Parent, each non-executive director continuing to serve after that date may be granted restricted share unit (RSU) award, a time-based award, vesting on a yearly basis in each case unconnected to the performance of such non-executive director. There is no additional holding or deferral period upon vesting of the awards. The number of RSUs covered by each such award will be determined by dividing (1) the "Annual Equity Award" (currently $250,000 for the role of Chairperson and $200,000 for other non-executive director roles, subject to change at the discretion of the Committee capped by the maximum opportunity set out opposite) grant value by (2) the closing share price as of the date of grant (rounded down to the nearest whole unit), (2) being subject to change at the discretion of the Committee taking market considerations into account. Annual RSU awards granted to non-executive directors under this policy will vest following the approval of financial statements by shareholders which the date of grant occurs. The Committee reviews the terms of the RSU awards for non-executive directors periodically with reference to any change in the time commitment required and an assessment of the competitive market. The Committee has the discretion to determine the appropriate awards and vesting mechanics by reference to the then current business strategy, and will take into account the then current institutional investor guidelines when making their decision. The Committee has the discretion to amend the formula to calculate the Annual Equity Award. The maximum opportunity for an increase in the Annual Equity Award on an annual basis is 10% of that year’s Annual Equity Award rising to a maximum of 20% of that Annual Equity Award in exceptional circumstances, as determined by the Committee in its sole discretion, taking market considerations into account. Awards made to non-recouped in certain restatement of the statements or fraud, and the to any clawback, provisions required by laws or its subsidiaries or policy may be amended from a committee thereof.
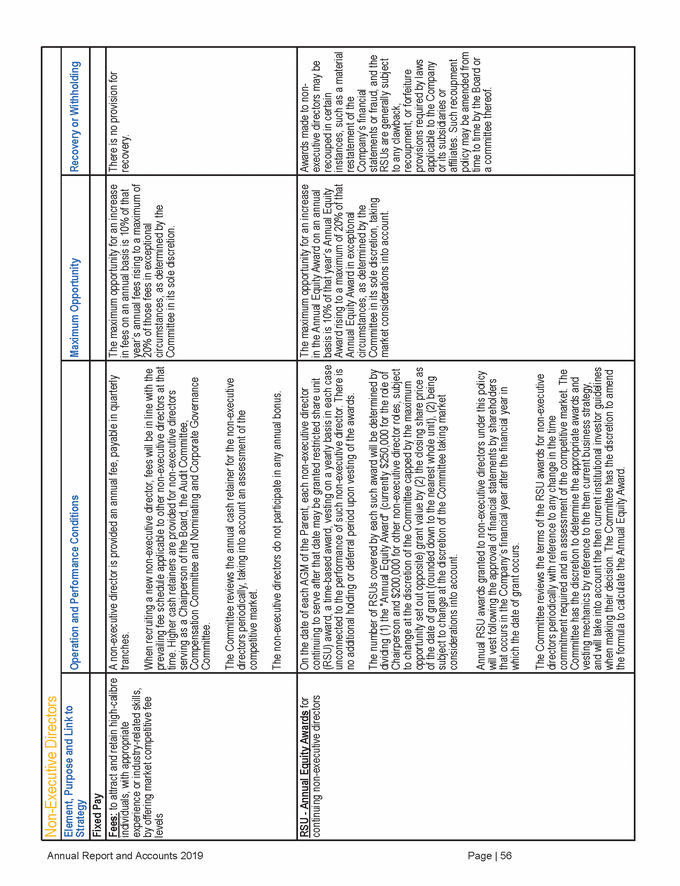
or its subsidiaries or time to time by the Board or Initial Equity Award. directors periodically and has the discretion to determine the appropriate strategy, any change in the time commitment required, and an The Company will honour prior commitments (including as to loss of office payments) entered into, and Directors will be eligible to receive payment in respect of any award granted, prior to the approval and implementation of this Remuneration Policy as described above, even if these commitments and/or awards would not otherwise be within this policy. The Company will also honour any commitment entered into at a time prior to an individual becoming a director if, in the opinion of the Committee, the payment was not in consideration for the individual becoming a director of the Company. Annual Report and Accounts 2019 Page | 57 RSU - Initial Equity Awards for new non-executive directors Each new non-executive director may be granted an award of RSUs determined by dividing (1) a pro-rata portion of the "Initial Equity Award" (currently $250,000 for the role of Chairperson and $200,000 for other non-executive director roles, subject to change at the discretion of the Committee capped by the maximum opportunity set out opposite) value by (2) the closing share price as of that date (rounded down to the nearest whole unit), (2) being subject to change at the discretion of the Committee taking market considerations into account. The pro-rata portion of the Initial Equity Award value will equal the Initial Equity Award value multiplied by the fraction which results from the following formula: X - Y X where: X is the number of days in the period beginning with (and including) the date of the AGM immediately preceding the appointment date (the Previous AGM) and ending on (and including) the date of the AGM immediately after the appointment date (the Next AGM); and Y is the number of days in the period beginning with (and including) the date of the Previous AGM and ending on (and including) the appointment date. The RSUs granted at the previous AGM vest following the approval of financial statements by shareholders at each annual general meeting of the Parent. If, on the date RSUs are granted, the date of the next AGM is not known, the RSUs shall be granted on the basis that the date of the next AGM is the date of the first anniversary of the previous AGM. The Committee has the discretion to amend the formula to calculate the The Committee reviews the terms of the RSU awards for non-executive awards and vesting mechanics by reference to the then current business assessment of the competitive market. The maximum opportunity for an increase in the Initial Equity Award on an annual basis is 10% of that year’s Annual Equity Award rising to a maximum of 20% of that Initial Equity Award in exceptional circumstances, as determined by the Committee in its sole discretion, taking market considerations into account. Awards made to Non-executive directors may be recouped in certain instances, such as a material restatement of the Company’s financial statements or fraud, and the RSUs are generally subject to any clawback, recoupment, or forfeiture provisions required by laws applicable to the Company affiliates. Such recoupment policy may be amended from a committee thereof.

Executive Directors’ Remuneration Policy The remuneration structure for Executive Directors is designed to incentivize the delivery of sustained performance consistent with the Parent’s strategic goals and appropriate risk management, and to reward success in doing so. The Executive Director plays a key role in the management and business success of a company. The Parent’s remuneration policy and structure are designed to reflect these combined roles. When setting the policy for Executive Directors’ remuneration, the Committee takes into account total remuneration levels in companies of a similar size and complexity, the responsibilities of the individual's role, the individual's performance and the individual’s experience. The Committee also considers developments in market practice and the pay and employment conditions within the Company. The Parent’s Remuneration Policy for the Executive Director as an employee of the Parent or of the Company, is to provide: (i) a base salary (ii) participation in an annual cash bonus plan, or STIP; and (iii) participation in an equity based LTIP, seeking to give a proportion of the total annual remuneration in the form of variable remuneration, which is linked to the performance of the Parent. The Parent’s Remuneration Policy for the Executive Director also provides participation in a Co-Investment Plan to incentivize him to commit to the short-to-medium term interests of the Parent. Differences in Remuneration Policy for Executive Directors compared to other employees Like the Executive Director, employees at management level and above receive a fixed salary and the potential for an uplift by way of a variable annual bonus through the same STIP. The STIP differs between employee levels of seniority: the Executive Director and senior management employees are subject to an 80% bonus weighting as to financial results based on either any of or all of operating income, EBITDA and net debt of the Parent and a bonus weighting of 20% based on personal performance. The STIP is paid out on an annual basis subject to financial results of the Parent and the personal performance of each employee. Manager and above level employees in general also participate in the same STIP. The percentage of the plan allocated to financial and individual objectives varies by level. Target as a percentage of base salary also varies by level. Director level employees and above also participate in the same LTIP as the Executive Director. Employees, other than the Executive Director, are not eligible to participate in the Parent’s co-investment plan. Approach to remuneration for new Executive Directors The Parent operates in a specialized sector and many of its competitors for talent are outside the U.K. The Committee’s approach to recruitment remuneration is to pay no more than is necessary to attract appropriate candidates to the role. On the recruitment of a new Executive Director, the level of fixed remuneration will be determined after considering the candidate’s skills and experience and the market data for the role that they will be undertaking. New Executive Directors will be eligible for the STIP and LTIP as set out in the Remuneration Policy and be subject to the same constraints as those for the existing Executive Director. A new Executive Director may also be required to enter into a co-investment agreement with the Parent similar to that described in the Executive Directors’ Remuneration Policy paragraph above and subject to the same constraints as set out. The Committee recognises that a new Executive Director may forfeit remuneration as a result of leaving a previous employer and the Committee will consider mitigating that loss or part of that loss by making an award in addition to the remuneration outlined above. In determining remuneration, the Committee will consider any relevant factors, including any performance conditions attached to any previous incentive arrangements and the likelihood of these conditions being met. Annual Report and Accounts 2019 Page | 58
Directors' contractual arrangements and loss of office payment policy The Executive Director's contractual arrangements The current CEO and Executive Director, Marco Sala, has a service agreement with the Parent and a service agreement with its wholly owned subsidiary, Lottomatica, only. The Parent service agreement Marco Sala’s service agreement with the Parent (70% of employment) can be terminated by either party on the giving of six months’ notice, if not, immediately for cause. He cannot resign without prior approval from the Directors. Following termination of employment, for a period of 24 months thereafter, Marco Sala is subject to certain restrictive covenants, including restrictions on soliciting or providing goods or services to certain customers, employing or enticing away from the group certain persons employed by any group company or being involved with any business in competition with any group company, among others. As consideration for compliance with the post-employment restrictive covenants, Marco Sala is entitled to a lump sum payment equal to two years’ base salary and any short-term incentive payments for the two financial years prior to the date of termination. Marco Sala is entitled to a salary of £450,520 per annum and this salary shall be reviewed by the Directors annually, but the Company is under no obligation to award an increase in salary. The Company has made available to him an apartment rented in the Company’s name. In addition, the Company will fully reimburse him for any expenses incurred as a result of his appointment. Marco Sala is not entitled to any other benefits under his service agreement with the Company. Under the service agreement, Marco Sala is entitled to participate in the LTIP and the co-investment plan under which Marco may be awarded restricted share units and/or share options. The Lottomatica service agreement Under the Lottomatica service agreement, Marco Sala is entitled to a base salary of €271,500, which has been subject to an Italian statutory increase to €272,003, paid in 13 equal gross instalments, plus additional benefits, including a company car. He is also entitled to an integrative pension fund in accordance with Italian law. The base salary paid by Lottomatica will not be less than 25% of the total salary paid to him by the Company. Noting there is no fixed term for either the Lottomatica service agreement or the service agreement with the Parent, however, Marco Sala was appointed by shareholders at the 2018 AGM for a term running from the conclusion of that AGM until the conclusion of the third subsequent AGM. The severance agreement According to a severance agreement entered into between the Company and Marco Sala (which supersedes a stability agreement originally entered into on February 20, 2012 between him and legacy GTECH S.p.A. and then assigned to Lottomatica S.p.A. as part of the merger), subject to Marco Sala working his notice period, he is entitled to a severance payment equal to one year’s base salary (plus any amounts owed to him) and a pro-rated STI payment as of the date of termination based on the projection of the Company's full year business and financial results. The severance payment is subject to the Company determining that he is a good leaver which includes, but is not limited to, circumstances involving redundancy, permanent incapacity, or retirement with the agreement of the Company. No severance payment will be made if Marco Sala’s employment is terminated for cause. Annual Report and Accounts 2019 Page | 59
The table below sets out the provisions of Marco Sala's service and severance agreements with the Parent. Estimated Value at December 31, 2019 ($) (1) Period Base Pay 12-months 1,000,000 Non-Compete Provisions Projected STI Actual payout for last 2 years (2017 & 2018) 4,157,250 (1) Excludes impact of foreign currency payments and tax equalization, per Marco Sala's employment contract, which is calculated as of the payment dates. (2) Marco Sala is also entitled to receive a pro-rated STI payment as of the date of termination based on a projection of the Company's full year business and financial results. As of December 31, 2019, this amount is equal to the 2019 Annual Bonus expected to be paid in March 2020, which is disclosed in Executive Director's remuneration as a single figure - audited. Non-Executive Directors' appointment agreements All Non-Executive Directors’ services are provided for in accordance with the prior approval of the Directors and their individual appointment agreements. They currently equally receive RSUs to the value of a $200,000 equity award save for the Chairperson and Lead Independent Director who receive a $250,000 and $220,000 equity award, respectively. No remuneration is payable upon a Non-Executive Director's termination, other than accrued fees and expenses, subject to the discretion of the Committee. Details of the terms of the appointment of the current Non-Executive Directors are as follows: Non-Executive Director Start of Current Term Expiry of Current Term James McCann (Lead Independent Director) 17 May 2019 25 June 2020 Beatrice Bassey 20 May 2020 25 June 2020 Marco Drago 17 May 2019 25 June 2020 Samantha Ravich 30 July 2019 25 June 2020 Gianmario Tondato Da Ruos 17 May 2019 25 June 2020 Loss of office When an Executive Director leaves the Company, the Committee will review the circumstances and apply the appropriate treatment under the terms of the applicable incentive plans and in accordance with the Executive Director’s contractual entitlements (see above). Where applicable, the Committee aims to avoid rewarding poor performance. Salary and benefits will continue to be paid throughout the notice period although the Committee has the discretion to make a payment in lieu of notice. In the event of a termination of the role of any of the directors for any reason prior to their vesting date, all outstanding and unvested restricted shares, restricted share units and/or options shall be automatically and immediately forfeited for no consideration as of such termination, subject to good and bad leaver provisions and any provision permitting a waiver of such forfeit at the discretion of the Committee, as appropriate. Annual Report and Accounts 2019 Page | 60 Vincent Sadusky17 May 201925 June 2020 Heather McGregor17 May 201925 June 2020 Alberto Dessy17 May 201925 June 2020 Paget Alves17 May 201925 June 2020 Lorenzo Pellicioli (Chairperson)17 May 201925 June 2020 Total Value7,157,250 Additional Base PayActual base for last 2 years2,000,000 STIPro-rated at termination date (2) Severance Provisions
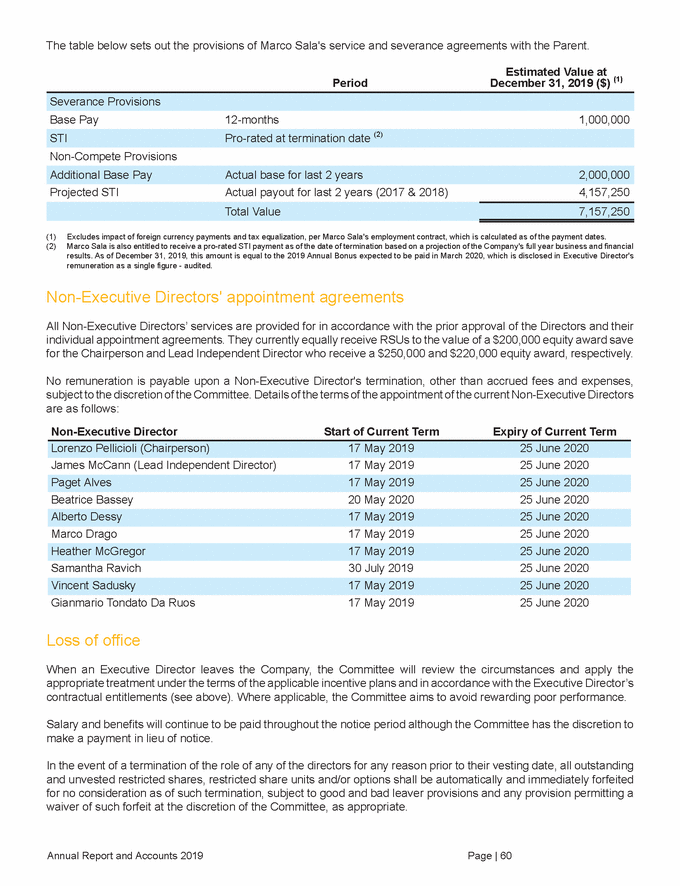
How the views of shareholders and employees are taken into account Shareholders The Committee values shareholder feedback when forming the Company's remuneration policy and takes into account shareholder views received in relation to resolutions to be considered at the AGM each year. Employees When determining Executive Director remuneration arrangements, the Committee takes into account pay and conditions throughout the Company as well as those of our peer companies to evaluate whether the structure and quantum of the Executive Director’s pay remains appropriate in this context. The Committee does not consider it appropriate to consult directly with other directors when developing a directors’ remuneration policy. The Committee does receive, however, periodic updates from the People and Transformation (HR) department on the overall remuneration structures and policies for all employees. At other levels of the Company, employees will receive a remuneration package that is reflective of their role and responsibilities, set by reference to relative remuneration throughout the Company and external market data, where applicable. Employees at an executive level will typically have a greater emphasis on performance-related and long-term pay compared to those below this level. Annual incentives may be payable based on performance measures which are suitable to the nature and responsibility of the role. This is considered when determining the policy for executive directors. Annual Report and Accounts 2019 Page | 61
Remuneration illustrations The chart below gives an indication of what could be received by an executive director in the first year of implementation after the Remuneration Policy was approved at the 2019 AGM. The bar chart shows (1) the minimum remuneration receivable as a percentage of total remuneration, (2) the remuneration receivable for performance in line with the Company’s expectations as a percentage of total remuneration, and (3) the maximum remuneration receivable as a percentage of total remuneration. Fixed remuneration, shown in the chart below, is comprised of salary, pension contributions, other benefits and any cash alternative. Variable remuneration comprises remuneration under the STIP and LTIP. Future remuneration will be determined based on profitability and performance as described in the proposed Remuneration Policy. Approval This Directors’ Remuneration Report, including both the Remuneration Implementation Report and the Remuneration Policy, has been approved by the Directors on May 12, 2020 and signed on its behalf on May 14, 2020. Signed on behalf of the Directors by: Gianmario Tondato Da Ruos Chairman of the Compensation Committee Annual Report and Accounts 2019 Page | 62
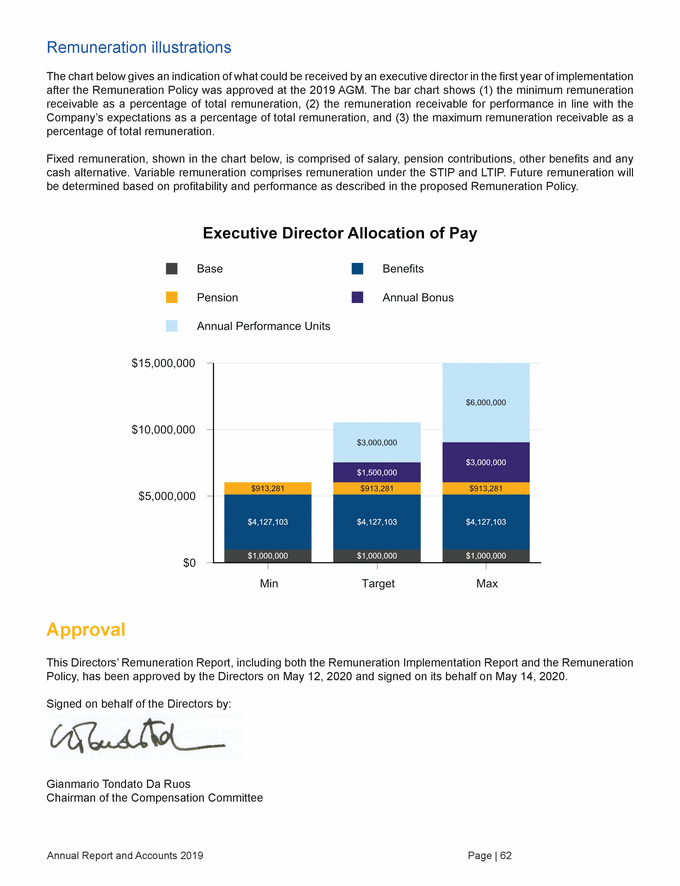
3. DIRECTORS’ REPORT The Directors present their report and the audited financial statements for the Parent and the Company for the period from January 1, 2019 to December 31, 2019. The Directors’ Report should be read in conjunction with the Strategic Report, the Directors’ Remuneration Report and other sections of the Annual Report and Accounts, all of which are incorporated into this Directors’ Report by reference. General information The Parent is a public company limited by shares, incorporated in the United Kingdom and is registered in England and Wales. The address of the Parent's registered office is 2nd Floor Marble Arch House, 66 Seymour Street, London, England, W1H 5BT. Future developments The Strategic Report contains details of likely future developments in the business. Dividends There are no recommended dividend payments for approval by shareholders for the period January 1, 2019 to December 31, 2019. The Company paid dividends of $163.5 million to shareholders and $136.7 million to non-controlling shareholders for the year ended December 31, 2019. Related party transactions Internal controls are in place to ensure that any related party transactions are carried out on an arm’s length basis and are disclosed in the financial statements. Accordingly, related party transactions are set out in Note 23, Related Party Transactions to the consolidated financial statements and form part of this Directors’ Report. Directors and their interests The directors of the Parent for the year ended December 31, 2019 are set out below: Marco Sala (CEO), Lorenzo Pellicioli (Chairman), James McCann (Lead Independent Director and Vice-Chairman), Paget Alves, Alberto Dessy, Marco Drago, Heather McGregor, Samantha Ravich, Vincent Sadusky and Gianmario Tondato Da Ruos. All of the directors listed above were appointed on April 7, 2015 and remain directors of the Parent as at the date of this Directors' Report, save for Heather McGregor, who was appointed on March 8, 2017 and Samantha Ravich, who was appointed on July 30, 2019. Patti Hart was previously a director of the Parent, whose term of office ended on May 17, 2019. Beatrice Bassey joined the Board as a director of the Parent on March 20, 2020 and Massimiliano Chiara joined the Company as Executive Vice President and Chief Financial Officer since April 2020 and was appointed as a director of the Parent on April 14, 2020. Paget Alves has informed the Parent that he does not intend to be re-appointed as a director of the Parent at the 2020 AGM, hence why he has not been included in the list of candidates in the notice of AGM. The Directors have interests in the Parent’s ordinary shares, namely share based plans, detailed in the Remuneration Report set out in Section 2 of this Annual Report and Accounts. Annual Report and Accounts 2019 Page | 63
Financial risk management objectives and policies The Company's activities expose it to a variety of market risks including interest rate risk and foreign currency exchange rate risk. The Company's overall risk management strategy focuses on the unpredictability of financial markets and seeks to minimize potential adverse effects on its performance through ongoing operational and finance activities. The Company monitors and manages its exposure to such risks both centrally and at the local level, as appropriate, as part of its overall risk management program with the objective of seeking to reduce the potential adverse effects of such risks on its results of operations and financial position. Depending upon the risk assessment, the Company uses selected derivative hedging instruments, including principally interest rate swaps and foreign currency forward contracts, for the purposes of managing interest rate risk and currency risks arising from its operations and sources of financing. The Company's policy is not to enter into such contracts for speculative purposes. Further disclosures relating to financial risk management objectives and policies, as well as disclosures relating to exposure to interest rate risk and foreign currency exchange rate risk, are described in Note 9, Financial Risk Management to the consolidated financial statements. The Company's accounting policies regarding derivatives and hedging are described in Note 2, Summary of Significant Accounting Policies to the consolidated financial statements. Directors’ indemnities In accordance with the Parent's articles of association and to the extent permitted by law, the Directors are granted a qualifying third party indemnity from the Parent in respect of liability incurred as a result of their office. In addition, the Parent maintained a directors’ and officers’ liability insurance policy throughout the year and continue to do so. Neither the indemnity nor the insurance provides cover in the event that a director of the Parent is proven to have acted dishonestly or fraudulently. Share capital The issued share capital of the Parent as at May 14, 2020 is $20,474,688 and £50,000, consisting of 204,744,830 ordinary shares of $0.10 each, 204,744,830 special voting shares of $0.000001 each, and 50,000 sterling non-voting shares of £1 each. The special voting shares carry 0.9995 votes each (compared to 1 vote for each ordinary share) and are held at all times by a nominee appointed by the Parent. Shareholders who maintain their ownership of ordinary shares continuously for at least three years are eligible to elect to direct the voting rights in respect of one special voting share per ordinary share held for such period, provided that such shareholders meet certain conditions set out in the Parent's Loyalty Plan (details of which are available at www.IGT.com). Once those conditions have been met and that eligible shareholder has successfully elected to participate in the Loyalty Plan, that shareholder will have the voting power of the equivalent of 1.9995 votes for each ordinary share held. The special voting shares and ordinary shares will be treated as if they are a single class of shares and not divided into separate classes for voting purposes. Further details of the special voting shares and the rights attaching to them are set out in the Parent's articles of association. The Directors were authorised, at the 2019 AGM, to allot ordinary shares in the capital of the Company up to a maximum nominal amount of $6,813,040.10 and up to a further maximum nominal amount of $6,813,040.10 where the allotment is in connection with an offer by way of a rights issue, in each case representing approximately one third of the nominal value of the ordinary shares in issue on April 5, 2019, for a period expiring at the end of the next annual general meeting (or if sooner, August 16, 2020). The Directors are requesting a new authority for the Parent to allot ordinary shares in the capital of the Company at the 2020 AGM in line with the Investment Association Share Capital Management Guidelines. The Parent currently has the authority to purchase a maximum of 20% of the aggregate issued ordinary shares in the Parent as at April 7, 2015. This authority will expire on July 28, 2020. The Directors are requesting a new authority at the 2020 AGM in line with the Investment Association Share Capital Management Guidelines. The Parent did not purchase any of its own share capital for the year ended December 31, 2019. Annual Report and Accounts 2019 Page | 64
Research and Development To remain competitive, the Company invests resources toward its R&D efforts to introduce new and innovative games with dynamic features to attract new customers and retain existing customers. The Company's R&D efforts cover multiple creative and engineering disciplines, including creative game content, hardware, electrical, systems, and software for lottery, land-based, online social, and digital real-money applications. R&D costs include salaries and benefits, stock-based compensation, consultants' fees, facilities-related costs, material costs, depreciation, and travel and are expensed as incurred. The Company devotes substantial resources on R&D and incurred $265.8 million and $262.3 million of related expenses in 2019 and 2018, respectively. Branches As the Company is a global business, there are activities operated through many jurisdictions. In 2019, the Company was active in over 100 countries and had 26 branches. Political donations and political expenditure During the year ended December 31, 2019 subsidiaries of the Parent made various forms of contributions (i.e. charitable donations, membership dues, sponsorships) to entities in the U.S. and Barbados that have political, charitable, social welfare, trade and business sector affiliations and missions. Some of these organisations and entities have affiliations with government officials. These contributions totalled $2.1 million in the U.S. and $5,000 in Barbados. The Company has fully complied with jurisdictional reporting of these contributions and such contributions are permissible under the relevant countries' laws. The Company policy is that no political donations be made or political expenditure incurred outside the U.S. or Canada. Other than as set forth above, neither the Company nor any of its subsidiaries for the year ended December 31, 2019: • Made any donations to a registered political party or other political or any independent election candidate or organisation in or outside the E.U.; or Incurred any political expenditure in or outside the E.U.. • Employee: Diversity and Inclusion IGT is committed to providing equal employment opportunities for all applicants and employees on the basis of qualification. The Company will not permit discrimination on the basis of characteristics such as, race, color, religion, sex, gender, sexual orientation, gender identity or expression, pregnancy, marital status or civil partnership status, national origin, citizenship, covered veteran status, ancestry, age, physical or mental disability, medical condition, genetic information, or any other legally protected status in accordance with applicable local, state, and federal laws. To the extent reasonably possible, IGT will accommodate applicants and employees with disabilities, including those who acquire temporary or long-term disabilities during their employment with IGT. Reasonable accommodations are available as long as the accommodation does not create an undue hardship for the Company and can be provided without posing a substantial safety risk to the employee or others. In addition, IGT may offer training and other professional development opportunities to employees with disabilities or those who become disabled during their employment. IGT values workplace diversity and respect for all employees. As reported, the Company follows the principles set by the International Labor Organization (ILO) Declaration on Fundamental Principles and Rights at Work in the member countries where the Company operates and is committed to providing a work environment where everyone is treated with fairness, dignity, and respect without discrimination. IGT regularly updates its policies, outlining the Company’s commitment to equal employment opportunities and non-discrimination, thus fostering a work environment that reflects a fair and inclusive culture that values unity and diversity. The Company enforces compliance by implementing practices to execute policies in business conduct, training employees in the application of procedures, and taking appropriate disciplinary action up to and including termination of employment for violation of the Company’s policies except where prohibited by law or contrary to local collective bargaining agreements. Annual Report and Accounts 2019 Page | 65
At IGT, diversity and inclusion are critical to who IGT is and the value it creates in the market. IGT is relentlessly working to build an even more diverse and inclusive Company that anticipates and meets the needs of the global customer base and the ever-changing demographics of the communities served. In 2018, the Company established the Office of Diversity and Inclusion which is responsible for implementing the Company’s Global Strategic Plan for Diversity and Inclusion. IGT also released a specific sexual harassment policy, that reflect best practices and address company culture, designed to set the expectations and standards of behaviour required for all IGT employees. In 2019, the Company rebranded Employee Business Resource Groups (EBRGs) into Diversity and Inclusion groups (DIGs). DIGs are employee networks structured around underrepresented dimensions of diversity and are open to all employees. DIGs provide engagement and development opportunities, help develop awareness of the unique issues faced by employees, and promote inclusion at every level of the company. In 2019, the Company launched five DIGs with ten chapters worldwide, including groups for military veterans; persons with disabilities; employees who are 50 years of age and above; lesbian, gay, bisexual, transgender and queer employees and their supporters; and women. The mission of SuperAbilities at IGT, a DIG which launched in 2019, is to promote the rights of and empower persons with disabilities. One of their key areas of focus is to provide a community at the Company that understands, supports, nurtures and encourages employees with “SuperAbilities” so they can thrive in professional and social environments. SuperAbilities at IGT has both a global chapter and a local chapter in Italy. All of the Company’s employees participated in training that focused on building awareness of the Company’s global policies relating to equal employment and anti-harassment and bullying. In addition, the Company’s vice presidents and senior vice presidents participated in inclusive leadership briefings designed to promote inclusion at all levels of the Company’s employees. Employee: Communication The Company maintains communication tools and channels that allow for the distribution of information to employees through email, social networking and print materials covering, among other topics, financial and economic factors affecting the Company. The Company has an internal website, OneIGT, that enables employees to access certain corporate information, which, in addition to providing corporate information and commercial updates, provides a platform for employees to ask anonymous questions to be answered by the senior executive team as appropriate and responses are published on the internal website. This intranet site is new and provides all employees globally access to corporate information as well as business unit and location specific information. The Company also hosts Company-wide meetings in which employees or their representatives are consulted on a regular basis so that the views of employees can be considered in making decisions that are likely to affect their interests. The Company conducted its second global survey on employee engagement in 2018 which enabled employees to provide feedback, influencing employee-related programs for implementation by the Company. MyVoice@IGT is our engagement survey and it is distributed every other year with focused engagement action planning in between. In addition, the Company hosted six global townhalls. Four were led by our Chief Financial Officer, Inside the Numbers, which focused on finance performance. One was led by Executive Vice President of People & Transformation and focused on organizational culture and one led by the CEO and Senior Vice President of Global Brand and Marketing on our new brand. As part of encouraging employee involvement in the performance of the Company, the Company offers several performance-based programs, e.g. a share award program for employees at a senior management level. The share award is based on a three-year performance cycle, measured from the achievement of several financial metrics. Setting these thresholds and offering this share incentive helps drive leadership accountability which significantly impacts the overall performance of the Company. The Company also offers a short term incentive program related to fiscal year results and an employee recognition program, Spotlight Awards, that provides monetary and non-monetary awards for employee contributions. Annual Report and Accounts 2019 Page | 66

Engagement with employees At page 18, the Strategic Report - Consideration of Stakeholder Interests, Section 172 Statement contains a summary of how the Directors have engaged with employees and how they have had regard to employee interests, including examples of principal decisions taken by the Company concerning employees during the year ended December 31, 2019. Engagement with customers and suppliers At page 20, the Strategic Report - Consideration of Stakeholder Interests, Section 172 Statement contains a summary of how the Directors have engaged with customers and suppliers and how they have had regard to customer and supplier interests, including examples of principal decisions taken by the Company relating to customers and suppliers during the year ended December 31, 2019. Greenhouse gas emissions As part of the Company's approach to sustainability, IGT is committed to ensuring that its operations interact with the environment in a socially responsible manner. To this end, over the years the Company gradually improved its commitment to the collection and monitoring of Greenhouse Gas (CHC) emissions data, that are performed globally on a business-site basis. Since 2016, an internal web-based tool is used to collect environmental data from Company sites all over the world. The tool has enabled the collection process to be systemised and harmonised, giving a more comprehensive overview of the Company’s environmental impact. Over the last years, improvements were made to the tool which allowed the Company to significantly improve usability and to ensure full automation of data retrieval and aggregation, reducing risk of errors. The annual amount in tons of CO2e emissions from activities for which the Company is responsible, including for fuel consumption and facility operations, refers to the following facilities and categories of consumption: • • • Main facilities in the U.S.: fuel consumption, electricity and refrigerant gases; U.S. fleet (car and small trucks covering 100% of U.S. facilities): fuel consumption; Facilities in Italy (the headquarters in Rome and the other facilities owned or leased in Italy): fuel consumption, electricity and refrigerant gases; Italian car fleet: fuel consumption; Main facilities outside the U.S. and Italy: fuel consumption, electricity, refrigerant gases and fleet fuel consumption; and Data centers worldwide: electricity. • • • (adjusted)3 CO2e)1 Scope II emissions (t CO2e)2 Notes: 1Scope I: fuel consumptions (including: natural gas; diesel, propane and liquified petroleum gas (LPG) consumption for generators; diesel, gasoline and LPG for vehicles such as company cars, small trucks or forklifts) and fugitive emissions of refrigerants. Ton CO2eq = data (fuel consumption or refrigerants refill) * Emission Factor. Annual Report and Accounts 2019 Page | 67 Greenhouse Gas Emissions4 For the year ended December 31, 2019 For the year ended December 31, 2019 For the year ended December 31, 2018 Combustion of fuel and operation of facilities - Scope I emissions (t 31,549 31,178 36,514 Electricity, heat, steam and cooling purchased for own use - 47,321 42,459 47,941 Total emissions (tCO2e) 78,870 73,637 84,455
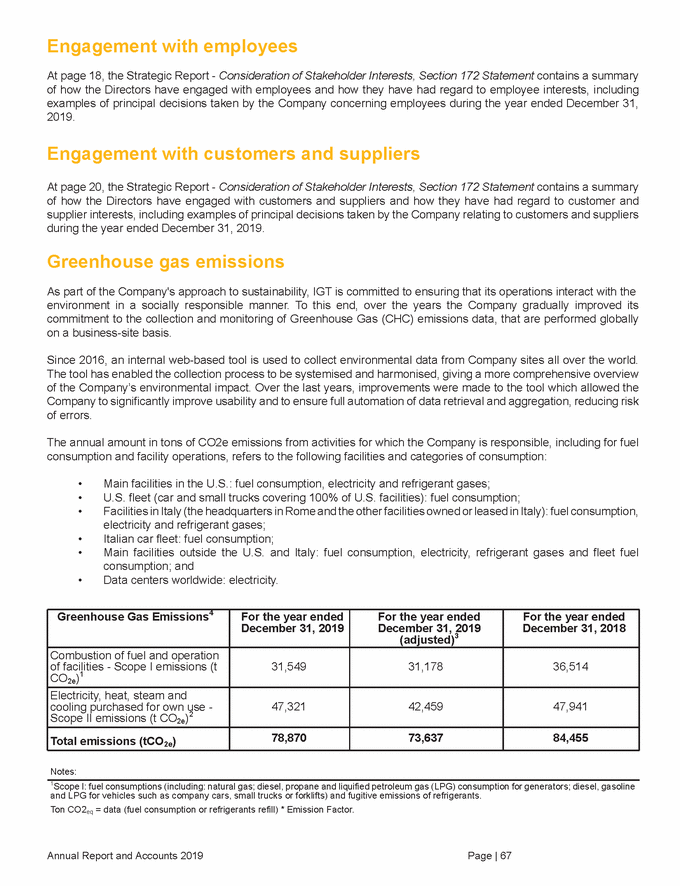
Data has been mainly collected from invoices (from refrigerants assuming each kg of refill has been a kg of fugitive emissions during the year). In addition, in order to calculate Scope I GHG emissions with reference to 100% of IGT locations active in 2019, only with reference to those offices that were unable to provide natural gas data in 2019, they have been estimated, based on an average emission per square meter. 2Scope II: Electricity consumption only. Ton CO2eq = kWh * Emission Factor. The ratio of the annual emissions associated with the Company’s activities based on the quantity of tonnage per thousand dollars is equal to 0.0165 (scope I and II divided by total revenues in U.S. thousand dollars). Data has been mainly collected from invoices. In addition, in order to calculate Scope II GHG emissions with reference to 100% of IGT locations active in 2019, only with reference to those offices that were unable to provide electricity consumption data for 2019, they have been estimated, based on an average emission per square meter. The decrease in CO2e Scope II emissions, despite the coverage of 100% of the perimeter, is mainly due to the update of the emission factors. 3The expression “adjusted” means that these data do not include estimations for those offices that were unable to provide electricity and natural gas data, ensuring a more reliable comparison with 2018 data. The methodology used is based on voluntary and mandatory GHG reporting guidance issued by the Department for Environment, Food & Rural Affairs (DEFRA). For fuels and operations, we have used DEFRA protocol conversion factors within our reporting methodology. For GHG emissions related to electricity we have used the emission factors (EFs) issued by the International Energy Agency (IEA), except for U.S. states for which we used state-based U.S. Environmental Protection Agency emission factors, and for countries for which the IEA EFs were not available we used and the Institute for Global Environmental Strategies EFs. 4Data related to the GHG emissions for 2019 could be updated based on data that will be available after the publication of this Annual Report and Accounts. The updated data will be published in the IGT Sustainability Report 2019. The Company's activities are mainly related to office work: software implementation, research and development, and administrative work. IGT's industrial activities are printing, which takes place in Lakeland (Florida, U.S.) and in Tito Scalo (Italy), and assembling, which occurs in Reno (Nevada, U.S.). The Company also has several environmental management systems that comply with the ISO 14001 (environmental management standards published by the International Organisation for Standardisation). Moreover, since 2011, the Company has implemented an ISO 50001 certified Energy Management System (EMS) for the Rome, Italy, location. In addition, the Reno, Nevada (U.S.), facility has a LEED (Leadership in Energy and Environmental Design) gold certification awarded by the United States Green Building Council in 2015 and is valid until 2025. It operates with less water and energy, consequently reducing GHG emissions. IGT Reno operates as Nevada’s first Gold certified combined office, data processing and manufacturing facility under the LEED for Existing Buildings: Operations & Maintenance distinction. One of the many benchmarks the Reno office met to earn its LEED certification was the elimination of approximately 1,530 tons of GHG’s annually by providing a fitness center, cafeteria, and on-site childcare services. Potential environmental impacts are related to: • Material consumption: there can be both an indirect impact in IGT's assembling plant with sub-products provided by suppliers, and a direct impact in terms of paper and ink consumption in the printing activities; Energy: there can be both direct - impact e.g. fuel consumption for heating, company fleet (cars and small trucks) and emergency electricity supplies, and indirect impact e.g. electricity consumption (office, manufacturing and printing); GHG emissions: these can be related to energy use (both direct and indirect) and transportation of goods made by IGT's service providers; Waste production: the Company's assembling process and printing processes do not produce a significant amount of waste; generally the waste is not hazardous. It is the Company’s policy to recycle; and Indirect environmental potential impacts: these can be significant for some processes relating to the production of the sub-products that are assembled in Reno (Nevada, U.S.) (such as chroming). The suppliers used for such processes are periodically monitored through on-site inspections to verify their compliance with environmental regulations. • • • • Annual Report and Accounts 2019 Page | 68
Board and Committee Evaluation The effectiveness of the Board is vital to the success of the Company. The Board undertakes a rigorous self-evaluation process each year to assess how it, its committees and each of the individual directors is performing. The evaluation is undertaken by way of an internal questionnaire, supported by discussions with the Nominating and Corporate Governance Committee, the Independent Directors and the full Board. Any items of note that result from the questionnaire or subsequent discussions are followed up on by the Board or relevant committee. The Board and committee self-evaluation for 2019 revealed that the Board is generally satisfied with individual director performance, the overall composition of the Board and the amount of information provided to the Board, noting that the flow of information from and the access to management could be improved further. Directors indicated that the Board fosters open and honest communication and is adequately involved in monitoring management’s implementation of strategy and reviewing significant transactions. The Board has identified that its role in crisis management, CEO succession planning and stakeholder outreach are deemed, amongst other things, areas for potential improvement. Statement of corporate governance arrangements The Parent is a U.K. public limited company that has its ordinary shares listed on the New York Stock Exchange (NYSE). The Parent's articles of association provide that, for as long as its ordinary shares are listed on the NYSE, the Parent shall comply with all NYSE corporate governance standards set forth in Section 3 of the NYSE Listed Company Manual applicable to non-controlled domestic U.S. issuers, regardless of whether the Parent is a foreign private issuer. To this end, the Board have adopted the Corporate Governance Guidelines (a copy of which is available at www.IGT.com). The Parent also voluntarily applies a selected number of provisions of the U.K. Corporate Governance Code which (i) are not inconsistent with the above said NYSE corporate governance standards, and (ii) would generally be expected by the market to be voluntarily applied by a company like the Parent. Going concern The current activities of the Company and those factors likely to affect its future development, together with a description of its financial position, are described in the Strategic Report. Principal risks and uncertainties affecting the Company are described in the Principal Risks and Uncertainties section of the Strategic Report. Critical accounting estimates affecting the carrying values of assets and liabilities of the Company are discussed in Note 2, Summary of Significant Accounting Policies to the consolidated financial statements. Having reviewed management's forecasted operating results, forecasted cash flows, forecasted net debt, forecasted funds available on the Revolving Credit Facilities, and the subsequent events discussed in Note 26, Subsequent Events, the Directors have a reasonable expectation that the Company has adequate resources to continue in operational existence for the foreseeable future and therefore will be well placed to manage its business risks successfully. Accordingly, the Directors consider it appropriate to continue to adopt the going concern basis of accounting in preparing the financial statements contained in this Annual Report and Accounts. Subsequent events Refer to Note 26, Subsequent Events to the consolidated financial statements. Statement of Directors’ responsibilities The Directors are responsible for preparing the Strategic Report, Directors’ Report, the Remuneration Report and the financial statements in accordance with applicable law and regulations. The Companies Act 2006 (the Act) and its associated regulations require directors to prepare financial statements for each financial year. Under the Act, the Directors have prepared the consolidated financial statements in accordance Annual Report and Accounts 2019 Page | 69

with International Financial Reporting Standards as adopted by the E.U. (IFRS) and the Parent financial statements in accordance with the U.K. Generally Accepted Accounting Practice (U.K. Accounting Standards, comprising FRS 101 “Reduced Disclosure Framework”, and applicable law). Under the Act, the Directors must not approve the financial statements unless they are satisfied that they give a true and fair view of the state of affairs of the Parent and the Company and of the profit or loss of the Parent and the Company for that period. In preparing these financial statements, the Directors are required to: • • Select suitable accounting policies and then apply them consistently; State whether applicable IFRSs as adopted by the European Union have been followed for the consolidated financial statements and U.K. Accounting Standards, comprising FRS 101, has been followed for the Parent financial statements, subject to any material departures disclosed and explained in the financial statements; Make judgements and accounting estimates that are reasonable and prudent; and Prepare the financial statements on the going concern basis unless it is inappropriate to presume that the Parent and the Company will continue in business. • The Directors are also responsible for safeguarding the assets of the Parent and the Company and hence for taking reasonable steps for the prevention and detection of fraud and other irregularities. The Directors are responsible for keeping adequate accounting records that are sufficient to show and explain the Parent's and the Company’s transactions and disclose with reasonable accuracy the financial position of the Parent and the Company at any time and enable them to ensure that the financial statements comply with the Act. The Directors are also responsible for the maintenance and integrity of the Parent’s website. Legislation in the U.K. governing the preparation and dissemination of financial statements may differ from legislation in other jurisdictions. The auditor and disclosure of information to the auditor In accordance with section 418 of the Act, each of the Directors confirms that: • So far as such Director is aware, there is no relevant audit information of which the Company’s auditor is unaware; and Such Director has taken all the steps that he or she ought to have taken as a director in order to make him or her aware of any relevant audit information, and to establish that the Company’s auditor is aware of that information. • Independent auditor The auditor, PricewaterhouseCoopers LLP, has indicated its willingness to continue in office and a resolution concerning its re-appointment will be proposed at the AGM. There are no significant post-balance sheet events. Approval This Directors’ Report has been approved by the Directors on May 12, 2020 and signed on its behalf on May 14, 2020. Signed on behalf of the Directors by: Marco Sala Chief Executive Officer Annual Report and Accounts 2019 Page | 70
4. INDEPENDENT AUDITORS’ REPORT Independent auditors’ report to the members of International Game Technology PLC Report on the audit of the financial statements Opinion In our opinion: • International Game Technology PLC’s group financial statements and parent company financial statements (the “financial statements”) give a true and fair view of the state of the group’s and of the parent company’s affairs as at 31 December 2019 and of the group’s profit and cash flows for the year then ended; the group financial statements have been properly prepared in accordance with International Financial Reporting Standards (IFRSs) as adopted by the European Union; the parent company financial statements have been properly prepared in accordance with United Kingdom Generally Accepted Accounting Practice (United Kingdom Accounting Standards, comprising FRS 101 “Reduced Disclosure Framework”, and applicable law); and the financial statements have been prepared in accordance with the requirements of the Companies Act 2006. • • • We have audited the financial statements, included within the Annual Report and Accounts (the “Annual Report”), which comprise: the Consolidated Balance Sheet as at 31 December 2019; the Parent Balance Sheet as at 31 December 2019; the Consolidated Statement of Operations, the Consolidated Statement of Comprehensive Loss, the Consolidated Statement of Cash Flows, the Consolidated Statement of Shareholders' Equity, and the Parent Statement of Shareholders' Equity for the year then ended; and the notes to the financial statements, which include a description of the significant accounting policies. Basis for opinion We conducted our audit in accordance with International Standards on Auditing (UK) (“ISAs (UK)”) and applicable law. Our responsibilities under ISAs (UK) are further described in the Auditors’ responsibilities for the audit of the financial statements section of our report. We believe that the audit evidence we have obtained is sufficient and appropriate to provide a basis for our opinion. Independence We remained independent of the group in accordance with the ethical requirements that are relevant to our audit of the financial statements in the UK, which includes the FRC’s Ethical Standard, as applicable to listed entities, and we have fulfilled our other ethical responsibilities in accordance with these requirements. Our audit approach Overview • Overall group materiality: $35 million (2018: $35 million), based on 2.1% of Earnings before interest, tax, depreciation and amortisation (EBITDA); adjusted to remove the impact of impairment losses and foreign exchange gains and losses. Overall parent company materiality: $70 million (2018: $70 million), based on approximately 0.8% of Total Liabilities. • • We conducted full scope audit work over three components in which the group has significant operations (Rome, Italy and Las Vegas, Nevada and Providence, Rhode Island, USA.) and a full scope audit of the parent company. • • In addition, we performed procedures on specific balances at seven non-significant components. During the year, the group engagement team visited the significant components in Italy and the USA. • • • Revenue recognition - identifying and evaluating contractual terms and conditions. Goodwill impairment assessments for North America Gaming and Interactive (“NAGI”) and International cash generating units. Management’s consideration of the potential impact of COVID - 19 The scope of our audit As part of designing our audit, we determined materiality and assessed the risks of material misstatement in the financial statements. In particular, we looked at where the directors made subjective judgements, for example in respect of significant accounting estimates that involved making assumptions and considering future events that are inherently uncertain. As in all of our audits we also addressed the risk of management override of internal controls, including evaluating whether there was evidence of bias by the directors that represented a risk of material misstatement due to fraud. Annual Report and Accounts 2019 Page | 71
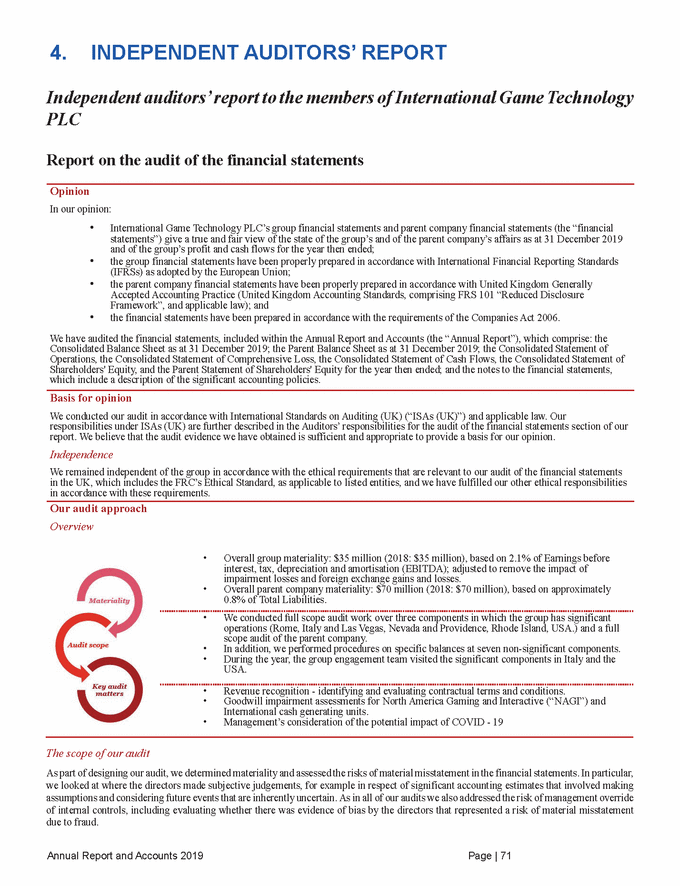
Key audit matters Key audit matters are those matters that, in the auditors’ professional judgement, were of most significance in the audit of the financial statements of the current period and include the most significant assessed risks of material misstatement (whether or not due to fraud) identified by the auditors, including those which had the greatest effect on: the overall audit strategy; the allocation of resources in the audit; and directing the efforts of the engagement team. These matters, and any comments we make on the results of our procedures thereon, were addressed in the context of our audit of the financial statements as a whole, and in forming our opinion thereon, and we do not provide a separate opinion on these matters. This is not a complete list of all risks identified by our audit. Key audit matter How our audit addressed the key audit matter Revenue recognition - identifying and evaluating contractual terms and conditions As described in Notes 2 and 3 to the consolidated financial statements, the Company generated service and product revenues of $3,857 million and $925 million, respectively, for the year ended 31 December 2019. The group’s revenue transactions include contracts with customers that consist of a combination of services and products that are accounted for as one or more distinct performance obligations. Management applies judgement in identifying and evaluating contractual terms and conditions that impact the identification of performance obligations and the associated pattern of revenue recognition. We considered this a key audit matter given the level of complexity and judgement involved in understanding the revenue affecting terms and conditions in the group’s revenue contracts. Under IFRS 15, Revenue from Contracts with Customers, the identification of different performance obligations, and the allocation of arrangement consideration to each of those obligations in a contract can require significant management judgement. Our procedures included the following: Assessing whether the revenue recognised on these contracts was in line with IFRS 15 by performing a combination of controls testing and substantive procedures. Assessing the controls in place over revenue recognition, including controls related to the identification and evaluation of contractual terms and conditions impacting the identification of performance obligations and the pattern of revenue recognition. Testing the completeness and accuracy of the contractual terms and conditions identified in contracts with customers. Testing a sample of revenue recognised on contracts and orders by validation against source documentation and assessing compliance with the provisions of IFRS 15. Based on the procedures performed, we noted no material issues from our work. Goodwill impairment assessments for North America Gaming and Interactive and International cash generating units The Group’s consolidated goodwill balance was $5,541 million as of 31 December 2019. The goodwill balances associated with the North America Gaming and Interactive (“NAGI”) and International cash generating units were $1,394 million and $1,284 million, respectively, as described in Notes 2 and 12 to the consolidated financial statements. The group’s annual impairment test identified an excess of fair value compared to carrying value in all but one of its cash generating units. For the International cash generating unit, an impairment of $57 million was recorded. We considered this a key audit matter given the sensitivity of the annual impairment tests for the NAGI and International cash generating units to changes in estimates of that were subject to a high degree of estimation uncertainty. Our procedures included the following: Evaluating the appropriateness of management’s identification of the group’s cash generating units. Assessing the business processes and controls related to the impairment assessments of goodwill. Assessing the suitability of the impairment model and understanding management's process and judgements utilised for developing estimates and assumptions. Performing a retrospective review of the prior period estimates by comparing to actual results in the current period and agreeing the current year cash flow assumptions to current year actual results. Using PwC valuation specialists to review significant assumptions, which included forecasted revenues, forecasted operating profits, terminal growth rates and weighted-average costs of capital, and the valuation report from management’s expert. Obtaining corroborating evidence to support significant assumptions and changes in the cash flow projections. Considering any contrary evidence to the assumptions used. Performing a sensitivity analysis based on reasonably possible outcomes. Checking the mathematical accuracy of the calculations. Based on the procedures performed, we noted no material issues from our work. Management’s consideration of the potential impact of COVID - 19 The COVID-19 outbreak, which was declared a global pandemic by the World Health Organization on 11 March 2020, and the social distancing measures implemented in 2020 by governments around the World have materially affected the operations of the Group, its customers, suppliers and other stakeholders. For example, the precautionary lockdown measures implemented in March 2020 by different territories including the USA and Italy have had an adverse impact on the Group given the significance of its operations in these territories. Management considered the implications for the Group’s going concern assessment (including a review of the financial covenants) and the adequacy of the disclosures in the Annual Report. We re-evaluated our initial risk assessment to determine whether the uncertainties associated with COVID-19 required additional audit testing or additional disclosure in the financial statements. As a result of the adverse impact on the Group, we have determined management's consideration of COVID-19 to be a key audit matter. Our procedures included the following: We considered management’s conclusion that COVID-19 represented a non-adjusting balance sheet event as at 31 December 2019. We considered the extent to which the Group's future cash flows might be adversely affected by COVID-19, including the Group's ability to comply with the financial covenants associated with its various debt facilities. We reviewed management’s cash flow forecast scenarios and considered their impact on liquidity and the ability of the Group to continue as a going concern for the foreseeable future. We considered the adequacy of the disclosures in the Annual Report, particularly in the Strategic report and the subsequent event note (note 26). Based on the procedures performed, we noted no material issues from our work. We determined that there were no key audit matters applicable to the parent company to communicate in our report. How we tailored the audit scope We tailored the scope of our audit to ensure that we performed enough work to be able to give an opinion on the financial statements as a whole, taking into account the structure of the group and the company, the accounting processes and controls, and the industry in which they operate. Annual Report and Accounts 2019 Page | 72
The group has its corporate headquarters in London, England, and operating headquarters in Rome, Italy and Las Vegas, Nevada and Providence, Rhode Island, USA. The worldwide engagement team is aligned to IGT PLC’s geographical organization and broadly mirrors the group’s management structure. As the group’s corporate headquarters are based in London, the group engagement team is also based in London and supported by component teams in Rome, Italy and Boston, Massachusetts, USA. Where work was performed by teams outside of the UK, we determined the level of independent involvement needed at those local operations to be able to conclude whether sufficient appropriate audit evidence had been obtained as a basis for our opinion on the consolidated financial statements as a whole. We issued formal, written instructions to the teams outside the UK setting out the work to be performed by each of them and maintained regular communication throughout the audit cycle. These interactions included participating in the planning and clearance meetings with our teams in Rome and Boston, holding regular conference calls, as well as reviewing work papers and assessing matters reported. We performed certain specified audit procedures across seven non-significant components to gain sufficient audit coverage over certain balances in the consolidated financial statements. The balances covered at each individual component varied based on their size but consisted of some or all of the following: service revenue, product revenue, cost of services, accounts receivable, accounts payable and systems & equipment. In total, the audit work performed accounted for approximately 90% of consolidated net revenue and approximately 90% of consolidated total assets. At the group level, we also carried out analytical and other procedures on the components not covered by the procedures described above. The group engagement team also performed audit procedures over the consolidation. Materiality The scope of our audit was influenced by our application of materiality. We set certain quantitative thresholds for materiality. These, together with qualitative considerations, helped us to determine the scope of our audit and the nature, timing and extent of our audit procedures on the individual financial statement line items and disclosures and in evaluating the effect of misstatements, both individually and in aggregate on the financial statements as a whole. Based on our professional judgement, we determined materiality for the financial statements as a whole as follows: amortisation (EBITDA); adjusted to remove the impact considerations for the members of International Game position. applied depreciation and amortisation (EBITDA); adjusted to exchange gains and losses measure to be one of the For each component in the scope of our group audit, we allocated a materiality that is less than our overall group materiality. The range of materiality allocated across components was between $4 million and $34.5 million (with $13.5 million being used for the parent company for the purpose of group audit). We agreed with the Audit Committee that we would report to them misstatements identified during our audit above $2.5 million (Group audit) (2018: $2.5 million) and $3.5 million (Parent company audit) (2018: $3.5 million) as well as misstatements below those amounts that, in our view, warranted reporting for qualitative reasons. Conclusions relating to going concern ISAs (UK) require us to report to you when: • • the directors’ use of the going concern basis of accounting in the preparation of the financial statements is not appropriate; or the directors have not disclosed in the financial statements any identified material uncertainties that may cast significant doubt about the group’s and parent company’s ability to continue to adopt the going concern basis of accounting for a period of at least twelve months from the date when the financial statements are authorised for issue. We have nothing to report in respect of the above matters. However, because not all future events or conditions can be predicted, this statement is not a guarantee as to the group’s and parent company’s ability to continue as a going concern. Annual Report and Accounts 2019 Page | 73 Group financial statementsParent company financial statements Overall materiality$35 million (2018: $35 million).$70 million (2018: $70 million). How we determined it2.1% of Earnings before interest, tax, depreciation andApproximately 0.8% of Total Liabilities. of impairment losses and foreign exchange gains and losses. Rationale for benchmarkWe consider an Earnings before interest, tax,We consider total liabilities to be one of the principal remove the impact of impairment losses and foreignTechnology PLC in assessing the parent company’s financial principal considerations for the members of International Game Technology PLC in assessing the recurring financial performance of the group as it best represents results from underlying operations.
Reporting on other information The other information comprises all of the information in the Annual Report other than the financial statements and our auditors’ report thereon. The directors are responsible for the other information. Our opinion on the financial statements does not cover the other information and, accordingly, we do not express an audit opinion or, except to the extent otherwise explicitly stated in this report, any form of assurance thereon. In connection with our audit of the financial statements, our responsibility is to read the other information and, in doing so, consider whether the other information is materially inconsistent with the financial statements or our knowledge obtained in the audit, or otherwise appears to be materially misstated. If we identify an apparent material inconsistency or material misstatement, we are required to perform procedures to conclude whether there is a material misstatement of the financial statements or a material misstatement of the other information. If, based on the work we have performed, we conclude that there is a material misstatement of this other information, we are required to report that fact. We have nothing to report based on these responsibilities. With respect to the Strategic Report and Directors’ Report, we also considered whether the disclosures required by the UK Companies Act 2006 have been included. Based on the responsibilities described above and our work undertaken in the course of the audit, the Companies Act 2006 and ISAs (UK) require us also to report certain opinions and matters as described below. did not identify any material misstatements in the Strategic Report and Directors’ Report. Responsibilities for the financial statements and the audit Responsibilities of the directors for the financial statements As explained more fully in the Statement of the Directors’ responsibilities set out on page 69, the directors are responsible for the preparation of the financial statements in accordance with the applicable framework and for being satisfied that they give a true and fair view. The directors are also responsible for such internal control as they determine is necessary to enable the preparation of financial statements that are free from material misstatement, whether due to fraud or error. In preparing the financial statements, the directors are responsible for assessing the group’s and the parent company’s ability to continue as a going concern, disclosing, as applicable, matters related to going concern and using the going concern basis of accounting unless the directors either intend to liquidate the group or the parent company or to cease operations, or have no realistic alternative but to do so. Auditors’ responsibilities for the audit of the financial statements Our objectives are to obtain reasonable assurance about whether the financial statements as a whole are free from material misstatement, whether due to fraud or error, and to issue an auditors’ report that includes our opinion. Reasonable assurance is a high level of assurance, but is not a guarantee that an audit conducted in accordance with ISAs (UK) will always detect a material misstatement when it exists. Misstatements can arise from fraud or error and are considered material if, individually or in the aggregate, they could reasonably be expected to influence the economic decisions of users taken on the basis of these financial statements. A further description of our responsibilities for the audit of the financial statements is located on the FRC’s website at: www.frc.org.uk/ auditorsresponsibilities. This description forms part of our auditors’ report. Use of this report This report, including the opinions, has been prepared for and only for the parent company’s members as a body in accordance with Chapter 3 of Part 16 of the Companies Act 2006 and for no other purpose. We do not, in giving these opinions, accept or assume responsibility for any other purpose or to any other person to whom this report is shown or into whose hands it may come save where expressly agreed by our prior consent in writing. Annual Report and Accounts 2019 Page | 74 Strategic Report and Directors’ Report In our opinion, based on the work undertaken in the course of the audit, the information given in the Strategic Report and Directors’ Report for the year ended 31 December 2019 is consistent with the financial statements and has been prepared in accordance with applicable legal requirements. In light of the knowledge and understanding of the group and parent company and their environment obtained in the course of the audit, we Directors’ Remuneration In our opinion, the part of the Directors’ Remuneration Report to be audited has been properly prepared in accordance with the Companies Act 2006.
Other required reporting Companies Act 2006 exception reporting Under the Companies Act 2006 we are required to report to you if, in our opinion: • • • • we have not received all the information and explanations we require for our audit; or adequate accounting records have not been kept by the parent company, or returns adequate for our audit have not been received from branches not visited by us; or certain disclosures of directors’ remuneration specified by law are not made; or the parent company financial statements and the part of the Directors’ Remuneration Report to be audited are not in agreement with the accounting records and returns. We have no exceptions to report arising from this responsibility. Gregory Briggs (Senior Statutory Auditor) for and on behalf of PricewaterhouseCoopers LLP Chartered Accountants and Statutory Auditors Uxbridge 14 May 2020 Annual Report and Accounts 2019 Page | 75
5. FINANCIAL STATEMENTS INTERNATIONAL GAME TECHNOLOGY PLC INDEX TO CONSOLIDATED FINANCIAL STATEMENTS Consolidated Balance Sheet at December 31, 2019 and 2018 77 Consolidated Statement of Operations for the years ended December 31, 2019 and 2018 78 Consolidated Statement of Comprehensive Loss for the years ended December 31, 2019 and 2018 79 Consolidated Statement of Cash Flows for the years ended December 31, 2019 and 2018 80 Consolidated Statement of Shareholders' Equity for the years ended December 31, 2019 and 2018 82 Notes to the Consolidated Financial Statements 83 Annual Report and Accounts 2019 Page | 76
International Game Technology PLC Consolidated Balance Sheet ($ thousands) December 31, Notes 2019 2018 Current assets: Restricted cash and cash equivalents 150,360 189,149 Inventories 5 161,790 282,698 Total current assets 2,544,772 2,199,954 Property, plant and equipment, net 10 146,847 154,539 Goodwill 12 5,541,397 5,631,186 Other non-current assets 6 1,901,678 2,158,687 Total assets 20 13,641,503 13,607,590 Liabilities and shareholders' equity Accounts payable 1,039,964 1,070,412 Short-term borrowings 15 3,193 34,822 Total current liabilities 2,547,758 2,078,761 Deferred income taxes 16 359,726 430,260 Other non-current liabilities 14 616,325 698,355 Total liabilities 11,466,815 11,228,005 Share capital 20,443 20,421 Retained deficit (1,497,003) (1,330,669) Total IGT PLC’s shareholders’ equity 1,634,931 1,772,450 Total shareholders’ equity 2,174,688 2,379,585 The accompanying notes are an integral part of these consolidated financial statements. The consolidated financial statements were approved by the Board of Directors on May 12, 2020 and signed on its behalf on May 14, 2020 by: Marco Sala Chief Executive Officer Company registration number: 09127533 Annual Report and Accounts 2019 Page | 77 Total liabilities and shareholders’ equity13,641,50313,607,590 Non-controlling interests539,757607,135 Other reserves18231,866226,211 Share premium2,879,6252,856,487 Shareholders’ equity Total non-current liabilities8,919,0579,149,244 Lease liabilities11342,83743,791 Long-term debt, less current portion157,600,1697,976,838 Other current liabilities141,042,446973,527 Current portion of long-term debt15462,155— Current liabilities: Total non-current assets11,096,73111,407,636 Intangible assets, net131,830,3422,038,315 Right-of-use assets11368,527— Systems, equipment and other assets related to contracts, net101,307,9401,424,909 Other current assets6563,561528,353 Trade and other receivables, net41,006,127949,085 Cash and cash equivalents662,934250,669 Assets
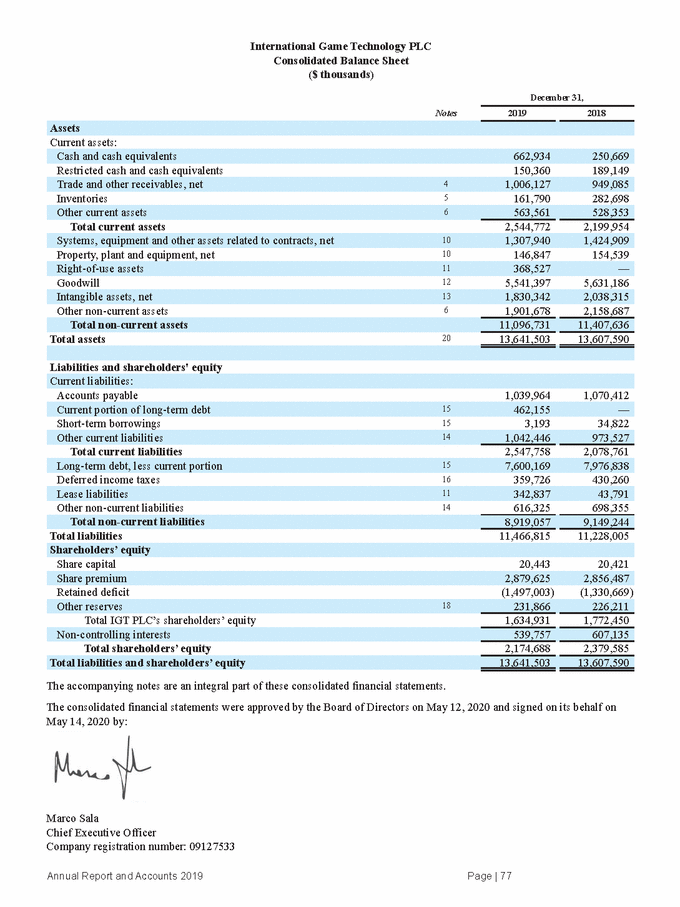
International Game Technology PLC Consolidated Statement of Operations ($ and shares in thousands, except per share amounts) For the year ended December 31, Notes 2019 2018 Product sales 3, 20 925,060 784,942 Cost of product sales 552,952 490,876 Research and development 265,815 262,262 Other operating expense 31,436 17,239 Total operating expenses 4,089,940 4,239,951 Operating income 20 692,484 589,586 Interest expense, net (434,419) (417,459) 15 Other expense (119,694) (210,333) Total non-operating expenses (475,960) (491,742) Income before provision for income taxes 16 216,524 97,844 Provision for income taxes 16 173,483 184,216 Net income (loss) (86,372) 43,041 Less: Net income attributable to non-controlling interests 52,772 58,003 The accompanying notes are an integral part of these consolidated financial statements. Annual Report and Accounts 2019 Page | 78 Weighted-average shares - basic and diluted22204,373204,083 Net loss attributable to IGT PLC per common share - basic and diluted22(0.05)(0.71) Net loss attributable to IGT PLC(9,731)(144,375) Other income38,2777,025 Foreign exchange gain, net39,876129,025 Other operating income10(27,694)— Goodwill impairment1257,000184,000 Selling, general and administrative835,298836,230 Cost of services2,375,1332,449,344 Total revenue3, 204,782,4244,829,537 Service revenue3, 203,857,3644,044,595
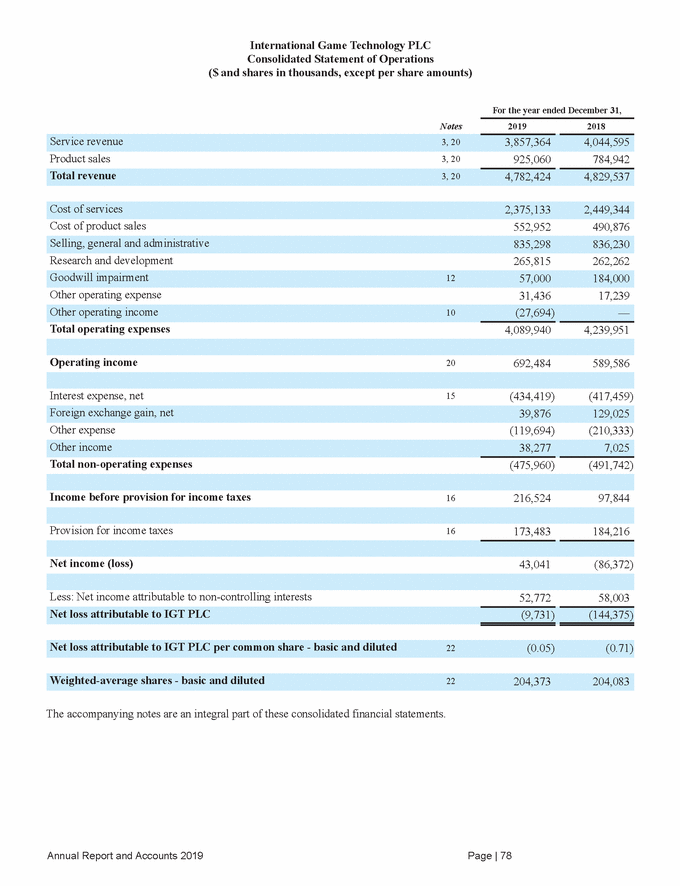
International Game Technology PLC Consolidated Statement of Comprehensive Loss ($ thousands) For the year ended December 31, Notes 2019 2018 Other comprehensive loss, net of tax: 1 Unrealized loss on hedges (1,451) (430) 18 Other comprehensive loss (10,251) (91,127) Less: Comprehensive income attributable to non-controlling interests 36,866 39,312 (1) All items in other comprehensive loss, net of tax will be reclassified subsequently to profit or loss when specific conditions are met, with the exception of unrealized (loss) gain on defined benefit plans of $(1.0) million and $0.4 million for the years ended December 31, 2019 and 2018, respectively, which is included in unrealized loss on other. The accompanying notes are an integral part of these consolidated financial statements. Annual Report and Accounts 2019 Page | 79 Comprehensive loss attributable to IGT PLC(4,076)(216,811) Comprehensive loss32,790(177,499) Unrealized gain (loss) on other 1183,059(5,008) Foreign currency translation adjustments18(11,859)(85,689) Net income (loss)43,041(86,372)
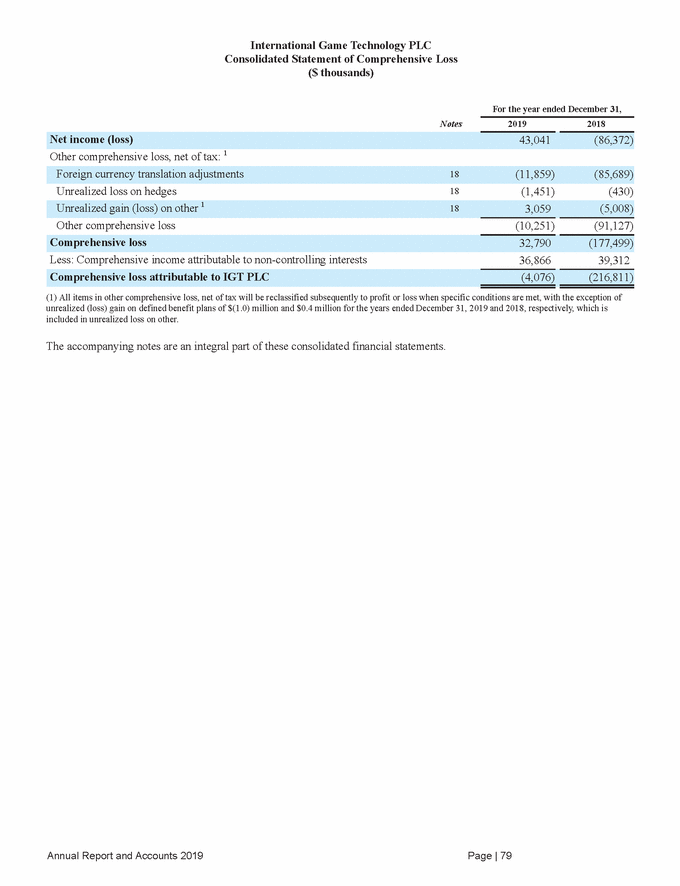
International Game Technology PLC Consolidated Statement of Cash Flows ($ thousands) For the year ended December 31, Notes 2019 2018 Net income (loss) 43,041 (86,372) Depreciation 510,827 441,066 Amortization of upfront license fees 207,379 219,069 Goodwill impairment 12 57,000 184,000 Debt issuance cost amortization 22,854 22,475 Foreign exchange gain, net (39,876) (129,025) (Gain) loss on sale of assets (64,714) 150 Changes in operating assets and liabilities, excluding the effects of dispositions and acquisitions: Inventories 84,472 12,556 Accounts payable (2,536) (39,203) Net cash provided by operating activities 1,170,240 8,655 Cash flows from investing activities Proceeds from sale of assets 124,043 19,243 Net cash used in investing activities (306,852) (515,550) Cash flows from financing activities Dividends paid (163,503) (163,236) Net (payments of) proceeds from short-term borrowings (32,067) 34,822 Payments in connection with the extinguishment of debt (8,689) (49,976) Dividends paid - non-controlling interests (136,655) (55,902) Capital increase - non-controlling interests 1,499 321,584 Return of capital - redeemable non-controlling interests — (39,077) Net cash used in financing activities (433,112) (311,545) Net increase (decrease) in cash and cash equivalents 430,276 (818,440) Cash and cash equivalents at the beginning of the period 250,669 1,057,418 Annual Report and Accounts 2019 Page | 80 Cash and cash equivalents at the end of the period662,934250,669 Effect of exchange rate changes on cash and cash equivalents(18,011)11,691 Other(67,033)(20,655) Dividends paid - redeemable non-controlling interests—(71,024) Return of capital - non-controlling interests(98,788)(46,044) Proceeds from long-term debt1,397,0251,687,761 Debt issuance costs paid(25,930)(17,033) Net (payments of) receipts from financial liabilities(34,324)7,123 Principal payments on long-term debt(1,264,647)(1,899,888) Other11,189(1,741) Capital expenditures(442,084)(533,052) Other assets and liabilities41,273(173,294) Upfront license fees—(878,055) Trade and other receivables(58,213)(54,356) Other non-cash costs, net23,07632,559 Deferred income taxes16(61,540)(40,422) Loss on extinguishment of debt11,96454,423 Stock-based compensation expense2125,27022,896 Redeemable non-controlling interest99,362148,416 Amortization270,601271,772 Adjustments to reconcile net income (loss) to net cash provided by operating activities: Cash flows from operating activities
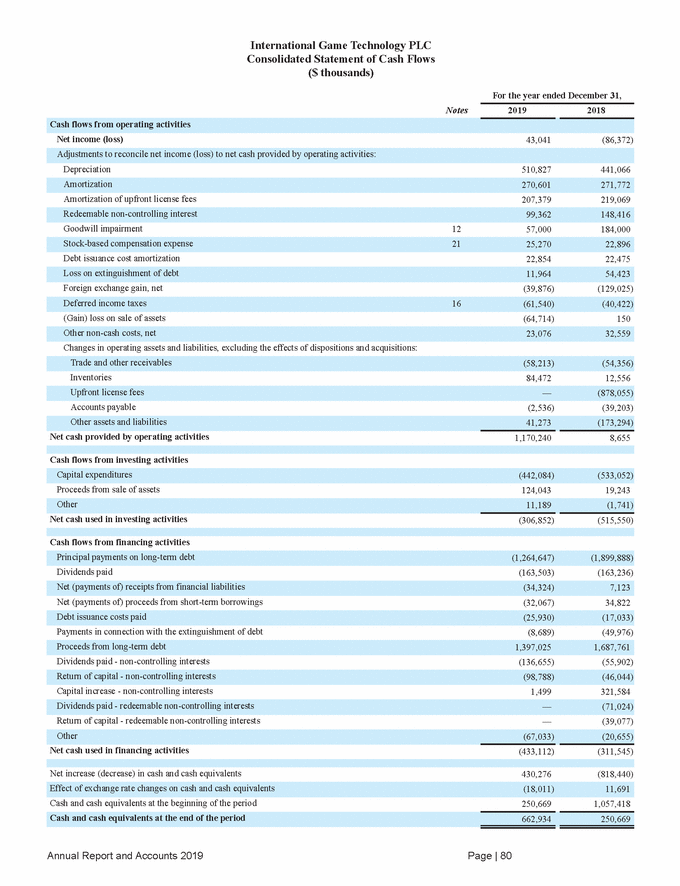
International Game Technology PLC Consolidated Statement of Cash Flows ($ thousands) For the year ended December 31, 2019 2018 Cash paid during the period for: Income taxes (235,385) (239,831) Non-cash investing and financing activities: The accompanying notes are an integral part of these consolidated financial statements. Annual Report and Accounts 2019 Page | 81 Capital expenditures(50,616)(51,805) Interest(423,427)(445,698) Supplemental disclosures of cash flow information
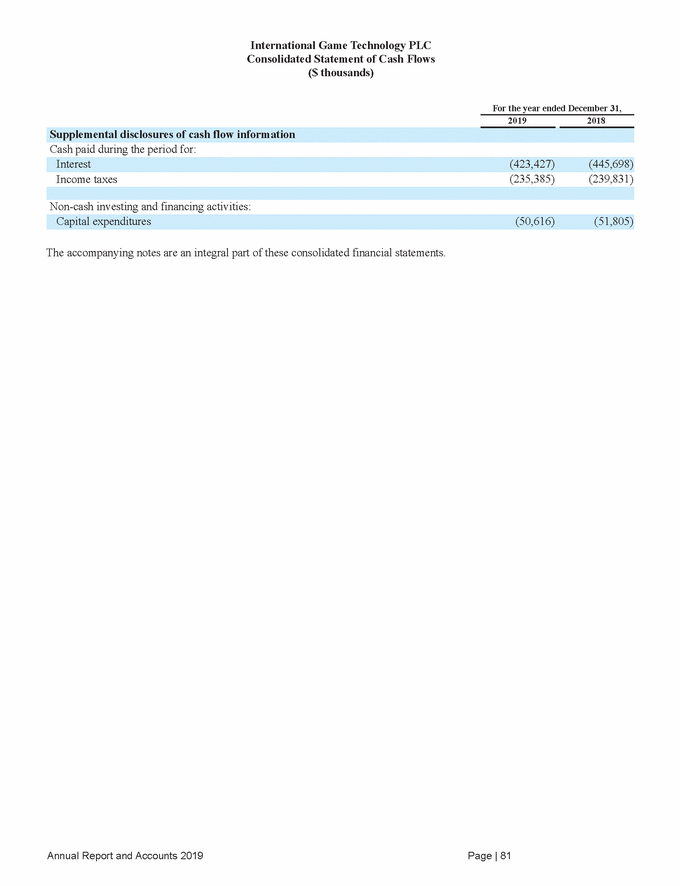
International Game Technology PLC Consolidated Statement of Shareholders’ Equity ($ thousands) Non-Controlling Interests (Note 19) Total IGT PLC Equity Share Capital Share Premium Retained Deficit Other Reserves (Note 18) Total Equity Other comprehensive loss, net of tax — — — (72,436) (72,436) (18,691) (91,127) Adoption of new accounting standards — — 50,874 — 50,874 — 50,874 Tax benefit on stock-based compensation expense — 1,119 — — 1,119 — 1,119 15 (1,566) — — (1,551) — (1,551) options Shares issued under stock award plans 62 (11,153) — — (11,091) — (11,091) Dividends paid — — (163,236) — (163,236) (43,313) (206,549) Balance at December 31, 2018 20,421 2,856,487 (1,330,669) 226,211 1,772,450 607,135 2,379,585 Net (loss) income — — (9,731) — (9,731) 52,772 43,041 Total comprehensive (loss) income — — (9,731) 5,655 (4,076) 36,866 32,790 Stock-based compensation expense (Note 21) — 25,270 — — 25,270 — 25,270 Tax benefit on stock-based compensation expense — (519) — — (519) — (519) Return of capital — — — — — (45,339) (45,339) Other — — 6,900 — 6,900 2,118 9,018 The accompanying notes are an integral part of these consolidated financial statements. Annual Report and Accounts 2019 Page | 82 Balance at December 31, 201920,4432,879,625(1,497,003)231,8661,634,931539,7572,174,688 Dividends paid——(163,503)—(163,503)(62,522)(226,025) Shares issued under stock award plans22(1,613)——(1,591)—(1,591) Capital increase—————1,4991,499 Other comprehensive income (loss), net of tax———5,6555,655(15,906)(10,251) Other—13—4—4 Return of capital—————(45,967)(45,967) Shares issued upon exercise of stock Stock-based compensation expense (Note 21)—22,896——22,896—22,896 Capital increase—————319,254319,254 Total comprehensive (loss) income——(144,375)(72,436)(216,811)39,312(177,499) Net (loss) income——(144,375)—(144,375)58,003(86,372) Balance at December 31, 201720,3442,845,190(1,073,935)298,6472,090,246337,8492,428,095
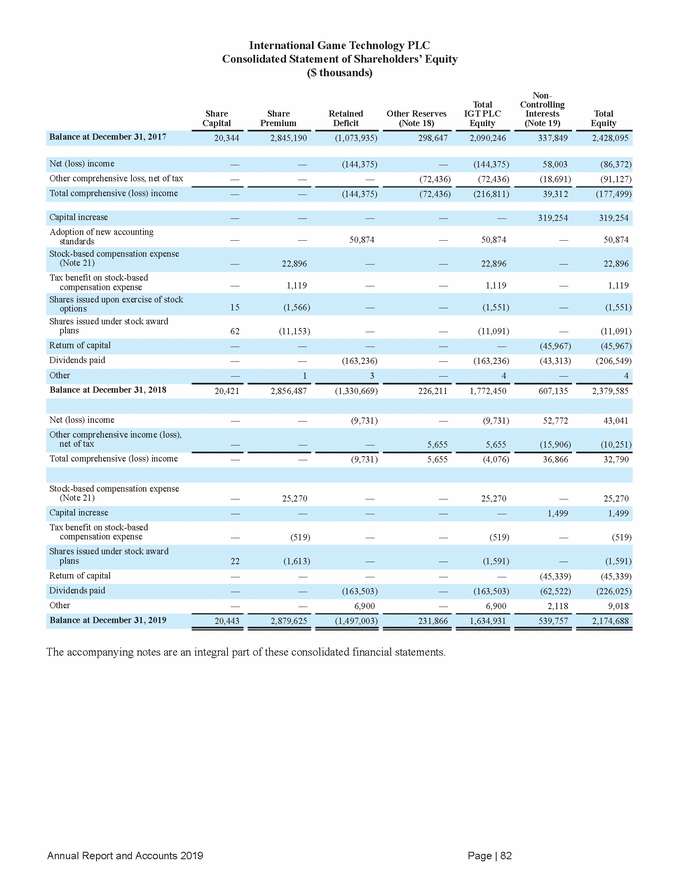
International Game Technology PLC Notes to the Consolidated Financial Statements 1.Description of Business International Game Technology PLC (the "Parent"), together with its consolidated subsidiaries (collectively referred to as "IGT PLC," the "Company," "we," "our," or "us"), is a global leader in gaming that delivers entertaining and responsible gaming experiences for players across all channels and regulated segments, from Gaming Machines and Lotteries to Sports Betting and Digital. We operate and provide an integrated portfolio of innovative gaming technology products and services, including: lottery management services, online and instant lottery systems, gaming systems, instant ticket printing, electronic gaming machines, sports betting, digital gaming, and commercial services. We have a local presence and relationships with governments and regulators in more than 100 countries around the world. We are majority owned by De Agostini S.p.A. ("De Agostini"), a century-old publishing, media, and financial services company that is incorporated in Italy. Our remaining shares not held by De Agostini are publicly held. De Agostini is the smallest group to consolidate these financial statements and is majority owned by B&D Holding di Marco Drago e C. S.a.p.a. ("B&D") which is incorporated in Italy and the largest group to consolidate these financial statements. B&D is wholly owned by the Boroli and Drago families. 2.Summary of Significant Accounting Policies The principal accounting policies adopted are set out below and have been consistently applied to all years presented, unless otherwise noted. Basis of Preparation The accompanying consolidated financial statements and notes of the Company, prepared for statutory purposes, have been prepared on a going concern basis and in accordance with International Financial Reporting Standards ("IFRS") and IFRS Interpretations Committee ("IFRS IC") interpretations as adopted by the European Union and the Companies Act 2006 applicable to companies reporting under IFRS. For internal and external reporting purposes, we also apply accounting principles generally accepted in the United States of America, which is our primary accounting standard for setting financial and operational performance targets. Refer to Note 26, Subsequent Events and the Directors’ Report - Going concern contained in this Annual Report and Accounts. The consolidated financial statements have been prepared on a historical cost basis unless otherwise stated. The consolidated financial statements are stated in thousands of U.S. dollars (except share, per share, and employee headcount data) unless otherwise indicated. We have reclassified certain prior period amounts to align with the current period presentation. All references to "U.S. dollars," "U.S. dollar" and "$" refer to the currency of the United States of America. All references to "euro" and "€" refer to the currency introduced at the start of the third stage of the European Economic and Monetary Union pursuant to the Treaty on the Functioning of the European Union, as amended. Principles of Consolidation The consolidated financial statements include the accounts of the Parent and our majority-owned or controlled subsidiaries. Intercompany accounts and transactions have been eliminated in consolidation. Earnings or losses attributable to non-controlling interests in a subsidiary are included in net income (loss) in the consolidated statement of operations. Investments in which we have the ability to exercise significant influence, but do not control, and with respect to which we are not the primary beneficiary, are accounted for using the equity method of accounting. Investments in which we have no ability to exercise significant influence are accounted for using the cost method of accounting. Equity and cost method investments are included within other non-current assets on the consolidated balance sheet. Annual Report and Accounts 2019 Page | 83
Critical Estimates, Judgments, and Assumptions The preparation of financial statements in conformity with IFRS requires management to make estimates, judgments, and assumptions that affect the amounts reported in the consolidated financial statements and accompanying disclosures. These estimates, judgments, and assumptions are used for, but not limited to, revenue recognition, allowance for credit losses, evaluation of long-lived assets for impairment, legal and other contingencies, and income taxes. Detailed information about each of these estimates, judgments, and assumptions is included in their respective notes, together with information about the basis of calculation for each affected line item in the financial statements. We evaluate our estimates continuously and base them on historical experience and on various other assumptions that we believe to be reasonable under the circumstances. As future events and their effects cannot be determined with precision, actual results may differ significantly from these estimates. Revenue Recognition We account for a contract with a customer when: i. ii. iii. iv. v. we have written approval; the contract is committed; the rights of the parties, including payment terms, are identified; the contract has commercial substance; and collectability of consideration is probable. A performance obligation is a promise in a contract with a customer to transfer products or services that are distinct. If we enter into two or more contracts at or near the same time, the contracts may be combined and accounted for as one contract, in which case we determine whether the services or products in the combined contract are distinct. A service or product that is promised to a customer is distinct if both of the following criteria are met: • The customer can benefit from the service or product either on its own or together with other resources that are readily available to the customer; and Our promise to transfer the service or product to the customer is separately identifiable from other promises in the contract. • Revenue is recognized when (or as) control of a promised service or product transfers to a customer, in an amount that reflects the consideration (which represents the transaction price) to which we expect to be entitled in exchange for transferring that service or product. If the consideration promised in a contract includes a variable amount, we estimate the amount to which we expect to be entitled using either the expected value or most likely amount method. Our contracts may include terms that could cause variability in the consideration, including, for example, rebates, volume discounts, service-level penalties, and performance bonuses or other forms of contingent revenue. Our standard payment terms dictate that payment is due upon receipt of invoice, payable within 30 days. Invoices are generally issued as control transfers and/or as services are rendered. Additionally, in determining the transaction price, we adjust the promised amount of consideration for the effects of the time value of money if the payment terms are not standard and the timing of payments agreed to by the parties to the contract provide the customer or the Company with a significant benefit of financing, in which case the contract contains a significant financing component. Most arrangements that contain a significant financing component include explicit financing terms. We may include subcontractor services or third-party vendor services or products in certain arrangements. In these arrangements, revenue from sales of third-party vendor services or products are recorded net of costs when we are acting as an agent between the customer and the vendor, and gross when we are the principal for the transaction. To determine whether we are an agent or principal, we consider whether we obtain control of the services or products before they are transferred to the customer. In making this evaluation, several factors are considered, most notably whether we have primary responsibility for fulfillment to the customer, as well as inventory risk and pricing discretion. Annual Report and Accounts 2019 Page | 84
Service Revenue Service revenue is derived from the following sources: • • • • Operating and Facilities Management Contracts; Lottery Management Agreements ("LMA"); Machine Gaming; and Other Services. Operating and Facilities Management Contracts Our revenue from operating contracts, primarily from the Italy segment, is derived from long-term exclusive operating licenses. Under operating contracts, we manage all the activities along the lottery value chain including collecting wagers, paying out prizes, managing all accounting and other back-office functions, running advertising and promotions, operating data transmission networks and processing centers, training staff, providing retailers with assistance, and supplying materials for the game. In most cases, the arrangement is accounted for as a single performance obligation composed of a series of distinct services that are substantially the same and have the same pattern of transfer (i.e., distinct days of service). Under operating contracts, we typically satisfy the performance obligation and recognize revenue over time because the customer simultaneously receives and consumes the benefits provided as we perform the services. The amount of consideration to which we are typically entitled is variable based on a percentage of sales. Revenue is typically recognized in the amount that we have the right to invoice the customer as this corresponds directly with the value to the customer of our performance completed to date. In arrangements where we are performing services on behalf of the government and the government is considered our customer, revenue is recognized net of prize payments, taxes, retailer commissions, and remittances to state authorities. Under operating contracts, we are generally required to pay an upfront license fee. Refer to the Upfront License Fee policy below for further details. Our revenue from facilities management contracts ("FMC") is generated by assembling, installing, and operating the online lottery system and related point-of-sale equipment. Under a typical FMC, we maintain ownership of the technology and are responsible for capital investments throughout the duration of the contract. FMCs typically include a wide range of support services that are provided throughout the contract and are part of the integrated solution that the customer has contracted to obtain. In most cases, the arrangement is accounted for as a single performance obligation composed of a series of distinct services that are substantially the same and that have the same pattern of transfer. Under FMCs, we typically satisfy the performance obligation and recognize revenue over time because the customer simultaneously receives and consumes the benefits provided as we perform the services. The amount of transaction price to which we are entitled is typically variable based on a percentage of sales. Revenue is typically recognized in the amount that we have the right to invoice the customer, as this corresponds directly with the value to the customer of our completed performance. Lottery Management Agreements Our revenue from LMAs is derived from two exclusive contracts within the North America Lottery segment. Similar to operating contracts, under LMAs we manage all the activities along the lottery value chain including collecting wagers, paying out prizes, managing all accounting and other back-office functions, running advertising and promotions, operating data transmission networks and processing centers, training staff, providing retailers with assistance, and supplying materials for the game. The arrangement is accounted for as a single performance obligation composed of a series of distinct services that are substantially the same and that have the same pattern of transfer (i.e., distinct days of service). In LMAs, we satisfy the performance obligation and recognize revenue over time because the customer simultaneously receives and consumes the benefits provided as we perform the services. These contracts are annual cost reimbursable contracts with incentives based on the achievement of contractual metrics. Annually, we estimate the amount of incentive to which we expect to be entitled and recognize the incentive and gross revenues on costs incurred as we perform the service. Changes in the annual estimated incentive are made cumulatively each reporting period. Under LMAs, we can be required to pay an upfront license fee. Refer to the Upfront License Fee policy below for further details. Machine Gaming Our revenue from machine gaming services is generated by providing customers with proprietary land-based gaming systems and equipment under a variety of recurring revenue arrangements, including a percentage of amounts wagered, a percentage of net win, or a fixed daily/monthly fee. Included in machine gaming services are Wide Area Progressive ("WAP") systems. WAP systems consist of linked slot machines located in multiple casino properties, connected to a central computer system. WAP systems include a Company-sponsored Annual Report and Accounts 2019 Page | 85
progressive jackpot that increases with every wager until a player wins the top award combination. Casinos with WAP machines pay a percentage of amounts wagered for services related to the design, assembly, installation, operation, maintenance, and marketing of the WAP systems, as well as funding and administration of Company-sponsored progressive jackpots. A portion of the total fee collected is allocated to the WAP jackpot. Since the jackpot is a payment to the customer, the portion allocated to the jackpot is classified as a reduction of revenue. In some arrangements, there is a single performance obligation composed of a series of distinct services that are substantially the same and that have the same pattern of transfer (i.e., distinct days of service). The amount of transaction price to which we are entitled typically is variable based on a percentage of wagers. This results in revenue recognition that corresponds with the value to the customer for the services transferred in the amount that we have the right to invoice. In other arrangements where the end customer is the player, we record revenue net of prize payouts once the wagering outcome has been determined. Other Services We also generate revenue from other services, including sports betting and commercial services. We provide sports betting technology to lotteries and commercial operators in regulated markets, primarily in Italy and other countries in Europe as well as in the U.S. We currently offer two types of sports betting services: fixed odds contracts and sports pools arrangements. In fixed odds contracts, we establish and assume the risks related to the odds. The potential payout is fixed at the time bets are placed and we bear the risk of odds setting. We are responsible for collecting the wagers, paying prizes, and paying fees to retailers. We retain the remaining amounts as profits. We record revenue as wagers are collected, net of estimated prize payouts. Our revenue from sports pools arrangements is derived from the management of sports pools where the prizes are divided among those players who select the correct outcome. There are no odds involved in sports pools and each winner’s payoff depends on the number of players and the size of the pool. Under sports pools arrangements, we collect the wagers, pay prizes, pay a percentage fee to retailers, withhold our fee, and remit the balance to the respective regulatory agency. We assume no risk associated with sports pool wagering. Under these contracts, we record revenue net of prize payouts, retailer commissions, and remittances to state authorities once the event occurs. We also develop technology to enable lotteries to offer commercial services over their existing lottery infrastructure or over standalone networks separate from the lottery. Leveraging our distribution network and secure transaction processing, we offer high-volume processing of commercial transactions including: prepaid cellular telephone recharges, bill payments, e-vouchers and retail-based programs, electronic tax payments, stamp duty services, prepaid card recharges, and money transfers. These services are primarily offered outside of North America. In most cases, these arrangements are considered to be short in duration. The amount of transaction price that we are typically entitled to is variable based on the number of transactions processed. Revenue is typically recognized in the amount that we have the right to invoice the customer as this corresponds directly with the value to the customer of our completed performance. Our contracts generally include other services, including telephone support, software maintenance, content licensing, hardware maintenance, and the right to receive unspecified upgrades or enhancements on a when-and-if-available basis, and other professional services. Fees earned for other services are generally recognized as service revenue in the period the service is performed (i.e., over the support period). Product Sales Product sales are derived from the following sources: • • Lottery and gaming machines, including game content; and Lottery and gaming systems and other. Lottery and Gaming Machines, including Game Content Our revenue from the sale of lottery and gaming machines includes game content, non-machine gaming services related equipment, licensing and royalty fees, and component parts (including game themes and electronics conversion kits). Our credit terms are predominantly short-term in nature. We also grant extended payment terms under contracts where the sale is typically secured by the related equipment sold. Revenue from the sale of lottery and gaming machines is recognized based upon the contractual terms of each arrangement, but predominantly upon transfer of physical possession of the goods or the lapse of customer acceptance Annual Report and Accounts 2019 Page | 86
provisions. If the sale of lottery and gaming machines includes multiple performance obligations, these arrangements are accounted for under arrangements with multiple performance obligations, discussed below. Lottery and Gaming Systems and Other Our revenue from the sale of lottery systems and gaming systems typically includes multiple performance obligations, where we assemble, sell, deliver, and install a turnkey system (inclusive of point-of-sale terminals, if applicable) or deliver equipment and license the computer software for a fixed price, and the customer subsequently operates the system. These arrangements generally include customer acceptance provisions and general rights to terminate the contract if we are in breach of the contract or at the convenience of the customer. Such arrangements include hardware, software, and professional services. In these arrangements, the performance obligation is satisfied over time if the customer controls the asset as it is created (i.e., when the asset is built at the customer site) or if our performance does not create an asset with an alternative use and we have an enforceable right to payment plus a reasonable profit for performance completed to date. If revenue is not recognized over time, it is recognized based upon the contractual terms of each arrangement, but predominantly upon transfer of physical possession of the goods or the satisfaction of customer acceptance provisions. Our other product sales are primarily derived from the production and sales of instant ticket games under multi-year contracts. In these arrangements, the performance obligation is generally satisfied at a point in time (i.e., upon transfer of control of the game tickets to the customer) based on the contractual terms of each arrangement. Arrangements with Multiple Performance Obligations We often enter into contracts that consist of any combination of services and products based on the needs of our customers, which may include post-contract support for the software and a contract for post-warranty maintenance service for the hardware. These contracts consist of multiple services and products, whereby the hardware and software may be delivered in one period and the software support and hardware maintenance services are delivered over time. To the extent that a service or product in an arrangement with multiple performance obligations is subject to other specific accounting guidance, that service or product is accounted for in accordance with such specific guidance. For all other distinct services and products in these arrangements, the arrangement transaction price is allocated to each performance obligation on a relative standalone selling price basis or another method that depicts the amount of consideration to which we expect to be entitled in exchange for transferring the promised services or products. If the services and products are not distinct, we determine an appropriate measure of progress based on the nature of our overall promise for the single performance obligation. To the extent we grant the customer the option to acquire additional services or products in one of these arrangements, we account for the option as a distinct performance obligation in the contract only if the option provides a material right to the customer that it would not receive without entering into the contract (i.e., a significant discount incremental to the range of discounts typically given for the service or product), in which case the customer in effect pays in advance for the option to purchase future services or products. We allocate a portion of the transaction price to the material right and recognize revenue when those future services or products are transferred or when the option expires. Standalone Selling Price We allocate the transaction price to each performance obligation on a relative standalone selling price ("SSP") basis. The SSP is the price at which we would sell a promised service or product separately to a customer. In some instances, we are able to establish SSP based on the observable prices of services or products sold separately in comparable circumstances to a similar customer. We typically establish an SSP range for our services and products that are reassessed on a periodic basis or when facts and circumstances change. In other instances, we may not be able to establish an SSP range based on observable prices, and we estimate the SSP by considering multiple factors including, but not limited to, overall market conditions, including geographic or regional specific factors, competitive positioning, competitor actions, internal costs, profit objectives, and pricing practices. Estimating SSP is a formal process that includes review and approval by management. Contract Costs Certain eligible, non-recurring costs incurred in the initial phases of service contracts are deferred and amortized ratably over the expected period of benefit, which includes anticipated contract renewals or extensions. Recurring operating costs in these contracts are recognized as incurred. Annual Report and Accounts 2019 Page | 87
Practical Expedients and Exemptions We report revenue net of any revenue-based taxes assessed by governmental authorities that are imposed on and concurrent with specific revenue-producing transactions. We generally expense sales commissions when incurred because the amortization period would have been one year or less. These costs are recorded within selling, general and administrative expenses in our consolidated statements of operations. For certain of our long-term contracts, we capitalize and amortize incremental costs of obtaining a contract (e.g., sales commissions) on a straight-line basis over the expected customer relationship period if we expect to recover those costs. We do not account for significant financing components if the period between when we transfer the promised service or product to the customer and when the customer pays for that service or product will be one year or less. We do not disclose the value of unsatisfied performance obligations for (i) contracts with an original expected length of one year or less, (ii) performance obligations for which we recognize revenue at the amount that we have the right to invoice for services performed, (iii) contracts for which variable consideration is accounted for in accordance with sales-based or usage-based royalty guidance, and (iv) wholly unperformed contracts. Contract Assets and Liabilities Contract assets arise from contracts when revenue is recognized over time and the amount of revenue recognized exceeds the amount billed to the customer. These amounts are included in contract assets until the right to payment is no longer conditional on events other than the passage of time. Contract liabilities include deferred revenue, advance payments, and billings in excess of revenue recognized. Stock-Based Compensation Stock-based compensation represents the cost related to stock-based awards granted to directors and employees. Stock-based compensation cost is measured at the grant date or modification date, based on the estimated fair value of the award and recognized as expense, net of estimated forfeitures, over the vesting period. For awards subject to graded vesting that contain only a service vesting condition, compensation cost is recognized on a straight-line basis over the entire award service period. For awards subject to graded vesting with a performance condition, when achievement of the performance condition is deemed probable, compensation cost is recognized by way of an accelerated attribution method over the awards’ expected vesting periods. Advertising Advertising costs are expensed as incurred. Advertising expense was $41.4 million and $61.5 million for the years ended December 31, 2019 and 2018, respectively. Research and Development Costs Research and development costs ("R&D"), which include salaries and benefits, stock-based compensation, consultants' fees, facilities-related costs, material costs, depreciation and travel, are expensed as incurred, as the criteria to capitalize development costs have not been met. Cash and Cash Equivalents Cash and cash equivalents consist primarily of highly liquid investments purchased with an original maturity of three months or less at the date of acquisition, such as bank deposits, money market funds, and interest bearing bank accounts with insignificant interest rate risk. The fair value of cash and cash equivalents approximates the carrying amount. Restricted Cash and Cash Equivalents We are required by gaming regulation to maintain sufficient reserves in restricted cash accounts to be used for the purpose of funding payments to WAP jackpot winners. These restricted cash balances are based primarily on the jackpot meters displayed to slot players, or for previously won jackpots, and vary by jurisdiction. Under our Italian Lotto contract, we deposit wagers, net of prizes paid and retailer commissions retained by the retailer at point of sale, into bank accounts, the use of which is restricted based on the contract with our customer. Restricted cash is also maintained for interactive digital player deposits, collections on factored Annual Report and Accounts 2019 Page | 88
and serviced receivables not yet paid through to the third-party owner, and for customer funds received in relation to the provision of our commercial services. These amounts are restricted based on the contracts with our customers or local regulations. Restricted cash equivalents are primarily composed of publicly-traded foreign government and corporate bonds and mutual funds, and are valued using quoted market prices. Allowance for Credit Losses We maintain an allowance for credit losses for the estimated probable losses on uncollectible trade and customer financing receivables. The allowance is estimated based upon the credit-worthiness of our customers, historical experience, and aging analysis, as well as current market and economic conditions. Receivables are written off against these allowances in the period they are determined to be uncollectible. We determine our allowances for credit losses on customer financing receivables based on two classes: contracts and notes. Contracts include extended payment terms granted to qualifying customers for periods from one to six years and are typically secured by the related products sold. Notes consist of development financing loans granted to select customers to assist in the funding of new or expanding gaming facilities, generally under terms of one to seven years, and are secured by the developed property and/or other customer assets. Customer financing interest income is recognized based on market rates prevailing at issuance. Inventories Inventories are stated at the lower of cost (applying the first in, first out method) and net realizable value. Allowances are made for defective, obsolete, or excess inventory. Systems, Equipment and Other Assets Related to Contracts, Net and Property, Plant and Equipment, Net We have two categories of fixed assets: systems, equipment and other assets related to contracts ("Systems & Equipment"); and property, plant and equipment ("PPE"). Systems & Equipment are assets that primarily support our operating contracts, FMCs, and WAP systems (collectively, the "Contracts") and are principally composed of lottery and gaming assets. PPE are assets we use internally, not associated with Contracts, primarily related to production and assembly, selling, general and administration, and R&D. Systems & Equipment and PPE are stated at cost, net of accumulated depreciation and accumulated impairment loss, if any. Depreciation commences when the asset is placed in service and is recognized on a straight-line basis over the estimated useful lives of the assets. Repair and maintenance costs are expensed as incurred, whereas major improvements that increase asset values and extend useful lives are capitalized. The estimated useful lives for Systems & Equipment depends on the type of asset. Lottery assets (such as terminals, mainframe computers, communications equipment, and software development costs) have estimated useful lives that generally do not exceed 10 years and commercial gaming machines have estimated useful lives of three to five years. The estimated useful lives for PPE is 40 years for buildings and five to 10 years for furniture and equipment. Leasehold improvements are amortized over the shorter of the lease term or estimated useful life. Systems & Equipment and PPE are tested for impairment whenever events or changes in circumstances indicate the carrying amount of those assets may not be recoverable. If the recoverable amount of an asset is estimated to be less than its carrying amount, the carrying amount of the asset is reduced to its recoverable amount. The Company calculates its recoverable amount as its fair value less costs to dispose. Goodwill The assets and liabilities of acquired businesses are recorded under the acquisition method of accounting at their estimated fair values at the date of acquisition. Goodwill represents costs in excess of fair values assigned to the underlying identifiable net assets of acquired businesses, and is stated at cost less accumulated impairment losses. Annual Report and Accounts 2019 Page | 89
Goodwill has been allocated to and is tested for impairment at the cash-generating unit level, which is the same level as our operating segment. We assess our cash-generating units annually and have identified the following four cash-generating units at December 31, 2019: North America Gaming and Interactive, North America Lottery, International, and Italy. Goodwill is tested for impairment annually, in the fourth quarter, or whenever events or changes in circumstances indicate the carrying amount may not be recoverable. We either first perform a qualitative assessment to determine whether it is more likely than not that the recoverable value of goodwill is less than its carrying amount and whether the quantitative analysis is necessary, or elect to perform a quantitative one-step process. The goodwill impairment test compares the recoverable value of a cash-generating unit with its carrying amount and an impairment loss is recognized for the amount by which the carrying amount exceeds the cash-generating unit's recoverable value. In performing the goodwill impairment test, we estimate the recoverable value of the cash-generating units using an income approach based on projected discounted cash flows. Other Intangible Assets Other intangible assets, which include indefinite-lived and definite-lived intangible assets, are stated at cost, less accumulated amortization and accumulated impairment losses. Indefinite-lived intangible assets are composed of trademarks for which there is no foreseeable limit of the period over which they are expected to generate net cash inflows. Definite-lived intangible assets, which are primarily composed of customer relationships and computer software and game library, are capitalized and amortized on a straight-line basis over their estimated economic lives. Amortization of software-related intangibles is included in cost of services and cost of product sales and amortization of other intangible assets is included in selling, general and administrative expenses in the consolidated statement of operations. The estimated economic lives of our definite-lived intangible assets are as follows: Estimated economic life Category Computer software and game library 3 - 14 years Customer relationships 3 - 20 years Trademarks 6 - 20 years Indefinite-lived intangible assets other than goodwill are tested for impairment annually, in the fourth quarter, or whenever events or changes in circumstances indicate the carrying amount may not be recoverable. We perform a quantitative analysis that compares the recoverable value of indefinite-lived intangible assets to their carrying amount and an impairment loss is recognized when the carrying amount exceeds the recoverable value. Capitalized Software Development Costs Costs incurred in the development of our externally-sold software products are expensed as incurred, except certain software development costs eligible for capitalization. Software development costs incurred subsequent to establishing technological feasibility and through the general release of the software products are capitalized. Capitalized costs are amortized over the products’ estimated economic life to cost of product sales in the consolidated statement of operations. Costs incurred during the application development phase of software for services provided to customers are capitalized as internal-use software and amortized over the useful life to cost of services. Costs incurred during the application of software for internal use are capitalized and amortized over the useful life to selling, general and administrative expenses in the consolidated statement of operations. Annual Report and Accounts 2019 Page | 90 Other4 - 17 years Developed technologies5 - 14 years Licenses3 - 15 years Sports betting rights7 years
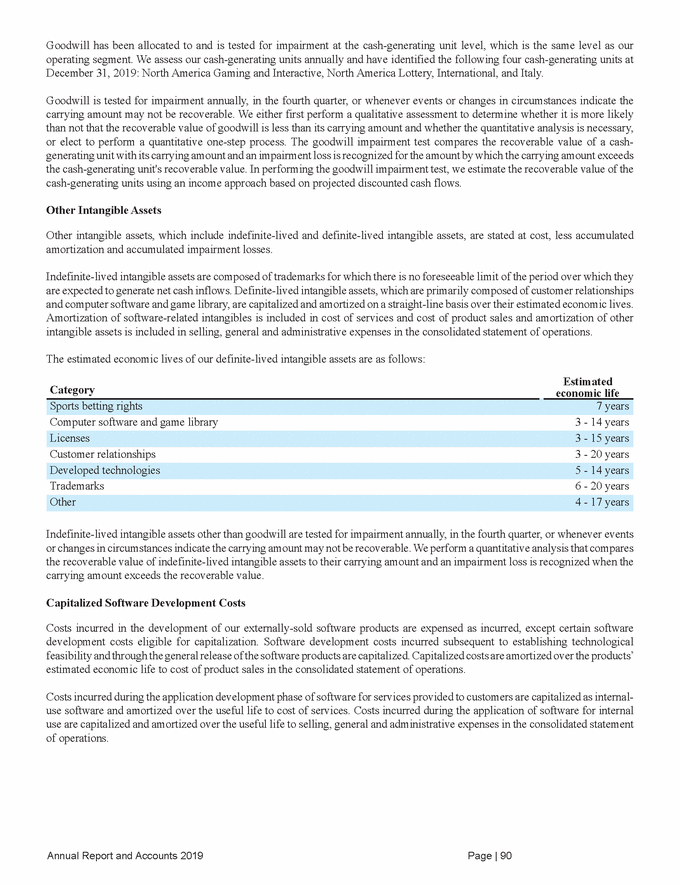
Upfront License Fees We periodically make long-term investments in contracts with customers and obtain licenses to supply products and services to the customers. As consideration, we pay license fees, which are classified as other non-current assets in the consolidated balance sheet. We recognize the amortization of the license fees as a reduction of service revenue over the estimated economic life of the license term. This method reflects the pattern in which economic benefits are expected to be realized. The recoverability of each payment is subject to significant estimates about future revenues related to the contracts' future cash flows. We evaluate these assets for impairment and update amortization rates on an agreement by agreement basis. The assets are reviewed for impairment whenever events or changes in circumstances indicate their carrying amount may not be recoverable. In periods in which payments are made to the customer, we classify the payment as a cash outflow from operating activities in the consolidated statement of cash flows. Jackpot Accounting We incur costs to fund jackpots and accrue jackpot liabilities with every wager on devices connected to a WAP system. Jackpot liabilities are estimated based on the size of the jackpot, the number of WAP units in service, variations and volume of play, and interest rate movements. Jackpots are generally payable to winners immediately, in the case of instant wins, or in equal annual installments over 20 to 26 years. Winners may elect to receive a lump sum payment for the present value of the jackpot discounted at applicable interest rates in lieu of periodic annual installments. Jackpot liabilities are composed of payments due to previous winners, and amounts due to future winners of jackpots not yet won. Liabilities due to previous winners for periodic payments are carried at the accreted cost of a qualifying U.S. government or agency annuity investment that may be purchased at the time of the jackpot win. If the periodic liability is not initially funded with an annuity investment, it is discounted and accreted using the risk-free rate at the time of the jackpot win. Liabilities due to future winners are recorded at the present value of the estimated amount of jackpots not yet won. We estimate the present value of these liabilities using current market rates, weighted with historical lump sum payout election ratios. Based on the most recent historical patterns, approximately 85% of winners will elect the lump sum payment option. The current portion of these liabilities are estimated based on historical experience with winner payment elections, in conjunction with the theoretical projected number of jackpots. Legal and Other Contingencies Loss contingency provisions arising from a legal proceeding or claim are recorded for probable and estimable losses at the best estimate of a loss when there is a range of possible outcomes, or when a best estimate cannot be made, at the midpoint of the range when any point in a continuous range is as likely as any other, the determination of which requires significant judgment. If it is reasonably possible but not probable that a liability has been incurred, or if the amount of a probable loss cannot be reasonably estimated, the amount or range of estimated loss is disclosed, if material. We evaluate our provisions for legal contingencies at least quarterly and, as appropriate, establish new provisions or adjust existing provisions to reflect the facts and circumstances known to us at the time, including information regarding negotiations, settlements, rulings, and other relevant events and developments; the advice of counsel; and the assumptions and judgment of management. Legal costs are expensed as incurred. Fair Value Measurements Financial assets are measured at either (i) amortized cost, (ii) fair value through profit and loss, or (iii) fair value through other comprehensive income. Financial liabilities are measured at (i) amortized cost or (ii) fair value through profit or loss. We account for certain financial assets and liabilities at fair value. Financial assets and liabilities are categorized, based on the inputs to the valuation technique, into a three-level fair value hierarchy. The fair value hierarchy gives the highest priority to the use of observable inputs and the lowest priority to the use of unobservable inputs. When inputs used to measure fair value fall within different levels of the hierarchy, the level within which the fair value measurement is categorized is based on the lowest level input that is significant to the fair value measurement. These levels are as follows: • • Level 1 - inputs are based upon unadjusted quoted prices for identical instruments in active markets. Level 2 - inputs are based upon quoted prices for similar instruments in active markets, quoted prices for identical or similar instruments in markets that are not active, and model-based valuation techniques for which all significant inputs are observable in the market or can be corroborated by observable market data for substantially the full term of the instruments. Annual Report and Accounts 2019 Page | 91
• Level 3 - inputs are unobservable and typically reflect management’s estimates of assumptions that market participants would use in pricing the asset or liability. The basis for measurement and categorization depends on the business model objective and the contractual cash flow characteristics of financial assets and liabilities. Derivative Financial Instruments We use derivative financial instruments for the management of foreign currency risks and interest rate risks. We do not enter into derivatives for speculative purposes. Derivatives are recognized as either assets or liabilities in the consolidated balance sheet at fair value. All derivatives are recorded gross, except netting of foreign exchange contracts and counterparty netting of interest receivable and payable related to interest rate swaps, as applicable. The accounting for changes in the fair value of a derivative depends on the nature of the hedge and the hedge effectiveness. Derivative gains and losses are reported in the consolidated statement of cash flows consistent with the classification of the cash flows from the underlying hedged items. For derivative instruments designated as cash flow hedges, gains and losses are recorded in other comprehensive income (loss) and are subsequently reclassified when the hedged item affects earnings. At that time, the amount is reclassified from other comprehensive income (loss) to the same income statement line as the earnings effect of the hedged item. For derivative instruments designated as fair value hedges, changes in fair value are recorded in interest income (expense) and are offset by changes in the fair value of the underlying debt instrument due to changes in the benchmark interest rate. For derivative instruments designated as net investment hedges, the spot portion of the derivative gain or loss is reported in foreign currency translation within other comprehensive income (loss) to offset any gains or losses on translation of the net investment in the subsidiary. All other components of the derivative fair value will be reported in income, as either interest income or interest expense, on an amortized basis. Derivative instruments not designated as hedges are recognized in the consolidated balance sheet at fair value with the changes in fair value recorded in foreign exchange gain (loss), net in the consolidated statement of operations. Leases We determine whether a contract is or contains a lease at inception. As a lessee, we recognize right-of-use ("ROU") assets and lease liabilities on the lease commencement date based on the present value of lease payments over the lease term. ROU assets also include any upfront lease payments or initial direct costs and are adjusted for lease incentives received. We consider renewal and termination options, including whether they are reasonably certain to be exercised, in determining the lease term and establishing the ROU assets and lease liabilities. ROU assets and lease liabilities are calculated using our incremental borrowing rate, which is based on the lease currency and length of the lease, unless the implicit rate is determinable. Most of our lease contracts contain both lease and non-lease components. As a lessee, we combine lease and non-lease components into a single lease component for all classes of underlying assets except certain communication equipment. For certain communication equipment, we allocate the consideration between lease and non-lease components based on relative standalone price. Variable lease payments are generally expensed as incurred except for certain rent payments that depend on an index, which are included in lease payments using the index rate in effect as of the lease commencement date. When the lease payments are adjusted for changes in the index, we will remeasure the ROU asset and lease liability. Short-term leases, which are leases with an initial term of 12 months or less with no purchase options, are not recognized on the balance sheet. The rental payments are recognized as lease expense on a straight-line basis over the lease term. Certain of our lottery and certain of our commercial gaming arrangements include leases for equipment installed at customer locations as part of our long-term service contracts. As the lessor, we evaluate whether the leases are classified as finance or operating leases and recognize revenue based on that evaluation. Finance leases are recognized as product sale revenue while operating leases are recognized as service revenue. Annual Report and Accounts 2019 Page | 92
Income Taxes Deferred tax assets and liabilities are recognized for the expected future tax consequences of events that have been included in the financial statements or tax returns. Deferred tax assets and liabilities are determined based on the difference between the tax basis of assets and liabilities and their reported amounts using the enacted tax rates in effect for the year in which the differences are expected to reverse. Tax credits are generally recognized as reductions of income tax provisions in the year in which the credits arise. The measurement of deferred tax assets is not recorded if, based upon available evidence, it is more likely than not that some or all of the deferred tax assets will not be realized. The effect of a change in income tax rates is recognized as income or expense in the period that includes the enacted or substantively enacted date. Accounting for uncertainty in income taxes recognized in the consolidated financial statements is in accordance with accounting authoritative guidance, which prescribes a two-step process to determine the amount of tax benefit to be recognized. First, the tax position must be evaluated to determine the likelihood that it will be sustained upon external examination. If the tax position is deemed "more likely than not" to be sustained, the tax position is then assessed to determine the amount of the benefit to recognize in the consolidated financial statements. The amount of the benefit that may be recognized is the largest amount that has a greater than 50 percent likelihood of being realized upon ultimate settlement. We recognize interest and penalties related to unrecognized tax benefits on the provision for taxes line of the consolidated statement of operations. Accrued interest and penalties are included on the related tax liability line in the consolidated balance sheet. We use the period cost method for global intangible low-taxed income ("GILTI") provisions and therefore have not recorded deferred taxes for basis differences expected to reverse in future periods. Foreign Currency Translation The financial statements of subsidiaries located outside of the United States with functional currencies other than the U.S. dollar are translated into U.S. dollars, with the resulting translation adjustments recorded as a component of other reserves within shareholders’ equity. Assets and liabilities are translated into U.S. dollars using the exchange rates in effect at the balance sheet date, while income and expense items are translated using the average exchange rates during the period. New Accounting Standards - Recently Adopted In January 2016, the International Accounting Standards Board ("IASB") issued International Financial Reporting Standard 16 Leases ("IFRS 16") to increase transparency and comparability among organizations by recognizing lease assets and liabilities on the balance sheet and disclosing key information about leasing arrangements. IFRS 16 introduces a single lease accounting model that requires entities to recognize assets and liabilities on the balance sheet for most lease arrangements, similar to the accounting for finance lease arrangements in the previous guidance. We adopted IFRS 16 as of January 1, 2019 using the modified retrospective approach. We applied the transition provisions in IFRS which required that we recognize a lease liability for leases previously classified as an operating lease and that lease liability is measured at the present value of the remaining lease payments, discounted using our incremental borrowing rate. We also recorded a ROU asset at an amount equal to the lease liability adjusted for any previously recognized prepaid or accrued leases payments. In addition, we assessed impairment of the ROU asset as of January 1, 2019. For leases previously classified as finance leases, the lease liabilities and lease assets as of December 31, 2018 were carried forward as the lease liability and ROU asset as of January 1, 2019. We elected to apply the transition expedients to not reassess whether a contract is, or contains, a lease as of January 1, 2019 and to use hindsight in determining the lease term and assessing impairment. Our election of the hindsight practical expedient resulted in longer lease terms for certain existing leases. The adoption of the new standard resulted in the recognition of ROU assets and lease liabilities of $376.6 million and $393.1 million, respectively for leases previously classified as operating leases. For these lease liabilities recognized as of January 1, 2019, we applied a weighted-average incremental borrowing rate of 6.41%. There was no impact to retained earnings on January 1, 2019. The adoption will impact our consolidated statements of operations, comprehensive income, and cash flows as all leases now reflect depreciation and interest expense rather than lease expense. Operating lease commitments were $452.7 million as of December 31, 2018 under IAS 17. If these commitments were discounted using the incremental borrowing rate as of January 1, 2019, then the resulting present value amount would be less than the recognized lease liability of $393.1 million because the calculation of the lease liability under IFRS 16 includes additional lease payments for renewal options that are reasonably certain to be exercised and termination options that are not reasonably certain to be exercised. Annual Report and Accounts 2019 Page | 93
New Accounting Standards - Not Yet Adopted We do not currently expect that any recently issued accounting guidance will have a significant effect on the consolidated financial statements. 3.Revenue Recognition Disaggregation of Revenue The following tables summarizes customer contract revenue disaggregated by reportable segment and the source of the revenue for the years ended December 31, 2019 and 2018: For the year ended December 31, 2019 North America Gaming and Interactive North America Lottery ($ thousands) International Italy Other Total Lottery Management Agreements — 108,032 — — — 108,032 Other services 212,592 59,984 64,051 373,900 722 711,249 Gaming machines 321,217 — 259,424 — — 580,641 Product sales 451,382 92,816 379,881 981 — 925,060 For the year ended December 31, 2018 North America Gaming and Interactive North America Lottery ($ thousands) International Italy Other Total Lottery Management Agreements — 129,104 — — — 129,104 Other services 204,029 53,645 72,697 349,053 723 680,147 Gaming machines 261,696 — 193,092 — — 454,788 Product sales 378,693 80,833 324,486 930 — 784,942 Annual Report and Accounts 2019 Page | 94 Total revenue1,003,1691,191,902819,9831,813,7607234,829,537 Systems and other116,99742885,071930—203,426 Lottery product—80,40546,323——126,728 Service revenue624,4761,111,069495,4971,812,8307234,044,595 Machine gaming420,44799,679139,936672,202—1,332,264 Operating and Facilities Management Contracts—828,641282,864791,575—1,903,080 Total revenue1,070,6471,165,199840,1881,705,6687224,782,424 Systems and other130,1651,529101,956981—234,631 Lottery product—91,28718,501——109,788 Service revenue619,2651,072,383460,3071,704,6877223,857,364 Machine gaming406,67397,013111,839572,242—1,187,767 Operating and Facilities Management Contracts—807,354284,417758,545—1,850,316
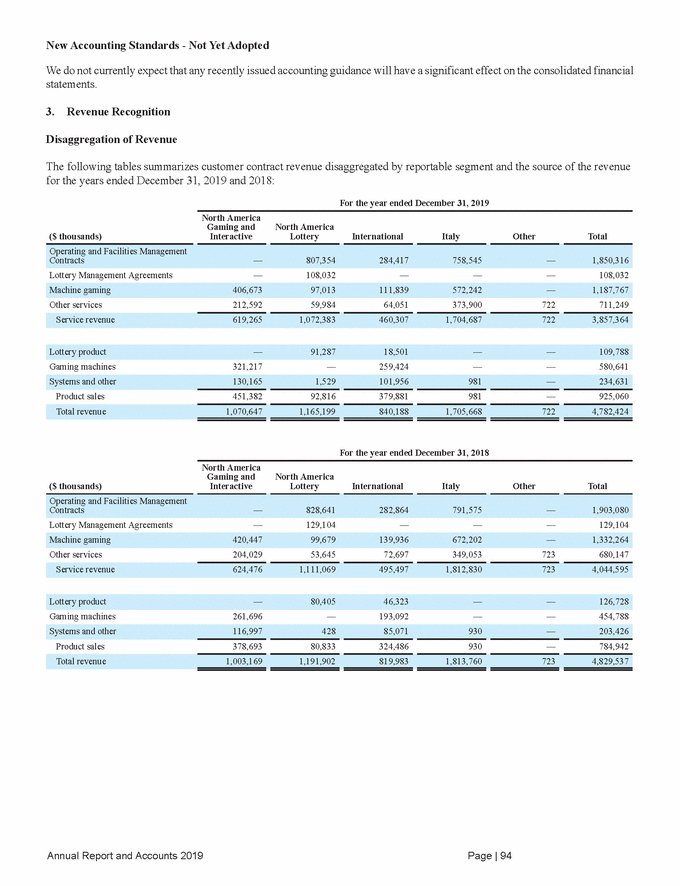
Contract Balances Information about receivables, contract assets, and contract liabilities is as follows: December 31, 2019 December 31, 2018 ($ thousands) Balance Sheet Classification Current 47,499 58,739 Other current assets 123,687 128,430 Contract liabilities: Non-current (65,855) (67,022) Other non-current liabilities The amount of revenue recognized during the year ended December 31, 2019 that was included in the contract liabilities balance at December 31, 2018 was $50.7 million. The amount of revenue recognized during the year ended December 31, 2018 that was included in the contract liabilities balance at January 1, 2018 was $44.5 million. Transaction Price Allocated to Remaining Performance Obligations At December 31, 2019, unsatisfied performance obligations for contracts expected to be greater than one year, or performance obligations for which we do not have a right to consideration from the customer in the amount that corresponds to the value to the customer for our performance completed to date, variable consideration which is not accounted for in accordance with the sales-based or usage-based royalties guidance, or contracts which are not wholly unperformed were approximately 9% of our annual revenue for 2019, of which approximately 26% is expected to be satisfied within one year and the remainder is expected to be satisfied over the subsequent 8 years. 4.Trade and Other Receivables, net Trade and other receivables are recorded at cost, net of allowances for credit losses. December 31, ($ thousands) 2019 2018 (51,362) (59,424) Allowance for credit losses The following table presents the activity in the allowance for credit losses: December 31, ($ thousands) 2019 2018 Recoveries (provisions), net 2,920 (10,800) Foreign currency translation 729 2,869 Balance at end of year (51,362) (59,424) Annual Report and Accounts 2019 Page | 95 Other294(392) Amounts written off as uncollectible4,1192,222 Balance at beginning of year(59,424)(53,323) Net1,006,127949,085 Gross1,057,4891,008,509 (132,604)(139,027) Current(66,749)(72,005) Other current liabilities Non-current76,18869,691Other non-current assets Contract assets: Receivables, net1,006,127949,085Trade and other receivables, net
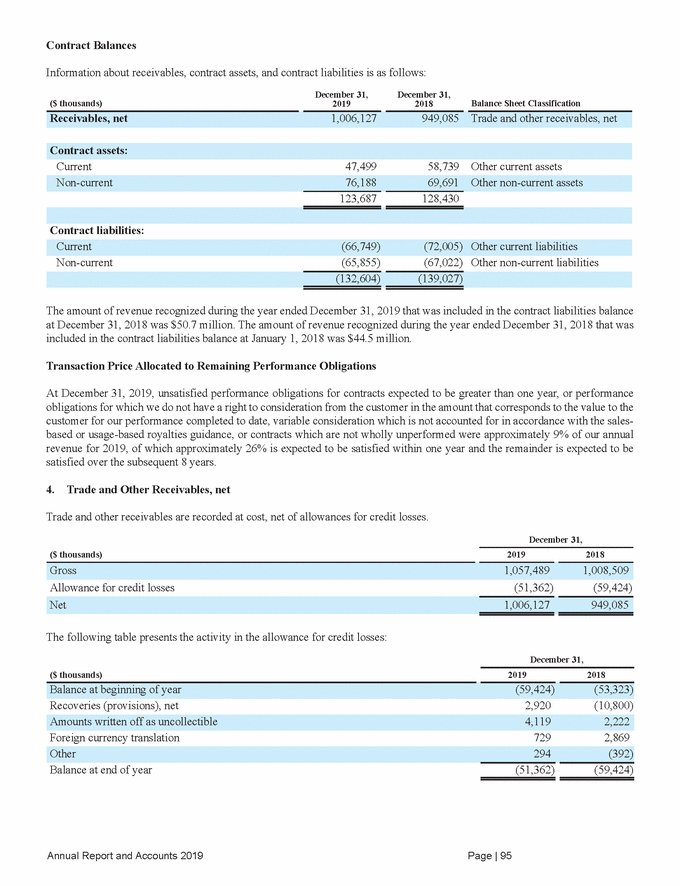
The following table presents an analysis of our past due trade and other receivables, gross of allowance for credit losses: For the year ended December 31, 2019 For the year ended December 31, 2018 ($ thousands) $ % $ % Past due: 31 - 60 days 23,958 2.3 16,656 1.7 91 - 180 days 7,833 0.7 19,441 1.9 1,057,489 100.0 1,008,509 100.0 5.Inventories December 31, ($ thousands) 2019 2018 Work in progress 11,663 32,835 Inventories, gross 195,435 322,583 Inventories, net 161,790 282,698 The following table presents the activity in the obsolescence reserve: December 31, ($ thousands) 2019 2018 Provisions, net (28,970) (14,199) Foreign currency translation (130) 408 Balance at end of year (33,645) (39,885) The cost of inventories related to product sales that were recognized as an expense during 2019 and 2018 was $472.5 million and $422.3 million, respectively. Annual Report and Accounts 2019 Page | 96 Other11,965— Amounts written off23,375817 Balance at beginning of year(39,885)(26,911) Obsolescence reserve(33,645)(39,885) Finished goods96,895117,519 Raw materials86,877172,229 Over 180 days35,5533.448,4314.8 61 - 90 days19,1171.817,4731.7 1 - 30 days56,5185.371,2097.1 Current914,51086.5835,29982.8
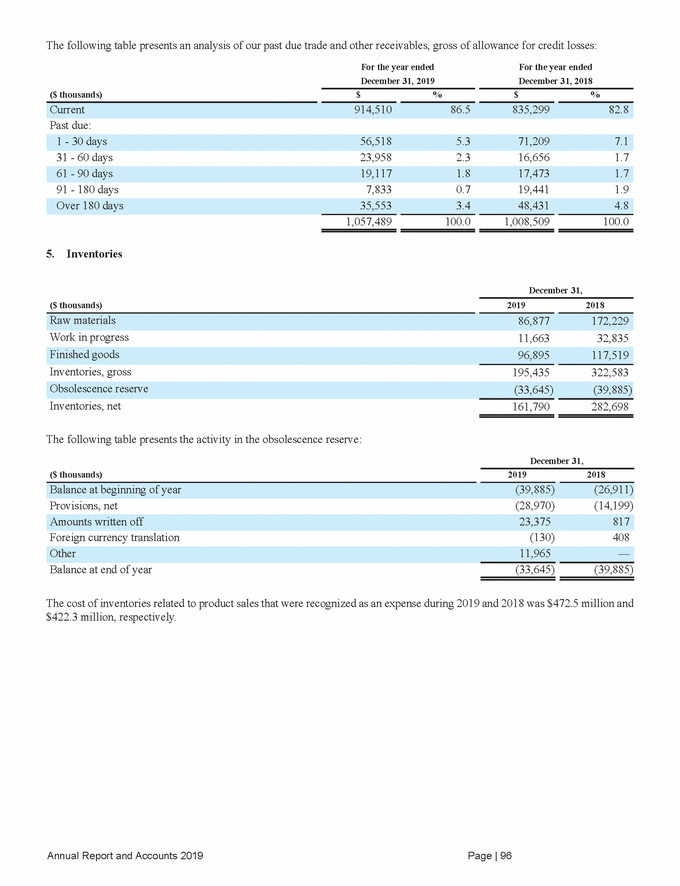
6.Other Assets Other Current Assets December 31, ($ thousands) Note 2019 2018 Other receivables 64,293 61,055 Value-added tax ("VAT") receivable 53,148 60,232 Prepaid expenses 41,520 47,781 Other 48,266 38,486 Other Non-Current Assets December 31, ($ thousands) Notes 2019 2018 Italian Scratch & Win 873,756 992,333 New Jersey 83,209 91,970 1,547,227 1,786,720 Customer financing receivables, net 122,124 88,354 Deferred income taxes 16 27,108 38,117 Debt issuance costs 15 20,464 — 1,901,678 2,158,687 Upfront License Fees The upfront license fees are being amortized on a straight-line basis as follows: Upfront License Fee License Term Amortization Start Date Italian Lotto 9 years December 2016 Indiana 15 years July 2013 Yeonama Holdings Co. Limited ("Yeonama") In May 2019, we sold our ownership interest in Yeonama, an investment previously included within other non-current assets on the consolidated balance sheet. The sale resulted in a pre-tax gain of €26.1 million ($29.1 million at the May 31, 2019 exchange rate). Annual Report and Accounts 2019 Page | 97 New Jersey15 years, 9 monthsOctober 2013 Italian Scratch & Win9 yearsOctober 2019 Other83,475111,207 Prepaid royalties25,09264,598 Contract assets376,18869,691 Indiana11,85313,247 Italian Lotto578,409689,170 Upfront license fees, net: 563,561528,353 Prepaid royalties24,99952,712 Contract assets347,49958,739 Income taxes receivable56,85739,075 Customer financing receivables, net226,979170,273
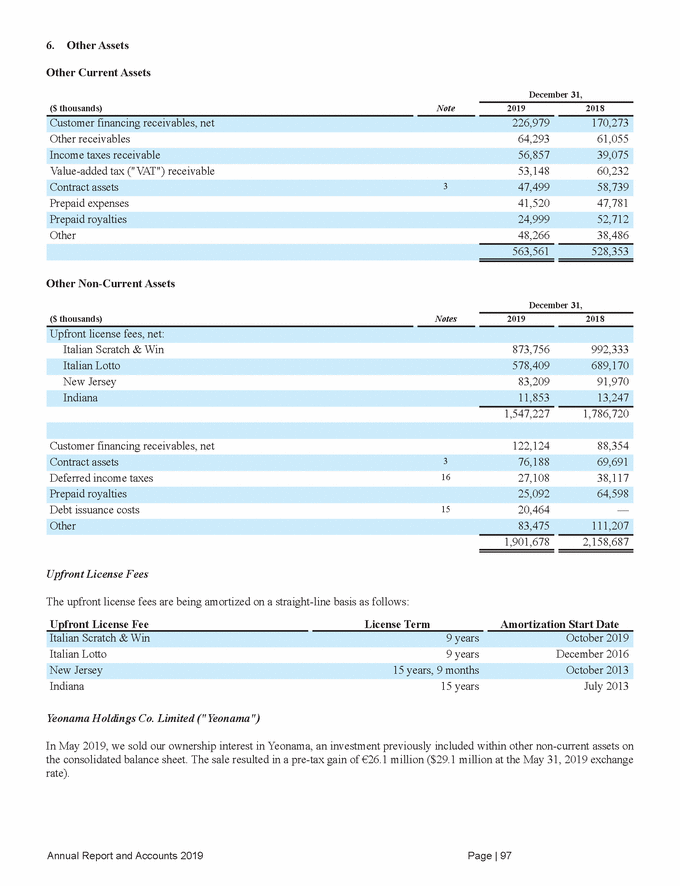
Customer Financing Receivables Customer financing receivables, net are recorded at amortized cost. December 31, 2019 Allowance for credit losses ($ thousands) Gross Net Non-current 125,542 (3,418) 122,124 December 31, 2018 Allowance for credit losses ($ thousands) Gross Net Non-current 91,005 (2,651) 88,354 The following table presents the activity in the allowance for credit losses: December 31, ($ thousands) 2019 2018 Provisions, net (2,477) (10,131) Foreign currency translation 15 179 The following table presents an analysis of our past due customer financing receivables, gross of allowance for credit losses: For the year ended December 31, 2019 For the year ended December 31, 2018 ($ thousands) $ % $ % Past due: 31 - 60 days 6,303 1.7 5,323 1.9 91 - 180 days 6,934 1.8 7,877 2.7 380,763 100.0 287,836 100.0 Annual Report and Accounts 2019 Page | 98 Over 180 days33,0678.742,34314.7 61 - 90 days3,5310.93,2731.1 1 -30 days15,8704.219,4616.8 Current315,05882.7209,55972.8 Balance at end of year(31,660)(29,209) Amounts written off as uncollectible11317 Balance at beginning of year(29,209)(19,574) 287,836(29,209)258,627 Current196,831(26,558)170,273 380,763(31,660)349,103 Current255,221(28,242)226,979
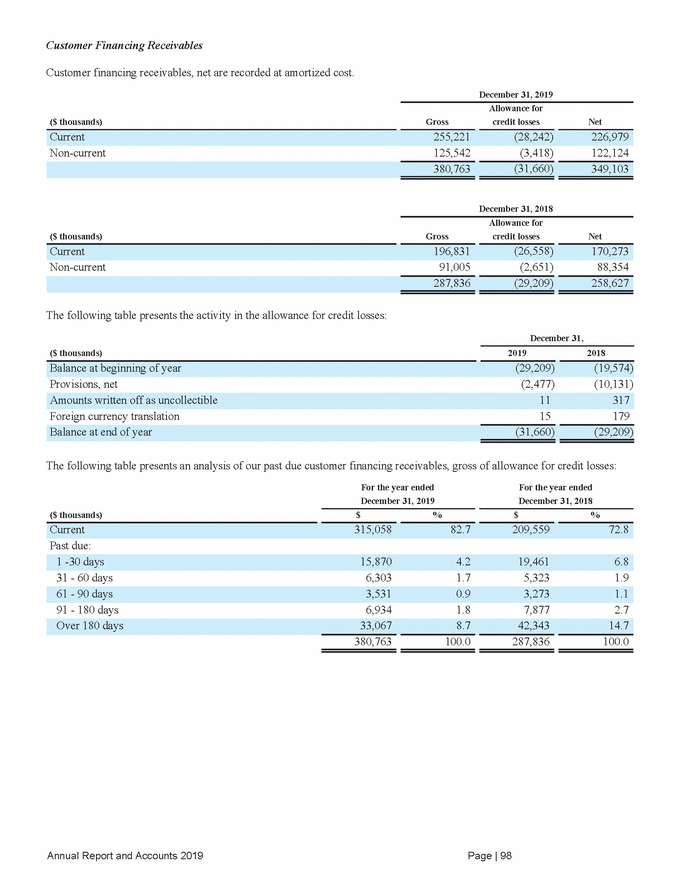
7.Fair Value of Financial Assets and Liabilities Financial Assets and Liabilities Measured at Fair Value on a Recurring Basis Our significant financial assets and liabilities measured at fair value on a recurring basis as of December 31, 2019 and 2018 are as follows: December 31, 2019 Total Fair Value ($ thousands) Balance Sheet Location Level 1 Level 2 Level 3 Derivative assets Other current and other non-current assets — 8,317 2,471 10,788 Derivative liabilities Other current and other non-current liabilities — 6,425 — 6,425 December 31, 2018 Total Fair Value ($ thousands) Balance Sheet Location Level 1 Level 2 Level 3 Restricted cash equivalents Restricted cash and cash equivalents 56,550 — — 56,550 Equity investments Other non-current assets 6,585 — 13,509 20,094 Liabilities: Valuation Techniques Derivative assets and liabilities classified as Level 2 were derived from quoted market prices for similar instruments or by discounting the future cash flows with adjustments for credit risk as appropriate. All significant inputs were derived from or corroborated by observable market data including current forward exchange rates and LIBOR rates, among others. The Level 3 derivative asset was valued based on a free cash flow forecast. Equity investments classified as Level 2 were valued using quoted market prices. Level 3 equity investments are carried at cost, which approximates fair value. Restricted cash equivalents are primarily composed of publicly-traded foreign government and corporate bonds and mutual funds, and were valued using quoted market prices. At December 31, 2019 and 2018, the carrying amounts for cash and cash equivalents, restricted cash, trade and other receivables, other current assets, accounts payable, and other current liabilities approximated their estimated fair values because of their short-term nature. Financial Assets Measured at Fair Value on a Nonrecurring Basis Our assessment of goodwill for impairment includes various inputs, including forecasted revenue, forecasted operating profits, terminal growth rates, and weighted-average costs of capital. The projected cash flows used in calculating the fair value of our cash-generating units, using the income approach, considered historical and estimated future results and general economic and market conditions, as well as the impact of planned business and operational strategies. As a result, the Company classified the International cash-generating unit measured at fair value on a nonrecurring basis within Level 3 of the fair value hierarchy. Annual Report and Accounts 2019 Page | 99 Derivative liabilitiesOther current and other non-current liabilities—25,473—25,473 Derivative assetsOther current and other non-current assets—7,3172,5199,836 Assets: Liabilities: Equity investmentsOther non-current assets7,769—15,09822,867 Assets:
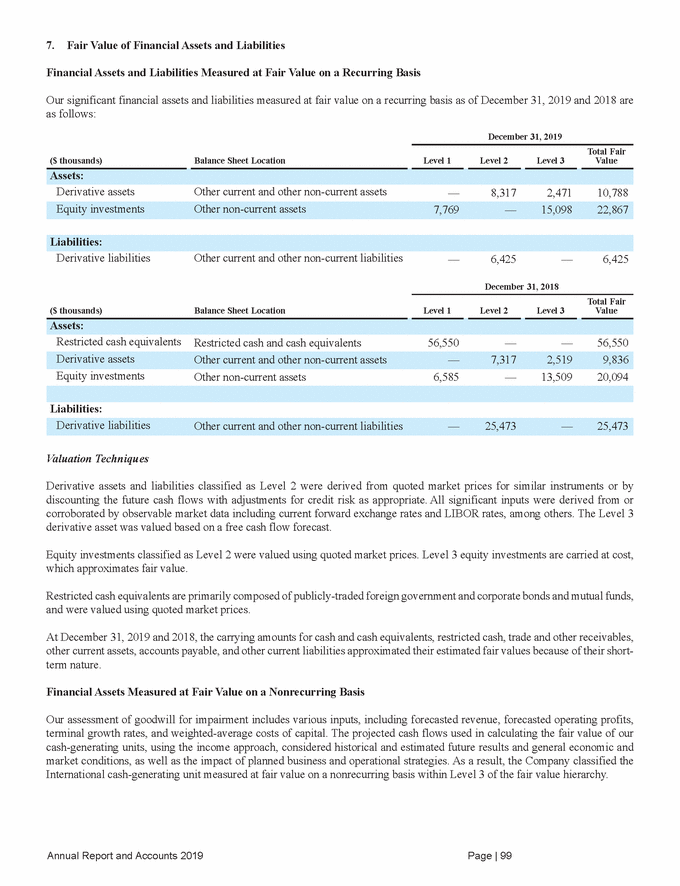
Financial Assets and Liabilities Not Carried at Fair Value The carrying amounts and fair value hierarchy classification of our significant financial assets and liabilities not carried at fair value as of December 31, 2019 and 2018 are as follows: December 31, 2019 Carrying Amount ($ thousands) Level 1 Level 2 Level 3 Total Fair Value Customer financing receivables, net 349,103 — — 349,686 349,686 Liabilities: Debt (1) 8,062,816 — 8,589,939 — 8,589,939 December 31, 2018 Carrying Amount ($ thousands) Level 1 Level 2 Level 3 Total Fair Value Customer financing receivables, net 258,627 — — 260,857 260,857 Liabilities: Debt (1) 7,996,073 — 8,089,154 — 8,089,154 (1) Debt excludes short-term borrowings and swap adjustments 8.Derivative Financial Instruments We use selected derivative hedging instruments, principally foreign currency forward contracts and interest rate swaps, for the purpose of managing currency risks and interest rate risk arising from our operations and sources of financing. Cash Flow Hedges The notional amount of foreign currency forward contracts, designated as cash flow hedges, outstanding at December 31, 2019 and 2018 were $56.8 million and $74.0 million, respectively. The amount recorded within other comprehensive loss at December 31, 2019 is expected to impact the consolidated statement of operations in 2020. Fair Value Hedges In September 2015, we executed $625.0 million notional amount of interest rate swaps that effectively convert $625.0 million of the 6.250% Senior Secured U.S. Dollar Notes from fixed interest rate debt to variable rate debt. The terms of the swaps require periodic net settlement payments and expire in February 2022. Net Investment Hedges In October 2018, we executed $200.0 million notional amount of cross-currency swaps that are a hedge of foreign exchange risk associated with a net investment in foreign operations. The terms of the swaps require periodic net settlement payments and a final notional exchange will occur on settlement. The swaps expire in August 2021. Derivatives Not Designated as Hedging Instruments The notional amount of foreign currency forward contracts, not designated as hedging instruments, outstanding at December 31, 2019 and 2018 was $550.0 million and $518.7 million, respectively. Refer to Note 18, Shareholders’ Equity - Other Reserves for further information. Annual Report and Accounts 2019 Page | 100 Jackpot liabilities254,567——229,089229,089 Assets: Jackpot liabilities234,827——230,363230,363 Assets:
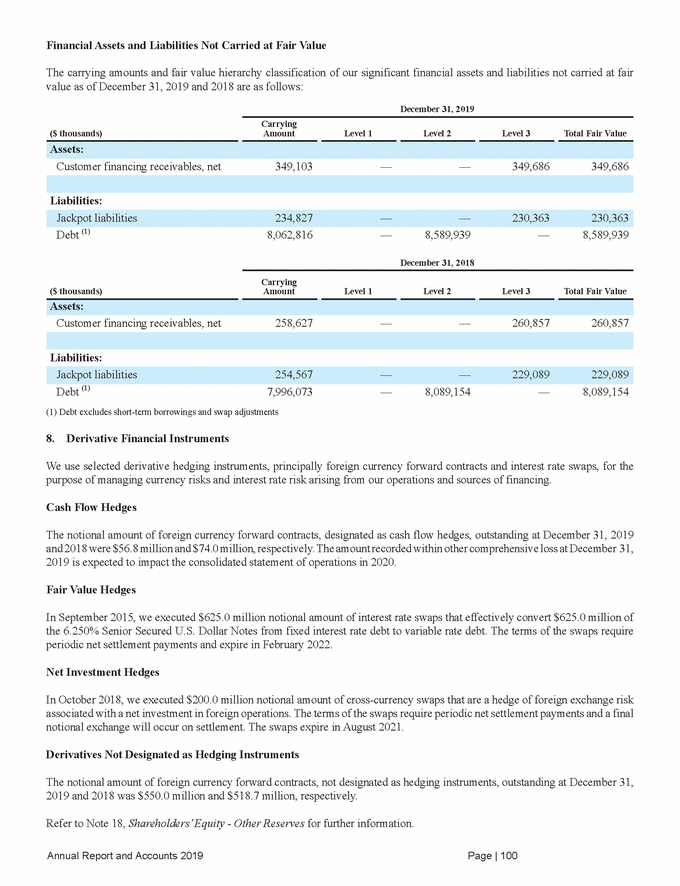
9.Financial Risk Management Our activities expose us to a variety of risks including interest rate risk and foreign currency exchange rate risk. Our overall risk management strategy focuses on the unpredictability of financial markets and seeks to minimize potential adverse effects on our performance through ongoing operational and finance activities. We monitor and manage our exposure to such risks both centrally and at the local level, as appropriate, as part of our overall risk management program with the objective of seeking to reduce the potential adverse effects of such risks on our results of operations and financial position. Depending upon the risk assessment, we use selected derivative hedging instruments, including principally interest rate swaps and foreign currency forward contracts, for the purposes of managing interest rate risk and currency risks arising from our operations and sources of financing. Our policy is not to enter into such contracts for speculative purposes. Our accounting policies and disclosures regarding derivatives are set out in Note 2, Summary of Significant Accounting Policies, and Note 8, Derivative Financial Instruments. The following section provides qualitative and quantitative disclosures on the effects that these risks may have. The quantitative data reported below does not have any predictive value and does not reflect the complexity of the markets or reactions which may result from any changes that are assumed to have taken place. Interest Rate Risk Indebtedness Our exposure to changes in market interest rates relates primarily to our cash and financial liabilities which bear floating interest rates. Our policy is to manage interest cost using a mix of fixed and variable rate debt. We have historically used various techniques to mitigate the risks associated with future changes in interest rates, including entering into interest rate swap and treasury rate lock agreements. At December 31, 2019 and 2018, approximately 24% and 35% of our debt portfolio was exposed to interest rate fluctuations, respectively. Our exposure to floating rates of interest primarily relates to the Euro Term Loan Facility due January 2023 and Revolving Credit Facilities due July 2024. At December 31, 2019 and 2018, we held $625.0 million (notional amount) in interest rate swaps that effectively convert $625.0 million of the 6.250% Senior Secured U.S. Dollar Notes due February 2022 from fixed interest rate debt to variable rate debt. A hypothetical 10 basis points increase in interest rates for 2019 and 2018, with all other variables held constant, would have resulted in lower income before provision for income taxes of approximately $2.0 million and $2.8 million, respectively. Costs to Fund Jackpot Liabilities Fluctuations in prime, treasury, and agency rates due to changes in market and other economic conditions directly impact our cost to fund jackpots and corresponding gaming operating income. If interest rates decline, jackpot cost increases and operating income decreases. We estimate a hypothetical decline of one percentage point in applicable interest rates would have reduced operating income by approximately $5.6 million and $7.1 million in 2019 and 2018, respectively. We do not manage this exposure with derivative financial instruments. Foreign Currency Exchange Rate Risk We operate on an international basis across a number of geographical locations. We are exposed to (i) transactional foreign exchange risk when an entity enters into transactions in a currency other than its functional currency, and (ii) translation foreign exchange risk which arises when we translate the financial statements of our foreign entities into U.S. dollars for the preparation of the consolidated financial statements. Transactional Risk Our subsidiaries generally execute their operating activities in their respective functional currencies. In circumstances where we enter into transactions in a currency other than the functional currency of the relevant entity, we seek to minimize our exposure by (i) sharing risk with our customers (for example, in limited circumstances, but whenever possible, we negotiate clauses into our contracts that allows for price adjustments should a material change in foreign exchange rates occur), (ii) creating a natural Annual Report and Accounts 2019 Page | 101
hedge by netting receipts and payments, (iii) utilizing foreign currency borrowings, and (iv) where applicable, by entering into foreign currency forward and option contracts. The principal foreign currency to which we are exposed is the euro. A hypothetical 10% decrease in the U.S. dollar to euro exchange rate, with all other variables held constant, would have resulted in lower income before provision for income taxes of approximately $331.2 million and $337.8 million for 2019 and 2018, respectively. From time to time, we enter into foreign currency forward and option contracts to reduce the exposure associated with certain firm commitments, variable service revenues, and certain assets and liabilities denominated in foreign currencies. These contracts generally have average maturities of 12 months or less, and are regularly renewed to provide continuing coverage throughout the year. It is our policy to negotiate the terms of the hedge derivatives to match the terms of the hedged item to maximize hedge effectiveness. At December 31, 2019, we had forward contracts for the sale of approximately $187.6 million of foreign currency (primarily Colombian peso, Canadian dollars, South African rand, and Australian dollars) and the purchase of approximately $419.2 million of foreign currency (primarily euro and Canadian dollars). At December 31, 2018, we had forward contracts for the sale of approximately $283.2 million of foreign currency (primarily euro and British pounds) and the purchase of approximately $309.5 million of foreign currency (primarily U.S. dollars, Canadian dollars, and Swedish krona). Translation Risk Certain of our subsidiaries are located in countries that are outside of the United States, in particular the Eurozone. As our reporting currency is the U.S. dollar, the income statements of those entities are converted into U.S. dollars using the average exchange rate for the period, and while revenues and costs are unchanged in local currency, changes in exchange rates may lead to effects on the converted balances of revenues, costs and the result in U.S. dollars. The monetary assets and liabilities of consolidated entities that have a reporting currency other than the U.S. dollar are translated into U.S. dollars at the period-end foreign exchange rate. The effects of these changes in foreign exchange rates are recognized directly in the consolidated statement of shareholders' equity within other reserves. Our foreign currency exposure primarily arises from changes between the U.S. dollar and the euro. A hypothetical 10% decrease in the U.S. dollar to euro exchange rate, with all other variables held constant, would have reduced equity by $120.4 million and $143.7 million for 2019 and 2018, respectively. Capital Management The primary goal of our capital management strategy is to ensure strong credit ratings and healthy financial ratios in order to support our business while maximizing corporate value and reducing our financial risks. We consider all equity and debt to be managed capital of the Company. We manage our capital structure and make adjustments based on long-term strategy decisions in light of changes in economic conditions. Additionally, we seek to preserve an optimal weighted average cost of capital and maintain sufficient financial flexibility to pursue growth opportunities. Annual Report and Accounts 2019 Page | 102
Our capital structure is as follows: December 31, ($ thousands, except ratios) 2019 2018 Less: Cash and cash equivalents 662,934 250,669 Total Net Debt 7,382,119 7,760,991 Total Equity 2,174,688 2,379,585 Net Debt to Equity Ratio 3.4x 3.3x 10. Systems, Equipment and Other Assets Related to Contracts, net and Property, Plant and Equipment, net Systems & Equipment, net consists of the following: Terminals and Systems Furniture and Equipment Construction in Progress ($ thousands) Land Buildings Total Balance at December 31, 2017 547 45,931 1,197,456 61,161 149,245 1,454,340 Depreciation — (14,320) (368,686) (19,469) — (402,475) Disposals (7) — (43,817) (85) (15) (43,924) Transfers — 1,349 397,242 7,223 (280,845) 124,969 Balance at December 31, 2018 303 43,235 1,247,011 59,978 74,382 1,424,909 Depreciation — (13,134) (372,939) (15,997) — (402,070) Disposals (6) (11) (66,955) (678) (146) (67,796) Transfers — (4,664) 281,719 9,937 (192,678) 94,314 Balance at December 31, 2019 297 32,713 1,162,576 57,404 54,950 1,307,940 Balance at December 31, 2018 Accumulated depreciation — (114,376) (1,818,017) (145,327) — (2,077,720) Cost 297 107,538 2,933,649 198,324 54,950 3,294,758 Net book value 297 32,713 1,162,576 57,404 54,950 1,307,940 Gain on Sale of Assets to Distributor During 2019, we entered into a long-term strategic agreement with a distributor in Oklahoma that included the sale of used, non-premium equipment, which was previously included within Systems & Equipment, net within the consolidated balance sheet. This sale resulted in a gain of $27.7 million which is classified in other operating income on the consolidated statement of operations for the year ended December 31, 2019. Annual Report and Accounts 2019 Page | 103 Accumulated depreciation—(74,825)(1,771,073)(140,920)—(1,986,818) Balance at December 31, 2019 Net book value30343,2351,247,01159,97874,3821,424,909 Cost303157,6113,065,028205,30574,3823,502,629 Other——(407)(1,859)(200)(2,466) Foreign currency translation—(184)(3,822)1,212(2,301)(5,095) Impairment——(432)——(432) Additions—7,47178,4014,811175,893266,576 Other(237)—1,347(1,582)—(472) Foreign currency translation—(1,202)(31,108)3,303184(28,823) Impairment——(2,407)——(2,407) Additions—11,47796,9849,427205,813323,701 Net book value Less: Debt issuance costs - Revolving Credit Facilities due July 2024 (Note 6)20,464— Total Debt (Note 15)8,065,5178,011,660
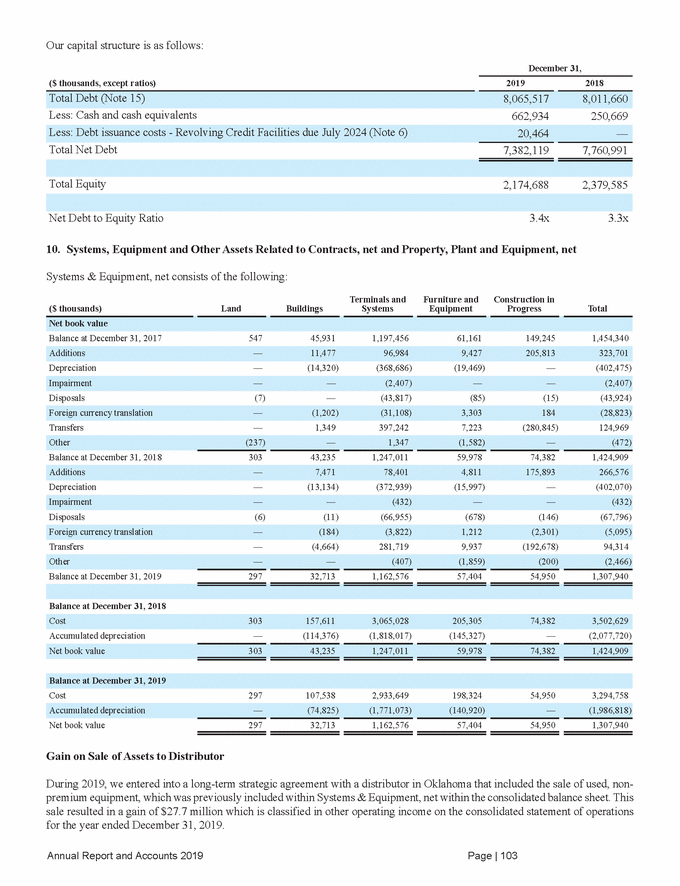
PPE, net consists of the following: Furniture and Equipment Construction in Progress ($ thousands) Land Buildings Total Balance at December 31, 2017 2,542 23,613 116,470 20,603 163,228 Depreciation — (1,408) (37,183) — (38,591) Foreign currency translation (80) (355) 1,165 (113) 617 Other — — (344) — (344) Additions — 14 4,275 32,685 36,974 Impairment loss — — — (562) (562) Foreign currency translation (2) (800) 2,207 (1) 1,404 Other — 225 (372) — (147) Cost 2,462 41,518 257,444 12,777 314,201 Net book value 2,462 21,765 117,535 12,777 154,539 Balance at December 31, 2019 Accumulated depreciation — (49,380) (136,296) — (185,676) 11. Leases Lessee We have leases for real estate (warehouses, office space, data centers), vehicles, communication equipment, and other equipment. Many of our real estate leases include one or more options to renew, while some include termination options. Certain vehicle and equipment leases include residual value guarantees and options to purchase the leased asset. Many of our real estate leases include variable payments for maintenance, real estate taxes, and insurance that are determined based on the actual costs incurred by the landlord. Some of our equipment leases include variable payments that are determined based on a percentage of sales. Annual Report and Accounts 2019 Page | 104 Net book value2,31721,093107,81315,624146,847 Cost2,31770,473244,10915,624332,523 Accumulated depreciation—(19,753)(139,909)—(159,662) Balance at December 31, 2018 Balance at December 31, 20192,31721,093107,81315,624146,847 Transfers—7,85619,338(29,275)(2,081) Disposals(143)(7,967)(2,722)—(10,832) Depreciation——(32,448)—(32,448) Balance at December 31, 20182,46221,765117,53512,777154,539 Transfers——30,031(29,777)254 Disposals—(117)(961)(18)(1,096) Additions—328,35722,08230,471 Net book value
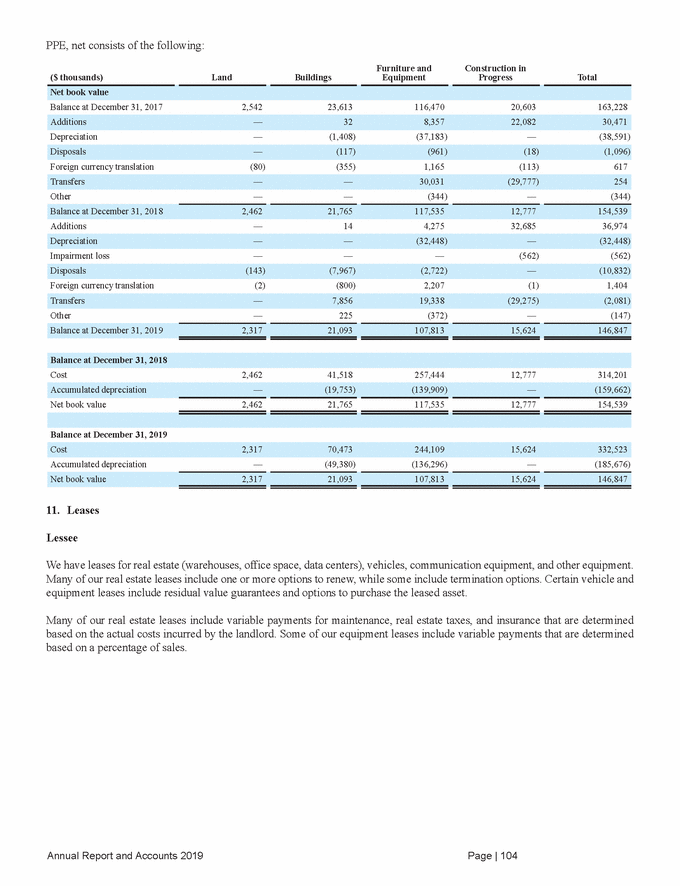
The classification of our leases in the consolidated balance sheet are as follows: ($ thousands) Balance Sheet Classification December 31, 2019 ROU asset, net (1) Right-of-use assets 368,527 Lease liability, current Other current liabilities 62,082 Total lease liabilities (1) ROU assets are recorded net of accumulated amortization of $73.3 million at December 31, 2019. 404,919 ROU asset, net, by class of underlying assets is as follows: ($ thousands) December 31, 2019 Vehicles 22,635 Total ROU asset, net 368,527 Components of expense related to leases are as follows: For the year ended December 31, 2019 ($ thousands) Vehicles 10,745 Total depreciation expense 76,309 Interest expense 26,380 (1) Variable lease costs include immaterial amounts related to short-term leases and sublease income. Maturities of lease liabilities at December 31, 2019 are as follows ($ thousands): Total (1) Year 2021 75,025 2023 56,578 Thereafter 209,414 Less: Imputed interest (129,621) (1) The maturities above exclude leases that have not yet commenced. We have committed rental payments of $14.4 million for leases that will commence in 2020 with lease terms ranging from 5-13 years. Annual Report and Accounts 2019 Page | 105 Present value of lease liabilities404,919 Total lease payments534,540 202446,077 202263,134 202084,312 Variable lease costs (1)74,804 Other equipment6,313 Real estate59,251 Other equipment17,290 Real estate328,602 Lease liability, non-currentLease liabilities342,837 Liabilities Total lease assets368,527 Assets
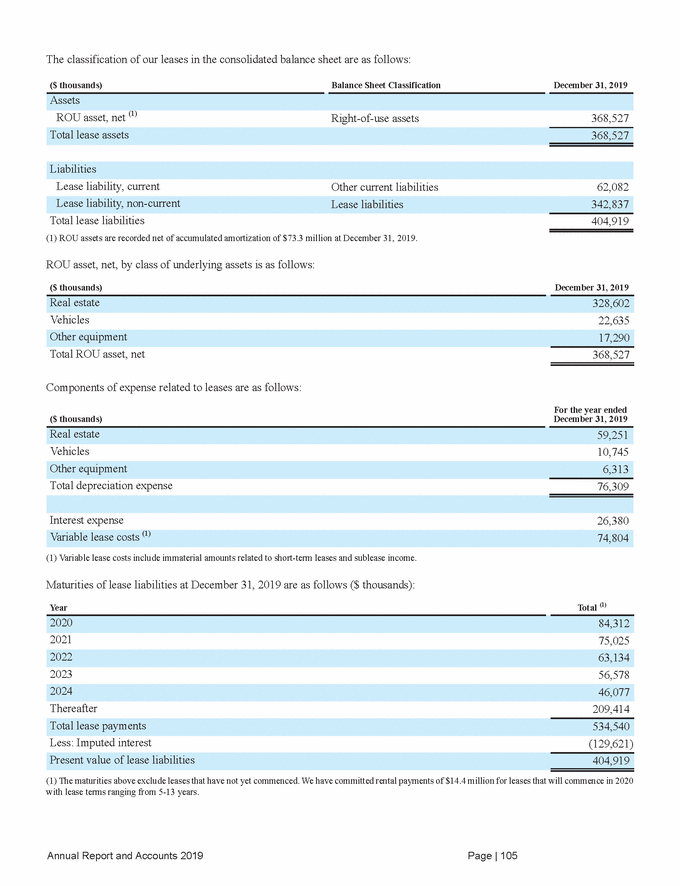
Cash flow information and non-cash activity related to leases is as follows: For the year ended December 31, 2019 ($ thousands) Operating cash flows 26,380 ROU assets obtained in exchange for lease obligations (net of early terminations) 25,071 Lessor We have various arrangements for commercial gaming and lottery equipment under which we are the lessor. These leases generally meet the criteria for operating lease classification. Lease income for operating leases is included within service revenue, while lease income for sales type leases is included within product sales in the consolidated statements of operations. Lease income was approximately 8.0% and 6.0% of total revenue for the years ended December 31, 2019 and 2018, respectively. 12. Goodwill Changes in the carrying amount of goodwill consist of the following: North America Gaming and Interactive North America Lottery ($ thousands) International Italy Total Impairment — — (184,000) — (184,000) Other — — — 265 265 Impairment — — (57,000) — (57,000) Foreign currency translation — — (2,677) (16,911) (19,588) Cost 2,153,867 1,225,682 1,658,698 1,659,600 6,697,847 1,394,867 1,221,589 1,356,848 1,657,882 5,631,186 Balance at December 31, 2019 Accumulated impairment (759,000) (4,093) (357,217) (1,685) (1,121,995) Impairment The process of evaluating potential impairments related to goodwill requires the application of significant judgment. Goodwill is tested for impairment annually, in the fourth quarter, or whenever events or changes in circumstances indicate the carrying amount may not be recoverable. If an event occurs that would cause revisions to the estimates and assumptions used in analyzing the fair value of goodwill, the revision could result in a non-cash impairment loss that could have a material impact on financial results. The goodwill impairment test compares the recoverable value of our four cash-generating units (which are the same as our reportable segments) with its carrying amount and an impairment loss is recognized for the amount by which the carrying amount exceeds the cash-generating unit's recoverable value. Annual Report and Accounts 2019 Page | 106 1,394,8671,221,5891,283,9701,640,9715,541,397 Cost2,153,8671,225,6821,641,1871,642,6566,663,392 Accumulated impairment(759,000)(4,093)(301,850)(1,718)(1,066,661) Balance at December 31, 2018 Balance at December 31, 20191,394,8671,221,5891,283,9701,640,9715,541,397 Disposal——(13,201)—(13,201) Balance at December 31, 20181,394,8671,221,5891,356,8481,657,8825,631,186 Foreign currency translation——(8,533)(25,000)(33,533) Balance at December 31, 20171,394,8671,221,5891,549,3811,682,6175,848,454 Non-cash activity: Finance cash flows64,470 Cash paid for amounts included in the measurement of lease liabilities:
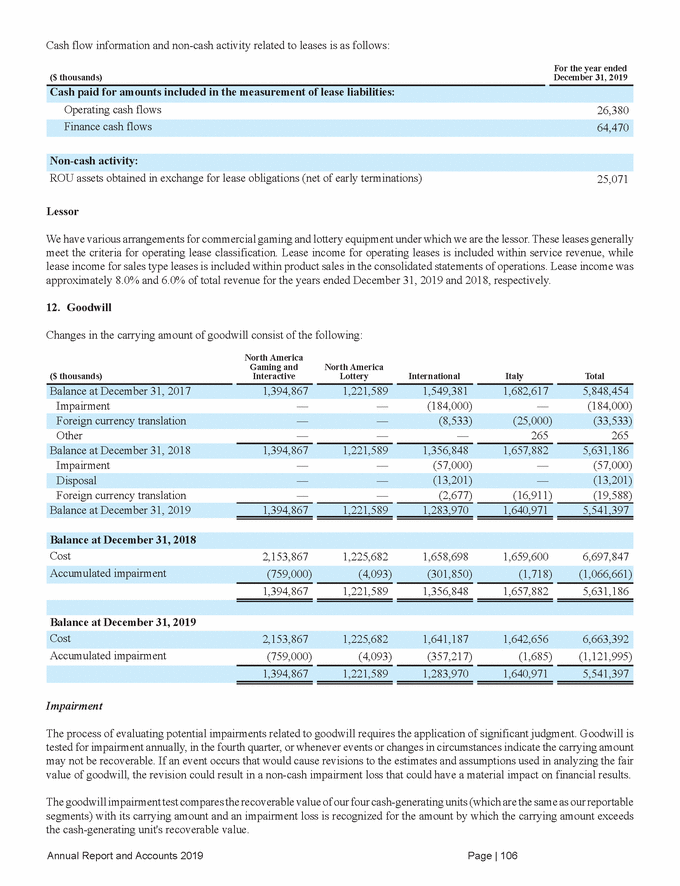
In performing the goodwill impairment test, we estimate the recoverable value of the cash-generating units using an income approach based on projected discounted cash flows. The procedures we follow includes, but are not limited to, the following: • • • • • Analysis of the conditions in, and the economic outlook for, the cash-generating units; Analysis of general market data, including economic, governmental, and environmental factors; Review of the history, current state, and future operations of the cash-generating units; Analysis of financial and operating projections based on historical operating results, industry results, and expectations; Analysis of financial, transactional, and trading data for companies engaged in similar lines of business to develop appropriate valuation multiples and operating comparisons; and Calculation of our market capitalization, total invested capital, the implied market participant acquisition premium, and supporting qualitative and quantitative analysis. • Under the income approach, the recoverable value of the cash-generating unit is determined based on the present value of each unit's estimated future cash flows, discounted at a risk-adjusted rate. We use internal forecasts to estimate future cash flows and estimate long-term future growth rates based on internal projections of the long-term outlook for each cash-generating unit. We use discount rates that are commensurate with the risks and uncertainty inherent in each cash-generating unit and in internally developed forecasts. Discount rates used in the cash-generating unit valuations were 9.10% and 8.50% for North America Gaming and Interactive in 2019 and 2018, respectively, 7.40% and 7.40% for North America Lottery in 2019 and 2018, respectively, 10.60% and 10.15% for International in 2019 and 2018, respectively, and 10.55% and 8.60% for Italy in 2019 and 2018, respectively. Estimating the recoverable value of cash-generating units requires management to use its judgment in making estimates and making forecasts that are based on a number of factors including forecasted revenue, forecasted operating profits, terminal growth rates, and weighted-average costs of capital. Actual results may differ from those assumed in forecasts. During the fourth quarter of 2019, we recorded a $57.0 million non-cash impairment loss with no income tax benefit and reduced the carrying amount of our International cash-generating unit to fair value. The Company determined that there was an impairment in the International cash-generating unit’s goodwill due to lower forecasted cash flows along with a higher weighted-average cost of capital. During the fourth quarter of 2018, we recorded a $184.0 million non-cash impairment loss with no income tax benefit and reduced the carrying amount of our International cash-generating unit to fair value. The Company determined that there was an impairment in the International cash-generating unit’s goodwill due to the results of 2018 being lower than forecasted along with a higher weighted-average cost of capital. Annual Report and Accounts 2019 Page | 107
13. Intangible Assets, net Net Book Value Trademarks (indefinite-lived) Trademarks (definite-lived) Computer software and game library Customer relationships Developed technologies Sports betting rights ($ thousands) Licenses Other Total Additions — — — 35,434 7,469 545 8,355 919 52,722 Foreign currency translation (2,473) (3,719) (1,068) — 11 — (553) (201) (8,003) Balance at December 31, 2018 1,328,785 246,913 123,783 214,668 72,169 40,905 2,265 8,827 2,038,315 Additions 305 — — 35,523 11,741 — 14,991 618 63,178 Foreign currency translation (1,172) (1,609) (233) — — — (228) (100) (3,342) Balance at December 31, 2019 1,196,903 245,000 109,088 189,280 50,572 16,326 8,734 14,439 1,830,342 December 31, 2018 (61,807) (753,160) (221,935) (179,192) Accumulated amortization (1,079,418) — (131,932) (18,632) (2,446,076) 1,328,785 246,913 123,783 214,668 72,169 40,905 2,265 8,827 2,038,315 Cost 2,407,222 254,689 224,730 1,005,221 298,008 219,638 146,506 54,595 4,610,609 (9,689) (39,446) (6,862) (191) Accumulated impairment loss (48,542) — — (19,152) (123,882) Weighted average life (in years) 15.2 — 14.1 5.4 10.1 5.4 6.5 9.0 Annual Report and Accounts 2019 Page | 108 1,196,903245,000109,088189,28050,57216,3268,73414,4391,830,342 Accumulated amortization(1,161,777)—(76,196)(809,079)(247,436)(203,121)(137,772)(21,004)(2,656,385) December 31, 2019 Weighted average life (in years)15.2—14.15.510.05.46.59.9 Accumulated impairment loss(48,265)(9,689)(39,696)(6,601)—(195)—(19,389)(123,835) Cost2,456,468256,602225,286974,429294,104220,292134,19746,8484,608,226 Write-off and other—(1,913)—(33)(2,231)(625)——(4,802) Amortization(131,954)—(14,695)(59,706)(29,498)(23,954)(8,294)(2,631)(270,732) Acquisitions———————7,7257,725 Write-off and other———(94)16(600)(26)(71)(775) Amortization(140,415)—(15,393)(54,681)(27,271)(23,383)(9,144)(1,605)(271,892) Balance at December 31, 20171,470,268246,913139,165236,48295,67464,3433,6339,7852,266,263
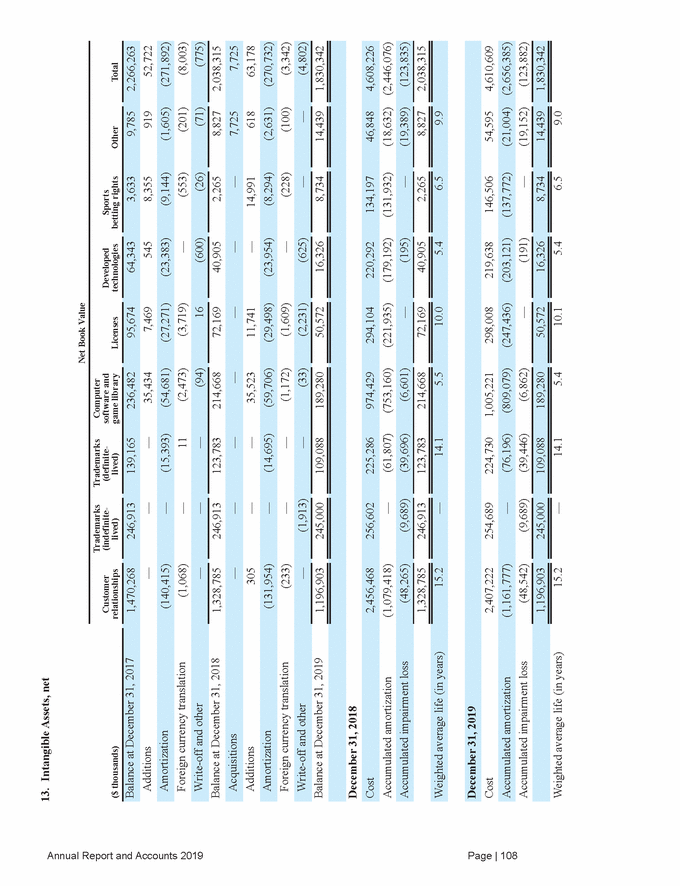
Trademarks with indefinite lives have been allocated to the cash generating units for impairment testing as follows: For the year ended December 31, ($ thousands) 2019 2018 International 40,000 41,913 Intangible asset amortization expense of $270.7 million and $271.9 million (which includes computer software amortization expense of $29.4 million and $29.6 million) was recorded in 2019 and 2018, respectively. Amortization expense on intangible assets for the next five years is expected to be as follows ($ thousands): Year Amount 2021 210,696 2023 145,400 Total 926,589 14. Other Liabilities Other Current Liabilities December 31, ($ thousands) Notes 2019 2018 Accrued interest payable 141,485 139,276 Accrued expenses 123,280 115,165 Income taxes payable 80,837 49,011 Contract liabilities 66,749 72,005 3 Lease liabilities 62,082 — 11 1,042,446 973,527 Other Non-Current Liabilities December 31, ($ thousands) Notes 2019 2018 Jackpot liabilities 160,101 178,376 17 Income taxes payable 26,493 25,654 Other 58,324 69,300 Annual Report and Accounts 2019 Page | 109 616,325698,355 Royalties payable18,91826,686 Contract liabilities365,85567,022 Redeemable non-controlling interest286,634331,317 Other20,35811,257 Current financial liabilities62,860113,027 Jackpot liabilities1774,72676,191 Redeemable non-controlling interest110,999102,776 Taxes other than income taxes135,607149,203 Employee compensation163,463145,616 2024137,997 2022180,260 2020252,236 245,000246,913 North America Gaming and Interactive205,000205,000
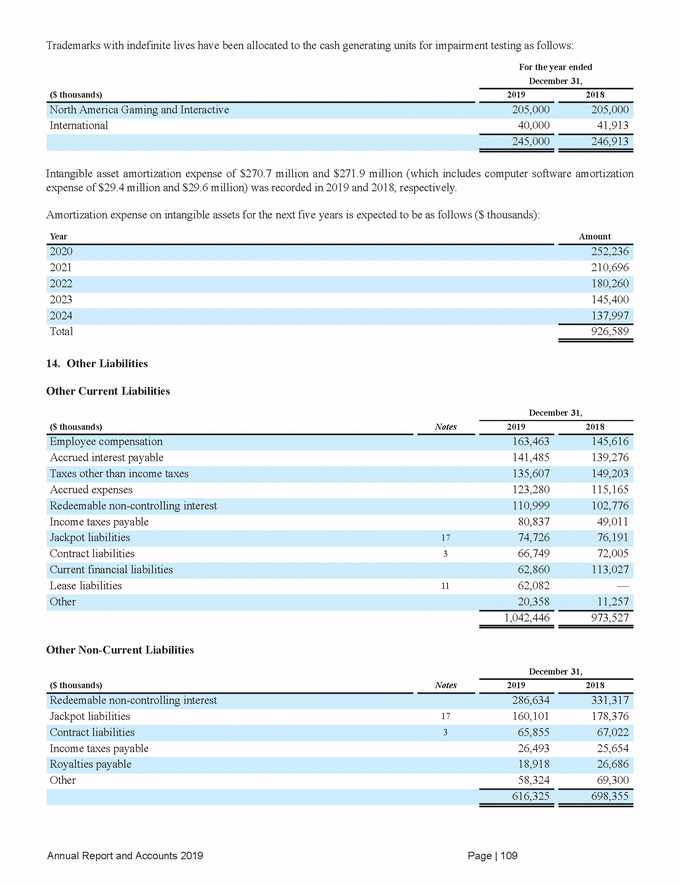
Redeemable Non-controlling Interest In 2016, the Parent, through its subsidiary Lottomatica S.p.A. ("Lottomatica"), entered into a consortium (Lottoitalia S.r.l. or "Lottoitalia") to bid on the Italian Gioco del Lotto service license (the "Lotto License"). Lottoitalia was awarded management of the Lotto License for a nine-year term, and under the terms of the consortium agreement, Lottomatica is the principal operating partner fulfilling the requirements of the Lotto License. We consolidate Lottoitalia due to the Company's risks and rewards of the investment and Lottoitalia's need for funding to finance planned operations. We classify the non-controlling interest in Lottoitalia as a financial liability recorded at amortized cost. Changes in the financial liability are recorded within other expense on the consolidated statement of operations. In connection with the formation of Lottoitalia in 2016, Lottomatica entered into an agreement with Italian Gaming Holding a.s. ("IGH"), one of the consortium members, which contains a deadlock put/call option in which IGH has the right, at its discretion, to sell its interest in Lottoitalia to Lottomatica and Lottomatica has a reciprocal call right, in the event of certain specified events as defined in the agreement. The put/call options expire 60 days following written notice by either party following the applicable event. The strike price of the options is determined based on a specified formula as defined in the agreement. The agreement also allows for the extension of Lottoitalia past its fixed term of December 31, 2026 if agreed to by both, Lottomatica and IGH. 15. Debt The principal balance of each debt obligation reconciles to the consolidated balance sheet as follows: December 31, 2019 Debt issuance cost, net ($ thousands) Principal Premium Swap Total 4.750% Senior Secured Euro Notes due February 2023 954,890 (6,508) — — 948,382 3.500% Senior Secured Euro Notes due July 2024 561,700 (4,369) — — 557,331 3.500% Senior Secured Euro Notes due June 2026 842,550 (7,445) — — 835,105 2.375% Senior Secured Euro Notes due April 2028 561,700 (5,297) — — 556,403 Euro Revolving Credit Facilities due July 20241 — — — — — Long-term debt, less current portion 7,657,019 (56,695) 318 (473) 7,600,169 4.750% Senior Secured Euro Notes due March 2020 435,767 (978) — — 434,789 Current portion of long-term debt 463,078 (978) 74 (19) 462,155 Short-term borrowings 3,193 — — — 3,193 Total Debt 8,123,290 (57,673) 392 (492) 8,065,517 (1) $20.5 million of debt issuance costs, net presented in other non-current assets Annual Report and Accounts 2019 Page | 110 5.500% Senior Secured U.S. Dollar Notes due June 202027,311—74(19)27,366 U.S. Dollar Revolving Credit Facilities due July 20241 ————— Euro Term Loan Facility due January 20231,325,612(8,223)——1,317,389 Senior Secured Notes, long-term6,331,407(48,472)318(473)6,282,780 6.250% Senior Secured U.S. Dollar Notes due January 2027750,000(6,613)——743,387 6.500% Senior Secured U.S. Dollar Notes due February 20251,100,000(10,041)——1,089,959 5.350% Senior Secured U.S. Dollar Notes due October 202360,567—318—60,885 6.250% Senior Secured U.S. Dollar Notes due February 20221,500,000(8,199)—(473)1,491,328
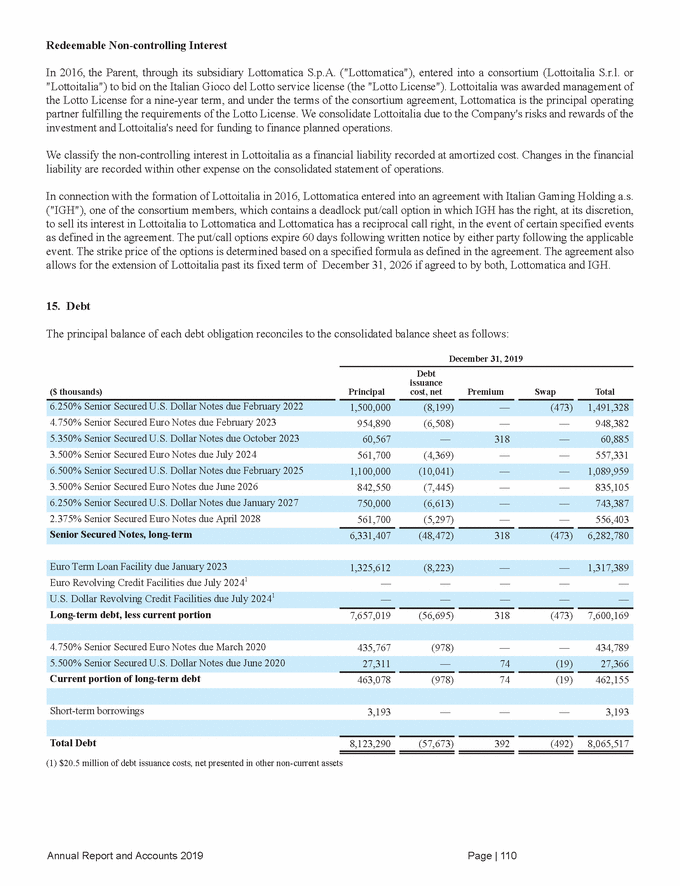
December 31, 2018 Debt issuance cost, net ($ thousands) Principal Premium Swap Total 4.750% Senior Secured Euro Notes due March 2020 444,146 (6,323) — — 437,823 6.250% Senior Secured U.S. Dollar Notes due February 2022 1,500,000 (11,611) — (18,780) 1,469,609 5.350% Senior Secured U.S. Dollar Notes due October 2023 60,567 — 416 — 60,983 6.500% Senior Secured U.S. Dollar Notes due February 2025 1,100,000 (11,615) — — 1,088,385 Senior Secured Notes, long-term 5,928,832 (52,614) 650 (18,806) 5,858,062 Euro Term Loan Facility due January 2023 1,717,500 (12,105) — — 1,705,395 U.S. Dollar Revolving Credit Facilities due July 2024 115,000 (8,614) — — 106,386 The principal amount of long-term debt maturing over the next five years and thereafter as of December 31, 2019 is as follows ($ thousands): U.S. Dollar Denominated Year Euro Denominated Total 2021 — 359,488 359,488 2023 60,567 1,561,526 1,622,093 2025 and thereafter 1,850,000 1,404,250 3,254,250 Annual Report and Accounts 2019 Page | 111 Total principal payments$3,437,878$4,682,219$8,120,097 2024—561,700561,700 20221,500,000359,4881,859,488 2020$27,311$435,767$463,078 Total Debt8,109,312(79,496)650(18,806)8,011,660 Short-term borrowings34,822———34,822 Long-term debt, less current portion8,074,490(79,496)650(18,806)7,976,838 Euro Revolving Credit Facilities due July 2024313,158(6,163)——306,995 6.250% Senior Secured U.S. Dollar Notes due January 2027750,000(7,333)——742,667 3.500% Senior Secured Euro Notes due July 2024572,500(5,321)——567,179 4.750% Senior Secured Euro Notes due February 2023973,250(8,520)——964,730 5.500% Senior Secured U.S. Dollar Notes due June 202027,311—234(26)27,519 4.125% Senior Secured Euro Notes due February 2020501,058(1,891)——499,167
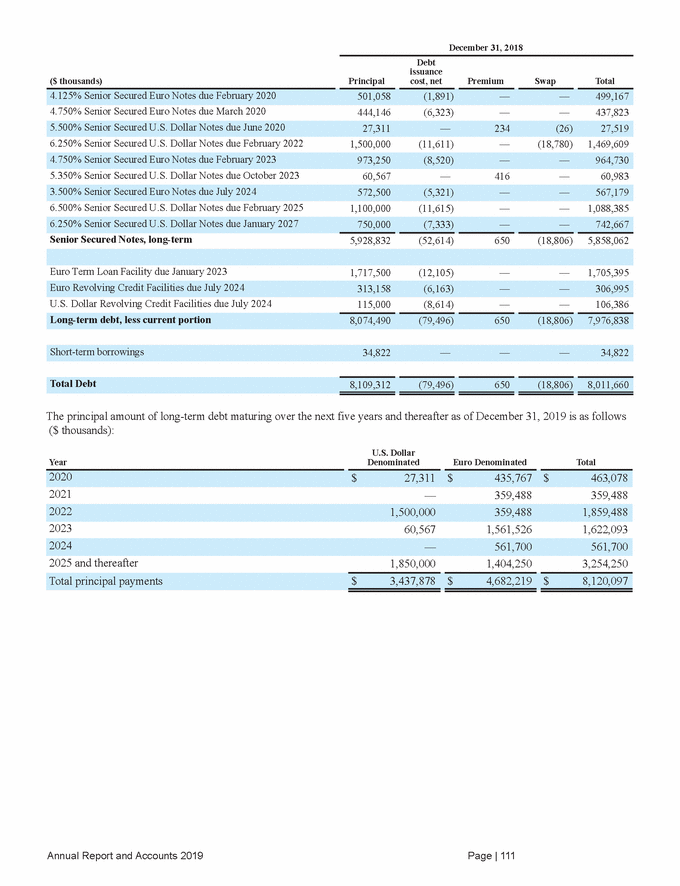
Senior Secured Notes The key terms of our senior secured notes (the "Notes"), which are rated Ba2 and BB+ by Moody’s Investor Service ("Moody’s") and Standard & Poor’s Ratings Services ("S&P"), respectively, are as follows: Principal (thousands) Effective Interest Rate Interest payments Description Issuer Guarantors Collateral Redemption Notes due March 2020 (1) arrears 5.500% Senior Secured U.S. Dollar Notes due June 2020 $27,311 4.88% IGT ** †† ++ Semi-annually in arrears 4.750% Senior Secured Euro Notes due February 2023 €850,000 4.98% Parent * † +++ Semi-annually in arrears 3.500% Senior Secured Euro Notes due July 2024 €500,000 3.68% Parent * † +++ Semi-annually in arrears 3.500% Senior Secured Euro Notes due June 2026 €750,000 3.65% Parent * † ++++ Semi-annually in arrears 2.375% Senior Secured Euro Notes due April 2028 €500,000 2.50% Parent * † ++++ Semi-annually in arrears (1) Subject to a 1.25% per annum decrease in the event of an upgrade in ratings by Moody’s to Baa or higher and S&P to BBB-or higher. * Certain subsidiaries of the Parent. ** The Parent and certain subsidiaries of the Parent. † Ownership interests of the Parent in certain of its direct subsidiaries and certain intercompany loans with principal balances in excess of $10 million. †† Certain intercompany loans with principal balances in excess of $10 million. + The Parent may redeem in whole but not in part at any time prior to maturity at 100% of their principal amount together with accrued and unpaid interest and a make-whole premium. The Parent may also redeem in whole but not in part at 100% of their principal amount together with accrued and unpaid interest in connection with certain tax events. Upon the occurrence of certain events, the Parent will be required to redeem in whole or in part at 100% of their principal amount together with accrued and unpaid interest. ++ International Game Technology ("IGT") may redeem in whole or in part at any time prior to maturity at 100% of their principal amount together with accrued and unpaid interest and a make-whole premium. IGT may also redeem in whole or in part at 100% of their principal amount together with accrued and unpaid interest in connection with certain gaming regulatory events. Upon the occurrence of certain events, IGT will be required to offer to repurchase all of the notes at a price equal to 101% of their principal amount together with accrued and unpaid interest. Annual Report and Accounts 2019 Page | 112 6.250% Senior Secured U.S.$750,0006.41%Parent*†+++Semi-annually Dollar Notes due January 2027in arrears 6.500% Senior Secured U.S.$1,100,0006.71%Parent*†+++Semi-annually Dollar Notes due Februaryin arrears 2025 5.350% Senior Secured U.S.$60,5675.47%IGT**††++Semi-annually Dollar Notes due October 2023in arrears 6.250% Senior Secured U.S.$1,500,0006.52%Parent*†+++Semi-annually Dollar Notes due Februaryin arrears 2022 4.750% Senior Secured Euro€387,9006.00%Parent*†+Annually in
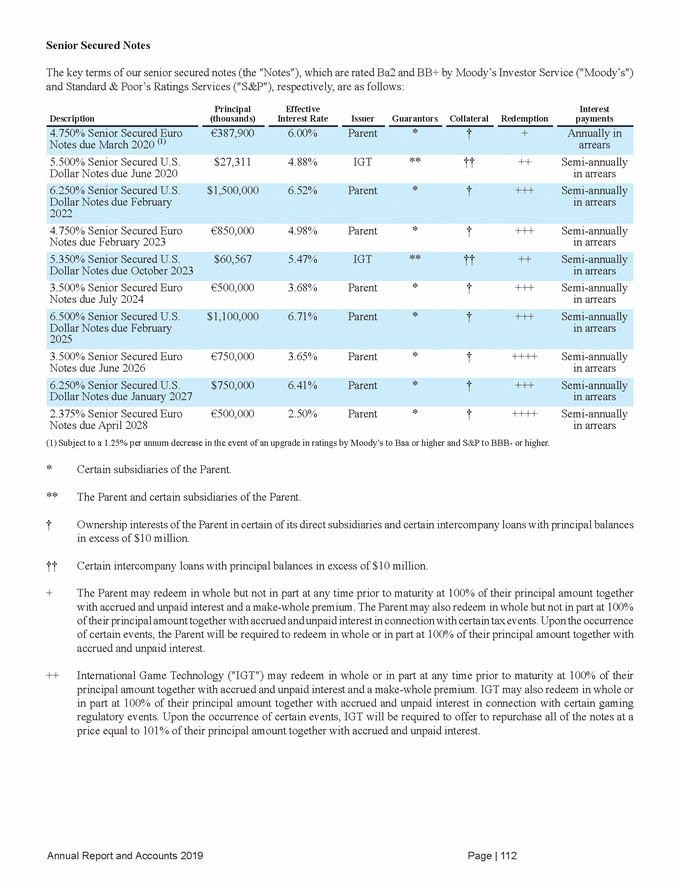
+++The Parent may redeem in whole or in part at any time prior to the date which is six months prior to maturity at 100% of their principal amount together with accrued and unpaid interest and a make-whole premium. After such date, the Parent may redeem in whole or in part at 100% of their principal amount together with accrued and unpaid interest. The Parent may also redeem in whole but not in part at 100% of their principal amount together with accrued and unpaid interest in connection with certain tax events. Upon the occurrence of certain events, the Parent will be required to offer to repurchase all of the notes at a price equal to 101% of their principal amount together with accrued and unpaid interest. ++++ The Parent may redeem in whole or in part at any time prior to the first date set forth in the redemption price schedule at 100% of their principal amount together with accrued and unpaid interest and a make-whole premium. After such date, the Parent may redeem in whole or in part at a redemption price set forth in the redemption price schedule in the indenture, together with accrued and unpaid interest. The Parent may also redeem in whole but not in part at 100% of their principal amount together with accrued and unpaid interest in connection with certain tax events. Upon the occurrence of certain events, the Parent will be required to offer to repurchase all of the notes at a price equal to 101% of their principal amount together with accrued and unpaid interest. The Notes contain customary covenants and events of default. At December 31, 2019, the issuers were in compliance with the covenants. 2.375% Senior Secured Euro Notes due April 2028 On September 16, 2019, the Parent issued €500 million of 2.375% Senior Secured Euro Notes due April 2028 (the "2.375% Notes") at par. The Parent used the net proceeds from the 2.375% Notes to pay the €320.0 million ($350.2 million) first installment on the Euro Term Loan Facility due January 25, 2020 on September 27, 2019 and pay down $192.3 million of the Revolving Credit Facilities due July 2024, for total consideration, excluding interest, of $542.5 million. The Company recorded a €2.1 million ($2.3 million) loss on extinguishment of debt in connection with the Term Loan repayment, which is classified in other income (expense), net on the consolidated statement of operations for the year ended December 31, 2019. 3.500% Senior Secured Euro Notes due June 2026 On June 20, 2019, the Parent issued €750 million of 3.500% Senior Secured Euro Notes due June 2026 (the "3.500% Notes due 2026") at par. The Parent used the net proceeds from the 3.500% Notes due 2026 to repurchase €437.6 million ($497.5 million) of the 4.125% Senior Secured Euro Notes due February 2020 (the "4.125% Notes") and pay down $339.3 million of the Revolving Credit Facilities due July 2024, for total consideration, excluding interest, of $845.3 million. The Company recorded an €8.5 million ($9.6 million) loss on extinguishment of debt in connection with the repurchase, which is classified in other income (expense), net on the consolidated statement of operations for the year ended December 31, 2019. 6.250% Senior Secured U.S. Dollar Notes due January 2027 On September 26, 2018, the Parent issued $750 million of 6.250% Senior Secured U.S. Dollar Notes due January 2027 (the "6.250% Notes") at par. The Parent used the net proceeds from the 6.250% Notes and borrowings under the Revolving Credit Facilities due July 2021 to redeem $600.0 million of the 5.625% Senior Secured U.S. Dollar Notes due February 2020, $144.3 million of the 7.500% Senior Secured U.S. Dollar Notes due July 2019 (the "7.500% Notes") and $96.8 million of the 5.500% Senior Secured U.S. Dollar Notes due June 2020 (the "5.500% Notes"), for total consideration, excluding interest, of $865.8 million. The Company recorded a $24.8 million loss on extinguishment of debt in connection with the redemptions, which is classified in other income (expense), net on the consolidated statement of operations for the year ended December 31, 2018. 3.500% Senior Secured Euro Notes due July 2024 On June 27, 2018, the Parent issued €500 million of 3.500% Senior Secured Euro Notes due July 2024 (the "3.500% Notes due 2024") at par. Annual Report and Accounts 2019 Page | 113
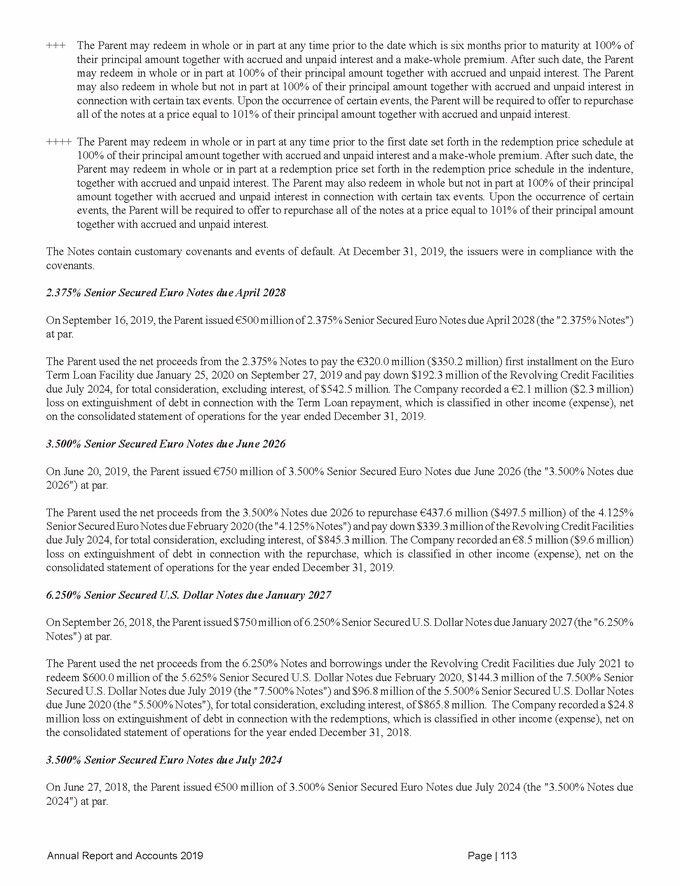
The Parent used the net proceeds from the 3.500% Notes due 2024 to repurchase €262.4 million ($303.6 million) of the 4.125% Notes and €112.1 million ($129.7 million) of the 4.750% Senior Secured Euro Notes due March 2020, for total consideration, excluding interest, of €395.5 million ($457.5 million). The Company recorded a $29.6 million loss on extinguishment of debt in connection with the repurchases, which is classified in other income (expense), net on the consolidated statement of operations for the year ended December 31, 2018. 6.625% Senior Secured Euro Notes due February 2018 The Parent redeemed the €500 million ($625.5 million) 6.625% Senior Secured Euro Notes due February 2018 when they matured on February 2, 2018, using proceeds from the Euro Term Loan Facility due January 2023. Term Loan Facility The Parent is party to a senior facility agreement (the "Term Loan Facility Agreement") for a €1.5 billion term loan facility maturing in January 2023 (the "Term Loan Facility"), which must be repaid in the following installments, as detailed below: Amount (€ thousands) Due Date January 25, 2022 320,000 On September 27, 2019, the Parent repaid the first €320 million installment due January 25, 2020 (resulting in €1.2 billion principal remaining) from the proceeds of the 2.375% Notes issued on September 16, 2019. Interest on the Term Loan Facility is payable between one and six months in arrears at rates equal to the applicable LIBOR or EURIBOR plus a margin based on our long-term ratings by Moody’s and S&P. At December 31, 2019 and 2018, the effective interest rate on the Term Loan Facility was 2.05%. The Term Loan Facility is guaranteed by certain subsidiaries of the Parent and is secured by ownership interests of the Parent in certain of its direct subsidiaries and certain intercompany loans with principal balances in excess of $10 million. Upon the occurrence of certain events, the Parent may be required to prepay the Term Loan Facility in full. The Term Loan Facility Agreement contains customary covenants (including maintaining a minimum ratio of EBITDA to net interest costs and maximum ratio of total net debt to EBITDA) and events of default. At December 31, 2019, the Parent was in compliance with the covenants. Revolving Credit Facilities The Parent and certain of its subsidiaries are party to a senior facilities agreement (the "RCF Agreement") which provides for the following multi-currency revolving credit facilities (the "Revolving Credit Facilities"): Maximum Amount Available (thousands) Facility Borrowers €625,000 Revolving Credit Facility B Parent and Lottomatica Holding S.r.l. On July 24, 2019, the Company entered into an amendment to the Revolving Credit Facilities due July 2021. The amendment extended the final maturity date of the Revolving Credit Facilities from July 26, 2021 to July 31, 2024 and established the minimum ratio of EBITDA to total net interest costs and the maximum ratio of total net debt to EBITDA for the extended term of the revolving credit facilities. In addition, the amendment reduced the aggregate revolving facilities commitments of the lenders from $1.20 billion and €725 million to $1.05 billion and €625 million and amended the definition of "Permitted Restricted Payment" to eliminate the leverage ratio threshold condition to the payment of dividends and other restricted payments. The amendment also allowed IGT-Europe B.V. to be added as a borrower under Revolving Credit Facility B and modified certain other non-material provisions. Interest on the Revolving Credit Facilities is payable between one and six months in arrears at rates equal to the applicable LIBOR or EURIBOR plus a margin based on the Parent’s long-term ratings by Moody’s and S&P. At December 31, 2019, there was no Annual Report and Accounts 2019 Page | 114 $1,050,000Revolving Credit Facility AParent, IGT, and IGT Global Solutions Corporation January 25, 2023540,000 January 25, 2021320,000
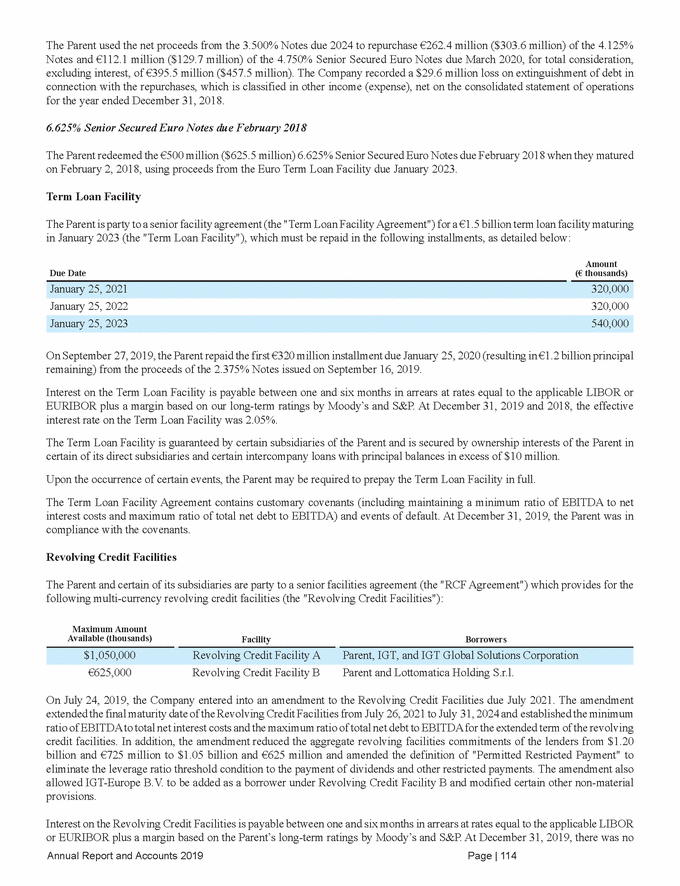
balance for the Revolving Credit Facilities. At December 31, 2018, the effective interest rate on the Revolving Credit Facilities was 2.66%. The RCF Agreement provides that the following fees, which are recorded in interest expense in the consolidated statement of operations, are payable quarterly in arrears: • Commitment fees - payable on the aggregate undrawn and un-cancelled amount of the Revolving Credit Facilities depending on the Parent’s long-term ratings by Moody’s and S&P. The applicable rate was 0.725% at December 31, 2019. Utilization fees - payable on the aggregate drawn amount of the Revolving Credit Facilities at a rate depending on the percentage of the Revolving Credit Facilities utilized. There was no balance as of December 31, 2019. • The Revolving Credit Facilities are guaranteed by the Parent and certain of its subsidiaries and are secured by ownership interests of the Parent in certain of its direct subsidiaries and certain intercompany loans with principal balances in excess of $10 million. Upon the occurrence of certain events, the borrowers may be required to repay the Revolving Credit Facilities and the lenders may have the right to cancel their commitments. At December 31, 2019 the available liquidity under the Revolving Credit Facilities was $1.752 billion. The RCF Agreement contains customary covenants (including maintaining a minimum ratio of EBITDA to net interest costs and a maximum ratio of total net debt to EBITDA) and events of default. At December 31, 2019, the borrowers were in compliance with the covenants. Other Credit Facilities The Parent and certain of its subsidiaries may borrow under senior unsecured uncommitted demand credit facilities made available by several financial institutions. At December 31, 2019, there were no borrowings under these facilities. At December 31, 2018, there were $34.8 million borrowings under these facilities with an effective interest rate of 3.64%. Letters of Credit The Parent and certain of its subsidiaries may obtain letters of credit under the Revolving Credit Facilities and under senior unsecured uncommitted demand credit facilities. The letters of credit secure various obligations, including obligations arising under customer contracts and real estate leases. The following table summarizes the letters of credit outstanding at December 31, 2019 and 2018 and the weighted-average annual cost of such letters of credit: Letters of Credit Outstanding Not under the Revolving Credit Facilities Under the Revolving Credit Facilities Weighted-Average Annual Cost ($ thousands) Total December 31, 2018 453,719 — 453,719 0.98% Interest Expense, Net For the year ended December 31, ($ thousands) 2019 2018 Term Loan Facilities (36,138) (39,462) Other (31,912) (13,036) Interest income 13,286 14,231 Annual Report and Accounts 2019 Page | 115 Interest expense, net(434,419)(417,459) Interest expense(447,705)(431,690) Revolving Credit Facilities(28,160)(27,805) Senior Secured Notes(351,495)(351,387) December 31, 2019402,300—402,3001.02%
16. Income Taxes The components of income before provision for income taxes, determined by tax jurisdiction, are as follows: For the year ended December 31, ($ thousands) 2019 2018 United States (306,772) (355,080) Other 84,580 (128,929) The provision for income taxes consists of: For the year ended December 31, ($ thousands) 2019 2018 United Kingdom 1,803 3,579 Italy 143,474 186,405 235,023 224,638 United Kingdom (151) (282) Italy 3,651 (3,186) (61,540) (40,422) Income taxes paid, net of refunds, were $235.4 million and $239.8 million in 2019 and 2018, respectively. Deferred tax related to items recognized in other comprehensive income ("OCI") during the year: December 31, ($ thousands) 2019 2018 Unrealized loss (gain) on other 183 (29) Deferred tax charged to OCI 700 895 In 2017, the United States enacted into law the Tax Cuts and Jobs Act of 2017 (the "Tax Act") which resulted in significant changes to the U.S. corporate income tax system. Changes include, but are not limited to: a corporate tax rate decrease from 35% to 21% effective for tax years beginning after December 31, 2017; the transition of U.S. international taxation from a worldwide tax system to a modified territorial tax system; and a one-time transition tax on the mandatory deemed repatriation of cumulative foreign earnings (the "transition tax") as of December 31, 2017. In accordance with the Tax Act, we recorded a $114.2 million income tax benefit in the fourth quarter of 2017, the period in which the legislation was enacted. The total tax benefit included a $60.5 million tax expense related to the transition tax and a $174.7 million tax benefit related to the remeasurement of deferred tax assets and liabilities. Annual Report and Accounts 2019 Page | 116 Foreign currency translation221,686 Unrealized loss (gain) on hedges495(762) 173,483184,216 Other(3,160)(9,952) United States(61,880)(27,002) Deferred: Other49,33045,941 United States40,416(11,287) Current: 216,52497,844 Italy403,744386,683 United Kingdom34,972195,170
The Parent is a tax resident in the United Kingdom (the "U.K."). A reconciliation of the provision for (benefit from) income taxes, with the amount computed by applying the weighted-average rate of the U.K. statutory main corporation tax rates enacted in each of the Parent’s calendar year reporting periods to income (loss) before provision for (benefit from) income taxes is as follows: For the year ended December 31, ($ thousands) 2019 2018 United Kingdom statutory tax rate 19.00% 19.00% IRAP and state taxes 30,607 38,820 Foreign tax expense, net of U.S. federal benefit 13,585 14,930 Foreign tax and statutory rate differential (1) 10,805 33,740 GILTI tax 4,575 11,079 Italian allowance for corporate equity (3,674) (4,515) Non-taxable gains on investments (6,225) — Other 14,989 (14,211) (1) Includes the effects of foreign subsidiaries' earnings taxed at rates other than the U.K. statutory rate In 2019, our effective tax rate was higher than the U.K. statutory rate of 19.00% primarily due to the impact of the international provisions of the Tax Act (BEAT and GILTI), foreign rate differences, non-deductible expenses and a goodwill impairment with no associated tax benefit. In 2018, our effective tax rate was higher than the U.K. statutory rate of 19.00% primarily due to the impact of the international provisions of the Tax Act (BEAT and GILTI), foreign rate differences, non-deductible expenses, a goodwill impairment with no associated tax benefit, increases in uncertain tax positions, and the settlement of an Italian tax audit. Annual Report and Accounts 2019 Page | 117 Effective tax rate80.1%188.3% 173,483184,216 Italian tax settlement—16,664 Non-taxable foreign exchange gain(3,744)(12,384) Change in valuation allowances507(13,723) Change in unrecognized tax benefits6,6379,166 Non-deductible goodwill impairment10,83034,960 Non-deductible expenses22,11137,331 Base erosion and anti-abuse ("BEAT") tax31,34013,769 Statutory tax expense41,14018,590 Income before provision for income taxes216,52497,844
The components of deferred tax assets and liabilities are as follows: December 31, ($ thousands) 2019 2018 Provisions not currently deductible for tax purposes 139,616 111,402 Lease liabilities 76,838 — Jackpot timing differences 40,550 42,651 Inventory reserves 3,437 10,497 Total deferred tax assets 469,130 372,855 Deferred tax liabilities: Depreciation and amortization 171,784 142,298 Other 21,903 32,707 Net deferred income tax liability (332,618) (392,143) Our net deferred income taxes are recorded in the consolidated balance sheet as follows: December 31, ($ thousands) Notes 2019 2018 Deferred income taxes - non-current liability (359,726) (430,260) As of December 31, 2019, we had recognized deferred tax assets of $469.1 million. We also have $156.1 million of unrecognized deferred tax assets primarily related to net operating losses. These deferred tax assets were not recorded because the realization of these assets is uncertain. Reconciliation of deferred tax liabilities, net December 31, ($ thousands) 2019 2018 Tax expense during the period recognized in income or loss 61,540 40,422 Translation/other (570) (1,087) Annual Report and Accounts 2019 Page | 118 Balance at end of year(332,618)(392,143) Adoption of new accounting standards(1,445)(10,173) Balance at beginning of year(392,143)(421,305) (332,618)(392,143) Deferred income taxes - non-current asset627,10838,117 Total deferred tax liabilities801,748764,998 Right-of-use assets71,817— Acquired intangible assets536,244589,993 Other40,43914,355 Net operating losses33,68471,430 Depreciation and amortization41,04446,742 Section 163(j) interest limitation93,52275,778 Deferred tax assets:
Net Operating Loss Carryforwards We have a $110.0 million gross tax loss carryforward, of which $87.6 million relates to U.S. Federal tax and $22.4 million relates to other foreign tax jurisdictions. Carryforwards in certain tax jurisdictions begin to expire in 2030, while others have an unlimited carryforward period. Portions of the tax loss carryforwards are subject to annual limitations, including Section 382 of the U.S. Internal Revenue Code of 1986, as amended, for U.S. tax purposes, and similar provisions under other countries' laws. In addition, as of December 31, 2019, we had U.S. state tax net operating loss carryforwards, resulting in a deferred tax asset (net of U.S. federal tax benefit) of approximately $10.0 million. U.S. state tax net operating loss carryforwards generally expire in the years 2020 through 2039. Accounting for Uncertainty in Income Taxes A reconciliation of the unrecognized tax benefits is as follows: December 31, ($ thousands) 2019 2018 Additions to tax positions - current year 717 11,947 Reductions to tax positions - prior years — (4,610) Lapses in statutes of limitations (535) (1,412) At December 31, 2019 and 2018, $29.1 million and $26.6 million, respectively, of the unrecognized tax benefits, if recognized, would affect our effective tax rates. We recognize interest expense and penalties related to income tax matters in the provision for income taxes. For 2019 and 2018, we recognized $4.7 million and $0.7 million, respectively, in interest expense, penalties, and inflationary adjustments. At December 31, 2019 and 2018, the gross balance of accrued interest and penalties was $21.2 million and $16.4 million, respectively. Unrecognized tax benefits increased during 2019 and 2018 as a result of various international tax audits. We file income tax returns in various jurisdictions of which the United Kingdom, United States, and Italy represent the major tax jurisdictions. All years prior to calendar year 2016 are closed with the IRS. As of December 31, 2019, we are subject to income tax audits in various tax jurisdictions globally, most significantly in Mexico and Italy. Mexico Tax Audit Based on a 2006 tax examination, the Company's Mexican subsidiary, GTECH Mexico S.A. de C.V., was issued an income tax assessment of approximately Mexican peso ("MXN") 425.0 million. The assessment relates to the denial of a deduction for cost of goods sold and the taxation of intercompany loan proceeds. The Company has unsuccessfully contested the two issues in the Mexican court system receiving unfavorable decisions by the Mexican Supreme Court in June 2017 and October 2019, respectively. As of December 31, 2019, based on the unfavorable decisions received, the Company has recorded a liability of MXN 463.9 million (approximately $24.5 million), which includes additional interest, penalties, and inflationary adjustments. Italy Tax Audits On December 21, 2017 and on March 29, 2018, the Italian Tax Authority issued a preliminary tax audit report for the 2014 and 2015 fiscal years, respectively. Both audit reports related to the reorganization of the Italian business and the merger of GTECH S.p.A. with and into the Parent effective from April 7, 2015, addressing (i) the non-deductibility of certain transaction costs, (ii) withholding taxes on bridge facility fees, and (iii) the redetermination of the taxable gains associated with the reorganization of the Italian business. The total income tax assessment for fiscal 2014 and fiscal 2015 was €13.2 million ($16.7 million), which has been settled and fully paid with the Italian Tax Authority as of December 31, 2018. Annual Report and Accounts 2019 Page | 119 Balance at end of year29,17526,635 Settlements—(17,238) Additions to tax positions - prior years2,35816,973 Balance at beginning of year26,63520,975
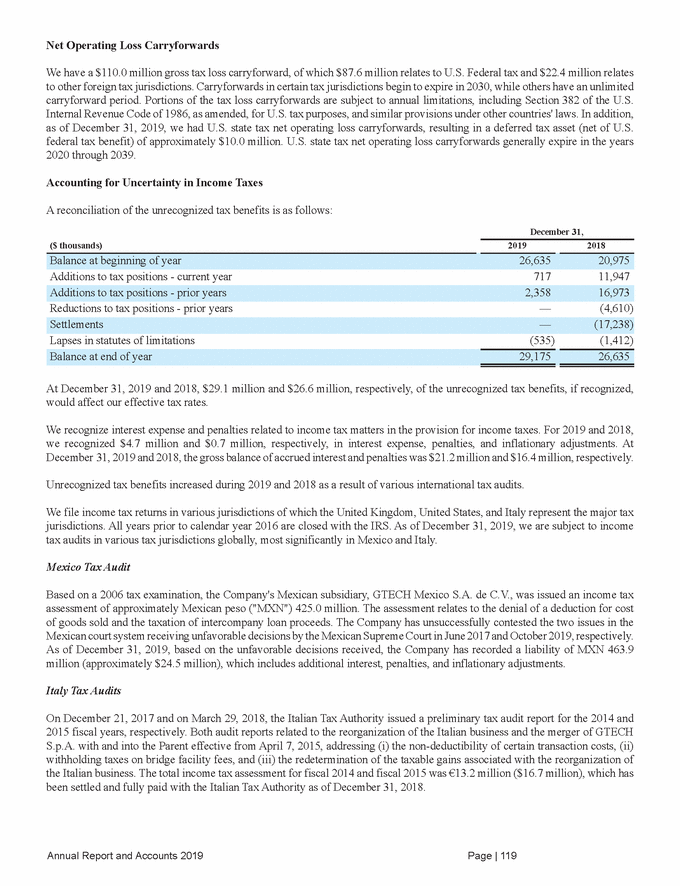
17. Commitments and Contingencies Commitments Jackpot Commitments Jackpot liabilities are recorded as current and non-current liabilities as follows: December 31, 2019 ($ thousands) Non-current liabilities 160,101 Future jackpot payments are due as follows: Previous Winners ($ thousands) Future Winners Total 2021 25,111 8,326 33,437 2023 20,073 689 20,762 Thereafter 93,745 10,329 104,074 Unamortized discounts (39,236) Performance and other bonds In connection with certain contracts, we have delivered performance bonds for the benefit of customers; bid and litigation bonds for the benefit of potential customers; and WAP bonds that are used to secure our financial liability when a player elects to have their WAP jackpot winnings paid over an extended period of time. These bonds give the beneficiary the right to obtain payment and/or performance from the issuer of the bond if certain specified events occur. In the case of performance bonds, which generally have a term of one year, such events include our failure to perform our obligations under the applicable contract. The following table provides information related to potential commitments for bonds outstanding at December 31, 2019: ($ thousands) Total bonds WAP bonds 218,419 All other bonds 3,602 Legal Proceedings From time to time, the Parent and/or one or more of its subsidiaries are party to legal, regulatory, or administrative proceedings regarding, among other matters, claims by and against us, and injunctions by third parties arising out of the ordinary course of business. Licenses are also subject to legal challenges by competitors seeking to annul awards made to the Company. The Parent and/or one or more of its subsidiaries are also, from time to time, subjects of, or parties to, ethics and compliance inquiries and investigations related to the Company’s ongoing operations. Legal proceedings can be expensive and disruptive to normal business operations. Moreover, the results of legal proceedings are often difficult to predict and our view of these matters may change as the related proceedings and events unfold. At December 31, 2019, provisions for litigation matters amounted to $15.5 million. With respect to litigation and other legal proceedings where we have determined that a loss is reasonably possible but we are Annual Report and Accounts 2019 Page | 120 770,932 Bid and litigation bonds41,788 Performance bonds507,123 Total jackpot liabilities234,826 Future jackpot payments due211,35262,710274,062 202417,49668918,185 202222,33868923,027 202032,58941,98874,577 234,827 Current liabilities74,726
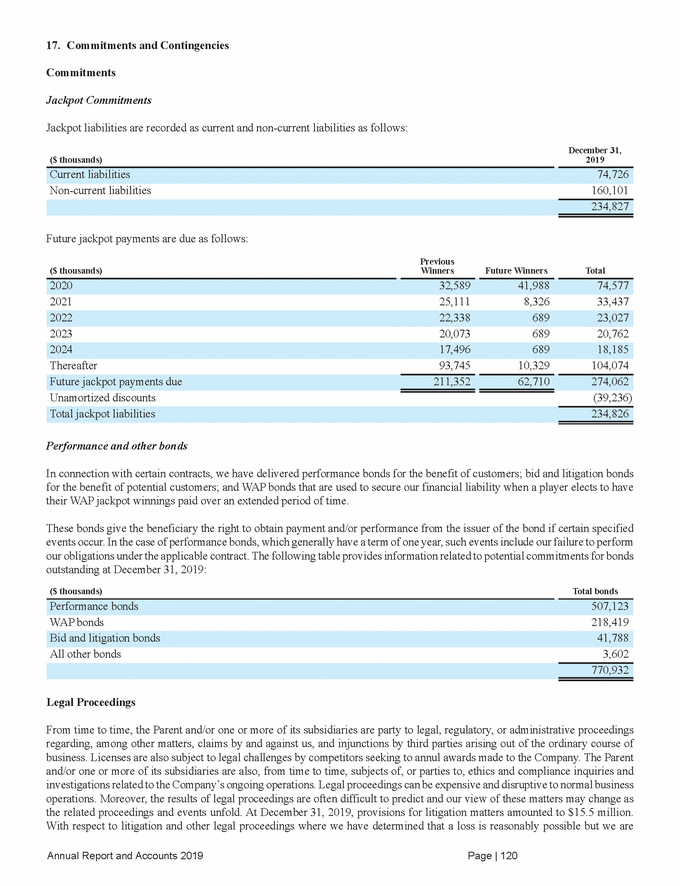
unable to estimate the amount or range of reasonably possible loss in excess of amounts already accrued, no additional amounts have been accrued, given the uncertainties of litigation and the inherent difficulty of predicting the outcome of legal proceedings. Texas Fun 5’s Instant Ticket Game Five lawsuits have been filed against IGT Global Solutions Corporation (f/k/a GTECH Corporation) in Texas state court arising out of the Fun 5’s instant ticket game sold by the Texas Lottery Commission ("TLC") from September 14, 2014 to October 21, 2014. Plaintiffs allege each ticket’s instruction for Game 5 provided a 5x win (five times the prize box amount) any time the "Money Bag" symbol was revealed in the "5X BOX". However, TLC awarded a 5x win only when (1) the "Money Bag" symbol was revealed and (2) three symbols in a pattern were revealed. (a) Steele, James et al. v. GTECH Corp., filed on December 9, 2014 in Travis County (No. D1GN145114). Through intervenor actions, over 1,200 plaintiffs claim damages in excess of $500.0 million. GTECH Corporation’s plea to the jurisdiction for dismissal based on sovereign immunity was denied. GTECH Corporation appealed. The appellate court ordered that plaintiffs' sole remaining claim should be reconsidered. Nettles, Dawn v. GTECH Corp. et al., filed on January 7, 2015 in Dallas County (No. 051501559CV). Plaintiff claims damages in excess of $4.0 million. GTECH Corporation and the TLC won pleas to the jurisdiction for dismissal based on sovereign immunity. Plaintiff lost her appeal and petitioned for Texas Supreme Court review. On April 27, 2018, IGT Global Solutions Corporation petitioned for Texas Supreme Court review and the Texas Supreme Court heard arguments on December 3, 2019 in both the Nettles and Steele cases. A decision is expected by June 2020. Guerra, Esmeralda v. GTECH Corp. et al., filed on June 10, 2016 in Hidalgo County (No. C277716B). Plaintiff claims damages in excess of $0.5 million. Wiggins, Mario & Kimberly v. IGT Global Solutions Corp., filed on September 15, 2016 in Travis County (No. D1GN16004344). Plaintiffs claim damages in excess of $1.0 million. Campos, Osvaldo Guadalupe et al. v. GTECH Corp., filed on October 20, 2016 in Travis County (No. D1GN16005300). Plaintiffs claim damages in excess of $1.0 million. (b) (c) (d) (e) We dispute the claims made in each of these cases and continue to defend against these lawsuits. Illinois State Lottery On February 2, 2017, putative class representatives of retailers and lottery ticket purchasers alleged the Illinois Lottery collected millions of dollars from sales of instant ticket games and wrongfully ended certain games before all top prizes had been sold. Raqqa, Inc. et al. v. Northstar Lottery Group, LLC., was filed in Illinois state court, St. Clair County (No. 17L51) against Northstar Lottery Group LLC, a consortium in which the Parent indirectly holds an 80% controlling interest. The claims include tortious interference with contract, violations of Illinois Consumer Fraud and Deceptive Practices Act, and unjust enrichment. The lawsuit was removed to the U.S. District Court for the Southern District of Illinois. On May 9, 2018, IGT Global Solutions Corporation and Scientific Games International, Inc. were added as defendants. We dispute these claims and continue to defend against the lawsuit. On March 15, 2017, a second lawsuit, Atteberry, Dennis et al. v. Northstar Lottery Group, LLC, was filed in Illinois state court, Cook County (No. 2017CHO3755) seeking damages on the same matter. On September 25, 2019, the Illinois state court, Cook County dismissed this case, as the parties entered into a settlement agreement. Annual Report and Accounts 2019 Page | 121
18. Shareholders’ Equity Shares Authorized and Outstanding The Board of Directors of the Parent (the "Board") is authorized to issue shares of any class in the capital of the Parent. The authorized shares of the Parent consist of 1.850 billion ordinary shares with a $0.10 per share par value. Ordinary shares outstanding were as follows: December 31, 2019 2018 Shares issued under restricted stock plans 224,602 619,614 Balance at end of year 204,435,333 204,210,731 Repurchases of Ordinary Shares The Parent has the authority to repurchase, subject to a maximum repurchase price, a maximum of 20% of the aggregate issued share capital of ordinary shares as of April 7, 2015. This authority will expire on July 28, 2020. The Parent did not repurchase any of its ordinary shares in 2019 or 2018. Dividends We declared cash dividends per share during the periods presented as follows: Per share amount ($) 2019 2018 Second Quarter 0.20 0.20 Fourth Quarter 0.20 0.20 Future dividends are subject to Board approval. During the first quarter of 2020, the Board declared a quarterly cash dividend of $0.20 per share payable in March 2020. The RCF Agreement and Term Loan Facility Agreement limit the aggregate amount of dividends and repurchases of the Parent's ordinary shares in each year to $300 million based on our current ratings by Moody’s and S&P. For the years ended December 31, 2019 and 2018, cash dividends declared were paid by our Parent and were in accordance with legal and compliance regulations. Annual Report and Accounts 2019 Page | 122 Total cash dividends declared0.800.80 Third Quarter0.200.20 First Quarter0.200.20 Shares issued upon exercise of stock options—144,545 Balance at beginning of year204,210,731203,446,572
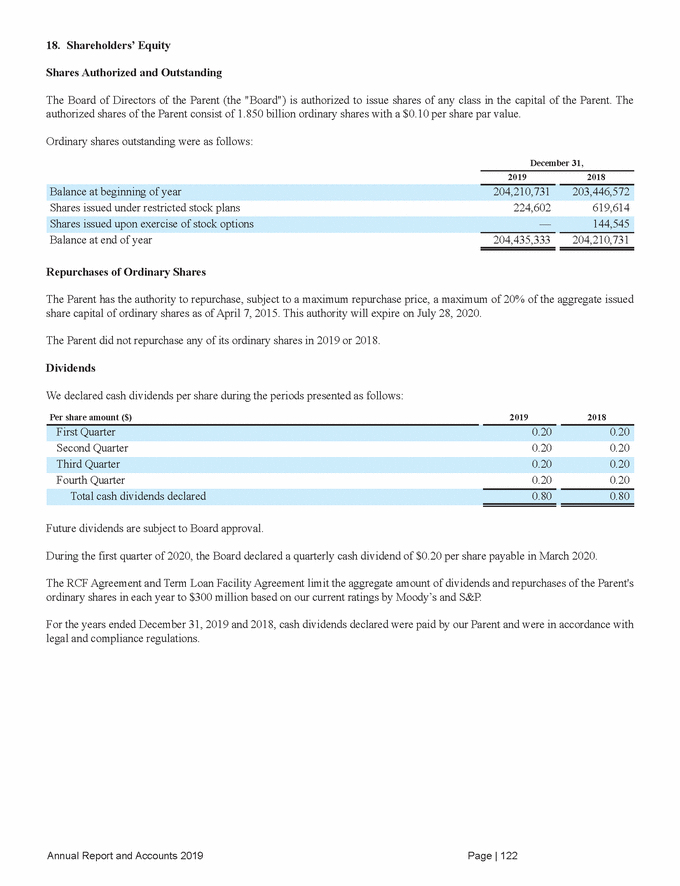
Other Reserves The following table details the changes in other reserves: Unrealized Gain (Loss) on: Other Reserves Attributable to non-controlling interests Foreign Currency Translation Attributable to IGT PLC Hedges Other Total Change during period (83,121) (204) (4,979) (88,304) 18,691 (69,613) Tax effect 1,686 (762) (29) 895 — 895 Balance at December 31, 2018 212,078 (6,800) 993 206,271 19,940 226,211 Reclassified to operations (1) 1,623 (2,183) — (560) — (560) Other comprehensive (loss) income (11,859) (1,451) 3,059 (10,251) 15,906 5,655 (1) Foreign currency translation adjustments related to liquidated subsidiaries were reclassified into foreign exchange gain, net on the consolidated statement of operations for the years ended December 31, 2019 and 2018. Unrealized gain (loss) on hedges were reclassified into service revenue on the consolidated statement of operations for the years ended December 31, 2019 and 2018, respectively. 19. Non-Controlling Interests At December 31, 2019, our material non-controlling interests ("NCIs") were as follows: % Ownership held by the Company Name of subsidiary Northstar New Jersey Lottery Group, LLC ("Northstar NJ") (1) 82.31% (1) Northstar New Jersey Holding Company LLC, of which we are a 50.15% shareholder, holds the 82.31% ownership in Northstar NJ LN holds a license to operate the Scratch & Win instant lottery game in Italy through September 2028. Northstar NJ manages a wide range of the lottery's day-to-day operations in the State of New Jersey, as well as provides marketing and sales services under a license valid through June 2029. We are the principal operating partner fulfilling the requirements under the licenses held by the NCIs. As such, we have the power to direct the activities that significantly affect the NCIs' economic performance, along with the right to receive benefits or the obligation to absorb losses that could potentially be significant to the NCIs. As a result, we concluded we have control over the NCIs and they have been consolidated. Accordingly, the balance sheet and operating activity of the NCIs are included in our consolidated financial statements and we adjust the net income (loss) in our consolidated statement of operations to exclude the NCIs' proportionate share of results. We present the proportionate share of NCIs as equity in the consolidated balance sheet. Annual Report and Accounts 2019 Page | 123 Lotterie Nazionali S.r.l. ("LN")64.00% Balance at December 31, 2019200,219(8,251)4,052196,02035,846231,866 Tax effect22495183700—700 Change during period(13,504)2372,876(10,391)15,9065,515 Other comprehensive (loss) income(85,689)(430)(5,008)(91,127)18,691(72,436) Reclassified to operations (1) (4,254)536—(3,718)—(3,718) Balance at December 31, 2017297,767(6,370)6,001297,3981,249298,647
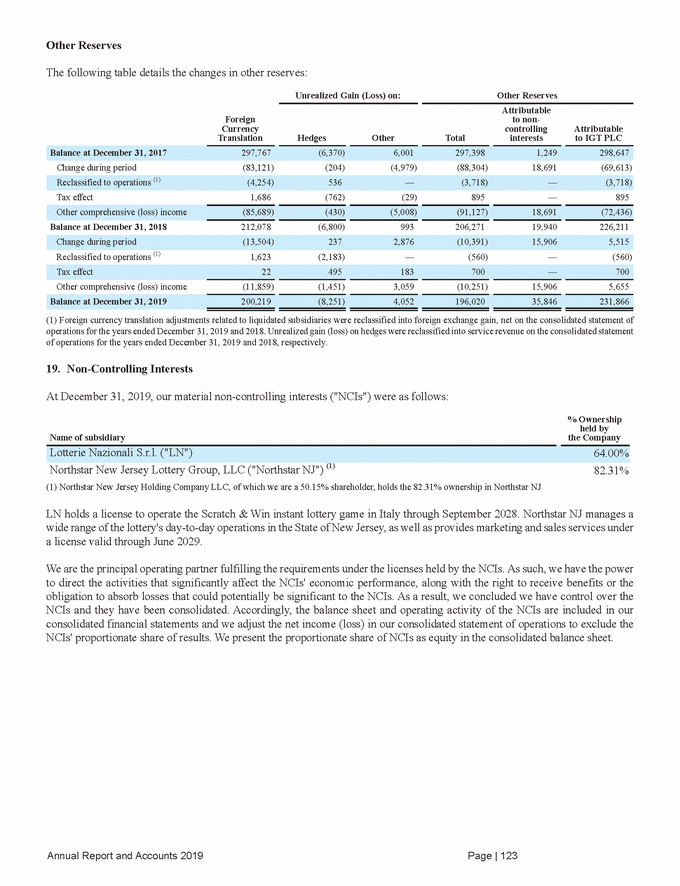
Activity within NCIs were as follows: ($ thousands) LN Northstar NJ All Other Total Net income 26,917 10,405 20,681 58,003 Total comprehensive (loss) income (4,605) 10,405 33,512 39,312 Return of capital (38,752) — (7,215) (45,967) Balance at December 31, 2018 423,274 68,695 115,166 607,135 Other comprehensive loss (7,594) — (8,312) (15,906) Capital increase — — 1,499 1,499 Dividends paid (25,616) (18,786) (18,120) (62,522) Balance at December 31, 2019 384,074 52,985 102,698 539,757 Summarized financial information for our material NCIs is as follows: Summarized Balance Sheets LN Northstar NJ December 31, December 31, ($ thousands) 2019 2018 2019 2018 Non-current assets 883,747 1,021,119 87,112 93,361 Non-current liabilities 374 838 2,490 — Shareholders' equity 1,007,906 1,117,306 100,201 128,620 Summarized Income Statements LN Northstar NJ For the year ended December 31, For the year ended December 31, ($ thousands) 2019 2018 2019 2018 Total operating expenses (192,760) (216,355) (112,795) (114,859) Total non-operating income (expenses) 85 (251) — — Benefit from income taxes (32,317) (30,111) — — Annual Report and Accounts 2019 Page | 124 Net income78,89974,6711,99716,397 Income before benefit from income taxes111,216104,7821,99716,397 Operating income111,131105,0331,99716,397 Total revenue303,891321,388114,792131,256 Total liabilities and shareholders' equity1,415,5971,435,575159,623173,236 Total liabilities407,691318,26959,42244,616 Current liabilities407,317317,43156,93244,616 Total assets1,415,5971,435,575159,623173,236 Current assets531,850414,45672,51179,875 Other——2,1182,118 Return of capital(34,424)—(10,915)(45,339) Total comprehensive income20,8403,07612,95036,866 Net income28,4343,07621,26252,772 Dividends paid(28,320)—(14,993)(43,313) Capital increase316,956—2,298319,254 Other comprehensive (loss) income(31,522)—12,831(18,691) Balance at December 31, 2017177,99558,290101,564337,849
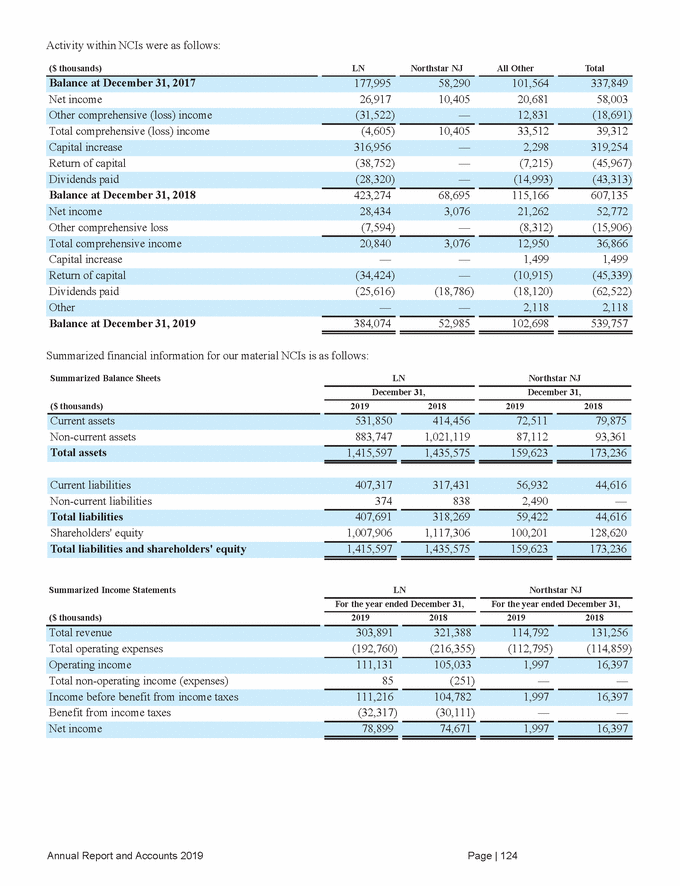
Summarized Cash Flow Statements LN Northstar NJ For the year ended December 31, For the year ended December 31, ($ thousands) 2019 2018 2019 2018 Net cash flows used in investing activities (4,498) (2,220) — — 20. Segment Information The Company's operations for the period presented here-in are classified into four principal business segments operating in three regions: North America Gaming and Interactive, North America Lottery, International, and Italy. Our chief operating decision maker monitors the operating results of our segments separately for the purpose of making decisions about resource allocation and performance assessment. Segment performance is evaluated based on operating income. Segment accounting policies are consistent with those of the consolidated financial statements. Corporate support expenses, which are not allocated to the segments, are principally composed of selling, general and administrative expenses and other expenses that are managed at the corporate level, including restructuring, transaction, corporate headquarters, and Board expenses. Purchase accounting principally represents the depreciation and amortization of acquired tangible and intangible assets in connection with acquired companies. Segment information is as follows ($ thousands): North America Gaming and Interactive North America Lottery Operating Segment Total For the year ended December 31, 2019 Corporate Support Purchase Accounting International Italy Total Product sales 451,382 92,816 379,881 981 925,060 — — 925,060 Depreciation and amortization 136,467 173,465 73,092 186,837 569,861 17,439 194,128 781,428 North America Gaming and Interactive North America Lottery Operating Segment Total For the year ended December 31, 2018 Corporate Support Purchase Accounting International Italy Total Product sales 378,693 80,833 324,486 930 784,942 — — 784,942 Depreciation and amortization 105,295 160,104 62,688 161,758 489,845 14,693 208,300 712,838 Annual Report and Accounts 2019 Page | 125 Expenditures for long-lived assets(150,440)(163,912)(60,456)(93,252)(468,060)(9,719)—(477,779) Operating income (loss)221,868297,836143,182540,1871,203,073(222,779)(390,708)589,586 Total revenue1,003,1691,191,902819,9831,813,7604,828,814—7234,829,537 Service revenue624,4761,111,069495,4971,812,8304,043,872—7234,044,595 Expenditures for long-lived assets(126,579)(149,982)(39,909)(47,233)(363,703)(8,115)—(371,818) Operating income (loss)272,319258,528127,775519,3411,177,963(235,360)(250,119)692,484 Total revenue1,070,6471,165,199840,1881,705,6684,781,702—7224,782,424 Service revenue619,2651,072,383460,3071,704,6873,856,642—7223,857,364 Net cash flows (used in) provided by financing activities(241,106)723,306(30,585)— Net cash flows provided by (used in) operating activities245,336(720,809)26,0525,538
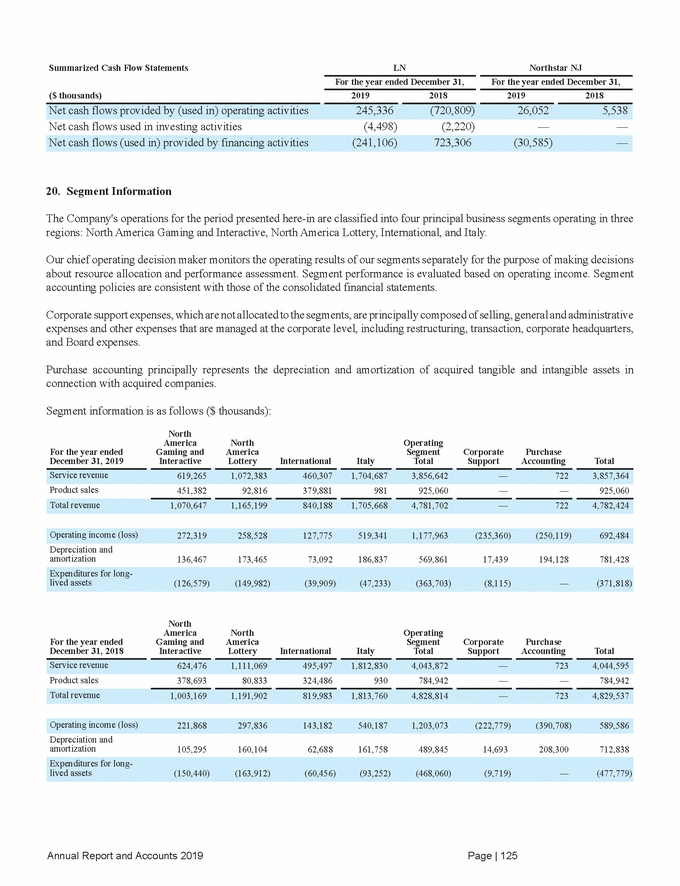
Total assets by segment are as follows: December 31, ($ thousands) 2019 2018 North America Lottery 2,446,067 2,480,027 Italy 4,380,471 4,598,577 Corporate Support 820,186 212,401 Geographical Information Revenue from external customers, which is based on the geographical location of our customers, is as follows: December 31, ($ thousands) 2019 2018 Italy 1,740,463 1,822,285 Rest of Europe 323,382 312,484 Total 4,782,424 4,829,537 Revenue from one customer in the Italy segment represented 15.9% and 16.4% of consolidated revenue in 2019 and 2018, respectively. Long-lived assets, which are comprised of Systems & Equipment and PPE, are based on the geographical location of the assets as follows: December 31, ($ thousands) 2019 2018 Italy 289,517 332,378 Rest of Europe 102,973 115,345 Total 1,454,787 1,579,448 21. Stock-Based Compensation Incentive Awards Stock-based incentive awards are provided to directors and employees under the terms of our 2015 Equity Incentive Plan (the "Plan") as administered by the Board. Awards available under the Plan principally include stock options, performance share units, restricted share units or any combination thereof. The maximum number of new shares that may be granted under the Plan is 11.5 million shares. To the extent any award is forfeited, expires, lapses, or is settled for cash, the award is available for reissue under the Plan. We utilize authorized and unissued shares to satisfy all shares issued under the Plan. Stock Options Stock options are awards that allow the employee to purchase shares of our stock at a fixed price. Stock options are granted under the Plan at an exercise price not less than the fair market value of a share on the date of grant. In 2018, stock options were granted solely to our Chief Executive Officer, which will vest in 2021 subject to certain performance and other criteria, and have a contractual term of approximately six years. No stock options were granted in 2019. Annual Report and Accounts 2019 Page | 126 All other115,059122,181 United Kingdom17,91126,256 United States929,327983,288 All other529,738572,229 United Kingdom73,05059,062 United States2,115,7912,063,477 13,641,50313,607,590 12,821,31713,395,189 International2,583,7462,728,325 North America Gaming and Interactive3,411,0333,588,260
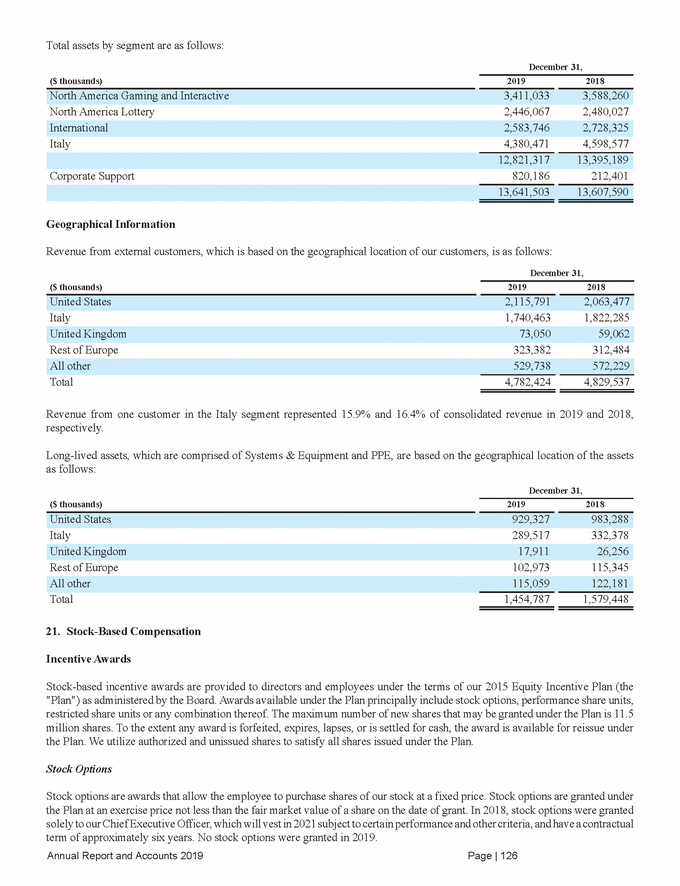
Stock Awards Stock awards are principally made in the form of performance share units ("PSUs") and restricted share units ("RSUs"). PSUs are stock awards where the number of shares ultimately received by the employee depends on the Company’s performance against specified targets, which may include Adjusted EBITDA, Adjusted Net Debt and Total Shareholder Return ("TSR") relative to the Russell Mid Cap Market Index. PSUs typically vest 50% over an approximate three-year period and 50% over an approximate four-year period. Dividend equivalents are not paid under the Plan. The fair value of each PSU is determined on the grant date or modification date, based on the Company’s stock price, adjusted for the exclusion of dividend equivalents, and assumes that performance targets will be achieved. Over the performance period, the number of shares of stock that will be issued is adjusted based upon the probability of achievement of performance targets. The ultimate number of shares issued and the related compensation cost recognized as expense is based on a comparison of the final performance metrics to the specified targets. RSUs are stock awards granted to directors that entitle the holder to shares of common stock as the award vests, typically over a one-year period, and have a contractual term of 10 years. Dividend equivalents are not paid under the Plan. Stock Option Activity A summary of our stock option activity and related information is as follows: Weighted-Average Remaining Contractual Term (in years) Aggregate Intrinsic Value ($ thousands) Stock Options Exercise Price Per Share ($) Expired (644,817) 21.66 Vested and expected to vest 1,140,566 20.73 1.43 — No stock options were exercised in 2019. The total intrinsic value of stock options exercised was $6.0 million in 2018. There were no cash proceeds from stock options exercised in 2018. Fair Value of Stock Options Granted We estimate the fair value of stock options at the date of grant using a valuation model that incorporates key inputs and assumptions as detailed in the table below. The weighted-average grant date fair value of stock options granted during 2018 was $6.84 per share. 2018 Exercise price ($) 30.12 Expected volatility of the Company’s stock (%) 35.00 Dividend yield (%) 2.66 The expected volatility assumes the historical volatility is indicative of future trends, which may not be the actual outcome. The expected option term is based on historical data and is not necessarily indicative of exercise patterns that may occur. Estimates of fair value are not intended to predict actual future events or the value ultimately realized by employees who receive equity awards, and subsequent events are not indicative of the reasonableness of our original estimates of fair value. Annual Report and Accounts 2019 Page | 127 Risk-free interest rate (%)2.73 Expected option term (in years)2.83 Valuation modelMonte Carlo Exercisable968,06619.060.91— At December 31, 2019: Outstanding at December 31, 20191,140,56620.731.43 Outstanding at January 1, 20191,785,38321.07
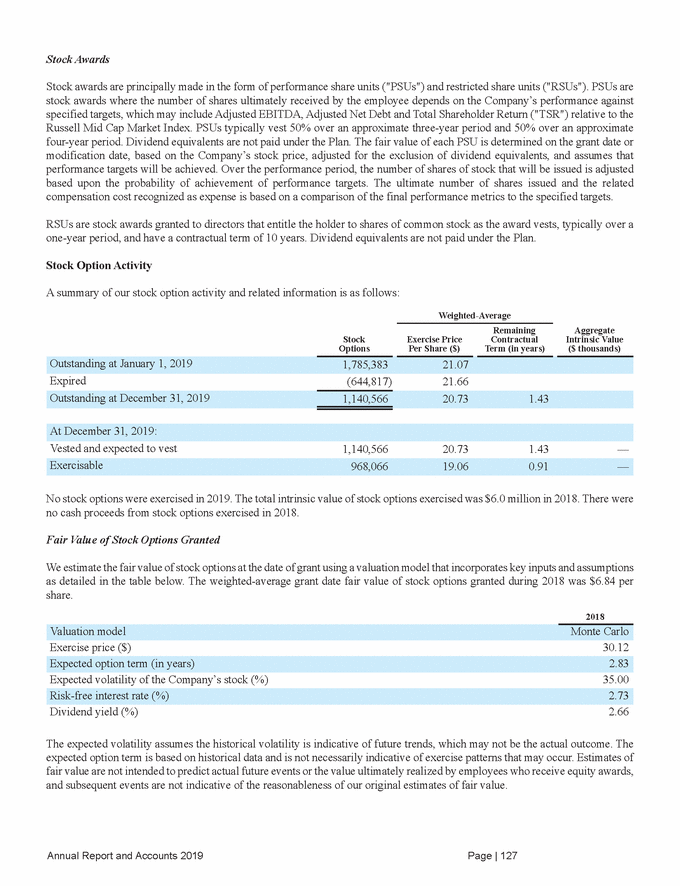
Stock Award Activity A summary of our stock award activity and related information is as follows: Weighted-Average Grant Date Fair Value ($) Weighted-Average Grant Date Fair Value ($) PSUs RSUs Granted 2,133,512 11.10 131,676 14.10 Forfeited (1,065,278) 21.26 — — Unrecognized cost for nonvested awards ($ thousands) 39,371 676 The total vest-date fair value of PSUs vested was $3.7 million and $24.6 million in 2019 and 2018, respectively. The total vest-date fair value of RSUs vested was $0.9 million and $3.4 million for 2019 and 2018, respectively. Fair Value of Stock Awards Granted We estimated the fair value of PSUs at the date of grant using a Monte Carlo simulation valuation model, as the awards include a market condition. The market condition is based on the Company's TSR relative to the Russell Midcap Market Index. During 2019 and 2018, we estimated the fair value of RSUs at the date of grant based on our stock price. Details of the grants are as follows: 2019 2018 Weighted-average grant date fair value ($) 11.10 28.93 RSUs granted during the year 131,676 68,142 Modifications 2018 During the first quarter of 2018, we modified the measurement of a performance condition for the outstanding PSUs granted in 2015, as the original vesting conditions were not expected to be satisfied. The modification affected 301 employees and resulted in $13.2 million of compensation cost for the year ended December 31, 2018. During the third quarter of 2018, we modified the measurement of a performance condition for the outstanding PSUs granted in 2016 and 2017, in order to better align the performance conditions with the PSUs granted in 2018. The modification affected 473 employees and resulted in $10.6 million of compensation cost for the year ended December 31, 2018. Annual Report and Accounts 2019 Page | 128 Weighted-average grant date fair value ($)14.1030.23 PSUs granted during the year2,133,5121,564,083 Weighted-average future recognition period (in years)2.650.37 At December 31, 2019: Nonvested at December 31, 20195,060,95118.18130,00914.07 Vested(277,330)21.68(61,580)29.84 Nonvested at January 1, 20194,270,04725.7959,91330.21
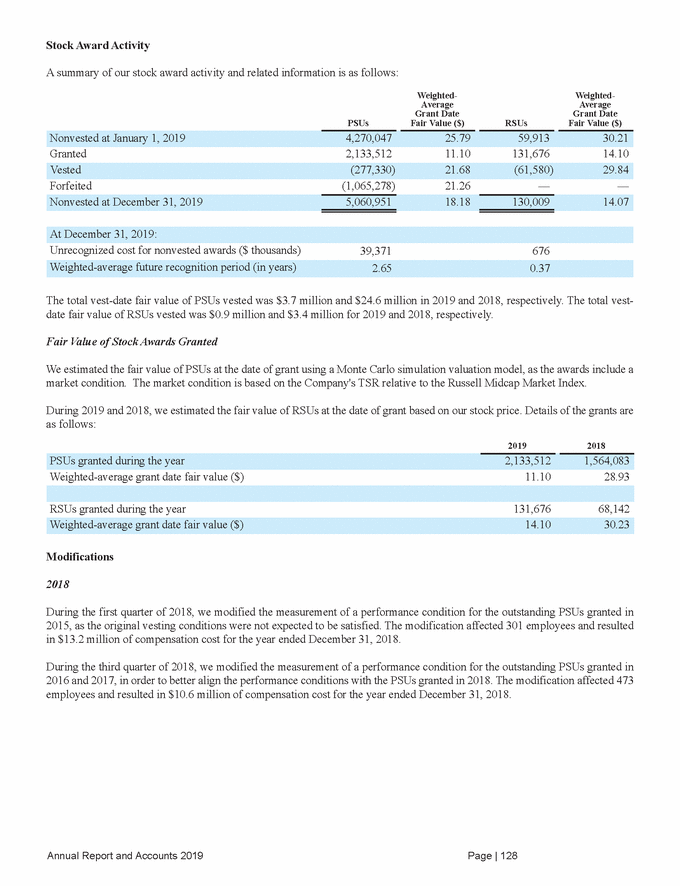
Stock-Based Compensation Expense Total compensation cost for our stock-based compensation plans is recorded based on the employees’ respective functions as detailed below. For the year ended December 31, ($ thousands) 2019 2018 Cost of product sales 393 291 Research and development 2,578 1,999 Income tax benefit 5,896 5,358 22. Earnings Per Share The following table presents the computation of basic and diluted loss per share: For the year ended December 31, ($ and shares in thousands, except per share amounts) 2019 2018 Net loss attributable to IGT PLC (9,731) (144,375) Denominator: Certain stock options to purchase common shares were outstanding, but were excluded from the computation of diluted earnings per share, because the exercise price of the options was greater than the average market price of the common shares for the full year, and therefore, the effect would have been antidilutive. During years when we are in a net loss position, certain outstanding stock options and unvested restricted stock awards are excluded from the computation of diluted earnings per share because including them would have had an antidilutive effect. For the years ended December 31, 2019 and 2018, stock options and unvested restricted stock awards totaling 1.2 million and 1.6 million, respectively, were excluded from the computation of diluted earnings per share because including them would have had an antidilutive effect. 23. Related Party Transactions We engage in business transactions with certain related parties which include (i) De Agostini or entities directly or indirectly controlled by De Agostini, (ii) other entities and individuals capable of exercising control, joint control, or significant influence over us, and (iii) our unconsolidated subsidiaries or joint ventures. Members of the Board, executives with authority for planning, directing, and controlling the activities of the Company and such Directors' and executives' close family members are also considered related parties. We may make investments in such entities, enter into transactions with such entities, or both. De Agostini Group We are majority-owned by De Agostini. Amounts receivable from De Agostini and subsidiaries of De Agostini (the "De Agostini Group") are non-interest bearing. Transactions with the De Agostini Group include payments for support services provided and office space rented pursuant to a lease entered into prior to the formation of the Company. In addition, certain of our Italian subsidiaries have a tax unit agreement, and in some cases, a VAT agreement, with De Agostini pursuant to which De Agostini consolidates certain Italian subsidiaries of De Agostini for the collection and payment of taxes to the Italian tax authority. Tax-related receivables from De Agostini were $2.0 million and $0.4 million at December 31, 2019 and 2018, respectively. Tax-related payables to De Agostini were $17.0 million and $12.3 million at December 31, 2019 and 2018, respectively. Annual Report and Accounts 2019 Page | 129 Net loss attributable to IGT PLC per common share - basic and diluted(0.05)(0.71) Weighted-average shares - basic and diluted204,373204,083 Numerator: Total stock-based compensation, net of tax19,37417,538 Stock-based compensation expense before income taxes25,27022,896 Selling, general and administrative20,37919,208 Cost of services1,9201,398
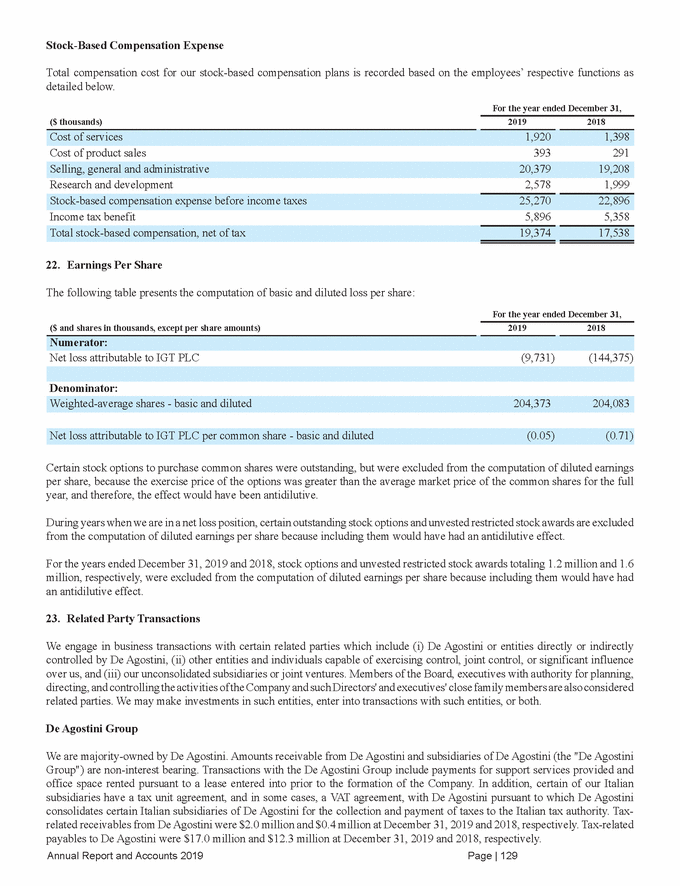
Related party transactions with the De Agostini Group are as follows: December 31, ($ thousands) 2019 2018 Trade payables 3,180 8,131 On May 22, 2018, De Agostini entered into a variable forward transaction (the "Variable Forward Transaction") with Credit Suisse International ("Credit Suisse") relating to 18.0 million of our ordinary shares owned by De Agostini. As part of the Variable Forward Transaction, to hedge its exposure, Credit Suisse or its affiliates borrowed approximately 13.2 million of our ordinary shares from third-party stock lenders and subsequently sold such ordinary shares in an underwritten public offering through Credit Suisse Securities (USA) LLC, acting as the underwriter, pursuant to an automatically effective registration statement on Form F-3 (including a base prospectus) filed by the Company with the SEC on May 21, 2018 (the "Registration Statement"). We were not a party to the Variable Forward Transaction, did not issue or sell any ordinary shares in connection with the Variable Forward Transaction, and did not receive any proceeds from the sale of the ordinary shares in the Variable Forward Transaction. De Agostini agreed to reimburse us for certain costs and fees incurred by us in connection with the Variable Forward Transaction and the preparation and filing of the Registration Statement. Unconsolidated Subsidiaries and Joint Ventures From time to time, we make strategic investments in publicly traded and privately held companies that develop software, hardware, and other technologies or provide services supporting its technologies. We may also purchase from or make sales to these organizations. Ringmaster S.r.l. ("Ringmaster") We have a 50% interest in Ringmaster, an Italian joint venture, that is accounted for using the equity method of accounting. Ringmaster provides software development services for our interactive gaming business pursuant to an agreement dated December 7, 2011. Our investment in Ringmaster was $0.7 million and $0.5 million at December 31, 2019 and 2018, respectively. We incurred $6.1 million and $10.4 million in expenses to Ringmaster for the years ended December 31, 2019 and 2018, respectively. Connect Ventures One LP and Connect Ventures Two LP We have held investments in Connect Ventures One LP and Connect Ventures Two LP (the "Connect Ventures") since 2011 and 2015, respectively, that are carried at cost and accounted for as equity investments. De Agostini also holds investments in the Connect Ventures, and Nicola Drago, the son of director Marco Drago, holds a 10% ownership interest in, and is a non-executive member of, Connect Ventures LLP, the fund that manages the Connect Ventures. The Connect Ventures are venture capital funds that target "early stage" investment operations. Our investment in Connect Ventures One LP was $4.9 million and $4.3 million at December 31, 2019 and 2018, respectively. Our investment in Connect Ventures Two LP was $6.2 million and $5.3 million at December 31, 2019 and 2018, respectively. Annual Report and Accounts 2019 Page | 130 Trade receivables21,898
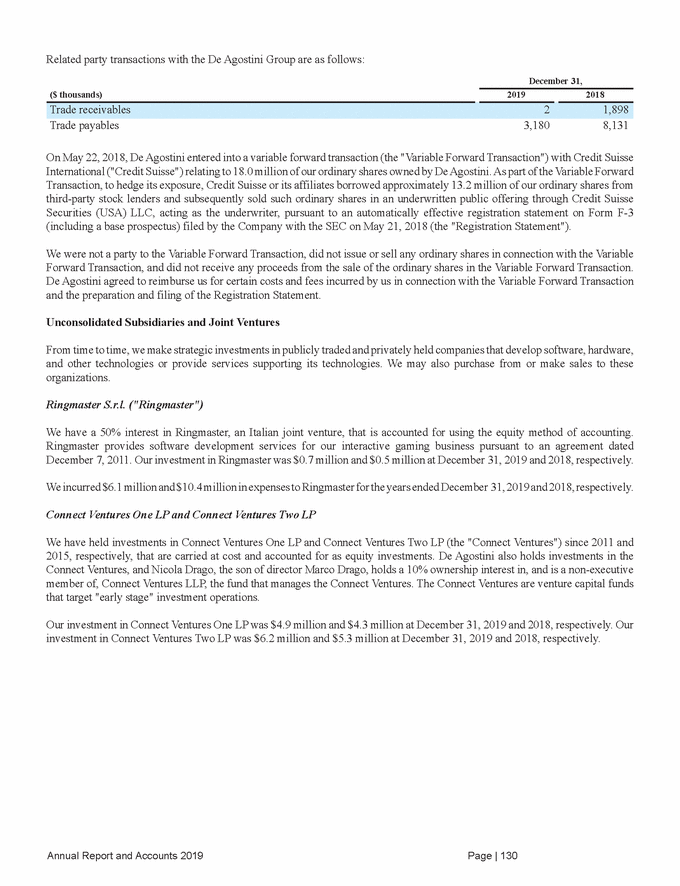
Key Management Personnel - Officer Compensation Key management personnel are those persons with authority and responsibility for planning, directing and controlling the activities of the Company. In 2019 and 2018, key management personnel was composed of ten and nine executive officers, respectively, including our Chief Executive Officer and Chief Financial Officer. Officer compensation for key management personnel for the years ended December 31, 2019 and 2018 is as follows: For the year ended December 31, ($ thousands) 2019 2018 Stock-based compensation 2,664 12,440 24,056 33,144 24. Employee Information Employee Benefit Expense For the year ended December 31, ($ thousands) 2019 2018 Social Security and other benefits 215,964 177,322 Stock-based compensation 25,270 22,896 1,145,355 1,153,716 Average Number of Employees by Segment For the year ended December 31, 2019 2018 North America Lottery 1,640 2,474 Italy 2,062 1,965 12,020 12,163 Annual Report and Accounts 2019 Page | 131 Corporate Support1,4871,395 International1,4881,514 North America Gaming and Interactive5,3434,815 Post-employment benefits21,46422,062 Incentive compensation107,73994,758 Wages and salaries774,918836,678 Post-employment benefits2,1051,567 Short-term employee benefits19,28719,137
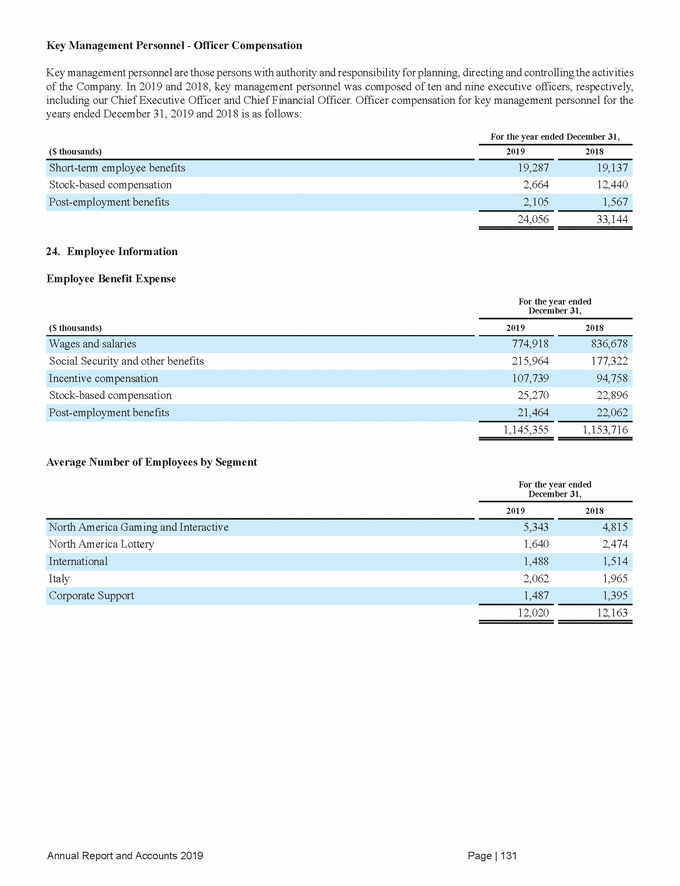
25. Auditors' Remuneration PricewaterhouseCoopers LLP ("PwC U.K.") has been serving as our independent auditor since 2015. Aggregate fees for professional services and other services rendered by PwC U.K. and its foreign entities belonging to the PwC network in 2019 and 2018 were as follows: For the year ended December 31, ($ thousands) 2019 2018 Audit services - Subsidiaries' financial statements 1,565 2,374 Audit-related services 660 1,028 13,191 15,713 26. Subsequent Events The outbreak of the coronavirus global pandemic ("COVID-19") in early 2020 has affected businesses and economic activities to varying extents and it is challenging for organizations to estimate the longer-term impacts on their business. The outbreak has materially affected the operations of the Company, its customers, suppliers and other stakeholders. The impact of COVID-19 is a non-adjusting subsequent event for these financial statements; however, we have considered its impact on the Company’s liquidity in connection with our use of the going concern basis of presentation in the preparation of the financial statements. We will continue to review the effects of COVID-19 and it is possible that it may result in impairments and other adverse charges in 2020, as discussed below. As of March 31, 2020, under U.S. GAAP, the Company determined there was an interim goodwill impairment triggering event caused by COVID-19. Based principally on management’s financial projections, which included the estimated impact of COVID-19, goodwill within the International and North America Gaming and Interactive cash-generating units were impaired by $193 million and $103 million, respectively. Under U.S. GAAP, management determined there was no impairment within our North America Lottery and Italy cash-generating units. In May 2020, the Company entered into amendments to the RCF Agreement and Term Loan Facility Agreement (collectively the "Facilities Agreements"). The amendments modify the Facilities Agreements by, among other things: providing a waiver of the covenants requiring the Company to maintain a minimum ratio of EBITDA to net interest costs and a maximum ratio of total net debt to EBITDA (collectively the "financial covenants") from the quarter ending June 30, 2020 through the quarter ending June 30, 2021; resetting the thresholds for the financial covenants from the quarter ending September 30, 2021; introducing a minimum liquidity requirement through June 30, 2021; and prohibiting the Company from making certain restricted payments (including dividends) from April 1, 2020 through June 30, 2021. At April 30, 2020, the Company had drawn $938.1 million on the Revolving Credit Facilities and had $791.6 million of available funds. 27. The Parent's Directly and Indirectly Owned Subsidiaries The Parent had the following subsidiaries for the year ended December 31, 2019: Name of entity Address of registered office Ownership % Shareholder Anguilla Lottery and Gaming Company Limited AXA Offshore Management Limited The Law Building PO Box 687, The Valley, Anguilla, British West Indies 100 Leeward Islands Lottery Holding Company, Inc. Atronic Australien GmbH Weseler Strab 253, Münster, Germany 48151 100 International Game Technology PLC Annual Report and Accounts 2019 Page | 132 Antigua Lottery Company LimitedSimon, Rogers Murdoch, Chancellor100Leeward Islands Lottery Holding Chambers, Island House, NewgateCompany, Inc. Street, St. John’s, Antigua Acres Gaming Incorporated6355 South Buffalo Drive, Las Vegas,100International Game Technology Nevada 89113, United States All other services147189 Tax services1,2941,242 Audit services - Parent company and consolidated financial statements9,52510,880
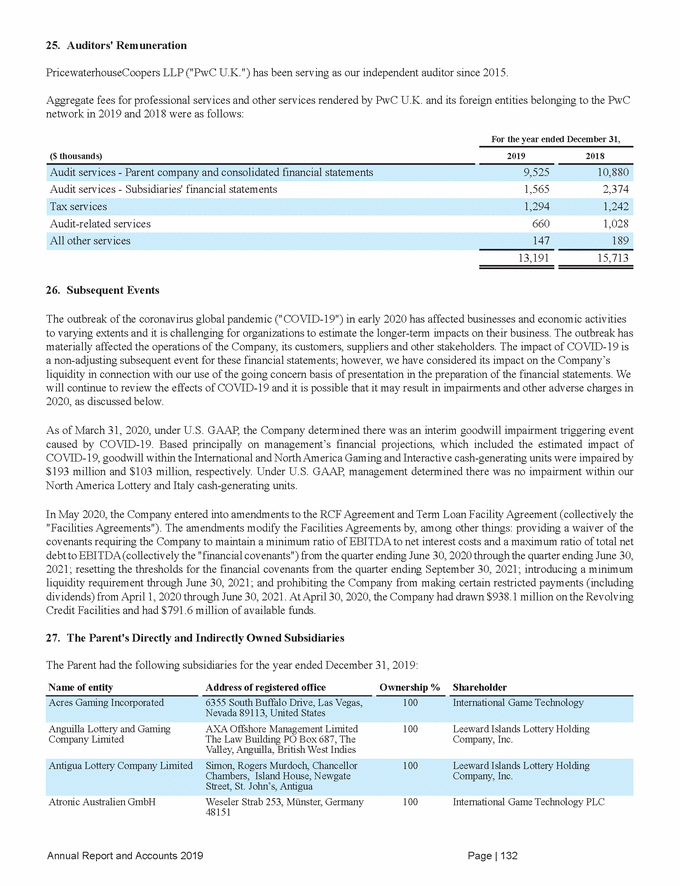
Name of entity Address of registered office Ownership % Shareholder Big Easy S.r.l. Viale del Campo Boario, 56/d Roma, Italy 56 Lottomatica Videolot Rete S.p.A. Business Venture Investments No 1560 Proprietary Limited GLMI House, Harlequins Office Park, 164 Totius Street, Groenkloof Pretoria, 0127, South Africa 100 IGT Global Services Limited CartaLis Istituto di Moneta Elettronica S.p.A. (also known as CartaLis IMEL S.p.A.) Via Pordenone, 8, Milano, Italy 100 Lottomatica Italia Servizi S.p.A. Consorzio Lotterie Nazionali Via Buonconvento, 6 Roma, Italy 63 Lottomatica Holding S.r.l. Data Transfer System Inc. 1209 Orange Street, Wilmington, DE 19801, United States 100 IGT Global Solutions Corporation Dreamport do Brasil Ltda. Rua Barao do Triunfo, 88 room 1210, Brooklin Paulista, 04602-000, Sao Paulo, Brazil 100 Dreamport, Inc. (>99.99%); IGT Foreign Holdings Corporation (<0.01%) Dreamport, Inc. 1209 Orange Street, Wilmington, DE 19801, United States 100 IGT Global Solutions Corporation Europrint (Promotions) Limited 1 Bridgewater Place, Water Lane, Leeds, West Yorkshire, LS11 5QR 100 Europrint Holdings Limited GTECH (Gibraltar) Holdings Limited f/k/a St. Enodoc Holdings Limited 23 Portland House, Glacis Road, GX11 1AA, Gibraltar 100 IGT Global Services Limited GTECH Brasil Ltda. Rua Barao do Triunfo, 88 room 1211, Brooklin Paulista, 04602-000, Sao Paulo, Brazil 100 IGT Global Solutions Corporation (>99.99%); IGT Foreign Holdings Corporation (<0.01%) IGT Malta Interactive Limited f/k/ a GTECH Malta Poker Limited f/ k/a Boss Media Malta Poker Ltd. 2, Belvedere Court, Triq Il-Qaliet, St. Julians STJ 3255, Malta 99.99 IGT Malta Casino Holdings Limited Annual Report and Accounts 2019 Page | 133 GTECH Management P.I.1209 Orange Street, Wilmington, DE100IGT Global Solutions Corporation Corporation19801, United States GTECH German HoldingsWeseler Straß 253, Mûnster,48151,100International Game Technology PLC Corporation GmbHGermany GTECH Asia Corporation1209 Orange Street, Wilmington, DE100IGT Global Solutions Corporation 19801, United States Europrint Holdings Limited1st Floor, Building 3 Croxley Green100IGT Global Solutions Corporation Business Park, Hatters Lane, Watford, Hertfordshire, England WD18 8YG Eagle Ice ABMannheimer Swartling Advokatbyra,100International Game Technology Norrlansgatan 21. Stockhom. 11187. Sweden Dreamport Suffolk Corporation1209 Orange Street, Wilmington, DE100IGT Global Solutions Corporation 19801, United States DoubleDown Interactive B.V.Galwin 2, 1046 AW Amsterdam,100IGT Interactive C.V. Netherlands Cyberview International, Inc.6355 South Buffalo Drive, Las Vegas,100IGT Nevada 89113, United States CLS-GTECH Technology2/F Block A, Raycom Info Tech Park,100CLS-GTECH Company Limited (Beijing) Co., Ltd.2 Kexueyuan South Road, Zhong Guan Cun, Haidian District, Beijing, 100190 China Caribbean Lottery Services, Inc.c/o Moore Dodson & Russell P.C., 14A100Leeward Islands Lottery Holding Norte Gade, Charlotte Amalie, St.Company, Inc. Thomas USVI 00802 BringIt, Inc.6355 South Buffalo Drive, Las Vegas,100IGT Nevada 89113, United States Beijing GTECH ComputerR1101-1102, 11F, Viva Plaza, No. 29100IGT Foreign Holdings Corporation Technology Company LimitedSuzhou Street, Haidian District, Beijing 100080, China
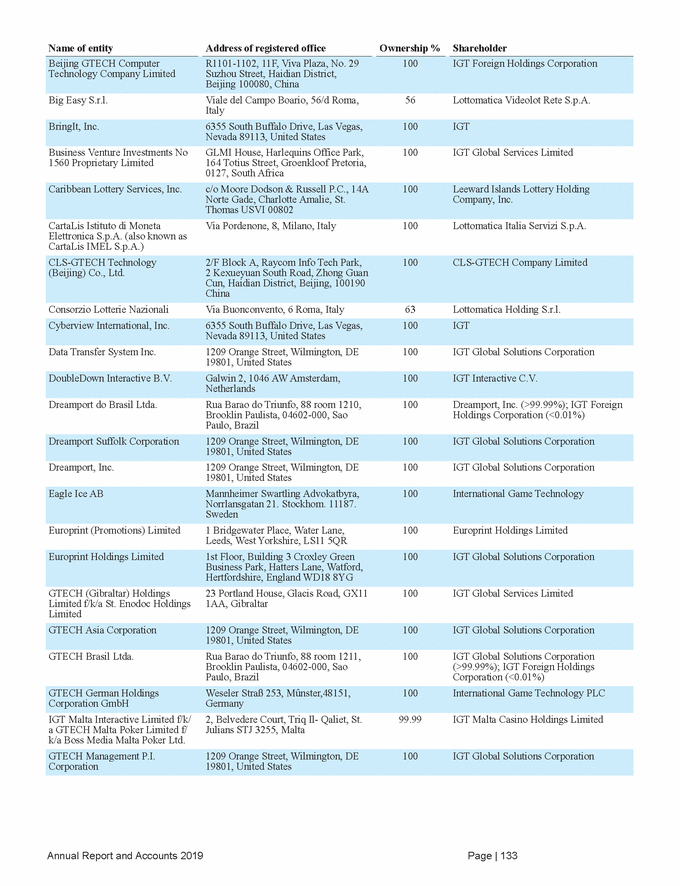
Name of entity Address of registered office Ownership % Shareholder GTECH Mexico S.A. de C.V. Av. Constituyentes 635, Colonia 16 de Septiembre,Mexico City, 11810, Mexico 100 IGT Global Solutions Corporation (99.700258% - 100% of Class II); IGT Foreign Holdings Corporation (0.343297% - 99.998% of Common); GTECH Latin America Corporation (0.000006% - .002% of Common) GTECH Ukraine 3-A Leiptsygska Street, Kyiv, Ukraine 100 GTECH Asia Corporation (99%); GTECH Management P.I. Corporation (1%) GTECH West Africa Lottery Limited 98, Awolowo Road, Ikoyi, Nigeria 100 IGT Global Services Limited (75%); IGT Ireland Operations Limited (25%) I.G.T. - Argentina S.A. Hipolito Alferez Bouchard 4191, Optima Park Tower, 5to piso - Munro, Argentina 100 International Game Technology (96.67%); International Game Technology S.R.L. (3.33%) IGT 701 South Carson Street, Suite 200, Carson City, Nevada 89701, United States 100 International Game Technology IGT (Alderney 1) Limited Inchalla, Le Val, GY93UL, Alderney, Bristish Channel Islands 100 IGT (Alderney) Limited IGT (Alderney 4) Limited Inchalla, Le Val, GY93UL, Alderney, Bristish Channel Islands 100 IGT (Alderney) Limited IGT (Alderney 7) Limited Inchalla, Le Val, GY93UL, Alderney, Bristish Channel Islands 100 IGT (Alderney) Limited IGT (Gibraltar) Limited 57 - 63 Line Wall Road, Gibraltar 100 IGT Interactive C.V. IGT (UK1) Limited Quay West Trafford Wharf Road, 100 IGT Interactive, Inc. Trafford Park, Manchester, M17 1HH, United Kingdom IGT Asia - Macau, S.A. Avenida Comercial de Macau, nos. 100 International Game Technology (99.92%); IGT (0.04%); IGT International Holdings 1 LLC (0.04%) 251A-301, AIA Tower, 21/F, Room 2101, Macau, China IGT Asiatic Development Limited Jayla Place, Wickhams Cay I, Road Town, Tortola, British Virgin Islands 100 International Game Technology IGT Austria GmbH f/k/a GTECH Austria GmbH Seering 13-14, 8141 Unterpremstatten, Austria 100 IGT Germany Gaming GmbH Annual Report and Accounts 2019 Page | 134 IGT Australasia Corporation f/k/a1209 Orange Street, Wilmington, DE100IGT Global Solutions Corporation GTECH Australasia Corporation19801, United States IGT ASIA PTE. LTD.1 Changi North St 1, 02-01 and 02-03,100International Game Technology 498789, Singapore IGT (UK2) LimitedQuay West Trafford Wharf Road,100IGT – UK Group Limited Trafford Park, Manchester, M17 1HH, United Kingdom IGT (Gibraltar) Solutions Limited23 Portland House, Glacis Road, GX11100GTECH (Gibraltar) Holdings Limited f/k/a GTECH (Gibraltar) Limited1AA, Gibraltar IGT (Alderney) LimitedInchalla, Le Val, GY93UL, Alderney,100IGT Interactive C.V. Bristish Channel Islands IGT (Alderney 5) LimitedInchalla, Le Val, GY93UL, Alderney,100IGT (Alderney) Limited Bristish Channel Islands IGT (Alderney 2) LimitedInchalla, Le Val, GY93UL, Alderney,100IGT (Alderney) Limited Bristish Channel Islands IGT - UK Group LimitedQuay West Trafford Wharf Road,100International Game Technology Trafford Park, Manchester, M17 1HH, United Kingdom I.G.T. (Australia) Pty LimitedLevel 5, 11 Talavera Road, Macquarie100International Game Technology Park, NSW 2113 Australia Hudson Alley Software, Inc.28 Liberty Street, New York, NY100IGT Global Solutions Corporation 10005 GTECH WaterPlace Park1209 Orange Street, Wilmington, DE100IGT Global Solutions Corporation Company, LLC19801, United States GTECH Southern Africa (Pty) Ltd.Ground Floor, Orbach Place, 261100IGT Global Solutions Corporation Oxford Road, Illovo 2196, South Africa
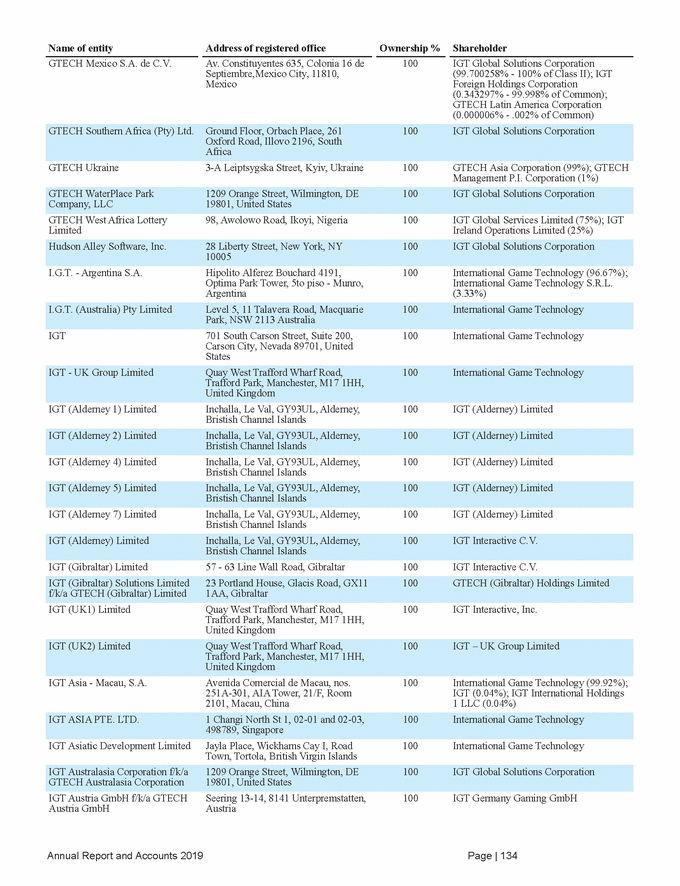
Name of entity Address of registered office Ownership % Shareholder IGT Colombia Ltda. f/k/a GTECH Colombia Ltda. Carrera 45, #108A-50, Piso 5, Bogata, Colombia 99.99 IGT Global Services Limited (99.998%); IGT Comunicaciones Colombia Ltda. (0.001%); Claudia Mendoza (0.001%) IGT Commercial Services, S de R L CV Avenida Constituyentes 635, 16 de Septiembre, Mexico City, 11810, Mexico 100 IGT Global Solutions Corporation (99.9%); IGT Foreign Holdings Corporation (0.1%) IGT Czech Republic LLC f/k/a GTECH Czech Republic LLC 1209 Orange Street, Wilmington, DE 19801, United States 37 IGT Global Solutions Corporation IGT do Brasil Ltda. Avenida das Nacoes Unidas, 14171, 15° Andar, City of Sao Paulo, Brazil 100 IGT International Treasury B.V. (99.99%); IGT International Treasury Holding LLC (0.01%) IGT EMEA B.V. Galwin 2, 1046 AW Amsterdam, Netherlands 100 IGT-Europe B.V. IGT Foreign Holdings Corporation f/k/a GTECH Foreign Holdings Corporation 1209 Orange Street, Wilmington, DE 19801, United States 100 IGT Global Solutions Corporation IGT GAMES SAS f/k/a GTECH SAS Carrera 45, #108A-50, Piso 5, Bogata, Colombia 100 IGT Global Services Limited (80%); IGT Comunicaciones Colombia Ltda. (10%); IGT Foreign Holdings Corporation (10%) IGT Germany GmbH f/k/a GTECH GmbH Weseler Straß 253, Mûnster,48151, Germany 100 IGT Global Services Limited IGT Global Solutions Corporation f/k/a GTECH Corporation 1209 Orange Street, Wilmington, DE 19801, United States 100 IGT IGT India Private Limited f/k/a GTECH India Private Limited 2nd Floor, NCC House, Sy. No. 64, Madhapur, Hyderabad, Kurnool, Telangana 500081, India 100 IGT Global Services Limited (99.99%); IGT Far East Pte Ltd. (0.01%) IGT Interactive C.V. Galwin 2, 1046 AW Amsterdam, Netherlands 100 IGT (35.8274668%); IGT Interactive Holdings 2 C.V. (32.5220680%); International Game Technology (31.6504432%); IGT Dutch Interactive LLC (0.0000220%) Annual Report and Accounts 2019 Page | 135 IGT Interactive Holdings 2 C.V.Galwin 2, 1046 AW, Amsterdam,100IGT Interactive, Inc. (13.831555%); NetherlandsInternational Game Technology (86.168444%); IGT International Holdings 1 LLC (0.000001%) IGT Indiana, LLC f/k/a GTECH150 West Market Street, Suite 800,100IGT Global Solutions Corporation Indiana, LLCIndianapolis, IN 46204, United States IGT Hong Kong Limited26th Floor, No. 8 Queen's Road100IGT Asiatic Development Limited Central. Hong Kong, China IGT Global Services Limited f/k/aGrigori Afxentiou, 27, 6021, Larnaca,100IGT Global Solutions Corporation GTECH Global ServicesCyprus Corporation Limited IGT Germany Gaming GmbH f/k/Weseler Straß 253, Mûnster,48151,100GTECH German Holdings Corporation a GTECH Germany GmbHGermanyGmbH IGT France SARL f/k/a GTECH19, Boulevard Malesherbes, 75008100IGT Foreign Holdings Corporation France SARLParis, France IGT Far East Pte Ltd f/k/a GTECH8 Marina Boulevard, #05-02, Marina100IGT Global Services Limited Far East Pte LtdBay Financial Centre, 018981, Singapore IGT Dutch Interactive LLC160 Greentree Drive, Suite 101, Dover,100IGT Interactive Holdings 2 C.V. DE 19904, United States IGT Denmark Corporation f/k/a1209 Orange Street, Wilmington, DE100IGT Global Solutions Corporation GTECH Northern Europe19801, United States Corporation IGT Comunicaciones ColombiaCarrera 45, #108A-50, Piso 5, Bogata,99.99IGT Foreign Holdings Corporation Ltda. f/k/a GTECHColombia(>99.99%); Claudia Mendoza (<0.01%) Comunicaciones Colombia Ltda.(Nominee share) IGT Colombia Solutions S.A.S.Carrera 45, #108A-50, Piso 5, Bogata,100International Game Technology PLC Colombia IGT Canada Solutions ULC f/k/a1959 Upper Water Street, Suite 900,100International Game Technology PLC GTECH Canada ULCHalifax B3J 3N2 Nova Scotia, Canada
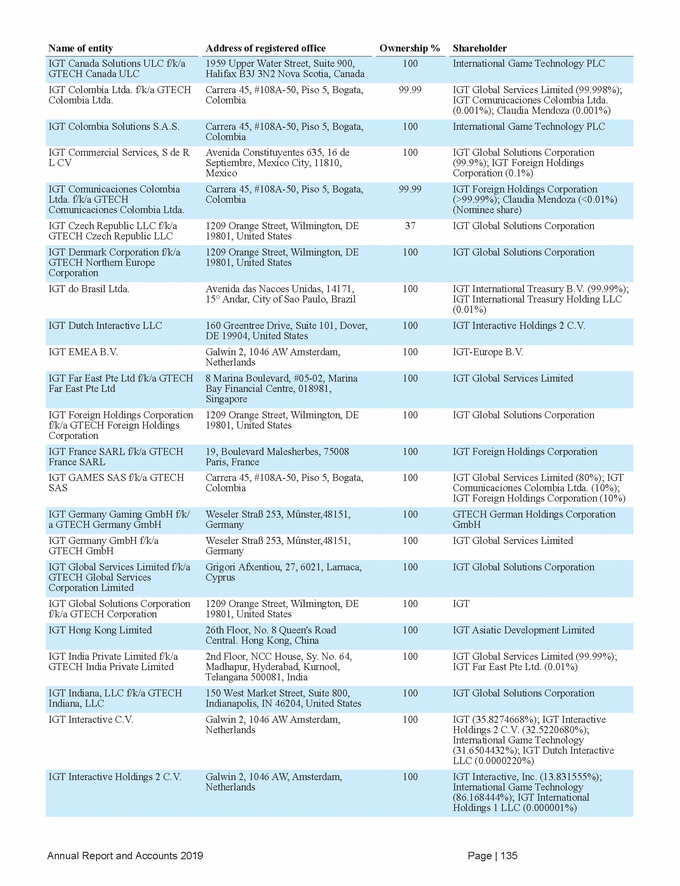
Name of entity Address of registered office Ownership % Shareholder IGT Interactive, Inc. 160 Greentree Drive, Suite 101, Dover, DE 19904, United States 100 International Game Technology IGT International Treasury B.V. Galwin 2, 1046 AW, Amsterdam, Netherlands 100 International Game Technology IGT Ireland Operations Limited f/ k/a GTECH Ireland Operations Limited Riverside One, Sir John Rogerson's Quay, Dublin 2, Ireland 100 IGT Global Services Limited IGT Japan K.K. Oak Minami-Azabu Building 2F, 3-19-23 Minami-Azabu, Minato-ku, Tokyo, 106-0047, Japan 100 IGT International Treasury B.V. IGT Korea Yuhan Chaekim Hoesa a/k/a IGT Korea LLC 16th, 17th Fl, Teheran-ro 134, Gangnam-gu, Seoul, Korea 100 IGT Global Services Limited IGT Malta Casino Holdings Limited f/k/a GTECH Malta Holdings Limited 2, Belvedere Court, Triq Il-Qaliet, St. Julians STJ 3255, Malta 99.99 IGT Sweden Interactive AB IGT Mexico Lottery S. de R.L. de C.V. f/k/a GTECH Servicios de México, S. de R.L. de C.V. Av. Constituyentes 635, 16 de Septiembre, Mexico City, Mexico 11810 100 IGT Global Solutions Corporation (99.9%); IGT Foreign Holdings Corporation Holdings Corporation (0.1%) IGT Peru Solutions S.A. f/ka GTECH Peru S.A. Av. Manuel Olguin, Officina 1001-1002, Santiago de Surco, Lima, Peru 100 IGT Germany Gaming GmbH (99.999971%); GTECH German Holdings Corporation GmbH (0.000029%) IGT Slovakia Corporation f/k/a GTECH Slovakia Corporation 1209 Orange Street, Wilmington, DE 19801, United States 100 IGT Global Solutions Corporation IGT Spain Lottery, S.LU. f/k/a GTECH Global Lottery S.L. Edificio Avant BCN, Selva 12, Planta 1, Modula A2, El Prat de Llobregat, Barcelona 08820, Spain 100 IGT Global Services Limited IGT SWEDEN AB f/k/a GTECH Sweden AB Hälsingegatan 40 12tr, 113 43 Stockholm, Sweden 100 IGT Global Services Limited k/a Boss Media AB IGT Sweden Investment AB f/k/a GTECH Sweden Investment AB Honnorsgatan 2, Vaxjo 35053, Sweden 100 IGT Sweden Interactive AB Annual Report and Accounts 2019 Page | 136 IGT Technology Development11F, Viva Plaza, No. 29 Suzhou Street,100IGT Hong Kong Limited (Beijing) Co. Ltd.Haidian District, Beijing 100080, P.R. China IGT Sweden Interactive AB f/k/aHonnorsgatan 2, Vaxjo 35053, Sweden100IGT Global Services Limited GTECH Sweden Interactive AB f/ IGT Spain Operations, S.A. f/k/aEdificio Avant, Parque de Negocios100IGT Spain Lottery S.L.U. GTECH Spain S.A.Mas Blau, Calle Selva 12, planta 1a, Modulo A2, El Prat de Llobregat, 08820, Barcelona, Spain IGT SOLUTIONS CHILE SpAAvenida El Rosal N 5.108 Santiago,100International Game Technology PLC Chile 8580000 IGT Poland Sp. z.o.o. f/k/aAL. JEROZOLIMSKIE, nr 92, 00-807,100IGT Global Solutions Corporation GTECH Poland Sp. z o.o.Warsaw, Poland IGT Monaco S.A.M. f/k/a GTECH7, Rue Du Gabian, Le Gildo Pastor-95IGT Austria GmbH (95%); Walter Bugno Monaco S.A.M.Bloc C-8 ETG-N° 22, 98000, Monaco(1%), Katarzyna Szorc (1%); Abdelhalim Stri (1%) IGT Malta Casino Limited f/k/a2, Belvedere Court, Triq Il-Qaliet, St.99.99IGT Malta Casino Holdings Limited GTECH Malta Casino LimitedJulians STJ 3255, Malta IGT Latin America Corporation f/1209 Orange Street, Wilmington, DE80IGT Global Solutions Corporation (80%); k/a GTECH Latin America19801, United StatesComputers and Controls (Holdings) CorporationLimited (20%) IGT Juegos S.A.S.Carrera 45, #108A-50, Piso 5, Bogata,100IGT Peru Solutions S.A. (60%); IGT ColombiaGames S.A.S. (40%) IGT Italia Gaming MachinesViale del Campo Boario, 56/d Roma,100Lottomatica Holding S.r.l. Solutions S.r.l. f/k/a SpieloItaly International Italy S.r.l. IGT International Treasury160 Greentree Drive, Suite 101, Dover,100IGT International Treasury B.V. Holding LLCDE 19904, United States IGT International Holdings 1 LLC160 Greentree Drive, Suite 101, Dover,100International Game Technology DE 19904, United States
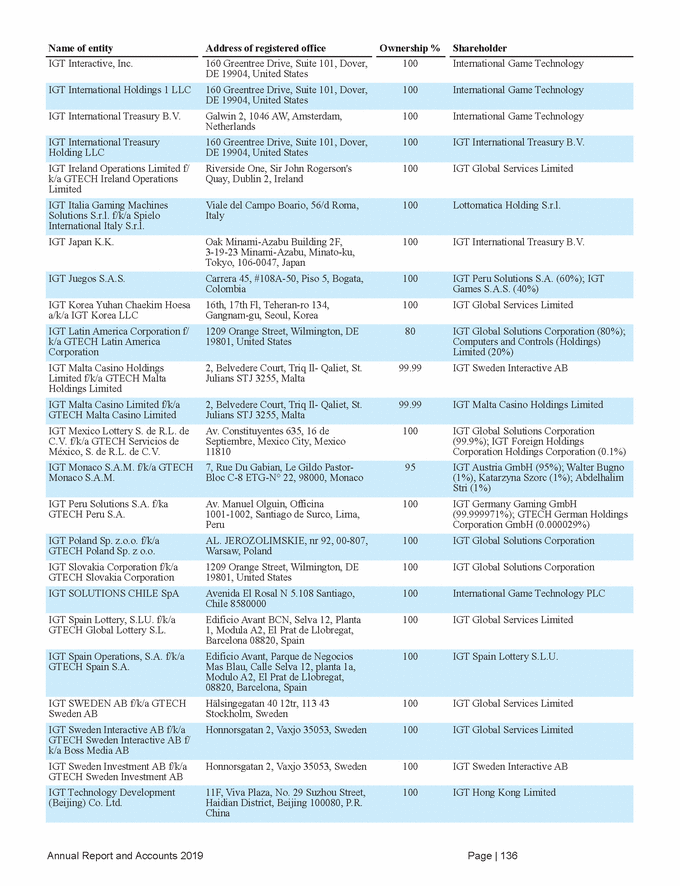
Name of entity Address of registered office Ownership % Shareholder IGT Turkey Teknik Hizmetler Ve Musavirlik Anonim f/k/a GTECH Avrasya Teknik Hizmetler Ve Musavirlik A.S. Nasuh Akar Mahallesi. Turkocagi cad. 1400. sok. No: 34/2, Balgat, Ankara, Turkey 99.9 IGT Global Solutions Corporation (99.9%); Ufuk Ozlu (0.1%) IGT UK Games Limited f/k/a GTECH UK Games Limited 3rd Floor 10 Finsbury Square, London, EC2A 1AF, United Kingdom 100 IGT Sweden Interactive AB IGT UK Interactive Limited f/k/a GTECH UK Interactive Limited 3rd Floor 10 Finsbury Square, London, EC2A 1AF, United Kingdom 100 IGT UK Interactive Holdings Limited IGT Worldwide Services 1209 Orange Street, Wilmington, DE 19801, United States 100 IGT Global Solutions Corporation Corporation f/k/a GTECH Worldwide Services Corporation IGT-China, Inc. 160 Greentree Drive, Suite 101, Dover, DE 19904, United States 100 International Game Technology IGT-Íslandi ehf. (IGT-Iceland plc) Sigtuni 3800, Selfoss, Iceland 100 International Game Technology IGT-Mexicana de Juegos, S. de R.L. de C.V. Andres Bello 45 Piso 14, Col. Polanco, Chapultepec, Deleg. Miguel Hidalgo, D.F.C.P. 11560, Mexico 100 IGT (99.99%); International Game Technology (0.01%) IMA S.r.l. Viale del Campo Boario, 56/d Roma, Italy 51 IGT EUROPE BV Interactive Games International Limited 1 Bridgewater Place, Water Lane, Leeds, West Yorkshire LS11 5QR 100 Europrint Holdings Ltd. International Game Technology (NZ) Limited Birchwood Park, Unit 4, 483 Hutt Road, Lower Hutt, New Zeland 100 I.G.T. (Australia) Pty Limited International Game Technology S.R.L. Av. Pardo y Aliaga No. 695, Oficina 11, distrito de San Isidro, provincia y departamento de Lima 100 IGT (99.991%); IGT International Holdings 1 LLC (0.009%) International Game Technology-Africa (Pty) Ltd. 2 Brands Hatch Close, Corner 100 IGT International Treasury B.V. (74.9%); IGT Empowerment Trust (25.1%) Indianapolis St, Kyalami Business Park, Midrand 1685, South Africa Annual Report and Accounts 2019 Page | 137 LB Participacões E Loterias Ltda.Calcada das Margaridas No. 163 Sala100Lottomatica Giochi e Partecipazioni 02, CV 1237 Centro Comercial de(>99.99%); International Game Alphaville, Barueri Sao Paulo BrazilTechnology PLC (<0.01%) 06453-038 International Game Technology27 Grigori, 6021, Larnaca, Cyprus100International Game Technology PLC Services Limited International Game TechnologyPza de Pablo Ruiz Picasso 1, Torre100IGT-Europe B.V. España, S.L.Picasso, 5, 28020, Madrid, Spain International Game Technology701 South Carson Strret, Suite 200,100International Game Technology PLC Carson City, Nevada 89701 Innoka OyAku Korhosen tie 4, 00440 Helsinki,81IGT Global Services Limited Finland IGT-UK Gaming LimitedQuay West, Trafford Wharf Road,100IGT – UK Group Limited Trafford Park, Manchester, M17 1HH, United Kingdom IGT-Latvia SIAKrisjana Valdemara Street 33-19. Riga,100International Game Technology Latvia IGT-Europe B.V.Galwin 2, 1046 AW Amsterdam,100International Game Technology Netherlands IGT-Canada Inc.600-1134 Grande Allee O, bureau 600,100International Game Technology Quebec (Quebec) G1S1E5, Canada IGT VIA DOMINICANAvenida Estrella Sadhala, Esquina100IGT Global Services Limited (99.9666%); REPUBLIC, SAS f/k/a GTECHBartolome Colon, Edificio Hache,IGT Ireland Operations Limited VIA DR, SASPrimer Piso, Santiago, Dominican(0.0333%) Republic IGT UK Interactive Holdings3rd Floor 10 Finsbury Square, London,100International Game Technology PLC Limited f/k/a GTECH SportsEC2A 1AF, United Kingdom Betting Solutions Limited IGT U.K. Limited f/k/a GTECH1st Floor Building, 3 Croxley Green100IGT Global Solutions Corporation U.K. LimitedBusiness Park, Hatters Lane, Watford, WD18 8YG, United Kingdom
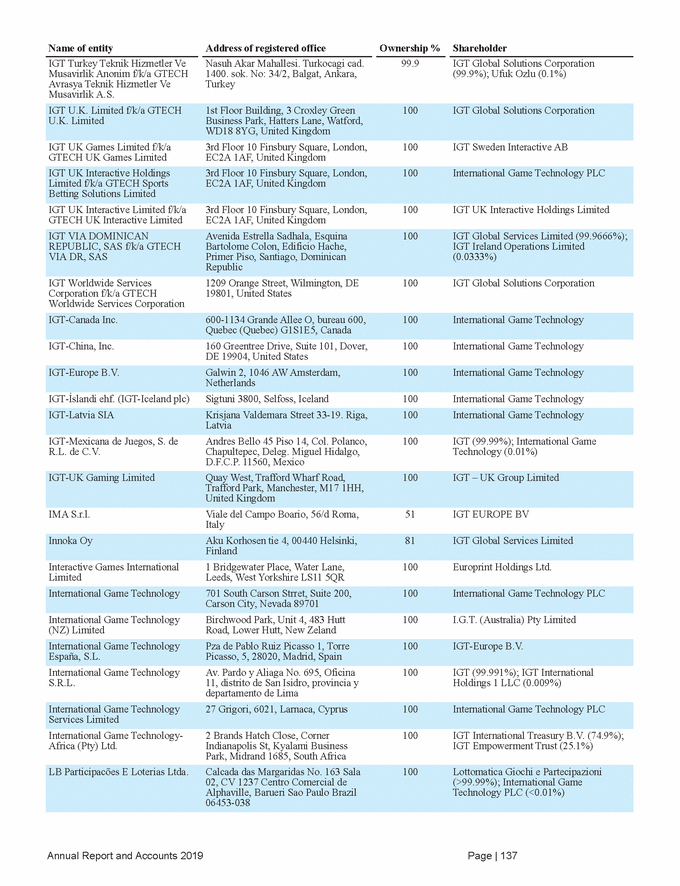
Name of entity Address of registered office Ownership % Shareholder LB Produtos Lotéricos E Licenciamentos Ltda. Calcada das Margaridas No. 163 Sala 02, CV 1237 Centro Comercial de Alphaville, Barueri Sao Paulo Brazil 06453-038 100 LB Participacões E Loterias Ltda. (>99.99%); International Game Technology PLC (<0.01%) LIS Istituto di Pagamento S.p.A. Via Pordenone, 8, Milano, Italy 100 Lottomatica Italia Servizi S.p.A. Lottery Equipment Company c/o Shevchenko, Didkovskiy and Parnters LLC, 2-A Kostyantynivska Street, 5th Floor, Kyiv, Ukraine 100 GTECH Asia Corporation (99.994%); GTECH Management P.I. Corporation (0.006%) Lottomatica Giochi e Partecipazioni S.r.l. Viale del Campo Boario, 56/d Roma, Italy 100 International Game Technology PLC Lottomatica Italia Servizi S.p.A. Via Pordenone, 8, Milano, Italy 100 Lottomatica Holding S.r.l. Lottomatica Videolot Rete S.p.A. Viale del Campo Boario, 56/d Roma, Italy 100 Lottomatica Holding S.r.l. Northstar Lottery Group, LLC 208 South LaSalle Street, Suite 814, Chicago, IL 60601, United States 80 IGT Global Solutions Corporation Northstar New Jersey Lottery Group, LLC 820 Bear Tavern Road, West Trenton, NJ 08628, United States 82.31 Northstar New Jersey Lottery Holding Company, LLC Online Transaction Technologies S.à.r.l. à Associé Unique Twin Center West, Angle Bd Zerktouni 100 IGT Foreign Holdings Corporation et Al Massira El Khadra, Casablanca, Morocco Orbita Sp. z o.o. ul. KAMIENNA, nr 21, KRAKOW, 31-403, Poland 100 IGT Global Solutions Corporation PCC Giochi e Servizi S.p.A. Viale del Campo Boario, 56/d Roma, Italy 100 Lottomatica Holding S.r.l. Powerhouse Technologies, Inc. 6355 South Buffalo Drive, Las Vegas, Nevada, 89113, United States 100 International Game Technology Prodigal Lottery Services, N.V. 63A Walter J.A. Nisbeth Road, Pondfill Philipsburg, St. Maarten 100 Leeward Islands Lottery Holding Company, Inc. Ringmaster S.r.l. Corso Francia, 110 - Torino, Italy 50 Lottomatica Holding S.r.l. Annual Report and Accounts 2019 Page | 138 SB Industria E Comercio Ltda. Rua Rio Pauini 30, A, Quadra F, 100 IGT Global Solutions Corporation conjunto Manauense, Bairro Nossa (?99.99%); IGT Foreign Holdings Senhora das Graças, CEP 69053-001, Corporation (?0.01%) Cidade de Manaus, Estado do Amazonas Retail Display and Service1209 Orange Street, Wilmington, DE100IGT Global Solutions Corporation Handlers, LLC19801, United States Probability (Gibraltar) LimitedSuite 23, Portland House Glacis Road,100IGT UK Interactive Limited GX11 1AA, Gibraltar Playyoo SAVia Cantonale 19, Lugano 6900,100IGT UK Interactive Limited Switzerland Oy IGT Finland AB f/k/a Oyc/o Veikkaus Oy, Aku Korhosen tie100IGT Global Solutions Corporation GTECH Finland Ab2-4, 00440 Veikkaus, Vantaa, Finland Optima Gaming Service S.r.l.Viale del Campo Boario, 56/d Roma,100Lottomatica Videolot Rete S.p.A. Italy Northstar SupplyCo New Jersey,820 Bear Tavern Road, West Trenton,70IGT Global Solutions Corporation LLCNJ 08628, United States Northstar New Jersey Holding820 Bear Tavern Road, West Trenton,50.15IGT Global Solutions Corporation Company, LLCNJ 08628, United States Loxley GTECH Technology102 Na Ranong Road, Klongtoey,49IGT Global Services Limited (10%); IGT Co., Ltd.Bangkok Metropolis, ThailandGlobal Solutions Corporation (39%) Lottomatica Scommesse S.r.l.Viale del Campo Boario, 56/d Roma,100Lottomatica Holding S.r.l. Italy Lottomatica Holding S.r.l.Viale del Campo Boario, 56/d Roma,100International Game Technology PLC Italy LOTTOITALIA S.r.l.Viale del Campo Boario, 56/d Roma,61.5Lottomatica Holding S.r.l. Italy Lotterie Nazionali S.r.l.Viale del Campo Boario, 56/d Roma,64Lottomatica Holding S.r.l. Italy Leeward Islands Lottery HoldingC18, The Sands Complex, Bay Road,100IGT Global Services Limited Company, Inc.Basseterre, St. Christopher, St. Kitts
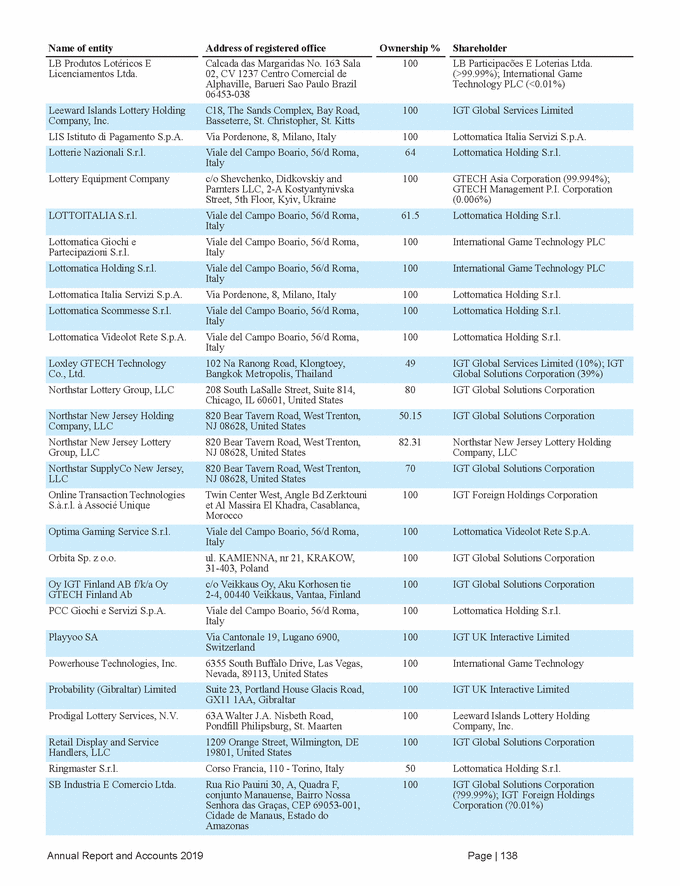
Name of entity Address of registered office Ownership % Shareholder SED Multitel S.r.l. Viale del Campo Boario, 56/d Roma, Italy 100 Lottomatica Holding S.r.l. Siam GTECH Company Limited No. 102, 16th Floor, Na Ranong Road, Klongtoey District, Bangkok, Thailand 99.965 IGT Global Solutions Corporation Technology Risk Management Services, Inc. 1209 Orange Street, Wilmington, DE 19801, United States 100 IGT Global Solutions Corporation VIA TECH Servicios SpA Isadora Goyenechea, 3447 Piso 19, 2215-21, Las Condes, Santiago, Chile 100 IGT Global Services Limited ZEST GAMING MEXICO, S.A. DE C.V. Campos Eliseos169, Col. Polanco, Mexico City, 11560, Mexico 100 International Game Technology PLC (99%); IGT Spain Lottery S.L.U. (1%) Joint Ventures Telling IGT Information Technology (Shenzhen) Co., Ltd. 503D, Tian An Chuangxin Keji Square (Phase II) East Block, the Interchange of Binhe Road and Xiangmihu Road, Shatou Street, Futian District, Shenzhen, China 49 IGT Global Services Limited Annual Report and Accounts 2019 Page | 139 Ringmaster S.r.l.Corso Francia, 110 - Torino, Italy50Lottomatica Holding S.r.l. CLS-GTECH Company LimitedPO Box 957, Offshore Incorporations50IGT Global Services Limited Centre, Road Town, Tortola, British Virgin Islands VLC, Inc.6355 South Buffalo Drive, Las Vegas,100Powerhouse Technologies, Inc. Nevada, 89113, United States UTE LOGISTA IGT f/k/a UTETrigo n° 39, Polfgono Industrial50IGT Spain Lottery S.L.U. Logista-GTECH, Law 18/1982,Polvoranca, Madrid, 18104 Spain No. 1 St. Kitts and Nevis LotteryC18, The Sands Complex, Bay Road,100Leeward Islands Lottery Holding Company, Ltd.Basseterre, St. KittsCompany, Inc. Servicios Corporativos y deAndres Bello 45 Piso 14, Col. Polanco,100International Game Technology (99.97%); Administracion, S. de R.L. de C.V.Chapultepec, Deleg. Miguel Hidalgo,IGT (0.03%) D.F.C.P. 11560, Mexico
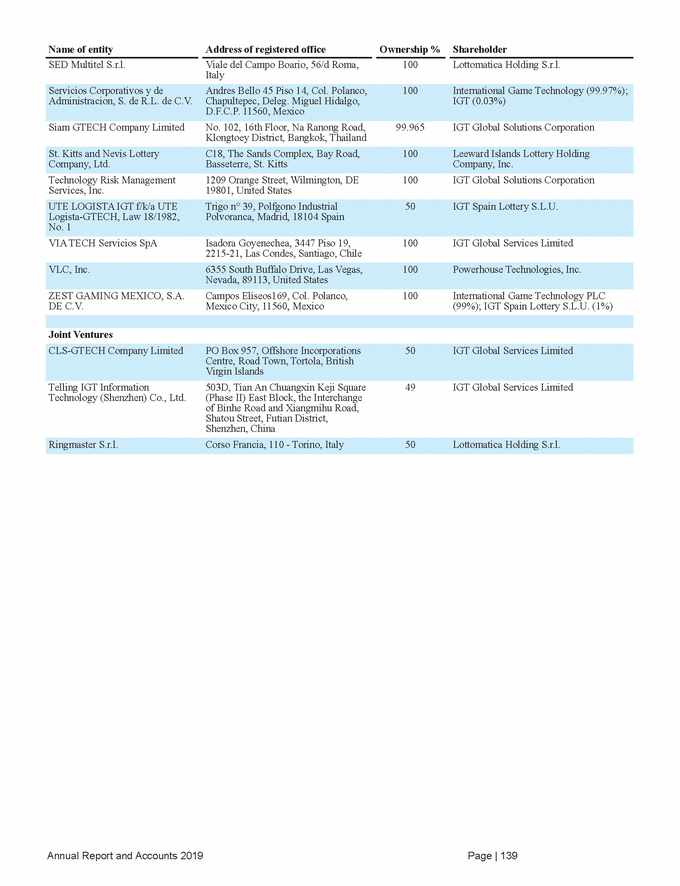
FINANCIAL STATEMENTS INTERNATIONAL GAME TECHNOLOGY PLC INDEX TO PARENT COMPANY FINANCIAL STATEMENTS Parent Balance Sheet at December 31, 2019 and 2018 141 Parent Statement of Shareholders' Equity for the years ended December 31, 2019 and 2018 142 Notes to the Parent Financial Statements 143 Annual Report and Accounts 2019 Page | 140
International Game Technology PLC Parent Balance Sheet ($ thousands) December 31, Notes 2019 2018 Current assets: Loans receivable from related parties 476,446 457,143 Other current assets 11,297 10,469 Property, plant and equipment, net 1,034 1,379 Investments in subsidiaries 3 4,659,174 4,504,754 Other non-current assets 39,703 13,956 Total assets 13,021,231 12,567,719 Liabilities and shareholders' equity Accounts payable 1,186 10,671 Short-term borrowings 4 — 29,007 Payables to related parties 533,834 518,136 Total current liabilities 1,247,136 787,722 Lease liabilities 6 11,173 — Other non-current liabilities 2,835 20,586 Total liabilities 8,874,834 8,668,041 Share capital 20,443 20,421 Retained earnings 3,960,373 3,715,278 Total shareholders' equity 4,146,397 3,899,678 Net income was $379.9 million and $386.8 million for the years ended December 31, 2019 and 2018, respectively. As permitted by section 408 of the Companies Act 2006, no statement of comprehensive income for International Game Technology PLC is shown. The Parent financial statements were approved by the Board of Directors on May 12, 2020 and signed on its behalf on May 14, 2020 by: Marco Sala Chief Executive Officer Company registration number: 09127533 The accompanying notes are an integral part of these Parent financial statements. Annual Report and Accounts 2019 Page | 141 Total liabilities and shareholders' equity13,021,23112,567,719 Other reserves144,579142,977 Share premium21,00221,002 Shareholders' equity Total non-current liabilities7,627,6987,880,319 Loans payable to related parties74,40652,746 Long-term debt, less current portion47,539,2847,806,987 Other current liabilities153,245146,865 Loans payable to related parties124,08283,043 Current portion of long-term debt4434,789— Current liabilities: Total non-current assets12,146,01411,977,078 Loans receivable from related parties7,435,1517,456,989 Right-of-use assets610,952— Total current assets875,217590,641 Receivables from related parties97,879110,202 Cash and cash equivalents289,59512,827 Assets
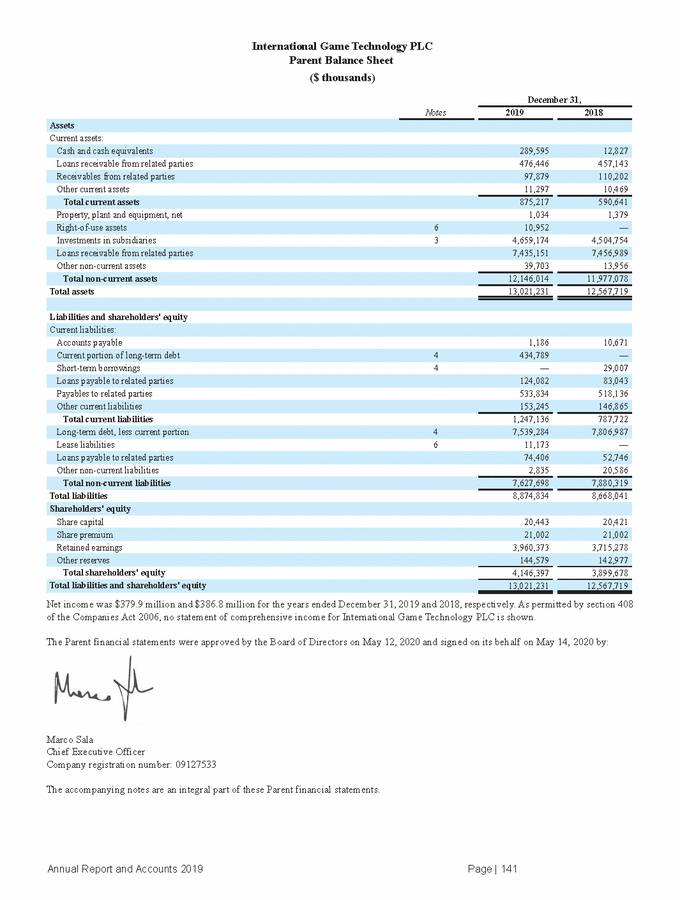
International Game Technology PLC Parent Statement of Shareholders' Equity ($ thousands) Retained Earnings Share Capital Share Premium Other Reserves Total Equity Other comprehensive loss — — — (7,314) (7,314) Shares issued under stock award plans 62 — (10,633) — (10,571) Stock-based compensation expense — — 6,613 — 6,613 Balance at December 31, 2018 20,421 21,002 3,715,278 142,977 3,899,678 Net income — — 379,911 — 379,911 Total comprehensive income — — 379,911 1,602 381,513 Dividends paid — — (163,503) — (163,503) Stock-based compensation expense — — 6,905 — 6,905 Other — — 4,858 — 4,858 For further information related to shareholders' equity, refer to Note 18, Shareholders' Equity, in the notes to the consolidated financial statements included herein. The accompanying notes are an integral part of these Parent financial statements. Annual Report and Accounts 2019 Page | 142 Balance at December 31, 201920,44321,0023,960,373144,5794,146,397 Non-cash investment in subsidiaries——18,527—18,527 Shares issued under stock award plans22—(1,603)—(1,581) Other comprehensive income———1,6021,602 Non-cash investment in subsidiaries——16,566—16,566 Shares issued upon exercise of stock options15—(1,695)—(1,680) Dividends paid——(163,236)—(163,236) Total comprehensive income (loss)——386,838(7,314)379,524 Net income——386,838—386,838 Balance at December 31, 201720,34421,0023,480,825150,2913,672,462
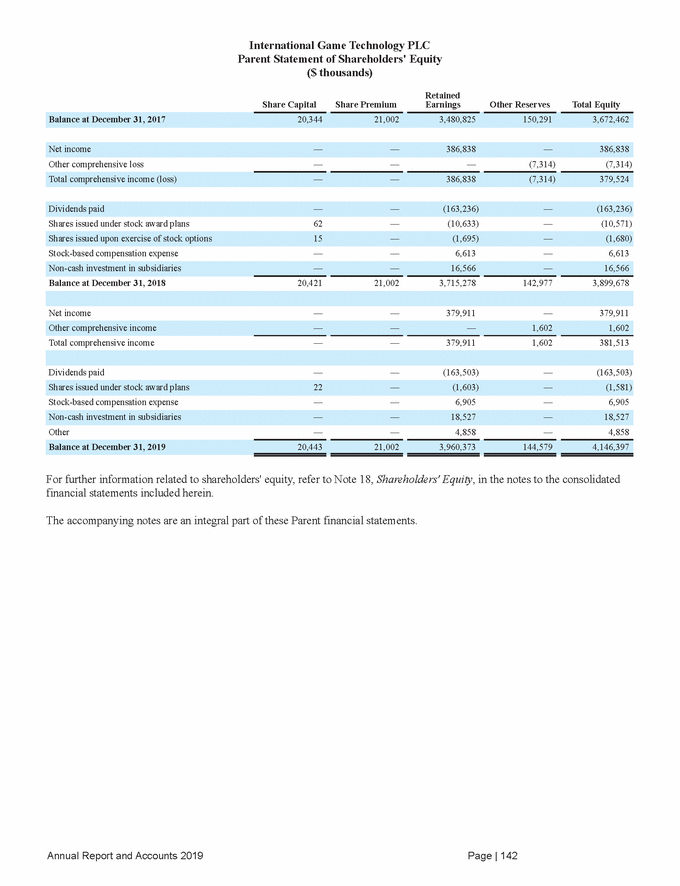
International Game Technology PLC Notes to the Parent Financial Statements 1.Description of Business The principal activities of International Game Technology PLC (the "Parent") are to make investments and provide loans to its consolidated subsidiaries. All references to the "Company" refer to the business and operations of the Parent and its consolidated subsidiaries. 2.Summary of Significant Accounting Policies Basis of Preparation The accompanying financial statements and notes of the Parent have been prepared in accordance with Financial Reporting Standard 101 "Reduced Disclosure Framework ("FRS 101") and the Companies Act 2006 applicable to companies reporting under FRS 101. The amendments to FRS 101 issued in March 2018 and effective immediately have been applied. The Parent financial statements are stated in thousands of U.S. dollars unless otherwise indicated. In the transition from International Financial Reporting Standards as adopted by the EU ("Adopted IFRS"), the Company has made no measurement and recognition adjustments. In applying FRS 101, various disclosure amendments to the financial statements have been applied from Adopted IFRS disclosure requirements. The results of the Company herein have not been impacted due to the adoption FRS 101. The comparative information has been amended where necessary to reflect the disclosure requirements of FRS 101. In preparing these financial statements, the Company applies the recognition, measurement, and disclosure requirements of Adopted IFRSs, but makes amendments where necessary in order to comply with the Companies Act 2006 and has set out below where advantage of the FRS 101 disclosure exemptions have been taken. The accounting policies set out below have been applied consistently to all periods presented in these financial statements. The following exemptions available under FRS 101 have been applied: • The following paragraphs of IAS 1 "Presentation of financial statements": 10(d) (statement of cash flows); 16 (statement of compliance with all IFRS); 38 (comparative information requirements in respect of Paragraph 79(a)(iv) of IAS 1) 38A (requirement for minimum of two primary statements, including cash flow statements); 38B-D (additional comparative information); 111 (cash flow statement information); 134-136 (capital management disclosures); IAS 7 "Statement of Cash Flows" Paragraphs 30 and 31 of IAS 8 "Accounting policies, changes in estimates and errors" (requirement for the disclosure of information when an entity has not applied a new IFRS that has been issued and is not yet effective); IFRS 7 "Financial Instruments: Disclosures"; Paragraphs 91 to 99 of IFRS 13 "Fair value measurement" (disclosure of valuation techniques and inputs used for fair value measurement of assets and liabilities); The requirements of IAS 24 "Related party disclosures" to disclose related party transactions entered into between two or more members of a group; Paragraph 17 of IAS 24 "Related party disclosures" (key management compensation); and Paragraphs 45(b) and 46 to 52 of IFRS 2, "Share-based payment" (details of the number and weighted-average exercise prices of stock options and stock awards, and how the fair value of stock options and stock awards was determined). • • • • • • • Annual Report and Accounts 2019 Page | 143
Significant Accounting Policies The accounting policies used in the preparation of the Parent financial statements are the same as those used in the preparation of the consolidated financial statements, in accordance with the Companies Act 2006. Refer to Note 2, Summary of Significant Accounting Policies, in the notes to the consolidated financial statements included herein. In addition to those accounting policies, the following accounting policy for investments in subsidiaries also applies to the Parent financial statements: Investments in subsidiaries are held at cost less accumulated impairment losses, if any. 3.Investments in Subsidiaries Country of Incorporation December 31, ($ thousands) 2019 2018 Lottomatica Holding S.r.l. Italy 838,825 836,439 4,659,174 4,504,754 For a complete list of the Parent's subsidiaries, refer to Note 27, The Parent's Directly and Indirectly Owned Subsidiaries, in the notes to the consolidated financial statements included herein. 4.Debt The principal balance of each debt obligation reconciles to the balance sheet is as follows: December 31, 2019 Debt issuance cost, net ($ thousands) Principal Swap Total 4.750% Senior Secured Euro Notes due February 2023 954,890 (6,508) — 948,382 6.500% Senior Secured U.S. Dollar Notes due February 2025 1,100,000 (10,041) — 1,089,959 6.250% Senior Secured U.S. Dollar Notes due January 2027 750,000 (6,613) — 743,387 Senior Secured Notes, long-term 6,270,840 (48,472) (473) 6,221,895 Euro Term Loan Facility due January 2023 1,325,612 (8,223) — 1,317,389 U.S. Dollar Revolving Credit Facilities due July 2024 1 — — — — Current portion of long-term debt 435,767 (978) — 434,789 Total Debt (1) $17.9 million of debt issuance costs, net presented in other non-current assets 8,032,219 (57,673) (473) 7,974,073 Annual Report and Accounts 2019 Page | 144 4.750% Senior Secured Euro Notes due March 2020435,767(978)—434,789 Long-term debt, less current portion7,596,452(56,695)(473)7,539,284 Euro Revolving Credit Facilities due July 2024 1———— 2.375% Senior Secured Euro Notes due April 2028561,700(5,297)—556,403 3.500% Senior Secured Euro Notes due June 2026842,550(7,445)—835,105 3.500% Senior Secured Euro Notes due July 2024561,700(4,369)—557,331 6.250% Senior Secured U.S. Dollar Notes due February 20221,500,000(8,199)(473)1,491,328 Other279,448245,407 International Game TechnologyUnited States3,540,9013,422,908
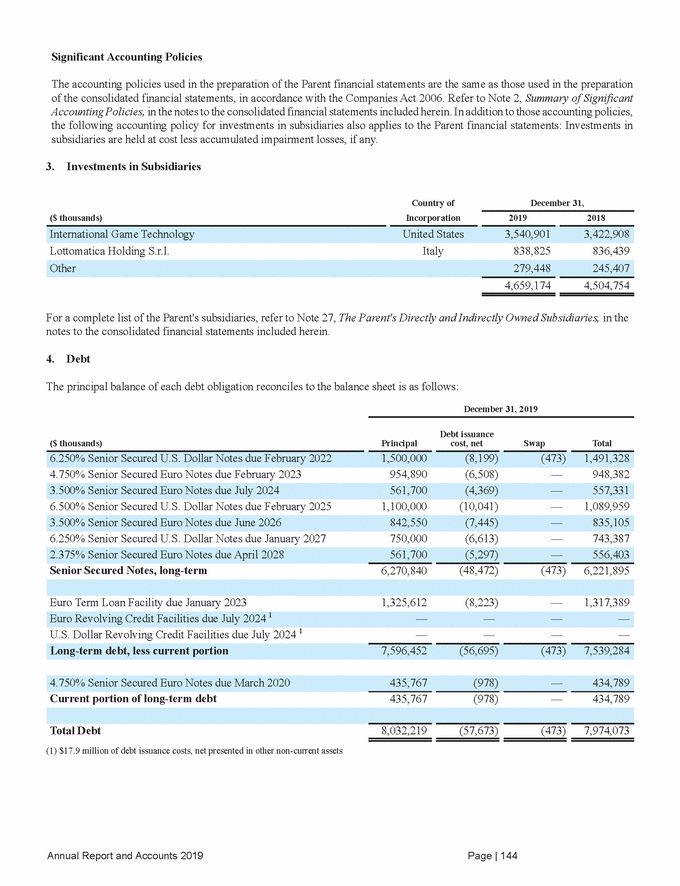
December 31, 2018 Debt issuance cost, net ($ thousands) Principal Swap Total 4.750% Senior Secured Euro Notes due March 2020 444,146 (6,323) — 437,823 4.750% Senior Secured Euro Notes due February 2023 973,250 (8,520) — 964,730 6.500% Senior Secured U.S. Dollar Notes due February 2025 1,100,000 (11,615) — 1,088,385 Senior Secured Notes, long-term 5,840,954 (52,614) (18,780) 5,769,560 Euro Term Loan Facility due January 2023 1,717,500 (12,105) — 1,705,395 U.S. Dollar Revolving Credit Facilities due July 2024 30,000 (4,963) — 25,037 Total Debt 7,930,619 (75,845) (18,780) 7,835,994 Principal payments for each debt obligation, excluding short-term borrowings, for the next five years and thereafter are as follows: (thousands): U.S. Dollar Denominated Euro Denominated Year Total 2021 — 359,488 359,488 2023 — 1,561,526 1,561,526 2025 and thereafter 1,850,000 1,404,250 3,254,250 For further information related to debt, refer to Note 15, Debt, in the notes to the consolidated financial statements included herein. 5.Income Taxes The provision for income taxes consists of: For the year ended December 31, ($ thousands) 2019 2018 Current tax on profit for the year 777 19,655 857 19,655 Income taxes paid, net of refunds, were $3.0 million and $16.7 million for 2019 and 2018, respectively. There were no deferred tax assets and deferred tax liabilities at December 31, 2019 and 2018. Annual Report and Accounts 2019 Page | 145 Withholding tax80— Current: Total principal payments$3,350,000$4,682,219$8,032,219 2024—561,700561,700 20221,500,000359,4881,859,488 2020$—$435,767$435,767 Short-term borrowings29,007——29,007 Long-term debt, less current portion7,901,612(75,845)(18,780)7,806,987 Euro Revolving Credit Facilities due July 2024313,158(6,163)—306,995 6.250% Senior Secured U.S. Dollar Notes due January 2027750,000(7,333)—742,667 3.500% Senior Secured Euro Notes due July 2024572,500(5,321)—567,179 6.250% Senior Secured U.S. Dollar Notes due February 20221,500,000(11,611)(18,780)1,469,609 4.125% Senior Secured Euro Notes due February 2020501,058(1,891)—499,167
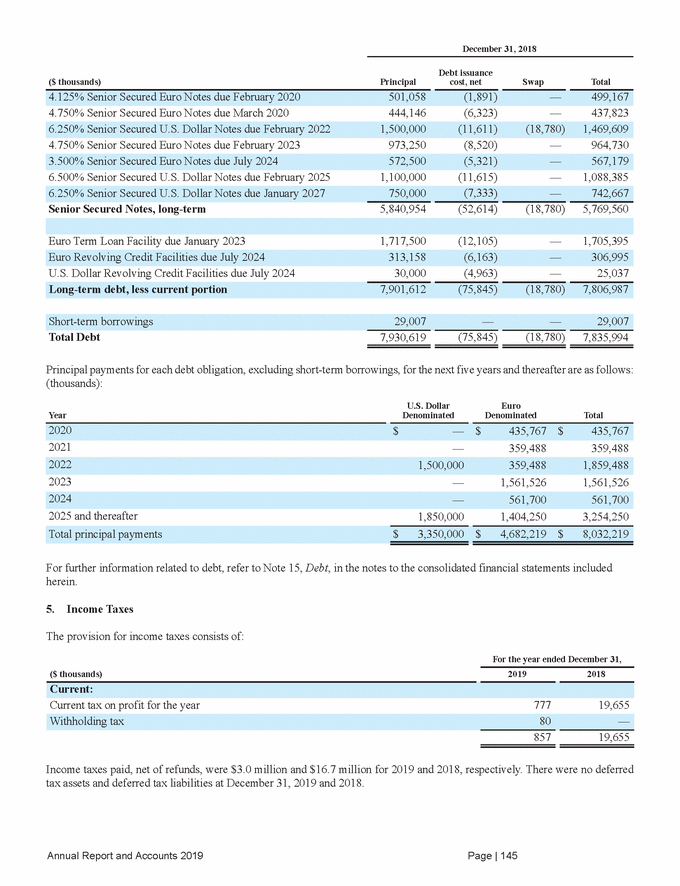
The Parent is a tax resident in the United Kingdom ("U.K."). A reconciliation of the provision for income taxes, with the amount computed by applying the weighted average rate of the U.K. statutory main corporation tax rates enacted in each of the Parent's calendar year reporting periods to income before provision for income taxes is as follows: For the year ended December 31, ($ thousands) 2019 2018 United Kingdom statutory tax rate 19.00% 19.00% Earnout investment adjustment (95) (945) Unrealized foreign exchange (3,744) (12,384) Italian tax litigation settlement — 16,664 857 19,655 Effective tax rate 0.2% 4.8% The Parent's effective income tax rate was 0.2% in 2019 compared to 4.8% in 2018. The principal drivers of the tax rate reduction were the result of no Italian tax settlement and a larger non-taxable dividend in 2019 versus 2018. Changes to the U.K. corporate tax rates were substantively enacted as part of Finance Bill 2015 (on October 26, 2015) and Finance Bill 2016 (on September 7, 2016). These changes include reductions to the main tax rate to 19% effective from April 1, 2017 and to 17% from April 1, 2020. Deferred taxes at the balance sheet date have been measured using these enacted tax rates and reflected in these financial statements. Net Operating Losses At December 31, 2019 and 2018, the Parent had gross tax loss carryforwards of $394.0 million and $402.0 million, respectively, that relate to the U.K. No deferred tax assets were recorded for these tax loss carryforwards as realization is uncertain. These tax loss carryforwards may be carried forward indefinitely notwithstanding that they offset only 50% of taxable income (above a £5.0 million full allowance threshold) in a given year. 6.Leases The Parent has a lease for its registered office in London that is effective from March 25, 2015 to March 25, 2025 and a lease for another location in London that is utilized entirely by a subsidiary, which is effective from January 14, 2016 to January 13, 2026. Leasehold improvements made to the Parent's registered office in London are capitalized and depreciated from the date placed in service through March 25, 2025, in accordance with the Company's depreciation policy. Annual Report and Accounts 2019 Page | 146 Other41643 Non-taxable dividend income(67,187)(57,355) Change in unrecognized deferred tax asset(584)(4,202) Foreign withholding taxes80— Statutory tax expense72,34677,234 Income before provision for income taxes380,768406,493
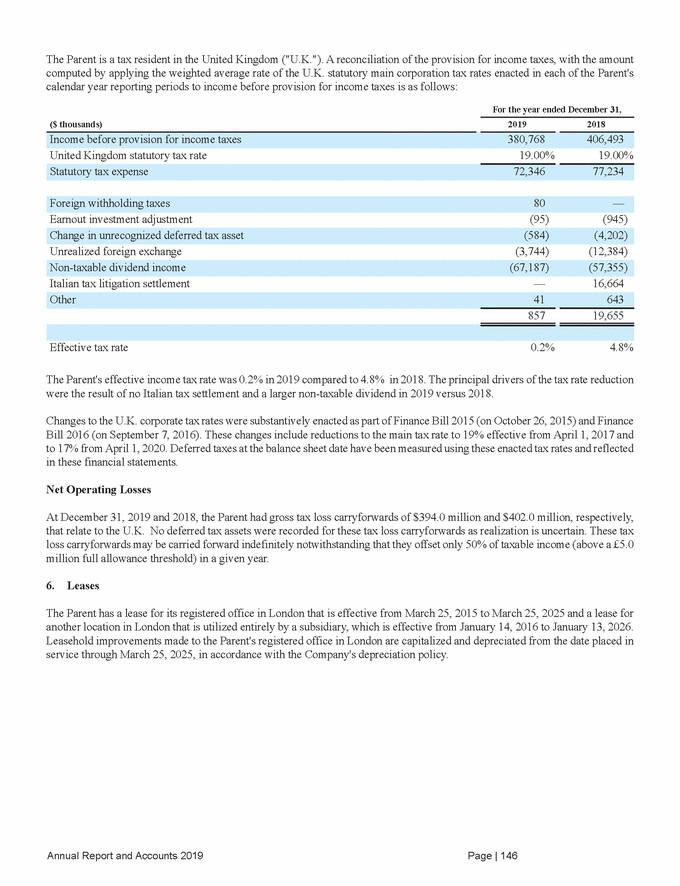
The classification of our leases in the balance sheet are as follows: ($ thousands) Balance Sheet Classification December 31, 2019 ROU asset, net (1) Right-of-use assets 10,952 Lease liability, current Other current liabilities 2,240 Total lease liabilities (1) ROU assets are recorded net of accumulated amortization of $1.9 million at December 31, 2019. 13,413 Maturities of lease liabilities at December 31, 2019 are as follows ($ thousands): Year Total 2021 2,634 2023 2,634 Thereafter 1,443 Less: Imputed interest (1,200) 7.Stock-Based Compensation Stock-based incentive awards are provided to directors and employees under the terms of our 2015 Equity Incentive Plan (the "Plan") as administered by the Board. Awards available under the Plan principally include stock options, performance share units, restricted share units or any combination thereof. The maximum number of new shares that may be granted under the Plan is 11.5 million shares. To the extent any award is forfeited, expires, lapses, or is settled for cash, the award is available for reissue under the Plan. We utilize authorized and unissued shares to satisfy all shares issued under the Plan. Stock Options Stock options are awards that allow the employee to purchase shares of our stock at a fixed price. Stock options are granted under the Plan at an exercise price not less than the fair market value of a share on the date of grant. In 2018, stock options were granted solely to our Chief Executive Officer, which will vest in 2021 subject to certain performance and other criteria, and have a contractual term of approximately six years. No stock options were granted in 2019. Stock Awards Stock awards are principally made in the form of performance share units ("PSUs") and restricted share units ("RSUs"). PSUs are stock awards where the number of shares ultimately received by the employee depends on the Company’s performance against specified targets, which may include Adjusted EBITDA, Adjusted Net Debt and Total Shareholder Return ("TSR") relative to the Russell Mid Cap Market Index. PSUs typically vest 50% over an approximate three-year period and 50% over an approximate four-year period. Dividend equivalents are not paid under the Plan. The fair value of each PSU is determined on the grant date or modification date, based on the Company’s stock price, adjusted for the exclusion of dividend equivalents, and assumes that performance targets will be achieved. Over the performance period, the number of shares of stock that will be issued is adjusted based upon the probability of achievement of performance targets. The ultimate number of shares issued and the related compensation cost recognized as expense is based on a comparison of the final performance metrics to the specified targets. Annual Report and Accounts 2019 Page | 147 Present value of lease liabilities13,413 Total lease payments14,613 20242,634 20222,634 20202,634 Lease liability, non-currentLease liabilities11,173 Liabilities Total lease assets10,952 Assets
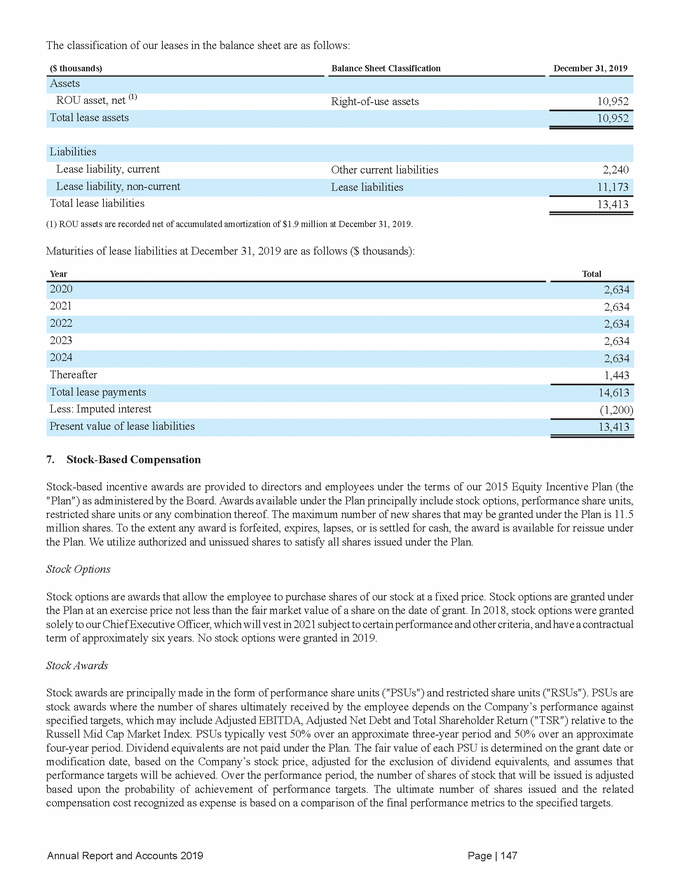
RSUs are stock awards granted to directors that entitle the holder to shares of common stock as the award vests, typically over a one-year period, and have a contractual term of 10 years. Dividend equivalents are not paid under the Plan. 8.Employee Information Employee Benefit Expense For the year ended December 31, ($ thousands) 2019 2018 Social Security and other benefits 5,265 5,767 Wages and salaries 1,784 1,892 The Parent had 8 and 10 people employed in corporate support roles as of December 31, 2019 and 2018, respectively. 9.Auditors' Remuneration Aggregate fees for audit services rendered by PricewaterhouseCoopers LLP were $75,000 for the years ended December 31, 2019 and 2018, respectively. Audit services consist of professional services performed in connection with the Parent's annual financial statements. 10. Subsequent Events Refer to Note 26, Subsequent Events, in the notes to the consolidated financial statements included herein. Annual Report and Accounts 2019 Page | 148 18,20917,904 Incentive compensation4,2553,632 Stock-based compensation6,9056,613