Period ended December 31, 2022

Cautionary Statement Regarding Forward-Looking Statements This presentation may contain forward-looking statements (including within the meaning of the Private Securities Litigation Reform Act of 1995) concerning International Game Technology PLC and its consolidated subsidiaries (the “Company”) and other matters. These statements may discuss goals, intentions, and expectations as to future plans, trends, events, dividends, results of operations, or financial condition, or otherwise, based on current beliefs of the management of the Company as well as assumptions made by, and information currently available to, such management. Forward-looking statements may be accompanied by words such as “aim,” “anticipate,” “believe,” “plan,” “could,” “would,” “should,” “shall”, “continue,” “estimate,” “expect,” “forecast,” “future,” “guidance,” “intend,” “may,” “will,” “possible,” “potential,” “predict,” “project” or the negative or other variations of them. These forward-looking statements speak only as of the date on which such statements are made and are subject to various risks and uncertainties, many of which are outside the Company’s control. Should one or more of these risks or uncertainties materialize, or should any of the underlying assumptions prove incorrect, actual results may differ materially from those predicted in the forward-looking statements and from past results, performance, or achievements. Therefore, you should not place undue reliance on such statements. Factors that could cause actual results to differ materially from those in the forward-looking statements include (but are not limited to) the factors and risks described in the Company’s annual report on Form 20-F for the financial year ended December 31, 2021 and other documents filed from time to time with the SEC, which are available on the SEC’s website at www.sec.gov and on the investor relations section of the Company’s website at www.IGT.com. Except as required under applicable law, the Company does not assume any obligation to update these forward-looking statements. You should carefully consider these factors and other risks and uncertainties that affect the Company’s business. Nothing in this presentation is intended, or is to be construed, as a profit forecast or to be interpreted to mean that the financial performance of International Game Technology PLC for the current or any future financial years will necessarily match or exceed the historical published financial performance of International Game Technology PLC, as applicable. All forward-looking statements contained in this presentation are qualified in their entirety by this cautionary statement. All subsequent written or oral forward-looking statements attributable to International Game Technology PLC, or persons acting on its behalf, are expressly qualified in their entirety by this cautionary statement. Comparability of Results All figures presented in this presentation are prepared under U.S. GAAP, unless noted otherwise. Non-GAAP Financial Measures Management supplements the reporting of financial information, determined under GAAP, with certain non-GAAP financial information. Management believes the non-GAAP information presented provides investors with additional useful information, but it is not intended to nor should it be considered in isolation or as a substitute for the related GAAP measures. Moreover, other companies may define non-GAAP measures differently, which limits the usefulness of these measures for comparisons with such other companies. The Company encourages investors to review its financial statements and publicly-filed reports in their entirety and not to rely on any single financial measure. Adjusted EBITDA represents net income (loss) from continuing operations (a GAAP measure) before income taxes, interest expense, net, foreign exchange gain (loss), net, other non-operating expenses (e.g., DDI / Benson Matter provision, gains/losses on extinguishment and modifications of debt, etc.), net, depreciation, impairment losses, amortization (service revenue, purchase accounting and non-purchase accounting), restructuring expenses, stock-based compensation, litigation expense (income), and certain other non-recurring items. Other non-recurring items are infrequent in nature and are not reflective of ongoing operational activities. For the business segments, Adjusted EBITDA represents segment operating income (loss) before depreciation, amortization (service revenue, purchase accounting and non-purchase accounting), restructuring expenses, stock-based compensation, litigation expense (income) and certain other non-recurring items. Management believes that Adjusted EBITDA is useful in providing period-to-period comparisons of the results of the Company's ongoing operational performance. Adjusted EPS represents diluted earnings per share from continuing operations (a GAAP measure), excluding the effects of foreign exchange, impairments, amortization from purchase accounting, discrete tax items, and other significant non-recurring adjustments that are not reflective of on-going operational activities (e.g., DDI / Benson Matter provision, gains/losses on sale of business, gains/losses on extinguishment and modifications of debt, etc.). Adjusted EPS is calculated using diluted weighted- average number of shares outstanding, including the impact of any potentially dilutive common stock equivalents that are anti-dilutive to GAAP net income (loss) per share but dilutive to Adjusted EPS. Management believes that Adjusted EPS is useful in providing period-to-period comparisons of the results of the Company's ongoing operational performance. Net debt is a non-GAAP financial measure that represents debt (a GAAP measure, calculated as long-term obligations plus short-term borrowings) minus capitalized debt issuance costs and cash and cash equivalents, including cash and cash equivalents held for sale. Cash and cash equivalents, including cash and cash equivalents classified as held for sale, are subtracted from the GAAP measure because they could be used to reduce the Company’s debt obligations. Management believes that net debt is a useful measure to monitor leverage and evaluate the balance sheet. Net debt leverage is a non-GAAP financial measure that represents the ratio of Net debt as of a particular balance sheet date to Adjusted EBITDA for the last twelve months (“LTM”) prior to such date. Management believes that Net debt leverage is a useful measure to assess IGT's financial strength and ability to incur incremental indebtedness when making key investment decisions. Free cash flow is a non-GAAP financial measure that represents cash flow from operations (a GAAP measure) less capital expenditures. Management believes free cash flow is a useful measure of liquidity and an additional basis for assessing IGT’s ability to fund its activities, including debt service and distribution of earnings to shareholders. Constant currency or constant FX is a non-GAAP financial measure that expresses the current financial data using the prior-year/period exchange rate (i.e., the month end exchange rates used in preparing the financial statements for the prior year). Management believes that constant currency is a useful measure to compare period-to-period results without regard to the impact of fluctuating foreign currency exchange rates. A reconciliation of the non-GAAP measures to the corresponding amounts prepared in accordance with GAAP appears in the tables in this release. The tables provide additional information as to the items and amounts that have been excluded from the adjusted measures. 2

3

Achieved all Financial Goals, Returned Record Capital to Shareholders, and Strengthened Leadership Positions in FY’22 4 #1 #1 • U.S. & Canada iGaming Market Share • North American Sports Betting Service Provider • North American Unit Ship Share for four consecutive years (2) • Global Game Feature Patent Portfolio Top 3 Industry-Leading ESG Ratings #1 • Global Lottery Operator (1) • Global Lottery Service Provider (1) • Global iLottery Platform Provider (1) Revenue Operating Income Margin Cash From Operations Capital Expenditures 2022 Financial Goals $4.1B - $4.2B 20% - 22% $850M - $950M ~$350M 2022 Actual Results $4.2B 22% $899M $317M Achievement Global Lottery Global Gaming PlayDigital Global Gaming Awards 2023 "Casino Supplier of the Year“ third consecutive win European Casino Awards 2023 "Best Slot Machine PeakSlant49" International Gaming Awards 2023 "Lottery Product of the Year 'Progressive eInstants'" ((1) Based on global market presence (2) Based on Eilers & Krejcik Gaming research; 2022 market share based on YTD as of 9/30/22 (the latest available data)
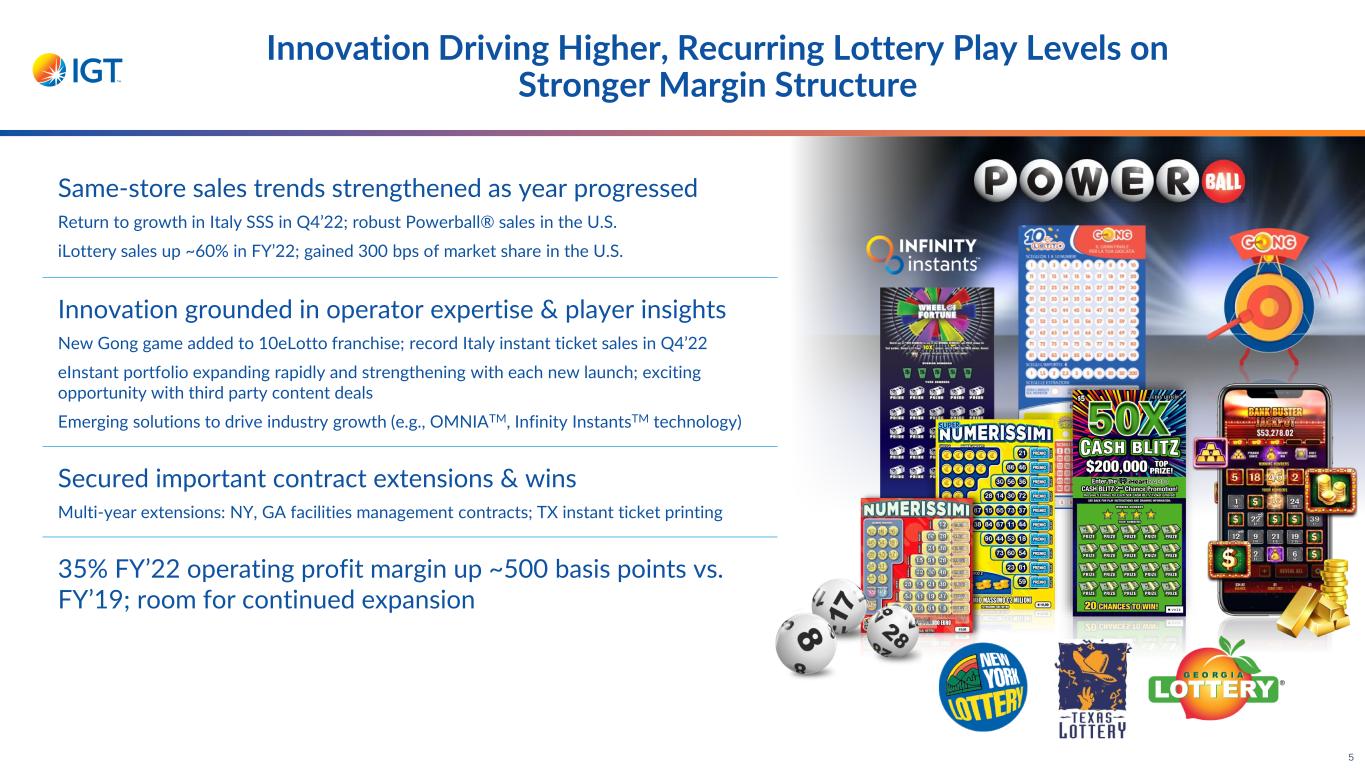
Innovation Driving Higher, Recurring Lottery Play Levels on Stronger Margin Structure 5 Same-store sales trends strengthened as year progressed Return to growth in Italy SSS in Q4’22; robust Powerball® sales in the U.S. iLottery sales up ~60% in FY’22; gained 300 bps of market share in the U.S. Innovation grounded in operator expertise & player insights New Gong game added to 10eLotto franchise; record Italy instant ticket sales in Q4’22 eInstant portfolio expanding rapidly and strengthening with each new launch; exciting opportunity with third party content deals Emerging solutions to drive industry growth (e.g., OMNIATM, Infinity InstantsTM technology) Secured important contract extensions & wins Multi-year extensions: NY, GA facilities management contracts; TX instant ticket printing 35% FY’22 operating profit margin up ~500 basis points vs. FY’19; room for continued expansion

Strategic Focus Fueling Significant Global Gaming Revenue & Profit Gains; Achieved Record Levels on Important KPIs in FY’22 6 (1)Per Eilers & Krejcik Gaming research; 2022 market share based on YTD as of 9/30/22 (the latest available data) 28% FY’22 revenue growth drives over 5x increase in operating profit Disciplined cost control, despite higher supply chain costs Record ASPs, U.S. & Canada unit shipments Maintained #1 U.S. & Canada ship share(1) for four consecutive years; 27% in Q3’22 Strengthened and expanded MLP portfolio: Wolf Run Eclipse™, Egyptian Link™ Success of new hardware: PeakDual 32™, PeakSlant 49™, PeakBarTop™, DiamondRS™ Installed base growth marks important milestone Significant installed base growth in Latin America and Greece Improved U.S. & Canada WAP and MLP installed base and yields in H2’22 vs H1’22; Wheel of Fortune® High Roller™, Prosperity Link™, and Money Mania™ driving results Expect continued installed base growth in U.S. & Canada and ROW Significant revenue opportunity and margin improvement potential through 2025

PlayDigital Momentum Enhanced by Expanded Capabilities & Opportunities 27% FY’22 revenue growth drives over 50% increase in operating profit Seamless integration of iSoftBet’s complementary products and geographies Creation of new, unified “PlayDigital” organization and brand Compelling iGaming growth outlook On pace to more than double new game launches to 65+ games/year Ability to develop exclusive games for specific markets & customers First iSoftBet games launched in Ontario; IGT game launches planned for Romania, Greece Growing portfolio of turnkey sports betting customers Powering over 80 sportsbooks; 16 new installations across 11 jurisdictions in 2022 Opportunity to expand customer base with best-in-class hardware, technology & services SaaS-like business model has attractive margin structure; 26% operating income margin in Q4’22 7

Executed Important Strategic Transformation Over Last Three Years 8 Established PlayDigital as standalone segment Sale of Italy B2C gaming machine, sports betting, and digital gaming businesses Reorganization by global product responsibility Tuck-in acquisition of iSoftBet Sale of Italy commercial services business July 2020 May 2021 July 2021 Nov. 2021 Sept. 2022July 2022 Achieved $200+M in structural cost reductions vs. 2019 Simplified organizational structure & financial disclosure Monetized non-core assets at attractive valuations Increased digital investment to advance iLottery and iGaming growth objectives (e.g., talent, R&D, iSoftBet acquisition) Significantly reduced structural costs Substantially lowered debt and leverage leading to greatly improved credit profile with cross-over investment grade credit rating Enhanced shareholder returns Mar. 2020 Net debt leverage* 4.5x Dec. 2022 *Non-GAAP measure; see disclaimer on page 2 and reconciliations to the most directly comparable GAAP measures in Appendix for further details Nov. 2021 Reinstated quarterly cash dividend Dec. 2021 Announced $300M multi- year stock repurchase program OPtiMa 3.1x

Entering FY’23 from a Position of Strength with Good Momentum Across Segments 9 Strategic transformation puts us on solid path to achieving our long-term goals Q1’23 off to an encouraging start Accelerated growth for Italy Lottery sales, elevated U.S. multi-jurisdiction jackpot activity Robust funnel for U.S. & Canada gaming machine unit sales; opportunity to grow the global installed base Continued PlayDigital momentum as we leverage expanded capabilities Outlook supported by a resilient business with high recurring revenue streams, mostly backed by long-term contracts Strong balance sheet & substantial liquidity provide flexibility and support for our strategic goals and balanced capital allocation philosophy OPTIMIZE GROW INNOVATE
10
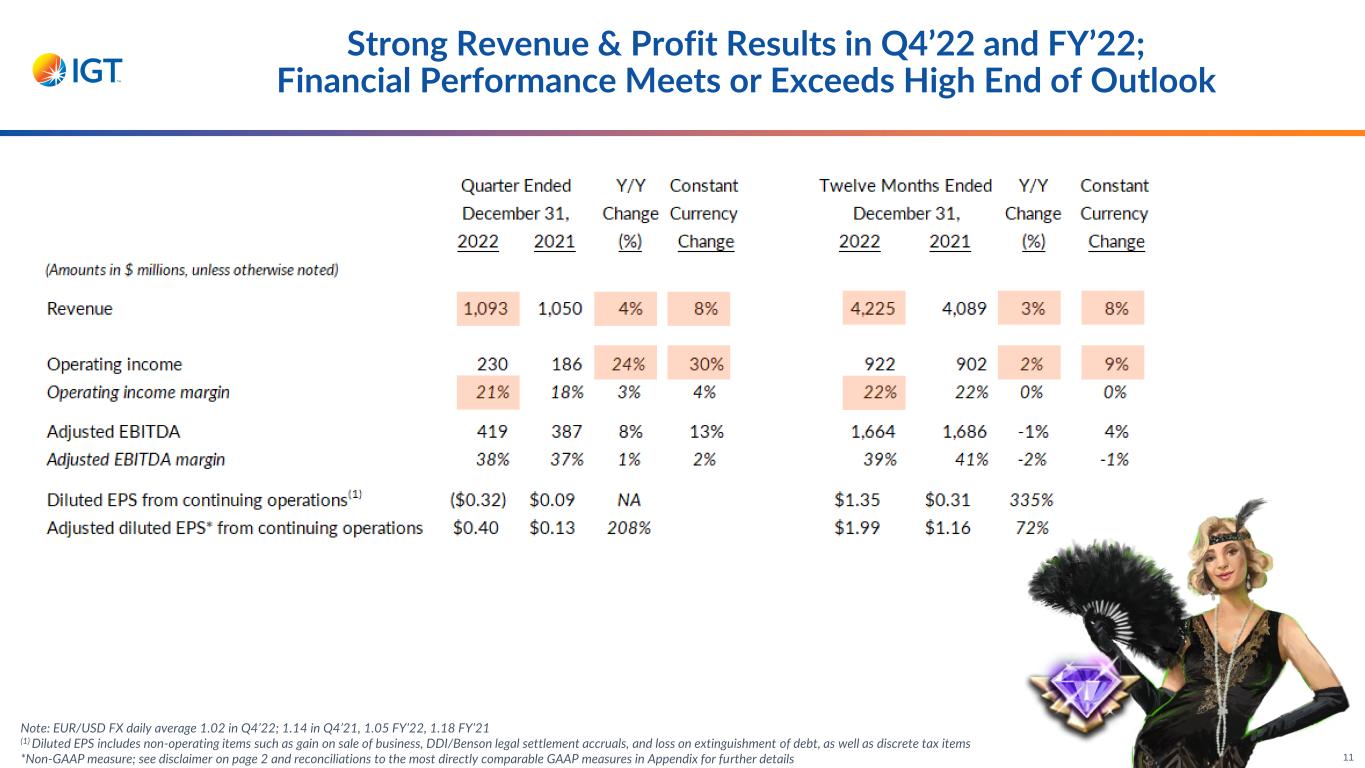
Strong Revenue & Profit Results in Q4’22 and FY’22; Financial Performance Meets or Exceeds High End of Outlook 11 Note: EUR/USD FX daily average 1.02 in Q4’22; 1.14 in Q4’21, 1.05 FY’22, 1.18 FY’21 (1) Diluted EPS includes non-operating items such as gain on sale of business, DDI/Benson legal settlement accruals, and loss on extinguishment of debt, as well as discrete tax items *Non-GAAP measure; see disclaimer on page 2 and reconciliations to the most directly comparable GAAP measures in Appendix for further details

OPtiMa 2.0 Delivering Additional, Structural Profit Improvement 2022: Successful execution of initiatives offset by supply chain headwinds and inflationary cost increases 2023 onward: Realization of margin improvement benefits with normalization of supply chain/inflation headwinds 2022: $50+M reduction in interest expense achieved despite accelerated monetary policy tightening 2023 onward: Expect credit spread compression from journey towards investment grade to offset further tightening 2022: Low 30% effective tax rate achieved ahead of schedule 2023 onward: Effective tax rate, net of FX and discrete tax items, expected to remain in low-mid 30% range Over $150 million in incremental savings targeted by the end of 2023 vs. 2019; Each initiative expected to contribute ~one-third of total savings 12 Operational Excellence/ Margin Improvement Interest Expense OI benefit Below OI benefit Effective Tax Rate Initiative Status Achievements/Outlook

Revenue $639M Operating Income $216M OI Margin 34% 2025 target 33% - 36% Global Lottery Delivers Solid Results on Strong Player Demand 13 Q4’22 revenue down 7%; net of FX and sale of Italy commercial services business, revenue rose 8% Global SSS increased 7% in Q4’22 Strong U.S. multi-jurisdiction jackpot activity Recovery in Italy drives 3% SSS growth iLottery sales increase 84% Solid product sales revenue in Q4’22 Strong Q4’22 and FY’22 operating margins Profit margin profile aligned with 2025 target range

Revenue $389M Operating Income $68M OI Margin 18% 2025 target 28% - 30% Higher Global Gaming Revenue & Profit Fueled by Strong Player Demand & Operating Leverage 20+% revenue increase in Q4’22 as robust demand drives double-digit growth across service and product sale revenue streams Global shipments up 29% in Q4’22 to nearly 9,500 units Record quarterly U.S. & Canada shipments of ~7,500 units Record global ASP of $15,500 Global installed base rose 1,000+ units Q/Q; yields rise 5% Y/Y Underlying growth in U.S. & Canada Global installed base of 51,041 units pro forma for Rhode Island JV contribution in Q1’23; above pre-pandemic level U.S. & Canada yields up on strong WAP and premium game performance Q4’22 operating income up 89%; record OI margin Significant operating leverage drives operating profit up over 5x in FY’22, exceeding FY’19 level 14

OI Margin 26% 2025 target 30+% Revenue $65M Revenue grows 56% in Q4’22 iGaming fueled by organic growth, market expansion, and iSoftBet acquisition Sports betting up on strong FanDuel and Rhode Island performance iSoftBet integration timing progressing as expected Record Q4’22 operating income, up ~240%; strong OI margin helped by lower jackpot expense and despite investments in growth initiatives FY’22 revenue growth of 27% translates to 51% profit growth PlayDigital Exceeding Expectations; Record Revenue & Profit Generated in Q4’22 and FY’22 15 Operating Income $17M

20% 10% 16% 37% Generated Strong Cash Flows in FY’22; Executing on Balanced Capital Allocation Strategy ~$900M Cash from Operations (CFO) $278M in Q4’22 $582M Free Cash Flow* (FCF) $187M in Q4’22 FY’22 Cash Flows FY’22 Allocation of Cash from Operations & Divestitures Share repurchases Dividends to shareholders Minority payments, net Capital expenditures *Non-GAAP measure; see disclaimer on page 2 and reconciliations to the most directly comparable GAAP measures in Appendix for further details 16 Debt reductions, net 8% Capital returned to Shareholders 9% Business acquisitions, net CFO includes $50M escrow payment related to DDI/Benson matter Achieved high end of CFO outlook excluding escrow payment Implied FCF above expectations Record $275+M returned to shareholders Distributed over $160M in cash dividends Repurchased 5.4M shares for $115M; average price of $21.22 $145M repurchase authorization remaining
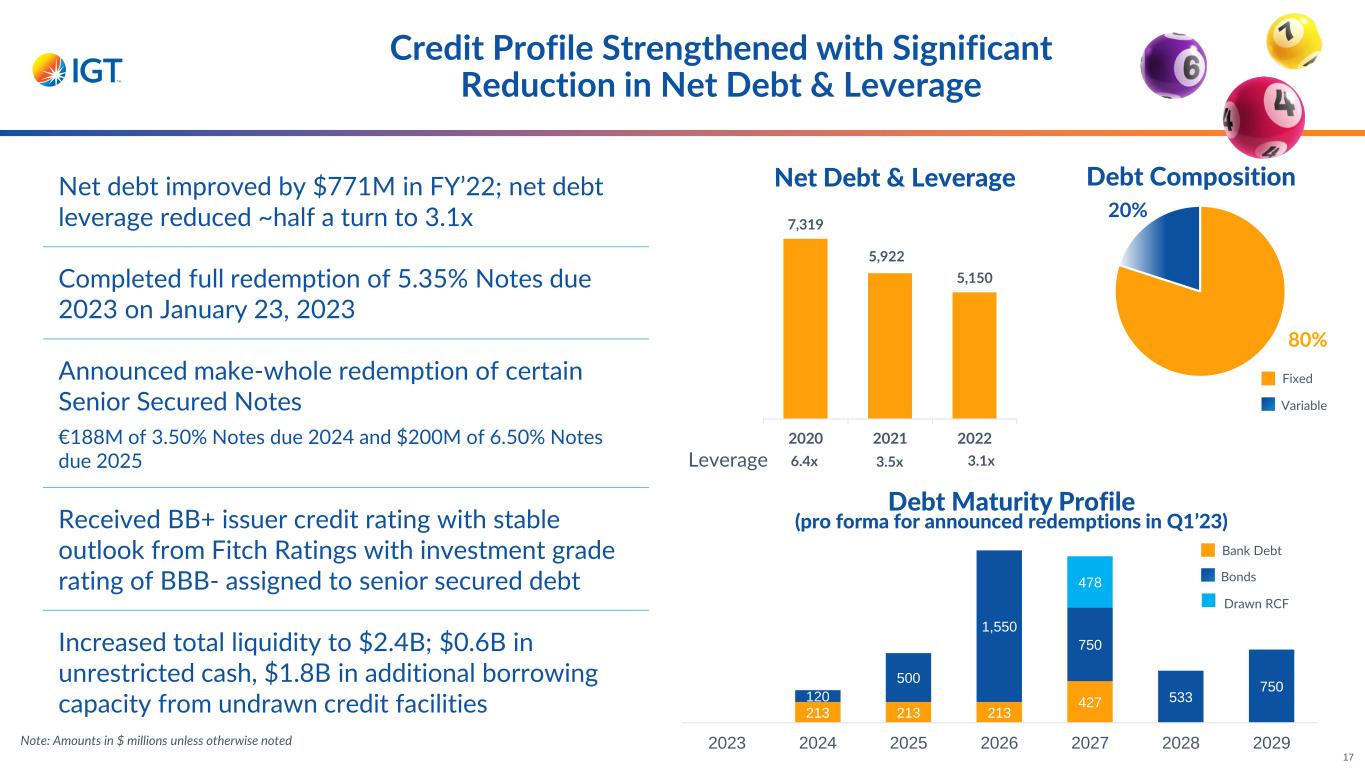
Credit Profile Strengthened with Significant Reduction in Net Debt & Leverage 17 80% Fixed Variable Debt Composition 20% 213 213 213 427120 500 1,550 750 533 750 478 2023 2024 2025 2026 2027 2028 2029 Net debt improved by $771M in FY’22; net debt leverage reduced ~half a turn to 3.1x Completed full redemption of 5.35% Notes due 2023 on January 23, 2023 Announced make-whole redemption of certain Senior Secured Notes €188M of 3.50% Notes due 2024 and $200M of 6.50% Notes due 2025 Received BB+ issuer credit rating with stable outlook from Fitch Ratings with investment grade rating of BBB- assigned to senior secured debt Increased total liquidity to $2.4B; $0.6B in unrestricted cash, $1.8B in additional borrowing capacity from undrawn credit facilities Net Debt & Leverage 7,319 5,922 5,150 2020 2021 2022 Leverage 6.4x 3.5x 3.1x Note: Amounts in $ millions unless otherwise noted Bank Debt Bonds Drawn RCF Debt Maturity Profile (pro forma for announced redemptions in Q1’23)

_______________________________________ FY’23: • Low single-digit SSS growth in Global Lottery; stronger H1’23 vs. H2’23 • Continued Global Gaming momentum supported by robust sales funnel, higher ASPs, and a growing global installed base • PlayDigital continues to deliver double-digit revenue growth • OI margin includes ~100 bp negative impact from higher D&A, primarily related to investments in the installed base, in addition to ongoing Italy restructuring program • Cash from operations includes ~$155M after-tax outflow related to DDI/Benson matter Revenue Operating Income Margin Cash from Operations Capital Expenditures Introducing FY’23 & Q1’23 Expectations Key Outlook AssumptionsFY’23 Outlook Q1’23 Outlook ~$1.0BRevenue Operating Income Margin 22% – 24% $4.1B – $4.3B 21% – 23% $900M - $1,000M $400M - $450M Note: EUR/USD FX @ 1.07 18

A Year of Significant Accomplishments; Good Momentum Heading into 2023 Revenue and profit exceed high end of outlook Revenue rises 4%, 8% at constant currency, to $1.1B 24% increase in operating income; OI margin reaches 21% Strong Q4’22 Financial Results Enhanced Credit Profile Meaningful debt reduction; net debt lowered by $771M Net debt leverage reduced ~half a turn to 3.1x; better than 2022 target and near mid-point of 2025 target range Strong cash flow generation; balanced capital allocation strategy Record ~$275M in capital returned to shareholders Distributed over $160M in cash dividends Repurchased 5.4M shares for $115M; $21.22 avg. price per share Record Shareholder Returns Revenue of $4.2B 22% operating income margin Cash from operations of ~$900M CapEx of ~$317M Met or Exceeded FY’22 Financial Targets 19

20

21
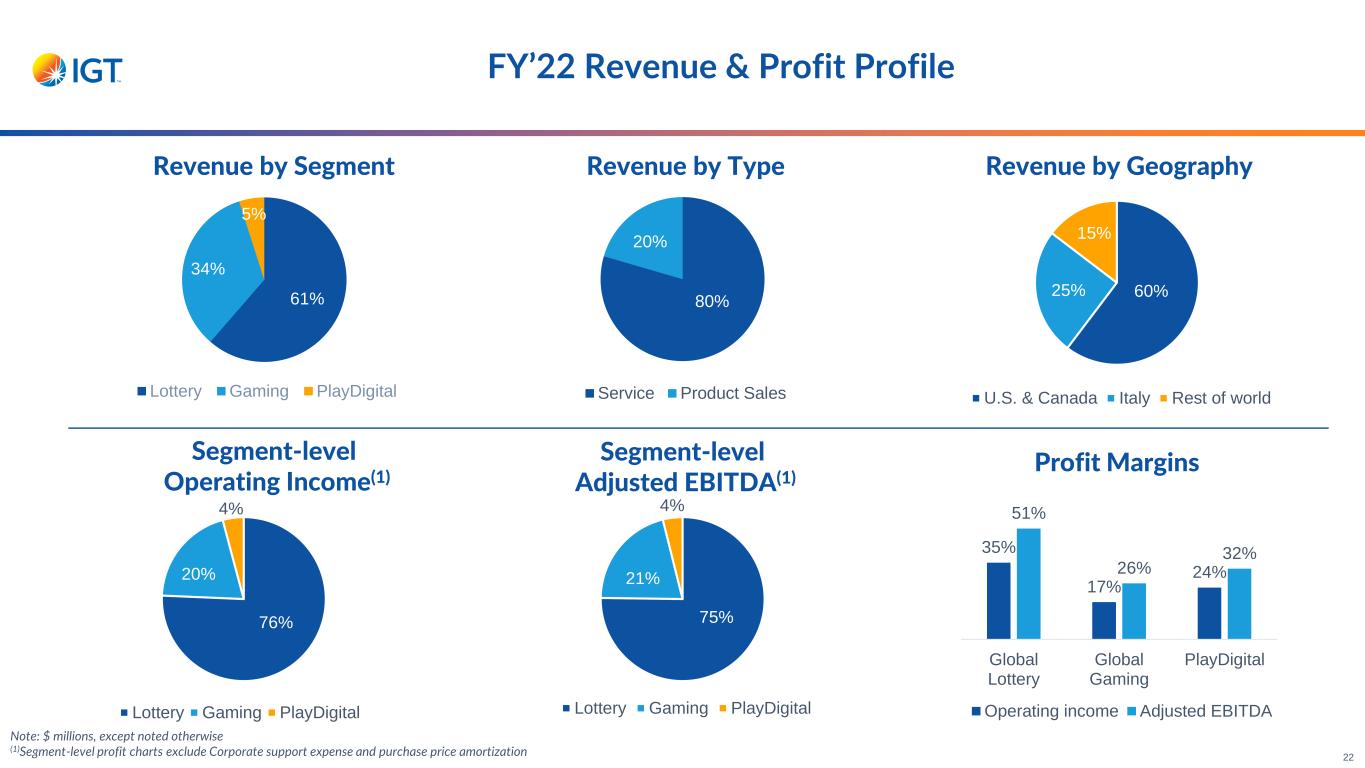
FY’22 Revenue & Profit Profile 41% Note: $ millions, except noted otherwise (1)Segment-level profit charts exclude Corporate support expense and purchase price amortization 61% 34% 5% Lottery Gaming PlayDigital 80% 20% Service Product Sales 60%25% 15% U.S. & Canada Italy Rest of world 76% 20% 4% Lottery Gaming PlayDigital 75% 21% 4% Lottery Gaming PlayDigital 35% 17% 24% 51% 26% 32% Global Lottery Global Gaming PlayDigital Operating income Adjusted EBITDA 22 Revenue by Segment Revenue by Type Revenue by Geography Segment-level Operating Income(1) Segment-level Adjusted EBITDA(1) Profit Margins

High-level Summary of Comprehensive 20-year Rhode Island Contract Extension • Extended IGT’s relationship with RI Lottery from July 1, 2023 - June 30, 2043 • IGT remains exclusive provider of lottery, iLottery, instant ticket, and video lottery system solutions and services • Effective 1/1/23, IGT, through a joint venture with Bally’s, is the exclusive provider of video lottery terminals (VLTs) to the state’s two casinos • Ownership • IGT– 60% owner • Bally’s Corporation – 40% owner • Compensation based on daily net VLT income • Accounting for the JV • IGT will consolidate the results of the JV (i.e., 100% of revenue, expenses, etc.) in the Global Gaming segment • Bally’s economic interests in the JV will be reported as non-controlling interest in IGT’s consolidated financial statements Key Highlights VLT Joint Venture (JV) Details VLT Installed Base (IB) Dynamics • 49,586 IGT global IB 12/31/22 +1,455 Bally’s contribution to JV 1/1/23 51,041 IGT global IB 1/1/23 23
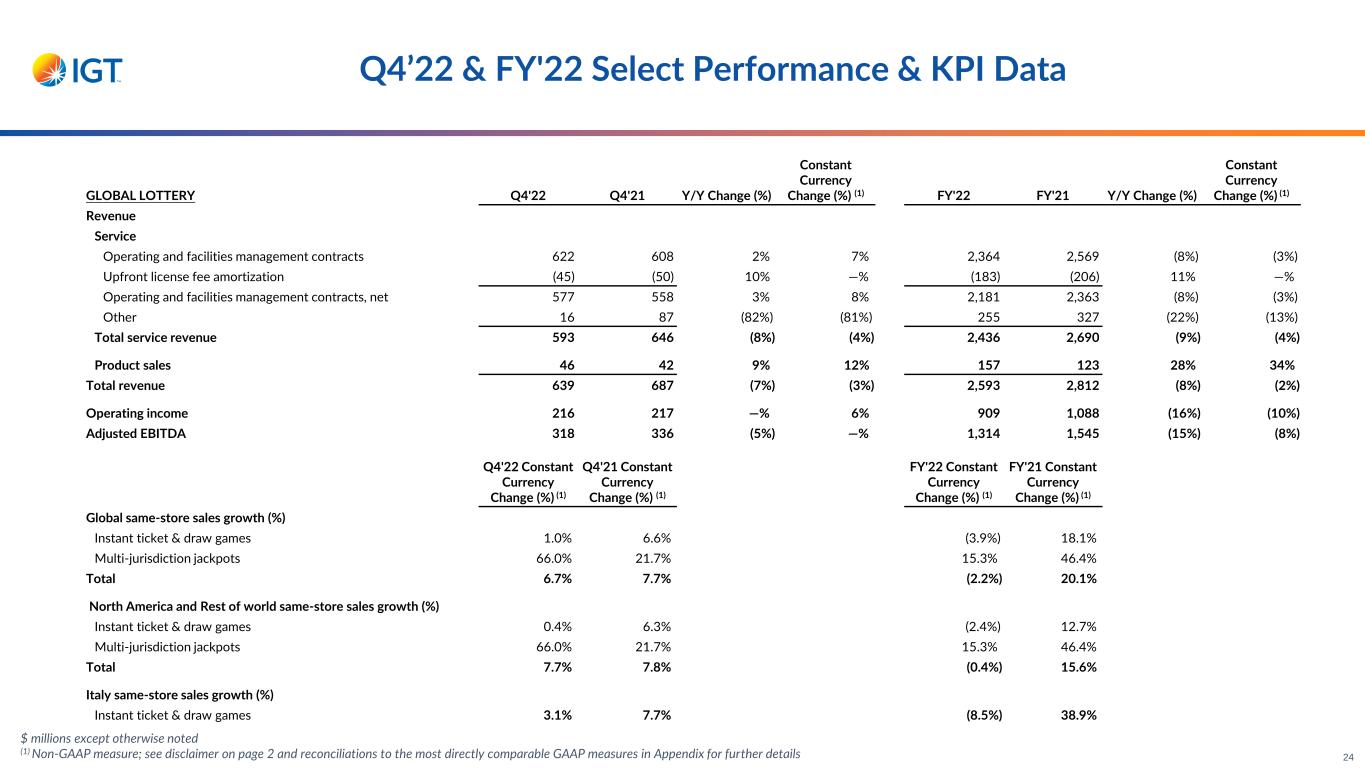
$ millions except otherwise noted (1) Non-GAAP measure; see disclaimer on page 2 and reconciliations to the most directly comparable GAAP measures in Appendix for further details Q4’22 & FY'22 Select Performance & KPI Data GLOBAL LOTTERY Q4'22 Q4'21 Y/Y Change (%) Constant Currency Change (%) (1) FY'22 FY'21 Y/Y Change (%) Constant Currency Change (%) (1) Revenue Service Operating and facilities management contracts 622 608 2% 7% 2,364 2,569 (8%) (3%) Upfront license fee amortization (45) (50) 10% —% (183) (206) 11% —% Operating and facilities management contracts, net 577 558 3% 8% 2,181 2,363 (8%) (3%) Other 16 87 (82%) (81%) 255 327 (22%) (13%) Total service revenue 593 646 (8%) (4%) 2,436 2,690 (9%) (4%) Product sales 46 42 9% 12% 157 123 28% 34% Total revenue 639 687 (7%) (3%) 2,593 2,812 (8%) (2%) Operating income 216 217 —% 6% 909 1,088 (16%) (10%) Adjusted EBITDA 318 336 (5%) —% 1,314 1,545 (15%) (8%) Q4'22 Constant Currency Change (%) (1) Q4'21 Constant Currency Change (%) (1) FY'22 Constant Currency Change (%) (1) FY'21 Constant Currency Change (%) (1) Global same-store sales growth (%) Instant ticket & draw games 1.0% 6.6% (3.9%) 18.1% Multi-jurisdiction jackpots 66.0% 21.7% 15.3% 46.4% Total 6.7% 7.7% (2.2%) 20.1% North America and Rest of world same-store sales growth (%) Instant ticket & draw games 0.4% 6.3% (2.4%) 12.7% Multi-jurisdiction jackpots 66.0% 21.7% 15.3% 46.4% Total 7.7% 7.8% (0.4%) 15.6% Italy same-store sales growth (%) Instant ticket & draw games 3.1% 7.7% (8.5%) 38.9% 24
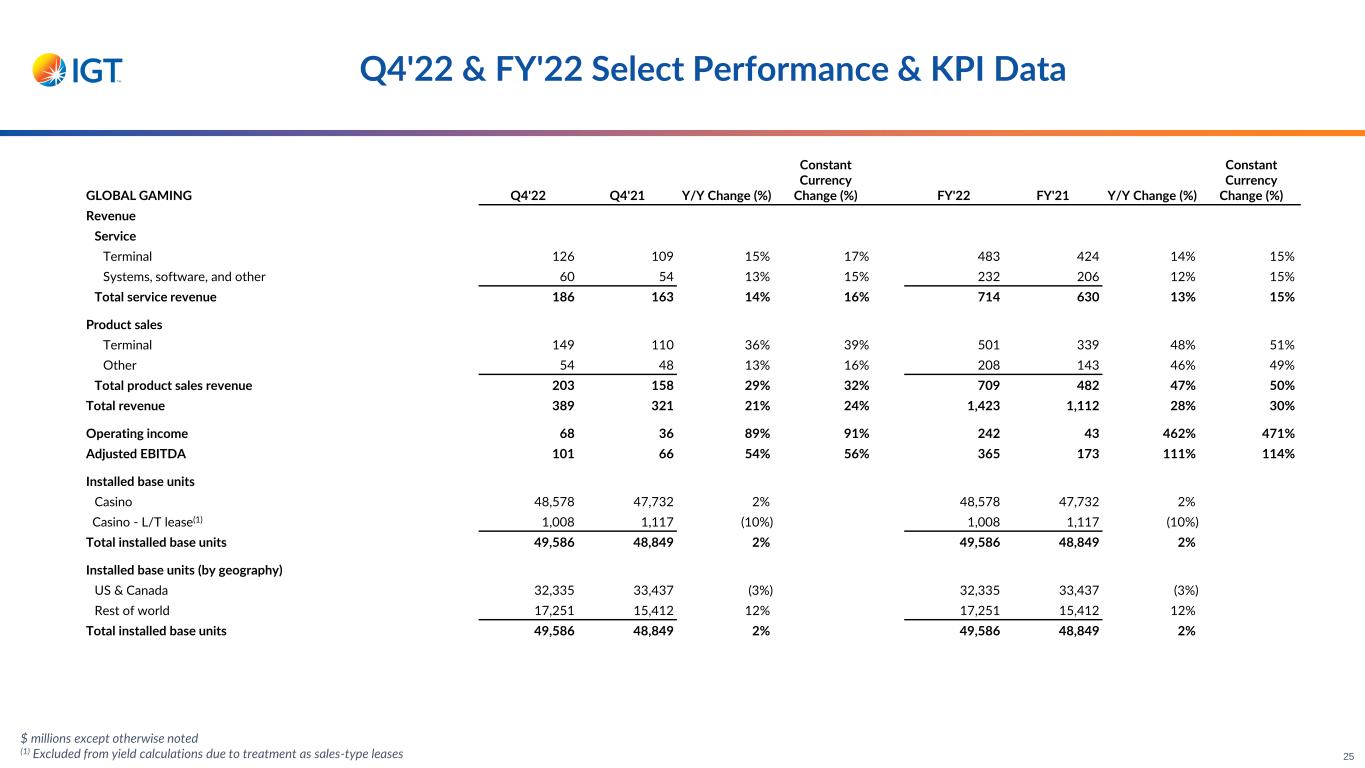
$ millions except otherwise noted (1) Excluded from yield calculations due to treatment as sales-type leases Q4'22 & FY'22 Select Performance & KPI Data 25 GLOBAL GAMING Q4'22 Q4'21 Y/Y Change (%) Constant Currency Change (%) FY'22 FY'21 Y/Y Change (%) Constant Currency Change (%) Revenue Service Terminal 126 109 15% 17% 483 424 14% 15% Systems, software, and other 60 54 13% 15% 232 206 12% 15% Total service revenue 186 163 14% 16% 714 630 13% 15% Product sales Terminal 149 110 36% 39% 501 339 48% 51% Other 54 48 13% 16% 208 143 46% 49% Total product sales revenue 203 158 29% 32% 709 482 47% 50% Total revenue 389 321 21% 24% 1,423 1,112 28% 30% Operating income 68 36 89% 91% 242 43 462% 471% Adjusted EBITDA 101 66 54% 56% 365 173 111% 114% Installed base units Casino 48,578 47,732 2% 48,578 47,732 2% Casino - L/T lease(1) 1,008 1,117 (10%) 1,008 1,117 (10%) Total installed base units 49,586 48,849 2% 49,586 48,849 2% Installed base units (by geography) US & Canada 32,335 33,437 (3%) 32,335 33,437 (3%) Rest of world 17,251 15,412 12% 17,251 15,412 12% Total installed base units 49,586 48,849 2% 49,586 48,849 2%

$ millions except otherwise noted (1) Excludes Casino L/T lease units due to treatment as sales-type leases; comparability on a Y/Y basis hindered due to fewer active units Q4'22 & FY'22 Select Performance & KPI Data GLOBAL GAMING (Continued) Q4'22 Q4'21 Y/Y Change (%) FY'22 FY'21 Y/Y Change (%) Yields (by geography)(1), in absolute $ US & Canada $42.08 $38.95 8% $41.87 $37.62 11% Rest of world $6.53 $5.39 21% $6.22 $4.42 41% Total yields $29.72 $28.27 5% $29.89 $27.11 10% Global machine units sold New/expansion 728 (11) NA 2,879 3,049 (6%) Replacement 8,755 7,377 19% 29,941 20,758 44% Total machine units sold 9,483 7,366 29% 32,820 23,807 38% US & Canada machine units sold New/expansion 574 (452) NA 2,020 1,335 51% Replacement 6,875 5,547 24% 22,202 14,759 50% Total machine units sold 7,449 5,095 46% 24,222 16,094 51% Rest of world machine units sold New/expansion 154 441 (65%) 859 1,714 (50%) Replacement 1,880 1,830 3% 7,739 5,999 29% Total machine units sold 2,034 2,271 (10%) 8,598 7,713 11% Average selling price (ASP), in absolute $ US & Canada $15,600 $15,300 2% $15,400 $14,300 8% Rest of world $15,300 $13,400 14% $13,700 $13,500 1% Total ASP $15,500 $14,700 5% $15,000 $14,100 6% 26

$ millions except otherwise noted Q4'22 & FY'22 Select Performance & KPI Data PLAYDIGITAL Q4'22 Q4'21 Y/Y Change (%) Constant Currency Change (%) FY'22 FY'21 Y/Y Change (%) Constant Currency Change (%) Revenue Service 65 41 58% 65% 209 163 28% 32% Product sales — 1 (64%) (64%) 1 1 (53%) (51%) Total revenue 65 42 56% 63% 209 165 27% 32% Operating income 17 5 239% 256% 50 33 51% 54% Adjusted EBITDA 22 9 149% 159% 68 48 41% 44% CONSOLIDATED Revenue (by geography) US & Canada 714 591 21% 22% 2,549 2,250 13% 14% Italy 226 305 (26%) (18%) 1,059 1,300 (19%) (8%) Rest of world 153 154 (1%) 6% 618 539 14% 23% Total revenue 1,093 1,050 4% 8% 4,225 4,089 3% 8% 27

$ millions except per share amounts; all amounts presented reflect continuing operations Q4'22 & FY'22 Summarized Income Statements Q4'22 Q4'21 Y/Y Change (%) FY'22 FY'21 Y/Y Change (%) Service revenue 845 850 (1%) 3,359 3,483 (4%) Product sales 249 200 24% 866 606 43% Total revenue 1,093 1,050 4% 4,225 4,089 3% Total operating expenses 863 864 —% 3,303 3,187 4% Operating income 230 186 24% 922 902 2% Interest expense, net 66 77 289 341 Foreign exchange loss (gain), net 95 (4) 36 (66) Other non-operating (income) expense, net (1) 2 7 98 Total non-operating expenses 161 75 333 373 Income from continuing operations before provision for income taxes 70 111 589 529 Provision for income taxes 101 56 175 274 (Loss) income from continuing operations (31) 55 414 255 Income from discontinued operations, net of tax — — — 24 Gain on sale of discontinued operations, net of tax — — — 391 Net (loss) income (31) 55 414 670 Less: Net income attributable to non-controlling interests from continuing operations 34 35 139 190 Less: Net loss attributable to non-controlling interests from discontinued operations — — — (2) Net (loss) income attributable to IGT PLC (64) 19 275 482 Net (loss) income from continuing operations attributable to IGT PLC per common share - diluted $(0.32) $0.09 $1.35 $0.31 Adjusted net income from continuing operations attributable to IGT PLC - per common share - diluted $0.40 $0.13 $1.99 $1.16 28

Q4'22 & FY'22 Summarized Cash Flow Statements Q4'22 Q4'21 FY'22 FY'21 Net cash provided by operating activities 278 396 899 1,010 Capital expenditures (91) (71) (317) (238) Free cash flow 187 326 582 771 Debt proceeds/(repayments), net 30 33 (576) (1,439) Repurchases of common stock (22) (41) (115) (41) Shareholder dividends paid (40) (41) (161) (41) Proceeds from sale of business (21) — 476 — Business acquisitions — — (142) — Other - Net 60 (38) (188) (355) Other Investing/Financing Activities 8 (88) (706) (1,876) Net cash provided by discontinued operations — — 126 821 Net Cash Flow 195 238 2 (284) Effect of Exchange Rates/Other 28 (17) (70) (37) Net Change in Cash and Restricted Cash 223 221 (68) (321) Cash and cash equivalents at end of period 590 591 590 591 Restricted cash and cash equivalents at end of period 150 218 150 218 Total cash, cash equivalents, and restricted cash at end of period 740 808 740 808 $ millions; all amounts presented reflect continuing operations unless otherwise indicated 29
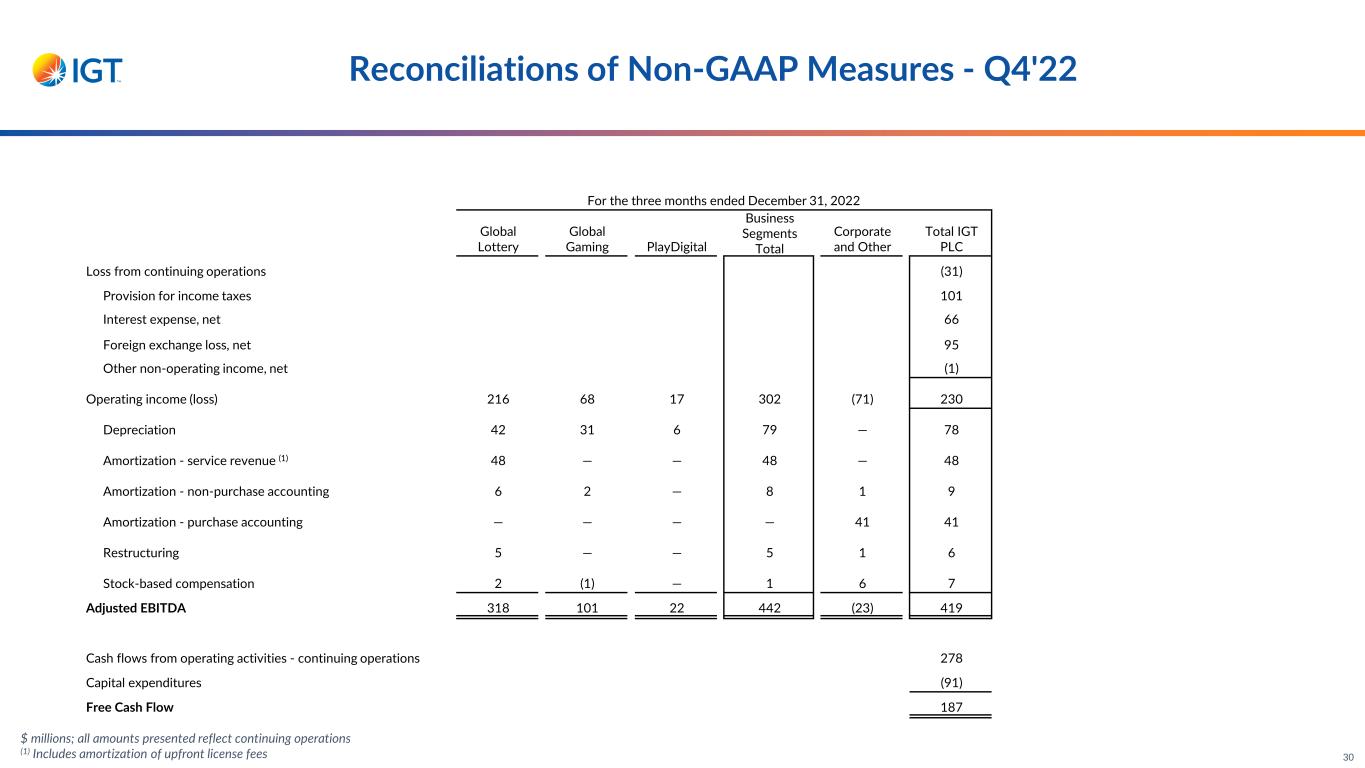
Reconciliations of Non-GAAP Measures - Q4'22 $ millions; all amounts presented reflect continuing operations (1) Includes amortization of upfront license fees For the three months ended December 31, 2022 Global Lottery Global Gaming PlayDigital Business Segments Total Corporate and Other Total IGT PLC Loss from continuing operations (31) Provision for income taxes 101 Interest expense, net 66 Foreign exchange loss, net 95 Other non-operating income, net (1) Operating income (loss) 216 68 17 302 (71) 230 Depreciation 42 31 6 79 — 78 Amortization - service revenue (1) 48 — — 48 — 48 Amortization - non-purchase accounting 6 2 — 8 1 9 Amortization - purchase accounting — — — — 41 41 Restructuring 5 — — 5 1 6 Stock-based compensation 2 (1) — 1 6 7 Adjusted EBITDA 318 101 22 442 (23) 419 Cash flows from operating activities - continuing operations 278 Capital expenditures (91) Free Cash Flow 187 30

Reconciliations of Non-GAAP Measures - Q4'22 31 For the three months ended December 31, 2022 Pre-Tax Impact Tax Impact (1)(2) Net Impact Reported EPS from continuing operations attributable to IGT PLC - diluted (0.32) Adjustments: Foreign exchange loss, net 0.47 (0.04) 0.51 Amortization - purchase accounting 0.20 0.02 0.18 Discrete tax items — (0.01) 0.01 DDI / Benson Matter provision — 0.01 (0.01) Other (non-recurring adjustments) 0.03 0.01 0.02 Net adjustments 0.72 Adjusted EPS from continuing operations attributable to IGT PLC - diluted (3) 0.40 All amounts presented are in $ and reflect continuing operations (1) Calculated based on nature of item, including any realizable deductions, and statutory tax rate in effect for the relevant jurisdiction (2) The reported effective tax rate was 144.0%. Adjusted for the above items, the effective tax rate was 46.2% (3) Adjusted EPS was calculated using weighted average shares outstanding of 201.4 million, which includes the dilutive impact of share-based payment awards

Reconciliations of Non-GAAP Measures - Q4'21 $ millions; all amounts presented reflect continuing operations (1) Includes amortization of upfront license fees For the three months ended December 31, 2021 Global Lottery Global Gaming PlayDigital Business Segments Total Corporate and Other Total IGT PLC Income from continuing operations 55 Provision for income taxes 56 Interest expense, net 77 Foreign exchange gain, net (4) Other non-operating expense, net 2 Operating income (loss) 217 36 5 258 (72) 186 Depreciation 47 29 4 79 — 79 Amortization - service revenue (1) 53 — — 53 — 53 Amortization - non-purchase accounting 9 1 — 11 1 12 Amortization - purchase accounting — — — — 39 39 Restructuring 8 (4) — 4 3 7 Stock-based compensation 3 4 — 7 6 13 Adjusted EBITDA 336 66 9 411 (24) 387 Cash flows from operating activities - continuing operations 396 Capital expenditures (71) Free Cash Flow 326 32

Reconciliations of Non-GAAP Measures - Q4'21 For the three months ended December 31, 2021 Pre-Tax Impact Tax Impact (1)(2) Net Impact Reported EPS from continuing operations attributable to IGT PLC - diluted 0.09 Adjustments: Foreign exchange gain, net (0.02) 0.05 (0.07) Amortization - purchase accounting 0.19 0.05 0.14 Discrete tax items — 0.06 (0.06) Other (non-recurring adjustments) 0.03 0.01 0.02 Net adjustments 0.04 Adjusted EPS from continuing operations attributable to IGT PLC - diluted (3) 0.13 All amounts presented are in $ and reflect continuing operations (1) Adjustments for income taxes are determined based on the statutory tax rate in effect in the respective jurisdiction where the adjustment originated (2) The reported effective tax rate was 50.8%. Adjusted for the above items, the effective tax rate was 59.0% (3) Adjusted EPS was calculated using weighted average shares outstanding of 207.0 million, which includes the dilutive impact of share-based payment awards 33

Reconciliations of Non-GAAP Measures - FY'22 $ millions; all amounts presented reflect continuing operations (1) Includes amortization of upfront license fees (2) Primarily includes transaction-related costs For the year ended December 31, 2022 Global Lottery Global Gaming PlayDigital Business Segments Total Corporate and Other Total IGT PLC Income from continuing operations 414 Provision for income taxes 175 Interest expense, net 289 Foreign exchange loss, net 36 Other non-operating expense, net 7 Operating income (loss) 909 242 50 1,201 (279) 922 Depreciation 173 112 17 302 (1) 301 Amortization - service revenue (1) 193 — — 193 — 193 Amortization - non-purchase accounting 24 7 — 31 3 34 Amortization - purchase accounting — — — — 158 158 Restructuring 6 (1) — 5 1 6 Stock-based compensation 9 5 1 14 27 41 Other (2) — — — — 9 9 Adjusted EBITDA 1,314 365 68 1,746 (83) 1,664 Cash flows from operating activities - continuing operations 899 Capital expenditures (317) Free Cash Flow 582 34

Reconciliations of Non-GAAP Measures - FY'22 35 For the year ended December 31, 2022 Pre-Tax Impact Tax Impact (1)(2) Net Impact Reported EPS from continuing operations attributable to IGT PLC - diluted 1.35 Adjustments: Foreign exchange loss, net 0.18 0.08 0.10 Amortization - purchase accounting 0.77 0.16 0.61 Loss on extinguishment and modifications of debt, net 0.06 0.01 0.06 Discrete tax items — (0.17) 0.17 DDI / Benson Matter provision 1.33 0.33 1.00 Gain on sale of business (1.36) (0.01) (1.36) Other (non-recurring adjustments) 0.07 0.01 0.06 Net adjustments 0.64 Adjusted EPS from continuing operations attributable to IGT PLC - diluted (3) 1.99 All amounts presented are in $ and reflect continuing operations (1) Adjustments for income taxes are determined based on the statutory tax rate in effect in the respective jurisdiction where the adjustment originated (2) The reported effective tax rate was 29.7%. Adjusted for the above items, the effective tax rate was 32.2% (3) Adjusted EPS was calculated using weighted average shares outstanding of 203.4 million, which includes the dilutive impact of share-based payment awards

Reconciliations of Non-GAAP Measures - FY'21 $ millions; all amounts presented reflect continuing operations (1) Includes amortization of upfront license fees (2) Primarily includes transaction-related costs For the year ended December 31, 2021 Global Lottery Global Gaming PlayDigital Business Segments Total Corporate and Other Total IGT PLC Income from continuing operations 255 Provision for income taxes 274 Interest expense, net 341 Foreign exchange gain, net (66) Other non-operating expense, net 98 Operating income (loss) 1,088 43 33 1,164 (262) 902 Depreciation 191 121 15 326 (1) 325 Amortization - service revenue (1) 216 — — 216 — 216 Amortization - non-purchase accounting 34 5 — 40 3 43 Amortization - purchase accounting — — — — 158 158 Restructuring 8 (4) (1) 3 2 6 Stock-based compensation 8 8 1 17 18 35 Other (2) — — — — 1 1 Adjusted EBITDA 1,545 173 48 1,766 (80) 1,686 Cash flows from operating activities - continuing operations 1,010 Capital expenditures (238) Free Cash Flow 771 36

Reconciliations of Non-GAAP Measures - FY'21 37 For the year ended December 31, 2021 Pre-Tax Impact Tax Impact (1)(2) Net Impact Reported EPS from continuing operations attributable to IGT PLC - diluted 0.31 Adjustments: Foreign exchange gain, net (0.32) 0.13 (0.45) Amortization - purchase accounting 0.76 0.18 0.58 Loss on extinguishment and modifications of debt, net 0.42 — 0.42 Discrete tax items — (0.27) 0.27 Other (non-recurring adjustments) 0.04 0.01 0.02 Net adjustments 0.85 Adjusted EPS from continuing operations attributable to IGT PLC - diluted (3) 1.16 All amounts presented are in $ and reflect continuing operations (1) Adjustments for income taxes are determined based on the statutory tax rate in effect in the respective jurisdiction where the adjustment originated (2) The reported effective tax rate was 51.8%. Adjusted for the above items, the effective tax rate was 39.9% (3) Adjusted EPS was calculated using weighted average shares outstanding of 206.8 million, which includes the dilutive impact of share-based payment awards


